Embed Size (px)
Citation preview

Mining Web Videos for Video Quality AssessmentDubravko Culibrk1, Milan Mirkovic2, Predrag Lugonja3 and Vladimir Crnojevic4
University of Novi Sad, Faculty of Technical Sciences,Trg Dositeja Obradovica 6, 21000 Novi Sad, Serbia
Abstract: Correlating estimates of objective measures relatedto the presence of different coding artifacts with the quality ofvideo as perceived by human observers is a non-trivial task.There is no shortage of data to learn from, thanks to the Internetand web-sites such as YouTubetm. There has, however, been lit-tle done in the research community to try to use such resourcesto advance our understanding of perceived video quality. Theproblem is the fact that it is not easy to obtain the Mean OpinionScore (MOS), a standard measure of the perceived video qual-ity, for more than a handful of videos.The paper presents an approach to determining the quality ofa relatively large number of videos obtained randomly fromYouTubetm. Several measures related to motion, saliency andcoding artifacts are calculated for the frames of the video. Pro-grammable graphics hardware is used to perform clustering:first, to create an artifacts-related signature of each video; then,to cluster the videos according to their signatures. To obtain anestimate for the video quality, MOS is obtained for representa-tive videos, closest to the cluster centers. This is then used as anestimate of the quality of all other videos in the cluster.Results based on 2,107 videos containing some 90,000,000frames are presented in the paper.Keywords: Video quality assessment, internet data, data mining,YouTubetm
I. Introduction
As the amount of multimedia content generated and con-sumed grows, there is an increased need to measure and as-sess the quality of video sequences, as it is perceived by theconsumers. The quality depends on the video codec, bit-ratesrequired and the content of video material. User orientedvideo quality assessment (VQA) research is aimed at provid-ing means to monitor the perceptual service quality.Overall degradation in the quality of the sequence, is a com-pound effect of different coding artifacts [1].A large number of published papers exist that propose differ-ent measures of prominent artifacts which appear in codedimages and video sequences [2][3]. The goal of each no-reference approach, as is the one proposed in the text below,is to create an estimator based on the proposed features thatwould predict the Mean Opinion Score (MOS)[4] of human
observes, without using the original (not-degraded) image orsequence data.The procedures for obtaining MOS for a set of degraded se-quences are laborious as they involve large number of per-sons viewing the sequences repeatedly and then averagingthe subjective quality score each person gives to the se-quence. The size of data sets that can be labelled in suchmanner makes them more suitable to serve as test sets forapproaches relying on designed mathematical models of as-pects of the Human Visual System (HVS), than for using ma-chine learning techniques to create an estimate of the MOS.This, of course, is due to the fact that the latter require largeramounts of data, as they first need to undergo training, test-ing and (often) validation, using different parts of the dataset. The quality of data that an algorithm learns from is veryimportant and incomplete and unbalanced data will lead tothe learning algorithm being unable to learn the target con-cept or overfit the data set used for training [5].Even a carefully selected data set, such as that created bythe Video Quality Experts group [6] for the specific purposeof evaluating the quality of video coding and decoding algo-rithms, leaves something to be desired when machine learn-ing is concerned. In addition, the same study indicates thatthe results of approaches relying on (HVS) models can besignificantly improved upon using machine learning.The aim of the work described here, is the design of anapproach that would use large numbers of multimedia dataavailable on the Internet to determine, using machine learn-ing methods, the appropriate subset of the content that needsto be viewed by the human observers. Doing this using k-means clustering leads to a straightforward VQA approach,which labels the input data according to the obtained MOSof representative sequences. The set of representative se-quences contains sequences that fit best into the cluster, foreach cluster. To evaluate the quality of the clustering, MOSscores of representative sequences were obtained by subjec-tive assessment and a variance analysis of the opinion scoresconducted. The rest of the paper is organized as follows: Sec-tion II provides an overview of the relevant published work.The proposed VQA methodology is described in Section III.
International Journal of Computer Information Systems and Industrial Management Applications.ISSN 2150-7988 Volume 4 (2012) pp. 392–399c©MIR Labs, www.mirlabs.net/ijcisim/index.html
Dynamic Publishers, Inc., USA

Section IV presents the experiments conducted to evaluatethe applicability of the proposed method. Conclusions canbe found in Section V.
II. Background and related work
When publicly available multimedia content is concerned,videos are usually available only in their coded form. There-fore, the work presented in this paper relates to no-referencevideo quality assessment methodologies. No information re-garding the original (not-coded) video is used to estimatevideo quality, as perceived by human observers.In studies such as this, ground truth is usually established inthe form of a subjective quality measure mean opinion score(MOS), which is obtained by averaging scores from a num-ber of human observers[1]. The correct procedure for con-ducting such experiments, in the work presented, was derivedfrom ITU-R BT.500-10 recommendations[4].The first stage of any no-reference approach is the calculationof metrics designed to quantify the presence of certain pre-defined artifacts or video features, which can then be relatedto overall quality for a specific application [1].Overall degradation in the quality of the sequence, due to en-coder/decoder implementations as part of transport stream atvarious bit rates, is a compound effect of different coding ar-tifacts. Three types of artifacts are typically considered per-tinent to DCT block coded data: blocking, ringing and blur-ring. Blocking appears in all block-based compression tech-niques due to coarse quantization of frequency components[2][7]. It can be observed as surface discontinuity (edge) atblock boundaries. These edges are perceived as abnormalhigh frequency components in the spectrum. Ringing is ob-served as periodic pseudo edges around original edges [8]. Itis due to improper truncation of high frequency components.In the worst case, the edges can be shifted far away fromthe original edge locations, observed as false edge. Blurring,which appears as edge smoothness or texture blur, is due tothe loss of high frequency components when compared withthe original image. Blurring causes the received image to besmoother than the original one [9].Measures related to various artifacts are usually evalu-ated for each frame of the sequence and collapsed tempo-rally to arrive at a quality measure for the whole sequence[10][11][12][3].Machine learning methods have rarely been used to buildMOS estimators. An Multi Layer Perceptron (MLP) neuralnetwork estimator was used by Babu and Perkis [13], to esti-mate MOS for JPEG coded images. In a recent paper Culibrket al. used the same learner to estimate MOS of videos [3].They evaluated 18 different previously published measuresrelated to image and video quality to determine their suit-ability to serve as features used in video quality estimation.The final set of measures they selected included no-referencemeasures proposed by Wang et al. for blockiness and blur-ring [2], as well as a blockiness measure proposed by Babuet al. [14].Most perceived-blockiness measures are based on the notionthat the block-edge-related effects can be masked by highspatial activity in the image itself, and that the blockinesscannot be observed in very bright and very dark regions.Wang et al.[2] proposed a no-reference approach to qual-
ity assessment in JPEG coded images. Their final measureis derived as a non-linear combination of a blockiness, localactivity and a so-called zero-crossing measure. The com-bination is supposed to provide information regarding bothblockiness and blurring (via the two latter measures) in JPEGcoded images. The blockiness measure of Babu et al. [14]takes effects along each edge of the block into account sepa-rately. Thus, they derived a measure surpassing the Wang etal. approach.Motion [11] and attention [10] can adversely affect MOSestimation. In [15], authors proposed using a multi-scalebackground-subtraction approach to detect salient motion inthe frame. Based on this information and intra-frame mea-sures proposed by Wang et al. [2] and Babu et al. [14],they proposed a set of seventeen measures to describe salientmotion, blockiness and blurring, for salient and non-salientregions separately. These measures were used to train MOSestimators based on MLP and M5’ decision trees [5].Data sets used to test various metrics and MOS estimatorsare based on a small number of carefully (and manually) se-lected short sequences, which are then impaired using dif-ferent coding algorithms and settings to form the final dataset [14][3][16][10]. The sequences are selected to representdifferent types of content deemed pertinent by the authors.To the best of our knowledge, there have been no attemptsto use an automatic procedure to create a reference set of se-quences.Video Quality Experts Group provides a representative setof test sequences, designed specifically for codec testing.These have been used by several authors [11][3][1][15].The set consists of 8-second scenes comprising both naturaland computer-generated scenes with different characteristics(e.g. spatial detail, color, motion) and was selected by inde-pendent labs. 10 scenes with a frame rate of 25 Hz and a res-olution of 720×576 pixels as well as 10 scenes with a framerate of 30 Hz and a resolution of 720×486 pixels were cre-ated in the format specified by ITU-R Rec. BT.601-5 (1995)for 4:2:2 component video.In the work presented here, seventeen measures related tosalient motion, blockiness and blurring, as proposed in [15],were used to describe frames of the sequence. We then pro-ceed to cluster the frames of the sequence to arrive at a qual-ity signature of the sequence, consisting of 100 cluster cen-troids. The signatures for all the sequences in the data set are,subsequently, clustered to arrive at a set of representative se-quences for which subjective MOS is obtained.
III. Video quality assessment
A block diagram of the proposed video quality assessmentapproach is shown in Fig 1. In Phase 1, each video in the dataset is processed to extract measures related to motion, salientchanges, blurring and blockiness. A total of 17 measuresis extracted for half of the frames of video, distributed uni-formly - once the measures have been calculated for a frame,the next frame is skipped. This increases the efficiency ofthe approach without affecting the effectiveness. The val-ues of measures for all frames of a single video are clusteredinto 100 clusters using k-means clustering [17]. The processyields 100 cluster centroids that represent each video. Theset of centroids is a fixed-size representation of a video, re-
393 Culibrk et al.

gardless of the number of frames it has. This will be referredto as a Video Quality Signature (VQS) henceforth.Phase 2 starts when all the VQSs have been calculated. Thevalues in the all the VQSs undergo another round of clus-tering, to associate sequences of similar quality. Each VQSis assigned 100 cluster labels - one for each centroid in it,by this final clustering. The cluster a VQS and the corre-sponding video belong to is determined by majority voting.The cluster that most elements of the VQS belong to, is thecluster the VQS belongs to. Each cluster has one or morevideos that are the best representatives of that particular clus-ter. These are the videos that have the most representatives ofthat cluster in their VQS. For each cluster, a single of videois selected from those that represent the cluster best. The se-lected sequences form the data set of representatives videosfor which MOS should be measured using human observers.Once MOS values are obtained, the MOS of the represen-tative sequence is propagated to all the videos in the samecluster. This is the estimated MOS, designated in Fig. 1.The set of features related to video quality was adopted from[15]. Table 1 lists the features used.The approach proposed in [15] attempts to estimate salientmotion in each frame of the sequence and estimate the ex-tent of different coding artifacts in the salient and non-salientparts of the frame separately.
A. Detecting Salient Motion
While the methodology for the detection of salient motion isdescribed in detail in [15], an overview of the algorithm isincluded here, for the sake of completeness.The method employs a multi-scale model of the backgroundin the form of frames which form a Gaussian pyramid. Thisallows the approach to account for the spatial coherence andcross-scale consistency of changes due to motion of bothcamera and objects. Even with a small number of scales (3-5), the approach is able the achieve good segmentation of in-teresting moving objects in the scene. Moreover, it is able todo so consistently over a wide range of the amount of codingartifacts present.The background frames at each level are obtained by infi-nite impulse response (running average) filtering. This al-lows the approach to take into account temporal consistencyin the frames. Finally, outlier detection [18] is used to de-tect salient changes in the frame. The assumption is thatthe salient changes are those that differ significantly from thechanges undergone by most of the pixels in the frame.Each frame of the sequence is iteratively passed to a 2DGaussian filter and decimated to obtain a pyramid of framerepresentations at different scales. A background model ismaintained in the form of two (background) frames updatedin accordance with Eq. 1.
bl(i) = (1− αl)bl(i) + αlp(i), l ∈ {1, 2} (1)
where: αl is the learning rate used to filter the l-th back-ground frame, p(i) is the value of pixel at location i in thecurrent frame, bl(i) is the value of pixel at location i in thel-th background frame.The initial values for the background frames are copies ofthe first frame of the sequence. As Equation 1 suggests, thedata observed in the frames of the sequence is slowly incor-
porated into the background. The two background framesare obtained using different learning rates (α1 = α2), allow-ing for better adjustment of the time taken by the model toadjust to a scene change. Throughout the experiments pre-sented in this paper the relation of α2 = α1/2 was used, assuggested in [19]. Therefore, the first reference frame incor-porated changes twice as fast as the second one. In addition,since the bottom-up saliency of an object dominates the vi-sual search in about 30ms after the viewer is confronted witha visual scene, the value of α1 is set to 0.3 times the recip-rocal of the frame rate, i.e. for the sequences with 30 framesper second (as those used in our experiments), α1 is set to0.01.Temporal filtering is then performed to obtain a single imageindicating the extent to which the current frame differs fromthe background frames. This is equivalent to inserting thecurrent frame between the two background frames and em-ploying a temporal filter in the form of Mexican hat function,given by the equation 2.
f(x) = − 2√3π− 1
4 · (1− x2) · exp −x2
2(2)
where x represents the Euclidean distance of the point fromthe center of the filter.Once the filter is applied, a modified Z-score test is used todetect the outliers in the frame [20]. Mean absolute distance(MAD) is calculated using Equation 3:
MAD =
∑Ni=1 |fpi − µ|
N(3)
where µ is the mean value of the pixels in the filtered image,fpi is the value of i-th pixel in the filtered frame and N isthe number of pixels.The Z-score values are then calculated using Equation 4:
Zscorei =
|fpi − µ|MAD
(4)
where Zscorei is the Z-score for the i-th pixel.
An additional step is performed once the Z-scores have beencalculated, which allows the approach to handle the situa-tions where the outlier detection procedure would be mis-led by large changes occurring in large parts of the frame.The values are re-normalized to [0,1] range and those smallerthan a specified threshold discarded. In the experiments con-ducted, the threshold was set dynamically by multiplying athreshold coefficient (θ) with the mean value of the final, nor-malized set of values (Equation 5).
outi =
{Zsnormi , if Zsnorm
i ≥ θµsnorm;0, if Zsnorm
i < θµsnorm; (5)
where outi is the final segmented value of the i-th pixel,Zsnormi is the normalized Z-score value for the pixel and
µsnorm is the mean of the normalized Z-score values. Thevalue of θ was set to 2.5 in the experiments performed.The result of temporal filtering at each scale is a temporalsaliency map containing non-zero real values of the pixelsundergoing salient changes.The saliency maps obtained for different scales are iterativelyupsampled and summed to increase the score of pixels scor-ing high consistently across scales. Thus, a single saliency
394 Mining Web Videos for Video Quality Assessment

Figure. 1: Proposed VQA approach: in Phase 1 a VQ signature is extracted for each video, in Phase 2 the signatures areclustered to determine the set of representative videos, their MOS measured and propagated to other videos
map is obtained per color channel. The value describing thesaliency of the pixel is the maximum value across the colorchannels. The values of the single saliency map obtained inthis way are then normalized and compared to a thresholdto eliminate the inconspicuous changes. The output saliencymap is a binary mask splitting the frame into salient and in-conspicuous (non-salient) motion regions.
B. Features for Video Quality Assessment
Several features are used to describe the salient motion ina frame: number of salient regions, their average size, andfirst moments (mean and standard deviation) of the differ-ence between the current frame and background frames, cal-culated separately for salient and non-salient regions. Also,to account for blurring and blockiness, Z-score measuresproposed by Wang et al. [2] and the blockiness measureproposed by Babu et al. [14] are calculated separately forsalient, non-salient and (int the case of the last feature) bor-der regions.
Figure. 2: Portion of the data set corresponding to each ofthe 45 clusters
The blockiness measures proposed by Wang et al. and Babuet al. are profoundly different. Babu et al. focus on the ef-fects that can be observed along the edges of a single block.Their measure is designed to detect blocks with low spatialactivity along the edges, but significant differences acrossthem.To characterize the activity on the inside of the block edgethey calculate the standard deviation of pixel values for 6-pixel long stretches along he border of the block, since theyobserved that blockiness that spans less than 6 pixels is notperceived as significant. For each edge of the block they tryto detect if there is significant activity that could mask the
blockiness effect. Let {Ik,j |k ∈ [1, 4], j ∈ [1, 8]} be theedges of a block and {Ok,j , k ∈ [1, 4], j ∈ [1, 8]} the corre-sponding pixels across the edge of the block. We first con-sider the standard deviation of pixel values on the inside ofblock edges:
σk,j = stddev(Ik,j), k ∈ [1, 3], j ∈ [k, k + 5] (6)
Then we compute the gradient across block edges for eachsubsegment of the edge:
∆k,j = mean(|Ik,j −Ok,j |), k ∈ [1, 3], j ∈ [k, k + 5] (7)
If any of σk,i is below an empirically selected threshold ε,than that edge can contribute to the blockiness, but it will doso only if the gradient is larger than a different threshold τ .For a block i of a frame, we define
Wi =
{1, (∃σk,j ,∆k,j)(σk,j < ε ∧∆k,j > τ)0, otherwise. (8)
Finally, we calculate the proportion of blocks that contributesto the blockiness effect as the measure of blockiness:
BB =
∑NBi=1 Wi
NB(9)
where NB is the number of blocks in the region considered.The authors of the approach [14] suggest ε = 0.1 and τ =2.0, which are also the values used in the study presentedhere.The approach of Wang et al. is based on the observationthat the artifacts can be detected if the image is transformedto the frequency domain and its power spectrum examined.They design their measures of blurring and blockiness in anattempt to achieve a less computationally intensive approachthan that of computing the full power spectrum. Let x(m,n)m ∈ [1,M ] and n ∈ [1, N ], be the pixel values (signal) fora frame. First a differencing signal is calculated along thehorizontal lines:
dh(m,n) = x(m,n+ 1)− x(m,n), n ∈ [1, N − 1] (10)
The blockiness measure proposed by Wang et al. tries to takeinto account the differences between a whole line of blocks,rather than looking at a single block:
Bh =1
M(⌊N/8⌋ − 1)
M∑i=1
⌊N/8⌋−1∑j=1
dh(i, 8j) (11)
395 Culibrk et al.

Table 1: List of proposed quality features.# Feature # Feature1 Salient reg. count 10 Z score non-salient2 Avg. reg. size 11 Activity salient3 Mean change non-salient 12 Blocking effect salient4 Change Std.Dev. non-salient 13 Zero-crossing rate salient5 Mean Change salient 14 Z score salient6 Change Std.Dev. salient 15 Blockiness non-salient7 Activity non-salient 16 Blockiness salient8 Blocking effect non-salient 17 Blockiness border9 Zero-crossing rate non-salient
Thus, the Wang et al. provides a more wider-range measureof blockiness, when compared to the basic Babu et al. metric.Wang et al. proposed two measures in an attempt to charac-terize the spatial activity of the signal. Their motivation liesin the fact that activity is reduced by blurring. The activityis related to how pronounced the texture is in a particular re-gion of the frame. The first measure is the average absolutedifference between in-block image samples:
Ah =1
7
8
M(N − 1)
M∑i=1
N−1∑j=1
|dh(i, j)−Bh|
(12)
The second measure is the zero-crossing (ZC) rate. Theydefine for n ∈ [1, N − 2]:
zh(m,n) =
{1, horizontal ZC at dh(m,n)0, otherwise (13)
the horizontal ZC rate can then be estimated as:
Zh =1
M(N − 2)
M∑i=1
N−2∑j=1
zh(m,n) (14)
The vertical features (Bv ,Av and Zv) are then calculated in asimilar fashion. The overall blockiness, activity and ZC rateare calculated as:
B =Bh +Bv
2, A =
Ah +Av
2, Z =
Zh + Zv
2(15)
Finally they formulate an empirical model for the qualityscore:
Zscore = α+ βBγ1Aγ2Zγ3 (16)
They used the non-linear regression routine available in theMatlab statistics toolbox to find the best value of parame-ters (α,β,γ1,γ2,γ3) for Eq. 16. The values they calculatedare used in the study presented here: α = −245.9,β =261.9,γ1 = −0.0024,γ2 = 0.016,γ3 = 0.0064.Blockiness is masked by the texture(spatial activity) in theregion for which it is calculated. Activity measures are di-rectly related to texture properties within blocks. The finalZ-score is a nonlinear combination of these measures, thatemulates the properties of the human visual system.All the quality related features used are listed in Table 1. Zscore, activity, blocking effect and zero-crossing rate wereoriginally proposed by Wang et al.. Blockiness designatesthe measure proposed by Babu et al..
IV. Experiments and Results
A. Data
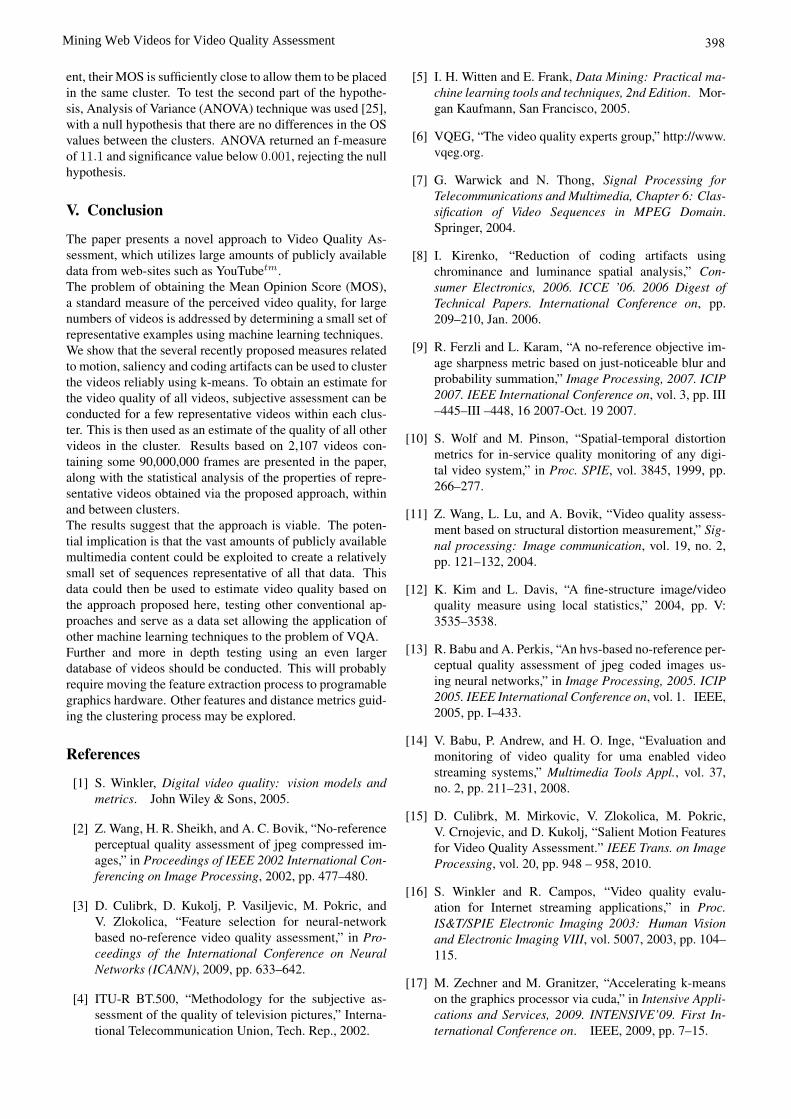
The experimental data used consists of 2,107 videos down-loaded from YouTube(tm). The videos were downloaded au-tomatically in a random fashion using a download tool cus-tomized at our lab.The tool, which is an extension of the TubeKit toolkit de-signed by Shah [21], relies on a set of random keywords(phrases) to achieve randomness of the downloaded mate-rial. The core components of the TubeKit were used to cre-ate a system that takes a set of keywords and the number ofquery results desired for each keyword, and acquires videosbased on that data. Keywords were obtained using a shufflingfunction to get a word from the Ubuntu Linux 9.10 built-inEnglish dictionary. Fig. 5 shows some frames from the ma-terial.
B. Objective Video Quality
To calculate the values of features in Table 1 the algorithmwas implemented in C++, using OpenCV[22] to read thevideos.On an Intel Core2Duo processor the algorithm was able toextract features in near real time, taking environ 25 ms perframe. Once the features were calculated a programmablegraphics hardware implementation of k-means clustering[17] was used to cluster the feature values for a single se-quence into 100 clusters, whose centroids comprise the VQSfor that sequence. This took between 0.025 and 1.74 ad-ditional seconds per sequence, when running on an MSI9500GT graphics card.Once all the VQS-es were collected a final round of cluster-ing was conducted to form 45 clusters. The number of clus-ters was selected to correspond to the number of impairedsequences used by Culibrk et al. in [3] to train and evalu-ate the approach proposed there. Fig. 2 shows the data setcontribution of each cluster. The contributions of the largestclusters and some clusters of interest for the discussion infurther text are given in detail.
10 20 30 40 50 60 70 80 90 1000
2
4
6
8
10
12
14
16
18
20
Confidence
Figure. 3: Histogram of the number of representative se-quences’ VQS elements that correspond to pertaining clus-ters
Once the clusters are obtained, sequences with the largest
396 Mining Web Videos for Video Quality Assessment

portion of the VQS corresponding to a cluster are selected asrepresentative of that cluster. Fig. 3 shows the histogram ofconfidence values indicating the portions of the VQS-es ofrepresentative sequences that correspond to the cluster theyrepresent. As the figure shows, 29 of the clusters have rep-resentatives that have a confidence value over 70%. Repre-sentative sequences for these clusters were selected for sub-jective assessment. Five of these clusters have more than onesequence that is representative of them, the duplicates wereincluded in the subjective assessment test, bringing the totalnumber of sequences to 34.
Figure. 4: MOS and standard deviation of opinion score
C. Subjective Assessment
The subjective video quality assessment method used wasAbsolute Category Rating (ACR), described in detail in ITURecommendations [4, 23], and successfully implemented forsimilar applications[24]. In this method, test clips are pre-sented to assessors one at a time, and rated independently ona discrete 9-level scale, ranging from “Bad” to “Excellent”.The ratings for each test clip are then averaged over all sub-jects to obtain a Mean Opinion Score (MOS).The subjective test consisted of two sessions of about 15minutes, including training. Two sessions were conductedto allow for unreliable observers to be eliminated from thefinal MOS scores, using a paired t-test [25]. Before the ac-tual test, written instructions were given to subjects and atest session was executed. The test session consisted of fivevideos demonstrating the extremes of expected video qual-ity ranges. The actual test comprised thirty four segmentscut from original videos, each around 10 seconds long. Asequence was made, comprising all of the videos (with 8spause between them for voting). Subjects were grading thesequence twice, but at different points in time (once per ses-sion). In that way intra-subject reliability as well as inter-subject variability could be measured. 21 subjects - 13 maleand 8 female - participated in the test, their age ranging from19 to 30. None of them were familiar with video processingnor had previously participated in similar tests. All of thesubjects reported normal or corrected vision prior to testing.Fig. 4 shows a plot MOS values and standard deviation ofopinion scores, for the 34 sequences assessed.
Table 2: Opinion score statistics for the representative se-quences used in the evaluation
Sequence Min OS MOS Max OS Std. Dev. Cluster
clip 20 5.88 6.48 7.08 1.40 1clip 15 5.32 6.1 6.87 1.81clip 9 4.87 5.57 6.27 1.63
clip 14 3.96 4.67 5.37 1.65 11clip 7 5.30 5.95 6.6 1.53
clip 25 6.51 7.28 8.06 1.82 35clip 29 6.04 7.05 8.06 2.36
clip 11 4.6 5.48 6.36 2.06 40clip 3 5.64 6.43 7.21 1.83
clip 23 4.62 5.38 6.14 1.78 5clip 5 4.27 5.14 6.01 2.03
Table 3: T-test results for pairs of sequences representative ofa single cluster:t values, degrees of freedom (df) and p-values
t df p-value Cluster
-0.2502 19 0.8051 1-1.7119 19 0.1032-1.3966 19 0.1786
-3.3804 19 0.003 11
0.2239 19 0.8252 35
0.1724 19 0.865 40
-0.4774 19 0.6385 5
D. Evaluation
To evaluate the ability of the proposed approach to cluster thevideos according to their perceived quality and detect reliablerepresentative sequences, statistical tests were performed onrepresentative sequences of clusters which had more than onerepresentative in the subjective assessment test. These se-quences are listed along with their opinion score statistics inTable 2.If the proposed approach is able to fulfill its intended pur-pose, one expects the representative sequences within thesame cluster to have similar MOS, while there should be sig-nificant differences in OS between different clusters. Ratherthan simply comparing MOS values, we test a more stringentrequirement: the differences in the opinion scores (OS) ofrepresentative sequences gathered from the human observersshould not be statistically significant for most clusters, whilethere should be statistically significant differences betweenthem.To verify the first part of the hypothesis, t-tests were con-ducted between representative sequences within the samecluster. The null hypothesis was that there are no significantdifferences between the pairs of representative sequences inthe clusters. Table 3 shows the results for the OS of ten reli-able observers.The p-values for all but one cluster are well over 0.05, mean-ing the first part of the hypothesis cannot be rejected basedon the experimental data. For cluster 11, however, the t-testrejected the hypothesis that the opinion scores of the two se-quences show no statistically significant difference. Whilethis means that the observers found the two sequences differ-
397 Culibrk et al.
ent, their MOS is sufficiently close to allow them to be placedin the same cluster. To test the second part of the hypothe-sis, Analysis of Variance (ANOVA) technique was used [25],with a null hypothesis that there are no differences in the OSvalues between the clusters. ANOVA returned an f-measureof 11.1 and significance value below 0.001, rejecting the nullhypothesis.
V. Conclusion
The paper presents a novel approach to Video Quality As-sessment, which utilizes large amounts of publicly availabledata from web-sites such as YouTubetm.The problem of obtaining the Mean Opinion Score (MOS),a standard measure of the perceived video quality, for largenumbers of videos is addressed by determining a small set ofrepresentative examples using machine learning techniques.We show that the several recently proposed measures relatedto motion, saliency and coding artifacts can be used to clusterthe videos reliably using k-means. To obtain an estimate forthe video quality of all videos, subjective assessment can beconducted for a few representative videos within each clus-ter. This is then used as an estimate of the quality of all othervideos in the cluster. Results based on 2,107 videos con-taining some 90,000,000 frames are presented in the paper,along with the statistical analysis of the properties of repre-sentative videos obtained via the proposed approach, withinand between clusters.The results suggest that the approach is viable. The poten-tial implication is that the vast amounts of publicly availablemultimedia content could be exploited to create a relativelysmall set of sequences representative of all that data. Thisdata could then be used to estimate video quality based onthe approach proposed here, testing other conventional ap-proaches and serve as a data set allowing the application ofother machine learning techniques to the problem of VQA.Further and more in depth testing using an even largerdatabase of videos should be conducted. This will probablyrequire moving the feature extraction process to programablegraphics hardware. Other features and distance metrics guid-ing the clustering process may be explored.
References
[1] S. Winkler, Digital video quality: vision models andmetrics. John Wiley & Sons, 2005.
[2] Z. Wang, H. R. Sheikh, and A. C. Bovik, “No-referenceperceptual quality assessment of jpeg compressed im-ages,” in Proceedings of IEEE 2002 International Con-ferencing on Image Processing, 2002, pp. 477–480.
[3] D. Culibrk, D. Kukolj, P. Vasiljevic, M. Pokric, andV. Zlokolica, “Feature selection for neural-networkbased no-reference video quality assessment,” in Pro-ceedings of the International Conference on NeuralNetworks (ICANN), 2009, pp. 633–642.
[4] ITU-R BT.500, “Methodology for the subjective as-sessment of the quality of television pictures,” Interna-tional Telecommunication Union, Tech. Rep., 2002.
[5] I. H. Witten and E. Frank, Data Mining: Practical ma-chine learning tools and techniques, 2nd Edition. Mor-gan Kaufmann, San Francisco, 2005.
[6] VQEG, “The video quality experts group,” http://www.vqeg.org.
[7] G. Warwick and N. Thong, Signal Processing forTelecommunications and Multimedia, Chapter 6: Clas-sification of Video Sequences in MPEG Domain.Springer, 2004.
[8] I. Kirenko, “Reduction of coding artifacts usingchrominance and luminance spatial analysis,” Con-sumer Electronics, 2006. ICCE ’06. 2006 Digest ofTechnical Papers. International Conference on, pp.209–210, Jan. 2006.
[9] R. Ferzli and L. Karam, “A no-reference objective im-age sharpness metric based on just-noticeable blur andprobability summation,” Image Processing, 2007. ICIP2007. IEEE International Conference on, vol. 3, pp. III–445–III –448, 16 2007-Oct. 19 2007.
[10] S. Wolf and M. Pinson, “Spatial-temporal distortionmetrics for in-service quality monitoring of any digi-tal video system,” in Proc. SPIE, vol. 3845, 1999, pp.266–277.
[11] Z. Wang, L. Lu, and A. Bovik, “Video quality assess-ment based on structural distortion measurement,” Sig-nal processing: Image communication, vol. 19, no. 2,pp. 121–132, 2004.
[12] K. Kim and L. Davis, “A fine-structure image/videoquality measure using local statistics,” 2004, pp. V:3535–3538.
[13] R. Babu and A. Perkis, “An hvs-based no-reference per-ceptual quality assessment of jpeg coded images us-ing neural networks,” in Image Processing, 2005. ICIP2005. IEEE International Conference on, vol. 1. IEEE,2005, pp. I–433.
[14] V. Babu, P. Andrew, and H. O. Inge, “Evaluation andmonitoring of video quality for uma enabled videostreaming systems,” Multimedia Tools Appl., vol. 37,no. 2, pp. 211–231, 2008.
[15] D. Culibrk, M. Mirkovic, V. Zlokolica, M. Pokric,V. Crnojevic, and D. Kukolj, “Salient Motion Featuresfor Video Quality Assessment.” IEEE Trans. on ImageProcessing, vol. 20, pp. 948 – 958, 2010.
[16] S. Winkler and R. Campos, “Video quality evalu-ation for Internet streaming applications,” in Proc.IS&T/SPIE Electronic Imaging 2003: Human Visionand Electronic Imaging VIII, vol. 5007, 2003, pp. 104–115.
[17] M. Zechner and M. Granitzer, “Accelerating k-meanson the graphics processor via cuda,” in Intensive Appli-cations and Services, 2009. INTENSIVE’09. First In-ternational Conference on. IEEE, 2009, pp. 7–15.
398 Mining Web Videos for Video Quality Assessment

(a) Cluster 1 (b) Cluster 11 (c) Cluster 11
(d) Cluster 35 (e) Cluster 5 (f) Cluster 40
Figure. 5: Sample frames from representative sequences
[18] V. J. Hodge and J. Austin, “A survey of outlier detectionmethodologies,” Artificial Intelligence Review, vol. 22,pp. 85–126, 2004.
[19] D. Culibrk, V. Crnojevic, and B. Antic, “Multiscalebackground modelling and segmentation,” in DigitalSignal Processing, 2009 16th International Conferenceon. IEEE, 2009, pp. 1–6.
[20] E. McBean and F. Rovers, Statistical procedures ofenvironmental monitoring data and risk assessment.Prentice Hall PTR, 1998.
[21] C. Shah, “Tubekit: a query-based youtube crawlingtoolkit,” ACM, pp. 433–433, 2008.
[22] G. Bradski and A. Kaehler, Learning OpenCV: Com-puter Vision with the OpenCV Library. O’Reilly Me-dia, Inc., 2008.
[23] I.-T. R. P.910, Subjective video quality assessmentmethods for multimedia applications., Sept. 1999.
[24] S. Winkler and C. Faller, “Audiovisual quality evalu-ation of low-bitrate video,” SPIE/IS&T Human Visionand Electronic Imaging, vol. 5666, pp. 139–148, 2005.
[25] H. R. Lindman, Analysis of variance in complex exper-imental designs. W. H. Freeman & Co., 1974.
Author Biographies
Dubravko Culibrk is an Assistant Professor in the Depart-ment of Industrial Engineering and Management at Facultyof Technical Sciences in Novi Sad, Serbia. He received hisB.Eng. degree in automation and system control as well as aM.Sc. degree in computer engineering from the University of
Novi Sad, Novi Sad, Serbia, in 2000 and 2003. In 2006 he re-ceived a Ph.D. degree in computer engineering from FloridaAtlantic University, Boca Raton, Florida, USA. His researchinterests include video and image processing, computer vi-sion, neural networks and their applications, cryptographyand evolutionary computing.
Milan Mirkovic is a Teaching Assistant at Faculty of Tech-nical Sciences in Novi Sad, Department of Industrial Engi-neering and Management. He received his B.Eng. degree inindustrial engineering and management, and his M.Sc. de-gree in business processes automation from the Universityof Novi Sad. He is pursuing a Ph.D. degree in informationand communication systems at University of Novi Sad, hiscurrent interests focusing on image processing, data mining,web and persuasive technologies, and their application.
Lugonja Predrag was born in Novi Sad, Serbia in July 24,1983. He received M.S. degree in electrical engineering formNovi Sad University, Serbia, in 2002. He is currently work-ing towards the Ph.D. degree at Faculty of Technical Scienceon University of Novi Sad. His research interests includeremote sensing and video quality assessment.
Vladimir Crnojevic received the Diploma degree and theM.Sc. and Ph.D. degrees in electrical engineering from theUniversity of Novi Sad, Serbia, in 1995, 1999, and 2004,respectively. In 1995, he joined the Communications andSignal Processing Group, Department of Electrical Engineer-ing, University of Novi Sad, where he was a teaching andresearch assistant; in 2004, he became an Assistant Profes-sor in the same department. He is a coordinator of severalprojects from the EU program (FP7, EUREKA!) and nationalresearch programs. His research interests include image pro-cessing, computer vision, and evolutionary algorithms.
399 Culibrk et al.


