Embed Size (px)
Citation preview
Mineral Resources andMineral Reserves Report
2021At 30 June 2021
MINING WITH PURPOSE

Our 2021 suite of reports:
Integrated annual report
2021
MINING WITH PURPOSE
Integrated annual report 2021
ESG report
2021
MINING WITH PURPOSE
Environment, social and governance report2021(ESG report)
Mineral Resources andMineral Reserves Report
2021At 30 June 2021
MINING WITH PURPOSE
Mineral Resources and Mineral Reserves2021
Mineral Resources andMineral Reserves Report
2021At 30 June 2021
MINING WITH PURPOSE
Report to shareholders
2021
Harm
on
y Rep
ort to
shareh
old
ers 2021
MINING WITH PURPOSE
Report to shareholders2021
Financial report
2021
MINING WITH PURPOSE
Financial report2021
Operational report
2021
MINING WITH PURPOSE
Operational report2021
Climate-related financial disclosures
2021 Reporting in accordance with the recommendation of the TCFD (Task Force on Climate-related Financial Disclosures)
MINING WITH PURPOSE
Climate-related financial disclosures 2021*
* Referred to in our reporting suite as TCFD report.
Other reports:
Form 20-FAnnual report filed with the United States Securities and Exchange Commission, in compliance with the listing requirements of the New York Stock Exchange
These reports and supporting documents are available at www.harmony.co.za.
Mponeng underground development end drilling.
Harmony Gold Mining Company Limited

CONTENTIntroduction 1 – 9Corporate profile 2Where we operate 3Compliance and summary 4ESG summary 10Independent audit opinion 11
Mineral Resources and Mineral Reserves 12 – 28Relationship between Mineral Resources and Mineral Reserves (SAMREC code) 12Mineral Resources statement (metric) 15Mineral Reserves statement (metric) 17Mineral Resources statement (imperial) 19Mineral Reserves statement (imperial) 21Mineral Resource reconciliation 23Mineral Reserve reconciliation 27
Exploration and projects 29 – 41Location and geology of operations, projects and exploration 29Exploration 31Projects 37
Mineral Resources and Mineral Reserves by operation 42 – 151SOUTH AFRICA 43West Rand 44Doornkop 48Kusasalethu 54Mponeng 60Klerksdorp goldfield 72Moab Khotsong 74Free State 82Tshepong Operations 86Bambanani 92Joel 98Masimong 104Target 1 110Surface sources 115Kalgold 118Tailings retreatment facilities – Free State 124Surface sources – West Rand/Klerksdorp goldfields 128PAPUA NEW GUINEA 134Hidden Valley 138Wafi-Golpu project 143Kili Teke 149
Administrative information 152 – 161Harmony standard for SAMREC compliance reporting 152Harmony sampling standard 154Glossary of terms 156Forward-looking statements 160Directorate and administration 161
ABOUT THIS REPORTThis statement of Harmony’s Mineral Resources
and Mineral Reserves (South Africa and Papua
New Guinea) as at 30 June 2021 is produced in
accordance with the South African Code for
the Reporting of Exploration Results, Mineral
Resources and Mineral Reserves (SAMREC) and
section 12.13 of the JSE Listings Requirements
(as updated from time to time).
In reporting on our Mineral Resources and Mineral Reserves, certain terms are used, such as “Measured”, “Indicated” and “Inferred” Mineral Resources, which the United States’ Securities and Exchange Commission guidelines strictly prohibit US-registered companies from including in their filings. United States investors are urged to consider the disclosure in this regard in our Form 20-F which is available on our website at www.harmony.co.za/investors/reporting/20f.
Note:
• Unless otherwise stated, Harmony’s equity interest is 100%
• The convention adopted in this report is that the Measured and Indicated Mineral Resource estimates are reported inclusive of the portion converted to Mineral Reserves
• Throughout this report, “$” or “dollar” refers to US dollar, unless otherwise stated
• “K” refers to kina, the currency of Papua New Guinea
• “Moz” refers to million ounces, “Mt” refers to million tonnes and “Mlb” refers to million pounds
• All production volumes are in metric tonnes (t), unless specifically stated as being imperial tons
• Rounding of figures may result in minor computational discrepancies in the Mineral Resource and Mineral Reserve tabulations
• Where Harmony has included the Inferred Mineral Resource in a feasibility study, this is disclosed under the relevant project
• While our reporting currency is the South African rand, the US dollar equivalents of significant financial metrics, together with the applicable percentage movements, are also provided to aid sector and peer comparisons.
Mineral Resources and Mineral Reserves Report 2021 1

CORPORATE PROFILE
Harmony is an emerging-market gold mining and exploration specialist with a copper footprint. We operate in South Africa and Papua New Guinea, one of the world’s premier new gold-copper regions.
With over 70 years in the industry, Harmony is an experienced emerging-market gold miner and the largest gold producer by volume in South Africa. The company is also a significant operator of gold tailings retreatment facilities. Our operations in Papua New Guinea include the Hidden Valley gold mine and our joint-venture stake in the Wafi-Golpu copper-gold project.
Our purposeA global, sustainable gold producer, creating shared value for all stakeholders while leaving a lasting positive legacy:• Creating longevity, profitability and sustainability • Committed to safe, ethical, social and ecologically responsible
mining• Positioning our business to contribute to a low-carbon future.
Our missionTo create value by operating safely and sustainably, and growing our margins.
Our values• No matter the circumstances, safety is our main priority• We are all accountable for delivering on our commitments• Achievement is core to our success• We are all connected as one team• We uphold honesty in all our business dealings and communicate
openly with stakeholders.
Our impactAt Harmony, we understand that our activities and the way we conduct business affects the lives of the people we employ, communities that surround our mines and the environment. This impact has economic and social implications for our stakeholders and the countries in which we operate. In line with our purpose, we strive to ensure that our contribution is positive on balance and that our positive legacy endures once mining stops.
ShareholdersOur largest shareholder is African Rainbow Minerals Limited (ARM), which has a stake of 12.12% in Harmony. Our remaining shareholders are geographically diverse and include some of the largest fund managers globally. The largest shareholder base is in the United States (over 50%), followed by South Africa.
Market capitalisation at 30 June 2021 R32.5 billion (US$2.3 billion)Headquartered in Randfontein, South Africa, Harmony has its primary listing on Johannesburg’s stock exchange, the JSE Limited (HAR). It also has an American depositary receipt programme listed on the New York Stock Exchange (HMY). At 30 June 2021, our market capitalisation is R32.5 billion (30 June 2020: R43.3 billion; US$2.5 billion).
Doing what we know best
South African gold-mining champion – delivering value-enhancing consolidation
Proven expertise in driving efficiencies safely
Elevated margins and operating free cash flow
• Emerging-market specialist (South Africa and Papua New Guinea)
• Significant increase in South African production from Moab Khotsong acquisition, followed by Mponeng and Mine Waste Solutions acquisition
• Meaningful value-enhancing improvement in South African recovered grade through acquisition, development
• Acquisition synergies and other investments have potential to reduce all-in sustaining costs.
• Safety, a core value• Focus – quality ounces and cost
reduction aimed at lowering all-in sustaining costs
• Proven track record – sustaining and prolonging operating lives of deep-level mines
• Wealth of mining expertise – combined, senior executive management and prescribed officers have decades of industry experience.
• Positioned to benefit from gold price and foreign exchange (operating free cash flow highly geared to current gold price environment)
• Locking in high margin for future returns• Strengthened balance sheet supports
future growth and capital returns• Regional consolidation in South Africa
will unlock significant value, synergies and scale
• Portfolio value supported by joint ownership of Wafi-Golpu asset.
2 Harmony Gold Mining Company Limited

WHERE WE OPERATE
Free State
North West Gauteng
PAPUA NEW GUINEA
SOUTH AFRICA
Morobe
Hidden ValleyOpen-pit gold and
silver mineLoM 6 years
2 228 employeesAnnual production 150 755oz
Grade 1.37g/t
Wafi-GolpuProposed underground
copper-gold joint operation – 50%
LoM 28 yearsProjected grade 1.27% copper,
0.9g/t gold
Multiple exploration areas1 The West Rand is on the border between Gauteng and North West.2 Production for nine months from October 2020 to June 2021.3 North West.4 Includes Zaaiplaats.* LoM – life-of-mine.
South AfricaProduction:
1.38Moz (90%)Located on the Witwatersrand Basin and Kraaipan Greenstone Belt, our South African operations accounted for 71% of group Mineral Resources (gold and gold equivalent ounces) and 58% of group Mineral Reserves at year end.
Papua New
GuineaProduction:
~150 755oz (10%)
Located on the New Guinea Mobile Belt, in Morobe Province, our
PNG operation accounted for 29% of
group Mineral Resources (gold and gold
equivalent ounces) and 42% of group Mineral
Reserves at year end.
Free StateTshepong OperationsLoM 20 years9 164 employeesAnnual production 238 526ozGrade 4.76g/t
BambananiLoM 3 years1 639 employeesAnnual production 64 044ozGrade 8.78g/t
JoelLoM 9 years2 032 employeesAnnual production 45 783ozGrade 3.97g/t
MasimongLoM 1.5 years2 064 employeesAnnual production 64 687ozGrade 3.95g/t
Target 1LoM 7 years1 865 employeesAnnual production 51 536ozGrade 3.28g/t
UNDERGROUNDWest Rand1
DoornkopLoM* 14 years4 146 employeesAnnual production 117 993ozGrade 4.31g/t
KusasalethuLoM 3 years4 260 employeesAnnual production 128 570ozGrade 5.65g/t
Mponeng2
LoM 8 years5 308 employeesAnnual production 175 092ozGrade 7.97g/t
Klerksdorp goldfield3
Moab KhotsongLoM 24 years4
6 209 employeesAnnual production 230 391ozGrade 7.94g/t
SURFACENorth WestKalgoldLoM 12 years700 employeesAnnual production 35 655ozGrade 0.74g/t
Mine Waste Solutions2
LoM: 17 years1 276 employeesAnnual production 66 133ozGrade 0.116g/t
Waste-rock dumpsAnnual production 41 250ozGrade 0.285g/t
West Rand1
Waste-rock dumpsAnnual production 41 506ozGrade 0.324g/t
Free StateCentral Plant ReclamationLoM 14 years249 employeesAnnual production 18 101ozGrade 0.140g/t
Phoenix (tailings retreatment)LoM 7 years333 employeesAnnual production 25 046ozGrade 0.126g/t
Waste-rock dumpsAnnual production 32 343ozGrade 0.616g/t
Mineral Resources and Mineral Reserves Report 2021 3
INTRODUCTION

COMPLIANCE AND SUMMARYAS AT 30 JUNE 2021
Harmony’s statement of Mineral Resources and Mineral Reserves (South Africa and Papua New Guinea) as at 30 June 2021 is produced in accordance with the South African Code for the Reporting of Exploration Results, Mineral Resources and Mineral Reserves (SAMREC). It should be noted that Mineral Resources are reported inclusive of Mineral Reserves.
Harmony uses certain terms in the summary such as “measured”, “indicated” and “inferred” resources, which the United States’ Securities and Exchange Commission (SEC) guidelines strictly prohibit companies registered in the United States from including in their filings with the commission. United States investors are urged to consider the disclosure in this regard in our Form 20-F which will be available on our website at https://www.harmony.co.za/invest/annual-reports on 29 October 2021.
Reporting code and complianceThe SAMREC Code was developed and established in 1998 by the South African Institute of Mining and Metallurgy and is the recommended guideline for reporting on exploration results, Mineral Resources and Mineral Reserves for companies listed on the JSE.
The first version of the SAMREC Code was issued in March 2000 and adopted by the JSE in its Listings Requirements later that year; this was similarly the basis for the JSE Ongoing Reporting Requirements promulgated in 2005. The SAMREC Code was reviewed in 2004, updated in 2007 and amended in July 2009. The latest update of the SAMREC Code was launched on 19 May 2016 with this version superseding previous versions. In addition, Section 12.13 of the JSE Listings Requirements was subsequently updated with the revised SAMREC and SAMVAL Codes that came into effect on 1 January 2017.
The latest edition of the SAMREC Code includes an updated Table 1 template, which provides an extended list of the main criteria to be considered and reported when reporting on Exploration Results, Mineral Resources and Mineral Reserves. In complying with the principles of the code, comments relating to the items in the relevant sections of Table 1 must be provided on an “if not, why not” basis within the competent person’s report. Guidelines for the compilation of Table 1 are for (i) the first-time declaration of exploration results, a Mineral Resource or a Mineral Reserve, and (ii) instances where this information has changed materially since last publicly reported for significant projects.
Reporting on an “if not, why not” basis ensures that it is clear to investors or other stakeholders whether items have been considered and deemed of low consequence or are not yet addressed or resolved. Harmony has adopted the compilation and updating of Table 1 as a standard to complement internal reports.
Harmony has written confirmation from the lead competent person that the information disclosed in this report is compliant with the SAMREC Code and, where applicable, with the relevant JSE Section 12 and SAMREC Table 1 requirements, and that it may be published in the form, format and context in which it was intended.
In reporting our Mineral Reserves, distinct cognisance has also been taken of Industry Guide 7 of the United States’ Securities and Exchange Commission.
Our strategyHarmony’s strategy is to produce safe, profitable ounces and increase margins. This includes delivering safely on our operational plans, reducing costs and improving productivity. Harmony’s growth journey entails acquiring higher grade assets and ensuring a pipeline of Mineral Reserves. In FY17, Harmony invested in a life-of-mine extension at Hidden Valley and in FY18 acquired and integrated the higher-grade Moab Khotsong operations. The transaction to acquire the remainder of AngloGold Ashanti’s South African assets – Mponeng and Mine Waste Solutions – was concluded in September 2020 and we took ownership of them on 1 October 2020.
ASSUMPTIONS
In converting Mineral Resources to Mineral Reserves, the following commodity prices and exchange rates were applied:• A gold price of US$1 500/oz• An exchange rate of R/US$14.51• The above parameters resulted in a rand gold price of
R700 000/kg for the South African assets• The Hidden Valley Mine and the Wafi-Golpu project used
commodity prices of US$1 500/oz Au, US$20.70/oz Ag, US$10.00/lb Mo and US$3.00/lb Cu at an exchange rate of AUD1.39 per US$
• Gold equivalent ounces are calculated assuming the following: US$1 500/oz Au, US$3.00/lb Cu and US$20.70/oz Ag, and assuming a 100% recovery for all metals.
Note:Au = gold Cu = copper Ag = silver Mo = molybdenum U3O8 = uranium
For more information on Harmony’s reporting code, our SAMREC compliance and the definitions used, refer to the section, Harmony standard for SAMREC compliant reporting.
Classification relationship between exploration results, Mineral Resources and
Mineral Reserves (SAMREC Code)
Incr
easin
g le
vel o
f geo
scie
ntifi
c kno
wle
dge
and
confi
denc
e Exploration results
Mineral Resources Mineral Reserves
Reported as in situ mineralisation
estimates
Reported as mineable production
estimates
Inferred
Indicated Probable
Measured Proved
Consideration of mining, metallurgical, economic, processing, infrastructural, economic, marketing, legal, environmental,
social and governmental factors (the modifying factors)
4 Harmony Gold Mining Company Limited

Independent reviewIndividual mines are independently reviewed on a three-year rotational basis. This year, the Mineral Resources and Mineral Reserves at Doornkop and Mponeng as well as the group SAMREC statement were independently reviewed by The Mineral Corporation for compliance with SAMREC.
Competent persons’ declarationThe Mineral Resources and Mineral Reserves estimates in this report are based on information compiled by the two competent persons whose details are presented below. Both these full-time employees of Harmony Gold Mining Company Limited consent to the inclusion of the information in this report in the form and context in which it appears. They are:
MINERAL RESOURCES AND MINERAL RESERVES, SOUTH AFRICA:
Jaco Boshoff, BSc (Hons), MSc, MBA, has 26 years’ relevant experience. He is registered with the South African Council for Natural Scientific Professions (SACNASP), and is a member of the South African Institute of Mining and Metallurgy (SAIMM) and the Geological Society of South Africa (GSSA).
Mr Boshoff is Harmony’s Lead Competent Person.
Physical address:Randfontein Office Park,Corner Main Reef Road and Ward Avenue, Randfontein,South Africa
Postal address:PO Box 2,Randfontein 1760, South Africa
MINERAL RESOURCES AND MINERAL RESERVES, PAPUA NEW GUINEA:
Gregory Job, BSc, MSc, has 33 years’ relevant experience and is a member of the Australasian Institute of Mining and Metallurgy (AusIMM).
Physical address:Level 2, 189 Coronation Drive,Milton, Queensland 4064, Australia
Postal address:PO Box 1562,Milton, Queensland 4064, Australia
In South Africa, Harmony employs an Ore Reserve manager at each of its operations who takes responsibility as competent person for the compilation and reporting of Mineral Resources and Mineral Reserves at their respective operation. In Papua New Guinea, competent persons are appointed for the Mineral Resources and Mineral Reserves for specific projects and operations. Details on these competent persons are presented in the respective operational Mineral Resource and Mineral Reserve statements in this report.
Administrative information for professional organisationsAustralasian Institute of Mining and Metallurgy (AusIMM)Postal address: PO Box 660, Carlton South, Vic 3053, AustraliaTelephone: +61 3 9658 6100Facsimile: +61 3 9662 3662Website: www.ausimm.com.au
South African Council for Natural Scientific Professions (SACNASP)Postal address: Private Bag X540, Silverton, 0127, Gauteng,South AfricaTelephone: +27 12 841 1075Facsimile: +27 86 206 0427Website: www.sacnasp.org.za
Southern African Institute of Mining and Metallurgy (SAIMM)Postal address: PO Box 61127, Marshalltown, 2107, Gauteng, South AfricaTelephone: +27 11 834 1273/7Facsimile: +27 11 838 5923/8156Website: www.saimm.co.za
Geological Society of South Africa (GSSA)CSIR MiningtekCarlow and Rustenburg RoadsMelville, JohannesburgSouth AfricaWebsite: www.gssa.org.za
Details of the professional registrations of our competent persons can be obtained from the company secretary at: [email protected]
Legal entitlement to minerals reportedHarmony’s South African operations operate under new order mining rights in terms of the Mineral and Petroleum Resources Development Act (MPRDA) of 2002 (Act No 28 of 2002).
In Papua New Guinea, Harmony operates under the Independent State of Papua New Guinea Mining Act 1992. All required operating permits have been obtained and are in good standing.
The legal tenure of each operation and project has been verified to the satisfaction of the accountable competent person.
Environmental management and fundingHarmony’s environmental strategy aims to optimise our environmental performance by managing our environmental impacts, focusing on effective risk controls, reducing environmental liabilities, ensuring responsible stewardship of our products within our scope of influence, complying with environmental legislation and regulations.
For further information regarding Harmony’s approach to sustainability and environmental performance refer to the ESG report 2021, which is available at www.harmony.co.za.
Details relating to the provision for Environmental rehabilitation and funding can be found in note 26 in Harmony’s audited annual financial statements that are presented in a separate report, the Financial report 2021. This is also available online at www.harmony.co.za.
Mineral Resources and Mineral Reserves Report 2021 5
INTRODUCTION

COMPLIANCE AND SUMMARY continuedAS AT 30 JUNE 2021
Mineral Resources and Mineral Reserves – summaryPost the acquisition of Mponeng and related assets in October 2020, we have concluded our life-of-mine planning process for the operations. We have also concluded our reconciliation and assessment of the Mineral Reserves and Resources based on updated models and the new life-of-mine plan. As a result, we have excluded the below infrastructure Reserves as previously published by AngloGold Ashanti Limited (AGA) while Harmony is in the process with an update of the project studies. The below infrastructure areas are being re-assessed and new project studies will be commissioned to evaluate the economic viability of these blocks of ground. As a result, we have made downward adjustments to the Reserves and Resources originally published by AngloGold Ashanti at the end of 2019. Despite these reconciliations, the company’s attributable gold and gold equivalent Mineral Resources are now declared as 141.2Moz as at 30 June 2021, a 19% increase year on year from the 118.6Moz declared as at 30 June 2020. The total gold contained in the Mineral Resources at the South African operations represents 71% of the company total, with the Papua New Guinea operations representing 29% of Harmony’s total gold and gold equivalent Mineral Resources as at 30 June 2021. Harmony’s attributable gold and gold equivalent Mineral Reserves amounts to 42.5Moz, a 16% increase from the 36.5Moz declared at 30 June 2020. The gold Reserve ounces in South Africa represent 58% while the Papua New Guinea gold and gold equivalent Reserve ounces represent 42% of Harmony’s total Mineral Reserves as at 30 June 2021. (See Appendix for Mineral Resources and Reserves detail per operation.)
SOUTH AFRICA
UNDERGROUND OPERATIONS
The company’s Mineral Resources at the South African underground operations as at 30 June 2021 are 84.0Moz (262.1Mt at 9.96g/t), an increase of 33% year-on-year from the 62.9Moz (214.8Mt at 9.10g/t) declared as at 30 June 2020. This increase is mainly due to additional mineral resources from the Mponeng acquisition.
The company’s Mineral Reserves at the South African underground operations as at 30 June 2021 are 14.3Moz (70.46Mt at 6.31g/t), an increase of 33% year-on-year from the 10.8Moz (56.95Mt at 5.87g/t) declared as at 30 June 2020. The increase in ounces is mainly due to the reserves added from the Mponeng acquisition and inclusion of the Zaaiplaats project at Moab Khotsong.
SURFACE OPERATIONS (INCLUDING KALGOLD)
The company’s Mineral Resources at the South African surface operations as at 30 June 2021 are 16.0Moz (1 769.9Mt at 0.28g/t) an increase of 53% mainly due to the acquisition of AngloGold Ashanti South African surface sources.
The company’s Mineral Reserves after normal depletion at the South African surface operations as at 30 June 2021 are 10.4Moz (1 236.6Mt at 0.26g/t), an increase of 57% due to the acquisition of AngloGold Ashanti South African surface sources.
PAPUA NEW GUINEA
OPERATIONS
The company’s attributable gold and gold equivalent Mineral Resources at the Papua New Guinea operations as at 30 June 2021 are 41.3Moz, a decrease of 9% year-on-year from the 45.4Moz declared as at 30 June 2020. This decrease is mainly due to a new resource model at Hidden Valley (Kaveroi), commodity price ratio changes affecting the gold equivalent ounces negatively, and depletion.
The company’s gold and gold equivalent Mineral Reserves at the Papua New Guinea operations as at 30 June 2021 are 17.7Moz, a decrease of 7.3% year-on-year from the 19.1Moz declared as at 30 June 2020. The decrease is mainly due to depletion and a change in the commodity price ratios. There was a year-on-year increase of 0.5Moz of gold reserves at Hidden Valley due to the addition of Stage 8 to the life of mine plan.
Ventersdorp Contact Reef intersection.
6 Harmony Gold Mining Company Limited

ExplorationOur exploration strategy is to predominantly pursue brownfields exploration targets close to existing infrastructure. This will drive short to medium-term organic Mineral Reserve replacement and growth to support our current strategy of increasing quality ounces and to mitigate the risk of a depleting Mineral Reserve base.
Key work streams underpinning the FY21 exploration programme include:• Brownfield exploration at Hidden Valley and Kalgold to optimise existing open-pit operations and extend mine life• Brownfield exploration at our underground operations in South Africa• Greenfield exploration at Target North• Reviewing exploration opportunities as part of our new business strategy.
During the year these work streams continued to be impacted as a result of the global Covid-19 pandemic, with some work programmes suspended in the interest of the health and safety of our employees and the host communities we work in, and to preserve capital during these challenging times.
A detailed report of the exploration results will be provided as part of the suite of annual reports to be published on 28 October 2021.
KALGOLD
The brownfields drilling campaign focused on resource extension drilling for the Windmill Zone. A total of 30 boreholes were drilled which amounts to 4745 meters of RC drilling. Geotechnical, condemnation and water borehole drilling was also carried out to support the various components of the Feasibility study and provide input into the mine planning. All proposed sites have now been cleared for the future development.
The systematic geochemical soil sampling survey was completed over the selected anomalies identified by magnetic and electro-magnetic surveys. A total of 1 806 auger holes were drilled and 3 476 outcrop samples were obtained and analysed. Integration of these results with all historical geological information was concluded and identified excellent drilling targets associated with favourable cherty BIF sequence, the main host rock of Kalgold mineralisation.
TARGET NORTH
The exploration drilling programme from surface advanced well and a total of 3 744m was drilled. At MAL21A borehole the first long directional deflection targeting the VCR to the west of the original intersection was completed including a set of short grade variability deflections. Deflection drilling continues. The average grade of reef intersections obtained from the mother hole and short deflections is 10g/t over the 110cm stoping width. Drilling of the second borehole MAL22 commenced in January 2021 and the hole advanced to a depth of 1547m. Drilling continues in the Ventersdorp Lava.
• Kalgold exploration drilling• Target North• Tau Tona and Savuka shafts pillar extraction project studies.*
Exploration
• Wafi-Golpu.Permitting
• Kalgold expansion project• Savuka Plant Tailings Reclamation project.
Feasibility
• Zaaiplaats • Doornkop expansion• Kareerand • Great Noligwa pillar• Hidden Valley extension • Target 1• Renewable energy • Tshepong Sub 75
Projects
EXPLORATION AND PROJECTS
CREATING FUTURE VALUE
* Study work to commence during FY22.
Mineral Resources and Mineral Reserves Report 2021 7
INTRODUCTION

COMPLIANCE AND SUMMARY continuedAS AT 30 JUNE 2021
Exploration continued
PAPUA NEW GUINEA
HIDDEN VALLEY BROWNFIELD EXPLORATION
Kerimenge Prospect – The Kerimenge prospect is located approximately 8km to the west of the Hamata Processing plant. Review of existing drill data commenced with the aim of developing a new resource estimate. Kerimenge is an historic gold deposit outlined by previous explorers that contains components of refractory and free milling oxide gold mineralisation.
Webiak Prospect – Assay results were returned for drilling at the Webiak Prospect, located approximately 7.5km north of Hidden Valley (one hole for 120.5m). While no significant gold assays were obtained, results highlighted several zones of coincident anomalous silver-arsenic-antimony-mercury element anomalism consistent with the upper parts of a low sulphidation precious metal system.
WAFI-GOLPU JOINT VENTURE (Harmony 50%)
Buvu Prospect – The Buvu prospect is located approximately 2km to the northwest of the Golpu porphyry. A programme of soil sampling supported by geological reconnaissance mapping and rockchip sampling was completed to develop a gold target in the hanging wall of the Buvu Fault. Results outlined a significant gold anomaly (open to the south) which sits within an envelope of anomalous silver, lead, and zinc geochemistry. Work completed to date has confirmed the Buvu target area as having potential for an unrecognised centre of epithermal hydrothermal alteration and mineralisation.
Target North exploration site.
8 Harmony Gold Mining Company Limited

ProjectsWe have identified substantial opportunities in our existing portfolio through exploration and brownfield projects which will extend the life of some of our larger and higher-grade assets, adding lower-risk, higher-margin ounces to Harmony’s portfolio. Each project brings multiple benefits to Harmony and exceeds all our minimum criteria for allocating capital. We will continue to focus on ensuring all our mines operate safely and optimally and will continue investing across all our operations to ensure optimal production.
The salient features of our key projects are:
SOUTH AFRICA
ZAAIPLAATS PROJECT
Zaaiplaats is located to the south west of the Moab Khotsong mine in South Africa and has significant resources of 3.5Moz below the last infrastructure level. This project is expected to produce over 200 000 ounces per annum and add 24 years’ life of mine at a yield of approximately 9g/t and an estimated, real all-in sustaining cost of R512 300/kg. The major capital expenditure will be funded by Moab Khotsong. There are significant benefits to pursuing this project such as leveraging existing infrastructure, increasing ounces and sustaining jobs. Harmony has proven its ability to extract value and add life of mine time and again throughout its 71-year history.
KAREERAND EXTENSION
Mine Waste Solutions was acquired in October 2020 and is a reclamation operation in the Stilfontein/Orkney area in the North West province, and treats 2.2 million tonnes per month from historical tailings facilities through the Mine Waste Solution plant. Residue is then deposited on the existing Kareerand Tailings Storage Facility. However, this facility is running out of tailings deposition capacity. The project will require major capital to extend the existing deposition site to enable the full development of our tailings resource in the region. This project will be funded out of group cash and will deliver excellent cash flow margins once this project is completed and the Franco-Nevada streaming agreement comes to an end. This project is expected to produce approximately 100 000 ounces of gold per annum and add 16 years’ life of mine at an estimated all-in sustaining cost of R572 000/kg over the life of mine.
HIDDEN VALLEY EXTENSION
This project in Papua New Guinea will be self-funded and will extend the life of mine to 2027. We expect the project to deliver approximately 160 000oz to 200 000oz of gold per annum and 2.1Moz to 3.1Moz of silver per annum at a life of mine all-in sustaining cost of $1 017/oz.
OTHER PROJECTS ALREADY IN EXECUTION
These include the Doornkop levels 207 and 212 mining and engineering infrastructure upgrade, the Tshepong sub-75 development, the Target 1 recapitalisation and decline development as well as our renewable energy projects (which are expected to realise significant energy savings).
PAPUA NEW GUINEA
WAFI-GOLPU PROJECT
Harmony is committed to realising its aspiration of being a specialist emerging market copper-gold producer. In December 2020, following a rigorous environmental impact assessment, the Environmental Permit for the Wafi-Golpu project was approved by the Papua New Guinean Conservation and Environment Protection Authority and issued by the Director of Environment.
The Environmental Permit is required under the Papua New Guinean Environment Act and is a prerequisite for the grant of a Special Mining Lease under the Mining Act. Harmony, together with its Wafi-Golpu Joint Venture partner Newcrest Mining Limited, is currently engaging with the State of Papua New Guinea to progress permitting of the Wafi-Golpu Project and has commenced discussions with the State in relation to the Special Mining Lease.
The Wafi-Golpu Joint Venture Social License to Operate is in good standing and continues to receive support from the Project Impact Area communities, including the various coastal communities.
During FY21, several meetings took place between the Prime Minister, Deputy Prime Minister and the Wafi-Golpu Joint Venture proponents on the resumption of the permitting process, with the Prime Minister expressing his government’s desire to have it expedited.
In July 2021, engagement on a revised draft term sheet occurred.
Mineral Resources and Mineral Reserves Report 2021 9
INTRODUCTION

Banked over R1 billion in energy saving initiatives since 2016
Recorded a 33% improvement in electricity intensity year on year
34% reduction in carbon emissions intensity due to efficiency programmes and asset mix (including Mine Waste Solutions)
4.46 hectares of impacted land rehabilitated
Robust and meticulous Tailings Management strategy
Environment
Achieved record 3.38 million fatal free shifts in the fourth quarter of FY21 over our 71 year history
R488 million (US$32 million) spent on training and development for our employees
Effective Covid-19 management and vaccination roll-out strategy
74% of SA discretionary spend or R7.9 billion (US$0.5 billion) is spent on BEE compliant spend
Social
Corporate governance compliance with regulatory frameworks and legislation
Ethical leadership = ethical mining
Executive remuneration set against ESG KPIs
Embrace diversity; 27% female board representation; 20% of management is female
Lead independent director
“ To strengthen the role of the chair and ensure independence for the board where the chair is in conflict.”
Governance
ESG highlights
For further detail link to our ESG report.
Good governance is overarching and embodies everything we do as a business. Ethical leadership equals ethical mining.
ESG SUMMARY
We have implemented the necessary governance frameworks to ensure that we are held accountable and deliver on our sustainability targets and ambitions. Our sustainable development strategy is an all-encompassing risk-based strategy – one in which all the components of the business are considered, and the various capitals are weighed up against each other.
E, S and G are all interlinked and inform our sustainability framework.
On 22 June 2021, Harmony held its inaugural investor ESG day. The virtual event was streamed via Harmony’s dedicated YouTube channel, ‘Harmony Gold’. The theme for the day was “Who cares, wins” with the key message being that we understand the importance of mining for the future, and as the South African gold mining champion, we have illustrated time and again that sustainability is the driving force of our business.
Our copper-gold aspirations will ensure we continue to deliver on the “E” in ESG while our response to the Covid-19 pandemic, combined with our existing health and wellness initiatives, job creation and enterprise development, clearly demonstrate that the “S” in ESG is part of Harmony’s DNA. Good governance is non-negotiable and is demonstrated through our transparency and governance structures throughout our company.
Renewable energy and powerWe are pleased to report a reduction in our water, energy and emission intensities as a result of our focus on driving efficiencies combined with our sizeable surface source business. In addition, we have embarked on our renewable energy journey which will be rolled out in a phased approach. Our initial phase will see the construction 3 x 10 Megawatts (MW) (30MW) solar plants in the Free State province, with plans in the next phase for an additional
70-80MW of renewable energy over the next 18 months. In addition to these two phases, we have a pipeline of renewable and alternative energy projects in various stages of development.
We have also implemented more than 200 energy savings initiatives which have yielded an estimated savings of R1 billion since 2016 and an energy reduction of approximately 1.3 terawatt hours or 1.2 million tonnes of carbon dioxide.
Climate change and environmental reportingIn October 2021, we will publish our second Task Force for Climate-related Financial Disclosure report alongside our ESG report and as part of our suite of annual reports.
External recognition
Our ESG efforts have resulted in our inclusion in the FTSE4Good Index where we continue to outperform the gold sub-sector and basic metals sector averages.
In FY21, MSCI upgraded Harmony’s score to a ‘B’ rating on the back of our strong governance framework.
We were included in the Bloomberg Gender-Equality Index for a third consecutive year as well as the Standard Bank Top gender empowerment company 2021.
It is evident from these external recognitions and continual improvements in our ratings that we are committed to a greener and more equitable future, creating and sharing value for all our stakeholders.
10 Harmony Gold Mining Company Limited

DIRECTORS: JE Murphy (Managing), AH Hart, RA Heins (British), C Madamombe (Zimbabwean), D Portela, GK Wilson
Mineral Corporation Consultancy (Pty) Ltd Homestead Office Park P O Box 1346 Tel: +27 11 463 4867 Reg. No. 1995/000999/07 65 Homestead Avenue Cramerview Fax: +27 11 706 8616 Trading as: The Mineral Corporation Bryanston 2021 South Africa 2060 South Africa email: [email protected]
www.mineralcorp.co.za
Mr A J Boshoff 12 August 2021 Executive: Mineral Resources and Reserves Harmony Gold Mining Company Limited Randfontein Office Park Corner Main Reef Road and Ward Avenue Randfontein Dear Mr Boshoff INDEPENDENT AUDIT OF THE 2021 MINERAL RESOURCES AND MINERAL RESERVES Mineral Corporation Consultancy (Pty) Limited (The Mineral Corporation or TMC), at the request of Harmony Gold Mining Company Limited (Harmony), carried out an independent audit (the Audit) of the 30 June 2021 Mineral Resource and Mineral Reserve Estimates and Mineral Resource and Mineral Reserve Statements for Harmony’s various gold operations in South Africa (Harmony SA Operations). The Mineral Resource and Mineral Reserve Estimates audited by TMC were prepared and signed off as at 30 June 2021 by in-house Competent Persons appointed by Harmony following the guidelines of the 2016 Edition of the South African Code for the Reporting of Exploration Results, Mineral Resources and Mineral Reserves (The SAMREC Code, 2016), as required for inclusion in the Group Mineral Resources and Mineral Reserves Statement for 2021, and disclosed according to Section 12 of the JSE Limited Listing Requirements and the United States Securities and Exchange Commission's (SEC's) Industry Guide 7. The Audit was carried out by Mineral Resource and Mineral Reserve Competent Persons from TMC following a risk-based audit methodology with reference to the guidelines of The SAMREC Code (2016). This entailed systematic and detailed reviews of the key elements of the Mineral Resource and Mineral Reserve estimation processes to validate adherence to internal procedures and to identify any fatal flaws and material errors and/or omissions for remediation by Harmony. The Audit also included detailed reviews of the input base data, grade block models, Modifying Factors, Life of Mine plans, economic testing and classification and reporting of the Mineral Resources and Mineral Reserves. The Doornkop and Mponeng gold operations were selected for detailed audit focus whereas the remainder of the operations were subjected to high-level audit. TMC could not identify any fatal flaws or material errors and/or omissions in relation to the input data, geological modelling, mine planning and estimation, classification and reporting of the 2021 Mineral Resources and Mineral Reserves for Harmony SA Operations. The input data, estimation process flow and final estimates were subjected to scrutiny and validation before sign-off by Competent Persons. The Modifying Factors and planning parameters employed to develop Life of Mine plans for the various operations were benchmarked to historical performance. The Mineral Resource Estimates satisfy The SAMREC Code (2016) requirements for reasonable prospects for eventual economic extraction while the Life of Mine plans and the Mineral Reserves were tested for economic viability using reasonable economic parameters and price forecasts. TMC concludes that the Mineral Resources and Mineral Reserve Estimates for Harmony SA Operations have been compiled following Harmony’s internal procedures and the guidelines of The SAMREC Code (2016). Accordingly, the Mineral Resources and Mineral Reserve Estimates can be included in the Harmony Consolidated Mineral Resource and Mineral Reserve Statements for 2021, and disclosed according to Section 12 of the JSE Limited Listing Requirements and the SEC's Industry Guide 7. These opinions do not imply that TMC has accepted the role of Competent Person for the purpose of reporting the 30 June 2021 Mineral Resources and Mineral Reserves for the Harmony SA Operations. Such a role resides with the nominated personnel of Harmony. Yours faithfully
Darren Portela Director BSc (Honours), Pr.Sci.Nat. (400040/12)
INDEPENDENT AUDIT OPINION
DIRECTORS: JE Murphy (Managing), AH Hart, RA Heins (British), C Madamombe (Zimbabwean), D Portela, GK Wilson
Mineral Corporation Consultancy (Pty) Ltd Homestead Office Park P O Box 1346 Tel: +27 11 463 4867 Reg. No. 1995/000999/07 65 Homestead Avenue Cramerview Fax: +27 11 706 8616 Trading as: The Mineral Corporation Bryanston 2021 South Africa 2060 South Africa email: [email protected]
www.mineralcorp.co.za
Mr A J Boshoff 12 August 2021 Executive: Mineral Resources and Reserves Harmony Gold Mining Company Limited Randfontein Office Park Corner Main Reef Road and Ward Avenue Randfontein Dear Mr Boshoff INDEPENDENT AUDIT OF THE 2021 MINERAL RESOURCES AND MINERAL RESERVES Mineral Corporation Consultancy (Pty) Limited (The Mineral Corporation or TMC), at the request of Harmony Gold Mining Company Limited (Harmony), carried out an independent audit (the Audit) of the 30 June 2021 Mineral Resource and Mineral Reserve Estimates and Mineral Resource and Mineral Reserve Statements for Harmony’s various gold operations in South Africa (Harmony SA Operations). The Mineral Resource and Mineral Reserve Estimates audited by TMC were prepared and signed off as at 30 June 2021 by in-house Competent Persons appointed by Harmony following the guidelines of the 2016 Edition of the South African Code for the Reporting of Exploration Results, Mineral Resources and Mineral Reserves (The SAMREC Code, 2016), as required for inclusion in the Group Mineral Resources and Mineral Reserves Statement for 2021, and disclosed according to Section 12 of the JSE Limited Listing Requirements and the United States Securities and Exchange Commission's (SEC's) Industry Guide 7. The Audit was carried out by Mineral Resource and Mineral Reserve Competent Persons from TMC following a risk-based audit methodology with reference to the guidelines of The SAMREC Code (2016). This entailed systematic and detailed reviews of the key elements of the Mineral Resource and Mineral Reserve estimation processes to validate adherence to internal procedures and to identify any fatal flaws and material errors and/or omissions for remediation by Harmony. The Audit also included detailed reviews of the input base data, grade block models, Modifying Factors, Life of Mine plans, economic testing and classification and reporting of the Mineral Resources and Mineral Reserves. The Doornkop and Mponeng gold operations were selected for detailed audit focus whereas the remainder of the operations were subjected to high-level audit. TMC could not identify any fatal flaws or material errors and/or omissions in relation to the input data, geological modelling, mine planning and estimation, classification and reporting of the 2021 Mineral Resources and Mineral Reserves for Harmony SA Operations. The input data, estimation process flow and final estimates were subjected to scrutiny and validation before sign-off by Competent Persons. The Modifying Factors and planning parameters employed to develop Life of Mine plans for the various operations were benchmarked to historical performance. The Mineral Resource Estimates satisfy The SAMREC Code (2016) requirements for reasonable prospects for eventual economic extraction while the Life of Mine plans and the Mineral Reserves were tested for economic viability using reasonable economic parameters and price forecasts. TMC concludes that the Mineral Resources and Mineral Reserve Estimates for Harmony SA Operations have been compiled following Harmony’s internal procedures and the guidelines of The SAMREC Code (2016). Accordingly, the Mineral Resources and Mineral Reserve Estimates can be included in the Harmony Consolidated Mineral Resource and Mineral Reserve Statements for 2021, and disclosed according to Section 12 of the JSE Limited Listing Requirements and the SEC's Industry Guide 7. These opinions do not imply that TMC has accepted the role of Competent Person for the purpose of reporting the 30 June 2021 Mineral Resources and Mineral Reserves for the Harmony SA Operations. Such a role resides with the nominated personnel of Harmony. Yours faithfully
Darren Portela Director BSc (Honours), Pr.Sci.Nat. (400040/12)
Mineral Resources and Mineral Reserves Report 2021 11
INTRODUCTION

RELATIONSHIP BETWEEN HARMONY’S MINERAL RESOURCES AND MINERAL RESERVES
SOUTH AFRICA UNDERGROUND
Incr
easi
ng le
vel o
f ge
osci
enti
fic
know
ledg
e an
d co
nfide
nce
Mineral Resources (total) Mineral Reserves (total)Tonnes Gold Tonnes Gold
Mt g/t 000kg 000oz Mt g/t 000kg 000oz262.1 9.96 2 611 83 957 70.5 6.31 445 14 299
Reported as in situ mineralisation estimates Reported as mineable production estimates
InferredTonnes Gold
Mt g/t 000kg 000oz99.3 10.25 1 019 32 746
Indicated ProbableTonnes Gold Tonnes Gold
Mt g/t 000kg 000oz Mt g/t 000kg 000oz88.6 10.50 930 29 909 30.8 6.91 213 6 846
Measured ProvedTonnes Gold Tonnes Gold
Mt g/t 000kg 000oz Mt g/t 000kg 000oz
74.2 8.93 663 21 301 39.6 5.85 232 7 453
Consideration of mining, metallurgical, economic, marketing, legal, environmental, social and governmental factors (the modifying factors)
SOUTH AFRICA – SURFACE (INCLUDING KALGOLD)
Incr
easi
ng le
vel o
f ge
osci
enti
fic
know
ledg
e an
d co
nfide
nce
Mineral Resources (total) Mineral Reserves (total)Tonnes Gold Tonnes Gold
Mt g/t 000kg 000oz Mt g/t 000kg 000oz1 769.0 0.28 497 15 971 1 236.6 0.26 325 10 440
Reported as in situ mineralisation estimates Reported as mineable production estimates
InferredTonnes Gold
Mt g/t 000kg 000oz63.3 0.32 20 642
Indicated ProbableTonnes Gold Tonnes Gold
Mt g/t 000kg 000oz Mt g/t 000kg 000oz1 368.6 0.28 384 12 361 1 029.4 0.26 266 8 550
Measured ProvedTonnes Gold Tonnes Gold
Mt g/t 000kg 000oz Mt g/t 000kg 000oz
337.1 0.27 92 2 968 207.2 0.28 59 1 890
Consideration of mining, metallurgical, economic, marketing, legal, environmental, social and governmental factors (the modifying factors)
12 Harmony Gold Mining Company Limited

SOUTH AFRICA – TOTAL
Incr
easi
ng le
vel o
f ge
osci
enti
fic
know
ledg
e an
d co
nfide
nce
Mineral Resources (total) Mineral Reserves (total)Tonnes Gold Tonnes Gold
Mt 000kg 000oz Mt 000kg 000oz2 031.1 3 108 99 928 1 307.1 769 24 739
Reported as in situ mineralisation estimates Reported as mineable production estimates
InferredTonnes Gold
Mt 000kg 000oz162.6 1 039 33 389
Indicated ProbableTonnes Gold Tonnes Gold
Mt 000kg 000oz Mt 000kg 000oz1 457.1 1 315 42 271 1 060.3 479 15 397
Measured ProvedTonnes Gold Tonnes Gold
Mt 000kg 000oz Mt 000kg 000oz
411.3 755 24 268 246.8 291 9 343
Consideration of mining, metallurgical, economic, marketing, legal, environmental, social and governmental factors (the modifying factors)
PAPUA NEW GUINEA – ATTRIBUTABLE GOLD
Incr
easi
ng le
vel o
f ge
osci
enti
fic
know
ledg
e an
d co
nfide
nce
Mineral Resources (total) Mineral Reserves (total)Tonnes Gold Tonnes Gold
Mt g/t 000kg 000oz Mt g/t 000kg 000oz805.9 0.70 561 17 956 223.5 0.92 206 6 634
Reported as in situ mineralisation estimates Reported as mineable production estimates
InferredTonnes Gold
Mt g/t 000kg 000oz352.6 0.41 144 4 567
Indicated ProbableTonnes Gold Tonnes Gold
Mt g/t 000kg 000oz Mt g/t 000kg 000oz449.9 0.92 414 13 385 220.1 0.92 203 6 530
Measured ProvedTonnes Gold Tonnes Gold
Mt g/t 000kg 000oz Mt g/t 000kg 000oz
3.4 0.95 3 103 3.4 0.95 3 103
Consideration of mining, metallurgical, economic, marketing, legal, environmental, social and governmental factors (the modifying factors)
Mineral Resources and Mineral Reserves Report 2021 13
MINERAL RESOURCES AND MINERAL RESERVES

RELATIONSHIP BETWEEN HARMONY’S MINERAL RESOURCES AND MINERAL RESERVES continued
TOTAL ATTRIBUTABLE GOLD – HARMONY UNDERGROUND AND SURFACE
Incr
easi
ng le
vel o
f ge
osci
enti
fic
know
ledg
e an
d co
nfide
nce
Mineral Resources (total) Mineral Reserves (total)Tonnes Gold Tonnes Gold
Mt 000kg 000oz Mt 000kg 000oz2 837.0 3 669 117 884 1 530.6 976 31 373
Reported as in situ mineralisation estimates Reported as mineable production estimates
InferredTonnes Gold
Mt 000kg 000oz515.2 1 183 37 956
Indicated ProbableTonnes Gold Tonnes Gold
Mt 000kg 000oz Mt 000kg 000oz1 907.1 1 729 55 656 1 280.4 682 21 927
Measured ProvedTonnes Gold Tonnes Gold
Mt 000kg 000oz Mt 000kg 000oz
414.7 758 24 372 250.2 294 9 446
Consideration of mining, metallurgical, economic, marketing, legal, environmental, social and governmental factors (the modifying factors)
TOTAL ATTRIBUTABLE GOLD EQUIVALENTS – HARMONY UNDERGROUND AND SURFACE
Incr
easi
ng le
vel o
f ge
osci
enti
fic
know
ledg
e an
d co
nfide
nce
Mineral Resources (total) Mineral Reserves (total)Tonnes Gold Tonnes Gold
Mt 000kg 000oz Mt 000kg 000oz2 837.0 4 395 141 231 1 530.6 1 320 42 453
Reported as in situ mineralisation estimates Reported as mineable production estimates
InferredTonnes Gold
Mt 000kg 000oz515.2 1 379 44 262
Indicated ProbableTonnes Gold Tonnes Gold
Mt 000kg 000oz Mt 000kg 000oz1 907.1 2 258 72 672 1 280.4 1 026 32 981
Measured ProvedTonnes Gold Tonnes Gold
Mt 000kg 000oz Mt 000kg 000oz
414.7 759 24 398 250.2 295 9 472
Consideration of mining, metallurgical, economic, marketing, legal, environmental, social and governmental factors (the modifying factors)
14 Harmony Gold Mining Company Limited

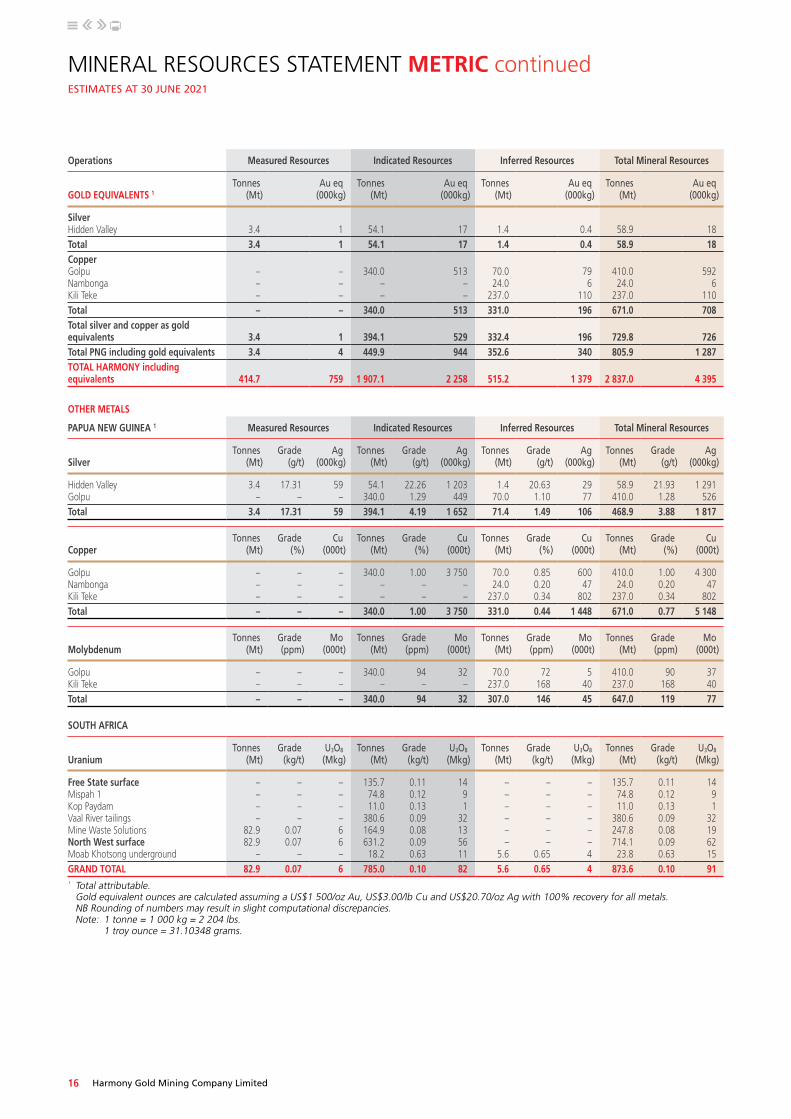
MINERAL RESOURCES STATEMENT METRICESTIMATES AT 30 JUNE 2021
Operations Measured Resources Indicated Resources Inferred Resources Total Mineral Resources
GOLDTonnes
(Mt)Grade
(g/t)Gold
(000kg)Tonnes
(Mt)Grade
(g/t)Gold
(000kg)Tonnes
(Mt)Grade
(g/t)Gold
(000kg)Tonnes
(Mt)Grade
(g/t)Gold
(000kg)
SOUTH AFRICA UNDERGROUNDFree State regionTshepong operations 24.9 11.47 286 12.3 10.61 130 35.3 10.76 380 72.5 10.98 796Bambanani 0.4 13.48 6 – – – – – – 0.4 13.48 6Joel 4.0 7.89 32 3.8 7.24 27 7.3 5.13 38 15.2 6.39 97Masimong 2.5 8.98 22 0.2 7.35 1 0.02 6.48 0.2 2.7 8.85 24Target 1 7.8 6.99 54 5.2 6.57 34 4.5 5.50 25 17.4 6.48 113Target 3 0.6 9.19 6 2.9 10.17 30 1.2 8.66 11 4.8 9.66 46Total Free State underground 40.2 10.08 406 24.3 9.15 223 48.3 9.36 453 112.9 9.57 1 081West Rand regionDoornkop South Reef 5.2 7.93 41 3.8 6.88 26 3.5 7.65 27 12.5 7.53 94Doornkop Main Reef 0.1 5.38 0.4 0.05 5.51 0.3 0.02 5.32 0.1 0.1 5.41 1Doornkop Kimberly Reef 18.1 3.36 61 12.1 3.15 38 10.1 3.28 33 40.3 3.28 132Kusasalethu 3.4 11.15 38 12.6 9.05 114 3.7 8.63 32 19.7 9.33 184Mponeng 2.9 15.61 46 21.7 14.11 306 28.1 13.60 382 52.7 13.92 733Total West Rand region 29.7 6.26 186 50.3 9.65 485 45.4 10.43 473 125.4 9.13 1 145Klerksdorp operationMoab Khotsong 4.2 16.75 71 14.0 15.95 223 5.6 16.42 92 23.8 16.20 386Total North West region 4.2 16.75 71 14.0 15.95 223 5.6 16.42 92 23.8 16.20 386TOTAL SOUTH AFRICA UNDERGROUND 74.2 8.93 663 88.6 10.50 930 99.3 10.25 1 019 262.1 9.96 2 611SOUTH AFRICA SURFACEKraaipan Greenstone BeltKalgold open pit 9.4 0.88 8 67.8 0.89 60 4.4 0.63 3 81.6 0.88 72Kalgold tailing dam – – – – – – 23.8 0.26 6 23.8 0.26 6Kalgold 9.4 0.88 8 67.8 0.89 60 28.2 0.32 9 105.4 0.74 78Free State region – SurfaceTailingsOther Free State tailings – – – 571.7 0.22 128 15.5 0.19 3 587.1 0.22 131Phoenix 42.6 0.28 12 – – – – – – 42.6 0.28 12St Helena 191.3 0.27 52 – – – – – – 191.3 0.27 52Central – – – 52.0 0.27 14 – – – 52.0 0.27 14Waste rock dumpsFree State WRD – – – 2.3 0.48 1 16.7 0.43 7 19.0 0.44 8Total Free State 233.9 0.27 63 626.0 0.23 143 32.2 0.31 10 892.1 0.24 216North West region – SurfaceTailingsMispah – – – 74.8 0.30 22 – – – 74.8 0.30 22Kop Paydam – – – 11.0 0.20 2 – – – 11.0 0.20 2Vaal River tailings 10.8 0.20 2 369.7 0.26 95 – – – 380.6 0.26 98Mine Waste Solutions 82.9 0.22 18 164.9 0.26 42 – – – 247.8 0.24 61Waste rock dumpsMoab MOD – – – 3.4 0.41 1 – – – 3.4 0.41 1Vaal River WRD – – – 3.3 0.31 1 2.9 0.28 1 6.2 0.30 2Total North West 93.80 0.22 20 627.1 0.26 165 2.9 0.28 1 723.7 0.26 186West Rand region – SurfaceTailingsWest Wits tailings – – – 45.5 0.34 16 – – – 45.5 0.34 16Waste rock dumpsWest Wits WRD – – – 2.2 0.40 1 – – – 2.2 0.40 1Total West Rand – – – 47.8 0.35 17 – – – 47.8 0.35 17TOTAL SOUTH AFRICA SURFACE (including Kalgold) 337.1 0.27 92 1 368.6 0.28 384 63.3 0.32 20 1 769.0 0.28 497TOTAL SOUTH AFRICA 411.3 755 1 457.1 1 315 162.6 1 039 2 031.1 3 108PAPUA NEW GUINEA¹Hidden Valley 3.4 0.95 3 54.1 1.42 77 1.4 1.06 1 58.9 1.39 82Hamata 0.006 1.63 0.01 1.9 1.90 4 0.2 1.50 0.3 2.1 1.86 4Wafi – – – 54.0 1.65 89 20.0 1.37 26 74.0 1.58 114Golpu – – – 340.0 0.72 245 70.0 0.63 44 410.0 0.70 289Nambonga – – – – – – 24.0 0.69 16 24.0 0.69 16Kili Teke – – – – – – 237.0 0.24 56 237.0 0.24 56Total Papua New Guinea 3.4 0.95 3 449.9 0.92 414 352.6 0.41 144 805.9 0.70 561GRAND TOTAL 414.7 758 1 907.1 1 729 515.2 1 183 2 837.0 3 669
Mineral Resources and Mineral Reserves Report 2021 15
MINERAL RESOURCES AND MINERAL RESERVES
Operations Measured Resources Indicated Resources Inferred Resources Total Mineral Resources
GOLD EQUIVALENTS 1Tonnes
(Mt)Au eq
(000kg)Tonnes
(Mt)Au eq
(000kg)Tonnes
(Mt)Au eq
(000kg)Tonnes
(Mt)Au eq
(000kg)
SilverHidden Valley 3.4 1 54.1 17 1.4 0.4 58.9 18Total 3.4 1 54.1 17 1.4 0.4 58.9 18CopperGolpu – – 340.0 513 70.0 79 410.0 592Nambonga – – – – 24.0 6 24.0 6Kili Teke – – – – 237.0 110 237.0 110Total – – 340.0 513 331.0 196 671.0 708Total silver and copper as gold equivalents 3.4 1 394.1 529 332.4 196 729.8 726Total PNG including gold equivalents 3.4 4 449.9 944 352.6 340 805.9 1 287TOTAL HARMONY including equivalents 414.7 759 1 907.1 2 258 515.2 1 379 2 837.0 4 395
OTHER METALS
PAPUA NEW GUINEA 1 Measured Resources Indicated Resources Inferred Resources Total Mineral Resources
SilverTonnes
(Mt)Grade
(g/t)Ag
(000kg)Tonnes
(Mt)Grade
(g/t)Ag
(000kg)Tonnes
(Mt)Grade
(g/t)Ag
(000kg)Tonnes
(Mt)Grade
(g/t)Ag
(000kg)
Hidden Valley 3.4 17.31 59 54.1 22.26 1 203 1.4 20.63 29 58.9 21.93 1 291Golpu – – – 340.0 1.29 449 70.0 1.10 77 410.0 1.28 526Total 3.4 17.31 59 394.1 4.19 1 652 71.4 1.49 106 468.9 3.88 1 817
CopperTonnes
(Mt)Grade
(%)Cu
(000t)Tonnes
(Mt)Grade
(%)Cu
(000t)Tonnes
(Mt)Grade
(%)Cu
(000t)Tonnes
(Mt)Grade
(%)Cu
(000t)
Golpu – – – 340.0 1.00 3 750 70.0 0.85 600 410.0 1.00 4 300Nambonga – – – – – – 24.0 0.20 47 24.0 0.20 47Kili Teke – – – – – – 237.0 0.34 802 237.0 0.34 802Total – – – 340.0 1.00 3 750 331.0 0.44 1 448 671.0 0.77 5 148
MolybdenumTonnes
(Mt)Grade(ppm)
Mo(000t)
Tonnes(Mt)
Grade(ppm)
Mo(000t)
Tonnes(Mt)
Grade(ppm)
Mo(000t)
Tonnes(Mt)
Grade(ppm)
Mo(000t)
Golpu – – – 340.0 94 32 70.0 72 5 410.0 90 37Kili Teke – – – – – – 237.0 168 40 237.0 168 40Total – – – 340.0 94 32 307.0 146 45 647.0 119 77
SOUTH AFRICA
UraniumTonnes
(Mt)Grade
(kg/t)U3O8
(Mkg)Tonnes
(Mt)Grade
(kg/t)U3O8
(Mkg)Tonnes
(Mt)Grade
(kg/t)U3O8
(Mkg)Tonnes
(Mt)Grade
(kg/t)U3O8
(Mkg)
Free State surface – – – 135.7 0.11 14 – – – 135.7 0.11 14Mispah 1 – – – 74.8 0.12 9 – – – 74.8 0.12 9Kop Paydam – – – 11.0 0.13 1 – – – 11.0 0.13 1Vaal River tailings – – – 380.6 0.09 32 – – – 380.6 0.09 32Mine Waste Solutions 82.9 0.07 6 164.9 0.08 13 – – – 247.8 0.08 19North West surface 82.9 0.07 6 631.2 0.09 56 – – – 714.1 0.09 62Moab Khotsong underground – – – 18.2 0.63 11 5.6 0.65 4 23.8 0.63 15GRAND TOTAL 82.9 0.07 6 785.0 0.10 82 5.6 0.65 4 873.6 0.10 91¹ Total attributable. Gold equivalent ounces are calculated assuming a US$1 500/oz Au, US$3.00/lb Cu and US$20.70/oz Ag with 100% recovery for all metals. NB Rounding of numbers may result in slight computational discrepancies. Note: 1 tonne = 1 000 kg = 2 204 lbs. 1 troy ounce = 31.10348 grams.
MINERAL RESOURCES STATEMENT METRIC continuedESTIMATES AT 30 JUNE 2021
16 Harmony Gold Mining Company Limited

Operations Proved Reserves Probable Reserves Total Mineral Reserves
GOLDTonnes
(Mt)Grade
(g/t)Gold ²
(000kg)Tonnes
(Mt)Grade
(g/t)Gold ²
(000kg)Tonnes
(Mt)Grade
(g/t)Gold ²
(000kg)
SOUTH AFRICA UNDERGROUNDFree State regionTshepong operations 20.0 5.77 116 4.7 4.46 21 24.7 5.53 137Joel 2.6 5.00 13 1.5 4.50 7 4.1 4.82 20Bambanani 0.6 8.48 5 – – – 0.6 8.48 5Masimong 0.7 4.37 3 0.03 3.08 0.1 0.8 4.32 3Target 1 2.9 4.46 13 1.8 3.89 7 4.7 4.24 20
Total Free State underground 26.9 5.57 150 8.0 4.33 35 34.9 5.29 185
West Rand regionDoornkop South Reef 6.0 4.73 29 4.4 4.17 19 10.5 4.49 47Kusasalethu 1.9 7.51 14 0.3 4.76 1 2.2 7.15 15Mponeng 1.9 8.72 17 5.8 8.47 49 7.7 8.53 65
Total West Rand region 9.8 6.04 59 10.5 6.55 69 20.3 6.30 128
North West regionMoab Khotsong 2.9 7.77 23 12.3 8.89 109 15.2 8.68 132
Total North West region 2.9 7.77 23 12.3 8.89 109 15.2 8.68 132
TOTAL SOUTH AFRICA UNDERGROUND 39.6 5.85 232 30.8 6.91 213 70.5 6.31 445
SOUTH AFRICA SURFACEKraaipan Greenstone BeltKalgold 6.1 0.93 6 12.5 1.12 14 18.5 1.06 20Free State region – SurfaceTailingsOther Free State tailings – – – 571.7 0.22 128 571.7 0.22 128Phoenix 42.6 0.28 12 – – – 42.6 0.28 12St Helena 108.6 0.27 29 – – – 108.6 0.27 29Central – – – 52.0 0.27 14 52.0 0.27 14
Total Free State 151.1 0.27 41 623.7 0.23 142 774.8 0.24 183
North West region – SurfaceTailingsVaal River tailings – – – 190.3 0.29 56 190.3 0.29 56Mine Waste Solutions 50.0 0.24 12 164.9 0.26 42 214.9 0.25 54
Total North West 50.0 0.24 12 355.2 0.28 98 405.1 0.27 110
West Rand – SurfaceWest Wits tailings – – – 38.2 0.32 12 38.2 0.32 12
Total West Rand – – – 38.2 0.32 12 38.2 0.32 12
TOTAL SOUTH AFRICA SURFACE (including Kalgold) 207.2 0.28 59 1 029.4 0.26 266 1 236.6 0.26 325
TOTAL SOUTH AFRICA 246.8 291 1 060.3 479 1 307.1 769
PAPUA NEW GUINEA Hidden Valley 3.4 0.95 3 19.9 1.59 32 23.3 1.50 35Hamata 0.006 1.63 0.01 0.2 1.82 0.4 0.2 1.82 0.5Golpu¹ – – – 200.0 0.86 171 200.0 0.86 171
Total Papua New Guinea 3.4 0.95 3 220.1 0.92 203 223.5 0.92 206
HV Hamata 3.4 0.95 3 20.1 1.59 32 23.5 1.50 35
GRAND TOTAL 250.2 294 1 280.4 682 1 530.6 976
MINERAL RESERVES STATEMENT METRICESTIMATES AT 30 JUNE 2021
Mineral Resources and Mineral Reserves Report 2021 17
MINERAL RESOURCES AND MINERAL RESERVES

Operations Proved Reserves Probable Reserves Total Mineral Reserves
GOLD EQUIVALENTSTonnes
(Mt)Au eq 2
(000kg)Tonnes
(Mt)Au eq 2
(000kg)Tonnes
(Mt)Au eq 2
(000kg)
SilverHidden Valley 3.4 1 19.9 7 23.3 8CopperGolpu¹ – – 200.0 336 200.0 336
Total silver and copper as gold equivalents 3.4 1 219.9 344 223.3 345
Total PNG including gold equivalents 3.4 4 220.1 547 223.5 551
TOTAL HARMONY including equivalents 250.2 295 1 280.4 1 026 1 530.6 1 320
OTHER METALS
PAPUA NEW GUINEA Proved Reserves Probable Reserves Total Mineral Reserves
SilverTonnes
(Mt)Grade
(g/t) Ag ²
(000kg)Tonnes
(Mt)Grade
(g/t) Ag ²
(000kg)Tonnes
(Mt)Grade
(g/t) Ag ²
(000kg)
Hidden Valley 3.4 17.31 59 19.9 27.18 540 23.3 25.75 599
CopperTonnes
(Mt)Grade
(%)Cu 2
(000t)Tonnes
(Mt)Grade
(%)Cu 2
(000t)Tonnes
(Mt)Grade
(%)Cu 2
(000t)
Golpu¹ – – – 200.0 1.20 2 450 200.0 1.20 2 450
MolybdenumTonnes
(Mt)Grade
ppmMo ²
(000t)Tonnes
(Mt)Grade
ppmMo ²
(000t)Tonnes
(Mt)Grade
ppmMo ²
(000t)
Golpu – – – – – – – – –
SOUTH AFRICA
UraniumTonnes
(Mt)Grade
(kg/t)U3O8 ²(Mkg)
Tonnes(Mt)
Grade(kg/t)
U3O8 ²(Mkg)
Tonnes(Mt)
Grade(kg/t)
U3O8 ²(Mkg)
Moab Khotsong underground – – – 15.2 0.25 4 15.2 0.25 4
¹ Total attributable. Gold equivalent ounces are calculated assuming a US$1 500/oz Au, US$3.00/lb Cu and US$20.70/oz Ag with 100% recovery for all metals.² Metal figures are fully inclusive of all mining dilutions and gold losses, and are reported as mill delivered tonnes and head grades. Metallurgical recovery
factors have not been applied to the reserve figures. NB Rounding of numbers may result in slight computational discrepancies. Note: 1 tonne = 1 000 kg = 2 204 lbs. 1 troy ounce = 31.10348 grams.
MINERAL RESERVES STATEMENT METRIC continuedESTIMATES AT 30 JUNE 2021
18 Harmony Gold Mining Company Limited

Operations Measured Resources Indicated Resources Inferred Resources Total Mineral Resources
GOLDTons(Mt)
Grade(oz/t)
Gold(000oz)
Tons(Mt)
Grade(oz/t)
Gold(000oz)
Tons(Mt)
Grade(oz/t)
Gold(000oz)
Tons(Mt)
Grade(oz/t)
Gold(000oz)
SOUTH AFRICA UNDERGROUNDFree State regionTshepong operations 27.5 0.335 9 195 13.5 0.309 4 191 38.9 0.314 12 210 79.9 0.320 25 596Bambanani 0.5 0.393 181 – – – – – – 0.5 0.393 181Joel 4.5 0.230 1 026 4.2 0.211 878 8.1 0.149 1 209 16.7 0.186 3 113Masimong 2.7 0.262 710 0.2 0.215 42 0.03 0.189 5 2.9 0.258 757Target 1 8.6 0.204 1 750 5.7 0.192 1 089 4.9 0.161 788 19.2 0.189 3 627Target 3 0.7 0.268 178 3.3 0.297 965 1.3 0.253 340 5.3 0.282 1 483Total Free State underground 44.4 0.294 13 040 26.8 0.267 7 164 53.3 0.273 14 553 124.5 0.279 34 756West Rand regionDoornkop South Reef 5.7 0.231 1 326 4.2 0.201 838 3.9 0.223 860 13.8 0.220 3 024Doornkop Main Reef 0.1 0.157 14 0.1 0.161 8 0.02 0.155 3 0.2 0.158 25Doornkop Kimberly Reef 20.0 0.098 1 957 13.4 0.092 1 226 11.1 0.096 1 066 44.5 0.096 4 249Kusasalethu 3.8 0.325 1 226 13.9 0.264 3 668 4.1 0.252 1 026 21.7 0.272 5 919Mponeng 3.2 0.455 1 464 23.9 0.412 9 851 30.9 0.397 12 266 58.1 0.406 23 581Total West Rand region 32.8 0.183 5 987 55.4 0.281 15 591 50.0 0.304 15 221 138.2 0.266 36 798Klerksdorp operationMoab Khotsong 4.7 0.489 2 274 15.4 0.465 7 155 6.2 0.479 2 973 26.2 0.473 12 402Total North West region 4.7 0.489 2 274 15.4 0.465 7 155 6.2 0.479 2 973 26.2 0.473 12 402TOTAL SOUTH AFRICA UNDERGROUND 81.8 0.260 21 301 97.6 0.306 29 909 109.5 0.299 32 746 288.9 0.291 83 957SOUTH AFRICA SURFACEKraaipan Greenstone BeltKalgold 10.4 0.026 268 74.7 0.026 1 942 4.8 0.018 89 89.9 0.026 2 299Kalgold tailing dam – – – – – – 26.2 0.008 201 26.2 0.008 201Total Kalgold 10.4 0.026 268 74.7 0.026 1 942 31.1 0.009 290 116.2 0.022 2 501Free State region – SurfaceTailingsOther Free State tailings – – – 630.2 0.007 4 106 17.0 0.006 94 647.2 0.006 4 200Phoenix 46.9 0.008 385 – – – – – – 46.9 0.008 385St Helena 210.9 0.008 1 656 – – – – – – 210.9 0.008 1 656Central – – – 57.3 0.008 450 – – – 57.3 0.008 450Waste rock dumpsFree State WRD – – – 2.5 0.014 36 18.4 0.013 231 21.0 0.013 267Total Free State 257.8 0.008 2 041 690.0 0.007 4 591 35.5 0.009 326 983.3 0.007 6 958North West region – SurfaceTailingsMispah – – – 82.4 0.009 719 – – – 82.4 0.009 719Kop Paydam – – – 12.1 0.006 72 – – – 12.1 0.006 72Vaal River tailings 11.9 0.006 70 407.6 0.008 3 070 – – – 419.5 0.007 3 140Mine Waste Solutions 91.4 0.006 588 181.8 0.007 1 358 – – – 273.2 0.007 1 946Waste rock dumpsMoab MOD – – – 3.7 0.012 45 – – – 3.7 0.012 45Vaal River WRD – – – 3.7 0.009 33 3.2 0.008 26 6.9 0.009 60Total North West 103.4 0.006 659 691.2 0.008 5 296 3.2 0.008 26 797.8 0.007 5 981West Rand region – SurfaceTailingsWest Wits tailings – – – 50.2 0.010 503 – – – 50.2 0.010 503Waste rock dumpsWest Wits WRD – – – 2.5 0.012 29 – – – 2.5 0.012 29Total West Rand – – – 52.6 0.010 532 – – – 52.6 0.010 532TOTAL SOUTH AFRICA SURFACE (including Kalgold) 371.6 0.008 2 968 1 508.6 0.008 12 361 69.8 0.009 642 1 950.0 0.008 15 971TOTAL SOUTH AFRICA 453.4 24 268 1 606.2 42 271 179.3 33 389 2 238.9 99 928PAPUA NEW GUINEA ¹Hidden Valley 3.7 0.028 103 59.6 0.041 2 471 1.6 0.031 48 64.9 0.040 2 622Hamata 0.007 0.048 0.33 2.1 0.055 115 0.2 0.044 9 2.3 0.054 124Kili Teke – – – – – – 261.2 0.007 1 810 261.2 0.007 1 810Wafi – – – 59.5 0.047 2 800 22.0 0.036 800 81.6 0.044 3 600Golpu – – – 374.8 0.021 8 000 77.2 0.018 1 400 451.9 0.021 9 300Nambonga – – – – – – 26.5 0.019 500 26.5 0.019 500Total Papua New Guinea 3.7 0.028 103 496.0 0.027 13 385 388.6 0.012 4 567 888.4 0.020 17 956GRAND TOTAL 457.1 24 372 2 102.2 55 656 567.9 37 956 3 127.2 117 884
MINERAL RESOURCES STATEMENT IMPERIALESTIMATES AT 30 JUNE 2021
Mineral Resources and Mineral Reserves Report 2021 19
MINERAL RESOURCES AND MINERAL RESERVES

Operations Measured Resources Indicated Resources Inferred Resources Total Mineral Resources
GOLD EQUIVALENTS 1Tons(Mt)
Au eq(000oz)
Tons(Mt)
Au eq(000oz)
Tons(Mt)
Au eq(000oz)
Tons(Mt)
Au eq(000oz)
SilverHidden Valley 3.7 26 59.6 534 1.6 13 64.9 573Total 3.7 26 59.6 534 1.6 13 64.9 573CopperGolpu – – 374.8 16 482 77.2 2 548 451.9 19 030Nambonga – – – – 26.5 207 26.5 207Kili Teke – – – – 261.2 3 538 261.2 3 538Total – – 374.8 16 482 364.8 6 293 739.6 22 775Total Silver and Copper as gold equivalents 3.7 26 434.4 17 016 366.4 6 306 804.5 23 347Total PNG including gold equivalents 3.7 129 496.0 30 401 388.6 10 873 888.4 41 304TOTAL HARMONY including equivalents 457.1 24 398 2 102.2 72 672 567.9 44 262 3 127.2 141 231
OTHER METALS
PAPUA NEW GUINEA 1 Measured Resources Indicated Resources Inferred Resources Total Mineral Resources
SilverTons(Mt)
Grade(oz/t)
Ag(000oz)
Tons(Mt)
Grade(oz/t)
Ag(000oz)
Tons(Mt)
Grade(oz/t)
Ag(000oz)
Tons(Mt)
Grade(oz/t)
Ag(000oz)
Hidden Valley 3.7 0.505 1 886 59.6 0.649 38 682 1.6 0.602 941 64.9 0.640 41 508Golpu – – – 374.8 0.037 14 000 77.2 0.030 2 300 451.9 0.038 17 000Nambonga – – – – – – – – – – – –Total 3.7 0.505 1 886 434.4 0.121 52 682 78.7 0.041 3 241 516.8 0.113 58 508
CopperTons(Mt)
Grade(%)
Cu(Mlb)
Tons(Mt)
Grade(%)
Cu(Mlb)
Tons(Mt)
Grade(%)
Cu(Mlb)
Tons(Mt)
Grade(%)
Cu(Mlb)
Golpu – – – 374.8 1.001 8 250 77.2 0.778 1 250 451.9 0.963 9 500Nambonga – – – – – – 26.5 0.177 104 26.5 0.177 104Kili Teke – – – – – – 261.2 0.307 1 767 261.2 0.307 1 767Total – – – 374.8 1.001 8 250 364.8 0.397 3 120 739.6 0.594 11 370
MolybdenumTons(Mt)
Grade(lb/t)
Mo(Mlb)
Tons(Mt)
Grade(lb/t)
Mo(Mlb)
Tons(Mt)
Grade(lb/t)
Mo(Mlb)
Tons(Mt)
Grade(lb/t)
Mo(Mlb)
Golpu – – – 374.8 0.188 70 77.2 0.143 11 451.9 0.180 81Kili Teke – – – – – – 261.2 0.335 88 261.2 0.335 88Total – – – 374.8 0.188 70 338.4 0.291 99 713.2 0.237 169
SOUTH AFRICA
UraniumTons(Mt)
Grade(lb/t)
U3O8(Mlb)
Tons(Mt)
Grade(lb/t)
U3O8(Mlb)
Tons(Mt)
Grade(lb/t)
U3O8(Mlb)
Tons(Mt)
Grade(lb/t)
U3O8(Mlb)
Free State surface – – – 149.5 0.213 32 – – – 149.5 0.213 32Mispah 1 – – – 82.4 0.242 20 – – – 82.4 0.242 20Kop Paydam – – – 12.1 0.260 3 – – – 12.1 0.260 3Vaal River tailings – – – 419.5 0.171 72 – – – 419.5 0.171 72Mine Waste Solutions 91.4 0.136 12 181.8 0.162 30 – – – 273.2 0.154 42North West Surface 91.4 0.136 12 695.8 0.178 124 – – – 787.2 0.174 137Moab underground – – – 20.0 1.252 25 6.2 1.295 8 26.2 1.262 33GRAND TOTAL 91.4 0.136 12 865.3 0.209 181 6.2 1.295 8 963.0 0.209 202
¹ Total attributable. Gold equivalent ounces are calculated assuming a US$1 500/oz Au, US$3.00/lb Cu and US$20.70/oz Ag with 100% recovery for all metals. NB Rounding of numbers may result in slight computational discrepancies. Note: 1 ton = 907 kg = 2 000 lbs. 1 troy ounce = 32.1507 grams.
MINERAL RESOURCES STATEMENT IMPERIAL continuedESTIMATES AT 30 JUNE 2021
20 Harmony Gold Mining Company Limited

Operations Proved Reserves Probable Reserves Total Mineral Reserves
GOLDTons(Mt)
Grade(oz/t)
Gold ²(000oz)
Tons(Mt)
Grade(oz/t)
Gold ²(000oz)
Tons(Mt)
Grade(oz/t)
Gold ²(000oz)
SOUTH AFRICA UNDERGROUNDFree State regionTshepong operations 22.1 0.168 3 722 5.2 0.130 672 27.3 0.161 4 394Bambanani 0.6 0.247 152 – – – 0.6 0.247 152Joel 2.9 0.146 423 1.6 0.131 215 4.5 0.141 639Masimong 0.8 0.127 105 0.03 0.090 3 0.9 0.126 108Target 1 3.2 0.130 416 2.0 0.113 231 5.2 0.124 647
Total Free State underground 29.6 0.163 4 818 8.9 0.126 1 121 38.5 0.154 5 939
West Rand regionDoornkop South Reef 6.7 0.138 918 4.9 0.122 596 11.5 0.131 1 513Kusasalethu 2.1 0.219 455 0.3 0.139 43 2.4 0.209 498Mponeng 2.1 0.254 535 6.3 0.247 1 569 8.5 0.249 2 104
Total West Rand region 10.8 0.176 1 907 11.6 0.191 2 208 22.4 0.184 4 115
North West regionMoab Khotsong 3.2 0.227 727 13.6 0.259 3 518 16.8 0.253 4 245
Total North West region 3.2 0.227 727 13.6 0.259 3 518 16.8 0.253 4 245
TOTAL SOUTH AFRICA UNDERGROUND 43.7 0.171 7 453 34.0 0.201 6 846 77.7 0.184 14 299
SOUTH AFRICA SURFACEKraaipan Greenstone BeltKalgold 6.7 0.027 182 13.7 0.033 449 20.4 0.031 631Free State region – SurfaceTailingsOther Free State tailings – – – 630.2 0.007 4 106 630.2 0.007 4 106Phoenix 46.9 0.008 385 – – – 46.9 0.008 385St Helena 119.7 0.008 933 – – – 119.7 0.008 933Central – – – 57.3 0.008 450 57.3 0.008 450
Total Free State 166.6 0.008 1 318 687.5 0.007 4 555 854.1 0.007 5 873
North West region – SurfaceTailingsVaal River tailings – – – 209.7 0.009 1 789 209.7 0.009 1 789Mine Waste Solutions 55.1 0.007 390 181.8 0.007 1 358 236.9 0.007 1 749
Total North West 55.1 0.007 390 391.5 0.008 3 148 446.6 0.008 3 538
West Rand – SurfaceWest Wits tailings – – – 42.1 0.009 398 42.1 0.009 398
Total West Rand – – – 42.1 0.009 398 42.1 0.009 398
TOTAL SOUTH AFRICA SURFACE (including Kalgold) 228.4 0.008 1 890 1 134.8 0.008 8 550 1 363.1 0.008 10 440
TOTAL SOUTH AFRICA 272.0 9 343 1 168.8 15 397 1 440.8 24 739
PAPUA NEW GUINEAHidden Valley 3.7 0.028 103 21.9 0.046 1 016 25.6 0.044 1 119Hamata 0.007 0.048 0.33 0.3 0.053 14 0.3 0.053 15Golpu ¹ – – – 220.5 0.025 5 500 220.5 0.025 5 500
Total Papua New Guinea 3.7 0.028 103 242.6 0.027 6 530 246.4 0.027 6 634
HV Hamata 3.7 0.028 103 22.2 0.046 1 030 25.9 0.044 1 134
GRAND TOTAL 275.8 9 446 1 411.4 21 927 1 687.2 31 373
MINERAL RESERVES STATEMENT IMPERIALESTIMATES AT 30 JUNE 2021
Mineral Resources and Mineral Reserves Report 2021 21
MINERAL RESOURCES AND MINERAL RESERVES

Operations Proved Reserves Probable Reserves Total Mineral Reserves
GOLD EQUIVALENTSTons(Mt)
Au eq 2
(000oz)Tons(Mt)
Au eq 2
(000oz)Tons(Mt)
Au eq 2
(000oz)
SilverHidden Valley 3.7 26 21.9 240 25.6 266CopperGolpu¹ – – 220.5 10 814 220.5 10 814
Total Silver and Copper as gold equivalents 3.7 26 242.4 11 054 246.1 11 080
Total PNG including gold equivalents 3.7 129 242.6 17 584 246.4 17 714
TOTAL HARMONY including equivalents 275.8 9 472 1 411.4 32 981 1 687.2 42 453
OTHER METALS
PAPUA NEW GUINEA 1 Proved Reserves Probable Reserves Total Mineral Reserves
SilverTons(Mt)
Grade(oz/t)
Ag 2
(000oz)Tons(Mt)
Grade(oz/t)
Ag 2
(000oz)Tons(Mt)
Grade(oz/t)
Ag 2
(000oz)
Hidden Valley 3.7 0.505 1 886 21.9 0.793 17 363 25.6 0.751 19 249
CopperTons(Mt)
Grade(%)
Cu ²(Mlb)
Tons(Mt)
Grade(%)
Cu ²(Mlb)
Tons(Mt)
Grade(%)
Cu ²(Mlb)
Golpu – – – 220.5 1.111 5 400 220.5 1.111 5 400
SOUTH AFRICA
UraniumTons(Mt)
Grade(lb/t)
U3O8 ²(Mlb)
Tons(Mt)
Grade(lb/t)
U3O8 ²(Mlb)
Tons(Mt)
Grade(lb/t)
U3O8 ²(Mlb)
Moab Khotsong underground – – – 16.8 0.493 8 16.8 0.493 8
¹ Total attributable. Gold equivalent ounces are calculated assuming a US$1 500/oz Au, US$3.00/lb Cu and US$20.70/oz Ag with 100% recovery for all metals.² Metal figures are fully inclusive of all mining dilutions and gold losses, and are reported as mill delivered tonnes and head grades. Metallurgical recovery
factors have not been applied to the reserve figures. NB Rounding of numbers may result in slight computational discrepancies. Note: 1 ton = 907 kg = 2 000 lbs. 1 troy ounce = 32.1507 grams.
MINERAL RESERVES STATEMENT IMPERIAL continuedESTIMATES AT 30 JUNE 2021
22 Harmony Gold Mining Company Limited

MINERAL RESOURCE AND MINERAL RESERVE RECONCILIATION
MINERAL RESOURCESAs at 30 June 2021, attributable gold equivalent Mineral Resources were 141.2Moz, up from 118.6Moz in June 2020. The following tables show the year on year reconciliation of the Mineral Resources.
Mineral Resource reconciliation – gold and gold equivalents
kg (000) Moz
June 2020 – Gold and gold equivalents 3 690 118.6Changes during FY21:Mined (72) (2.3)Net of additions at Mponeng and Mine Waste Solutions 884 28.4Gold equivalents (110) (3.5)
June 2021 – Gold and gold equivalents 4 393 141.2
June 2020gold and gold equivalents
MinedduringFY21
Net of additionsat Mponeng and
Mine WasteSolutions
Goldequivalents
June 2021gold and goldequivalents
26.9
91.8
2.3
3.5 23.3
117.928.4
Mineral Resource reconciliationJune 2020 vs June 2021
(Moz)
140
120
100
80
60
40
20
0
Gold Gold equivalents
Mineral Resources and Mineral Reserves Report 2021 23
MINERAL RESOURCES AND MINERAL RESERVES
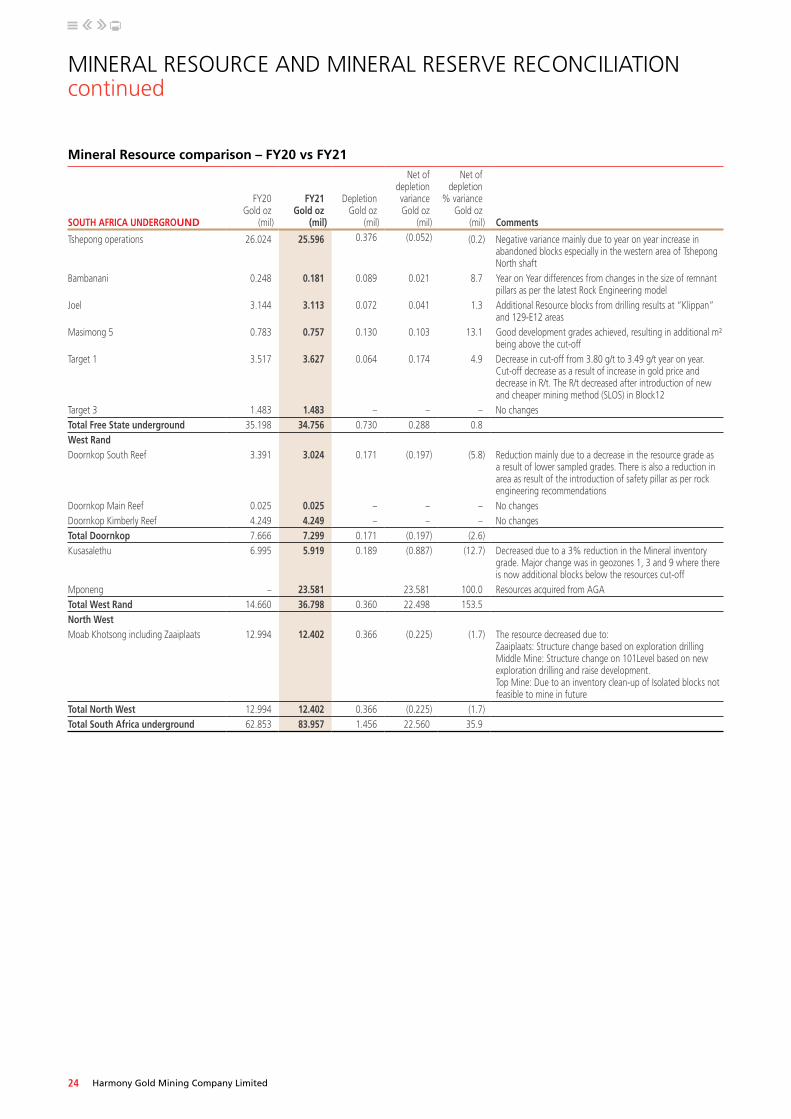
Mineral Resource comparison – FY20 vs FY21
SOUTH AFRICA UNDERGROUND
FY20 Gold oz
(mil)
FY21 Gold oz
(mil)
Depletion Gold oz
(mil)
Net ofdepletionvariance Gold oz
(mil)
Net ofdepletion
% variance Gold oz
(mil) Comments
Tshepong operations 26.024 25.596 0.376 (0.052) (0.2) Negative variance mainly due to year on year increase in abandoned blocks especially in the western area of Tshepong North shaft
Bambanani 0.248 0.181 0.089 0.021 8.7 Year on Year differences from changes in the size of remnant pillars as per the latest Rock Engineering model
Joel 3.144 3.113 0.072 0.041 1.3 Additional Resource blocks from drilling results at “Klippan” and 129-E12 areas
Masimong 5 0.783 0.757 0.130 0.103 13.1 Good development grades achieved, resulting in additional m² being above the cut-off
Target 1 3.517 3.627 0.064 0.174 4.9 Decrease in cut-off from 3.80 g/t to 3.49 g/t year on year. Cut-off decrease as a result of increase in gold price and decrease in R/t. The R/t decreased after introduction of new and cheaper mining method (SLOS) in Block12
Target 3 1.483 1.483 – – – No changesTotal Free State underground 35.198 34.756 0.730 0.288 0.8West RandDoornkop South Reef 3.391 3.024 0.171 (0.197) (5.8) Reduction mainly due to a decrease in the resource grade as
a result of lower sampled grades. There is also a reduction in area as result of the introduction of safety pillar as per rock engineering recommendations
Doornkop Main Reef 0.025 0.025 – – – No changesDoornkop Kimberly Reef 4.249 4.249 – – – No changesTotal Doornkop 7.666 7.299 0.171 (0.197) (2.6)Kusasalethu 6.995 5.919 0.189 (0.887) (12.7) Decreased due to a 3% reduction in the Mineral inventory
grade. Major change was in geozones 1, 3 and 9 where there is now additional blocks below the resources cut-off
Mponeng – 23.581 23.581 100.0 Resources acquired from AGATotal West Rand 14.660 36.798 0.360 22.498 153.5North WestMoab Khotsong including Zaaiplaats 12.994 12.402 0.366 (0.225) (1.7) The resource decreased due to:
Zaaiplaats: Structure change based on exploration drillingMiddle Mine: Structure change on 101Level based on new exploration drilling and raise development.Top Mine: Due to an inventory clean-up of Isolated blocks not feasible to mine in future
Total North West 12.994 12.402 0.366 (0.225) (1.7)Total South Africa underground 62.853 83.957 1.456 22.560 35.9
MINERAL RESOURCE AND MINERAL RESERVE RECONCILIATION continued
24 Harmony Gold Mining Company Limited

GOLDFY20(Moz)
FY21 (Moz)
Depletion(Moz)
Net ofdepletionvariance
(Moz)
Net ofdepletion
% variance(Moz) Comments
SOUTH AFRICA SURFACEKraaipan Greenstone BeltKalgold 2.345 2.299 0.043 (0.003) (0.1) Depletion only – No model changes year on yearKalgold tailing dam 0.201 0.201 – – – No changes Total 2.546 2.501 0.043 (0.003) (0.1)Free State SurfaceOther Free State tailings 4.152 4.200 – 0.048 1.2 Deposition from current operationsFree State (Phoenix) 0.442 0.385 0.057 – (0.1)Free State (St Helena) 1.656 1.656 – – – No changeFree State (Central) 0.476 0.450 0.038 0.011 2.4Waste rock dumps 0.287 0.267 0.128 0.109 37.9 Depletion offsetted by adding Mponeng WRD miningTotal Free State Surface 7.013 6.958 0.223 0.167 2.4North West SurfaceMispah 0.713 0.719 – 0.006 0.8 Additions from Moab Operations plant residueKop Paydam 0.072 0.072 – – – No changeMoab MOD 0.064 0.045 0.017 (0.002) (3.8) DepletionVaal River tailings – 3.140 – 3.140 100.0 Resources acquired from AGAVaal River WRD – 0.060 – 0.060 100.0 Resources acquired from AGAMine Waste Solutions – 1.946 1.946 100.0 Resources acquired from AGA
Total North West Surface 0.849 5.981 0.017 5.149 606.5West Wits SurfaceWest Wits tailings – 0.503 – 0.503 100.0 Resources acquired from AGAWest Wits WRD – 0.029 – 0.029 100.0 Resources acquired from AGATotal West Wits Surface – 0.532 – 0.532 100.0Total South Africa Surface (including Kalgold)
10.408 15.971 0.283 5.846 56.2
Total South Africa (including u/g, surface, Kalgold)
73.261 99.928 1.739 28.405 38.8
Papua New Guinea Hidden Valley/Kaveroi 3.074 2.622 0.182 (0.270) (8.8) New conservative Resource Model not offsetted by the
addition of Stage HVX into LOMHamata 0.127 0.124 – (0.003) (2.1) DepletionWafi 3.600 3.600 – – – No changeGolpu 9.300 9.300 – – – No changeNambonga 0.500 0.500 – – – No changeKili Teke 1.810 1.810 – – – No changeTotal Papua New Guinea 18.511 17.956 0.182 (0.373) (2.0)Grand Total 91.772 117.884 1.921 28.033 30.5Silver – Equivalent gold ouncesHidden Valley 0.602 0.573 – (0.029) (4.8) New conservative Resource Model not offsetted by the
addition of Stage HVX into LOMCopper – Equivalent gold ouncesGolpu 22.110 19.030 – (3.080) (13.9) Due to commodity price ratio changesNambonga 0.240 0.207 – (0.033) (13.7) Due to commodity price ratio changesKili Teke 3.926 3.538 – (0.388) (9.9) Due to commodity price ratio changesTotal Copper – Equivalent gold ounces 26.276 22.775 – (3.501) (13.3)Total PNG equivalent gold ounces 26.877 23.347 – (3.530) (13.1)Total PNG including equivalent gold ounces
45.389 41.304 0.182 (3.902) (8.6)
GRAND TOTAL (excluding equivalent) 91.772 117.884 1.921 28.033 30.5GRAND TOTAL (including equivalent) 118.649 141.231 1.921 24.503 20.7
Mineral Resources and Mineral Reserves Report 2021 25
MINERAL RESOURCES AND MINERAL RESERVES

MINERAL RESOURCE AND MINERAL RESERVE RECONCILIATION continued
SILVERFY20(Moz)
FY21(Moz)
Depletion(Moz)
Net ofdepletionvariance
(Moz)
Net ofdepletion
% variance(Moz) Comments
Hidden Valley 47.754 41.508 (6.246) (13.1)Golpu 16.500 17.000 0.500 3.0Total silver 64.254 58.508 – (5.746) (8.9)
COPPERFY20(Mlb)
FY21(Mlb)
Depletion(Mlb)
Net ofdepletionvariance
(Mlb)
Net ofdepletion
% variance(Mlb)
Kili Teke 1 767.000 1 766.987 (0.013) –Golpu 9 500.000 9 500.000 – –Nambonga 88.000 103.503 15.503 17.6Total copper 11 355.000 11 370.491 – 15.491 0.1
MOLYBDENUMFY20(Mlb)
FY21(Mlb)
Depletion(Mlb)
Net ofdepletionvariance
(Mlb)
Net ofdepletion
% variance(Mlb)
Kili Teke 88.000 88 (0.432) (0.5)Golpu 83.000 81 (1.659) (2.0)
26 Harmony Gold Mining Company Limited

MINERAL RESERVESAs at 30 June 2021, Harmony’s attributable gold equivalent Mineral Reserves were 42.5Moz, up from 36.5Moz. The year on year Mineral Reserve reconciliation is shown below.
Mineral Reserve reconciliation – gold and gold equivalents
kg (000) Moz
June 2020 – Gold and gold equivalents 1 135 36.5Changes during FY21Mined (52) (1.7)Net of additions at Tshepong Operations, Moab Khotsong, Masimong, Kalgold, Target and Hidden Valley 289 9.3Gold equivalents (52) (1.7)
June 2021 – Gold and gold equivalents 1 320 42.5
June 2020gold and gold equivalents
MinedduringFY21
Net of additions at Moab Khotsong
(Zaaiplaats), Mponeng Mine Waste Solutions
and Hidden Valley
Goldequivalents
June 2021gold and goldequivalents
12.8
23.7
1.7
1.7 11.1
31.49.3
Mineral Reserve reconciliationJune 2020 vs June 2021
(Moz)
50
40
30
20
10
0
Gold Gold equivalents
Mineral Reserve comparison – FY20 vs FY21
GOLDFY20(Moz)
FY21(Moz)
Depletion(Moz)
Net ofdepletionvariance
(Moz)
Net ofdepletion
% variance(Moz) Comments
SOUTH AFRICA UNDERGROUNDFree StateTshepong operations 4.980 4.394 0.251 (0.334) (6.7) Tshepong South – Year on Year variance mainly due to
Geological Losses to the North section of the shaft. Tshepong North – Decrease mainly due to an increase in abandoned blocks
Bambanani 0.207 0.152 0.067 0.012 5.7 Year on Year differences from changes in the size of remnant pillars. Latest Rock Engineering model enabling additional mining
Joel 0.661 0.639 0.049 0.026 4.0 Joel managed to complete exploration drilling which proved additional Reserves in the “Klippan” and the 129-E12 areas which is included in the LOM plan
Masimong 5 0.110 0.108 0.068 0.066 59.6 Good development grades achieved, resulting in additional m² being above the cut-off
Target 1 0.707 0.647 0.055 (0.005) (0.7) Additional reserves available to mine in BLK12 due to decrease in the massives reserves cut-off from 3.80g/t to 3.49g/t
Total Free State 6.664 5.939 0.490 (0.236) (3.5)
Mineral Resources and Mineral Reserves Report 2021 27
MINERAL RESOURCES AND MINERAL RESERVES

MINERAL RESOURCE AND MINERAL RESERVE RECONCILIATION continued
GOLDFY20(Moz)
FY21(Moz)
Depletion(Moz)
Net ofdepletionvariance
(Moz)
Net ofdepletion
% variance(Moz) Comments
SOUTH AFRICA UNDERGROUNDWest RandDoornkop South Reef 1.638 1.513 0.122 (0.002) (0.2) Reduction in grade and area mined as result of the
introduction of safety pillars as per rock engineering recommendations
Kusasalethu 0.730 0.498 0.141 (0.092) (12.6) Decrease in reserves due to the removal of high risk areas as well as the change in strike of the kittems fault
Mponeng – 2.104 2.104 100.0 Reserves acquired from AGATotal West Rand 2.368 4.115 0.262 2.010 84.9North WestMoab Khotsong 1.718 1.449 0.238 (0.031) (1.8) Moab Khotsong Top and Middle Mine decreased marginally
due to a delay in the Shaft Pillar schedulingZaaiplaats – 2.796 – 2.796 100.0Moab Khotsong including Zaaiplaats 1.718 4.245 0.238 2.765 161.0 Inclusion of Zaaiplaats in the LoM ReservesTotal North West 1.718 4.245 0.238 2.765 161.0Total South Africa underground 10.750 14.299 0.990 4.539 42.2South Africa SurfaceKraaipan Greenstone BeltKalgold 0.683 0.631 0.043 (0.009) (1.4) Mainly Depletion – No model changesFree State SurfaceOther Free State tailings 4.114 4.106 – (0.008) (0.2) Mainly Depletion – No model changesPhoenix 0.442 0.385 0.057 – (0.1) Mainly Depletion – No model changesSt Helena 0.933 0.933 – – – No changesCentral 0.476 0.450 0.038 0.011 2.4 Depletion offset by higher recoveriesTotal Free State Surface 5.965 5.873 0.094 0.003 –North West SurfaceVaal River tailings – 1.789 – 1.789 100.0 Reserves acquired from AGAMine Waste Solutions – 1.749 – 1.749 100.0 Reserves acquired from AGATotal North West Surface – 3.538 – 3.538 100.0West Rand SurfaceWest Wits tailings – 0.398 0.398 100.0 Reserves acquired from AGATotal West Rand Surface – 0.398 0.398 100.0Total South Africa Surface (including Kalgold)
6.648 10.440 0.137 3.929 59.1
Total South Africa (including u/g, surface, Kalgold)
17.398 24.739 1.127 8.468 48.7
Papua New Guinea Hidden Valley/Kaveroi 0.831 1.119 0.172 0.460 55.3 Addition of Stage 8 HVX into the LOMHamata 0.016 0.015 0.002 – – DepletionGolpu 5.500 5.500 – – – Rounded to match CP statementTotal Papua New Guinea 6.347 6.634 0.173 0.460 7.2Grand Total 23.746 31.373 1.300 8.928 37.6Silver – Equivalent gold ouncesHidden Valley 0.214 0.266 – 0.052 24.3 Addition of Stage 8 HVX into the LOMCopper – Equivalent gold ouncesGolpu 12.538 10.814 – (1.724) (13.7) Due to commodity price ratio changesTotal PNG equivalent gold ounces 12.752 11.080 – (1.672) (13.1)Total PNG including equivalent gold ounces
19.099 17.714 – (1.385) (7.3)
GRAND TOTAL (excluding equivalent) 23.746 31.373 1.300 8.928 37.6GRAND TOTAL (including equivalent) 36.497 42.453 1.300 7.256 19.9
28 Harmony Gold Mining Company Limited

LOCATION AND GEOLOGY OF OPERATIONS, PROJECTS AND EXPLORATION
Harmony – South Africa
Mineral Resources and Mineral Reserves Report 2021 29
EXPLORATION AND PROJECTS
26°
27°
28°
26°
N
SOUTH AFRICAAFRICA
Johannesburg
Bloemfontein
Mahikeng
RandfonteinCarletonville
Klerksdorp
Kroonstad
Welkom
Virginia
Johannesburg
Springs
Devon Dome
Vredefort Dome
KlerksdorpNamibia
Botswana
West Rand operationsLatitude Longitude
1 Doornkop 26º13'03.36"S 27º47'26.55"E
2 Kusasalethu 26º27'16.23"S 27º21'32.91"E
3 Mponeng 26º26'15.60"S 27º25'41.24"E
Klerksdorp goldfield
4 Moab Khotsong
26º59'12.7"S 26º48'03.3"E
Exploration Target North
MAL21A 27º40'58.29"S 26º36'11.95"E
MAL22 27º40'43.75"S 26º36'12.49"E
Free State operationsLatitude Longitude
5 Target 1 27º45'42.59"S 26º38'24.92"E
6 Target 3* 27º49'42.93"S 26º38'29.27"E
7 Tshepong operations**
27º51'56.45"S 26º42'45.15"E
8 Bambanani 28º2'28.24"S 26º48'9.13"E
9 Masimong 27º58'23.93"S 26º52'39.41"E
Joel 28º16'17.19"S 26º48'57.97"E
Surface sourcesKraaipan Greenstone Belt
Kalgold 26º10'12.85"S 25º14'02.70"E
MWS Klerksdorp MWS Plant 26º50'10.50"S 26º47'50.41"E
Kareerand 26º53'21.49"S 26º53'21.24"E
Free State Saaiplaas Plant 28º2'6.64"S 26º52'4.02"E
Central Plant 28º3'36.57"S 26º53'14.18"E
0 50 100
Kilometres
Projection: UTM Zone 36, Southern Hemisphere (WGS 84)
Harmony South Africa1 West Rand operations
2 Free State operations
3 Klerksdorp goldfield
4 Kraaipan Greenstone Belt
Towns/Cities
Exposed Central Rand Group
Covered Central Rand Group
Exposed West Rand Group
Covered West Rand Group
Dominion Group
Exposed Granitoid Basement
Major faults
LEGEND
* Care and maintenance** Tshepong Operations includes Tshepong and Phakisa sections combined
NORTH WEST PROVINCE
KRAAIPAN GREENSTONE BELT
WITWATERSRAND BASIN
GAUTENG
FREE STATE
HOMESTEAD FAULT
DE BRON FAULT
4
1
2
3
4
5
67
89
31
2

Harmony – Papua New Guinea
LOCATION AND GEOLOGY OF OPERATIONS, PROJECTS AND EXPLORATION continued
30 Harmony Gold Mining Company Limited
135°135°
140°140°
145°145°
150°150°
0° 0°
-5° -5°
}
Legend
New Guinea Mobile BeltPapuan Fold Belt
Papuan Ultramafic Belt
Aure Trough
Other mining operations
Towns/Cities
Niugini Mobile BeltExploration
Kili Teki
Hidden Valley district
Exploration Portfolio Joint Venture(Harmony 50%)
5
3
4
Harmony equity interest 100% unless otherwise indicated
Operations and projects
Hidden Valley
Wafi-Golpu project (Harmony 50%)
1
2
135°
0°
-5°
0°
-5°
140°
145°
150°
135°
140°
145°
150°
Projection: UTM Zone 54, Southern Hemisphere (WGS 84)
Kilometres
0 400 800
AUSTRALIA
INDONESIA
Papua NewGuinea
Grasberg
INDONESIA
Frieda River
PorgeraOk Tedi
3
4
5
2
1
Port Moresby
Madang
Lae
PAPUA NEW GUINEA
N
Grasberg Frieda River
INDONESIA
INDONESIA
AUSTRALIA
Ok Tedi
Porgera
Madang
Lae
Port Moresby
1
25
3
4
Operations and projects1 Hidden Valley
2 Wafi-Golpu project (Harmony 50%)
Exploration3 Kili Teki
4 Hidden Valley district
5 Exploration Portfolio Joint Venture (Harmony 50%)
Harmony equity interest 100% unless otherwise indicated
LEGENDNew Guinea Mobile Belt
Niugini Mobile BeltPapuan Fold Belt
Papuan Ultramafic Belt
Aure Trough
Other mining operations
Towns/Cities
0 400 800
Kilometres
Projection: UTM Zone 54, Southern Hemisphere (WGS 84)

PAPUA NEW GUINEAKey geological featuresPapua New Guinea is one of the world’s most prospective, yet under-explored, terrains for porphyry copper-gold and epithermal gold mineralisation. The New Guinea Mobile Belt, which spans the core of the Irian Jaya-Papua New Guinea mainland, is host to a number of world-class porphyry copper-gold and gold deposits, including Golpu (Cu-Au), Ok Tedi (Cu-Au), Grasberg (Cu-Au), and Porgera (Au).
The central rock belt that makes up the highland spine of Papua New Guinea formed as a result of subduction-related interaction between the Pacific plate (in the north), converging with the Australian plate (in the south). Deposits typical of subduction-related arc settings include:• Epithermal gold deposits which form at shallow depths, relatively
close to the earth’s surface, examples of which include Hidden Valley, Hamata, Kerimenge, Wau and Wafi
• Porphyry copper-gold systems which form at deeper levels in the crust are associated with the emplacement of intrusive stocks and dykes. These systems are among the largest sources of copper ore in the world, and can also contain significant amounts of gold, molybdenum and silver as by-products. Golpu is a high-grade porphyry copper-gold system.
Key legal and regulatory features Mining in Papua New Guinea is governed by the Mining Act of 1992. Minerals are owned by the State, which issues and administers mining tenements through the offices of the Mineral Resources Authority. The types of tenements comprise exploration licence, mining lease, special mining lease, alluvial mining lease, lease for mining purpose, and mining easement.
Exploration licences are issued for a term not exceeding two years and are renewable for further two-year terms, subject to compliance with expenditure and other conditions. Each licence contains a condition conferring on the State the right, exercisable at any time prior to the commencement of mining, to make a single purchase of up to 30% equitable interest in any mineral discovery under the
licence at a price pro rata to the accumulated exploration expenditure.
If (pursuant to a feasibility study approved by the board of directors) a decision is made to develop a mine on a resource, a permitting process must be followed, including:• Applying to the Mineral Resources Authority for a mining lease
(or, at the discretion of the Minister for Mines, a special mining lease). This includes entering into a memorandum of agreement with local, provincial and national governments and landowners regarding the allocation to those parties of a share of the royalties payable by the company to the State, and other community and local business-related matters. If the Minister determines that a special mining lease is required, it will be necessary to enter into a mining development contract with the State, setting out the applicable project implementation, fiscal and other arrangements in respect of the proposed mining operation. Other relevant agreements include a Fiscal Stabilisation Agreement and a State Equity Acquisition Agreement
• Applying to the Conservation and Environment Protection Authority for a level 3 environment permit. This includes undertaking an environmental impact study.
The permitting process can be very time consuming (18-24 months, or longer in some cases).
Over the past five years, the national government has undertaken a wide-ranging review of the fiscal and regulatory regime governing the mining industry. This process accelerated with the appointment in May 2019 of the Honourable James Marape as Prime Minister, following a vote of no confidence in the previous government.
Legislation the subject of the review includes the Mining Act 1992, the Mining Safety Act 1997, the Income Tax Act 1959 and the Environment Act 2000. In addition, the review has addressed mineral policy generally, and such mining-specific issues as fly-in, fly-out employment arrangements, offshore mining, sustainable development, carbon replacement, downstream processing, involuntary relocation and mine closure.
EXPLORATIONIn line with the company’s strategy and growth targets, capital allocated to exploration projects for organic growth in FY21 focused on near-mine, brownfield targets. Although greenfield exploration activities have been scaled back, as part of a balanced approach, Harmony continued to maintain its greenfield tenement interests for exposure to major new gold and copper-gold discoveries in highly prospective underexplored terranes and mining districts throughout Papua New Guinea.
Key work streams underpinning the FY21 exploration programme included:
• Brownfield exploration at Hidden Valley and Kalgold to optimise existing open pit operations and extend mine life
• Brownfield exploration at our underground operations in South Africa
• Greenfield exploration at Target North
• Reviewing exploration opportunities as part of the new business strategy.
Mineral Resources and Mineral Reserves Report 2021 31
EXPLORATION AND PROJECTS
EXPLORATION continued
The review has also considered changes to the quantum of the royalty payable to the State, and to the provisions of the State purchase option reservation, including possible changes to the percentage interest “cap”, the consideration payable for the interest and the allocation of ownership of the acquired interest between the State nominee, the relevant provincial government and affected landowners.
Pursuant to the tax regime review and notwithstanding industry objections, certain adverse changes to the fiscal regime were introduced with effect from 1 January 2017. The main changes were the introduction of an additional profit tax, the cessation of the double deduction allowance for exploration expenditure, and an increase in the rates of interest withholding and dividend withholding taxes.
In June 2020, a bill, entitled the Mining (Amendment) Bill 2020 and proposing various amendments to the Mining Act 1992 (Papua New Guinea), was passed by the national parliament. The amendments are in two parts, with the first part introducing additional reporting requirements and the second part expanding the State’s ability, via a holding company, to apply for tenement and other related permits and authorisations in respect of reserved land.
In July 2020, a proposed Organic Law on Ownership and Development of Hydrocarbons and Minerals and the Commercialisation of State Businesses was tabled for comment. The Organic Law (if adopted) will materially alter the legislative and regulatory regime governing mining in Papua New Guinea, including the ownership of minerals by the government and the transformation of the methodology of its participation in mining operations from a concessionary to a production sharing regime.
The Papua New Guinea Chamber of Mines and Petroleum, as the representative mining industry body, has engaged with the State in response to these proposed legislative changes, some of which industry considers to be materially adverse. However, there has been only limited engagement with the State.
Harmony’s operations and projects in Papua New Guinea will potentially be adversely affected by the fiscal and regulatory changes presently being considered.
HARMONY IN PAPUA NEW GUINEA – A SUMMARY
Harmony began actively exploring in Papua New Guinea in 2003. Since then, we have developed a high-quality project portfolio, both in established mineral provinces and in emerging gold and copper districts. Harmony has advanced several gold and copper-gold prospects which are at various stages of exploration and evaluation across Harmony’s tenement areas.
In line with the company’s strategy and growth targets, capital allocated to exploration projects for organic growth in FY21 focused on near-mine, brownfield targets. Although greenfield exploration activities have been scaled back, as part of a balanced approach, Harmony continued to maintain its greenfield tenement interests for exposure to major new gold and copper-gold discoveries in highly prospective underexplored terranes and mining districts throughout Papua New Guinea.
Exploration FY21Key work streams underpinning the FY21 exploration programme included:• The Wafi-Golpu copper-gold deposit permitting process and
progressing the special mining lease application
• Near-mine exploration and projects in support of extending mine life at Hidden Valley
• Rationalisation of non-prospective tenure.
In FY21, we spent R74.6 million (US$5.4 million) on exploration in Papua New Guinea, driven largely by activities related to the Wafi-Golpu project (FY20: R203 million; US$13 million). Exploration expenditure of R77.6 million (US$5.3 million) is planned for FY22.
The FY21 work programme was impacted by the resurgent Covid-19 pandemic in PNG, which severely disrupted the social and business operational environment, including global travel restrictions and compulsory work stoppages.
The company has adapted its work programmes and resourcing to reflect travel constraints (both within and outside of PNG) and social distancing and group gathering constraints that particularly affect our engagement with communities and other stakeholders. Of particular focus has been limiting contact with remote communities who would not otherwise be at risk of exposure to the pandemic.
In relation to Covid-19 safeguards, company employees are currently progressing through the Covid-19 vaccination process, which is a two-phase, 12-week programme. Concurrently, updated field Covid-19 protocols and procedures are being prepared to enable a restart to work that is safe from a community health perspective.
The country is highly prospective and under-explored and the case for exploration investment in Papua New Guinea will remain strong if the current or proposed legislative environment remains supportive.
Tenements held in joint ventureWafi-Golpu joint venture and exploration portfolio joint venture (Harmony 50%)Harmony is in a 50:50 joint venture with Newcrest Mining over a number of tenements in the Morobe Province. The aggregate tenement package in Morobe Province, held in 50:50 joint venture between Newcrest and Harmony, stands at 152.81km2 (unchanged year on year). These tenements encompass the Wafi-Golpu project and span the Wafi transfer zone and its strike extensions.
The Wafi-Golpu project is presently in the permitting phase. The joint venture participants are awaiting the conclusion by the State of its assessment of their proposals for development, whereafter relevant agreements with the State will be negotiated.
The Wafi transfer zone and its strike extensions are prospective for epithermal gold and porphyry style copper-gold deposits, and the exploration strategy is to discover bulk tonnage (~1Moz) or high-margin gold or copper-gold deposits to provide new resource options that can leverage infrastructure or complement the Wafi-Golpu project.
In line with the greater focus on brownfields exploration, regional joint venture work concentrated on tenements contiguous with the Wafi-Golpu project.
During FY21, the joint venture exploration work programme was heavily disrupted as a result of various controls and travel constraints adopted to prevent spread of the virus into local communities. Generative work to further evaluate an epithermal target approximately 1.5km north-west of the Golpu porphyry is planned to resume in FY22 in order to develop near mine drill targets within the Wafi-Golpu project area.
32 Harmony Gold Mining Company Limited

Exclusively held tenements Morobe Consolidated Goldfields Limited and Harmony Gold (PNG) Exploration Limited) (Harmony 100%)Rationalisation of regional greenfield tenure within Harmony’s 100%-owned tenement portfolio in Papua New Guinea continued. The tenement portfolio comprised 464km2 as at 30 June 2021, compared with FY20: 599.8km2 (a 23% decrease year on year).
Work programme expenditure focused on the development of brownfield gold targets within a 10km radius of the Hamata processing plant at Hidden Valley. This included study work on the depth extension of the Hidden Valley deposit.
Papua New Guinea – overview of joint venture exploration (Harmony 50%)
Objectives Progress in FY21 Targets/plans for FY22
Exploration portfolio tenements (Wafi-Golpu district)
Wafi transfer zone – grassroots exploration targeting discovery of additional resources to expand Wafi-Golpu into a mineral district.
• A programme of follow-up soil sampling supported by geological reconnaissance mapping and rockchip sampling was completed to further evaluate an epithermal target ~1.5km north-west of the Golpu porphyry
• Very encouraging results were obtained with a coherent gold anomaly of +0.1g/t Au identified over a 500m x 200m area (open to the south). The anomaly contained peak gold values up to 2.8g/t Au, which sit within an envelope of anomalous Ag, Pb, and Zn geochemistry.
Work completed to date has confirmed the Buvu Thrust target area as having potential for an unrecognised centre of epithermal hydrothermal alteration/mineralisation.
• Complete mapping and surface sampling on ranked targets along the Wafi transfer structure including follow up of open anomalism at new Buvu fault target (EL440) via extension of systematic soil sampling grid and mapping
• Undertake bulk material characteristic sampling on sites identified as potentially suitable sources for road construction materials in support of the Wafi-Golpu joint venture project.
Papua New Guinea – overview of brownfield exploration activity and greenfield tenement portfolio (Harmony 100%)
Objectives Progress in FY21 Targets/plans for FY22
Kili Teke project – EL2310
Targeting copper-gold porphyry. • Fieldwork was paused to limit contact with remote communities who would not otherwise be at risk of exposure to the pandemic
• A review of soil pathfinder distribution patterns over the Kili Teke project area has highlighted a potential area of untested hydrothermal alteration located ~1.5km east of the known mineralised porphyry area. This area of interest is considered the most prospective area on EL2310 for a potential new centre of mineralisation.
• Community engagement and social mapping
• Complete a programme of systematic soil sampling and mapping. The soil sampling aims to extend geochemical coverage over the eastern and northern extensions of this highly prospective target. The geological mapping will try to map out the existence of any marble fronts developed within the overlying Darai Limestone.
Brownfields exploration within a 10km radius of the Hidden Valley plant to develop replacement resources and support the mine-life extension
Objectives Progress in FY21 Targets/plans for FY22
Brownfields exploration within a 10km radius of the Hidden Valley plant to develop replacement resources and support the mine-life extension.
• Mining studies to investigate options to extend mine life of Hidden Valley orebody continued and included: – Studies on the down plunge extensions of
the Hidden Valley orebody which remain open
– Resource modelling of the historic Kerimenge Resource area commenced with the aim of developing high-grade satellite deposits with trucking distance to Hidden Valley plant.
• A programme of target generative systematic soil sampling and mapping was completed south of the Hidden Valley Mine on EL677 adjacent to ML151
• Partial relinquishment applications were processed as part of a broader consolidation plan, reducing Hidden Valley District tenure by 39% from 347km2 to 212km2.
• Complete resource development work and progress mining option studies for Kerimenge and Hidden Valley extensions
• Restart of the Webiak exploration programme including: – Grass roots generative systematic soil
sampling and mapping extending soil grids at both Webiak (EL497) and Kobiak (EL2313)
– Drill testing of ranked anomalies.
Mineral Resources and Mineral Reserves Report 2021 33
EXPLORATION AND PROJECTS

EXPLORATION continued
South Africa – summary of brownfields exploration
Objectives Progress in FY21 Targets/plans for FY22
Kalgold expansion
Advance feasibility studies in support of an expansion of the Kalgold open-pit mining operation:• Additional resource growth to
underpin expansion studies and improve operational flexibility
• New high-grade satellite resources• Extensions to known deposits.
Resource extension drilling was carried for the Windmill Zone; total of 30 boreholes1 were drilled (4 745 metres of RC drilling). Drilling returned very encouraging initial results. Windmill resource model update is planned once all assay results are obtained and verified.
Geotechnical, condemnation and water borehole drilling was also completed to support the various components of the feasibility study and provide input into the mine planning. All proposed sites have now been cleared for the future development.
A feasibility study has advanced and will be concluded during the year.
1 Complete assay results and resource details are tabulated in the technical annexure available on the website at www.harmony.co.za: SAMREC Table 1 Report – Kalgold operation, North West province, Republic of South Africa
Using a method known as continuous coring, underground exploration drilling is conducted as per required intervals from existing underground excavations (haulages and cross cuts). This drilling provides information to determine the elevation and grade of the targeted reef horizon as well as geological features in the immediate surrounding lithology. It assists in structural geological interpretation and evaluation of specific areas as well as compilation of regional structural geological and evaluation models. Mine geologists and planners use drilling information to determine a mine’s development strategy and eventually its economic viability.
Kalgold brownfield exploration programmeThe Kalgold operation is 100% owned by Harmony and located approximately 276km west of Johannesburg, in North West Province, South Africa.
The brownfield infill drill campaign carried out in FY20 focused on the main line of lode and potential satellite targets. Intercepts returned confirmed an expanded, robust mineralised system with over 2.1 kilometres of strike, extending more than 300 metres below surface (a full list of drill intercepts is included in the SAMREC Table 1 report available at www.harmony.co.za). The expanded resource base underpins the Kalgold expansion prefeasibility study that was completed this year.
SOUTH AFRICA
All our underground mines are located within the Witwatersrand Supergroup. Most are situated in the south-western corner of the Witwatersrand Basin or Free State goldfields, and comprise sedimentary rocks extend laterally for hundreds of kilometres into the West Rand goldfields and East Rand Basin. Our mining assets include an open-pit operation on the Kraaipan Greenstone Belt to the north-west of the Witwatersrand Basin. Additional information on geology is provided per operation in this report.
Exploration FY21In FY21, Harmony spent R91 million (US$6 million) on exploration in South Africa (FY20: R56 million; US$4 million). Expenditure of R195 million (US$13 million) planned for FY22 includes R48 million budgeted for Target North and R27 million budgeted for Kalgold.
Underground resource definition drillingIn all, 61 630 metres were drilled across Harmony’s underground operations in South Africa (FY20: 68 764 metres).
34 Harmony Gold Mining Company Limited

South Africa – summary of brownfields exploration continued
Objectives Progress in FY21 Targets/plans for FY22
Kalgold prospecting rights
Exploration aimed at improving understanding of the potential to develop the Kraaipan Greenstone Belt into a new mineralised province with multiple mining centres.
The systematic geochemical soil sampling survey was completed over the selected anomalies identified by magnetic and electro-magnetic surveys.
A total of 1 806 auger holes were drilled and 3 476 of outcrop samples were obtained and analysed. Integration of these results with all historical geological information was concluded and identified excellent drilling targets associated with favourable Cherty BIF sequence.
Planned regional exploration includes reverse circulation drilling programme over the selected potential targets and continuation of systematic, geological investigations of the identified geophysical anomalies, including mapping and surface geochemistry.
Doornkop – South Reef
The objective of the project is to de-risk the mine in terms of geological confidence, delineation of geological structures and understanding of grade trends.
The main aim is to better define the resource base on 207 and 212 level while reducing the inferred resource in the life of mine.
A total of 15 boreholes has been drilled to date which has assisted with the structural geological confidence.
Exploration is scheduled to continue into identified areas to further increase the geological confidence and grow the resource base. LIB drilling sites are strategically selected to give enough drilling coverage to target resource blocks that will be mined in the LOM (life of mine).
Exploration targets:• The north-eastern block• South-western block.
Tshepong Operations: Phakisa section, B Reef
Currently, there is no stoping of the B Reef at the Phakisa section, however footwall development is in progress to access the EV10 payshoot area. Exploration drilling is underway to identify areas of economic value in the down-dip extensions of those channels being mined in the neighbouring Tshepong section. Significant potential may exist to mine the B Reef in the Phakisa section.
Drill results, combined with historic regional information, have improved understanding of the B Reef’s boundaries. This has allowed enhanced definition of the EV10 pay shoot which is currently being explored by drill holes. The potential of the existence of the pay shoot is being extrapolated from current mining across the Dagbreek fault as well as from two surface boreholes in the extrapolated pay shoot.
The capital exploration drilling project was completed in October 2020. Four reef intersections confirmed the existence of the B Reef facies with well mineralised buckshot pyrite and visible flyspeck carbon. No further capital drilling is planned.
Mineral Resources and Mineral Reserves Report 2021 35
EXPLORATION AND PROJECTS

EXPLORATION continued
South Africa – summary of brownfields exploration continued
Objectives Progress in FY21 Targets/plans for FY22
Target North
The aim of the current exploration programme is to confirm the geological model, which was created on the completion of the Target North study work. The model defined a potential block of well-mineralised Ventersdorp Contact Reef where it overlies the alluvial fans of the upper Elsburg and Dreyerskuil reefs. Two fans have been interpreted in the Target North area of the Dreyerskuil and Mariasdal fans.
Further resource definition drilling will be planned, pending the results of the current exploration programme.
The exploration drilling programme from surface advanced and a total of 3 744 metres was drilled.
At MAL21A borehole, the first long directional deflection targeting the VCR to the west of the original intersection was completed including a set of short grade variability deflections. Deflection drilling continues.
Drilling of the second borehole MAL22 commenced in January 2021 and the hole advanced to a depth of 1 547 metres. Drilling continues.
Drilling of the remaining two long directional deflections for MAL21A borehole is planned to test the postulated Mariasdal Fan Head.
Continue drilling of the second borehole MAL22 as planned.
The sedimentological model will be updated once the deflection programme has been completed.
N
Target North Project Area showing historic boreholes Witwatersrand Basin
Sun South Portion of Target 1 – 14 MR
TNT 1
ZST 3
MAL 1
West Rand 78Moz/5.1g/t Au
Carletonville 302Moz/8.5g/t Au
Central Rand 247Moz/8.2g/t Au
East Rand 320Moz/8.2g/t Au
Evander 48Moz/7.0g/t A
Klerksdorp 204Moz/8.4g/t Au
ZST 2
Evander
Locality
JohannesburgCarletonville
PotchefstroomKlerksdorp
Welkom
BotswanaPretoria
Johannesburg
BloemfonteinLesotho
Durban
Swazi-Land
Southern Free State Goldfield
KlerksdorpGoldfield
PotchefstroomGoldfield
ZST 1
DKL 1
DKL 5
S 4
S 1S 3S 11
S 7S 10
S 8MAL 18
MAL 3
MAL 9MAL 17MAL 4MAL 14
MAL 7MAL 16MAL 5KFN 1
KFN 5KFN 3S
KFN 2KFN 4
MAL 8MAL 21AMAL 22
MAL 6MAL 19
MAL 2NMAL 2S
MAL 10
S 5S 9DKL 2DKL 7
DKL 9DKL 8
S 6S 2
Original Target 1 – 14 MR
Loraine MR
Free State 311Moz/8.4g/t Au
250km
Central Rand Group
West Rand Group
Dominion Group
Granites
Mine Boundary
Faults
Current boreholes
LEGEND
Not to scale
27°27°
26° 26°
Joel – high-grade Beatrix Reef extension (Klippan)
Exploration is planned to upgrade the Mineral Resource to Indicated level and determine the economic mining limit in the north and north-east areas originally classified as non-depositional zones. Opening up this area will greatly reduce the risks of the initial development-constrained mining areas in the 137 level project area.
Since this project started, Joel has completed six exploration holes which resulted in the declaration of additional Resources and Reserves.
Further exploration is planned for this area as it is now evident that there is more opportunity in this “Klippan” area.
Joel – 145 level exploration
Exploration here is aimed at upgrading the current Mineral Resource to Indicated level and to determine the economic mining limit to the north and north-east, below current mining infrastructure, to ensure the 145 level decline project remains economically viable.
Exploration drilling began in August 2019. Three long inclined boreholes will be drilled in total. The first hole was completed and the 2nd/3rd holes intersected major water which is currently being drained. The drill machine was moved to a new area to explore for the continuation of the Beatrix Reef below 137 level.
Exploration drilling is currently ongoing towards 145 level and further west from the 137 E4 Raise.
36 Harmony Gold Mining Company Limited

PAPUA NEW GUINEAHarmony currently has two major projects in Papua New Guinea, both located in the Morobe Province:• The Wafi-Golpu project, being a greenfield undeveloped deep
level block cave mine, currently in the permitting phase. The project is held under a 50:50 unincorporated Wafi-Golpu joint venture between wholly owned PNG-registered subsidiaries of Harmony Gold Mining Company Limited (namely, Wafi Mining Limited) and Newcrest Mining Limited (namely, Newcrest PNG2 Limited).
• The Hidden Valley extension project, being a life-of-mine extension of the established Hidden Valley Mine which is owned by a 100% subsidiary of Harmony (namely, Morobe Consolidated Goldfields Limited). The project is underpinned by a completed feasibility study and was recently permitted.
Wafi-Golpu project (Harmony 50%)Headline summary:• Location: Eastern Papua New Guinea in the Morobe Province
(supports Harmony’s geographical diversification strategy)• Tenement holding: The Wafi-Golpu joint venture participants are
the holders in equal shares of exploration licences EL440 and EL1105. The Golpu, Wafi and Nambonga deposits are located on exploration licence EL440.
• Commodity: Copper-gold (supports Harmony’s commodity diversification strategy)
• Deposits: The Golpu, Wafi and Nambonga deposits • Resource: Contains 18.6Moz gold and 8.6Mt copper• Level of confidence: Feasibility study completed March 2018• Mining method: Block cave with multi-cave options• Production rate: 16.85Mtpa, steady-state production estimated
at 161 000t of copper, 266 000oz of gold (more than 1.4Moz of gold equivalent ounces annually)
• Grade: Above average grades for Gold – 0.90g/t and Copper – 1.27%
• Costs: of US$0.26/lb are in the lowest decile for copper production
• All-in sustaining cost: Expressed in terms of gold production minus US$2 128/oz is estimated
• Operating life of mine: >28 years (potential to extend to 40 years)
• Project lifecycle: In permitting phase. The Wafi-Golpu joint venture participants have applied for a special mining lease (SML 10) and an environment permit to undertake the construction, operation and ultimately, closure of the greenfield block cave copper-gold mine. The environment permit was granted in December 2020.
Project technical overviewThe Golpu, Wafi and Nambonga deposits are located in eastern Papua New Guinea (PNG), approximately 60km southwest of Lae in Morobe Province. The proposed mine site is situated at an elevation of approximately 400m above sea level in moderately hilly terrain located near the Watut River, approximately 30km upstream from its confluence with the Markham River. Lae, the second largest city in Papua New Guinea, will host at its port the project’s concentrate export facilities, which will be linked to the mine-site by a concentrate pipeline. Tailings will be disposed of by means of deep sea tailings placement in the Huon Gulf, near the mouth of the Markham River.
The 2018 feasibility study update, which remains the basis for the business case, is based on block caving the Golpu resource. The project is a viable development of a high-quality resource, capitalising on the high-grade nature of the copper-gold Golpu orebody, an optimised capital expenditure profile and the ability to optimise the production rate and cash flow by preferentially (in time) targeting higher-grade sections of the Ore Reserve early.
The primary project deliverable is the commissioning of a mining operation to produce at nameplate capacity of 16.84Mtpa a high-quality copper and gold concentrate with ore sourced from three block caves, namely BC44 and BC42 and BC40.
Project permitting overviewThe Wafi-Golpu project is in the permitting phase. The proposal for development underpinning the Special Mining Lease 10 (SML 10) application was submitted to the Papua New Guinea Mineral Resources Authority in August 2016 and was updated in March 2018, when the feasibility study update was completed.
PROJECTS
Harmony has several projects underway in Papua New Guinea and South Africa which are essential to the longevity of the business. The aim of these projects is to ensure a pipeline of exploitable, cost efficient Mineral Reserves.
Harmony currently has two projects in Papua New Guinea:
• The Wafi-Golpu project is owned by the Wafi-Golpu Joint Venture, a 50:50 unincorporated joint venture between subsidiaries of Harmony and Newcrest Mining Limited respectively
• Hidden Valley extension project – a feasibility study is being conducted to assess the viability of exploiting the large Mineral Resource below the current life of mine pit. This project depends on finding a suitable location for a tailings storage facility.
Mineral Resources and Mineral Reserves Report 2021 37
EXPLORATION AND PROJECTS

PROJECTS continued
This update identified deep sea tailings placement as the tailings management solution for the project. Informed by the feasibility study update, the environment impact statement (EIS) was submitted to the Conservation and Environment Protection Agency in July 2018, which after the conclusion of its assessment of the project’s environment permit application, granted an environment permit for the Wafi-Golpu Project in December 2020. The grant of the environment permit is currently the subject of an application for judicial review by the Governor and the Provincial Government of the Morobe Province.
Since the lodgement in 2016 of the application for Special Mining Lease 10 and associated tenements, the Government of Papua New Guinea has undertaken a wide-ranging review of the fiscal and legislative regimes governing mining in Papua New Guinea. That review is ongoing, and its outcomes are presently unclear.
In addition, the assessment by the Minerals Resources Authority of the Wafi-Golpu Project’s Proposal for Development is ongoing. Negotiations with the State Negotiating Team regarding the terms and conditions of the grant of SML 10 and its associated tenements, including the terms and conditions of participation in the Project by the State and its nominees, can only commence upon finalisation of that assessment.
In the interim, no mining has occurred in the project area.
The Wafi-Golpu Project will progress to execution only once:• SML 10 and all other associated tenements and necessary permits
required for Project development have been granted. This will only occur after all required agreements with the State have been negotiated and executed, including a Mining Development Contract, a Fiscal Stability Agreement and a State Equity Agreement
• All required agreements with the State and landowners have been negotiated and executed, including a Memorandum of Agreement and individual compensation agreements
• The judicial review of the environment permit has been dismissed, and/or the validity of the environment permit for the life of the Project has been confirmed
• All necessary approvals have been received from the boards of directors of the ultimate holding companies of the Wafi-Golpu joint venture participants, namely Harmony and Newcrest Mining Limited.
Initial activities after the achievement of the above execution conditions will focus on the establishment of Project delivery capacity and capability. This will be followed by the validation and update of the Feasibility Study completed in March 2018 which will further inform decisions associated with the commencement of site access roads and bridges, the construction of accommodation facilities and the construction of the Nambonga and Watut declines.
Hidden Valley extension project (Harmony 100%)Headline summary:• Location: Eastern Papua New Guinea in the Morobe Province
(supports Harmony’s geographical diversification strategy)• Tenement holding: Morobe Consolidated Goldfields Limited,
being a wholly owned subsidiary of Harmony registered in Papua New Guinea, is the 100% owner and operator of the Hidden Valley Mine, which is situated on Mining Lease ML 151
• Environment permit: EP L3(578).
The Hidden Valley extension project reported on last year was completed, gated and approved for execution commencing in FY22. The project now informs the production base and Mineral Reserves. The project will deliver to the Hidden Valley operation:• A 2.5-year mine-life-extension to FY27• Additional gold production of 350Koz• Additional silver production of 5.4Moz• Ave AISC US$1050.
The extension of the mining lease and the amendment to the environment permit required to facilitate this extension were granted in June 2021.
Morobe Consolidated Goldfields Limited is in continuing discussions with the Mineral Resources Authority regarding the conditions of the grant of the extension of the mining lease.
PREFERRED DEVELOPMENT OPTION FOR WAFI-GOLPU
The diagram alongside illustrates the preferred development option. Evaluation of this preferred development option in the feasibility study update is based on:• Mining 155Mt (approximately 40%) of the current known Ore
Reserve in two block cave levels being block cave 44 (BC44, 65Mt) at 4400mRL and block cave 42 (BC42, 90Mt) at 4200mRL, both at a feasibility level of confidence
• Mining and processing the remaining Ore Reserve (210Mt), currently at a prefeasibility level of confidence, in a third block cave level, block cave 40 (BC40) at 4000mRL
• Total ore mined of 376Mt over 28 years• (26 years post commercial production), including 11Mt of
development ore.
Note that when development tonnages are allocated to the block caves levels, the volumes per cave are 68Mt (BC40), 93Mt (BC42) and 215Mt (BC44). The values (tonnages and durations) per block cave level refer to production from the drawpoints, not development.
Decline Cross Section – Ore Body.
38 Harmony Gold Mining Company Limited

SOUTH AFRICAIn South Africa, projects are currently in progress at Kalgold, Doornkop, Joel and Moab Khotsong, all of which are aimed at extending the life of mine at these operations.
South Africa – summary of projects currently underwaySouth Africa – summary projects
Objectives Progress in FY21 Targets/plans for FY22
Kalgold – expansion project
The Kalgold plant currently treats approximately 130 000 tonnes a month. Following on from the current exploration drilling programme, the project is aimed at increasing production.
A feasibility study was started and almost completed by year end. The study is investigating the building of a new 300 000 tpm plant which will see the current plant stopping production. An EIA was also started and will only be completed after the finalisation of the feasibility study.
The feasibility study will be completed in the first quarter of FY22 and will be gate kept pending a favourable EIA decision. The EIA is expected to be completed by the end of FY22.
Doornkop – 207 and 212 levels project
The project extends the mining of the orebody at depth. The levels need to be developed while the shaft infrastructure needs to be completed in order for both levels to be able to handle the planned production. An ore handling system incorporating 215 level also needs to be put in place.
Only critical early works, including development on 207 level, widening (drilling and drop raising) of the 192 to 212 level ore passes, as well as re-commissioning of the ventilation shaft rock hoisting and mid shaft loading arrangements, were executed in FY20.
A feasibility study was initiated in September 2019 to firm up the project scope, costs and timelines to allow for a formalised decision-making process. The study was complete by year end. Exploration drilling is being done to improve the geological confidence, increase the Mineral Reserves and better define the resource.
The project is scheduled to continue to complete the mid-shaft loading, drop raises as well as all required shaft infrastructure. Exploration will continue in line with a strategy that supports better definition of the resource base.
Ore pass on Level 212.Drop Raising Layout.
Mineral Resources and Mineral Reserves Report 2021 39
EXPLORATION AND PROJECTS

PROJECTS continued
South Africa – summary of projects currently underwaySouth Africa – summary projects
Objectives Progress in FY21 Targets/plans for FY22
Joel North
To access the orebody on 137 level, two declines were developed at 12° from 129 level – a chairlift decline and a conveyor belt decline. Primary footwall development is currently taking place on 137 level to intersect the reef.
A permanent conveyor was commissioned. Construction of the box fronts on 137 level is 97% complete. Work on the 137 level east haulage began. The 137 E4 and E5 crosscuts and raises were completed and started stoping.
The chairlift construction was planned to be completed by the end of June 2021. All other engineering construction work to be completed in 2021.
Primary development to the east and west of the mine is scheduled.
TB03A Box 4 Belt TB03A Box 4 Belt
TBO3A Box 4.
2
TB03A Bulkheads – Critical Path
Box 1 Moved to Belt Decline - Complete
Box 2 – 15 Oct 2020
Box 3 – 02 Jul 2020 Box 4 – Completed Oct 2019
Box 5 - 18 Jan 2021
TB03A/ TB03 Cross Over – Completed Oct
2019
TB03A Box no 4 Bulkhead and tip completed
TB03A Box no 4 Bulkhead , stringers and Cross box construction completed.
Drop Raise no 5 Drilling Completed
TBO3A Bulkheads – critical path.
TB03A Box 4 Belt
TB03A Box 4 Belt
Belt.
40 Harmony Gold Mining Company Limited

South Africa – summary of projects currently underwaySouth Africa – summary projects
Objectives Progress in FY21 Targets/plans for FY22
Joel tailings reclamation
Increase tailings reclamation capacity by using the Joel plant and tailings storage facility which have become available following the transfer of the Joel run-of-mine ore to Harmony One plant for processing.
The prefeasibility study was completed, however, the economics of the project did not allow it to proceed to feasibility.
Investigate possible collaboration with owners of other mining infrastructure in the area.
Moab Khotsong – Mispah tailings dam retreatment project
The Mispah tailings reclamation feasibility study investigated the recovery of gold from reclamation of Mispah 1 tailings storage facility (TSF) with treatment at 220ktpm in the Noligwa gold plant and 350ktpm, ramping up to 500ktpm in three years in the Kopanang gold plant.
Deposition would be onto existing TSFs and the footprint of the south-east TSF once it becomes available.
The Mispah tailings reclamation project entails reclaiming gold from the Mispah 1 tailings storage facility. The tailings will be treated in existing plants and residue will be deposited on existing tailings storage facilities.
The study was concluded in March 2021 and indicated that the project is not viable.
The feasibility study was completed however the high capital cost for tailings deposition resulted in the project not being financially viable.
FY22 to investigate the inclusion of the Mispah 1 TSF in the MWS operation.
Investigate potential of treating only through Kopanang plant with minimal capital expenditure. (Deposition remains a high cost item).
An optimisation study is planned which will look at alternative option for the treatment of the Mispah 1 TSF.
Moab Khotsong – Great Noligwa shaft pillar extraction
This project was approved by the technical and investment committees for implementation in FY20. The chosen option is based on the partial extraction of reef blocks with a central stabilising pillar to maintain the integrity of both shaft barrels.
The GN# Pillar continued with project execution phase in FY21. The waste development achieved 1 478m and reef development achieved 133m for FY21. Infrastructure rehabilitation upgrades was conducted on the GN shaft surface and underground access routes. Opening up and startup was conducted on the required development ends on 70, 71 and 73 levels and the early work to over-stope 73 level infrastructure commenced in FY21.
The GN# Pillar capital was approved to continue with project execution in FY22. The project has scheduled to continue with waste and reef development on 70, 71 and 73 level. Infrastructure rehabilitation upgrades is scheduled at GN. The over-stope of 73 level infrastructure will continue in FY22.
Moab Khotsong – Zaaiplaats project
The Zaaiplaats project is to mine the orebody below the current Moab Khotsong middle mine. New infrastructure below 101 level will need to be developed to access the orebody.
A feasibility was completed in March 2021 confirming the economic value add to the existing Moab operations. Limited early works had been identified and commenced on 101 level supporting a prompt project start-up.
The project has made its way through Harmony’s project review process and the capital for the project has been approved by the board.
A detailed design phase is planned in early FY22 for aspects of the project that the feasibility study identified as needing additional work. This work will run in parallel with project execution.
Mineral Resources and Mineral Reserves Report 2021 41
EXPLORATION AND PROJECTS

SOUTH AFRICA
Doornkop shaft.
42 Harmony Gold Mining Company Limited

Harmony’s South African operations include nine deep-level
mines, an open pit mining operation and several surface
retreatment facilities. Combined, these account for gold Mineral
Resources of 99.9Moz and gold Mineral Reserves of 24.7Moz.
These are equivalent to 71% and 58% respectively of total
group Mineral Resources and Mineral Reserves.
Mineral Resources and Mineral Reserves Report 2021 43
MINERAL RESOURCES AND MINERAL RESERVES BY OPERATION

SOUTH AFRICA – WEST RAND
MINERAL RESOURCES AND MINERAL RESERVES BY OPERATION
West Rand 44 – 71
Doornkop 48
Kusasalethu 54
Mponeng 60
Harmony has three underground mining
operations on the West Rand – Doornkop,
Kusasalethu and Mponeng. As at 30 June
2021, their combined Mineral Resource
(inclusive) was 36.8Moz and the combined
Mineral Reserve, 4.1Moz.
WEST RAND
LOCATION OF WEST RAND OPERATIONSHarmony’s West Rand operations are located on the north and north-western rim of the Witwatersrand Basin.
The Doornkop shaft complex is south of Krugersdorp, 30km west of Johannesburg, in the province of Gauteng. The property lies between Sibanye-Stillwater’s Cooke 1 shaft and Durban Roodepoort Deep.
Kusasalethu is on the West Wits Line, adjacent to the Savuka and Mponeng mines to the east and the dormant Deelkraal to the west. Kusasalethu is situated 14km south of Carletonville and 90km southwest of Johannesburg. Post year-end 2020 the acquisition from AngloGold Ashanti of Mponeng, as well as infrastructure related to Tau Tona and Savuka, was completed.
Mponeng Mine was purchased by Harmony Gold in October 2020 as part of the transaction whereby the ownership of the remaining AngloGold Ashanti Limited’s South African operations were transferred. Mponeng Mine is 100%-owned by Harmony Gold and forms part of the West Rand operations.
REGIONAL GEOLOGYFor a description of the geological characteristics of the West Rand, refer to the Geology section under each operation.
36.8Moz
4.1Moz
Mineral Resources (inclusive)
Mineral Reserves
Gold and Gold equivalentsContribution to Harmony
26 – Mineral resources
74 – Rest of Harmony
%
10 – Mineral reserves
90 – Rest of Harmony
%
44 Harmony Gold Mining Company Limited

West Rand Operations – Locality
Mponeng: the deepest point.
Mineral Resources and Mineral Reserves Report 2021 45
MINERAL RESOURCES AND MINERAL RESERVES BY OPERATION
27°2527°25
27°4727°47
26°26 26°26
26°13 26°13
West Rand operationsLatitude Longitude
Doornkop 26º13'03.36"S 27º47'26.55"EKusasalethu 26º27'16.23"S 27º21'32.91"EMponeng 26º26'15.60"S 27º25'41.24"E
N
Randfontein West RandCons Luipaardsvlei
R28
R28
R28R501
R500
R501
R500
N12
N12
R41R41
Durban Roodepoort
DeepRand
Leases
Cooke
Westonaria
Cooke
South DeepKloof
Driefontein
TauTonaBlyvooruitzicht
Deelkraal
BLYVOOR MINE
Fochville
Carletonville
Savuka
West Rand operations
DOORNKOP
DOORNKOP 1ASOUTH AFRICA
KUSASALETHUMPONENG
Johannesburg
Pretoria
Polokwane
LesothoDurban
Bloemfontein
East London
Port ElizabethCape Town
Namibia
Botswana
Swaziland
LIMPOPO
GAUTENG
NORTH WEST
NORTHERN CAPE
EASTERN CAPE
WESTERN CAPE
FREE STATEKWAZULU-NATAL
LEGEND
Shaft position
West Rand operations
Towns/residential areas
National roads
Regional roads 0 5
Kilometres

KUSASALETHU/MPONENG STRATIGRAPHIC COLUMNSACS no 42 (2006) Mponeng
Formation Member Mponeng classification (2010) LOG
Ven
ters
do
rp S
up
erg
rou
p
Klip
rivi
ersb
erg
gro
up Alberton Porphyry
Alberton lava
Ventersdorp
VCR
Wit
wat
ersr
and
Su
per
gro
up C
entr
al R
and
Gro
up
Turf
fon
tein
su
bg
rou
p
ElsburgElsburg Quartzite
Denny’s Quartzite
Kimberley Libanon Reef
LIBA5, LIBA4LIBA3, LIBA2
LIBARZLibanon Reef
Joh
ann
esb
urg
su
bg
rou
p
Booysens Doornkop memberDoornkop Quartzite
Booysens Shale
Krugersdorp Bird ReefKrugersdorp Quartzite
Bird Reef
Luipaardsvlei Livingstone ReefLuipaardsvlei Quartzite
Livingstone Reef
RandfonteinJohnstone ReefsMiddlevlei Reef
Johnstone ReefRandfontein Quartzite
Middlevlei Reef
Main Carbon LeaderMain Quartzite
Green BarCarbon Leader
BlyvooruitzichtBlyvooruitzicht Quartzite
North Leader Reef
Wes
t R
and
Gro
up
Jep
pes
tow
n S
ub
gro
up
Maraisburg Maraisburg Quartzite
RoodepoortTransition Zone
Roodepoort Shales
Crown Crown Lavas
Babrosco Veldschoen ReefFlorida Quartzites
Veldschoen Reef
SOUTH AFRICA – WEST RAND continued
46 Harmony Gold Mining Company Limited

WEST RAND STRATIGRAPHIC COLUMN (DOORNKOP)Group Sub-group Formation Informal unit Member
Klipriviers-berg
Westonaria
GROUPSUB-
GROUP FORMATION INFORMAL UNIT AND REEFS MEMBER
KLIPRIVIERSBERG
UPPER TRANSITIONAL
SHALE
LOWER TRANSITIONAL
QURTZITES AND CONGLOMERATES
SHALE
LUIPAARDSVLEI QUARTZITE
JOHNSTONE REEF
LIVINGSTONE REEF
VCR
BIRD AMYGDALOID BIRD REEFS WHITE
REEF
ELSBURG MASSIVES AND
INDIVIDUALS
WEST RAND STRATIGRAPHIC COLUMN
TURFFONTEIN
MAIN REEF, LEADER REEF, SOUTH REEF
CEN
TRA
L
RA
ND
G
RO
UP
WES
T RA
ND
GRO
UP
JEPP
ESTO
WN
TUR
FFO
NTE
INJO
HA
NN
ESB
UR
G
VCR
KIMBERLEYREEFS
LUIPAARDSVLEI
MAIN CONGLOMERATE
RO
OD
EPO
OR
TEL
SBU
RG
KLIP
RIVI
ERSB
ERG
WES
TON-
ARIA
VENETRSPOST
WES
TON
AR
IAR
OB
INSO
N
LANGLAAGTEQUARTZITE
JOHNSTONECONGLOMERATE
RANDFONTEINQUARTZITE
LIVINGSTONECONGLOMERATE
BOOYSENSSHALE
KRUGERSDORP
MODDERFONTEIN WATERPAN
LIVINGSTONE REEF
BIRD
KIMBERLEYSHALE
JOHNSTONE REEF
LANGLAAGTE
GEMSBOKFONTEIN
PANVLAKTE
GEMSPOST
VLAKFONTEIN
Klipriviersberg
Venterspost VCR VCR
Cen
tral
Ran
d G
rou
p
Turf
fon
tein
Elsburg Elsburg massives and individualsModderfontein
Waterpan
Westonaria Quartzites and conglomerates
Gemsbokfontein
PanvlakteGemspost
Vlakfontein
Robinson Shale Kimberley Reefs
Joh
ann
esb
urg
Booysens ShaleUpper transitional
Kimberley ShaleShaleLower transitional
Krugersdorp
Bird AmygdaloidBird ReefsWhite Reef
Bird
Luipaardsvlei Quartzite Luipaardsvlei
Livingstone Conglomerate
GROUPSUB-
GROUP FORMATION INFORMAL UNIT AND REEFS MEMBER
KLIPRIVIERSBERG
UPPER TRANSITIONAL
SHALE
LOWER TRANSITIONAL
QURTZITES AND CONGLOMERATES
SHALE
LUIPAARDSVLEI QUARTZITE
JOHNSTONE REEF
LIVINGSTONE REEF
VCR
BIRD AMYGDALOID BIRD REEFS WHITE
REEF
ELSBURG MASSIVES AND
INDIVIDUALS
WEST RAND STRATIGRAPHIC COLUMN
TURFFONTEIN
MAIN REEF, LEADER REEF, SOUTH REEF
CEN
TRA
L
RA
ND
G
RO
UP
WES
T RA
ND
GRO
UP
JEPP
ESTO
WN
TUR
FFO
NTE
INJO
HA
NN
ESB
UR
G
VCR
KIMBERLEYREEFS
LUIPAARDSVLEI
MAIN CONGLOMERATE
RO
OD
EPO
OR
TEL
SBU
RG
KLIP
RIVI
ERSB
ERG
WES
TON-
ARIA
VENETRSPOST
WES
TON
AR
IAR
OB
INSO
N
LANGLAAGTEQUARTZITE
JOHNSTONECONGLOMERATE
RANDFONTEINQUARTZITE
LIVINGSTONECONGLOMERATE
BOOYSENSSHALE
KRUGERSDORP
MODDERFONTEIN WATERPAN
LIVINGSTONE REEF
BIRD
KIMBERLEYSHALE
JOHNSTONE REEF
LANGLAAGTE
GEMSBOKFONTEIN
PANVLAKTE
GEMSPOST
VLAKFONTEIN
Livingstone Reef Livingstone Reef
Randfontein Quartzite
GROUPSUB-
GROUP FORMATION INFORMAL UNIT AND REEFS MEMBER
KLIPRIVIERSBERG
UPPER TRANSITIONAL
SHALE
LOWER TRANSITIONAL
QURTZITES AND CONGLOMERATES
SHALE
LUIPAARDSVLEI QUARTZITE
JOHNSTONE REEF
LIVINGSTONE REEF
VCR
BIRD AMYGDALOID BIRD REEFS WHITE
REEF
ELSBURG MASSIVES AND
INDIVIDUALS
WEST RAND STRATIGRAPHIC COLUMN
TURFFONTEIN
MAIN REEF, LEADER REEF, SOUTH REEF
CEN
TRA
L
RA
ND
G
RO
UP
WES
T RA
ND
GRO
UP
JEPP
ESTO
WN
TUR
FFO
NTE
INJO
HA
NN
ESB
UR
G
VCR
KIMBERLEYREEFS
LUIPAARDSVLEI
MAIN CONGLOMERATE
RO
OD
EPO
OR
TEL
SBU
RG
KLIP
RIVI
ERSB
ERG
WES
TON-
ARIA
VENETRSPOST
WES
TON
AR
IAR
OB
INSO
N
LANGLAAGTEQUARTZITE
JOHNSTONECONGLOMERATE
RANDFONTEINQUARTZITE
LIVINGSTONECONGLOMERATE
BOOYSENSSHALE
KRUGERSDORP
MODDERFONTEIN WATERPAN
LIVINGSTONE REEF
BIRD
KIMBERLEYSHALE
JOHNSTONE REEF
LANGLAAGTE
GEMSBOKFONTEIN
PANVLAKTE
GEMSPOST
VLAKFONTEIN
Johnstone Conglomerate
GROUPSUB-
GROUP FORMATION INFORMAL UNIT AND REEFS MEMBER
KLIPRIVIERSBERG
UPPER TRANSITIONAL
SHALE
LOWER TRANSITIONAL
QURTZITES AND CONGLOMERATES
SHALE
LUIPAARDSVLEI QUARTZITE
JOHNSTONE REEF
LIVINGSTONE REEF
VCR
BIRD AMYGDALOID BIRD REEFS WHITE
REEF
ELSBURG MASSIVES AND
INDIVIDUALS
WEST RAND STRATIGRAPHIC COLUMN
TURFFONTEIN
MAIN REEF, LEADER REEF, SOUTH REEF
CEN
TRA
L
RA
ND
G
RO
UP
WES
T RA
ND
GRO
UP
JEPP
ESTO
WN
TUR
FFO
NTE
INJO
HA
NN
ESB
UR
G
VCR
KIMBERLEYREEFS
LUIPAARDSVLEI
MAIN CONGLOMERATE
RO
OD
EPO
OR
TEL
SBU
RG
KLIP
RIVI
ERSB
ERG
WES
TON-
ARIA
VENETRSPOST
WES
TON
AR
IAR
OB
INSO
N
LANGLAAGTEQUARTZITE
JOHNSTONECONGLOMERATE
RANDFONTEINQUARTZITE
LIVINGSTONECONGLOMERATE
BOOYSENSSHALE
KRUGERSDORP
MODDERFONTEIN WATERPAN
LIVINGSTONE REEF
BIRD
KIMBERLEYSHALE
JOHNSTONE REEF
LANGLAAGTE
GEMSBOKFONTEIN
PANVLAKTE
GEMSPOST
VLAKFONTEIN
Johnstone Reef Johnstone Reef
Langlaagte Quartzite
GROUPSUB-
GROUP FORMATION INFORMAL UNIT AND REEFS MEMBER
KLIPRIVIERSBERG
UPPER TRANSITIONAL
SHALE
LOWER TRANSITIONAL
QURTZITES AND CONGLOMERATES
SHALE
LUIPAARDSVLEI QUARTZITE
JOHNSTONE REEF
LIVINGSTONE REEF
VCR
BIRD AMYGDALOID BIRD REEFS WHITE
REEF
ELSBURG MASSIVES AND
INDIVIDUALS
WEST RAND STRATIGRAPHIC COLUMN
TURFFONTEIN
MAIN REEF, LEADER REEF, SOUTH REEF
CEN
TRA
L
RA
ND
G
RO
UP
WES
T RA
ND
GRO
UP
JEPP
ESTO
WN
TUR
FFO
NTE
INJO
HA
NN
ESB
UR
G
VCR
KIMBERLEYREEFS
LUIPAARDSVLEI
MAIN CONGLOMERATE
RO
OD
EPO
OR
TEL
SBU
RG
KLIP
RIVI
ERSB
ERG
WES
TON-
ARIA
VENETRSPOST
WES
TON
AR
IAR
OB
INSO
N
LANGLAAGTEQUARTZITE
JOHNSTONECONGLOMERATE
RANDFONTEINQUARTZITE
LIVINGSTONECONGLOMERATE
BOOYSENSSHALE
KRUGERSDORP
MODDERFONTEIN WATERPAN
LIVINGSTONE REEF
BIRD
KIMBERLEYSHALE
JOHNSTONE REEF
LANGLAAGTE
GEMSBOKFONTEIN
PANVLAKTE
GEMSPOST
VLAKFONTEIN
Main Conglomerate
GROUPSUB-
GROUP FORMATION INFORMAL UNIT AND REEFS MEMBER
KLIPRIVIERSBERG
UPPER TRANSITIONAL
SHALE
LOWER TRANSITIONAL
QURTZITES AND CONGLOMERATES
SHALE
LUIPAARDSVLEI QUARTZITE
JOHNSTONE REEF
LIVINGSTONE REEF
VCR
BIRD AMYGDALOID BIRD REEFS WHITE
REEF
ELSBURG MASSIVES AND
INDIVIDUALS
WEST RAND STRATIGRAPHIC COLUMN
TURFFONTEIN
MAIN REEF, LEADER REEF, SOUTH REEF
CEN
TRA
L
RA
ND
G
RO
UP
WES
T RA
ND
GRO
UP
JEPP
ESTO
WN
TUR
FFO
NTE
INJO
HA
NN
ESB
UR
G
VCR
KIMBERLEYREEFS
LUIPAARDSVLEI
MAIN CONGLOMERATE
RO
OD
EPO
OR
TEL
SBU
RG
KLIP
RIVI
ERSB
ERG
WES
TON-
ARIA
VENETRSPOST
WES
TON
AR
IAR
OB
INSO
N
LANGLAAGTEQUARTZITE
JOHNSTONECONGLOMERATE
RANDFONTEINQUARTZITE
LIVINGSTONECONGLOMERATE
BOOYSENSSHALE
KRUGERSDORP
MODDERFONTEIN WATERPAN
LIVINGSTONE REEF
BIRD
KIMBERLEYSHALE
JOHNSTONE REEF
LANGLAAGTE
GEMSBOKFONTEIN
PANVLAKTE
GEMSPOST
VLAKFONTEIN
Main Reef, Leader Reef, South Reef Langlaagte
West Rand Group Jeppestown Roodepoort
GROUPSUB-
GROUP FORMATION INFORMAL UNIT AND REEFS MEMBER
KLIPRIVIERSBERG
UPPER TRANSITIONAL
SHALE
LOWER TRANSITIONAL
QURTZITES AND CONGLOMERATES
SHALE
LUIPAARDSVLEI QUARTZITE
JOHNSTONE REEF
LIVINGSTONE REEF
VCR
BIRD AMYGDALOID BIRD REEFS WHITE
REEF
ELSBURG MASSIVES AND
INDIVIDUALS
WEST RAND STRATIGRAPHIC COLUMN
TURFFONTEIN
MAIN REEF, LEADER REEF, SOUTH REEF
CEN
TRA
L
RA
ND
G
RO
UP
WES
T RA
ND
GRO
UP
JEPP
ESTO
WN
TUR
FFO
NTE
INJO
HA
NN
ESB
UR
G
VCR
KIMBERLEYREEFS
LUIPAARDSVLEI
MAIN CONGLOMERATE
RO
OD
EPO
OR
TEL
SBU
RG
KLIP
RIVI
ERSB
ERG
WES
TON-
ARIA
VENETRSPOST
WES
TON
AR
IAR
OB
INSO
N
LANGLAAGTEQUARTZITE
JOHNSTONECONGLOMERATE
RANDFONTEINQUARTZITE
LIVINGSTONECONGLOMERATE
BOOYSENSSHALE
KRUGERSDORP
MODDERFONTEIN WATERPAN
LIVINGSTONE REEF
BIRD
KIMBERLEYSHALE
JOHNSTONE REEF
LANGLAAGTE
GEMSBOKFONTEIN
PANVLAKTE
GEMSPOST
VLAKFONTEIN
Thin SR
• Characterised by 1-3cm thick• Single pebbly lag• Scattered pebbly – pyrite/black stringer
2
Thin SR
• Characterised by 1cm to 3cm thick
• Single pebbly lag• Scattered pebbly
– pyrite/black stringer.
Thin SR.
Thick SR facies
• Thickness ranges from 4-12cm thickness• Well packed with milky, smoky and blue
pebbles
3
Thick SR
• Thickness ranges from 4cm to 12cm thickness
• Well packed with milky, smoky and blue pebbles.
Thick SR facies.
1
South Reef facies
Compiled by Cobbert Musingadi
South Reef facies.Black SR Picture
4
Black SFBlack SR
Black SR.
Doornkop Reef samples
Mineral Resources and Mineral Reserves Report 2021 47
MINERAL RESOURCES AND MINERAL RESERVES BY OPERATION
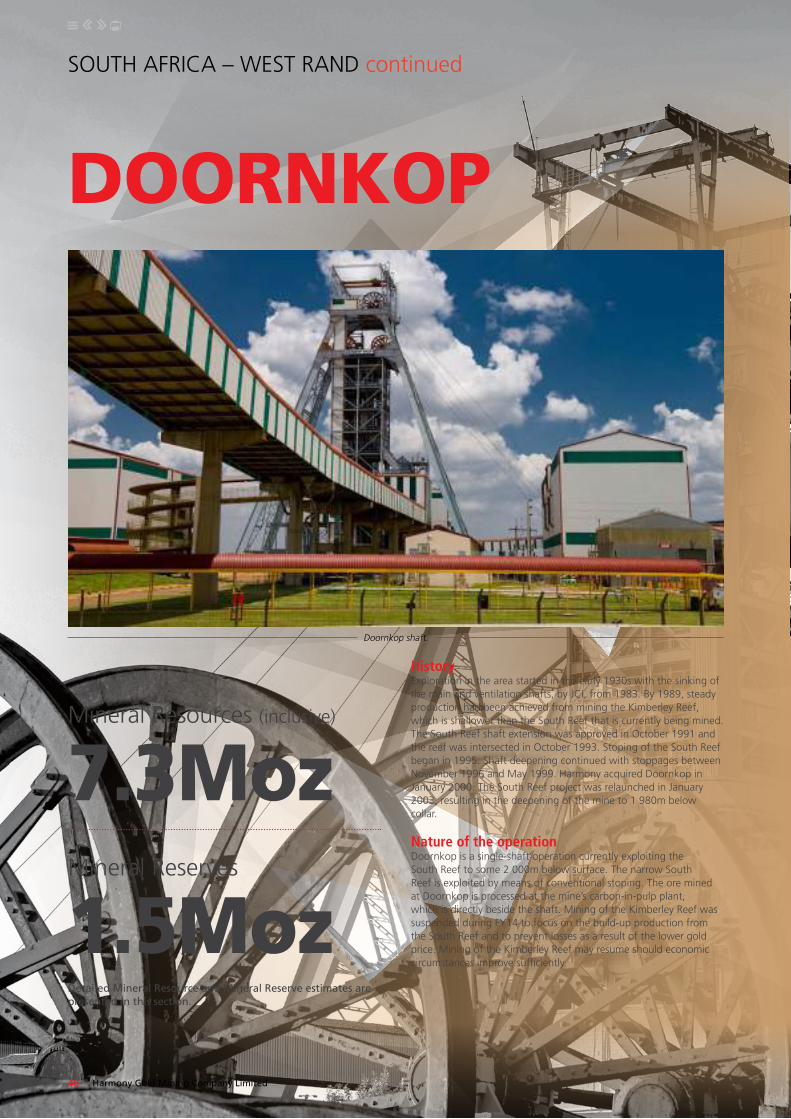
DOORNKOP
SOUTH AFRICA – WEST RAND continued
HistoryExploration in the area started in the early 1930s with the sinking of the main and ventilation shafts, by JCI, from 1983. By 1989, steady production had been achieved from mining the Kimberley Reef, which is shallower than the South Reef that is currently being mined. The South Reef shaft extension was approved in October 1991 and the reef was intersected in October 1993. Stoping of the South Reef began in 1995. Shaft deepening continued with stoppages between November 1996 and May 1999. Harmony acquired Doornkop in January 2000. The South Reef project was relaunched in January 2003, resulting in the deepening of the mine to 1 980m below collar.
Nature of the operationDoornkop is a single-shaft operation currently exploiting the South Reef to some 2 000m below surface. The narrow South Reef is exploited by means of conventional stoping. The ore mined at Doornkop is processed at the mine’s carbon-in-pulp plant, which is directly beside the shaft. Mining of the Kimberley Reef was suspended during FY14 to focus on the build-up production from the South Reef and to prevent losses as a result of the lower gold price. Mining of the Kimberley Reef may resume should economic circumstances improve sufficiently.
Doornkop shaft.
7.3Moz
1.5Moz
Mineral Resources (inclusive)
Mineral Reserves
Detailed Mineral Resource and Mineral Reserve estimates are presented in this section.
48 Harmony Gold Mining Company Limited

GeologyThe Doornkop shaft lease area lies to the south-east of the major north-easterly striking Roodepoort fault, which dips to the south and constitutes the southern edge of the Witpoortjie horst block or gap. This horst block comprises the stratigraphically older sediments of the West Rand Group, with the overlying Central Rand Group sediments having been removed by erosion. Doornkop is bounded by the Roodepoort fault and a number of other faults, including the Saxon fault, which constitute conspicuous structural breaks. Another major fault, the Doornkop fault, which trends in an east-west direction, occurs toward the southern portion of the lease area. This fault dips to the south and has an up-throw to the north.
As nearly the entire upper Witwatersrand section lies within the lease area, all major zones are present. However, given the distance of the area from the primary source of gold, the number of economic bands and their payability is limited. Eight of the well-known reefs are present in the area but only the South Reef and potentially the Kimberley Reef are considered viable at this stage.
The South Reef is between 7.5m and 60m above the Main Reef horizon. The hanging wall of the South Reef consists of siliceous quartzite with non-persistent bands of “blue shot” grit and thin argillite partings. The South Reef footwall is a light coloured and fairly siliceous quartzite. Secondary conglomerate bands and stringers in the hanging wall and footwall of the South Reef may contain sporadic gold values. The general strike of the reef is east-west with a flat dip from 5 to 15 degrees.
Exploration drilling is set to continue in the coming financial year, and will target potential high-grade areas and those with limited geological information, to further increase geological confidence.
Mineral rights/legal aspects and tenureThe current mining right encompasses an area of 2 941.021ha and was successfully converted, executed and registered as a new order mining right at the Mineral and Petroleum Resources Titles Office (MPRTO) on 25 February 2009 under MPT 18/2009. The Department of Mineral Resources reference GP30/5/1/2/2/09MR is valid from 7 October 2008 to 6 October 2038.
Mining methods and mine planningThe mining method used is longwall mining with stability pillars on major geological structures. Geotechnical dip pillars have been introduced between raiseline to minimise seismicity. The flat dip, which results in the development of long cross cuts, presents challenges in terms of ore handling, especially for the bottom part of the raises, ventilation and in the long lead times between the start of cross cut development to completion of stoping per raise line.
Mineral processingThe carbon-in-pulp plant has a monthly milling capacity of 225 000 tonnes. Before Sibanye-Stillwater’s Cooke shafts were placed on care and maintenance, this included toll treatment of approximately 120 000 tonnes a month of ore from these shafts.
InfrastructureDoornkop’s surface and underground infrastructure, including its power and water supplies, can cope with current planned peak production level requirements. The 192, 197 and 202 levels are track-bound while current development on 207 and 212 levels is
trackless. Plans are in place to eventually make these levels track-bound. Work continues on certain essential underground infrastructure on the South Reef, including the permanent tipping arrangements required to bring 207 and 212 levels to full production. Ore is hoisted through the main shaft. Currently, the mine uses Sibanye-Stillwater’s Cooke 1 shaft, which is 7km away, as a second escape way.
Mineral resource estimationThe estimation method used for local measured data on the shaft is ordinary kriging. For local indicated and inferred data, it is simple macro-kriging. Estimates are generally kriged into 30m x 30m blocks for the measured resources from the point support data. Indicated resources are kriged into 60m x 60m blocks, using the associated regularized variograms together with a macro-kriging decluster. Similarly, inferred resources are estimated using the associated regularised variograms and kriging into 120m x 120m blocks. Any unkriged areas in the inferred regions are then covered by global mean estimates. Geozones are based on grade distribution and structure to ensure correct grade estimates for the different areas.
Environmental impactIn line with the Mineral and Petroleum Resources Development Act, Doornkop has the environmental management programme (Ref: GP 30/5/1/2/2/ (09) EM), approved by the Department of Minerals Resources and Energy on 7 June 2010. According to the EMPr approval, and regulation 55(3) of the MPRDA regulations as well as the EMPr itself, regular scheduled EMPr audits should be undertaken and are required to be submitted to the DMRE. The audit conducted for the year 2019/20 indicates that Harmony Doornkop operation obtained a total compliance score of 94.31% for the audit.
All environmental impacts emanating from mining, processing activities and associated infrastructure are documented in the environmental management programme and in the environmental aspect register, as required by both the MPRDA and the ISO 14001 standard.
Annual environmental compliance audits/inspections are conducted by the relevant government departments and independent environmental auditors to verify the status compliance against all applicable environmental laws such as National Water Act, National Environmental Management Act the and the National Nuclear regulations.
An online Doornkop environmental legal register, available at www.drayer-legal.co.za, is used to monitor compliance and to obtain relevant legal environmental updates for the operation to ensure compliance.
Environmental monitoring of key environmental indicators is also undertaken by the operation to monitor compliance which includes: • Air quality monitoring• Ground and surface water monitoring• Biodiversity• Monitoring the ecological status of the klipriver.
Doornkop operation is both certified in terms of ISO 14001:2015 standard and by the International Cyanide Management Institute in terms of the cyanide management code. As required by both the ISO14001 standard and cyanide management code, every effort is made to either eliminate or minimise the impacts of mining activities on the environment and surrounding communities.
Mineral Resources and Mineral Reserves Report 2021 49
MINERAL RESOURCES AND MINERAL RESERVES BY OPERATION
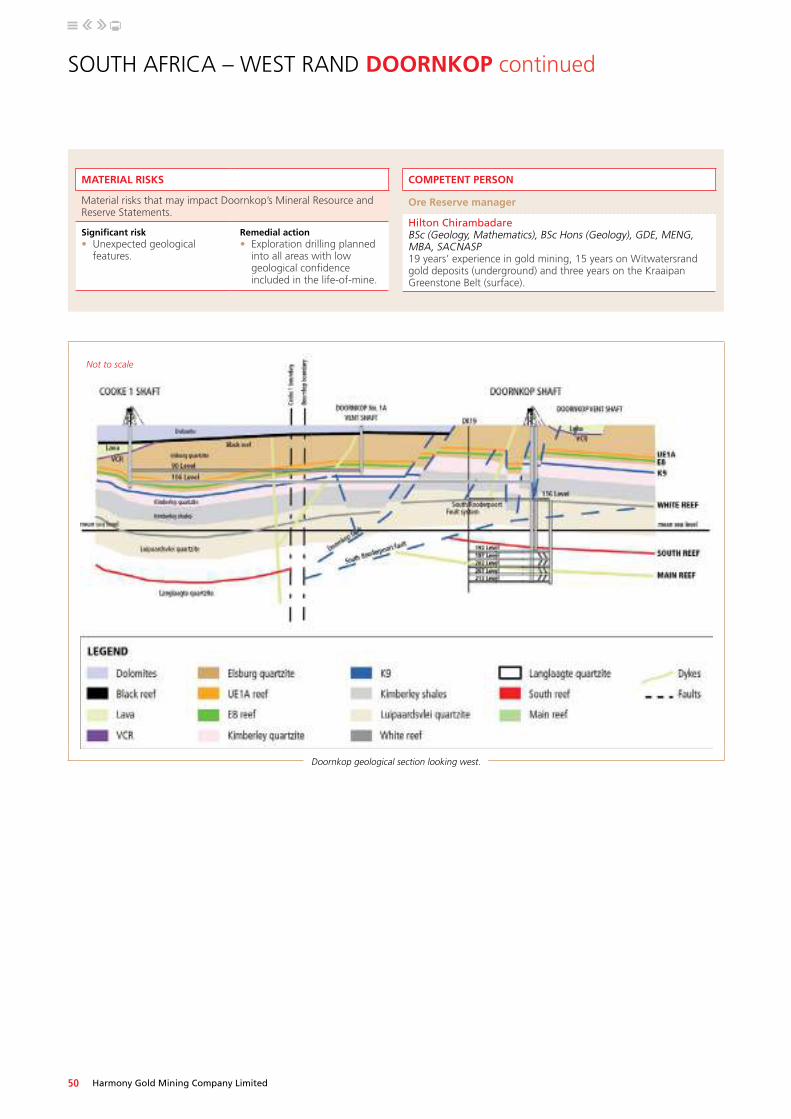
SOUTH AFRICA – WEST RAND DOORNKOP continued
Not to scale
Doornkop geological section looking west.
MATERIAL RISKS
Material risks that may impact Doornkop’s Mineral Resource and Reserve Statements.
Significant risk• Unexpected geological
features.
Remedial action• Exploration drilling planned
into all areas with low geological confidence included in the life-of-mine.
COMPETENT PERSON
Ore Reserve manager
Hilton Chirambadare BSc (Geology, Mathematics), BSc Hons (Geology), GDE, MENG, MBA, SACNASP19 years’ experience in gold mining, 15 years on Witwatersrand gold deposits (underground) and three years on the Kraaipan Greenstone Belt (surface).
50 Harmony Gold Mining Company Limited

Doornkop Mine:South Reef
Measured and Indicated Mineral Resource grade-tonnage curve
14
12
10
8
6
4
2
00.0 2.0 4.0 6.0 8.0 10.0 12.0 ■ Tonnage ■ Grade
Accumulative tonnes (millions)
20
18
16
14
12
10
8
6
4
2
0
Grade above cut-off (g/t)
Cut-off grade (g/t)
DOORNKOPGold – Mineral Resource estimates at 30 June 2021 (inclusive)
Measured Indicated Inferred Total
Tonnes Gold Tonnes Gold Tonnes Gold Tonnes Gold(Mt) (g/t) (000kg) (000oz) (Mt) (g/t) (000kg) (000oz) (Mt) (g/t) (000kg) (000oz) (Mt) (g/t) (000kg) (000oz)
South Reef 5.2 7.93 41 1 326 3.8 6.88 26 838 3.5 7.65 27 860 12.5 7.53 94 3 024Main Reef 0.1 5.38 0.4 14 0.05 5.51 0.3 8 0.02 5.32 0.1 3 0.1 5.41 1 25Kimberley Reef 18.1 3.36 61 1 957 12.1 3.15 38 1 226 10.1 3.28 33 1 066 40.3 3.28 132 4 249
Total 23.4 4.38 103 3 297 15.9 4.04 64 2 072 13.6 4.41 60 1 929 53.0 4.29 227 7 299
Modifying factors
South ReefMCF
(%)SW(cm)
MW(cm)
PRF (%)
Cut-off (cmg/t)
2020 80 123 146 96 8002021 79 124 152 96 739
Gold – Mineral Reserve estimates at 30 June 2021
Proved Probable Total
Tonnes Gold Tonnes Gold Tonnes Gold(Mt) (g/t) (000kg) (000oz) (Mt) (g/t) (000kg) (000oz) (Mt) (g/t) (000kg) (000oz)
South Reef 6.0 4.73 29 918 4.4 4.17 19 596 10.5 4.49 47 1 513
Mineral Resources and Mineral Reserves Report 2021 51
MINERAL RESOURCES AND MINERAL RESERVES BY OPERATION
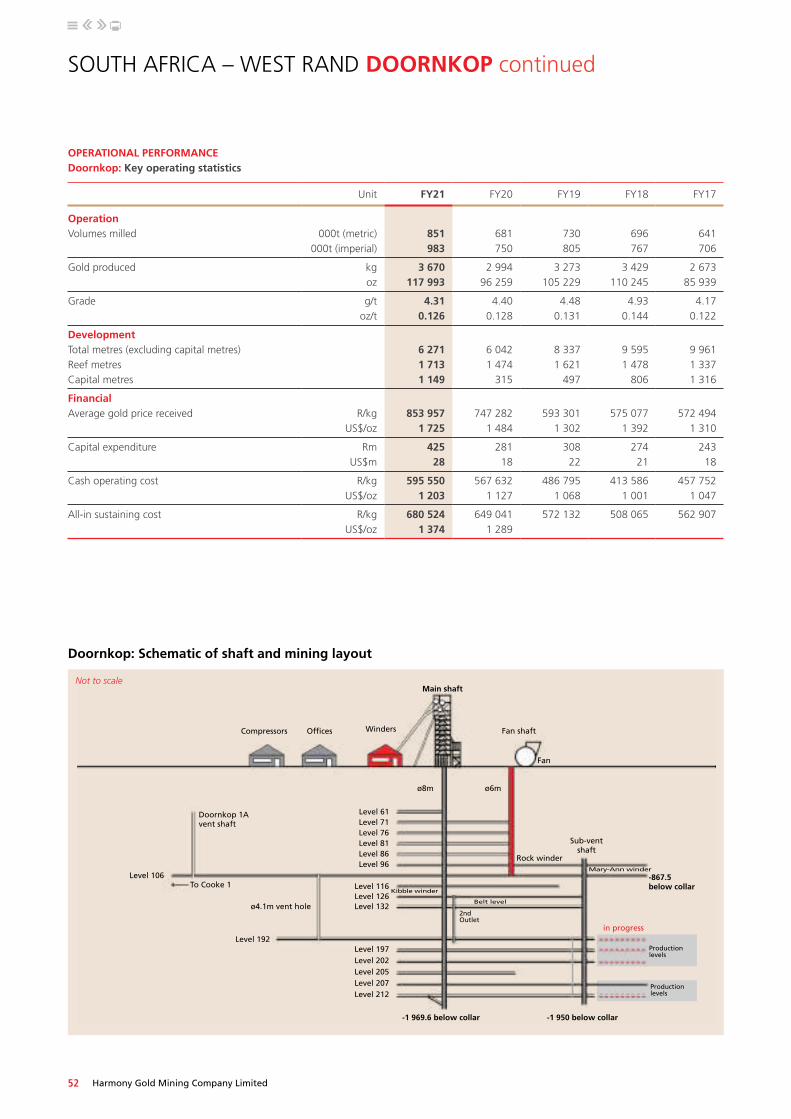
SOUTH AFRICA – WEST RAND DOORNKOP continued
OPERATIONAL PERFORMANCEDoornkop: Key operating statistics
Unit FY21 FY20 FY19 FY18 FY17
OperationVolumes milled 000t (metric) 851 681 730 696 641
000t (imperial) 983 750 805 767 706
Gold produced kg 3 670 2 994 3 273 3 429 2 673oz 117 993 96 259 105 229 110 245 85 939
Grade g/t 4.31 4.40 4.48 4.93 4.17oz/t 0.126 0.128 0.131 0.144 0.122
DevelopmentTotal metres (excluding capital metres) 6 271 6 042 8 337 9 595 9 961Reef metres 1 713 1 474 1 621 1 478 1 337Capital metres 1 149 315 497 806 1 316
FinancialAverage gold price received R/kg 853 957 747 282 593 301 575 077 572 494
US$/oz 1 725 1 484 1 302 1 392 1 310
Capital expenditure Rm 425 281 308 274 243US$m 28 18 22 21 18
Cash operating cost R/kg 595 550 567 632 486 795 413 586 457 752US$/oz 1 203 1 127 1 068 1 001 1 047
All-in sustaining cost R/kg 680 524 649 041 572 132 508 065 562 907US$/oz 1 374 1 289
Productionlevels
Productionlevels
Not to scale
Doornkop: Schematic of shaft and mining layout
Main shaft
Fan shaftCompressors Offices Winders
Fan
ø6mø8m
Doornkop 1A vent shaft
Sub-ventshaft
Level 192
Mary-Ann winderLevel 106
Level 86Level 96
Rock winder
in progress
Level 116
Level 197
Level 132Level 126
-867.5below collarTo Cooke 1
2ndOutlet
Level 205Level 207Level 212
ø4.1m vent hole
Level 202
Level 61Level 71
Level 81Level 76
Kibble winder
Belt level
-1 969.6 below collar -1 950 below collar
52 Harmony Gold Mining Company Limited

Doornkop Mine – South Reef: Mineral Resources and Mineral Reserves
* Inferred Resources are incorporated into the life-of-mine plan, based on the good track record of our ability to convert Inferred Mineral Resources into Indicated and Measured Mineral Resources through ongoing development and exploration work.
Mineral Resources and Mineral Reserves Report 2021 53
MINERAL RESOURCES AND MINERAL RESERVES BY OPERATION
Y -84 000
Y -84 000
Y -76 000
Y -76 000
Y -80 000
Y -80 000
X +905 000 X +905 000
X +899 000X +899 000
X +896 000X +896 000
X +902 000X +902 000
SOUTH ROODEPOORT FAULT
DOORNKOP FAULT
DOORNKOP
VENT SHAFT 1A
SAXON FA
ULT
WITPOORTJIE HORST
ROODEPOORT FAULT
ROODEPOORT FAULT
N
LEGEND
Mining right
Shaft position
Fault zones
Dykes
Infrastructure
Abandoned pillars
Mined out
Mineral ResourcesMeasured
Indicated
Inferred
Inferred Resources in LOM*
Mineral ReservesProved and Probable
0 1 000 2 000
Metres

SOUTH AFRICA – WEST RAND continued
KUSASALETHU
SOUTH AFRICA – WEST RAND continued
HistoryHarmony acquired the Elandsrand and Deelkraal mines from the then AngloGold Limited in 2001. Shaft sinking of twin vertical shafts at Elandsrand had begun in January 1975 and been completed in December 1978. First gold was produced in 1979. In February 2010, Elandsrand changed its name to Kusasalethu, which means “our future” in Zulu.
Nature of the operationThe 10m-diameter rock/ventilation shaft was initially sunk to 2 195m and the man/material shaft to 2 127m. By June 1984, a 10m-diameter sub-vertical rock/service shaft had been completed to a depth of 3 048m and a 7m-diameter sub-vertical ventilation shaft to a depth of 3 048m. Both shafts were deepened to a final depth below surface of 3 318m and 3 388m respectively as part of the deepening project to extract the higher-grade pay shoot towards the west of the mine. In December 2014, a decision was taken to suspend operations in the old portion of Kusasalethu and to restructure the mine. Subsequently, mining above 98 level ceased.
Kusasalethu employs sequential-grid mining, which is in essence an upside-down Christmas tree configuration. This method is used to direct seismic stresses away from current working areas into virgin rock areas.
Given the decrease in the Mineral Reserve at Kusasalethu in recent years, a result of normal depletion, a revised, shortened life-of-mine
Kusasalethu shaft.
5.9Moz
0.5Moz
Mineral Resources (inclusive)
Mineral Reserves
Detailed Mineral Resource and Mineral Reserve estimates are presented in this section.
54 Harmony Gold Mining Company Limited

plan was implemented in FY15. This plan aims to optimise the mine’s cash flow at a higher grade and create a stronger operating margin while providing the flexibility necessary to access the high-grade payshoot of the Ventersdorp Contact Reef below infrastructure should economic circumstances allow.
GeologyKusasalethu is situated in the West Wits Basin and mines the VCR as its main orebody.
The Ventersdorp Contact Reef facies model at Kusasalethu is based on the paleotopographic or slope and terrace model. Nine facies types have been recognised at Kusasalethu – eight sedimentological and one structural. Four of the facies are thick, high-grade, geologically distinct reef terraces separated from one another by a thin low-grade slope reef.
The sand-filled channel is a thick low-grade facies. The Sandy Terrace Complex is found on the same elevation as the Terrace Complex but is essentially a pebbly quartzite with no grade. The Mondeor conglomerates have been identified sub-cropping against the Ventersdorp Contact Reef in stopes in certain areas and have been delineated as separate facies in these areas.
The Elsburg conglomerates, found on the western side of Kusasalethu, form the footwall to the Ventersdorp Contact Reef and are part of the Turffontein Supergroup. It is a predominantly polymictic matrix-supported conglomerate of well-packed and moderately sorted, sub-rounded smoky (80%), black-grey (15%) quartz pebbles, chert (3%) and some elongated shale pebbles (2%). The matrix is pale yellow to light green and medium-grained and pyritic in places.
The Ventersdorp Contact Reef is overlain by the Ventersdorp Lava belonging to the Ventersdorp Supergroup. The reef is light to mid-grey in colour and fine crystalline, seldom containing phenocrysts. In places it is amygdaloidal with quartz and pyrite mineralisation. Flow structures are also present at the base of the lava. It breaks into very angular fragments due to weak jointing and flow banding – it would appear to be andesitic in composition.
Geological discontinuities observed at Kusasalethu include faults, dykes and sills. Sills may occur in the footwall in areas adjacent to certain dykes. Flat bedding plane faulting also occurs and results in reef duplication, elimination and brecciation. Faults and dykes are classified according to their relative geologic ages as follows: Pre-Ventersdorp Contact Reef, Ventersdorp, Platberg, Bushveld and Pilanesberg structures.
Kusasalethu mines in blocky ground created by structures in the form of dykes and faults. The dykes are fairly basic in composition and they tend to strike north-north east and south-south west with a general dip of 75 degrees. The faults, however, have a strike mostly of east-south east and west-north west with a few exceptions. Generally, these are normal faults with the accompanying loss of ground with varying throws – from mere centimetres to a massive 60m (the Kittims and De Twem faults).
Mineral rights/legal aspects and tenureThe current mining right encompasses a total area of 7 000ha. Kusasalethu’s mining right has been successfully converted, executed and registered as a new order mining right at the Mineral and Petroleum Resources Titles Office (MPRTO). GP30/5/1/2/2/07MR is valid from 18 December 2007 to 17 December 2037. In terms of section 102 of the Mineral and Petroleum Resources Development
Act (MPRDA), the farms Buffelsdoorn and Deelkraal have been successfully included into Kusasalethu’s mining right, increasing the extent of the original mining right from 51km² to 70km². These farms are contiguous to the south of the principal mining right.
Mining methods and mine planningMining is by means of sequential grids with regional dip stabilising pillars, backfill and pre-conditioning to offset the effects of mining at this depth. Mining is conducted over five levels from 98 level to 113 level. Large geological structures are stabilised by means of clamping pillars. Mine planning is done in two major phases, a life-of-mine plan is done annually and six-month mine plans are reviewed monthly to ensure ample time to react to changes in the dynamic mining environment. All planning is done in the digital environment by means of computer-assisted draughting.
Mineral processingOre mined is processed on-site at the Kusasalethu gold plant. Gold is extracted by means of milling, cyanide leaching, carbon-in-pulp concentration and electrowinning to absorb the carbon to produce ore. No smelting is done on-site and the gold doré is dispatched to Rand Refinery.
InfrastructureOre mined is transported by rail-bound equipment to the shaft’s main ore pass system where it gravity feeds to 115 level. Ore is then hoisted via the sub-vertical shaft to above 73 level and then to surface. Given the depth of mining, major engineering infrastructure required includes refrigeration and cooling installations on surface and underground.
Mineral resource estimationData for valuation is obtained by means of chip sampling on the reef horizon in a 6m x 6m grid. Supplemental information is obtained from underground exploration drilling and existing surface exploration boreholes. All sampling done is subject to quality assurance/quality control, as prescribed by SAMREC, to ensure data quality and accuracy. Based on similarities in geology, the mining lease is divided into a total of eight geozones. Based on confidence levels for geostatistical data, valuation is by means of a computer-generated block model as follows:• Measured blocks (30m x 30m grid)• Indicated blocks (60m x 60m grid)• Inferred blocks (120m x 120m grid)
The block model is then digitally transferred to the digital environment for valuation.
Environmental impactKusasalethu’s environmental aspects and impacts are managed according to the environmental management programme, as approved by the Department of Mineral Resources (DMR), in terms of the MPRDA. All environmental aspects and impacts emanating from mining activities are documented in a dedicated report and in the environmental aspect register, as required by the MPRDA and the ISO 14001:2015 standard.
The approved environmental management programme was amended in 2014, in terms of section 102 of the MPRDA. This amendment allowed for the inclusion of the dimensions of the waste rock dumps, as well as the new height details and footprint of the tailings storage facility, reclamation of the rock dumps and the expansion of the existing underground workings for numerous portions of the farm Deelkraal 142 IQ. The DMR approved the amendments in 2018.
Mineral Resources and Mineral Reserves Report 2021 55
MINERAL RESOURCES AND MINERAL RESERVES BY OPERATION

SOUTH AFRICA – WEST RAND KUSASALETHU continued
Annual performance monitoring audits are conducted by various departments, including the DMR and the Department of Water and Sanitation to verify compliance with the following legislation:• Mine Health and Safety Act• National Water Act• National Environmental Management Act• MPRDA.
All environmental impacts arising from mining activities are managed in terms of the requirements of the approved environmental management programme, the water use licence, the waste permit and in line with the ISO 14001:2015 standards.
As required by relevant regulations, environmental audits or performance assessments to verify compliance with the approved environmental management programme are conducted every second year by independent environmental consultants and a report is submitted to the DMR. External and internal environmental legal compliance audits are also conducted. An off-site legal environmental register is used to monitor compliance, and to obtain applicable and relevant environmental legal updates for the operation.
In line with Harmony’s biodiversity and rehabilitation position statement, Kusasalethu management has successfully implemented an alien invader plant eradication programme since 2016. To date, this programme, which continues to run, has cleared invasive plant species from more than 3 500ha of 5 113ha of the surface mining right area.
Bio-monitoring surveys are also conducted on surface water resources, close to the operation, to safeguard the scarce resource and to ensure compliance with the conditions of the water use licence issued in terms of National Water Act to:• Determine the condition of biological communities in the rivers
and streams and to determine the chemical water quality in streams during the wet and dry seasons
• Provide baseline reference conditions for future studies in order to assist Kusasalethu management in identifying environmental liabilities that might result from current mining activities regarding the potential contamination of surface streams.
Full chemical analyses include:• Monthly sampling of surface streams• Quarterly analysis of borehole water to monitor groundwater
quality.
Kusasalethu is ISO 14001:2015-certified and complies with the requirements of the ISO 14001:2015 standard for which it is audited annually by an independent certification body. The operation was initially certified in 2011, and most recently in 2018, under the new ISO 14001 standard (2015). In line with this accreditation, every effort is made to eliminate or minimise the negative effects of mining activities on the environment and adjacent communities.
The operation has also been accredited in terms of the Cyanide Management Code by the International Cyanide Management Institute. Independent third-party audits are conducted every three years to check compliance with the Cyanide Code.
MATERIAL RISKS
Material risks that may impact Kusasalethu’s Mineral Resource and Reserve Statement.
Significant risks• Seismicity• Water build-up at Deelkraal• Backfill volumes• Major engineering
infrastructure failure.
Remedial action• Extended production breaks
scheduled over past three years to allow for infrastructure upgrades
• Control of mining sequence and appropriate support systems
• Dewatering of the Deelkraal area through 98 level
• Waste rock dump on surface used to supplement backfill volumes.
COMPETENT PERSON
Johann Ackermann BSc Geology with distinction (UFS, 2005), SAIMM27 years’ hard rock, deep-level and ultra-deep level gold mining experience in the Witwatersrand Supergroup.
56 Harmony Gold Mining Company Limited

Kusasalethu Mine:Ventersdorp Contact Reef
Measured and Indicated Mineral Resource grade-tonnage curve
■ Tonnage ■ Grade
Accumulative tonnes (millions)
35
30
25
20
15
10
5
0
Grade above cut-off (g/t)
Cut-off grade (g/t)
30
25
20
15
10
5
00.0 4.02.0 8.06.0 12.010.0 16.014.0 20.018.0
Sample of Ventersdorp Contact Reef (VCR) Mined at our Kusasalethu mineThe sample description is as follows: Poorly sorted and moderately packed clast to matrix supported conglomerate of predominantly medium-sized quarts pebbles (oligomectic: with an 85:15 ratio: milky Quartz versus smokey Quartz ratio) – set within a medium-grained arenetic to pyritic matrix.
Well mineralized (20% – 25%) disseminated pyrite to heavily bottom-loaded pyrrhotite basal contact (with an estimated {AU value} of between 1500 – 2000 cm.g/t). At its base is a dual band – flow banded mylonite with micro xenoliths. The twin mylonite bands on the bottom contact is indicative of two distinct phases of deformation, likely associated with the world’s largest known meteor crater, known as the Vredefort dome.
VCR Reef.
KUSASALETHUGold – Mineral Resource estimates at 30 June 2021 (inclusive)
Measured Indicated Inferred Total
Tonnes Gold Tonnes Gold Tonnes Gold Tonnes Gold(Mt) (g/t) (000kg) (000oz) (Mt) (g/t) (000kg) (000oz) (Mt) (g/t) (000kg) (000oz) (Mt) (g/t) (000kg) (000oz)
Ventersdorp Contact Reef 3.4 11.15 38 1 226 12.6 9.05 114 3 668 3.7 8.63 32 1 026 19.7 9.33 184 5 919
Modifying factors
Ventersdorp Contact ReefMCF
(%)SW(cm)
MW(cm)
PRF (%)
Cut-off (cmg/t)
2020 85 136 164 93 1 1002021 86 136 165 95 1 100
Gold – Mineral Reserve estimates at 30 June 2021
Proved Probable Total
Tonnes Gold Tonnes Gold Tonnes Gold(Mt) (g/t) (000kg) (000oz) (Mt) (g/t) (000kg) (000oz) (Mt) (g/t) (000kg) (000oz)
Ventersdorp Contact Reef 1.9 7.51 14 455 0.3 4.76 1 43 2.2 7.15 15 498
Mineral Resources and Mineral Reserves Report 2021 57
MINERAL RESOURCES AND MINERAL RESERVES BY OPERATION

SOUTH AFRICA – WEST RAND KUSASALETHU continued
Kusasalethu: Schematic of shaft and mining layout
Winders:2 Men1 Service
Winders:2 Rock
3 x 4.1MW fans
Refrigeration plant and bac 42MW Compressors
Offices, stores and workshops
ø9.63mRock/Vent
Pump station and energy recovery
Pump station and energy recovery
Winders: 2 Men, 2 Rock,Levels 70 and 71
Winders: 1 Kibble, 1 StageEnergy recovery
1 x 1 000kW fan
1 x 160kW fan
2 x 210kW fan
1 x 240kW fan
Pumping
Pumping
Pumping
Sub
-ven
t sh
aft
-2 334 below datum
-3 582 below datum
ø10
m s
haf
t
ø8.35m Men/Material
Level 29
Level 52
No mining
No mining
Production levels
Level 70Level 71Level 73Level 75Level 76Level 77
Level 76Level 78Level 80Level 82Level 85Level 88Level 92Level 95Level 98Level 100Level 102Level 105Level 109Level 113Level 115Level 117
Not to scale
OPERATIONAL PERFORMANCEKusasalethu: Key operating statistics
Unit FY21 FY20 FY19 FY18 FY17
OperationVolumes milled 000t (metric) 708 615 742 670 607
000t (imperial) 780 678 817 738 670
Gold produced kg 3 999 3 015 4 989 4 429 4 394oz 128 570 96 934 160 400 142 395 141 270
Grade g/t 5.65 4.90 6.72 6.61 7.24oz/t 0.165 0.143 0.196 0.193 0.211
DevelopmentTotal metres (excluding capital metres) 2 202 3 039 5 437 4 016 5 101Reef metres 282 1 019 1 217 776 1 185Capital metres – – – – –
FinancialAverage gold price received R/kg 854 201 743 153 591 742 577 313 572 376
US$/oz 1 725 1 476 1 298 1 397 1 309
Capital expenditure Rm 205 188 316 289 289US$m 13 12 22 22 21
Cash operating cost R/kg 742 452 849 782 476 417 472 177 459 422US$/oz 1 500 1 687 1 045 1 143 1 051
All-in sustaining cost R/kg 814 048 923 054 556 621 554 302 541 247US$/oz 1 644 1 833 1 221 1 342 1 238
58 Harmony Gold Mining Company Limited

Kusasalethu Mine – Ventersdorp Contact Reef June 2021: Mineral Resources and Mineral Reserves
Mineral Resources and Mineral Reserves Report 2021 59
MINERAL RESOURCES AND MINERAL RESERVES BY OPERATION
Y -30 000
Y -30 000
Y -34 000
Y -34 000
Y -38 000
Y -38 000
X +26 000 X +26 000
X +29 200 X +29 200
X +32 400 X +32 400
0 500 1 000
Metres
N
DEELKRAAL
KUSASALETHU MINE
LEGENDMining right
Shaft position
Intermine boundary
Fault zones and dykes
Infrastructure
Abandoned pillars
Mined out
Mineral ResourcesMeasured
Indicated
Inferred
Mineral ReservesProved and Probable
East
ern
Ob
erh
olz
er 2
East
ern
Ob
erh
olz
er
Ken
t D
yke
De
Twem
fau
lt
Kit
Tim
s fa
ult

MPONENG
SOUTH AFRICA – WEST RAND continued
HistoryMponeng Mine is located on a site that has been operational for over 30 years.
Mponeng was previously known as the Western Deep Levels South shaft, or No 1 shaft. The original twin shaft sinking from surface commenced in 1981 and was commissioned along with the gold plant complex in 1986 when mining began. Production started through the use of two hoisting shafts, a sub-shaft and two service shafts. The name changed to Mponeng Mine in 1999.
In 2017, Savuka and Tau Tona mines commenced orderly closure and the remaining Tau Tona Mineral Resources and Ore Reserves are published as part of Mponeng Mine.
Western Deep Levels commenced mining in 1957 as part of the Anglo-American operations. Mponeng, previously known as Western Deep Levels 1 shaft or South Mine, commenced in February 1980 and the first ore was hoisted in June 1986.The initial scope of the operation was to set up the shaft infrastructure consisting of a main shaft and a service shaft that was complemented with horizontal development from Tau Tona Mine and Savuka Mine on 75 level and 81 level to establish the mining in the main shaft area.
Mponeng shaft.
23.6Moz
2.1Moz
Mineral Resources (inclusive)
Mineral Reserves
Detailed Mineral Resource and Mineral Reserve estimates are presented in this section.
60 Harmony Gold Mining Company Limited
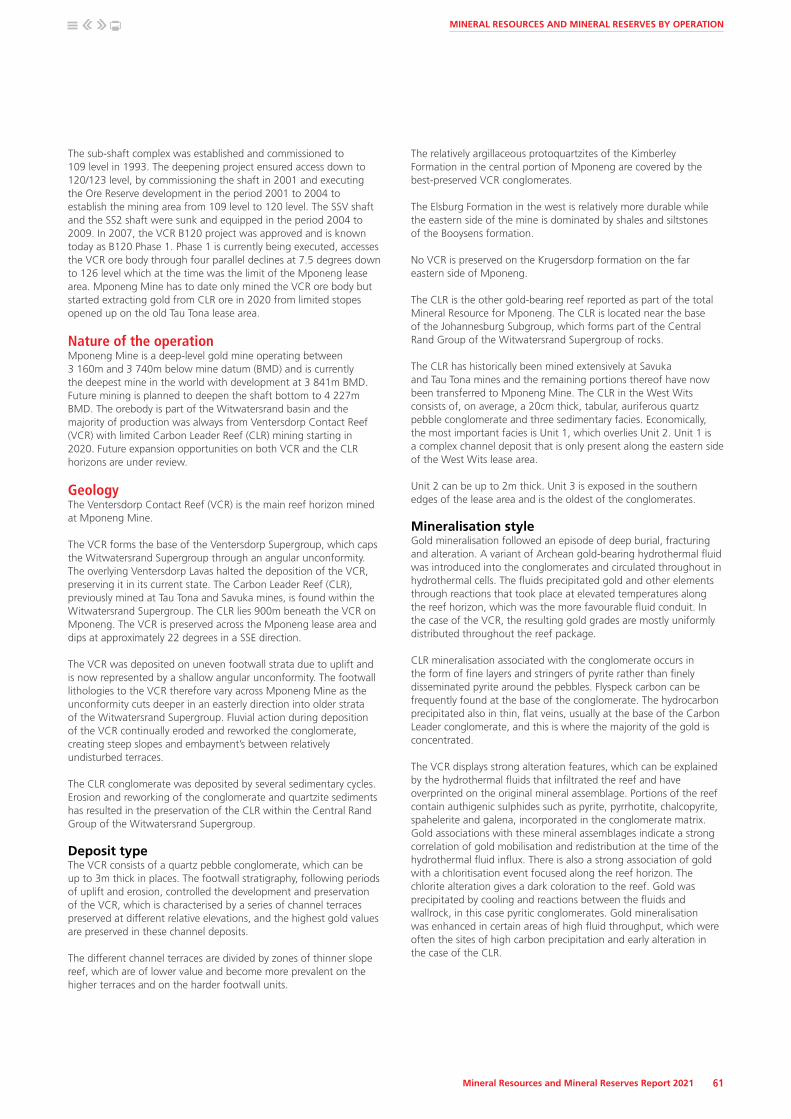
The sub-shaft complex was established and commissioned to 109 level in 1993. The deepening project ensured access down to 120/123 level, by commissioning the shaft in 2001 and executing the Ore Reserve development in the period 2001 to 2004 to establish the mining area from 109 level to 120 level. The SSV shaft and the SS2 shaft were sunk and equipped in the period 2004 to 2009. In 2007, the VCR B120 project was approved and is known today as B120 Phase 1. Phase 1 is currently being executed, accesses the VCR ore body through four parallel declines at 7.5 degrees down to 126 level which at the time was the limit of the Mponeng lease area. Mponeng Mine has to date only mined the VCR ore body but started extracting gold from CLR ore in 2020 from limited stopes opened up on the old Tau Tona lease area.
Nature of the operationMponeng Mine is a deep-level gold mine operating between 3 160m and 3 740m below mine datum (BMD) and is currently the deepest mine in the world with development at 3 841m BMD. Future mining is planned to deepen the shaft bottom to 4 227m BMD. The orebody is part of the Witwatersrand basin and the majority of production was always from Ventersdorp Contact Reef (VCR) with limited Carbon Leader Reef (CLR) mining starting in 2020. Future expansion opportunities on both VCR and the CLR horizons are under review.
GeologyThe Ventersdorp Contact Reef (VCR) is the main reef horizon mined at Mponeng Mine.
The VCR forms the base of the Ventersdorp Supergroup, which caps the Witwatersrand Supergroup through an angular unconformity. The overlying Ventersdorp Lavas halted the deposition of the VCR, preserving it in its current state. The Carbon Leader Reef (CLR), previously mined at Tau Tona and Savuka mines, is found within the Witwatersrand Supergroup. The CLR lies 900m beneath the VCR on Mponeng. The VCR is preserved across the Mponeng lease area and dips at approximately 22 degrees in a SSE direction.
The VCR was deposited on uneven footwall strata due to uplift and is now represented by a shallow angular unconformity. The footwall lithologies to the VCR therefore vary across Mponeng Mine as the unconformity cuts deeper in an easterly direction into older strata of the Witwatersrand Supergroup. Fluvial action during deposition of the VCR continually eroded and reworked the conglomerate, creating steep slopes and embayment’s between relatively undisturbed terraces.
The CLR conglomerate was deposited by several sedimentary cycles. Erosion and reworking of the conglomerate and quartzite sediments has resulted in the preservation of the CLR within the Central Rand Group of the Witwatersrand Supergroup.
Deposit typeThe VCR consists of a quartz pebble conglomerate, which can be up to 3m thick in places. The footwall stratigraphy, following periods of uplift and erosion, controlled the development and preservation of the VCR, which is characterised by a series of channel terraces preserved at different relative elevations, and the highest gold values are preserved in these channel deposits.
The different channel terraces are divided by zones of thinner slope reef, which are of lower value and become more prevalent on the higher terraces and on the harder footwall units.
The relatively argillaceous protoquartzites of the Kimberley Formation in the central portion of Mponeng are covered by the best-preserved VCR conglomerates.
The Elsburg Formation in the west is relatively more durable while the eastern side of the mine is dominated by shales and siltstones of the Booysens formation.
No VCR is preserved on the Krugersdorp formation on the far eastern side of Mponeng.
The CLR is the other gold-bearing reef reported as part of the total Mineral Resource for Mponeng. The CLR is located near the base of the Johannesburg Subgroup, which forms part of the Central Rand Group of the Witwatersrand Supergroup of rocks.
The CLR has historically been mined extensively at Savuka and Tau Tona mines and the remaining portions thereof have now been transferred to Mponeng Mine. The CLR in the West Wits consists of, on average, a 20cm thick, tabular, auriferous quartz pebble conglomerate and three sedimentary facies. Economically, the most important facies is Unit 1, which overlies Unit 2. Unit 1 is a complex channel deposit that is only present along the eastern side of the West Wits lease area.
Unit 2 can be up to 2m thick. Unit 3 is exposed in the southern edges of the lease area and is the oldest of the conglomerates.
Mineralisation styleGold mineralisation followed an episode of deep burial, fracturing and alteration. A variant of Archean gold-bearing hydrothermal fluid was introduced into the conglomerates and circulated throughout in hydrothermal cells. The fluids precipitated gold and other elements through reactions that took place at elevated temperatures along the reef horizon, which was the more favourable fluid conduit. In the case of the VCR, the resulting gold grades are mostly uniformly distributed throughout the reef package.
CLR mineralisation associated with the conglomerate occurs in the form of fine layers and stringers of pyrite rather than finely disseminated pyrite around the pebbles. Flyspeck carbon can be frequently found at the base of the conglomerate. The hydrocarbon precipitated also in thin, flat veins, usually at the base of the Carbon Leader conglomerate, and this is where the majority of the gold is concentrated.
The VCR displays strong alteration features, which can be explained by the hydrothermal fluids that infiltrated the reef and have overprinted on the original mineral assemblage. Portions of the reef contain authigenic sulphides such as pyrite, pyrrhotite, chalcopyrite, spahelerite and galena, incorporated in the conglomerate matrix. Gold associations with these mineral assemblages indicate a strong correlation of gold mobilisation and redistribution at the time of the hydrothermal fluid influx. There is also a strong association of gold with a chloritisation event focused along the reef horizon. The chlorite alteration gives a dark coloration to the reef. Gold was precipitated by cooling and reactions between the fluids and wallrock, in this case pyritic conglomerates. Gold mineralisation was enhanced in certain areas of high fluid throughput, which were often the sites of high carbon precipitation and early alteration in the case of the CLR.
Mineral Resources and Mineral Reserves Report 2021 61
MINERAL RESOURCES AND MINERAL RESERVES BY OPERATION

Reef sedimentology (VCR and CLR)The VCR is characterised by a predominantly pebble to matrix-supported conglomerate that was deposited on an uneven topographic surface (see Figure 1).
The first pulse of VCR deposition followed a prolonged episode of regional uplift centred on the Bank Anticline to the east and north-east of the mine property. The VCR sedimentary package
displays all the characteristics associated with a braided fluvial environment.
Following the initial depositional phase, a series of fluvial regressions, caused by continuing regional uplift, resulted in the erosion and reworking of the sediments. This created embayment’s which eroded into the original conglomerate terraces. The area between these embayment’s and terraces is referred to as slope, where extensive slumping often left only a thin veneer of preserved conglomerate.
SOUTH AFRICA – WEST RAND MPONENG continued
Figure 1: Schematic 3D representation showing the depositional environment
Not to scale
Highest terrace elevation
Footwall FootwallLowest terrace elevation
20m – 30m
1
4
4
3
5
5
4
4
5
2
2
LEGENDMain lithofacies
Terrace A
Terrace B
Terrace C
Terrace D
Terrace E
Terrace F
Slope
Morphological features1. Extensive slope type area
2. Terrace
3. Terrace slope/riser
4. Embayment
5. Erosion channel
Current directions
Footwall quartzite
Samplers taking reef samples.
62 Harmony Gold Mining Company Limited
Towards the end of each regressional fluvial cycle, more quiescent fluvial conditions prevailed in which fluvial winnowing and sorting of existing sediment took place.
The three major sedimentary facies of VCR are referred to as upper, middle and lower-terrace reefs, the upper terraces representing the original pulse of conglomerate deposition, and the lower terraces the final reworked product. The terraces are separated by narrow, laterally impersistent areas of slope reef. These slope reef areas constitute approximately 10-15% of the total surface area of VCR. This number does change and has done so the more east and west the mine develops on the VCR across the softer footwall units of the Booysens shale in the east and west onto the Elsburg subunits.
Intermediate (middle) terrace elevations between upper and lower terraces are observed throughout the mining areas and represent areas where late stage fluvial cutback into upper terraces was incomplete.
Distribution and orientation of slopes and terraces was largely influenced by the nature of the underlying footwall rock and its natural susceptibility to fluvial and erosional processes. As a consequence, the more competent and siliceous footwall lithologies generally host a high proportion of upper reef terraces, whereas the less competent lithologies host a higher proportion of lower terrace and slope-type VCR.
The competent Denny’s quartzite which underlies the VCR on the western side of Mponeng and the eastern side of Savuka therefore hosts a higher percentage of upper terrace reef than the less competent Kimberley quartzites that underlie the reef in the central portion of Mponeng and Tau Tona mines.
Quartzites of the Elsburg formation lie beneath the VCR on the western portion of Mponeng and Savuka. On Mponeng the quartzites generally host a poorly developed VCR that often consists of a single pebble layer. On Savuka, the VCR on the Elsburg footwall has been extensively mined, suggesting that a breakthrough might exist on Mponeng. On a local scale, prominent subcrop-parallel channels of thicker reef occur which are oriented along sedimentary troughs in the footwall, and probably represent accumulation of sediment at the bases of ridges.
The Elsburg facies is thought to represent an extensive area of denudation where early VCR was washed off a gentle westward-facing surface by seasonal flooding, thus indicating an over-bank depositional environment. Recently it has been exposed that VCR on the lower terraces have developed and eroded onto the Elsburg units further west than on the upper levels showing good preservation and persistent channel development. The mine is currently mining 30% of its ore on the Elsburg footwall unit.
On the eastern side of Mponeng and Tau Tona, the VCR lies on the Booysens shale formation, which represents an area of highly variable and undulating palaeo-topography. Terrace elevation differences often exceed 15m. The Booysens facies VCR is considered as representing the more proximal facies of the reef, with a general increase in average pebble size compared with the adjacent Kimberley footwall. Reef thickness is generally reduced on the upper terraces due to the undulating topography but is above
the mine average in the lower terraces. On the lower levels in the east the erratic nature of the VCR is dominant on the Booysens shale. The preservation of the VCR is erratic, and the terrain is currently exhibiting a thinly preserved VCR with thick channel developed in places. The soft footwall is considered to affect the thick reef development.
The terraces that lie on the Booysens shale gradually become less extensive in an eastward direction, as the Krugersdorp footwall contact is approached. The contact between the Booysens and the Krugersdorp is generally considered to be the eastern limit of economic VCR resource.
The long axes of the lower terraces reflect the local palaeo-drainage direction during the reworking phase of the VCR. Drainage from the higher terraces onto slopes and lower terraces resulted in local embayment’s and valleys aligned perpendicular to the main drainage direction.
VCR terrace complexes on the Kimberley footwall extend across the Booysens shale contact for distances up to 400m. The reef channel orientations on the Booysens shale geozone appear to be similar to those on the Kimberley quartzites on the western side of the Booysens footwall, but swing parallel to the regional palaeo-footwall strike on the eastern side of the geozone. Areas of slope, erosional facies or non-depositional facies separate the channels.
Deposition of the VCR was followed by rapid extrusion of lavas and tuffs of the Ventersdorp Supergroup. Fluvial activity was abruptly halted, causing preservation of the underlying palaeo-topographic features.
The facies model consists of three geological parameters: Terrace elevation, footwall lithology, and channel development (or “reef architecture”).
The output of the model provides the geological basis for the evaluation model. Polygons defining areas of thick and thin VCR are outlined using new geological information. Figure 3 illustrates how the VCR orebody is subdivided according to the footwall lithology and used within the estimation process. The estimation domains are based on geological information.
The estimation domains are defined and refined using mostly data from chip sampling and, to a lesser extent, borehole sampling. The thick/thin (VTK/VTN) of the Kimberley domain split is largely confined to mined, and therefore sampled, areas, with very little projection of those areas into unmined ground. The unmined ground is estimated separately as a “mixed” domain (VMD) by means of a percentage krig in which each macro block is assigned a certain percentage thick and thin channel.
The resultant new estimation domain areas defining VTN were derived from the low-value areas defined in this study done through an inhouse study.
The trends of new VTN areas are similar to those areas defined above 120 level and north of the Mponeng shaft area and the rest of the VCR areas above 120 level. Similar trend of the thick domain (VTK) is followed.
Mineral Resources and Mineral Reserves Report 2021 63
MINERAL RESOURCES AND MINERAL RESERVES BY OPERATION

SOUTH AFRICA – WEST RAND MPONENG continued
Figure 2: Schematic section of the proposed VCR palaeo-morphology indicating the variation of terrace deposition characteristics
The dark blue of the Kimberley zone (Figure 3) defines the thick facies and the light blue defines the thin facies.
Similarly, on the Booysens domain where the yellow defines the thin facies and the pink defines the thick facies.
The other principal economic horizon mined at Mponeng Mine is the Carbon Leader Reef (CLR).
The CLR is part of the Central Rand Group near the base of the Carletonville formation. The CLR possesses a considerable lateral persistence, covering an area of approximately 5km x 30km. The CLR lies 800-900 metres stratigraphically deeper than the VCR. The CLR resides on a disconformity as it truncates the underlying North Leader, which appears to be a reef body in many ways with varying gold content.
Following the burial of the North Leader by a succession of protoquartzites and immature conglomerates (the footwall beds or Blyvooruitzicht formation), the West Wits area was eroded to produce a scoured but generally planar unconformity. Oligomictic small-pebble conglomerates (10-50 cm thick). Also known as Carbon Leader Reef were deposited on this unconformity, followed by mature sands. This conglomerate is referred to as the No 3 band. The No 3 band was gently folded, scoured and eroded and then overlain by a thick (c.400cm) package of sediments, the No 2
package. This unit in turn was gently folded and eroded. Later a planar unconformity (possibly the result of a marine transgression) formed over the entire region. Pre-existing conglomerates were re-worked in places, forming a very mature oligomictic conglomerate (the No 1 band) that was subsequently well mineralised with gold. No conglomerate is present on this No 1 unconformity in places, probably due to a combination of variations in transport direction and the presence of sandy material under the unconformity.
Gold mineralisation followed an episode of deep burial, fracturing and alteration. A variant of Achaean greenstone gold-bearing hydrothermal fluid was introduced into the reef environment and was probably circulated in hydrothermal cells.
The Carbon Leader conglomerate system proved a suitable fluid conduit and various minerals were precipitated in the permeable, often structurally prepared host. Solid hydrocarbon precipitated in very thin, flat veins, which usually formed at the base of the Carbon Leader. Gold was precipitated by cooling and reactions between the fluid and the wall rocks, in this case pyritic conglomerates. The regional distribution of gold was strongly influenced by subtle changes in the physical properties of the conglomerates and their footwall lithologys. Gold mineralisation was enhanced in areas of high fluid throughput, which were often the sites of high carbon precipitation and strong early alteration.
64 Harmony Gold Mining Company Limited

Mineral rights, legal aspects and tenureTable 1: Prospecting and Mining Rights registered in the name of Harmony gold for Mponeng Mine
DMR Ref NoMPTRO No
AGA File Cover No Farm Minerals
Effective date
Expiry date Comments
GP30/5/1/2/2(01) MR 10/2006 1948 Elandsfontein Mining Right Gold 14.02.2006 13.02.2036 Granted and registered
DoA: 04/2012 Ptns of the farms Elandsfontein 115 IQ, Elandsfontein 135 IQ, Elandsfontein 144 IQ, Elandsfontein 146 IQ, Elandsfontein 115 IQ, Elandsfontein 135 IQ, Elandsfontein 140 IQ, Elandsfontein144 IQ, Elandsfontein 145 IQ, Elandsfontein 146 IQ
Silver, nickel, uranium
Mining methods and mine planningGold prices applied are R700 000/kg for Ore Reserve and R820 000/kg for Mineral Resource. The Mineral Resource is reported at an average width of 136cm overall of which 160cm applied to VCR and WUDLS and 120cm applied to CLR.
The orebody is extracted by means of mostly breast mining methods with associated waste mining in addition to the reef being extracted. The dilution resulting from these waste sources is captured and incorporated in the tonnage calculation with historic performance being the benchmark. In addition to the in-stope dilution sources being accounted for allowance is also made for dilution from development waste sources to mill by both schedule results and factors based on history. Widths used are based on the channel width of the orebody being mined and are aligned with the mining method (stoping and ledging) and historical achievements.
Geological models and the sampling data are presented for the mine’s evaluation in a Datamine file format.
Cut-off grades are derived by taking into consideration the available resource for the selected project areas, the operating cost as captured for the business plan and the required margin. Modifying factors are also being brought into the equation.
Due to the variability of the VCR with respect to value and the seismic risk associated with deep level mining the sequential grid mining method is used at Mponeng. The aim is to create sufficient flexibility to mitigate the risks posed to the production plan by doing sufficient development to have at least 24 months of minable reserves available.
(a) Some design criteria include the following for the VCR ore body:• Breast mining to strike spans of 180m with 30m wide dip
stabilising pillars orientated on true dip• Major geological features are bracketed• Incorporation of 30m strike stability pillars at a maximum dip
spacing of 100m (skin to skin) on the side of the raise where the mining is conducted last in order to minimise closure in the stoping areas below 109 level
• Rock engineering requirements are adhered to.
(b) Some design criteria include the following for the CLR ore body:• Breast mining to strike spans of 180m with 40m wide dip
stabilising pillars orientated on true dip• Major geological features are bracketed• Incorporation of 30m strike stability pillars at a maximum dip
spacing of 100m (skin to skin) on the side of the raise where the mining is conducted last in order to minimise closure
• Rock engineering requirements are adhered to.
(c) On the VCR horizon above 109 level the access haulages have all been developed in the hanging wall with the exception of 99 level. For the areas below 109 level all the haulages are being developed in the footwall. In the case of the CLR all haulages will be developed in the footwall.• Middling to reef 85-150m for the VCR and 70m for footwall
placement in the CLR orebody• Where possible the VCR haulages are placed out of the
Booysens shale, however, where these shales are traversed allowance is made for reduced rate of advance to account for delays due to additional support requirements.
(d) The overall mining sequence is an inverted Christmas tree, however, within each raise the face configuration is underhand when mining towards the west and overhand (top panels leading) when mining towards the east (the bottom panels leading). This is, however, governed by the presence of large geological structures within the raise line.
Based on the latest geological structure model and the selected mining method (sequential grid) the geotechnical team designed a suitable pillar layout based on modelling results. These include dip stabilising-bracket and strike pillars. A detailed mine design and schedule is done based on the pillar design taking cognisance of uneconomical areas which on macro-scale is excluded. This design and schedule are the basis of the mine plan and the Ore Reserves declared. With the exploitation of ever deepening resources and the need for flexibility on a mine of this nature the sequential grid mining method was adopted. This has been proven as the method best suited to the deep-level gold mining with its associated seismicity and therefore flexibility requirements.
Mineral Resources and Mineral Reserves Report 2021 65
MINERAL RESOURCES AND MINERAL RESERVES BY OPERATION

SOUTH AFRICA – WEST RAND MPONENG continued
Mining rates are based on current and expected performance depending on underground conditions and constraints. Development is done by either mechanised, mechanical or conventional method depending on the most suitable method for the specific requirements. Dilution is included in the production plan mainly from external waste sources from the stoping operations, but allowances are also made for dilution occurred in the ore flow process.
Planning resource is based on the resources available at a required mining value where a cut-off value (971cmg/t) is determined and these resources are excluded from the planning resource on a macro scale. Geotechnical design is done of the available planning resource and mine design is done accordingly. All level 1 reserves are accessible via current infrastructure.
Mineral processingMponeng has its own processing plant situated adjacent to the mine. Ore and waste material are hoisted separately with ore being delivered to the plant by means of a conveyor belt and the waste rock going to the low-grade stockpile.
Ore mined is treated and smelted at the Mponeng gold plant, which also processes low grade ore from the stockpile adjacent to the shaft.
The ore is initially ground down by means of semi-autogenous milling, after which a conventional gold leach process incorporating liquid oxygen injection is applied. The gold is then recovered by means of carbon in pulp (CIP) technology together with electro-winning and smelting processes.
InfrastructureMponeng is an established mine which has been in operation since 1986. All surface and underground infrastructure is in place to support the current reserve declaration and includes processing plant, tailing dam, roads, water and power supply, offices, housing, security, etc.
Mponeng is an operating mine with well-established logistic support. Transport of ore is done on premises as well as processing which is done next to the mine at the Mponeng Mine gold plant.
Mineral resource estimationThe estimation method used for local measured estimates on the shaft is Ordinary Kriging (OK) and for local indicated and inferred estimates is simple macro kriging (SMK). The orientations and ranges of each geozone’s semi-variogram are used to determine the
kriging search parameters, and the estimation parameters are also optimised. Estimates are generally kriged into 30m x 30m blocks for the measured resources from the point support data. The indicated resources are kriged into 60m x 60m blocks data is capped at Mponeng Mine.
Gold is the only variable estimated for large block sizes. ChW is estimated for all block sizes.
The Ore Reserve classification is based on the Mineral Resource category. The choice of the appropriate category of Mineral Resource depends upon the quantity, distribution and quality of data available and the level of confidence attached to the data. The Mineral Resource is classified per the SAMREC guidelines into the following components: Measured, Indicated and Inferred Resources.
Discounts are applied to the Resource due to the “unknown” complex geological structure ahead of current mining faces and are based on the level of information available. These discounts are regularly checked to confirm that they are still appropriate for the areas being mined in.
For the Ore Reserves, which are modified Indicated and Measured Mineral Resources, consideration was given to the modifying factors affecting extraction. No Measured Mineral Resources have been converted to Probable Ore Reserves instead of Proved Ore Reserve due to uncertainties associated with modifying factors that are considered in the conversion from Mineral Resources to Ore Reserves.
The Datamine mining software system is currently in use on this shaft. A scripting/macro system has been generated, which is linked to a customised scripting menu. This menu allows for professional and easy managing of the data and building of geostatistical models.
The imported data is associated to the geozones for the geostatistical model generation. It is also assumed that the differing support sizes for chip samples and borehole samples are negligible. Histograms and statistics of the raw data are then calculated for each geozone for comparison purposes.
The various search parameters files are based on the modelled semi-variograms. The defined search ellipse adheres to the direction of the associated semi-variogram, as well as the range distances. The current minimum and maximum is variable for VCR measured estimation per geozone as well as for the Indicated/Inferred estimation VCR.
66 Harmony Gold Mining Company Limited

Figure 3: Footwall Geozones which form the basis of the Geological facies model. Each footwall zone is subdividedVCR - Estimation Domains
600m
KIMBERLEYELSBURG BOOYSENS KRUGERSDORP
SAVUKA MINE TAU TONA MINE
MPONENG MINE
TYPE DESCRIPTION
Elsburg Khusasalethu, Savuka.
Elsburg Mponeng
Kimberley Terrace
Kimberley Slope
Ventersdorp Mixed Domain
Fretted Terrace
VML Right
WUDLS Elsburg
WUDLS VML
WUDLS Booysens
WUDLS Driefontein side
WUDLS Elandskraal
Booysens Terrace
Booysens Slope
Booysens Mixed Domain South
Booysens Mixed North
Booysens Mixed South EastBooysens Mixed Domain South Fixed %
Booysens Thick South
Booysens Thin South
Krugersdorp Slope
Krugersdorp Terrace
Krugersdorp East
Krugersdorp Mixed Domain
Environmental impactMponeng’s environmental aspects and impacts are managed according to the environmental management programme, as approved by the Department of Mineral Resources (DMR), in terms of the MPRDA. All environmental aspects and impacts emanating from mining activities are documented in a dedicated report and in the environmental aspect register, as required by the MPRDA and the ISO 14001:2015 standard.
Annual performance monitoring audits are conducted by various departments, including the DMR and the Department of Water and Sanitation to verify compliance with the following legislation:• Mine Health and Safety Act• National Water Act• National Environmental Management Act• MPRDA.
All environmental impacts arising from mining activities are managed in terms of the requirements of the approved environmental management programme, the water use licence, the waste permit is in line with the ISO 14001:2015 standards.
As required by relevant regulations, environmental audits or performance assessments to verify compliance with the approved environmental management programme are conducted every
second year by independent environmental consultants and a report is submitted to the DMR. External and internal environmental legal compliance audits are also conducted. An off-site legal environmental register is used to monitor compliance, and to obtain applicable and relevant environmental legal updates for the operation.
Full chemical analyses include:• Monthly sampling of surface streams• Quarterly analysis of borehole water to monitor groundwater
quality.
Mponeng is ISO 14001:2015-certified and complies with the requirements of the ISO 14001:2015 standard for which it is audited annually by an independent certification body. The operation was initially certified in 2011, and most recently in 2018, under the new ISO 14001 standard (2015). In line with this accreditation, every effort is made to eliminate or minimise the negative effects of mining activities on the environment and adjacent communities.
The operation has also been accredited in terms of the Cyanide Management Code by the International Cyanide Management Institute. Independent third-party audits are conducted every three years to check compliance with the Cyanide Code.
Mineral Resources and Mineral Reserves Report 2021 67
MINERAL RESOURCES AND MINERAL RESERVES BY OPERATION

SOUTH AFRICA – WEST RAND MPONENG continued
Mponeng Mine:Ventersdorp Contact Reef
Measured and Indicated Mineral Resource grade-tonnage curve
■ Tonnage ■ Grade
Accumulative tonnes (millions)
35
30
25
20
15
10
5
0
Grade above cut-off (g/t)
Cut-off grade (g/t)
30
25
20
15
10
5
00.0 4.02.0 8.06.0 12.010.0 16.014.0 20.018.0
MATERIAL RISKS
Material risks that may impact Mponeng’s Mineral Resource and Reserve Statement.
Significant risks• Seismicity
Remedial action• Support strategy• Seismic management around
mass response• Cycle mining implemented• Preconditioning• Monitor seismic potency.
• Face length flexibility • Optimise development rates• Critical raise line scrutiny• Maintain affective mining
mix.
• Flooding of shaft bottom • Commissioning of 123l pumping column
• Sealing of dam sidewall 127 level.
COMPETENT PERSON
Ore Reserve manager
William Herman OlivierCertificate of Competency for Mine Survey, GDE,South African Geomatics Council (SAGC)0136
MPONENGGold – Mineral Resource estimates at 30 June 2021 (inclusive)
Measured Indicated Inferred Total
Tonnes Gold Tonnes Gold Tonnes Gold Tonnes Gold(Mt) (g/t) (000kg) (000oz) (Mt) (g/t) (000kg) (000oz) (Mt) (g/t) (000kg) (000oz) (Mt) (g/t) (000kg) (000oz)
Mponeng 2.9 15.61 46 1 464 21.7 14.11 306 9 851 28.1 13.60 382 12 266 52.7 13.92 733 23 581
Modifying factors
MponengMCF
(%)SW(cm)
MW(cm)
PRF (%)
Cut-off (cmg/t)
2020 – – – – –2021 81 152 215 98 971
Gold – Mineral Reserve estimates at 30 June 2021
Proved Probable Total
Tonnes Gold Tonnes Gold Tonnes Gold(Mt) (g/t) (000kg) (000oz) (Mt) (g/t) (000kg) (000oz) (Mt) (g/t) (000kg) (000oz)
Mponeng 1.9 8.72 17 535 5.8 8.47 49 1 569 7.7 8.53 65 2 104
68 Harmony Gold Mining Company Limited

OPERATIONAL PERFORMANCEMponeng: Key operating statistics
Unit FY21
OperationVolumes milled 000t (metric) 683
000t (imperial) 753
Gold produced kg 5 446oz 175 092
Grade g/t 7.97oz/t 0.233
DevelopmentTotal metres (excluding capital metres) 6 299Reef metres 815Capital metres –
FinancialAverage gold price received R/kg 896 474
US$/oz 1 811
Capital expenditure Rm 493US$m 32
Cash operating cost R/kg 532 812US$/oz 1 076
All-in sustaining cost R/kg 659 760US$/oz 1 333
Mponeng: Schematic of shaft and mining layout
Winders:2 Men2 Rock
Winders:2 Men2 Rock
Winders:2 Men2 Rock
Winders:1 Man
Dri
efo
nte
in b
ou
nd
ary
Ven
tila
tio
n s
haf
t
Mai
n s
haf
t
WU
DL V
CR
bo
un
dary
Mai
n s
haf
t
Serv
ice
shaf
t
Winders:2 Men2 Rock
Sea level: (1 828.797m bd)Su
b shaft
TV shaft
SS1
SS2
SSV
Collar: 176.2 mbdCollar: 275.8 mbd
Winders:2 Men2 Rock
Winders:1 Man 500m bd
1 000m bd
1 500m bd
2 000m bd
2 500m bd
3 000m bd
3 500m bd
4 000m bd
Tau Tona Mponeng
58 Level61 Level66 Level
87 Level
75 Level
VCR
CL
No mining
Production levels
81 Level84 Level
109 Level113 Level116 Level120 Level
123 Level126 Level
89 Level94 Level
99 Level
104 Level
91 Level94 Level
97 Level100 Level
106 Level109 Level112 Level116 Level120 Level
124 # Bottom: 3 773m bd 123 # Bottom: 3 737.3m bd
N
Not to scale
Mineral Resources and Mineral Reserves Report 2021 69
MINERAL RESOURCES AND MINERAL RESERVES BY OPERATION

SOUTH AFRICA – WEST RAND MPONENG continued
Mponeng MineVentersdorp Contact Reef Mineral Resources
70 Harmony Gold Mining Company Limited
-Y 40 000
-Y 40 000
-Y 44 000
-Y 44 000
-+X 25 600 -+X 25 600
-+X 32 000 -+X 32 000
-+X 35 200 -+X 35 200
-+X 28 800 -+X 28 800
N
TAU TONA MINE
SAVUKA MINE
MPONENG MINE
0 1 000 2 000 3 000
Metres
LEGEND
Shaft position
Mine boundary
Fault zones and dykes
Abandoned areas
Mined out
Mineral ResourcesMeasured
Indicated
Inferred
Mineral ReservesProven or Probable
Mak
ulu
Dyk
e
BV
78 D
yke
Peggy Dyke
Peggy Dyke
Georgette Dyke
DD
Dyk
e
Pin
k an
d G
reen
Dyk
e
Gre
ater
Gre
en D
yke
PE D
yke
Pretorius Fault Z
one
Spotted Dick Dyke
Pretorius Fault Zone

Mponeng MineCarbon Leader Reef Mineral Resources
Mineral Resources and Mineral Reserves Report 2021 71
INTRODUCTION
-Y 40 000
-Y 40 000
-Y 44 000
-Y 44 000
-+X 25 600 -+X 25 600
-+X 28 800 -+X 28 800
-+X 32 000 -+X 32 000
N
TAU TONA MINE
SAVUKA MINE
MPONENG MINE
0 1 000 2 000 3 000
Metres
LEGEND
Shaft position
Mine boundary
Fault zones and dykes
Abandoned areas
Mined out
Mineral ResourcesMeasured
Indicated
Inferred
Mineral ReservesProven or Probable
Boulder Dyke
Speckled Dyke
Bank Dyke
Bank Dyke
Frid
ay D
yke
Frid
ay D
yke
Braz
il D
yke
Tum
i Dyk
e
Litt
le T
um
i Dyk
e
Pink and Green D
yke
Gre
ater
Gre
en D
yke
Pretorius Fault Z
oneChri
stm
as D
yke
Com
posi
te D
yke
KO
P ea
st a
nd w
est
PE D
yke
JK D
yke
Skel
m D
yke
Kud
u D
yke
Peggy Dyke
Peggy DykeLess
er G
reenBV
78 D
yke
Georgette Dyke
Georgette Dyke

SOUTH AFRICA – KLERKSDORP GOLDFIELD
KLERKSDORP GOLDFIELD
MINERAL RESOURCES AND MINERAL RESERVES BY OPERATION
Klerksdorp goldfield 72 – 81
Moab Khotsong 74
12.4Moz
4.2Moz
Mineral Resources (inclusive)
Mineral Reserves
Harmony has one underground mining
operation in the Klerksdorp goldfield – Moab
Khotsong. As at 30 June 2021, the estimated
Mineral Resource (inclusive) was 12.4Moz and
the estimated Mineral Reserve, 4.2Moz.
LOCATION OF OPERATION IN KLERKSDORP GOLDFIELDMoab Khotsong, which includes the mining and surface infrastructure of the adjacent Great Noligwa, is located in the Free State province, near the towns of Orkney and Klerksdorp, about 180km south-west of Johannesburg. The mining lease area lies just south of the Vaal River, which forms a natural boundary between South Africa’s North West and Free State provinces.
REGIONAL GEOLOGYFor a description of the geological characteristics of the Klerksdorp goldfield, refer to the Geology section under Moab Khotsong.
From FY20 to FY21, Moab Khotsong’s Mineral Reserves increased by 147% due to the inclusion of Zaaiplaats. Moab top and middle mine Reserve was influenced mainly by depletions. The Mineral Resource decreased by 1.7% due to a structure change in the Zaaiplaats area which was based on new information from exploration drilling.
Gold and Gold equivalentsContribution to Harmony
9 – Mineral resources
91 – Rest of Harmony
%
10 – Mineral reserves
90 – Rest of Harmony
%
72 Harmony Gold Mining Company Limited

Klerksdorp Goldfield Operations – Locality
KLERKSDORP GOLDFIELD STRATIGRAPHIC COLUMNGroup Sub-group Formation Informal unit and reefs Member
KlipriviersbergAlberton/ Orkney
GROUPSUB-
GROUP FORMATION INFORMAL UNIT AND REEFS MEMBER
COMMONAGE
QUARTZITES
QURTZITES AND CONGLOMERATES
QUARTZITE
VCR
ZANDPAN MARKER
VAAL REEF
ELSBURG MASSIVES AND
INDIVIDUALS
Lava beds
C-REEF
KLERKSDORP GOLDFIELDS STRATIGRAPHIC COLUMN
TURF
FONT
EIN
COMMONAGE REEF ADDA MAY REEF
LIVINGSTONE REEF
MILLAR REEF
CEN
TRA
L
RA
ND
G
RO
UP
WES
T RA
ND
GRO
UP
JEPP
ESTO
WN
TUR
FFO
NTE
INJO
HA
NN
ESB
UR
G
VCR
KIMBERLEYREEFS
QUARTZITES WITH MINOR INTERBEDDED
CONGLOMERATES
RO
OD
EPO
OR
TM
ON
DEO
R
KLIP
RIVI
ERSB
ERG
Albe
rton
/ Ork
ney
VENETRSPOST
KLE
RK
SDO
RP
GO
LD
ESTA
TE
STILFONTEIN
CRYSTALKOP
STRATHMORE
MODDERFONTEIN WATERPAN
MILLAR REEF
BIRD
C-REEF
LIVINGSTONE REEF
Qua
rtzi
te
GOLD ESTATES QUARTZITE
DENNYS REEF
COMMONAGE
Lava beds
Venterspost VCR VCR
Cen
tral
Ran
d G
rou
p
Turf
fon
tein
Mondeor Elsburg massives and individuals Modderfontein Waterpan
Klerksdorp Quartzites and conglomeratesGold Estates Quartzite
Dennys Reef
Gold Estate Kimberley Reefs
Joh
ann
esb
urg
Crystalkop C-Reef C-Reef
Strathmore Zandpan Marker Vaal ReefVaal Reef
Bird
Stilfontein
Quartzite Quartzites with minor interbedded conglomerates
Millar Reef Millar Reef
Quartzites
Livingstone Reef Livingstone Reef
Commonage QuartziteCommanage ReefAda May or Reef
Wes
t R
and
G
rou
p
Jeppestown Roodepoort
Mineral Resources and Mineral Reserves Report 2021 73
MINERAL RESOURCES AND MINERAL RESERVES BY OPERATION
26°4826°48
26°59 26°59R502
R502
R30
LEGEND
Shaft position
Surface lease area
National roads
R76
MOAB KHOTSONG
GREAT NOLIGWA
Orkney
Vaal River
NORTH WEST PROVINCE
FREE STATE
Bu�elsfontein
Klerksdorp
N12 NKlerksdorp goldfield
SOUTH AFRICA
Johannesburg
Pretoria
Polokwane
LesothoDurban
Bloemfontein
East London
Port ElizabethCape Town
Namibia
Botswana
Swaziland
LIMPOPO
GAUTENG
NORTHERN CAPE
EASTERN CAPE
WESTERN CAPE
FREE STATEKWAZULU-NATAL
NORTH WEST
Klerksdorp
Buffelsfontein
Vaal River
Orkney
NORTH WEST PROVINCE
FREE STATE
GREAT NOLIGWA
MOAB KHOTSONG
N12
R502
R502
R30
R76
LEGEND
Shaft position
Surface lease area
Mine lease area
National roads
Regional roads
0 0.3 0.6 1.2 1.8
Kilometres

SOUTH AFRICA – KLERKSDORP GOLDFIELD continued
MOAB KHOTSONG
HistoryThe Moab Khotsong Mine began production in 2003 while Great Noligwa, which was merged with Moab Khotsong in 2014, began production in 1968. These mines are collectively referred to as Moab Khotsong. Harmony acquired Moab Khotsong from AngloGold Ashanti Limited in March 2018. Lower mine (Zaaiplaats) Reserves were included into the Moab Khotsong Reserves as at June 2021 following the conclusion of the feasibility study and approval of capital by the board.
Nature of the operationMoab Khotsong is the youngest of the South African deep-level gold mines with three vertical shaft systems maintained to service the mine. The orebody is divided into three distinguishable blocks through major faulting. These geographical areas are referred to as top mine (Great Noligwa), middle mine and lower mine (Zaaiplaats).
GeologyThe Vaal Reef is the primary economic horizon at Moab Khotsong. A secondary economic horizon, the C Reef, contributes less than 5% of total mining volumes. Both reefs are narrow tabular deposits forming part of the Witwatersrand Supergroup and are stratigraphically located near the middle of the Central Rand Group. The Vaal Reef lies approximately 255m below the C Reef.
Moab Khotsong shaft.
12.4Moz
4.2Moz
Mineral Resources (inclusive)
Mineral Reserves
Detailed Mineral Resource and Mineral Reserve estimates are presented in this section.
74 Harmony Gold Mining Company Limited

The geology at Moab Khotsong is structurally complex with large fault-loss areas between the three mining areas (top mine, middle mine and Zaaiplaats). The geological setting is one of crustal extension, dominated by major south-dipping fault systems with north-dipping Zuiping faults wedged between the south-dipping faults. The De Hoek and Buffels East faults are structural bounds for the reef blocks of the middle mine to the north-west and south-east respectively. The northern boundary of Moab Khotsong’s middle mine is the north-dipping Zuiping fault. Moab Khotsong requires a reduced drill spacing pattern of the order of 50m x 50m, which allows for accurate delineation of the structurally bound mineable blocks so that accurate and efficient mine designs can be implemented to ensure optimal extraction and maximum orebody use.
The mineralisation model adopted for the deposit is that of gold precipitation in the conglomerates through the actions of hydrothermal fluids. The fluids precipitated gold and other elements through reactions that took place at elevated temperatures (300-350°C). Migrating liquid and gaseous hydrocarbons precipitated as solid hydrocarbon (carbon), which was then mesophased through metamorphism and structural deformation. Carbon was preferentially precipitated in bedding-parallel fractures that most commonly followed the base of the Vaal Reef package (A-bottom sub-facies), however, gold and uranium mineralisation is also commonly observed within the A-middle and A-top sub-facies of the Vaal Reef. Gold was precipitated very soon after the carbon, giving the critical gold-carbon association that characterises many of the high-grade Vaal Reef localities.
A geological model is employed to delineate variations (either lateral or vertical) in characteristics of the Vaal Reef and C Reef. The current geological model thus sub-divides these two reefs into homogeneous zones based on geological and grade characteristics.
The Vaal Reef consists of a thin basal conglomerate (the C-facies) and a thicker sequence of upper conglomerates (A-facies). These two sedimentary facies are separated by the B-facies, which is a layer of barren orthoquartzite. The A-facies is the primary economic horizon at Moab Khotsong, however, remnants of the C-facies are sporadically preserved below the A-facies. High gold values in the Vaal Reef are often located at the base of this unit and are associated with high uranium values and the presence of carbon. Uranium is an important by-product recovered from the Vaal Reef.
The C Reef is mined on a limited scale in the central part of top mine where a high-grade, north-south trending sedimentary channel, containing two economic horizons, has been exposed. To the east and the west of this channel, the C Reef is poorly developed with limited areas containing economic concentrations of gold and uranium. As with the Vaal Reef, high uranium values are also often associated with high gold values. A carbon seam, with a thickness of 5mm to 20mm, commonly occurs at the base of the conglomerate. To the north of the mine, the C Reef sub-crops against the Gold Estates Conglomerate Formation and, in the extreme south of the mine, the C Reef has been eliminated by a deep Kimberley erosion channel and the Jersey fault.
Mining methods and mine planningThe tabular nature of the orebody, along with its depth and structural complexity, dictates the mining method employed at Moab Khotsong. Mining here is based on a scattered mining method together with an integrated backfill support system that incorporates bracket pillars. The economic reef horizons are exploited between depths of 1 791m and 3 052m below surface.
Zaaiplaats is located between the elevations of 2 866m and 3 471m below surface. Zaaiplaats will be accessed by declines from the
north-eastern end of the Zaaiplaats ground to take advantage of the existing access development in place. Stoping will be conventional scattered breast mining together with an integrated backfill support system, with raises spaced 200m apart.
Zaaiplaats Section line A – A’.
Zaaiplaats Section line B – B’.
Zaaiplaats Section line C – C’.
Zaaiplaats Section line D – D’.
LEGEND
Zaaiplaats Section line.
Mineral Resources and Mineral Reserves Report 2021 75
MINERAL RESOURCES AND MINERAL RESERVES BY OPERATION

SOUTH AFRICA – KLERKSDORP GOLDFIELD MOAB KHOTSONG continued
Mineral rights/legal aspects and tenureHarmony holds the following mining rights, which have been successfully converted, executed and registered as new order mining rights at the Mineral and Petroleum Resources Titles Office.
• NW30/5/1/2/2/15MR valid from 12 September 2007 to 11 September 2037
• NW30/5/1/1/2/16MR valid from 20 August 2008 to 19 August 2038.
These rights cover a combined area of 10991.1296ha. (15MR = 1372.4696ha and 16MR = 9618.660ha).
Mineral processingMoab Khotsong’s mineral processing is done through the Great Noligwa gold plant with design capacity exceeding the maximum planned production volume from the operation. The plant uses the reverse gold leach method which recovers gold and uranium through gold cyanide and acid uranium leaching.
InfrastructureMoab Khotsong and Great Noligwa’s surface and underground infrastructure, as well as the power and water services, are designed to fully meet planned life-of-mine production and service capacity requirements. The operation has a dedicated ore processing plant in close proximity to Moab Khotsong and tailings are pumped to existing tailings storage facilities. Most of the waste rock is separated from reef ore underground and accounted for separately. All waste and reef are delivered to the metallurgical plant.
Mineral Resource estimationThe geostatistical estimation model is created per reef type and per geological zone.
Measured model: Point data and drill hole data, capped to the 99th percentile, uses the ordinary kriging method with experimental semi-variograms, search/estimation parameters, kriging efficiency and slope of regression. Commonly measured models are done on a 10m x 10m and 30m x 30m estimation block size.
Indicated model: Declustered data uses simple macro kriging (SMK) with experimental semi-variograms, search/estimation parameters. Commonly indicated models are done on a 60m x 60m estimation block size.
Inferred model: Declustered data uses SMK with experimental semi-variograms, search/estimation parameters. Commonly indicated models are done on a 120m x 120m estimation block size.
Inferred model beyond estimation confidence: Global arithmetic mean of the declustered data for all the areas to the lease boundary.
Environmental impactHarmony, holder of the tenement, has addressed the requirements of the Department of Mineral Resources and Energy (DMRE). An environmental impact assessment report and environmental management programme report is in place and approved by the DMRE. An environmental performance assessment report was submitted to the DMRE in 2019.
Moab Khotsong operations has applied for its own water use licence, which entails splitting the current approved licence between Harmony, Village Main Reef and AngloGold Ashanti (sold to Harmony/owned by Harmony). Moab Khotsong operations is awaiting the issuing of the licence by the Department of Water and Sanitation.
Moab Khotsong also have the following licences/certification in place:(1) Atmospheric emission licence, AEL/FS/MKO-HGM/14/10/2019
issued to Moab Khotsong operations (Harmony Gold Mining Company) in terms of section 41(1) of the National Environmental Management: Air Quality Act, 2004 (Act No 39 of 2004), in respect of Listed Activity No.4.1: Drying and Calcining and 4.17: Precious and Base Metal Production and Refining.
(2) Waste disposal site licence, NWP/DK2/WM/2018/04/01/02, issued for the management of the Harmony Vaal Reefs waste disposal site.
(3) Moab Khotsong is ISO 14001 certified for its environmental management system. As part of its certification and compliance obligations, Moab Khotsong is committed to continually improve its processes and services to prevent pollution, minimise waste, increase carbon efficiency, use natural resources efficiently and protect the environment.
There are no sensitive areas that may affect the project or any other environmental factors, including interested and affected parties and/or studies that could have a material effect on the likelihood of eventual economic extraction.
Regarding environmental rehabilitation liability, all costs associated with demolition and rehabilitation of the footprint after mining activities cease have been considered in the environmental rehabilitation liabilities. This liability covers all buildings, offices, water tanks, plants, tailings storage facilities, waste rock dumps and properties, among others. The liability is assessed annually and updated to include new infrastructure or demolition and all rates are updated (either escalated or revised) annually. These costs are then escalated to future values and discounted back to present value for inclusion in Harmony’s current liability in the financial statements.
Great Noligwa UG Stope new drills.
76 Harmony Gold Mining Company Limited

2
Base of Vaal ReefBase of Vaal Reef.
1
UltracataclasiteFault rock above Vaal Reef
Ultracataclasite fault rock above Vaal Reef.
MATERIAL RISKS
Material risks that may impact Moab Khotsong’s Mineral Resource and Mineral Reserve statements.
Significant risks• Flooding from neighbouring
mines• Seismicity• Structural complexity.
Remedial action• Pumping• Mining industry occupational
safety and health programme
• Maintaining seismic network system
• Comprehensive risk drilling programme.
COMPETENT PERSON
Ore Reserve manager
Leanne Brenda FreeseBSc Geology, BSc Hons (Geology), GDE, SACNASP, GSSA23 years’ hard rock, deep level and ultra-deep level gold mining experience on the Witwatersrand Supergroup
Geological cross-section through Moab Khotsong (west-north west and east-south east).
Mineral Resources and Mineral Reserves Report 2021 77
MINERAL RESOURCES AND MINERAL RESERVES BY OPERATION

SOUTH AFRICA – KLERKSDORP GOLDFIELD MOAB KHOTSONG continued
Moab Khotsong Mine:Vaal Reef
Measured and Indicated Mineral Resource grade-tonnage curve
Top, Middle and Lower Mines
■ Tonnage ■ Grade
Accumulative tonnes (millions)
40
35
30
25
20
15
10
5
0
Grade above cut-off (g/t)
Cut-off grade (g/t)
0.0 4.02.0 6.0 10.08.0 14.012.0 20.018.016.0
20
18
16
14
12
10
8
6
4
2
0
MOAB KHOTSONGGold – Mineral Resource estimates at 30 June 2021 (inclusive)
Measured Indicated Inferred Total
Tonnes Gold Tonnes Gold Tonnes Gold Tonnes Gold(Mt) (g/t) (000kg) (000oz) (Mt) (g/t) (000kg) (000oz) (Mt) (g/t) (000kg) (000oz) (Mt) (g/t) (000kg) (000oz)
Moab Khotsong 4.2 16.75 71 2 274 14.0 15.95 223 7 155 5.6 16.42 92 2 973 23.8 16.20 386 12 402
Modifying factors
Moab KhotsongMCF
(%)SW(cm)
MW(cm)
PRF (%)
Cut-off (cmg/t)
2020 73 170 219 97 1 8012021 75 177 223 97 1 801
Gold – Mineral Reserve estimates at 30 June 2021
Proved Probable Total
Tonnes Gold Tonnes Gold Tonnes Gold(Mt) (g/t) (000kg) (000oz) (Mt) (g/t) (000kg) (000oz) (Mt) (g/t) (000kg) (000oz)
Moab Khotsong 2.9 7.77 23 727 12.3 8.89 109 3 518 15.2 8.68 132 4 245
Uranium – Mineral Resource estimates at 30 June 2021
Measured Indicated Inferred Total
Tonnes U308 Tonnes U308 Tonnes U308 Tonnes U308
(Mt) (kg/t) (Mkg) (Mlb) (Mt) (kg/t) (Mkg) (Mlb) (Mt) (kg/t) (Mkg) (Mlb) (Mt) (kg/t) (Mkg) (Mlb)
Total – – – – 18.2 0.63 11 25 5.6 0.65 4 8 23.8 0.63 15 33
Modifying factors
Moab KhotsongMCF
(%)SW(cm)
MW(cm)
PRF (%)
2020 69 170 219 972021 65 177 223 97
Uranium – Mineral Reserve estimates at 30 June 2021
Proved Probable Total
Tonnes U308 Tonnes U308 Tonnes U308
(Mt) (kg/t) (Mkg) (Mlb) (Mt) (kg/t) (Mkg) (Mlb) (Mt) (kg/t) (Mkg) (Mlb)
Total – – – – 15.2 0.25 4 8 15.2 0.25 4 8
78 Harmony Gold Mining Company Limited


