Embed Size (px)
Citation preview

1
Mis-expression of BRE gene in the developing chick neural tube affects
neurulation and somitogenesis
Guang Wang1#, Yan Li1#, Xiao-yu Wang1#, Manli Chuai2, John Yeuk-Hon Chan1, Jian
Lei1, Andrea Münsterberg3, Kenneth Ka Ho Lee4* and Xuesong Yang1*
1 Department of Histology and Embryology, School of Medicine, Key Laboratory for
Regenerative Medicine of The Ministry of Education, Jinan University, Guangzhou
510632, China
2Division of Cell and Developmental Biology, University of Dundee, Dundee, DD1
5EH, UK
3School of Biological Sciences, University of East Anglia, Norwich NR4 7TJ, UK
4Key Laboratory for Regenerative Medicine of the Ministry of Education, School of
Biomedical Sciences, Chinese University of Hong Kong, Shatin, Hong Kong
Running title: BRE in neurulation and somitogenesis
#contribute to the work equally
*Corresponding authors: Yang X. E-mail: [email protected] or
Lee KKH. E-mail: [email protected]
http://www.molbiolcell.org/content/suppl/2015/01/06/mbc.E14-06-1144v1.DC1.htmlSupplemental Material can be found at:

2
Abstract
The BRE (Brain and Reproductive Expression) gene is expressed in numerous
adult tissues and especially in the nervous and reproductive systems. However, little is
known about BRE expression in the developing embryo or about its role in embryonic
development. In this study, we used in situ hybridization to reveal the spatio-temporal
expression pattern for BRE in chick embryo during development. To determine the
importance of BRE in neurogenesis, we over-expressed BRE and also silenced BRE
expression specifically in the neural tube. We established that over-expressing BRE in
the neural tube indirectly accelerated Pax7+ somite development and directly increased
HNK-1+ neural crest cell (NCC) migration and TuJ-1+ neurite outgrowth. These altered
morphogenetic processes were associated with changes of cell cycle of NCCs and
neural tube cells. The inverse effect was obtained when BRE expression was silenced
in the neural tube. We also determined that BMP4 and Shh expression in the neural tube
was affected by mis-expression of BRE. This provides a possible mechanism for how
altering BRE expression was able to affect somitogenesis, neurogenesis and NCC
migration. In summary, our results demonstrate that BRE plays an important role in
regulating neurogenesis and indirectly somite differentiation during early chick embryo
development.
Key words: chick embryo, BRE, neural crest cells, somite, neural tube.

3
Introduction
BRE is expressed in a variety of tissues that include the brain, ovary, testis heart,
kidneys and adrenal glands (Li et al., 1995; Miao et al., 2001). The gene is most highly
expressed in the nervous and reproductive systems hence it was named BRE for brain
and reproductive expression. BRE is now considered to be an adaptor protein involved
in stress response and DNA damage repair response by some yet unknown
mechanisms. It is also believed to be a homeostatic or housekeeping protein (Ching et
al., 2001) since the gene is capable of modulating the action of hormones and cytokines
in stress response, cell survival and various pathological conditions such as
inflammation, infection and cancers (Tang et al., 2006). Moreover, BRE has also been
called “TNFRSF1A modulator” because it can directly bind to TNFR-1 and modulate
TNF signaling (Gu et al., 1998). Recently, we reported that BRE plays an important
role in regulating stem cell differentiation by helping to maintain stemness (Chen et al.,
2013). However, the function of BRE during embryo development has not yet been
investigated. Hence, in this study we examined how over-expressing and silencing
BRE expression in the chick embryo neural tube affected development.
The neural tube develops from a bilateral pair of neural plate elevations at the early
embryonic stage and subsequently fuses to form a tubular structure extending
cranial-caudally. This is a complex morphogenetic process involving cell induction,
proliferation and apoptosis. The neural tube will eventually form the spinal cord and
brain at late embryogenesis. During neural tube formation, NCCs are formed at the
crests of neural plate elevations. These NCCs undergo an epithelial to mesenchymal

4
transition (EMT) as the neural tube closes and migrate throughout the embryo, where
they differentiate into a host of different cell types (Huang and Saint-Jeannet, 2004;
Bronner, 2012; Bronner and LeDouarin, 2013). These dynamic processes associated
with NCC emergence, migration and development could be regarded as a continual
process of cellular differentiation i.e. the transition of pre-migratory NCCs in the dorsal
neural tube into migratory NCCs and then their migration beneath the neuroepithelium
or between the somites and neural tube. Like NCCs, somites are also transient
embryonic structures. They are derived from the paraxial mesoderm and take the form
of a paired spherical body localized on each side of neural tube (Christ et al., 1992;
Noden et al., 1999). The somites appear cranially and extend caudally to the tail end of
the chick embryo. They differentiate to form the dermatome, myotome and sclerotome
which in turn become the dermis, skeletal muscles, cartilage and connective tissues
(Christ and Ordahl, 1995; Kageyama et al., 2012; Eckalbar et al., 2013).
It is now well established that the neural tube, somites and notochord closely
interact with each other to regulate normal development. During somitogenesis,
inhibitory and stimulatory signals generated from the surrounding tissues (such as the
notochord, floor plate, neural tube, dorsal ectoderm and lateral mesoderm) regulate
somite morphogenesis and differentiation (Lee et al., 1995; Francetic and Li, 2011).
Signals from the dorsal neural tube affect the development of the somite-derived
dermomyotome and myotome (Munsterberg et al., 1995; Marcelle et al., 1997;
Sela-Donenfeld and Kalcheim, 2002; Serralbo and Marcelle, 2014) and it has been
reported that migrating NCC affect somite differentiation (Rios et al., 2011; Serralbo
5
and Marcelle, 2014). Reciprocally, the medial lip of the dermomyotome inhibits the
transcription of noggin in the neural tube, which relieves repression from BMP
signaling and stimulates the emigration of NCCs. The migration of NCCs to the ventral
and dorsal side of the somites are involved in regulating somitic myogenesis
(Kalcheim, 2011). The notochord and floor plate generate sonic hedgehog (Shh)
protein, an important morphogen, which controls many important morphogenetic
events in the embryo, including somite development. Shh could transiently control
somite formation (Resende et al., 2010), promote somitic chondrogenesis (Murtaugh et
al., 1999) and myogenesis by inducing Myf5 expression directly and MyoD indirectly
(Chiang et al., 1996). Inversely, factors produced in a rostro-caudal pattern by the
somites could confine the movement of spinal motor axons and NCCs to the rostral half
of the somitic sclerotome (Koblar et al., 2000).
In this study, we first defined the spatio-temporal expression pattern of BRE during
early chick embryo development. We then examined the effects of over-expressing and
silencing BRE in the neural tube to elucidate the importance of this gene in NCCs
migration, somite development, neurite outgrowth and cell cycle.
Results
BRE is expressed in the developing neural tube and somites
In situ hybridization was performed on chick embryos to establish where BRE was
spatio-temporally expressed at the primitive streak (HH4) stage to the heart formation
(HH12) stage (Figure 1). In stage HH4 chick embryos, the primitive streak has

6
elongated to attain its overall length. The neural plate, which will give rise to the neural
tube, was also fully formed. BRE was found mainly expressed in the neural plate at this
stage (Figure 1A). In transverse sections, BRE could be seen strongly expressed in the
epiblast cells around the primitive streak (neural plate) (Figs 1A1-4). BRE was also
expressed in the mesoderm layer directly beneath the epiblast, although weaker when
compared with the neural plate. In stage HH8-10 embryos, BRE was expressed mainly
in closing (Figs 1B1-2) and closed (Fig 1C1) rostral neural tube (derived from the
neural plate) - which indicates a continuous expression for BRE in the neural tissues.
Cranial NCCs also expressed BRE (Fig 1C2). This suggested that BRE might be
involved in the migration of NCCs. BRE was also expressed in developing somites,
although relatively weakly (Fig 1C3). In stage HH12 chick embryos, BRE was
expressed in the neural tube (Fig 1D), but not as intense as earlier stage embryos (Fig
1D1). In contrast, BRE expression dramatically increased in head mesenchymal tissues
and trunk somites (Figs 1D1-3), implying that BRE might also be involved in somite
development and differentiation.
Over-expressing BRE in the neural tube accelerates somitogenesis
Above, we have validated that BRE was expressed in the neural tube by in situ
hybridization. Hence, we asked whether neural tube development would be affected
when we mis-expressed BRE. We injected and electroporated constructs containing the
full length BRE (BRE-wt) or small interfering RNA (BRE-siRNA) into the neural tube
to over-express or silence BRE expression, respectively (Figure 1E). Electroporation

7
was performed so that one side of the neural tube was transfected with the construct
while the contralateral half was untransfected and served as the control. In situ
hybridization was performed to confirm BRE expression has been ipsilaterally silenced
using our BRE-siRNA (Figure 1F), or ipsilaterally over-expressed after transfection
with our BRE-wt construct (Figure 1G-G1) in the neural tube. Using the
semi-quantitative RT-PCR and quantitative-PCR, we confirmed that BRE expression
could be significantly up-regulated after BRE-wt transfection (Figure 1H and Figure
S1A, Control-GFP = 0.98±0.04, BRE-wt =1.28±0.09, P < 0.05, N=8) or
down-regulated after BRE-siRNA transfection (Figure 1H, N=3).
Then immunofluorescence staining was performed for Pax7, which labels the
dorsal side of neural tube, somites and dermomyotome derivatives (Figure 2A-G) (Otto
et al., 2006; Galli et al., 2008). We determined that the neural tube unilaterally
co-transfected with control-siRNA plus GFP constructs has no effect on the Pax7+
somites and neural tube (Figure 2A-B2, I and J). Surprisingly, we found Pax7+ somites
were larger on the side of the neural tube that over-expressed BRE than the control-side
(N=8/10, Figure 2C and J). In corresponding transverse sections, the affected somites
have differentiated to form a wide strip of Pax7+ dermomyotome while on the control
side the dermomyotome was smaller and less differentiated (Figure 2D1-D2 and I). At
more caudal levels, where the somites are less mature, the larger somites on the
BRE-over-expressed side of the neural tube were still clearly evident (Figure 2E1-E2
and I; transfection side somite area versus control side somite area:
Control-GFP=0.98±0.09, BRE-wt=1.57±0.15, P<0.001). Next, we silenced BRE

8
expression in one half of the neural tube, this inhibited somite development (N=7/10,
Figure 2F and J). In corresponding transverse sections, we found that the length of the
Pax7+ dermomyotome on the BRE silenced side of the neural tube (left) was smaller
than the contralateral control side (Figure 2G1-G2), suggesting the reduced BRE
expression in the neural tube indirectly interfered with somite development and
differentiation (Figure 2I; transfection side somite area versus control side somite area:
BRE-siRNA=0.81±0.04, P<0.001). Furthermore, the level of Pax7 expression was
confirmed by semi-quantitative RT-PCR and quantitative-PCR analysis after
electroporation with BRE-wt and BRE-siRNA (Figure 2H; Control-GFP = 0.98±0.04,
BRE-wt = 1.39±0.16, P<0.05, N=7, Figure S1B). The quantitative-PCR results showed
that Pax3, another gene involved in somite differentiation, was also increased after
BRE over-expression in the neural tube compared with control samples (Control-GFP
= 0.91±0.14, BRE-wt =2.63±0.63, P<0.05, N=7; Figure S1C).
Neural tube is required for proper somitogenesis and differentiation.
Developmentally, there is a very close relationship between the somites and neural
tube. It has been proposed that inhibitory crosstalk between the paraxial mesoderm and
neural primordium controls the timing of neural crest delamination - to match the
development of a suitable mesodermal substrate for subsequent NCC migration
(Sela-Donenfeld and Kalcheim, 2000). Our above data show somites developed
asymmetrically when the opposing side of the neural tube over-expressed BRE. To
directly confirm that there is crosstalk between the somite and neural tube, we cultured

9
explants composed of somite and presomitic mesoderm (PSM) devoid of the neural
tube or explants composed of somite and PSM plus neural tube (Fig 3) in vitro at 37oC
for 48 hours. Immunofluorescent staining for Pax7, clearly demonstrated that somites
develop and differentiate much faster in the presence of the neural tube than in its
absence (Fig 3B). This confirms that somite development and differentiation are
dependent on signals emitted from ipsilateral neural tube.
BRE modulates NCCs migration and neurite outgrowth
Normally, NCCs delaminate from the dorsal neural tube of the trunk, with one
population of NCCs migrating through the rostral half of adjacent differentiating
somites. This raises the possibility that the larger somites formed on the
BRE-transfected neural tube side might be a consequence of NCCs invasion. To
address this question, we performed immunofluorescence staining against HNK-1 (a
maker for migrating NCCs) following ipsilateral BRE over-expression or silencing on
one-side of the neural tube (Fig 4). In control embryos, we ipsilaterally transfected the
neural tube with a GFP only construct and stained the embryos with HNK-1 antibody to
demonstrate the normal extent of NCCs migration (Figure 4A-D, N=6 embryos). The
results show that our electroporation technique did not physically damage the neural
tube to prevent NCCs migration. When we ipsilaterally over-expressed BRE in the
neural tube, we found that NCCs migration was significantly increased on the BRE
transfected-side in 93% embryos, as compared with the contralateral control side
(Figure 4E-H and M, N=14 embryos). Inversely, NCCs migration was reduced when

10
BRE expression was ipsilaterally silenced in the neural tube (Figure 4I-L and M, N=8
embryos). We then calculated the area occupied by HNK-1+ cells in the
BRE-manipulated neural tube side versus the control side. The ratio for GFP: control
was 0.97±0.03 (N=8 sections; Figure 4N), BRE-wt/control was significantly increased
at 2.01±0.21 (N=8 sections, P<0.01, Fig 4N), and BRE-siRNA/control was
significantly reduced at 0.42±0.04 (N=8 sections, P<0.001, Figure 4N). Together, the
results suggest that over-expression of BRE enhances the migration of NCCs (Figure
4O), which then invade the differentiating somites - making them appear larger than
normal. Besides HNK-1, we examined other neural crest specifier genes (Snail2,
MSX1, FoxD3 and Sox9) by quantitative-PCR analysis (Figure S1D-G). We found that
over-expressing BRE did not affect Snail2 and MSX1 but increased FoxD3 and
reduced Sox9 expression. In situ hybridization confirmed that BRE hardly affect Snail2
expression (N=3 embryos in each group, Figure S2).
Besides NCCs delamination, neurites also grow out from the developing neural
tube. Hence, we want to establish whether altering BRE expression affects this process.
NF antibody was used to label intermediate filaments within neurites, which protrude
from anterior horns of the spinal cord (Figure S3 D1-2). Control-GFP transfection
confirmed that the electroporation did not harm the neural tube and that it was able to
produce neurite outgrowths (Figs, 5A, A1 and D, N=6 embryos). We found that
ipsilaterally over-expressing BRE resulted in an earlier appearance of NF+ neurite
outgrowth from the anterior horn in 92% embryos as compared with the contralateral
control side (Figs, 5B, B1 and E, N=13 embryos). In contrast, silencing BRE

11
expression resulted in a delay in the appearance of NF+ neurites in 86% of the embryos
examined; the phenotype can be easily observed on the rostral side (Figure 5C, C1 and
F, N=7 embryos). We also used the TuJ-1 neuron marker to confirm our observation.
TuJ-1 identifies neuron-specific class III beta-tubulin. The neural tube was unilaterally
transfected with Control-GFP (Fig 5G-G1, K; N=6 embryos), BRE-wt or BRE-siRNA
constructs. The results were consistent with the NF-staining patterns, where TuJ-1+
neurites grew out earlier from the side of the neural tube that over-expressed BRE than
the control side, in 86% of the embryos (Figs, 5H, H1 and K, N=7 embryos). Inversely,
silencing BRE expression delayed the outgrowth of the TuJ-1+ neurites in 88% of the
embryos examined (Figs 5I, I1 and K, N=8 embryos). In addition, we used
semi-quantitative PCR to detect Neurogenin2, a basic helix-loop-helix transcription
factor which functions in neuronal differentiation (Simmons et al., 2001). Neurogenin2
was up-regulated after BRE-wt transfection or down-regulated after BRE-siRNA
transfection (Fig 5L). In sum, altered level of BRE expression can impact on neurite
outgrowth from the neural tube (Fig 5M).
BRE modulates cell cycle progression and survival in the developing neural tube.
We investigated whether there was any association between BRE expression and
cell cycle, which will help explain why NCCs migration and neurite outgrowth were
abnormal. It was established that 68.01±1.60% of BRE over-expressing (GFP+) cells
were BrdU+ while 49.03±1.56% of control GFP+ were BrdU+. This implies that that
BRE over-expression significantly accelerated cells into S phase compared with control

12
cells in the neural tube (P < 0.001, Figure 6A-A2, B-B2 and J). In contrast, there were
significantly fewer BRE silenced (GFP+) cells that were BrdU+ cells (43.06±1.11%)
than the control (P<0.05, Figure 6C-C2 and J). In the BRE over-expressed group, we
also found GFP+ and BrdU+ co-localisation in neural crest cells, as indicated by arrows
(Figure 6B-B2). Additionally, we found that BrdU+ cells in BRE-wt transfected side of
somite were more than contralateral control side in somites (control-GFP=0.96±0.03,
N=6; BRE-wt=1.72±0.06, N=12; ***P < 0.001 Figure S4A-D and G). Conversely, the
BrdU+ cells in BRE-siRNA transfected side of somite were less
(BRE-siRNA=0.70±0.02, N=12; ***P < 0.01; Figure S4A-B and E-G). These results
imply that BRE is also involved in neural tube, NCCs and somite development by
modulating cell cycle.
We next examined the effects of altered BRE expression on Cyclin D1 expression,
since the latter is indispensable for G1/S cell cycle transition. Using in situ
hybridization, we showed that Cyclin D1 expression was little affected in the control
group (Figure 6D, D1 and K, N=6). When BRE was over-expressed, Cyclin D1
expression was correspondingly increased in the BRE-wt transfected side of the neural
tube in 60% of the embryos (Fig 6E-E1 and K; N=5). Inversely, silencing of BRE
expression reduced Cyclin D1 expression, in 100% of the embryos examined (Figure
6F, F1 and K, N=6). Furthermore, the extent of Cyclin D1 expression in the neural tube
was validated by semi-quantitative RT-PCR analysis after electroporation with
BRE-wt or BRE-siRNA (Figure 6L). These data suggest that BRE promotes G1-S
transition. Aberrant cell cycle re-activation in postmitotic neurons could lead to

13
apoptosis (Becker and Bonni, 2005) and Cyclin D1 is essential for regulating neuronal
cell death (Kranenburg et al., 1996). Hence, we examined whether cell survival was
altered following BRE-wt and BRE-siRNA transfection. TUNEL assay revealed that
there was no significant difference in the ratio (transfection side versus control side) of
TUNEL+ between Control-GFP group and BRE-wt group (Figure 6G, H and M,
Control=1.15±0.07 and BRE-wt=1.24±0.09; P>0.05). However, there are more
apoptotic cells present in the BRE silenced side of the neural tube than the control
(Figure 6I and M, BRE-siRNA =1.93±0.15, P < 0.001). We also found that p53 and
BRCA1, which can regulate the cell cycle (Agarwal et al., 1995; Deng, 2006), were
significantly decreased (Fig. S1H) or increased (Fig. S1I) respectively after over
expressed BRE.
BRE regulates gene expression pattern along the dorsoventral neural tube.
BMP4 and Shh are two important genes expressed in the dorsoventral neural tube
and they also play crucial roles in somite differentiation (Murtaugh et al., 1999;
Anderson et al., 2009; Resende et al., 2010; Kalcheim, 2011; Van Ho et al., 2011) and
neuron differentiation in the ventral neural tube (Wilson and Maden, 2005; Ribes and
Briscoe, 2009). Hence, we investigated whether BRE influence on the neural tube,
NCCs and somite development was mediated by BMP4 and Shh signaling. We
performed in situ hybridization to examine BMP4 and Shh expression following BRE
over-expression and silencing in the neural tube. We found that ipsilateral transfection
of the neural tube with our GFP construct (control) did not affect BMP4 expression in

14
the dorsal neural tube or Shh expression in notochord and ventral neural tube. Both
genes were expressed symmetrically (Figure 7A, A1, B and B1, N=3/3). Following
BRE over-expression, we found BMP4 expression was correspondingly up-regulated at
the affected ipsilateral neural tube side (Figure 7C and C1, N=3/4). When BRE
expression was silenced, we determined that BMP4 expression was reduced in the
neural tube (Fig 7E and E1, N=3/5). In contrast, Shh expression in the ventral neural
tube was inhibited following BRE over-expression (Fig 7D and D1, N=4/6), and
enhanced following BRE silencing (Fig 7F and F1, N=4/6). We validated these
observations by semi-quantitative RT-PCR analysis (Figure 7G). The results infer that
BRE promotes BMP4 expression in dorsal neural tube while it inhibits Shh expression
in the ventral neural tube (Figure 7H). BMP and Wnt family members are known to
antagonize Shh expression and play an important role in the patterning of the dorsal
axis (Patten and Placzek, 2002; Ulloa and Marti, 2010). So we also detected whether
the Wnt signaling was affected after the BRE transfection. The results showed that
BRE over expression could up-regulate β-Catenin while BRE silencing could
down-regulate β-Catenin (Figure S5).
Over-expressing BRE in the neural tube activated BMP signaling.
We examined the expression of p-Smad1/5/8 after we over-expressed BRE. In
control embryos, we ipsilaterally transfected the neural tube with a GFP only construct
and stained the embryos with p-Smad1/5/8 antibody to demonstrate that our
electroporation technique did not cause any non-specific changes (N=3/3, Fig 8A-A1).

15
When we ipsilaterally over-expressed BRE in the neural tube, we found that
p-Smad1/5/8 was significantly increased on the BRE transfected-side, as compared
with the contralateral control side (N=4/4, Fig 8B-B1). Next, we used in vitro
experiments and added LDN-193189, which can inhibit the p-Smad1/5/8 (Yu et al.,
2008), to rescue BRE effects by BMP modulation. The neural tubes were
co-transfected with control-GFP+control-siRNA or BRE-wt or
control-GFP+BRE-siRNA and then explanted into culture dishes at 37oC with 5% CO2
for 48 hours. These cultured neural tube explants were checked for extent of cell
migration and HNK-1 expression in migratory cells. The results revealed that BRE
promoted NCCs migration, as the area covered by migrating cells increased when BRE
was up-regulated (1.85±0.28 mm2, N=5, P<0. 01). In contrast, when BRE was
down-regulated, the area covered by migrating cells was significantly reduced
(0.56±0.19 mm2, N=4, P<0.05) when compared with control GFP explants (1.09±0.17
mm2; N=4, Fig 8C-F and K). Also, there were significantly more HNK-1+ cells in the
BRE over-expressing explants (78.88±5.22%; P<0.001), while significantly less
HNK-1+ cells in the BRE silenced explants (31.88±5.05%; P<0.01) as compared with
the control explants (39.75±3.45%, Fig 8G-J1 and L). However, NCC migration of the
BRE-wt transfected tube was significantly inhibited in the LDN-193189 culture group
(Area: 0.81±0.44 mm2, HNK-1+ cells percentage: 44.16±5.16%) compared with the
BRE-wt transfected tube in control culture (P<0.001).

16
Discussion
We have recently reported that BRE is important for maintaining stemness in
human umbilical cord perivascular mesenchymal stem cells. We found that silencing
BRE expression in these cells could dramatically accelerate osteogenic induction and
differentiation (Chen et al., 2013). This observation suggests that BRE may potentially
play a role in development but the function of this gene in embryogenesis has never
been investigated. The early chick embryo is a good model for determining the
multifunctional nature the BRE gene during development. In adult mice, BRE is mainly
expressed in the nervous system and their precursors (Li et al., 1995; Miao et al., 2001)
and consist with this, we found BRE expressed in the neural plate of primitive streak
stage embryos and in the neural tube of older embryos. We also detected BRE
expression in the cranial NCCs. In this context, we decided to manipulate BRE gene
expression in the neural tube of all experiments since the tissue normally express high
levels of BRE during early embryonic development. Interestingly, either
overexpression or knock-down of BRE expression in the neural tube affected somites
as the embryo developed. Our data suggest that this is due to the effect of BRE on
expression of morphogenes involved in dorsoventral neural tube patterning and on
NCCs.
In ovo electroporation, a widely used method in the chick embryo(Itasaki et al.,
1999), allowed us to transfect one-half of the neural tube with BRE constructs while the
contralateral-half was left un-transfected and served as control. Surprisingly, we found
that over-expressing and silencing BRE in the chick neural tube did affect neural tube

17
patterning genes, BMP4 and Shh, and affected the morphology of the flanking somites.
When BRE was over-expressed, we found that the somites opposing the side that
over-expressed BRE were significantly larger than the control side. The inverse effect
was elicited when BRE expression in the neural tube was silenced. Since Pax7 is
expressed in dorsal neural tube and upper-lateral somites (Otto et al., 2006; Galli et al.,
2008), it was employed to mark the process of somite differentiation following
transfection of BRE in neural tube (Figure 2). This suggests that mis-expression of
BRE in the neural tube can indirectly affect somitogenesis. It is now well established
that the neural tube, somites and notochord all interact intimately to regulate each
other’s development (Patten and Placzek, 2002; Ulloa and Marti, 2010).
The NCCs normally delaminate from the region between the dorsal neural tube and
overlying ectoderm and migrate out towards the periphery of the embryo. Therefore,
we investigated whether these cells were directly affected when BRE was
mis-expressed in the neural tube. We used HNK-1 as the marker for migrating NCCs
(Tucker et al., 1984) and found that over-expressing BRE increased HNK-1+ NCCs
emigration. It has been reported that transcription factor FoxD3 induced NCCs
delamination while Sox9 was down-regulated after NCCs initiated their migration
(McKeown et al., 2005). This would be consistent with our results that over-expressing
BRE accelerates NCCs migration. Sela-Donenfeld and Kalcheim 2000
(Sela-Donenfeld and Kalcheim, 2000) have proposed that the timing of NCCs
delamination was regulated by developing somites, and that they serve as substrates for

18
NCCs migration. Since over-expressing BRE in the neural tube causes larger somites to
develop, this may feed-back to further enhance NCCs migration.
The segmented peripheral nervous system in the trunk is generated by the ventral
migration of NCCs that invade the anterior sclerotome and then differentiate into
metameric dorsal root and sympathetic ganglia (Kuo and Erickson, 2010). The ventral
spinal motor axons also project through the somites in a segmental fashion
(Roffers-Agarwal and Gammill, 2009). Hitherto, we explored whether neurite
outgrowth from the ventral neural tube was affected by BRE mis-expression. We used
NF and TuJ-1 as neuronal markers - since NF is an intimidate filament while TuJ-1 is a
neuron-specific class III beta-tubulin. We found that over-expressing BRE enhanced
neurite outgrowth while silencing BRE inhibited outgrowth. It has been reported that
the developing motor and sensory axons are intimately associated with their
surrounding tissues that help to direct and guide axon growth (Tannahill et al., 1997).
Motor axons turn or branch away after encountering the posterior sclerotome cells,
whereas the anterior sclerotome stimulates axon motility (Oakley and Tosney, 1993).
This suggests that neurite outgrowth across somites might also act as a medium
between neural tube signaling and somite development.
For neural tube to develop normally, it relies on a correct balance between cell
proliferation and apoptosis in the neuroepithelium (Wei et al., 2012). Cell proliferation
is an essential process found in every aspect of embryo development - especially during
the early developmental stages (Fu et al., 2006). This is the reason why early embryos
are susceptible to changes in the external microenvironment. We performed BrdU

19
incorporation assays and determined that over-expressing BRE accelerated NCCs and
neuroepithelial cells into S phase while silencing BRE inhibited this process. We have
also examined other cell cycle-related genes (such as cyclin D1 Figure 6D-F and L; p53
and BRCA1, Figure S1H-I) to further establish an association between BRE and cell
cycle. We found that BRE regulated NCC migration and cell cycle by modulating the
transcription of Cyclin D1 which is similar to what has been previously reported: the
cytoplasmic N-cadherin fragment translocates into the nucleus, stimulates cyclin D1
transcription and crest delamination, while enhancing transcription of beta-catenin
(Shoval et al., 2007). It has also been reported that p53 can coordinate NCC growth and
EMT delamination by altering the expression of cell cycle-related genes (Rinon et al.,
2011). We found that over-expressing BRE down-regulated p53 expression. The
BRCA1 protein complex forms from an assembly of proteins,
RAP80/CCDC98/BRCC36/BRE/MERIT40/ BRCA1, at the site of DNA breakage and
plays a pivotal role in DNA repair and maintenance of genomic integrity. Increased
apoptosis is caused by BRCA1 depletion and this is known to involve the p53 pathway
(Pulvers and Huttner, 2009). This suggests that the cell survival effects seen in the
neuroepithelium following BRE transfection might be attributed to the disturbance of
p53 pathway.
The neurites are initially formed as outgrowths from the anterior horns of the spinal
cord; this process may also due to the BRE promote the neurogenesis (Fig. 5L). The
BMP4 also regulate Neurogenin2 Expression (Ota and Ito, 2006). The neurite
outgrowth process is associated with Shh and BMP4 signaling from the notochord and

20
the dorsal neural tube, respectively. Hence, we investigated the expression pattern of
BMP4 and Shh in the neural tube following BRE mis-expression. We found BMP4
expression was significantly increased in the dorsal neural tube when we
over-expressed BRE. This may explain why when we over-expressed BRE in the
neural tube, over-sized somites were produced and also there was increased NCC
migration. In support, we observed the inverse effect when BRE expression was
silenced in the neural tube. Since BMP4 antagonizes Shh, we found that silencing BRE
correspondingly increased Shh expression in the ventral neural tube because BMP4
expression was reduced dorsally by BRE knock-down.
BMPs achieve their inductive effects both locally, via direct cell-cell
communication, and over a long range, via BMP-binding proteins which establish
diffusible BMP gradients (Hegarty et al., 2013). The concentration of active BMP
proteins (which deceases ventrally from the roof plate) is crucial for the dorsal/ventral
patterning (Liu and Niswander, 2005). The transcription factors, Smad1/5/8, are the
pivotal intracellular effectors of the BMP family of proteins (Hegarty et al., 2013). The
results of p-Smad1/5/8 suggested that BMP signaling was activated after BRE
overexpression. In early neurogenesis, BMP-Smad could act upstream of
Wnt-β-Catenin (Muller et al., 2005) and BMP-Smad cooperates with Wnt-β-Catenin
signaling to control the neurogenesis (Muller et al., 2005), with BMP-Smad important
in the specification of neural fates and Wnt-β-Catenin signalling functioning in
appropriate proliferation (Hegarty et al., 2013). These suggested that the BRE affected

21
the neuroepithelial cell proliferation, differentiation, apoptosis and neural crest cells
migration though both BMP-Smad and Wnt-β-Catenin signaling.
In summary, BRE is mainly expressed in neural tube, NCCs, somites and neurites
during early embryo development. We altered BRE expression specifically in the
neural tube, since it is capable of determining the development of NCCs, somites and
neurites. We found that over-expressing BRE could simultaneously enhance BMP4 and
also inhibit Shh expression, dorsoventrally, in the neural tube. This may explain how
BRE was able to directly enhance NCC migration and neurite outgrowth, also
indirectly somite development. We have schematically illustrated the role of BRE
during the early embryogenesis in Figure 9.
Materials and Methods
Chick embryos
Fertilized leghorn eggs were acquired from the Avian Farm of South China
Agriculture University. The eggs were incubated in a humidified incubator (Yiheng
Instruments, Shanghai, China) set at 38oC and 70% humidity until the embryos reached
the desired developmental stage.
Gene transfection of chick embryos
pEGFP-N3 vector was purchased from Clontech and BRE-siRNA was purchased
from Guangzhou Ribobio Co. Ltd. Full length human BRE (BRE-wt) cDNA was
ligated into the pEGFP-N3 vector. The plasmid DNAs were prepared and concentrated
to 2μg/μl using a TIANGEN DP107-02 kit. The following strategy was designed for

22
transfecting the different constructs into different stage of chick embryos according to
experimental requirement. For the in ovo electroporation, plasmid DNA were
microinjected into the lumen of the neural tube of HH10 stage chick embryos. The
electroporation parameters used for archiving maximum transfection efficiency were as
previously described (Yang et al., 2002; Wang et al., 2013). The transfected chick
embryos were then incubated at 38oC with 70% humidity until the embryos reached the
HH13 stage. Some of these embryos were exposed to BrdU (Sigma-Aldrich 10μg/ml)
for 2-hours in Early Chick (EC) culture to determine the cell rate in S phase(Chapman
et al., 2001). The somatic level from 8th to 13th pairs of somites (Rostral to caudal) was
used for analyze.
Immunohistochemistry
Immunohistogical staining was performed on whole-mount chick embryos to
determine Pax7, HNK-1, TuJ-1, Phospho-Smad1/5/8 (p-Smad1/5/8), β-Catenin and
Neurofilament (NF) expression, as previously described (Yang et al., 2008; Yue et al.,
2008). All embryos were fixed in 4% paraformaldehyde at 4oC overnight and then
washed with PBS. The embryos were then blocked with 2% Bovine Serum Albumin
(BSA) + 1% Triton-X + 1% Tween 20 in PBS for 2 hours at room temperature to
prevent unspecific immunoreaction. Following several washes in PBS, the embryos
were incubated with primary monoclonal antibody specific for Pax7 (DSHB 1:100),
HNK-1 (Sigma-Aldrich 1:200), TuJ-1 (Neuromics 1:200), GFP (Novus Biologicals,
1:1000), p-Smad1/5/8 (Cell Signaling 1:100), β-Catenin (Epitomics 1:100) and NF
(Invitrogen 1:200) overnight at 4oC on rocker. After extensive washing, the embryos
23
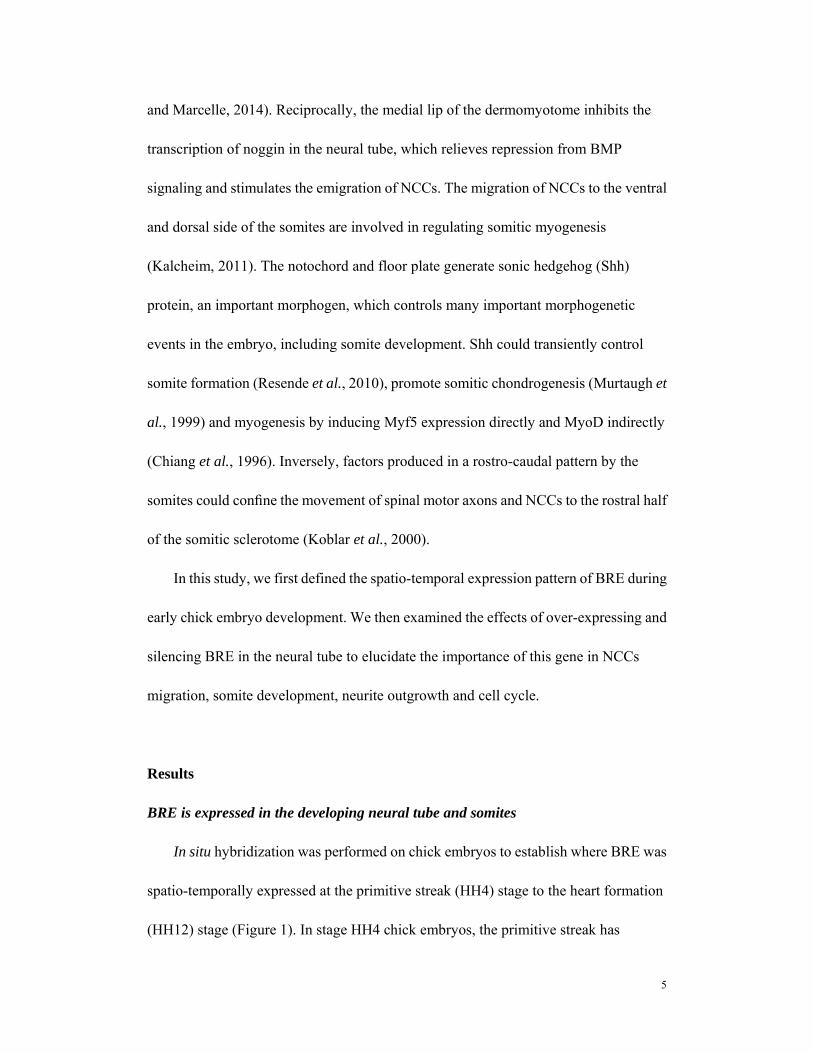
were incubated with anti-mouse or anti-rabbit Alexa Fluor 555 antibody (2µg/ml,
Invitrogen) overnight at 4℃ on rocker to reveal the primary antibody staining. Some
embryos were pre-treated with BrdU (Sigma-Aldrich 10μg/ml) for 2-hours and then
immunohistological staining with BrdU antibody (BD Biosciences, 1:200). All
embryos were counterstained with DAPI (5μg/ml, Invitrogen) for 1 hour at room
temperature. Subsequently the embryos were sectioned on a cryostat microtome (Leica
CM1900). The sections were mounted onto glass slides using Mowiol 4-88 mounting
solution (Sigma-Aldrich-Aldrich) and sealed with coverslips.
In situ hybridization
BRE antisense probes were synthesized from a 1.2 kb BRE fragment inserted into a
pGEMT vector. The BRE-pGEMT plasmid was cut with Xho1 and linearized to
generate digoxigen-labelled antisense BRE probes using T6 polymerase (Boeh-ringer
Mannheim Biochemica). Antisense probes that are specific for Cylin D1 (Shoval et al.,
2007), FGF8 (Yang et al., 2002), BMP4 (Somi et al., 2004) , Snail2 (Nieto et al., 1994)
and Shh (Diez del Corral et al., 2003) were also synthesized as previously described.
Whole-mount in situ hybridization of chick embryos was performed according to a
standard in situ hybridization protocol (Henrique et al., 1995). Briefly the embryos
were fixed with 4% PFA overnight at 4oC, dehydrated in a graded series of methanol
and stored at -20oC (overnight). The following day, the embryos were hybridized with
BRE digoxigenin labeled antisense probe overnight at 65oC. Following hybridization,
the bound RNA probe was visualized by incubation with alkaline
phosphatase-conjugated anti-digoxigenin antibodies and the color was developed in

24
BCIP & NBT (Roche). The whole-mount stained embryos were photographed and
then prepared for cryo-sectioning to a thickness of 15-20μm on a cryostat microtome
(Leica CM1900).
Analysis of programmed cell death
The extent of cell death in embryonic tissues was established by TUNEL analysis,
using an In Situ Cell Death Detection Kit (Roche). The staining was performed
according to the protocol provided by the manufacturer, which we adapted for
whole-amount chick embryo labeling. TUNEL-positive cells were counted using an
Image Analysis Software (Olympus, Japan).
siRNA-interference experiments
The BRE-siRNA corresponding to TCTGGCTGCACATCATTGA was custom
design to specifically target BRE mRNA, Ctrl-siRNA sequence was
AAGCCUCGAAAUAUCUCCU (Tang et al., 2006; Chen et al., 2008). Both of them
were purchased from Guangzhou Ribobio Company. The siRNA was diluted to a
concentration of 1 mM in 20 mM KCl, 6 mM Hepes (pH 7.5) and 200 mM MgCl2. To
track the siRNA transfection, we co-transfected BRE-siRNA or Ctrl-siRNA along with
a pEGFP-N3 marker (1:1) in half side neural tube of HH10 chick embryos. The
electroporation was performed using the same condition as described
mentioned-above.
RNA isolation, semi-quantitative RT-PCR and Quantitative-PCR
Transfected chick embryos (Control-GFP, BRE-wt and BRE-siRNA, N=10
embryos for each group) were incubated at 38oC with 70% humidity until the embryos

25
reached the HH13 stage. Total RNA was then isolated from the embryonic neural tube
and somites using Trizol (Invitrogen, USA) according to the manufacturer's
instructions. First-strand cDNA was synthesized at a final volume of 25µl using a
SuperScript Ⅲ First-Strand kit (Invitrogen, USA). Following reverse transcription,
RT-PCR amplification of the cDNA was performed using specific primers for chick
BRE (5’-GCAGCCTTCCTGAGTCACTT-3’ and
5’-TGCTCTCTTGGCCATTTCGT-3’), Neurogenin2
(5’-TCTCCGTGATTTACGAGCGG-3’ and 5’-CGCTGTAATGTCCCGTGTCT-3’),
β-Catenin (5’-AGTTCTGGGAGCACAGCAAG-3’ and
5’-TGAACCATAACCGCAGCCTT-3’), Pax7
(5’-GCTTACTGAAGAGGTCCGACTGTG-3’ and 5’-
ACAAGTTGATGCGAGGTGGAAGG-3’), cyclin D1 (5'-TCGGTGTCCTACTT
CAAGTG-3' and 5'-GGAGTTGTCGGTGTAAATGC-3'), chick BMP4
(5'-AGGAGTGGCAGAAGTAG-3' and 5’- CGGCTAATCCTGACGTGTTT-3’) and
chick GAPDH (5'-GTCAACGGATTTGGCCGTAT-3' and 5'-AATGCCAAAGT
TGTCATGGATG-3') as previously described (Huber et al., 2008; Endo et al., 2012;
Scott-Drechsel et al., 2013). PCR was performed in a Bio-Rad S1000TM Thermal cycler
(Bio-Rad, USA). cDNAs were amplified for 30 cycles. One round of amplification was
performed at 98°C for 10 sec, at 60°C for15 sec and at 72°C for 30 sec (TaKaRa,
Japan). The PCR products (20 µl) were resolved on 1% agarose gels (Biowest, Spain)
in 1× TAE buffer (0.04 M Trisacetate and 0.001 M EDTA), and GeneGreen Nucleic
Acid Dye (TIANGEN, China). The reaction products were visualized using a

26
transilluminator (SYNGENE, UK) and a computer-assisted gel documentation system
(SYNGENE). Quantitative-PCR was also performed using SYBR Premix Ex Tag
(Takara) using a 7900HT Fast Real-Time PCR system (Applied Biosystems). The sets
of primers used for Quantitative-PCR are provided in the supplementary information.
Each of these experiments was replicated at least three times.
Primary explant culture
The neural tubes of chick embryos (at stage HH10) alone or with somites attached
explants, or neural tubes co-transfected with BRE-siRNA or Ctrl-siRNA along with a
pEGFP-N3 , or BRE-wt-GFP excised from the embryos at somite level 1-10 and then
incubated in DMEM-F12 culture medium (GIBCO) or 200nM LDN-193189
(Sigma-Aldrich, SML0559) DMEM-F12 inside an incubator (Galaxy S, RS Biotech) at
37 oC and 5% CO2 for 48 hours. The cultured explants were used for photography and
immunofluorescent staining.
Photography
After immunohistological staining, the whole-mount embryos were photographed
using a fluorescence stereomicroscope (Olympus MVX10) and imaging software
(Image-Pro Plus 7.0). Sections of the stained embryos were photographed using an
epi-fluorescent microscope (Olympus IX51, Leica DM 4000B) at 200x or 400x
magnification using the Olympus software package (Leica CW4000 FISH).
Image acquisition and analysis
For the quantification in the BrdU experiments, we manually counted BrdU+ GFP+
cells versus BrdU+ cells of the neural tube in tansfected side and as described before

27
(Cayuso et al., 2006); the HNK-1+ area was quantified with Image-Pro Plus 6.0; for the
primary explant culture experiments, cell migration was quantified by measuring the
HNK-1+ staining with Image-Pro Plus 6.0; HNK-1+ cells were manually counted at the
DAPI and HNK-1 merged images. The data were presented as mean ± SE or mean ±
SD. Statistical analysis for the experimental data was performed using a SPSS 13.0
statistical package program for windows. Statistical significance was established using
one-way analysis of variance (ANOVA). P<0.05 was considered to be significantly
different.
Acknowledgements
We would like to thank Zheng-lai Ma, Jiang-chao Li, En-ni Chen, Chang Liang
and Shi-yao Zhang for the technical help; Prof. Maurice van den Hoff for the BMP4
plasmid; Prof. Chaya Kalcheim for the Cyclin D1 plasmid; Prof. Qing Chang for
invaluable input on the design of the experiments. This study was supported by NSFC
grants (31401230; 31071054; 30971493) to X Yang and G Wang. Also part funded by
GRF grant (469313) to KKH Lee and the Fundamental Research Funds for the Central
Universities (21614319) to G Wang.
Author Contributions
G.W., Y.L., X.W. and J.L. performed the experiments and collected the data; M.C.,
J.C. and A. M. analyzed the data. G.W., K.L., and X. Y. designed the study, analyzed
the data and wrote manuscript.

28
Competing Financial Interest
The authors have declared that no competing interests exist.
References
Agarwal, M.L., Agarwal, A., Taylor, W.R., and Stark, G.R. (1995). p53 controls both
the G2/M and the G1 cell cycle checkpoints and mediates reversible growth arrest
in human fibroblasts. Proceedings of the National Academy of Sciences of the
United States of America 92, 8493-8497.
Anderson, C., Thorsteinsdottir, S., and Borycki, A.G. (2009). Sonic
hedgehog-dependent synthesis of laminin alpha1 controls basement membrane
assembly in the myotome. Development (Cambridge, England) 136, 3495-3504.
Becker, E.B., and Bonni, A. (2005). Beyond proliferation--cell cycle control of
neuronal survival and differentiation in the developing mammalian brain.
Seminars in cell & developmental biology 16, 439-448.
Bronner, M.E. (2012). A career at the interface of cell and developmental biology: a
view from the crest. Molecular biology of the cell 23, 4151-4153.
Bronner, M.E., and LeDouarin, N.M. (2013). Development and evolution of the neural
crest: an overview. Developmental biology 366, 2-9.
Cayuso, J., Ulloa, F., Cox, B., Briscoe, J., and Marti, E. (2006). The Sonic hedgehog
pathway independently controls the patterning, proliferation and survival of

29
neuroepithelial cells by regulating Gli activity. Development (Cambridge,
England) 133, 517-528.
Chapman, S.C., Collignon, J., Schoenwolf, G.C., and Lumsden, A. (2001). Improved
method for chick whole-embryo culture using a filter paper carrier. Dev Dyn 220,
284-289.
Chen, E., Tang, M.K., Yao, Y., Yau, W.W., Lo, L.M., Yang, X., Chui, Y.L., Chan, J.,
and Lee, K.K. (2013). Silencing BRE expression in human umbilical cord
perivascular (HUCPV) progenitor cells accelerates osteogenic and chondrogenic
differentiation. PloS one 8, e67896.
Chen, H.B., Pan, K., Tang, M.K., Chui, Y.L., Chen, L., Su, Z.J., Shen, Z.Y., Li, E.M.,
Xie, W., and Lee, K.K. (2008). Comparative proteomic analysis reveals
differentially expressed proteins regulated by a potential tumor promoter, BRE, in
human esophageal carcinoma cells. Biochemistry and cell biology = Biochimie et
biologie cellulaire 86, 302-311.
Chiang, C., Litingtung, Y., Lee, E., Young, K.E., Corden, J.L., Westphal, H., and
Beachy, P.A. (1996). Cyclopia and defective axial patterning in mice lacking
Sonic hedgehog gene function. Nature 383, 407-413.
Ching, A.K., Li, P.S., Li, Q., Chan, B.C., Chan, J.Y., Lim, P.L., Pang, J.C., and Chui,
Y.L. (2001). Expression of human BRE in multiple isoforms. Biochemical and
biophysical research communications 288, 535-545.
Christ, B., Brand-Saberi, B., Grim, M., and Wilting, J. (1992). Local signalling in
dermomyotomal cell type specification. Anatomy and embryology 186, 505-510.

30
Christ, B., and Ordahl, C.P. (1995). Early stages of chick somite development.
Anatomy and embryology 191, 381-396.
Deng, C.X. (2006). BRCA1: cell cycle checkpoint, genetic instability, DNA damage
response and cancer evolution. Nucleic acids research 34, 1416-1426.
Diez del Corral, R., Olivera-Martinez, I., Goriely, A., Gale, E., Maden, M., and Storey,
K. (2003). Opposing FGF and retinoid pathways control ventral neural pattern,
neuronal differentiation, and segmentation during body axis extension. Neuron 40,
65-79.
Eckalbar, W.L., Fisher, R.E., Rawls, A., and Kusumi, K. (2013). Scoliosis and
segmentation defects of the vertebrae. Wiley interdisciplinary reviews 1, 401-423.
Endo, Y., Ishiwata-Endo, H., and Yamada, K.M. (2012). Extracellular matrix protein
anosmin promotes neural crest formation and regulates FGF, BMP, and WNT
activities. Developmental cell 23, 305-316.
Francetic, T., and Li, Q. (2011). Skeletal myogenesis and Myf5 activation.
Transcription 2, 109-114.
Fu, J., Tay, S.S., Ling, E.A., and Dheen, S.T. (2006). High glucose alters the expression
of genes involved in proliferation and cell-fate specification of embryonic neural
stem cells. Diabetologia 49, 1027-1038.
Galli, L.M., Knight, S.R., Barnes, T.L., Doak, A.K., Kadzik, R.S., and Burrus, L.W.
(2008). Identification and characterization of subpopulations of Pax3 and Pax7
expressing cells in developing chick somites and limb buds. Dev Dyn 237,
1862-1874.

31
Gu, C., Castellino, A., Chan, J.Y., and Chao, M.V. (1998). BRE: a modulator of
TNF-alpha action. Faseb J 12, 1101-1108.
Hegarty, S.V., O'Keeffe, G.W., and Sullivan, A.M. (2013). BMP-Smad 1/5/8 signalling
in the development of the nervous system. Progress in neurobiology 109, 28-41.
Henrique, D., Adam, J., Myat, A., Chitnis, A., Lewis, J., and Ish-Horowicz, D. (1995).
Expression of a Delta homologue in prospective neurons in the chick. Nature 375,
787-790.
Huang, X., and Saint-Jeannet, J.P. (2004). Induction of the neural crest and the
opportunities of life on the edge. Developmental biology 275, 1-11.
Huber, K., Franke, A., Bruhl, B., Krispin, S., Ernsberger, U., Schober, A., von Bohlen
und Halbach, O., Rohrer, H., Kalcheim, C., and Unsicker, K. (2008). Persistent
expression of BMP-4 in embryonic chick adrenal cortical cells and its role in
chromaffin cell development. Neural development 3, 28.
Itasaki, N., Bel-Vialar, S., and Krumlauf, R. (1999). 'Shocking' developments in chick
embryology: electroporation and in ovo gene expression. Nature cell biology 1,
E203-207.
Kageyama, R., Niwa, Y., Isomura, A., Gonzalez, A., and Harima, Y. (2012).
Oscillatory gene expression and somitogenesis. Wiley interdisciplinary reviews 1,
629-641.
Kalcheim, C. (2011). Regulation of trunk myogenesis by the neural crest: a new facet of
neural crest-somite interactions. Developmental cell 21, 187-188.

32
Koblar, S.A., Krull, C.E., Pasquale, E.B., McLennan, R., Peale, F.D., Cerretti, D.P.,
and Bothwell, M. (2000). Spinal motor axons and neural crest cells use different
molecular guides for segmental migration through the rostral half-somite. Journal
of neurobiology 42, 437-447.
Kranenburg, O., van der Eb, A.J., and Zantema, A. (1996). Cyclin D1 is an essential
mediator of apoptotic neuronal cell death. The EMBO journal 15, 46-54.
Kuo, B.R., and Erickson, C.A. (2010). Regional differences in neural crest
morphogenesis. Cell adhesion & migration 4, 567-585.
Lee, K.K., Webb, S.E., Cai, D.Q., Sze, L.Y., Lam, K.H., Li, Z., and Paulin, D. (1995).
Desmin transgene expression in mouse somites requires the presence of the neural
tube. The International journal of developmental biology 39, 469-475.
Li, L., Yoo, H., Becker, F.F., Ali-Osman, F., and Chan, J.Y. (1995). Identification of a
brain- and reproductive-organs-specific gene responsive to DNA damage and
retinoic acid. Biochemical and biophysical research communications 206,
764-774.
Liu, A., and Niswander, L.A. (2005). Bone morphogenetic protein signalling and
vertebrate nervous system development. Nature reviews 6, 945-954.
Marcelle, C., Stark, M.R., and Bronner-Fraser, M. (1997). Coordinate actions of BMPs,
Wnts, Shh and noggin mediate patterning of the dorsal somite. Development
(Cambridge, England) 124, 3955-3963.

33
McKeown, S.J., Lee, V.M., Bronner-Fraser, M., Newgreen, D.F., and Farlie, P.G.
(2005). Sox10 overexpression induces neural crest-like cells from all dorsoventral
levels of the neural tube but inhibits differentiation. Dev Dyn 233, 430-444.
Miao, J., Panesar, N.S., Chan, K.T., Lai, F.M., Xia, N., Wang, Y., Johnson, P.J., and
Chan, J.Y. (2001). Differential expression of a stress-modulating gene, BRE, in
the adrenal gland, in adrenal neoplasia, and in abnormal adrenal tissues. J
Histochem Cytochem 49, 491-500.
Muller, T., Anlag, K., Wildner, H., Britsch, S., Treier, M., and Birchmeier, C. (2005).
The bHLH factor Olig3 coordinates the specification of dorsal neurons in the
spinal cord. Genes & development 19, 733-743.
Munsterberg, A.E., Kitajewski, J., Bumcrot, D.A., McMahon, A.P., and Lassar, A.B.
(1995). Combinatorial signaling by Sonic hedgehog and Wnt family members
induces myogenic bHLH gene expression in the somite. Genes & development 9,
2911-2922.
Murtaugh, L.C., Chyung, J.H., and Lassar, A.B. (1999). Sonic hedgehog promotes
somitic chondrogenesis by altering the cellular response to BMP signaling. Genes
& development 13, 225-237.
Nieto, M.A., Sargent, M.G., Wilkinson, D.G., and Cooke, J. (1994). Control of cell
behavior during vertebrate development by Slug, a zinc finger gene. Science (New
York, N.Y 264, 835-839.

34
Noden, D.M., Marcucio, R., Borycki, A.G., and Emerson, C.P., Jr. (1999).
Differentiation of avian craniofacial muscles: I. Patterns of early regulatory gene
expression and myosin heavy chain synthesis. Dev Dyn 216, 96-112.
Oakley, R.A., and Tosney, K.W. (1993). Contact-mediated mechanisms of motor axon
segmentation. J Neurosci 13, 3773-3792.
Ota, M., and Ito, K. (2006). BMP and FGF-2 regulate neurogenin-2 expression and the
differentiation of sensory neurons and glia. Dev Dyn 235, 646-655.
Otto, A., Schmidt, C., and Patel, K. (2006). Pax3 and Pax7 expression and regulation in
the avian embryo. Anatomy and embryology 211, 293-310.
Patten, I., and Placzek, M. (2002). Opponent activities of Shh and BMP signaling
during floor plate induction in vivo. Curr Biol 12, 47-52.
Pulvers, J.N., and Huttner, W.B. (2009). Brca1 is required for embryonic development
of the mouse cerebral cortex to normal size by preventing apoptosis of early neural
progenitors. Development (Cambridge, England) 136, 1859-1868.
Resende, T.P., Ferreira, M., Teillet, M.A., Tavares, A.T., Andrade, R.P., and
Palmeirim, I. (2010). Sonic hedgehog in temporal control of somite formation.
Proceedings of the National Academy of Sciences of the United States of America
107, 12907-12912.
Ribes, V., and Briscoe, J. (2009). Establishing and interpreting graded Sonic Hedgehog
signaling during vertebrate neural tube patterning: the role of negative feedback.
Cold Spring Harbor perspectives in biology 1, a002014.

35
Rinon, A., Molchadsky, A., Nathan, E., Yovel, G., Rotter, V., Sarig, R., and Tzahor, E.
(2011). p53 coordinates cranial neural crest cell growth and
epithelial-mesenchymal transition/delamination processes. Development
(Cambridge, England) 138, 1827-1838.
Rios, A.C., Serralbo, O., Salgado, D., and Marcelle, C. (2011). Neural crest regulates
myogenesis through the transient activation of NOTCH. Nature 473, 532-535.
Roffers-Agarwal, J., and Gammill, L.S. (2009). Neuropilin receptors guide distinct
phases of sensory and motor neuronal segmentation. Development (Cambridge,
England) 136, 1879-1888.
Scott-Drechsel, D.E., Rugonyi, S., Marks, D.L., Thornburg, K.L., and Hinds, M.T.
(2013). Hyperglycemia slows embryonic growth and suppresses cell cycle via
cyclin D1 and p21. Diabetes 62, 234-242.
Sela-Donenfeld, D., and Kalcheim, C. (2000). Inhibition of noggin expression in the
dorsal neural tube by somitogenesis: a mechanism for coordinating the timing of
neural crest emigration. Development (Cambridge, England) 127, 4845-4854.
Sela-Donenfeld, D., and Kalcheim, C. (2002). Localized BMP4-noggin interactions
generate the dynamic patterning of noggin expression in somites. Developmental
biology 246, 311-328.
Serralbo, O., and Marcelle, C. (2014). Migrating cells mediate long-range WNT
signaling. Development (Cambridge, England) 141, 2057-2063.

36
Shoval, I., Ludwig, A., and Kalcheim, C. (2007). Antagonistic roles of full-length
N-cadherin and its soluble BMP cleavage product in neural crest delamination.
Development (Cambridge, England) 134, 491-501.
Simmons, A.D., Horton, S., Abney, A.L., and Johnson, J.E. (2001). Neurogenin2
expression in ventral and dorsal spinal neural tube progenitor cells is regulated by
distinct enhancers. Developmental biology 229, 327-339.
Somi, S., Buffing, A.A., Moorman, A.F., and Van Den Hoff, M.J. (2004). Dynamic
patterns of expression of BMP isoforms 2, 4, 5, 6, and 7 during chicken heart
development. The anatomical record 279, 636-651.
Tang, M.K., Wang, C.M., Shan, S.W., Chui, Y.L., Ching, A.K., Chow, P.H.,
Grotewold, L., Chan, J.Y., and Lee, K.K. (2006). Comparative proteomic analysis
reveals a function of the novel death receptor-associated protein BRE in the
regulation of prohibitin and p53 expression and proliferation. Proteomics 6,
2376-2385.
Tannahill, D., Cook, G.M., and Keynes, R.J. (1997). Axon guidance and somites. Cell
and tissue research 290, 275-283.
Tucker, G.C., Aoyama, H., Lipinski, M., Tursz, T., and Thiery, J.P. (1984). Identical
reactivity of monoclonal antibodies HNK-1 and NC-1: conservation in vertebrates
on cells derived from the neural primordium and on some leukocytes. Cell
differentiation 14, 223-230.

37
Ulloa, F., and Marti, E. (2010). Wnt won the war: antagonistic role of Wnt over Shh
controls dorso-ventral patterning of the vertebrate neural tube. Dev Dyn 239,
69-76.
Van Ho, A.T., Hayashi, S., Brohl, D., Aurade, F., Rattenbach, R., and Relaix, F. (2011).
Neural crest cell lineage restricts skeletal muscle progenitor cell differentiation
through Neuregulin1-ErbB3 signaling. Developmental cell 21, 273-287.
Wang, G., Li, Y., Wang, X.Y., Han, Z., Chuai, M., Wang, L.J., Ho Lee, K.K., Geng,
J.G., and Yang, X. (2013). Slit/Robo1 signaling regulates neural tube
development by balancing neuroepithelial cell proliferation and differentiation.
Experimental cell research 319, 1083-1093.
Wei, X., Li, H., Miao, J., Zhou, F., Liu, B., Wu, D., Li, S., Wang, L., Fan, Y., Wang,
W., and Yuan, Z. (2012). Disturbed apoptosis and cell proliferation in developing
neuroepithelium of lumbo-sacral neural tubes in retinoic acid-induced spina bifida
aperta in rat. Int J Dev Neurosci.
Wilson, L., and Maden, M. (2005). The mechanisms of dorsoventral patterning in the
vertebrate neural tube. Developmental biology 282, 1-13.
Yang, X., Chrisman, H., and Weijer, C.J. (2008). PDGF signalling controls the
migration of mesoderm cells during chick gastrulation by regulating N-cadherin
expression. Development (Cambridge, England) 135, 3521-3530.
Yang, X., Dormann, D., Munsterberg, A.E., and Weijer, C.J. (2002). Cell movement
patterns during gastrulation in the chick are controlled by positive and negative
chemotaxis mediated by FGF4 and FGF8. Developmental cell 3, 425-437.

38
Yu, P.B., Deng, D.Y., Lai, C.S., Hong, C.C., Cuny, G.D., Bouxsein, M.L., Hong, D.W.,
McManus, P.M., Katagiri, T., Sachidanandan, C., Kamiya, N., Fukuda, T.,
Mishina, Y., Peterson, R.T., and Bloch, K.D. (2008). BMP type I receptor
inhibition reduces heterotopic [corrected] ossification. Nature medicine 14,
1363-1369.
Yue, Q., Wagstaff, L., Yang, X., Weijer, C., and Munsterberg, A. (2008).
Wnt3a-mediated chemorepulsion controls movement patterns of cardiac
progenitors and requires RhoA function. Development (Cambridge, England)
135, 1029-1037.

39
Fig 1. Expression pattern of BRE in the early chick embryo. Whole-mount in situ
hybridization for BRE expression was performed on stage HH4, 8, 10 and 12
embryos. (A) In HH4 chick embryos, BRE was expressed mainly in the neural
plate. The embryo was transversely sectioned along rostral-caudal axis (A1-4) as
indicated by the dotted white lines. (A1-4) BRE was mainly expressed in the
ectoderm (EC) of the neural plate region and weakly in the lateral mesoderm (M)
along embryonic along rostral-caudal axis. (B) In HH8 chick embryos, BRE was
mainly expressed in the head folds, closing neural folds and regressing primitive
streak. (B1-3) Transverse sections of B, showing BRE expressed in the closing
neural folds and the neuroepithelial site adjacent to the underlying mesoderm
layer. (C) BRE was mainly expressed in the forebrain, midbrain, hind-brain and
trunk neural tube of HH10 embryos. (C1-3) Transverse sections of C showing

40
BRE was expressed in the cranial neural tube and in NCCs located at the heart tube
and trunk neural tube levels. (D) In HH12 chick embryo, BRE was dispersedly
expressed in the neural tube and more intensely expressed in mesodermal
structures, such as somites. (D1-3) Transverse sections of D showing BRE was
mainly expressed in somites, brain and trunk neural tube (although the latter two
tissues more weakly compared with younger embryos). (E) Schematic drawing
depicting how our gene constructs were transfected into the neural tube of chick
embryos in ovo. (F) In situ hybridization showing that the endogenous BRE was
silenced following BRE-siRNA transfection (left). (G-G1) In situ hybridization
showing that BRE expression (white arrows) was increased following unilateral
co-transfection of the neural tube with BRE-wt and GFP (left). (H)
Semi-quantitative RT-PCR analysis confirmed BRE expression was increased
after transfection with BRE-wt construct and decreased after transfection with
BRE-siRNA (N=3). Scale bars = 500μm in A-D; 20μm in A1-A4; 50μm in B1-B3,
C1-C2, D2-D3; 25μm in C3; 100μm in D1; 50μm in F-G1. Abbreviation: PS,
primitive streak; EC, ectoderm; M, endoderm; EN, endoderm; NT, neural tube;
So, somite.
41
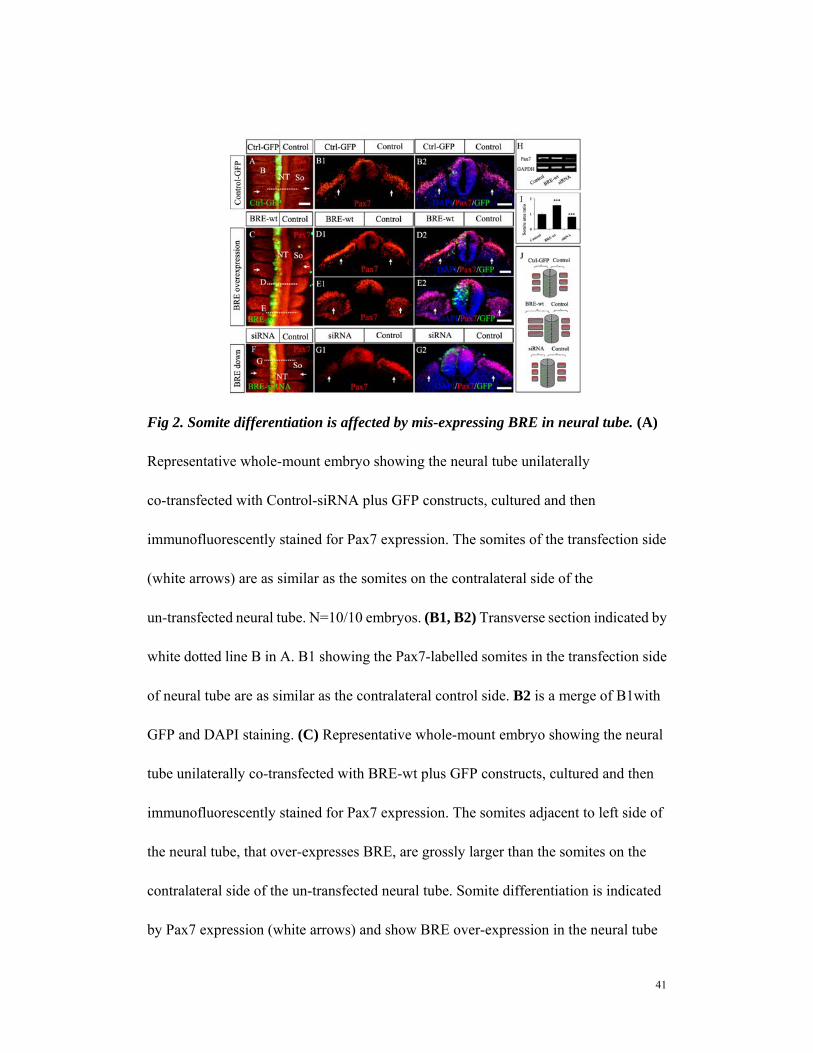
Fig 2. Somite differentiation is affected by mis-expressing BRE in neural tube. (A)
Representative whole-mount embryo showing the neural tube unilaterally
co-transfected with Control-siRNA plus GFP constructs, cultured and then
immunofluorescently stained for Pax7 expression. The somites of the transfection side
(white arrows) are as similar as the somites on the contralateral side of the
un-transfected neural tube. N=10/10 embryos. (B1, B2) Transverse section indicated by
white dotted line B in A. B1 showing the Pax7-labelled somites in the transfection side
of neural tube are as similar as the contralateral control side. B2 is a merge of B1with
GFP and DAPI staining. (C) Representative whole-mount embryo showing the neural
tube unilaterally co-transfected with BRE-wt plus GFP constructs, cultured and then
immunofluorescently stained for Pax7 expression. The somites adjacent to left side of
the neural tube, that over-expresses BRE, are grossly larger than the somites on the
contralateral side of the un-transfected neural tube. Somite differentiation is indicated
by Pax7 expression (white arrows) and show BRE over-expression in the neural tube
42
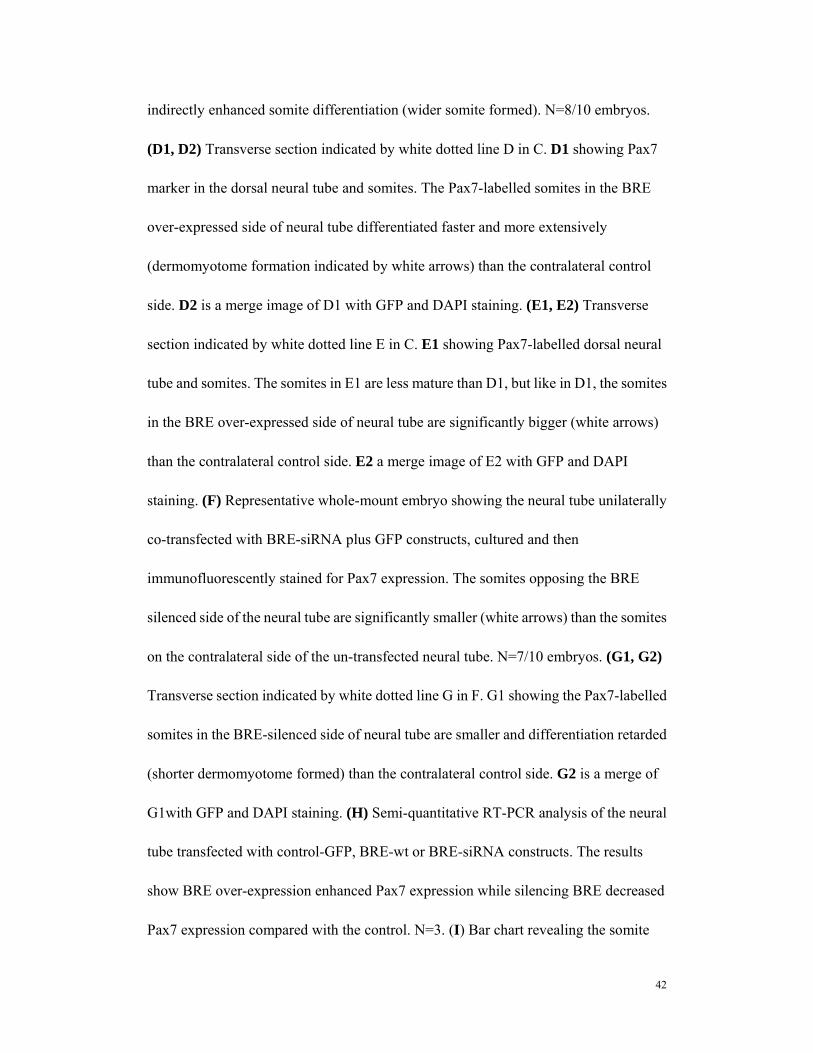
indirectly enhanced somite differentiation (wider somite formed). N=8/10 embryos.
(D1, D2) Transverse section indicated by white dotted line D in C. D1 showing Pax7
marker in the dorsal neural tube and somites. The Pax7-labelled somites in the BRE
over-expressed side of neural tube differentiated faster and more extensively
(dermomyotome formation indicated by white arrows) than the contralateral control
side. D2 is a merge image of D1 with GFP and DAPI staining. (E1, E2) Transverse
section indicated by white dotted line E in C. E1 showing Pax7-labelled dorsal neural
tube and somites. The somites in E1 are less mature than D1, but like in D1, the somites
in the BRE over-expressed side of neural tube are significantly bigger (white arrows)
than the contralateral control side. E2 a merge image of E2 with GFP and DAPI
staining. (F) Representative whole-mount embryo showing the neural tube unilaterally
co-transfected with BRE-siRNA plus GFP constructs, cultured and then
immunofluorescently stained for Pax7 expression. The somites opposing the BRE
silenced side of the neural tube are significantly smaller (white arrows) than the somites
on the contralateral side of the un-transfected neural tube. N=7/10 embryos. (G1, G2)
Transverse section indicated by white dotted line G in F. G1 showing the Pax7-labelled
somites in the BRE-silenced side of neural tube are smaller and differentiation retarded
(shorter dermomyotome formed) than the contralateral control side. G2 is a merge of
G1with GFP and DAPI staining. (H) Semi-quantitative RT-PCR analysis of the neural
tube transfected with control-GFP, BRE-wt or BRE-siRNA constructs. The results
show BRE over-expression enhanced Pax7 expression while silencing BRE decreased
Pax7 expression compared with the control. N=3. (I) Bar chart revealing the somite

43
area ratio (transfection side versus control side from the sections) in the control,
BRE-wt and BRE-siRNA transfected embryos (N= 10). (J) Schematic illustrations
showing the neural tube unilaterally co-transfected with Control-siRNA plus GFP
constructs has no effect on the differentiation of somites. However, BRE
over-expression in the neural tube indirectly accelerates somite differentiation (middle
panel) while silencing BRE retarded somite differentiation (lower panel). Scale bar =
100μm in A, C and F; 20μm in B1-B2, D1-D3,E1-E2 and G1-G2. Abbreviation:
Ctrl-GFP, Control-GFP; NT, neural tube; So, somite.

44
Fig 3. Presence of the neural tube is required for normal somite development.
Somite development was compared in the presence or absence of neural tube in explant
culture. A HH10 chick embryo was sliced into two parts along rostral-caudal axis and
then cultured 24 hours. (A) The left explant contained somites that developed in the
absence of neural tube, while right explant the somites developed in the presence of
neural tube. (B) immunofluorescent staining for Pax7 was performed on explant
cultures in A. In both bright-field and Pax7 IHC images, the somites developed
normally in presence of neural tube. In contrast, in the absence of the neural tube,
somite development was retarded and abnormal - illustrating the importance of the
neural tube in somitogenesis (C). Scale bar = 100μm in A-B. Abbreviation: NT, neural
tube; So, somite.

45
Fig 4. Effects of over-expressing and silencing BRE in the Neural tube on NCC
migration. (A-D) The neural tube was unilaterally co-transfected with Control-siRNA
plus GFP constructs. (A) immunofluorescent staining for HNK-1 labels the migrating
NCCs on both sides of the neural tube (white arrows). (A1) is a merge image of HNK-1
and GFP. (B) showing the left side of the neural tube expressing GFP in section. (C)
immunofluorescent staining for HNK-1 labels the migrating NCCs on both sides of the
neural tube (white arrows) in section. (D) is a merge image of A, B stained with DAPI.
(E-H) The neural tube was unilaterally transfected with BRE-wt. (E) showing HNK-1+
NCCs migrating more extensively on the neural tube side over-expressing BRE, than
the non-transfected side (white arrows). (E1) is a merge image of HNK-1 and GFP. (F)
showing the left side of the neural tube over-expressing BRE. (G, H) showing HNK-1+
NCCs migrating more extensively on the neural tube side over-expressing BRE, than
the non-transfected side (white arrows) in section. (I-L) The neural tube was

46
unilaterally co-transfected with BRE-siRNA and GFP constructs. (I) showing HNK-1+
NCCs migration was reduced on the silenced BRE neural tube, compared with NCCs
migration on the non-transfected side (white arrows). (I1) is a merge image of HNK-1
and GFP. (J) showing the left side of the neural tube silenced by BRE-siRNA and
expressing GFP. (K, L) showing HNK-1+ NCCs migration was reduced on the silenced
BRE neural tube, compared with NCCs migration on the non-transfected side (white
arrows) in section. (M) Bar chart showing abnormal NCCs migration (colored in black)
following BRE over-expression and silencing (BRE-wt: N=14 embryos; BRE-siRNA:
N=8 embryos). (N) Bar chart revealing the relative area in the embryo invaded by
HNK-1+ NCCs, in the control, BRE-wt and BRE-siRNA transfected embryos (N= 8
sections per embryo). (O) Schematic illustration showing BRE promotes the NCCs
migration. Error bars, SE. Scale bar = 100μm in A-A1, E-E1 and I-I1; 20μm in B-D,
F-H and J-L. Abbreviation: NT, neural tube; NCC, neural crest cells.

47
Fig 5. BRE affects the initiation of motor neuron outgrowth from the neural tube
anterior horns. BRE was over-expressed or silenced on the left side of HH10 neural
tube. The embryos were cultured the motor neurons started to develop and the stained
with NF (A-F) and TuJ-1 (G-I) antibodies. (A-C) whole-mount immunohistochemistry
against NF to label the neurites. (A1-C1) are merge images of GFP and NF staining.
D-F are the transverse sections. (A-A1 and D) left side of the neural tube transfected
with Control-GFP constructs, showing NF expression is symmetrical in both side of the
neural tube. (B-B1 and E) left side of the neural tube co-transfected with BRE-wt and
GFP constructs, showing more NF+ cells in BRE over-expressed side than
un-transfected side, as indicated by white arrows. (C-C1 and F) left side of the neural
tube co-transfected with BRE-siRNA and GFP constructs showing fewer NF+ cells on
the BRE silenced side than the un-transfected side, as indicated by the white arrows.

48
(G-G1) left side of the neural tube transfected with Control-GFP construct showing
TuJ-1+ cells are symmetrically distrusted on both sides of the neural tube (white
arrows). H-H1 left side of the neural tube co-transfected with BRE-wt and GFP
constructs revealed that there are more TuJ-1+ cells on the side over-expressing BRE
than non-transfected side (white arrows). I-I1 left side of the neural tube co-transfected
with BRE-siRNA and GFP constructs. There are fewer TuJ-1+ cells in BRE silenced
side than non-transfected side. (J) Bar chart showing NF+ neurite out-growth is affected
(colored black) by BRE mis-expression (Control-GFP: N=6 embryos; BRE-wt: N=7
embryos; BRE-siRNA: N=8 embryos). (K) Bar chart showing TuJ-1+ neurite
out-growth is affected (colored black) by BRE mis-expression (Control-GFP: N=6
embryos; BRE-wt: N=13 embryos; BRE-siRNA: N=7 embryos). (L) Semi-quantitative
RT-PCR analysis showing BRE over-expression in the neural tubes increased
Neurogenin 2 expression while silencing BRE reduced Neurogenin 2 expression
(N=3). (M) Schematic drawing illustrating that BRE promotes motor neurite
out-growth from anterior horns. Scale bar = 100μm in A-C; 50μm in D-E1 and G-H1;
50μm in F-F1 and I-I1. Abbreviation: NT, neural tube.

49
Fig 6. Ability of BRE to modulate cell cycle progression and survival in the
developing neural tube. The neural tubes were unilaterally transfected with
Control-GFP (A), BRE-wt plus GFP (B) or BRE-siRNA plus GFP (C) constructs.
(A1-C1) are transverse sections of the neural tube that have been immunofluorescently
stained for BrdU following transfection. (A2-C2) are merge images of BrdU
incorporation and GFP marker expression. There are significantly more BrdU+/GFP+
cells present in the BRE-wt over-expressed samples (B2) than the Control-GFP
samples (A2). Cyclin D1 expression following unilateral transfection of the neural tube
(left side) with Control-GFP (D), BRE-wt plus GFP (E) and BRE-siRNA plus GFP (F)
constructs. In situ hybridization showing over-expressing BRE increased Cyclin D1
expression (E, E1) as compared with the control (D, D1). Inversely, silencing BRE
expression decreased Cyclin D1 expression (F, F1). (G-I) TUNEL assay showing

50
over-expressing BRE did not increase apoptosis (H) compared with the control (G).
However, silencing BRE increased the incidence of apoptosis (the transfected side of
the neural tube is marked by a green asterisk). (J) Bar chart showing the ratio of
BrdU+/GFP+ cells in neural tube transfected with Control-GFP, BRE-wt and
BRE-siRNA constructs. (K) Bar chart displaying the incidence of normal and abnormal
phenotypes resulting from BRE over-expression and silencing. Control-GFP (N=6),
BRE-wt (N=5) and BRE-siRNA (N=6) transfection. (L) Semi-quantitative RT-PCR
analysis showing BRE over-expression in the neural tubes increased Cyclin D1
expression while silencing BRE reduced Cyclin D1 expression (N=3). (M) Bar chart
showing silencing BRE expression significantly increased apoptosis. Ratio of TUNEL+
cells in the transfected side of the neural tube verses the contralateral control side (N=6,
***P < 0.001). Error bars, SE. Scale bars = 20μm in A-C and G-I; 100μm in D-F; 20μm
in D1-F1. Abbreviation: NT, neural tube.

51
Fig 7. BRE affects BMP4 and Shh expression in the chick neural tube. HH10 neural
tubes were unilaterally (green asterisks) transfected with control-GFP (A, B), BRE-wt
plus GFP (C, D) and BRE-siRNA plus GFP (E, F) constructs. After 20 h, in situ
hybridization was performed to establish BMP4 and Shh express. (A1, B1) showing the
normal expression pattern for BMP4 (black arrows in A1) and Shh on both sides of
neural tube. Shh expression is symmetrically distributed in the neural tube as indicated
by the dotted white line in B1. (C1, D1) demonstrating BRE over-expression enhanced
BMP4 expression (black arrows) in the dorsal neural tube compared with the
un-transfected side. In contrast, Shh expression was reduced in the BRE over-expressed
side of the neural tube as indicated by dotted white line in D1. (E1, F1) showing that
silencing BRE represses BMP4 expression (black arrow in E1) compared with the
contralateral un-transfected side of the neural tube. In contrast, Shh expression slightly

52
increased compared the un-transfected side (dotted line in F1). (G) Neural tubes were
collected for RT-PCR analysis following BE over-expression and silencing.
Over-expressing BRE increased BMP4 expression while silencing BRE suppressed
BMP4, as compared with the control (N=3). (H) Schematic illustration showing BRE
promoting BMP4 expression while suppressing Shh expression in the chick neural
tube. Scale bar = 20μm in A-F. Abbreviation: NT, neural tube

53
Fig 8. BRE modulates NCCs migration through activation of BMP signaling.
(A1-A1) are transverse sections of neural tube that have been immunofluorescently
stained for p-Smad1/5/8 following transfection of the Control-GFP. (B1-B1) are
transverse sections of neural tube that have been immunofluorescently stained for
p-Smad1/5/8 following transfection of the BRE-wt. (C-F) are cultured neural tube
explants transfected with control-GFP+control-siRNA (C), BRE-wt (D),
control-GFP+BRE-siRNA (E) or BRE-wt with LDN-193189 added (F),
immunofluorescently stained for HNK-1. (G-J) are hgher magnification images of C-F
(top left corner showed the edge of neural tube). (G1-J1) are merged images (DAPI,
HNK-1 and GFP). (K) Graph showing the area occupied by HNK+ migratory cells.
Image-Pro Plus 6.0 software was used to analyze the data. (L) Graph showing the ratio
of HNK-1+ cells relative to the total number of cells in each sample. *P<0.05, **P<0.01
indicate significant difference between experimental and control-GFP groups. ###P <

54
0.001 indicate significant difference between BRE-wt and BRE-wt+LDN-193189
embryos. Scale bars: 50μm in A-B1; 500μm in C-F; 100μm in G-J1. Error bars, SD.

55
Fig 9. Model depicting how BRE mis-expression in the neural tube can modulate
somite development. Over-expression of BRE enhances BMP4 and inhibits Shh
expression (might be indirectly) in the neural tube. This would in turn affect cell cycle
through the activation of cell cycle related-genes. NCCs migration and neurite
outgrowth (neuron diffrentiation) are directly or indirectly enhanced by BMP4, Shh
and cell cycle. Lastly, the enhanced NCCs migration and neurite outgrowth might
promote somites development.


