Embed Size (px)
Citation preview
of June 13, 2013.This information is current as
Responses in Lung Venular CapillariesRegulate Spatial Profile of Proinflammatory Mitochondrial Reactive Oxygen Species
Andrew Issekutz and Jahar BhattacharyaKaushik Parthasarathi, Hideo Ichimura, Sadiqa Quadri,
http://www.jimmunol.org/content/169/12/70782002; 169:7078-7086; ;J Immunol
Referenceshttp://www.jimmunol.org/content/169/12/7078.full#ref-list-1
, 35 of which you can access for free at: cites 45 articlesThis article
Subscriptionshttp://jimmunol.org/subscriptions
is online at: The Journal of ImmunologyInformation about subscribing to
Permissionshttp://www.aai.org/ji/copyright.htmlSubmit copyright permission requests at:
Email Alertshttp://jimmunol.org/cgi/alerts/etocReceive free email-alerts when new articles cite this article. Sign up at:
Print ISSN: 0022-1767 Online ISSN: 1550-6606. Immunologists All rights reserved.Copyright © 2002 by The American Association of9650 Rockville Pike, Bethesda, MD 20814-3994.The American Association of Immunologists, Inc.,
is published twice each month byThe Journal of Immunology
by guest on June 13, 2013http://w
ww
.jimm
unol.org/D
ownloaded from
Mitochondrial Reactive Oxygen Species Regulate SpatialProfile of Proinflammatory Responses in Lung VenularCapillaries1
Kaushik Parthasarathi,* Hideo Ichimura,* Sadiqa Quadri,* Andrew Issekutz,‡ andJahar Bhattacharya2*†
Cytokine-induced lung expression of the endothelial cell (EC) leukocyte receptor P-selectin initiates leukocyte rolling. To under-stand the early EC signaling that induces the expression, we conducted real-time digital imaging studies in lung venular capillaries.To compare receptor- vs nonreceptor-mediated effects, we infused capillaries with respectively, TNF-� and arachidonate. Atconcentrations adjusted to give equipotent increases in the cytosolic Ca2�, both agents increased reactive oxygen species (ROS)production and EC P-selectin expression. Blocking the cytosolic Ca2� increases abolished ROS production; blocking ROS pro-duction abrogated P-selectin expression. TNF-�, but not arachidonate, released Ca2� from endoplasmic stores and increasedmitochondrial Ca2�. Furthermore, Ca2� depletion abrogated TNF-� responses partially, but arachidonate responses completely.These differences in Ca2� mobilization by TNF-� and arachidonate were reflected in spatial patterning in the capillary in that theTNF-� effects were localized at branch points, while the arachidonate effects were nonlocalized and extensive. Furthermore,mitochondrial blockers inhibited the TNF-�- but not the arachidonate-induced responses. These findings indicate that the differentmodes of Ca2� mobilization determined the spatial patterning of the proinflammatory response in lung capillaries. Responses toTNF-� revealed that EC mitochondria regulate the proinflammatory process by generating ROS that activate P-selectinexpression. The Journal of Immunology, 2002, 169: 7078–7086.
T he vast alveolar surface area of the lung potentially con-stitutes a portal of entry for inhaled pathogens. Althoughit is understood that the lung defends against this by
mounting an inflammatory response as part of its well-developedinnate immunity, it is puzzling as to how the response is spatiallypatterned in capillaries to maintain optimal conditions for gas ex-change. Recruitment of capillary surface area by the inflammatoryresponse could amount to a loss of surface area for gas exchangesince the physical presence of inflammatory cells in lung capillar-ies, or increased capillary leak during the inflammatory response,could impede oxygen transport. The lung’s strategy for avoidingthis nonbeneficial competition between defense and gas exchangefunctions remains unknown.
Critical to the lung’s innate immunity are endothelial cells (EC)3
that institute rapid signaling by increasing the cytosolic Ca2�
(Ca2�CYT) (1, 2). In a mechanical model of the lung’s proinflam-
matory response in EC of lung capillaries, elevating vascular pres-sure increased Ca2�
CYT as also expression of the leukocyte adhe-sion receptor, P-selectin, within minutes of the challenge (1).Notably, these responses localized at capillary branch points, sug-gesting the existence of a spatial strategy that spares a major partof the capillary surface during inflammatory initiation.
Ca2� mobilization leading to increase of Ca2�CYT occurs by
capacitative Ca2� entry (CCE) in which Ca2� release from endo-somal stores (ER) activates Ca2� influx through capacitative chan-nels in the cell membrane, or by Ca2� entry through noncapaci-tative channels activated by direct agonist action (3). Ca2�
mobilization also occurs into and out of mitochondria (4, 5), rais-ing the possibility that these organelles may have an impact onCa2�
CYT levels (4) and consequently, on downstream Ca2�CYT-
dependent events relevant to proinflammatory responses. How-ever, the mitochondrial role in inflammation remains undefined.
In this study, we tested the hypothesis that in EC, differences inCa2� mobilization determine the extent to which mitochondriadetermine proinflammatory responses in lung venular capillaries.To distinguish between CCE and non-CCE, we exposed the cap-illaries to the prototypical inflammatory cytokine, TNF-� thatcauses receptor-mediated Ca2�
CYT increases (6), and to the in-flammatory product, arachidonate that mobilizes Ca2� entry di-rectly across the cell membrane by nonreceptor mechanisms (3).At equipotent Ca2�
CYT increases induced by these agents, we ad-dressed spatial profiles of mitochondrial density and mitochondrialCa2� (Ca2�
MIT) content in EC of these capillaries. Our findingsindicate that mechanisms of Ca2� mobilization play a critical rolein patterning the proinflammatory response in the lung capillary.
St. Luke’s-Roosevelt Hospital Center, Departments of *Physiology and Cellular Bio-physics, and †Medicine, College of Physicians and Surgeons, Columbia University,New York, NY 10019; ‡Departments of Pediatrics, Microbiology-Immunology andPathology, Dalhousie University, Halifax, Nova Scotia, Canada
Received for publication August 23, 2002. Accepted for publication October18, 2002.
The costs of publication of this article were defrayed in part by the payment of pagecharges. This article must therefore be hereby marked advertisement in accordancewith 18 U.S.C. Section 1734 solely to indicate this fact.1 This work was supported by National Institutes of Health Grants HL57556,HL36024, HL64896, and HL69514 (to J.B.).2 Address correspondence and reprint requests to Dr. Jahar Bhattacharya, St. Luke’s-Roosevelt Hospital Center, Department of Medicine, College of Physicians and Sur-geons, Columbia University, 1000 10th Avenue, New York, NY 10019. E-mail ad-dress: [email protected] Abbreviations used in this paper: EC, endothelial cell; ROS, reactive oxygen spe-cies; Ca2�
CYT, cytosolic Ca2�; CCE, capacitative Ca2� entry; ER, endosomal store;Ca2�
MIT, mitochondrial Ca2�; MTG, MitoTracker Green FM; DCF, 2�,7�-dichlo-rofluorescein; MTO, MitoTracker Orange; DCFH-DA, DCF diacetate; DAF 2DA, 4,5diaminofluorescein; L-NAME, NG-nitro-L-arginine methyl ester; SNAP, s-nitrosoacetyl penicilamine; PTIO, 2-phenyl-4,4,5,5-tetra-methyllimidazole-1-oxyl 3-oxide;
FCCP, carbonyl cyanide p-(trifluoro methoxy) phenylhydrazone; t-BHQ, 2,5-ditert-butyl-hydroquinone; XeC, Xestospongin C.
The Journal of Immunology
Copyright © 2002 by The American Association of Immunologists, Inc. 0022-1767/02/$02.00
by guest on June 13, 2013http://w
ww
.jimm
unol.org/D
ownloaded from
An unexpected result was that TNF-� induced P-selectin expres-sion by augmenting mitochondrial reactive oxygen species (ROS)production.
Materials and MethodsFluorescent probes and other agents
Fluorescent probes fura 2-AM, MitoTracker Green FM (MTG), chloro-methyl tetramethyl rosamine (MitoTracker Orange; MTO), rhod 2AM, and2�,7�-dichlorofluorescin diacetate (DCFH-DA) were purchased from Mo-lecular Probes (Eugene, OR). fura 2FF AM and 4,5 diaminofluorescein(DAF 2DA) were from TEF Labs (Austin, TX) and Calbiochem (La Jolla,CA), respectively. Mouse anti-rat P-selectin mAb RP-2 was a gift fromA. C. Issekutz (Department of Microbiology-Immunology, Dalhousie Uni-versity, Halifax, Canada). Goat anti-rat TNFR1 mAb E-20 was from SantaCruz Biotechnology (Santa Cruz, CA). Alexa-Fluor 488-conjugated goatanti-mouse secondary Ab was from Molecular Probes.
Agents human rTNF-� and arachidonic acid, the mitochondrial inhibi-tors rotenone and antimycin, the NO synthase inhibitor NG-nitro-L-argininemethyl ester (L-NAME), NO donor s-nitroso acetyl penicilamine (SNAP),the NO scavenger 2-phenyl-4,4,5,5-tetra-methyllimidazole-1-oxyl 3-oxide(PTIO), and the mitochondrial ATP-ase inhibitor oligomycin were fromSigma-Aldrich (St. Louis, MO). Mitochondrial inhibitor carbonyl cyanidep-(trifluoro methoxy) phenylhydrazone (FCCP), the Ca2�-ATPase inhibi-tor 2,5-ditert-butyl-hydroquinone (t-BHQ), the ionositol trisphosphate re-ceptor blocker Xestospongin C (XeC) and the antioxidant trolox were fromCalbiochem. The Ca2� chelator BAPTA-AM was from Molecular Probes.
Agents were infused into capillaries in HEPES-buffered vehicle with 4%dextran (70 kDa) and 1% FBS at pH 7.4, osmolarity 295 � 5 milliosmoles,and containing (millimolars) 150 Na�, 5 K�, 1 Ca2�, 1 Mg2�, and 10glucose.
Lung preparation
Preparation of the isolated blood perfused rat lungs and the imaging meth-ods have been detailed previously (2, 7). Briefly, lungs were excised fromadult male Sprague Dawley rats and continuously pump-perfused at 14ml/min with autologous rat blood warmed to 37°C. The lungs were con-stantly inflated at an airway pressure of 5 cm H2O. The pulmonary arteryand left atrial pressures were maintained at 10 and 5 cm H2O, respectively.The lungs were positioned on a vibration-free air table. The lung surfacewas kept moist with saline warmed to 37°C.
Substance delivery and concentration
A PE10 (BD Biosciences, Sparks, MD) microcatheter was introducedthrough the left atrial canula and wedged into the lung microcirculation.Capillary blood cell-free conditions were established by flushing withHEPES-buffered Ringer’s solution. The agents were infused at the follow-ing concentrations: rhod 2AM 5 �M, MTG FM 1 �M, MTO 2.5 �M, fura2AM 10 �M, DCFH-DA 2.5 �M, DAF 2DA 2 �M, TNF-� 40–200 ng/ml,arachidonate 2–10 �M, saponin 0.01%, antimycin 1 �g/ml, FCCP 400nM–1 �M, oligomycin 2.5 �g/ml, rotenone 1 �M, BAPTA AM 40 �M,t-BHQ 15 �M, XeC 20 �M, trolox 2 mM, L-NAME 10 �M, PTIO 100�M, and SNAP 500 �M. FCCP was always infused with oligomycin, toprevent ATP depletion by the mitochondrial ATPase (8). To establishCa2�-free conditions, capillaries were flushed for 10 min with Ca2�-freeHEPES-buffered Ringer’s containing 0.5 mM EGTA.
Although the only cell type in these capillaries are EC (7), fluorophoresmay leak across the capillary wall to enter cells such as epithelial cells ofadjacent alveoli. Fluorophores may also enter cells in the bloodstream suchas leukocytes and platelets. We protected against these potential artifactsby maintaining absorptive conditions within the capillary (9) and by clear-ing the capillaries of blood before dye infusion.
Fluorescence microscopy
Fluorophores were excited using mercury arc lamp illumination directedthrough appropriate interference filters (XB58/25R and XB62/25R; OmegaOptical, Brattleboro, VT) and filter sets (71000, 41001, and 41004; ChromaTechnology, Brattleboro, VT). Fluorophore exposures were controlled bya filter wheel (LAMBDA10-2; Sutter Instrument, Novato, CA). The fluo-rescence emission was collected using an objective lens (LUMPlanFL�40/0.8W; Olympus Optical, Melville, NY), passed through an image in-tensifier (Midnight Sun; Imaging Research, St. Catharine’s, Canada), andcaptured with a charge-coupled device camera (CCD-72; Dage-MTI,Michigan City, IN). The images were then recorded and subject to imageanalysis (MCID5.0; Imaging Research).
Confocal microscopy
Confocal images were obtained using a LSM5-Pascal (Zeiss, Thornwood,NY) confocal imaging system attached to an Axiophot (Zeiss) microscope.Fluorophores were excited using a He-Ne Laser (545 nm) and an Argonlaser (492 nm). Emitted fluorescence was collected using objective lens(Achroplan �40/0.8W, Achroplan �63/1.2W; Zeiss). The images wererecorded and analyzed using Pascal (Zeiss).
Capillary imaging and analysis
To detect Ca2�MIT, we infused rhod 2AM into capillaries for 20 min fol-
lowed by a Ringer’s flush for 30 min. A capillary was excited at 545 nmand the fluorescence emissions recorded at 560 nm. Capillary Ca2�
CYT wasdetermined as described previously (7). Briefly, capillaries were loadedwith fura 2-AM for 30 min and then excited at 340 and 380 nm. Thefluorescence emissions at 510 nm were recorded and Ca2�
CYT calculatedfrom a computer-generated 340:380 emissions ratio. ER Ca2� was deter-mined by fura 2FF using a protocol similar to that used for fura 2. To detectEC ROS and NO production, DCFH-DA and DAF 2DA, respectively, werecontinuously infused into capillaries. Image acquisitions were started 30min after the start of fluorophore infusion. Capillaries were excited at 490nm and the emission at 510 nm was recorded. Changes in capillary fluo-rescence were quantified in a 4-�m2 area along the capillary wall.
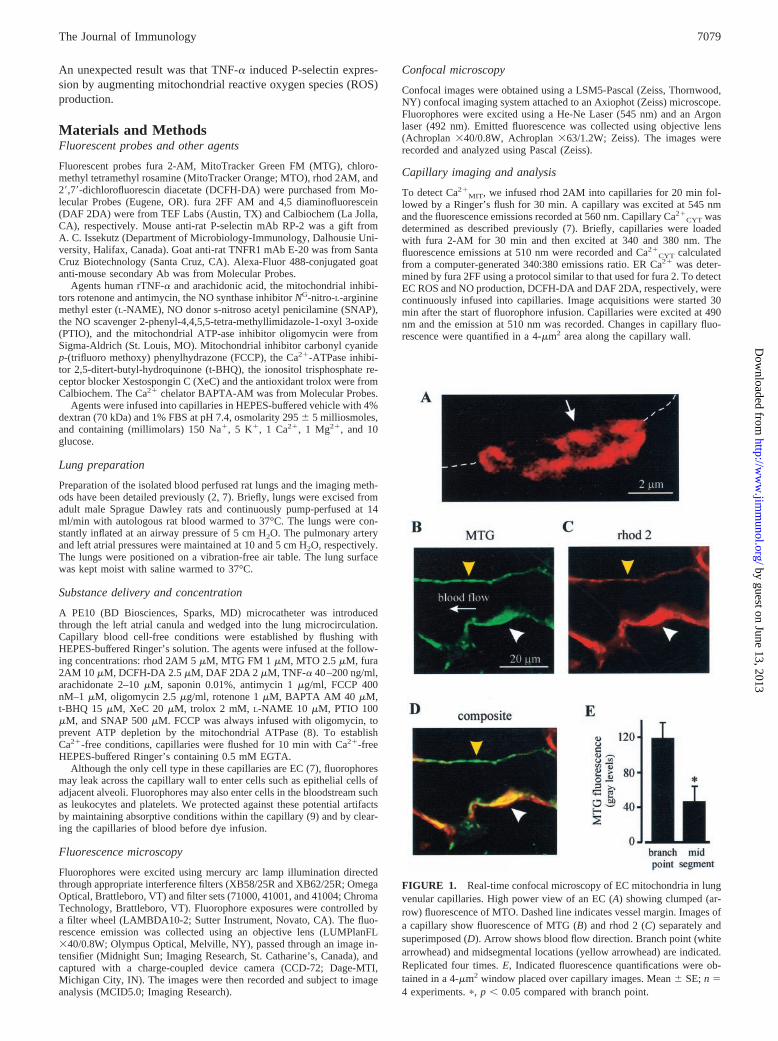
FIGURE 1. Real-time confocal microscopy of EC mitochondria in lungvenular capillaries. High power view of an EC (A) showing clumped (ar-row) fluorescence of MTO. Dashed line indicates vessel margin. Images ofa capillary show fluorescence of MTG (B) and rhod 2 (C) separately andsuperimposed (D). Arrow shows blood flow direction. Branch point (whitearrowhead) and midsegmental locations (yellow arrowhead) are indicated.Replicated four times. E, Indicated fluorescence quantifications were ob-tained in a 4-�m2 window placed over capillary images. Mean � SE; n �4 experiments. �, p � 0.05 compared with branch point.
7079The Journal of Immunology
by guest on June 13, 2013http://w
ww
.jimm
unol.org/D
ownloaded from
In situ indirect immunofluorescence
To determine EC P-selectin expression, we infused RP-2 (3.5 �g/ml) intothe capillary for 3 min, followed by the secondary AlexaFluor-488-conju-gated Ab (2 �g/ml) for 2 min. Unbound fluorescence was removed byflushing for 1 min with Ringer’s solution. Residual capillary fluorescencewas recorded and changes in global fluorescence were reported as changesin P-selectin expression.
Statistics
All data are reported as mean � SE. Paired observations were comparedusing paired Student’s t test and grouped differences were compared withANOVA (Newman-Keuls test).
ResultsEC mitochondria
To determine mitochondrial density in lung EC in situ, we infusedvenular capillaries with the mitochondria-sensitive dyes, MTG,MTO, and rhod 2. MTG and MTO localize to mitochondria bybinding to the inner membrane (10), while rhod 2, which is Ca2�
sensing, distributes by charge to the anionic mitochondrial matrix(8). Real-time confocal microscopy at high magnification revealedEC mitochondria as clumped fluorescence aggregates of diameter0.5–1 �m that were organized along the cell periphery (Fig. 1A)(10, 11). Viewed at lower magnification, the dyes appeared colo-calized in the capillary wall and were most dominantly fluorescentin EC located at capillary branch points (Fig. 1, B–D). Quantified overequal lengths of vessel wall, MTG fluorescence was more than twotimes higher at branch points than at midsegments (Fig. 1E).
Rhod 2
To determine the extent of cytosolic uptake, we compared rhod 2fluorescence against that of the Ca2�
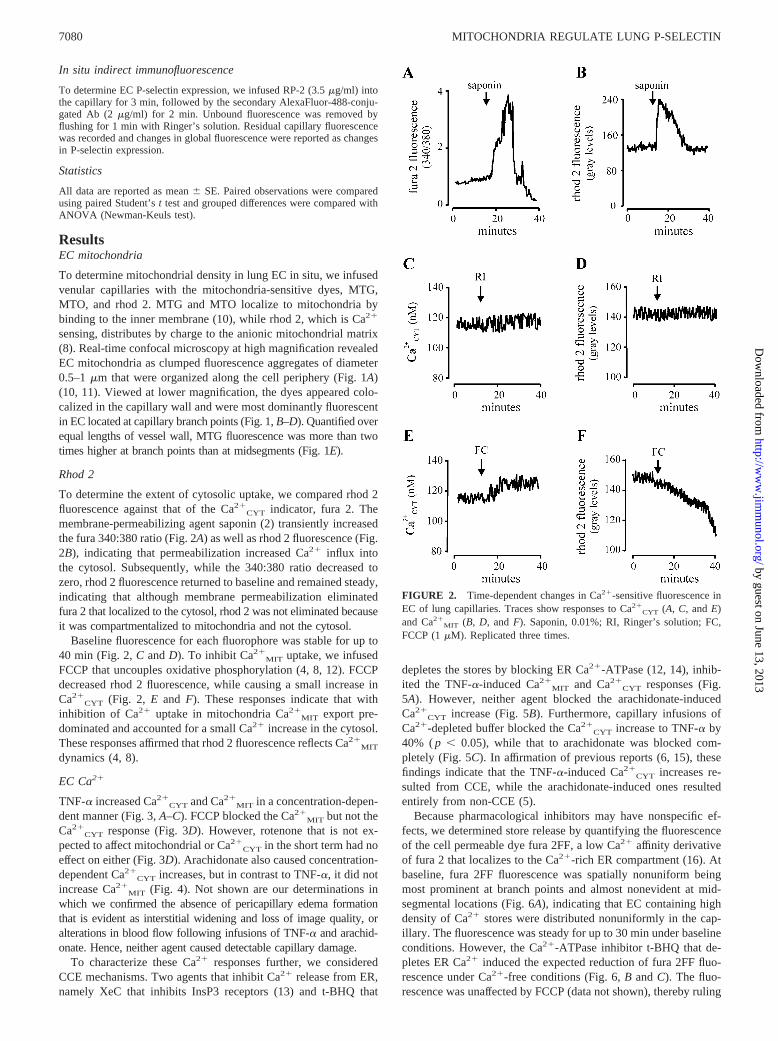
CYT indicator, fura 2. Themembrane-permeabilizing agent saponin (2) transiently increasedthe fura 340:380 ratio (Fig. 2A) as well as rhod 2 fluorescence (Fig.2B), indicating that permeabilization increased Ca2� influx intothe cytosol. Subsequently, while the 340:380 ratio decreased tozero, rhod 2 fluorescence returned to baseline and remained steady,indicating that although membrane permeabilization eliminatedfura 2 that localized to the cytosol, rhod 2 was not eliminated becauseit was compartmentalized to mitochondria and not the cytosol.
Baseline fluorescence for each fluorophore was stable for up to40 min (Fig. 2, C and D). To inhibit Ca2�
MIT uptake, we infusedFCCP that uncouples oxidative phosphorylation (4, 8, 12). FCCPdecreased rhod 2 fluorescence, while causing a small increase inCa2�
CYT (Fig. 2, E and F). These responses indicate that withinhibition of Ca2� uptake in mitochondria Ca2�
MIT export pre-dominated and accounted for a small Ca2� increase in the cytosol.These responses affirmed that rhod 2 fluorescence reflects Ca2�
MIT
dynamics (4, 8).
EC Ca2�
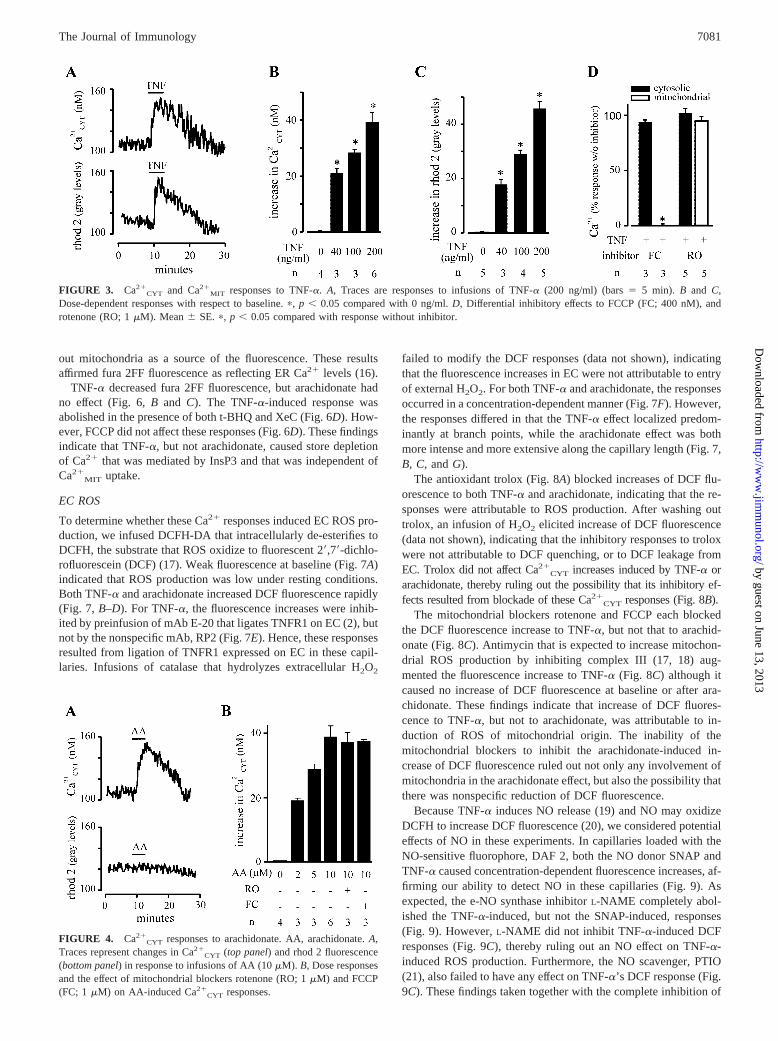
TNF-� increased Ca2�CYT and Ca2�
MIT in a concentration-depen-dent manner (Fig. 3, A–C). FCCP blocked the Ca2�
MIT but not theCa2�
CYT response (Fig. 3D). However, rotenone that is not ex-pected to affect mitochondrial or Ca2�
CYT in the short term had noeffect on either (Fig. 3D). Arachidonate also caused concentration-dependent Ca2�
CYT increases, but in contrast to TNF-�, it did notincrease Ca2�
MIT (Fig. 4). Not shown are our determinations inwhich we confirmed the absence of pericapillary edema formationthat is evident as interstitial widening and loss of image quality, oralterations in blood flow following infusions of TNF-� and arachid-onate. Hence, neither agent caused detectable capillary damage.
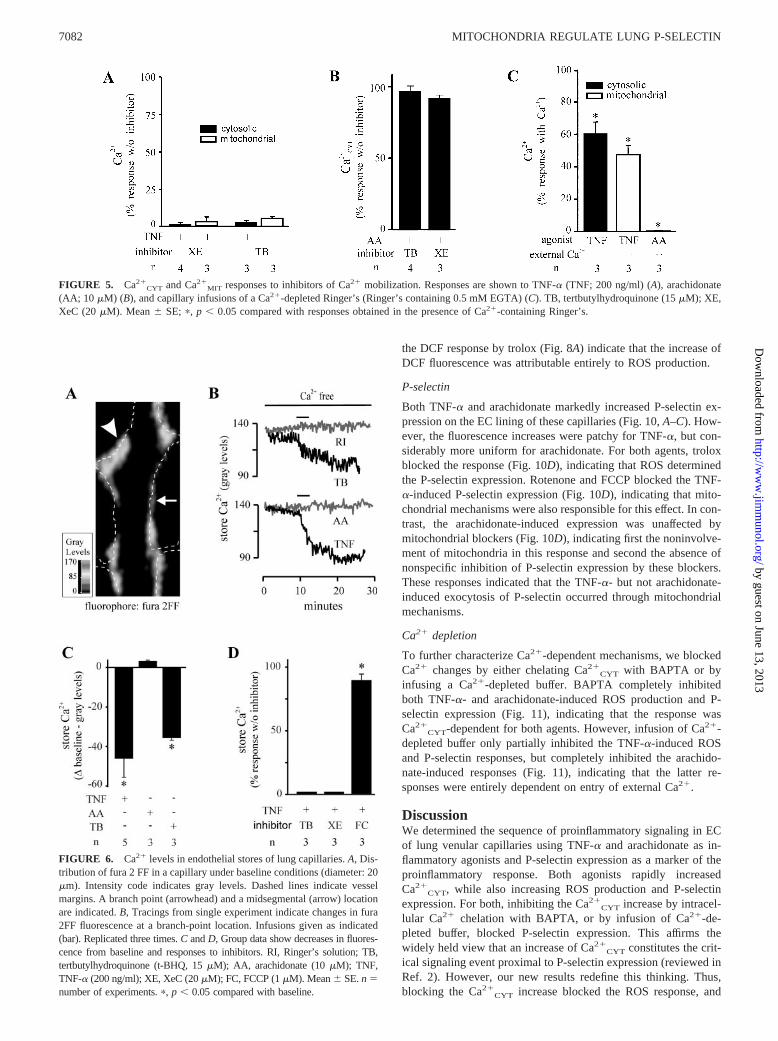
To characterize these Ca2� responses further, we consideredCCE mechanisms. Two agents that inhibit Ca2� release from ER,namely XeC that inhibits InsP3 receptors (13) and t-BHQ that
depletes the stores by blocking ER Ca2�-ATPase (12, 14), inhib-ited the TNF-�-induced Ca2�
MIT and Ca2�CYT responses (Fig.
5A). However, neither agent blocked the arachidonate-inducedCa2�
CYT increase (Fig. 5B). Furthermore, capillary infusions ofCa2�-depleted buffer blocked the Ca2�
CYT increase to TNF-� by40% ( p � 0.05), while that to arachidonate was blocked com-pletely (Fig. 5C). In affirmation of previous reports (6, 15), thesefindings indicate that the TNF-�-induced Ca2�
CYT increases re-sulted from CCE, while the arachidonate-induced ones resultedentirely from non-CCE (5).
Because pharmacological inhibitors may have nonspecific ef-fects, we determined store release by quantifying the fluorescenceof the cell permeable dye fura 2FF, a low Ca2� affinity derivativeof fura 2 that localizes to the Ca2�-rich ER compartment (16). Atbaseline, fura 2FF fluorescence was spatially nonuniform beingmost prominent at branch points and almost nonevident at mid-segmental locations (Fig. 6A), indicating that EC containing highdensity of Ca2� stores were distributed nonuniformly in the cap-illary. The fluorescence was steady for up to 30 min under baselineconditions. However, the Ca2�-ATPase inhibitor t-BHQ that de-pletes ER Ca2� induced the expected reduction of fura 2FF fluo-rescence under Ca2�-free conditions (Fig. 6, B and C). The fluo-rescence was unaffected by FCCP (data not shown), thereby ruling
FIGURE 2. Time-dependent changes in Ca2�-sensitive fluorescence inEC of lung capillaries. Traces show responses to Ca2�
CYT (A, C, and E)and Ca2�
MIT (B, D, and F). Saponin, 0.01%; RI, Ringer’s solution; FC,FCCP (1 �M). Replicated three times.
7080 MITOCHONDRIA REGULATE LUNG P-SELECTIN
by guest on June 13, 2013http://w
ww
.jimm
unol.org/D
ownloaded from
out mitochondria as a source of the fluorescence. These resultsaffirmed fura 2FF fluorescence as reflecting ER Ca2� levels (16).
TNF-� decreased fura 2FF fluorescence, but arachidonate hadno effect (Fig. 6, B and C). The TNF-�-induced response wasabolished in the presence of both t-BHQ and XeC (Fig. 6D). How-ever, FCCP did not affect these responses (Fig. 6D). These findingsindicate that TNF-�, but not arachidonate, caused store depletionof Ca2� that was mediated by InsP3 and that was independent ofCa2�
MIT uptake.
EC ROS
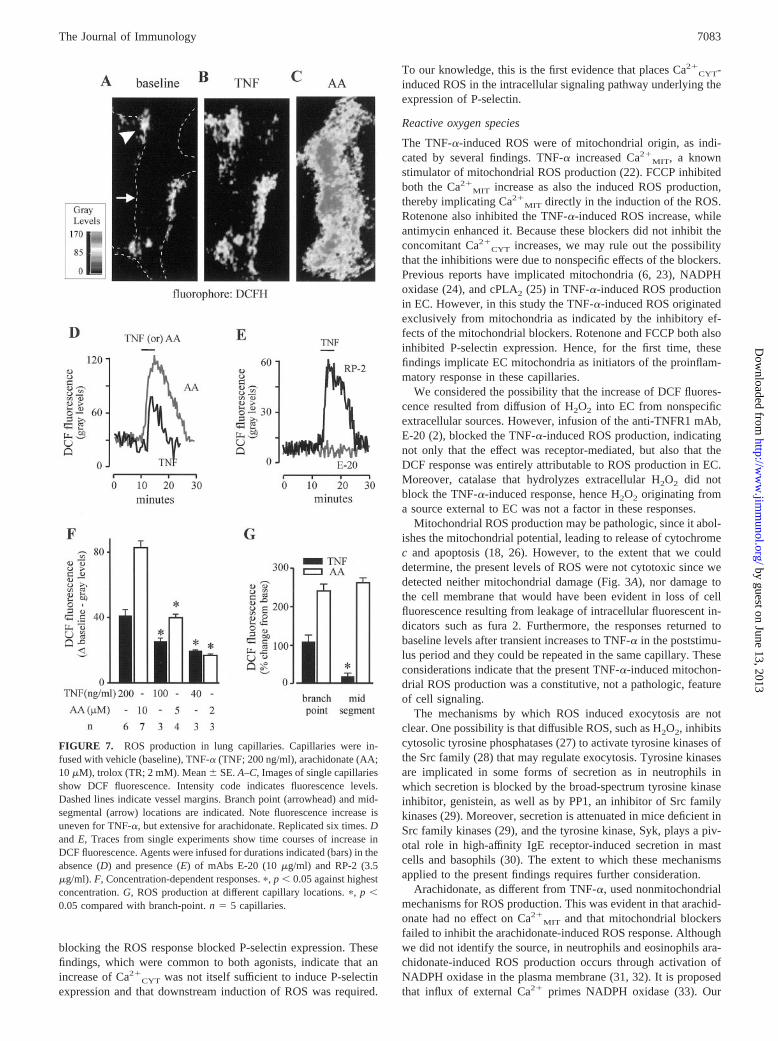
To determine whether these Ca2� responses induced EC ROS pro-duction, we infused DCFH-DA that intracellularly de-esterifies toDCFH, the substrate that ROS oxidize to fluorescent 2�,7�-dichlo-rofluorescein (DCF) (17). Weak fluorescence at baseline (Fig. 7A)indicated that ROS production was low under resting conditions.Both TNF-� and arachidonate increased DCF fluorescence rapidly(Fig. 7, B–D). For TNF-�, the fluorescence increases were inhib-ited by preinfusion of mAb E-20 that ligates TNFR1 on EC (2), butnot by the nonspecific mAb, RP2 (Fig. 7E). Hence, these responsesresulted from ligation of TNFR1 expressed on EC in these capil-laries. Infusions of catalase that hydrolyzes extracellular H2O2
failed to modify the DCF responses (data not shown), indicatingthat the fluorescence increases in EC were not attributable to entryof external H2O2. For both TNF-� and arachidonate, the responsesoccurred in a concentration-dependent manner (Fig. 7F). However,the responses differed in that the TNF-� effect localized predom-inantly at branch points, while the arachidonate effect was bothmore intense and more extensive along the capillary length (Fig. 7,B, C, and G).
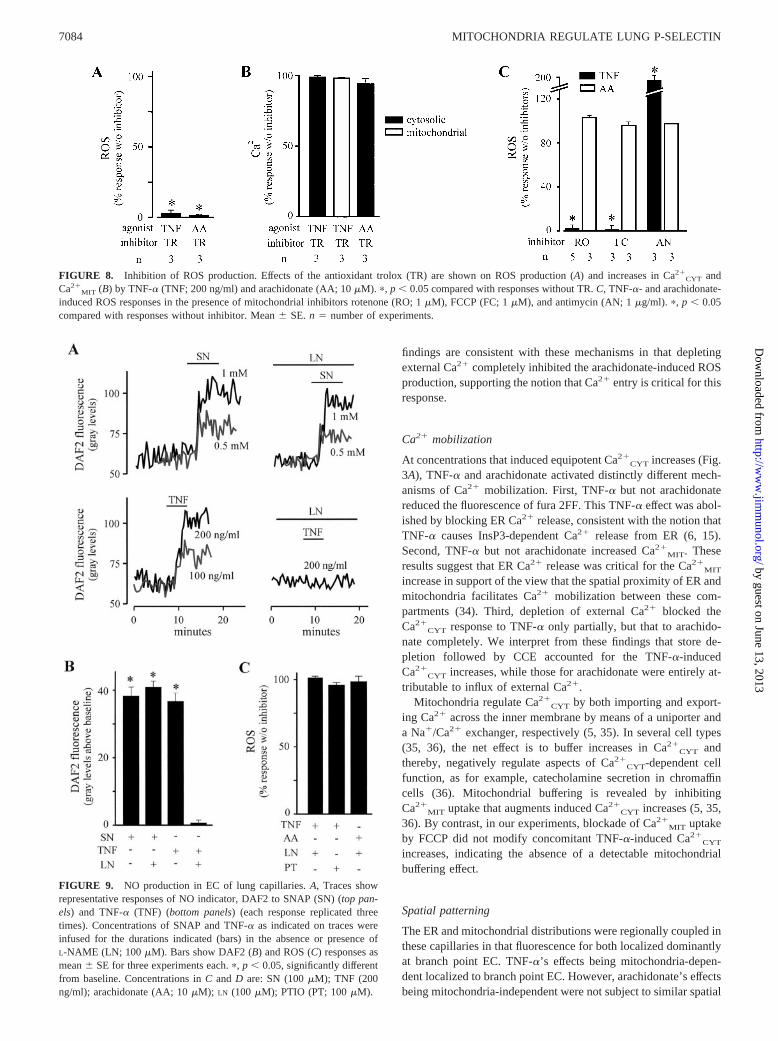
The antioxidant trolox (Fig. 8A) blocked increases of DCF flu-orescence to both TNF-� and arachidonate, indicating that the re-sponses were attributable to ROS production. After washing outtrolox, an infusion of H2O2 elicited increase of DCF fluorescence(data not shown), indicating that the inhibitory responses to troloxwere not attributable to DCF quenching, or to DCF leakage fromEC. Trolox did not affect Ca2�
CYT increases induced by TNF-� orarachidonate, thereby ruling out the possibility that its inhibitory ef-fects resulted from blockade of these Ca2�
CYT responses (Fig. 8B).The mitochondrial blockers rotenone and FCCP each blocked
the DCF fluorescence increase to TNF-�, but not that to arachid-onate (Fig. 8C). Antimycin that is expected to increase mitochon-drial ROS production by inhibiting complex III (17, 18) aug-mented the fluorescence increase to TNF-� (Fig. 8C) although itcaused no increase of DCF fluorescence at baseline or after ara-chidonate. These findings indicate that increase of DCF fluores-cence to TNF-�, but not to arachidonate, was attributable to in-duction of ROS of mitochondrial origin. The inability of themitochondrial blockers to inhibit the arachidonate-induced in-crease of DCF fluorescence ruled out not only any involvement ofmitochondria in the arachidonate effect, but also the possibility thatthere was nonspecific reduction of DCF fluorescence.
Because TNF-� induces NO release (19) and NO may oxidizeDCFH to increase DCF fluorescence (20), we considered potentialeffects of NO in these experiments. In capillaries loaded with theNO-sensitive fluorophore, DAF 2, both the NO donor SNAP andTNF-� caused concentration-dependent fluorescence increases, af-firming our ability to detect NO in these capillaries (Fig. 9). Asexpected, the e-NO synthase inhibitor L-NAME completely abol-ished the TNF-�-induced, but not the SNAP-induced, responses(Fig. 9). However, L-NAME did not inhibit TNF-�-induced DCFresponses (Fig. 9C), thereby ruling out an NO effect on TNF-�-induced ROS production. Furthermore, the NO scavenger, PTIO(21), also failed to have any effect on TNF-�’s DCF response (Fig.9C). These findings taken together with the complete inhibition of
FIGURE 4. Ca2�CYT responses to arachidonate. AA, arachidonate. A,
Traces represent changes in Ca2�CYT (top panel) and rhod 2 fluorescence
(bottom panel) in response to infusions of AA (10 �M). B, Dose responsesand the effect of mitochondrial blockers rotenone (RO; 1 �M) and FCCP(FC; 1 �M) on AA-induced Ca2�
CYT responses.
FIGURE 3. Ca2�CYT and Ca2�
MIT responses to TNF-�. A, Traces are responses to infusions of TNF-� (200 ng/ml) (bars � 5 min). B and C,Dose-dependent responses with respect to baseline. �, p � 0.05 compared with 0 ng/ml. D, Differential inhibitory effects to FCCP (FC; 400 nM), androtenone (RO; 1 �M). Mean � SE. �, p � 0.05 compared with response without inhibitor.
7081The Journal of Immunology
by guest on June 13, 2013http://w
ww
.jimm
unol.org/D
ownloaded from
the DCF response by trolox (Fig. 8A) indicate that the increase ofDCF fluorescence was attributable entirely to ROS production.
P-selectin
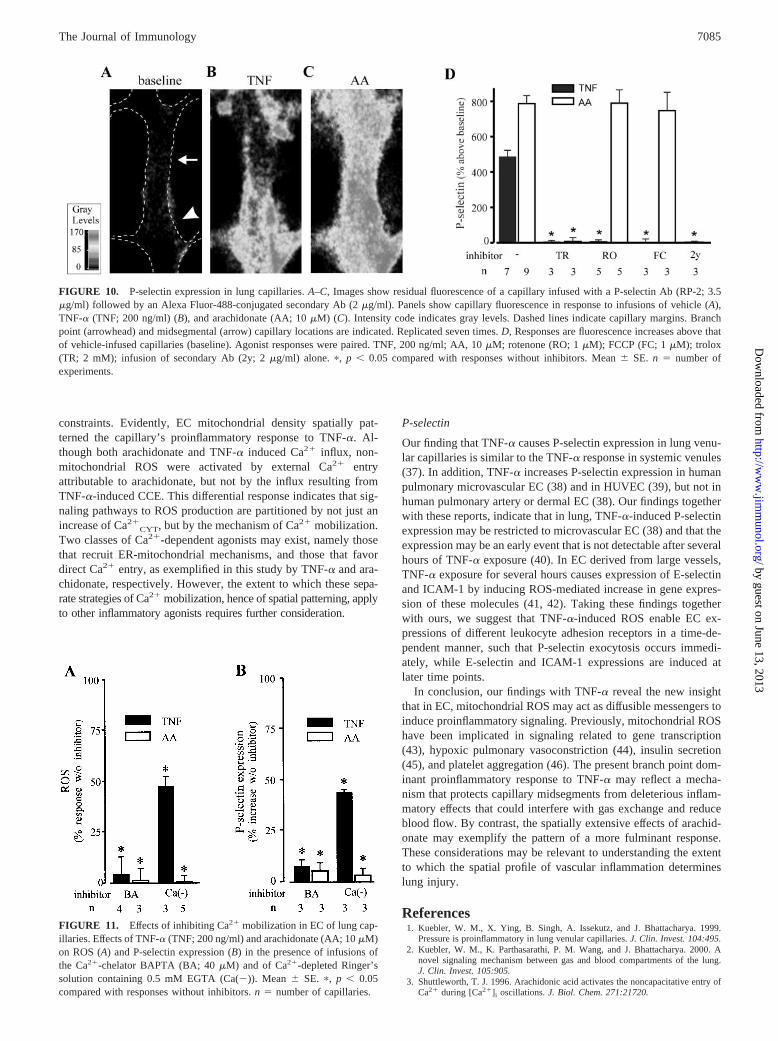
Both TNF-� and arachidonate markedly increased P-selectin ex-pression on the EC lining of these capillaries (Fig. 10, A–C). How-ever, the fluorescence increases were patchy for TNF-�, but con-siderably more uniform for arachidonate. For both agents, troloxblocked the response (Fig. 10D), indicating that ROS determinedthe P-selectin expression. Rotenone and FCCP blocked the TNF-�-induced P-selectin expression (Fig. 10D), indicating that mito-chondrial mechanisms were also responsible for this effect. In con-trast, the arachidonate-induced expression was unaffected bymitochondrial blockers (Fig. 10D), indicating first the noninvolve-ment of mitochondria in this response and second the absence ofnonspecific inhibition of P-selectin expression by these blockers.These responses indicated that the TNF-�- but not arachidonate-induced exocytosis of P-selectin occurred through mitochondrialmechanisms.
Ca2� depletion
To further characterize Ca2�-dependent mechanisms, we blockedCa2� changes by either chelating Ca2�
CYT with BAPTA or byinfusing a Ca2�-depleted buffer. BAPTA completely inhibitedboth TNF-�- and arachidonate-induced ROS production and P-selectin expression (Fig. 11), indicating that the response wasCa2�
CYT-dependent for both agents. However, infusion of Ca2�-depleted buffer only partially inhibited the TNF-�-induced ROSand P-selectin responses, but completely inhibited the arachido-nate-induced responses (Fig. 11), indicating that the latter re-sponses were entirely dependent on entry of external Ca2�.
DiscussionWe determined the sequence of proinflammatory signaling in ECof lung venular capillaries using TNF-� and arachidonate as in-flammatory agonists and P-selectin expression as a marker of theproinflammatory response. Both agonists rapidly increasedCa2�
CYT, while also increasing ROS production and P-selectinexpression. For both, inhibiting the Ca2�
CYT increase by intracel-lular Ca2� chelation with BAPTA, or by infusion of Ca2�-de-pleted buffer, blocked P-selectin expression. This affirms thewidely held view that an increase of Ca2�
CYT constitutes the crit-ical signaling event proximal to P-selectin expression (reviewed inRef. 2). However, our new results redefine this thinking. Thus,blocking the Ca2�
CYT increase blocked the ROS response, and
FIGURE 5. Ca2�CYT and Ca2�
MIT responses to inhibitors of Ca2� mobilization. Responses are shown to TNF-� (TNF; 200 ng/ml) (A), arachidonate(AA; 10 �M) (B), and capillary infusions of a Ca2�-depleted Ringer’s (Ringer’s containing 0.5 mM EGTA) (C). TB, tertbutylhydroquinone (15 �M); XE,XeC (20 �M). Mean � SE; �, p � 0.05 compared with responses obtained in the presence of Ca2�-containing Ringer’s.
FIGURE 6. Ca2� levels in endothelial stores of lung capillaries. A, Dis-tribution of fura 2 FF in a capillary under baseline conditions (diameter: 20�m). Intensity code indicates gray levels. Dashed lines indicate vesselmargins. A branch point (arrowhead) and a midsegmental (arrow) locationare indicated. B, Tracings from single experiment indicate changes in fura2FF fluorescence at a branch-point location. Infusions given as indicated(bar). Replicated three times. C and D, Group data show decreases in fluores-cence from baseline and responses to inhibitors. RI, Ringer’s solution; TB,tertbutylhydroquinone (t-BHQ, 15 �M); AA, arachidonate (10 �M); TNF,TNF-� (200 ng/ml); XE, XeC (20 �M); FC, FCCP (1 �M). Mean � SE. n �number of experiments. �, p � 0.05 compared with baseline.
7082 MITOCHONDRIA REGULATE LUNG P-SELECTIN
by guest on June 13, 2013http://w
ww
.jimm
unol.org/D
ownloaded from
blocking the ROS response blocked P-selectin expression. Thesefindings, which were common to both agonists, indicate that anincrease of Ca2�
CYT was not itself sufficient to induce P-selectinexpression and that downstream induction of ROS was required.
To our knowledge, this is the first evidence that places Ca2�CYT-
induced ROS in the intracellular signaling pathway underlying theexpression of P-selectin.
Reactive oxygen species
The TNF-�-induced ROS were of mitochondrial origin, as indi-cated by several findings. TNF-� increased Ca2�
MIT, a knownstimulator of mitochondrial ROS production (22). FCCP inhibitedboth the Ca2�
MIT increase as also the induced ROS production,thereby implicating Ca2�
MIT directly in the induction of the ROS.Rotenone also inhibited the TNF-�-induced ROS increase, whileantimycin enhanced it. Because these blockers did not inhibit theconcomitant Ca2�
CYT increases, we may rule out the possibilitythat the inhibitions were due to nonspecific effects of the blockers.Previous reports have implicated mitochondria (6, 23), NADPHoxidase (24), and cPLA2 (25) in TNF-�-induced ROS productionin EC. However, in this study the TNF-�-induced ROS originatedexclusively from mitochondria as indicated by the inhibitory ef-fects of the mitochondrial blockers. Rotenone and FCCP both alsoinhibited P-selectin expression. Hence, for the first time, thesefindings implicate EC mitochondria as initiators of the proinflam-matory response in these capillaries.
We considered the possibility that the increase of DCF fluores-cence resulted from diffusion of H2O2 into EC from nonspecificextracellular sources. However, infusion of the anti-TNFR1 mAb,E-20 (2), blocked the TNF-�-induced ROS production, indicatingnot only that the effect was receptor-mediated, but also that theDCF response was entirely attributable to ROS production in EC.Moreover, catalase that hydrolyzes extracellular H2O2 did notblock the TNF-�-induced response, hence H2O2 originating froma source external to EC was not a factor in these responses.
Mitochondrial ROS production may be pathologic, since it abol-ishes the mitochondrial potential, leading to release of cytochromec and apoptosis (18, 26). However, to the extent that we coulddetermine, the present levels of ROS were not cytotoxic since wedetected neither mitochondrial damage (Fig. 3A), nor damage tothe cell membrane that would have been evident in loss of cellfluorescence resulting from leakage of intracellular fluorescent in-dicators such as fura 2. Furthermore, the responses returned tobaseline levels after transient increases to TNF-� in the poststimu-lus period and they could be repeated in the same capillary. Theseconsiderations indicate that the present TNF-�-induced mitochon-drial ROS production was a constitutive, not a pathologic, featureof cell signaling.
The mechanisms by which ROS induced exocytosis are notclear. One possibility is that diffusible ROS, such as H2O2, inhibitscytosolic tyrosine phosphatases (27) to activate tyrosine kinases ofthe Src family (28) that may regulate exocytosis. Tyrosine kinasesare implicated in some forms of secretion as in neutrophils inwhich secretion is blocked by the broad-spectrum tyrosine kinaseinhibitor, genistein, as well as by PP1, an inhibitor of Src familykinases (29). Moreover, secretion is attenuated in mice deficient inSrc family kinases (29), and the tyrosine kinase, Syk, plays a piv-otal role in high-affinity IgE receptor-induced secretion in mastcells and basophils (30). The extent to which these mechanismsapplied to the present findings requires further consideration.
Arachidonate, as different from TNF-�, used nonmitochondrialmechanisms for ROS production. This was evident in that arachid-onate had no effect on Ca2�
MIT and that mitochondrial blockersfailed to inhibit the arachidonate-induced ROS response. Althoughwe did not identify the source, in neutrophils and eosinophils ara-chidonate-induced ROS production occurs through activation ofNADPH oxidase in the plasma membrane (31, 32). It is proposedthat influx of external Ca2� primes NADPH oxidase (33). Our
FIGURE 7. ROS production in lung capillaries. Capillaries were in-fused with vehicle (baseline), TNF-� (TNF; 200 ng/ml), arachidonate (AA;10 �M), trolox (TR; 2 mM). Mean � SE. A–C, Images of single capillariesshow DCF fluorescence. Intensity code indicates fluorescence levels.Dashed lines indicate vessel margins. Branch point (arrowhead) and mid-segmental (arrow) locations are indicated. Note fluorescence increase isuneven for TNF-�, but extensive for arachidonate. Replicated six times. Dand E, Traces from single experiments show time courses of increase inDCF fluorescence. Agents were infused for durations indicated (bars) in theabsence (D) and presence (E) of mAbs E-20 (10 �g/ml) and RP-2 (3.5�g/ml). F, Concentration-dependent responses. �, p � 0.05 against highestconcentration. G, ROS production at different capillary locations. �, p �0.05 compared with branch-point. n � 5 capillaries.
7083The Journal of Immunology
by guest on June 13, 2013http://w
ww
.jimm
unol.org/D
ownloaded from
findings are consistent with these mechanisms in that depletingexternal Ca2� completely inhibited the arachidonate-induced ROSproduction, supporting the notion that Ca2� entry is critical for thisresponse.
Ca2� mobilization
At concentrations that induced equipotent Ca2�CYT increases (Fig.
3A), TNF-� and arachidonate activated distinctly different mech-anisms of Ca2� mobilization. First, TNF-� but not arachidonatereduced the fluorescence of fura 2FF. This TNF-� effect was abol-ished by blocking ER Ca2� release, consistent with the notion thatTNF-� causes InsP3-dependent Ca2� release from ER (6, 15).Second, TNF-� but not arachidonate increased Ca2�
MIT. Theseresults suggest that ER Ca2� release was critical for the Ca2�
MIT
increase in support of the view that the spatial proximity of ER andmitochondria facilitates Ca2� mobilization between these com-partments (34). Third, depletion of external Ca2� blocked theCa2�
CYT response to TNF-� only partially, but that to arachido-nate completely. We interpret from these findings that store de-pletion followed by CCE accounted for the TNF-�-inducedCa2�
CYT increases, while those for arachidonate were entirely at-tributable to influx of external Ca2�.
Mitochondria regulate Ca2�CYT by both importing and export-
ing Ca2� across the inner membrane by means of a uniporter anda Na�/Ca2� exchanger, respectively (5, 35). In several cell types(35, 36), the net effect is to buffer increases in Ca2�
CYT andthereby, negatively regulate aspects of Ca2�
CYT-dependent cellfunction, as for example, catecholamine secretion in chromaffincells (36). Mitochondrial buffering is revealed by inhibitingCa2�
MIT uptake that augments induced Ca2�CYT increases (5, 35,
36). By contrast, in our experiments, blockade of Ca2�MIT uptake
by FCCP did not modify concomitant TNF-�-induced Ca2�CYT
increases, indicating the absence of a detectable mitochondrialbuffering effect.
Spatial patterning
The ER and mitochondrial distributions were regionally coupled inthese capillaries in that fluorescence for both localized dominantlyat branch point EC. TNF-�’s effects being mitochondria-depen-dent localized to branch point EC. However, arachidonate’s effectsbeing mitochondria-independent were not subject to similar spatial
FIGURE 9. NO production in EC of lung capillaries. A, Traces showrepresentative responses of NO indicator, DAF2 to SNAP (SN) (top pan-els) and TNF-� (TNF) (bottom panels) (each response replicated threetimes). Concentrations of SNAP and TNF-� as indicated on traces wereinfused for the durations indicated (bars) in the absence or presence ofL-NAME (LN; 100 �M). Bars show DAF2 (B) and ROS (C) responses asmean � SE for three experiments each. �, p � 0.05, significantly differentfrom baseline. Concentrations in C and D are: SN (100 �M); TNF (200ng/ml); arachidonate (AA; 10 �M); LN (100 �M); PTIO (PT; 100 �M).
FIGURE 8. Inhibition of ROS production. Effects of the antioxidant trolox (TR) are shown on ROS production (A) and increases in Ca2�CYT and
Ca2�MIT (B) by TNF-� (TNF; 200 ng/ml) and arachidonate (AA; 10 �M). �, p � 0.05 compared with responses without TR. C, TNF-�- and arachidonate-
induced ROS responses in the presence of mitochondrial inhibitors rotenone (RO; 1 �M), FCCP (FC; 1 �M), and antimycin (AN; 1 �g/ml). �, p � 0.05compared with responses without inhibitor. Mean � SE. n � number of experiments.
7084 MITOCHONDRIA REGULATE LUNG P-SELECTIN
by guest on June 13, 2013http://w
ww
.jimm
unol.org/D
ownloaded from
constraints. Evidently, EC mitochondrial density spatially pat-terned the capillary’s proinflammatory response to TNF-�. Al-though both arachidonate and TNF-� induced Ca2� influx, non-mitochondrial ROS were activated by external Ca2� entryattributable to arachidonate, but not by the influx resulting fromTNF-�-induced CCE. This differential response indicates that sig-naling pathways to ROS production are partitioned by not just anincrease of Ca2�
CYT, but by the mechanism of Ca2� mobilization.Two classes of Ca2�-dependent agonists may exist, namely thosethat recruit ER-mitochondrial mechanisms, and those that favordirect Ca2� entry, as exemplified in this study by TNF-� and ara-chidonate, respectively. However, the extent to which these sepa-rate strategies of Ca2� mobilization, hence of spatial patterning, applyto other inflammatory agonists requires further consideration.
P-selectin
Our finding that TNF-� causes P-selectin expression in lung venu-lar capillaries is similar to the TNF-� response in systemic venules(37). In addition, TNF-� increases P-selectin expression in humanpulmonary microvascular EC (38) and in HUVEC (39), but not inhuman pulmonary artery or dermal EC (38). Our findings togetherwith these reports, indicate that in lung, TNF-�-induced P-selectinexpression may be restricted to microvascular EC (38) and that theexpression may be an early event that is not detectable after severalhours of TNF-� exposure (40). In EC derived from large vessels,TNF-� exposure for several hours causes expression of E-selectinand ICAM-1 by inducing ROS-mediated increase in gene expres-sion of these molecules (41, 42). Taking these findings togetherwith ours, we suggest that TNF-�-induced ROS enable EC ex-pressions of different leukocyte adhesion receptors in a time-de-pendent manner, such that P-selectin exocytosis occurs immedi-ately, while E-selectin and ICAM-1 expressions are induced atlater time points.
In conclusion, our findings with TNF-� reveal the new insightthat in EC, mitochondrial ROS may act as diffusible messengers toinduce proinflammatory signaling. Previously, mitochondrial ROShave been implicated in signaling related to gene transcription(43), hypoxic pulmonary vasoconstriction (44), insulin secretion(45), and platelet aggregation (46). The present branch point dom-inant proinflammatory response to TNF-� may reflect a mecha-nism that protects capillary midsegments from deleterious inflam-matory effects that could interfere with gas exchange and reduceblood flow. By contrast, the spatially extensive effects of arachid-onate may exemplify the pattern of a more fulminant response.These considerations may be relevant to understanding the extentto which the spatial profile of vascular inflammation determineslung injury.
References1. Kuebler, W. M., X. Ying, B. Singh, A. Issekutz, and J. Bhattacharya. 1999.
Pressure is proinflammatory in lung venular capillaries. J. Clin. Invest. 104:495.2. Kuebler, W. M., K. Parthasarathi, P. M. Wang, and J. Bhattacharya. 2000. A
novel signaling mechanism between gas and blood compartments of the lung.J. Clin. Invest. 105:905.
3. Shuttleworth, T. J. 1996. Arachidonic acid activates the noncapacitative entry ofCa2� during [Ca2�]i oscillations. J. Biol. Chem. 271:21720.
FIGURE 11. Effects of inhibiting Ca2� mobilization in EC of lung cap-illaries. Effects of TNF-� (TNF; 200 ng/ml) and arachidonate (AA; 10 �M)on ROS (A) and P-selectin expression (B) in the presence of infusions ofthe Ca2�-chelator BAPTA (BA; 40 �M) and of Ca2�-depleted Ringer’ssolution containing 0.5 mM EGTA (Ca(�)). Mean � SE. �, p � 0.05compared with responses without inhibitors. n � number of capillaries.
FIGURE 10. P-selectin expression in lung capillaries. A–C, Images show residual fluorescence of a capillary infused with a P-selectin Ab (RP-2; 3.5�g/ml) followed by an Alexa Fluor-488-conjugated secondary Ab (2 �g/ml). Panels show capillary fluorescence in response to infusions of vehicle (A),TNF-� (TNF; 200 ng/ml) (B), and arachidonate (AA; 10 �M) (C). Intensity code indicates gray levels. Dashed lines indicate capillary margins. Branchpoint (arrowhead) and midsegmental (arrow) capillary locations are indicated. Replicated seven times. D, Responses are fluorescence increases above thatof vehicle-infused capillaries (baseline). Agonist responses were paired. TNF, 200 ng/ml; AA, 10 �M; rotenone (RO; 1 �M); FCCP (FC; 1 �M); trolox(TR; 2 mM); infusion of secondary Ab (2y; 2 �g/ml) alone. �, p � 0.05 compared with responses without inhibitors. Mean � SE. n � number ofexperiments.
7085The Journal of Immunology
by guest on June 13, 2013http://w
ww
.jimm
unol.org/D
ownloaded from
4. Collins, T. J., P. Lipp, M. J. Berridge, and M. D. Bootman. 2001. MitochondrialCa2� uptake depends on the spatial and temporal profile of cytosolic Ca2� sig-nals. J. Biol. Chem. 276:26411.
5. Colegrove, S. L., M. Albrecht, and D. D. Friel. 2000. Dissection of mitochondrialCa2� uptake and release fluxes in situ after depolarization-evoked [Ca2�]i ele-vations in sympathetic neurons. J. Gen. Physiol. 115:351.
6. Murphy, H. S., J. Shayman, G. Till, M. Mahrougui, C. Owens, U. Ryan, andP. A. Ward. 1992. Superoxide responses of endothelial cells to C5a and TNF�:divergent signal transduction pathways. Am. J. Physiol. 263:L51.
7. Ying, X., Y. Minamiya, C. Fu, and J. Bhattacharya. 1996. Ca2� waves in lungcapillary endothelium. Circ. Res. 79:898.
8. Babcock, D. F., J. Herrington, P. Goodwin, T. Park, and B. Hille. 1997. Mito-chondrial participation in the intracellular Ca2� network. J. Cell Biol. 136:833.
9. Tsukada, H., X. Ying, C. Fu, S. Ishikawa, P. McKeown-Longo, S. Albelda,S. Bhattacharya, B. Bray, and J. Bhattacharya. 1995. Ligation of endothelial �v�3
integrin increases capillary hydraulic conductivity of rat lung. Circ. Res. 77:651.10. Poot, M., Y. Zhang, J. Kramer, K. Wells, L. Jones, D. Hanzel, A. Lugade,
V. Singer, and R. Haugland. 1996. Analysis of mitochondrial morphology andfunction with novel fixable fluorescent stains. J. Histochem. Cytochem. 44:1363.
11. Sedova, M., and L. A. Blatter. 2000. Intracellular sodium modulates mitochon-drial calcium signaling in vascular endothelial cells. J. Biol. Chem. 275:35402.
12. Gonzalez, A., I. Schulz, and A. Schmid. 2000. Agonist-evoked mitochondrialCa2� signals in mouse pancreatic acinar cells. J. Biol. Chem. 275:38680.
13. Schaloske, R., C. Schlatterer, and D. Malchow. 2000. A xestospongin C-sensitiveCa2� store is required cAMP-induced Ca2� influx and cAMP oscillations inDictyostelium. J. Biol. Chem. 275:8404.
14. Pfeiffer, F., L. Sternfeld, A. Schmid, and I. Schulz. 1998. Control of Ca2� wavepropagation in mouse pancreatic acinar cells. Am. J. Physiol. 274:C663.
15. Bouchelouche, P. N., K. Bendtzen, S. Bak, and O. H. Nielsen. 1990. Recombi-nant human tumour necrosis factor increases cytosolic free calcium in murinefibroblasts and stimulates inositol phosphate formation in L-M and arachidonicacid release in 3T3 cells. Cell. Signal. 2:479.
16. Golovina, V. A., and M. P. Blaustein. 1997. Spatially and functionally distinctCa2� stores in sarcoplasmic and endoplasmic reticulum. Science 275:1643.
17. Duranteau, J., N. Chandel, A. Kulisz, Z. Shao, and P. T. Schumacker. 1998.Intracellular signaling by reactive oxygen species during hypoxia in cardiomyo-cytes. J. Biol. Chem. 273:11619.
18. Schulze-Osthoff, K., A. Bakker, B. Vanhaesebroeck, R. Beyaert, W. Jacob, andW. Fiers. 1992. Cytotoxic activity of tumor necrosis factor is mediated by earlydamage of mitochondrial functions: evidence for the involvement of mitochon-drial radical generation. J. Biol. Chem. 267:5317.
19. Bove, K., P. Neumann, N. Gertzberg, and A. Johnson. 2001. Role of ecNOS-derived NO in mediating TNF�-induced endothelial barrier dysfunction.Am. J. Physiol. Lung Cell. Mol. Physiol. 80:L914.
20. Murrant, C. L., F. Andrade, and M. B. Reid. 1999. Exogenous reactive oxygenand nitric oxide alter intracellular oxidant status of skeletal muscle fibres. ActaPhysiol. Scand. 166:111.
21. Espey, M. G., K. Miranda, D. Thomas, and D. A. Wink. 2001. Distinction be-tween nitrosating mechanisms within human cells and aqueous solution. J. Biol.Chem. 276:30085.
22. Moreno-Sanchez, R. 1985. Regulation of oxidative phosphorylation in mitochon-dria by external free Ca2� concentrations. J. Biol. Chem. 260:4028.
23. Corda, S., C. Laplace, E. Vicaut, and J. Duranteau. 2001. Rapid reactive oxygenspecies production by mitochondria in endothelial cells exposed to tumor necrosisfactor-� is mediated by ceramide. Am. J. Respir. Cell Mol. Biol. 24:762.
24. Frey, R. S., A. Rahman, J. Kefer, R. Minshall, and A. B. Malik. 2002. PKC�regulates TNF-�-induced activation of NADPH oxidase in endothelial cells. Circ.Res. 90:1012.
25. Rogers, R. J., J. Monnier, and H. S. Nick. 2001. Tumor necrosis factor-� selec-tively induces MnSOD expression via mitochondria-to-nucleus signaling,whereas interleukin-1� utilizes an alternative pathway. J. Biol. Chem. 276:20419.
26. Sanchez-Alcazar, J. A., E. Schneider, M. Martinez, P. Carmona,I. Hernandez-Munoz, E. Siles, P. Torre, J. Ruiz-Cabello, I. Garcia, andJ. A. Solis-Herruzo. 2000. Tumor necrosis factor-� increases the steady-statereduction of cytochrome b of the mitochondrial respiratory chain in metabolicallyinhibited L929 cells. J. Biol. Chem. 275:13353.
27. Sattler, M., S. Verma, G. Shrikhande, C. Byrne, Y. Pride, T. Winkler,E. Greenfield, R. Salgia, and J. D. Griffin. 2000. The BCR/ABL tyrosine kinaseinduces production of reactive oxygen species in hematopoietic cells. J. Biol.Chem. 275:24273.
28. Jin, Y. J., J. Friedman, and S. J. Burakoff. 1998. Regulation of tyrosine phos-phorylation in isolated T cell membrane by inhibition of protein tyrosine phos-phatases. J. Immunol. 161:1743.
29. Mocsai, A., Z. Jakus, T. Vantus, G. Berton, C. Lowell, and E. Ligeti. 2000.Kinase pathways in chemoattractant-induced degranulation of neutrophils: therole of p38 mitogen-activated protein kinase activated by Src family kinases.J. Immunol. 164:4321.
30. Zhang, J., M. Billingsley, R. Kincaid, and R. P Siraganian. 2000. Phosphorylationof Syk activation loop tyrosines is essential for Syk function: an in vivo studyusing a specific anti-Syk activation loop phosphotyrosine antibody. J. Biol. Chem.275:35442.
31. Shiose, A., and H. Sumimoto. 2000. Arachidonic acid and phosphorylation syn-ergistically induce a conformational change of p47phox to activate the phagocyteNADPH oxidase. J. Biol. Chem. 275:13793.
32. Cherny, V. V., L. Henderson, W. Xu, L. Thomas, and T. E. DeCoursey. 2001.Activation of NADPH oxidase-related proton and electron currents in humaneosinophils by arachidonic acid. J. Physiol. 535:783.
33. Watson, F., L. Gasmi, and S. W. Edwards. 1997. Stimulation of intracellularCa2� levels in human neutrophils by soluble immune complexes: functional ac-tivation of Fc�RIIIb during priming. J. Biol. Chem. 272:17944.
34. Rizzuto, R., P. Pinton, W. Carrington, F. Fay, K. Fogarty, L. Lifshitz, R. Tuft, andT. Pozzan. 1998. Close contacts with the endoplasmic reticulum as determinantsof mitochondrial Ca2� responses. Science 280:1763.
35. Kaftan, E. J., T. Xu, R. Abercrombie, and B. Hille. 2000. Mitochondria shapehormonally induced cytoplasmic calcium oscillations and modulate exocytosis.J. Biol. Chem. 275:25465.
36. Montero, M., M. Alonso, E. Carnicero, I. Cuchillo-Ibanez, A. Albillos, A. Garcia,J. Garcia-Sancho, and J. Alvarez. 2000. Chromaffin-cell stimulation triggers fastmillimolar mitochondrial Ca2� transients that modulate secretion. Nat. Cell Biol.2:57.
37. Piccio, L., B. Rossi, E. Scarpini, C. Laudanna, C. Giagulli, A. Issekutz,D. Vestweber, E. Butcher, and G. Constantin. 2002. Molecular mechanisms in-volved in lymphocyte recruitment in inflamed brain microvessels: critical rolesfor P-selectin glycoprotein ligand-1 and heterotrimeric Gi-linked receptors. J. Im-munol. 168:1940.
38. Shen, J., R. Ham, and S. Karmiol. 1995. Expression of adhesion molecules incultured human pulmonary microvascular endothelial cells. Microvasc. Res. 50:360.
39. Bahra, P. S., G. Rainger, J. Wautier, and G. B. Nash. 2001. Effects of pentoxi-fylline on the different steps during adhesion and transendothelial migration offlowing neutrophils. Cell Biochem. Funct. 19:249.
40. Raab, M., H. Daxecker, S. Markovic, A. Karimi, A. Griesmacher, andM. M. Mueller. 2002. Variation of adhesion molecule expression on human um-bilical vein endothelial cells upon multiple cytokine application. Clin. Chim. Acta321:11.
41. Rahman, A., J. Kefer, M. Bando, W. Niles, and A. B. Malik. 1998. E-selectinexpression in human endothelial cells by TNF�-induced oxidant generation andNF-�B activation. Am. J. Physiol. 275:L533.
42. Chen, K. H., L. Reece, and J. F. Leary. 1999. Mitochondrial glutathione modu-lates TNF�-induced endothelial cell dysfunction. Free Radic. Biol. Med. 27:100.
43. Quillet-Mary, A., J. Jaffrezou, V. Mansat, C. Bordier, J. Naval, and G. Laurent.1997. Implication of mitochondrial hydrogen peroxide generation in ceramide-induced apoptosis. J. Biol. Chem. 272:21388.
44. Waypa, G. B., N. Chandel, and P. T. Schumacker. 2001. Model for hypoxicpulmonary vasoconstriction involving mitochondrial oxygen sensing. Circ. Res.88:1259.
45. Maechler, P., L. Jornot, and C. B. Wollheim. 1999. Hydrogen peroxide altersmitochondrial activation and insulin secretion in pancreatic � cells. J. Biol. Chem.274:27905.
46. Yamagishi, S. I., D. Edelstein, X. Du, and M. Brownlee. 2001. Hyperglycemiapotentiates collagen-induced platelet activation through mitochondrial superoxideoverproduction. Diabetes 50:1491.
7086 MITOCHONDRIA REGULATE LUNG P-SELECTIN
by guest on June 13, 2013http://w
ww
.jimm
unol.org/D
ownloaded from


![Preparation and characterization of p-tert-butylcalix[8]arene bonded capillaries for open-tubular capillary electrochromatography](https://img.pdfslide.net/doc/110x75/63474aa3494dcf875e045881/preparation-and-characterization-of-p-tert-butylcalix8arene-bonded-capillaries.jpg)


