Embed Size (px)
Citation preview
Antonio Jarquin LagunaOffshore Engineering Section,
Delft University of Technology,
Delft 2628CN, The Netherlands
e-mail: [email protected]
Modeling and Analysisof an Offshore Wind TurbineWith Fluid Power Transmissionfor Centralized ElectricityGenerationThis paper presents a mathematical model of an innovative offshore wind turbine withfluid power transmission. The proposed concept is a variable-speed, pitch controlled tur-bine which differs from conventional technology by using fluid power technology as amedium to transfer the energy from the wind. The final aim is to use several turbines tocentralize electricity generation. Unlike conventional variable speed concepts, the pro-posed turbine comprises a passive-torque control method which allows the turbine tooperate at optimal aerodynamic performance for different wind speeds. A numericalmodel of a single turbine is developed and time-domain simulations are used to analyzethe dynamic response of the different operational parameters to a turbulent wind speedinput. The results are compared with those of a reference offshore wind turbine with simi-lar characteristics. It is shown that operation below rated wind speed with a passive con-trol is possible for a single turbine with a better dynamic performance than the referencein terms of transmission torque. However, the efficiency of the energy transmission isreduced throughout the operational range. The addition and simulation of more turbinesto the hydraulic network is necessary to determine to which extent the benefits of a cen-tralized wind farm compensate for the relatively lower efficiency.[DOI: 10.1115/1.4028110]
1 Introduction
Offshore wind has developed incrementally from onshore tur-bines being enlarged for offshore use. This has resulted in veryheavy machines, with large generators on top connected withpower electronics which are expensive and failure prone [1]. Tosupport these turbines, heavy structures need to be erected off-shore at significant cost. Furthermore, in a typical offshore windfarm an electrical-conversion system is used for the collection andtransmission of wind power. Different power-converter topologiesare used to interconnect the different turbines to a large utility or alocal grid [2]. Thus conversion system adds the use of severalcomponents like individual medium voltage transformers for col-lecting the power inside the wind farm, as well as high-powertransformers and electronics which also have to be taken intoaccount for efficiency and reliability of the entire farm [3].
The Delft offshore turbine (DOT) project considers a radicallynew concept for power transmission in an offshore wind farmusing pressurized seawater as power transmission medium. Theeventual goal of the DOT project is to make offshore wind a com-petitive source of energy by reducing complexity, mass, mainte-nance, and capital cost. With this in mind, a new transmissionconcept for wind farms was developed using a hydrostatic trans-mission for individual turbines and a seawater circuit as a hydrau-lic network for transmission. Using fluid power technology andremoving from the nacelle, the generator and power electronicslead to a significant reduction of the top mass of the individualnacelles. Details on the motivation and application of fluid powertransmissions for offshore wind turbines are found in Ref. [4].
This paper presents a numerical model of the proposed conceptand uses time-domain simulations to analyze the dynamic per-formance and behavior of a single turbine response under differentoperational conditions. The results are compared with those of areference offshore turbine [5]. The presented models can beimplemented and compiled into a dynamic link library file (DLL)which can be used by other simulation packages used for designand certification such as HAWC2 or GH Bladed [6,7]. The imple-mentation of such models through an external DLL file has beenpreviously done for fluid power drivetrains in Ref. [8]. In Sec. 2, adescription of the main components and working principle of theproposed concept is explained. In Sec. 3, a mathematical model ofthe different subsystems is described and the control strategy ispresented in Sec. 4. Time-domain simulations are performed inSec. 5. Finally, the conclusions are presented in Sec. 6.
2 System Description
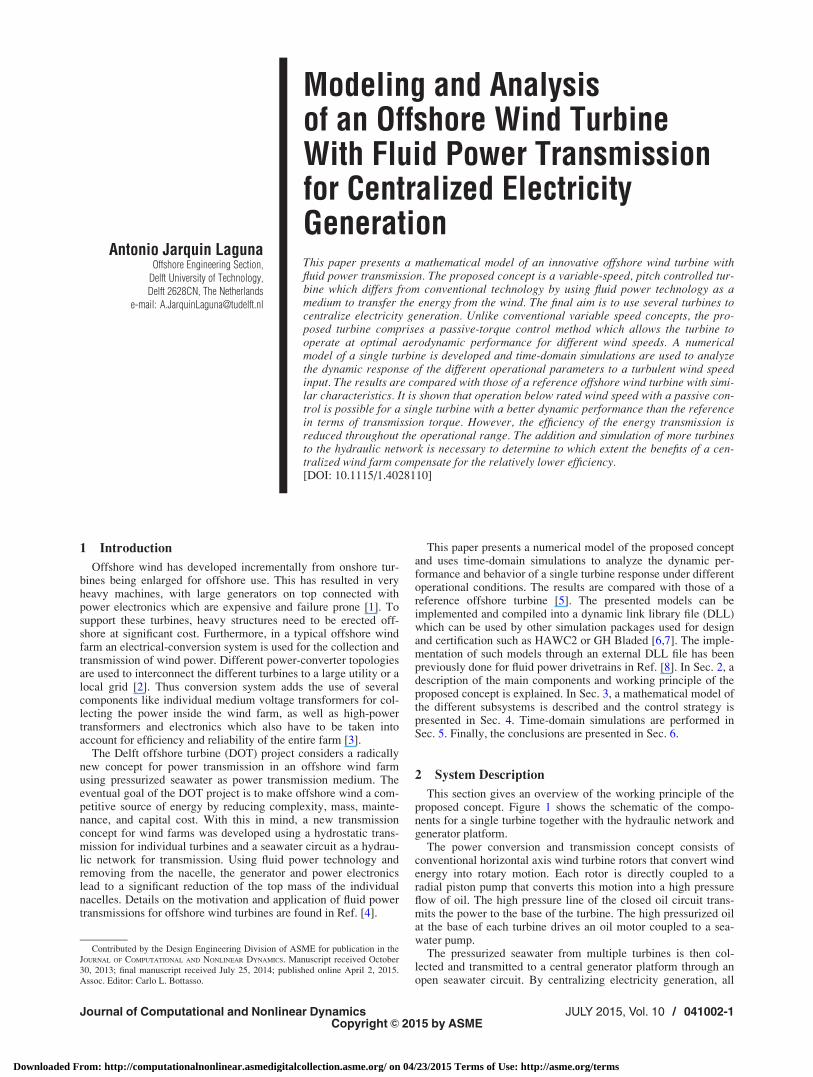
This section gives an overview of the working principle of theproposed concept. Figure 1 shows the schematic of the compo-nents for a single turbine together with the hydraulic network andgenerator platform.
The power conversion and transmission concept consists ofconventional horizontal axis wind turbine rotors that convert windenergy into rotary motion. Each rotor is directly coupled to aradial piston pump that converts this motion into a high pressureflow of oil. The high pressure line of the closed oil circuit trans-mits the power to the base of the turbine. The high pressurized oilat the base of each turbine drives an oil motor coupled to a sea-water pump.
The pressurized seawater from multiple turbines is then col-lected and transmitted to a central generator platform through anopen seawater circuit. By centralizing electricity generation, all
Contributed by the Design Engineering Division of ASME for publication in theJOURNAL OF COMPUTATIONAL AND NONLINEAR DYNAMICS. Manuscript received October30, 2013; final manuscript received July 25, 2014; published online April 2, 2015.Assoc. Editor: Carlo L. Bottasso.
Journal of Computational and Nonlinear Dynamics JULY 2015, Vol. 10 / 041002-1Copyright VC 2015 by ASME
Downloaded From: http://computationalnonlinear.asmedigitalcollection.asme.org/ on 04/23/2015 Terms of Use: http://asme.org/terms
the individual generators and power electronics from single tur-bines are replaced with a few high rated generators, hence lookingat the wind farm as a central power plant. The flow of high pres-sure water is finally converted into electricity via a Pelton wheelturbine. It is important to mention that the pressurized water goesthrough one or more nozzles and is converted into a high velocitywater jet before reaching the Pelton wheel; therefore, it allows tohave a physically decoupled system between the individual windturbines and the hydraulic network from the Pelton wheel andgenerator at the grid side. In case of an off-grid situation the waterjets are deflected from the hydraulic turbine, while the wind tur-bine still operates under normal operational conditions. The abovementioned characteristic has several advantages for the individualturbines and the hydraulic network since they are not affected byelectrical disturbances. These electrical disturbances impose sev-eral difficulties with current wind farms, specially in complyingwith grid-fault ride-through requirements [9].
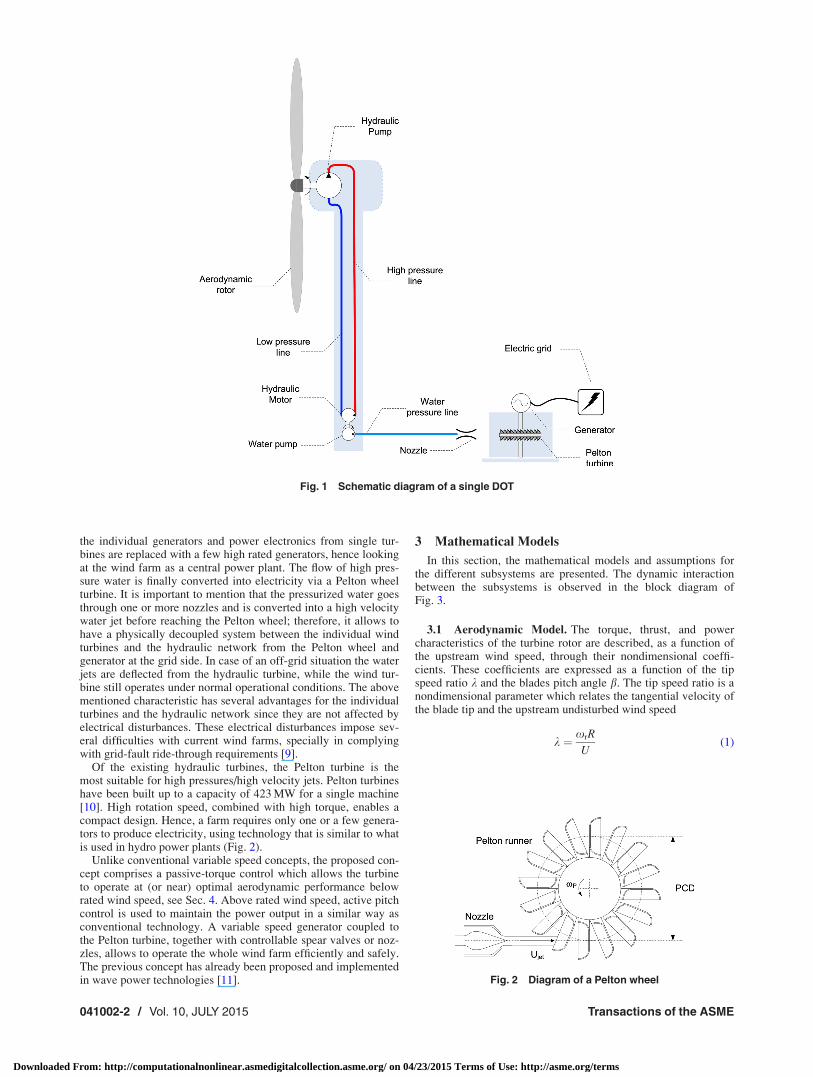
Of the existing hydraulic turbines, the Pelton turbine is themost suitable for high pressures/high velocity jets. Pelton turbineshave been built up to a capacity of 423 MW for a single machine[10]. High rotation speed, combined with high torque, enables acompact design. Hence, a farm requires only one or a few genera-tors to produce electricity, using technology that is similar to whatis used in hydro power plants (Fig. 2).
Unlike conventional variable speed concepts, the proposed con-cept comprises a passive-torque control which allows the turbineto operate at (or near) optimal aerodynamic performance belowrated wind speed, see Sec. 4. Above rated wind speed, active pitchcontrol is used to maintain the power output in a similar way asconventional technology. A variable speed generator coupled tothe Pelton turbine, together with controllable spear valves or noz-zles, allows to operate the whole wind farm efficiently and safely.The previous concept has already been proposed and implementedin wave power technologies [11].
3 Mathematical Models
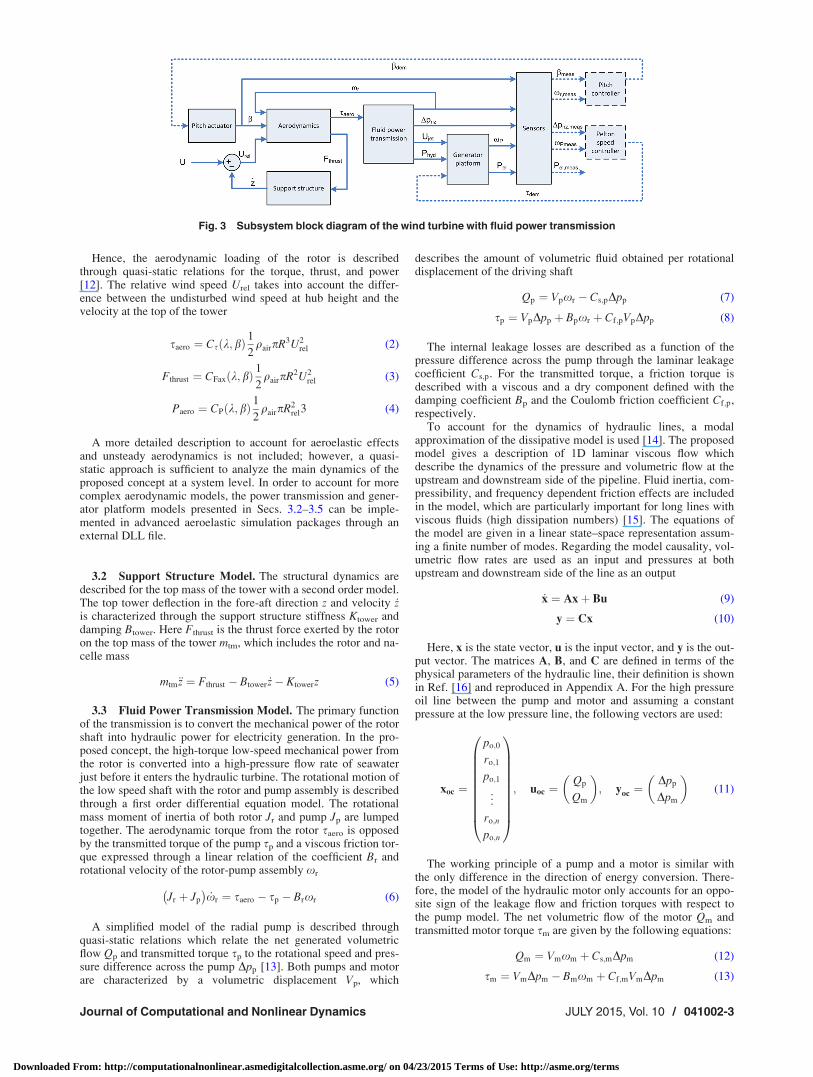
In this section, the mathematical models and assumptions forthe different subsystems are presented. The dynamic interactionbetween the subsystems is observed in the block diagram ofFig. 3.
3.1 Aerodynamic Model. The torque, thrust, and powercharacteristics of the turbine rotor are described, as a function ofthe upstream wind speed, through their nondimensional coeffi-cients. These coefficients are expressed as a function of the tipspeed ratio k and the blades pitch angle b. The tip speed ratio is anondimensional parameter which relates the tangential velocity ofthe blade tip and the upstream undisturbed wind speed
k ¼ xrR
U(1)
Fig. 1 Schematic diagram of a single DOT
Fig. 2 Diagram of a Pelton wheel
041002-2 / Vol. 10, JULY 2015 Transactions of the ASME
Downloaded From: http://computationalnonlinear.asmedigitalcollection.asme.org/ on 04/23/2015 Terms of Use: http://asme.org/terms
Hence, the aerodynamic loading of the rotor is describedthrough quasi-static relations for the torque, thrust, and power[12]. The relative wind speed Urel takes into account the differ-ence between the undisturbed wind speed at hub height and thevelocity at the top of the tower
saero ¼ Csðk;bÞ1
2qairpR3U2
rel (2)
Fthrust ¼ CFaxðk; bÞ1
2qairpR2U2
rel (3)
Paero ¼ CPðk;bÞ1
2qairpR2
rel3 (4)
A more detailed description to account for aeroelastic effectsand unsteady aerodynamics is not included; however, a quasi-static approach is sufficient to analyze the main dynamics of theproposed concept at a system level. In order to account for morecomplex aerodynamic models, the power transmission and gener-ator platform models presented in Secs. 3.2–3.5 can be imple-mented in advanced aeroelastic simulation packages through anexternal DLL file.
3.2 Support Structure Model. The structural dynamics aredescribed for the top mass of the tower with a second order model.The top tower deflection in the fore-aft direction z and velocity _zis characterized through the support structure stiffness Ktower anddamping Btower. Here Fthrust is the thrust force exerted by the rotoron the top mass of the tower mtm, which includes the rotor and na-celle mass
mtm€z ¼ Fthrust � Btower _z� Ktowerz (5)
3.3 Fluid Power Transmission Model. The primary functionof the transmission is to convert the mechanical power of the rotorshaft into hydraulic power for electricity generation. In the pro-posed concept, the high-torque low-speed mechanical power fromthe rotor is converted into a high-pressure flow rate of seawaterjust before it enters the hydraulic turbine. The rotational motion ofthe low speed shaft with the rotor and pump assembly is describedthrough a first order differential equation model. The rotationalmass moment of inertia of both rotor Jr and pump Jp are lumpedtogether. The aerodynamic torque from the rotor saero is opposedby the transmitted torque of the pump sp and a viscous friction tor-que expressed through a linear relation of the coefficient Br androtational velocity of the rotor-pump assembly xr
Jr þ Jp
� �_xr ¼ saero � sp � Brxr (6)
A simplified model of the radial pump is described throughquasi-static relations which relate the net generated volumetricflow Qp and transmitted torque sp to the rotational speed and pres-sure difference across the pump Dpp [13]. Both pumps and motorare characterized by a volumetric displacement Vp, which
describes the amount of volumetric fluid obtained per rotationaldisplacement of the driving shaft
Qp ¼ Vpxr � Cs;pDpp (7)
sp ¼ VpDpp þ Bpxr þ Cf;pVpDpp (8)
The internal leakage losses are described as a function of thepressure difference across the pump through the laminar leakagecoefficient Cs;p. For the transmitted torque, a friction torque isdescribed with a viscous and a dry component defined with thedamping coefficient Bp and the Coulomb friction coefficient Cf;p,respectively.
To account for the dynamics of hydraulic lines, a modalapproximation of the dissipative model is used [14]. The proposedmodel gives a description of 1D laminar viscous flow whichdescribe the dynamics of the pressure and volumetric flow at theupstream and downstream side of the pipeline. Fluid inertia, com-pressibility, and frequency dependent friction effects are includedin the model, which are particularly important for long lines withviscous fluids (high dissipation numbers) [15]. The equations ofthe model are given in a linear state–space representation assum-ing a finite number of modes. Regarding the model causality, vol-umetric flow rates are used as an input and pressures at bothupstream and downstream side of the line as an output
_x ¼ Axþ Bu (9)
y ¼ Cx (10)
Here, x is the state vector, u is the input vector, and y is the out-put vector. The matrices A, B, and C are defined in terms of thephysical parameters of the hydraulic line, their definition is shownin Ref. [16] and reproduced in Appendix A. For the high pressureoil line between the pump and motor and assuming a constantpressure at the low pressure line, the following vectors are used:
xoc ¼
po;0
ro;1
po;1
..
.
ro;n
po;n
0BBBBBBBBB@
1CCCCCCCCCA; uoc ¼
Qp
Qm
� �; yoc ¼
Dpp
Dpm
� �(11)
The working principle of a pump and a motor is similar withthe only difference in the direction of energy conversion. There-fore, the model of the hydraulic motor only accounts for an oppo-site sign of the leakage flow and friction torques with respect tothe pump model. The net volumetric flow of the motor Qm andtransmitted motor torque sm are given by the following equations:
Qm ¼ Vmxm þ Cs;mDpm (12)
sm ¼ VmDpm � Bmxm þ Cf;mVmDpm (13)
Fig. 3 Subsystem block diagram of the wind turbine with fluid power transmission
Journal of Computational and Nonlinear Dynamics JULY 2015, Vol. 10 / 041002-3
Downloaded From: http://computationalnonlinear.asmedigitalcollection.asme.org/ on 04/23/2015 Terms of Use: http://asme.org/terms
At the hydraulic motor and water pump shaft, the rotationalvelocity of the assembly is also described with a first order differ-ential equation model considering the mass moments of inertias ofboth motor Jm and water pump Jwp, and their respective transmit-ted torques sm and swp
Jm þ Jwp
� �_xm ¼ sm � swp � Bmxm (14)
Similarly for the water pump, the volumetric flow Qwp andtransmitted torque swp are shown in the following equation:
Qwp ¼ Vwpxm � Cs;wpDpwp (15)
swp ¼ VwpDpwp þ Bwpxm þ Cf;wpVwpDpwp (16)
The open seawater circuit is simplified for a single turbine as anindividual hydraulic line which is modeled with Eqs. (9) and (10).In this case the state variables, inputs, and outputs are as follows:
xwc ¼
pw;0
rw;1
pw;1
..
.
rw;n
pw;n
0BBBBBBBBB@
1CCCCCCCCCA; uwc ¼
Qwp
Qnz
� �; ywc ¼
Dpwp
Dpnz
� �(17)
Finally, a first order orifice model by taking momentum equa-tion of fluid particle into account is used to describe the nozzle[16]. Here, Lnz is the nozzle length, Anz is the nozzle cross sec-tional area, and Cd is the discharge coefficient to account for pres-sure losses due to the geometry and flow regime at the nozzle exit.The seawater density is given by qsw and the volumetric flow andpressure across the nozzle is given by Qnz and Dpnz, respectively,
qsw_QnzLnz ¼ DpnzAnz �
qswQnzjQnzj2AnzC2
d
(18)
The hydraulic power at the nozzle Phyd is given by the productof the volumetric flow rate and the pressure of the seawater at thislocation. The water jet velocity Ujet is simply the volumetric flowrate divided by the cross sectional area and multiplied by a venacontracta coefficient Cv to account for the change in velocity im-mediately after the water jet exits the nozzle [17]
Phyd ¼ QnzDpnz (19)
Ujet ¼ Cv
Qnz
Anz
(20)
3.4 Generator Platform. Once the energy content of thewind is transferred into water jet(s), the kinetic energy is extractedfrom the water via a Pelton runner and delivered as rotationalenergy in the generator shaft. In this way centralized electricitygeneration takes place.
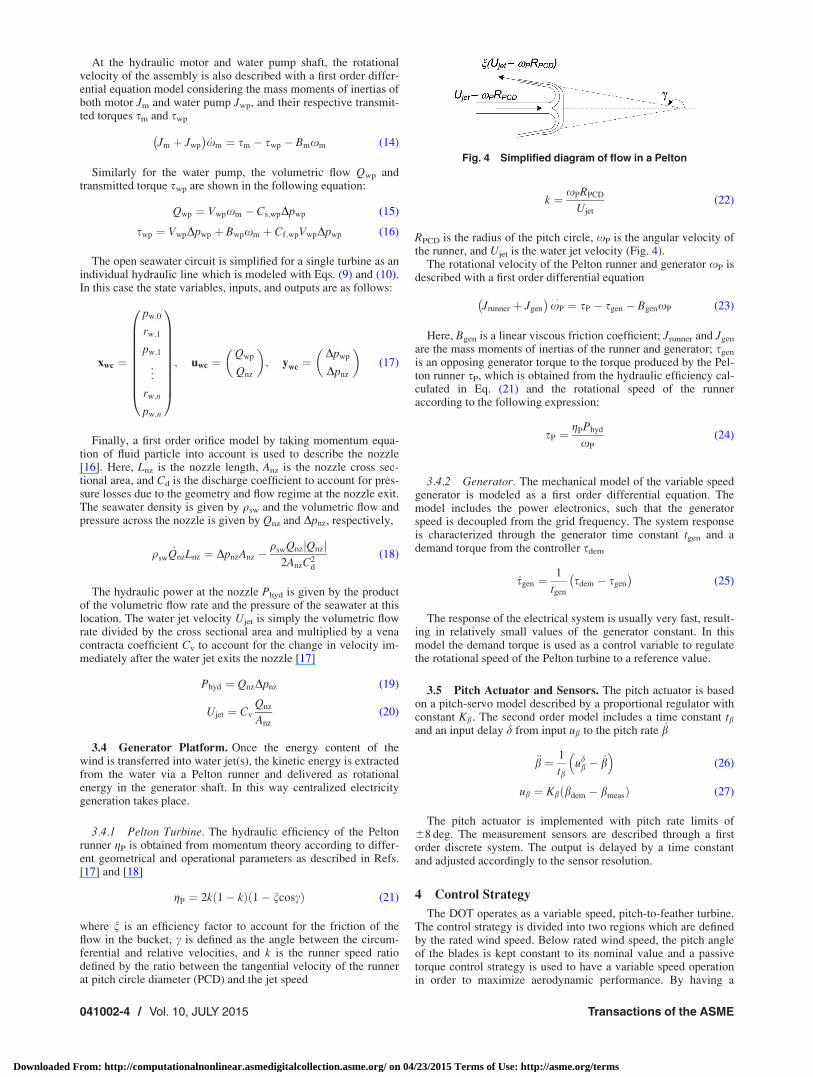
3.4.1 Pelton Turbine. The hydraulic efficiency of the Peltonrunner gP is obtained from momentum theory according to differ-ent geometrical and operational parameters as described in Refs.[17] and [18]
gP ¼ 2k 1� kð Þ 1� ncoscð Þ (21)
where n is an efficiency factor to account for the friction of theflow in the bucket, c is defined as the angle between the circum-ferential and relative velocities, and k is the runner speed ratiodefined by the ratio between the tangential velocity of the runnerat pitch circle diameter (PCD) and the jet speed
k ¼ xPRPCD
Ujet
(22)
RPCD is the radius of the pitch circle, xP is the angular velocity ofthe runner, and Ujet is the water jet velocity (Fig. 4).
The rotational velocity of the Pelton runner and generator xP isdescribed with a first order differential equation
Jrunner þ Jgen
� �xP� ¼ sP � sgen � BgenxP (23)
Here, Bgen is a linear viscous friction coefficient; Jrunner and Jgen
are the mass moments of inertias of the runner and generator; sgen
is an opposing generator torque to the torque produced by the Pel-ton runner sP, which is obtained from the hydraulic efficiency cal-culated in Eq. (21) and the rotational speed of the runneraccording to the following expression:
sP ¼gPPhyd
xP
(24)
3.4.2 Generator. The mechanical model of the variable speedgenerator is modeled as a first order differential equation. Themodel includes the power electronics, such that the generatorspeed is decoupled from the grid frequency. The system responseis characterized through the generator time constant tgen and ademand torque from the controller sdem
_sgen ¼1
tgen
sdem � sgen
� �(25)
The response of the electrical system is usually very fast, result-ing in relatively small values of the generator constant. In thismodel the demand torque is used as a control variable to regulatethe rotational speed of the Pelton turbine to a reference value.
3.5 Pitch Actuator and Sensors. The pitch actuator is basedon a pitch-servo model described by a proportional regulator withconstant Kb. The second order model includes a time constant tband an input delay d from input ub to the pitch rate _b
€b ¼ 1
tbud
b � _b� �
(26)
ub ¼ Kb bdem � bmeasð Þ (27)
The pitch actuator is implemented with pitch rate limits of68 deg. The measurement sensors are described through a firstorder discrete system. The output is delayed by a time constantand adjusted accordingly to the sensor resolution.
4 Control Strategy
The DOT operates as a variable speed, pitch-to-feather turbine.The control strategy is divided into two regions which are definedby the rated wind speed. Below rated wind speed, the pitch angleof the blades is kept constant to its nominal value and a passivetorque control strategy is used to have a variable speed operationin order to maximize aerodynamic performance. By having a
Fig. 4 Simplified diagram of flow in a Pelton
041002-4 / Vol. 10, JULY 2015 Transactions of the ASME
Downloaded From: http://computationalnonlinear.asmedigitalcollection.asme.org/ on 04/23/2015 Terms of Use: http://asme.org/terms
passive control, no active control actions are needed below ratedwind speed to adjust the rotor speed. On the other hand, for thegenerator platform, the velocity of the water jet at the nozzle ischanging. Therefore, in order to achieve a maximum efficiency ofthe system, the rotational speed of the Pelton runner should becontinuously adjusted to its optimal value depending on the waterinflow conditions. Above rated wind speed, the objective is tolimit the power capture at rated value by continuously adjustingthe pitch angle. This pitching strategy is the same as conventionalvariable-speed variable-pitch turbines [12].
4.1 Passive Torque Control. The main idea of a variablespeed wind turbine is that in order to operate at maximum aerody-namic performance, the rotor should be able to operate with a con-stant tip speed ratio where the maximum power coefficient Cp;max
is achieved for the required range of wind speeds. The optimalstatic relationship between the aerodynamic torque as a functionof the rotor speed is described with the following equation:
saero ¼CP
k3� 12� qair � pR5 � x2
r (28)
¼ K1 � x2r (29)
Regarding the fluid power transmission, let us consider theideal case where no friction, flow leakages, or pressure lossesoccur. In this case, the final torque transmitted by the pump to the
rotor is also expressed as a quadratic function of the rotor speedaccording to
sp ¼Vp
Vm
� �31
2� qsw �
V3wp
A2nz
� x2r (30)
¼ K2 � x2r (31)
By making equal the terms K1 and K2 from Eqs. (29) and (31),it is possible to match both curves by proper dimensioning of thecomponents given the aerodynamic performance of the rotor.Hence a passive control for variable speed operation is achieved.If all the different losses in the power transmission are included,the quadratic relation in Eq. (31) is no longer valid. However,deviations from the optimal quadratic relation are rather small ifcomponents are properly dimensioned based on the required char-acteristics and ranges of operation. An experimental validation ofthis concept is described in Ref. [19].
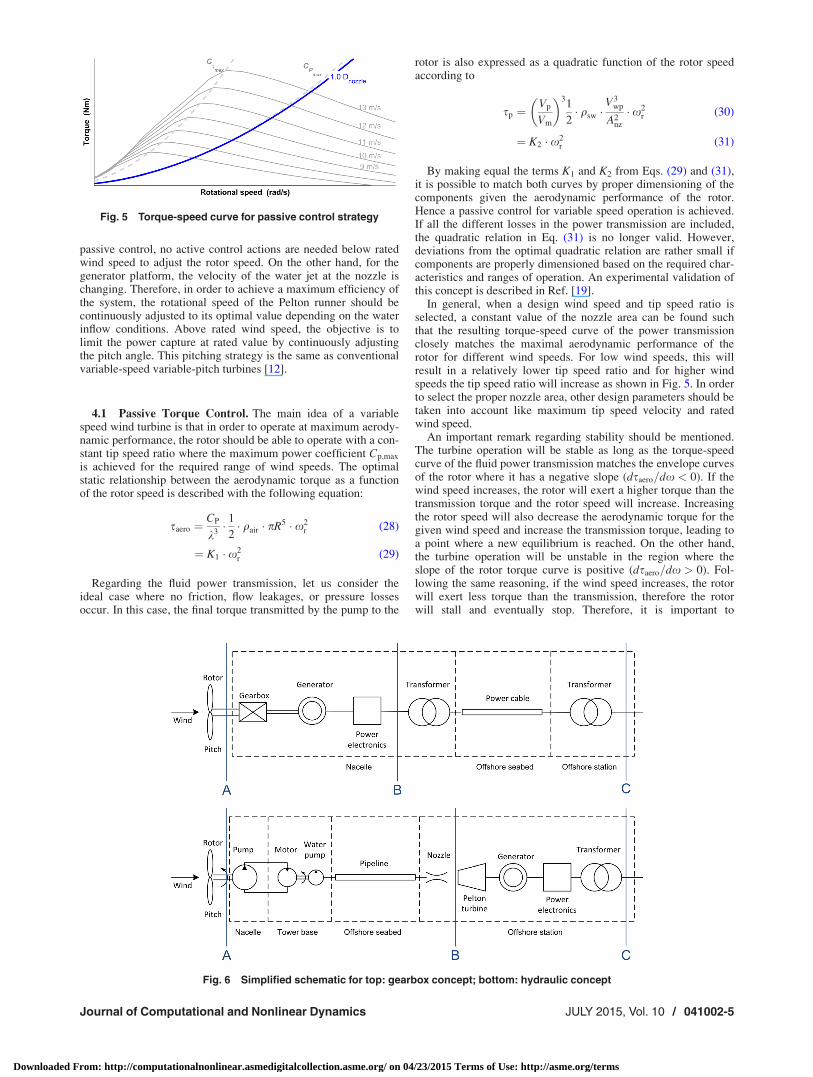
In general, when a design wind speed and tip speed ratio isselected, a constant value of the nozzle area can be found suchthat the resulting torque-speed curve of the power transmissionclosely matches the maximal aerodynamic performance of therotor for different wind speeds. For low wind speeds, this willresult in a relatively lower tip speed ratio and for higher windspeeds the tip speed ratio will increase as shown in Fig. 5. In orderto select the proper nozzle area, other design parameters should betaken into account like maximum tip speed velocity and ratedwind speed.
An important remark regarding stability should be mentioned.The turbine operation will be stable as long as the torque-speedcurve of the fluid power transmission matches the envelope curvesof the rotor where it has a negative slope (dsaero=dx < 0). If thewind speed increases, the rotor will exert a higher torque than thetransmission torque and the rotor speed will increase. Increasingthe rotor speed will also decrease the aerodynamic torque for thegiven wind speed and increase the transmission torque, leading toa point where a new equilibrium is reached. On the other hand,the turbine operation will be unstable in the region where theslope of the rotor torque curve is positive (dsaero=dx > 0). Fol-lowing the same reasoning, if the wind speed increases, the rotorwill exert less torque than the transmission, therefore the rotorwill stall and eventually stop. Therefore, it is important to
Fig. 5 Torque-speed curve for passive control strategy
Fig. 6 Simplified schematic for top: gearbox concept; bottom: hydraulic concept
Journal of Computational and Nonlinear Dynamics JULY 2015, Vol. 10 / 041002-5
Downloaded From: http://computationalnonlinear.asmedigitalcollection.asme.org/ on 04/23/2015 Terms of Use: http://asme.org/terms
correctly size the nozzle in order to operate in the stable region ofthe rotor.
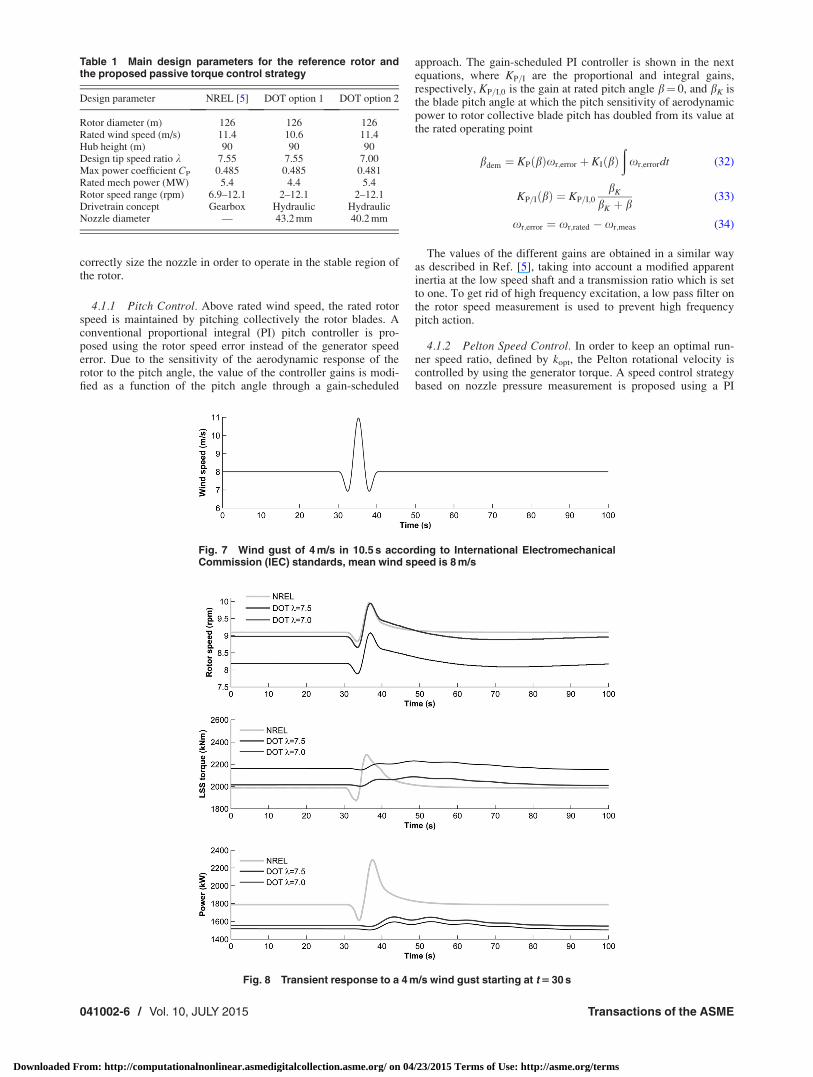
4.1.1 Pitch Control. Above rated wind speed, the rated rotorspeed is maintained by pitching collectively the rotor blades. Aconventional proportional integral (PI) pitch controller is pro-posed using the rotor speed error instead of the generator speederror. Due to the sensitivity of the aerodynamic response of therotor to the pitch angle, the value of the controller gains is modi-fied as a function of the pitch angle through a gain-scheduled
approach. The gain-scheduled PI controller is shown in the nextequations, where KP=I are the proportional and integral gains,respectively, KP=I;0 is the gain at rated pitch angle b¼ 0, and bK isthe blade pitch angle at which the pitch sensitivity of aerodynamicpower to rotor collective blade pitch has doubled from its value atthe rated operating point
bdem ¼ KP bð Þxr;error þ KI bð Þð
xr;errordt (32)
KP=I bð Þ ¼ KP=I;0bK
bK þ b(33)
xr;error ¼ xr;rated � xr;meas (34)
The values of the different gains are obtained in a similar wayas described in Ref. [5], taking into account a modified apparentinertia at the low speed shaft and a transmission ratio which is setto one. To get rid of high frequency excitation, a low pass filter onthe rotor speed measurement is used to prevent high frequencypitch action.
4.1.2 Pelton Speed Control. In order to keep an optimal run-ner speed ratio, defined by kopt, the Pelton rotational velocity iscontrolled by using the generator torque. A speed control strategybased on nozzle pressure measurement is proposed using a PI
Table 1 Main design parameters for the reference rotor andthe proposed passive torque control strategy
Design parameter NREL [5] DOT option 1 DOT option 2
Rotor diameter (m) 126 126 126Rated wind speed (m/s) 11.4 10.6 11.4Hub height (m) 90 90 90Design tip speed ratio k 7.55 7.55 7.00Max power coefficient CP 0.485 0.485 0.481Rated mech power (MW) 5.4 4.4 5.4Rotor speed range (rpm) 6.9–12.1 2–12.1 2–12.1Drivetrain concept Gearbox Hydraulic HydraulicNozzle diameter — 43.2 mm 40.2 mm
Fig. 7 Wind gust of 4 m/s in 10.5 s according to International ElectromechanicalCommission (IEC) standards, mean wind speed is 8 m/s
Fig. 8 Transient response to a 4 m/s wind gust starting at t 5 30 s
041002-6 / Vol. 10, JULY 2015 Transactions of the ASME
Downloaded From: http://computationalnonlinear.asmedigitalcollection.asme.org/ on 04/23/2015 Terms of Use: http://asme.org/terms
controller. From the measurement of the pressure difference at thenozzle exit, a maximum power point tracking is derived fromstatic relations based on Eqs. (18) and (22) to determine the refer-ence runner speed for maximum hydraulic efficiency. The optimalrunner speed ratio for maximum runner efficiency is derived fromEq. (21) and has a theoretical value of kopt¼ 0.5 [18]
xP;ref ¼kopt
RPCD
CvCd
ffiffiffiffiffiffiffiffiffiffiffiffiffiffiffiffiffiffiffiffiffiffi2jDpnz;measj
qsw
s(35)
The PI controller for the Pelton runner speed is given by
sdem ¼ KPxP;error þ KI
ðxP;errordt (36)
xP;error ¼ xP;ref � xP;meas (37)
A low pass filter applied to the pressure measurement at thenozzle is also used to get rid of high frequency excitation due topressure transients.
5 Time Domain Simulations
In this section, results of the time domain simulations are pre-sented for an operational extreme gust and for 10 min of turbulent
wind speed input at both below and above rated conditions. Theresults show the operational response of the NREL baseline model[5], which comprises a gearbox, and two different design optionsof the hydraulic concept where the same rotor is coupled to thefluid power transmission and generator platform described inSecs. 3 and 4. Electrical efficiencies for the transformers andpower cables were derived from Ref. [3]. A simplified schematicfor the overall conversion system of both reference and hydraulicconcept is shown in Fig. 6, where A, B, and C are the points usedfor performance comparison in Secs. 5.1–5.3.
Using the rotor characteristics of the NREL 5 MW, a nozzle areais chosen in the first design option to optimize power capture at atip speed ratio of k ¼ 7:55. In this case the maximum tip speed of80m=s is reached at a wind speed of around 10:6m=s which definesthe rated wind speed using the passive control strategy. Thus, therated power is limited to the values obtained at the reduced ratedwind speed but with maximum aerodynamic performance belowthis value. For the second design, a smaller nozzle area is chosensuch that a tip speed ratio of k ¼ 7:0 is reached at the same maxi-mum tip speed of 80m=s. Under this conditions the rated windspeed is matched with that of the baseline at a value 11:4m=s. Inthe other case, the aerodynamic efficiency is slightly reduced froma maximum of CP ¼ 0:485 to a value of CP ¼ 0:481, but with anoverall increase in power capture at rated conditions which is thesame as the reference rotor as shown in Table 1.
Fig. 9 Hub height wind speed of 8 m/s with 17.67% TI
Fig. 10 Transient response operation below rated wind speed
Journal of Computational and Nonlinear Dynamics JULY 2015, Vol. 10 / 041002-7
Downloaded From: http://computationalnonlinear.asmedigitalcollection.asme.org/ on 04/23/2015 Terms of Use: http://asme.org/terms
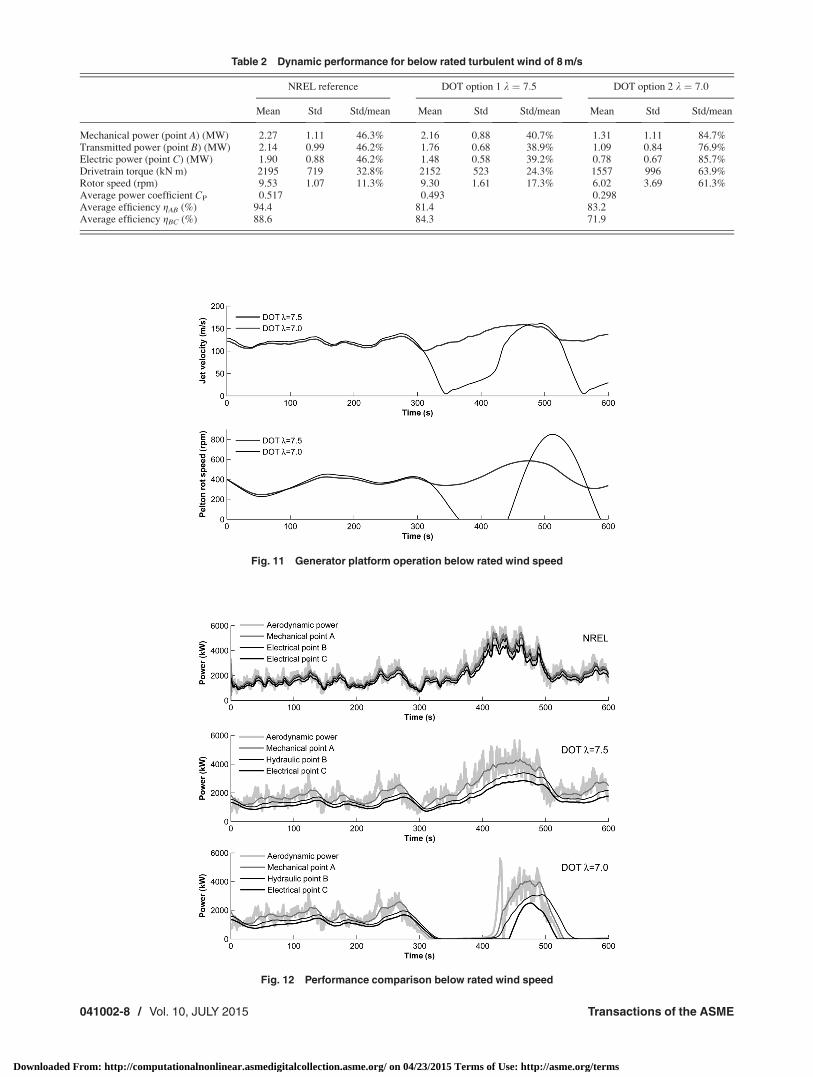
Table 2 Dynamic performance for below rated turbulent wind of 8 m/s
NREL reference DOT option 1 k ¼ 7:5 DOT option 2 k ¼ 7:0
Mean Std Std/mean Mean Std Std/mean Mean Std Std/mean
Mechanical power (point A) (MW) 2.27 1.11 46.3% 2.16 0.88 40.7% 1.31 1.11 84.7%Transmitted power (point B) (MW) 2.14 0.99 46.2% 1.76 0.68 38.9% 1.09 0.84 76.9%Electric power (point C) (MW) 1.90 0.88 46.2% 1.48 0.58 39.2% 0.78 0.67 85.7%Drivetrain torque (kN m) 2195 719 32.8% 2152 523 24.3% 1557 996 63.9%Rotor speed (rpm) 9.53 1.07 11.3% 9.30 1.61 17.3% 6.02 3.69 61.3%Average power coefficient CP 0.517 0.493 0.298Average efficiency gAB (%) 94.4 81.4 83.2Average efficiency gBC (%) 88.6 84.3 71.9
Fig. 11 Generator platform operation below rated wind speed
Fig. 12 Performance comparison below rated wind speed
041002-8 / Vol. 10, JULY 2015 Transactions of the ASME
Downloaded From: http://computationalnonlinear.asmedigitalcollection.asme.org/ on 04/23/2015 Terms of Use: http://asme.org/terms
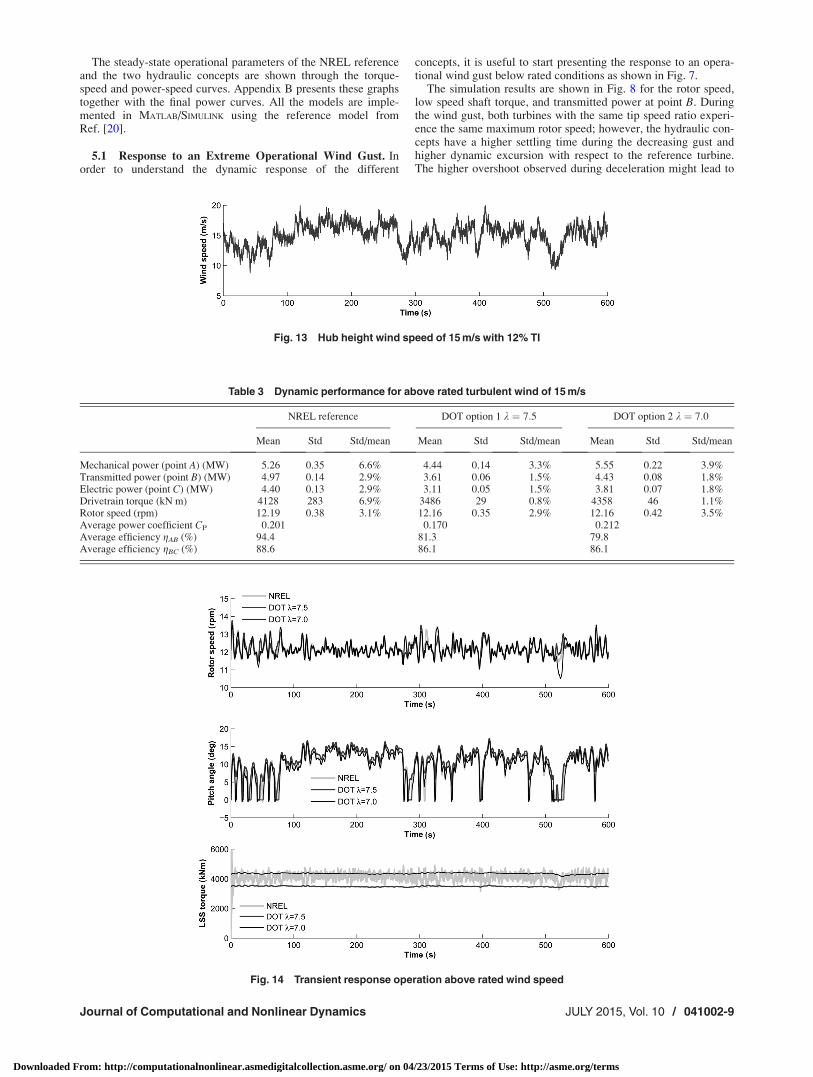
The steady-state operational parameters of the NREL referenceand the two hydraulic concepts are shown through the torque-speed and power-speed curves. Appendix B presents these graphstogether with the final power curves. All the models are imple-mented in MATLAB/SIMULINK using the reference model fromRef. [20].
5.1 Response to an Extreme Operational Wind Gust. Inorder to understand the dynamic response of the different
concepts, it is useful to start presenting the response to an opera-tional wind gust below rated conditions as shown in Fig. 7.
The simulation results are shown in Fig. 8 for the rotor speed,low speed shaft torque, and transmitted power at point B. Duringthe wind gust, both turbines with the same tip speed ratio experi-ence the same maximum rotor speed; however, the hydraulic con-cepts have a higher settling time during the decreasing gust andhigher dynamic excursion with respect to the reference turbine.The higher overshoot observed during deceleration might lead to
Fig. 13 Hub height wind speed of 15 m/s with 12% TI
Table 3 Dynamic performance for above rated turbulent wind of 15 m/s
NREL reference DOT option 1 k ¼ 7:5 DOT option 2 k ¼ 7:0
Mean Std Std/mean Mean Std Std/mean Mean Std Std/mean
Mechanical power (point A) (MW) 5.26 0.35 6.6% 4.44 0.14 3.3% 5.55 0.22 3.9%Transmitted power (point B) (MW) 4.97 0.14 2.9% 3.61 0.06 1.5% 4.43 0.08 1.8%Electric power (point C) (MW) 4.40 0.13 2.9% 3.11 0.05 1.5% 3.81 0.07 1.8%Drivetrain torque (kN m) 4128 283 6.9% 3486 29 0.8% 4358 46 1.1%Rotor speed (rpm) 12.19 0.38 3.1% 12.16 0.35 2.9% 12.16 0.42 3.5%Average power coefficient CP 0.201 0.170 0.212Average efficiency gAB (%) 94.4 81.3 79.8Average efficiency gBC (%) 88.6 86.1 86.1
Fig. 14 Transient response operation above rated wind speed
Journal of Computational and Nonlinear Dynamics JULY 2015, Vol. 10 / 041002-9
Downloaded From: http://computationalnonlinear.asmedigitalcollection.asme.org/ on 04/23/2015 Terms of Use: http://asme.org/terms
undesired transient performance as will be shown in Secs. 5.2 and5.3. On the other hand, the transmission torque and the power ex-perience very low fluctuation for the hydraulic concepts whencompared to the reference. In this example no pitch action isrequired.
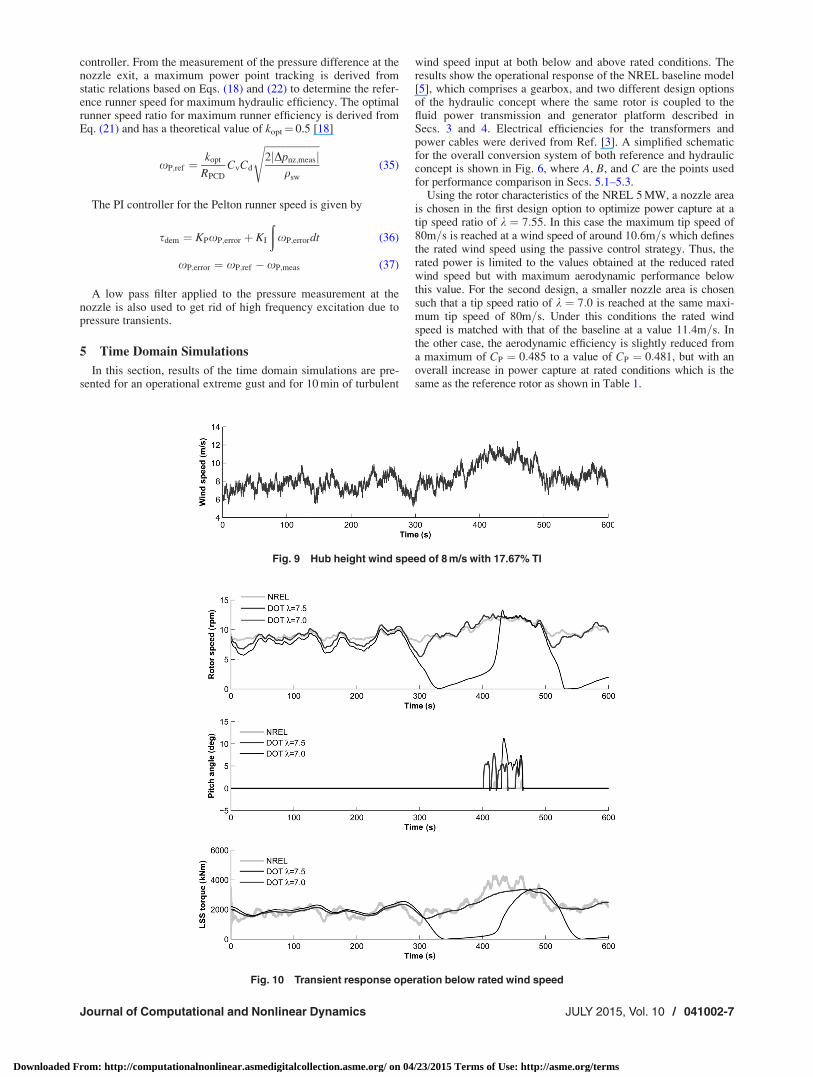
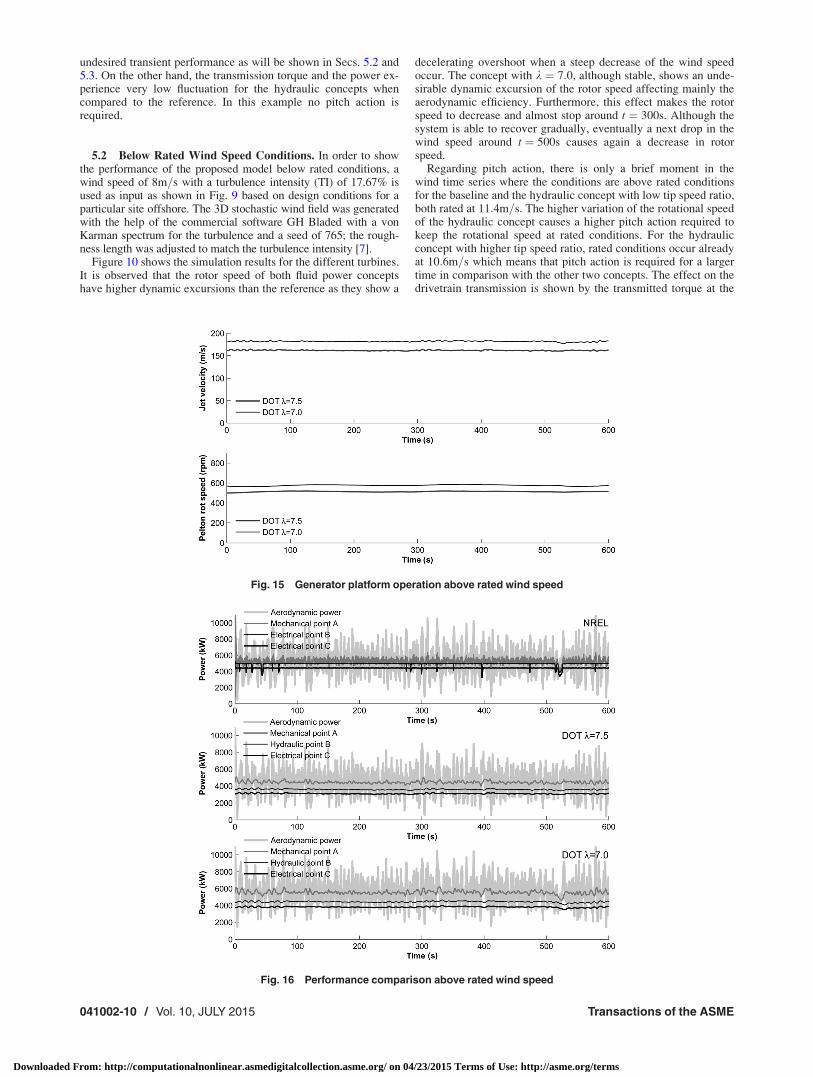
5.2 Below Rated Wind Speed Conditions. In order to showthe performance of the proposed model below rated conditions, awind speed of 8m=s with a turbulence intensity (TI) of 17.67% isused as input as shown in Fig. 9 based on design conditions for aparticular site offshore. The 3D stochastic wind field was generatedwith the help of the commercial software GH Bladed with a vonKarman spectrum for the turbulence and a seed of 765; the rough-ness length was adjusted to match the turbulence intensity [7].
Figure 10 shows the simulation results for the different turbines.It is observed that the rotor speed of both fluid power conceptshave higher dynamic excursions than the reference as they show a
decelerating overshoot when a steep decrease of the wind speedoccur. The concept with k ¼ 7:0, although stable, shows an unde-sirable dynamic excursion of the rotor speed affecting mainly theaerodynamic efficiency. Furthermore, this effect makes the rotorspeed to decrease and almost stop around t ¼ 300s. Although thesystem is able to recover gradually, eventually a next drop in thewind speed around t ¼ 500s causes again a decrease in rotorspeed.
Regarding pitch action, there is only a brief moment in thewind time series where the conditions are above rated conditionsfor the baseline and the hydraulic concept with low tip speed ratio,both rated at 11:4m=s. The higher variation of the rotational speedof the hydraulic concept causes a higher pitch action required tokeep the rotational speed at rated conditions. For the hydraulicconcept with higher tip speed ratio, rated conditions occur alreadyat 10:6m=s which means that pitch action is required for a largertime in comparison with the other two concepts. The effect on thedrivetrain transmission is shown by the transmitted torque at the
Fig. 15 Generator platform operation above rated wind speed
Fig. 16 Performance comparison above rated wind speed
041002-10 / Vol. 10, JULY 2015 Transactions of the ASME
Downloaded From: http://computationalnonlinear.asmedigitalcollection.asme.org/ on 04/23/2015 Terms of Use: http://asme.org/terms

low speed shaft, where the baseline exhibits larger oscillationsand excursions than those of the fluid power transmission conceptwhich show a much smoother and steady value. The results of thedynamic performance are summarized in Table 2.
For the generator platform of the hydraulic concepts, it isshown in Fig. 11 that the rotor speed of the Pelton turbine is modi-fied accordingly to the water jet velocity in order to keep a con-stant ratio as mentioned in Sec. 4.1.2. The low tip speed ratioconcept shows an undesirable operation of the Pelton wheel dueto the sudden decrease of the water jet velocity resulting in alower performance when compared to the high tip speed ratio con-cept. As shown in the power performance of Fig. 12, the sacrificein aerodynamic performance for the low and the high tip speedratio concepts is minor, nevertheless with a lower value than thereference turbine but with reduced oscillations and a smootherresponse similar to the drivetrain torque response. In the samegraph, a large fluctuation of aerodynamic power is observedaround t ¼ 420s for the concept with k ¼ 7:0. Such variation isdue to the sudden pitch action after the rotor is accelerated beyondnominal rated speed.
5.3 Above Rated Wind Speed Conditions. For above ratedwind speed conditions, a turbulent wind speed of 15m=s with tur-bulence intensity of 12% is used as an input in the numericalmodel as shown in Fig. 13.
For above rated conditions, the rotational speed of the rotorshows a similar response for the three turbines, with related fluctu-ations and excursions (Fig. 14). Only a small decrease in rotorspeed with a relatively fast recovery is shown for the hydraulicconcept with low tip speed ratio due to the fast decrease in windspeed below rated conditions around t ¼ 520s. In the same man-ner, pitch action shows a similar behavior with slightly higherpitch values for the hydraulic concept with high tip speed ratio. Interms of the drivetrain torque, it is clear the hydraulic transmissionconcepts shows an advantage over the geared transmission with amore steady value and reduced fluctuations when compared to thereference turbine as observed in the summarized results of Table 3.The higher value of torque from the hydraulic concept with lowtip speed ratio is due to a higher slope in the torque-speed curveof the passive control strategy.
Regarding the generator platform of the hydraulic concepts,both jet velocities and Pelton rotational speeds are kept to nominalvalues, ensuring a suitable performance for above rated conditionsas observed in Table 3. In contrast with below rated wind speeds,both hydraulic concepts perform in an adequate manner for aboverated conditions (Fig. 15). However, both hydraulic conceptsshow a lower efficiency in the power conversion than the refer-ence as it is observed in the comparison of Fig. 16.
6 Conclusions
Simulations show that the operation below rated wind speed fora fluid power transmission with passive control is feasible for asingle turbine. A strongly damped response of the generatedpower and transmitted torque demonstrates a good dynamic per-formance for the hydraulic transmission with a tip speed ratio ofk ¼ 7:5, while achieving slightly higher excursions for the vari-able rotor speed when compared to the reference turbine. The con-cept with lower tip speed ratio of k ¼ 7:0 shows high deceleratingovershoots of the rotor speed resulting in a lower power captureand thus unsatisfactory performance. For above rated conditions,both hydraulic concepts perform satisfactory using the same pitchcontrol strategy but with reduced energy capture than the refer-ence. A reduced fluctuation of the drive train torque and powerare also demonstrated for both hydraulic concepts.
The addition and simulation of more turbines to the hydraulicnetwork is necessary to determine to which extent the benefits ofa centralized wind farm compensate for the relatively lower effi-ciency using the proposed passive torque control.
Appendix A: Pipeline Parameters
The proposed distributed parameter model is a two-port modelbased on volumetric flow rates and pressures at the upstream anddownstream side of the pipeline according to Ref. [14]. Theacoustic velocity in the fluid c0 and the dissipation number Dn areobtained through the pipeline parameters (Fig. 17)
c0 ¼ffiffiffiE
q
s; Dn ¼
�L
r2c0
(A1)
Some additional pipeline parameters are defined as
Z0 ¼qc0
pr2; T ¼ L
c0
; e ¼ 8�L
r2c0
(A2)
The impedance model of a pipeline is defined when the inputsof the model are specified as the flow rates at the two ends of thepipeline. The outputs from the model are the pressures at theupstream and downstream side of the pipeline. The matrices A, B,and C from the state-space representation of Eqs. (9) and (10) aredefined as
A ¼ diag 0;A1;A2;…An½ �
Ai ¼0 �xi
T2
1 � ei
T
2664
3775
B ¼
B0
B1
..
.
Bn
266666664
377777775
2nþ1ð Þ�2
(A3)
B0 ¼Z0
T1 �1½ �
B2i�1 ¼2Z0w2i�1
T2
ebn ebn
T T
" #
B2i ¼2Z0w2i
T2
e �e
T �T
" #
8>>>>>>>>><>>>>>>>>>:
(A4)
C ¼1 0 1 0 1 0 …
1 0 �1 0 �1 0 …
" #2� 2nþ1ð Þ
(A5)
The modal natural frequency xi and the modal damping coeffi-cient ei are given by
xi ¼ ai �1
4
ffiffiffiffiffiffiaiep þ 1
16e (A6)
ei ¼1
2
ffiffiffiffiffiffiaiep þ 1
8e (A7)
ai ¼ ip; i ¼ 1; 2; 3;…; n (A8)
The following attenuation factors with Riemann windowing arealso used:
Fig. 17 Distributed parameters pipeline representation
Journal of Computational and Nonlinear Dynamics JULY 2015, Vol. 10 / 041002-11
Downloaded From: http://computationalnonlinear.asmedigitalcollection.asme.org/ on 04/23/2015 Terms of Use: http://asme.org/terms
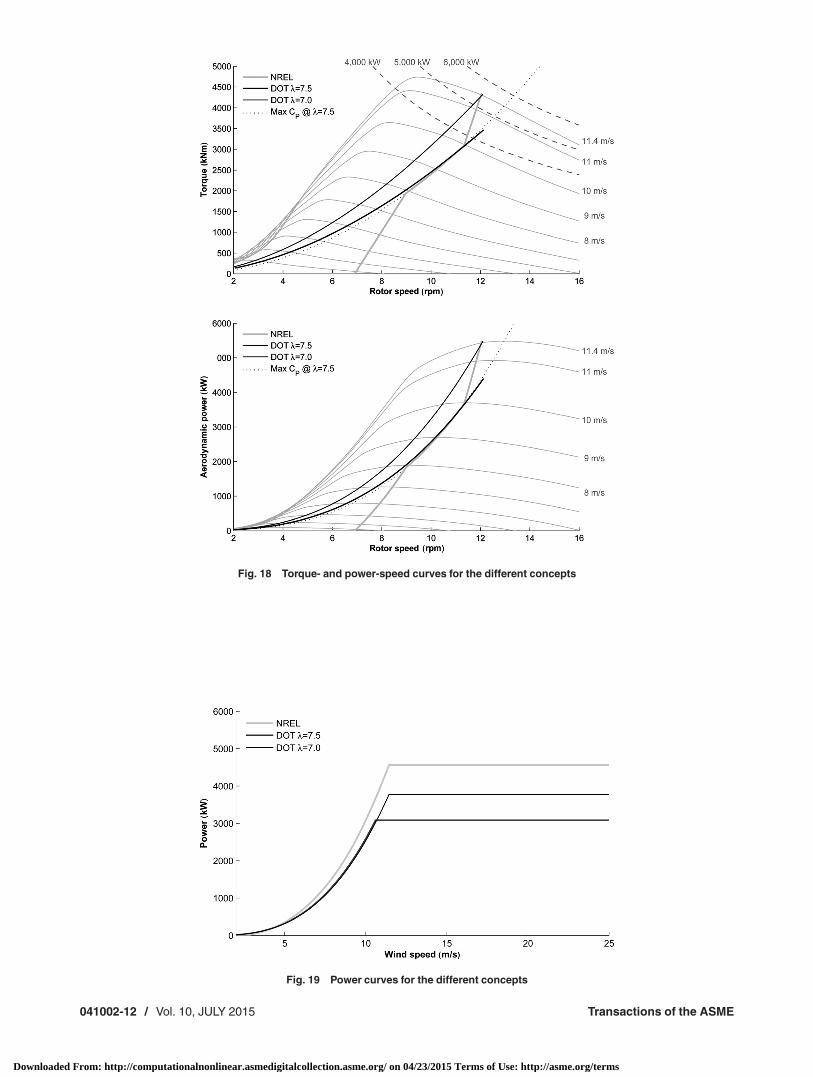
Fig. 18 Torque- and power-speed curves for the different concepts
Fig. 19 Power curves for the different concepts
041002-12 / Vol. 10, JULY 2015 Transactions of the ASME
Downloaded From: http://computationalnonlinear.asmedigitalcollection.asme.org/ on 04/23/2015 Terms of Use: http://asme.org/terms
wi ¼sin bi
bi
; bi ¼ip
nþ 1(A9)
bn ¼ 8Xn�1
i¼1;3;…
wi
x2i
!�1
(A10)
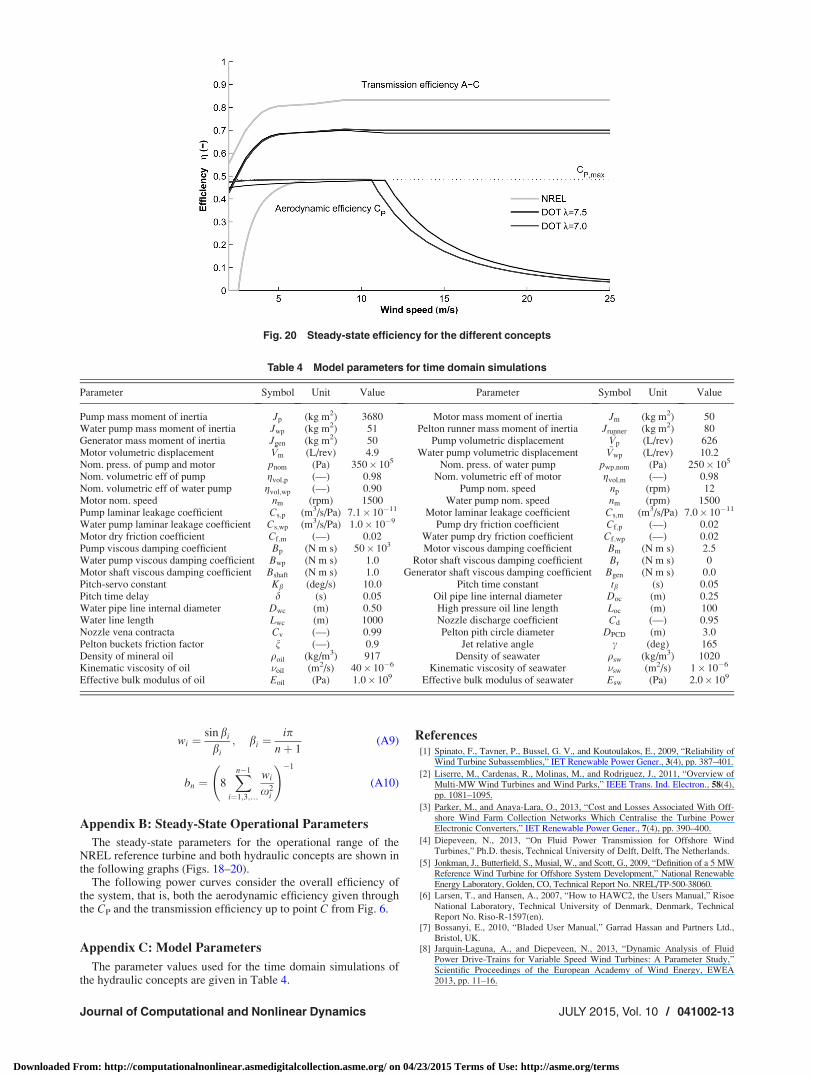
Appendix B: Steady-State Operational Parameters
The steady-state parameters for the operational range of theNREL reference turbine and both hydraulic concepts are shown inthe following graphs (Figs. 18–20).
The following power curves consider the overall efficiency ofthe system, that is, both the aerodynamic efficiency given throughthe CP and the transmission efficiency up to point C from Fig. 6.
Appendix C: Model Parameters
The parameter values used for the time domain simulations ofthe hydraulic concepts are given in Table 4.
References[1] Spinato, F., Tavner, P., Bussel, G. V., and Koutoulakos, E., 2009, “Reliability of
Wind Turbine Subassemblies,” IET Renewable Power Gener., 3(4), pp. 387–401.
[2] Liserre, M., Cardenas, R., Molinas, M., and Rodriguez, J., 2011, “Overview ofMulti-MW Wind Turbines and Wind Parks,” IEEE Trans. Ind. Electron., 58(4),pp. 1081–1095.
[3] Parker, M., and Anaya-Lara, O., 2013, “Cost and Losses Associated With Off-shore Wind Farm Collection Networks Which Centralise the Turbine PowerElectronic Converters,” IET Renewable Power Gener., 7(4), pp. 390–400.
[4] Diepeveen, N., 2013, “On Fluid Power Transmission for Offshore WindTurbines,” Ph.D. thesis, Technical University of Delft, Delft, The Netherlands.
[5] Jonkman, J., Butterfield, S., Musial, W., and Scott, G., 2009, “Definition of a 5 MWReference Wind Turbine for Offshore System Development,” National RenewableEnergy Laboratory, Golden, CO, Technical Report No. NREL/TP-500-38060.
[6] Larsen, T., and Hansen, A., 2007, “How to HAWC2, the Users Manual,” RisoeNational Laboratory, Technical University of Denmark, Denmark, TechnicalReport No. Riso-R-1597(en).
[7] Bossanyi, E., 2010, “Bladed User Manual,” Garrad Hassan and Partners Ltd.,Bristol, UK.
[8] Jarquin-Laguna, A., and Diepeveen, N., 2013, “Dynamic Analysis of FluidPower Drive-Trains for Variable Speed Wind Turbines: A Parameter Study,”Scientific Proceedings of the European Academy of Wind Energy, EWEA2013, pp. 11–16.
Fig. 20 Steady-state efficiency for the different concepts
Table 4 Model parameters for time domain simulations
Parameter Symbol Unit Value Parameter Symbol Unit Value
Pump mass moment of inertia Jp (kg m2) 3680 Motor mass moment of inertia Jm (kg m2) 50Water pump mass moment of inertia Jwp (kg m2) 51 Pelton runner mass moment of inertia Jrunner (kg m2) 80Generator mass moment of inertia Jgen (kg m2) 50 Pump volumetric displacement ~Vp (L/rev) 626Motor volumetric displacement ~Vm (L/rev) 4.9 Water pump volumetric displacement ~Vwp (L/rev) 10.2Nom. press. of pump and motor pnom (Pa) 350� 105 Nom. press. of water pump pwp;nom (Pa) 250� 105
Nom. volumetric eff of pump gvol;p (—) 0.98 Nom. volumetric eff of motor gvol;m (—) 0.98Nom. volumetric eff of water pump gvol;wp (—) 0.90 Pump nom. speed np (rpm) 12Motor nom. speed nm (rpm) 1500 Water pump nom. speed nm (rpm) 1500Pump laminar leakage coefficient Cs;p (m3/s/Pa) 7.1� 10�11 Motor laminar leakage coefficient Cs;m (m3/s/Pa) 7.0� 10�11
Water pump laminar leakage coefficient Cs;wp (m3/s/Pa) 1.0� 10�9 Pump dry friction coefficient Cf;p (—) 0.02Motor dry friction coefficient Cf;m (—) 0.02 Water pump dry friction coefficient Cf;wp (—) 0.02Pump viscous damping coefficient Bp (N m s) 50� 103 Motor viscous damping coefficient Bm (N m s) 2.5Water pump viscous damping coefficient Bwp (N m s) 1.0 Rotor shaft viscous damping coefficient Br (N m s) 0Motor shaft viscous damping coefficient Bshaft (N m s) 1.0 Generator shaft viscous damping coefficient Bgen (N m s) 0.0Pitch-servo constant Kb (deg/s) 10.0 Pitch time constant tb (s) 0.05Pitch time delay d (s) 0.05 Oil pipe line internal diameter Doc (m) 0.25Water pipe line internal diameter Dwc (m) 0.50 High pressure oil line length Loc (m) 100Water line length Lwc (m) 1000 Nozzle discharge coefficient Cd (—) 0.95Nozzle vena contracta Cv (—) 0.99 Pelton pith circle diameter DPCD (m) 3.0Pelton buckets friction factor n (—) 0.9 Jet relative angle c (deg) 165Density of mineral oil qoil (kg/m3) 917 Density of seawater qsw (kg/m3) 1020Kinematic viscosity of oil �oil (m2/s) 40� 10�6 Kinematic viscosity of seawater �sw (m2/s) 1� 10�6
Effective bulk modulus of oil Eoil (Pa) 1.0� 109 Effective bulk modulus of seawater Esw (Pa) 2.0� 109
Journal of Computational and Nonlinear Dynamics JULY 2015, Vol. 10 / 041002-13
Downloaded From: http://computationalnonlinear.asmedigitalcollection.asme.org/ on 04/23/2015 Terms of Use: http://asme.org/terms

[9] Chen, Z., Guerrero, J., and Blaabjerg, F., 2009, “A Review of the State of theArt of Power Electronics for Wind Turbines,” IEEE Trans. Power Electron.,24(8), pp. 1859–1875.
[10] Angehm, R., 2000, “Safety Engineering for the 423 MW-Pelton Runners atBieudron,” 20th IAHR Symposium, VATECH HYDRO.
[11] Whittaker, T., and Folley, M., 2012, “Nearshore Oscillating Wave Surge Convertersand the Development of Oyster,” Philos. Trans. R. Soc., A, 370(1959), pp. 345–364.
[12] Bianchi, F., Battista, H., and Mantz, R., 1997, Wind Turbine Control Systems:Principles, Modelling and Gain Scheduling Design (Advances in IndustrialControl), 1st ed., Vol. 1, A. Editor, ed., Springer, London, pp. 1–3.
[13] Merrit, H., 1967, Hydraulic Control Systems, Wiley, New York.[14] Makinen, J., Piche, R., and Ellman, A., 2000, “Fluid Transmission Line Model-
ing Using a Variational Method,” ASME J. Dyn. Syst., Meas., Control, 122(1),pp. 153–162.
[15] Yang, W., and Tobler, W., 1991, “Dissipative Modal Approximation of FluidTransmission Lines Using Linear Friction Model,” ASME J. Dyn. Syst., Meas.,Control, 113(1), pp. 152–162.
[16] Makinen, J., Pertola, P., and Marjamaki, H., 2010, “Modeling CoupledHydraulic-Driven Multibody Systems Using Finite Element Method,” 1st JointInternational Conference on Multibody System Dynamics, Lappeenranta Uni-versity of Technology.
[17] Thake, J., 2000, The Micro-hydro Pelton Turbine Manual, ITDG Publishing,London.
[18] Zhang, Z., 2007, “Flow Interactions in Pelton Turbines and the Hydraulic Effi-ciency of the Turbine System,” Proc. Inst. Mech. Eng., Part A, 221(3), pp.343–357.
[19] Diepeveen, N., and Jarquin-Laguna, A., 2012, “Wind Tunnel Experiments toProve a Hydraulic Passive Torque Control Concept for Variable Speed WindTurbines,” Science of Making Torque from Wind, The European Academy ofWind Energy, EAWE 2012.
[20] Grunnet, J., Soltani, M., Knudsen, T., Kragelund, M., and Bak, T., 2010,“Aeolus Toolbox for Dynamics Wind Farm Model, Simulation and Control,”European Wind Energy Conference and Exhibition, The European Academy ofWind Energy, EWEC 2010, pp. 3119–3129.
041002-14 / Vol. 10, JULY 2015 Transactions of the ASME
Downloaded From: http://computationalnonlinear.asmedigitalcollection.asme.org/ on 04/23/2015 Terms of Use: http://asme.org/terms


