Embed Size (px)
Citation preview

Modelling and TOFOR measurements of scattered neutrons at JET
This content has been downloaded from IOPscience. Please scroll down to see the full text.
Download details:
IP Address: 86.111.144.194
This content was downloaded on 01/10/2013 at 01:07
Please note that terms and conditions apply.
2010 Plasma Phys. Control. Fusion 52 085002
(http://iopscience.iop.org/0741-3335/52/8/085002)
View the table of contents for this issue, or go to the journal homepage for more
Home Search Collections Journals About Contact us My IOPscience

IOP PUBLISHING PLASMA PHYSICS AND CONTROLLED FUSION
Plasma Phys. Control. Fusion 52 (2010) 085002 (29pp) doi:10.1088/0741-3335/52/8/085002
Modelling and TOFOR measurements of scatteredneutrons at JET
M Gatu Johnson1,5, S Conroy1, M Cecconello1, E Andersson Sunden1,G Ericsson1, M Gherendi2, C Hellesen1, A Hjalmarsson1, A Murari3,S Popovichev4, E Ronchi1, M Weiszflog1, V L Zoita2 and JET-EFDAContributors6
JET-EFDA, Culham Science Centre, OX14 3DB, Abingdon, UK1 Department of Physics and Astronomy, Uppsala University, Box 516, SE-75120 Uppsala,Sweden (EURATOM-VR Association)2 Association EURATOM-MEdC, National Institute for Laser, Plasma and Radiation Physics,Bucharest, Romania3 Consorzio RFX-Associazione EURATOM ENEA per la Fusione, I-35127 Padova, Italy4 Euratom/CCFE Fusion Association, Culham Science Centre, Abingdon, UK
E-mail: [email protected]
Received 9 March 2010, in final form 18 May 2010Published 23 June 2010Online at stacks.iop.org/PPCF/52/085002
AbstractIn this paper, the scattered and direct neutron fluxes in the line of sight (LOS)of the TOFOR neutron spectrometer at JET are simulated and the simulationscompared with measurement results. The Monte Carlo code MCNPX isused in the simulations, with a vessel material composition obtained from theJET drawing office and neutron emission profiles calculated from TRANSPsimulations of beam ion density profiles. The MCNPX simulations show thatthe material composition of the scattering wall has a large effect on the shapeof the scattered neutron spectrum. Neutron source profile shapes as well asradial and vertical source displacements in the TOFOR LOS are shown to onlymarginally affect the scatter, while having a larger impact on the direct neutronflux. A matrix of simulated scatter spectra for mono-energetic source neutronsis created which is folded with an approximation of the source spectrum for eachJET pulse studied to obtain a scatter component for use in the data analysis. Thescatter components thus obtained are shown to describe the measured data. It isalso demonstrated that the scattered flux is approximately constant relative to thetotal neutron yield as measured with the JET fission chambers, while there is alarger spread in the direct flux, consistent with simulations. The simulated effecton the integrated scattered/direct ratio of an increase with movements outwardalong the radial direction and a drop at higher values of the vertical plasma
5 Author to whom any correspondence should be addressed.6 See the appendix of Romanelli F et al 2008 Proc. 22nd IAEA Fusion Energy Conf. (Geneva, Switzerland).
0741-3335/10/085002+29$30.00 © 2010 IOP Publishing Ltd Printed in the UK & the USA 1

Plasma Phys. Control. Fusion 52 (2010) 085002 M Gatu Johnson et al
position is also reproduced in the measurements. Finally, the quantitativeagreement found in scatter/direct ratios between simulations (0.185 ± 0.005)
and measurements (0.187 ± 0.050) serves as a solid benchmark of the MCNPXmodel used.
(Some figures in this article are in colour only in the electronic version)
1. Introduction
The issue of energy-degraded neutrons that have scattered off the fusion tokamak vesselwall before reaching the detecting instrument, here referred to as scattered neutrons but alsosometimes as wall emission neutrons, is important because it has an impact on the analysis ofcollected neutron data. The scattered neutrons can be contrasted with direct neutrons, whichare detected without undergoing scattering with a corresponding loss of energy on the wayfrom the plasma source. Obviously, in a tokamak operating with DT fuel, measurements of2.5 MeV neutrons from d + d → 3He + n reactions will be affected by the flux of scattered14 MeV neutrons from d + t → 4He + n reactions. Maybe less obvious but no less importantis the fact that a fraction of the energy-degraded scattered neutrons fall very close in energy tothe direct emission peak; this affects the possibility to accurately determine the neutron rateand, consequently, the fusion power produced.
The impact of scattered neutrons on tokamak neutron measurements has been recognizedin previous work at JET [1] and TFTR [2] and in preparations for ITER [3–7]. In [1], thepossibility of separation of scattered neutrons from direct ones is claimed to be vital for thesuccessful operation of the JET neutron profile monitor. Reference [2] discusses observationsof scattered neutrons on TFTR, where the scattered flux is determined to be 30% if so-calledsee through collimators are not used. Scattered and direct neutron simulations for the plasmafocus device PF-1000 are described in [8], where it is shown that accurate analysis of collectedneutron spectra would require scattered neutrons to be taken into account. In [9], the authorsanticipate that the advent of more advanced neutron spectrometers will make the scattered flux alimiting factor in the accuracy of neutron spectral analysis. With the installation of the TOFORneutron spectrometer [10] at JET, this prediction was realized. A significant contribution tothe neutron spectrum as measured with TOFOR was seen that could only be explained in termsof scatter and that had to be accounted for in order to accurately analyse the data. PreliminaryTOFOR scatter results were presented in [11].
In [9], Antozzi et al report on a thorough study of the expected scattered neutron flux from14 MeV neutrons in a large tokamak using MCNP simulations. Scatter on carbon and ironnuclei is investigated independently and the scattered flux is analysed in terms of contributionsfrom single scattering, inboard and outboard multiple scattering. The study focuses on ahypothetical example with a horizontal radial line of sight (LOS). Changes in the scatteredflux depending on plasma width, plasma elongation, horizontal and vertical displacementsare studied and it is concluded that, given the radial viewing geometry, the largest impact onthe magnitude of the scattered flux is from displacement in the radial direction. The authorsalso discuss the fact that the shape of the scattered neutron spectrum will be highly sensitiveto wall nuclide composition and plasma temperature (in the case of a burning thermonuclearplasma). It is concluded that the temperature must be well known in order to perform accuratesubtraction of the scattered neutrons, and that the magnitude of the scattered flux could be
2

Plasma Phys. Control. Fusion 52 (2010) 085002 M Gatu Johnson et al
measured in the region of little or no direct plasma emission, given a large enough ‘energybite’ of the detecting instrument.
In this paper, we take the practical approach of focusing on what the scattered neutronspectrum as detected with TOFOR should look like according to simulations, how sensitive itis to parameter variations and how it can be accounted for in the analysis of measured data.MCNPX 2.5 [12] is used in the simulations and the results are compared with [9] when relevantto verify consistency. We will show how the correction for the scattered neutron flux can bedone in the analysis of TOFOR data in the general case of applied auxiliary heating and rathercomplex neutron spectra without prior knowledge of the ‘temperature’ (or equivalent spectralshape) by creating a matrix of expected scatter spectra as a function of direct neutron energy,folding this with an approximation of the direct spectrum from the data and iterating untila scatter component of the correct shape is produced. A comparison between scatter/directneutron ratios in the TOFOR LOS as predicted from MCNPX simulations (0.185 ± 0.005) anddetermined from analysis of experimental TOFOR data (0.187 ± 0.050) serves as a benchmarkto verify the reliability of the MCNPX model.
2. TOFOR
TOFOR is a time-of-flight neutron spectrometer in regular operation at JET since 2005. It isoptimized for the study of 2.5 MeV neutrons from deuterium plasmas but has a large dynamicrange allowing for detection of neutrons in a large energy range including, e.g., 14 MeVneutrons from deuterium–tritium reactions. The neutron flight time is measured between aprimary set of five small in-beam scintillator detectors and a secondary set of 32 larger, removedscintillator detectors. Time-of-flight (tTOF) spectra are reconstructed post-discharge from timetraces of individual events from all 37 detectors. True events corresponding to the interactionof the same neutron in both detector sets as well as random events representing a combinationof uncorrelated neutrons will be constructed in this way. The randoms will show up as aflat intensity level across the spectrum which can be accurately determined and accounted forthrough analysis of data in the unphysical region of negative tTOF.
To lowest order, an incident neutron energy En (MeV) will manifest itself as a coincidencewith a flight time tTOF = 1.02 × 10²E
−1/2n ns; for example, 2.5 MeV neutrons will have flight
times around 65 ns. This simple approximation must then be modified to account for the finitesize of the detectors and for neutrons undergoing multiple scattering on their way between thetwo detector sets. Such effects are included in the TOFOR response function [13], simulatedusing GEANT4 in the range En = 1–18 MeV. As an example, the simulated response forquasi-monoenergetic 2.45 ± 0.025 MeV neutrons is shown in figure 1. Both the broadeningof the peak due to the instrument geometry and the multiscatter tails on the low and high timeof flight sides of the peak are clearly seen.
The detection efficiency of TOFOR is energy dependent, due both to the cross section ofthe n,p reaction invoked for neutron detection in the scintillator material and to the geometricconfiguration of the setup. It is also dependent on the setting of discriminator thresholds in thedata acquisition electronics. We have aimed at setting the thresholds to Ep = 380 keV to get100% efficiency for detection of 2.5 MeV neutrons on a direct path between the two detectorsets while discriminating against low energy noise. However, we estimate an uncertainty inthe threshold settings of �Ep = ±60 keV, leading to the uncertainty in the detector responseshown in figure 1 and a corresponding uncertainty in the energy-dependent efficiency as shownin figure 2. The uncertainty due to the discriminator settings is the dominating uncertainty inthe simulated response function.
3

Plasma Phys. Control. Fusion 52 (2010) 085002 M Gatu Johnson et al
105
104
103
50 60 70 80 9040 100
n on
TO
FO
R p
er 1
08
tTOF (ns)
JG09
.419
-1c
Figure 1. TOFOR response to quasi-mono-energetic 2.45 ± 0.025 MeV neutrons as simulatedusing GEANT4. The curves represent the target discriminator threshold settings (Ep = 380 keV,solid black) and the extremes within the estimated threshold uncertainty (dashed–dottted red forEp = 320 keV, dashed blue for Ep = 440 keV). (Colour online.)
0.010
0.008
0.006
0.004
0.002
0.012
2 4 6 8 10 12 14 16 18
ε(E
n) (
n-1 b
in-
1 )
En (MeV)
JG09
.419
-2c
Figure 2. TOFOR efficiency as a function of incident neutron energy, En, determined throughintegrating the flight time spectrum (as in figure 1) for each simulated energy, for the target thresholdsettings and the extremes within the uncertainty (colours as in figure 1). (Colour online.)
The response function of TOFOR is essential in the interpretation of scattered neutronresults. Any measurement of energy-degraded scatter will be intermixed with multiscatterevents in the region of the spectrum with high tTOF (figure 1), since lower incident energymeans longer flight times. For accurate determination of the scattered neutron flux, the responseneeds to be well characterized in terms of threshold levels. As can be seen, the current intrinsic
4

Plasma Phys. Control. Fusion 52 (2010) 085002 M Gatu Johnson et al
uncertainty in the discriminator threshold determination process (�Ep = ±60 keV) leads to asizable span in multiscatter level (figure 1). For TOFOR, we have also observed drifts in PMtube gain over time, leading to a further uncertainty in effective threshold levels which needsto be taken into account. TOFOR has been operational and collected data for some 10000JET pulses. In this paper, we chose to focus on the pulse interval 71650–74000, with wellcharacterized response.
When comparing simulated and measured scatter, also the energy-dependent efficiency(figure 2) as determined from the response function simulations will play a role. The backscatterwill include a spectrum of different neutron energies. Since the efficiency of TOFOR goes tozero at 1 MeV, this constitutes the low energy detection threshold. When comparing measuredand simulated spectra, this has been taken into account by setting a lower En limit at 1 MeV.
TOFOR views the plasma radially through a vertical LOS from its location in the JETroof laboratory (figure 3(a)). The sight line is defined by the collimator through the rooflaboratory floor, a concrete precollimator structure that can be adjusted to change the viewingcone of TOFOR (figure 3(b)), and the upper vertical port on the JET vessel. To create anaccurate MCNPX model for the determination of the scattered flux reaching TOFOR, detailedknowledge of the sight line is essential. This is not a straight-forward task since the coordinatesystems for the JET torus hall and roof laboratory are not linked. We base our estimate on:
• drawings giving the vertical distances between different structures in the sight line,• a theodolite survey done during TOFOR installation that determined the instrument axis
and hence viewing angle to be tilted 1◦ relative to the true vertical, and• a sight line survey also done during installation that gave (i) the intersection point at the
vertical port (as drawn on a piece of mm paper glued to the port) and (ii) the setting of theprecollimator that corresponded to blocking half the LOS of TOFOR (outer radial jaw at54.5 mm, see figure 3(b)).
The vertical distances as given by drawings are shown in figure 3(c). The inner and outerradial jaws of the TOFOR precollimator are fully open when set to −152.5 mm and 143.3 mm,respectively (figure 3(b)). From these numbers, we calculate that the field of view as seenfrom the TOFOR primary detector centre point extends in the radial direction from 2.74 to3.02 m major radius, centred at 2.88 m, at the torus midplane. If the sight line was limited onlyby the collimator through the roof laboratory floor, the field of view would be 44 cm wide.In practice, the limiting structures according to our calculations are the precollimator on theoutboard and the vertical port on the inboard sides, respectively.
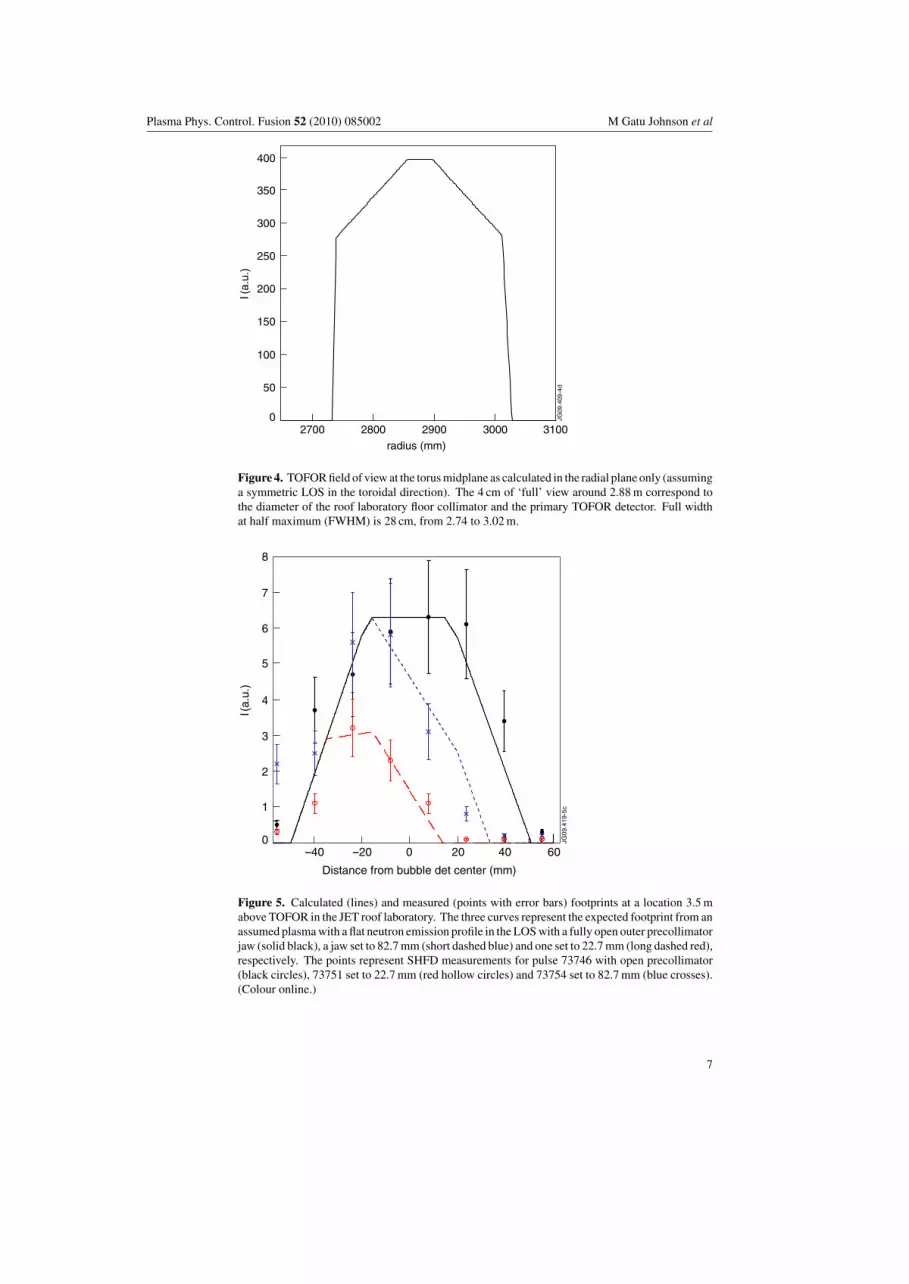
The field of view is restricted also in the toroidal direction, by the precollimator (with a70.6 + 71.5 mm wide opening) and the vertical port. The vertical port is not symmetric in thetoroidal direction but wider on the outboard side and narrower on the inboard side. A simplecode has been written where the radial footprint of TOFOR at the torus midplane is calculatedneglecting the toroidal variations (figure 4). The code takes into account the assumed blockof the sight line by the precollimator and the vertical port as well as the roof laboratory floorcollimator.
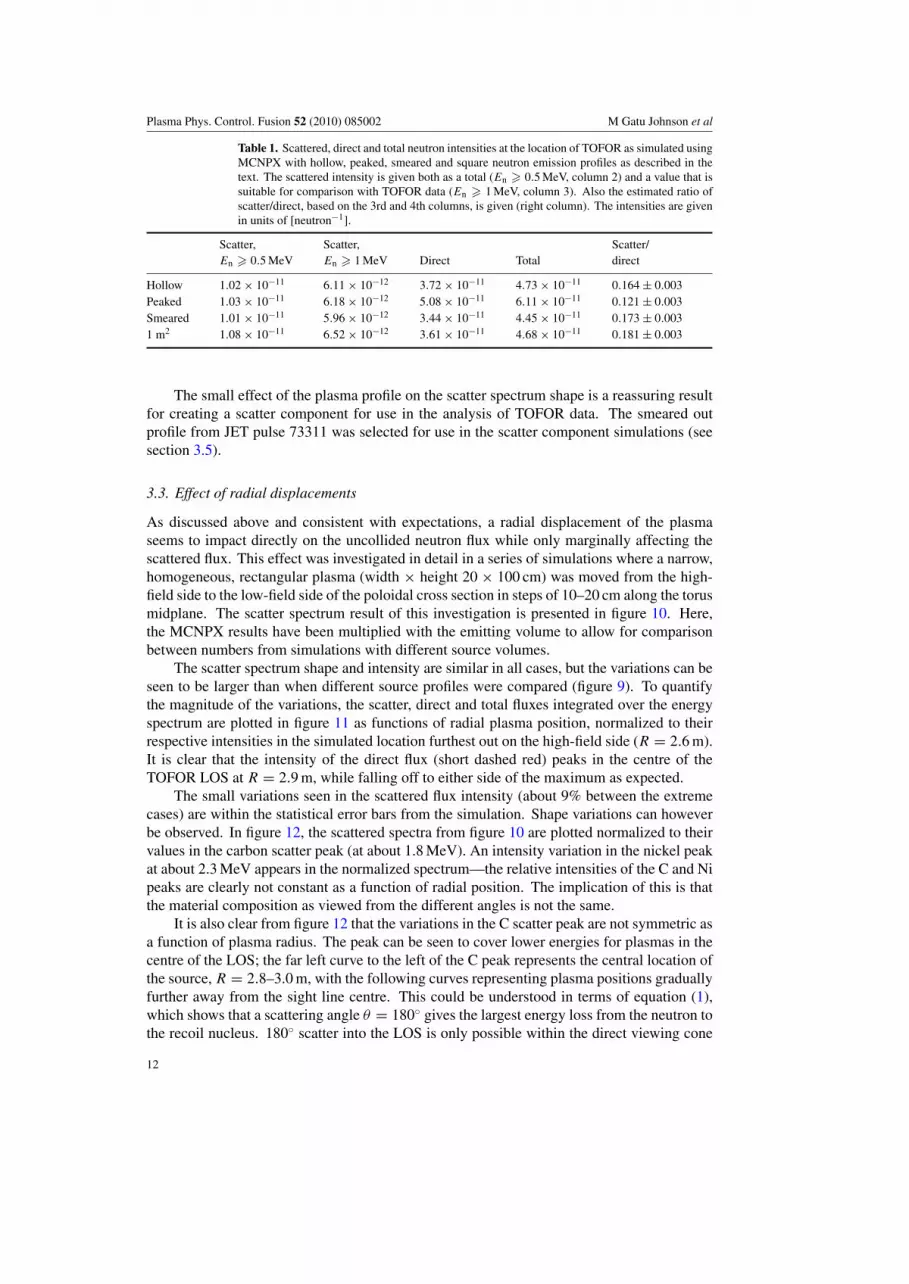
The uncertainty in especially the half-view precollimator setting estimated in the TOFORinstallation survey (54.5 mm, see figure 3(b)) is expected to be large. An error in this numberwould propagate through the calculations to have a large impact on the LOS estimate. Avalidation of the estimated LOS can be obtained by comparing with measurements using a 2Darray of super heated fluid detectors (SHFDs, [14]) placed above TOFOR in the roof laboratory(figure 3(c)). The code used to produce figure 4 can be applied to calculate the expectedfootprint of a flat neutron emission profile at the estimated SHFD array location 3.5 m aboveTOFOR. The calculation is done for a fully open outer precollimator jaw (143.3 mm), one set
5

Plasma Phys. Control. Fusion 52 (2010) 085002 M Gatu Johnson et al
Figure 3. (a) The vertical TOFOR LOS through the JET vessel, defined by the collimator throughthe roof laboratory floor, the precollimator structure and the upper vertical port. (b) Cartoon ofthe fully open precollimator as viewed from above, with positions (in mm) and the centre of theTOFOR LOS (×) indicated. The lighter coloured jaws are movable in the radial direction (R), theblack in the toroidal direction (φ). (c) Vertical distances between relevant structures in the TOFORLOS. (Colour online.)
to 82.7 and one set to 22.7 mm (with the inner jaw fully open in all three cases at −152.2 mm,see figure 3(b)). The results are shown in figure 5 (lines). These calculated footprints can becompared with measurements using SHFD for pulses with the same precollimator settings,also shown in figure 5 (points with error bars). Two important points should be rememberedwhen comparing calculations and measurements: (i) while the neutron emission profiles forthe calculations were assumed flat in the LOS, this was in all likelihood not the case forthe experimental data. (ii) The estimated distance of 3.5 m between the roof laboratoryfloor and the location of the SHFDs comes with a large uncertainty. Still, the agreementbetween measurements and calculations is remarkable, lending credit to our estimate of theTOFOR LOS.
6
Plasma Phys. Control. Fusion 52 (2010) 085002 M Gatu Johnson et al
300
350
250
200
150
100
50
400
02700 2800 2900 3000 3100
I (a.
u.)
radius (mm)
JG09
.409
-4d
Figure 4. TOFOR field of view at the torus midplane as calculated in the radial plane only (assuminga symmetric LOS in the toroidal direction). The 4 cm of ‘full’ view around 2.88 m correspond tothe diameter of the roof laboratory floor collimator and the primary TOFOR detector. Full widthat half maximum (FWHM) is 28 cm, from 2.74 to 3.02 m.
7
6
5
4
3
2
1
0
8
-40 -20 0 20 40 60
I (a.
u.)
Distance from bubble det center (mm)
JG09
.419
-5c
Figure 5. Calculated (lines) and measured (points with error bars) footprints at a location 3.5 mabove TOFOR in the JET roof laboratory. The three curves represent the expected footprint from anassumed plasma with a flat neutron emission profile in the LOS with a fully open outer precollimatorjaw (solid black), a jaw set to 82.7 mm (short dashed blue) and one set to 22.7 mm (long dashed red),respectively. The points represent SHFD measurements for pulse 73746 with open precollimator(black circles), 73751 set to 22.7 mm (red hollow circles) and 73754 set to 82.7 mm (blue crosses).(Colour online.)
7

Plasma Phys. Control. Fusion 52 (2010) 085002 M Gatu Johnson et al
(a) (b)
JG09
.419
-6c
Figure 6. Visualization of the JET MCNPX model used in the backscatter simulations, showing (a)the cross section of the JET torus, the precollimator structure (blue) and the collimator through theroof laboratory floor (red) (compare figure 3) and (b) a detailed view of the JET torus, indicating,e.g., the level of detail included in the modelling of the divertor and the vertical port. The differentcolours in (b) indicate different material compositions.
3. Simulations
The MCNPX model used in the simulation is a full 3D model of the JET torus (360◦), includingtransformer limbs in the torus hall, with the divertor, vertical port, precollimator and rooflaboratory collimator included as shown in figure 6(a). JET is represented by 64 rotated andtransformed copies of 4 subuniverses (32 toroidal field coils, 16 intracoil plains, 8 intracoilmajor ports, 8 intracoil minor ports) to represent the underlying segmented structure of JET.Poloidal field coils in and outside the vacuum vessel along with carbon tiles represent theimportant structures. In the model, we take into account the sight line information as describedin section 2. By necessity the modelling includes simplifications; only parts of the vessel witha direct impact in the TOFOR LOS are modelled in detail. In figure 6(b), a close-up of thevessel cross section is shown to demonstrate the level of detail included. A point detector at thelocation of the TOFOR primary detector is used to tally total and uncollided (direct) neutronfluxes as functions of energy, in the interval from En = 0.45–18 MeV (with 50 keV bins). Alimitation of the point detector technique is that it effectively does not include interactions nearthe primary TOFOR detectors as it is unlikely that the Monte Carlo particles will go there.However, modelling of the effects of structures near the detector has shown that such effectsare small. Using volume detectors with the full JET model would lead to impractically longcomputation times to reach the same statistics as obtained with the point detector approach—however, the results would come out the same. The scattered neutron flux is taken to be thecollided neutron flux, obtained through subtraction of the uncollided flux from the total.
Taking the geometry (shown in figure 6) as given, assumptions that affect the results ofthe simulations have to be made on:
• the material composition for each model component,• the plasma shape in terms of an assumed neutron emission profile,
8

Plasma Phys. Control. Fusion 52 (2010) 085002 M Gatu Johnson et al
• the radial plasma position, and• the vertical plasma position.
Below, the effect of each of these assumptions on the shape of the scatter component andthe relative intensity scatter/direct is discussed. For each of these investigations, a quasi-monoenergetic neutron source with En = 2.5 ± 0.025 MeV is used.
3.1. Effect of material composition in model
In the preliminary work on TOFOR backscatter presented in [11], a simplified MCNPX modelof JET excluding the divertor structure was used. The lower vertical port (figure 3(a)) was filledwith inconel and a 1 cm layer of carbon was added at the bottom of the JET vessel to accountfor the divertor carbon tiles. The thickness of this layer was adjusted to give a componentshape that matched TOFOR data from thermonuclear (so-called ohmic) JET pulses. For thecurrent model, we have obtained information on the material composition of the various modelcomponents from the JET drawing office. Based on this information, we conclude that the mainconstituents of the JET divertor region most relevant for our application are Ni (the dominantelement in the inconel of the support structures) and C (dominant in the divertor tiles). In themodel, the divertor tiles contain 95% C and 5% inconel by weight (as do all tiles indicatedwith purple colour in figure 6(b)), support tiles contain inconel only (green) and ‘composite’tiles contain a mixture of elements, dominated by copper (light blue); these latter tiles include,for example, the divertor coils. The density of the carbon tiles has been adjusted to includea contribution from their inconel supports. Our best efforts have been put into making themodel as accurate a description of the vessel as possible; however, the information obtainedfrom the drawing office has been modified in some aspects to reach a level of detail which isa compromise between accuracy and practicality.
In order to clarify the influence of the two main materials, we have also looked at resultsfrom a model containing a larger fraction of Ni relative to C (divertor tiles with 34% C and66% inconel by weight). In figure 7, three sets of results are presented: the ones obtained inthe preliminary study of [11], the high Ni model and the ‘drawing office’ model as outlinedabove (and in figure 6). In order to interpret the results, we note that the energy loss to therecoil nucleus in an elastic scattering event will be [15]
ER = 4A
(1 + A)2(cos2 θ)En, (1)
where A is the mass number of the nucleus, θ the scattering angle and En the incident neutronenergy. Scattering at about 180◦ angles will dominate due to the viewing geometry. The peaksobservable in figure 7 can thus be identified as resulting from elastic scattering on 12C (atabout 1.8 MeV) and 58Ni (at about 2.3 MeV). The peak at 2.5 MeV representing very smallenergy losses is due to inscatter, while the structure below 1 MeV is due to inelastic scatteringinvolving excited states of various inconel constituents.
As can be seen in figure 7, the impact of the material composition on the spectral shape ofthe scattered neutrons is large. The uncertainty in the information obtained from the drawingoffice for implementation in our model and in the implementation itself (due to the selectedlevel of detail) can have an impact on the shape of the spectrum and should be kept in mindwhen assessing the results. This is in agreement with the conclusion reached by Antozziet al [9], i.e. that straight-forward computation of the scattered neutron spectrum might neverreach the desired accuracy specifically due to indetermination of the nuclide composition ofthe wall.
9

Plasma Phys. Control. Fusion 52 (2010) 085002 M Gatu Johnson et al
0.2
0.4
0.6
0.8
0
1.0
1.0 1.5 2.0 2.50.5 3.0
I (n-
1 bi
n-
1 )
x10-12
En (MeV)
JG09
.419
-7c
Figure 7. Scattered neutron spectra from MCNPX, per cm2 on the primary TOFOR detector, usingthe model described in [11] (short dashed blue), the new model used in this paper (solid black) anda version of the new model with a higher contribution of Ni relative to C (dashed–dotted red). Theerror bars show the statistical error from the simulation. The MCNPX output is given per simulatedneutron. (Colour online.)
3.2. Effect of different plasma shapes
In [11], the neutron emitting JET plasma was approximated as a toroidal neutron source with asquare poloidal cross section of 1 m sides. Here, we investigate the impact of using a realisticneutron emission profile based on actual JET plasma configurations. We have used the neutralbeam code TRANSP [16] with the module NUBEAM [17] to produce spatially resolved beamion density distributions for actual JET pulses. Using these beam ion density distributionsand the corresponding bulk ion density distributions, the neutron emission in each point ona spatial grid spanning the plasma volume has been calculated using the Monte Carlo codeControlRoom [18].
In figure 8, three examples of neutron emission profiles are shown, calculated usingthis method for JET pulses 69242 (time periods 8–10 s and 10.5–12.5 s) and 73311 (9–10 s),respectively. The two profiles from pulse 69242 come from time periods where only a singlepositive ion neutral injector (PINI) was used at the time: on-axis PINI 4.1 and off-axis PINI8.3, respectively. This special heating scenario gives an unsually peaked profile in the on-axiscase, while it results in a hollow profile in the off-axis case. For pulse 73311, a mixture of 14on- and off-axis PINIs was used, giving a more smeared out emission profile.
The scattered neutron spectra as simulated using the MCNPX model with the three profilesfrom figure 8 as well as with the square plasma model used in [11] as the neutron source,respectively, are shown in figure 9.
As can be seen, the results for the hollow, peaked and smeared out profiles as well as thesimple square emission source are very similar in terms of scatter spectrum shape. Also thetotal scatter intensities, integrated over the observed spectrum from 0.5 to 3.0 MeV (table 1),are close for the four cases, with the JET profiles differing less than 2% and the square lessthan 7%.
10

Plasma Phys. Control. Fusion 52 (2010) 085002 M Gatu Johnson et al
0
0.05
0.1
0.15
0.2
0.25
0.3
0.35
0.4
x1014
1.5
2.0
1.0
0.5
0
-1.0
-0.5
-1.5
2.0 2.5 3.0 3.5 4.0
Z (m
)
R (m)
(a)JG09.419-8c
0
0.02
0.04
0.06
0.08
0.10
x1014
1.5
2.0
1.0
0.5
0
-1.0
-0.5
-1.5
2.0 2.5 3.0 3.5 4.0
Z (m
)
R (m)
(b)JG09.419-8d
0
1
2
3
4
5
x1014
1.5
2.0
1.0
0.5
0
-1.0
-0.5
-1.5
2.0 2.5 3.0 3.5 4.0
Z (m
)
R (m)
(c)JG09.419-8e
Figure 8. Neutron emission profiles calculated based on the fast ion density profile output fromthe TRANSP module NUBEAM as described in the text for JET pulses (a) 69242 8–10 s (peaked),(b) 69242 10.5–12.5 s (hollow) and (c) 73311 9–10 s. The two vertical lines approximately indicatethe extent of the TOFOR LOS.
0.1
0.2
0.3
0.4
0.5
0.6
0
0.7
1.0 1.5 2.0 2.50.5 3.0
I (n-
1 bin
-1 )
x10-12
En (MeV)
JG09
.419
-9c
Figure 9. Scattered neutron spectra per cm2 on the primary TOFOR detector, simulated usingMCNPX for the hollow (short dashed black) and peaked (long dashed red) neutron emissionprofiles from JET pulse 69242, the smeared profile from pulse 73311 (solid blue) and the 1 m2
square neutron source used in [11] (dash-dotted magenta), respectively.
As can be seen (table 1), the direct (uncollided) neutron flux is quite sensitive to the profileused in the simulation. This is due to sight line effects. The neutron emission profile may movein or out of the TOFOR field of view in the radial direction. While this will directly affect theuncollided (direct) neutron flux observed with TOFOR, it will only contribute as a secondaryeffect in the scattered flux, the source of which is always the far wall of the torus (divertorregion), fixed relative to the TOFOR LOS. In table 1, also a value for the ratio between thesimulated scattered and direct neutron fluxes, integrated for En > 1 MeV, is given.
11
Plasma Phys. Control. Fusion 52 (2010) 085002 M Gatu Johnson et al
Table 1. Scattered, direct and total neutron intensities at the location of TOFOR as simulated usingMCNPX with hollow, peaked, smeared and square neutron emission profiles as described in thetext. The scattered intensity is given both as a total (En � 0.5 MeV, column 2) and a value that issuitable for comparison with TOFOR data (En � 1 MeV, column 3). Also the estimated ratio ofscatter/direct, based on the 3rd and 4th columns, is given (right column). The intensities are givenin units of [neutron−1].
Scatter, Scatter, Scatter/En � 0.5 MeV En � 1 MeV Direct Total direct
Hollow 1.02 × 10⁻¹¹ 6.11 × 10⁻¹² 3.72 × 10⁻¹¹ 4.73 × 10⁻¹¹ 0.164 ± 0.003Peaked 1.03 × 10⁻¹¹ 6.18 × 10⁻¹² 5.08 × 10⁻¹¹ 6.11 × 10⁻¹¹ 0.121 ± 0.003Smeared 1.01 × 10⁻¹¹ 5.96 × 10⁻¹² 3.44 × 10⁻¹¹ 4.45 × 10⁻¹¹ 0.173 ± 0.0031 m2 1.08 × 10⁻¹¹ 6.52 × 10⁻¹² 3.61 × 10⁻¹¹ 4.68 × 10⁻¹¹ 0.181 ± 0.003
The small effect of the plasma profile on the scatter spectrum shape is a reassuring resultfor creating a scatter component for use in the analysis of TOFOR data. The smeared outprofile from JET pulse 73311 was selected for use in the scatter component simulations (seesection 3.5).
3.3. Effect of radial displacements
As discussed above and consistent with expectations, a radial displacement of the plasmaseems to impact directly on the uncollided neutron flux while only marginally affecting thescattered flux. This effect was investigated in detail in a series of simulations where a narrow,homogeneous, rectangular plasma (width × height 20 × 100 cm) was moved from the high-field side to the low-field side of the poloidal cross section in steps of 10–20 cm along the torusmidplane. The scatter spectrum result of this investigation is presented in figure 10. Here,the MCNPX results have been multiplied with the emitting volume to allow for comparisonbetween numbers from simulations with different source volumes.
The scatter spectrum shape and intensity are similar in all cases, but the variations can beseen to be larger than when different source profiles were compared (figure 9). To quantifythe magnitude of the variations, the scatter, direct and total fluxes integrated over the energyspectrum are plotted in figure 11 as functions of radial plasma position, normalized to theirrespective intensities in the simulated location furthest out on the high-field side (R = 2.6 m).It is clear that the intensity of the direct flux (short dashed red) peaks in the centre of theTOFOR LOS at R = 2.9 m, while falling off to either side of the maximum as expected.
The small variations seen in the scattered flux intensity (about 9% between the extremecases) are within the statistical error bars from the simulation. Shape variations can howeverbe observed. In figure 12, the scattered spectra from figure 10 are plotted normalized to theirvalues in the carbon scatter peak (at about 1.8 MeV). An intensity variation in the nickel peakat about 2.3 MeV appears in the normalized spectrum—the relative intensities of the C and Nipeaks are clearly not constant as a function of radial position. The implication of this is thatthe material composition as viewed from the different angles is not the same.
It is also clear from figure 12 that the variations in the C scatter peak are not symmetric asa function of plasma radius. The peak can be seen to cover lower energies for plasmas in thecentre of the LOS; the far left curve to the left of the C peak represents the central location ofthe source, R = 2.8–3.0 m, with the following curves representing plasma positions graduallyfurther away from the sight line centre. This could be understood in terms of equation (1),which shows that a scattering angle θ = 180◦ gives the largest energy loss from the neutron tothe recoil nucleus. 180◦ scatter into the LOS is only possible within the direct viewing cone
12

Plasma Phys. Control. Fusion 52 (2010) 085002 M Gatu Johnson et al
250-270270-290280-300290-310300-320310-330330-350
0.5
1.0
1.5
2.0
2.5
01.0 1.5 2.0 2.50.5 3.0
I (a.
u.)
x10-12
En (MeV)
JG09
.419
-10c
Figure 10. Scattered neutron spectra per cm2 on the primary TOFOR detector, simulated usingMCNPX with a narrow rectangular plasma source moved from the high-field side (250–270 cm)towards the low-field side (330–350 cm) in steps of 10–20 cm as indicated by the legend. TheMCNPX output (in units of n−1 bin−1) has been multiplied with the emitting volume to give acomparable emissivity in the TOFOR LOS for the seven cases. (Colour online.)
0.5
1.0
1.5
2.0
2.5
3.0
02.6 2.8 3.0 3.2 3.4
I nor
m
R (m)
scatterdirecttotal
JG09
.419
-11c
Figure 11. Variations in scatter (solid black), direct (short dashed red) and total (long dashed blue)intensities as simulated with MCNPX as a function of position along the JET major radius. Theintensities are normalized to their values at R = 2.6 m. (Colour online.)
of TOFOR, meaning the largest energy losses will only be possible in the case of a centrallylocated neutron source.
It should be stressed that the narrow rectangular neutron source used in this investigationwas selected specifically to make observation of these subtle effects possible. The effects
13

Plasma Phys. Control. Fusion 52 (2010) 085002 M Gatu Johnson et al
0.2
0.4
0.6
0.8
1.0
01.8 2.0 2.2
250-270270-290280-300290-310300-320310-330330-350
2.41.6
I sca
tter (a
.u.)
En (MeV)
JG09
.419
-12c
Figure 12. Scattered neutron spectra as in figure 10 normalized to their values in the C scatterpeak. The curves represent lines between the centre points of the histogram bins.
-20-100+10+20+30
0.1
0.2
0.3
0.4
0.5
0.6
0.7
01.0 1.5 2.0 2.50.5 3.0
I (n-
1 bi
n-1 )
x10-12
En (MeV)
JG09
.419
-13c
Figure 13. Scattered neutron spectra, per cm2 on the primary TOFOR detector, simulated withMCNPX using a 20 × 20 cm square neutron source, for vertical positions −20 to +30 cm relativeto the torus midplane as indicated in the label.
would not be as marked for a realistic plasma neutron source since the emission profile iswider in this case (figure 8), spanning a larger radial section and smoothing out the effectsstudied. Although the effects of the radial variation on the scattered neutron flux are small, theimpact on the direct flux is large as seen in figure 11. Therefore, the scatter/direct ratios willvary as a function of radial position. It is clear from figure 11 that the minimum ratios will be
14

Plasma Phys. Control. Fusion 52 (2010) 085002 M Gatu Johnson et al
scatterdirecttotal
0.95
0.90
0.85
1.00
1.05
0-20 -10 0 10 20 30
I nor
m
Z (cm)
JG09
.419
-14c
Figure 14. Relative intensities for scatter (solid black), direct (short dashed red) and total (longdashed blue) neutron fluxes from MCNPX, each normalized to their values in the Z = −20 cmpoint. (Colour online.)
obtained when a maximal fraction of the direct flux is emitted within the field of view of thedetecting instrument, while larger ratios will be obtained for plasmas displaced to either sideof the LOS. The numerical values of scatter/direct obtained from these simulations will not bedirectly comparable to TOFOR measurements due to the unique shape of the plasma source(20 × 100 cm).
The effects of radial and vertical shifts in plasma position on the expected scattered fluxwere discussed also in [9], where it was concluded that a radial shift affected the scatter intensitywhile a vertical shift did not. Since the viewing geometry was horizontal in the simulations forthat paper while vertical in our case, our radial result of little impact on the scatter componentshould be consistent with the vertical result in [9], which is also observed.
3.4. Effect of vertical displacements
For completeness, also the effect of moving the neutron source in the vertical direction hasbeen studied. In this case, a small, square source (width × height 20×20 cm), located between280 and 300 cm major radius, was used. The source was moved in the vertical direction inincrements of 10 cm from −20 to +30 cm relative to the torus midplane. The result is shownin figure 13.
The effects of these small movements on the scatter component are minor. However, ifthe integrated fluxes are normalized to their values at the Z = −20 cm extreme, a clearlydecreasing trend is seen for the scatter intensity as the neutron source is moved in the positivedirection, i.e. further from the wall responsible for the scatter and closer to the detectinginstrument (figure 14). The opposite effect, though small for the limited displacements studiedhere, can also be observed for the direct flux.
This is in agreement with the results obtained in [9] concerning radial displacements,though the effects observed here are smaller since the displacements studied are smallerrelative to the total distances involved in the configuration far wall—neutron source—detectinginstrument in these calculations. The deduced scatter/direct ratio (En > 1 MeV) varies from
15

Plasma Phys. Control. Fusion 52 (2010) 085002 M Gatu Johnson et al
20
2
4
6
8
10
12
14
4
6
8
10
12
14
16
18
2 4 6 8 10 12 14 16 18
En (MeV)scatt
En
(M
eV)
sim
JG09
.419
-15c
x1013
Figure 15. Matrix of simulated scattered neutron spectra (x-axis) for simulated source neutronenergies from 1 to 18 MeV (y-axis). The lines (magenta) indicate the simulated neutron energiesEn = 2.5 and 14 MeV, respectively; the corresponding simulated scatter spectra are visualized infigure 16.The diagonal bands of higher intensity represent inscatter and scatter on Ni and C nuclei,as indicated in figure 16.
0.071 to 0.057 between the two extremes in our simulation, i.e. a relative drop of about 20%.Note, however, that due to the unrealistic shape of the plasma source in this case (20 × 20 cm),the results obtained are not comparable to real TOFOR data.
3.5. Simulated scatter matrix for use in the TOFOR data analysis
Scattered neutron spectra have been simulated for quasi-monoenergetic (±25 keV) neutronsources in the interval 1–18 MeV in steps of 50 keV, using the smeared out neutron emissionprofile from the TRANSP simulation for JET pulse 73311 (figure 8(c)) and the materialcomposition for the divertor region obtained from the drawing office (section 3.1). The resultis a scatter matrix with resulting scatter spectra for each source energy (figure 15).
Examples of simulated scattered neutron spectra for 2.5 ± 0.025 and 14.0 ± 0.025 MeVneutron sources are shown in figure 16. The number of source neutrons simulated is 50 × 106
independent of incident neutron energy; a larger number of simulated neutrons would reducethe statistical error (represented with error bars in figure 16).
The scatter matrix in figure 15 is used to create a scatter component for use in the TOFORdata analysis by folding the matrix with an estimate of the neutron emission spectrum froma preliminary fit to the data, as will be further discussed in section 4. The scatter matrix isproduced with bins of 50 keV width to match the resolution of the TOFOR response function.
The simulation studies discussed above show that the impact of the neutron emissionprofile, radial and vertical positions on the shape of the scattered neutron spectrum is small.We are confident that use of the neutron emission profile for pulse 73311 in the generation
16

Plasma Phys. Control. Fusion 52 (2010) 085002 M Gatu Johnson et al
10-12
10-13
10-11
1.2 1.4 1.6
(a)
1.8 2.0 2.2
12C
58Ni
inscatter
direct
2.4 2.61.0
scat
tere
d fl
ux (b
in-
1 n-
1 )
En (MeV)
JG09
.419
-16c
10-12
10-13
10-14
10-15
10-11
2 4 6 8 10 12 14
(b)
12C 58Ni
inscatter
direct
scat
tere
d fl
ux (b
in-
1 n-
1 )
En(MeV)
JG09
.419
-16d
12C*
Figure 16. Simulated scattered neutron spectra per cm2 on the primary TOFOR detector for sourceneutron energies (a) En = 2.5 ± 0.025 MeV and (b) En = 14.0 ± 0.025 MeV (solid black), withthe main carbon, nickel and inscatter peaks indicated (corresponding to bands of higher intensityin figure 15). Also shown are the corresponding simulated direct neutron spectra (dashed red).(Colour online.)
of the scatter matrix introduces only minor additional uncertainties in the extracted physicsresults.
It should be emphasized that with this method, the scattered neutron component for usein the data analysis is determined based on the measured neutron emission spectroscopy dataonly. In [9], it is anticipated that for detailed subtraction of the scatter, the temperature of aplasma (assumed to be thermonuclear) needs to be known. Our results show that this is notnecessary.
The fraction of scattered neutrons relative to direct will vary with the simulated neutronenergy for two reasons. Firstly, the cross sections of elastic neutron scattering vary with energy,giving an intensity variation for different simulated source energies. Secondly, the fraction ofthe scatter spectrum with En > 1 MeV measureable with TOFOR increases with increasingsource neutron energy. As an example, the fraction of scattered-to-direct neutrons observablewith TOFOR for the En = 2.5 MeV simulation is 0.174 ± 0.005, while the average simulatedscatter/direct ratio from 2.2 to 2.8 MeV is 0.185 ± 0.005. This means that a scatter/directcomparison between measured and simulated data needs to take the neutron emission energyspectrum into account.
4. Results of experiments
In this section, the scatter results from the MCNPX simulations are compared with measuredTOFOR data. As described in section 2, the shape of the measured tTOF spectrum in the regionof low En (or, equivalently, high tTOF) is crucially dependent on discriminator thresholds set inthe data acquisition electronics. Because of this, only pulses from the interval 71650–74000with well-known threshold settings and, hence, well-defined response function (with estimateduncertainty as in figures 1 and 2) are studied here.
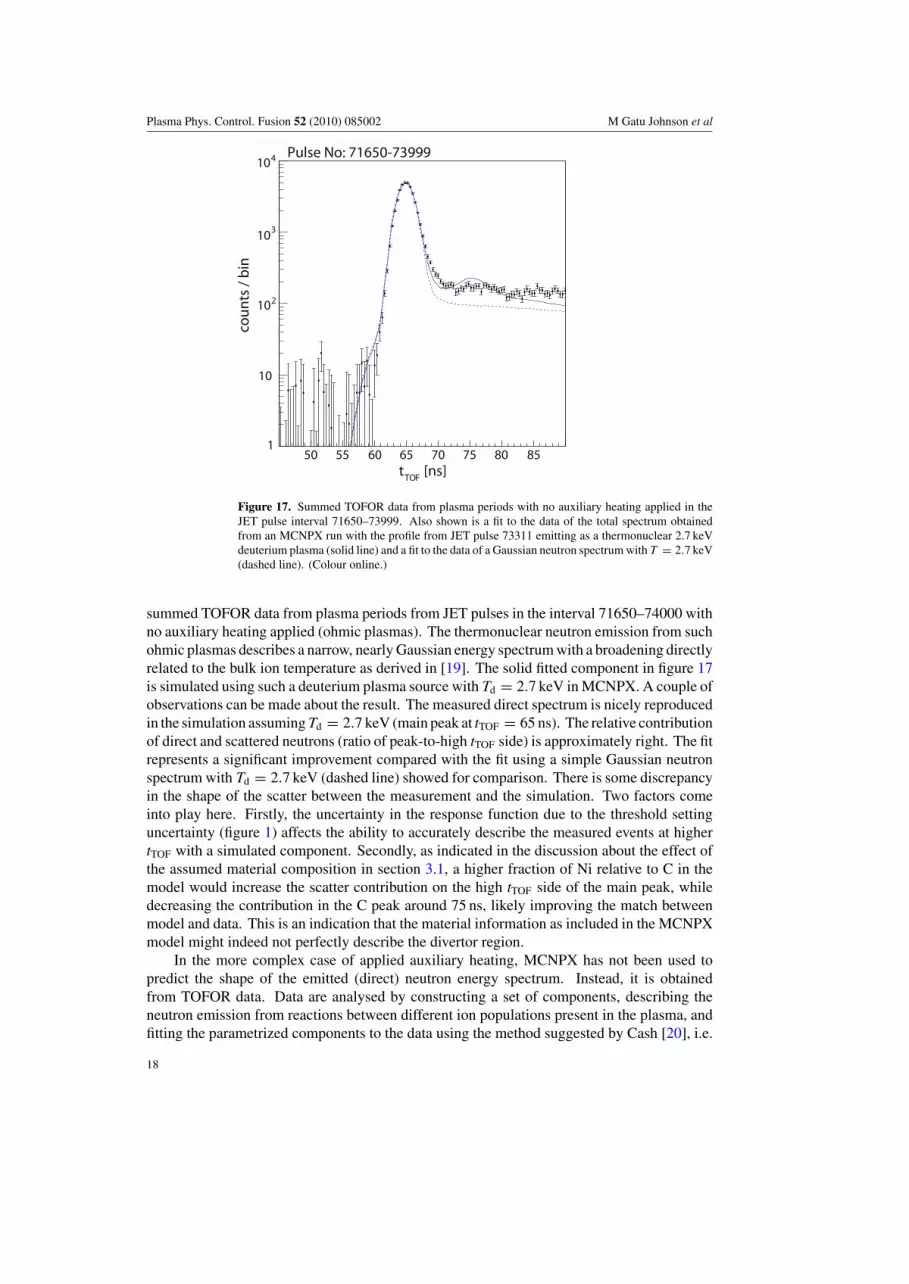
As a general consistency check between model and data, a neutron spectrum as measuredwith TOFOR (points with error bars) is compared with the total simulated neutron energyspectrum obtained from MCNPX (solid blue line) in figure 17. The tTOF spectrum shows
17
Plasma Phys. Control. Fusion 52 (2010) 085002 M Gatu Johnson et al
Figure 17. Summed TOFOR data from plasma periods with no auxiliary heating applied in theJET pulse interval 71650–73999. Also shown is a fit to the data of the total spectrum obtainedfrom an MCNPX run with the profile from JET pulse 73311 emitting as a thermonuclear 2.7 keVdeuterium plasma (solid line) and a fit to the data of a Gaussian neutron spectrum with T = 2.7 keV(dashed line). (Colour online.)
summed TOFOR data from plasma periods from JET pulses in the interval 71650–74000 withno auxiliary heating applied (ohmic plasmas). The thermonuclear neutron emission from suchohmic plasmas describes a narrow, nearly Gaussian energy spectrum with a broadening directlyrelated to the bulk ion temperature as derived in [19]. The solid fitted component in figure 17is simulated using such a deuterium plasma source with Td = 2.7 keV in MCNPX. A couple ofobservations can be made about the result. The measured direct spectrum is nicely reproducedin the simulation assuming Td = 2.7 keV (main peak at tTOF = 65 ns). The relative contributionof direct and scattered neutrons (ratio of peak-to-high tTOF side) is approximately right. The fitrepresents a significant improvement compared with the fit using a simple Gaussian neutronspectrum with Td = 2.7 keV (dashed line) showed for comparison. There is some discrepancyin the shape of the scatter between the measurement and the simulation. Two factors comeinto play here. Firstly, the uncertainty in the response function due to the threshold settinguncertainty (figure 1) affects the ability to accurately describe the measured events at highertTOF with a simulated component. Secondly, as indicated in the discussion about the effect ofthe assumed material composition in section 3.1, a higher fraction of Ni relative to C in themodel would increase the scatter contribution on the high tTOF side of the main peak, whiledecreasing the contribution in the C peak around 75 ns, likely improving the match betweenmodel and data. This is an indication that the material information as included in the MCNPXmodel might indeed not perfectly describe the divertor region.
In the more complex case of applied auxiliary heating, MCNPX has not been used topredict the shape of the emitted (direct) neutron energy spectrum. Instead, it is obtainedfrom TOFOR data. Data are analysed by constructing a set of components, describing theneutron emission from reactions between different ion populations present in the plasma, andfitting the parametrized components to the data using the method suggested by Cash [20], i.e.
18

Plasma Phys. Control. Fusion 52 (2010) 085002 M Gatu Johnson et al
minimization of the metric
C = 2N∑
i=1
(xi − ni ln xi), (2)
where xi is the value of the fitted parameter and ni the number of counts in each bin. A reducedvalue of the metric, Cred, is obtained by dividing by υ–p, where υ is the number of bins and p
the number of free parameters in the fit. As in the case of reduced χ2, Cred should on averagealso tend to unity for a good fit. Note that also the random background, though subtracted inthe figures, is treated as a parameter in the fit.
TOFOR was built to measure the (tTOF manifestation) of the neutron energy spectrum.However, the measured data will be a superposition of direct and scattered neutrons. TOFORanalysis taking scattered neutrons into account is done by (i) estimating the direct spectrumthrough a preliminary fit without taking scattered neutrons into account (ii) folding this directspectrum with the scatter matrix obtained as described in section 3.5 (iii) fitting with thepreliminary scatter component to obtain a better estimate of the direct spectrum and iterating,repeating the process until a good description of the data is obtained. This method was usedalso in the preliminary work in [11].
Pulses with neutral beam (NB) heating (PNB > 10 MW) and no radio frequency (RF)heating from the pulse range 71650–74000 are selected to get a data set with good statisticsand similar features to test the scatter component. Note that only pulses with a fully openprecollimator are included in the selected data set. The direct emission is assumed to consistof three components, describing reactions between two ions from the thermal bulk population,beam-thermal reactions and beam-beam ion reactions, respectively. The thermal component isparametrized as a Gaussian described by its intensity and width (σ = 35.0×√
Td keV, with Td
in keV). In the analysis performed here, the temperature Td is fixed to a value as obtained fromother diagnostics at JET (Ti from charge exchange recombination spectroscopy measurementswhen available, otherwise Te from LIDAR Thomson scattering), leaving only the intensity ofthe thermal component as a free parameter, to reduce the number of free parameters in the fit.The beam-thermal component is parametrized as a uniform distribution in ion energy spacewith the maximum energy (E0) and intensity as free parameters. The shape of the beam-beamcomponent is created from the TRANSP beam distribution output from pulse 73311, usingControlRoom to determine the neutron spectrum when the beam distribution reacts with itself.In this case, only the intensity is left as a free parameter.
Figure 18(a) shows the Cred results from fitting the three direct components only to TOFORdata for the set of NB heated pulses. The mean is Cred = 12.5, with a standard deviation of 5.3.If the scatter component is taken into account using the method outlined above, the result infigure 18(b) is instead obtained, with average Cred = 1.1 and standard deviation 0.30. It is clearthat the scatter component is needed to describe the data. With the shapes of the thermal andbeam-beam components fixed as described above, only the broadening of the beam-thermalcomponent (described by E0) changes significantly between the fits in figures 18(a) and (b).E0 should mimic the injection energy of the neutral beams, i.e. about 80 or 130 keV at JET,depending on the positive ion neutral injector (PINI) used. For the plasmas studied here, allwith mixed PINI heating, the average injection energy for a pulse should fall between 80 and130 keV. Average E0 for all pulses analysed in figure 18 without using a scattered componentis 132 keV (with a max of 165 keV), while the average E0 with use of a scattered componentis 121 keV (with a max of 145 keV). It is clear that E0 comes out closer to what is physicallyexpected when a scattered component is used.
19

Plasma Phys. Control. Fusion 52 (2010) 085002 M Gatu Johnson et al
30
25
20
15
10
5
0
35
71800 72200 72600 73000 73400 73800
Cre
d
Pulse no
(a)
JG09
.419
-18a
2.0
1.0
1.5
0.5
0
2.5
71800 72200 72600 73000 73400 73800
Cre
d
Pulse no
(b)
JG09
.419
-18b
Figure 18. Cred from fits to NB heated JET pulses with PNB > 10 MW from the pulse interval71650–73999 (a) without including a component to account for scattered neutrons in the fit and(b) with a scatter component. Note the different y-axis scales of the two panels.
Examples of fits to TOFOR data for JET pulses 73183, 73311 and 73703 from the set of NBheated pulses are shown in figure 19. Cred in the three cases is 2.03, 0.98 and 0.99, respectively.Also shown in figure 19 are the representations of the components on the En scale. As canbe seen, the thermal emission dominates for pulse 73183, the beam–beam emission is strongfor pulse 73311 and the beam-thermal dominates for pulse 73703, leading to different shapesof the direct spectra with a corresponding perceivable impact on the shape of the scatteredspectra.
In figure 20(a), the data from all NB heated pulses with PNB > 10 MeV in the intervalselected for study are summed to obtain a tTOF spectrum with statistics sufficiently high foranalysis also in the region of 14 MeV neutrons (∼27 ns). The 14 MeV neutron peak in this dataset is due to reactions between bulk deuterium and the tritium from d + d → t + p reactions, i.e.triton burn-up neutrons (TBN). The TBN component shape is simulated using ControlRoom;only the intensity is left as a free parameter in the fit. For simplicity, and since it wouldnot affect the spectrum below tTOF = 55 ns, the beam–beam component is excluded here.Figure 20 shows that the thermal, beam-thermal, TBN and scatter components can be invokedto nicely describe the measured neutron spectrum from En = 1–18 MeV, with the neutronenergy representation illustrated in panel (b). Even the structure due to the first excited stateof 12C (figure 16(b)) can be discerned in the measured data (around tTOF = 40 ns).
As discussed in section 3, the intensity of the direct neutron flux reaching TOFOR shoulddepend on the plasma profile and position while the scattered flux intensity to lowest ordershould not. This could be checked by comparing scatter and direct intensities from the fits tothe set of TOFOR data from NB heated pulses with PNB > 10 MW with the total neutron yieldduring the plasma periods studied as measured with the JET fission chambers (KN1). Such acomparison is done in figure 21(a) (scatter) and b (direct), showing also linear fits to the data(solid red lines). The spread in the two cases is quantified through introducing a goodness offit metric G according to
G =⟨ |yi − l|
σi
⟩(3)
20

Plasma Phys. Control. Fusion 52 (2010) 085002 M Gatu Johnson et al
10
102
103
104
160
(a)
70 80 90 10050
coun
ts /
bin
tTOF (ns)
Pulse no: 73183 @ t = 10.0-18.2s
JG09
.419
-19c
10
102
103
160
(b)
70 80 90 10050
coun
ts /
bin
tTOF (ns)
Pulse no: 73311 @ t = 3.4-10.5s
JG09
.419
-19d
102
103
10
160 70
Pulse No: 73703 @ t = 3.5-9.5s
80 90 10050
coun
ts /
bin
tTOF (ns)
(c)
JG09
.419
-19e
104
106
105
1.5 2.0 2.5
(d)
3.01.0 3.5
dN/d
E (a
.u.)
En (MeV)
JG09
.419
-19f
105
104
103
106
1.5 2.0 2.5
(e)
3.01.0 3.5
dN/d
E (a
.u.)
En (MeV)
JG09
.419
-19g
104
103
105
1.5 2.0 2.5
(f)
3.01.0 3.5
dN/d
E (a
.u.)
En (MeV)
JG09
.419
-19h
Figure 19. Examples of TOFOR data with the total fit (upper solid blue curve), thermal (thinsolid red curve), beam-thermal (double-humped solid black curve), beam-beam (short dashed bluecurve) and scatter (broken black curve) components indicated for JET pulses (a) 73183, (b) 73311and (c) 73703. (d), (e), (f ) show the fitted components on a neutron energy scale for pulses 73183,73311 and 73703, respectively. (Colour online.)
averaged over 253 points (one per pulse) in each plot. It is clear that a lower value of G meansa smaller average deviation from the line in the fit. There is a larger spread for direct/KN1(G = 0.68) compared with scatter/KN1 (G = 0.12), consistent with the hypothesis that thedirect flux is profile and position dependent while the scattered flux is not.
21

Plasma Phys. Control. Fusion 52 (2010) 085002 M Gatu Johnson et al
103
104
105
106
102
30 40 50 60 70 80
(a)
9020 100
coun
ts /
bin
tTOF (ns)
TBN Pulse No: 71729 – 73979
JG09
.419
-20a
10-3
10-2
10-1
1
10-4
04 6 8 10
(b)
12 14 16 182
dN/d
E (a
.u.)
En (MeV)
JG09
.419
-20b
Figure 20. (a) Summed TOFOR data with fitted components and (b) the fitted components on aneutron energy scale from NB heated JET pulses with PNB > 10 MW in the interval 71650–73999.The data are fitted over a tTOF interval including also the 14 MeV neutron peak from d + t reactions,at 27 ns in (a). Fitted components are thermal (thin solid red curve), beam-thermal (double-humpedsolid black curve), triton burn-up (long dashed blue curve) and scatter (dash-dotted black curve).Also shown is the total fit to the data (upper solid blue curve). (Colour online.)
3.5
x10 6
x101
5
3.0
2.5
2.0
1.5
1.0
0.5
(a)
10 20 30 40 50 60 70 80 90
I sca
tter
I KN1
JG09.419-21a x106
x101
52
4
6
8
10
12
14
16
18(b)
10 20 30 40 50 60 70 80 90
I dire
ct
IKN1
JG09.419-21b
Figure 21. (a) Scattered and (b) direct neutrons incident on the primary TOFOR detector asdetermined from the fits to JET NB data in the interval 71650–74000, plotted as functions of thetotal number of neutrons emitted as obtained from the JET fission chambers (KN1). Also shownare fits to the data (solid red lines). (Colour online.)
The average ratio scatter/KN1 is 4.6×10⁻¹¹ and direct/KN1 2.4×10⁻¹⁰. The small spreadin the scatter case justifies normalization of the scatter intensity relative to KN1 to reduce theuncertainty of the fit for pulses with lower neutron emission and hence lower statistics in theTOFOR data.
22

Plasma Phys. Control. Fusion 52 (2010) 085002 M Gatu Johnson et al
0.24
0.22
0.20
0.18
0.16
71800 72200 72600 73000 73400 73800
scat
ter
/ dire
ct
Pulse no
JG09
.419
-22c
Figure 22. Scatter/direct ratio from fits to measured data as a function of pulse number for JETNB data (PNB > 10 MW) from the pulse interval 71650–74000. Also shown is a 0◦ polynomialfit to the data (solid red line). (Colour online.)
4.1. Comparison of experiment and simulation results
It is interesting to compare the scatter/direct ratios obtained from analysis of experimentaldata with those obtained from the simulations as a quantifiable benchmark of the goodness ofthe modelling. When obtaining the numbers for such a comparison, it is of course essentialto integrate the scatter over the same interval from simulations and measurements. Here, weselect a lower cut-off in the integration of En = 1 MeV, since no experimental observation ofthe energy spectrum below this cut-off is possible (figure 2).
Figure 22 shows the scatter/direct ratio from analysis of TOFOR experimental data as afunction of pulse number for the set of similar NB heated pulses described above. Also shownis a zero-degree polynomial fit to the data, giving a scatter/direct average of 0.187 (G = 0.14)
for the set of pulses included. These results are obtained using the method as outlined above,i.e. performing a preliminary fit with direct components only, folding the resulting neutronspectrum with the scatter matrix to get the shape of the scattered component for use in the fit,and then again fitting to the data, now with direct and scattered components. Note that whatcomes out of this is a measured ratio between scattered and direct neutrons, i.e. the relativescatter and direct intensities needed to describe the measured data.
The ratio result from the data analysis can be compared with the corresponding valuegiven by the MCNPX modelling. As discussed above (section 3.5), the scatter intensitywill be dependent on the energy of the source neutrons. The shape of the emitted neutronspectrum varies slightly between the pulses studied (figure 19); it can be approximated asa flat distribution in the range 2.2–2.8 MeV. The average of simulated scatter/direct ratios(En � 1 MeV) for source energies En = 2.2–2.8 MeV is 0.185 (statistical error 0.005). Itshould be stressed that in this case, both the scattered and direct intensities are taken fromthe MCNPX modelling; the scattered intensity from the scatter matrix and the direct from thecorresponding simulated direct flux matrix. This simulation result can be compared with theaverage ratio from analysis of experimental data of 0.187.
23

Plasma Phys. Control. Fusion 52 (2010) 085002 M Gatu Johnson et al
0.181
0.182
0.183
0.184
0.185
0.186
0.187
0.180
0.188
72000 72500 73000 073500 20 40 60
scat
ter
/ dire
ct
Pulse no Frequency
JG09
.419
-23c
Figure 23. Expected variation in scatter/direct ratio due to variations in the direct spectrum shape,plotted as a function of pulse number (left) and as a frequency in scatter/direct space with bins ofwidth 0.05 (right).
The goodness of the 2.2–2.8 MeV flat distribution approximation for the neutron spectrumhas been tested by folding the scatter and direct matrices from MCNPX with the direct spectraobtained from TOFOR analysis, integrating and taking the ratios. The result is illustrated infigure 23, where the obtained scatter/direct ratios are shown as functions of pulse number. Ascan be seen, the spread due to source spectrum shape variations is very small indeed, withvalues ranging from 0.181 to 0.187. The average is 0.185 and the standard deviation 0.001assuming the values are Gaussian distributed in scatter/direct space; this is however not quitethe case as can be seen from the frequency distribution to the right in figure 23.
The agreement between scatter/direct from measurements of 0.187 and simulations of0.185 is remarkable. However, the numbers are subject to a number of uncertainties.Systematic uncertainties in the simulation result are introduced due to the LOS implementationand the material composition selected for use in the model. No attempt is made to quantifythese uncertainties, but the statistical MCNPX uncertainty of 0.005 is likely negligible in thecontext. The main systematic uncertainty in the data analysis is the discriminator thresholdsof TOFOR, with a corresponding uncertainty in the TOFOR response function (figure 1). Thiseffect is quantifiable: redoing the analysis of measured data using response functions with theupper and lower extreme values of the threshold settings within the uncertainty interval (seesection 2) gives average scatter/direct ratios of 0.134 and 0.232 with mean Cred of 1.2 and 1.5,respectively. It should be noted that these values represent the extremes; it is not likely that thethresholds for all 37 TOFOR detector channels systematically deviate �Ep = 60 keV fromthe target values of 380 keV.
A number of uncertainties also affect the obtained result on a pulse-to-pulse basis. Theeffect of the shape of the direct En spectrum has already been discussed (figure 23) and foundto be small. As discussed in section 3, also the location of the plasma and the plasma profilewill play a role. The MCNPX result is obtained using the profile for JET pulse 73311. The
24

Plasma Phys. Control. Fusion 52 (2010) 085002 M Gatu Johnson et al
0.16
0.18
0.20
0.22
0.24
2.96 3.00 3.04 3.08 3.12
Rmag (m)
scat
ter
/ dire
ct
JG09
.419
-24c
Figure 24. Scatter/direct ratio from fits to measured data as a function of average radial position ofthe magnetic axis (Rmag) for JET NB data (PNB > 10 MW) from the pulse interval 71650–74000.Also shown is a fit to the data (solid red line). (Colour online.)
spread in plasma profiles and positions was limited by selecting similar NB heated pulses withhigh neutron emission in the analysis. However, data on the location of the magnetic axis inthe radial and vertical directions can be extracted from the JET database for each of the pulsesstudied. In figure 24, the scatter/direct ratios from figure 23 are plotted as functions of radialmagnetic axis location (Rmag), and in figure 25 as a function of vertical (Zmag). For JET pulse73311, Rmag = 3.09 m and Zmag = 3.05 m.
No strong trends in the plotted scatter/direct values are observed as functions of Rmag
or Zmag - the spread in scatter/direct is in both cases much larger than the, possible, smalldependence on Rmag or Zmag. Also shown in figures 24 and 25 are fits to the data (solidred lines) with slope 0.03 m−1 in the Rmag case (G = 0.14) and −0.02 m−1 in the Zmag
case (G = 0.14). These slopes, if significant, would give position-dependent variations inscatter/direct of 0.005 over the 2.96–3.14 m in the radial case and 0.007 over the 0.04–0.41 min the vertical case. It should be noted that the fitted slopes are consistent with the simulationsin sections 3.3 and 3.4, which showed that the scatter/direct ratio should increase with R inthis region (R > 2.9 m) in the radial case and decrease with Z in the vertical case.
5. Discussion
In summary, it has been shown that the MCNPX simulation scatter results are consistent withthe results from analysis of TOFOR measurements. Variations in neutron source shape, verticaland horizontal position are shown to have a small impact on the shape and intensity of thescattered neutron spectrum in the TOFOR LOS, but a larger impact on the direct flux. Thematerial composition used in the MCNPX model will have a direct impact on the shape ofthe scatter component. This means that it is essential to make every effort to obtain a gooddescription of the vessel wall constituents on a nuclide level. It also means that the shape ofthe scattered spectrum will be dependent on viewing geometry; a horizontal radial view at JET,for instance, would not include scattered neutrons from the divertor region but from the inner
25

Plasma Phys. Control. Fusion 52 (2010) 085002 M Gatu Johnson et al
0.16
0.18
0.20
0.22
0.24
0 0.1 0.2 0.3 0.4Zmag (m)
scat
ter
/ dire
ct
JG09
.419
-25c
Figure 25. Scatter/direct ratio from fits to measured data as a function of average vertical positionof the magnetic axis (Zmag) for JET NB data (PNB > 10 MW) from the pulse interval 71650–74000.Also shown is a fit to the data (solid red line). (Colour online.)
vessel wall with a quite different material composition. Finally, it also means that any changesin the vessel design will require new simulations to determine the corresponding new scattermatrix for use in the data analysis.
Such a vessel design change is currently being undertaken at JET with the installationof the ITER-like wall (ILW). The planned composition of the plasma-facing materials afterthe upgrade is discussed in [21]. Specifically in the divertor region, the central carbon fibrecomposite (CFC) tile will be replaced with a bulk tungsten tile, and the surrounding CFC tilescoated with a 200 µm thick layer of tungsten. A quick test of the impact of these structuralchanges on the scatter spectrum was done by replacing the central CFC tile with a W tile in themodel, neglecting the W coating of the other tiles and the detailed structure of the bulk W tile.In figure 26, the result from this test (solid red) is compared with the result from our modelof the current JET setup (dashed blue), for MCNPX runs with quasi-monoenergetic 2.5 MeVneutrons. As can be seen, the relative contributions from the C and Ni peaks change.
The magnitude of the scattered flux has important implications for the possibility ofusing neutron spectrometry as a tool for determining the fuel ion density ratio, nt/nd, forfuture reactors such as ITER, because of its implications for the feasibility of distinguishingthe 2.5 MeV neutron peak from the background of 14 MeV backscatter. The crucial pointhere is the signal (2.5 MeV DD neutron peak amplitude) to background (14 MeV DT scatteramplitude) ratio in the neutron energy region around 2.5 MeV, which will determine whetheraccurate information about the 2.5 MeV DD neutron flux can be obtained. The model describedin this paper has been used to predict the signal-to-background ratio in the TOFOR LOS atJET for ohmic 2.5 and 20 keV DT plasmas (figure 27). The prediction relies on an assumptionof the relative DT and DD neutron rates, YDT/YDD; assuming a DT plasma with 50% D/T(i.e. nd = nt), this ratio is 210 for a 2.5 keV plasma and 330 for a 20 keV plasma. This givessignal-to-background ratios of about 2 : 1 in the 2.5 keV case and 1 : 2 in the 20 keV case.
Diverging predictions on this signal-to-background ratio at ITER can be found in theliterature (see, e.g. [3–7, 9]). In this paper, we have seen that dedicated simulations taking into
26

Plasma Phys. Control. Fusion 52 (2010) 085002 M Gatu Johnson et al
0.1
0.2
0.3
0.4
0.5
0
0.6
1.0 1.5 2.0 2.50.5 3.0
I (n-
1bi
n-
1 )
En (MeV)
x10-12
“Ni”“C”
JG09
.419
-26c
Figure 26. MCNPX scattered neutron spectra per cm2 on the primary TOFOR detector (sourceneutron energy E = 2.5 ± 0.025 MeV) with a material composition reflecting the current JETdivertor structure (dashed blue) and the planned structure after the installation of the ILW (solidred), respectively. (Colour online.)
103
104
105
106
2 4 6
(a)
8 10 12 14 16
Flu
x (a
.u.)
En (MeV)
JG09
.419
-27a
103
104
105
106
02 4 6
(b)
8 10 12 14 16
Flu
x (a
.u.)
En (MeV)
JG09
.419
-27b
Figure 27. DD (black) and DT (red) neutron fluxes on TOFOR for (a) a 2.5 keV and (b) a 20 keV50/50 D/T plasma at JET, simulated using MCNPX. The relative neutron rates YDT/YDD are 210in the 2.5 keV case and 330 in the 20 keV case, as determined from the temperature dependentMaxwellian reactivites of the DD and DT reactions. (Colour online.)
account the specific LOS information for a planned instrument would be needed in order toaccurately predict the measurement conditions. Two main factors will affect the result:
• The material composition will have a crucial effect on the shape of the scattered neutronspectrum. Any detailed predictions on the signal-to-background ratio in the region ofthe 2.5 MeV DD neutron peak at ITER must include an estimate of the expected nuclidecomposition of the wall.
27

Plasma Phys. Control. Fusion 52 (2010) 085002 M Gatu Johnson et al
• The assumed viewing geometry will have an impact; we have found here that the relativedistances scattering wall—neutron source—detecting instrument affect the simulatedscatter/direct ratios (section 3.4).
The principal source of the observed scattered neutron flux is the fraction of the far vessel wallthat falls within the LOS of the instrument. This means that a change in collimator apertureor length will not affect the signal-to-background ratio, since it will have the same effect ondirect neutrons as on neutrons scattered off the far wall.
6. Conclusions
In this paper, a method of including scattered neutrons in the analysis of neutron spectral datawithout prior knowledge of the plasma source properties is established. A scatter matrix issimulated with scatter spectra as a function of source neutron energy; this matrix is folded withthe direct neutron spectrum for each pulse studied to obtain a plasma-specific scatter componentfor use in the analysis. Simulations show that the shape and magnitude of the scattered spectrumin the TOFOR LOS is only marginally affected by plasma shape and position. This means thatthe same scatter matrix can be used with confidence in the analysis of TOFOR data from mostJET plasma scenarios.
It is shown that the scatter component obtained in this way is essential in describing themeasured TOFOR data. Inclusion of the component in analysis of some 250 NB heated JETpulses gives an average goodness of fit value Cred = 1.1 ± 0.3, while fits that do not takescatter into account give Cred = 12.5 ± 5.3.
The scattered neutron intensity as observed with TOFOR is found to be more closelyrelated than the direct intensity to the total neutron yield as measured with the JET fissionchambers, consistent with the expectation from simulations. The small spread in TOFORscatter intensity relative to the total neutron yield motivates fixing of this parameter in theanalysis relative to the JET fission chambers to improve the accuracy for pulses with lowerstatistics.
The material composition of the scattering wall is identified as crucial in modelling ofthe expected scattered flux. It is also clear that the viewing geometry will have an impact onthe relative intensity of scattered and direct neutrons. This means that a dedicated individualdetermination of the scattered neutron flux is necessary for each relevant instrument location.
Any simulation model based on engineering drawings will include uncertainties in thematerial composition on an isotope level. It would be interesting to be able to measure thedetailed shape of the scattered spectrum, in an energy region with no direct neutron flux.In the case of TOFOR, the instrument response with multiscattered neutrons interferingin the region of energy-degraded scattered neutrons from the vessel makes such detailedmeasurements of the scattered flux difficult, even though TOFOR has the energy bite requiredboth in the 2.5 and 14 MeV cases. However, we show that the scatter spectrum shape obtainedfrom MCNPX simulations in this paper describes the scattered flux sufficiently well over thefull energy range 1–18 MeV.
The excellent agreement between simulations and measurements found in terms ofscatter/direct ratios, with 18.5 ± 0.5% from the simulations and 18.7 ± 5.0% frommeasurements, serves as a solid benchmark of the MCNPX model used. Also a smalldrop in scatter/direct with vertical plasma source displacements and a small increase withradial displacements are observed in the measurements, consistent with the predictions fromsimulations.
28

Plasma Phys. Control. Fusion 52 (2010) 085002 M Gatu Johnson et al
Acknowledgments
This work, supported by the European Communities under the contract of Association betweenEURATOM and VR, was carried out under the framework of the European Fusion DevelopmentAgreement. The views and opinions expressed herein do not necessarily reflect those of theEuropean Commission. The authors gratefully acknowledge all the help from Paul Carman atthe JET drawing office in obtaining data about the material composition in the TOFOR LOS.The computations were performed on UPPMAX resources under Project p2007016.
© Euratom 2010.
References
[1] Jarvis O N 1994 Plasma Phys. Control. Fusion 36 209–44[2] von Goeler S, Johnson L C, Bitter M, Efthimion P C and Roquemore A L 1997 Rev. Sci. Instrum. 68 548–51[3] Kallne J, Batistoni P and Gorini G 1991 Rev. Sci. Instrum. 62 2871[4] Marocco D, Belli F, Bonheure G, Esposito B, Kaschuck Y, Petrizzi L and Riva M 2007 The ITER radial
neutron camera detection system Proc. Int. Workshop on Burning Plasma Diagnostics (Varenna, Italy, 24–28September 2007) AIP Conf. Proc. 988 291
[5] Petrizzi L et al 2007 Fusion Eng. Des. 82 1308–14[6] Moro F, Petrizzi L, Brolatti G, Esposito B, Marocco D and Villari R 2009 Fusion Eng. Des. 84 1351–6[7] Okada K, Kondo K, Sato S, Nishitani T, Nomura. K, Okamoto A, Iwasaki T, Kitajima S and Sasao M 2006 Rev.
Sci. Instrum. 77 10E726[8] Krasa J et al 2008 Plasma Phys. Control. Fusion 50 125006[9] Antozzi P, Gorini G, Kallne J and Ramstrom E 1996 Nucl. Instrum. Methods A 368 457–72
[10] Gatu Johnson M et al 2008 Nucl. Instrum. Methods A 591 417–30[11] Gatu Johnson M et al 2007 The TOFOR neutron spectrometer for high-performance measurements of D plasma
fuel ion properties Proc. Int. Workshop on Burning Plasma Diagnostics (Varenna, Italy, 24–28 September2007) AIP Conf. Proc. 988 311
[12] MCNPX Version 2.5.0 User’s Manual * (LA-CP-05-0369, April 2005) https://mcnpx.lanl.gov/[13] Hjalmarsson A, Conroy S, Ericsson G, Giacomelli L and Kallne J 2006 Response function simulations of the
TOFOR neutron time-of-flight spectrometer Uppsala University Neutron Physics Report UU-NF 06#06[14] Gherendi M et al 2008 J. Optoelectron. Adv. Mater. 10 2092–4[15] Knoll G F 2000 Radiation Detection and Measurement 3rd edn (New York: Wiley)[16] Ongena J et al 2006 Trans. Fusion Sci. Technol. 49 337–45[17] Pankin A, McCune D, Andre R, Bateman G and Kritz A 2004 Comput. Phys. Commun. 159 157–84[18] Ballabio L 2003 Calculation and measurement of the neutron emission spectrum due to thermonuclear and
higher-order reactions in tokamak plasmas PhD Thesis, Acta Universitatis Upsaliensis No 797, Faculty ofScience and Technology, Uppsala University
[19] Lehner G and Pohl F 1967 Z. Phys. 207 83–104[20] Cash W 1979 Astrophys. J. 228 939–47[21] Matthews G F et al 2007 Phys. Scr. T128 137–43
29


