Embed Size (px)
Citation preview
arX
iv:q
-bio
/031
2016
v1 [
q-bi
o.PE
] 1
1 D
ec 2
003
APS/123-QED
Modelling of SARS for Hong Kong
Pengliang Shi∗ and Michael SmallDepartment of Electronic and Information Engineering,
The Hong Kong Polytechnic University, Hung Hom, Kowloon, Hong Kong
(Dated: February 4, 2008)
A simplified susceptible-infected-recovered (SIR) epidemic model and a small-world model areapplied to analyse the spread and control of Severe Acute Respiratory Syndrome (SARS) for HongKong in early 2003. From data available in mid April 2003, we predict that SARS would be controlledby June and nearly 1700 persons would be infected based on the SIR model. This is consistent withthe known data. A simple way to evaluate the development and efficacy of control is described andshown to provide a useful measure for the future evolution of an epidemic. This may contributeto improve strategic response from the government. The evaluation process here is universal andtherefore applicable to many similar homogeneous epidemic diseases within a fixed population. Anovel model consisting of map systems involving the Small-World network principle is also described.We find that this model reproduces qualitative features of the random disease propagation observedin the true data. Unlike traditional deterministic models, scale-free phenomena are observed in theepidemic network. The numerical simulations provide theoretical support for current strategies andachieve more efficient control of some epidemic diseases, including SARS.
PACS numbers: 89.75.Hc, 87.23.Ge
During 2003 SARS killed 916 and infected 8422globally[1]. In Hong Kong (HK), one of the most severelyaffected regions, 1755 individuals were infected and 299died[2]. SARS is caused by a coronavirus, which ismore dangerous and tenacious than the AIDS virus be-cause of its strong ability to survive in moist air andconsiderable potential to infect through close personalcontact[3, 4, 5, 6]. Unlike other well-known epidemicdiseases, such as AIDS, SARS spreads quickly. Althoughsignificant, its mortality rate is, fortunately, relativelylow (approximately 11%)[1]. Researchers have decodedthe genome of SARS coronavirus and developed promptdiagnostic tests and some medicines, a vaccine is still farfrom being developed and widely used[7, 8, 9]. The dan-ger of a recurrence of SARS remains.
Irrespective of pharmacological research, the epidemi-ology study of SARS will help to prevent possible spread-ing of similar future contagions. Generally, current epi-demiological models are of two types. First, the well-known Susceptible-Infected-Recovered (SIR) model pro-posed in 1927[10, 11]. Second, the concept of Small-World (SW) networks[12]. Arousing a new wave of epi-demiological research, the SW model has made someprogress recently[13, 14, 15]. Our work aims to modelSARS data for HK. Practical advice for a better con-trol are drawn from both the SIR and SW models. Inparticular, a generalized method to evaluate control ofan epidemic is promoted here based on the SIR modelwith fixed population. Using this method, measuringthe spread and control of various epidemics among differ-ent countries becomes simple. Quick action in the earlystage is highlighted for both government and individualsto prevent rapid propagation.
∗Electronic address: [email protected]
I. SUSCEPTIBLE-INFECTED-RECOVERED
MODEL
In the SIR model, the fixed population N is dividedinto three distinct groups: Susceptible S, Infected I andRemoved R. Those at risk of the disease are suscepti-ble, those that have it are infected and those that areeither quarantined, dead, or have acquired immunity areremoved. The following flow chart shows the basic pro-cession of the SIR model [11].
rSI aIS → I → R
(1)
Here r and a are the infection coefficient and removalrate, respectively. A discrete model was adapted by Ganifrom the original SIR model through the coarse-grainingprocess and was applied to successfully predict outbreakof influenza epidemics in England and Wales[16, 17].
Si+1 = Si (1 − rIi)
Ii+1 = [rSi + (1 − a)] Ii (2)
Ri+1 = Ri + aIi
During the epidemic process, N = Si + Ii + Ri is fixed.Initially, we examine the data for the first 15 days to
estimate the parameters r and a of SARS for HK. Theonly data are new cases (removal R) announced everydayby HK Dept. of Health from March 12, 2003 followed bya revised version later[2]. To avoid inadvertently usingfuture information we do not use the revised data at thisstage. Population N = 7.3 × 10⁶; since I + R ≪ N it isreasonable to let Si = N in right hand side of (2). I1 = 1and R1 = 0 is set as the initial condition. Ii is replacedwith Ri−1 whereas Ii is uncertain. This assumption im-plies the incubation period is only one day, in spite of the
2
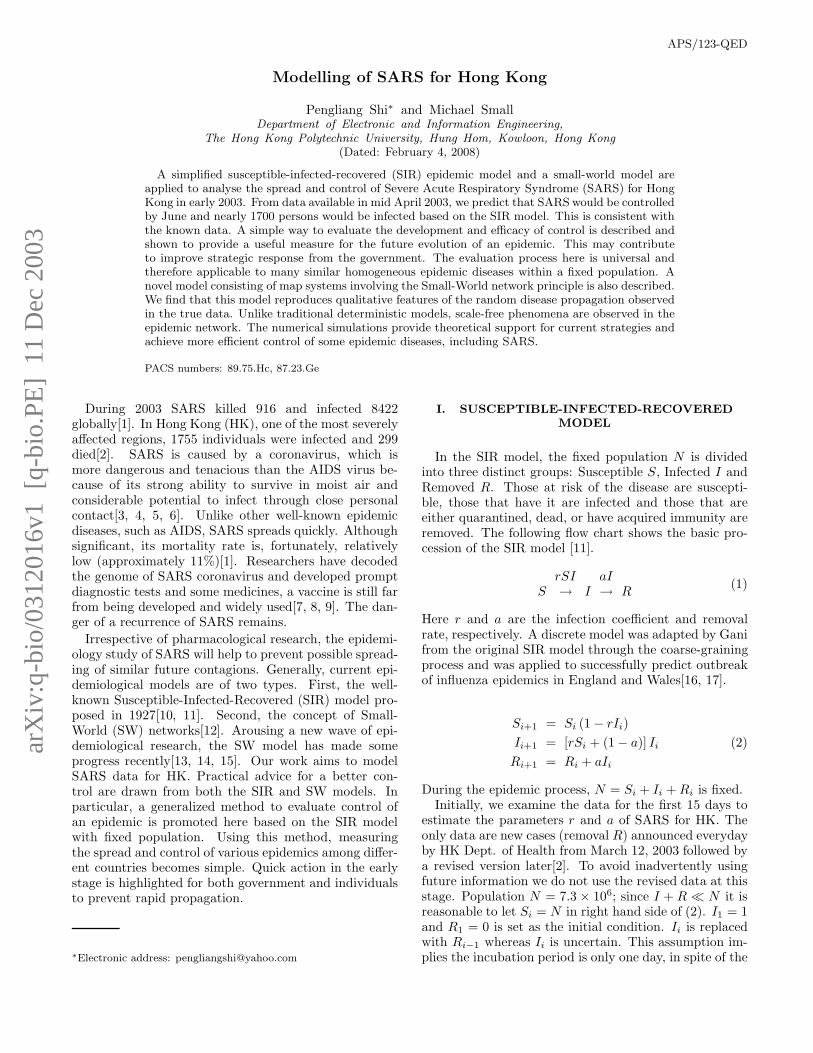
fact that the true incubation period of the coronavirus is2-7 days[8]. The parameters r and a are scanned forthe best fit for the stage. For every (r, a), a sequenceof R′
i+1 is obtained by numerical simulations. An Eu-
clidean norm of∑15
i=1
(
Ri+1 − R′
i+1
)2, which indicates a
distance between the true and simulated data, is appliedto measure the fit. In Fig. 1 (r, a) of the lowest pointis the best fit parameters for this stage and this value isused for the following prediction. We get r = 2.05×10⁻⁷
and a = 1.444. The method is applied to get parametersof a and r in Figs. 2 and 3.
0
2
40.0
2.0x10⁻⁷
4.0x10⁻⁷
6.0x10⁻⁷
4
5
6
7
ln(R
i-Ri')²
ra
FIG. 1: The quantity∑
15
i=1(Ri+1 − R′
i+1)2
vs. r and a isplotted as dots for the first 15 days SARS data for HK. Thenatural logarithm is applied. R and R′ are original and sim-ulated data, respectively. The thick red curve shows the bot-tom of the sharp valley clearly. The lowest point of the valleyis according to the best fit: r = 2.05 × 10⁻⁷ and a = 1.444.
The prediction is available for the trend based on pa-rameters r and a of this stage, the middle day (March20, 2003) of the stage is applied as the first day and
R = 1
15
∑15
i=1Ri+1 is assumed as I. A curve of squares
is plotted in Fig. 2 for the first stage prediction. In thesame way the best fit and prediction is applied for thenext two stages and plotted in Fig. 2. The best fit is alsoprocessed weekly for detail discussion later.
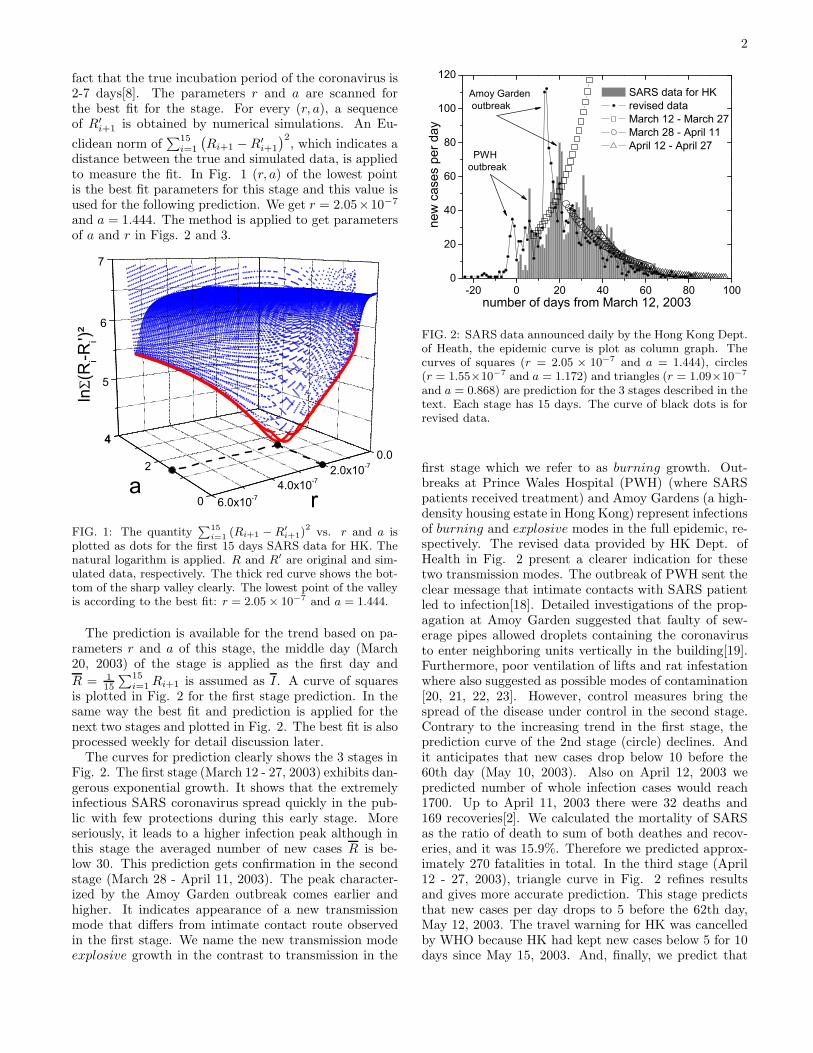
The curves for prediction clearly shows the 3 stages inFig. 2. The first stage (March 12 - 27, 2003) exhibits dan-gerous exponential growth. It shows that the extremelyinfectious SARS coronavirus spread quickly in the pub-lic with few protections during this early stage. Moreseriously, it leads to a higher infection peak although inthis stage the averaged number of new cases R is be-low 30. This prediction gets confirmation in the secondstage (March 28 - April 11, 2003). The peak character-ized by the Amoy Garden outbreak comes earlier andhigher. It indicates appearance of a new transmissionmode that differs from intimate contact route observedin the first stage. We name the new transmission modeexplosive growth in the contrast to transmission in the
-20 0 20 40 60 80 1000
20
40
60
80
100
120 SARS data for HK revised data March 12 - March 27 March 28 - April 11 April 12 - April 27
new
cas
es p
er d
ay
number of days from March 12, 2003
Amoy Garden outbreak
PWHoutbreak
FIG. 2: SARS data announced daily by the Hong Kong Dept.of Heath, the epidemic curve is plot as column graph. Thecurves of squares (r = 2.05 × 10⁻⁷ and a = 1.444), circles(r = 1.55×10⁻⁷ and a = 1.172) and triangles (r = 1.09×10⁻⁷
and a = 0.868) are prediction for the 3 stages described in thetext. Each stage has 15 days. The curve of black dots is forrevised data.
first stage which we refer to as burning growth. Out-breaks at Prince Wales Hospital (PWH) (where SARSpatients received treatment) and Amoy Gardens (a high-density housing estate in Hong Kong) represent infectionsof burning and explosive modes in the full epidemic, re-spectively. The revised data provided by HK Dept. ofHealth in Fig. 2 present a clearer indication for thesetwo transmission modes. The outbreak of PWH sent theclear message that intimate contacts with SARS patientled to infection[18]. Detailed investigations of the prop-agation at Amoy Garden suggested that faulty of sew-erage pipes allowed droplets containing the coronavirusto enter neighboring units vertically in the building[19].Furthermore, poor ventilation of lifts and rat infestationwhere also suggested as possible modes of contamination[20, 21, 22, 23]. However, control measures bring thespread of the disease under control in the second stage.Contrary to the increasing trend in the first stage, theprediction curve of the 2nd stage (circle) declines. Andit anticipates that new cases drop below 10 before the60th day (May 10, 2003). Also on April 12, 2003 wepredicted number of whole infection cases would reach1700. Up to April 11, 2003 there were 32 deaths and169 recoveries[2]. We calculated the mortality of SARSas the ratio of death to sum of both deathes and recov-eries, and it was 15.9%. Therefore we predicted approx-imately 270 fatalities in total. In the third stage (April12 - 27, 2003), triangle curve in Fig. 2 refines resultsand gives more accurate prediction. This stage predictsthat new cases per day drops to 5 before the 62th day,May 12, 2003. The travel warning for HK was cancelledby WHO because HK had kept new cases below 5 for 10days since May 15, 2003. And, finally, we predict that
3
the total cases reaches 1730 and nearly 287 deaths (upto April 27, 2003 there were 668 recovered and 133, themortality increased to 16.6%). These numbers are veryclose to the true data[2]. Precisely the method drawnfrom the SIR model has been verified for prediction forfull epidemic. However, the accuracy is only possible bythe first dividing the epidemic into separate ”stages”.
This problem of determining to what extent an epi-demic is under control is of greater strategic significance.Information on the efficacy of epidemic control will helpdetermine whether to apply more control policies or not,and balance cost and benefit from them. For each indi-vidual the same question will also inform the degree towhich precautions are taken: i.e. wearing a surgical maskto prevent the spread (acquisition) of SARS. Obviously away to estimate control level is required. Actually this isa difficult problem because of significant statistical fluc-tuations in the data. A quite simple method to evaluatecontrol efficiency is discussed below.
In the SIR model (2), if ∆I = Ii+1 − Ii ≤ 0 a diseaseis regards as being controlled as new cases will decrease.This inequality leads to a control criterion for some dis-eases in epidemiology research. Applying the approxi-mation of Si = N we get a threshold Nr ≤ a from (2).We rescale rN → r (r is called infection rate in place ofinfection coefficient now) and then get the threshold thatis free from population N .
r ≤ a (3)
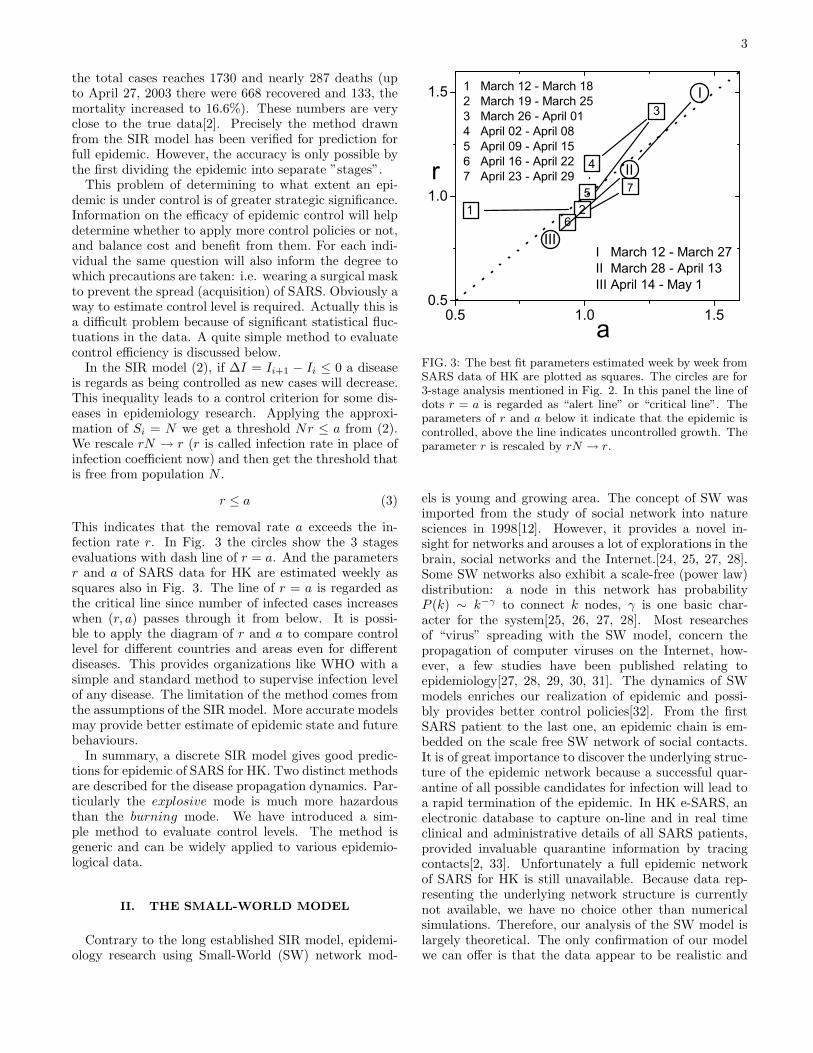
This indicates that the removal rate a exceeds the in-fection rate r. In Fig. 3 the circles show the 3 stagesevaluations with dash line of r = a. And the parametersr and a of SARS data for HK are estimated weekly assquares also in Fig. 3. The line of r = a is regarded asthe critical line since number of infected cases increaseswhen (r, a) passes through it from below. It is possi-ble to apply the diagram of r and a to compare controllevel for different countries and areas even for differentdiseases. This provides organizations like WHO with asimple and standard method to supervise infection levelof any disease. The limitation of the method comes fromthe assumptions of the SIR model. More accurate modelsmay provide better estimate of epidemic state and futurebehaviours.
In summary, a discrete SIR model gives good predic-tions for epidemic of SARS for HK. Two distinct methodsare described for the disease propagation dynamics. Par-ticularly the explosive mode is much more hazardousthan the burning mode. We have introduced a sim-ple method to evaluate control levels. The method isgeneric and can be widely applied to various epidemio-logical data.
II. THE SMALL-WORLD MODEL
Contrary to the long established SIR model, epidemi-ology research using Small-World (SW) network mod-
0.5 1.0 1.50.5
1.0
1.5 1 March 12 - March 182 March 19 - March 253 March 26 - April 014 April 02 - April 085 April 09 - April 156 April 16 - April 227 April 23 - April 29
6
r
a
1 2
3
4
5 7II
III
I
I March 12 - March 27II March 28 - April 13III April 14 - May 1
FIG. 3: The best fit parameters estimated week by week fromSARS data of HK are plotted as squares. The circles are for3-stage analysis mentioned in Fig. 2. In this panel the line ofdots r = a is regarded as “alert line” or “critical line”. Theparameters of r and a below it indicate that the epidemic iscontrolled, above the line indicates uncontrolled growth. Theparameter r is rescaled by rN → r.
els is young and growing area. The concept of SW wasimported from the study of social network into naturesciences in 1998[12]. However, it provides a novel in-sight for networks and arouses a lot of explorations in thebrain, social networks and the Internet.[24, 25, 27, 28].Some SW networks also exhibit a scale-free (power law)distribution: a node in this network has probabilityP (k) ∼ k−γ to connect k nodes, γ is one basic char-acter for the system[25, 26, 27, 28]. Most researchesof “virus” spreading with the SW model, concern thepropagation of computer viruses on the Internet, how-ever, a few studies have been published relating toepidemiology[27, 28, 29, 30, 31]. The dynamics of SWmodels enriches our realization of epidemic and possi-bly provides better control policies[32]. From the firstSARS patient to the last one, an epidemic chain is em-bedded on the scale free SW network of social contacts.It is of great importance to discover the underlying struc-ture of the epidemic network because a successful quar-antine of all possible candidates for infection will lead toa rapid termination of the epidemic. In HK e-SARS, anelectronic database to capture on-line and in real timeclinical and administrative details of all SARS patients,provided invaluable quarantine information by tracingcontacts[2, 33]. Unfortunately a full epidemic networkof SARS for HK is still unavailable. Because data rep-resenting the underlying network structure is currentlynot available, we have no choice other than numericalsimulations. Therefore, our analysis of the SW model islargely theoretical. The only confirmation of our modelwe can offer is that the data appear to be realistic and
4
exhibit the same features as the true epidemic data.
To simulate an epidemic chain, a simple model of so-cial contacts is proposed . The model is established on agrid network weaved by m parallel and m vertical lines.Every node in the network represents a person. We setm = 2700 with population N = m2 = 7.29 × 10⁶. Allnodes are initiated with a value of 0 (named good nodes).Every node has 2, 3 or 4 nearest neighbors as short rangecontacts for corner, edge and center, respectively. For ev-ery node there are two long range contacts with 2 othernodes randomly selected in the whole system everyday.These linkages model the social contact between individ-uals (i.e. social contacts that are sufficiently intimate tobring individuals at risk of spreading the disease). Onerandom node of the system is set to 1 (called the badnode), through its short and long range contacts, thevalue of the nodes linked with it turns into 1 according toprobability of p1 and p2, respectively. An infection hap-pens if a node changes its value from 0 to 1. This changeis irreversible. During the full simulation process, the badnode is not removed from the whole system. We makethis assumption because the number of deaths is small incomparision of the population, and there is no absolutequarantine—even the SARS patient in hospital can affectthe medical workers. Moreover, the treatment period forSARS is relatively length, and during this time infectedindviduals are highly infectious. To reflect the true vari-ation in control strategy and individual behaviour, thecontrol parameters p1,2 (0 ≤ p1,2 ≤ 1) vary with time.
0 20 40 60 80 1000
100
200
300
400
500
0 1000
100
new
cas
es p
er ti
me
unit
time
a) b)
Y
X
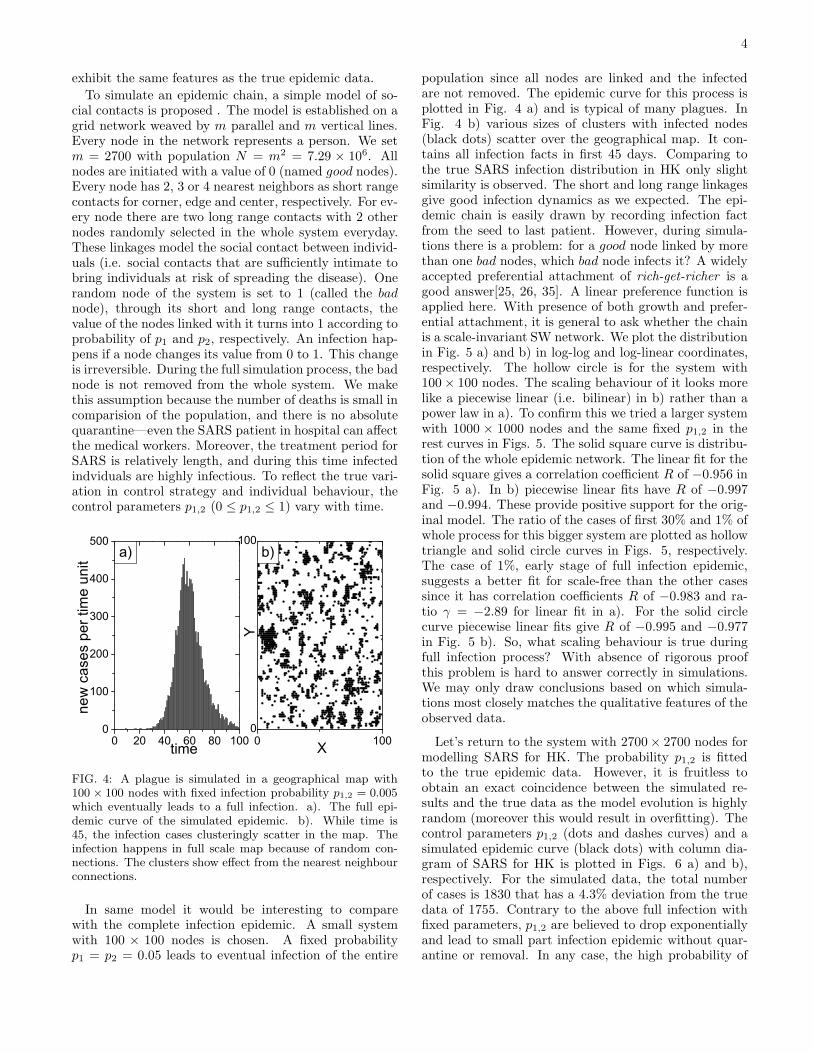
FIG. 4: A plague is simulated in a geographical map with100 × 100 nodes with fixed infection probability p1,2 = 0.005which eventually leads to a full infection. a). The full epi-demic curve of the simulated epidemic. b). While time is45, the infection cases clusteringly scatter in the map. Theinfection happens in full scale map because of random con-nections. The clusters show effect from the nearest neighbourconnections.
In same model it would be interesting to comparewith the complete infection epidemic. A small systemwith 100 × 100 nodes is chosen. A fixed probabilityp1 = p2 = 0.05 leads to eventual infection of the entire
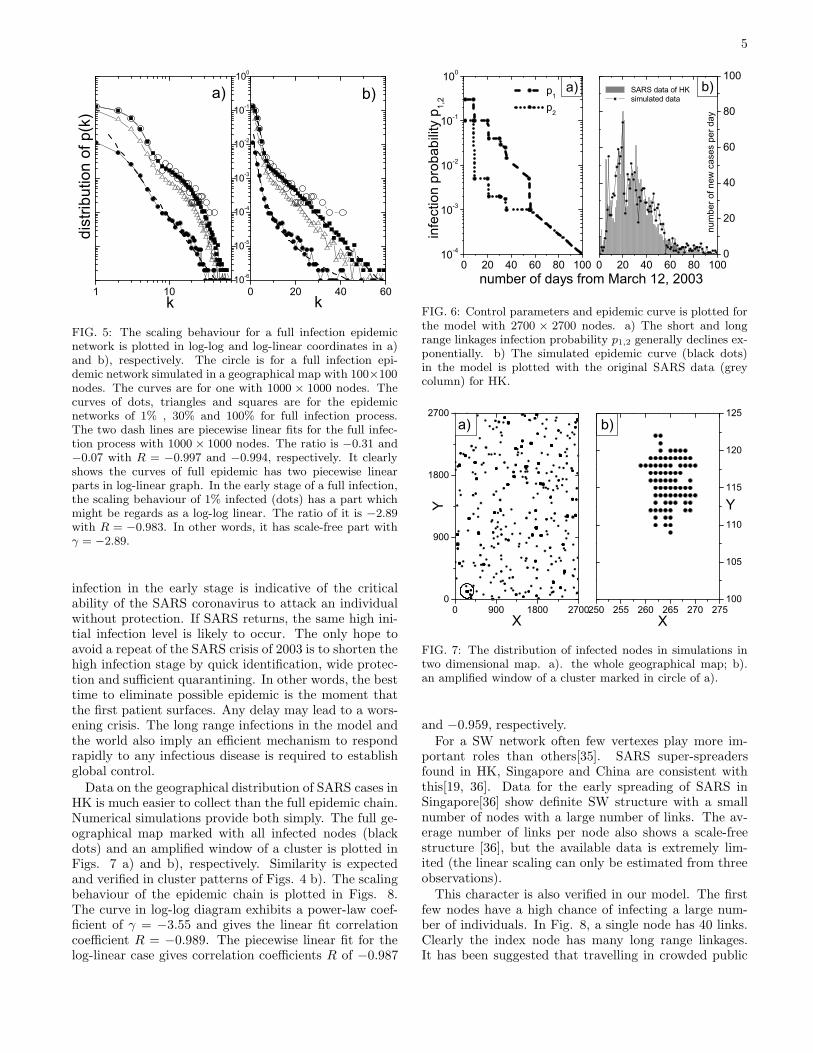
population since all nodes are linked and the infectedare not removed. The epidemic curve for this process isplotted in Fig. 4 a) and is typical of many plagues. InFig. 4 b) various sizes of clusters with infected nodes(black dots) scatter over the geographical map. It con-tains all infection facts in first 45 days. Comparing tothe true SARS infection distribution in HK only slightsimilarity is observed. The short and long range linkagesgive good infection dynamics as we expected. The epi-demic chain is easily drawn by recording infection factfrom the seed to last patient. However, during simula-tions there is a problem: for a good node linked by morethan one bad nodes, which bad node infects it? A widelyaccepted preferential attachment of rich-get-richer is agood answer[25, 26, 35]. A linear preference function isapplied here. With presence of both growth and prefer-ential attachment, it is general to ask whether the chainis a scale-invariant SW network. We plot the distributionin Fig. 5 a) and b) in log-log and log-linear coordinates,respectively. The hollow circle is for the system with100 × 100 nodes. The scaling behaviour of it looks morelike a piecewise linear (i.e. bilinear) in b) rather than apower law in a). To confirm this we tried a larger systemwith 1000 × 1000 nodes and the same fixed p1,2 in therest curves in Figs. 5. The solid square curve is distribu-tion of the whole epidemic network. The linear fit for thesolid square gives a correlation coefficient R of −0.956 inFig. 5 a). In b) piecewise linear fits have R of −0.997and −0.994. These provide positive support for the orig-inal model. The ratio of the cases of first 30% and 1% ofwhole process for this bigger system are plotted as hollowtriangle and solid circle curves in Figs. 5, respectively.The case of 1%, early stage of full infection epidemic,suggests a better fit for scale-free than the other casessince it has correlation coefficients R of −0.983 and ra-tio γ = −2.89 for linear fit in a). For the solid circlecurve piecewise linear fits give R of −0.995 and −0.977in Fig. 5 b). So, what scaling behaviour is true duringfull infection process? With absence of rigorous proofthis problem is hard to answer correctly in simulations.We may only draw conclusions based on which simula-tions most closely matches the qualitative features of theobserved data.
Let’s return to the system with 2700× 2700 nodes formodelling SARS for HK. The probability p1,2 is fittedto the true epidemic data. However, it is fruitless toobtain an exact coincidence between the simulated re-sults and the true data as the model evolution is highlyrandom (moreover this would result in overfitting). Thecontrol parameters p1,2 (dots and dashes curves) and asimulated epidemic curve (black dots) with column dia-gram of SARS for HK is plotted in Figs. 6 a) and b),respectively. For the simulated data, the total numberof cases is 1830 that has a 4.3% deviation from the truedata of 1755. Contrary to the above full infection withfixed parameters, p1,2 are believed to drop exponentiallyand lead to small part infection epidemic without quar-antine or removal. In any case, the high probability of
5
1 10 0 20 40 6010-6
10-5
10-4
10-3
10-2
10-1
100
k
dist
ribut
ion
of p
(k)
k
a) b)
FIG. 5: The scaling behaviour for a full infection epidemicnetwork is plotted in log-log and log-linear coordinates in a)and b), respectively. The circle is for a full infection epi-demic network simulated in a geographical map with 100×100nodes. The curves are for one with 1000 × 1000 nodes. Thecurves of dots, triangles and squares are for the epidemicnetworks of 1% , 30% and 100% for full infection process.The two dash lines are piecewise linear fits for the full infec-tion process with 1000 × 1000 nodes. The ratio is −0.31 and−0.07 with R = −0.997 and −0.994, respectively. It clearlyshows the curves of full epidemic has two piecewise linearparts in log-linear graph. In the early stage of a full infection,the scaling behaviour of 1% infected (dots) has a part whichmight be regards as a log-log linear. The ratio of it is −2.89with R = −0.983. In other words, it has scale-free part withγ = −2.89.
infection in the early stage is indicative of the criticalability of the SARS coronavirus to attack an individualwithout protection. If SARS returns, the same high ini-tial infection level is likely to occur. The only hope toavoid a repeat of the SARS crisis of 2003 is to shorten thehigh infection stage by quick identification, wide protec-tion and sufficient quarantining. In other words, the besttime to eliminate possible epidemic is the moment thatthe first patient surfaces. Any delay may lead to a wors-ening crisis. The long range infections in the model andthe world also imply an efficient mechanism to respondrapidly to any infectious disease is required to establishglobal control.
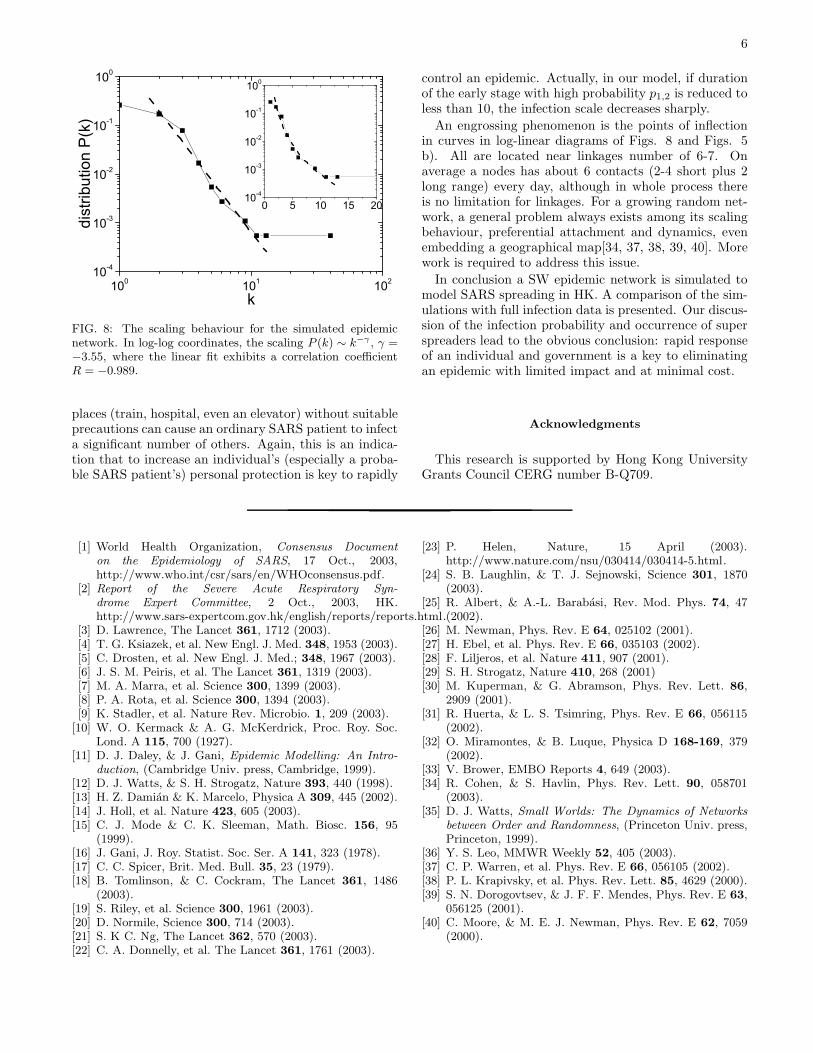
Data on the geographical distribution of SARS cases inHK is much easier to collect than the full epidemic chain.Numerical simulations provide both simply. The full ge-ographical map marked with all infected nodes (blackdots) and an amplified window of a cluster is plotted inFigs. 7 a) and b), respectively. Similarity is expectedand verified in cluster patterns of Figs. 4 b). The scalingbehaviour of the epidemic chain is plotted in Figs. 8.The curve in log-log diagram exhibits a power-law coef-ficient of γ = −3.55 and gives the linear fit correlationcoefficient R = −0.989. The piecewise linear fit for thelog-linear case gives correlation coefficients R of −0.987
0 20 40 60 80 10010-4
10-3
10-2
10-1
100
p1
p2
infe
ctio
n pr
obab
ility
p1,
2
number of days from March 12, 2003
a)
0 20 40 60 80 1000
20
40
60
80
100b)
num
ber o
f new
cas
es p
er d
ay
SARS data of HK simulated data
FIG. 6: Control parameters and epidemic curve is plotted forthe model with 2700 × 2700 nodes. a) The short and longrange linkages infection probability p1,2 generally declines ex-ponentially. b) The simulated epidemic curve (black dots)in the model is plotted with the original SARS data (greycolumn) for HK.
0 900 1800 27000
900
1800
2700
250 255 260 265 270 275100
105
110
115
120
125
b)
Y
X
Y
X
a)
FIG. 7: The distribution of infected nodes in simulations intwo dimensional map. a). the whole geographical map; b).an amplified window of a cluster marked in circle of a).
and −0.959, respectively.For a SW network often few vertexes play more im-
portant roles than others[35]. SARS super-spreadersfound in HK, Singapore and China are consistent withthis[19, 36]. Data for the early spreading of SARS inSingapore[36] show definite SW structure with a smallnumber of nodes with a large number of links. The av-erage number of links per node also shows a scale-freestructure [36], but the available data is extremely lim-ited (the linear scaling can only be estimated from threeobservations).
This character is also verified in our model. The firstfew nodes have a high chance of infecting a large num-ber of individuals. In Fig. 8, a single node has 40 links.Clearly the index node has many long range linkages.It has been suggested that travelling in crowded public
6
100 101 10210-4
10-3
10-2
10-1
100
0 5 10 15 2010-4
10-3
10-2
10-1
100
dist
ribut
ion
P(k
)
k
FIG. 8: The scaling behaviour for the simulated epidemicnetwork. In log-log coordinates, the scaling P (k) ∼ k−γ , γ =−3.55, where the linear fit exhibits a correlation coefficientR = −0.989.
places (train, hospital, even an elevator) without suitableprecautions can cause an ordinary SARS patient to infecta significant number of others. Again, this is an indica-tion that to increase an individual’s (especially a proba-ble SARS patient’s) personal protection is key to rapidly
control an epidemic. Actually, in our model, if durationof the early stage with high probability p1,2 is reduced toless than 10, the infection scale decreases sharply.
An engrossing phenomenon is the points of inflectionin curves in log-linear diagrams of Figs. 8 and Figs. 5b). All are located near linkages number of 6-7. Onaverage a nodes has about 6 contacts (2-4 short plus 2long range) every day, although in whole process thereis no limitation for linkages. For a growing random net-work, a general problem always exists among its scalingbehaviour, preferential attachment and dynamics, evenembedding a geographical map[34, 37, 38, 39, 40]. Morework is required to address this issue.
In conclusion a SW epidemic network is simulated tomodel SARS spreading in HK. A comparison of the sim-ulations with full infection data is presented. Our discus-sion of the infection probability and occurrence of superspreaders lead to the obvious conclusion: rapid responseof an individual and government is a key to eliminatingan epidemic with limited impact and at minimal cost.
Acknowledgments
This research is supported by Hong Kong UniversityGrants Council CERG number B-Q709.
[1] World Health Organization, Consensus Document
on the Epidemiology of SARS, 17 Oct., 2003,http://www.who.int/csr/sars/en/WHOconsensus.pdf.
[2] Report of the Severe Acute Respiratory Syn-
drome Expert Committee, 2 Oct., 2003, HK.http://www.sars-expertcom.gov.hk/english/reports/reports.html.
[3] D. Lawrence, The Lancet 361, 1712 (2003).[4] T. G. Ksiazek, et al. New Engl. J. Med. 348, 1953 (2003).[5] C. Drosten, et al. New Engl. J. Med.; 348, 1967 (2003).[6] J. S. M. Peiris, et al. The Lancet 361, 1319 (2003).[7] M. A. Marra, et al. Science 300, 1399 (2003).[8] P. A. Rota, et al. Science 300, 1394 (2003).[9] K. Stadler, et al. Nature Rev. Microbio. 1, 209 (2003).
[10] W. O. Kermack & A. G. McKerdrick, Proc. Roy. Soc.Lond. A 115, 700 (1927).
[11] D. J. Daley, & J. Gani, Epidemic Modelling: An Intro-
duction, (Cambridge Univ. press, Cambridge, 1999).[12] D. J. Watts, & S. H. Strogatz, Nature 393, 440 (1998).[13] H. Z. Damian & K. Marcelo, Physica A 309, 445 (2002).[14] J. Holl, et al. Nature 423, 605 (2003).[15] C. J. Mode & C. K. Sleeman, Math. Biosc. 156, 95
(1999).[16] J. Gani, J. Roy. Statist. Soc. Ser. A 141, 323 (1978).[17] C. C. Spicer, Brit. Med. Bull. 35, 23 (1979).[18] B. Tomlinson, & C. Cockram, The Lancet 361, 1486
(2003).[19] S. Riley, et al. Science 300, 1961 (2003).[20] D. Normile, Science 300, 714 (2003).[21] S. K C. Ng, The Lancet 362, 570 (2003).[22] C. A. Donnelly, et al. The Lancet 361, 1761 (2003).
[23] P. Helen, Nature, 15 April (2003).http://www.nature.com/nsu/030414/030414-5.html.
[24] S. B. Laughlin, & T. J. Sejnowski, Science 301, 1870(2003).
[25] R. Albert, & A.-L. Barabasi, Rev. Mod. Phys. 74, 47(2002).
[26] M. Newman, Phys. Rev. E 64, 025102 (2001).[27] H. Ebel, et al. Phys. Rev. E 66, 035103 (2002).[28] F. Liljeros, et al. Nature 411, 907 (2001).[29] S. H. Strogatz, Nature 410, 268 (2001)[30] M. Kuperman, & G. Abramson, Phys. Rev. Lett. 86,
2909 (2001).[31] R. Huerta, & L. S. Tsimring, Phys. Rev. E 66, 056115
(2002).[32] O. Miramontes, & B. Luque, Physica D 168-169, 379
(2002).[33] V. Brower, EMBO Reports 4, 649 (2003).[34] R. Cohen, & S. Havlin, Phys. Rev. Lett. 90, 058701
(2003).[35] D. J. Watts, Small Worlds: The Dynamics of Networks
between Order and Randomness, (Princeton Univ. press,Princeton, 1999).
[36] Y. S. Leo, MMWR Weekly 52, 405 (2003).[37] C. P. Warren, et al. Phys. Rev. E 66, 056105 (2002).[38] P. L. Krapivsky, et al. Phys. Rev. Lett. 85, 4629 (2000).[39] S. N. Dorogovtsev, & J. F. F. Mendes, Phys. Rev. E 63,
056125 (2001).[40] C. Moore, & M. E. J. Newman, Phys. Rev. E 62, 7059
(2000).


