Embed Size (px)
Citation preview
Modelling the Asian summer monsoon using CCAM
Kim Chi Nguyen Æ John L. McGregor
Received: 4 July 2007 / Accepted: 6 November 2008 / Published online: 27 November 2008
� Springer-Verlag 2008
Abstract A ten-year mean (1989–1998) climatology of
the Asian summer monsoon is studied using the CSIRO
Conformal-Cubic Atmospheric Model (CCAM) to down-
scale NCEP reanalyses. The aim of the current study is to
validate the model results against previous work on this
topic, in order to identify model strengths and weaknesses
in simulating the Asian summer monsoon. The model
results are compared with available observations and are
presented in two parts. In the first part, the mean summer
rainfall, maximum and minimum temperatures and winds
are compared with the observations. The second part
focuses on validation of the monsoon onset. The model
captures the mean characteristics such as the cross-equa-
torial flow of low-level winds over the Indian Ocean and
near the Somali coast, rainfall patterns, onset indices,
northward movements, active-break and revival periods.
Keywords Regional climate modelling �Asia summer monsoon � Dynamical downscaling �Variable resolution model
1 Introduction
The Asian summer monsoon (ASM) plays a vital role in
China (Ding and Liu 2001), Thailand, Vietnam, Cambodia,
India (Fein and Stephens 1987) and other nearby countries.
The Asian region contains more than 60% of the world
population. Its agricultural and industrial productivity are
heavily dependent on the monsoon seasons (e.g., Fein and
Stephens 1987). However, the monsoon may also bring
destruction to the region and cause thousands of lives to be
lost or displaced, as occurred during the 1998 and 2000
floods in China. It is therefore important to predict the
monsoon seasons to help the affected communities to better
prepare for such destruction, and also to better utilize the
benefits that the monsoon may bring.
Many researchers have described the main dynamical
seasonal features of the ASM: the low-level cross-equato-
rial southwesterly flow over the Indian Ocean towards
South Asia and east China, starting in May (Krishnamurti
1985); the easterly trade winds in the tropical Pacific; the
cyclonic vortex over the south Indian Ocean and a high
pressure system in the western Pacific (Li and Yanai 1996).
Also, in the upper troposphere at 200 hPa, there is a huge
anticyclonic circulation (the Tibetan High) located on the
south side of the Tibetan Plateau (Krishnamurti 1985; Li
and Yanai 1996), with an associated westerly jet to its
north and an easterly jet to its south.
The ASM is affected by the surrounding orography,
especially the Tibetan Plateau (He et al. 1987; Luo and
Yanai 1983, 1984). Due to orography intruding up to the
600 hPa level of the troposphere, the Plateau has a strong
influence on the atmospheric general circulation over the
region, both thermally and dynamically. The Plateau exerts
dynamical blocking of the air motion, resulting in strong
atmospheric perturbations (Liu and Yin 2001) and induces
vertical circulations (He et al. 1987). Sensible heat fluxes
from the elevated ground surface of the Tibetan Plateau in
spring lead to a reversal of the meridional temperature
gradient in the upper troposphere south of the Plateau,
which occurs at the same time as the onset of the ASM (Li
and Yanai 1996). The region is also surrounded by open
oceans, the Indian and the Pacific Ocean, which are the two
major moisture sources contributing to the ASM. Lim et al.
K. C. Nguyen (&) � J. L. McGregor
CSIRO Marine and Atmospheric Research,
PB1, Aspendale, VIC 3195, Australia
e-mail: [email protected]
123
Clim Dyn (2009) 32:219–236
DOI 10.1007/s00382-008-0492-5
(2002) showed that the sea level pressure anomaly over
these oceans is the governing mechanism for the monsoon.
As reported by Kang et al. (2002), general circulation
models (GCMs) have great difficulty in simulating the
correct location and amount of rainfall for the Asian
summer monsoon. Using a limited-area model with a large
domain, Gao et al. (2006) found that the circulation and
rainfall patterns during the mid- to late-monsoon months
improved with increasing model resolution, and they
advocated a minimum grid resolution of 60 km. It has also
been found that increasing model horizontal resolution can
substantially improve the simulation of Meiyu-Baiu frontal
structures and the associated rain (Kusunoki et al. 2006;
Kitoh and Kusunoki 2007). Other researchers have also
used limited-area models to study extreme flood events
with short climate simulations of a few months (Leung
et al. 1999; Wang et al. 2003; Hsu et al. 2004).
The current study uses the CSIRO Conformal Cubic
Atmospheric Model (CCAM) to study the ASM. The
purpose of this research is to verify whether the model can
reproduce significant features reported by Ding (2004) and
other authors. In this way we aim to identify model
strengths and weaknesses in simulating the monsoon in this
region. The west Pacific summer monsoon has close links
to the East Asian summer monsoon and both are influenced
by ENSO; during warm ENSO years, the anomalous anti-
cyclones in the western north Pacific strongly affect the
East Asian monsoon (Wang and Li 2004). The decaying
phase of ENSO has pronounced effects on anomalous
summer rainfall in northern China and Japan (Wu and
Wang 2002). The meridional shift of the ridge of the
western Pacific subtropical high and its zonal migration
influence the locations of convection associated with the
East Asian summer monsoon (Tao and Chen 1987).
The layout of the paper is as follows. The model
description and simulation design are provided in Sect. 2.
The model climatic results over Asia are investigated in
Sect. 3. Section 4 concentrates on further aspects of the
simulation of the Asian summer monsoon. Conclusions are
drawn in Sect. 5.
2 Model description and simulation design
2.1 Model description
CCAM is formulated on a quasi-uniform grid, derived by
projecting the panels of a cube onto the surface of the
Earth. The conformal-cubic grid geometry was devised by
Rancic et al. (1996). Using the Schmidt (1977) transfor-
mation, CCAM can be run in stretched-grid mode to
provide high resolution over any selected region. Com-
pared to the more traditional nested limited-area modelling
approach, CCAM provides great flexibility for dynamical
downscaling from any global climate model, requiring only
sea surface temperatures (SSTs) and (optionally) some
form of nudging from the host model (McGregor and Dix
2001). It avoids a number of problems that may occur with
limited-area regional climate models, such as reflections at
lateral boundaries, as discussed by Wang et al. (2004).
The dynamical formulation of CCAM includes a num-
ber of distinctive features. The model is hydrostatic, with
two-time-level semi-implicit time differencing. It employs
semi-Lagrangian advection with bi-cubic horizontal inter-
polation (McGregor 1993, 1996), together with total-
variation-diminishing vertical advection. The grid is un-
staggered, but the winds are transformed reversibly to/from
C-staggered locations before/after the gravity wave calcu-
lations, providing improved dispersion characteristics
(McGregor 2005b). Three-dimensional Cartesian repre-
sentation is used during the calculation of departure points,
and also for the advection or diffusion of vector quantities.
As with most semi-Lagrangian models, the time differ-
encing is made weakly implicit by off-centering (Rivest
et al. 1994) in order to avoid resonances near steep orog-
raphy for large Courant numbers. Special care is also taken
in the advection of temperature and surface pressure near
terrain. Further details of the model dynamical formulation
are provided by McGregor and Dix (2001) and McGregor
(2005a).
CCAM includes a fairly comprehensive set of physical
parameterizations. The GFDL parameterization for long-
wave and shortwave radiation (Schwarzkopf and Fels
1991) is employed, with interactive cloud distributions
determined by the liquid and ice-water scheme of Rotstayn
(1997). The gravity wave drag scheme of Chouinard et al.
(1986) is included. The model employs a stability-depen-
dent boundary layer scheme based on Monin–Obukhov
similarity theory (McGregor et al. 1993), together with
non-local vertical mixing (Holtslag and Boville 1993) and
also enhanced mixing of cloudy boundary layer air (Smith
1990). A canopy scheme is included, as described by
Kowalczyk et al. (1994), having six layers for soil tem-
peratures, six layers for soil moisture (solving Richard’s
equation), and three layers for snow. CCAM also includes
a simple parameterization to enhance sea surface tempera-
tures under conditions of low wind speed and large
downward solar radiation, affecting the calculation of
ocean surface fluxes.
CCAM employs a mass-flux cumulus convection
scheme (McGregor 2003), which includes both downdrafts
and detrainment. Cloud base is determined by proceeding
downwards to find the first moist adiabatically unstable
layer. It is assumed that the mixing ratio of the air parcel at
the potential cloud base is enhanced by 5% over sea and
15% over land; the latter value is intended to represent the
220 K. C. Nguyen, J. L. McGregor: Modelling the Asian summer monsoon using CCAM
123
greater spatial variability expected in the boundary layer
over land. Convection is permitted up to the uppermost
model layer for which the parcel is moist adiabatically
unstable. The closure is that convection is calculated to be
exhausted during a 20-min convective time-scale, the same
as the model time step for these simulations. Exhaustion
occurs for the smallest possible mass flux such that the
modified environment no longer provides the given cloud
base or supports the convective plume. A simple detrain-
ment scheme is used for deep convection, in that a fraction
of the condensed moisture is transferred to liquid and ice-
water in the environment surrounding the upper part of the
convective tower; a fairly large fraction of 30% is pre-
scribed, which acts to transfer a significant fraction of the
precipitation to the resolved scale. In any time step, three
passes of the convection scheme are performed to avoid the
possibility that the cloud-base or cloud-top layers are only
marginally satisfying the convective stability criteria.
Although the cloud base condition is rather simple; it
permits an estimate of the new cloud-base conditions as a
result of the environment modification, and hence permits a
simple and natural cumulus closure.
2.2 Simulation design
The present CCAM regional climate simulation over Asia
uses a C63 global grid (six panels each having 63 9 63
grid points), with 18 levels in the vertical extending up to
4.5 hPa, with the lowest level at about 38 m. A Schmidt
stretching factor of 0.37 was used, giving about 60 km
resolution over the region of interest, which includes 75–
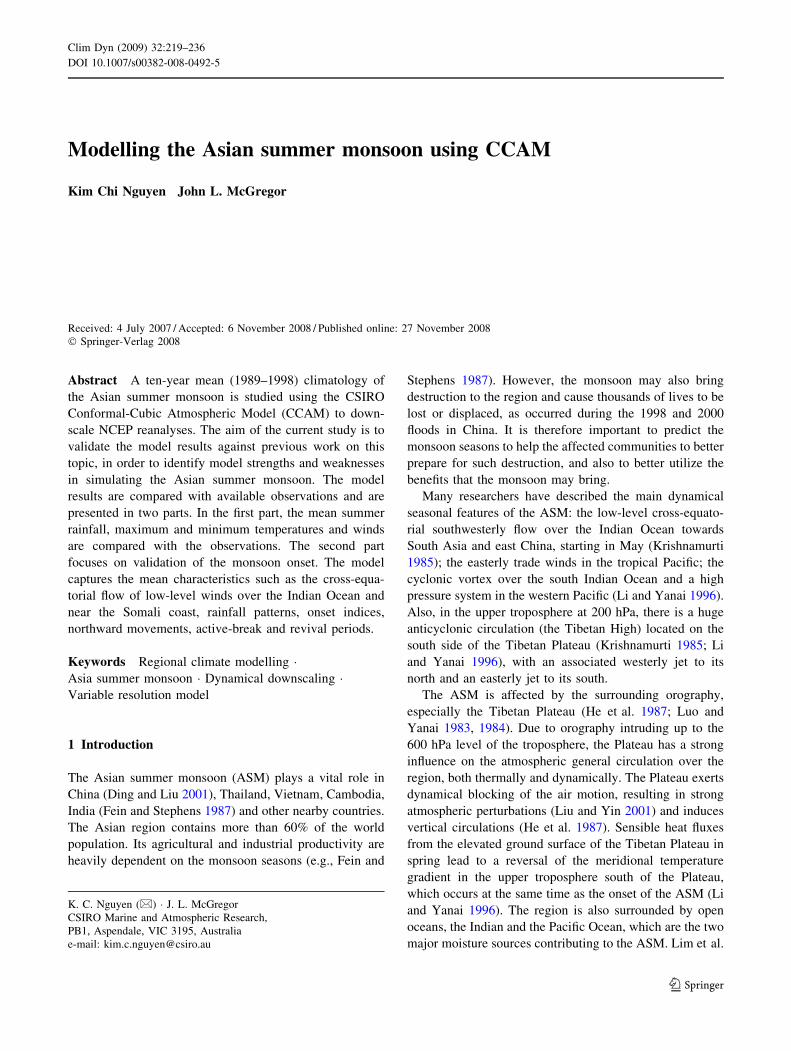
140E and 5–60N. The dominant orography in this region is
the Himalayas, including the Tibetan Plateau, as shown in
Fig. 1. Figure 1 also displays the conformal-cubic grid
cells, shown at one-third resolution. The vegetation types
over the Asian region are specified as mainly broadleaf
evergreen trees (tropical forest) and agriculture or grass-
land. The soil in east China is specified as fine clay to
coarse-medium sandy-loam. West China is specified as
silty-clay-loam, with the same soil type being used over
India. The Indochina Peninsula is specified as silty-clay to
coarse sandy-clay-loam.
The CCAM model can be run in stand-alone mode,
requiring only initial conditions and prescribed fields for
SST and sea-ice. For the simulation described in this
paper, global nudging of winds above 500 hPa from the
large-scale fields is also employed, with an e-folding time,
sefold, of 24 h, to help the jet stream locations of the
modelled synoptic systems follow those of the reanalysis.
This technique is appropriate when comparisons are being
made with specific years (such as when the forcing is
being provided by reanalysis fields). The equations are
described here for the u component, as an example, when
nudged by the host model (or reanalysis) field, uhost.
Applied in a time-split manner, the nudging tendency
equation is
Fig. 1 Orography (m) used for
the simulation. The conformal-
cubic grid cells are also shown,
at one-third resolution
K. C. Nguyen, J. L. McGregor: Modelling the Asian summer monsoon using CCAM 221
123
ou
ot¼ uhost � u
sefold
: ð1Þ
If the value of u before the nudging correction is denoted
by u0, the analytic solution of (1) is
usþ1 ¼ uhost þ exp�Dt
sefold
� �ðu0 � uhostÞ: ð2Þ
From (2), it can be seen that if the nudging is applied for a
time interval equal to sefold, then the difference of u from
uhost will be reduced during that time interval by a factor
exp(1). In practice, the following simple finite difference
solution to (1) is used
usþ1 ¼ u0 þ Dtðuhost � u0Þ=sefold: ð3Þ
It may be noted that for some other stretched regional
climate simulations using CCAM, a far-field wind nudging
technique has been employed (McGregor et al. 2002),
where the far-field model resolution may be considered too
coarse to provide a reliable climatology in the coarse
region. Note that the wind-nudging techniques avoid the
lateral boundary problems experienced by limited-area
regional climate models, which typically use a one-way
nesting technique.
A 10.5-year simulation from July 1988 to December
1998 was carried out with initial conditions, sea surface
temperatures (SSTs), sea-ice and upper level nudging of
winds provided by the NCEP-1 reanalyses (Kalnay et al.
1996). The 6 months of 1988 are regarded as a spin-up
period for the simulation. The model output was saved
once per day at 00 GMT, except rainfall was saved every
3 h. The simulation design is very similar to that used for
the CCAM simulation submitted to the Regional Model
Intercomparison Project (Fu et al. 2005), the main differ-
ence being the use of a more recent model version.
3 Mean states of JJA rainfall, temperature and wind
The 10-year (1989–1998) monthly-mean CCAM rainfall
was averaged to produce seasonal averages for June, July
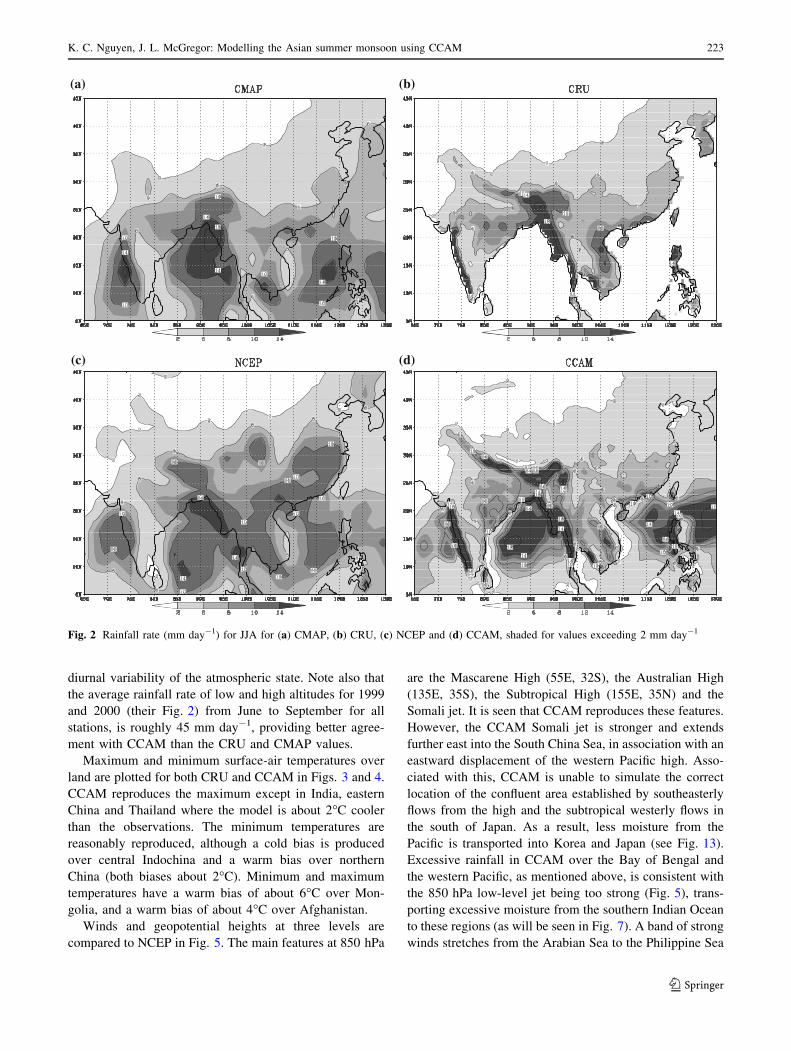
and August (JJA). These averages are compared in Fig. 2
against the observed seasonal rainfall provided by the
Climate Prediction Center Merged Analysis of Precipita-
tion (CMAP) and the Climate Research Unit (CRU), and
also against rainfall from the host NCEP reanalyses. The
horizontal resolution is 2.5� for NCEP and CMAP and
about 0.5� for CRU (which thus should be most compa-
rable to the CCAM rainfall).
In general, CCAM captures well the rainfall patterns
over the land compared to CRU, including high-rainfall
coastal regions such as the long thin strip along the west
coast of India, the east coast of the Bay of Bengal and the
east coast of the Gulf of Thailand. These high-rainfall
strips are related to land–sea contrasts (land roughness and
diurnal temperature effects) and advection of humid air
onto a rising orography. The coastal rainfall peaks along
the west coast of India can be related to deceleration of the
low-level Somali jet by the Indian subcontinent, which
produces surface wind convergence with associated
upward flux of moisture in the eastern Arabian Sea
(Halpern and Woicesshyn 1999); in support of this rela-
tionship, the model produces about 95% correlation (not
shown) of the area-averaged 850 hPa zonal wind compo-
nent over the Arabian Sea (50–65E, 5–15N) with the
rainfall over the land along the west coast (70–77E, 10–20N).
The simulated rainfall peaks along the west coast of India
occur just after midday (not displayed). Over the Bay of
Bengal, the model reproduces the heavy rainfall shown by
CMAP, although the peak is displaced a little westward.
Along the east coast of the Bay of Bengal, simulated
rainfall occurs throughout the day but is heaviest during the
morning with a peak 1 h before midday (not displayed).
CCAM reproduces, but more excessively, the rain sha-
dow (dry) regions off the eastern coasts of India, Sri Lanka,
Malaysia and Vietnam. The dry regions are located over
the water, and on the leeside of the land masses. Over the
oceans, the high rainfall in the western Pacific and north of
the Philippines is reproduced by CCAM, except it is a little
excessive, more east–west oriented and displaced a little
north. On the other hand, NCEP rainfall exceeds CMAP
over east China, Thailand and north Vietnam, but appears
under-estimated over the sea, in particular near the Phil-
ippines and also over the Bay of Bengal. The CCAM
rainfall patterns have much improved detail over the land
areas, compared to the NCEP patterns.
In the foothills of the Himalayas, CCAM produces high
rainfall exceeding 16 mm day-1, somewhat more than the
CRU and CMAP values of 4–6 mm day-1. Note that there
are few observations in this region, and that neither CRU
nor CMAP include corrections for orographic effects or
gauge-undercatch for strong winds. The modelled rainfall
peak is also displaced south of the peak given by the
observation stations, located around latitude 28.4N (see
Fig. 1 of Barros et al. 2000). The CCAM rainfall peak over
the foothills of the Himalayas is produced in the early
morning hours around 0400 LT (not displayed). This
modelled nocturnal rainfall occurs about 2–3 h later than
the observations documented by Barros et al. (2000) and
by Barros and Lang (2003); a more recent description of
the observations is provided at http://www.hyarc.nagoyau.
ac.jp/game/6thconf/html/abs_html/pdfs/T8APB19Oct04100
318.pdf. According to Barros and Lang (2003), there is a
nocturnal rainfall peak during the summer monsoon, and
this is primarily due to an interaction of the monsoon flow
with the south slope of the Himalayas, modulated by the
222 K. C. Nguyen, J. L. McGregor: Modelling the Asian summer monsoon using CCAM
123
diurnal variability of the atmospheric state. Note also that
the average rainfall rate of low and high altitudes for 1999
and 2000 (their Fig. 2) from June to September for all
stations, is roughly 45 mm day-1, providing better agree-
ment with CCAM than the CRU and CMAP values.
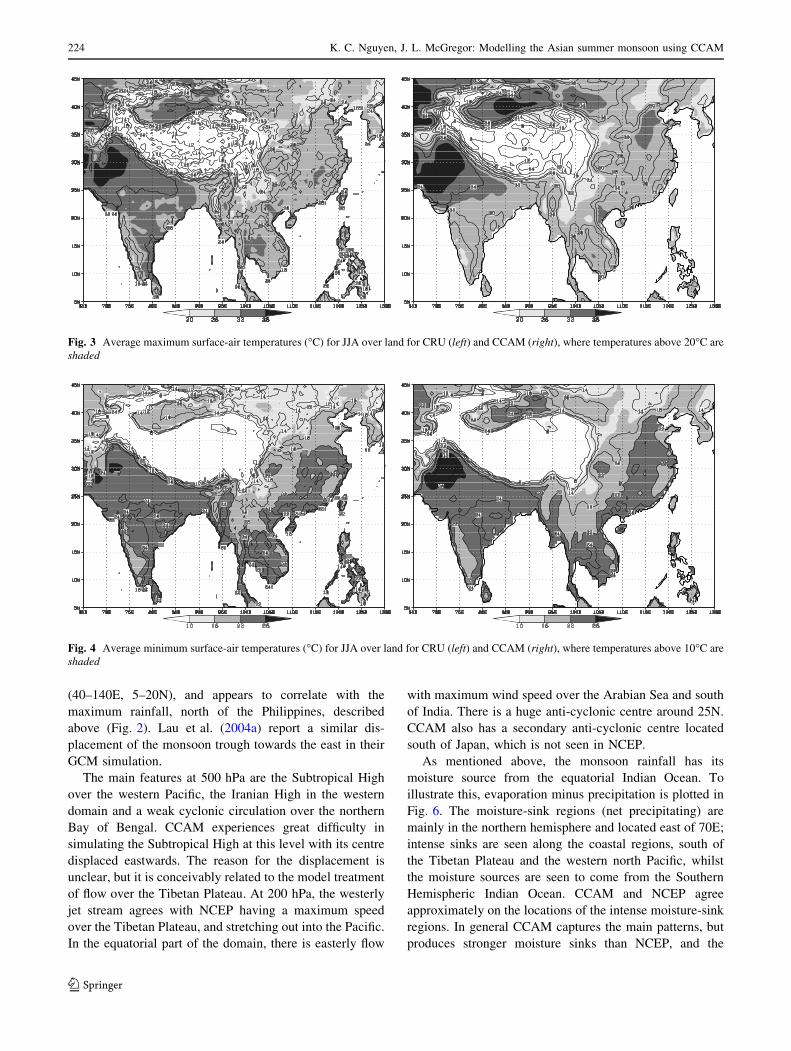
Maximum and minimum surface-air temperatures over
land are plotted for both CRU and CCAM in Figs. 3 and 4.
CCAM reproduces the maximum except in India, eastern
China and Thailand where the model is about 2�C cooler
than the observations. The minimum temperatures are
reasonably reproduced, although a cold bias is produced
over central Indochina and a warm bias over northern
China (both biases about 2�C). Minimum and maximum
temperatures have a warm bias of about 6�C over Mon-
golia, and a warm bias of about 4�C over Afghanistan.
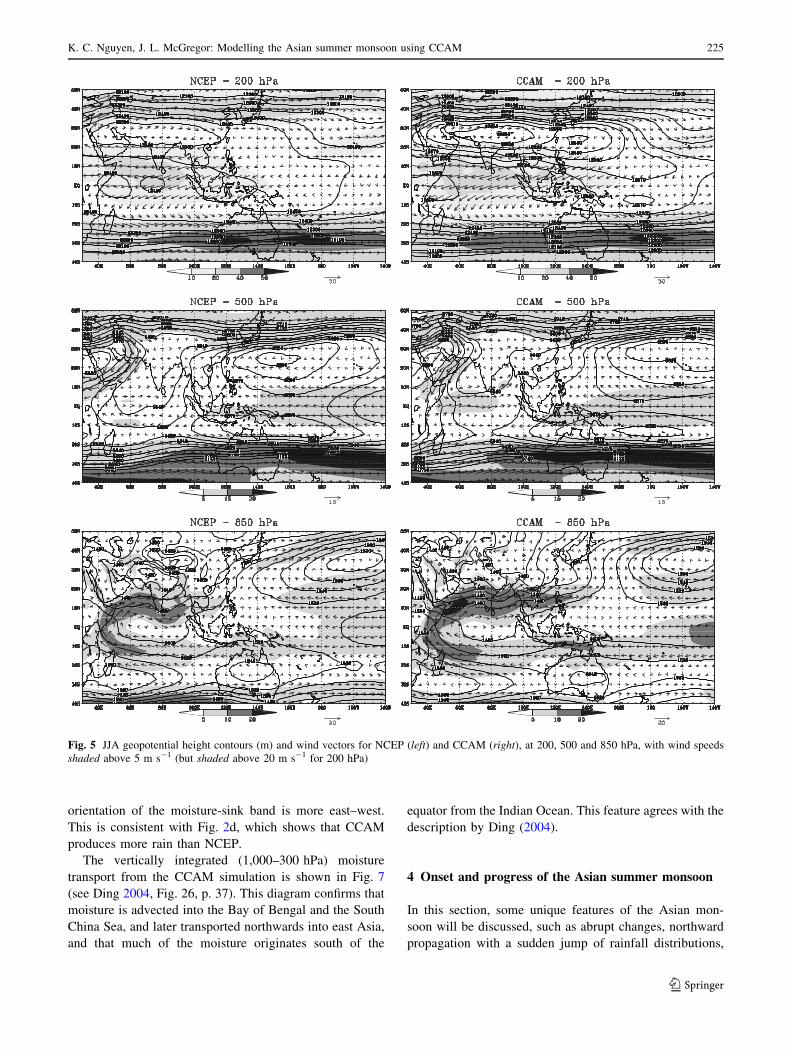
Winds and geopotential heights at three levels are
compared to NCEP in Fig. 5. The main features at 850 hPa
are the Mascarene High (55E, 32S), the Australian High
(135E, 35S), the Subtropical High (155E, 35N) and the
Somali jet. It is seen that CCAM reproduces these features.
However, the CCAM Somali jet is stronger and extends
further east into the South China Sea, in association with an
eastward displacement of the western Pacific high. Asso-
ciated with this, CCAM is unable to simulate the correct
location of the confluent area established by southeasterly
flows from the high and the subtropical westerly flows in
the south of Japan. As a result, less moisture from the
Pacific is transported into Korea and Japan (see Fig. 13).
Excessive rainfall in CCAM over the Bay of Bengal and
the western Pacific, as mentioned above, is consistent with
the 850 hPa low-level jet being too strong (Fig. 5), trans-
porting excessive moisture from the southern Indian Ocean
to these regions (as will be seen in Fig. 7). A band of strong
winds stretches from the Arabian Sea to the Philippine Sea
(a) (b)
(d)(c)
Fig. 2 Rainfall rate (mm day-1) for JJA for (a) CMAP, (b) CRU, (c) NCEP and (d) CCAM, shaded for values exceeding 2 mm day-1
K. C. Nguyen, J. L. McGregor: Modelling the Asian summer monsoon using CCAM 223
123
(40–140E, 5–20N), and appears to correlate with the
maximum rainfall, north of the Philippines, described
above (Fig. 2). Lau et al. (2004a) report a similar dis-
placement of the monsoon trough towards the east in their
GCM simulation.
The main features at 500 hPa are the Subtropical High
over the western Pacific, the Iranian High in the western
domain and a weak cyclonic circulation over the northern
Bay of Bengal. CCAM experiences great difficulty in
simulating the Subtropical High at this level with its centre
displaced eastwards. The reason for the displacement is
unclear, but it is conceivably related to the model treatment
of flow over the Tibetan Plateau. At 200 hPa, the westerly
jet stream agrees with NCEP having a maximum speed
over the Tibetan Plateau, and stretching out into the Pacific.
In the equatorial part of the domain, there is easterly flow
with maximum wind speed over the Arabian Sea and south
of India. There is a huge anti-cyclonic centre around 25N.
CCAM also has a secondary anti-cyclonic centre located
south of Japan, which is not seen in NCEP.
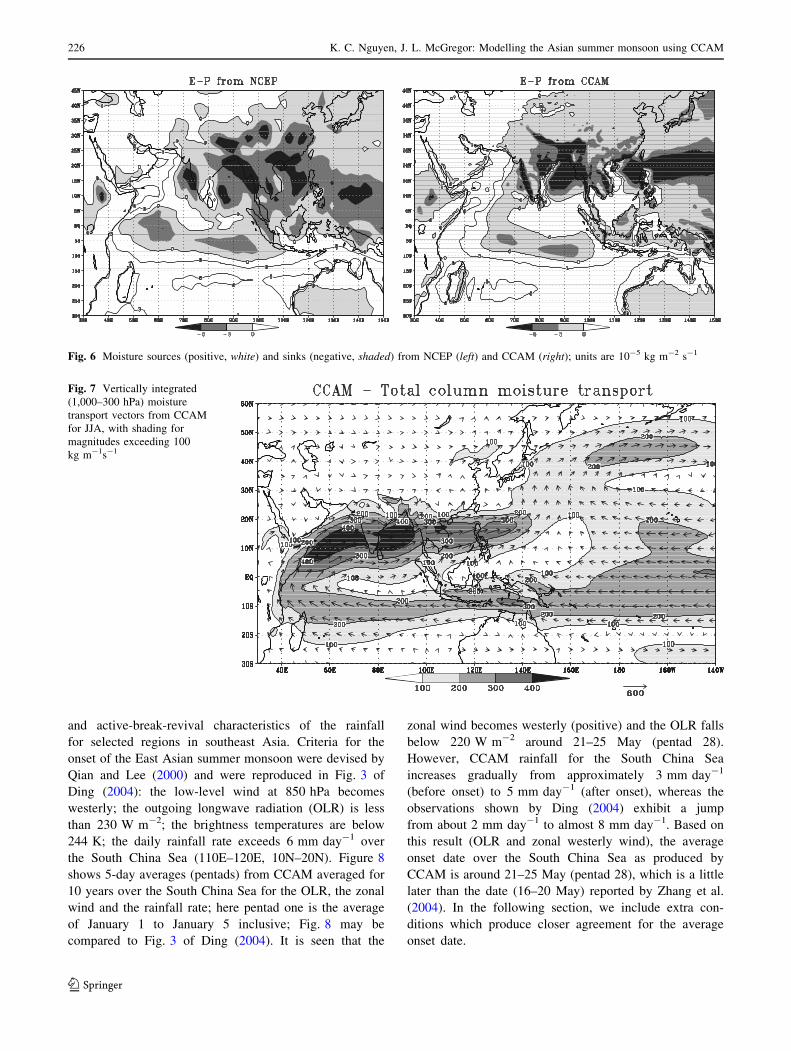
As mentioned above, the monsoon rainfall has its
moisture source from the equatorial Indian Ocean. To
illustrate this, evaporation minus precipitation is plotted in
Fig. 6. The moisture-sink regions (net precipitating) are
mainly in the northern hemisphere and located east of 70E;
intense sinks are seen along the coastal regions, south of
the Tibetan Plateau and the western north Pacific, whilst
the moisture sources are seen to come from the Southern
Hemispheric Indian Ocean. CCAM and NCEP agree
approximately on the locations of the intense moisture-sink
regions. In general CCAM captures the main patterns, but
produces stronger moisture sinks than NCEP, and the
Fig. 3 Average maximum surface-air temperatures (�C) for JJA over land for CRU (left) and CCAM (right), where temperatures above 20�C are
shaded
Fig. 4 Average minimum surface-air temperatures (�C) for JJA over land for CRU (left) and CCAM (right), where temperatures above 10�C are
shaded
224 K. C. Nguyen, J. L. McGregor: Modelling the Asian summer monsoon using CCAM
123
orientation of the moisture-sink band is more east–west.
This is consistent with Fig. 2d, which shows that CCAM
produces more rain than NCEP.
The vertically integrated (1,000–300 hPa) moisture
transport from the CCAM simulation is shown in Fig. 7
(see Ding 2004, Fig. 26, p. 37). This diagram confirms that
moisture is advected into the Bay of Bengal and the South
China Sea, and later transported northwards into east Asia,
and that much of the moisture originates south of the
equator from the Indian Ocean. This feature agrees with the
description by Ding (2004).
4 Onset and progress of the Asian summer monsoon
In this section, some unique features of the Asian mon-
soon will be discussed, such as abrupt changes, northward
propagation with a sudden jump of rainfall distributions,
Fig. 5 JJA geopotential height contours (m) and wind vectors for NCEP (left) and CCAM (right), at 200, 500 and 850 hPa, with wind speeds
shaded above 5 m s-1 (but shaded above 20 m s-1 for 200 hPa)
K. C. Nguyen, J. L. McGregor: Modelling the Asian summer monsoon using CCAM 225
123
and active-break-revival characteristics of the rainfall
for selected regions in southeast Asia. Criteria for the
onset of the East Asian summer monsoon were devised by
Qian and Lee (2000) and were reproduced in Fig. 3 of
Ding (2004): the low-level wind at 850 hPa becomes
westerly; the outgoing longwave radiation (OLR) is less
than 230 W m-2; the brightness temperatures are below
244 K; the daily rainfall rate exceeds 6 mm day-1 over
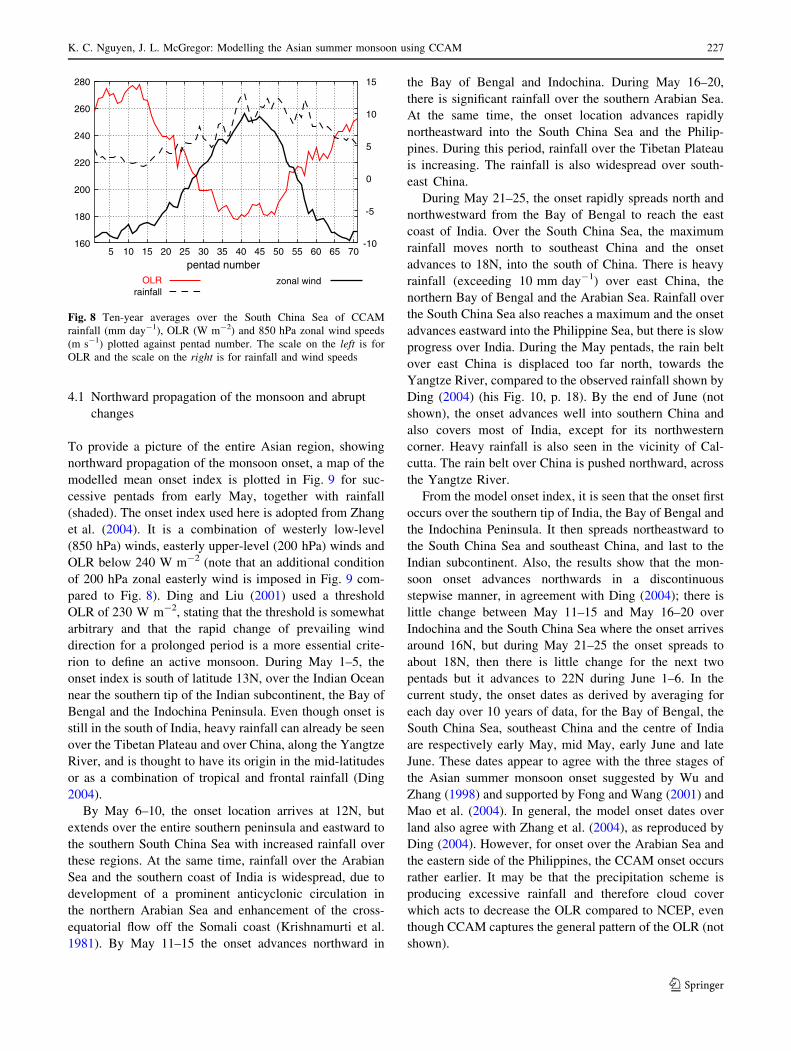
the South China Sea (110E–120E, 10N–20N). Figure 8
shows 5-day averages (pentads) from CCAM averaged for
10 years over the South China Sea for the OLR, the zonal
wind and the rainfall rate; here pentad one is the average
of January 1 to January 5 inclusive; Fig. 8 may be
compared to Fig. 3 of Ding (2004). It is seen that the
zonal wind becomes westerly (positive) and the OLR falls
below 220 W m-2 around 21–25 May (pentad 28).
However, CCAM rainfall for the South China Sea
increases gradually from approximately 3 mm day-1
(before onset) to 5 mm day-1 (after onset), whereas the
observations shown by Ding (2004) exhibit a jump
from about 2 mm day-1 to almost 8 mm day-1. Based on
this result (OLR and zonal westerly wind), the average
onset date over the South China Sea as produced by
CCAM is around 21–25 May (pentad 28), which is a little
later than the date (16–20 May) reported by Zhang et al.
(2004). In the following section, we include extra con-
ditions which produce closer agreement for the average
onset date.
Fig. 6 Moisture sources (positive, white) and sinks (negative, shaded) from NCEP (left) and CCAM (right); units are 10-5 kg m-2 s-1
Fig. 7 Vertically integrated
(1,000–300 hPa) moisture
transport vectors from CCAM
for JJA, with shading for
magnitudes exceeding 100
kg m-1s-1
226 K. C. Nguyen, J. L. McGregor: Modelling the Asian summer monsoon using CCAM
123
4.1 Northward propagation of the monsoon and abrupt
changes
To provide a picture of the entire Asian region, showing
northward propagation of the monsoon onset, a map of the
modelled mean onset index is plotted in Fig. 9 for suc-
cessive pentads from early May, together with rainfall
(shaded). The onset index used here is adopted from Zhang
et al. (2004). It is a combination of westerly low-level
(850 hPa) winds, easterly upper-level (200 hPa) winds and
OLR below 240 W m-2 (note that an additional condition
of 200 hPa zonal easterly wind is imposed in Fig. 9 com-
pared to Fig. 8). Ding and Liu (2001) used a threshold
OLR of 230 W m-2, stating that the threshold is somewhat
arbitrary and that the rapid change of prevailing wind
direction for a prolonged period is a more essential crite-
rion to define an active monsoon. During May 1–5, the
onset index is south of latitude 13N, over the Indian Ocean
near the southern tip of the Indian subcontinent, the Bay of
Bengal and the Indochina Peninsula. Even though onset is
still in the south of India, heavy rainfall can already be seen
over the Tibetan Plateau and over China, along the Yangtze
River, and is thought to have its origin in the mid-latitudes
or as a combination of tropical and frontal rainfall (Ding
2004).
By May 6–10, the onset location arrives at 12N, but
extends over the entire southern peninsula and eastward to
the southern South China Sea with increased rainfall over
these regions. At the same time, rainfall over the Arabian
Sea and the southern coast of India is widespread, due to
development of a prominent anticyclonic circulation in
the northern Arabian Sea and enhancement of the cross-
equatorial flow off the Somali coast (Krishnamurti et al.
1981). By May 11–15 the onset advances northward in
the Bay of Bengal and Indochina. During May 16–20,
there is significant rainfall over the southern Arabian Sea.
At the same time, the onset location advances rapidly
northeastward into the South China Sea and the Philip-
pines. During this period, rainfall over the Tibetan Plateau
is increasing. The rainfall is also widespread over south-
east China.
During May 21–25, the onset rapidly spreads north and
northwestward from the Bay of Bengal to reach the east
coast of India. Over the South China Sea, the maximum
rainfall moves north to southeast China and the onset
advances to 18N, into the south of China. There is heavy
rainfall (exceeding 10 mm day-1) over east China, the
northern Bay of Bengal and the Arabian Sea. Rainfall over
the South China Sea also reaches a maximum and the onset
advances eastward into the Philippine Sea, but there is slow
progress over India. During the May pentads, the rain belt
over east China is displaced too far north, towards the
Yangtze River, compared to the observed rainfall shown by
Ding (2004) (his Fig. 10, p. 18). By the end of June (not
shown), the onset advances well into southern China and
also covers most of India, except for its northwestern
corner. Heavy rainfall is also seen in the vicinity of Cal-
cutta. The rain belt over China is pushed northward, across
the Yangtze River.
From the model onset index, it is seen that the onset first
occurs over the southern tip of India, the Bay of Bengal and
the Indochina Peninsula. It then spreads northeastward to
the South China Sea and southeast China, and last to the
Indian subcontinent. Also, the results show that the mon-
soon onset advances northwards in a discontinuous
stepwise manner, in agreement with Ding (2004); there is
little change between May 11–15 and May 16–20 over
Indochina and the South China Sea where the onset arrives
around 16N, but during May 21–25 the onset spreads to
about 18N, then there is little change for the next two
pentads but it advances to 22N during June 1–6. In the
current study, the onset dates as derived by averaging for
each day over 10 years of data, for the Bay of Bengal, the
South China Sea, southeast China and the centre of India
are respectively early May, mid May, early June and late
June. These dates appear to agree with the three stages of
the Asian summer monsoon onset suggested by Wu and
Zhang (1998) and supported by Fong and Wang (2001) and
Mao et al. (2004). In general, the model onset dates over
land also agree with Zhang et al. (2004), as reproduced by
Ding (2004). However, for onset over the Arabian Sea and
the eastern side of the Philippines, the CCAM onset occurs
rather earlier. It may be that the precipitation scheme is
producing excessive rainfall and therefore cloud cover
which acts to decrease the OLR compared to NCEP, even
though CCAM captures the general pattern of the OLR (not
shown).
160
180
200
220
240
260
280
5 10 15 20 25 30 35 40 45 50 55 60 65 70-10
-5
0
5
10
15
pentad numberOLR
rainfallzonal wind
Fig. 8 Ten-year averages over the South China Sea of CCAM
rainfall (mm day-1), OLR (W m-2) and 850 hPa zonal wind speeds
(m s-1) plotted against pentad number. The scale on the left is for
OLR and the scale on the right is for rainfall and wind speeds
K. C. Nguyen, J. L. McGregor: Modelling the Asian summer monsoon using CCAM 227
123
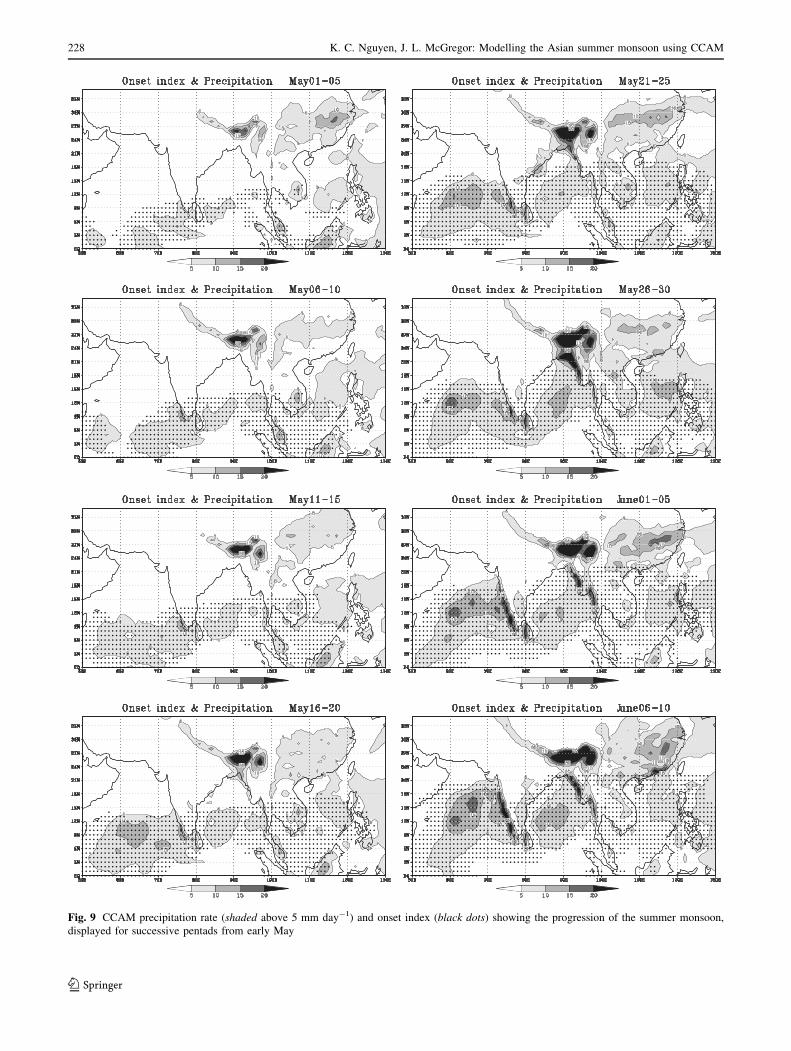
Fig. 9 CCAM precipitation rate (shaded above 5 mm day-1) and onset index (black dots) showing the progression of the summer monsoon,
displayed for successive pentads from early May
228 K. C. Nguyen, J. L. McGregor: Modelling the Asian summer monsoon using CCAM
123
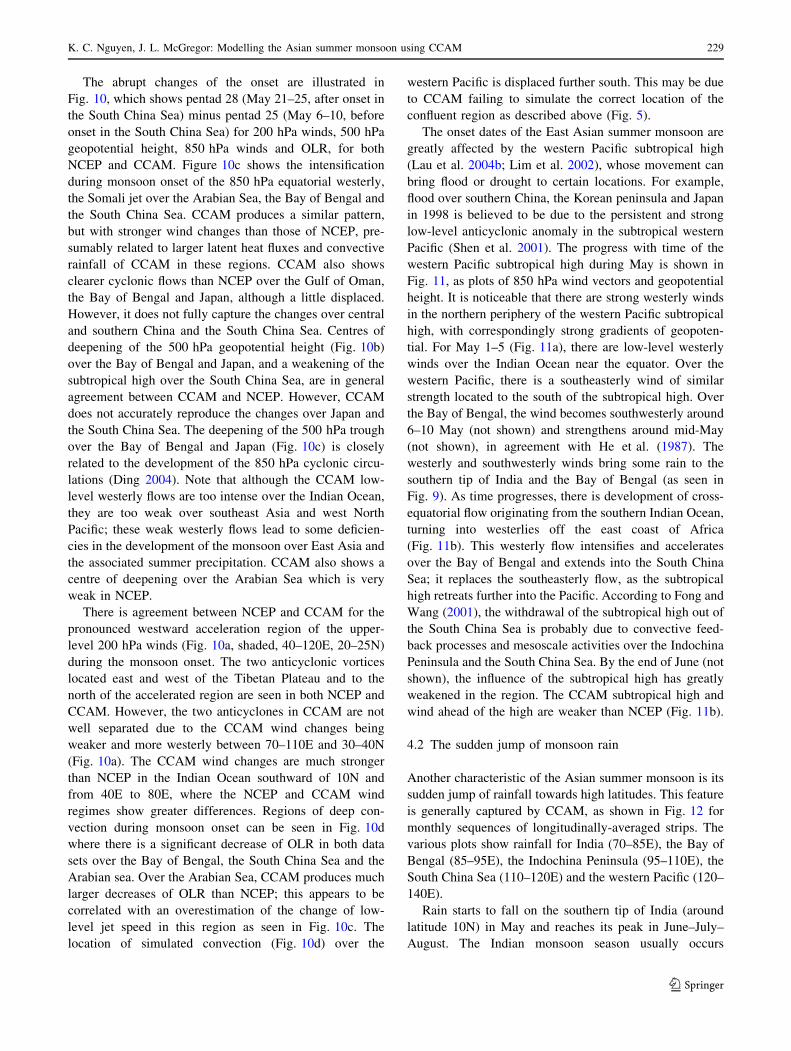
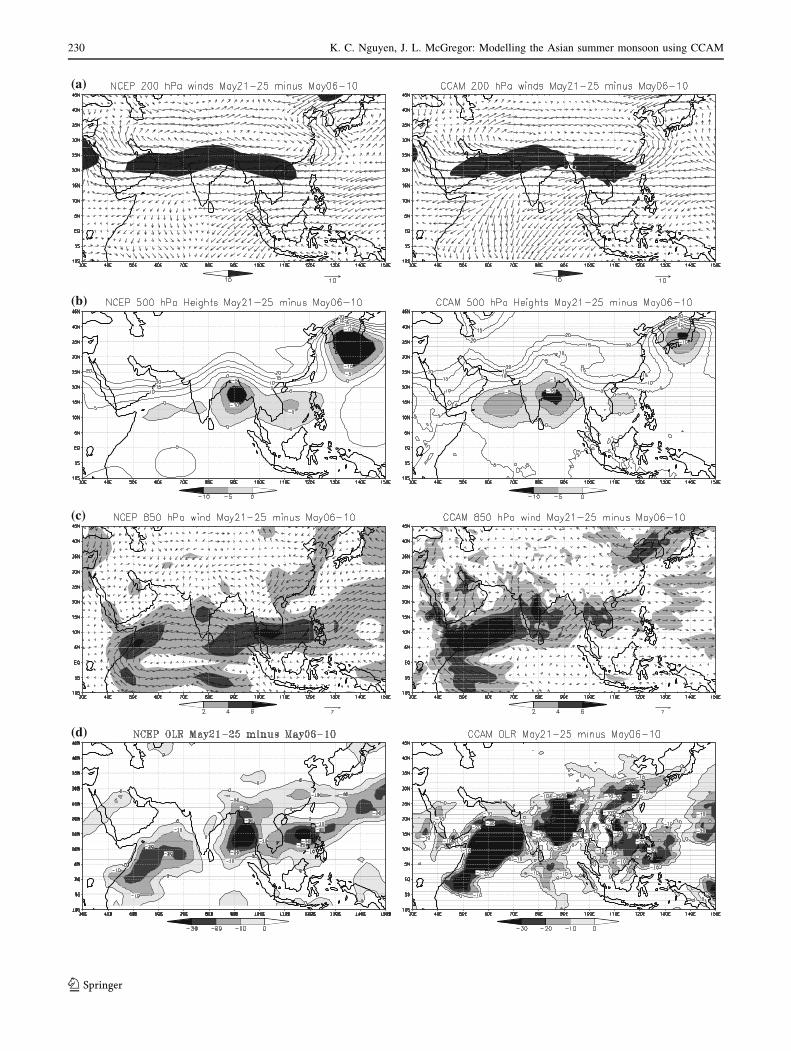
The abrupt changes of the onset are illustrated in
Fig. 10, which shows pentad 28 (May 21–25, after onset in
the South China Sea) minus pentad 25 (May 6–10, before
onset in the South China Sea) for 200 hPa winds, 500 hPa
geopotential height, 850 hPa winds and OLR, for both
NCEP and CCAM. Figure 10c shows the intensification
during monsoon onset of the 850 hPa equatorial westerly,
the Somali jet over the Arabian Sea, the Bay of Bengal and
the South China Sea. CCAM produces a similar pattern,
but with stronger wind changes than those of NCEP, pre-
sumably related to larger latent heat fluxes and convective
rainfall of CCAM in these regions. CCAM also shows
clearer cyclonic flows than NCEP over the Gulf of Oman,
the Bay of Bengal and Japan, although a little displaced.
However, it does not fully capture the changes over central
and southern China and the South China Sea. Centres of
deepening of the 500 hPa geopotential height (Fig. 10b)
over the Bay of Bengal and Japan, and a weakening of the
subtropical high over the South China Sea, are in general
agreement between CCAM and NCEP. However, CCAM
does not accurately reproduce the changes over Japan and
the South China Sea. The deepening of the 500 hPa trough
over the Bay of Bengal and Japan (Fig. 10c) is closely
related to the development of the 850 hPa cyclonic circu-
lations (Ding 2004). Note that although the CCAM low-
level westerly flows are too intense over the Indian Ocean,
they are too weak over southeast Asia and west North
Pacific; these weak westerly flows lead to some deficien-
cies in the development of the monsoon over East Asia and
the associated summer precipitation. CCAM also shows a
centre of deepening over the Arabian Sea which is very
weak in NCEP.
There is agreement between NCEP and CCAM for the
pronounced westward acceleration region of the upper-
level 200 hPa winds (Fig. 10a, shaded, 40–120E, 20–25N)
during the monsoon onset. The two anticyclonic vortices
located east and west of the Tibetan Plateau and to the
north of the accelerated region are seen in both NCEP and
CCAM. However, the two anticyclones in CCAM are not
well separated due to the CCAM wind changes being
weaker and more westerly between 70–110E and 30–40N
(Fig. 10a). The CCAM wind changes are much stronger
than NCEP in the Indian Ocean southward of 10N and
from 40E to 80E, where the NCEP and CCAM wind
regimes show greater differences. Regions of deep con-
vection during monsoon onset can be seen in Fig. 10d
where there is a significant decrease of OLR in both data
sets over the Bay of Bengal, the South China Sea and the
Arabian sea. Over the Arabian Sea, CCAM produces much
larger decreases of OLR than NCEP; this appears to be
correlated with an overestimation of the change of low-
level jet speed in this region as seen in Fig. 10c. The
location of simulated convection (Fig. 10d) over the
western Pacific is displaced further south. This may be due
to CCAM failing to simulate the correct location of the
confluent region as described above (Fig. 5).
The onset dates of the East Asian summer monsoon are
greatly affected by the western Pacific subtropical high
(Lau et al. 2004b; Lim et al. 2002), whose movement can
bring flood or drought to certain locations. For example,
flood over southern China, the Korean peninsula and Japan
in 1998 is believed to be due to the persistent and strong
low-level anticyclonic anomaly in the subtropical western
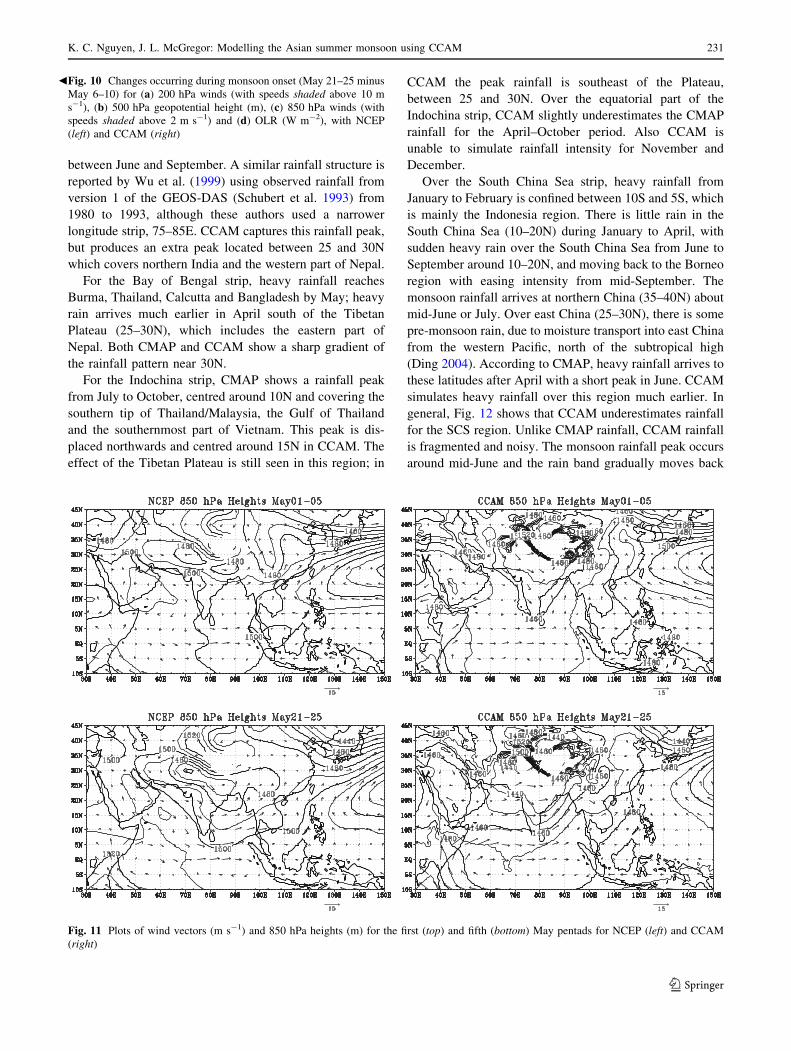
Pacific (Shen et al. 2001). The progress with time of the
western Pacific subtropical high during May is shown in
Fig. 11, as plots of 850 hPa wind vectors and geopotential
height. It is noticeable that there are strong westerly winds
in the northern periphery of the western Pacific subtropical
high, with correspondingly strong gradients of geopoten-
tial. For May 1–5 (Fig. 11a), there are low-level westerly
winds over the Indian Ocean near the equator. Over the
western Pacific, there is a southeasterly wind of similar
strength located to the south of the subtropical high. Over
the Bay of Bengal, the wind becomes southwesterly around
6–10 May (not shown) and strengthens around mid-May
(not shown), in agreement with He et al. (1987). The
westerly and southwesterly winds bring some rain to the
southern tip of India and the Bay of Bengal (as seen in
Fig. 9). As time progresses, there is development of cross-
equatorial flow originating from the southern Indian Ocean,
turning into westerlies off the east coast of Africa
(Fig. 11b). This westerly flow intensifies and accelerates
over the Bay of Bengal and extends into the South China
Sea; it replaces the southeasterly flow, as the subtropical
high retreats further into the Pacific. According to Fong and
Wang (2001), the withdrawal of the subtropical high out of
the South China Sea is probably due to convective feed-
back processes and mesoscale activities over the Indochina
Peninsula and the South China Sea. By the end of June (not
shown), the influence of the subtropical high has greatly
weakened in the region. The CCAM subtropical high and
wind ahead of the high are weaker than NCEP (Fig. 11b).
4.2 The sudden jump of monsoon rain
Another characteristic of the Asian summer monsoon is its
sudden jump of rainfall towards high latitudes. This feature
is generally captured by CCAM, as shown in Fig. 12 for
monthly sequences of longitudinally-averaged strips. The
various plots show rainfall for India (70–85E), the Bay of
Bengal (85–95E), the Indochina Peninsula (95–110E), the
South China Sea (110–120E) and the western Pacific (120–
140E).
Rain starts to fall on the southern tip of India (around
latitude 10N) in May and reaches its peak in June–July–
August. The Indian monsoon season usually occurs
K. C. Nguyen, J. L. McGregor: Modelling the Asian summer monsoon using CCAM 229
123
(a)
(b)
(c)
(d)
230 K. C. Nguyen, J. L. McGregor: Modelling the Asian summer monsoon using CCAM
123
between June and September. A similar rainfall structure is
reported by Wu et al. (1999) using observed rainfall from
version 1 of the GEOS-DAS (Schubert et al. 1993) from
1980 to 1993, although these authors used a narrower
longitude strip, 75–85E. CCAM captures this rainfall peak,
but produces an extra peak located between 25 and 30N
which covers northern India and the western part of Nepal.
For the Bay of Bengal strip, heavy rainfall reaches
Burma, Thailand, Calcutta and Bangladesh by May; heavy
rain arrives much earlier in April south of the Tibetan
Plateau (25–30N), which includes the eastern part of
Nepal. Both CMAP and CCAM show a sharp gradient of
the rainfall pattern near 30N.
For the Indochina strip, CMAP shows a rainfall peak
from July to October, centred around 10N and covering the
southern tip of Thailand/Malaysia, the Gulf of Thailand
and the southernmost part of Vietnam. This peak is dis-
placed northwards and centred around 15N in CCAM. The
effect of the Tibetan Plateau is still seen in this region; in
CCAM the peak rainfall is southeast of the Plateau,
between 25 and 30N. Over the equatorial part of the
Indochina strip, CCAM slightly underestimates the CMAP
rainfall for the April–October period. Also CCAM is
unable to simulate rainfall intensity for November and
December.
Over the South China Sea strip, heavy rainfall from
January to February is confined between 10S and 5S, which
is mainly the Indonesia region. There is little rain in the
South China Sea (10–20N) during January to April, with
sudden heavy rain over the South China Sea from June to
September around 10–20N, and moving back to the Borneo
region with easing intensity from mid-September. The
monsoon rainfall arrives at northern China (35–40N) about
mid-June or July. Over east China (25–30N), there is some
pre-monsoon rain, due to moisture transport into east China
from the western Pacific, north of the subtropical high
(Ding 2004). According to CMAP, heavy rainfall arrives to
these latitudes after April with a short peak in June. CCAM
simulates heavy rainfall over this region much earlier. In
general, Fig. 12 shows that CCAM underestimates rainfall
for the SCS region. Unlike CMAP rainfall, CCAM rainfall
is fragmented and noisy. The monsoon rainfall peak occurs
around mid-June and the rain band gradually moves back
Fig. 11 Plots of wind vectors (m s-1) and 850 hPa heights (m) for the first (top) and fifth (bottom) May pentads for NCEP (left) and CCAM
(right)
Fig. 10 Changes occurring during monsoon onset (May 21–25 minus
May 6–10) for (a) 200 hPa winds (with speeds shaded above 10 m
s-1), (b) 500 hPa geopotential height (m), (c) 850 hPa winds (with
speeds shaded above 2 m s-1) and (d) OLR (W m-2), with NCEP
(left) and CCAM (right)
b
K. C. Nguyen, J. L. McGregor: Modelling the Asian summer monsoon using CCAM 231
123
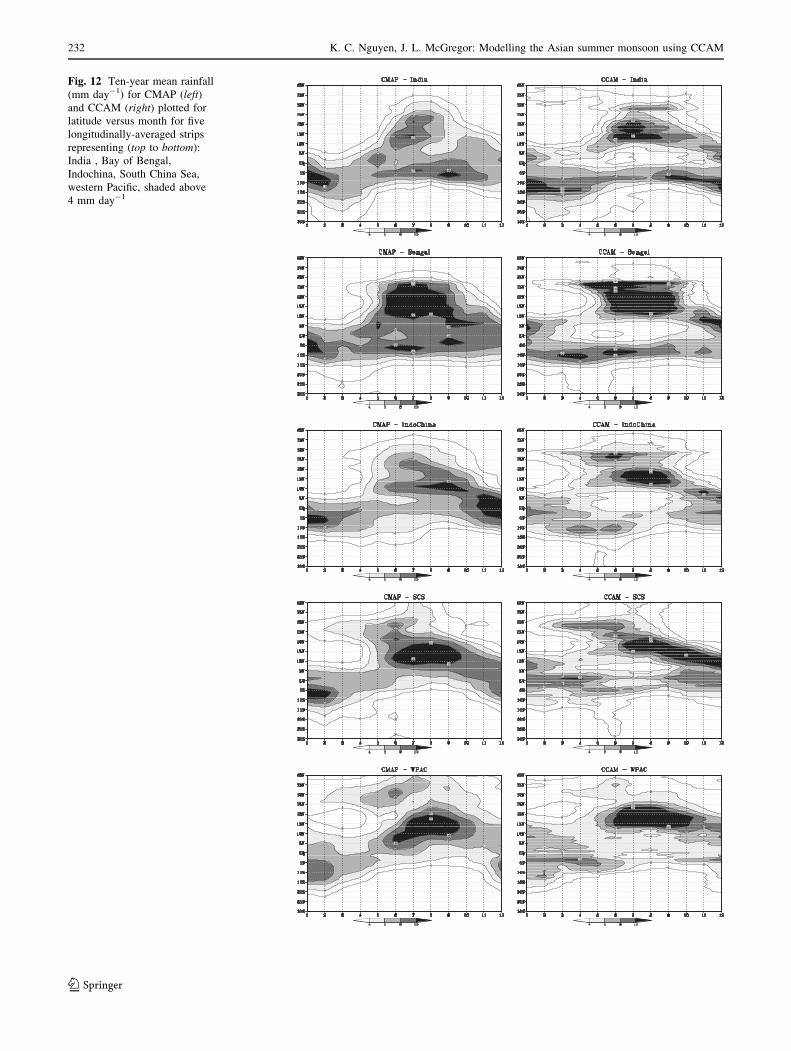
Fig. 12 Ten-year mean rainfall
(mm day-1) for CMAP (left)and CCAM (right) plotted for
latitude versus month for five
longitudinally-averaged strips
representing (top to bottom):
India , Bay of Bengal,
Indochina, South China Sea,
western Pacific, shaded above
4 mm day-1
232 K. C. Nguyen, J. L. McGregor: Modelling the Asian summer monsoon using CCAM
123
southward around August, which is earlier than CMAP,
with intensity remaining unchanged throughout subsequent
months.
Over the western Pacific strip, CMAP shows a similar
structure as in SCS with some heavy rainfall during
December–February, located in the Southern Hemisphere
between 15 and 5S, which is the northern tip of Australia,
Arafura Sea and New Guinea and its surrounding waters.
Sudden heavy rainfall is seen in the Northern Hemisphere
around mid-May, lasting until mid-October, with its peak
between June-mid September, first occurring between 5
and 10N, which is the southern Philippines and surround-
ing water. The heavy rain arrives in the East China Sea
(20–25N) around July and remains there until September
when its starts to move back to the south. On the other
hand, a more sudden jump of this rain band is seen in
CCAM, with its peak confined between 15 and 25N.
CCAM is unable to capture the narrow rain band between
10S and 5N from March to May; instead its rainfall
intensity is confined between 5S and the equator during
these months.
In summary, the above results show that between Jan-
uary and April, heavy rainfall is confined between 10S and
10N for all strips. From May to September, the heavy rain
band is seen north of 10N. These characteristics show a
sudden and northward jump of the monsoon rainfall. In
general, CCAM captures the main features, but it tends to
produce a dry patch around the equator for all regions from
April to October; the cause of this dry patch is unclear.
During the monsoon period, CCAM shows secondary
peaks which are sometimes not seen in CMAP, between 25
and 30N for the India and Indochina strips, possibly related
to CCAM better resolving the orography of the Tibetan
Plateau. CCAM shows less clearly than CMAP the rainfall
at 5–10N which commences around mid-May over all
regions.
0
5
10
15
6 12 18 24 30 36 42 48 54 60 66 72
SCSCMAP
CCAM
0
5
10
6 12 18 24 30 36 42 48 54 60 66 72
SECCMAP
CCAM
0
5
10
6 12 18 24 30 36 42 48 54 60 66 72
IndiaCMAP
CCAM
0
5
10
15
6 12 18 24 30 36 42 48 54 60 66 72
JapanCMAP
CCAM
0
5
10
6 12 18 24 30 36 42 48 54 60 66 72
KoreaCMAP
CCAM
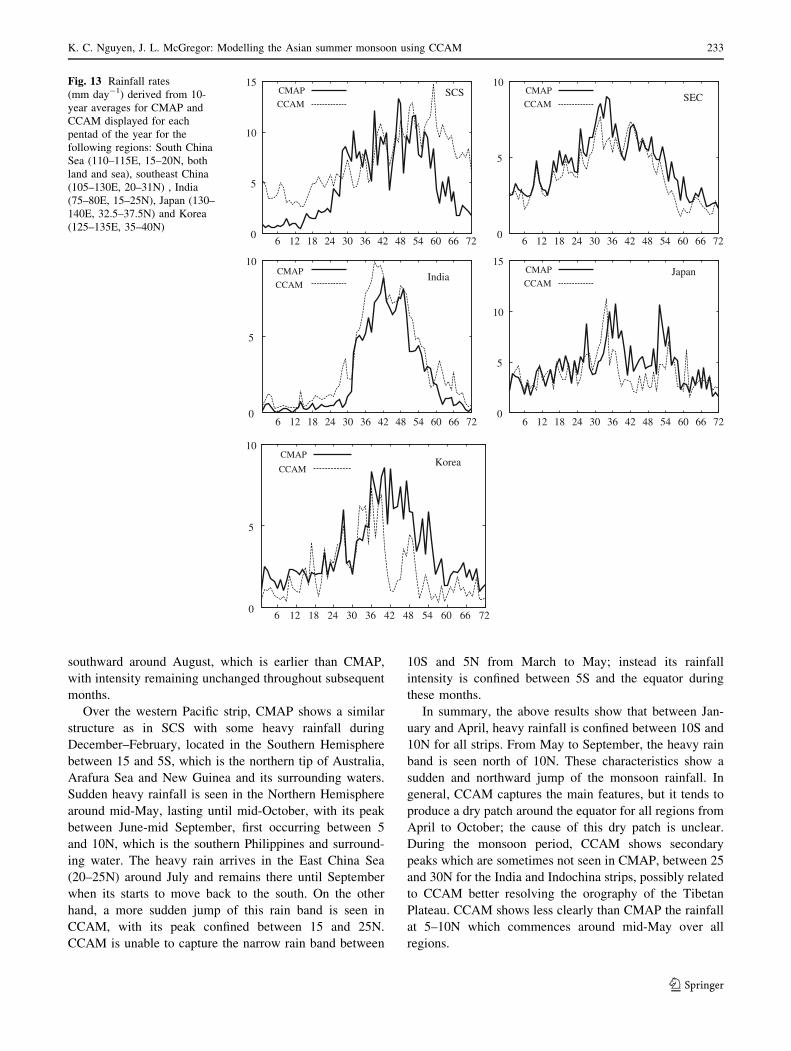
Fig. 13 Rainfall rates
(mm day-1) derived from 10-
year averages for CMAP and
CCAM displayed for each
pentad of the year for the
following regions: South China
Sea (110–115E, 15–20N, both
land and sea), southeast China
(105–130E, 20–31N) , India
(75–80E, 15–25N), Japan (130–
140E, 32.5–37.5N) and Korea
(125–135E, 35–40N)
K. C. Nguyen, J. L. McGregor: Modelling the Asian summer monsoon using CCAM 233
123
4.3 Monsoon breaks
During the monsoon season, there is a period of heavy
rainfall (active, exceeding 5 mm day-1) and also a dry
(break) period when there is little (below 5 mm day-1) or
no rainfall, or a drop in rainfall rate. The summer break
over this region is highly variable from year to year. For
example, over India, Ramamurthy (1969) investigated an
80-year period, 1888–1967, and found that there are years
with no break or up to four breaks. The break length also
varies depending on normal or dry years (Krishnamurti and
Bhalme 1976). The current study shows the climatological
break from CCAM for a 10-year period 1989–1998, whilst
the observations from CMAP are from 1979 to 1999. The
characteristic monsoon active-break-revival (re-occurrence
of heavy rainfall), described by Chen et al. (2004), is seen
from the CCAM results for three of the following five
regions: the South China Sea (110–120E, 15–20N),
southeast China (105–130E, 20–30N, including Taiwan),
India (75–80E, 15–25N), Japan (130–140E, 32.5–37.5N)
and Korea (125–130E, 35–40N). For those five regions, the
time series of area-averaged rainfall rate for both CMAP
and CCAM is plotted for the entire year against pentad
number in Fig. 13.
Over the South China Sea, CCAM rainfall starts
increasing steadily around mid-March (pentad 15). A break
is seen in June (pentads 31–34) and a second break is seen
in July (pentads 37–38); the rainfall attains its peak in late
October (pentad 59), and the rainfall declines thereafter.
Compared to CMAP, CCAM over-predicts the rainfall in
the early and late months of the year. In the observations, a
jump from 3 to 8 mm/day occurs in mid-May (pentad 28);
the rainfall maintains this intensity until early July (pentad
37–38) when a short break is observed. This short break
coincides with the second break in CCAM rainfall.
Over the southeast China region, CCAM rainfall follows
the CMAP rainfall reasonably, although it under-estimates
the rainfall a little. Both plots show rainfall over this region
increasing with time and attaining its peak during June.
CCAM rainfall shows an earlier and longer break, which
starts mid-June (pentad 33) and lasts until mid-July (pentad
40), whereas CMAP shows a break starting around pentad
38, but also reviving around pentad 40. Over India, CCAM
captures the rainfall pattern and the break, although CCAM
slightly over-estimates the rainfall.
Over Japan, CCAM rainfall follows CMAP reasonably
well until mid-May (pentad 26) when CMAP shows its first
peak, which is not captured by CCAM. CCAM predicts the
break period (pentads 41–51) reasonably, but is unable to
capture the heavy rainfall period just before this break,
except for a peak at pentad 34, which is one pentad earlier
than CMAP. In the revival period, CCAM under-predicts
the rainfall.
Over Korea, CCAM rainfall follows CMAP until mid-
June (pentad 32) when CCAM rainfall peaks early; a break
is seen from mid-July till early August (pentads 40–44).
CMAP rainfall peaks a little later (pentad 36) and lasts
longer (till pentad 49), followed by a short break. CCAM
under-predicts rainfall for the second half of the year. It is
seen that CCAM produces much less rain than CMAP over
Korea, as discussed earlier. The under-estimation of rain-
fall over Japan and Korea, in particular for the revival
stage, may be related to incorrectly simulating the conflu-
ent region which is associated with the westward extension
of the western Pacific high being too far into the Pacific
(Fig. 5).
According to Chen et al. (2004) and other researchers,
the active and break periods described for the above
regions, except India and the South China Sea, are caused
by the northward movement of both the Meiyu rain band
and the western Pacific subtropical high. However, the
revivals in southeast China and Taiwan are caused by
northward progression of the ITCZ embedded in the
monsoon trough over the South China Sea (Ramage 1952).
The monsoon revivals over Korea and Japan are caused by
the northward movement of the monsoon rainfall which is
linked to the northward progression of the ITCZ (Chen
et al. 2004). In summary, CCAM generally captures the
rainfall distribution and breaks over India, SEC and Japan.
5 Conclusions
A 10-year simulation has been performed, using CCAM to
downscale the NCEP reanalysis to a resolution of about
60 km over the Asian region. Weak wind nudging was
used above 500 hPa to assist the modelled storm tracks to
approximately follow those of the reanalysis. The simula-
tion captures the mean state of the Asian JJA summer
monsoon season. There is good agreement of rainfall
compared to CRU over land. CCAM appears to systemat-
ically produce excessive dryness downwind of large land
masses. CCAM captures the timing of nocturnal rainfall
over Nepal, although the peak is a little weaker and dis-
placed southward.
Maximum surface-air temperatures have a cold bias (but
less than 2�C) over eastern China, Laos and Thailand.
Minimum surface-air temperatures are reasonably simu-
lated, although a cold bias is produced over central
Indochina and a warm bias over northern China. A large
warm bias in both minimum and maximum temperatures is
seen over Mongolia (6�C) and Afghanistan (4�C). The
modelled low-level Somali jet for JJA is too strong and
intrudes too far eastwards into the western Pacific. This
may contribute to excessive rainfall over the Bay of Bengal
and the western Pacific. CCAM experiences difficulties in
234 K. C. Nguyen, J. L. McGregor: Modelling the Asian summer monsoon using CCAM
123
simulating the locations of the western Pacific high at both
850 and 500 hPa. As a result, CCAM simulates insufficient
rainfall over Japan and Korea in the second half of the year.
The timing of the climatological onset of the monsoon
season is reasonably captured, although the rainfall does
not increase as rapidly as the observations. The changes of
wind, OLR and geopotential height before and after mon-
soon onset are generally captured. However, after monsoon
onset CCAM produces much stronger wind changes than
NCEP over the Indian Ocean southwards of 10N, both at
850 and 200 hPa. CCAM experiences some difficulties in
capturing these changes over Japan, central and southern
China and the South China Sea (Fig. 10b, c). The simula-
tion generally captures the characteristic northward jump
of rainfall of the Asian summer monsoon over regions
spanning 70–140E. It also skillfully reproduces the active-
break-revival behaviour for the southeast China region,
India and probably Japan. However, it has some difficulty
in capturing the rainfall distribution over the South China
Sea during early and late months. Also, CCAM produces
insufficient rainfall along the equator during the monsoon
season (Fig. 12).
Acknowledgments The authors are grateful to Dr. Huqiang Zhang,
Prof. Murari Lal and the anonymous reviewers for their constructive
comments. The observed rainfall was provided by ftp://ftp.cpc.ncep.
noaa.gov/precip/cmap/pentad and ftp://ftp.cpc.ncep.noaa.gov/precip/
cmap/monthly.
References
Barros AP, Lang TJ (2003) Monitoring the monsoon in the
Himalayas: observations in Central Nepal, June 2001. Mon
Weather Rev 131:1408–1427
Barros AP, Joshi M, Putkonen J, Burbank DW (2000) A study of the
1999 monsoon rainfall in the mountainous region in central
Nepal using TRMM products and rain gauge observations. J
Geophys Res 27:3683–3686
Chen TC, Wang SY, Huang WH, Yen MC (2004) Variation of the
East Asian summer monsoon rainfall. J Clim 17:744–762
Chouinard C, Beland M, McFarlane N (1986) A simple gravity wave
drag parametrization for use in medium-range weather forecast
models. Atmos Ocean 24:91–110
Ding Y (2004) Seasonal march of the East-Asian summer monsoon.
In: Chang CP (ed) The East Asian monsoon, vol 2. World
Scientific, Singapore pp 3–53
Ding Y, Liu Y (2001) Onset and the evolution of the Summer
Monsoon over the South China Sea during SCSMEX Field
Experiment in 1998. J Meteorol Soc Jpn 79:255–276
Fein JS, Stephens PL (1987) Monsoons. Wiley, New York
Fong SK, Wang AY (2001) Climatological atlas for Asian summer
monsoon. Macau Meteorological and Geophysical Bureau and
Macau Foundation
Fu C, Wang S, Xiong Z, Gutowski WJ, Lee DK, McGregor JL, Sato
Y, Kato H, Kim JW, Suh MS (2005) Regional climate model
Intercomparison Project for Asia. Bull Am Meteorol Soc
86:257–266
Gao X, Xu Y, Zhao Z, Pal JS, Giorgi F (2006) On the role of
resolution and topography in the simulation of East Asia
precipitation. Theor Appl Climatol 86:173–185
Halpern D, Woicesshyn PM (1999) Onset of the Somali jet in the
Arabian Sea during June 1997. J Geophys Res 104:18041–18046
He H, McGinnis JW, Song Z, Yanai M (1987) Onset of the Asian
summer monsoon in 1979 and the effect of the Tibetan Plateau.
Mon Weather Rev 115:1966–1995
Holtslag AAM, Boville BA (1993) Local versus non-local boundary
layer diffusion in a global climate model. J Clim 6:1825–1842
Hsu HH, Yu YC, Kau WS, Hsu WR, Sun WY, Tsou CH (2004)
Simulation of the 1998 East Asian summer monsoon using the
Purdue regional model. J Meteorol Soc Jpn 82:1715–1733
Kalnay E, Kanamitsu M, Kistler R, Collins W, Deaven D, Gandin L,
Iredell M, Saha S, White G, Woollen J, Zhu Y, Chelliah M,
Ebisuzaki W, Higgins W, Janowiak J, Mo KC, Ropelewski C,
Wang J, Leetmaa A, Reynolds R, Jenne R, Joseph D (1996) The
NCEP/NCAR 40-year reanalysis project. Bull Am Meteorol Soc
77:437–472
Kang IS, Jin K, Wang B, Lau KM, Shukla J, Krishnamurthy V,
Schubert S, Wailser D, Stern W, Kitoh A, Meehl G, Kanamitsu
M, Galin V, Satyan V, Park CK, Liu Y (2002) Intercomparison
of the climatological variations of Asian summer monsoon
precipitation simulated by 10 GCMs. Clim Dyn 19:383–395
Kitoh A, Kusunoki S (2007) East Asian summer monsoon simulation
by a 20-km mesh AGCM. Clim Dyn 29:293–305
Kowalczyk EA, Garratt JR, Krummel PB (1994) Implementation of a
soil-canopy scheme into the CSIRO GCM— regional aspects of
the model response (electronic publication). Technical report 32,
CSIRO Atmospheric Research
Krishnamurti TN (1985) Summer monsoon experiment—a review.
Mon Weather Rev 113:1590–1626
Krishnamurti TN, Bhalme HN (1976) Oscillations of a monsoon
system. Part I. Observational aspects. J Atmos Sci 33:1937–1954
Krishnamurti TN, Ardanuy P, Ramanathan Y, Pasch R (1981) On the
onset vortex of the summer monsoon. Mon Weather Rev
109:341–363
Kusunoki S, Yoshimura J, Yoshimura H, Noda A, Oouchi K, Mizuta
R, Yoshimura J (2006) Change of Baiu rain band in global
warming projection by an atmospheric general circulation model
with a 20-km grid size. J Meteorol Soc Jpn 84:581–611
Lau NC, Nath MJ, Wang H (2004a) Simulations by a GFDL GCM of
ENSO-related variability of the coupled atmosphere–ocean
system in the East Asian monsoon region. In: Chang CP (ed)
The East Asian monsoon, vol 2. World Scientific, Singapore, pp
271–300
Lau WKM, Kim KM, Lee JY (2004b) Interannual variability, global
teleconnection, and potential predictability associated with the
Asian summer monsoon. In: Chang CP (ed) The East Asian
monsoon, vol 2. World Scientific, Singapore, pp 153–176
Leung LR, Ghan SJ, Zhao ZC, Luo Y, Wang WC, Wei HL (1999)
Intercomparison of regional climate simulations of the 1991
summer monsoon in eastern Asia. J Geophys Res 104:6425–
6454
Li C, Yanai M (1996) The onset and interannual variability of the
Asian summer monsoon in relation to land–sea thermal contrast.
J Clim 9:358–375
Lim YK, Kim KY, Lee HS (2002) Temporal and spatial evolution of
the Asian summer monsoon in the seasonal cycle of synoptic
fields. J Clim 15:3630–3644
Liu X, Yin Z (2001) Spatial and temporal variation of summer
precipitation over the Eastern Tibetan Plateau and the North
Atlantic Oscillation. J Clim 14:2896–2909
Luo H, Yanai M (1983) The large-scale circulation and heat sources
over the Tibetan Plateau and surrounding areas during the early
K. C. Nguyen, J. L. McGregor: Modelling the Asian summer monsoon using CCAM 235
123
summer of 1979. Part I: precipitation and kinematic analyses.
Mon Weather Rev 111:922–944
Luo H, Yanai M (1984) The large-scale circulation and heat sources
over the Tibetan Plateau and surrounding areas during the early
summer of 1979. Part II: heat and moisture budgets. Mon
Weather Rev 112:966–989
Mao J, Chan JCL, Wu G (2004) Relationship between the onset of the
South China Sea summer monsoon and the structure of the Asian
subtropical anticylone. J Meteorol Soc Jpn 82:845–859
McGregor JL (1993) Economical determination of departure points
for semi-Lagrangian models. Mon Weather Rev 121:221–230
McGregor JL (1996) Semi-Lagrangian advection on conformal-cubic
grids. Mon Weather Rev 124:1311–1322
McGregor JL (2003) A new convection scheme using a simple
closure. BMRC Res Rep 93:33–36
McGregor JL (2005a) C-CAM: geometric aspects and dynamical
formulation (electronic publication). Technical report 70, CSIRO
Atmospheric Research
McGregor JL (2005b) Geostrophic adjustment for reversibly stag-
gered grids. Mon Weather Rev 133:1119–1128
McGregor JL, Dix MR (2001) The CSIRO Conformal-Cubic
Atmospheric GCM. In: Hodnett PF (ed) IUTAM symposium
on Advances in mathematical modelling of atmosphere and
ocean dynamics. Kluwer, Dordrecht, pp 197–202
McGregor JL, Gordon HB, Watterson IG, Dix MR, Rotstayn LD
(1993) The CSIRO 9-level atmospheric general circulation
model. Technical report 26, CSIRO Atmospheric Research
McGregor JL, Nguyen KC, Katzfey JJ (2002) Regional climate
simulations using a stretched-grid global model. In: Ritchie H
(ed) Research activities in atmospheric and oceanic modelling
rep. 32. WMO tech. doc. 1105, pp 3.15–3.16
Qian WH, Lee DK (2000) Seasonal march of Asian summer
monsoon. Int J Climatol 20:1371–1386
Ramage CS (1952) Variation of rainfall over south China through the
wet season. Bull Am Meteorol Soc 33:308–311
Ramamurthy K (1969) Some aspects of the break in the Indian
southwest monsoon during July and August. Forecasting manual
no. IV-18.3, India Meteorological Department, Poona
Rancic M, Purser RJ, Mesinger F (1996) A global shallow-water
model using an expanded spherical cube: gnomonic versus
conformal coordinates. Q J R Meteorol Soc 122:959–982
Rivest C, Staniforth A, Robert A (1994) Spurious resonant response
of semi-Lagrangian discretizations to orographic forcing: diag-
nosis and solution. Mon Weather Rev 122:366–376
Rotstayn LD (1997) A physically based scheme for the treatment of
stratiform clouds and precipitation in large-scale models. I:
description and evaluation of the microphysical processes. Q J R
Meteorol Soc 123:1227–1282
Schmidt F (1977) Variable fine mesh in spectral global model. Beitr
Phys Atmos 50:211–217
Schubert SD, Rood RB, Pfaendtner J (1993) An assimilated dataset
for Earth science applications. Bull Am Meteorol Soc 74:2331–
2342
Schwarzkopf MD, Fels SB (1991) The simplified exchange method
revisited: an accurate, rapid method for computation of infrared
cooling rates and fluxes. J Geophys Res 96:9075–9096
Shen X, Kimoto M, Sumi A, Numaguti A, Matsumoto J (2001)
Simulation of the 1998 East Asian summer monsoon by the
CCSR/NIES AGCM. J Meteorol Soc Japan 79:741–757
Smith RNB (1990) A scheme for predicting layer clouds and their
water content in a general circulation model. Q J R Meteorol Soc
116:435–460
Tao SY, Chen LX (1987) A review of recent research on the East
Asian summer monsoon in China. In: Chang CP, Krishnamurti
TN (eds) Monsoon meteorology. Oxford University Press,
Oxford, pp 60–92
Wang B, Li T (2004) East Asian monsoon–ENSO interactions. In:
Chang CP (ed) The East Asian monsoon, vol 2. World Scientific,
Singapore, pp 177–212
Wang Y, Sen OL, Wang B (2003) A highly resolved regional climate
model and its simulation of the 1998 severe precipitation event
over China. Part I: model description and verification of
simulation. J Clim 16:1721–1738
Wang Y, Leung LR, McGregor JL, Lee DK, Wang WC, Ding Y,
Kimura F (2004) Regional climate modeling: progress, chal-
lenges, and prospects. J Meteorol Soc Jpn 82:1599–2004
Wu R, Wang B (2002) A contrast of the East Asian summer
monsoon–ENSO relationship between 1962–77 and 1978–93. J
Clim 15:3266–3279
Wu GX, Zhang YS (1998) Tibetan Plateau forcing and the monsoon
onset over South Asia and the South China Sea. Mon Weather
Rev 126:913–927
Wu MLC, Schubert S, Huang NE (1999) The development of the
south Asian summer monsoon and the intraseasonal oscillation. J
Clim 12:2054–2075
Zhang ZQ, Chan JCL, Ding YH (2004) Characteristics, evolution and
mechanisms of the summer monsoon onset over Southeast Asia.
Int J Climatol 24:1461–1482
236 K. C. Nguyen, J. L. McGregor: Modelling the Asian summer monsoon using CCAM
123


