Embed Size (px)
Citation preview
102
ISSN 1392-1258. EKONOMIKA 2014 Vol. 93(3)
MODELLING THE FOOD SECURITY IN UKRAINE
Stavytskyy A.V.*, Prokopenko O.O.Taras Shevchenko National University of Kyiv, Ukraine
Abstract. In the present paper, regional food security in Ukraine is investigated. Food security level is estimated using the developed integral indicator based on food availability and accessibility. The relationship betwe-en this indicator and some macroeconomic parameters is estimated with the help of the panel regression methods that allow to evaluate some specific features for each region and to summarize some general deve-lopment trends.
Key words: food security, panel regression, integral indicator, principal component analysis, agro-food sector, regional economy
Introduction
Food security is an essential condition for any field activity development. Undernou-rishment causes children maldevelopment which can worsen their future labour quality. Famine problems can influence the ecology, too: malnutrition can cause forest area re-duction, although, regarding the modern processes and outlook, this tendency is reducing.
Even in the most developed countries, part of the population have no access to the full set of food products that could provide for the healthy life. The current population growth accompanied by resource limits, land exhaustion, and climate change may create potentially dangerous conditions for food security.
The most difficult and impossible (for now) task is to ensure providing not only a sufficient volume of food, but also its necessary quality.
The main goal of the present research is to develop an integral indicator of food security for Ukraine regions and to evaluate with its help the interrelation between food security and different macroeconomic indicators.
This goal sets the following challenges: 1. To broaden the indicator base that was proposed in the official methodology of
food security assessment in Ukraine. 2. To develop the above-mentioned integral indicator.
* Corresponding author:Office 809, Faculty of Economics, Department of Economic Cybrnetics, Taras Shevchenko National University of Kyiv, Vasylkivska Str, 90a, Kyiv, 03022, Ukraine.E-mail: [email protected]
103
3. To build and to analyze the panel regression that can characterize the interrelation between regional food security and macroeconomic indicators.
The structure of the paper is as follows: Section I presents a literature review concer-ning the discussed topic, Section II explores the problem of food security, Section III refers to the construction and analysis of an integral indicator of food security for Ukrainian regi-ons, Section IV describes the panel data model for the analysis and comparison of the re-sults, and Section V presents the results of the investigation and some policy implications.
Section I. Literature review
A lot of different researches are dedicated to food security study which is frequently separated from the economic security. One of the leading Ukrainian food security re- searchers B. Pashaver (2012) even identifies the special term “agflation” referred to food price increase, which is usually accompanied by the growing demand for foods and bio-fuels. Some other researchers who studied food security investigated its different critical levels.
In Ukraine, food security is officially studied according to the Cabinet of Ministers Resolution of 5.12.2007 “On Certain Issues of Food Security” by Ministry of Health, Ministry of Agriculture and Food, Ministry of Social Affairs, Ministry of Economic De-velopment and Trade. This resolution indicates also the official methodology of food se-curity assessment, which includes the following indicators (Cabinet of Ministers, 2007):
• daily energy consumption defined as a certain sum of multiplications of consu-med products’ mass and their energy value;
• basic product procuring defined as the real consumption of a specific product, divided by its rational norm;
• the adequacy of grain supplies to state resources, which is defined as the ratio of the amount of grains in the state food reserves and the consumption volume of grain products;
• food economic accessibility defined as food costs divided by total household costs;• differentiation of food costs by social groups, which is monitored in dynamics and
is defined as the ratio of the 20% highest income households’ food cost and the 20% lowest income households’ food cost;
• the market capacity of specific products, which is monitored in dynamics and is defined in physical terms as the multiplication of a certain food consumption and the average population;
• food dependency on a specific product, defined as the ratio of the volume of a specific product imports in physical terms and the capacity of its domestic mar-ket. This indicator characterizes the ratio of national independence from a certain product due to the production volume that covers the national consumption.
104
Most documents of the FAO (Food Agricultural Organization) provide the following definition of food security: “Food security on individual, family, national, regional and global levels [is reached] when all people at all times have physical and economic access to sufficient, safe and nutritious food to meet their dietary needs and food preferences for an active and healthy lifestyle”. Also, the Council of Food and Agriculture has defi-ned food security as “the policy that allows a country to get a higher level of food self-procuring as a result of integrated forces in order to increase the production of needed products, to improve supply systems, food consumption, malnutrition elimination”.
In order to compare different approaches, let’s present some other food security de-finitions. For example, V.V. Kuznetsov (2010) defines it as “a socio-economic system, the structure of which consists of consumption, production, and resource distribution”. A.S. Reznikova (2001) gives the definition that describes food security as “procuring population with necessary food products in medically substantiated quantities”.
Section II. Food security
Food security as an occurrence is essential for any national and world development. Today, the number of people under the famine risk, who do not have regular access to food, is estimated to be nearly 20 million. This year, the most difficult situation for food security is observed in South Sudan where nearly 7 million people have no access to a sufficient food volume (FAO, 2013).
Generally, the main problem that can provide for a stable food security positioning is to ensure an efficient crop and livestock production, including increasing yields on the small farms level. Firstly, small farms provide the biggest part of agricultural production in most countries; secondly, they can provide higher incomes with decreased income differentiation. These problems can be solved only through remarkable investments, as nowadays in most countries the situation with small farms is rather not optimistic: op-timal fertilizers, agricultural machinery investment are needed in order to increase land productivity.
No doubt, considering the recent climate change trend which involves the unequal precipitation distribution, the necessity of investment into irrigation systems is obvious as it may decrease yield dependence on weather and climate conditions.
The fact that food insecurity may cause the further worsening is threatening for some more reasons. Firstly, malnutrition of children and pregnant women influences it a lot. This may cause delayed child development, diseases that in future will result in the lack of labour force and its relatively low productivity. Secondly, usually the food insecurity problem needs remarkable financial flows to provide for at least minimum necessary amount of food for the population. This reduces (in turn) investments and thus can cause a remarkable decline in agricultural production in the following years.
105
Generally, the current tendencies show us the importance of increasing food econo-mic accessibility, because during the previous years the grain production that was ne-cessary at least to avoid the so-called “chronic malnutrition” exceeded population needs. So, the crucial problem is not the physical absence of food on the market but the low level of its presence in certain countries, especially in Africa. The base of this problem is unequal development in different countries and, as a result, extremely low average incomes in certain countries and even the absence of physical possibility for stable food deliveries to some regions.
For the time being, food security problems are especially actual in Ukraine, because, despite the sufficient amount of calories consumed per capita, the consumer basket structu-re is worsening. While meat and milk parts are decreasing, the grain products are increa-sing, causing a deficit of proteins, vitamins, macro- and microelements of animal origin which leads to the so-called “concealed hunger”. For example, comparing the consumption of 2012 and 1995 years, we can see that generally daily consumption has increased by 9.6%, but during this period milk consumption has decreased by almost 12%, while potato, the most energy intensive but a pretty cheap product, has increased by 13%. Generally, the dynamics by regions is totally different. For example, in the Donetsk region, meat con-sumption has doubled while potato one decreased by 6%. In contrast, in the Khmelnitsky region, potato consumption has increased by 58.5%, meanwhile that of meat has increased by only 9%. The positive dynamics consists in the fact that the daily energy consumption is observed to increase at a different rate: the lowest in the Kyiv region (by 3.7% – usually because of the Kyiv region not containing Kyiv itself) and the highest in the Cherkassy region (by 22.7%).
In addition, a negative dynamics of food quality worsening is observed. It is usually connected with the nowadays widespread falsification of products, artificial increase of product shelf life, and pollution by dangerous substances. For example, it is a common practice in Ukraine to sell grain with an inappropriate specification when actual quality indicators, such as protein content, do not meet the specified standards. This causes not only non-getting a product of an appropriate quality, but also a non-systematic food price increasing. Consumption of food of such quality, besides an insufficient amount of required elements, may also lead to dangerous consuming.
Such a situation to some extent is caused by the social destabilization and leads to the further social security deterioration. Malnutrition is the result of the social and economic population poverty and may cause the so-called “poverty inheritance” when, for the lack of high-quality food, future generations grow up with some physical disabilities. This is worsened by the lack of education and absence of culture caused by social instability which may provoke the economic situation worsening because of the lost active popu-lation as a labour force for the further production
106
Section III. Integral indicator of food security for Ukraine regions
This research offers an original approach to assessing food security, which differs from those used for its assessment on the national level. For example, no grain stocks were included, as urgent grain transportation in extreme situations leads to much lower losses, both financial and time, for a regional level, and so the essential importance is referred only to national grain stocks.
The following indicators were included to the developed integral indicator:1. Daily calorie consumption per capita is the key indicator that illustrates the result of
influence of all factors and demonstrates the main point of food security.2. The yield of cereal, potato, vegetables, and fruits. This indicator is surely the basic
for Ukraine which is a country with a highly developed agricultural complex, agri-cultural production and indicators of its productivity. Primarily, the most important yield indicators are those for cereals (as Ukraine is becoming a rather powerful grain exporter, it also enables some additional import of other products), potato (which is nowadays one of the key components of the average Ukrainian diet), vegetables (lack of which points to the above-mentioned “concealed hunger”) and fruits (the lack of which points to the “concealed hunger” and for which Ukraine is import-dependent).
3. The average price of milk, meat, fruits and berries, vegetables and potato shows the economic accessibility of some basic food products.
4. Quality water consumption, which shows the quality of nutrition, its compliance with health standards. It is measured as the volume of high-quality water consumed per capita.
5. Protein consumption characterizes the quality of nutrition, its diversity, and points to the “concealed hunger”.
6. The total area of agricultural land characterizes the state of agriculture development combined with the yield level.
7. An average wage combined with average prices fully describes the economical access of food.
8. Cereal, milk, meat, fruits and berries, vegetables, potato procuration shows the de-pendence of each region on a certain product. This indicator isn’t essential on the regional level, nevertheless it is influential, because transportation leads to costs growth and thus to price growth. Weights were estimated using the principal component analysis. This methodology
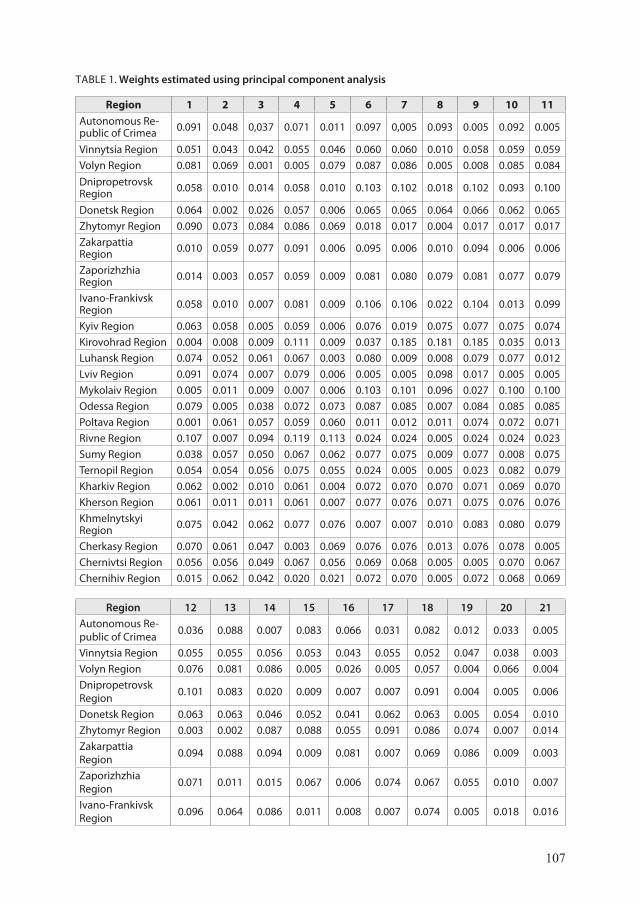
provides the allocation of a certain quantity of components which could cumulatively explain at least 90% of variation of all variables’ dynamics, and then a correlation of these components with each variable is estimated. For each indicator, the multiplication of the highest correlation coefficient and the corresponding eigenvalue of the primary data corre-lation matrix are estimated. The coefficient on the integral integrator equals the weight of this multiplication in the total sum of such multiplications for all variables (see Table 1).
107
TABLE 1. Weights estimated using principal component analysis
Region 1 2 3 4 5 6 7 8 9 10 11Autonomous Re-public of Crimea 0.091 0.048 0,037 0.071 0.011 0.097 0,005 0.093 0.005 0.092 0.005
Vinnytsia Region 0.051 0.043 0.042 0.055 0.046 0.060 0.060 0.010 0.058 0.059 0.059Volyn Region 0.081 0.069 0.001 0.005 0.079 0.087 0.086 0.005 0.008 0.085 0.084Dnipropetrovsk Region 0.058 0.010 0.014 0.058 0.010 0.103 0.102 0.018 0.102 0.093 0.100
Donetsk Region 0.064 0.002 0.026 0.057 0.006 0.065 0.065 0.064 0.066 0.062 0.065Zhytomyr Region 0.090 0.073 0.084 0.086 0.069 0.018 0.017 0.004 0.017 0.017 0.017Zakarpattia Region 0.010 0.059 0.077 0.091 0.006 0.095 0.006 0.010 0.094 0.006 0.006
Zaporizhzhia Region 0.014 0.003 0.057 0.059 0.009 0.081 0.080 0.079 0.081 0.077 0.079
Ivano-Frankivsk Region 0.058 0.010 0.007 0.081 0.009 0.106 0.106 0.022 0.104 0.013 0.099
Kyiv Region 0.063 0.058 0.005 0.059 0.006 0.076 0.019 0.075 0.077 0.075 0.074Kirovohrad Region 0.004 0.008 0.009 0.111 0.009 0.037 0.185 0.181 0.185 0.035 0.013Luhansk Region 0.074 0.052 0.061 0.067 0.003 0.080 0.009 0.008 0.079 0.077 0.012Lviv Region 0.091 0.074 0.007 0.079 0.006 0.005 0.005 0.098 0.017 0.005 0.005Mykolaiv Region 0.005 0.011 0.009 0.007 0.006 0.103 0.101 0.096 0.027 0.100 0.100Odessa Region 0.079 0.005 0.038 0.072 0.073 0.087 0.085 0.007 0.084 0.085 0.085Poltava Region 0.001 0.061 0.057 0.059 0.060 0.011 0.012 0.011 0.074 0.072 0.071Rivne Region 0.107 0.007 0.094 0.119 0.113 0.024 0.024 0.005 0.024 0.024 0.023Sumy Region 0.038 0.057 0.050 0.067 0.062 0.077 0.075 0.009 0.077 0.008 0.075Ternopil Region 0.054 0.054 0.056 0.075 0.055 0.024 0.005 0.005 0.023 0.082 0.079Kharkiv Region 0.062 0.002 0.010 0.061 0.004 0.072 0.070 0.070 0.071 0.069 0.070Kherson Region 0.061 0.011 0.011 0.061 0.007 0.077 0.076 0.071 0.075 0.076 0.076Khmelnytskyi Region 0.075 0.042 0.062 0.077 0.076 0.007 0.007 0.010 0.083 0.080 0.079
Cherkasy Region 0.070 0.061 0.047 0.003 0.069 0.076 0.076 0.013 0.076 0.078 0.005Chernivtsi Region 0.056 0.056 0.049 0.067 0.056 0.069 0.068 0.005 0.005 0.070 0.067Chernihiv Region 0.015 0.062 0.042 0.020 0.021 0.072 0.070 0.005 0.072 0.068 0.069
Region 12 13 14 15 16 17 18 19 20 21Autonomous Re-public of Crimea 0.036 0.088 0.007 0.083 0.066 0.031 0.082 0.012 0.033 0.005
Vinnytsia Region 0.055 0.055 0.056 0.053 0.043 0.055 0.052 0.047 0.038 0.003Volyn Region 0.076 0.081 0.086 0.005 0.026 0.005 0.057 0.004 0.066 0.004Dnipropetrovsk Region 0.101 0.083 0.020 0.009 0.007 0.007 0.091 0.004 0.005 0.006
Donetsk Region 0.063 0.063 0.046 0.052 0.041 0.062 0.063 0.005 0.054 0.010Zhytomyr Region 0.003 0.002 0.087 0.088 0.055 0.091 0.086 0.074 0.007 0.014Zakarpattia Region 0.094 0.088 0.094 0.009 0.081 0.007 0.069 0.086 0.009 0.003
Zaporizhzhia Region 0.071 0.011 0.015 0.067 0.006 0.074 0.067 0.055 0.010 0.007
Ivano-Frankivsk Region 0.096 0.064 0.086 0.011 0.008 0.007 0.074 0.005 0.018 0.016
108
Region 12 13 14 15 16 17 18 19 20 21Kyiv Region 0.014 0.063 0.071 0.064 0.062 0.005 0.062 0.059 0.007 0.004Kirovohrad Region 0.036 0.012 0.032 0.010 0.011 0.009 0.009 0.009 0.082 0.014Luhansk Region 0.009 0.069 0.076 0.070 0.051 0.076 0.006 0.042 0.004 0.077Lviv Region 0.091 0.085 0.096 0.084 0.063 0.049 0.061 0.008 0.065 0.007Mykolaiv Region 0.088 0.082 0.097 0.008 0.013 0.095 0.013 0.010 0.007 0.021Odesa Region 0.078 0.080 0.006 0.018 0.007 0.072 0.019 0.007 0.004 0.011Poltava Region 0.004 0.057 0.069 0.067 0.067 0.072 0.063 0.058 0.049 0.005Rivne Region 0.003 0.004 0.004 0.109 0.006 0.004 0.005 0.103 0.091 0.107Sumy Region 0.017 0.005 0.077 0.067 0.058 0.064 0.042 0.056 0.003 0.016Ternopil Region 0.021 0.002 0.079 0.072 0.063 0.079 0.046 0.056 0.060 0.009Kharkiv Region 0.067 0.064 0.053 0.060 0.048 0.057 0.065 0.008 0.008 0.010Kherson Region 0.014 0.057 0.013 0.067 0.010 0.066 0.033 0.056 0.067 0.014Khmelnytskyi Region 0,.007 0.056 0.066 0.070 0.042 0.076 0.002 0.068 0.011 0.007
Cherkasy Region 0.012 0.073 0.067 0.070 0.069 0.065 0.010 0.046 0.003 0.010Chernivtsi Region 0.004 0.059 0.070 0.058 0.041 0.056 0.001 0.063 0.048 0.034Chernihiv Region 0.019 0.014 0.065 0.064 0.059 0.064 0.064 0.057 0.010 0.069
Source: authors calculations based on the State Statistics Service of Ukraine data.
Having estimated the coefficients of the integral indicator, we can conclude that on the average the greatest influence on the integral indicator have indicators of mean prices, daily consumed calories, and crop yield. The least influence has the indicator of basic agricultural products procurement. This is a positive signal, because it means that the situation of self-procurement in Ukraine is positive and stable. It definitely reflects the real situation as Ukraine is a country with a developed agriculture, and its production forms the crucial part of the national export.
It’s worth noting that the coefficients vary depending on the regional level of develop-ment. For example, in more secure regions, the most important indicators (on average) are the average prices of different products. Meanwhile, regions with a lower indicator level depend more on the crop yield indicators. Such a situation may be explained by the fact that in more developed regions the crop yield has already reached a rather high level. And so, this indicator varies a bit, while the variation of prices still remains significant and certainly may sharply influence the food security situation.
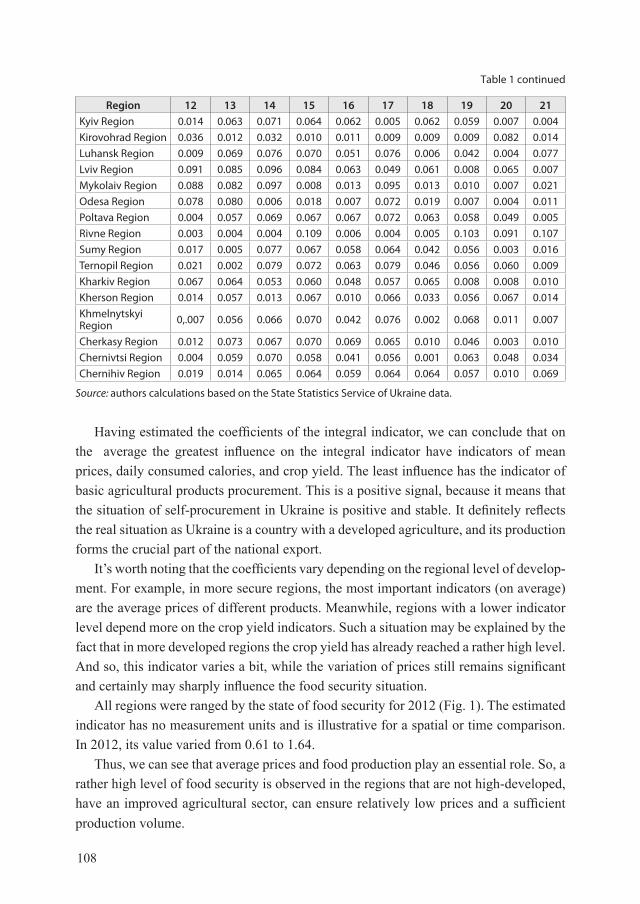
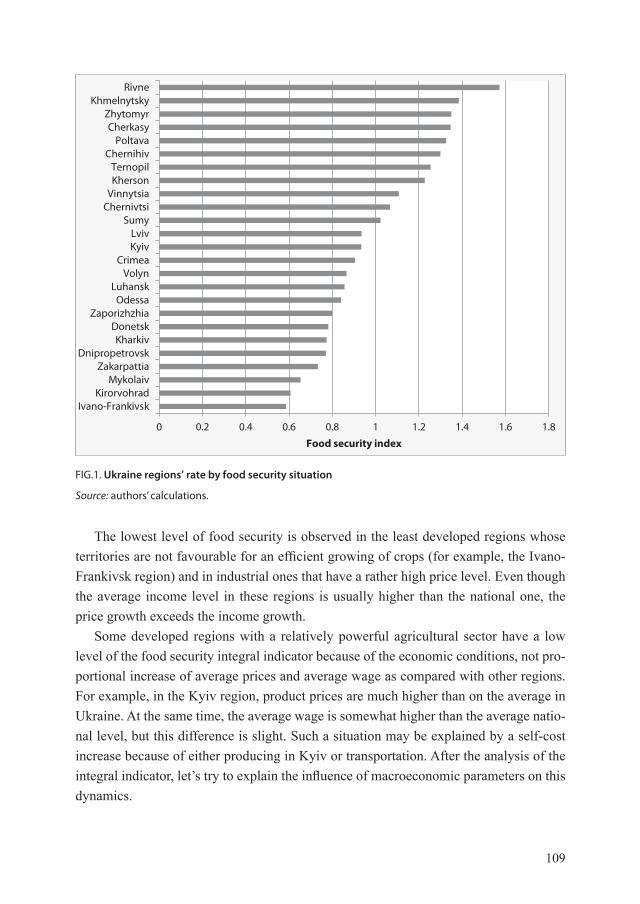
All regions were ranged by the state of food security for 2012 (Fig. 1). The estimated indicator has no measurement units and is illustrative for a spatial or time comparison. In 2012, its value varied from 0.61 to 1.64.
Thus, we can see that average prices and food production play an essential role. So, a rather high level of food security is observed in the regions that are not high-developed, have an improved agricultural sector, can ensure relatively low prices and a sufficient production volume.
Table 1 continued
109
The lowest level of food security is observed in the least developed regions whose territories are not favourable for an efficient growing of crops (for example, the Ivano-Frankivsk region) and in industrial ones that have a rather high price level. Even though the average income level in these regions is usually higher than the national one, the price growth exceeds the income growth.
Some developed regions with a relatively powerful agricultural sector have a low level of the food security integral indicator because of the economic conditions, not pro-portional increase of average prices and average wage as compared with other regions. For example, in the Kyiv region, product prices are much higher than on the average in Ukraine. At the same time, the average wage is somewhat higher than the average natio-nal level, but this difference is slight. Such a situation may be explained by a self-cost increase because of either producing in Kyiv or transportation. After the analysis of the integral indicator, let’s try to explain the influence of macroeconomic parameters on this dynamics.
0 0.2 0.4 0.6 0.8 1 1.2 1.4 1.6 1.8
Ivano-FrankivskKirorvohrad
MykolaivZakarpattia
DnipropetrovskKharkiv
DonetskZaporizhzhia
OdessaLuhansk
VolynCrimea
KyivLviv
SumyChernivtsiVinnytsiaKhersonTernopil
ChernihivPoltava
CherkasyZhytomyr
KhmelnytskyRivne
Food security index
FIG.1. Ukraine regions’ rate by food security situation
Source: authors’ calculations.
110
Section IV. Research methodology
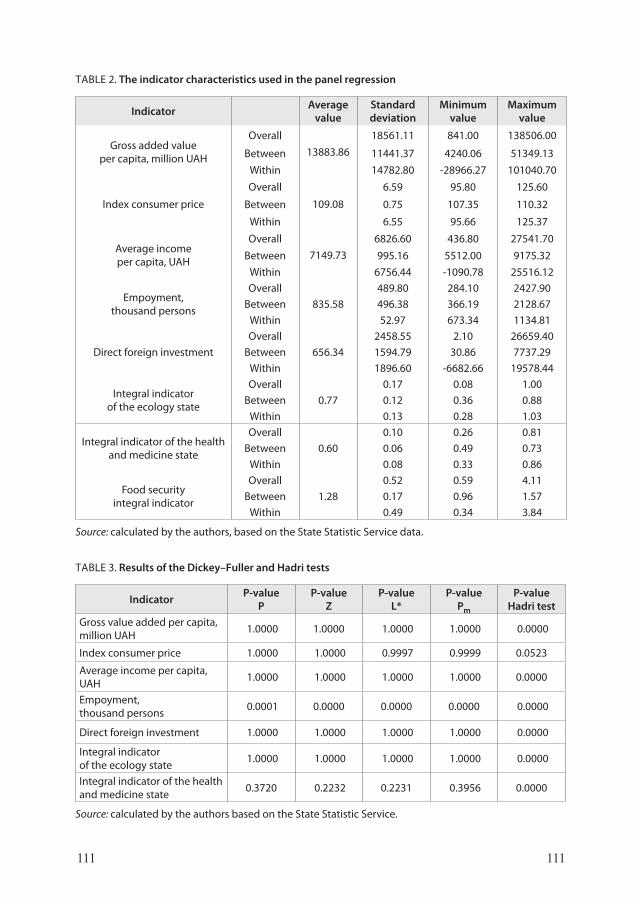
For the further research, official data of the State Statistics Service of Ukraine were used. The descriptive statistics is presented in Table 2. The following indicators are shown there: ICP, income per capita, direct foreign investment, food security integral indicator, employment, gross value added, integral indicators of medical and environmental con-ditions. For most of them, a much higher level of within-group variation than among groups is observed. Generally, for the whole country, common tendencies with a slight regional variation are widespread.
The opposite situation may be observed regarding the indicator of employment: the overall variation is mainly among the groups. Such indicators as ecological and health / medicine state vary equally within and among the regions.
The panel regression method was selected in this study. It gives the possibility to get more resistant estimates and to indicate some special features for each region (estimated as fixed or random effects) that cannot be reached using aggregated or pooled data. Ba-sing on this method, the model of the following general form was developed:
FoodSecit = α0 + α1GVAit + α2Empit + υi + εit ,
where FoodSec – food security index, GVA – gross value added per capita, Emp – employment level, α0, α1, α2 – the coefficients of the model, υit – region’s group residuals, εit – all-effects residuals.
Before building the panel regression, the studied series had been tested for stationa-rity. In order to test it, the Dickey–Fuller and Hadri tests for panel data were used. For the Dickey–Fuller test, the zero-hypothesis is formulated as the assumption of non-sta-tionarity for all groups, meanwhile the one of the Hadri test is indicated time series as stationary for all panels. In Table 2, four different types of the unit root test are presented. Each one is assumed to be consistent for all panels. The P one is only for finite N (num-ber of panels), while all others are for both finite and non-finite N.
The results of both tests are presented in Table 3 from which we can conclude that all indicators are non-stationary at least for one region, so we assume non-stationarity for all series.
The further research included studying the long- and short-term interconnection between food security state and macroeconomic indicators. Existence of these intercon-nections was tested using the Westerlund test of cointegration for panel data (Wester-lund, 2007). The idea of this test differs from the usual one which provides the estimation of the dynamics itself. It is based on estimating the error-correction term. If it equals to
111111
TABLE 2. The indicator characteristics used in the panel regression
Indicator Average value
Standard deviation
Minimum value
Maximum value
Gross added value per capita, million UAH
Overall13883.86
18561.11 841.00 138506.00
Between 11441.37 4240.06 51349.13Within 14782.80 -28966.27 101040.70
Index consumer price
Overall
109.08
6.59 95.80 125.60
Between 0.75 107.35 110.32
Within 6.55 95.66 125.37
Average income per capita, UAH
Overall7149.73
6826.60 436.80 27541.70Between 995.16 5512.00 9175.32
Within 6756.44 -1090.78 25516.12
Empoyment, thousand persons
Overall835.58
489.80 284.10 2427.90Between 496.38 366.19 2128.67
Within 52.97 673.34 1134.81
Direct foreign investmentOverall
656.342458.55 2.10 26659.40
Between 1594.79 30.86 7737.29Within 1896.60 -6682.66 19578.44
Integral indicator of the ecology state
Overall0.77
0.17 0.08 1.00Between 0.12 0.36 0.88
Within 0.13 0.28 1.03
Integral indicator of the health and medicine state
Overall0.60
0.10 0.26 0.81Between 0.06 0.49 0.73
Within 0.08 0.33 0.86
Food security integral indicator
Overall1.28
0.52 0.59 4.11Between 0.17 0.96 1.57
Within 0.49 0.34 3.84
Source: calculated by the authors, based on the State Statistic Service data.
TABLE 3. Results of the Dickey–Fuller and Hadri tests
Indicator P-value P
P-value Z
P-value L*
P-value Pm
P-value Hadri test
Gross value added per capita, million UAH 1.0000 1.0000 1.0000 1.0000 0.0000
Index consumer price 1.0000 1.0000 0.9997 0.9999 0.0523
Average income per capita, UAH 1.0000 1.0000 1.0000 1.0000 0.0000
Empoyment, thousand persons 0.0001 0.0000 0.0000 0.0000 0.0000
Direct foreign investment 1.0000 1.0000 1.0000 1.0000 0.0000
Integral indicator of the ecology state 1.0000 1.0000 1.0000 1.0000 0.0000
Integral indicator of the health and medicine state 0.3720 0.2232 0.2231 0.3956 0.0000
Source: calculated by the authors based on the State Statistic Service.
112
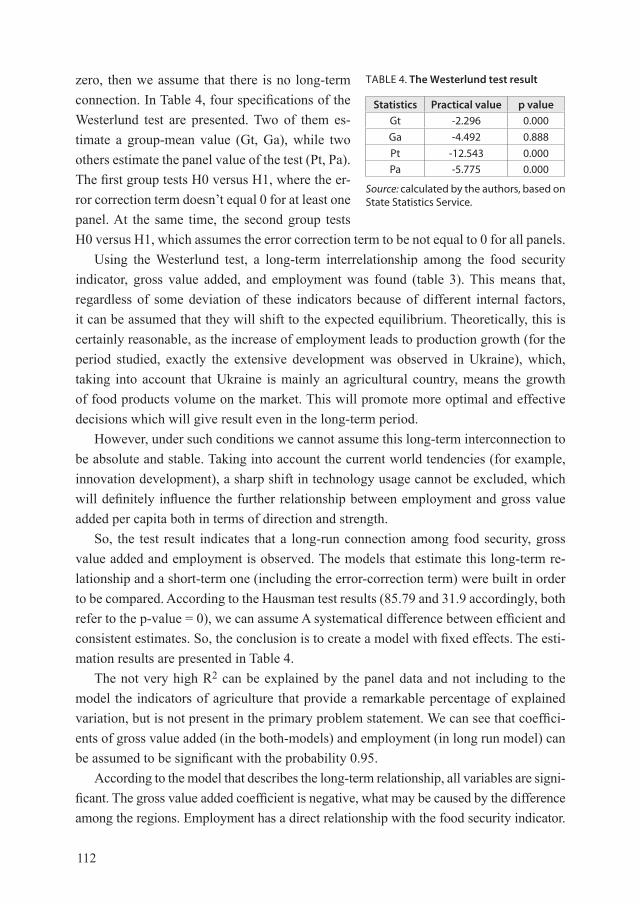
zero, then we assume that there is no long-term connection. In Table 4, four specifications of the Westerlund test are presented. Two of them es-timate a group-mean value (Gt, Ga), while two others estimate the panel value of the test (Pt, Pa). The first group tests H0 versus H1, where the er-ror correction term doesn’t equal 0 for at least one panel. At the same time, the second group tests H0 versus H1, which assumes the error correction term to be not equal to 0 for all panels.
Using the Westerlund test, a long-term interrelationship among the food security indicator, gross value added, and employment was found (table 3). This means that, regardless of some deviation of these indicators because of different internal factors, it can be assumed that they will shift to the expected equilibrium. Theoretically, this is certainly reasonable, as the increase of employment leads to production growth (for the period studied, exactly the extensive development was observed in Ukraine), which, taking into account that Ukraine is mainly an agricultural country, means the growth of food products volume on the market. This will promote more optimal and effective decisions which will give result even in the long-term period.
However, under such conditions we cannot assume this long-term interconnection to be absolute and stable. Taking into account the current world tendencies (for example, innovation development), a sharp shift in technology usage cannot be excluded, which will definitely influence the further relationship between employment and gross value added per capita both in terms of direction and strength.
So, the test result indicates that a long-run connection among food security, gross value added and employment is observed. The models that estimate this long-term re-lationship and a short-term one (including the error-correction term) were built in order to be compared. According to the Hausman test results (85.79 and 31.9 accordingly, both refer to the p-value = 0), we can assume A systematical difference between efficient and consistent estimates. So, the conclusion is to create a model with fixed effects. The esti-mation results are presented in Table 4.
The not very high R2 can be explained by the panel data and not including to the model the indicators of agriculture that provide a remarkable percentage of explained variation, but is not present in the primary problem statement. We can see that coeffici-ents of gross value added (in the both-models) and employment (in long run model) can be assumed to be significant with the probability 0.95.
According to the model that describes the long-term relationship, all variables are signi-ficant. The gross value added coefficient is negative, what may be caused by the difference among the regions. Employment has a direct relationship with the food security indicator.
TABLE 4. The Westerlund test result
Statistics Practical value р valueGt -2.296 0.000 Ga -4.492 0.888 Pt -12.543 0.000Pa -5.775 0.000
Source: calculated by the authors, based on State Statistics Service.
113
Thus, in Ukraine, a higher gross value added usually means a significant price growth as compared with the average national value, while incomes change slightly. So, the negative value of the coefficient is caused primarily by spatial and not time relationships.
Thus, for most developed regions, any economic growth leads to price growth usu-ally by far exceeding the output growth (which has already reached a certain level), and this growth is often accompanied by the gross value added growth. Such dynamics may reduce the level of food security. It should be mentioned that less developed regions have the opposite dynamics and relationship.
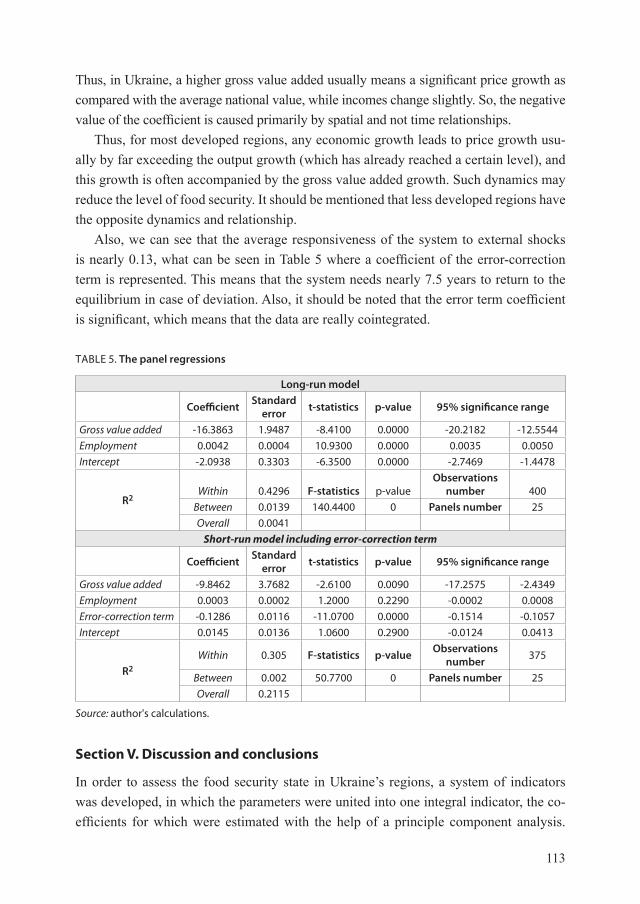
Also, we can see that the average responsiveness of the system to external shocks is nearly 0.13, what can be seen in Table 5 where a coefficient of the error-correction term is represented. This means that the system needs nearly 7.5 years to return to the equilibrium in case of deviation. Also, it should be noted that the error term coefficient is significant, which means that the data are really cointegrated.
TABLE 5. The panel regressions
Long-run model
Coefficient Standard error t-statistics р-value 95% significance range
Gross value added -16.3863 1.9487 -8.4100 0.0000 -20.2182 -12.5544Employment 0.0042 0.0004 10.9300 0.0000 0.0035 0.0050Intercept -2.0938 0.3303 -6.3500 0.0000 -2.7469 -1.4478
R2Within 0.4296 F-statistics р-value
Observations number 400
Between 0.0139 140.4400 0 Panels number 25Overall 0.0041
Short-run model including error-correction term
Coefficient Standard error t-statistics р-value 95% significance range
Gross value added -9.8462 3.7682 -2.6100 0.0090 -17.2575 -2.4349Employment 0.0003 0.0002 1.2000 0.2290 -0.0002 0.0008Error-correction term -0.1286 0.0116 -11.0700 0.0000 -0.1514 -0.1057Intercept 0.0145 0.0136 1.0600 0.2900 -0.0124 0.0413
R2Within 0.305 F-statistics р-value Observations
number 375
Between 0.002 50.7700 0 Panels number 25Overall 0.2115
Source: author's calculations.
Section V. Discussion and conclusions
In order to assess the food security state in Ukraine’s regions, a system of indicators was developed, in which the parameters were united into one integral indicator, the co-efficients for which were estimated with the help of a principle component analysis.
114
The following indicators were included: the daily consumption of calories, the yield of cereals, potatoes, vegetables and fruit, the average prices of milk, meat, fruits, vegeta-bles, cereals, quality water consumption, protein consumption, the total area of agricul-tural land, the average wage, the procurement of cereal, milk, meat, vegetables, fruits and potatoes. This allowed to range all regions according to the food security level in 2012. It showed that the highest level was mainly observed in regions with developed agriculture and the lowest one – in non-developed and industrial regions.
Models created on the basis of the developed indicator show the interrelation betwe-en food security and macroeconomic indicators. For the cointegrated series that have a common trend, long-run models were built.
The model showed a statistically significant coefficient of error-correction, equal to 0.13. And so, we can expect the system to return to its equilibrium state with the devia-tion rate of nearly 13% per year.
Using these models, the direct relationship between food security and employment, on the one side, and between food security and gross value added on the other side was estimated on the regional level. In the first model specification, both coefficients are sta-tistically significant, while in the second one, after adding the error-correction term, the employment coefficient is not statistically significant any more. This may lead us to the conclusion that returning to the equilibrium is usually carried out by employment change and further correction.
The estimation of the regional gross value added is not informative directly for the decision adoption within the frameworks of the social and agricultural programs. This shows mainly the spatial difference in gross value added and food security indicator dy-namics. At the same time, the positive impact of employment definitely shows the neces-sity of the policy that would provide for its high level, both in terms of average income growth and agriculture development (in case of employment increase in the agricultural sector). Thus, it can be important as the mathematical foundation for policy adopting and decision making.
REFERENCES
Barrett, C.B. (2002). Food Security and Food Assistance Programs. Department of Agricultural, Resource, and Managerial Economics. Handbook of Agricultural Economics. Vol. 2.
Baten, Mohammed Abdul. (2010). Agriculture Biodiversity and Food Security: Two Sides of a Coin. Unnayan Onneshan.
Bent E. Sorensen. (2005). Cointegration. Economics, 266, March 1, 2005.Cameron, A. C. (2007). Panel data methods for microeconometrics. Univ. of California – Davis. Chernyak, O., Komashko, O., Stavytskyy, A., Bazenova, O. (2009). Econometrics. Taras Shevchen-
ko National University of Kyiv.
115
Chromov, U. (1996). International food security and Russia integration. AIC: Economy, Manage-ment.
Food and Agriculture Organization of the United Nations. Web access: http://www.fao.orgGoichuk, O. (2004). Food security. Zhytomyr: Polissia.Jrad Samir, Bashar Nahas, Hajar Baghas (2010). Food Security Models. Syrian Arab Republic
National Agriculture Policy Center, Damascus, August 2010.Klimova, N. (2012) Food security as the base of regional economic security providing. Economy.
Fundamentals. No. 9.Lipton, M. (2001). Challenges to meet: food and nutrition security in the new millennium. Procee-
dings of the Nutrition Society (2001), Vol. 60, pp. 203–214.Murray, M.P. (2006). Econometrics: A Modern Introduction. Pearson Higher Education.Parry, M.A.J., Hawkesford M.J. (2010). Food security: increasing yield and improving resource use
efficiency. Proceedings of the Nutrition Society (2010). Vol. 69, pp. 592–600.Radimer, K.L. (2002) Measurement of household food security in the USA and other industrialised
countries. Public Health Nutrition, Vol. 5(6A), pp. 859–864.Reznikova, O. (2011). Food security in world globalization conditions. IT “ARIAL”.Rosegrant, M.W. (The IMPACT Development Team (2012). International Model for Policy Analy-
sis of Agricultural Commodities and Trade (IMPACT): [Model Description]. International Food Policy Research Institute.
Shubravska, O. (2012). The Innovative Transformation of the Agricultural Sector (monograph). Institute of Economy and Forecasting.
Cabinet of Ministers of Ukraine. (2007) Some Food Security Issues. State Statistics Service of Ukraine. Web access: www.ukrstat.gov.uaWesterlund, J., Persyn D. (2007) Error-correction-based cointegration tests for panel data. The Stata
Journal. Vol. 8, No 2, pp. 232–241.Wooldridge, J. M. (2002). Econometric Analysis of Cross Section and Panel Data. The MIT Press. World Health Organization (WHO). Food and agriculture organization of the United Nations
(FAO): Сodex Alimentarius: International Food Standards. Web access: http://www.codexalimentarius.org/