Embed Size (px)
Citation preview
UNIVERSIDAD PONTIFICIA COMILLAS DE MADRID
ESCUELA TECNICA SUPERIOR DE INGENIERIA (ICAI)
(Instituto de Investigacion Tecnologica)
MODELO REGULATORIO DELCONTROL DE TENSIONES EN LOS
SISTEMAS ELECTRICOS DE POTENCIA
Tesis para la obtencion del grado de Doctor
Directores: Prof. Dr. D. Tomas Gomez San Roman
Prof. Dr. D. David Soler Soneira
Autor: Ing. D. Pablo Frıas Marın
Madrid 2008

UNIVERSIDAD PONTIFICIA COMILLAS DE MADRID
ESCUELA TECNICA SUPERIOR DE INGENIERIA (ICAI)
(Instituto de Investigacion Tecnologica)
A REGULATORY MODEL PROPOSALFOR VOLTAGE CONTROL
IN ELECTRIC POWER SYSTEMS
Tesis para la obtencion del grado de Doctor
Directores: Prof. Dr. D. Tomas Gomez San Roman
Prof. Dr. D. David Soler Soneira
Autor: Ing. D. Pablo Frıas Marın
Madrid 2008


A María

i
Resumen
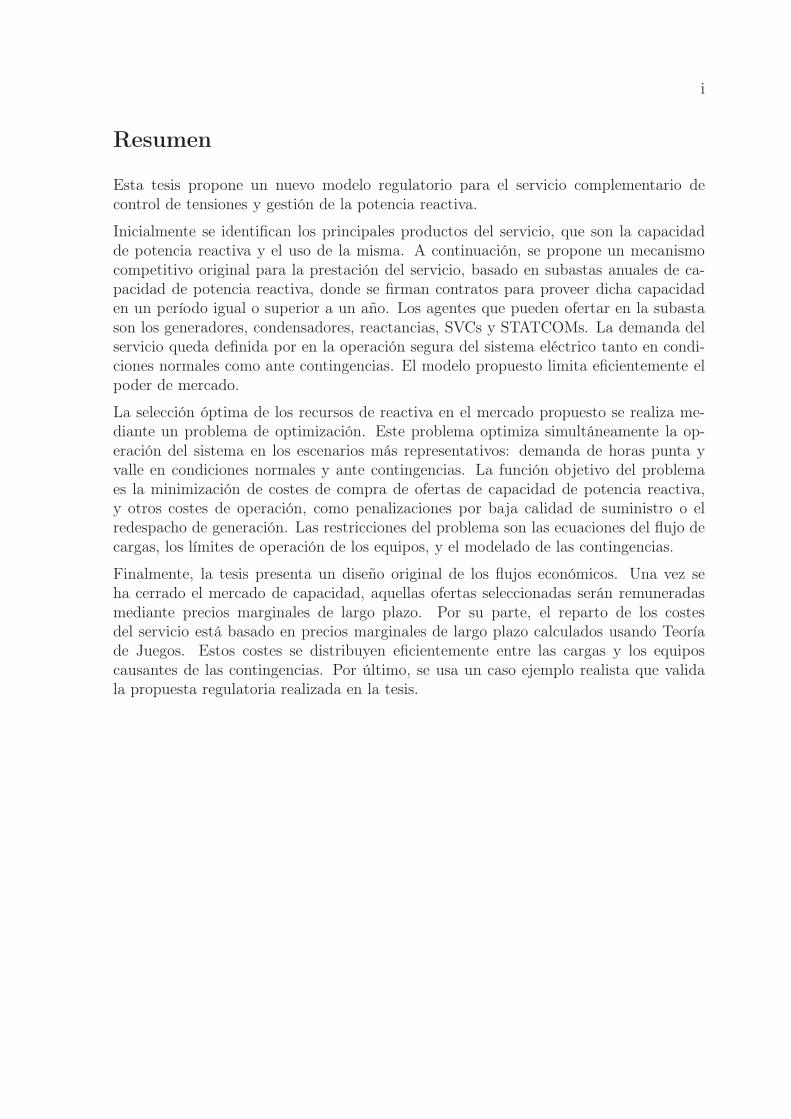
Esta tesis propone un nuevo modelo regulatorio para el servicio complementario decontrol de tensiones y gestión de la potencia reactiva.
Inicialmente se identifican los principales productos del servicio, que son la capacidadde potencia reactiva y el uso de la misma. A continuación, se propone un mecanismocompetitivo original para la prestación del servicio, basado en subastas anuales de ca-pacidad de potencia reactiva, donde se firman contratos para proveer dicha capacidaden un período igual o superior a un año. Los agentes que pueden ofertar en la subastason los generadores, condensadores, reactancias, SVCs y STATCOMs. La demanda delservicio queda definida por en la operación segura del sistema eléctrico tanto en condi-ciones normales como ante contingencias. El modelo propuesto limita eficientemente elpoder de mercado.
La selección óptima de los recursos de reactiva en el mercado propuesto se realiza me-diante un problema de optimización. Este problema optimiza simultáneamente la op-eración del sistema en los escenarios más representativos: demanda de horas punta yvalle en condiciones normales y ante contingencias. La función objetivo del problemaes la minimización de costes de compra de ofertas de capacidad de potencia reactiva,y otros costes de operación, como penalizaciones por baja calidad de suministro o elredespacho de generación. Las restricciones del problema son las ecuaciones del flujo decargas, los límites de operación de los equipos, y el modelado de las contingencias.
Finalmente, la tesis presenta un diseño original de los flujos económicos. Una vez seha cerrado el mercado de capacidad, aquellas ofertas seleccionadas serán remuneradasmediante precios marginales de largo plazo. Por su parte, el reparto de los costesdel servicio está basado en precios marginales de largo plazo calculados usando Teoríade Juegos. Estos costes se distribuyen eficientemente entre las cargas y los equiposcausantes de las contingencias. Por último, se usa un caso ejemplo realista que validala propuesta regulatoria realizada en la tesis.

iii
Abstract
This thesis proposes an original framework for the voltage control and reactive powermanagement ancillary service.
First, the main products in the service are identified, which are the reactive powercapacity and its use. Under this competitive framework, an original market structureis designed for the reactive power capacity, based on an annual auction. In addition,the use of the capacity will be remunerated with a regulated price. The agents thatcan participate in the service are generators, capacitor banks, shunt reactors, SVCs andSTATCOM devices. The demand of the service is defined by the secure operation ofthe power system both under normal and contingency situations. The resulting schemeefficiently limits market power for those sources localized in privileged positions.
An optimization formulation is used to efficiently select the reactive power capacitybids. The resulting problem optimizes simultaneously the most representative operat-ing conditions: peak and valley load conditions for normal and contingency scenarios.An original objective function minimizes the costs associated with the purchase of re-active power capacity, and with other expected operation costs, such as redispatchingof generation units, or quality of service penalties. The constraints of the optimizationproblem are the power flow equations, the operating limits of the equipment, and themodeling of system contingencies.
An original design for the economic flows is also presented in this thesis. Once themarket is cleared, selected bids will be remunerated based using long-term marginalpricing. On the other hand, the costs of the service are distributed using long-termmarginal pricing based on Cooperative Game Theory. These costs are efficiently sharedamong the loads and the agents responsible for system contingencies. Finally, a realisticcase study is used to verify the applicability of the regulatory approach.

CONTENTS
1 Introduction 1
1.1 Reactive power support and voltage control . . . . . . . . . . . . . . . . 2
1.2 Scope and objectives of this thesis . . . . . . . . . . . . . . . . . . . . . . 4
1.3 Outline of the document . . . . . . . . . . . . . . . . . . . . . . . . . . . 5
1.4 References . . . . . . . . . . . . . . . . . . . . . . . . . . . . . . . . . . . 8
2 The VQ service in power systems 9
2.1 Voltage control and reactive power management . . . . . . . . . . . . . . 10
2.1.1 VAR compensation equipment . . . . . . . . . . . . . . . . . . . . 11
2.1.2 Voltage control . . . . . . . . . . . . . . . . . . . . . . . . . . . . 15
2.1.2.1 Dynamic voltage control and VAR reserve management . 16
2.1.2.2 Voltage profile management and VAR dispatch . . . . . 17
2.2 The VQ service . . . . . . . . . . . . . . . . . . . . . . . . . . . . . . . . 17
2.2.1 Definition of the VQ service . . . . . . . . . . . . . . . . . . . . . 18
2.2.2 Procurement of the VQ service . . . . . . . . . . . . . . . . . . . 19
2.2.2.1 Procurement options of the VQ service . . . . . . . . . . 19
2.2.2.2 The VQ service associated products and their cost . . . 22
2.2.3 Allocation of the VQ service . . . . . . . . . . . . . . . . . . . . . 24
2.2.3.1 Volume of demand of VQ service . . . . . . . . . . . . . 24
2.2.3.2 VAR sources participating in the VQ service . . . . . . . 25
2.2.3.3 Mechanism to assign the participation in the VQ service 26
vii
viii CONTENTS
2.2.4 Economic flows in the VQ service . . . . . . . . . . . . . . . . . . 27
2.2.4.1 Remuneration to the VQ service suppliers . . . . . . . . 28
2.2.4.2 VQ service charging methodology . . . . . . . . . . . . . 30
2.3 Economic theory on VAR pricing . . . . . . . . . . . . . . . . . . . . . . 31
2.3.1 Real time VAR marginal pricing . . . . . . . . . . . . . . . . . . . 31
2.3.2 Valuating VAR capacity . . . . . . . . . . . . . . . . . . . . . . . 32
2.3.3 VAR market power . . . . . . . . . . . . . . . . . . . . . . . . . . 35
2.4 Conclusions . . . . . . . . . . . . . . . . . . . . . . . . . . . . . . . . . . 36
2.5 References . . . . . . . . . . . . . . . . . . . . . . . . . . . . . . . . . . . 38
3 A market proposal for the long-term VQ service 45
3.1 Reference framework for the VAR market proposal . . . . . . . . . . . . 46
3.2 Product definition . . . . . . . . . . . . . . . . . . . . . . . . . . . . . . . 47
3.3 The VAR capacity market . . . . . . . . . . . . . . . . . . . . . . . . . . 49
3.3.1 Bids for the VAR capacity market . . . . . . . . . . . . . . . . . . 50
3.3.2 Determine the VAR demand for the VAR capacity market . . . . 51
3.3.3 VAR capacity market settlement . . . . . . . . . . . . . . . . . . 52
3.3.4 VAR capacity market arrangements . . . . . . . . . . . . . . . . . 53
3.3.5 Perfect and imperfect competition in the VAR capacity market . . 54
3.4 Economic settlement of the VAR capacity market . . . . . . . . . . . . . 54
3.4.1 Payments to the VAR procurement . . . . . . . . . . . . . . . . . 55
3.4.2 Charges to the VAR demand . . . . . . . . . . . . . . . . . . . . . 56
3.5 Monitoring and penalties . . . . . . . . . . . . . . . . . . . . . . . . . . . 57
3.6 Conclusions . . . . . . . . . . . . . . . . . . . . . . . . . . . . . . . . . . 58
3.7 References . . . . . . . . . . . . . . . . . . . . . . . . . . . . . . . . . . . 61
4 VAR capacity market settlement 63
4.1 VAR capacity bids . . . . . . . . . . . . . . . . . . . . . . . . . . . . . . 64
4.1.1 Bid definition . . . . . . . . . . . . . . . . . . . . . . . . . . . . . 65
4.1.1.1 Generators . . . . . . . . . . . . . . . . . . . . . . . . . 65
4.1.1.2 Capacitor banks, shunt reactors, SVCs and STATCOMdevices . . . . . . . . . . . . . . . . . . . . . . . . . . . . 66
4.1.2 Integration of the bids in the VAR capacity market . . . . . . . . 66
CONTENTS ix
4.2 Market settlement . . . . . . . . . . . . . . . . . . . . . . . . . . . . . . . 68
4.2.1 Normal operation scenario . . . . . . . . . . . . . . . . . . . . . . 69
4.2.1.1 VAR demand variation . . . . . . . . . . . . . . . . . . . 69
4.2.1.2 Active power dispatch . . . . . . . . . . . . . . . . . . . 70
4.2.2 Contingency scenarios . . . . . . . . . . . . . . . . . . . . . . . . 71
4.2.2.1 Main characteristics . . . . . . . . . . . . . . . . . . . . 71
4.2.2.2 Contingency selection . . . . . . . . . . . . . . . . . . . 72
4.2.3 VAR allocation problem decoupling . . . . . . . . . . . . . . . . . 75
4.2.4 General overview of the market proposal . . . . . . . . . . . . . . 75
4.3 Optimization problem formulation . . . . . . . . . . . . . . . . . . . . . . 76
4.3.1 Objective function . . . . . . . . . . . . . . . . . . . . . . . . . . 76
4.3.1.1 VAR capacity purchase . . . . . . . . . . . . . . . . . . 77
4.3.1.2 Regulated VAR energy compensation . . . . . . . . . . . 78
4.3.1.3 Voltage deviation costs . . . . . . . . . . . . . . . . . . . 79
4.3.1.4 Active power redispatch and energy losses . . . . . . . . 82
4.3.2 Constraints . . . . . . . . . . . . . . . . . . . . . . . . . . . . . . 83
4.3.2.1 AC power flow . . . . . . . . . . . . . . . . . . . . . . . 84
4.3.2.2 Operation limits . . . . . . . . . . . . . . . . . . . . . . 85
4.3.2.3 VAR capacity purchases . . . . . . . . . . . . . . . . . . 86
4.3.2.4 Dynamic performance . . . . . . . . . . . . . . . . . . . 89
4.3.2.5 Modeling contingencies . . . . . . . . . . . . . . . . . . . 90
4.3.2.6 VAR reserve management . . . . . . . . . . . . . . . . . 91
4.4 Analysis of the results of the VAR capacity market settlement . . . . . . 92
4.4.1 Main outputs . . . . . . . . . . . . . . . . . . . . . . . . . . . . . 92
4.4.2 Lagrange multipliers information . . . . . . . . . . . . . . . . . . 93
4.4.3 Splitting the Lagrange multipliers . . . . . . . . . . . . . . . . . . 95
4.5 Other issues . . . . . . . . . . . . . . . . . . . . . . . . . . . . . . . . . . 97
4.5.1 Optimization characteristics . . . . . . . . . . . . . . . . . . . . . 97
4.5.2 Alternative formulations . . . . . . . . . . . . . . . . . . . . . . . 98
4.5.2.1 Voltage control areas . . . . . . . . . . . . . . . . . . . . 98
4.5.2.2 Benders decomposition . . . . . . . . . . . . . . . . . . . 99
4.6 Conclusions . . . . . . . . . . . . . . . . . . . . . . . . . . . . . . . . . . 100
4.7 References . . . . . . . . . . . . . . . . . . . . . . . . . . . . . . . . . . . 101
x CONTENTS
5 Remuneration and charging criteria in the VAR capacity market 103
5.1 Economic settlement . . . . . . . . . . . . . . . . . . . . . . . . . . . . . 104
5.2 Remuneration mechanisms in the VAR capacity market . . . . . . . . . . 105
5.2.1 Spot pricing . . . . . . . . . . . . . . . . . . . . . . . . . . . . . . 105
5.2.1.1 Mathematical formulation . . . . . . . . . . . . . . . . . 106
5.2.2 Implementation mechanism . . . . . . . . . . . . . . . . . . . . . 108
5.3 Charging mechanisms in the VAR capacity market . . . . . . . . . . . . . 110
5.3.1 Allocating VAR capacity costs under normal operating conditions 110
5.3.1.1 Proposed charging mechanism . . . . . . . . . . . . . . . 110
5.3.1.2 Implementation mechanism . . . . . . . . . . . . . . . . 112
5.3.2 Allocating VAR capacity costs due to equipment unavailability . . 116
5.3.2.1 Proposed charging mechanism . . . . . . . . . . . . . . . 116
5.3.2.2 Implementation of the proposed charging mechanism . . 119
5.4 Final economic settlement . . . . . . . . . . . . . . . . . . . . . . . . . . 123
5.5 Other economic flows . . . . . . . . . . . . . . . . . . . . . . . . . . . . . 124
5.6 Summary of the VAR capacity market procedure . . . . . . . . . . . . . 125
5.7 Conclusions . . . . . . . . . . . . . . . . . . . . . . . . . . . . . . . . . . 127
5.8 References . . . . . . . . . . . . . . . . . . . . . . . . . . . . . . . . . . . 130
6 Case Study 131
6.1 Description of the case study . . . . . . . . . . . . . . . . . . . . . . . . . 132
6.1.1 Test system . . . . . . . . . . . . . . . . . . . . . . . . . . . . . . 132
6.1.2 Description of the VAR capacity bids . . . . . . . . . . . . . . . . 133
6.1.3 Description of the VAR capacity demand . . . . . . . . . . . . . . 135
6.1.4 Additional data for the VAR capacity market . . . . . . . . . . . 136
6.2 VAR capacity market settlement . . . . . . . . . . . . . . . . . . . . . . . 137
6.2.1 VAR capacity purchase for peak hours . . . . . . . . . . . . . . . 137
6.2.2 VAR capacity purchase for low-demand hours . . . . . . . . . . . 139
6.3 Economic settlement . . . . . . . . . . . . . . . . . . . . . . . . . . . . . 145
6.3.1 Remuneration of the selected VAR capacity bids . . . . . . . . . . 145
6.3.2 Charges to the VAR demand . . . . . . . . . . . . . . . . . . . . . 145
6.3.2.1 Charges to loads . . . . . . . . . . . . . . . . . . . . . . 145
CONTENTS xi
6.3.2.2 Charging due to equipment unavailability . . . . . . . . 146
6.3.3 Final economic settlement . . . . . . . . . . . . . . . . . . . . . . 148
6.4 Conclusions . . . . . . . . . . . . . . . . . . . . . . . . . . . . . . . . . . 151
6.5 References . . . . . . . . . . . . . . . . . . . . . . . . . . . . . . . . . . . 152
7 Conclusions, contributions and future research 153
7.1 Conclusions . . . . . . . . . . . . . . . . . . . . . . . . . . . . . . . . . . 154
7.2 Original contributions . . . . . . . . . . . . . . . . . . . . . . . . . . . . 155
7.2.1 Regulatory contributions . . . . . . . . . . . . . . . . . . . . . . . 155
7.2.2 Modeling contributions . . . . . . . . . . . . . . . . . . . . . . . . 156
7.3 Future research . . . . . . . . . . . . . . . . . . . . . . . . . . . . . . . . 157
A International review of the VQ service 159
A.1 The VQ service in Spain . . . . . . . . . . . . . . . . . . . . . . . . . . . 160
A.1.1 Description of the Spanish electricity market . . . . . . . . . . . . 160
A.1.2 Voltage control and VAR management . . . . . . . . . . . . . . . 160
A.1.2.1 Voltage control Ancillary Service . . . . . . . . . . . . . 161
A.1.2.2 System constraints management . . . . . . . . . . . . . 165
A.1.3 System Operator tools and generator control . . . . . . . . . . . 166
A.1.3.1 System Operator tools . . . . . . . . . . . . . . . . . . 167
A.1.3.2 Generator control . . . . . . . . . . . . . . . . . . . . . 168
A.1.4 Lessons learned and recommendations . . . . . . . . . . . . . . . 168
A.2 The VQ service in the United Kingdom . . . . . . . . . . . . . . . . . . . 170
A.2.1 The electricity market in the United Kingdom . . . . . . . . . . . 170
A.2.2 The reactive power balancing service . . . . . . . . . . . . . . . . 170
A.2.2.1 Service procurement . . . . . . . . . . . . . . . . . . . . 171
A.2.2.2 Service monitoring . . . . . . . . . . . . . . . . . . . . . 172
A.2.2.3 Service payments and penalties . . . . . . . . . . . . . . 172
A.2.2.4 Example . . . . . . . . . . . . . . . . . . . . . . . . . . . 173
A.2.3 System Operator tools for voltage control . . . . . . . . . . . . . . 174
A.2.4 Lessons learned and recommendations . . . . . . . . . . . . . . . 174
A.3 The VQ service in Europe . . . . . . . . . . . . . . . . . . . . . . . . . . 174
A.3.1 Technical issues of the VQ control . . . . . . . . . . . . . . . . . . 174
xii CONTENTS
A.3.2 Economic issues of the VQ service . . . . . . . . . . . . . . . . . . 175
A.4 The VQ service in the United States and other countries . . . . . . . . . 181
A.4.1 Technical issues of the VQ control . . . . . . . . . . . . . . . . . . 181
A.4.2 Economic issues of the VQ service . . . . . . . . . . . . . . . . . . 182
A.5 References . . . . . . . . . . . . . . . . . . . . . . . . . . . . . . . . . . . 185
B Bid definition for VAR capacity market participants 189
B.1 Generator VAR bids . . . . . . . . . . . . . . . . . . . . . . . . . . . . . 190
B.1.1 VAR capacity . . . . . . . . . . . . . . . . . . . . . . . . . . . . . 190
B.1.1.1 Capability diagram of an alternator . . . . . . . . . . . 190
B.1.1.2 Operation constraints . . . . . . . . . . . . . . . . . . . 191
B.1.1.3 Calculation of the available VAR capacity . . . . . . . . 192
B.1.1.4 Power plant example . . . . . . . . . . . . . . . . . . . . 194
B.1.2 VAR capacity costs . . . . . . . . . . . . . . . . . . . . . . . . . . 199
B.1.2.1 Cost analysis . . . . . . . . . . . . . . . . . . . . . . . . 199
B.1.2.2 Power plant example . . . . . . . . . . . . . . . . . . . . 203
B.1.3 Proposed bid structure . . . . . . . . . . . . . . . . . . . . . . . . 204
B.2 Bid definition for other VAR compensation technologies . . . . . . . . . . 205
B.3 References . . . . . . . . . . . . . . . . . . . . . . . . . . . . . . . . . . . 207
C Voltage value 209
C.1 Cost components of voltage quality . . . . . . . . . . . . . . . . . . . . . 210
C.2 Quantitative analysis . . . . . . . . . . . . . . . . . . . . . . . . . . . . . 211
C.2.1 Distribution network example . . . . . . . . . . . . . . . . . . . . 211
C.2.2 Proposed formulations for the powerflow and cost analysis . . . . 213
C.2.3 Technical and economic analysis . . . . . . . . . . . . . . . . . . . 215
C.3 Conclusion . . . . . . . . . . . . . . . . . . . . . . . . . . . . . . . . . . . 216
C.4 References . . . . . . . . . . . . . . . . . . . . . . . . . . . . . . . . . . . 219
D Case study data 221
D.1 Technical data of the New England 39 case study . . . . . . . . . . . . . 222
D.2 References . . . . . . . . . . . . . . . . . . . . . . . . . . . . . . . . . . . 227
LIST OF TABLES
2.1 Technical characteristics of the VAR compensation devices . . . . . . . . 14
2.2 Costs distribution of the VAR capacity products of the VAR compensa-tion devices . . . . . . . . . . . . . . . . . . . . . . . . . . . . . . . . . . 24
2.3 Remuneration alternatives for the capacity and use products . . . . . . . 29
2.4 International review of the VAR remuneration alternatives . . . . . . . . 30
3.1 Literature review of VAR valuation approaches . . . . . . . . . . . . . . . 60
4.1 Main characteristics of generators and VAR sources . . . . . . . . . . . . 68
4.2 Scenario generation . . . . . . . . . . . . . . . . . . . . . . . . . . . . . . 73
4.3 Failure rates in the illustrative case . . . . . . . . . . . . . . . . . . . . . 73
4.4 Monte Carlo simulation failure results . . . . . . . . . . . . . . . . . . . . 74
4.5 Costs associated with each scenario . . . . . . . . . . . . . . . . . . . . . 74
4.6 Comparison between complete and reduced problem formulation . . . . . 74
4.7 Power flow results . . . . . . . . . . . . . . . . . . . . . . . . . . . . . . . 93
4.8 Cost sharing of the VAR capacity market . . . . . . . . . . . . . . . . . . 93
4.9 Lagrange multipliers in the load buses . . . . . . . . . . . . . . . . . . . 94
4.10 Lagrange multipliers for generation . . . . . . . . . . . . . . . . . . . . . 94
4.11 Splitting of Lagrange multipliers . . . . . . . . . . . . . . . . . . . . . . 97
4.12 Model characteristics . . . . . . . . . . . . . . . . . . . . . . . . . . . . . 98
5.1 Remuneration of selected VAR sources . . . . . . . . . . . . . . . . . . . 109
xiii
xiv LIST OF TABLES
5.2 Charges to loads using the Aumann-Shapley methodology . . . . . . . . 115
5.3 Application of Aumann-Shapley methodology to equipment failure . . . . 123
5.4 Final economic settlement . . . . . . . . . . . . . . . . . . . . . . . . . . 124
6.1 Bids for the VAR capacity market . . . . . . . . . . . . . . . . . . . . . . 133
6.2 Example of the VAR capacity bid for generator #6 . . . . . . . . . . . . 134
6.3 Energy dispatch for peak and valley scenarios . . . . . . . . . . . . . . . 135
6.4 Failure rates of the power system devices in the New England 39 testsystem . . . . . . . . . . . . . . . . . . . . . . . . . . . . . . . . . . . . . 136
6.5 Run-time of the optimization model for the VAR capacity market in thecase study . . . . . . . . . . . . . . . . . . . . . . . . . . . . . . . . . . . 137
6.6 Economic settlement in this case study . . . . . . . . . . . . . . . . . . . 149
A.1 Reactive power generation capacity bid for the example generation plant 164
A.2 Reactive power absorption capacity bid for the example generation plant(Mvar) . . . . . . . . . . . . . . . . . . . . . . . . . . . . . . . . . . . . . 164
A.3 Transmission System reactive power resources available in August 2005 . 168
A.4 Tender matrix example for the VAR market in the United Kingdom forVAR generation . . . . . . . . . . . . . . . . . . . . . . . . . . . . . . . . 173
A.5 Comparison of the technical features of the VQ service in Europe I . . . 176
A.6 Comparison of the technical features of the VQ service in Europe II . . . 177
A.7 Comparison of the economical features of the VQ service in Europe I . . 179
A.8 Comparison of the economical features of the VQ service in Europe II . . 180
A.9 Comparison of the technical features of the VQ service in the UnitedStates and other countries . . . . . . . . . . . . . . . . . . . . . . . . . . 183
A.10 Comparison of the economical features of the VQ service in the UnitedStates and other countries . . . . . . . . . . . . . . . . . . . . . . . . . . 184
B.1 Example generator data . . . . . . . . . . . . . . . . . . . . . . . . . . . 195
B.2 VAR generation limits components for tap ratio 230/16kV . . . . . . . . 196
B.3 VAR absorption limits components for tap ratio 230/16kV . . . . . . . . 197
B.4 Cost analysis in the power station example . . . . . . . . . . . . . . . . . 203
C.1 Distribution network example characteristics . . . . . . . . . . . . . . . . 212
C.2 Distribution network transformers characteristics . . . . . . . . . . . . . 212
LIST OF TABLES xv
D.1 Generator initial dispatch data in the New England 39 case study . . . . 223
D.2 Generator capability data in the New England 39 case study . . . . . . . 223
D.3 Generator dynamic data in the New England 39 case study . . . . . . . . 224
D.4 Failure rates of the power system devices in the New England 39 testsystem . . . . . . . . . . . . . . . . . . . . . . . . . . . . . . . . . . . . . 224
D.5 Data for the simplified New England 39 case study . . . . . . . . . . . . 225
D.6 Line and transformer data in the simplified New England 39 case study . 226

xvi LIST OF TABLES
LIST OF FIGURES
1.1 Reactive Reserves throughout the Ohio area on August 14, 2003 . . . . . 3
2.1 Reactive power flows in power systems . . . . . . . . . . . . . . . . . . . 12
2.2 Voltage control levels . . . . . . . . . . . . . . . . . . . . . . . . . . . . . 16
2.3 VQ curves for stability analysis . . . . . . . . . . . . . . . . . . . . . . . 17
2.4 Structure of reactive power offers from VQ service providers . . . . . . . 34
2.5 Building the market demand side curve for VAR generation capacity . . . 35
3.1 Dynamic response of VAR sources . . . . . . . . . . . . . . . . . . . . . . 48
3.2 VAR capacity contracts . . . . . . . . . . . . . . . . . . . . . . . . . . . . 50
3.3 Characteristic points of the installed VAR capacity for generators . . . . 52
3.4 Bids for VAR capacity . . . . . . . . . . . . . . . . . . . . . . . . . . . . 56
3.5 Remuneration for the use of the VAR capacity . . . . . . . . . . . . . . . 57
4.1 Two bus power system . . . . . . . . . . . . . . . . . . . . . . . . . . . . 67
4.2 VAR capacity market settlement . . . . . . . . . . . . . . . . . . . . . . . 69
4.3 Daily evolution of VAR load and total VAR demand . . . . . . . . . . . . 70
4.4 General overview of the VAR allocation problem . . . . . . . . . . . . . . 76
4.5 Energy losses variation in a generation power plant . . . . . . . . . . . . 79
4.6 Voltage deviation costs . . . . . . . . . . . . . . . . . . . . . . . . . . . . 80
4.7 Voltage deviations cost . . . . . . . . . . . . . . . . . . . . . . . . . . . . 82
4.8 VAR limits for different operating points . . . . . . . . . . . . . . . . . . 88
xvii
xviii LIST OF FIGURES
4.9 Benders decomposition . . . . . . . . . . . . . . . . . . . . . . . . . . . . 99
5.1 Economic flows in the VAR capacity market . . . . . . . . . . . . . . . . 105
5.2 Calculation of the VAR cost allocation in the base case . . . . . . . . . . 113
5.3 Incremental cost allocation . . . . . . . . . . . . . . . . . . . . . . . . . . 118
5.4 Calculation of the VAR cost allocation for contingencies . . . . . . . . . . 120
5.5 Detailed framework of the VAR capacity market . . . . . . . . . . . . . . 126
5.6 Resume of the economic flows in the VAR capacity market . . . . . . . . 129
6.1 One-line diagram of the New England 39 bus test system . . . . . . . . . 132
6.2 Selected VAR capacity bids for generation and absorption during peakhours . . . . . . . . . . . . . . . . . . . . . . . . . . . . . . . . . . . . . . 138
6.3 VAR output of selected VAR sources for the different contingencies duringpeak hours . . . . . . . . . . . . . . . . . . . . . . . . . . . . . . . . . . . 140
6.4 Aggregated VAR output of selected VAR sources for the different contin-gencies during peak hours . . . . . . . . . . . . . . . . . . . . . . . . . . 141
6.5 Selected VAR capacity bids for generation and absorption during low-demand hours . . . . . . . . . . . . . . . . . . . . . . . . . . . . . . . . . 142
6.6 VAR output of selected VAR sources for the different contingencies duringlow-demand hours . . . . . . . . . . . . . . . . . . . . . . . . . . . . . . . 143
6.7 Aggregated VAR output of selected VAR sources for the different contin-gencies during low-demand hours . . . . . . . . . . . . . . . . . . . . . . 144
6.8 Marginal prices for VAR capacity generation and absorption . . . . . . . 146
6.9 Remuneration for VAR capacity generation and absorption . . . . . . . . 147
6.10 Marginal price at each bus . . . . . . . . . . . . . . . . . . . . . . . . . . 148
6.11 Charges to loads . . . . . . . . . . . . . . . . . . . . . . . . . . . . . . . 149
6.12 Marginal price for system outages . . . . . . . . . . . . . . . . . . . . . . 150
6.13 Charges to the agents responsible for system contingencies . . . . . . . . 150
A.1 Voltage service correct fulfillment . . . . . . . . . . . . . . . . . . . . . . 165
A.2 Voltage service wrong fulfillment . . . . . . . . . . . . . . . . . . . . . . . 166
A.3 Main technical constraints in the Spanish peninsular transmission network167
A.4 Voltage control diagram . . . . . . . . . . . . . . . . . . . . . . . . . . . 169
A.5 VAR capacity breakpoints for the VAR tenders in England and Wales . . 172
B.1 Typical capability curve of an alternator and its limits . . . . . . . . . . 191
LIST OF FIGURES xix
B.2 Equivalent schematic of a power plant . . . . . . . . . . . . . . . . . . . 192
B.3 Calculation of VAR limits for a power plant . . . . . . . . . . . . . . . . 194
B.4 Capability curves on the transmission side for different tap ratios of thestep-up transformer . . . . . . . . . . . . . . . . . . . . . . . . . . . . . . 198
B.5 Influence of VAR generation on vibrations . . . . . . . . . . . . . . . . . 202
B.6 Influence of VAR generation on winding temperature . . . . . . . . . . . 203
B.7 Generator bid alternatives . . . . . . . . . . . . . . . . . . . . . . . . . . 205
B.8 Estimated fixed costs of different VAR compensation technologies . . . . 206
B.9 Estimated variable costs of different VAR compensation technologies . . 206
C.1 Case study network . . . . . . . . . . . . . . . . . . . . . . . . . . . . . . 212
C.2 Tap changes for a voltage of 0.9 p.u. on the transmission side . . . . . . 216
C.3 Cost of tap changing . . . . . . . . . . . . . . . . . . . . . . . . . . . . . 217
C.4 Cost of energy-non supplied . . . . . . . . . . . . . . . . . . . . . . . . . 217
C.5 Cost of energy losses . . . . . . . . . . . . . . . . . . . . . . . . . . . . . 218
C.6 Total voltage costs . . . . . . . . . . . . . . . . . . . . . . . . . . . . . . 218
D.1 One-line diagram of New England 39 test system . . . . . . . . . . . . . 222

xx LIST OF FIGURES
NOMENCLATURE
Set and Indices
Symbol Interpretation
G Set of generator units
N Set of buses
L Set of transmission lines
RT Set of transformers
C Set of capacitor banks
R Set of shunt reactors
S Set of scenarios (base case plus contingencies)
K Set of subintervals in the Aumann-Shapley pricing calculation
J Set of voltage control areas in which the power system has been divided
g Generation unit (g ∈ G)
l Transmission line (l ∈ L or l ∈ RT )
n, m Bus (n, m ∈ N)
c Capacitor bank (c ∈ C)
r Shunt reactor (r ∈ R)
s Scenario (s ∈ S)
xxi
xxii NOMENCLATURE
sb,sg,sl Base case, contingency of generator g, contingency of line l (sb, sg, sl ∈ S)
k Iteration in the Aumann-Shapley pricing calculation (k ∈ K)
j Voltage control area (j ∈ J)
Parameters
Symbol Interpretation
PDn, QDn Active and reactive power demand at bus n (MW,Mvar)
P 0g Active power dispatched for generator g in the energy market (MW)
QAA0g Reactive power absorption capacity assigned to generator g in previous auc-
tions (Mvar)
QAG0g Reactive power generation capacity assigned to generator g in previous auc-
tions (Mvar)
QA0c Reactive power capacity assigned to capacitor bank c in previous auctions
(Mvar)
QA0r Reactive power capacity assigned to shunt reactor r in previous auctions
(Mvar)
Hs Duration of a scenario s (hours)
∆P ug , ∆P d
g Maximum active power change upwards/downwards that generator g canprovide in case of contingencies (MW)
∆Qug , ∆Qd
g Maximum reactive power change upwards/downwards that generator g canprovide in case of contingencies (Mvar)
∆Quc , ∆Qd
c Maximum reactive power change upwards/downwards that the capacitorbank c can provide in case of contingencies (Mvar)
∆Qur , ∆Qd
r Maximum reactive power change upwards/downwards that the shunt reactorr can provide in case of contingencies (Mvar)
AUV,s, A
OV,s Penalty for under and over voltage deviations for the scenario s (e/MWh/kV2)
AD Penalty for the non-supplied energy (e/MWh)
ACc , BC
c Price coefficients of the annual bid of capacitor bank c for reactive powercapacity (e/Mvar-year,e/Mvar2-year)
ARr , BR
r Price coefficients of the annual bid of shunt reactor r for reactive powercapacity (e/Mvar-year,e/Mvar2-year)
NOMENCLATURE xxiii
APg Variable production cost of generator g (e/MWh)
AL Average price of energy losses purchase (e/MWh)
AAg , BA
g Price coefficients of the annual bid of generator g for reactive power absorp-tion capacity (e/Mvar-year,e/Mvar2-year)
AGg , BG
g Price coefficients of the annual bid of generator g for reactive power gener-ation capacity (e/Mvar-year,e/Mvar2-year)
AEAg , AEG
g Regulated compensation of the VAR capacity use for generator g, for VARabsorption and VAR generation (e/Mvar2-h)
SLmaxl Transmission capacity of line l (MVA)
V minn,s , V max
n,s Minimum and maximum voltage limits at bus n in the scenario s (kV)
V min, V max Minimum and maximum voltage security limits (kV)
Pming , Pmax
g Minimum and maximum active power generation of generator g (MW)
QGmaxg , QAmax
g Maximum reactive power generation and absorption of generator g (Mvar)
QGPmaxg , QAPmax
g Maximum reactive power generation and absorption of generator goperating at its maximum real power output (Mvar)
QGPming , QAPmin
g Maximum reactive power generation and absorption of generator goperating at its minimum real power output (Mvar)
Qmaxc , Qmax
r Maximum reactive power capacity of capacitor bank c and shunt reactor rrespectively (Mvar)
RT minl , RT max
l Minimum and maximum rating values of the transformer tap ratio (p.u.)
Y cnm, Y s
nm Real and imaginary terms of the admittance between buses n and m
σ Margin of the VAR capacity reserve
Variables
Symbol Interpretation
pg,s Active power generation from generator g in scenario s (MW)
qAg,s Reactive power absorption from generator g in scenarios (Mvar)
qGg,s Reactive power generation from generator g in scenarios (Mvar)
qaAg Assigned reactive power absorption capacity to generator g (Mvar)
xxiv NOMENCLATURE
qaGg Assigned reactive power generation capacity to generator g (Mvar)
qc,s Reactive power switched on by a capacitor bank c in scenario s (Mvar)
qr,s Reactive power switched on by a shunt reactor r in scenario s (Mvar)
qac Reactive power capacity assigned to capacitor bank c (Mvar)
qar Reactive power capacity assigned to shunt reactor r (Mvar)
bc,s Susceptance of capacitor banks c in scenario s
br,s Susceptance of shunt reactor r in scenario s
vn,s Voltage at bus n in scenario s (kV)
∆vminn,s , ∆vmax
n,s Undervoltage and overvoltage deviations in bus n and scenario s(kV)
θn,s Voltage angle at bus n in scenario s (rad)
dn,s Continuous variable [0-1] that represents the portion of energy not suppliedat bus n in scenario s
ug Binary variable 0,1 (1 if generator g is dispatched, 0 otherwise)
wg,s Continuous variable [0-1] that defines the limits for active and reactive powerproduction of generator g in scenario s, used to distribute the charges dueto contingency scenarios
wl,s Continuous variable [0-1] that defines the value of the impedance matrixcoefficients of transmission line l in scenario s, used to distribute the chargesdue to contingency scenarios
sll,s Apparent power flow in line l and scenario s
rtnm, rtl Tap ratio of transformer located in between buses n and m which define theline l
gnm,s, bnm,s Real and imaginary part of the admittance matrix corresponding to busesn and m for scenario s ()
rGj , rA
j Generation/absorption VAR capacity reserve in the voltage control area j
NOMENCLATURE xxv
Economic outputs
Symbol Interpretation
CT Total costs of the VAR capacity market (e-year)
CQC Annual costs associated with the procurement of VAR capacity (e-year)
CQE Expected annual costs of the regulated payment for VAR capacity use (e-year)
CV Expected annual costs for voltage deviations (e-year)
CD Expected annual costs of non-supplied energy (e-year)
CP Expected annual costs of generation redispatch (e-year)
Rg Annual remuneration for selected VAR capacity of generator g (e-year)
Rc Annual remuneration for selected VAR capacity of capacitor bank c (e-year)
Rr Annual remuneration for selected VAR capacity of shunt reactor r (e-year)
CHs Annual charge paid by the agent responsible for contingency s(e-year)
CHn Annual charge paid by the load located in bus n (e-year)
CHl Annual charge paid by transmission line l due to its failure rate (e-year)
CHg Annual charge paid by generation g due to its failure rate (e-year)
λpn,s Lagrange multiplier of the active power balance equation at bus n in scenario
s
λqn,s Lagrange multiplier of the reactive power balance equation at bus n in sce-
nario s
λp∗n,s Curtailed Lagrange multiplier of the active power balance equation at bus
n in scenario s
λq∗n,s Curtailed Lagrange multiplier of the reactive power balance equation at bus
n in scenario s
λpn Aumann-Shapley value for the active power balance equation at bus n in
scenario s
λqn Aumann-Shapley value for the reactive power balance equation at bus n in
scenario s
µAg,s Lagrange multiplier of the equation of the selected capacity of VAR absorp-
tion to generator g in scenario s
xxvi NOMENCLATURE
µGg,s Lagrange multiplier of the equation of the selected capacity of VAR genera-
tion to generator g in scenario s
µc,s Lagrange multiplier of the equation for the selected VAR capacity to capac-itor bank c in scenario s
µr,s Lagrange multiplier of the equation for the selected VAR capacity to shuntr in scenario s
γkg,s Lagrange multiplier of the equation that defines the active and reactive power
limits for generator g in scenario s, calculated for the iteration k in theAumann-Shapley procedure
γkl,s Lagrange multiplier of the equation that redefines the impedance matrix
coefficients for transmission line l in scenario s, calculated for the iterationk in the Aumann-Shapley procedure
α Normalizing factor for the loads in order to settle the revenue reconciliation
Acronyms
Symbol Interpretation
AGC Automatic Generation Control, for active power management
AVR Automatic Voltage Regulator, installed in generation units
CAISO California Independent System Operator (United States)
CAPEX CAPital EXpenditures
DSO Distribution System Operator
ELCOM Electricity Commission of New South West (Unites States)
ENS Energy Non-Supplied
ERCOT Electric Reliability Council of Texas (United States)
FERC Federal Energy Regulatory Commission (United States)
GRTN Gestore della Rete di Trasmissione Nazionale (Italy)
LOC Loss of Opportunity Costs
MIBEL Mercado Ibérico de la Electricidad (Spain and Portugal), which can be trans-lated as Iberian Electric Energy Market
NERSA National Energy Regulator of South Africa
NOMENCLATURE xxvii
NGC National Grid Company (United Kingdom)
NYISO New York Independent System Operator (United States)
OFGEM The Office of Gas and Electricity Markets (United Kingdom)
OPEX OPerational EXpenditures
OPF Optimal Power Flow
PJM Energy market in Pennsylvania, New Jersey and Maryland
POD Point Of Delivery, connection point to the transmission network
REE Red Eléctrica de España (Spanish SO)
SO System Operator
STATCOM Static Compensator
SVC Static VAR Compensator
TSO Transmission System Operator
UCPTE Union pour la Coordination de la Production et du Transport d’Électricité
VAR Reactive Power
VQ Voltage control and reactive power management service

xxviii NOMENCLATURE
CHAPTER 1
Introduction
This introductory chapter presents the general background that motivates this thesis:the need for an improved regulatory model for reactive power and voltage control
service under restructuring and re-regulation of electric power systems. Current inci-dents concerning power system security, such as the one in April 2004 in the UnitedStates where 50 million people were affected, show the critical importance of reactivepower management. Traditional regulation schemes consider this service to be manda-tory with no associated compensation, so therefore there were no clear incentives for thecorrect procurement of this service. New competitive mechanisms are needed in orderto send efficient signals to service providers and demand in order to guarantee systemsecurity together with a minimization of the operation costs.
1
2 CHAPTER 1. INTRODUCTION
1.1 Reactive power support and voltage control
The supply of reactive power (VAR) is essential in order to maintain system securityin electric power systems. In the new unbundled organization of electricity markets,voltage control is usually integrated into the so-called ancillary services, which comprisethose services needed to guarantee the efficient and economic delivery of active power.Under this scheme, the management of voltage control is provided by the System Op-erators (SOs) using the different VAR sources, which are mainly generators and othercompensating devices such as capacitor banks, shunt reactors, SVCs and STATCOMdevices.
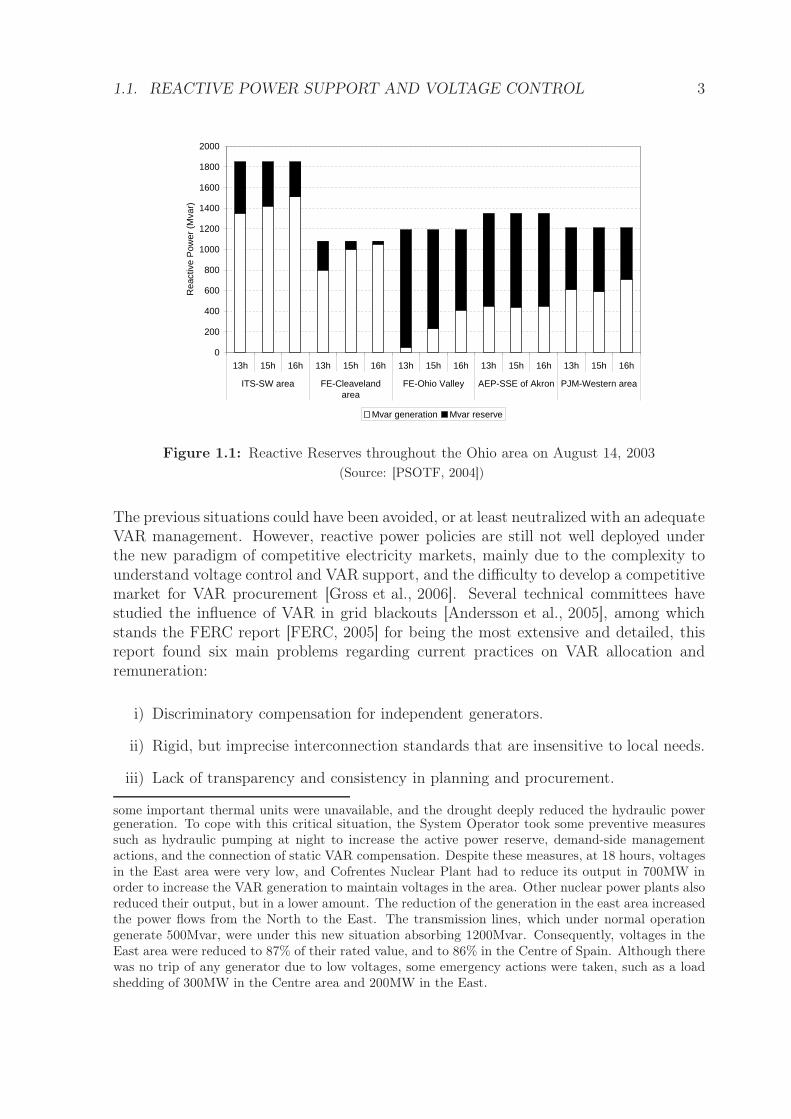
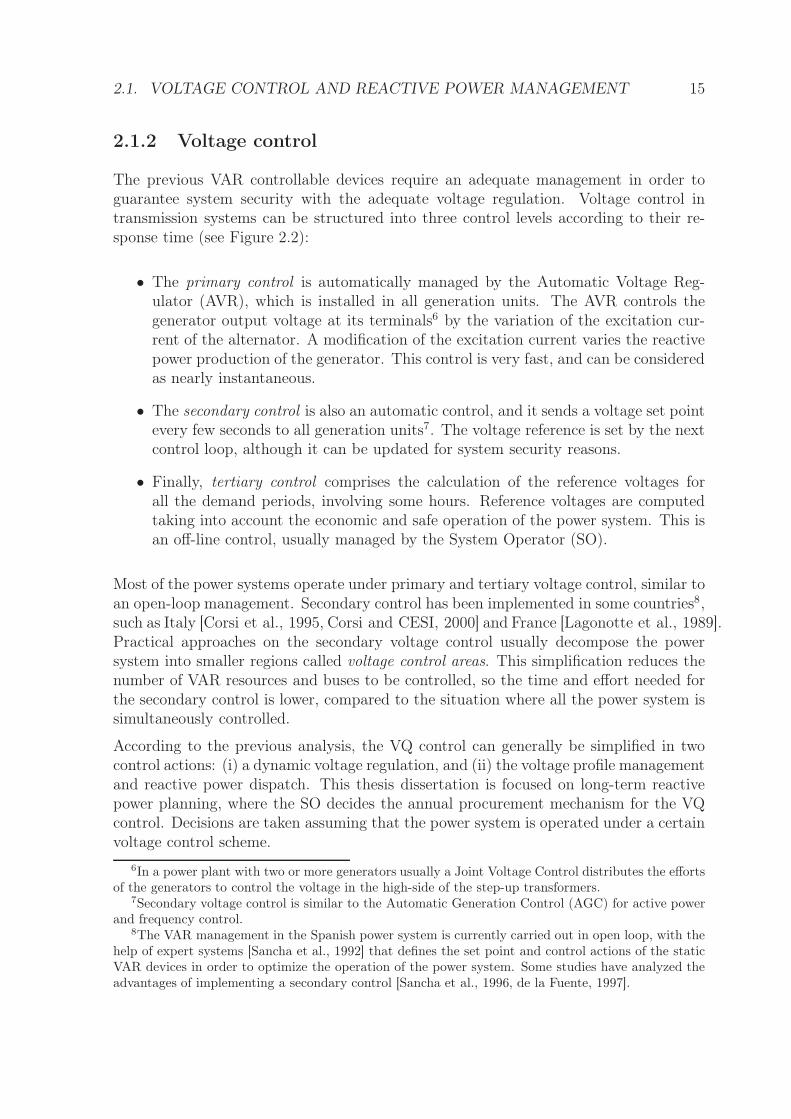
In most of the system-wide disturbances, inadequate reactive power management hasbeen one of the main causes for the system collapse. The final report of the Power SystemOutage in the United States and Canada in April 20041 stated that insufficient reactivepower was an issue in the blackout. Indeed, during this blackout the dynamic reactivepower sources were exhausted in some areas, as shown in Figure1.12. VAR supporthas also been identified as a key issue in other important blackouts in European powersystems: 1987 in France3 [RTE, 2002], 2003 in Italy [Corsi et al., 2004a, Vournas, 2004],or the emergency situation in 2001 in Spain4.
1On August 14, 2003 there was an electric power blackout in the Midwest and Northeast of theUnited States and Ontario (Canada). Fifty million customers were affected by the outage, constitutinga 61800MW load, with and an estimated cost of $4 to $10 billion. The blackout began with the tripof Eastlake 5 generation unit at 13:31 hours. Soon after the alarm and logging system in the SystemOperator control room failed. After 15:05 hours, five transmission lines in 345kV tripped out becauseof contacting overgrown trees within the lines’ right-of-way areas. The 138kV lines began to fail andcollapsed, with the loss of an important transmission line between the substations Sammis and Star.This line trip triggered the cascade blackout of the neighboring power systems, due to new unsustainableoverloading in the lines, and generation tripping. The normal operation of the whole affected area wasrecovered 4 days later.
2 This figure presents the reactive power reserve margins for five regions throughout Ohio, includingthe most representative power plants [PSOTF, 2004]. The VAR reserve is plotted for three situations,at 13 hours, 15 hours and 16 hours. It is clear that the reactive power reserves in the Cleveland areawere completely exhausted at 16 hours. Although the neighboring regions had enough VAR reserves,due to the local characteristic of VAR, they could not help the Cleveland area to maintain voltages.
3On January 12, 1987 there was a cold wave throughout all of France. There was enough capacityto supply the West area load with 5900MW, resulting in a voltage level of 405kV. Between 10:55 hoursand 11.42 hours, the generating groups #1, #2 and #3 of the Thermal Power Plant of Cordemaisbecame unavailable for different reasons. Still, Group #4 was strong enough to support the voltagelevel in the area, but a failure in its voltage regulating system caused the trip of the group. Theoutage of all the groups in Cordemais Thermal plant lowered voltage levels to 380kV during 30 seconds.Then, the autotransformers in the area modified their taps in order to improve the voltage level.Notwithstanding, this automatic operation of the autotransformers increased the power flows into thearea, and voltages fell down. Consequently, 9 groups tripped and there was a disconnection of 9000MWload. At 11:50 hours a manual load shedding of 1500MW load was needed to recover the voltagelevels in the transmission network. Gradually the system was restored, recovering normal operation atmidnight.
4The energy consumption during December 2001 in Spain was higher than usual due to a cold wave.In December 17, 2001 the active power reserve in the Spanish power system was very low because
1.1. REACTIVE POWER SUPPORT AND VOLTAGE CONTROL 3
0
200
400
600
800
1000
1200
1400
1600
1800
2000
13h 15h 16h 13h 15h 16h 13h 15h 16h 13h 15h 16h 13h 15h 16h
ITS-SW area FE-Cleavelandarea
FE-Ohio Valley AEP-SSE of Akron PJM-Western area
Rea
ctiv
e P
ower
(M
var)
Mvar generation Mvar reserve
Figure 1.1: Reactive Reserves throughout the Ohio area on August 14, 2003
(Source: [PSOTF, 2004])
The previous situations could have been avoided, or at least neutralized with an adequateVAR management. However, reactive power policies are still not well deployed underthe new paradigm of competitive electricity markets, mainly due to the complexity tounderstand voltage control and VAR support, and the difficulty to develop a competitivemarket for VAR procurement [Gross et al., 2006]. Several technical committees havestudied the influence of VAR in grid blackouts [Andersson et al., 2005], among whichstands the FERC report [FERC, 2005] for being the most extensive and detailed, thisreport found six main problems regarding current practices on VAR allocation andremuneration:
i) Discriminatory compensation for independent generators.
ii) Rigid, but imprecise interconnection standards that are insensitive to local needs.
iii) Lack of transparency and consistency in planning and procurement.
some important thermal units were unavailable, and the drought deeply reduced the hydraulic powergeneration. To cope with this critical situation, the System Operator took some preventive measuressuch as hydraulic pumping at night to increase the active power reserve, demand-side managementactions, and the connection of static VAR compensation. Despite these measures, at 18 hours, voltagesin the East area were very low, and Cofrentes Nuclear Plant had to reduce its output in 700MW inorder to increase the VAR generation to maintain voltages in the area. Other nuclear power plants alsoreduced their output, but in a lower amount. The reduction of the generation in the east area increasedthe power flows from the North to the East. The transmission lines, which under normal operationgenerate 500Mvar, were under this new situation absorbing 1200Mvar. Consequently, voltages in theEast area were reduced to 87% of their rated value, and to 86% in the Centre of Spain. Although therewas no trip of any generator due to low voltages, some emergency actions were taken, such as a loadshedding of 300MW in the Centre area and 200MW in the East.
4 CHAPTER 1. INTRODUCTION
iv) Poor financial incentives to provide or consume reactive power.
v) Poor incentives for some SOs to procure reactive power capability at the least cost.
vi) Failure of SOs to adjust VAR instructions so as to fully optimize the dispatch.
The tight relationship of voltage control and security of supply in power systems appliesboth to transmission networks and distribution networks. This thesis is focused onvoltage control management in transmission networks, where the main problems oncurrent practices have been previously highlighted. Voltage control in transmissionnetworks is mainly procured by generators, and is generally complemented by other VARcompensation sources, such as capacitor banks, shunt reactors, SVCs, or STATCOMdevices.
The voltage control actions performed to guarantee system security are typically basedon three time-frames loops: (i) the primary control is achieved by fast VAR sources tocompensate voltage variations, (ii) the secondary control actions coordinate the VARsupport of different sources in an electric area, and (iii) the tertiary control includesdispatching and planning of VAR sources in order to guarantee short-term securityof supply. The objective of this thesis dissertation is focused on the development ofcompetitive mechanisms for the procurement of the long-term VAR support, assumingadequate primary and secondary control loops.
The products that have been identified with the voltage control service are the installedVAR capacity, and the use of that capacity. The cost analysis of both products carriedout in this thesis determined that the main product is the installed capacity, which isproposed to be traded under competitive mechanisms. Under this scheme the differentVAR sources can procure the service optionally, and will be paid accordingly. The useof the VAR capacity has a lower cost, and can be economically compensated usingregulated mechanisms.
Under the competitive approach for VAR capacity procurement, the thesis explores theoptimal selection of the VAR sources using a comprehensive optimization algorithm forthe settlement of the proposed market structure. In order to send efficiency signals toall the market participants, the remuneration of the selected VAR sources is based onmarginal pricing. On the other hand, revenue reconciliation and efficient signals are aprimary objective for charging the demand of VAR capacity market. These signals areobtained using Cooperative Game Theory, based on Aumann-Shapley cost allocation.
1.2 Scope and objectives of this thesis
The aim of this thesis dissertation is to develop a unified framework for voltage controland reactive management service. This main objective requires the analysis and com-prehension of the many specific characteristics of the voltage control mechanisms andtheir economic impact. At present, although there has been a great research effort made
1.3. OUTLINE OF THE DOCUMENT 5
in this area, some key concepts are still misunderstood. Therefore, another key objectiveof this thesis is to clarify all the important concepts associated with the reactive powerprocurement.
In addition to the previous general objectives, the specific objectives tackled in theresearch study of this thesis can be summarized as follows:
i) Review the current regulatory mechanisms for the procurement of the reactivemanagement and voltage control service. The analysis will include the agentsparticipating in the service, the description of the costs of the service, and theallocation and remuneration mechanisms.
ii) From the previous analysis, propose a regulatory model for the VQ service. Thedesign of the model should consider the possibility of being integrated into thecurrent electricity trading mechanisms.
iii) Propose a mathematical formulation for the efficient selection of the best VARresources, minimizing the purchase costs and the expected operation costs in thepower system, which comprise the energy losses costs, voltage quality penalties,and non-supplied energy costs.
iv) Propose a remuneration mechanism for the procurement of the VQ service. First,the demand and procurement of the VQ service should be clearly identified. Then,the structure of payments and charges must send efficient economic and locationsignals to the market agents.
v) Apply the regulatory proposal for the VQ service to a case study in order to verifyits applicability.
1.3 Outline of the document
In order to cover all the objectives this thesis dissertation is structured in seven chaptersand four appendices. Each chapter covers a specific objective, including all developmentsand results for this purpose.
Chapter 2 analyzes the reactive power management and voltage control service in electricpower systems and introduces the main proposals of this thesis dissertation. First,an introduction to reactive power control in power systems is presented. The maintechnical characteristics of the control are analyzed together with the system devicesthat can participate in its procurement. Then, the VQ service based on voltage controland reactive power management is defined, including the market participants, the VARselection criteria and the economic flows. Finally, the economic theory is reviewed inorder to provide a basis for the VQ service definition.
Chapter 3 constitutes the core of this thesis. This chapter presents a regulatory proposalto allocate and remunerate the VQ service. The proposal for this service is based on
6 CHAPTER 1. INTRODUCTION
a reactive power capacity market. First, the framework in which the proposed marketcan be included is presented. Then, the VAR capacity is selected as the homogeneousproduct to be traded in the proposed market. This capacity market is then described,discussing the VAR capacity bids, and the structure of the market. The economicsettlement of the VAR capacity market includes the payments to the selected VAR bids,and the charging mechanism for the demand of the service. Finally, monitoring andpenalties are defined for the correct procurement of the service.
Chapter 4 presents an original VAR allocation method under the proposed market struc-ture. The proposed formulation selects the best VAR capacity bids that minimize thecost of the VQ service procurement, meeting the security-operating conditions both ina base case and under selected system contingencies. First, a general description of themarket auction and its theoretical basis are presented. Then, the mathematical formu-lation of the corresponding optimization problem is described in detail. Finally, someimplementation details of the VAR capacity market settlement are analyzed. A simpleillustrative case with two buses and three generators is used throughout this chapter toillustrate the theoretical discussion.
In Chapter 5 the principles for the settlement of the proposed VAR market are presented.First, the economic flows in the VAR market are described. On the one hand, theremuneration of the selected VAR sources are based on long-term marginal pricing.However on the other hand, the charging scheme is based on the Cooperative GameTheory, and will therefore differentiate the demand of VAR resources under normaloperating conditions and the over costs associated with the contingencies.
Chapter 6 presents the results of a case study in order to verify the applicability of theproposed VAR capacity market. This case study, a power system with 39 buses and 10generators, is presented first, with a brief description of the power system and the bidsof the market agents. Then, the VAR capacity is assigned to the selected market agents.Finally, the economic flows in the market are obtained, remunerating VAR procurement,and charging VAR demand.
Chapter 7 summarizes the conclusions, developments, and results that have been achievedin the analysis carried out in this thesis. The main original contributions that this workhas yielded are described, and finally new lines of research are suggested.
Appendix A presents an analysis of the innovative regulatory proposals for the VQservice in Spain and the United Kingdom. In addition, a comparative review of otherregulatory frameworks in Europe, the United States and other countries is presented.
Appendix B presents an original approach to building the capacity bids for the proposedVAR capacity market. VAR bids comprise the definition of an available VAR capacityand a corresponding price. First, a new method to calculate VAR capacity at theconnection point to the transmission network for the different VAR sources is presented.Then, the cost associated with the availability and use of the VAR capacity into theproposed market is described. The appendix is structured in two parts, analyzing thebids for generators, and then the bids of the other VAR compensation technologiesparticipating in the market.
1.3. OUTLINE OF THE DOCUMENT 7
Appendix C includes an original economic analysis of the value for a distribution systemoperator of the voltage at the connection point to the transmission network. The costevaluation considers the wear and tear of the voltage control equipment together withthe energy losses costs and the expected penalties for the non-supplied energy.
The data of the case study analyzed in Chapter 6 is presented in Appendix D.
8 BIBLIOGRAPHY
1.4 References
[Andersson et al., 2005] Andersson, G., Donalek, P., Farmer, R., Hatziargyriou, N.,Kamwa, I., Kundur, P., Martins, N., Paserba, J., Pourbeik, P., and Sanchez-Gasca,J. (2005). Causes of the 2003 major grid blackouts in north america and europe, andrecommended means to improve system dynamic performance. IEEE Transactionson Power Systems, 20(4):1922–1928.
[Corsi et al., 2004a] Corsi, S., Pozzi, M., Sabelli, C., and Serrani, A. (2004a). Thecoordinated automatic voltage control of the italian transmission grid-part i: reasonsof the choice and overview of the consolidated hierarchical system. IEEE Transactionson Power Systems, 19(4):1723–1732. TY - JOUR.
[FERC, 2005] FERC (2005). Principles for efficient and reliable reactive power supplyand consumption. Staff Report, Docket No. AD05-1-000.
[Gross et al., 2006] Gross, G., Marannino, P., and Chicco, G. (2006). Reactive Sup-port and Voltage Control Service: Key Issues and Challenges. IEEE MediterraneanElectrotechnical Conference, 2006. MELECON 2006., pages 897–901.
[PSOTF, 2004] PSOTF (2004). Final report on the august 14, 2003 blackout in theunited states and canada: Causes and recommendations. U.S.-Canada Power SystemOutage Task Force.
[RTE, 2002] RTE (2002). Mémento de la sûreté du systéme électrique. Gestionnnairedu Réseau de Transport d’électricité, Paris.
[Vournas, 2004] Vournas, C. (2004). Technical summary on the athens and southerngreece blackout of july 12, 2004. Regulatory Authority for Energy, Athens, Greece,Tech. Rep.
CHAPTER 2
The VQ service in power systems
This chapter analyzes the reactive power management and voltage control service inelectric power systems and introduces the main proposals of this thesis dissertation.
The chapter is structured in three sections:
• First, an introduction to the reactive power control in power systems is presented.The main technical characteristics of the control are analyzed, together with thesystem devices that can participate in its procurement.
• Then, the VQ service based on voltage control and reactive power managementis defined, trying to answer the following questions: who can provide the service?which criteria is used to select the VAR sources to participate in the service? whatare the economic flows (remuneration to suppliers and charges to demand) in theVQ service?
• Finally, the economic theory is reviewed in order to provide a basis for the VQservice definition.
9
10 CHAPTER 2. THE VQ SERVICE
2.1 Voltage control and reactive power management
Back in 1882, Thomas A. Edison switched on the first generating station to supplyelectricity to 59 customers in lower Manhattan. The electric distribution was in 110volts direct current. Edison realized that the voltage for the customers dropped asthe consumption in lighting increased, and also if the customer was far away from thepower station. He solved this problem by modifying the circuit of the direct currentgenerator. This was the first voltage regulator, known as compounding. A few yearslater Nikola Tesla introduced the alternating current, which overcame the limitation ofthe direct current to transfer energy over long distances. This was done by changingthe voltage levels with transformers, and therefore transmitting the energy with lowerlosses and lower voltage drops. However, the voltage regulation problem remained, andtherefore was later solved by including in the alternating generator a voltage regulatorthat modified its excitation current. By modifying the excitation current, the voltagein the generator terminal is controlled, but also the reactive power1 (VAR) generatedby the alternator is modified. This double effect gives the name to voltage control andreactive power management (VQ control). Soon after, other static compensation deviceswere used to help generators to control voltages, such as capacitor banks and shuntreactors. Nowadays power electronics have developed improved VAR equipment, such asStatic VAR Compensators (SVC), that can perform similar VAR compensation as thatprovided by generators. First studies on voltage control analyzed the VAR capabilityof generators [Adams and McClure, 1948], and during the eighties2 and nineties a bigeffort was done in analyzing the optimal procurement of VAR support.
As it occurred in the very dawn of electricity, nowadays the main objective of the VQcontrol is to achieve an overall improvement of the system security, service quality, andeconomic efficiency. System security in power networks requires adequate voltage levelsand reactive reserves in order to prevent voltage stability problems and to maintainsystem integrity when critical contingencies occur. On the other hand, service qualityrequires appropriate control of all voltages in the power system within tolerable lim-its. Finally, the economic efficiency implies reactive line flows control which results inminimal transmission losses.
Next, a description of the technical and economic characteristics of the VAR compensa-tion equipment is presented, together with the detailed analysis of the voltage controlin power systems.
1The formulation of reactive power is obtained from the general equation of the instantaneouspower. The average value of reactive power is always zero, which means that the energy is flowingfor half of the cycle in one direction and in the opposite direction for the second half of the cycle.Therefore, another quantity is needed to describe the back and forth flow of reactive power, which isthe maximum instantaneous reactive power. Note that for the active power flow the average value isused, and the maximum instantaneous value is usually ignored as it is the same quantity as the averagevalue. Finally, the loss of reactive power can be seen as a loss in the amplitude of the instantaneousreactive power [Fetea and Petroianu, 2000].
2A complete bibliography on reactive power and voltage control was developed in 1987 by the IEEEVAR management Working Group in [Smith et al., 1987].
2.1. VOLTAGE CONTROL AND REACTIVE POWER MANAGEMENT 11
2.1.1 VAR compensation equipment
Traditionally, there have been different voltage control procedures for transmission anddistribution networks. Voltage control practices are the result of distinct operationand characteristics of transmission networks (a meshed network) and the distributionnetworks (radial operated networks, with low generation penetration).
The main objective of the VQ control in transmission networks is to provide securityin the operation. In addition, the VQ control should watch the economic efficiency,and quality in the supply of energy. The providers of the VQ control are synchronousgenerators, power transformers, power lines, shunt reactors, and capacitors banks. TheVQ control is usually considered as a service among the ancillary services for the trans-mission network, as it will be discussed in the following sections.
The aim of the VQ control in distribution networks is to maintain voltage ampli-tude in the demand within a range where loads can operate properly. Voltage prob-lems are usually associated to long lines, together with the increase of load demand.The distribution system operators (DSOs) manage the voltage across the distributionnetwork by adjusting the taps of transformers, and with the installation of voltageregulators and capacitor banks. Nowadays, the integration of large amounts of dis-tributed generation in distribution networks poses a new challenge for the VQ control[Peças et al., 2005, Li et al., 2006].
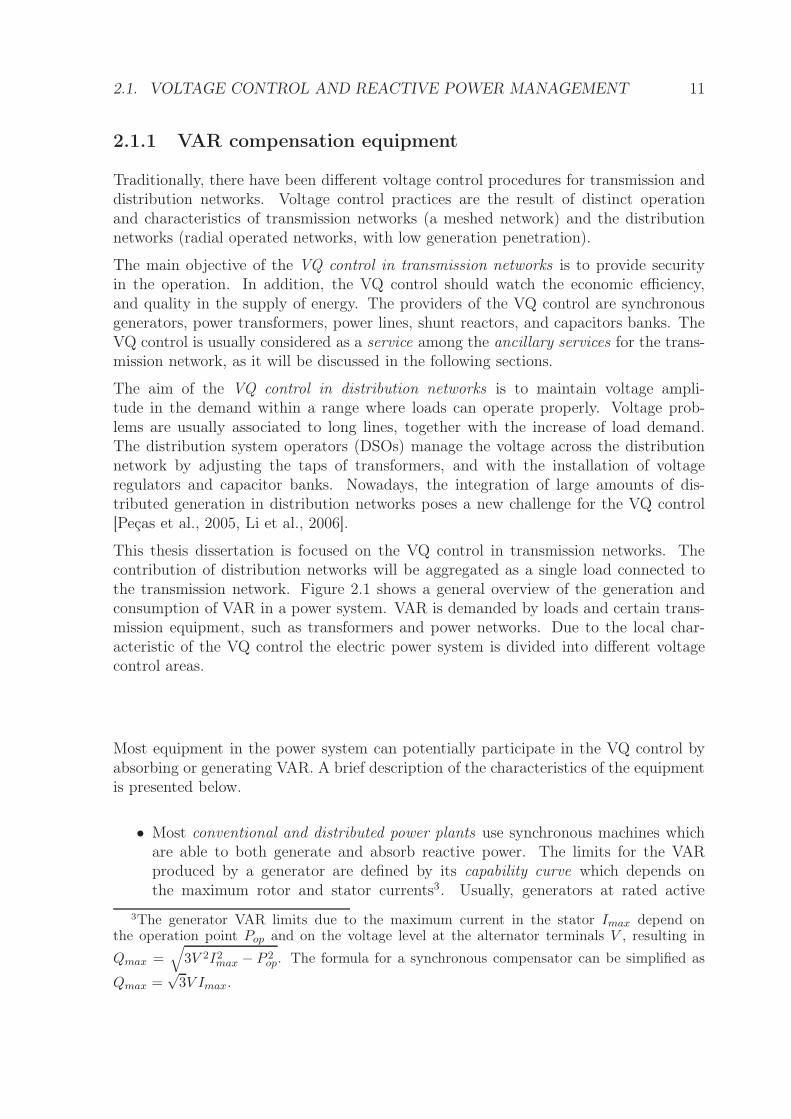
This thesis dissertation is focused on the VQ control in transmission networks. Thecontribution of distribution networks will be aggregated as a single load connected tothe transmission network. Figure 2.1 shows a general overview of the generation andconsumption of VAR in a power system. VAR is demanded by loads and certain trans-mission equipment, such as transformers and power networks. Due to the local char-acteristic of the VQ control the electric power system is divided into different voltagecontrol areas.
Most equipment in the power system can potentially participate in the VQ control byabsorbing or generating VAR. A brief description of the characteristics of the equipmentis presented below.
• Most conventional and distributed power plants use synchronous machines whichare able to both generate and absorb reactive power. The limits for the VARproduced by a generator are defined by its capability curve which depends onthe maximum rotor and stator currents3. Usually, generators at rated active
3The generator VAR limits due to the maximum current in the stator Imax depend onthe operation point Pop and on the voltage level at the alternator terminals V , resulting in
Qmax =√
3V 2I2max − P 2
op. The formula for a synchronous compensator can be simplified as
Qmax =√
3V Imax.
12 CHAPTER 2. THE VQ SERVICE
G
G G
G
-Generators can generate and absorb VAR-The step-up transformer controls the
voltage in the high volage side
Networks, depending on loading, generate or absorb VAR
-Reactors absorb VAR-Capacitors generate VAR
Tap-changerscontrol voltages
in the distributionnetworks
Capacitors are mainly usednear loads
Load characteristics are veryimportant for voltage control
400kV
220kV 220kV
132/60/20 kV
400V
Transformersabsorb VAR
Figure 2.1: Reactive power flows in power systems
(Source: [RTE, 2002] and personal research)
power production can generate at their terminals 62% of their active power inreactive power (power factor 0.85 lag), and absorb 48% of its active power in re-active power (power factor 0.9 lead). The VAR limits in the high side of thestep-up transformer include additional limits associated with the operation ofthe whole power plant [Adibi and Milanicz, 1994, Frías, 2004, Nilsson et al., 1994,Panvini and Yohn, 1995], as it will be analyzed in Appendix B. If the synchronousmachine can be declutched from the associated turbine, then the generator canwork as a synchronous compensator, with no active power production and its fullVAR capacity available4.
• Fixed or mechanically switched capacitor banks and shunt reactors have been tra-ditionally used for VAR compensation. These devices provide an inexpensive com-pensation, and are widely used for power factor correction, both in low voltageand high voltage applications. Their main drawback is the quadratic dependence
4Converting a generator into a synchronous condenser requires the installation of a clutch, whichhas a cost of approximately 3% of the price of a new power plant (for example $700,000 in a50MW generator). At present, there are several companies that manufactures clutches, such asBorg Warner http://www.bwauto.com and Marland http://www.marland.com/literature/pdf/
catalogs/cecon_disconnect_catalog.pdf, which have already developed and installed clutches onturbine generators in the range of 1MW to 300MW [Li et al., 2006].
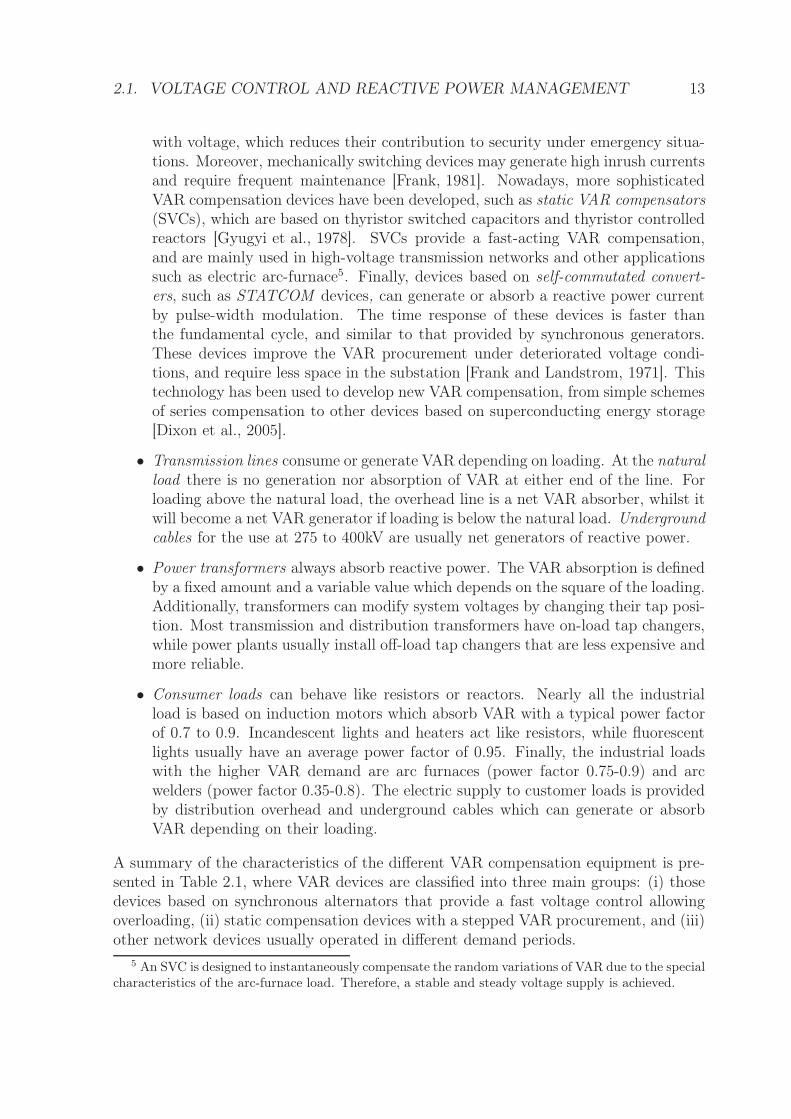
2.1. VOLTAGE CONTROL AND REACTIVE POWER MANAGEMENT 13
with voltage, which reduces their contribution to security under emergency situa-tions. Moreover, mechanically switching devices may generate high inrush currentsand require frequent maintenance [Frank, 1981]. Nowadays, more sophisticatedVAR compensation devices have been developed, such as static VAR compensators(SVCs), which are based on thyristor switched capacitors and thyristor controlledreactors [Gyugyi et al., 1978]. SVCs provide a fast-acting VAR compensation,and are mainly used in high-voltage transmission networks and other applicationssuch as electric arc-furnace5. Finally, devices based on self-commutated convert-ers, such as STATCOM devices, can generate or absorb a reactive power currentby pulse-width modulation. The time response of these devices is faster thanthe fundamental cycle, and similar to that provided by synchronous generators.These devices improve the VAR procurement under deteriorated voltage condi-tions, and require less space in the substation [Frank and Landstrom, 1971]. Thistechnology has been used to develop new VAR compensation, from simple schemesof series compensation to other devices based on superconducting energy storage[Dixon et al., 2005].
• Transmission lines consume or generate VAR depending on loading. At the naturalload there is no generation nor absorption of VAR at either end of the line. Forloading above the natural load, the overhead line is a net VAR absorber, whilst itwill become a net VAR generator if loading is below the natural load. Undergroundcables for the use at 275 to 400kV are usually net generators of reactive power.
• Power transformers always absorb reactive power. The VAR absorption is definedby a fixed amount and a variable value which depends on the square of the loading.Additionally, transformers can modify system voltages by changing their tap posi-tion. Most transmission and distribution transformers have on-load tap changers,while power plants usually install off-load tap changers that are less expensive andmore reliable.
• Consumer loads can behave like resistors or reactors. Nearly all the industrialload is based on induction motors which absorb VAR with a typical power factorof 0.7 to 0.9. Incandescent lights and heaters act like resistors, while fluorescentlights usually have an average power factor of 0.95. Finally, the industrial loadswith the higher VAR demand are arc furnaces (power factor 0.75-0.9) and arcwelders (power factor 0.35-0.8). The electric supply to customer loads is providedby distribution overhead and underground cables which can generate or absorbVAR depending on their loading.
A summary of the characteristics of the different VAR compensation equipment is pre-sented in Table 2.1, where VAR devices are classified into three main groups: (i) thosedevices based on synchronous alternators that provide a fast voltage control allowingoverloading, (ii) static compensation devices with a stepped VAR procurement, and (iii)other network devices usually operated in different demand periods.
5 An SVC is designed to instantaneously compensate the random variations of VAR due to the specialcharacteristics of the arc-furnace load. Therefore, a stable and steady voltage supply is achieved.
14 CHAPTER 2. THE VQ SERVICE
Table
2.1
:Tech
nical
characteristics
ofth
eVA
Rcom
pen
sationdev
ices
Volta
ge
contro
lVA
Rsu
pport
VA
Rso
urc
es
Norm
al
opera
tion
Speed
Volta
ge
step
VA
R
pro
cure
ment
Volta
ge
dependence
Conven
tionalgen
eratio
nIn
stanta
neo
us
Fast
Contin
uous
Gen
eratio
n&
abso
rptio
n
Capability
limits
dep
end
on
V
Rota
ting
synch
ronous
con-
den
ser
Insta
nta
neo
us
Fast
Contin
uous
Gen
eratio
n&
abso
rptio
n
Capability
limits
dep
end
on
V
Distribu
tedgen
eratio
nIn
stanta
neo
us
Fast
Contin
uous
Gen
eratio
n&
abso
rptio
n
V
Capa
citor
bank
Hourly,
seaso
nal
Slow
Step
ped
Gen
eratio
nV
2
Shuntrea
ctor
Hourly,
seaso
nal
Slow
On/off
Abso
rptio
nV
2
SV
CIn
stanta
neo
us
Fast
Step
ped
Gen
eratio
n&
abso
rptio
n
V2
Self-co
mm
uta
tedco
nverters
Insta
nta
neo
us
Fast
Contin
uous
Gen
eratio
n&
abso
rptio
n
V
Tra
nsm
ission
line
Dem
and
perio
dSlow
On/off
Gen
eratio
nor
abso
rptio
n
-
Tra
nsfo
rmer
tap
changer
Hourly,
daily
Slow
Step
ped
Volta
ge
contro
l-
Loa
ds
Hourly
Slow
Contin
uous
Abso
rptio
nD
epen
ds
on
load
chara
cteristics
(Source:
[Kirb
yand
Hirst,
1997]
and
perso
nalresea
rch)
2.1. VOLTAGE CONTROL AND REACTIVE POWER MANAGEMENT 15
2.1.2 Voltage control
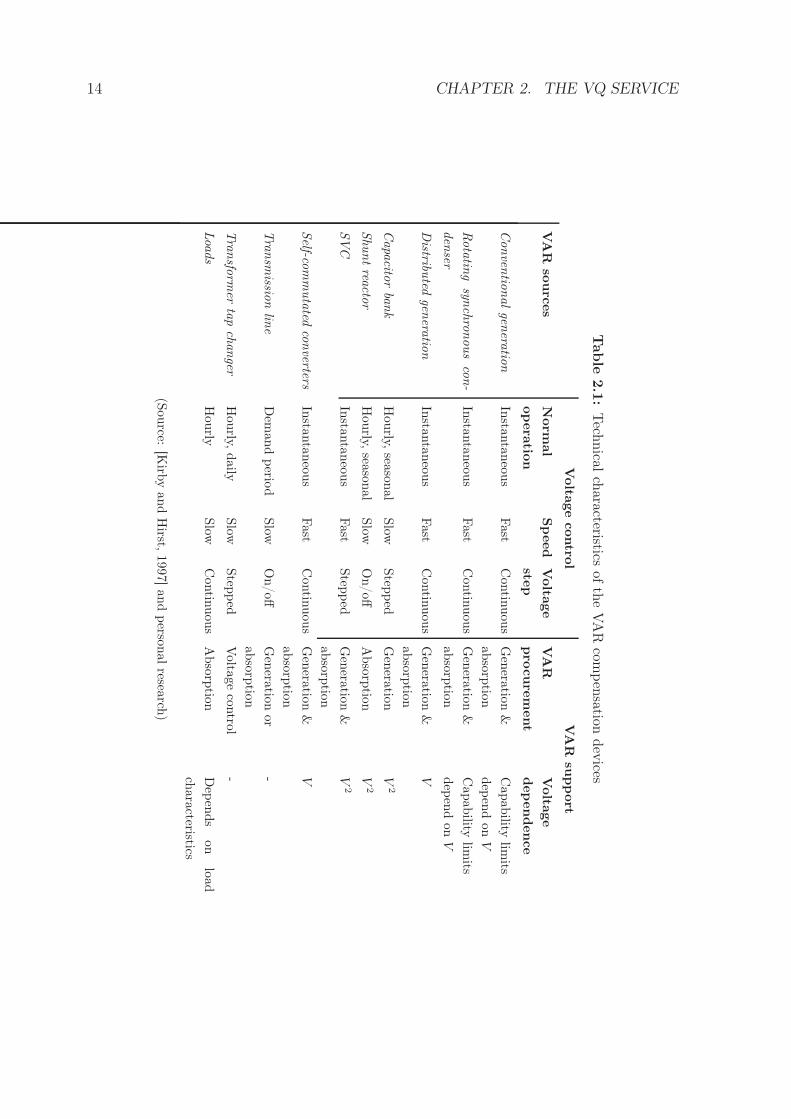
The previous VAR controllable devices require an adequate management in order toguarantee system security with the adequate voltage regulation. Voltage control intransmission systems can be structured into three control levels according to their re-sponse time (see Figure 2.2):
• The primary control is automatically managed by the Automatic Voltage Reg-ulator (AVR), which is installed in all generation units. The AVR controls thegenerator output voltage at its terminals6 by the variation of the excitation cur-rent of the alternator. A modification of the excitation current varies the reactivepower production of the generator. This control is very fast, and can be consideredas nearly instantaneous.
• The secondary control is also an automatic control, and it sends a voltage set pointevery few seconds to all generation units7. The voltage reference is set by the nextcontrol loop, although it can be updated for system security reasons.
• Finally, tertiary control comprises the calculation of the reference voltages forall the demand periods, involving some hours. Reference voltages are computedtaking into account the economic and safe operation of the power system. This isan off-line control, usually managed by the System Operator (SO).
Most of the power systems operate under primary and tertiary voltage control, similar toan open-loop management. Secondary control has been implemented in some countries8,such as Italy [Corsi et al., 1995, Corsi and CESI, 2000] and France [Lagonotte et al., 1989].Practical approaches on the secondary voltage control usually decompose the powersystem into smaller regions called voltage control areas. This simplification reduces thenumber of VAR resources and buses to be controlled, so the time and effort needed forthe secondary control is lower, compared to the situation where all the power system issimultaneously controlled.
According to the previous analysis, the VQ control can generally be simplified in twocontrol actions: (i) a dynamic voltage regulation, and (ii) the voltage profile managementand reactive power dispatch. This thesis dissertation is focused on long-term reactivepower planning, where the SO decides the annual procurement mechanism for the VQcontrol. Decisions are taken assuming that the power system is operated under a certainvoltage control scheme.
6In a power plant with two or more generators usually a Joint Voltage Control distributes the effortsof the generators to control the voltage in the high-side of the step-up transformers.
7Secondary voltage control is similar to the Automatic Generation Control (AGC) for active powerand frequency control.
8The VAR management in the Spanish power system is currently carried out in open loop, with thehelp of expert systems [Sancha et al., 1992] that defines the set point and control actions of the staticVAR devices in order to optimize the operation of the power system. Some studies have analyzed theadvantages of implementing a secondary control [Sancha et al., 1996, de la Fuente, 1997].
16 CHAPTER 2. THE VQ SERVICE
VAR control of each device
(AVR, SVC, or taps in
transformer)
Few seconds
VAR control and
management in an area
Few minutes OPF (security & economy)Time lag >15 minutes
Applied to the whole power system
Primary control
Secondary control
Tertiary control
Emergency actionsCritical(N-k)
Failure
Normal
t t+1minute t+15 minutes t+30 minutes
Load shedding,transformer tap block
Network condition
time
Figure 2.2: Voltage control levels
(Source: [UETP, 1997] and personal research)
2.1.2.1 Dynamic voltage control and VAR reserve management
Power system stability includes frequency and voltage stability. Frequency stability isa very fast process which is associated with generators swinging out of voltage. Onthe other hand, voltage stability problems are slower, from tens of seconds to minutes,and are caused by an imbalance between VAR generation and VAR demand. For thispurpose, the VQ curves study the reactive power needed to maintain voltages in a certainbus for different power system operating conditions. These curves are divided into twoareas, stable and unstable operation, which are delimited by the critical voltage. Understable operation, an increment in voltages across the network requires more reactivepower. For safe operation the working point should be well above the critical voltage[Kundur, 1994].
An example of stability analysis is shown in Figure 2.3. This figure represents fourcurves for different operating conditions, from normal operation to the failure of 3 el-ements in the power system. Under a normal operation scenario the operating pointis #1; however, if a contingency occurs (N-1) the system moves to #2, reducing thevoltage. Then, generators modify their VAR production to recover voltages, moving tothe reference voltage #3. A new failure (N-2) may lead the system to #4 and #5; here,the system cannot recover its initial voltage since all the VAR sources are exhausted. Ifa new failure occurs (N-3), the system becomes unstable, as there is not enough VARto maintain voltages.
To procure a safe preventive operation, the power system must have sufficient VAR
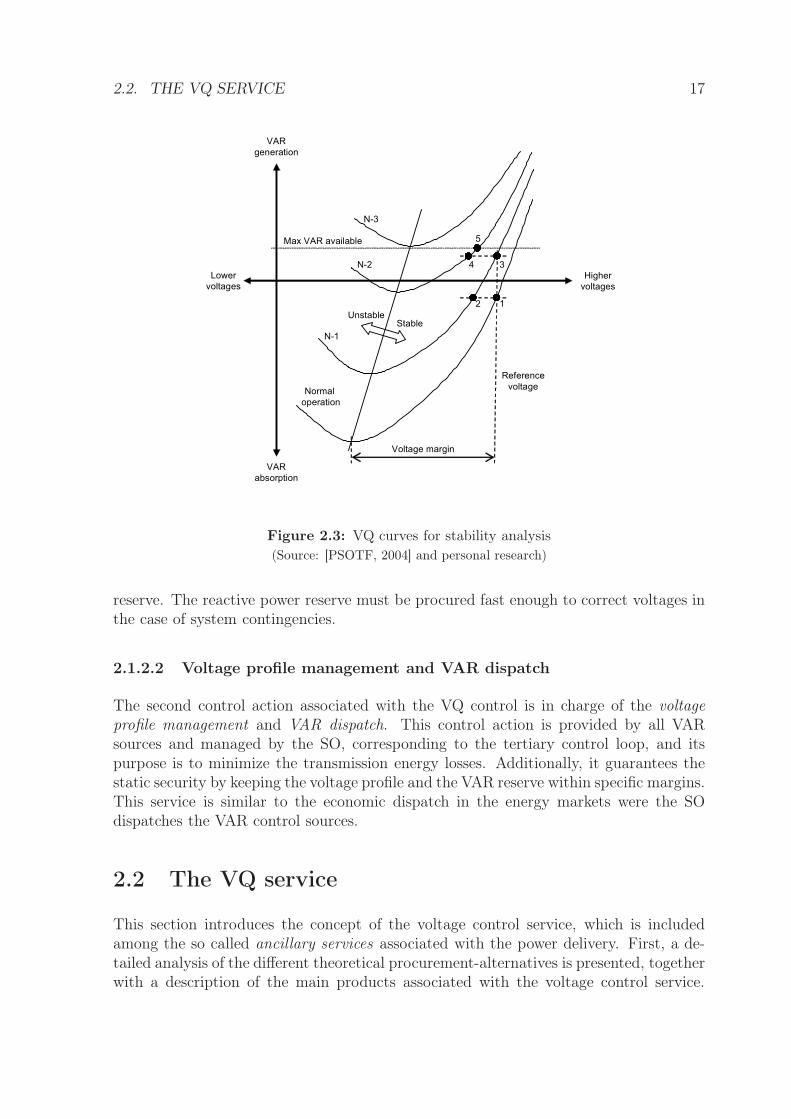
2.2. THE VQ SERVICE 17
12
34
5
Normal
operation
N-1
N-2
N-3
UnstableStable
Voltage margin
VAR
generation
VAR
absorption
Higher
voltages
Lower
voltages
Max VAR available
Reference
voltage
Figure 2.3: VQ curves for stability analysis
(Source: [PSOTF, 2004] and personal research)
reserve. The reactive power reserve must be procured fast enough to correct voltages inthe case of system contingencies.
2.1.2.2 Voltage profile management and VAR dispatch
The second control action associated with the VQ control is in charge of the voltageprofile management and VAR dispatch. This control action is provided by all VARsources and managed by the SO, corresponding to the tertiary control loop, and itspurpose is to minimize the transmission energy losses. Additionally, it guarantees thestatic security by keeping the voltage profile and the VAR reserve within specific margins.This service is similar to the economic dispatch in the energy markets were the SOdispatches the VAR control sources.
2.2 The VQ service
This section introduces the concept of the voltage control service, which is includedamong the so called ancillary services associated with the power delivery. First, a de-tailed analysis of the different theoretical procurement-alternatives is presented, togetherwith a description of the main products associated with the voltage control service.
18 CHAPTER 2. THE VQ SERVICE
Then, the mechanisms to efficiently allocate the VAR resources are described. Finally,the economic flows (remuneration and charging) in this service are analyzed.
2.2.1 Definition of the VQ service
Currently, many countries have developed competitive mechanisms for electric energytrading. Most of these mechanisms are based on bilateral arrangements between gener-ation companies and customers. However, some energy is still traded in spot markets.
Once the electric energy market has defined the corresponding energy transactions forthe next period of time, the market agents rely on the SO in order to guarantee thatthese transactions take place under a secure, quality and economic efficiency standards.For this purpose, the SO defines a group of operating procedures based on engineeringmandates in which all power system participants are involved. Among these operatingprocedures stand the voltage control and reactive power management (VQ control).
For the aim of economic efficiency, the SO can decide to create competitive mechanismsfor the procurement of one of these operating procedures. This was why in the 90’s theterm ancillary services was first used in the United Kingdom, to designate the group ofproducts and services needed to ensure the secure and efficient delivery of electric poweraccording to certain quality standards [NGC, 1991]. The ancillary service associatedwith voltage and reactive management (VQ service) can be defined by the followingcharacteristics:
• The generation units are the main service providers, although other VAR sourcescan also procure the service, such as capacitor banks, shunt reactors, SVCs, andother fast compensating devices.
• The SO is responsible for the definition of the volume of service, on behalf of allenergy market participants. The volume of service must guarantee a reasonablesecurity level which is settled by the load demand, the VAR requirements of thenetworks, and the set of probable contingencies.
• The service procurement will increase the costs of the ancillary services and reducethe expected costs for the operation costs in the period analyzed.
Traditionally, ancillary services have been integrated into the power generation businessand they are non-separable with the active power production activity. Therefore, thepurchase and remuneration of the VQ service have been integrated into the basic energyproduct, with a pass-through of its costs to all market participants. Nowadays, underthe liberalization process in electricity markets, it is accepted that the ancillary serviceswould have separate procurement and remuneration mechanisms in order to minimizethe expected system costs, and send efficient economic signals to the participants. Thisthesis dissertation is focused on the development of a competitive market for the VQservice.
2.2. THE VQ SERVICE 19
Economic analysis have demonstrated that voltage quality and system reliability havepublic good aspects [Joskow and Schmalensee, 1983]. The definition of a competitivemarket for the VQ service may have two difficulties, i) there may be a lack of VARsuppliers, and ii) the service demand is usually insensitive to the service value. Moreover,customers, regardless of their value of voltage quality, are going to receive the identicalquality of service. Therefore, some regulatory authority should establish a cost-effectiveVQ service. On the other hand, real and reactive power are private goods, whichare used to produce public goods, among which stand the VQ service. In this sense[Toomey et al., 2005] provides an engineering and economic model of voltage qualityand reliability to determine its true value.
In conclusion, some type of central authority is needed to design, plan, and manage theVQ service. This entity, depending on the regulatory framework of each power system,could be an ISO or the Electricity Regulator. Regulation is needed because electricpower does not lead itself to a degree of decentralized decision-making that is commonin other markets [Thomas et al., 2006]. Therefore, the central authority should designa VAR market for the efficient procurement of private goods (active power and VAR)in order to optimally procure the public good service, that is to say the VQ service.
An analysis of the different options for the procurement, remuneration, and allocationof the VQ service is presented in this section.
2.2.2 Procurement of the VQ service
One of the objectives of this thesis dissertation is to develop a market mechanism forthe VQ service. Therefore, the first topic of research is the analysis of the main productsthat can be defined for the VQ service. This section first discusses the main alternativesfor the procurement of the VQ service, and then presents an international review of thecurrent practices and definitions of the VQ service.
2.2.2.1 Procurement options of the VQ service
The liability to define the regulation for the procurement of the VQ service relies on theEnergy Regulator. However, the public regulator usually passes on this responsibilityto the SO, due to its experience in defining the operating criteria of power systems.The three questions that the SO should answer to define the VQ service procurementare: who can participate in the service? how is the VQ service provided? and, whatmechanism regulates the participation in the service?
The international review presented in Appendix A shows that most SOs rely on gen-erators as the main providers of the VQ service. Additionally, some of them define aminimum size for generators to participate in the service9. Other VAR compensation
9The Spanish SO defines a minimum capacity of 30MW per generation unit, or group of generatorsconnected to the same point of the transmission network. Other countries have similar limits, 50MWin the United Kingdom and Wales, 100MW in Germany, 10MVA in Finland, and 25MVA in Belgium.
20 CHAPTER 2. THE VQ SERVICE
sources, such as capacitor banks and shunt reactors, have been traditionally consideredas part of the transmission network assets and owned by the corresponding transmissioncompanies. These devices are usually managed following the SO orders. Additionally,in order to guarantee system security the SO may install new VAR compensation equip-ment if the current VAR resources are exhausted. This thesis dissertation proposesadvanced mechanisms for the procurement of the VQ service which incorporate theparticipation of private investors that install new VAR sources. Therefore, introduc-ing competition in the available VAR sources will improve its procurement of the VQservice.
It is important to differentiate the role of the SO and the transmission network ownerin the VQ service. The SO is responsible for the operation of the whole power system,to maintain the network within safe and secure operation limits, using the resources inthe network from other owners, such as transmission or generation companies. Underan unbundled scheme10 the SO is a regulated business that receives certain incentivesto efficiently manage the total costs of system operation on behalf of customers. Onthe other hand, the new investments in the transmission network are recovered by thenetwork companies usually through an annual investment program which is previouslyapproved by the government. Therefore, it is very important to have real unbundlingbetween the SO and network owners, because if not, the integrated company mightbenefit from its dominant position in the control of the transmission network, in termsof access to the network and economic benefits11.
The SOs use the operating procedures for voltage control to define the needs of VARsupport, and select the VAR sources that participate in the VQ service. The operatingprocedures are based on the control of the transmission voltages within certain securityranges. These voltage margins are usually defined according to engineering criteria fordifferent load periods, voltage control areas in the power system, and voltage levels.
The procurement of VAR support by the different VAR sources can be defined by theSO as mandatory or optional participation in the VQ service:
• Mandatory requirements. All the agents have the obligation to provide a certainamount of VAR capacity to procure the VQ service. This requirement is usu-ally specified for the installed VAR capacity in generators, with the definition ofleading and lagging power factors. These power factor requirements can be de-fined for each generation unit in the machine terminals or in the connection pointto the transmission network. The last alternative includes the consumption of
10In a liberalized electricity system, unbundling requires that the business that controls the networkis separated from the commercial activities, generation and retail to final consumers.
11Two potential problems may arise if there is not sufficient unbundling between the SO and thetransmission network owners. First, an integrated company owning the network and commercial ac-tivities might deny access to the network or apply unfair conditions to other generators or retailersthat compete with those of the integrated company. Second, the integrated company might allocatecosts more properly attributed to generation or retail to the network business. This would make theapparent costs of their generation or retail businesses artificially low and would give them an unfairadvantage in these activities [Thomas, 2007].
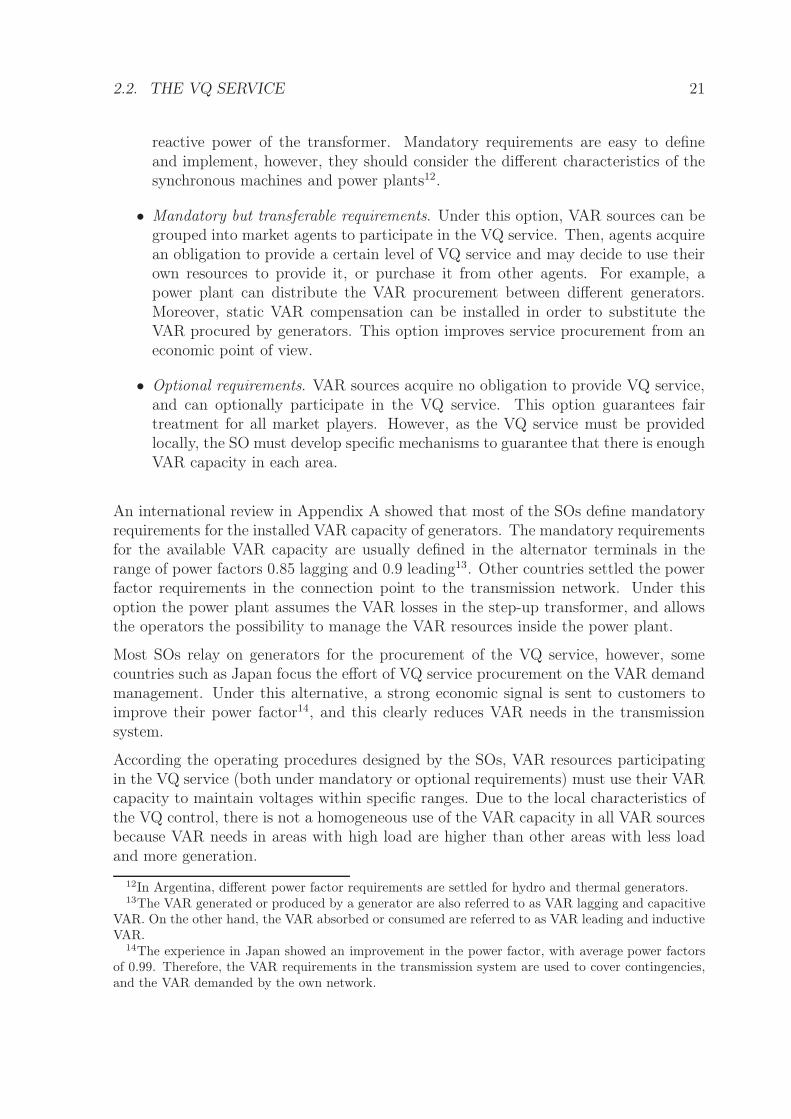
2.2. THE VQ SERVICE 21
reactive power of the transformer. Mandatory requirements are easy to defineand implement, however, they should consider the different characteristics of thesynchronous machines and power plants12.
• Mandatory but transferable requirements. Under this option, VAR sources can begrouped into market agents to participate in the VQ service. Then, agents acquirean obligation to provide a certain level of VQ service and may decide to use theirown resources to provide it, or purchase it from other agents. For example, apower plant can distribute the VAR procurement between different generators.Moreover, static VAR compensation can be installed in order to substitute theVAR procured by generators. This option improves service procurement from aneconomic point of view.
• Optional requirements. VAR sources acquire no obligation to provide VQ service,and can optionally participate in the VQ service. This option guarantees fairtreatment for all market players. However, as the VQ service must be providedlocally, the SO must develop specific mechanisms to guarantee that there is enoughVAR capacity in each area.
An international review in Appendix A showed that most of the SOs define mandatoryrequirements for the installed VAR capacity of generators. The mandatory requirementsfor the available VAR capacity are usually defined in the alternator terminals in therange of power factors 0.85 lagging and 0.9 leading13. Other countries settled the powerfactor requirements in the connection point to the transmission network. Under thisoption the power plant assumes the VAR losses in the step-up transformer, and allowsthe operators the possibility to manage the VAR resources inside the power plant.
Most SOs relay on generators for the procurement of the VQ service, however, somecountries such as Japan focus the effort of VQ service procurement on the VAR demandmanagement. Under this alternative, a strong economic signal is sent to customers toimprove their power factor14, and this clearly reduces VAR needs in the transmissionsystem.
According the operating procedures designed by the SOs, VAR resources participatingin the VQ service (both under mandatory or optional requirements) must use their VARcapacity to maintain voltages within specific ranges. Due to the local characteristics ofthe VQ control, there is not a homogeneous use of the VAR capacity in all VAR sourcesbecause VAR needs in areas with high load are higher than other areas with less loadand more generation.
12In Argentina, different power factor requirements are settled for hydro and thermal generators.13The VAR generated or produced by a generator are also referred to as VAR lagging and capacitive
VAR. On the other hand, the VAR absorbed or consumed are referred to as VAR leading and inductiveVAR.
14The experience in Japan showed an improvement in the power factor, with average power factorsof 0.99. Therefore, the VAR requirements in the transmission system are used to cover contingencies,and the VAR demanded by the own network.
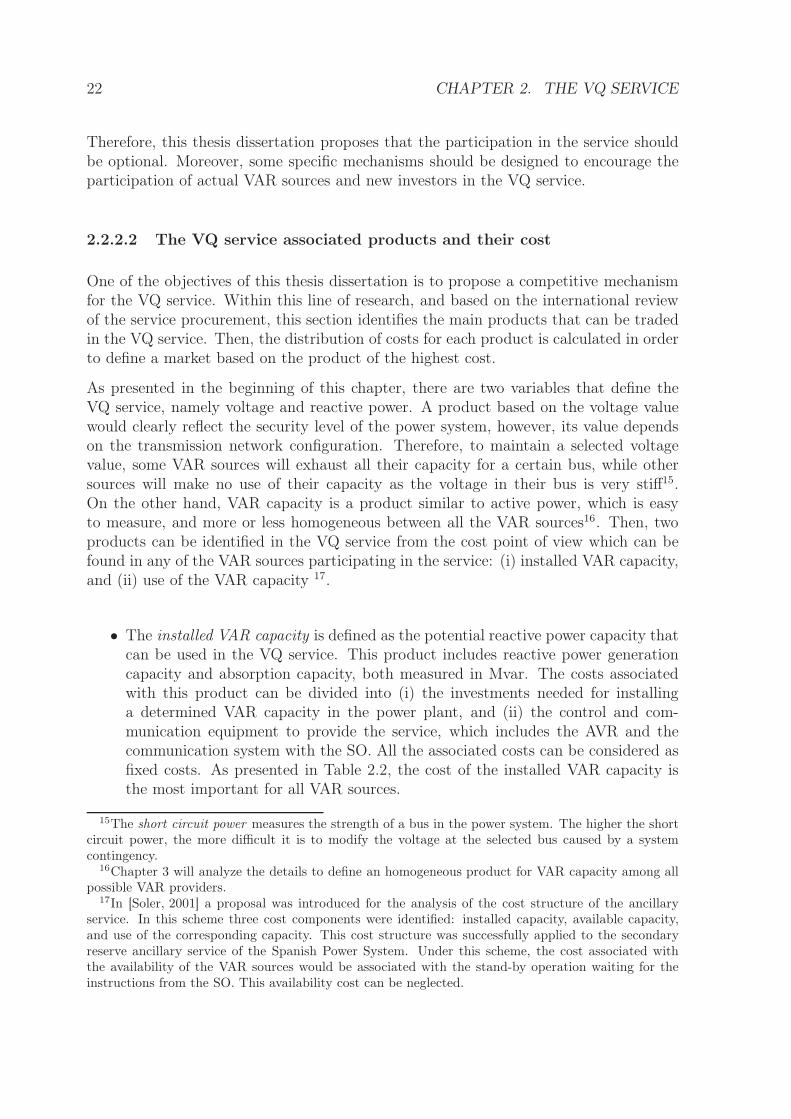
22 CHAPTER 2. THE VQ SERVICE
Therefore, this thesis dissertation proposes that the participation in the service shouldbe optional. Moreover, some specific mechanisms should be designed to encourage theparticipation of actual VAR sources and new investors in the VQ service.
2.2.2.2 The VQ service associated products and their cost
One of the objectives of this thesis dissertation is to propose a competitive mechanismfor the VQ service. Within this line of research, and based on the international reviewof the service procurement, this section identifies the main products that can be tradedin the VQ service. Then, the distribution of costs for each product is calculated in orderto define a market based on the product of the highest cost.
As presented in the beginning of this chapter, there are two variables that define theVQ service, namely voltage and reactive power. A product based on the voltage valuewould clearly reflect the security level of the power system, however, its value dependson the transmission network configuration. Therefore, to maintain a selected voltagevalue, some VAR sources will exhaust all their capacity for a certain bus, while othersources will make no use of their capacity as the voltage in their bus is very stiff15.On the other hand, VAR capacity is a product similar to active power, which is easyto measure, and more or less homogeneous between all the VAR sources16. Then, twoproducts can be identified in the VQ service from the cost point of view which can befound in any of the VAR sources participating in the service: (i) installed VAR capacity,and (ii) use of the VAR capacity 17.
• The installed VAR capacity is defined as the potential reactive power capacity thatcan be used in the VQ service. This product includes reactive power generationcapacity and absorption capacity, both measured in Mvar. The costs associatedwith this product can be divided into (i) the investments needed for installinga determined VAR capacity in the power plant, and (ii) the control and com-munication equipment to provide the service, which includes the AVR and thecommunication system with the SO. All the associated costs can be considered asfixed costs. As presented in Table 2.2, the cost of the installed VAR capacity isthe most important for all VAR sources.
15The short circuit power measures the strength of a bus in the power system. The higher the shortcircuit power, the more difficult it is to modify the voltage at the selected bus caused by a systemcontingency.
16Chapter 3 will analyze the details to define an homogeneous product for VAR capacity among allpossible VAR providers.
17In [Soler, 2001] a proposal was introduced for the analysis of the cost structure of the ancillaryservice. In this scheme three cost components were identified: installed capacity, available capacity,and use of the corresponding capacity. This cost structure was successfully applied to the secondaryreserve ancillary service of the Spanish Power System. Under this scheme, the cost associated withthe availability of the VAR sources would be associated with the stand-by operation waiting for theinstructions from the SO. This availability cost can be neglected.
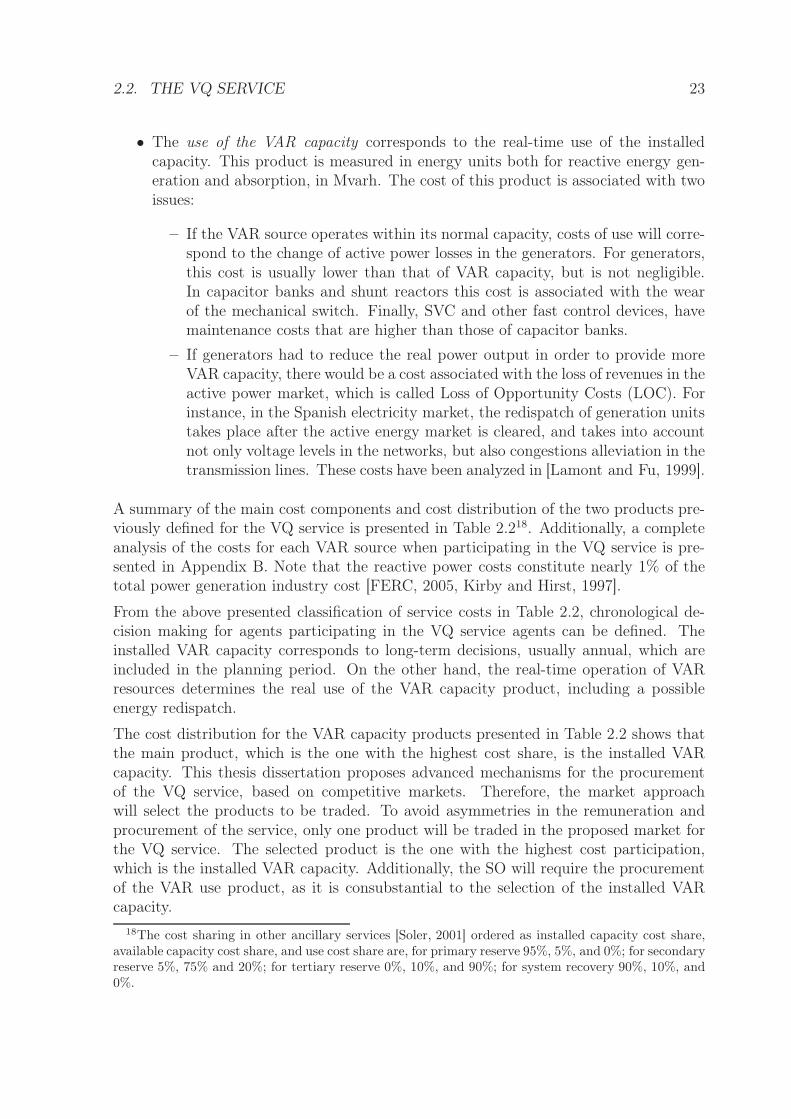
2.2. THE VQ SERVICE 23
• The use of the VAR capacity corresponds to the real-time use of the installedcapacity. This product is measured in energy units both for reactive energy gen-eration and absorption, in Mvarh. The cost of this product is associated with twoissues:
– If the VAR source operates within its normal capacity, costs of use will corre-spond to the change of active power losses in the generators. For generators,this cost is usually lower than that of VAR capacity, but is not negligible.In capacitor banks and shunt reactors this cost is associated with the wearof the mechanical switch. Finally, SVC and other fast control devices, havemaintenance costs that are higher than those of capacitor banks.
– If generators had to reduce the real power output in order to provide moreVAR capacity, there would be a cost associated with the loss of revenues in theactive power market, which is called Loss of Opportunity Costs (LOC). Forinstance, in the Spanish electricity market, the redispatch of generation unitstakes place after the active energy market is cleared, and takes into accountnot only voltage levels in the networks, but also congestions alleviation in thetransmission lines. These costs have been analyzed in [Lamont and Fu, 1999].
A summary of the main cost components and cost distribution of the two products pre-viously defined for the VQ service is presented in Table 2.218. Additionally, a completeanalysis of the costs for each VAR source when participating in the VQ service is pre-sented in Appendix B. Note that the reactive power costs constitute nearly 1% of thetotal power generation industry cost [FERC, 2005, Kirby and Hirst, 1997].
From the above presented classification of service costs in Table 2.2, chronological de-cision making for agents participating in the VQ service agents can be defined. Theinstalled VAR capacity corresponds to long-term decisions, usually annual, which areincluded in the planning period. On the other hand, the real-time operation of VARresources determines the real use of the VAR capacity product, including a possibleenergy redispatch.
The cost distribution for the VAR capacity products presented in Table 2.2 shows thatthe main product, which is the one with the highest cost share, is the installed VARcapacity. This thesis dissertation proposes advanced mechanisms for the procurementof the VQ service, based on competitive markets. Therefore, the market approachwill select the products to be traded. To avoid asymmetries in the remuneration andprocurement of the service, only one product will be traded in the proposed market forthe VQ service. The selected product is the one with the highest cost participation,which is the installed VAR capacity. Additionally, the SO will require the procurementof the VAR use product, as it is consubstantial to the selection of the installed VARcapacity.
18The cost sharing in other ancillary services [Soler, 2001] ordered as installed capacity cost share,available capacity cost share, and use cost share are, for primary reserve 95%, 5%, and 0%; for secondaryreserve 5%, 75% and 20%; for tertiary reserve 0%, 10%, and 90%; for system recovery 90%, 10%, and0%.
24 CHAPTER 2. THE VQ SERVICE
Table 2.2: Costs distribution of the VAR capacity products of the VAR compensation devices
VAR costs Costs distribution
Equipment Installed
capacity
VAR
use,
normal
VAR
use,
LOC
Installed
capacity
VAR
use,
normal
VAR
use,
LOC
Conventional
generator
Difficult to
separate
High Yes 65% 30% 0-5%
Synchronous
condenser
$30-35/kvar High No 70% 30% -
Distributed
generation
Difficult to
separate
High Yes 65% 30% 0-5%
Capacitor
banks
$10-20/kvar Very low No 95% 5% -
Shunt reac-
tor
$20-30/kvar Very low No 95% 5% -
SVC $30-60/kvar Moderate No 90% 10% -
STATCOM $55-70/kvar Moderate No 90% 10% -
(LOC: loss of opportunity costs. Source: [Kirby and Hirst, 1997] and personal research)
2.2.3 Allocation of the VQ service
In this thesis dissertation, the allocation of the VQ service is defined as the strategy forusing the available VAR resources in order to achieve the goal of procuring correctlythe VQ service. The allocation strategy consists of the following three steps: (i) charac-terization of the volume of demand of the VQ service, (ii) selection of the VAR sourcesthat can participate in the VQ service, (iii) definition of a mechanism to distribute theVAR demand between the VAR sources.
2.2.3.1 Volume of demand of VQ service
The volume of demand in the VQ service is defined by two topics, the VAR demand inthe power system, and the security requirements that the SO defines in the operatingprocedures.
• VAR demand in the power system is constituted by the active and reactive powerenergy demanded by loads, and by the own VAR consumption of the transmissionnetwork. Moreover, contingencies in the power system constitute an additionaldemand of the VQ service, as they require a certain amount of VAR reserve toguarantee the system security.
• On the other hand, the SO, based on engineering experience, defined the operat-ing procedures where the minimum and maximum voltages in the power system
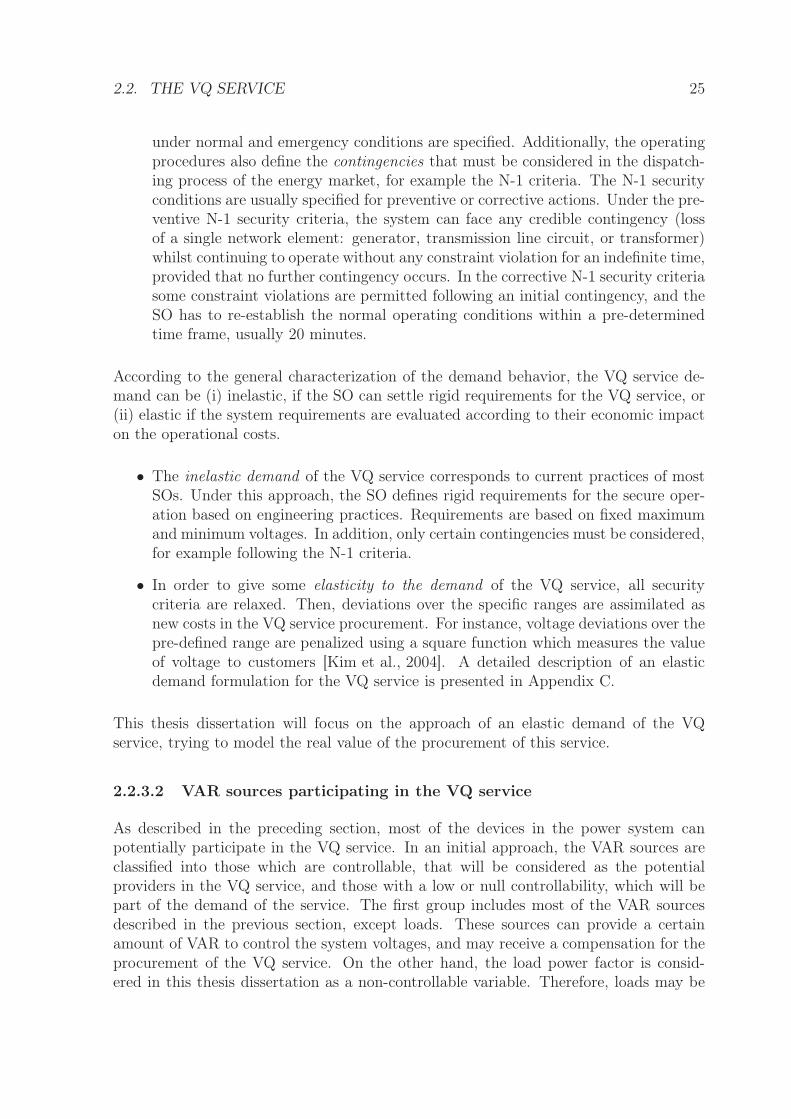
2.2. THE VQ SERVICE 25
under normal and emergency conditions are specified. Additionally, the operatingprocedures also define the contingencies that must be considered in the dispatch-ing process of the energy market, for example the N-1 criteria. The N-1 securityconditions are usually specified for preventive or corrective actions. Under the pre-ventive N-1 security criteria, the system can face any credible contingency (lossof a single network element: generator, transmission line circuit, or transformer)whilst continuing to operate without any constraint violation for an indefinite time,provided that no further contingency occurs. In the corrective N-1 security criteriasome constraint violations are permitted following an initial contingency, and theSO has to re-establish the normal operating conditions within a pre-determinedtime frame, usually 20 minutes.
According to the general characterization of the demand behavior, the VQ service de-mand can be (i) inelastic, if the SO can settle rigid requirements for the VQ service, or(ii) elastic if the system requirements are evaluated according to their economic impacton the operational costs.
• The inelastic demand of the VQ service corresponds to current practices of mostSOs. Under this approach, the SO defines rigid requirements for the secure oper-ation based on engineering practices. Requirements are based on fixed maximumand minimum voltages. In addition, only certain contingencies must be considered,for example following the N-1 criteria.
• In order to give some elasticity to the demand of the VQ service, all securitycriteria are relaxed. Then, deviations over the specific ranges are assimilated asnew costs in the VQ service procurement. For instance, voltage deviations over thepre-defined range are penalized using a square function which measures the valueof voltage to customers [Kim et al., 2004]. A detailed description of an elasticdemand formulation for the VQ service is presented in Appendix C.
This thesis dissertation will focus on the approach of an elastic demand of the VQservice, trying to model the real value of the procurement of this service.
2.2.3.2 VAR sources participating in the VQ service
As described in the preceding section, most of the devices in the power system canpotentially participate in the VQ service. In an initial approach, the VAR sources areclassified into those which are controllable, that will be considered as the potentialproviders in the VQ service, and those with a low or null controllability, which will bepart of the demand of the service. The first group includes most of the VAR sourcesdescribed in the previous section, except loads. These sources can provide a certainamount of VAR to control the system voltages, and may receive a compensation for theprocurement of the VQ service. On the other hand, the load power factor is consid-ered in this thesis dissertation as a non-controllable variable. Therefore, loads may be
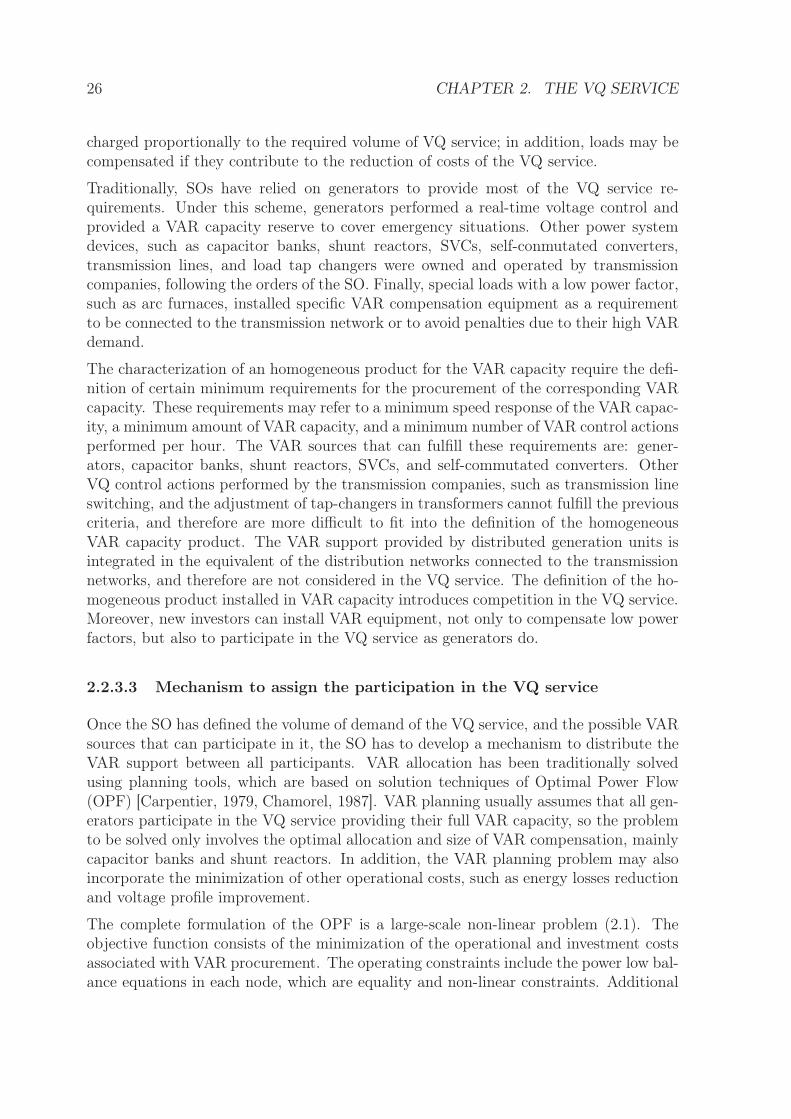
26 CHAPTER 2. THE VQ SERVICE
charged proportionally to the required volume of VQ service; in addition, loads may becompensated if they contribute to the reduction of costs of the VQ service.
Traditionally, SOs have relied on generators to provide most of the VQ service re-quirements. Under this scheme, generators performed a real-time voltage control andprovided a VAR capacity reserve to cover emergency situations. Other power systemdevices, such as capacitor banks, shunt reactors, SVCs, self-conmutated converters,transmission lines, and load tap changers were owned and operated by transmissioncompanies, following the orders of the SO. Finally, special loads with a low power factor,such as arc furnaces, installed specific VAR compensation equipment as a requirementto be connected to the transmission network or to avoid penalties due to their high VARdemand.
The characterization of an homogeneous product for the VAR capacity require the defi-nition of certain minimum requirements for the procurement of the corresponding VARcapacity. These requirements may refer to a minimum speed response of the VAR capac-ity, a minimum amount of VAR capacity, and a minimum number of VAR control actionsperformed per hour. The VAR sources that can fulfill these requirements are: gener-ators, capacitor banks, shunt reactors, SVCs, and self-commutated converters. OtherVQ control actions performed by the transmission companies, such as transmission lineswitching, and the adjustment of tap-changers in transformers cannot fulfill the previouscriteria, and therefore are more difficult to fit into the definition of the homogeneousVAR capacity product. The VAR support provided by distributed generation units isintegrated in the equivalent of the distribution networks connected to the transmissionnetworks, and therefore are not considered in the VQ service. The definition of the ho-mogeneous product installed in VAR capacity introduces competition in the VQ service.Moreover, new investors can install VAR equipment, not only to compensate low powerfactors, but also to participate in the VQ service as generators do.
2.2.3.3 Mechanism to assign the participation in the VQ service
Once the SO has defined the volume of demand of the VQ service, and the possible VARsources that can participate in it, the SO has to develop a mechanism to distribute theVAR support between all participants. VAR allocation has been traditionally solvedusing planning tools, which are based on solution techniques of Optimal Power Flow(OPF) [Carpentier, 1979, Chamorel, 1987]. VAR planning usually assumes that all gen-erators participate in the VQ service providing their full VAR capacity, so the problemto be solved only involves the optimal allocation and size of VAR compensation, mainlycapacitor banks and shunt reactors. In addition, the VAR planning problem may alsoincorporate the minimization of other operational costs, such as energy losses reductionand voltage profile improvement.
The complete formulation of the OPF is a large-scale non-linear problem (2.1). Theobjective function consists of the minimization of the operational and investment costsassociated with VAR procurement. The operating constraints include the power low bal-ance equations in each node, which are equality and non-linear constraints. Additional
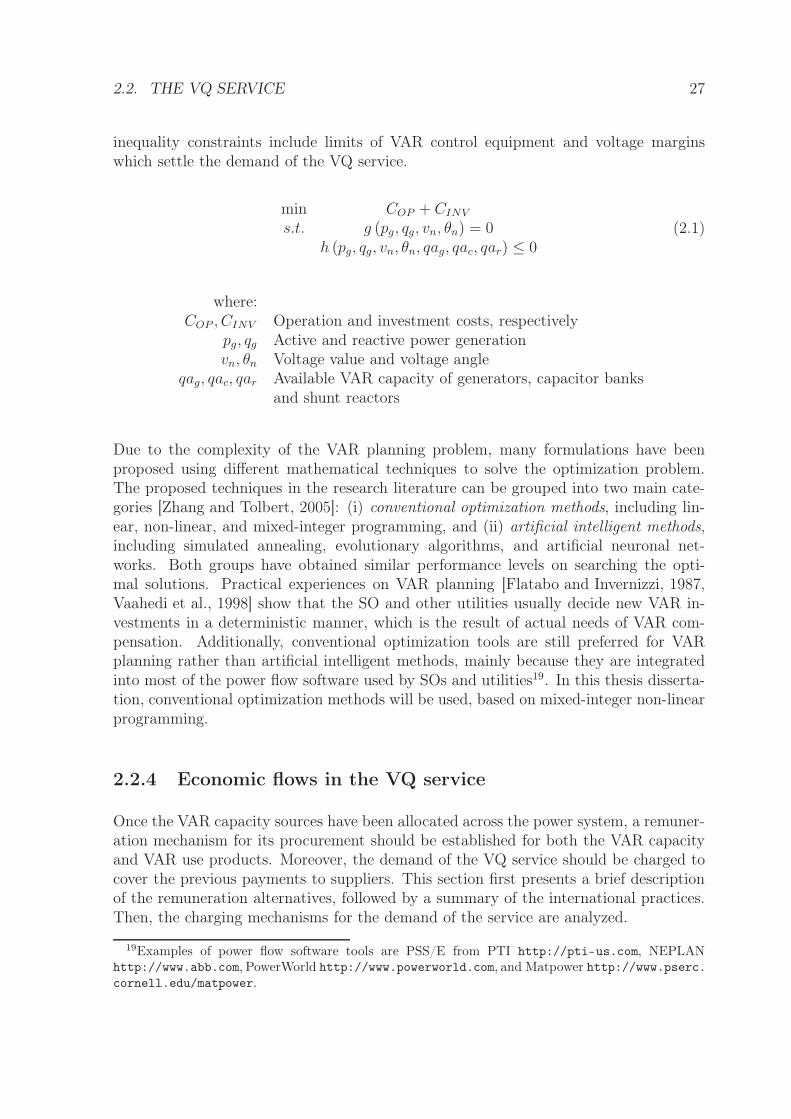
2.2. THE VQ SERVICE 27
inequality constraints include limits of VAR control equipment and voltage marginswhich settle the demand of the VQ service.
min COP + CINV
s.t. g (pg, qg, vn, θn) = 0h (pg, qg, vn, θn, qag, qac, qar) ≤ 0
(2.1)
where:COP , CINV Operation and investment costs, respectively
pg, qg Active and reactive power generationvn, θn Voltage value and voltage angle
qag, qac, qar Available VAR capacity of generators, capacitor banksand shunt reactors
Due to the complexity of the VAR planning problem, many formulations have beenproposed using different mathematical techniques to solve the optimization problem.The proposed techniques in the research literature can be grouped into two main cate-gories [Zhang and Tolbert, 2005]: (i) conventional optimization methods, including lin-ear, non-linear, and mixed-integer programming, and (ii) artificial intelligent methods,including simulated annealing, evolutionary algorithms, and artificial neuronal net-works. Both groups have obtained similar performance levels on searching the opti-mal solutions. Practical experiences on VAR planning [Flatabo and Invernizzi, 1987,Vaahedi et al., 1998] show that the SO and other utilities usually decide new VAR in-vestments in a deterministic manner, which is the result of actual needs of VAR com-pensation. Additionally, conventional optimization tools are still preferred for VARplanning rather than artificial intelligent methods, mainly because they are integratedinto most of the power flow software used by SOs and utilities19. In this thesis disserta-tion, conventional optimization methods will be used, based on mixed-integer non-linearprogramming.
2.2.4 Economic flows in the VQ service
Once the VAR capacity sources have been allocated across the power system, a remuner-ation mechanism for its procurement should be established for both the VAR capacityand VAR use products. Moreover, the demand of the VQ service should be charged tocover the previous payments to suppliers. This section first presents a brief descriptionof the remuneration alternatives, followed by a summary of the international practices.Then, the charging mechanisms for the demand of the service are analyzed.
19Examples of power flow software tools are PSS/E from PTI http://pti-us.com, NEPLANhttp://www.abb.com, PowerWorld http://www.powerworld.com, and Matpower http://www.pserc.cornell.edu/matpower.
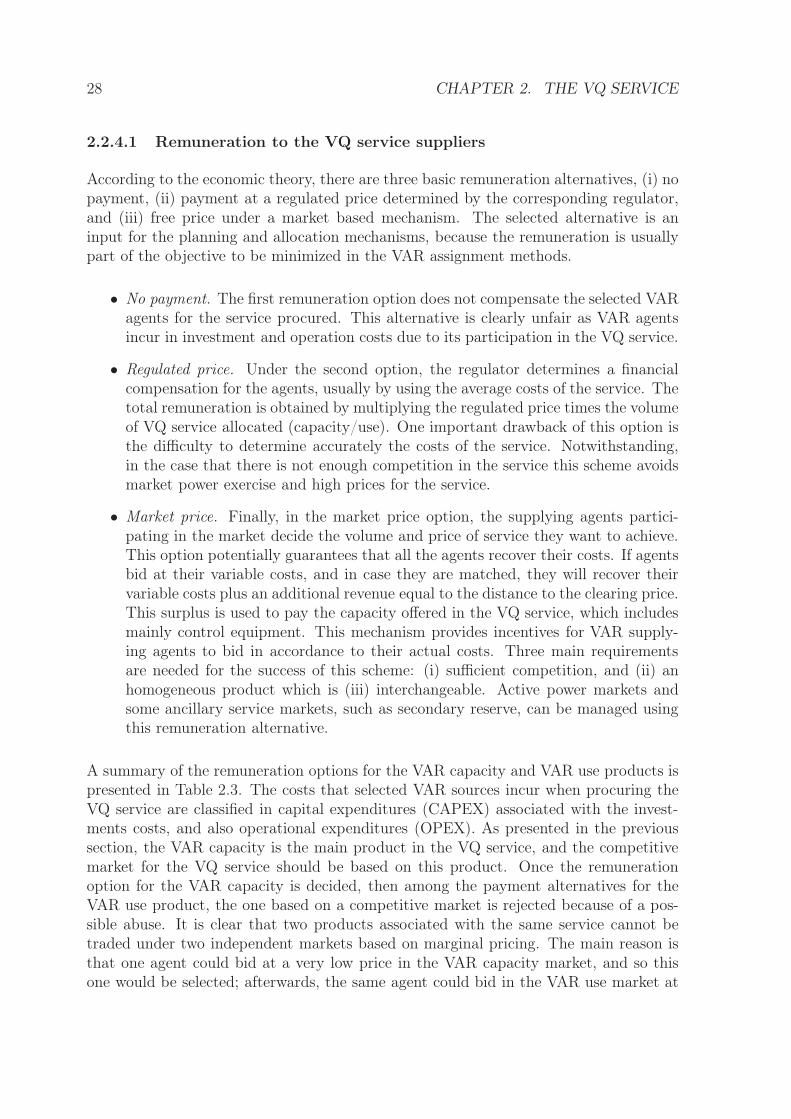
28 CHAPTER 2. THE VQ SERVICE
2.2.4.1 Remuneration to the VQ service suppliers
According to the economic theory, there are three basic remuneration alternatives, (i) nopayment, (ii) payment at a regulated price determined by the corresponding regulator,and (iii) free price under a market based mechanism. The selected alternative is aninput for the planning and allocation mechanisms, because the remuneration is usuallypart of the objective to be minimized in the VAR assignment methods.
• No payment. The first remuneration option does not compensate the selected VARagents for the service procured. This alternative is clearly unfair as VAR agentsincur in investment and operation costs due to its participation in the VQ service.
• Regulated price. Under the second option, the regulator determines a financialcompensation for the agents, usually by using the average costs of the service. Thetotal remuneration is obtained by multiplying the regulated price times the volumeof VQ service allocated (capacity/use). One important drawback of this option isthe difficulty to determine accurately the costs of the service. Notwithstanding,in the case that there is not enough competition in the service this scheme avoidsmarket power exercise and high prices for the service.
• Market price. Finally, in the market price option, the supplying agents partici-pating in the market decide the volume and price of service they want to achieve.This option potentially guarantees that all the agents recover their costs. If agentsbid at their variable costs, and in case they are matched, they will recover theirvariable costs plus an additional revenue equal to the distance to the clearing price.This surplus is used to pay the capacity offered in the VQ service, which includesmainly control equipment. This mechanism provides incentives for VAR supply-ing agents to bid in accordance to their actual costs. Three main requirementsare needed for the success of this scheme: (i) sufficient competition, and (ii) anhomogeneous product which is (iii) interchangeable. Active power markets andsome ancillary service markets, such as secondary reserve, can be managed usingthis remuneration alternative.
A summary of the remuneration options for the VAR capacity and VAR use products ispresented in Table 2.3. The costs that selected VAR sources incur when procuring theVQ service are classified in capital expenditures (CAPEX) associated with the invest-ments costs, and also operational expenditures (OPEX). As presented in the previoussection, the VAR capacity is the main product in the VQ service, and the competitivemarket for the VQ service should be based on this product. Once the remunerationoption for the VAR capacity is decided, then among the payment alternatives for theVAR use product, the one based on a competitive market is rejected because of a pos-sible abuse. It is clear that two products associated with the same service cannot betraded under two independent markets based on marginal pricing. The main reason isthat one agent could bid at a very low price in the VAR capacity market, and so thisone would be selected; afterwards, the same agent could bid in the VAR use market at
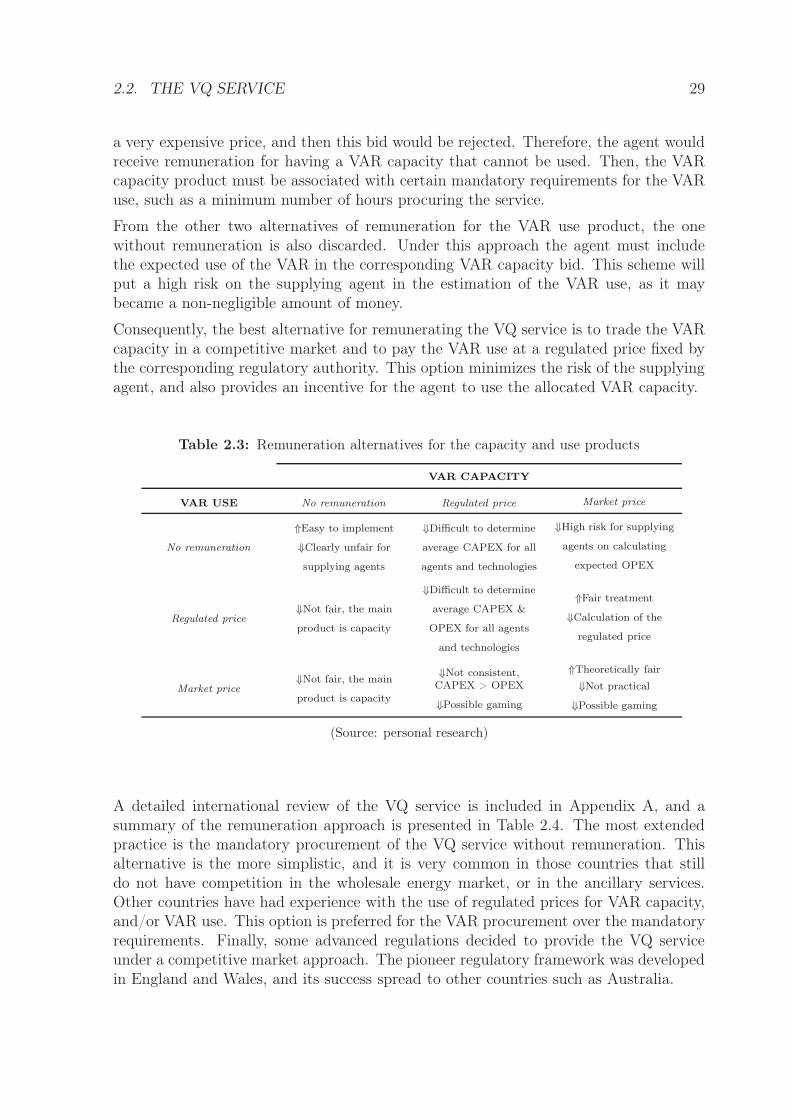
2.2. THE VQ SERVICE 29
a very expensive price, and then this bid would be rejected. Therefore, the agent wouldreceive remuneration for having a VAR capacity that cannot be used. Then, the VARcapacity product must be associated with certain mandatory requirements for the VARuse, such as a minimum number of hours procuring the service.
From the other two alternatives of remuneration for the VAR use product, the onewithout remuneration is also discarded. Under this approach the agent must includethe expected use of the VAR in the corresponding VAR capacity bid. This scheme willput a high risk on the supplying agent in the estimation of the VAR use, as it maybecame a non-negligible amount of money.
Consequently, the best alternative for remunerating the VQ service is to trade the VARcapacity in a competitive market and to pay the VAR use at a regulated price fixed bythe corresponding regulatory authority. This option minimizes the risk of the supplyingagent, and also provides an incentive for the agent to use the allocated VAR capacity.
Table 2.3: Remuneration alternatives for the capacity and use products
VAR CAPACITY
VAR USE No remuneration Regulated price Market price
No remuneration
⇑Easy to implement
⇓Clearly unfair for
supplying agents
⇓Difficult to determine
average CAPEX for all
agents and technologies
⇓High risk for supplying
agents on calculating
expected OPEX
Regulated price⇓Not fair, the main
product is capacity
⇓Difficult to determine
average CAPEX &
OPEX for all agents
and technologies
⇑Fair treatment
⇓Calculation of the
regulated price
Market price⇓Not fair, the main
product is capacity
⇓Not consistent,CAPEX > OPEX
⇓Possible gaming
⇑Theoretically fair
⇓Not practical
⇓Possible gaming
(Source: personal research)
A detailed international review of the VQ service is included in Appendix A, and asummary of the remuneration approach is presented in Table 2.4. The most extendedpractice is the mandatory procurement of the VQ service without remuneration. Thisalternative is the more simplistic, and it is very common in those countries that stilldo not have competition in the wholesale energy market, or in the ancillary services.Other countries have had experience with the use of regulated prices for VAR capacity,and/or VAR use. This option is preferred for the VAR procurement over the mandatoryrequirements. Finally, some advanced regulations decided to provide the VQ serviceunder a competitive market approach. The pioneer regulatory framework was developedin England and Wales, and its success spread to other countries such as Australia.
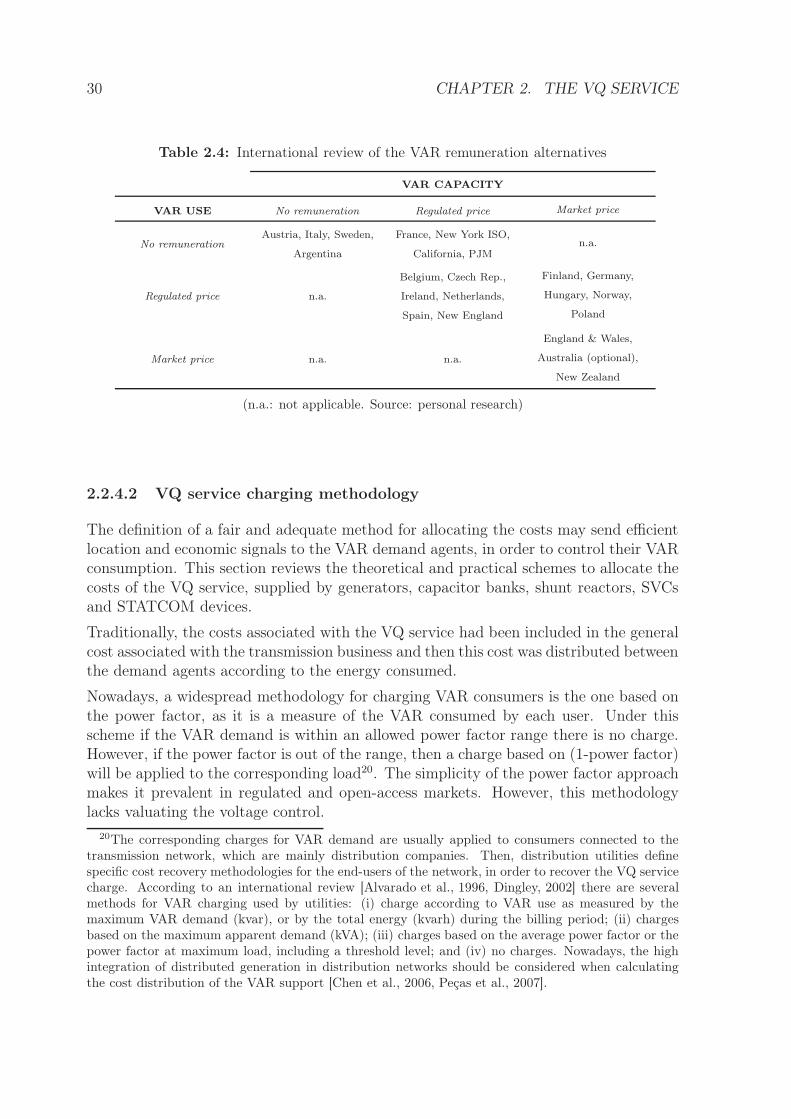
30 CHAPTER 2. THE VQ SERVICE
Table 2.4: International review of the VAR remuneration alternatives
VAR CAPACITY
VAR USE No remuneration Regulated price Market price
No remunerationAustria, Italy, Sweden,
Argentina
France, New York ISO,
California, PJMn.a.
Regulated price n.a.
Belgium, Czech Rep.,
Ireland, Netherlands,
Spain, New England
Finland, Germany,
Hungary, Norway,
Poland
Market price n.a. n.a.
England & Wales,
Australia (optional),
New Zealand
(n.a.: not applicable. Source: personal research)
2.2.4.2 VQ service charging methodology
The definition of a fair and adequate method for allocating the costs may send efficientlocation and economic signals to the VAR demand agents, in order to control their VARconsumption. This section reviews the theoretical and practical schemes to allocate thecosts of the VQ service, supplied by generators, capacitor banks, shunt reactors, SVCsand STATCOM devices.
Traditionally, the costs associated with the VQ service had been included in the generalcost associated with the transmission business and then this cost was distributed betweenthe demand agents according to the energy consumed.
Nowadays, a widespread methodology for charging VAR consumers is the one based onthe power factor, as it is a measure of the VAR consumed by each user. Under thisscheme if the VAR demand is within an allowed power factor range there is no charge.However, if the power factor is out of the range, then a charge based on (1-power factor)will be applied to the corresponding load20. The simplicity of the power factor approachmakes it prevalent in regulated and open-access markets. However, this methodologylacks valuating the voltage control.
20The corresponding charges for VAR demand are usually applied to consumers connected to thetransmission network, which are mainly distribution companies. Then, distribution utilities definespecific cost recovery methodologies for the end-users of the network, in order to recover the VQ servicecharge. According to an international review [Alvarado et al., 1996, Dingley, 2002] there are severalmethods for VAR charging used by utilities: (i) charge according to VAR use as measured by themaximum VAR demand (kvar), or by the total energy (kvarh) during the billing period; (ii) chargesbased on the maximum apparent demand (kVA); (iii) charges based on the average power factor or thepower factor at maximum load, including a threshold level; and (iv) no charges. Nowadays, the highintegration of distributed generation in distribution networks should be considered when calculatingthe cost distribution of the VAR support [Chen et al., 2006, Peças et al., 2007].
2.3. ECONOMIC THEORY ON VAR PRICING 31
In addition to the current experiences just reviewed, research literature has proposedother more sophisticated alternatives for allocating the costs of the VQ service. The firstapproach was derived from the marginal nodal VAR prices, as proposed in [El-Keib and Ma, 1997],but the formulation did not consider the investment and operational costs associatedwith the procurement of the VQ service. A new approach suggests that the customercould freely acquire the needed VAR capacity using the nodal prices within a local VARmarket, using certain VAR adjustment factors [Hao and Papalexopoulos, 1997].
Another interesting approach is the methodology for VAR cost allocation based ontracing the power flows through the network. This method can deduce the real or reac-tive power from individual generators received by each load [Bialek, 1996, Bialek, 1998,Kirschen et al., 1997]. New developments on the graph theory [Wu et al., 2000] and theYbus methodology [Chu et al., 2004] have improved the efficiency and fairness of thismethodology.
Finally, nowadays new allocation mechanisms based on Cooperative Game Theory areintroducing promising results for the distribution of the VAR costs among the demandagents [Lin et al., 2006]. This alternative will be explored in this thesis dissertation todefine a cost distribution mechanism for the proposed competitive VAR capacity market.
2.3 Economic theory on VAR pricing
Once it is decided that agents participating in the VQ service should receive a compen-sation, the next question to be answered is how to compute these payments. In researchliterature, many approaches have been proposed. The aim of this thesis dissertation isto propose advanced criteria for the definition of efficient location and economic signalsbased on the economic theory. This section will first present the traditional schemebased on real time VAR marginal pricing and other research proposals for valuating theVAR capacity. Then, issues regarding the possible market power associated with theVQ service are discussed.
2.3.1 Real time VAR marginal pricing
The basic theory of spot pricing in power systems was first applied to active powermarkets [Schweppe and Caramanis, 1988]. According to this theory, independent gen-erators would adjust their generation output using the spot prices, and this price wouldbe the payment they would receive due to their power production. The marginal coststheory is based on the assumption that marginal costs can recover all costs involved toproduce, transport, and deliver the active power.
The application of the marginal theory to reactive power was first presented in[Baughman and Siddiqi, 1991], where it was justified that VAR prices could not beneglected because they became relatively high under contingencies. This idea was con-firmed by [Hogan, 1993], who argued that DC load models were not sufficient to de-termine active power prices under contingencies, requiring the complete formulation
32 CHAPTER 2. THE VQ SERVICE
based on AC power flow models. Hogan stated that electricity markets need reactivepower prices. In subsequent approaches, real-time prices of real and reactive power areobtained by modifying the OPF formulation [Li and David, 1993, Li and David, 1994,Baughman and Siddiqi, 1991]. This formulation was also used to compute the wheelingrates21 to compensate the use of the transmission network.
The spot pricing formulation will be applied to design real time computation of thereactive power marginal pricing [Baughman et al., 1997a, Baughman et al., 1997b]. Adecoupled modified OPF is used by [El-Keib and Ma, 1997] where the objective functionof the sub-problem is to minimize the active power losses, obtaining reactive powerprices. In these two approaches, the VAR production cost is not obtained, as noted in[Hao and Papalexopoulos, 1997] which details some alternatives for the computation ofreactive power production costs.
The research was then focused on the role of the SO in planning the VAR needs. A firstapproach used an OPF to determine the optimal size and location of capacitor banks,minimizing the operation costs [Chattopadhyay et al., 1995]. Other proposals analyzedthe role of the SO in the competitive market for VAR support [Dandachi, 1997]. Un-der these approaches, the operating costs included in the objective function were ana-lyzed [Lamont and Fu, 1999], such as minimizing the movement of transmission devices,maximizing the social welfare [Choi et al., 1998], or including the maximization of theshipment of active power [Pirayesh et al., 2004a, Pirayesh et al., 2004b].
In conclusion, real-time VAR pricing is characterized by a high degree of volatility,with a value close to zero during normal operation, and high values under contingencysituations. To eliminate this unstable signal for VAR support, long-term payments areneeded [Barquín et al., 2000].
2.3.2 Valuating VAR capacity
The limitations of the real-time VAR pricing focused the new research on the analysisand valuation of the VAR capacity and the long-term contracts. In addition, the intro-duction of competition in electricity markets promoted the search for new proposal forcompetitive VAR markets.
An interesting valuation proposal for VAR support is based on the Equivalent ReactiveCompensation method [Xu et al., 2000]. This approach values each VAR source for itsactual contribution to the system security. This idea comes from the fact that if aVAR source changes its output, the network voltage profiles, and stability margins willchange. Then, to measure the value of a VAR source, the calculation of all the newVAR compensation needed to maintain the same voltage profile and security marginsis proposed. Therefore, the more VAR compensation needed, the more important thesource is to the system. These new VAR sources are fictitious capacitor banks distributedacross the system and are referred to as Equivalent Reactive Compensation.
21Wheeling is defined as the transmission of active and reactive power from a generator to a customer,using the transmission network that belongs to a third party.
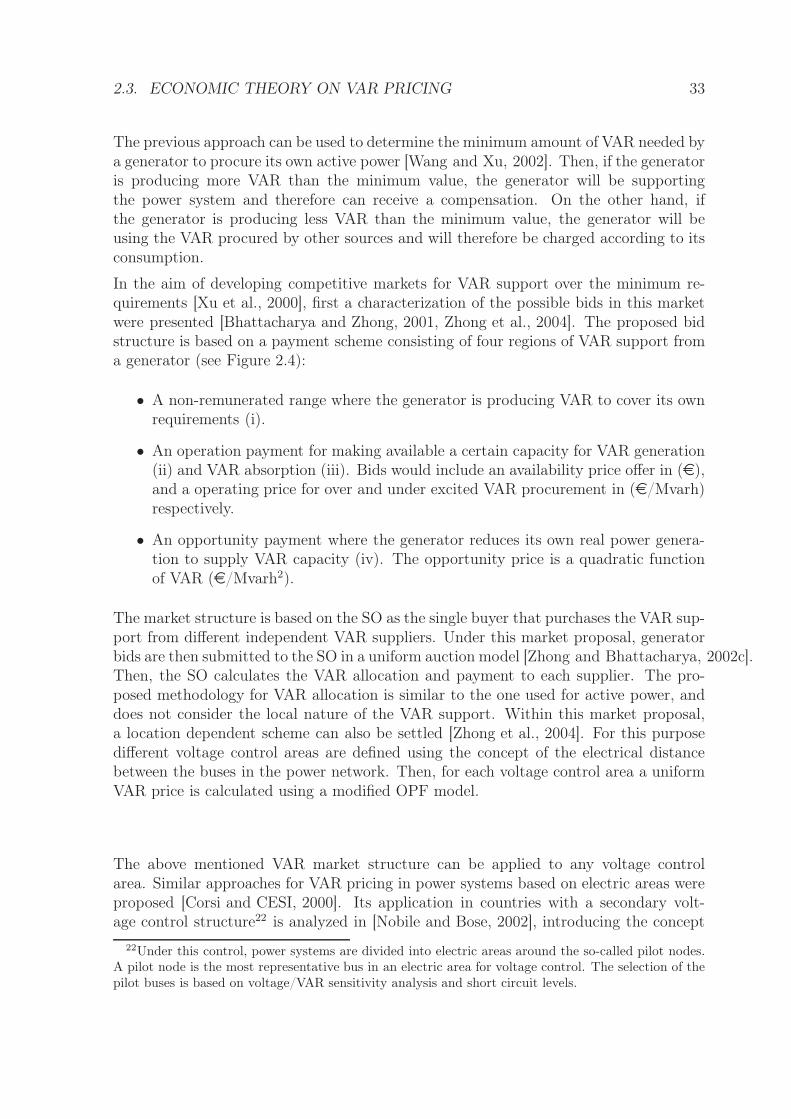
2.3. ECONOMIC THEORY ON VAR PRICING 33
The previous approach can be used to determine the minimum amount of VAR needed bya generator to procure its own active power [Wang and Xu, 2002]. Then, if the generatoris producing more VAR than the minimum value, the generator will be supportingthe power system and therefore can receive a compensation. On the other hand, ifthe generator is producing less VAR than the minimum value, the generator will beusing the VAR procured by other sources and will therefore be charged according to itsconsumption.
In the aim of developing competitive markets for VAR support over the minimum re-quirements [Xu et al., 2000], first a characterization of the possible bids in this marketwere presented [Bhattacharya and Zhong, 2001, Zhong et al., 2004]. The proposed bidstructure is based on a payment scheme consisting of four regions of VAR support froma generator (see Figure 2.4):
• A non-remunerated range where the generator is producing VAR to cover its ownrequirements (i).
• An operation payment for making available a certain capacity for VAR generation(ii) and VAR absorption (iii). Bids would include an availability price offer in (e),and a operating price for over and under excited VAR procurement in (e/Mvarh)respectively.
• An opportunity payment where the generator reduces its own real power genera-tion to supply VAR capacity (iv). The opportunity price is a quadratic functionof VAR (e/Mvarh2).
The market structure is based on the SO as the single buyer that purchases the VAR sup-port from different independent VAR suppliers. Under this market proposal, generatorbids are then submitted to the SO in a uniform auction model [Zhong and Bhattacharya, 2002c].Then, the SO calculates the VAR allocation and payment to each supplier. The pro-posed methodology for VAR allocation is similar to the one used for active power, anddoes not consider the local nature of the VAR support. Within this market proposal,a location dependent scheme can also be settled [Zhong et al., 2004]. For this purposedifferent voltage control areas are defined using the concept of the electrical distancebetween the buses in the power network. Then, for each voltage control area a uniformVAR price is calculated using a modified OPF model.
The above mentioned VAR market structure can be applied to any voltage controlarea. Similar approaches for VAR pricing in power systems based on electric areas wereproposed [Corsi and CESI, 2000]. Its application in countries with a secondary volt-age control structure22 is analyzed in [Nobile and Bose, 2002], introducing the concept
22Under this control, power systems are divided into electric areas around the so-called pilot nodes.A pilot node is the most representative bus in an electric area for voltage control. The selection of thepilot buses is based on voltage/VAR sensitivity analysis and short circuit levels.
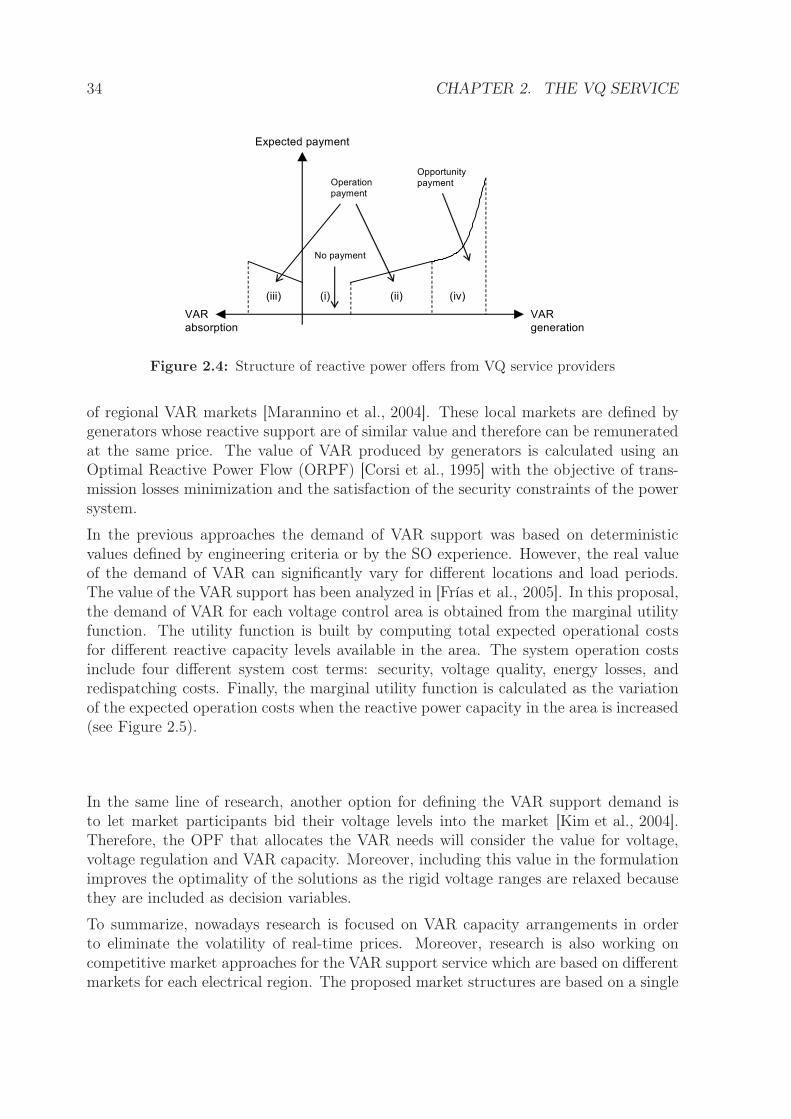
34 CHAPTER 2. THE VQ SERVICE
VAR
generation
Expected payment
(i) (ii)(iii) (iv)
VAR
absorption
No payment
Operation
payment
Opportunity
payment
Figure 2.4: Structure of reactive power offers from VQ service providers
of regional VAR markets [Marannino et al., 2004]. These local markets are defined bygenerators whose reactive support are of similar value and therefore can be remuneratedat the same price. The value of VAR produced by generators is calculated using anOptimal Reactive Power Flow (ORPF) [Corsi et al., 1995] with the objective of trans-mission losses minimization and the satisfaction of the security constraints of the powersystem.
In the previous approaches the demand of VAR support was based on deterministicvalues defined by engineering criteria or by the SO experience. However, the real valueof the demand of VAR can significantly vary for different locations and load periods.The value of the VAR support has been analyzed in [Frías et al., 2005]. In this proposal,the demand of VAR for each voltage control area is obtained from the marginal utilityfunction. The utility function is built by computing total expected operational costsfor different reactive capacity levels available in the area. The system operation costsinclude four different system cost terms: security, voltage quality, energy losses, andredispatching costs. Finally, the marginal utility function is calculated as the variationof the expected operation costs when the reactive power capacity in the area is increased(see Figure 2.5).
In the same line of research, another option for defining the VAR support demand isto let market participants bid their voltage levels into the market [Kim et al., 2004].Therefore, the OPF that allocates the VAR needs will consider the value for voltage,voltage regulation and VAR capacity. Moreover, including this value in the formulationimproves the optimality of the solutions as the rigid voltage ranges are relaxed becausethey are included as decision variables.
To summarize, nowadays research is focused on VAR capacity arrangements in orderto eliminate the volatility of real-time prices. Moreover, research is also working oncompetitive market approaches for the VAR support service which are based on differentmarkets for each electrical region. The proposed market structures are based on a single
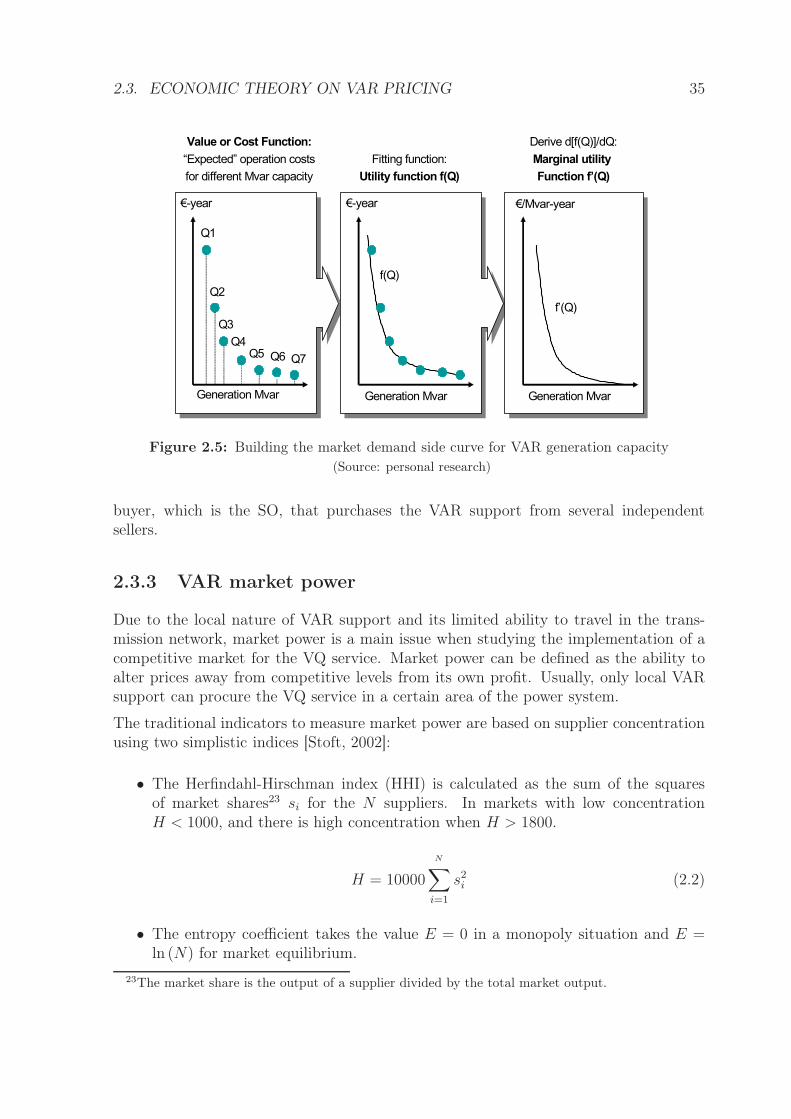
2.3. ECONOMIC THEORY ON VAR PRICING 35
Generation Mvar
€-year
Value or Cost Function:
“Expected” operation costs
for different Mvar capacity
Q1
Q4
Q6 Q7
Q2
Q3
Q5
€/Mvar-year€-year
Fitting function:
Utility function f(Q)
Derive d[f(Q)]/dQ:
Marginal utility
Function f’(Q)
f(Q)
f’(Q)
Generation Mvar Generation Mvar
Figure 2.5: Building the market demand side curve for VAR generation capacity
(Source: personal research)
buyer, which is the SO, that purchases the VAR support from several independentsellers.
2.3.3 VAR market power
Due to the local nature of VAR support and its limited ability to travel in the trans-mission network, market power is a main issue when studying the implementation of acompetitive market for the VQ service. Market power can be defined as the ability toalter prices away from competitive levels from its own profit. Usually, only local VARsupport can procure the VQ service in a certain area of the power system.
The traditional indicators to measure market power are based on supplier concentrationusing two simplistic indices [Stoft, 2002]:
• The Herfindahl-Hirschman index (HHI) is calculated as the sum of the squaresof market shares23 si for the N suppliers. In markets with low concentrationH < 1000, and there is high concentration when H > 1800.
H = 10000
N∑
i=1
s2i (2.2)
• The entropy coefficient takes the value E = 0 in a monopoly situation and E =ln (N) for market equilibrium.
23The market share is the output of a supplier divided by the total market output.
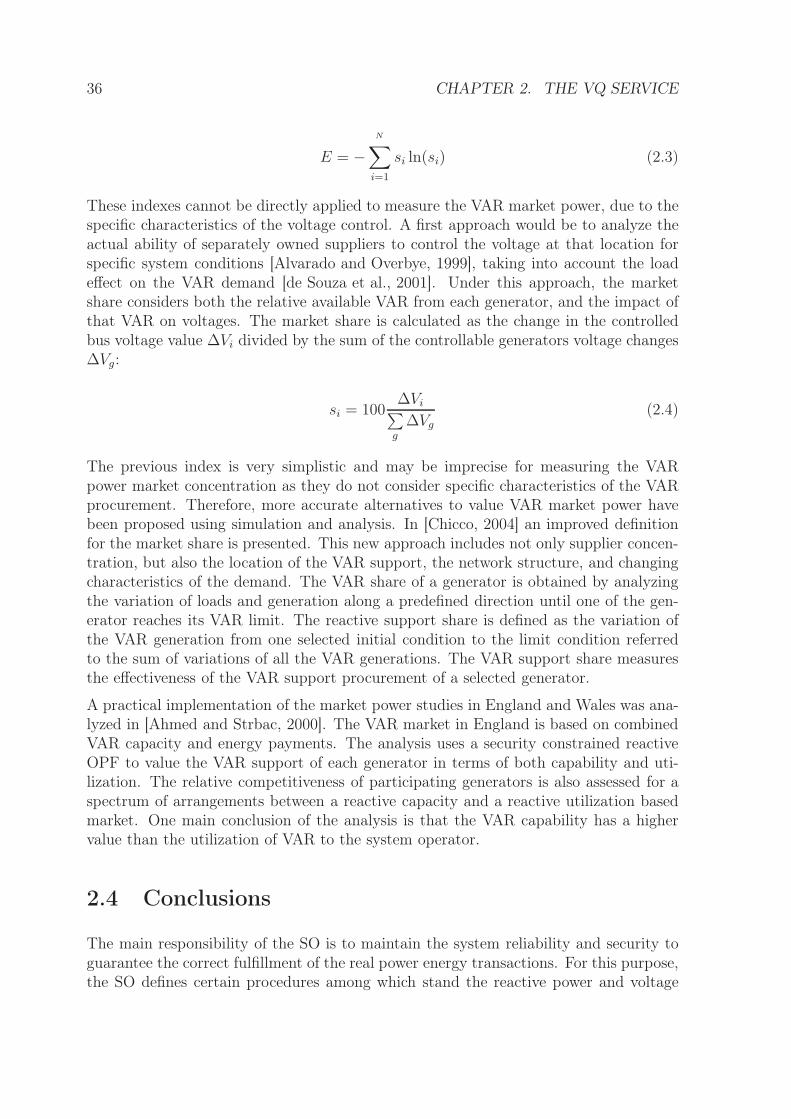
36 CHAPTER 2. THE VQ SERVICE
E = −N∑
i=1
si ln(si) (2.3)
These indexes cannot be directly applied to measure the VAR market power, due to thespecific characteristics of the voltage control. A first approach would be to analyze theactual ability of separately owned suppliers to control the voltage at that location forspecific system conditions [Alvarado and Overbye, 1999], taking into account the loadeffect on the VAR demand [de Souza et al., 2001]. Under this approach, the marketshare considers both the relative available VAR from each generator, and the impact ofthat VAR on voltages. The market share is calculated as the change in the controlledbus voltage value ∆Vi divided by the sum of the controllable generators voltage changes∆Vg:
si = 100∆Vi∑
g
∆Vg
(2.4)
The previous index is very simplistic and may be imprecise for measuring the VARpower market concentration as they do not consider specific characteristics of the VARprocurement. Therefore, more accurate alternatives to value VAR market power havebeen proposed using simulation and analysis. In [Chicco, 2004] an improved definitionfor the market share is presented. This new approach includes not only supplier concen-tration, but also the location of the VAR support, the network structure, and changingcharacteristics of the demand. The VAR share of a generator is obtained by analyzingthe variation of loads and generation along a predefined direction until one of the gen-erator reaches its VAR limit. The reactive support share is defined as the variation ofthe VAR generation from one selected initial condition to the limit condition referredto the sum of variations of all the VAR generations. The VAR support share measuresthe effectiveness of the VAR support procurement of a selected generator.
A practical implementation of the market power studies in England and Wales was ana-lyzed in [Ahmed and Strbac, 2000]. The VAR market in England is based on combinedVAR capacity and energy payments. The analysis uses a security constrained reactiveOPF to value the VAR support of each generator in terms of both capability and uti-lization. The relative competitiveness of participating generators is also assessed for aspectrum of arrangements between a reactive capacity and a reactive utilization basedmarket. One main conclusion of the analysis is that the VAR capability has a highervalue than the utilization of VAR to the system operator.
2.4 Conclusions
The main responsibility of the SO is to maintain the system reliability and security toguarantee the correct fulfillment of the real power energy transactions. For this purpose,the SO defines certain procedures among which stand the reactive power and voltage
2.4. CONCLUSIONS 37
control. In the VQ control the SO manages all the VAR resources in the network whichare property of private owners.
In deregulated power systems, the VQ control was redefined as the VQ control service,included in the Ancillary Services of the energy supply. The new definition of the VQservice requires that its characteristics are correctly defined: the procurement of theservice, the allocation of the different VAR sources, and the remuneration scheme.
The analysis of the cost structure of the possible VAR sources participating in the VQservice found two basic products: installed VAR capacity, and use of the VAR capacity.In addition, the use of VAR capacity may have high costs which are associated with theredispatch of generators to provide more VAR capacity. The demand in the VQ serviceis defined by the load from end-users and by the possible system contingencies.
To cover this demand, the SO can define different procurement alternatives, such asmandatory or optional participation in the VQ service. In most power systems, theprocurement of the VAR support has remained as a mandatory and non-remuneratedservice, mainly because of the simplicity of the approach. However, the introductionof competition in ancillary services in some countries changed the requirements frommandatory to optional. The analysis carried out in this chapter concluded that realunbundling between the SO and the network owners is needed in order to developcompetitive mechanism for the procurement of the VQ service. In addition, the bestregulation scheme for the VQ service should be based on a free market for VAR capacity,and regulated payments for the VAR use.
The economic theory on VAR pricing gives some important information for remuner-ating the VQ service, and sends efficient and location price signals. According to theanalysis, the VQ service allocation and remuneration should be based on long-term ar-rangements for the VAR capacity procurement, as the short-term VAR pricing has ahigh volatility due to the scenario with system contingencies. Moreover, due to the localcharacteristics of voltage support, different regional markets are preferred to a uniquemarket for the whole power system. Additionally, any proposal to regional competi-tive markets should analyze the possible VAR market power in order to provide thecorresponding mechanisms to minimize it.
38 BIBLIOGRAPHY
2.5 References
[Adams and McClure, 1948] Adams, C. G. and McClure, J. B. (1948). Underexcitedoperation of turbogenerators. A, IEE Transactions, 67:52.
[Adibi and Milanicz, 1994] Adibi, M. M. and Milanicz, D. P. (1994). Reactive capabilitylimitation of synchronous machines. IEEE Transactions on Power Systems, 9(1):29–40.
[Ahmed and Strbac, 2000] Ahmed, S. and Strbac, G. (2000). A method for simula-tion and analysis of reactive power market. IEEE Transactions on Power Systems,15(3):1047–1052. TY - JOUR.
[Alvarado et al., 1996] Alvarado, F., Broehm, R., Kirsch, L., and Panvini, A. (1996).Retail pricing of reactive power service. Proceedings of EPRI Conference, pages 28–30.
[Alvarado and Overbye, 1999] Alvarado, F. and Overbye, T. (1999). Measuring reactivemarket power. IEEE Power Engineering Society 1999 Winter Meeting, 1:294–296.
[Barquín et al., 2000] Barquín, J., San Román, T. G., Alba Ríos, J. J., andSánchez Martín, P. (2000). Reactive power pricing: a conceptual framework for remu-neration and charging procedures. IEEE Transactions on Power Systems, 15(2):483–489. TY - JOUR.
[Baughman and Siddiqi, 1991] Baughman, M. L. and Siddiqi, S. N. (1991). Real-timepricing of reactive power: theory and case study results. IEEE Transactions on PowerSystems, 6(1):23–29.
[Baughman et al., 1997a] Baughman, M. L., Siddiqi, S. N., and Zarnikau, J. W. (1997a).Advanced pricing in electrical systems. i. theory. IEEE Transactions on Power Sys-tems, 12(1):489–495. TY - JOUR.
[Baughman et al., 1997b] Baughman, M. L., Siddiqi, S. N., and Zarnikau, J. W.(1997b). Advanced pricing in electrical systems. ii. implications. IEEE Transactionson Power Systems, 12(1):496–502.
[Bhattacharya and Zhong, 2001] Bhattacharya, K. and Zhong, J. (2001). Reactivepower as an ancillary service. IEEE Transactions on Power Systems, 16(2):294–300.TY - JOUR.
[Bialek, 1996] Bialek, J. (1996). Tracing the flow of electricity. IEE Proceedings onGeneration, Transmission and Distribution, 143(4):313–320.
[Bialek, 1998] Bialek, J. (1998). Allocation of transmission supplementary charge toreal andreactive loads. IEEE Transactions on Power Systems, 13(3):749–754.
[Carpentier, 1979] Carpentier, J. (1979). Optimal power flow. Electrical Power & En-ergy System, 1(1):3–15.
BIBLIOGRAPHY 39
[Chamorel, 1987] Chamorel, P. A. (1987). Methods for reactive power optimization.CIGRE WG 38-01.
[Chattopadhyay et al., 1995] Chattopadhyay, D., Bhattacharya, K., and Parikh, J.(1995). Optimal reactive power planning and its spot-pricing: an integrated approach.IEEE Transactions on Power Systems, 10(4):2014–2020.
[Chen et al., 2006] Chen, L., Zhong, J., and Gan, D. (2006). Reactive power planningand its cost allocation for distribution systems with distributed generation. PowerEngineering Society General Meeting, 2006. IEEE, page 6.
[Chicco, 2004] Chicco, G. (2004). A new method for reactive market power assessmentin competitive electricity markets. Proceedings of the 12th IEEE Mediterranean Elec-trotechnical Conference, 2004. MELECON 2004., 3.
[Choi et al., 1998] Choi, J. Y., Rim, S. H., and Park, J. K. (1998). Optimal real timepricing of real and reactive powers. IEEE Transactions on Power Systems, 13(4):1226–1231.
[Chu et al., 2004] Chu, W., Chen, B., and Liao, C. (2004). Allocating the costs ofreactive power purchased in an ancillary service market by modified y-bus matrixmethod. IEEE Transactions on Power Systems, 19(1):174–179.
[Corsi and CESI, 2000] Corsi, S. and CESI, M. (2000). The secondary voltage regulationin Italy. Power Engineering Society Summer Meeting, 2000. IEEE, 1.
[Corsi et al., 1995] Corsi, S., Marannino, P., Losignore, N., Moreschini, G., and Piccini,G. (1995). Coordination between the reactive power scheduling function and thehierarchical voltage control of the ehv enel system. IEEE Transactions on PowerSystems, 10(2):686–694.
[Dandachi, 1997] Dandachi, N. (1997). Improved algorithm for voltage/VAr manage-ment on the NGC system. Voltage Collapse (Digest No: 1997/101), IEE Colloquiumon, page 4.
[de la Fuente, 1997] de la Fuente, J. I. (1997). Configuración del control jerárquico detensiones en un sistema de energía eléctrica. PhD Thesis, Universidad Pontificia deComillas, Madrid (Spain).
[de Souza et al., 2001] de Souza, A. C. Z., Alvarado, F., and Glavic, M. (2001). Theeffect of loading on reactive market power. System Sciences, 2001. Proceedings of the34th Annual Hawaii International Conference on, page 5.
[Dingley, 2002] Dingley, C. (2002). A preliminary investigation into the cost of reactivepower and methods of charging for it. Cape Town, South Africa: University of CapeTown.
40 BIBLIOGRAPHY
[Dixon et al., 2005] Dixon, J., Moran, L., Rodriguez, E., and Domke, R. (2005). Re-active power compensation technologies: state-of-the-art review. Proceedings of theIEEE, 93(12):2144–2164.
[El-Keib and Ma, 1997] El-Keib, A. A. and Ma, X. (1997). Calculating short-runmarginal costs of active and reactive power production. IEEE Transactions on PowerSystems, 12(2):559–565. TY - JOUR.
[FERC, 2005] FERC (2005). Principles for efficient and reliable reactive power supplyand consumption. Staff Report, Docket No. AD05-1-000.
[Fetea and Petroianu, 2000] Fetea, R. and Petroianu, A. (2000). Can the reactive powerbe used? Power System Technology, 2000. Proceedings. PowerCon 2000. Interna-tional Conference on, 3.
[Flatabo and Invernizzi, 1987] Flatabo, N. and Invernizzi, A. (1987). Use of reactivepower optimization techniques in system planning. CIGRE WG 38-01.
[Frank, 1981] Frank, H. (1981). Thyristor-controlled shunt compensation in power net-works. ASEA Journal, 54(5/6):121–127.
[Frank and Landstrom, 1971] Frank, H. and Landstrom, B. (1971). Power factor cor-rection with thyristor controlled capacitors. ASEA Journal, 44(6):180–184.
[Frías, 2004] Frías, P. (2004). Gestión optimizada del control de tensiones y gestión dela potencia reactiva. aplicación al caso español. Trabajo de Investigación. Instituto deInvestigación Tecnológica, Universidad Pontificia Comillas (Madrid, Spain).
[Frías et al., 2005] Frías, P., Soler, D., and Gómez, T. (2005). Valuation of reactivepower zonal capacity payments. Power Systems Computation Conference Proceedings,2005 Liege (Belgium), 1.
[Gyugyi et al., 1978] Gyugyi, L., Otto, R., and Putman, T. (1978). Principles andapplications of static, thyristor-controlled shunt compensators. IEEE Transactionson Power Apparatus and Systems, 97(5):1935–1944.
[Hao and Papalexopoulos, 1997] Hao, S. and Papalexopoulos, A. (1997). Reactive powerpricing and management. IEEE Transactions on Power Systems, 12(1):95–104.
[Hogan, 1993] Hogan, W. (1993). Markets in real electric networks require reactiveprices. The Energy Journal, 14(3):171–200.
[Joskow and Schmalensee, 1983] Joskow, P. L. and Schmalensee, R. (1983). Markets forPower: An Analysis of Electric Utility Deregulation. MIT Press.
[Kim et al., 2004] Kim, S. G., Outhred, H., and MacGill, I. (2004). Solving a nodal spotmarket with voltage value functions using a hybrid optimization algorithm. PowerSystem Technology, 2004. PowerCon 2004. 2004 International Conference on, 1.
BIBLIOGRAPHY 41
[Kirby and Hirst, 1997] Kirby, B. and Hirst, E. (1997). Ancillary service details: voltagecontrol. ORNL/CON-453, Oak Ridge National Laboratory.
[Kirschen et al., 1997] Kirschen, D., Allan, R., and Strbac, G. (1997). Contributionsof individual generators to loads and flows. IEEE Transactions on Power Systems,12(1):52–60.
[Kundur, 1994] Kundur, P. S. (1994). Power System Stability and Control. McGraw-HillProfessional.
[Lagonotte et al., 1989] Lagonotte, P., Sabonnadiere, J. C., Leost, J. Y., and Paul, J. P.(1989). Structural analysis of the electrical system: application to secondary voltagecontrol in france. IEEE Transactions on Power Systems, 4(2):479–486.
[Lamont and Fu, 1999] Lamont, J. W. and Fu, J. (1999). Cost analysis of reactive powersupport. IEEE Transactions on Power Systems, 14(3):890–898.
[Li et al., 2006] Li, F., Kueck, J., Rizy, T., King, T., and Incorporated, E. (2006). Apreliminary analysis of the economics of using distributed energy as a source of reac-tive power supply. Prepared for the U.S. Department of Energy. Oak Ridge NationalLaboratory and Energetics Incorporated.
[Li and David, 1993] Li, Y. Z. and David, A. K. (1993). Pricing reactive power con-veyance. IEE Proceedings-Generation, Transmission and Distribution, 140(3):174–180. TY - JOUR.
[Li and David, 1994] Li, Y. Z. and David, A. K. (1994). Wheeling rates of reactive powerflow under marginal cost pricing. IEEE Transactions on Power Systems, 9(3):1263–1269. TY - JOUR.
[Lin et al., 2006] Lin, X. J., Yu, C. W., Xu, N., Chung, C. Y., and Wu, H. (2006).Reactive power service cost allocation using aumann-shapley method. IEE Proceedingson Generation, Transmission and Distribution, 153(5):540–546.
[Marannino et al., 2004] Marannino, P., Zanellini, F., Marelli, G., Merlo, M., and Pic-cini, G. (2004). Assessing the mvar generation values to price the reactive support toa hierarchical voltage control. Proceedings of the Bulk Power Systems Dynamics andControl VI, pages 24–39.
[NGC, 1991] NGC (1991). Ancillary services. transmission system requirements. Tech-nical report, National Grid Company.
[Nilsson et al., 1994] Nilsson, N. E., Mercurio, J., Co, O. E., and Akron, O. H. (1994).Synchronous generator capability curve testing and evaluation. IEEE Transactionson Power Delivery, 9(1):414–424.
[Nobile and Bose, 2002] Nobile, E. and Bose, A. (2002). A new scheme for voltage con-trol in a competitive ancillary service market. Proceedings of XIV PSCC Conference,Session 40, Paper 4.
42 BIBLIOGRAPHY
[Panvini and Yohn, 1995] Panvini, A. and Yohn, T. J. (1995). Field assessment of gen-erators reactive capability. IEEE Transactions on Power Systems, 10(1):288–296.
[Peças et al., 2007] Peças, J. A., Hatziargyriou, N., Mutale, J., Djapic, P., and Jenkins,N. (2007). Integrating distributed generation into electric power systems: A review ofdrivers, challenges and opportunities. Electric Power Systems Research, 77(9):1189–1203.
[Peças et al., 2005] Peças, J. A., Mendonça, A., Fonseca, N., and Seca, L. (2005). Volt-age and reactive power control provided by dg units. CIGRE SYMPOSIUM: PowerSystems with Dispersed Generation, Athens, Greece, April.
[Pirayesh et al., 2004a] Pirayesh, A., Feuillet, R., Said, N., and Vakilian, M. (2004a).Generator VAr valuation based on MW shipment considerations in power markets.Universities Power Engineering Conference, 2004. UPEC 2004. 39th International,3.
[Pirayesh et al., 2004b] Pirayesh, A., Vakilian, M., Feuillet, R., and HadjSaid, N.(2004b). Valuation of dynamic reactive power support based on mw transaction im-plementation considerations. 2004 Large Engineering systems Conference on PowerEngineering, 2004. LESCOPE-04., pages 19–23.
[PSOTF, 2004] PSOTF (2004). Final report on the august 14, 2003 blackout in theunited states and canada: Causes and recommendations. U.S.-Canada Power SystemOutage Task Force.
[RTE, 2002] RTE (2002). Mémento de la sûreté du systéme électrique. Gestionnnairedu Réseau de Transport d’électricité, Paris.
[Sancha et al., 1996] Sancha, J. L., Fernandez, J. L., Cortes, A., and Abarca, J. T.(1996). Secondary voltage control: analysis, solutions and simulation results for thespanish transmission system. IEEE Transactions on Power Systems, 11(2):630–638.
[Sancha et al., 1992] Sancha, J. L., Fernández, J. L., and Martin, L. (1992). Spainimproves voltage profile on power network. Electric Power International, pages 41–42.
[Schweppe and Caramanis, 1988] Schweppe, F. C. and Caramanis, M. C. (1988). SpotPricing of Electricity. Springer.
[Smith et al., 1987] Smith, L. M., Carvalho, V. F., Sullivan, R. L., and Neumann, S. A.(1987). Bibliography on reactive power and voltage control: Ieee var managementworking group report. IEEE Trans. Power Syst., 2.
[Soler, 2001] Soler, D. (2001). Modelos regulatorios de los servicios complementarios degeneración y red en sistemas de energía eléctrica. PhD thesis, Universidad PontificiaComillas.
BIBLIOGRAPHY 43
[Stoft, 2002] Stoft, S. (2002). Power System Economics: Designing Markets for Elec-tricity. Wiley-Interscience.
[Thomas et al., 2006] Thomas, R., Mount, T., Schuler, R., Schulze, W., and Zimmer-mann, R. (2006). Markets for reactive power and reliability: a white paper. PSERCReport.
[Thomas, 2007] Thomas, S. (2007). Unbundling of electricity transmission networks:Analysis of the european commission’s position. Public Services International Re-search Unit (PSIRU), University of Greenwich, London.
[Toomey et al., 2005] Toomey, D., Schulze, W., Schuler, R., Thomas, R., and Thorp, J.(2005). Reliability, electric power, and public versus private goods: A new look at therole of markets. System Sciences, 2005. HICSS’05. Proceedings of the 38th AnnualHawaii International Conference on, pages 58b–58b.
[UETP, 1997] UETP (1997). Reactive power management and voltage control. EES-UETP Proceedings of the 1997 Course Program.
[Vaahedi et al., 1998] Vaahedi, E., Mansour, Y., Li, W., Tamby, J., Sun, D., Maratuko-lam, D., Hydro, B. C., and Burnaby, B. C. (1998). Evaluation of existing optimal varplanning tools on utility systems. IEE Proceedings on Generation, Transmission andDistribution, 145(6):663–668.
[Wang and Xu, 2002] Wang, Y. and Xu, W. (2002). Assessing the reactive power sup-port requirements for generators in a competitive electricity market. Power SystemManagement and Control, 2002. Fifth International Conference on (Conf. Publ. No.488), pages 402–407.
[Wu et al., 2000] Wu, F., Ni, Y., and Wei, P. (2000). Power transfer allocation foropen access using graph theory. Fundamentals and applications in systems withoutloopflow. IEEE Transactions on Power Systems, 15(3):923–929.
[Xu et al., 2000] Xu, W., Zhang, Y., da Silva, L., and Kundar, P. (2000). Competitiveprocurement of dynamic reactive power support service for transmission access. IEEEPower Engineering Society Summer Meeting, 2000., 1.
[Zhang and Tolbert, 2005] Zhang, W. and Tolbert, L. M. (2005). Survey of reactivepower planning methods. Power Engineering Society General Meeting, 2005. IEEE,pages 1430–1440.
[Zhong and Bhattacharya, 2002c] Zhong, J. and Bhattacharya, K. (2002c). Towarda competitive market for reactive power. IEEE Transactions on Power Systems,17(4):1206–1215.
[Zhong et al., 2004] Zhong, J., Nobile, E., Bose, A., and Bhattacharya, K. (2004). Lo-calized reactive power markets using the concept of voltage control areas. IEEETransactions on Power Systems, 19(3):1555–1561. TY - JOUR.

44 BIBLIOGRAPHY
CHAPTER 3
A market proposal for the long-term VQ
service
In the analysis presented in the previous chapter, some guidelines for the developmentof a regulatory framework for the VQ service procurement were discussed. Following
these guidelines, this chapter presents a regulatory proposal to allocate and remuneratethe VQ service. The proposal for this service is based on a reactive power capacitymarket.
First, the framework in which the proposed market can be included is presented. Then,the VAR capacity is selected as the homogeneous product to be traded in the proposedmarket. The capacity market is then described, discussing the VAR capacity bids, andthe structure of the market. The economic settlement of the VAR capacity marketincludes the payments to the selected VAR bids, and the charging mechanism for thedemand of the service. Finally, monitoring and penalties are defined for the correctprocurement of the service.
45
46 CHAPTER 3. MARKET PROPOSAL
3.1 Reference framework for the VAR market pro-
posal
In the beginning of the 90’s an international liberalization process in the energy sectorconverted the traditional centralized operation of electricity into a competitive market.In the beginning, only the energy market was cleared under competitive mechanisms.Soon after, some ancillary services were traded under market mechanisms. As presentedin Chapter 2 and Appendix A, nowadays many countries are introducing a competitivemechanism in the procurement of the VQ service.
As it has been analyzed in the previous chapter, there are three decision levels associatedwith the VQ service procurement, (i) VAR planning, (ii) VAR dispatch and (iii) VARuse. The period of time for the construction and installation of new VAR sources orupgrading existing ones is usually less than one year. This period of time is short,compared with the time needed for the construction of new power plants which extendsin several years. Therefore, the planning of VAR equipment covers usually a time frameof one or two years.
VAR dispatch is usually performed under the system constraint management mecha-nism, which normally takes place after the energy dispatch. Power system constraintsinclude both congestions in the transmission network, and local voltage problems. Sys-tem constraints are solved by changing the active power dispatch, increasing the genera-tion of connected units and connecting off-line generation, and decreasing the generationof the most expensive units. Decisions are taken one day or, at least, one hour in ad-vance of the real-time operation. Changes in the active power dispatch have specificeconomical compensations1.
An adequate VAR control may reduce the transmission energy losses. This effect is thecombined result of reducing currents with (i) the reduction of VAR flows through lines,and (ii) by increasing voltages. Each power system has its own mechanism to distributeand allocate the transmission losses2.
The main requirements to create a competitive market for the VQ service are the fol-lowing:
i) Services unbundling. The traditional operation of vertically-integrated power sys-tems usually considered ancillary services as mandatory and non-remunerated.Nowadays, new electricity markets are developing competitive mechanisms not
1In the Spanish energy market system constraints are solved after the day-ahead energy market iscleared, and are regulated by the Operating Procedure P.O.-3.2 [REE, 1998]. Generation units submitspecific bids for this market in quantity and price to solve constraints. These bids are different fromthose sent to the energy market. Selected generators are paid according to their bids. Those generatorswhose active power is reduced do not receive economic compensation.
2In Spain all the costs associated with transmission losses are allocated to customers using distribu-tion factors [Conejo et al., 2002, González and Basagoiti, 1999]. There exist other alternatives for lossesallocation, such as marginal pricing, incremental allocation, and transmission power flow decompositionamong others [Unsihuay and Saavedra, 2003].
3.2. PRODUCT DEFINITION 47
only for the energy supply but also for the ancillary services, among which standsthe VQ service. These new competitive proposals for the procurement of the an-cillary services increase the efficiency and fair treatment of the different suppliers.
ii) Absence of market power. Due to the local nature of VAR support, the existence ofmarket power in the procurement of the service is quite usual. Therefore, specificmechanisms should be designed to limit or at least neutralize the potential exerciseof market power.
iii) Minimize the distortion with the energy market. Most power systems with a mar-ket based mechanism for the energy dispatch perform a congestion managementanalysis after the energy market has been cleared. This analysis is usually carriedout by the SO, that modifies the market scheduled output of generators, by in-creasing the generation of connected units and by connecting off-line generation,in order to fulfill the security criteria3. Under this scheme, the existence of previ-ous long-term arrangements for the procurement of VAR capacity may potentiallyreduce the changes in the energy dispatch.
3.2 Product definition
The definition of a homogeneous product is a main requirement to establish a market forVAR. A product is considered to be homogeneous if the different bids for that productcan be easily compared between each other. In Chapter 2 two products associated withthe VQ service were identified: (i) installed VAR capacity, and (ii) use of the VARcapacity to control voltages. The economic analysis carried out in this thesis showsthat a reasonable alternative for a market of the VQ service is to design a competitivemechanism for the product of the highest cost, which is the installed VAR capacity4.Additionally, the VAR use product will have an specific compensation mechanism, as itwill be presented in the next section.
The homogeneous product that will be traded in the proposed competitive VARmarket is the band of installed VAR capacity. This basic product includes the VARgeneration capacity and VAR absorption capacity.
The procurement of VAR capacity has two main characteristics, (i) the dynamic per-formance, and (ii) the dependence on voltage. The dynamic response of VAR sourcesis defined as the step in its VAR output that can be achieved within a determined
3Appendix A presents a brief description of the Spanish constraint management mechanism.4In electric power markets the market is based on active power energy, as it is considered to be the
main product. However, an additional compensation is also defined for the active power capacity, inorder to send long-term signals for the security of energy supply.
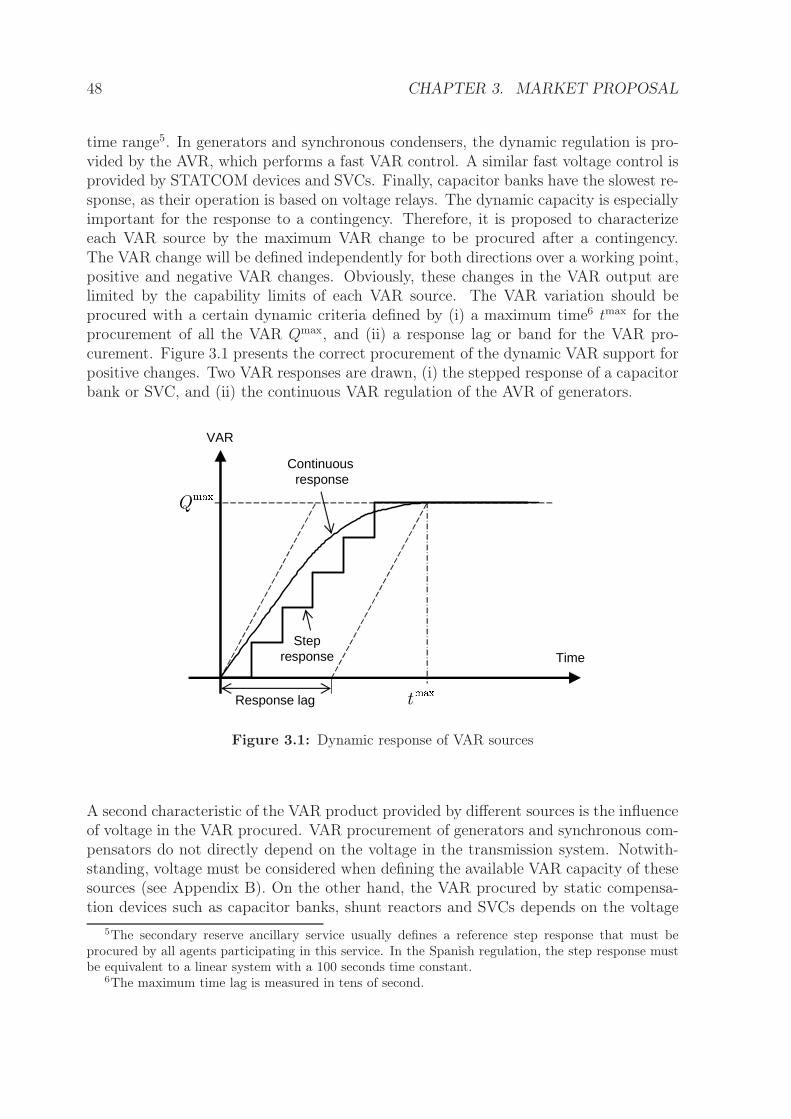
48 CHAPTER 3. MARKET PROPOSAL
time range5. In generators and synchronous condensers, the dynamic regulation is pro-vided by the AVR, which performs a fast VAR control. A similar fast voltage control isprovided by STATCOM devices and SVCs. Finally, capacitor banks have the slowest re-sponse, as their operation is based on voltage relays. The dynamic capacity is especiallyimportant for the response to a contingency. Therefore, it is proposed to characterizeeach VAR source by the maximum VAR change to be procured after a contingency.The VAR change will be defined independently for both directions over a working point,positive and negative VAR changes. Obviously, these changes in the VAR output arelimited by the capability limits of each VAR source. The VAR variation should beprocured with a certain dynamic criteria defined by (i) a maximum time6 tmax for theprocurement of all the VAR Qmax, and (ii) a response lag or band for the VAR pro-curement. Figure 3.1 presents the correct procurement of the dynamic VAR support forpositive changes. Two VAR responses are drawn, (i) the stepped response of a capacitorbank or SVC, and (ii) the continuous VAR regulation of the AVR of generators.
t
Q
Time
VAR
Stepresponse
Continuousresponse
Response lag
Figure 3.1: Dynamic response of VAR sources
A second characteristic of the VAR product provided by different sources is the influenceof voltage in the VAR procured. VAR procurement of generators and synchronous com-pensators do not directly depend on the voltage in the transmission system. Notwith-standing, voltage must be considered when defining the available VAR capacity of thesesources (see Appendix B). On the other hand, the VAR procured by static compensa-tion devices such as capacitor banks, shunt reactors and SVCs depends on the voltage
5The secondary reserve ancillary service usually defines a reference step response that must beprocured by all agents participating in this service. In the Spanish regulation, the step response mustbe equivalent to a linear system with a 100 seconds time constant.
6The maximum time lag is measured in tens of second.
3.3. THE VAR CAPACITY MARKET 49
squared. This issue is critical for low voltage operating situations, were VAR procure-ment is mostly needed. For low voltages the contribution of these VAR sources is highlyreduced. The VAR procured by STATCOM devices can be assumed as proportional tothe voltage value, which is a better response than that of static VAR sources. Therefore,the proposed market must consider the influence of voltage on the VAR procurementfrom the different devices.
3.3 The VAR capacity market
The SO must guarantee the system security associated with the VAR needs in the long-term. For this purpose, the SO selects certain VAR sources and, if needed, may requiretransmission owners to invest in new VAR sources in order to cover the expected VARdemand. The allocation of this VAR capacity results in costs that should be covered byall the agents participating in the energy market.
Under a real-time market for VAR paid at marginal prices, market agents would receiveefficient incentives for optimal VAR investment. Marginal VAR prices are valuable underthe contingency scenarios7. However, as these prices are very volatile, investment signalsbecame quite unstable. In order to minimize the uncertainty of investments, long-termVAR markets should be designed. This market structure also improves competition,and therefore minimizes market power. Finally, long-term VAR markets in comparisonwith real-time markets are easier to implement and manage. Indeed, nowadays, currentpower flow software is still not able to manage large-scale real-time VAR pricing.
The proposed VAR market is based on long-term contracts between the SO and theselected supply agents. As the construction and installation time frame for new VARsources is less than one year, markets for reactive power may cover a time frame of oneyear. Reactive generation and absorption capacity contracts are awarded in an annualauction for the whole power system. These contracts can be extended for more thanone year in order to provide more stable economic signals for investments. Decisions arethen taken one year in advance, allowing the entrance of new investments, as one yearis enough time to install a new VAR device or to upgrade the existing ones.
The annual auction will cover the reactive power capacity needs of the power systemthat are not already covered by previous VAR capacity contracts. Hence, VAR needswill be determined by concluded VAR contracts, and by the natural load increase (seeFigure 3.2).
This section describes in detail the proposed market for VAR capacity. First bids anddemand for the market are presented. Then, the proposed mechanism to select the bids,
7In energy markets paid at marginal price peaking units recover their costs with high remunerationduring peak hours.
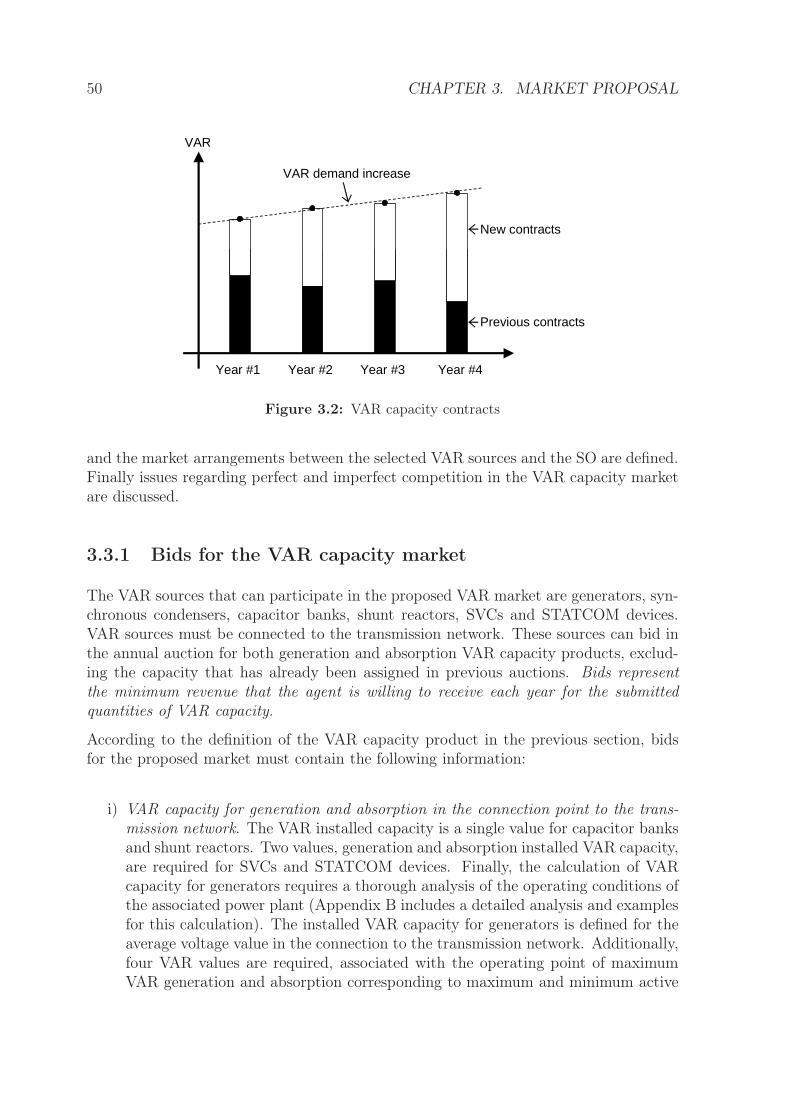
50 CHAPTER 3. MARKET PROPOSAL
Year #1 Year #2 Year #3 Year #4
VAR
VAR demand increase
New contracts
Previous contracts
Figure 3.2: VAR capacity contracts
and the market arrangements between the selected VAR sources and the SO are defined.Finally issues regarding perfect and imperfect competition in the VAR capacity marketare discussed.
3.3.1 Bids for the VAR capacity market
The VAR sources that can participate in the proposed VAR market are generators, syn-chronous condensers, capacitor banks, shunt reactors, SVCs and STATCOM devices.VAR sources must be connected to the transmission network. These sources can bid inthe annual auction for both generation and absorption VAR capacity products, exclud-ing the capacity that has already been assigned in previous auctions. Bids representthe minimum revenue that the agent is willing to receive each year for the submittedquantities of VAR capacity.
According to the definition of the VAR capacity product in the previous section, bidsfor the proposed market must contain the following information:
i) VAR capacity for generation and absorption in the connection point to the trans-mission network. The VAR installed capacity is a single value for capacitor banksand shunt reactors. Two values, generation and absorption installed VAR capacity,are required for SVCs and STATCOM devices. Finally, the calculation of VARcapacity for generators requires a thorough analysis of the operating conditions ofthe associated power plant (Appendix B includes a detailed analysis and examplesfor this calculation). The installed VAR capacity for generators is defined for theaverage voltage value in the connection to the transmission network. Additionally,four VAR values are required, associated with the operating point of maximumVAR generation and absorption corresponding to maximum and minimum active
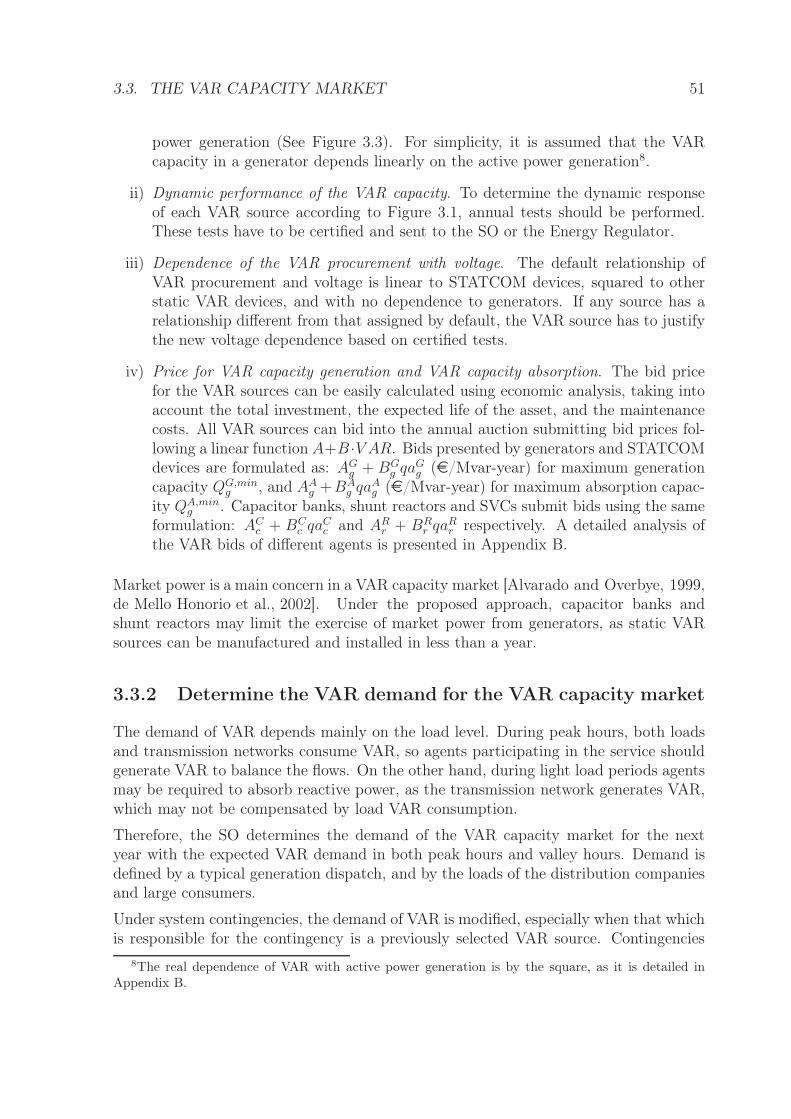
3.3. THE VAR CAPACITY MARKET 51
power generation (See Figure 3.3). For simplicity, it is assumed that the VARcapacity in a generator depends linearly on the active power generation8.
ii) Dynamic performance of the VAR capacity. To determine the dynamic responseof each VAR source according to Figure 3.1, annual tests should be performed.These tests have to be certified and sent to the SO or the Energy Regulator.
iii) Dependence of the VAR procurement with voltage. The default relationship ofVAR procurement and voltage is linear to STATCOM devices, squared to otherstatic VAR devices, and with no dependence to generators. If any source has arelationship different from that assigned by default, the VAR source has to justifythe new voltage dependence based on certified tests.
iv) Price for VAR capacity generation and VAR capacity absorption. The bid pricefor the VAR sources can be easily calculated using economic analysis, taking intoaccount the total investment, the expected life of the asset, and the maintenancecosts. All VAR sources can bid into the annual auction submitting bid prices fol-lowing a linear function A+B ·V AR. Bids presented by generators and STATCOMdevices are formulated as: AG
g + BGg qaG
g (e/Mvar-year) for maximum generationcapacity QG,min
g , and AAg +BA
g qaAg (e/Mvar-year) for maximum absorption capac-
ity QA,ming . Capacitor banks, shunt reactors and SVCs submit bids using the same
formulation: ACc + BC
c qaCc and AR
r + BRr qaR
r respectively. A detailed analysis ofthe VAR bids of different agents is presented in Appendix B.
Market power is a main concern in a VAR capacity market [Alvarado and Overbye, 1999,de Mello Honorio et al., 2002]. Under the proposed approach, capacitor banks andshunt reactors may limit the exercise of market power from generators, as static VARsources can be manufactured and installed in less than a year.
3.3.2 Determine the VAR demand for the VAR capacity market
The demand of VAR depends mainly on the load level. During peak hours, both loadsand transmission networks consume VAR, so agents participating in the service shouldgenerate VAR to balance the flows. On the other hand, during light load periods agentsmay be required to absorb reactive power, as the transmission network generates VAR,which may not be compensated by load VAR consumption.
Therefore, the SO determines the demand of the VAR capacity market for the nextyear with the expected VAR demand in both peak hours and valley hours. Demand isdefined by a typical generation dispatch, and by the loads of the distribution companiesand large consumers.
Under system contingencies, the demand of VAR is modified, especially when that whichis responsible for the contingency is a previously selected VAR source. Contingencies
8The real dependence of VAR with active power generation is by the square, as it is detailed inAppendix B.
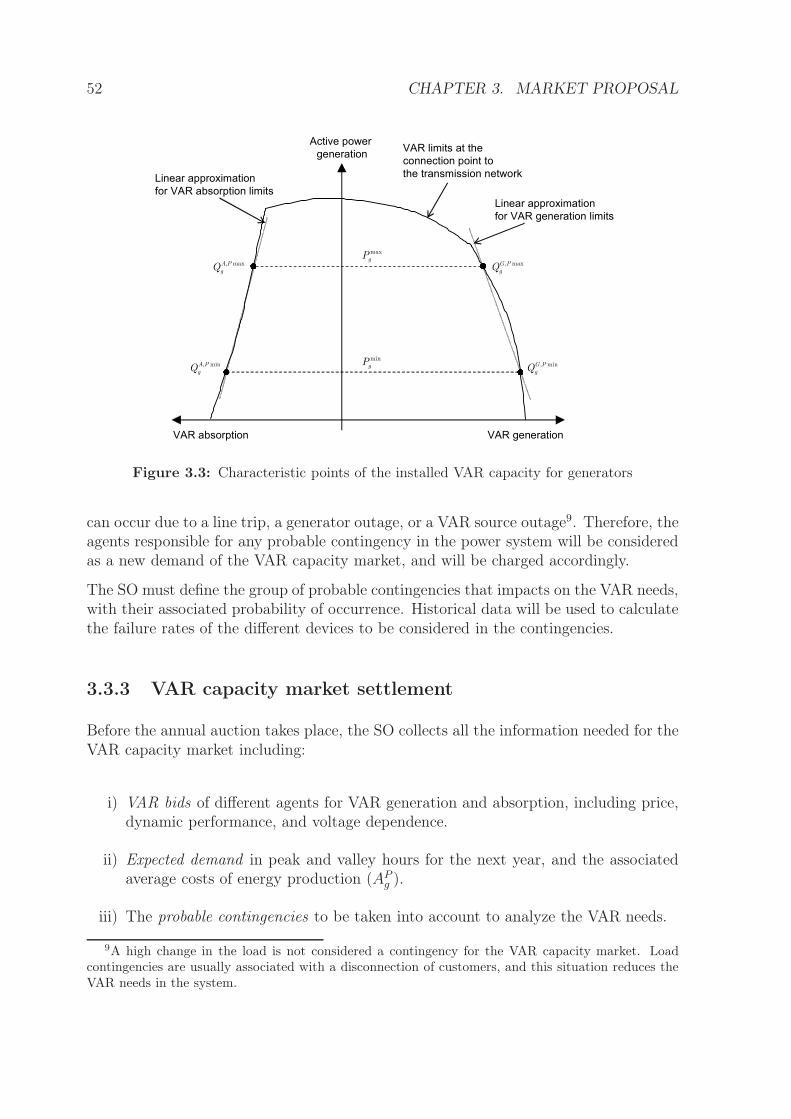
52 CHAPTER 3. MARKET PROPOSAL
max
gP
min
gP
, maxA P
gQ
, minA P
gQ
, maxG P
gQ
, minG P
gQ
VAR generationVAR absorption
Active power
generation
Linear approximation
for VAR generation limits
VAR limits at the
connection point to
the transmission networkLinear approximation
for VAR absorption limits
Figure 3.3: Characteristic points of the installed VAR capacity for generators
can occur due to a line trip, a generator outage, or a VAR source outage9. Therefore, theagents responsible for any probable contingency in the power system will be consideredas a new demand of the VAR capacity market, and will be charged accordingly.
The SO must define the group of probable contingencies that impacts on the VAR needs,with their associated probability of occurrence. Historical data will be used to calculatethe failure rates of the different devices to be considered in the contingencies.
3.3.3 VAR capacity market settlement
Before the annual auction takes place, the SO collects all the information needed for theVAR capacity market including:
i) VAR bids of different agents for VAR generation and absorption, including price,dynamic performance, and voltage dependence.
ii) Expected demand in peak and valley hours for the next year, and the associatedaverage costs of energy production (AP
g ).
iii) The probable contingencies to be taken into account to analyze the VAR needs.
9A high change in the load is not considered a contingency for the VAR capacity market. Loadcontingencies are usually associated with a disconnection of customers, and this situation reduces theVAR needs in the system.
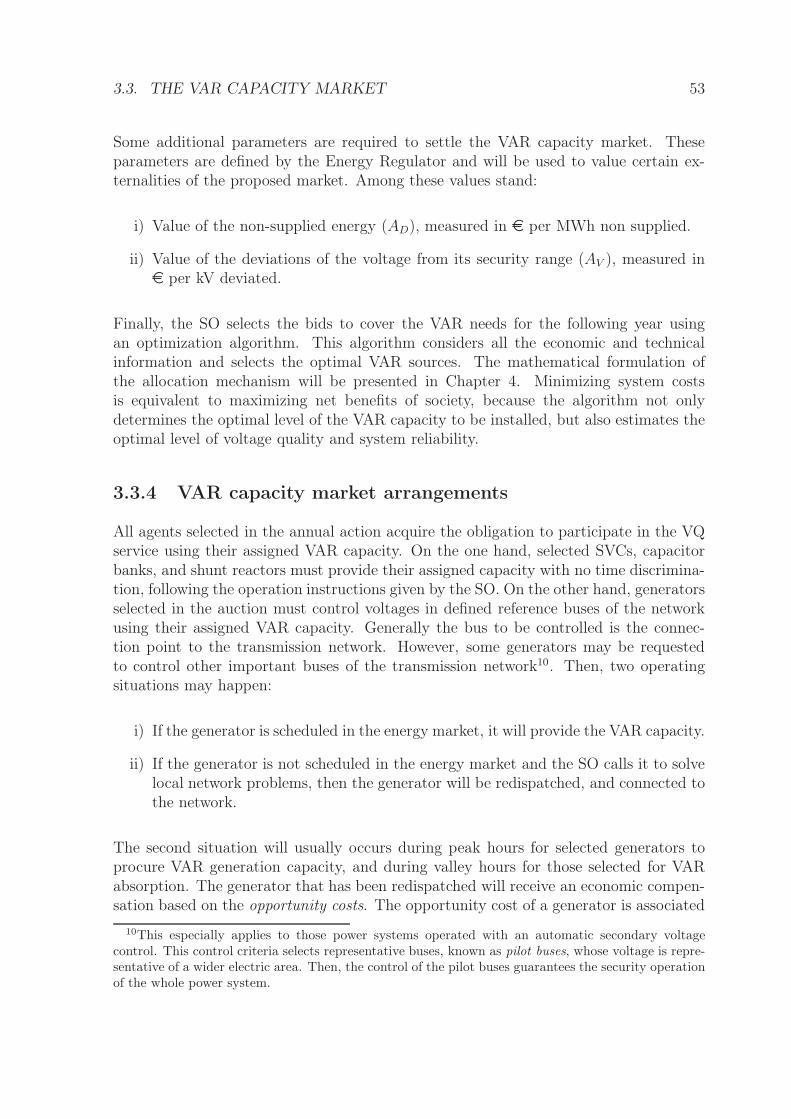
3.3. THE VAR CAPACITY MARKET 53
Some additional parameters are required to settle the VAR capacity market. Theseparameters are defined by the Energy Regulator and will be used to value certain ex-ternalities of the proposed market. Among these values stand:
i) Value of the non-supplied energy (AD), measured in e per MWh non supplied.
ii) Value of the deviations of the voltage from its security range (AV ), measured ine per kV deviated.
Finally, the SO selects the bids to cover the VAR needs for the following year usingan optimization algorithm. This algorithm considers all the economic and technicalinformation and selects the optimal VAR sources. The mathematical formulation ofthe allocation mechanism will be presented in Chapter 4. Minimizing system costsis equivalent to maximizing net benefits of society, because the algorithm not onlydetermines the optimal level of the VAR capacity to be installed, but also estimates theoptimal level of voltage quality and system reliability.
3.3.4 VAR capacity market arrangements
All agents selected in the annual action acquire the obligation to participate in the VQservice using their assigned VAR capacity. On the one hand, selected SVCs, capacitorbanks, and shunt reactors must provide their assigned capacity with no time discrimina-tion, following the operation instructions given by the SO. On the other hand, generatorsselected in the auction must control voltages in defined reference buses of the networkusing their assigned VAR capacity. Generally the bus to be controlled is the connec-tion point to the transmission network. However, some generators may be requestedto control other important buses of the transmission network10. Then, two operatingsituations may happen:
i) If the generator is scheduled in the energy market, it will provide the VAR capacity.
ii) If the generator is not scheduled in the energy market and the SO calls it to solvelocal network problems, then the generator will be redispatched, and connected tothe network.
The second situation will usually occurs during peak hours for selected generators toprocure VAR generation capacity, and during valley hours for those selected for VARabsorption. The generator that has been redispatched will receive an economic compen-sation based on the opportunity costs. The opportunity cost of a generator is associated
10This especially applies to those power systems operated with an automatic secondary voltagecontrol. This control criteria selects representative buses, known as pilot buses, whose voltage is repre-sentative of a wider electric area. Then, the control of the pilot buses guarantees the security operationof the whole power system.
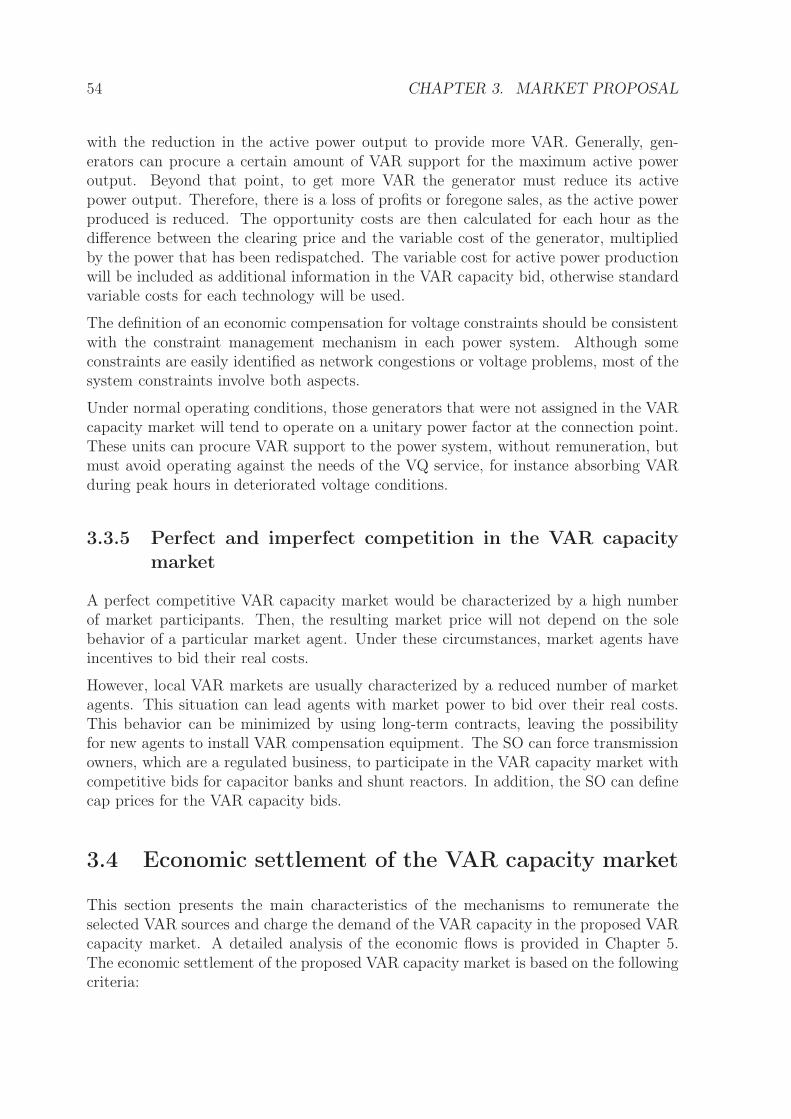
54 CHAPTER 3. MARKET PROPOSAL
with the reduction in the active power output to provide more VAR. Generally, gen-erators can procure a certain amount of VAR support for the maximum active poweroutput. Beyond that point, to get more VAR the generator must reduce its activepower output. Therefore, there is a loss of profits or foregone sales, as the active powerproduced is reduced. The opportunity costs are then calculated for each hour as thedifference between the clearing price and the variable cost of the generator, multipliedby the power that has been redispatched. The variable cost for active power productionwill be included as additional information in the VAR capacity bid, otherwise standardvariable costs for each technology will be used.
The definition of an economic compensation for voltage constraints should be consistentwith the constraint management mechanism in each power system. Although someconstraints are easily identified as network congestions or voltage problems, most of thesystem constraints involve both aspects.
Under normal operating conditions, those generators that were not assigned in the VARcapacity market will tend to operate on a unitary power factor at the connection point.These units can procure VAR support to the power system, without remuneration, butmust avoid operating against the needs of the VQ service, for instance absorbing VARduring peak hours in deteriorated voltage conditions.
3.3.5 Perfect and imperfect competition in the VAR capacity
market
A perfect competitive VAR capacity market would be characterized by a high numberof market participants. Then, the resulting market price will not depend on the solebehavior of a particular market agent. Under these circumstances, market agents haveincentives to bid their real costs.
However, local VAR markets are usually characterized by a reduced number of marketagents. This situation can lead agents with market power to bid over their real costs.This behavior can be minimized by using long-term contracts, leaving the possibilityfor new agents to install VAR compensation equipment. The SO can force transmissionowners, which are a regulated business, to participate in the VAR capacity market withcompetitive bids for capacitor banks and shunt reactors. In addition, the SO can definecap prices for the VAR capacity bids.
3.4 Economic settlement of the VAR capacity market
This section presents the main characteristics of the mechanisms to remunerate theselected VAR sources and charge the demand of the VAR capacity in the proposed VARcapacity market. A detailed analysis of the economic flows is provided in Chapter 5.The economic settlement of the proposed VAR capacity market is based on the followingcriteria:
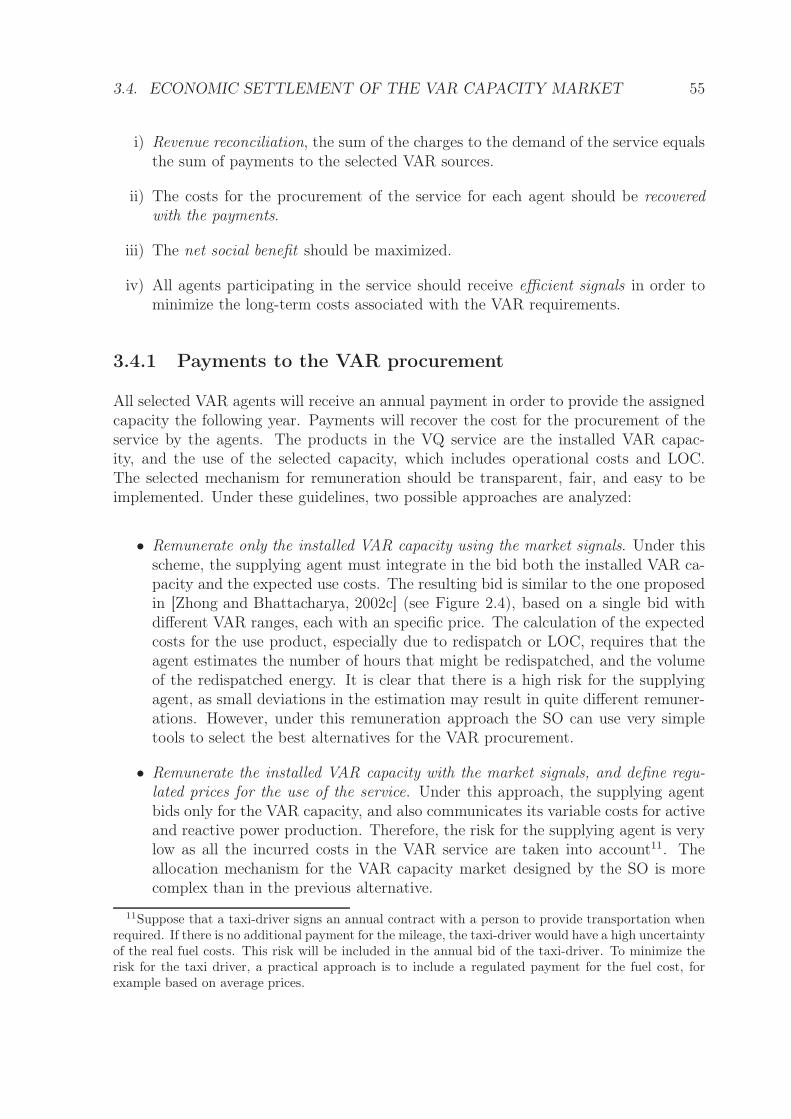
3.4. ECONOMIC SETTLEMENT OF THE VAR CAPACITY MARKET 55
i) Revenue reconciliation, the sum of the charges to the demand of the service equalsthe sum of payments to the selected VAR sources.
ii) The costs for the procurement of the service for each agent should be recoveredwith the payments.
iii) The net social benefit should be maximized.
iv) All agents participating in the service should receive efficient signals in order tominimize the long-term costs associated with the VAR requirements.
3.4.1 Payments to the VAR procurement
All selected VAR agents will receive an annual payment in order to provide the assignedcapacity the following year. Payments will recover the cost for the procurement of theservice by the agents. The products in the VQ service are the installed VAR capac-ity, and the use of the selected capacity, which includes operational costs and LOC.The selected mechanism for remuneration should be transparent, fair, and easy to beimplemented. Under these guidelines, two possible approaches are analyzed:
• Remunerate only the installed VAR capacity using the market signals. Under thisscheme, the supplying agent must integrate in the bid both the installed VAR ca-pacity and the expected use costs. The resulting bid is similar to the one proposedin [Zhong and Bhattacharya, 2002c] (see Figure 2.4), based on a single bid withdifferent VAR ranges, each with an specific price. The calculation of the expectedcosts for the use product, especially due to redispatch or LOC, requires that theagent estimates the number of hours that might be redispatched, and the volumeof the redispatched energy. It is clear that there is a high risk for the supplyingagent, as small deviations in the estimation may result in quite different remuner-ations. However, under this remuneration approach the SO can use very simpletools to select the best alternatives for the VAR procurement.
• Remunerate the installed VAR capacity with the market signals, and define regu-lated prices for the use of the service. Under this approach, the supplying agentbids only for the VAR capacity, and also communicates its variable costs for activeand reactive power production. Therefore, the risk for the supplying agent is verylow as all the incurred costs in the VAR service are taken into account11. Theallocation mechanism for the VAR capacity market designed by the SO is morecomplex than in the previous alternative.
11Suppose that a taxi-driver signs an annual contract with a person to provide transportation whenrequired. If there is no additional payment for the mileage, the taxi-driver would have a high uncertaintyof the real fuel costs. This risk will be included in the annual bid of the taxi-driver. To minimize therisk for the taxi driver, a practical approach is to include a regulated payment for the fuel cost, forexample based on average prices.
56 CHAPTER 3. MARKET PROPOSAL
QQ VAR
generationVAR
absorption
Remuneration forVAR capacity(€/Mvar-year)
(a)
(b)
(c)
Figure 3.4: Bids for VAR capacity
Considering the practical implementation of the proposed VAR market approach, thesecond remuneration scheme is selected. Then, payments to the installed VAR capacitywill be calculated using long-term marginal prices at each bus. The marginal prices areobtained from and optimization problem that minimizes the investment and operationcosts associated with the VAR procurement (see Chapter 4). Therefore, agents par-ticipating in the market will receive efficient location and cost/value signals. Marginalpricing guarantees that all selected agents will recover their costs. Figure 3.4 shows anexample of VAR capacity bids.
In addition, there is a regulated compensation for the use of the allocated VAR capacity(see Figure 3.5). The remuneration includes the sum of the VAR energy generated andthe VAR energy absorbed. Payments differentiate VAR generation and absorption, dueto its different costs. These regulated payments are easy to compute, taking into accountthe specific characteristics of each agent.
Finally, as commented in the previous section, a regulated compensation is defined forthe use of the VAR capacity if the active power output is reduced. This payment willbe computed for each hour, taking into account the variable cost of the generator andthe clearing price for the energy market for that hour.
3.4.2 Charges to the VAR demand
A charging mechanism is designed to recover all the payments to the selected agentsin the VAR capacity market. Charges are distributed among the demand of the VQservice using a methodology based on Cooperative Game Theory [Kreps, 1990]. TheCooperative Game Theory is applicable to cost allocation problems among participantsthat make use of the same service. Its objective is to obtain the fairest cost distribution.The approach in this thesis obtains the participation factors, also known as Aumann-Shapley values [Aumann and Shapley, 1975], on the costs of the VAR capacity market ofthe different agents that demand VAR support. These participation factors are obtained
3.5. MONITORING AND PENALTIES 57
QQ VAR generationVAR absorption
Remuneration forVAR capacity use
(€/Mvar-h)
Opportunity costcompensation,
calculated every hour
Losses & usecompensation
Figure 3.5: Remuneration for the use of the VAR capacity
using the marginal information that results from the equivalent optimization problemof the VAR capacity market settlement.
As described in the previous sections, the demand of the VQ service differentiates theload consumption, and system contingencies. On the one hand, loads will be chargedaccording to their active and reactive power consumption, taking into account theirinfluence on the VAR capacity costs. On the other hand, agents responsible for contin-gencies, mainly generators and transmission owners, will be charged for the additionalVAR costs in the market. Charges to contingencies depend on the failure rate of theconsidered devices, and on the extra VAR required to guarantee system security condi-tions.
3.5 Monitoring and penalties
The procurement of the allocated VAR capacity is considered as correctly fulfilled whenthe corresponding VAR source follows the SO control actions using the allocated VARcapacity. Generators must maintain defined bus voltages within reference value, andother VAR devices must follow the SO instructions. However, the service could becorrectly fulfilled with voltages out of the selected range, which is only possible whenthe VAR sources have already exhausted all their VAR capacity.
Once the selected VAR source has a certain purchased capacity, the SO cannot verify ifthat capacity really exists. Its existence will be demonstrated when the whole capacity isrequired under real operating conditions. As a large volume of VAR capacity is allocatedto solve contingencies, it may occur that there are no contingencies for years, and sothe SO will not know if the selected agent has that capacity available. Therefore, the
58 CHAPTER 3. MARKET PROPOSAL
SO must design mechanisms for service monitoring and penalties in order to discouragemarket agents to declare VAR over-capacity. For example, periodic tests of selectedVAR sources could be used. Under both test and real operation, if the selected agentcannot procure the allocated capacity, the agent should be penalized.
If a selected VAR source is called to solve voltage problems, and is not available, thenthis unavailability will be recorded and taken into account when calculating its failurerate (Hsg
) for the next VAR capacity auction. A failure rate increment will also increasethe charges associated with contingencies to that VAR source.
The design of the penalties should discourage selected VAR sources to profit from badpractices. However, penalties should be limited to avoid discouraging VAR sources toparticipate in the VAR capacity market. A penalty of 1.5 times the difference of theallocated capacity and the real capacity is proposed in the case that the selected VARsource does not fulfill its obligations12.
3.6 Conclusions
This Chapter has presented a regulatory proposal for the VQ service. The proposal isbased on a VAR capacity market which can be applied to competitive energy markets.
The proposed market is based on a single product, VAR capacity. This product has thehighest cost share compared with the use of the VAR capacity. The main product includea capacity range divided into VAR generation capacity and VAR absorption capacity.A homogeneous product is needed in order to compare all the VAR agents that areable to provide the service. Therefore, the VAR capacity has been characterized by itsdynamic performance, and the dependence of the VAR procurement on the voltage in thetransmission network. Then, annual tests are proposed to verify the main characteristicsof each VAR source participating the proposed market.
Generators, capacitor banks, shunt reactors, SVCs and STATCOM devices, which areconnected to the transmission network, can bid in the annual auction. Bids includeVAR quantity and an associated price. The demand of the service is defined by the VARneeds during peak hours and valley hours. In addition, the over VAR requirements dueto contingencies are included as a new demand agent.
An optimization algorithm is used to select the VAR sources that minimize the totalsystem costs associated with the VAR management for the next year. The results ofthe optimization problem are also used to determine the payments for the selected VARsources. Payments will be based on marginal pricing in order to receive efficient localand economic signals. Charges to demand and agents responsible for contingencies aredistributed using the Cooperative Game Theory.
The correct procurement of the service needs monitoring and the definition of penaltiesin case of failing to provide the assigned VAR capacity. Penalty policy should discourageagents for bad practices, and encourage the correct procurement.
12This penalty factor was proposed in [Soler, 2001] for the secondary reserve ancillary service.
3.6. CONCLUSIONS 59
As a summary, Table 3.1 presents a comparison of different VAR capacity market pro-posals in the research literature which are characterized according to the model of theVQ service problem and the resulting economic flows. This thesis proposal presents anovel approach to the competitive procurement of the VQ service, based on an annualauction, which represents and advance over the traditional schemes based on centralizedplanning criteria. This novel competitive scheme improves the efficiency of the economicsignals which are sent to the agents involved in the VQ service. In addition, this pro-posal attempts to improve on model limitations of previous works, taking into accountthe procurement of the VQ service from different VAR sources, and their dynamic volt-age support in case of emergency operation. Moreover, the proposed scheme provideselasticity to the demand of the VQ service (Section 2.2.3.1) with the definition of a morecomplete objective function.
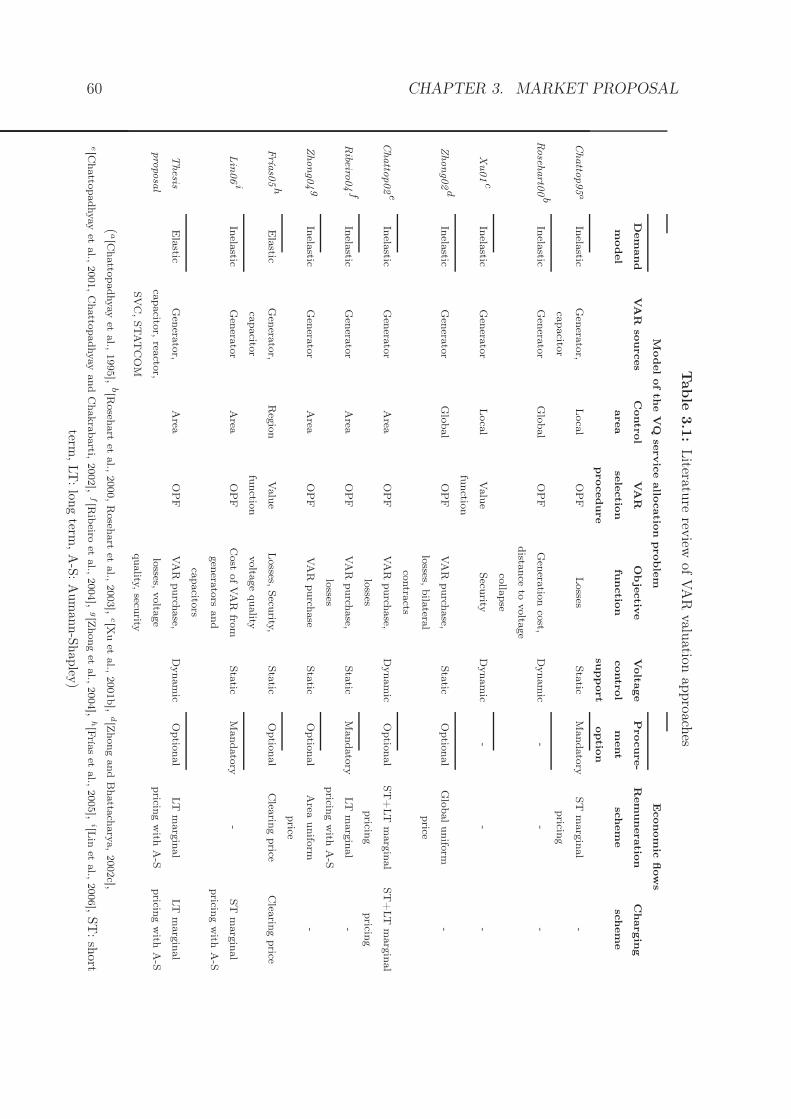
60 CHAPTER 3. MARKET PROPOSALTable
3.1
:Literatu
rerev
iewof
VA
Rvalu
ationap
proach
es
Modelofth
eV
Qse
rvic
eallo
catio
nproble
mEconom
icflow
s
Dem
and
model
VA
Rso
urces
Contr
ol
area
VA
R
sele
ctio
n
procedure
Obje
ctiv
e
functio
n
Volta
ge
contr
ol
support
Procure-
ment
optio
n
Rem
uneratio
n
schem
e
Chargin
g
schem
e
Chatto
p95
aIn
elastic
Gen
erato
r,
capacito
r
Loca
lO
PF
Losses
Sta
ticM
andato
ryST
marg
inal
pricin
g
-
Rose
hart0
0b
Inela
sticG
enera
tor
Glo
bal
OP
FG
enera
tion
cost,
dista
nce
tovolta
ge
colla
pse
Dynam
ic-
--
Xu01
cIn
elastic
Gen
erato
rLoca
lValu
e
functio
n
Secu
rityD
ynam
ic-
--
Zhong02
dIn
elastic
Gen
erato
rG
lobal
OP
FVA
Rpurch
ase,
losses,
bila
teral
contra
cts
Sta
ticO
ptio
nal
Glo
balunifo
rm
price
-
Chatto
p02
eIn
elastic
Gen
erato
rA
reaO
PF
VA
Rpurch
ase,
losses
Dynam
icO
ptio
nal
ST
+LT
marg
inal
pricin
g
ST
+LT
marg
inal
pricin
g
Ribe
iro04
fIn
elastic
Gen
erato
rA
reaO
PF
VA
Rpurch
ase,
losses
Sta
ticM
andato
ryLT
marg
inal
pricin
gw
ithA
-S
-
Zhong04
gIn
elastic
Gen
erato
rA
reaO
PF
VA
Rpurch
ase
Sta
ticO
ptio
nal
Area
unifo
rm
price
-
Fría
s05
hE
lastic
Gen
erato
r,
capacito
r
Reg
ion
Valu
e
functio
n
Losses,
Secu
rity,
volta
ge
quality
Sta
ticO
ptio
nal
Clea
ring
price
Clea
ring
price
Lin
06
iIn
elastic
Gen
erato
rA
reaO
PF
Cost
ofVA
Rfro
m
gen
erato
rsand
capacito
rs
Sta
ticM
andato
ry-
ST
marg
inal
pricin
gw
ithA
-S
Thesis
pro
posa
l
Ela
sticG
enera
tor,
capacito
r,rea
ctor,
SV
C,STAT
CO
M
Area
OP
FVA
Rpurch
ase,
losses,
volta
ge
quality,
security
Dynam
icO
ptio
nal
LT
marg
inal
pricin
gw
ithA
-S
LT
marg
inal
pricin
gw
ithA
-S
(a[C
hatto
padhyay
etal.,
1995],
b[R
oseh
art
etal.,
2000,R
oseh
art
etal.,
2003],
c[Xu
etal.,
2001b],
d[Z
hong
and
Bhatta
chary
a,2002c],
e[C
hatto
padhyay
etal.,
2001,C
hatto
padhyay
and
Chakra
barti,
2002],
f[R
ibeiro
etal.,
2004],
g[Z
hong
etal.,
2004],
h[F
rías
etal.,
2005],
i[Lin
etal.,
2006],
ST
:sh
ort
term,LT
:lo
ng
term,A
-S:A
um
ann-S
hapley
)
3.7. REFERENCES 61
3.7 References
[Alvarado and Overbye, 1999] Alvarado, F. and Overbye, T. (1999). Measuring reactivemarket power. IEEE Power Engineering Society 1999 Winter Meeting, 1:294–296.
[Aumann and Shapley, 1975] Aumann, R. J. and Shapley, L. S. (1975). Values of non-atomic games. Bull. Amer. Math. Soc. 81 (1975).
[Chattopadhyay et al., 1995] Chattopadhyay, D., Bhattacharya, K., and Parikh, J.(1995). Optimal reactive power planning and its spot-pricing: an integrated approach.IEEE Transactions on Power Systems, 10(4):2014–2020.
[Chattopadhyay and Chakrabarti, 2002] Chattopadhyay, D. and Chakrabarti, B.(2002). Reactive power planning incorporating voltage stability. International Journalof Electrical Power & Energy Systems, 24(3):185–200.
[Chattopadhyay et al., 2001] Chattopadhyay, D., Chakrabarti, B., and Read, E. (2001).Pricing for voltage stability. Power Industry Computer Applications, 2001. PICA2001. Innovative Computing for Power-Electric Energy Meets the Market. 22nd IEEEPower Engineering Society International Conference on, pages 235–240.
[Conejo et al., 2002] Conejo, A. J., Arroyo, J. M., Alguacil, N., and Guijarro, A. L.(2002). Transmission loss allocation: a comparison of different practical algorithms.IEEE Transactions on Power Systems, 17(3):571–576.
[de Mello Honorio et al., 2002] de Mello Honorio, L., de Souza, A. C. Z., de Lima, J.W. M., Torres, G. L., and Alvarado, F. (2002). Exercising reactive market powerthrough sensitivity studies and hhi. Power Engineering Society Winter Meeting, 2002.IEEE, 1.
[Frías et al., 2005] Frías, P., Soler, D., and Gómez, T. (2005). Valuation of reactivepower zonal capacity payments. Power Systems Computation Conference Proceedings,2005 Liege (Belgium), 1.
[González and Basagoiti, 1999] González, J. J. and Basagoiti, P. (1999). Spanish powerexchange market and information system designconcepts, and operating experience.Power Industry Computer Applications, 1999. PICA’99. Proceedings of the 21st 1999IEEE International Conference, pages 245–252.
[Kreps, 1990] Kreps, D. (1990). Game theory and economic modelling. Clarendon PressOxford.
[Lin et al., 2006] Lin, X. J., Yu, C. W., Xu, N., Chung, C. Y., and Wu, H. (2006).Reactive power service cost allocation using aumann-shapley method. IEE Proceedingson Generation, Transmission and Distribution, 153(5):540–546.
[REE, 1998] REE (1998). Procedimientos de operación del sistema eléctrico. Red Eléc-trica de España.
62 BIBLIOGRAPHY
[Ribeiro et al., 2004] Ribeiro, P. M., Marzano, L. G. B., Soto, J. R. O., and Melo, A.C. G. (2004). Methodology for pricing the genration reserve and the reactive powersupport as ancillary service provided by generators. In IX SEPOPE, Rio de Janeiro.
[Rosehart et al., 2000] Rosehart, W., Cañizares, C., and Quintana, V. (2000). Costs ofvoltage security in electricity markets. 2000 IEEE Power Engineering Society SummerMeeting, 4.
[Rosehart et al., 2003] Rosehart, W., Cañizares, C., and Quintana, V. (2003). Multi-objective optimal power flows to evaluate voltage security costs in power networks.IEEE Transactions on Power Systems, 18(2):578–587.
[Soler, 2001] Soler, D. (2001). Modelos regulatorios de los servicios complementarios degeneración y red en sistemas de energía eléctrica. PhD thesis, Universidad PontificiaComillas.
[Unsihuay and Saavedra, 2003] Unsihuay, C. and Saavedra, O. R. (2003). Comparativestudies on transmission loss allocation methods for competitive electricity markets.Power Tech Conference Proceedings, 2003 IEEE Bologna, 3.
[Xu et al., 2001b] Xu, W., Zhang, Y., da Silva, L. C. P., Kundur, P., and Warrack,A. A. (2001b). Valuation of dynamic reactive power support services for transmissionaccess. IEEE Transactions on Power Systems, 16(4):719–728. TY - JOUR.
[Zhong and Bhattacharya, 2002c] Zhong, J. and Bhattacharya, K. (2002c). Towarda competitive market for reactive power. IEEE Transactions on Power Systems,17(4):1206–1215.
[Zhong et al., 2004] Zhong, J., Nobile, E., Bose, A., and Bhattacharya, K. (2004). Lo-calized reactive power markets using the concept of voltage control areas. IEEETransactions on Power Systems, 19(3):1555–1561. TY - JOUR.
CHAPTER 4
VAR capacity market settlement
This chapter presents the formulation for the VAR capacity market settlement whichis proposed in the thesis dissertation. The proposed formulation selects the best
VAR capacity bids that minimize the cost of the VQ service procurement, meetingthe security and operating conditions both in a normal operation scenario and underselected system contingencies. First, the VAR capacity bids of the supplier agents areanalyzed. Then, a general description of the market auction and its theoretical basis arepresented. The mathematical formulation of the corresponding optimization problemis then described in detail. Finally, some implementation details of the VAR capacitymarket settlement are analyzed. A simple illustrative case with two buses and threegenerators is used throughout this chapter to illustrate the theoretical discussion.
The formulation presented along the next sections includes variables in small letters andparameters in capital letters.
63
64 CHAPTER 4. VAR MARKET SETTLEMENT
4.1 VAR capacity bids
The different VAR supplying agents can participate in the annual auction with bidsincluding a volume of VAR capacity and an associated price. As described in theprevious chapter, the remuneration of the service provides a compensation for the useof the purchased VAR capacity and for the loss of benefits due a reduction in the activepower output in order to increase the VAR capacity. Therefore, bids should only considerthose costs associated with the installed VAR capacity and those required for makingthe installed capacity available.
As will be presented in the next sections, the proposed market is based on long-termmarginal pricing. Under this market structure only the variable costs of the VAR ca-pacity are recognized. The adequate settlement of this market requires that the variablecost of the VAR capacity product are higher than the fixed cost (A > I in (4.1)). Ac-cording to economic theory, those markets where the capital costs are much higher thanthe variable costs (I ≫ A in (4.1)) are not competitive, as agents will be paid at theirmarginal cost (4.3), which is much lower than their average cost (4.2). Therefore, theseagents will have economic losses and will quit the market [Rothwell and Gómez, 2003]1.
TC = I + A · qa +1
2B · qa2 (4.1)
AC =TC
qa=
I
qa+ A +
1
2B · qa (4.2)
MC =d TC
d qa= A + B · qa (4.3)
where:TC Total cost associated with the VAR capacity (e)
AC, MC Average and marginal cost associated with the VARcapacity (e/Mvar)
qa Selected VAR capacity (Mvar)A, B Bid for VAR capacity (e/Mvar and e/Mvar2)
I Investment cost associated with VAR production (e)
This section first defines the structure of the VAR capacity bids of the different VARsources. Then, the mechanism to integrate these bids in the proposed VAR capacitymarket settlement is described.
1If the average cost of single a agent offering VAR capacity falls with increases in the VAR capacity,and the marginal cost is below the average cost, then there exist economies of scale. In the electricindustry there are some activities, such as networks, where the fixed cost is a high proportion of thetotal cost. This network activity is then a natural monopoly, and the design of a competitive marketwill fail to yield a market price equal to the marginal cost of production. In order to avoid marketpower in monopoly activities some regulation is required.
4.1. VAR CAPACITY BIDS 65
4.1.1 Bid definition
The proposed formulation for the bids includes a fixed term and a variable term which isproportional to the installed VAR capacity, as formulated in (4.4) (Appendix B presentsa detailed analysis of how the bids for the different agents are calculated).
Bid = A + B · qa (4.4)
• The fixed term A is expressed in e/Mvar-year and represents the variable costs formanufacturing the VAR source. In addition, the costs for the new reinforcementsin the substation and the connection to the main grid are also included in the fixedterm, as they are also proportional to the VAR capacity. Finally, the expectedpenalties of the agent for the non-fulfillment of the service can also be incorporatedin this term.
• On the other hand, the variable term B is expressed in e/Mvar2-year, and com-prises those costs which are proportional to the squared VAR capacity.
The application of the general bid structure for the VAR capacity market is discussedin the next subsections for generators and other compensation equipment.
4.1.1.1 Generators
The VAR capacity available in a generator has already been included in the installationcost of the power plant, according to the minimum technical requirements of the corre-sponding power system, and therefore is considered as a sunk cost2. The generator mayhave to undertake new investments to adapt the installation to procure the VQ service,making available the already installed VAR capacity, or to increase the VAR capacity.For instance, it can be necessary to change the transformer tap changer, to proceed witha rewind of the alternator, or to add addition static compensation. All these costs aredependent on the increase of VAR capacity and will be included in the fixed term A ofthe bid.
Moreover, the bid of the generator should include additional operating costs that are notincluded in the regulated compensation, especially those for making the VAR capacityavailable, and the possible penalties for non-supplying the selected capacity. These costsare more difficult to model and can be included in the bid using the variable term B.
Finally, the design of competitive bids for generators must take into account the variablecosts of the competing VAR sources, especially those of capacitor banks and shuntreactors.
2It is important to observe that in order to procure VAR support, the generator and transformer havebeen over-dimensioned (compared with the size of the power plant if only active power is produced),resulting in an over cost.
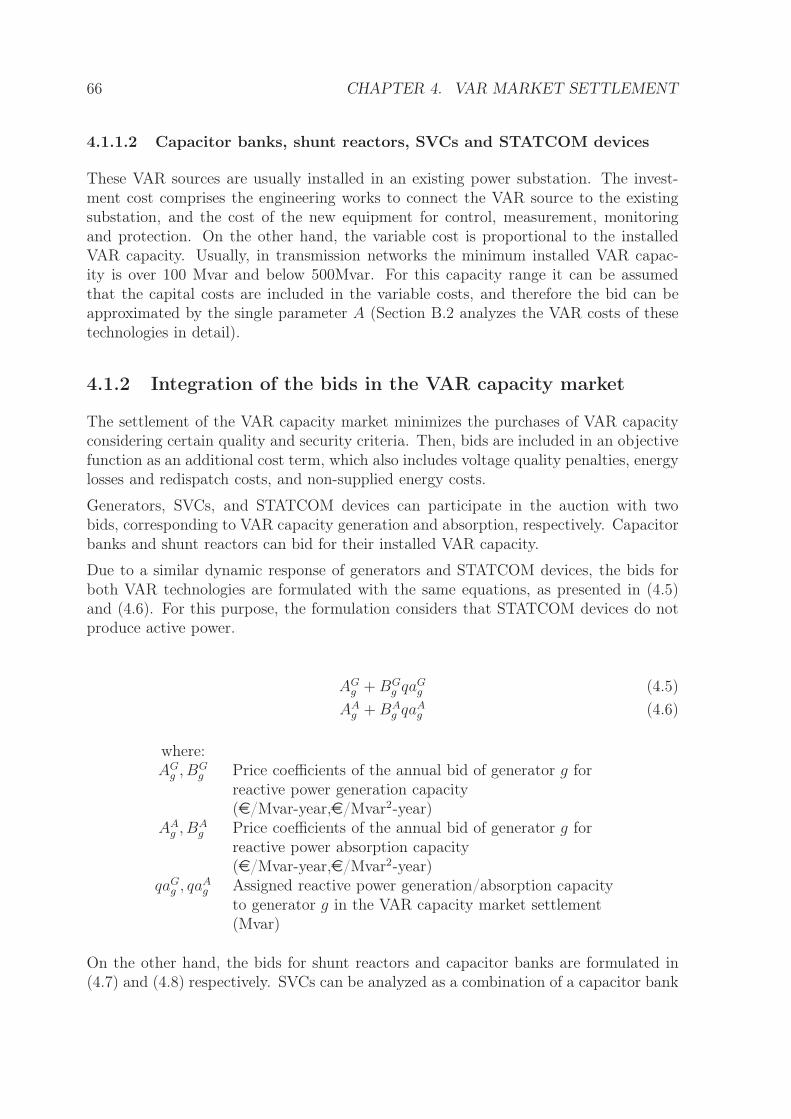
66 CHAPTER 4. VAR MARKET SETTLEMENT
4.1.1.2 Capacitor banks, shunt reactors, SVCs and STATCOM devices
These VAR sources are usually installed in an existing power substation. The invest-ment cost comprises the engineering works to connect the VAR source to the existingsubstation, and the cost of the new equipment for control, measurement, monitoringand protection. On the other hand, the variable cost is proportional to the installedVAR capacity. Usually, in transmission networks the minimum installed VAR capac-ity is over 100 Mvar and below 500Mvar. For this capacity range it can be assumedthat the capital costs are included in the variable costs, and therefore the bid can beapproximated by the single parameter A (Section B.2 analyzes the VAR costs of thesetechnologies in detail).
4.1.2 Integration of the bids in the VAR capacity market
The settlement of the VAR capacity market minimizes the purchases of VAR capacityconsidering certain quality and security criteria. Then, bids are included in an objectivefunction as an additional cost term, which also includes voltage quality penalties, energylosses and redispatch costs, and non-supplied energy costs.
Generators, SVCs, and STATCOM devices can participate in the auction with twobids, corresponding to VAR capacity generation and absorption, respectively. Capacitorbanks and shunt reactors can bid for their installed VAR capacity.
Due to a similar dynamic response of generators and STATCOM devices, the bids forboth VAR technologies are formulated with the same equations, as presented in (4.5)and (4.6). For this purpose, the formulation considers that STATCOM devices do notproduce active power.
AGg + BG
g qaGg (4.5)
AAg + BA
g qaAg (4.6)
where:AG
g , BGg Price coefficients of the annual bid of generator g for
reactive power generation capacity(e/Mvar-year,e/Mvar2-year)
AAg , BA
g Price coefficients of the annual bid of generator g forreactive power absorption capacity(e/Mvar-year,e/Mvar2-year)
qaGg , qaA
g Assigned reactive power generation/absorption capacityto generator g in the VAR capacity market settlement(Mvar)
On the other hand, the bids for shunt reactors and capacitor banks are formulated in(4.7) and (4.8) respectively. SVCs can be analyzed as a combination of a capacitor bank
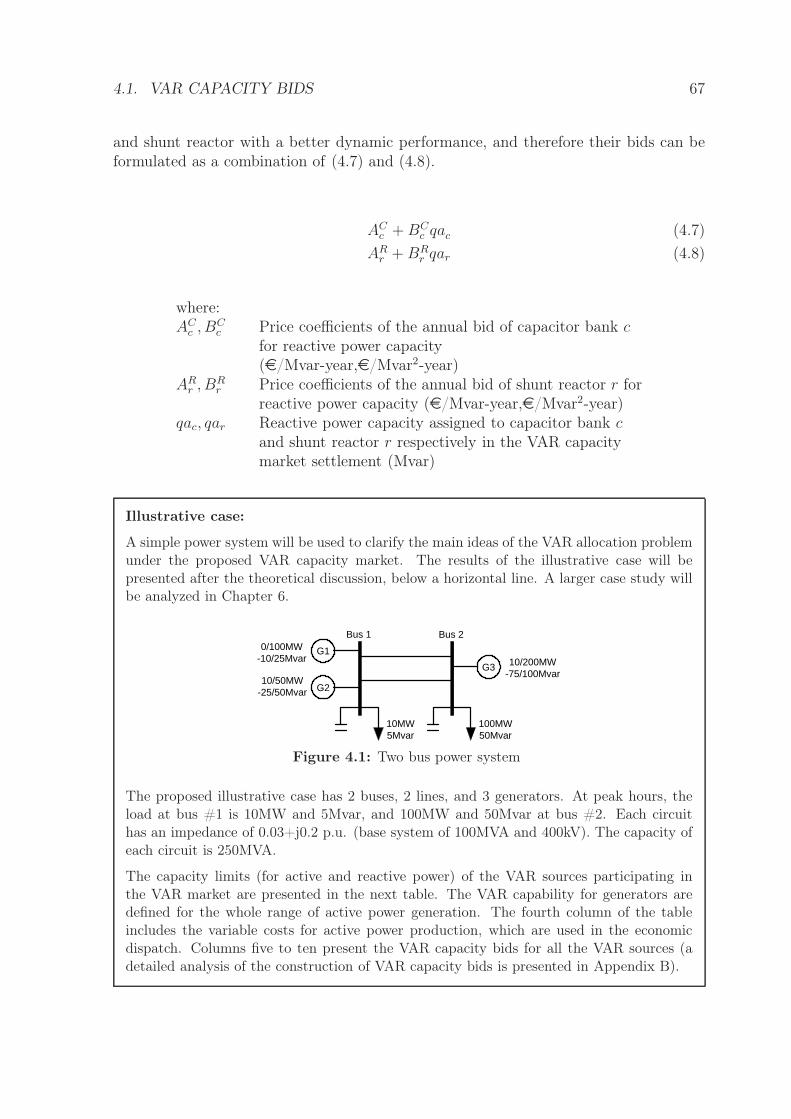
4.1. VAR CAPACITY BIDS 67
and shunt reactor with a better dynamic performance, and therefore their bids can beformulated as a combination of (4.7) and (4.8).
ACc + BC
c qac (4.7)
ARr + BR
r qar (4.8)
where:AC
c , BCc Price coefficients of the annual bid of capacitor bank c
for reactive power capacity(e/Mvar-year,e/Mvar2-year)
ARr , BR
r Price coefficients of the annual bid of shunt reactor r forreactive power capacity (e/Mvar-year,e/Mvar2-year)
qac, qar Reactive power capacity assigned to capacitor bank cand shunt reactor r respectively in the VAR capacitymarket settlement (Mvar)
Illustrative case:
A simple power system will be used to clarify the main ideas of the VAR allocation problemunder the proposed VAR capacity market. The results of the illustrative case will bepresented after the theoretical discussion, below a horizontal line. A larger case study willbe analyzed in Chapter 6.
Bus 2Bus 1
G2
G1
G3
100MW50Mvar
10MW5Mvar
10/200MW-75/100Mvar
0/100MW-10/25Mvar
10/50MW-25/50Mvar
Figure 4.1: Two bus power system
The proposed illustrative case has 2 buses, 2 lines, and 3 generators. At peak hours, theload at bus #1 is 10MW and 5Mvar, and 100MW and 50Mvar at bus #2. Each circuithas an impedance of 0.03+j0.2 p.u. (base system of 100MVA and 400kV). The capacity ofeach circuit is 250MVA.
The capacity limits (for active and reactive power) of the VAR sources participating inthe VAR market are presented in the next table. The VAR capability for generators aredefined for the whole range of active power generation. The fourth column of the tableincludes the variable costs for active power production, which are used in the economicdispatch. Columns five to ten present the VAR capacity bids for all the VAR sources (adetailed analysis of the construction of VAR capacity bids is presented in Appendix B).
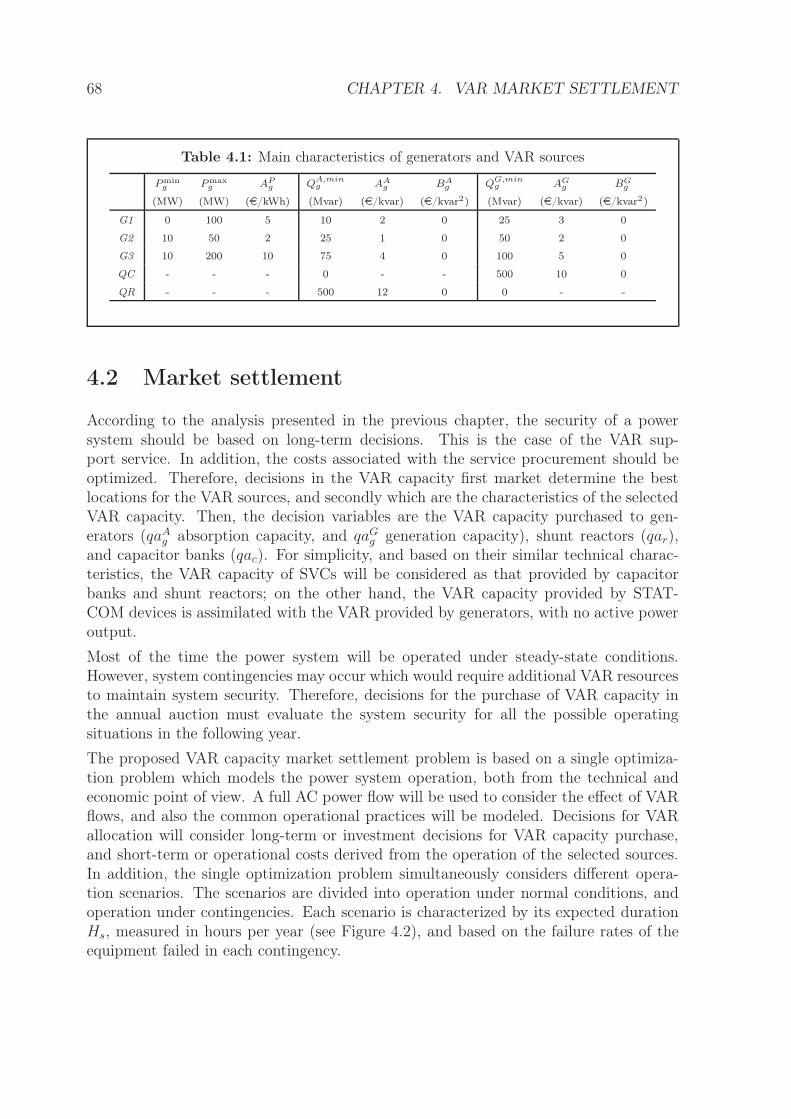
68 CHAPTER 4. VAR MARKET SETTLEMENT
Table 4.1: Main characteristics of generators and VAR sources
Pming Pmax
g APg QA,min
g AAg BA
g QG,ming AG
g BGg
(MW) (MW) (e/kWh) (Mvar) (e/kvar) (e/kvar2) (Mvar) (e/kvar) (e/kvar2)
G1 0 100 5 10 2 0 25 3 0
G2 10 50 2 25 1 0 50 2 0
G3 10 200 10 75 4 0 100 5 0
QC - - - 0 - - 500 10 0
QR - - - 500 12 0 0 - -
4.2 Market settlement
According to the analysis presented in the previous chapter, the security of a powersystem should be based on long-term decisions. This is the case of the VAR sup-port service. In addition, the costs associated with the service procurement should beoptimized. Therefore, decisions in the VAR capacity first market determine the bestlocations for the VAR sources, and secondly which are the characteristics of the selectedVAR capacity. Then, the decision variables are the VAR capacity purchased to gen-erators (qaA
g absorption capacity, and qaGg generation capacity), shunt reactors (qar),
and capacitor banks (qac). For simplicity, and based on their similar technical charac-teristics, the VAR capacity of SVCs will be considered as that provided by capacitorbanks and shunt reactors; on the other hand, the VAR capacity provided by STAT-COM devices is assimilated with the VAR provided by generators, with no active poweroutput.
Most of the time the power system will be operated under steady-state conditions.However, system contingencies may occur which would require additional VAR resourcesto maintain system security. Therefore, decisions for the purchase of VAR capacity inthe annual auction must evaluate the system security for all the possible operatingsituations in the following year.
The proposed VAR capacity market settlement problem is based on a single optimiza-tion problem which models the power system operation, both from the technical andeconomic point of view. A full AC power flow will be used to consider the effect of VARflows, and also the common operational practices will be modeled. Decisions for VARallocation will consider long-term or investment decisions for VAR capacity purchase,and short-term or operational costs derived from the operation of the selected sources.In addition, the single optimization problem simultaneously considers different opera-tion scenarios. The scenarios are divided into operation under normal conditions, andoperation under contingencies. Each scenario is characterized by its expected durationHs, measured in hours per year (see Figure 4.2), and based on the failure rates of theequipment failed in each contingency.
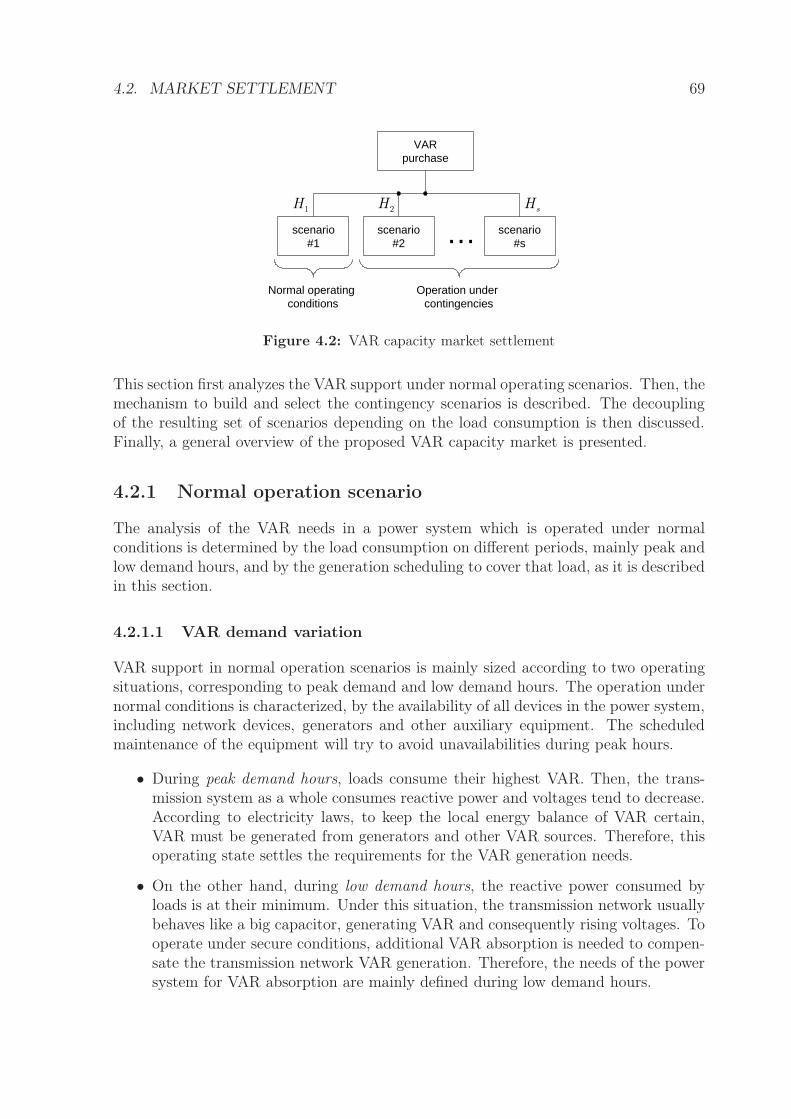
4.2. MARKET SETTLEMENT 69
VAR purchase
scenario#1
scenario#2
scenario#s …
Normal operating conditions
Operation under contingencies
1H
2H
sH
Figure 4.2: VAR capacity market settlement
This section first analyzes the VAR support under normal operating scenarios. Then, themechanism to build and select the contingency scenarios is described. The decouplingof the resulting set of scenarios depending on the load consumption is then discussed.Finally, a general overview of the proposed VAR capacity market is presented.
4.2.1 Normal operation scenario
The analysis of the VAR needs in a power system which is operated under normalconditions is determined by the load consumption on different periods, mainly peak andlow demand hours, and by the generation scheduling to cover that load, as it is describedin this section.
4.2.1.1 VAR demand variation
VAR support in normal operation scenarios is mainly sized according to two operatingsituations, corresponding to peak demand and low demand hours. The operation undernormal conditions is characterized, by the availability of all devices in the power system,including network devices, generators and other auxiliary equipment. The scheduledmaintenance of the equipment will try to avoid unavailabilities during peak hours.
• During peak demand hours, loads consume their highest VAR. Then, the trans-mission system as a whole consumes reactive power and voltages tend to decrease.According to electricity laws, to keep the local energy balance of VAR certain,VAR must be generated from generators and other VAR sources. Therefore, thisoperating state settles the requirements for the VAR generation needs.
• On the other hand, during low demand hours, the reactive power consumed byloads is at their minimum. Under this situation, the transmission network usuallybehaves like a big capacitor, generating VAR and consequently rising voltages. Tooperate under secure conditions, additional VAR absorption is needed to compen-sate the transmission network VAR generation. Therefore, the needs of the powersystem for VAR absorption are mainly defined during low demand hours.
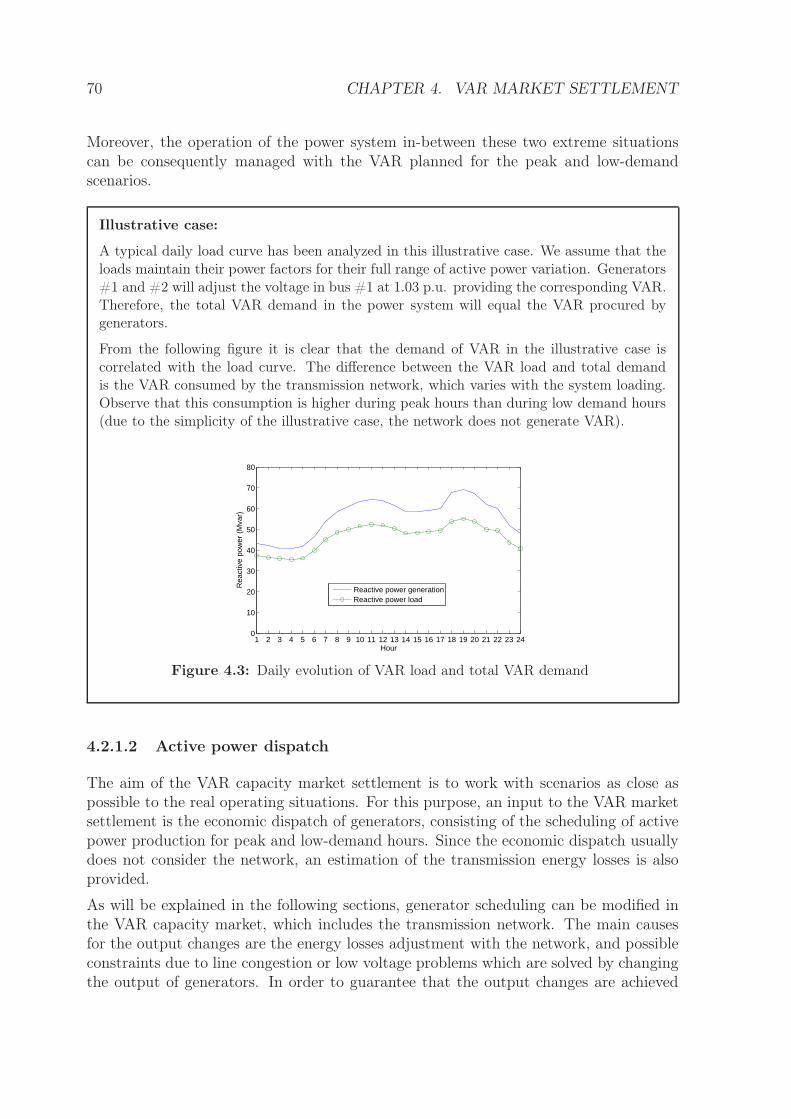
70 CHAPTER 4. VAR MARKET SETTLEMENT
Moreover, the operation of the power system in-between these two extreme situationscan be consequently managed with the VAR planned for the peak and low-demandscenarios.
Illustrative case:
A typical daily load curve has been analyzed in this illustrative case. We assume that theloads maintain their power factors for their full range of active power variation. Generators#1 and #2 will adjust the voltage in bus #1 at 1.03 p.u. providing the corresponding VAR.Therefore, the total VAR demand in the power system will equal the VAR procured bygenerators.
From the following figure it is clear that the demand of VAR in the illustrative case iscorrelated with the load curve. The difference between the VAR load and total demandis the VAR consumed by the transmission network, which varies with the system loading.Observe that this consumption is higher during peak hours than during low demand hours(due to the simplicity of the illustrative case, the network does not generate VAR).
1 2 3 4 5 6 7 8 9 10 11 12 13 14 15 16 17 18 19 20 21 22 23 240
10
20
30
40
50
60
70
80
Hour
Rea
ctiv
e po
wer
(M
var)
Reactive power generationReactive power load
Figure 4.3: Daily evolution of VAR load and total VAR demand
4.2.1.2 Active power dispatch
The aim of the VAR capacity market settlement is to work with scenarios as close aspossible to the real operating situations. For this purpose, an input to the VAR marketsettlement is the economic dispatch of generators, consisting of the scheduling of activepower production for peak and low-demand hours. Since the economic dispatch usuallydoes not consider the network, an estimation of the transmission energy losses is alsoprovided.
As will be explained in the following sections, generator scheduling can be modified inthe VAR capacity market, which includes the transmission network. The main causesfor the output changes are the energy losses adjustment with the network, and possibleconstraints due to line congestion or low voltage problems which are solved by changingthe output of generators. In order to guarantee that the output changes are achieved
4.2. MARKET SETTLEMENT 71
at minimum cost, the variable cost of generators are also an input to the VAR capacitymarket settlement.
Illustrative case:
In the illustrative case, a economic dispatch using generation variable costs APg is carried
out, and the output of generators in the base case is settled P 0g . Generator #1 is dispatched
at 50MW, and 50MW for generator #2. As described in the next section, generator #3 is
started-up at its minimum output in order to prevent non-supplied energy in the case of
generator #2 unavailability. Therefore, the resulting economic dispatch is, 50MW, 50MW
and 10MW for generators #1, #2 and #3 respectively. Since generator #1 is the marginal
one, it will cover the energy losses.
4.2.2 Contingency scenarios
Contingency situations generally require additional VAR capacity with an adequatedynamic VAR support in order to guarantee system security. This section describeshow contingency scenarios are built and characterized, and also presents a procedure toselect the critical scenarios for the proposed VAR capacity market.
4.2.2.1 Main characteristics
The VAR capacity market settlement also considers certain probable contingencies in thepower system. Contingencies can be the result of single or multiple changes in the normaloperating conditions, such as generator outages, transmission equipment unavailability,or high changes in load. Each contingency is characterized by a set of states of thedifferent power system devices and an associated probability of occurrence. For theproposed optimization problem, the failure probability will be calculated separately forpeak and low demand hours.
We assume that under contingencies the power system reacts using the primary andsecondary control mechanisms. Both active power-frequency control and reactive power-voltage control correct the deviations in the system variables. The speed governors andthe AGC (Automatic Generation Control) modify the active power output of selectedgenerators in order to cover the active power imbalance due to generation outage or loadvariation. The AVR (Automatic Voltage Regulator) and the secondary voltage controlloop (if installed) adjust the position of VAR resources to maintain voltages within thesecurity range.
The proposed formulation for the VAR capacity market will include a contingency inthe optimization problem with additional constraints. The number of contingencies tobe formulated is restricted by the characteristics of the solver and software tools used tosolve the optimization problem. The number of possible operating scenarios resultingfor the state of i devices with a non-zero failure rate will be 2i.
72 CHAPTER 4. VAR MARKET SETTLEMENT
For real power systems the number of possible scenarios would be very high, and more-over not all of these possible scenarios are worth analyzing, as their associated impacton the VAR investments is marginal. Therefore, in order to simplify the analysis, a pre-selection of the most important situations is required before including the contingencyscenarios in the formulation.
The set of contingencies included in the VAR capacity market model are those with thehighest impact on VAR requirements. A first approach to select the contingencies wouldbe to rely on the intuition and experience of the SO, who can effectively rank the differentcontingencies in the power system. However, there are automatic contingency selectionalgorithms that can assist the SO to select the most critical contingencies, by providingan objective criterion for this assessment [Ejebe and Wollenberg, 1979]. These methodsare known as contingency screening and ranking [Ekwue, 1991, Ejebe et al., 1995], andare usually based on the accurate and fast estimation of the voltage stability marginfor all the possible contingencies. The approach used in this thesis dissertation is theMonte-Carlo simulation methodology [von Neumann, 1951]. Under this approach theproposed formulation for the VAR capacity market settlement is solved for differentscenarios defined by the failure rates of the power system devices. This method issimple, and efficiently ranks the contingencies according to their effect on the total costsof the VAR capacity market.
4.2.2.2 Contingency selection
The Monte-Carlo simulation generates a set of random numbers that will define a pos-sible operating situation [Law and Kelton, 1997]. To determine the availability of eachpower system device, a random variable with uniform distribution [0,1] is generatedfor each device. A mixed congruential generator is used to generate the set of randomnumbers xn,
xn+1 = (a · xn + c) [mod(m)] (4.9)
un =xn
m(4.10)
where:a, c, m Positive integer numbers, with a < m, c < m
mod(m) A modulo operation finds the remainder of division ofone number by another
xn Random numberun Random number with a uniform distribution
Random numbers are obtained as a modulo operation involving the previous randomnumber. The number of possible different random numbers to be generated is definedby m. Then, if the random value un is lower than the probability failure of the device
4.2. MARKET SETTLEMENT 73
f (i), that power system device will be unavailable. If the random value is higher thanthe probability failure, then the device will be available.
Once all the possible scenarios are generated, the settlement of the VAR capacity marketand its cost are obtained for each single scenario using the formulation presented in thefollowing sections. Then, the associated costs for each scenario are classified from thehighest to the lowest, and those scenarios with the highest impact on the costs of theVAR market are selected. Finally, the settlement of the VAR capacity market is obtainedsimultaneously including all the selected scenarios.
Illustrative case:
For this illustrative case, the equipment that defines the possible operating scenarios con-sists of 2 generators and a circuit of the transmission line. The next table presents thetotal number of scenarios is 23 = 8, corresponding to the device states (On) available, and(Off) unavailable.
Table 4.2: Scenario generation
Scenario # 1 2 3 4 5 6 7 8
Single circuit On Off On On Off On Off Off
Generator 2 On On Off On Off Off On Off
Generator 3 On On On Off On Off Off Off
An example of the contingency selection for peak hours is presented with an estimatedduration of 1000 hours-year. The probability failure of the different devices considered ispresented in the next table.
Table 4.3: Failure rates in the illustrative case
Failure rate
Single circuit 0.0094
Generator 2 0.0157
Generator 3 0.0315
A Monte Carlo simulation generated 10000 possible operating scenarios using a uni-form distribution. A random number generator based on Coveyou & MacPherson[Carrasco and Fernández, 1996, Coveyou and Macpherson, 1967] is used, which is definedby a = 56, c = 1, m = 235. The equivalent hours of occurrence of each scenario areobtained by multiplying its probability times the total number of peak hours per year.
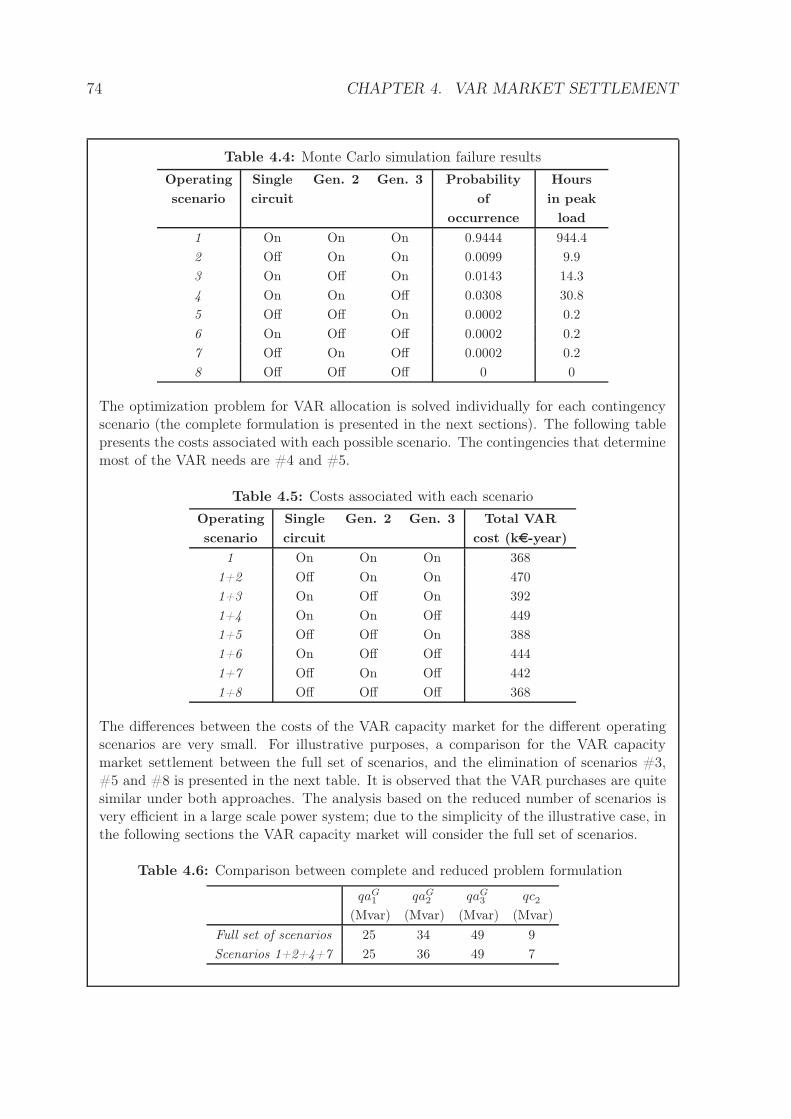
74 CHAPTER 4. VAR MARKET SETTLEMENT
Table 4.4: Monte Carlo simulation failure results
Operating
scenario
Single
circuit
Gen. 2 Gen. 3 Probability
of
occurrence
Hours
in peak
load
1 On On On 0.9444 944.4
2 Off On On 0.0099 9.9
3 On Off On 0.0143 14.3
4 On On Off 0.0308 30.8
5 Off Off On 0.0002 0.2
6 On Off Off 0.0002 0.2
7 Off On Off 0.0002 0.2
8 Off Off Off 0 0
The optimization problem for VAR allocation is solved individually for each contingencyscenario (the complete formulation is presented in the next sections). The following tablepresents the costs associated with each possible scenario. The contingencies that determinemost of the VAR needs are #4 and #5.
Table 4.5: Costs associated with each scenario
Operating
scenario
Single
circuit
Gen. 2 Gen. 3 Total VAR
cost (ke-year)
1 On On On 368
1+2 Off On On 470
1+3 On Off On 392
1+4 On On Off 449
1+5 Off Off On 388
1+6 On Off Off 444
1+7 Off On Off 442
1+8 Off Off Off 368
The differences between the costs of the VAR capacity market for the different operatingscenarios are very small. For illustrative purposes, a comparison for the VAR capacitymarket settlement between the full set of scenarios, and the elimination of scenarios #3,#5 and #8 is presented in the next table. It is observed that the VAR purchases are quitesimilar under both approaches. The analysis based on the reduced number of scenarios isvery efficient in a large scale power system; due to the simplicity of the illustrative case, inthe following sections the VAR capacity market will consider the full set of scenarios.
Table 4.6: Comparison between complete and reduced problem formulation
qaG1 qaG
2 qaG3 qc2
(Mvar) (Mvar) (Mvar) (Mvar)
Full set of scenarios 25 34 49 9
Scenarios 1+2+4+7 25 36 49 7
4.2. MARKET SETTLEMENT 75
4.2.3 VAR allocation problem decoupling
For the sake of simplicity, it seems reasonable to divide the VAR capacity market settle-ment into two independent sub-problems, associated with peak and low demand hours.The reason for this decoupling is twofold:
• The total VAR demand in each power area clearly depends on the load consump-tion, as was presented in Section 4.2.1.1.
• The generation dispatch and the state of the different transmission devices alsodepend on the load period. This consideration is critical as it defines the VARcapacity available in each period, mostly determined by the generation units.
Then, a first sub-problem will model the operating situations associated with peak hours,including generation dispatch, VAR load, and the critical contingencies for that period.This first sub-problem will mainly determine the requirements for VAR generation allo-cation. On the other hand, a second sub-problem will model operating situations asso-ciated with low demand hours, defined by the generation dispatch and network devicesstates, together with the critical contingencies for that period. The second sub-problemwill determine a VAR generation allocation (the capacity allocated will be usually lowerthan the requirements in peak hours) and, if necessary, the VAR absorption needs.
The impact of contingencies on VAR needs clearly depends on the load volume. Forexample, a line trip in peak load will usually need more VAR as the power flow in theneighboring lines will increase. However, a trip of the same line during low demandhours may improve voltages, as the network VAR generation is reduced.
Then, the calculation of the VAR needs for a whole year is based on the needs in twonormal operating scenarios for peak and low demand hours. It is assumed that in otherload situations, mostly plain hours, the VAR needs are covered by the two extremescenarios. This simplification may lead to a sub-optimal VAR allocation, as the bestdecision should be taken in the formulation that includes all load periods. However, inpractice, the difference in the optimum solution between both alternatives is very lowcompared with the simplicity in the formulation and the analysis of the results.
4.2.4 General overview of the market proposal
A summary of the methodology used for the settlement of the VAR capacity marketis presented in Figure 4.4. First, the bids of the different VAR supplying agents arereceived by the SO, both for VAR capacity generation and absorption. Then, the SOdefines the demand of the VAR, based on the operating conditions for peak and low-demand hours. Additionally, the failure rates of the power system devices settle thepossible contingency scenarios, which are then filtered according to their single impacton the VAR market cost. Finally, the SO selects the optimal bids that minimize theshort term and long term costs associated with the VQ service. For this purpose, the
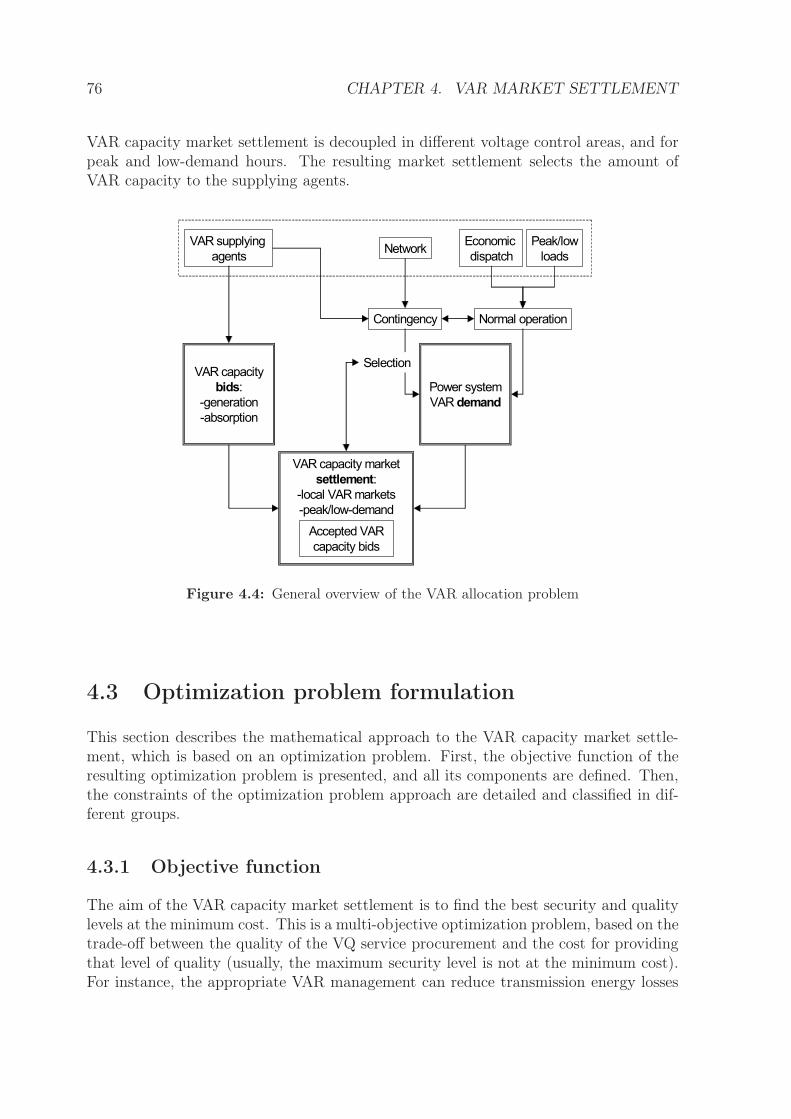
76 CHAPTER 4. VAR MARKET SETTLEMENT
VAR capacity market settlement is decoupled in different voltage control areas, and forpeak and low-demand hours. The resulting market settlement selects the amount ofVAR capacity to the supplying agents.
VAR capacity
bids:
-generation
-absorption
VAR capacity market
settlement:
-local VAR markets
-peak/low-demand
Power system
VAR demand
Accepted VAR
capacity bids
Contingency
VAR supplying
agents
Peak/low
loadsNetwork
Normal operation
Economic
dispatch
Selection
Figure 4.4: General overview of the VAR allocation problem
4.3 Optimization problem formulation
This section describes the mathematical approach to the VAR capacity market settle-ment, which is based on an optimization problem. First, the objective function of theresulting optimization problem is presented, and all its components are defined. Then,the constraints of the optimization problem approach are detailed and classified in dif-ferent groups.
4.3.1 Objective function
The aim of the VAR capacity market settlement is to find the best security and qualitylevels at the minimum cost. This is a multi-objective optimization problem, based on thetrade-off between the quality of the VQ service procurement and the cost for providingthat level of quality (usually, the maximum security level is not at the minimum cost).For instance, the appropriate VAR management can reduce transmission energy losses
4.3. OPTIMIZATION PROBLEM FORMULATION 77
by increasing the voltage level, which additionally results in a better voltage quality fordistributors. Moreover, by acquiring a certain level of VAR capacity, above that usedunder normal operation, we can guarantee the security of the power system in the caseof a contingency. Finally, some generator units can be redispatched, by connecting themor decreasing their output, in order to make more VAR capacity available to the powersystem, instead of acquiring static VAR compensation capacity.
Then, the objective function of the VAR capacity market settlement is formulated as thesum of the costs for purchasing VAR capacity, plus the expected payments for the VARcapacity use, the energy losses change, the generation redispatch costs, and penaltiesdue to voltage quality, and non-supplied energy (4.11).
min CQC + CQE + CV + CD + CP (4.11)
where:CQC Annual costs associated with the procurement of VAR
capacity (e-year)CQE Expected annual costs of the regulated payment for
VAR capacity use (e-year)CV Expected annual costs for voltage deviations (e-year)CD Expected annual costs of non-supplied energy (e-year)CP Expected annual costs of generation redispatch (e-year)
The different cost terms in the objective function are described in the following subsec-tions: (i) VAR capacity purchase, (ii) regulated VAR energy compensation, (iii) voltagedeviation costs and non-supplied energy, and (iv) active power dispatch and energylosses.
4.3.1.1 VAR capacity purchase
The cost for the assignment of VAR capacity is given by equation (4.12). First, thecost for the purchase of VAR capacity to generators and STATCOM devices is definedfor both VAR generation capacity and VAR absorption capacity. The cost is obtainedas the allocated VAR capacity times the bid price for that selected capacity. On theother hand, the cost associated with the purchase of capacity to capacitor banks, shuntreactors and SVCs has been modeled as their bid price times their assigned capacity.
CQC =∑
g
qaGg
(
AGg + BG
g qaGg
)
+∑
g
qaAg
(
AAg + BA
g qaAg
)
∑
c
qac
(
ACc + BC
c qac
)
+∑
r
qar
(
ARr + BR
r qar
)(4.12)
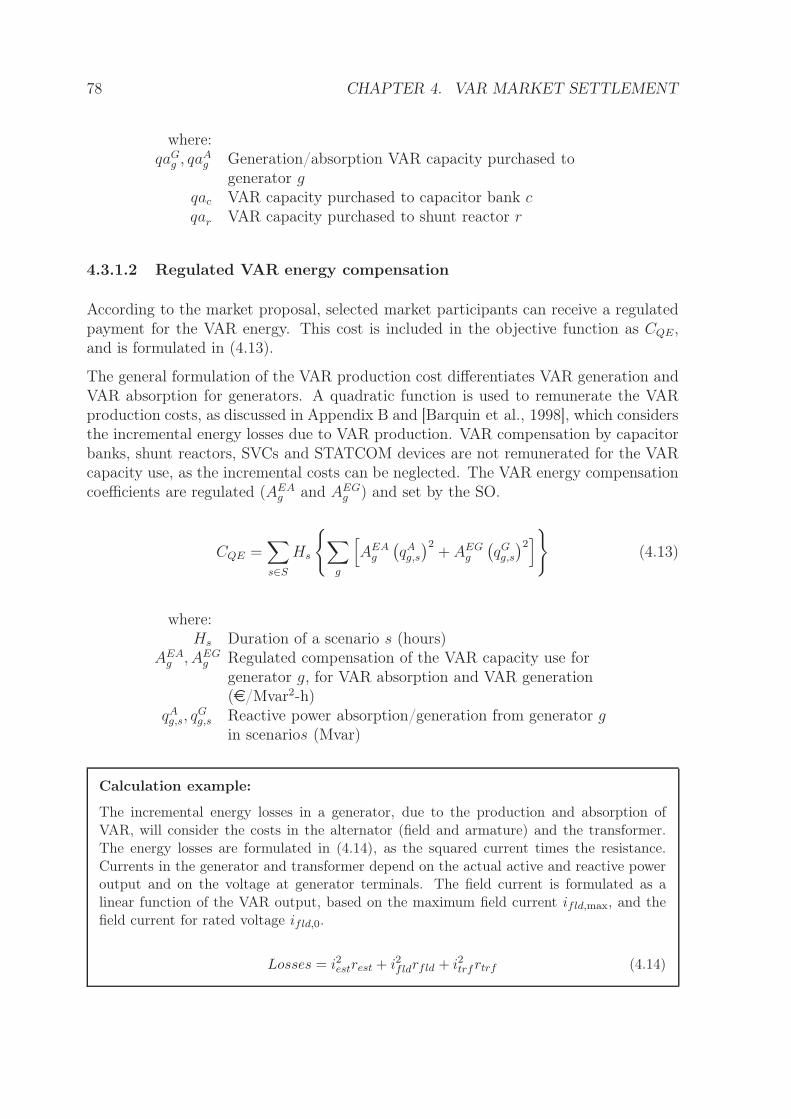
78 CHAPTER 4. VAR MARKET SETTLEMENT
where:qaG
g , qaAg Generation/absorption VAR capacity purchased to
generator gqac VAR capacity purchased to capacitor bank cqar VAR capacity purchased to shunt reactor r
4.3.1.2 Regulated VAR energy compensation
According to the market proposal, selected market participants can receive a regulatedpayment for the VAR energy. This cost is included in the objective function as CQE,and is formulated in (4.13).
The general formulation of the VAR production cost differentiates VAR generation andVAR absorption for generators. A quadratic function is used to remunerate the VARproduction costs, as discussed in Appendix B and [Barquin et al., 1998], which considersthe incremental energy losses due to VAR production. VAR compensation by capacitorbanks, shunt reactors, SVCs and STATCOM devices are not remunerated for the VARcapacity use, as the incremental costs can be neglected. The VAR energy compensationcoefficients are regulated (AEA
g and AEGg ) and set by the SO.
CQE =∑
s∈S
Hs
∑
g
[
AEAg
(
qAg,s
)2+ AEG
g
(
qGg,s
)2]
(4.13)
where:Hs Duration of a scenario s (hours)
AEAg , AEG
g Regulated compensation of the VAR capacity use forgenerator g, for VAR absorption and VAR generation(e/Mvar2-h)
qAg,s, q
Gg,s Reactive power absorption/generation from generator g
in scenarios (Mvar)
Calculation example:
The incremental energy losses in a generator, due to the production and absorption ofVAR, will consider the costs in the alternator (field and armature) and the transformer.The energy losses are formulated in (4.14), as the squared current times the resistance.Currents in the generator and transformer depend on the actual active and reactive poweroutput and on the voltage at generator terminals. The field current is formulated as alinear function of the VAR output, based on the maximum field current ifld,max, and thefield current for rated voltage ifld,0.
Losses = i2estrest + i2fldrfld + i2trfrtrf (4.14)
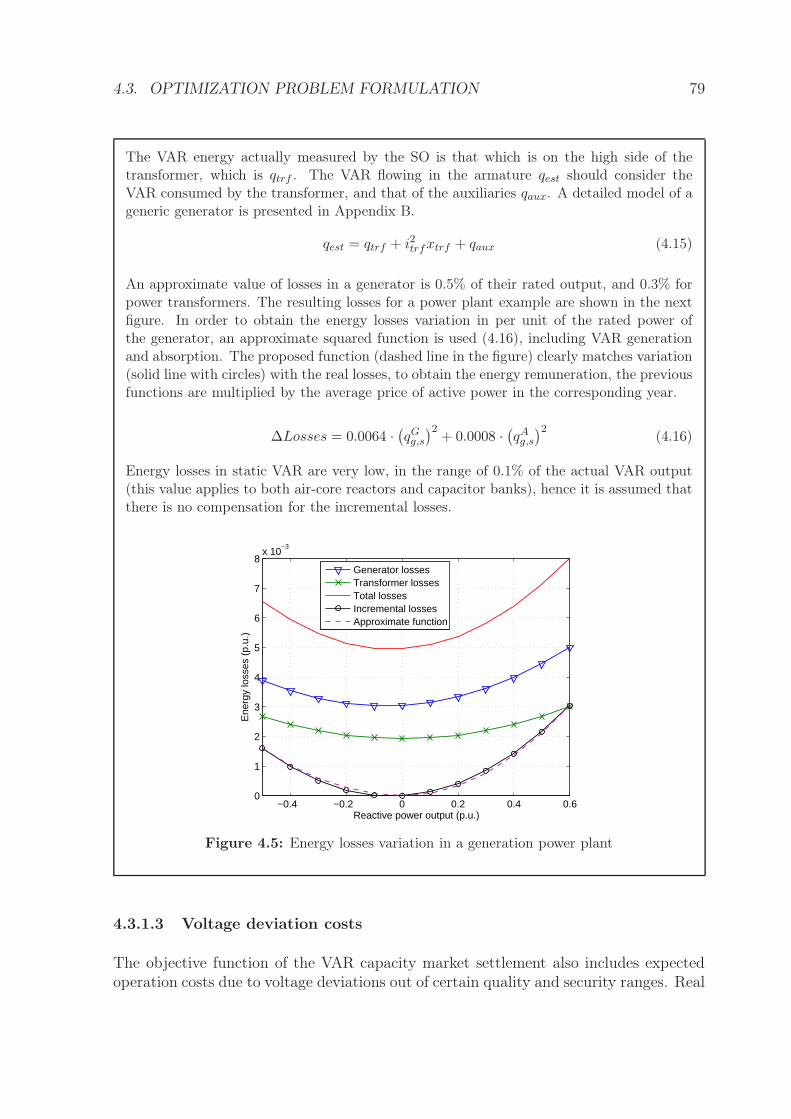
4.3. OPTIMIZATION PROBLEM FORMULATION 79
The VAR energy actually measured by the SO is that which is on the high side of thetransformer, which is qtrf . The VAR flowing in the armature qest should consider theVAR consumed by the transformer, and that of the auxiliaries qaux. A detailed model of ageneric generator is presented in Appendix B.
qest = qtrf + i2trfxtrf + qaux (4.15)
An approximate value of losses in a generator is 0.5% of their rated output, and 0.3% forpower transformers. The resulting losses for a power plant example are shown in the nextfigure. In order to obtain the energy losses variation in per unit of the rated power ofthe generator, an approximate squared function is used (4.16), including VAR generationand absorption. The proposed function (dashed line in the figure) clearly matches variation(solid line with circles) with the real losses, to obtain the energy remuneration, the previousfunctions are multiplied by the average price of active power in the corresponding year.
∆Losses = 0.0064 ·(
qGg,s
)2+ 0.0008 ·
(
qAg,s
)2(4.16)
Energy losses in static VAR are very low, in the range of 0.1% of the actual VAR output(this value applies to both air-core reactors and capacitor banks), hence it is assumed thatthere is no compensation for the incremental losses.
−0.4 −0.2 0 0.2 0.4 0.60
1
2
3
4
5
6
7
8x 10
−3
Reactive power output (p.u.)
Ene
rgy
loss
es (
p.u.
)
Generator lossesTransformer lossesTotal lossesIncremental lossesApproximate function
Figure 4.5: Energy losses variation in a generation power plant
4.3.1.3 Voltage deviation costs
The objective function of the VAR capacity market settlement also includes expectedoperation costs due to voltage deviations out of certain quality and security ranges. Real
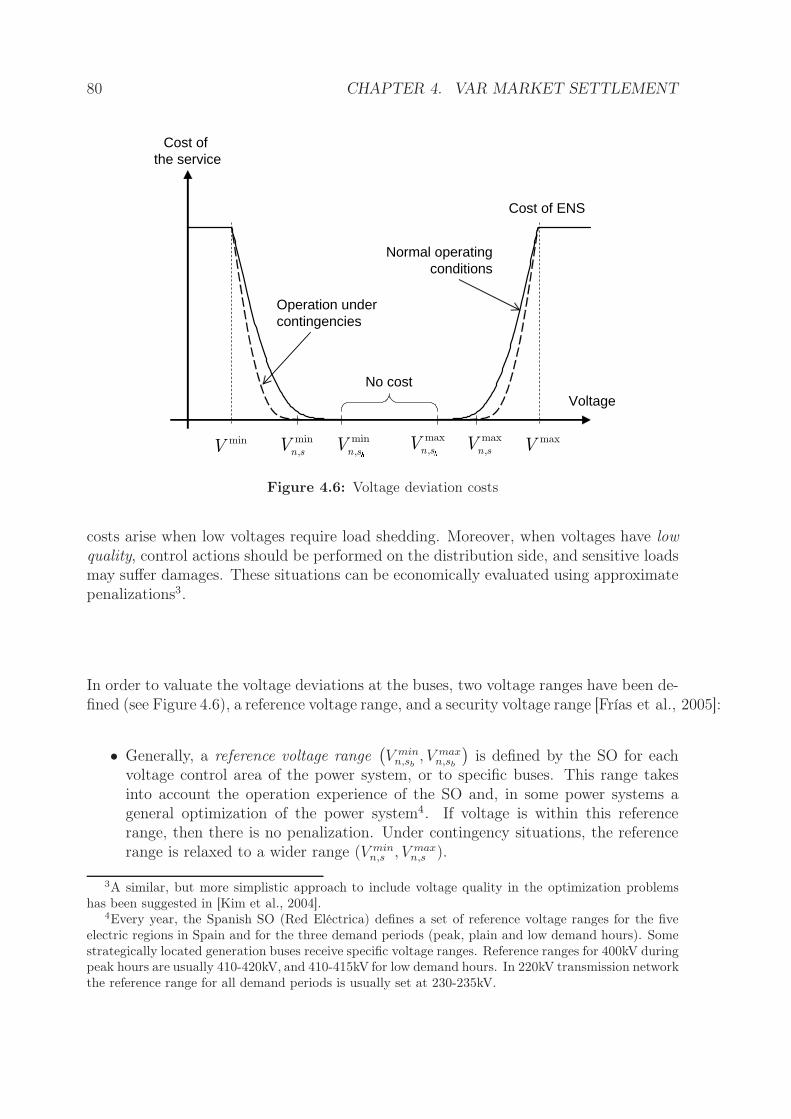
80 CHAPTER 4. VAR MARKET SETTLEMENT
min
, n sV
max
, n sVmin
Vmax
V
Cost of ENS
Cost of the service
VoltageNo cost
min
,n sV
max
,n sV
Operation undercontingencies
Normal operatingconditions
Figure 4.6: Voltage deviation costs
costs arise when low voltages require load shedding. Moreover, when voltages have lowquality, control actions should be performed on the distribution side, and sensitive loadsmay suffer damages. These situations can be economically evaluated using approximatepenalizations3.
In order to valuate the voltage deviations at the buses, two voltage ranges have been de-fined (see Figure 4.6), a reference voltage range, and a security voltage range [Frías et al., 2005]:
• Generally, a reference voltage range(
V minn,sb
, V maxn,sb
)
is defined by the SO for eachvoltage control area of the power system, or to specific buses. This range takesinto account the operation experience of the SO and, in some power systems ageneral optimization of the power system4. If voltage is within this referencerange, then there is no penalization. Under contingency situations, the referencerange is relaxed to a wider range (V min
n,s , V maxn,s ).
3A similar, but more simplistic approach to include voltage quality in the optimization problemshas been suggested in [Kim et al., 2004].
4Every year, the Spanish SO (Red Eléctrica) defines a set of reference voltage ranges for the fiveelectric regions in Spain and for the three demand periods (peak, plain and low demand hours). Somestrategically located generation buses receive specific voltage ranges. Reference ranges for 400kV duringpeak hours are usually 410-420kV, and 410-415kV for low demand hours. In 220kV transmission networkthe reference range for all demand periods is usually set at 230-235kV.
4.3. OPTIMIZATION PROBLEM FORMULATION 81
• For security reasons, and based on engineering practices, voltage in the transmis-sion network should be within a certain security range (V min, V max). If voltageis out of this range, low voltage relays may disconnect load to avoid a local orgeneral blackout of the power system. The load shedding cost is formulated in(4.17) using a penalty factor AD. This coefficient is usually defined by the En-ergy Regulator5, and is associated with the active non-supplied energy. Therefore,there is an efficient cost signal for voltages to be within the security range.
CD = AD
∑
s
[
Hs
∑
n
(dn,sPDn)
]
(4.17)
where:AD Penalty for the non-supplied energy (e/MWh)dn,s Continuous variable [0-1] that represents the portion of
energy not supplied at bus n in scenario sPDn Active power demand at bus n (MW)
• For voltages not in the reference range, but within the security band, a quadraticpenalty is proposed. This cost represents the economic impact on the distributorbusiness due to having one or another voltage in the supply point (a detailedanalysis is presented in Appendix C) shows the importance that the distributorfeels for a certain voltage value. The voltage value function is defined by theoperation costs incurred by the distribution utilities to maintain voltages in thecustomers side within admissible ranges. If no control action were provided, thenthere would be a cost associated to the loss of voltage quality for the load connecteddownstream. Therefore, the penalty is proportional to the load connected to eachbus, as formulated in (4.18). The penalty function considers different costs forunder and over voltages. Moreover, two penalty curves will be designed for normaloperating situations and operation under contingencies.
CV =∑
s
Hs
∑
n
PDn
[
AUV,s
(
∆vminn,s
)2+ AO
V,s
(
∆vmaxn,s
)2]
(4.18)
where:AU
V,s, AOV,s Penalty for under and over voltage deviations for the
scenario s (e/MWh/kV2)∆vmin
n,s , ∆vmaxn,s Undervoltage and overvoltage deviations in bus n and
scenario s(kV). The voltage deviation ∆vmaxn,s is defined
for the range V max and V maxn,s , and ∆vmin
n,s is defined forthe range V min and V min
n,s ,.
5The Non-Supplied Energy penalty is usually in the range of 10 to 100 times the average energyprice in e/kWh.
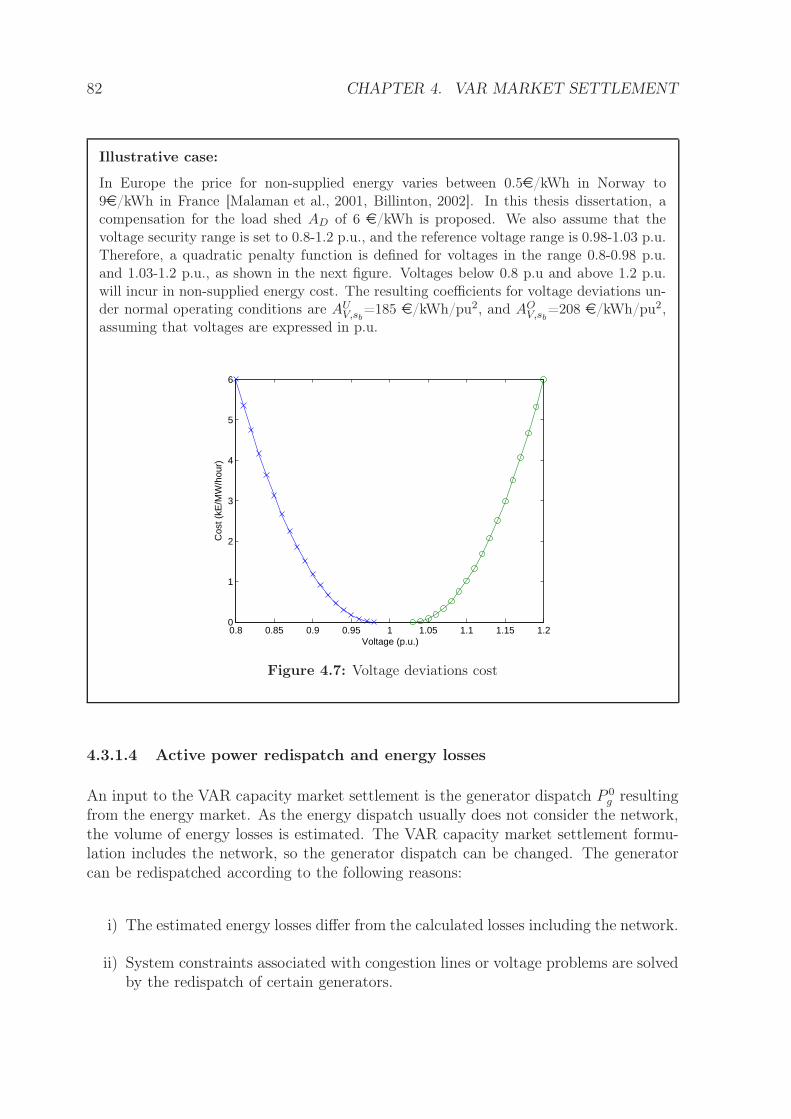
82 CHAPTER 4. VAR MARKET SETTLEMENT
Illustrative case:
In Europe the price for non-supplied energy varies between 0.5e/kWh in Norway to9e/kWh in France [Malaman et al., 2001, Billinton, 2002]. In this thesis dissertation, acompensation for the load shed AD of 6 e/kWh is proposed. We also assume that thevoltage security range is set to 0.8-1.2 p.u., and the reference voltage range is 0.98-1.03 p.u.Therefore, a quadratic penalty function is defined for voltages in the range 0.8-0.98 p.u.and 1.03-1.2 p.u., as shown in the next figure. Voltages below 0.8 p.u and above 1.2 p.u.will incur in non-supplied energy cost. The resulting coefficients for voltage deviations un-der normal operating conditions are AU
V,sb=185 e/kWh/pu2, and AO
V,sb=208 e/kWh/pu2,
assuming that voltages are expressed in p.u.
0.8 0.85 0.9 0.95 1 1.05 1.1 1.15 1.20
1
2
3
4
5
6
Voltage (p.u.)
Cos
t (kE
/MW
/hou
r)
Figure 4.7: Voltage deviations cost
4.3.1.4 Active power redispatch and energy losses
An input to the VAR capacity market settlement is the generator dispatch P 0g resulting
from the energy market. As the energy dispatch usually does not consider the network,the volume of energy losses is estimated. The VAR capacity market settlement formu-lation includes the network, so the generator dispatch can be changed. The generatorcan be redispatched according to the following reasons:
i) The estimated energy losses differ from the calculated losses including the network.
ii) System constraints associated with congestion lines or voltage problems are solvedby the redispatch of certain generators.
4.3. OPTIMIZATION PROBLEM FORMULATION 83
iii) The need of additional VAR capacity provided by a generator may require thereduction of that generator output.
The previous causes for generator redispatch are included in the objective function forthe base scenario as an additional cost (4.19). The generator output under contingen-cies is not included in the formulation, as their output is settled by the correspondingemergency control loop, for instance the AGC (Automatic Generation Control), whichdistributes the active power production according to the generator active power ramps.
CP = Hsb
∑
g
APg
(
pg,sb− P 0
g
)
(4.19)
where:Hsb
Duration of the base scenario (hours)AP
g Variable production cost of generator g (e/MWh)pg,sb
Active power generation from generator g in the basescenario sb (MW)
P 0g Active power dispatched for generator g in the energy
market (MW)
If the generator is called by the SO to reduce its original dispatch in order to increase itsVAR capacity, then the generator will lose some revenues in the active power market.This loss of revenues is calculated as the difference between the clearing price and thevariable costs of the generator, multiplied by the active power reduced. As commentedin the previous chapter, this loss of revenues will be compensated to the generator, andtherefore should be included as an additional cost in the objective function in the VARcapacity market settlement. This cost is known as opportunity cost, and it is alreadyincluded in the formulation in (4.19), as (4.19) can be obtained as the simplificationof (4.20) which includes the term for the incremental costs of redispatching generators,based on the difference of the clearing price in the active power market and the variablecosts, and the term of the opportunity cost.
CP = Hsb
[
∑
g
(
APg − MP
) (
pg,sb− P 0
g
)
+∑
g
(
MP − APg
) (
pg,sb− P 0
g
)
]
(4.20)
where:MP Clearing price in the energy market (e/MWh)
4.3.2 Constraints
The constraints of the optimization problem approach for the VAR capacity market aredetailed in the next subsections, which are classified in six different groups: (i) full AC
84 CHAPTER 4. VAR MARKET SETTLEMENT
power flow equations, (ii) operation limits, (iii) VAR capacity purchase constraints, (iv)dynamic VAR performance constraints, (v) contingency scenario modelling equations,and (vi) VAR capacity reserve constraints.
4.3.2.1 AC power flow
The power system behavior has been modeled with the full AC power flow equations(4.21)(4.22). Power flow equations are formulated for each considered scenario. Adecision variable dn,s determine the amount of load to be disconnected, which affectsboth active and reactive power. Other decision variables identify the static compensationneeded both for capacitor banks and shunt reactors based on their used capacity qc,s andqr,s respectively6. The procurement of static devices depends on the voltage magnitudeat the connected bus.
∑
g∈n
pg,s − (1 − dn,s)PDn =
vn,s
∑
m
vm,s [gnm,s cos (θn,s − θm,s) + bnm,s sin (θn,s − θm,s)]
∀n, m ∈ N, s ∈ S
(4.21)
∑
g∈n
(
qGg,s − qA
g,s
)
+∑
c∈n
qc,sv2n,s −
∑
r∈n
qr,sv2n,s − (1 − dn,s) QDn =
vn,s
∑
m
vm,s [gnm,s sin (θn,s − θm,s) − bnm,s cos (θn,s − θm,s)]
∀n, m ∈ N, s ∈ S
(4.22)
where:qGg,s, q
Ag,s Reactive power generation/absorption from generator g
in scenario s (Mvar)qc,s, qr,s Reactive power switched on by a capacitor bank
c/shunt reactor r in scenario s (Mvar)dn,s Continuous variable [0-1] that represents the portion of
energy not supplied energy at bus n in scenario svn,s Voltage at bus n in scenario s (kV)θn,s Voltage angle at bus n in scenario s (rad)
gnm,s, bnm,s Real and imaginary part of the admittance matrixcorresponding to buses n and m for scenario s ()
The transformers in the transmission network are included in the formulation by mod-ifying the terms of the admittance matrix. The terms to be modified are those corre-sponding to the two buses where the transformer is connected, as formulated in (4.23)to (4.26).
6As the problem is formulated using per unit system, the susceptance of capacitor banks and shuntreactors equals their corresponding capacity qs = bs.
4.3. OPTIMIZATION PROBLEM FORMULATION 85
gnn,sb=
∑
v⊺n/m
Y cnv +
Y cnm
(rtnm)2 (4.23)
bnn,sb=
∑
v⊺n/m
Y snv +
Y snm
(rtnm)2 (4.24)
gnm,sb=
Y cnm
rtnm
(4.25)
bnm,sb=
Y snm
rtnm
(4.26)
where:rtnm Tap ratio of transformer located in between buses n and
mY c
nm, Y snm Real and imaginary terms of the admittance between
buses n and mv ⊺ n/m All buses v connected to n except m
4.3.2.2 Operation limits
According to the proposed mechanism for voltage deviation penalty, voltage deviationsunder and over the reference range are defined in (4.27) and (4.28), using the slackvariables ∆vmin
n,s and ∆vmaxn,s . The security voltage range is formulated in (4.29).
V minn,s − ∆vmin
n,s ≤ vn,s ∀n ∈ N, s ∈ S (4.27)
vn,s ≤ V maxn,s + ∆vmax
n,s ∀n ∈ N, s ∈ S (4.28)
V min ≤ vn,s ≤ V max ∀n ∈ N, s ∈ S (4.29)
In addition, certain limits are defined for the voltage angle in order to obtain feasibleoperating points (4.30). The angle at the swing bus ns is set at zero (4.31).
−π ≤ θn,s ≤ π ∀n ∈ N/ ns , s ∈ S (4.30)
θns,s = 0 ∀s ∈ S (4.31)
Limits for the transmission line current are also considered (4.32). The selected limitingpower will be the most restrictive, which corresponds to that of summer time.
sll,s ≤ SLmaxl ∀l ∈ L, s ∈ S (4.32)
86 CHAPTER 4. VAR MARKET SETTLEMENT
where:sll,s Apparent power flow in line l and scenario s
SLmaxl Transmission capacity of line l (MVA)
Maximum and minimum active power generation are required in order to limit the gen-eration redispatch7 (4.33). This constraint is only active if the generator is dispatched,ug = 1.
ugPming ≤ pg,s ≤ ugP
maxg ∀g ∈ G, s ∈ S (4.33)
where:ug Binary variable [0,1] (1 if generator g is dispatched, 0
otherwise)Pmin
g , Pmaxg Minimum and maximum active power generation of
generator g (MW)
Transformer tap ratio rtl,s must be within their maximum and minimum rating values(4.34). Step-up transformers in power plants and distribution transformers are notincluded in the formulation, as the VAR support is provided in the connection pointto the transmission network. Therefore, this constraint applies to transformers in thetransmission network, which connect different voltage transmission levels8.
RTminl ≤ rtl,s ≤ RTmax
l (4.34)
where:rtl,s Tap ratio of transformer located in between buses n and
m which define the line lRTmin
l , RTmaxl Minimum and maximum rating values of the
transformer tap ratio (p.u.)
4.3.2.3 VAR capacity purchases
Each selected VAR source can be required to produce reactive power within its assignedVAR capacity in the year of the auction, (4.35) to (4.38). Additionally, the VAR capacitypurchases arranged in previous auctions are also considered.
7For simplicity, the start-up cost of generators is not included in the objective function. To includethem in the formulation of the VAR capacity market, an additional variable is needed to represent thatthe generator has been started-up us
g. In addition, a parameter representing the state of the generatorafter the economic dispatch U0
g will inform on the start-up. Then usg = 1 only if U0
g = 0 and ug = 1.This condition can be formulated by including new constraints in the proposed formulation.
8These units are typically auto-transformers of 400/220kV, 400/132kV or 220/132kV.
4.3. OPTIMIZATION PROBLEM FORMULATION 87
0 ≤ qAg,s ≤ qaA
g + QAA0g ∀g ∈ G , s ∈ S (4.35)
0 ≤ qGg,s ≤ qaG
g + QAG0g ∀g ∈ G , s ∈ S (4.36)
0 ≤ qc,s ≤ qac + QA0c ∀c ∈ C, s ∈ S (4.37)
0 ≤ qr,s ≤ qar + QA0r ∀r ∈ R, s ∈ S (4.38)
where:qAg,s, q
Gg,s, qc,s, qr,s Output of the reactive power sources (Mvar)
qaAg , qaG
g , qac, qar Assigned reactive power capacity (Mvar)QAA0
g , QAG0g , QA0
c , QA0r Reactive power capacity assigned in previous auctions
(Mvar)
The installation of compensating devices in a selected bus may be limited by physicalrestrictions, such as technical constraints in the substation, as formulated in (4.39) and(4.40).
qar + QA0r ≤ Qmax
r ∀r ∈ R (4.39)
qac + QA0c ≤ Qmax
c ∀c ∈ R (4.40)
where:Qmax
c , Qmaxr Maximum reactive power capacity of capacitor bank c
and shunt reactor r respectively (Mvar)
On the other hand, the allocation of VAR capacity should take into account the capacitylimits of generation units both for VAR generation and absorption, (4.41) and (4.42). Asdescribed in the previous sections, the VAR capacity limits depend on the active poweroutput of the generator. According to the capacity curve shape, to increase the VARcapacity, the active power output should be reduced. The corresponding relationshipbetween the active power output and the capacity limits is a non-linear function (seeFigure 4.8). For simplicity, this relationship is approximated by a linear function. Thissimplification also guarantees that the calculated VAR limits, (4.43) and (4.44), will bealways lower than the real VAR limits.
qaGg + QAG0
g ≤ ugQGmaxg ∀g ∈ G (4.41)
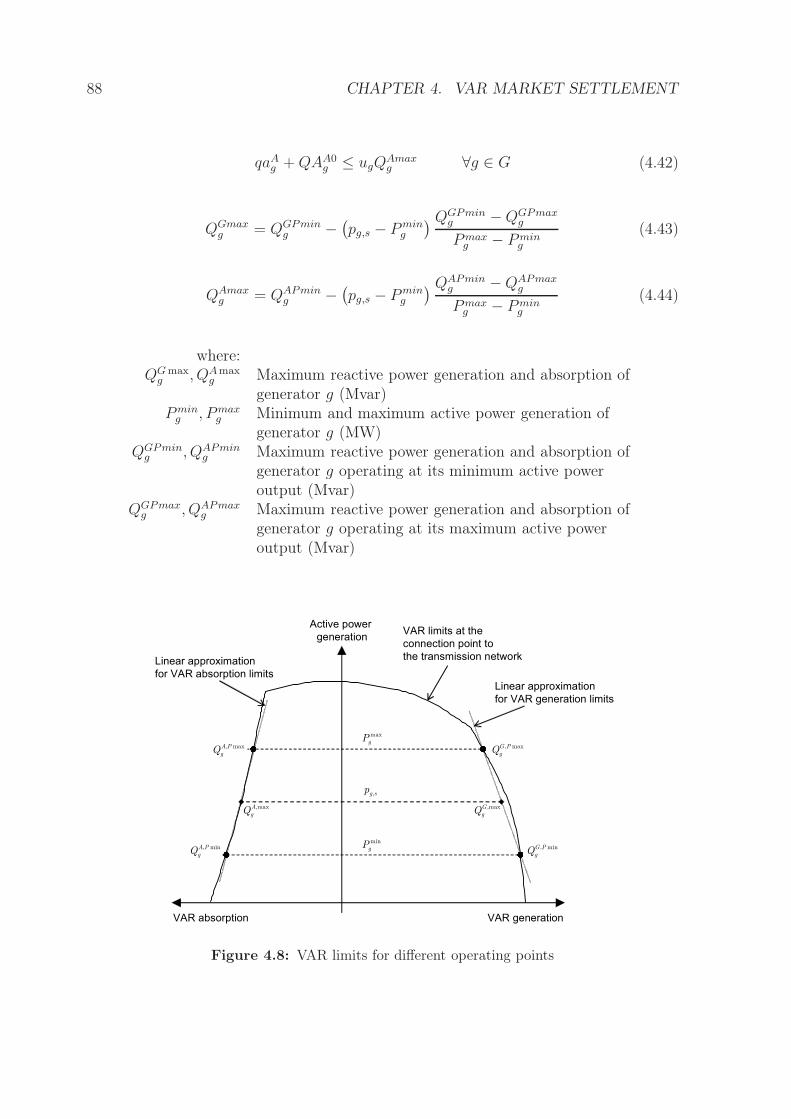
88 CHAPTER 4. VAR MARKET SETTLEMENT
qaAg + QAA0
g ≤ ugQAmaxg ∀g ∈ G (4.42)
QGmaxg = QGPmin
g −(
pg,s − P ming
) QGPming − QGPmax
g
P maxg − P min
g
(4.43)
QAmaxg = QAPmin
g −(
pg,s − P ming
) QAPming − QAPmax
g
P maxg − P min
g
(4.44)
where:QG max
g , QAmaxg Maximum reactive power generation and absorption of
generator g (Mvar)P min
g , P maxg Minimum and maximum active power generation of
generator g (MW)QGPmin
g , QAPming Maximum reactive power generation and absorption of
generator g operating at its minimum active poweroutput (Mvar)
QGPmaxg , QAPmax
g Maximum reactive power generation and absorption ofgenerator g operating at its maximum active poweroutput (Mvar)
max
gP
min
gP
, maxG P
gQ
, minG P
gQ
VAR generationVAR absorption
Active power
generation
Linear approximation
for VAR generation limits
VAR limits at the
connection point to
the transmission network
,g sp
,maxA
gQ,maxG
gQ
, maxA P
gQ
, minA P
gQ
Linear approximation
for VAR absorption limits
Figure 4.8: VAR limits for different operating points
4.3. OPTIMIZATION PROBLEM FORMULATION 89
4.3.2.4 Dynamic performance
In the selection of the VAR sources, it is important to consider their dynamic perfor-mance under contingencies. The dynamic performance is considered as the primary VARresponse of a VAR source, without the change of the set point by the operator (powerplant operator or SO). VAR regulation margin is formulated, for each VAR source, asthe maximum variation of the VAR production in a scenario with contingency comparedwith the VAR production in the base case. These constraints join the operation underthe base scenario and the contingencies, giving important information for the settlementof the VAR capacity market.
Generators, SVCs, and STATCOM devices can generally modify their VAR productionvery quickly, using their whole VAR capacity (4.45) (for very fast VAR regulating sources∆Qu
g = ∆Qug = ∞, and therefore the constraint is not active). However, capacitor
banks and shunt reactors have a slower dynamic performance, and their maximum VARvariation is more limited (4.46)(4.47) (for instance, ∆Qd
c = ∆Quc = ∆Qd
r = ∆Qur = 0).
−∆Qdg ≤ qA
g,s + qGg,s − qA
g,sb− qG
g,sb≤ ∆Qu
g ∀g ∈ G, s 6= sb (4.45)
−∆Qdc ≤ qc,s − qc,sb
≤ ∆Quc ∀c ∈ C, s 6= sb (4.46)
−∆Qdr ≤ qr,s − qr,sb
≤ ∆Qur ∀r ∈ R, s 6= sb (4.47)
where:∆Qu
g , ∆Qdg Maximum reactive power change upwards/downwards
that generator g can provide in case of contingencies(Mvar)
∆Quc , ∆Qd
c Maximum reactive power change upwards/downwardsthat the capacitor bank c can provide in case ofcontingencies (Mvar)
∆Qur , ∆Qd
r Maximum reactive power change upwards/downwardsthat the shunt reactor r can provide in case ofcontingencies (Mvar)
The variation of the active power generation after a contingency clearly depends on thetechnology of the power plant (4.48). Hydraulic and combined cycle plants can modifytheir active power production faster than nuclear and other thermal plants.
−∆P dg ≤ pg,s − pg,sb
≤ ∆P ug ∀g ∈ G, s 6= sb (4.48)
where:∆P u
g , ∆P dg Maximum active power change upwards/downwards
that generator g can provide in case of contingencies(MW)
90 CHAPTER 4. VAR MARKET SETTLEMENT
Illustrative case:
The following considerations were included in the illustrative case,
• In the capacity curve of generators QGPming = QGPmax
g and QAPming = QAPmax
g .
• The dynamic performance of all generators is defined as ∆P ug = ∆P d
g = 20MW, and
∆Qug = ∆Qd
g = 50Mvar.
• Capacitor banks and shunt reactors will not modify their operating capacity in thecase of contingency, ∆Qu
c = ∆Qdc = 0, and ∆Qu
r = ∆Qdr = 0.
• There are no previous VAR capacity contracts with any of the market participants,
therefore QA0c = QA0
r = 0, and QAG0g = QAA0
g = 0.
4.3.2.5 Modeling contingencies
The optimization formulation for VAR allocation also includes scenarios with contin-gencies. During contingencies, the control variables corresponding to the transformertap position and voltage at the generator terminals are kept constant and equal totheir value in the base scenario. Two possible contingencies are considered: generatorunavailability and line trip.
4.3.2.5.1 Generator unavailability. The unavailability of a generator gf in a sce-nario sgf
is modeled with three additional constraints that set to zero its active andreactive power production (4.50)(4.51). Additionally, the active power lost is compen-sated by a set of generators in the active power regulating area. The contribution ofeach selected generator is in proportion to the difference between their maximum activepower and their output in the base scenario (4.49). This criteria is similar to the oneused in the Spanish power system [Martínez-Crespo et al., 2006].
pg,sgf= pg,sb
+ pgf ,sb
Pmaxg − pg,sb
∑
g 6=gf
(
Pmaxg − pg,sb
) ∀s ∈ S/sb, g ∈ G/gf (4.49)
pgf ,sgf= 0 (4.50)
qgf ,sgf= 0 (4.51)
where:sgf
The scenario where generator g becomes unavailable
4.3. OPTIMIZATION PROBLEM FORMULATION 91
4.3.2.5.2 Line trip. The trip of a transmission line is included in the model bymodifying the impedance matrix of the power system. For line l between buses n andm, and the considered scenario sl, eight parameters should be modified. These datacorrespond to the real (4.52) and imaginary part (4.53) of the impedance matrix, inrows n and m .
gnm,sl= gmn,sl
= 0gnn,sl
= gnn,sb− gnm,sb
gmm,sl= gmm,sb
− gnm,sb
(4.52)
bnm,sl= bmn,sl
= 0bnn,sl
= bnn,sb− bnm,sb
bmm,sl= bmm,sb
− bnm,sb
(4.53)
where:gnm,sl
, bnm,slReal and imaginary part of the admittance matrixcorresponding to buses n and m for scenario sl wheretransmission line l has failed ()
4.3.2.6 VAR reserve management
A good practice in the operation of power systems is to distribute the VAR capacityreserve homogeneously between the fast VAR sources, mainly generators. This criterionclearly improves the power system response in the case of a system contingency, as itminimizes the possibility that a VAR source exhausts its VAR capacity while other VARsources are lightly loaded on VARs. The reserve margin is a result from the settlementof the VAR capacity market. The reserve margin is defined under normal operationconditions for each single voltage control area j, and for VAR capacity generation (4.54)and absorption (4.55). For better performance of the optimization formulation, a slackparameter σ for the VAR reserve margin in generators is included.
rGj − σ ≤ 1 −
qGg,sb
qaGg
≤ rGj + σ ∀g ∈ G (4.54)
rAj − σ ≤ 1 −
qAg,sb
qaAg
≤ rAj + σ ∀g ∈ G (4.55)
where:rGj , rA
j Generation/absorption VAR capacity reserve in thevoltage control area j
σ Margin of the VAR capacity reserve
92 CHAPTER 4. VAR MARKET SETTLEMENT
Illustrative case:
An adequate reserve margin variation of σ = 0.2 will be settled for the illustrative case.
This gap allows a 20% deviation of reserve margins between generators.
4.4 Analysis of the results of the VAR capacity market
settlement
The output of the optimization problem that formulates the settlement of the VARcapacity market contains both technical and economic information. This section firstpresents the main outputs of the market settlement, which are the selection of theVAR capacity bids for the next year and the estimated costs corresponding selectedVAR supplying agents. Then, the information obtained from the Lagrange multipliersassociated with the constraints of the optimization problem, which represents the VARcapacity market settlement, is analyzed. Finally, it is discussed the need of splitting theLagrange multipliers in order to obtain clear economic signals.
4.4.1 Main outputs
The main output of the VAR market formulation is the selected VAR capacity for eachsource and the cost for the purchase of that VAR capacity. In addition an estimationof the operation costs included in the VAR capacity market are obtained, comprisingthe VAR energy regulated cost, energy losses and active power redispatch cost, voltagequality penalties, and cost for non-supplied energy.
The previous information was obtained from the power flow results of each scenario,including active and reactive power balance at each bus, and the corresponding voltagevalue. Additional estimations were also obtained, such as voltage deviations per bus,the non-supplied energy, the generation redispatch, and the use of the selected VARcapacity sources.
Illustrative case:
The selected VAR capacity in the illustrative case is 25Mvar to generator #1 , 34Mvar
to generator #2 , 49Mvar to generator #3 , and a capacitor bank of 9Mvar at bus 2 . Theoperating conditions for the scenarios are shown in the following table. Note that generator3 was not initially dispatched (P 0
3 = 0), but it is started-up at its minimum power output,to avoid ENS in case of unavailability of generator 2. The active power output of generatorsduring contingencies is defined by the automatic response as defined in (4.49), and voltagesin the generator buses remain constant.
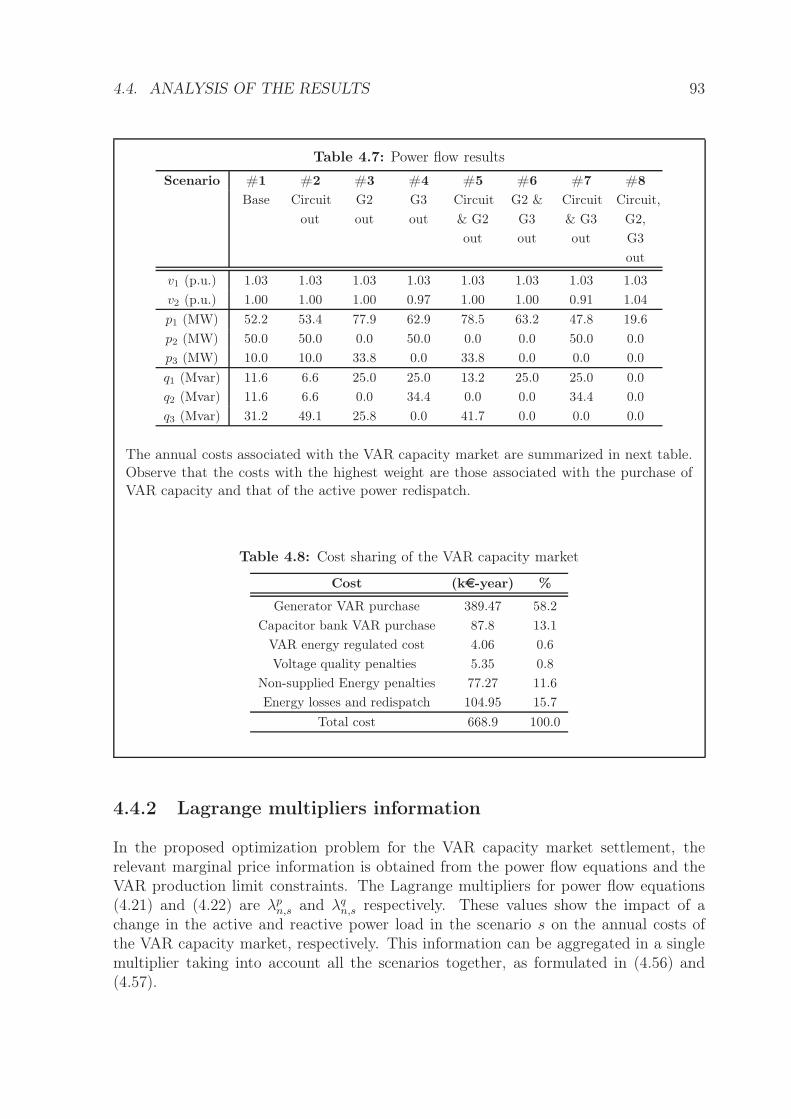
4.4. ANALYSIS OF THE RESULTS 93
Table 4.7: Power flow results
Scenario #1 #2 #3 #4 #5 #6 #7 #8
Base Circuit
out
G2
out
G3
out
Circuit
& G2
out
G2 &
G3
out
Circuit
& G3
out
Circuit,
G2,
G3
out
v1 (p.u.) 1.03 1.03 1.03 1.03 1.03 1.03 1.03 1.03
v2 (p.u.) 1.00 1.00 1.00 0.97 1.00 1.00 0.91 1.04
p1 (MW) 52.2 53.4 77.9 62.9 78.5 63.2 47.8 19.6
p2 (MW) 50.0 50.0 0.0 50.0 0.0 0.0 50.0 0.0
p3 (MW) 10.0 10.0 33.8 0.0 33.8 0.0 0.0 0.0
q1 (Mvar) 11.6 6.6 25.0 25.0 13.2 25.0 25.0 0.0
q2 (Mvar) 11.6 6.6 0.0 34.4 0.0 0.0 34.4 0.0
q3 (Mvar) 31.2 49.1 25.8 0.0 41.7 0.0 0.0 0.0
The annual costs associated with the VAR capacity market are summarized in next table.Observe that the costs with the highest weight are those associated with the purchase ofVAR capacity and that of the active power redispatch.
Table 4.8: Cost sharing of the VAR capacity market
Cost (ke-year) %
Generator VAR purchase 389.47 58.2
Capacitor bank VAR purchase 87.8 13.1
VAR energy regulated cost 4.06 0.6
Voltage quality penalties 5.35 0.8
Non-supplied Energy penalties 77.27 11.6
Energy losses and redispatch 104.95 15.7
Total cost 668.9 100.0
4.4.2 Lagrange multipliers information
In the proposed optimization problem for the VAR capacity market settlement, therelevant marginal price information is obtained from the power flow equations and theVAR production limit constraints. The Lagrange multipliers for power flow equations(4.21) and (4.22) are λp
n,s and λqn,s respectively. These values show the impact of a
change in the active and reactive power load in the scenario s on the annual costs ofthe VAR capacity market, respectively. This information can be aggregated in a singlemultiplier taking into account all the scenarios together, as formulated in (4.56) and(4.57).
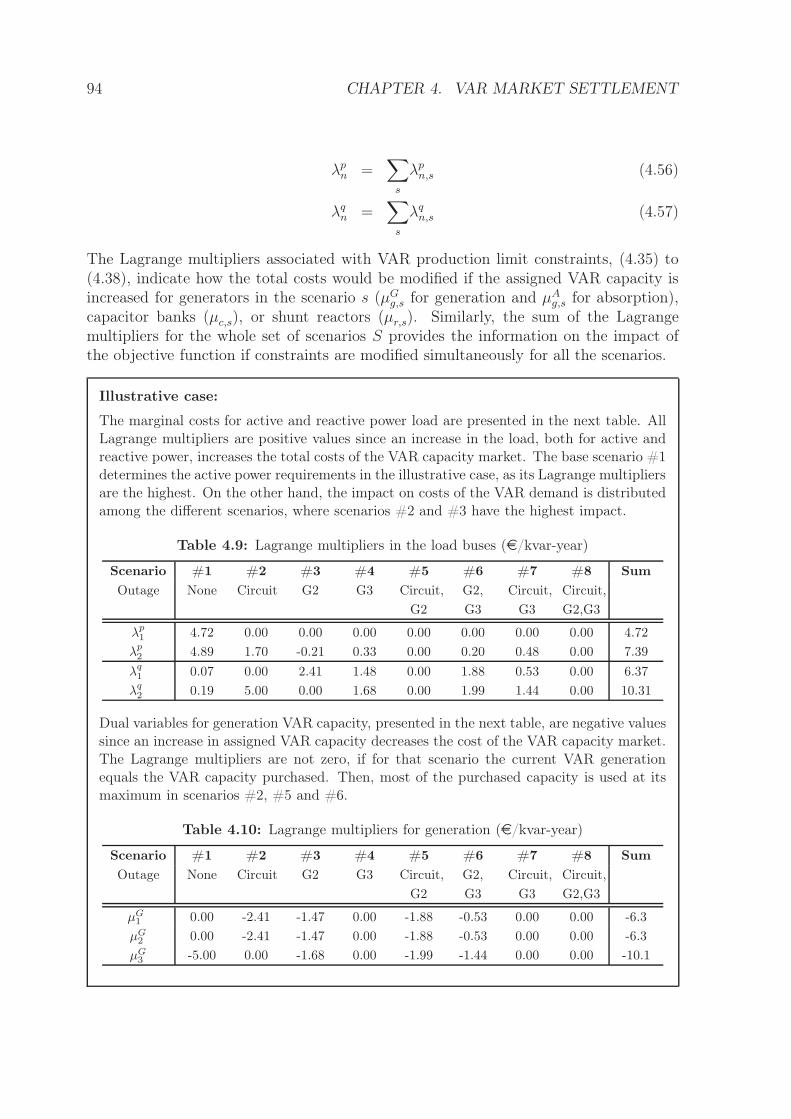
94 CHAPTER 4. VAR MARKET SETTLEMENT
λpn =
∑
s
λpn,s (4.56)
λqn =
∑
s
λqn,s (4.57)
The Lagrange multipliers associated with VAR production limit constraints, (4.35) to(4.38), indicate how the total costs would be modified if the assigned VAR capacity isincreased for generators in the scenario s (µG
g,s for generation and µAg,s for absorption),
capacitor banks (µc,s), or shunt reactors (µr,s). Similarly, the sum of the Lagrangemultipliers for the whole set of scenarios S provides the information on the impact ofthe objective function if constraints are modified simultaneously for all the scenarios.
Illustrative case:
The marginal costs for active and reactive power load are presented in the next table. AllLagrange multipliers are positive values since an increase in the load, both for active andreactive power, increases the total costs of the VAR capacity market. The base scenario #1determines the active power requirements in the illustrative case, as its Lagrange multipliersare the highest. On the other hand, the impact on costs of the VAR demand is distributedamong the different scenarios, where scenarios #2 and #3 have the highest impact.
Table 4.9: Lagrange multipliers in the load buses (e/kvar-year)
Scenario #1 #2 #3 #4 #5 #6 #7 #8 Sum
Outage None Circuit G2 G3 Circuit,
G2
G2,
G3
Circuit,
G3
Circuit,
G2,G3
λp1 4.72 0.00 0.00 0.00 0.00 0.00 0.00 0.00 4.72
λp2 4.89 1.70 -0.21 0.33 0.00 0.20 0.48 0.00 7.39
λq1 0.07 0.00 2.41 1.48 0.00 1.88 0.53 0.00 6.37
λq2 0.19 5.00 0.00 1.68 0.00 1.99 1.44 0.00 10.31
Dual variables for generation VAR capacity, presented in the next table, are negative valuessince an increase in assigned VAR capacity decreases the cost of the VAR capacity market.The Lagrange multipliers are not zero, if for that scenario the current VAR generationequals the VAR capacity purchased. Then, most of the purchased capacity is used at itsmaximum in scenarios #2, #5 and #6.
Table 4.10: Lagrange multipliers for generation (e/kvar-year)
Scenario #1 #2 #3 #4 #5 #6 #7 #8 Sum
Outage None Circuit G2 G3 Circuit,
G2
G2,
G3
Circuit,
G3
Circuit,
G2,G3
µG1 0.00 -2.41 -1.47 0.00 -1.88 -0.53 0.00 0.00 -6.3
µG2 0.00 -2.41 -1.47 0.00 -1.88 -0.53 0.00 0.00 -6.3
µG3 -5.00 0.00 -1.68 0.00 -1.99 -1.44 0.00 0.00 -10.1
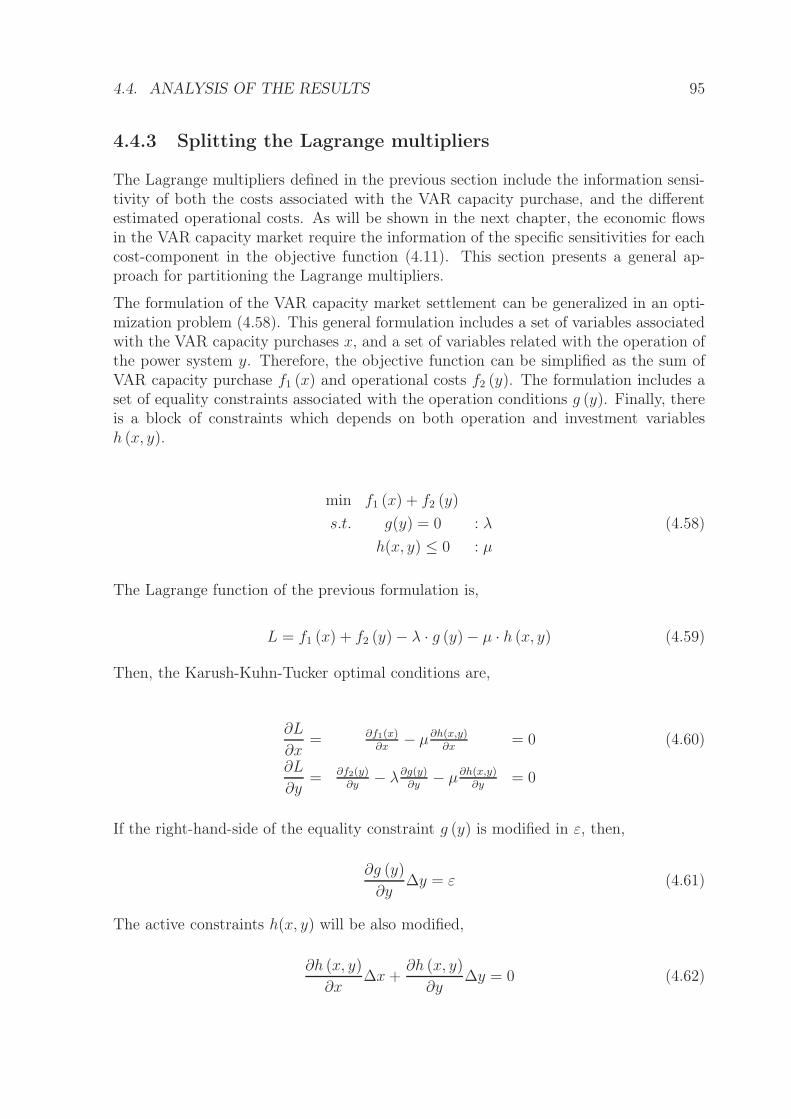
4.4. ANALYSIS OF THE RESULTS 95
4.4.3 Splitting the Lagrange multipliers
The Lagrange multipliers defined in the previous section include the information sensi-tivity of both the costs associated with the VAR capacity purchase, and the differentestimated operational costs. As will be shown in the next chapter, the economic flowsin the VAR capacity market require the information of the specific sensitivities for eachcost-component in the objective function (4.11). This section presents a general ap-proach for partitioning the Lagrange multipliers.
The formulation of the VAR capacity market settlement can be generalized in an opti-mization problem (4.58). This general formulation includes a set of variables associatedwith the VAR capacity purchases x, and a set of variables related with the operation ofthe power system y. Therefore, the objective function can be simplified as the sum ofVAR capacity purchase f1 (x) and operational costs f2 (y). The formulation includes aset of equality constraints associated with the operation conditions g (y). Finally, thereis a block of constraints which depends on both operation and investment variablesh (x, y).
min f1 (x) + f2 (y)
s.t. g(y) = 0 : λ (4.58)
h(x, y) ≤ 0 : µ
The Lagrange function of the previous formulation is,
L = f1 (x) + f2 (y) − λ · g (y) − µ · h (x, y) (4.59)
Then, the Karush-Kuhn-Tucker optimal conditions are,
∂L
∂x= ∂f1(x)
∂x− µ∂h(x,y)
∂x= 0 (4.60)
∂L
∂y= ∂f2(y)
∂y− λ∂g(y)
∂y− µ∂h(x,y)
∂y= 0
If the right-hand-side of the equality constraint g (y) is modified in ε, then,
∂g (y)
∂y∆y = ε (4.61)
The active constraints h(x, y) will be also modified,
∂h (x, y)
∂x∆x +
∂h (x, y)
∂y∆y = 0 (4.62)
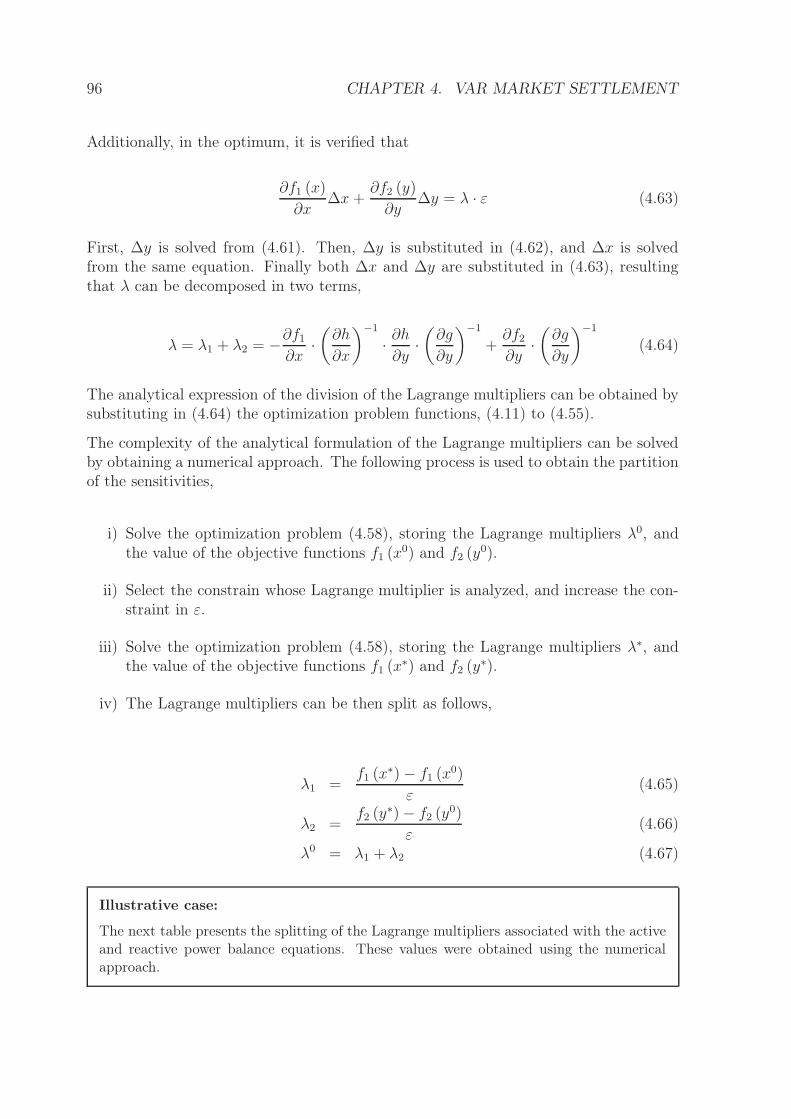
96 CHAPTER 4. VAR MARKET SETTLEMENT
Additionally, in the optimum, it is verified that
∂f1 (x)
∂x∆x +
∂f2 (y)
∂y∆y = λ · ε (4.63)
First, ∆y is solved from (4.61). Then, ∆y is substituted in (4.62), and ∆x is solvedfrom the same equation. Finally both ∆x and ∆y are substituted in (4.63), resultingthat λ can be decomposed in two terms,
λ = λ1 + λ2 = −∂f1
∂x·(
∂h
∂x
)−1
· ∂h
∂y·(
∂g
∂y
)−1
+∂f2
∂y·(
∂g
∂y
)−1
(4.64)
The analytical expression of the division of the Lagrange multipliers can be obtained bysubstituting in (4.64) the optimization problem functions, (4.11) to (4.55).
The complexity of the analytical formulation of the Lagrange multipliers can be solvedby obtaining a numerical approach. The following process is used to obtain the partitionof the sensitivities,
i) Solve the optimization problem (4.58), storing the Lagrange multipliers λ0, andthe value of the objective functions f1 (x0) and f2 (y0).
ii) Select the constrain whose Lagrange multiplier is analyzed, and increase the con-straint in ε.
iii) Solve the optimization problem (4.58), storing the Lagrange multipliers λ∗, andthe value of the objective functions f1 (x∗) and f2 (y∗).
iv) The Lagrange multipliers can be then split as follows,
λ1 =f1 (x∗) − f1 (x0)
ε(4.65)
λ2 =f2 (y∗) − f2 (y0)
ε(4.66)
λ0 = λ1 + λ2 (4.67)
Illustrative case:
The next table presents the splitting of the Lagrange multipliers associated with the activeand reactive power balance equations. These values were obtained using the numericalapproach.
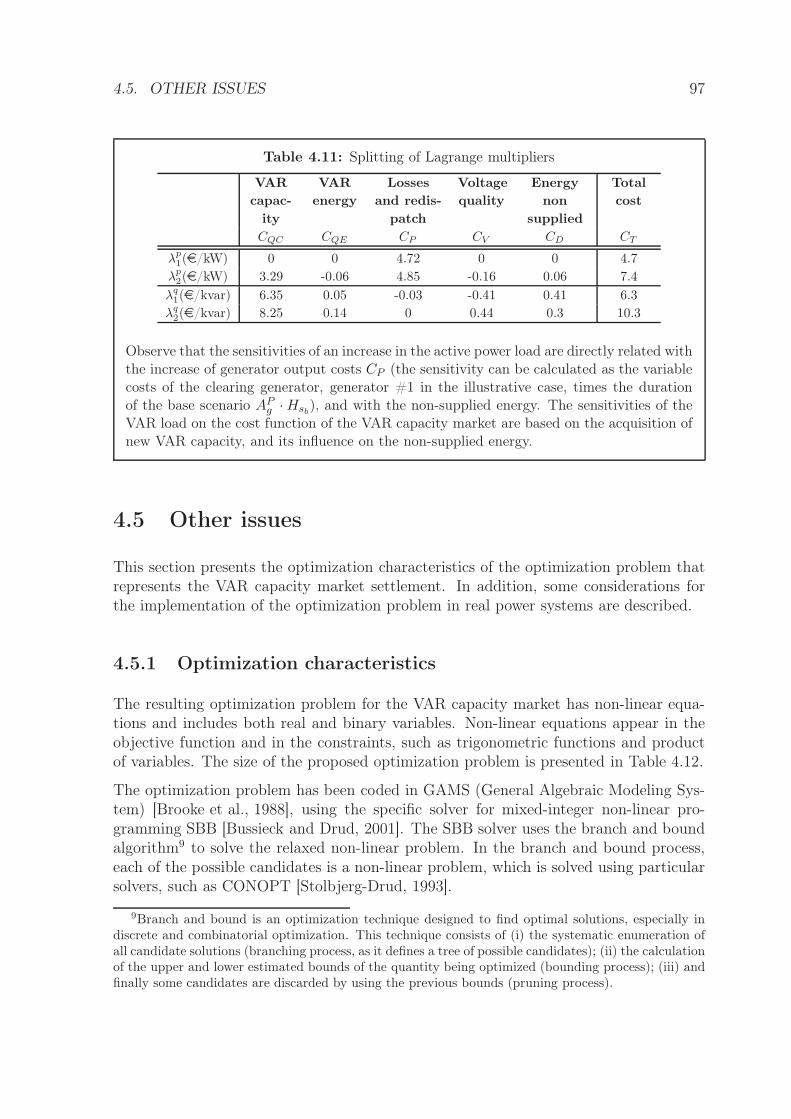
4.5. OTHER ISSUES 97
Table 4.11: Splitting of Lagrange multipliers
VAR
capac-
ity
VAR
energy
Losses
and redis-
patch
Voltage
quality
Energy
non
supplied
Total
cost
CQC CQE CP CV CD CT
λp1(e/kW) 0 0 4.72 0 0 4.7
λp2(e/kW) 3.29 -0.06 4.85 -0.16 0.06 7.4
λq1(e/kvar) 6.35 0.05 -0.03 -0.41 0.41 6.3
λq2(e/kvar) 8.25 0.14 0 0.44 0.3 10.3
Observe that the sensitivities of an increase in the active power load are directly related withthe increase of generator output costs CP (the sensitivity can be calculated as the variablecosts of the clearing generator, generator #1 in the illustrative case, times the durationof the base scenario AP
g · Hsb), and with the non-supplied energy. The sensitivities of the
VAR load on the cost function of the VAR capacity market are based on the acquisition ofnew VAR capacity, and its influence on the non-supplied energy.
4.5 Other issues
This section presents the optimization characteristics of the optimization problem thatrepresents the VAR capacity market settlement. In addition, some considerations forthe implementation of the optimization problem in real power systems are described.
4.5.1 Optimization characteristics
The resulting optimization problem for the VAR capacity market has non-linear equa-tions and includes both real and binary variables. Non-linear equations appear in theobjective function and in the constraints, such as trigonometric functions and productof variables. The size of the proposed optimization problem is presented in Table 4.12.
The optimization problem has been coded in GAMS (General Algebraic Modeling Sys-tem) [Brooke et al., 1988], using the specific solver for mixed-integer non-linear pro-gramming SBB [Bussieck and Drud, 2001]. The SBB solver uses the branch and boundalgorithm9 to solve the relaxed non-linear problem. In the branch and bound process,each of the possible candidates is a non-linear problem, which is solved using particularsolvers, such as CONOPT [Stolbjerg-Drud, 1993].
9Branch and bound is an optimization technique designed to find optimal solutions, especially indiscrete and combinatorial optimization. This technique consists of (i) the systematic enumeration ofall candidate solutions (branching process, as it defines a tree of possible candidates); (ii) the calculationof the upper and lower estimated bounds of the quantity being optimized (bounding process); (iii) andfinally some candidates are discarded by using the previous bounds (pruning process).
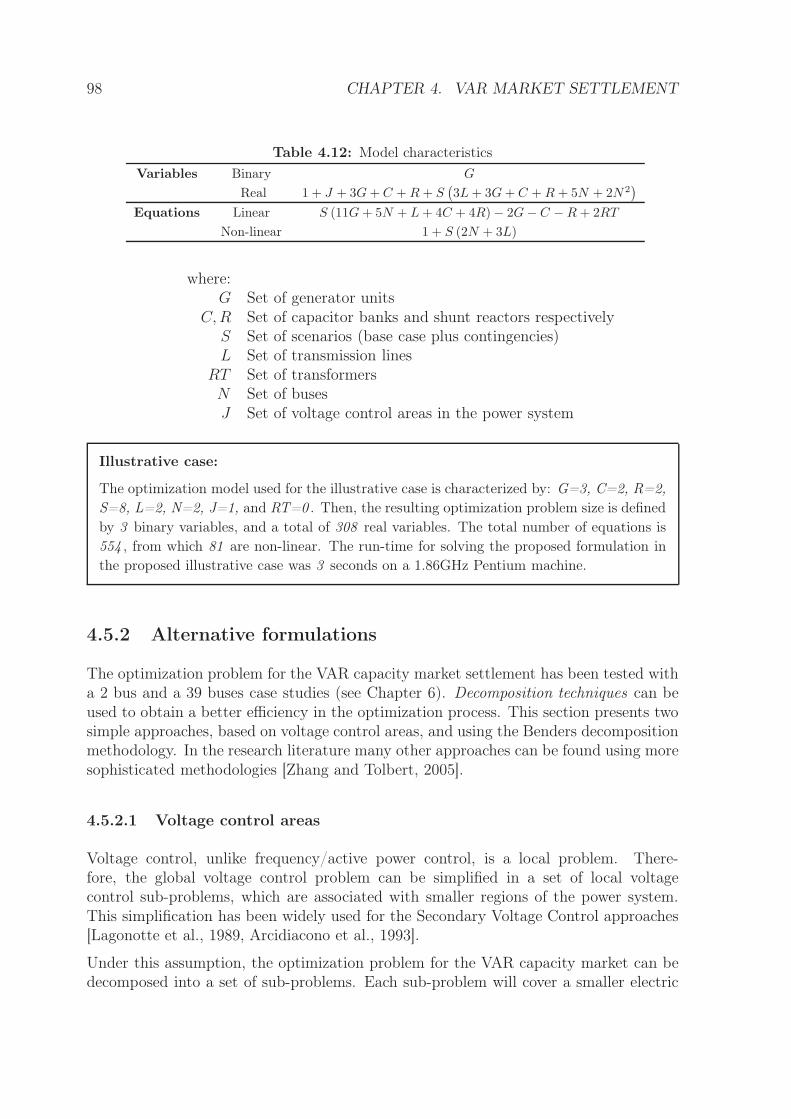
98 CHAPTER 4. VAR MARKET SETTLEMENT
Table 4.12: Model characteristics
Variables Binary G
Real 1 + J + 3G + C + R + S(
3L + 3G + C + R + 5N + 2N2)
Equations Linear S (11G + 5N + L + 4C + 4R) − 2G − C − R + 2RT
Non-linear 1 + S (2N + 3L)
where:G Set of generator units
C, R Set of capacitor banks and shunt reactors respectivelyS Set of scenarios (base case plus contingencies)L Set of transmission lines
RT Set of transformersN Set of busesJ Set of voltage control areas in the power system
Illustrative case:
The optimization model used for the illustrative case is characterized by: G=3, C=2, R=2,
S=8, L=2, N=2, J=1, and RT=0 . Then, the resulting optimization problem size is defined
by 3 binary variables, and a total of 308 real variables. The total number of equations is
554 , from which 81 are non-linear. The run-time for solving the proposed formulation in
the proposed illustrative case was 3 seconds on a 1.86GHz Pentium machine.
4.5.2 Alternative formulations
The optimization problem for the VAR capacity market settlement has been tested witha 2 bus and a 39 buses case studies (see Chapter 6). Decomposition techniques can beused to obtain a better efficiency in the optimization process. This section presents twosimple approaches, based on voltage control areas, and using the Benders decompositionmethodology. In the research literature many other approaches can be found using moresophisticated methodologies [Zhang and Tolbert, 2005].
4.5.2.1 Voltage control areas
Voltage control, unlike frequency/active power control, is a local problem. There-fore, the global voltage control problem can be simplified in a set of local voltagecontrol sub-problems, which are associated with smaller regions of the power system.This simplification has been widely used for the Secondary Voltage Control approaches[Lagonotte et al., 1989, Arcidiacono et al., 1993].
Under this assumption, the optimization problem for the VAR capacity market can bedecomposed into a set of sub-problems. Each sub-problem will cover a smaller electric
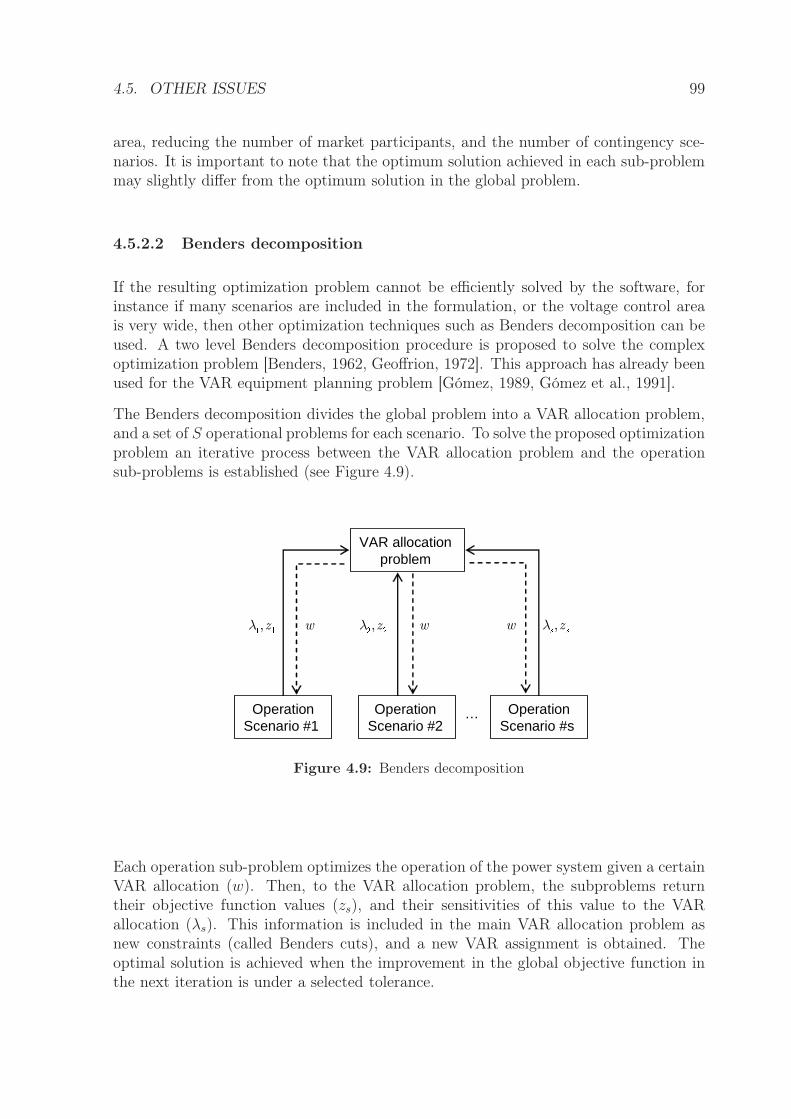
4.5. OTHER ISSUES 99
area, reducing the number of market participants, and the number of contingency sce-narios. It is important to note that the optimum solution achieved in each sub-problemmay slightly differ from the optimum solution in the global problem.
4.5.2.2 Benders decomposition
If the resulting optimization problem cannot be efficiently solved by the software, forinstance if many scenarios are included in the formulation, or the voltage control areais very wide, then other optimization techniques such as Benders decomposition can beused. A two level Benders decomposition procedure is proposed to solve the complexoptimization problem [Benders, 1962, Geoffrion, 1972]. This approach has already beenused for the VAR equipment planning problem [Gómez, 1989, Gómez et al., 1991].
The Benders decomposition divides the global problem into a VAR allocation problem,and a set of S operational problems for each scenario. To solve the proposed optimizationproblem an iterative process between the VAR allocation problem and the operationsub-problems is established (see Figure 4.9).
VAR allocation problem
OperationScenario #1
Operation Scenario #2
OperationScenario #s
…
,zλ ,zλ , zλw w w
Figure 4.9: Benders decomposition
Each operation sub-problem optimizes the operation of the power system given a certainVAR allocation (w). Then, to the VAR allocation problem, the subproblems returntheir objective function values (zs), and their sensitivities of this value to the VARallocation (λs). This information is included in the main VAR allocation problem asnew constraints (called Benders cuts), and a new VAR assignment is obtained. Theoptimal solution is achieved when the improvement in the global objective function inthe next iteration is under a selected tolerance.
100 CHAPTER 4. VAR MARKET SETTLEMENT
4.6 Conclusions
This chapter has presented the VAR capacity market settlement, which is based on anoptimization problem. The proposed formulation selects the best VAR capacity bids thatminimize the annual cost of the VQ service procurement, meeting certain security andoperational constraints, which are defined both for normal and contingency scenarios.
The bids for the different VAR supplying agents that participate in the annual auctioninclude VAR capacity and price. The bid structure should only consider those costsassociated with the installed VAR capacity and those required for making the installedcapacity available. Additionally, selected bids will receive a compensation for the use ofthe purchased VAR capacity, and for the loss of benefits due to a reduction in the activepower output in order to increase the VAR capacity. Then, the resulting bid functionfor VAR capacity includes fixed and variable costs.
The detailed formulation of the annual VAR capacity market must take into accountevery single hour in the year with their corresponding operating situations. It has beenfound that a practical approach to solve the VAR market problem is to analyze twobase scenarios representing the maximum requirements for VAR generation and VARabsorption in the power system. These scenarios correspond to the operating situationsassociated to peak demand and low demand hours.
The analysis also found that the operation under contingency scenarios may requireadditional VAR capacity than that calculated in the two previous base scenarios. Theseoperating situations comprise a single or multiple unavailability of a power system de-vice. For simplicity, it is recommended that not all the possible contingencies are takeninto account, and a pre-selection is carried out of those contingencies with the highestimpact on VAR market costs.
This chapter proposes to model the VAR capacity market settlement in an optimizationproblem. The objective function of the optimization problem includes the costs derivedfrom the purchase contracts of VAR capacity, and other operational costs such as theregulated payment for VAR capacity use, voltage quality penalties, transmission losses,and generation redispatch. The optimization problem also considers the constraints thatdefine the power flow equations, security limits of the power system operation, and thedynamic performance of the different VAR sources.
The resulting optimization problem is non-linear, and includes real and binary variables.The problem has been coded in GAMS and solved using specific mixed-integer non-linearprogramming tools. The application of the proposed formulation to large VAR capacitymarkets may require decomposition techniques to be run in a commercial optimizationsoftware.
The resulting information obtained from the output of the optimization problem for theVAR capacity market settlement is twofold, i) the selection of the best VAR capacitybids, ii) and the sensitivities of the VAR constraints with the overall VAR costs. Thesesensitivities are based on the Lagrange multipliers, and will be used in the next chapterto remunerate the VAR supplying agents and to charge the VAR demand.
4.7. REFERENCES 101
4.7 References
[Arcidiacono et al., 1993] Arcidiacono, V., Corsi, S., and Marannino, P. (1993). Thevoltage and reactive power control of enel transmission system. IEE Colloquium onInternational Practices in Reactive Power Control, page 1.
[Barquin et al., 1998] Barquin, J., Soler, D., Largo, O., Relano, G., and de la Fuente, I.(1998). On the Cost of the Reactive Power Generation and Voltage Support Service.Symposium on Bulk Power System Dynamics and Control IV.
[Benders, 1962] Benders, J. F. (1962). Partitioning methods for solving mixed variablesprogramming problems. Numerische Mathematik, 4:238–252.
[Billinton, 2002] Billinton, R. (2002). Economic cost of non-supply. Power EngineeringSociety Winter Meeting, 2002. IEEE, 2.
[Brooke et al., 1988] Brooke, A., Kendrick, D., Meeraus, A., et al. (1988). GAMS: AUser’s Guide. The Scientific Press.
[Bussieck and Drud, 2001] Bussieck, M. and Drud, A. (2001). Sbb:A new solver for mixed integer nonlinear programming. Slides:www.gams.com/presentations/or01/sbb.pdf; SBB user manual (2002):www.gams.com/solvers/sbb.pdf.
[Carrasco and Fernández, 1996] Carrasco, R. and Fernández, P. (1996). Introducción alos métodos de Monte Carlo. Universidad Politécnica de Valencia, Valencia.
[Coveyou and Macpherson, 1967] Coveyou, R. R. and Macpherson, D. (1967). Fourieranalysis of uniform random number generators. Journal of the Association for Com-puting Machinery, 14(1):100–119.
[Ejebe et al., 1995] Ejebe, G., Irisarri, G., Mokhtari, S., Obadina, O., Ristanovic, P.,and Tong, J. (1995). Methods for contingency screening and ranking for voltagestability analysis of power systems. 1995 IEEE Power Industry Computer ApplicationConference, 1995. Conference Proceedings., pages 249–255.
[Ejebe and Wollenberg, 1979] Ejebe, G. and Wollenberg, B. (1979). Automatic contin-gency selection. IEEE Transactions on Power Apparatus and Systems, pages 97–109.
[Ekwue, 1991] Ekwue, A. (1991). A review of automatic contingency selection algo-rithms for on-line security analysis. Third International Conference on Power SystemMonitoring and Control, 1991, pages 152–155.
[Frías et al., 2005] Frías, P., Soler, D., and Gómez, T. (2005). Valuation of reactivepower zonal capacity payments. Power Systems Computation Conference Proceedings,2005 Liege (Belgium), 1.
[Geoffrion, 1972] Geoffrion, A. M. (1972). Generalized benders decomposition. Journalof Optimization Theory and Applications, 10(4):237–260.
102 BIBLIOGRAPHY
[Gómez, 1989] Gómez, T. (1989). Localización y dimensionamiento de nuevos elementosde compensación de potencia reactiva en redes eléctricas de transporte atendiendo aconsideraciones de carácter técnico y económico: costes de instalación y explotación,y criterios de seguridad. PhD thesis, Universidad Politécnica de Madrid.
[Gómez et al., 1991] Gómez, T., Pérez-Arriaga, I. J., Lumbreras, J., and Parra, V. M.(1991). A security-constrained decomposition approach to optimal reactivepowerplanning. IEEE Transactions on Power Systems, 6(3):1069–1076.
[Kim et al., 2004] Kim, S. G., Outhred, H., and MacGill, I. (2004). Solving a nodal spotmarket with voltage value functions using a hybrid optimization algorithm. PowerSystem Technology, 2004. PowerCon 2004. 2004 International Conference on, 1.
[Lagonotte et al., 1989] Lagonotte, P., Sabonnadiere, J. C., Leost, J. Y., and Paul, J. P.(1989). Structural analysis of the electrical system: application to secondary voltagecontrol in france. IEEE Transactions on Power Systems, 4(2):479–486.
[Law and Kelton, 1997] Law, A. M. and Kelton, W. D. (1997). Simulation Modellingand Analysis. McGraw-Hill Higher Education.
[Malaman et al., 2001] Malaman, R., Afonso, J., Lo Schiavo, L., Romero, A., Sepul-veda, C., Vrolijk, R., and Wharmby, B. (2001). Quality of electricity supply: Initialbenchmarking on actual levels, standards and regulatory strategies. Council of Euro-pean Energy Regulators (CEER).
[Martínez-Crespo et al., 2006] Martínez-Crespo, J., Usaola, J., and Fernández, J. L.(2006). Security-constrained optimal generation scheduling in large-scale power sys-tems. IEEE Transactions on Power Systems, 21(1):321–332.
[Rothwell and Gómez, 2003] Rothwell, G. and Gómez, T. (2003). Principles of Elec-tricity Economics: Regulation and Deregulation. IEEE Press.
[Stolbjerg-Drud, 1993] Stolbjerg-Drud, A. (1993). Gams/conopt. GAMS-The SolverManuals. Washington DC: GAMS Development Corporation.
[von Neumann, 1951] von Neumann, J. (1951). Various techniques used in connectionwith random digits. Applied Math Series, 12:36–38.
[Zhang and Tolbert, 2005] Zhang, W. and Tolbert, L. M. (2005). Survey of reactivepower planning methods. Power Engineering Society General Meeting, 2005. IEEE,pages 1430–1440.
CHAPTER 5
Remuneration and charging criteria in the
VAR capacity market
This chapter presents a remuneration mechanism for the procurement of VAR capac-ity and a charging scheme for the demand in the proposed VAR capacity market.
First, the economic flows in the VAR market are described. On the one hand, the re-muneration of the selected VAR sources is based on long-term marginal pricing. On theother hand, the charging scheme is based on the Cooperative Game Theory, and willdifferentiate the demand of VAR resources under normal operating conditions, and theover costs associated with the contingencies.
103
104 CHAPTER 5. VAR ECONOMIC FLOWS
5.1 Economic settlement
In the previous chapter, the methodology for the VAR capacity market auction waspresented. This section introduces the economic settlement in the VAR capacity market,comprising the economic flows between all the market participants. The main principlesthat have been considered for the design of the economic settlement are:
• Reward the providers of VAR capacity, and charge those agents who benefit fromthe VAR procurement [FERC, 2005].
• It should guarantee that all agents recover their incurred costs.
• It should send efficient signals to the VAR demand and procurement of the VARcapacity, in order to minimize long-term costs.
• It should maximize net social benefit.
• It should guarantee the revenue reconciliation: the sum of the charges to thedemand of the VAR capacity should equal the sum of the remuneration to theselected VAR sources and the other operating costs.
Market agents in the VAR capacity market can be classified into VAR suppliers andVAR demand. As stated in the previous chapters, the VAR is procured by generators,capacitor banks, shunt reactors, SVCs and STATCOM devices, who will receive an eco-nomic compensation for the procurement. On the other hand, the VAR capacity isdemanded by the system loads, and by the contingency situations due to the unavail-ability of the power system devices (see Figure 5.1). In some operating conditions, loadscan reduce the needs of VAR capacity, and therefore can receive remuneration, as itwill be discussed in the next sections. This thesis dissertation proposes that the costsfor the purchase of VAR capacity and other operational costs considered in the marketsettlement should be charged to those agents that demand VAR.
For the economic flow definition, it is important to distinguish between the economicsignal that the participating agents receive, and the desired economic volume to berecovered through the VAR capacity market. The marginal prices, which are obtainedfrom the optimization problem used for the VAR capacity market clearing, include thecomplete information on the impact on the total costs associated with the VAR market.As will be discussed later, these marginal prices are divided into different terms for theappropriate remuneration and payment.
On the other hand, the costs included in the objective function of the VAR capacitymarket comprise the VAR capacity purchase and other estimated operational costs.This thesis dissertation proposes that only those costs directly associated with the VARmanagement are recovered through the VAR capacity market, as there are other mech-anisms for recovering some of the costs included in the objective function, such as theenergy losses.
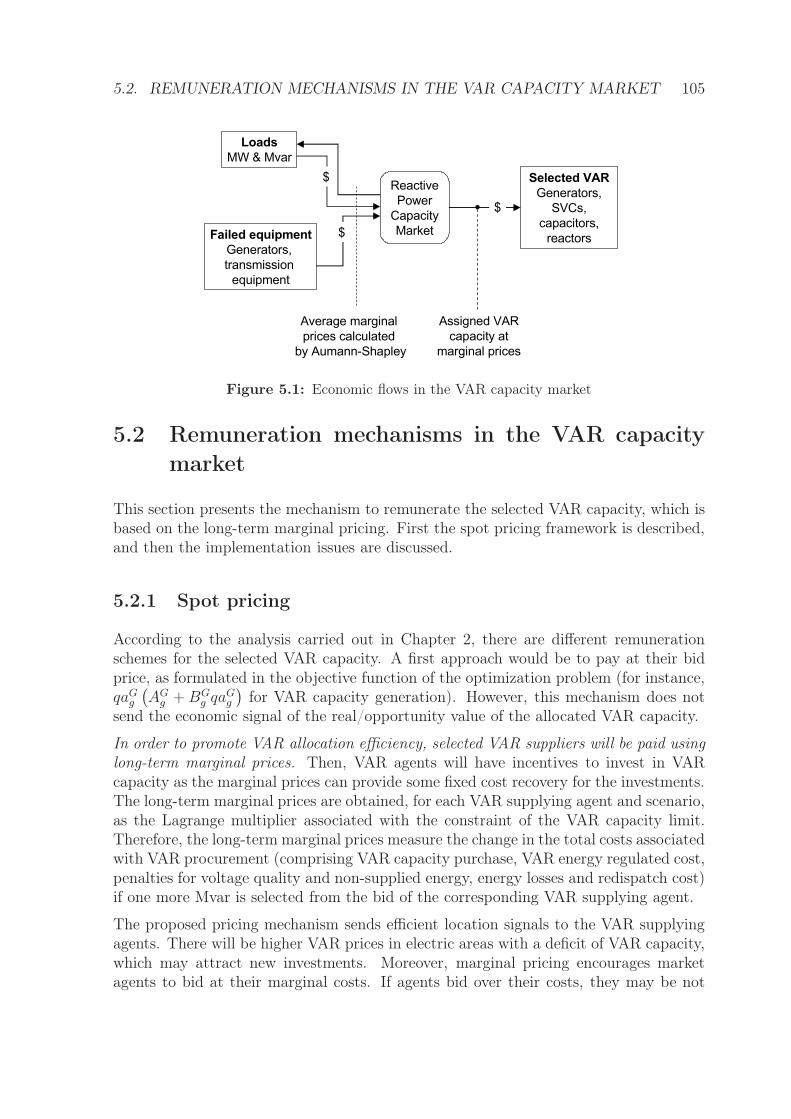
5.2. REMUNERATION MECHANISMS IN THE VAR CAPACITY MARKET 105
Reactive Power
Capacity Market
Selected VAR
Generators, SVCs,
capacitors, reactors
Loads
MW & Mvar
Failed equipment
Generators, transmission
equipment
Assigned VAR capacity at
marginal prices
Average marginal prices calculated
by Aumann-Shapley
$
$
$
Figure 5.1: Economic flows in the VAR capacity market
5.2 Remuneration mechanisms in the VAR capacity
market
This section presents the mechanism to remunerate the selected VAR capacity, which isbased on the long-term marginal pricing. First the spot pricing framework is described,and then the implementation issues are discussed.
5.2.1 Spot pricing
According to the analysis carried out in Chapter 2, there are different remunerationschemes for the selected VAR capacity. A first approach would be to pay at their bidprice, as formulated in the objective function of the optimization problem (for instance,qaG
g
(
AGg + BG
g qaGg
)
for VAR capacity generation). However, this mechanism does notsend the economic signal of the real/opportunity value of the allocated VAR capacity.
In order to promote VAR allocation efficiency, selected VAR suppliers will be paid usinglong-term marginal prices. Then, VAR agents will have incentives to invest in VARcapacity as the marginal prices can provide some fixed cost recovery for the investments.The long-term marginal prices are obtained, for each VAR supplying agent and scenario,as the Lagrange multiplier associated with the constraint of the VAR capacity limit.Therefore, the long-term marginal prices measure the change in the total costs associatedwith VAR procurement (comprising VAR capacity purchase, VAR energy regulated cost,penalties for voltage quality and non-supplied energy, energy losses and redispatch cost)if one more Mvar is selected from the bid of the corresponding VAR supplying agent.
The proposed pricing mechanism sends efficient location signals to the VAR supplyingagents. There will be higher VAR prices in electric areas with a deficit of VAR capacity,which may attract new investments. Moreover, marginal pricing encourages marketagents to bid at their marginal costs. If agents bid over their costs, they may be not
106 CHAPTER 5. VAR ECONOMIC FLOWS
selected in the auction. Finally generators procuring VAR capacity have a clear incentiveto reduce their failure-rates. The failure-rate affects the selection of VAR capacity bids,the higher the failure-rate the less VAR capacity will be selected.
The proposed formulation for the costs in the VAR capacity market (4.11) consideredthat selected agents are paid at their bid. If agents are paid at their marginal price, thenthe total costs will increase when marginal prices are higher than bids. Notwithstanding,the optimal selection of VAR capacity does not change.
Next, a simplified formulation of the VAR capacity market settlement is presented inorder to justify the remuneration of the selected VAR capacity.
5.2.1.1 Mathematical formulation
The simplified formulation of the objective function (5.1) only considers the cost of VARgeneration capacity purchase and the regulated payment of VAR energy. Additionally,all the scenarios are considered to have the same duration. The formulation considersthe reactive power balance equation (5.2), where the VAR generation must be positive(5.4) and below the selected VAR capacity (5.3). Finally, the selected VAR capacitymust be lower than the installed VAR (5.5).
minqag ,qg,s
∑
g
(
Bg · qag +∑
s AE · qg,s
)
(5.1)
s.t.∑
g qg,s = QDs ∀s : λqg,s (5.2)
qg,s ≤ qag ∀g, ∀s : µq+g,s (5.3)
qg,s ≥ 0 ∀g, ∀s : µq−g,s (5.4)
qag ≤ Qmaxg ∀g : γg (5.5)
where:Bg Bid of generation g (e/Mvar)qag Selected reactive power generation capacity to generator
g (Mvar)AE Regulated compensation for VAR generation energy
(e/Mvarh)qg,s Reactive power generation from generator g in scenarios
(Mvar)QDs Reactive power demand in the scenario s (Mvar)Qmax
g Maximum reactive power generation of generator g(Mvar)
λqg,s, µ
q+g,s, µ
q−g,s, γg Lagrange multipliers of the corresponding constraints
The Lagrange function of the simplified formulation for the VAR capacity market isobtained in (5.6).
5.2. REMUNERATION MECHANISMS IN THE VAR CAPACITY MARKET 107
L =∑
g
(
Bg · qag +∑
s
AE · qg,s
)
+∑
s
λqg,s
(
QDs −∑
g
qg,s
)
+∑
s
∑
g
µq+g,s (qg,s − qag) (5.6)
−∑
s
∑
g
µq−g,s · qg,s
+∑
g
γg
(
qag − Qmaxg
)
The optimality condition corresponding to the selection of the VAR capacity of agentg is formulated in (5.7). If the remuneration to VAR agent g is based on the sum ofLagrange multipliers associated with the (5.3) constraint, then agent g will cover itsvariable costs Bg. In addition, if the selected capacity reached its maximum, then agentg would receive a higher remuneration than its variable costs.
∂L
∂qag
= 0 →
Bg −∑
s
µq+g,s + γg = 0 →∑
s
µq+
g,s = Bg + γg (5.7)
On the other hand, the optimal condition for the use of the VAR capacity from agentg in scenario s is obtained in (5.8). Then, the marginal price of VAR use is obtained asthe sum of the regulated payment AE , an extra payment if the agent g in the scenario sis at its maximum selected capacity µq+
g,s, and the positive difference between the VARprice in scenario s and the regulated VAR price if the agent g is not selected µq−
g,s.
∂L
∂qg,s= 0 →
AE − λqg,s + µq+
g,s − µq−g,s = 0 →
λqg,s
= AE+ µq+
g,s− µq−
g,s(5.8)
The previous result is obtained from the optimally complementary conditions, as for-mulated in (5.9).
108 CHAPTER 5. VAR ECONOMIC FLOWS
λqg,s = AE + µq+
g,s − µq−g,s
µq+g,s (qg,s − qag) = 0 (5.9)
µq−g,s · qg,s = 0
qg,s = 0
λqg,s = AE − µq−
g,s
µq+g,s = 0
0 < qg,s < qag
λqg,s = AE
µq+g,s = 0
µq−g,s = 0
qg,s = qag
λqg,s = AE + µq+
g,s
µq−g,s = 0
(5.10)
Observe, that when the agent g is unavailable (qg,s = 0), its corresponding µq+g,s = 0,
and therefore it will not receive any remuneration in that scenario, as formulated in(5.7). The remuneration for the use of the VAR capacity will be defined in the followingsections.
5.2.2 Implementation mechanism
The long-term marginal prices for the selected sources are obtained from the VARcapacity constraints. Generator VAR capacity constraints are formulated in (4.35) and(4.36). Capacity constraints for capacitor banks are formulated in (4.37), and in (4.38)for shunt reactors.
The remuneration that each selected VAR source will receive is obtained as the productof the VAR capacity selected times the corresponding long-term marginal price. Thelong-term marginal price will be calculated as the sum of the marginal prices for eachscenario, except for those scenarios where the selected VAR source failed. The proposedremuneration mechanism includes payments for the selected VAR generation and ab-sorption capacity, and is formulated in (5.11) for generators and STATCOM devices,(5.12) for capacitor banks, and (5.13) for shunt reactors. The payments to SVCs areobtained as a combination of (5.12) and (5.13).
Rg = qaGg
∑
s 6=sg
µGg,s + qaA
g
∑
s 6=sg
µAg,s (5.11)
Rc = qac
∑
s
µc,s (5.12)
5.2. REMUNERATION MECHANISMS IN THE VAR CAPACITY MARKET 109
Rr = qar
∑
s
µr,s (5.13)
where:Rg Annual remuneration for the selected VAR capacity of
generator g (e-year)Rc Annual remuneration for the selected VAR capacity of
capacitor bank g (e-year)Rr Annual remuneration for the selected VAR capacity of
shunt reactor g (e-year)qaG
g , qaAg Assigned reactive power generation/absorption capacity
to generator g (Mvar)qac, qar Reactive power capacity assigned to capacitor bank
c/shunt reactor r, respectively (Mvar)µG
g,s, µAg,s Lagrange multiplier of the equation of the selected VAR
capacity generation/absorption to generator g inscenario s
µc,s, µr,s Lagrange multiplier of the equation of the selected VARcapacity of capacitor bank c/shunt reactor r in scenarios
Illustrative case:
The remuneration of the selected VAR sources is presented in the next table. Observe thatall VAR agents are paid at their bids, except Generator #1 and the capacitor bank that arepaid over their bids. The over-recovery can be used by the agent to pay the capital costs.Moreover, these high VAR prices are a clear incentive for new VAR agents to participatein the capacity market.
Table 5.1: Remuneration of selected VAR sources
Market agent Selected
capacity
Bid price Marginal
price
Total
remuneration
(Mvar) (e/kvar) (e/kvar) (ke-year)
Generator 1 25 3 6.3 157
Generator 2 34 2 2 68
Generator 3 49 5 5 245
Capacitor bank 2 9 10 10.3 93
110 CHAPTER 5. VAR ECONOMIC FLOWS
5.3 Charging mechanisms in the VAR capacity market
The aim of the charging mechanism is to send efficient signals to the demand of the VQservice and also to cover the operation costs and payments described in the previoussection. The principle of cost causality is applied to distribute the charges to paythe selected VAR suppliers. For this purpose, two types of payment mechanisms aredifferentiated. First, load demands will be charged for the VAR capacity costs associatedwith the normal operation of the power system. Second, generators and transmissionlines, because of their failure rates, impose extra requirements on VAR capacity. Thisadditional VAR purchase will be charged to the devices responsible for contingencies.The distribution of the charges is obtained using marginal pricing together with theCooperative Game theory.
This section is structured in two parts: first, charges for VAR capacity requirementsunder normal operation are presented, and then the charges for contingency scenariosare described.
5.3.1 Allocating VAR capacity costs under normal operating
conditions
First, a proposal for charging the agents responsible for VAR capacity needs undernormal conditions is presented. Then the implementation issues of the approach to theVAR capacity market are discussed.
5.3.1.1 Proposed charging mechanism
This subsection justifies the use of a curtailed marginal price based on the CooperativeGame theory to distribute the charges of the VAR capacity between the active andreactive power consumption of the loads. First, the different alternatives for pricing theVAR capacity demand are analyzed. Then the influence of active and reactive powerload in the VAR capacity needs is discussed. And finally, this section defines a curtailedmarginal signal to charge loads.
Selection of the pricing mechanism There are many alternatives to distribute thecosts between the agents that demand the service. The simplest methodology is basedon a fixed price for the volume of load consumed. However, this mechanism would notsend location signals to the demand.
More sophisticated approaches are those that are based on marginal pricing. Chargingagents in proportion to their marginal cost, induce agents into economic efficiency. How-ever, marginal charging may recover more than the incurred costs in the VAR capacitymarket. This over-recovery can be eliminated by proportionally adjusting the resultingcharges. This simplification may lead to situations were the charge is smaller than the
5.3. CHARGING MECHANISMS IN THE VAR CAPACITY MARKET 111
service cost, which is the result of a cross-subsidy between other agents participating inthe market [PSR, 2005].
Another interesting approach is one which is based on incremental cost allocation. Underthis scheme, charges are calculated as the increase in the service costs when a new loadparticipates in the VAR capacity market. This mechanism recovers all the costs of theservice, and eliminates any possible cross-subsidy. However, charges are very dependenton the entrance order of the loads when calculating the incremental cost. This limitationis eliminated if all the possible permutations of entrance orders of loads are considered,which is called the Shapley allocation [Aumann and Shapley, 1975]. The main drawbackof this alternative is the high computational effort needed to calculate all the possibleload-entrance combinations. Moreover, the size of each agent influences in the charging.If two agents existed with the same sensitivity with the total costs, they would havedifferent per-unit charges depending on their relative size.
The Aumann-Shapley cost allocation [Young, 1994] takes into account all the possiblecombinations of the agent entrance in the service, and also splits the agents size inmany sub-agents in order to avoid the size influence on charging. The mathemati-cal justification of its main characteristics can be found in [Barbosa, 1998, PSR, 2005,Ribeiro, 2005]. Additionally, the economical interpretation of the axioms of the Aumann-Shapley pricing [Billera and Heath, 1982, Lin et al., 2006] give out the most importantcharacteristics of this allocation method:
• Cost-sharing, the generated revenue exactly recovers the total costs.
• Additivity, the price based on the total cost function is equal to the sum of pricescomputed with respect to the additive components of the cost function.
• Positivity, the demand of the consumer actually contributes to total costs andshould have a non-negative price.
• Rescaling, a linear change in the units of measurement of the demand results in asimultaneous change in the price.
• Consistency, two consumers that have the same effect on the cost function shouldbe charged the same price.
To summarize, the Aumann-Shapley methodology induces economic efficiency and fairdistribution of the charges. Moreover, all the service costs are recovered with the col-lected charges, and the resulting distribution does not depend on the shape of theobjective cost function.
Active and reactive power influence on VAR capacity needs Both the activepower and reactive power consumption of loads defines the VAR needs in the power sys-tem. For instance, if all loads had a unit power factor, the power system would still needsome VAR support to maintain voltages and guarantee the active power transactions.
112 CHAPTER 5. VAR ECONOMIC FLOWS
The influence of active and reactive power loads in the objective function of the VARcapacity market is analyzed in this thesis dissertation using the Aumann-Shapley allo-cation methodology which obtains the participation factors for each load. These factorsare calculated by integrating the long-term marginal costs of active and reactive powerload over an specified interval for load variation [Young, 1994], as formulated in (5.14)and (5.15).
λpn =
∫ K
0
∂ (CQC + CQE + CV + CD + CP )
∂PDn
dk (5.14)
λqn =
∫ K
0
∂ (CQC + CQE + CV + CD + CP )
∂QDndk (5.15)
where:λp
n, λqn Aumann-Shapley values for active and reactive power
load at bus nPDn, QDn Active and reactive power demand at bus n (MW,Mvar)
K Set of subintervals in the Aumann-Shapley pricingcalculation
Definition of the curtailed marginal signal The Lagrange multipliers, which areused to obtain the Aumann-Shapley values, include the effect of all cost terms in theobjective function, among which stand the economic dispatch of active power CP . Thatis, if the active power load in a bus is increased, then generators will increase their output,and the VAR needs in the system may change. Generally, the variable costs of activepower are much higher than those of VAR procurement, so the Lagrange multiplierswill hide the sensitivity of the load over the VAR costs. Therefore, a curtailed Lagrangemultiplier is used for VAR capacity charging which eliminates the effect of the generatoroutput variable costs.
The sensitivity of the transmission losses is not eliminated from the curtailed Lagrangemultiplier, since this sensitivity is comparable with that of VAR procurement. Moreover,although energy losses are charged using other mechanisms it is important to incorporatetheir sensitivity in the charging signals sent to the demand of VAR capacity.
5.3.1.2 Implementation mechanism
This thesis proposes to charge loads in order to cover the VAR capacity needs undernormal operating conditions. These charges will be defined according to their locationand influence on VAR costs, which are obtained from the Lagrange multipliers of theactive and reactive power balance equations (4.21) and (4.22), respectively. The efficientdistribution of charging is based on the Aumann-Shapley methodology, which will bebased on the curtailed Lagrange multipliers that eliminate the effect of the generation
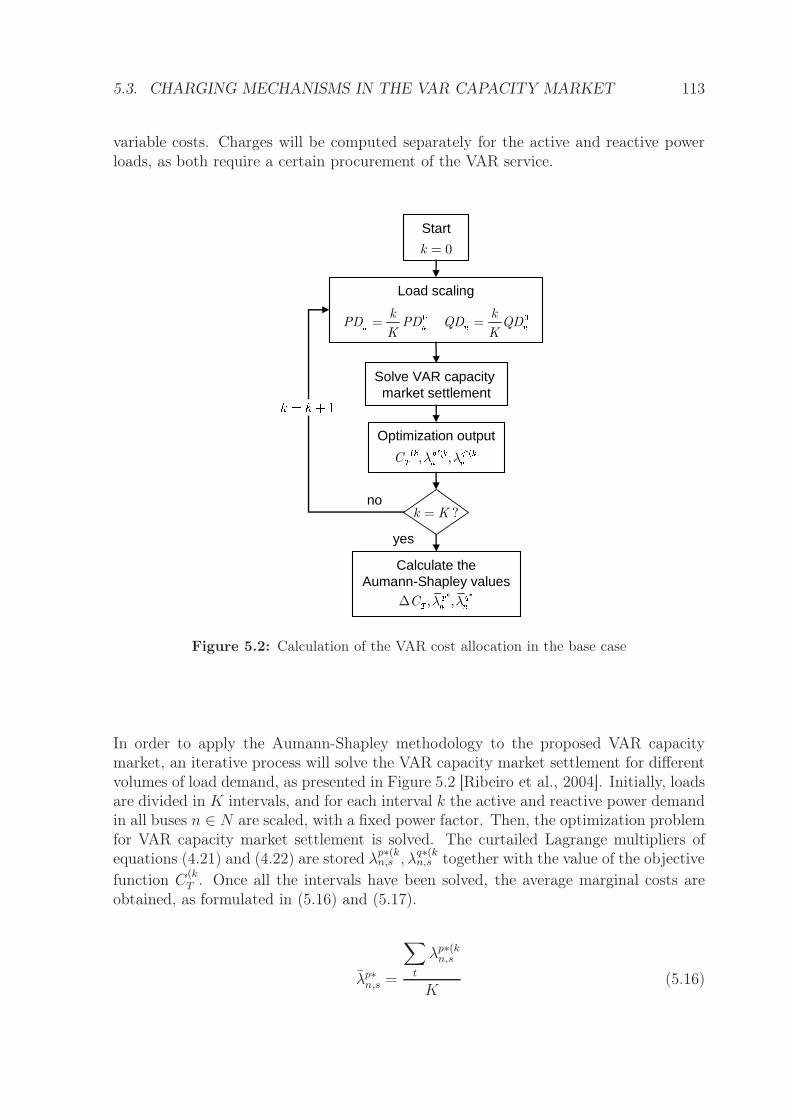
5.3. CHARGING MECHANISMS IN THE VAR CAPACITY MARKET 113
variable costs. Charges will be computed separately for the active and reactive powerloads, as both require a certain procurement of the VAR service.
0k = k kPD PD QD QD
K K= =
Solve VAR capacity market settlement
, ,
C λ λ
, ,
C λ λ∆
?k K=
Load scaling
Optimization output
Calculate the Aumann-Shapley values
Start
yes
no
Figure 5.2: Calculation of the VAR cost allocation in the base case
In order to apply the Aumann-Shapley methodology to the proposed VAR capacitymarket, an iterative process will solve the VAR capacity market settlement for differentvolumes of load demand, as presented in Figure 5.2 [Ribeiro et al., 2004]. Initially, loadsare divided in K intervals, and for each interval k the active and reactive power demandin all buses n ∈ N are scaled, with a fixed power factor. Then, the optimization problemfor VAR capacity market settlement is solved. The curtailed Lagrange multipliers ofequations (4.21) and (4.22) are stored λ
p∗(kn,s , λ
q∗(kn,s together with the value of the objective
function C(kT . Once all the intervals have been solved, the average marginal costs are
obtained, as formulated in (5.16) and (5.17).
λp∗n,s =
∑
t
λp∗(kn,s
K(5.16)
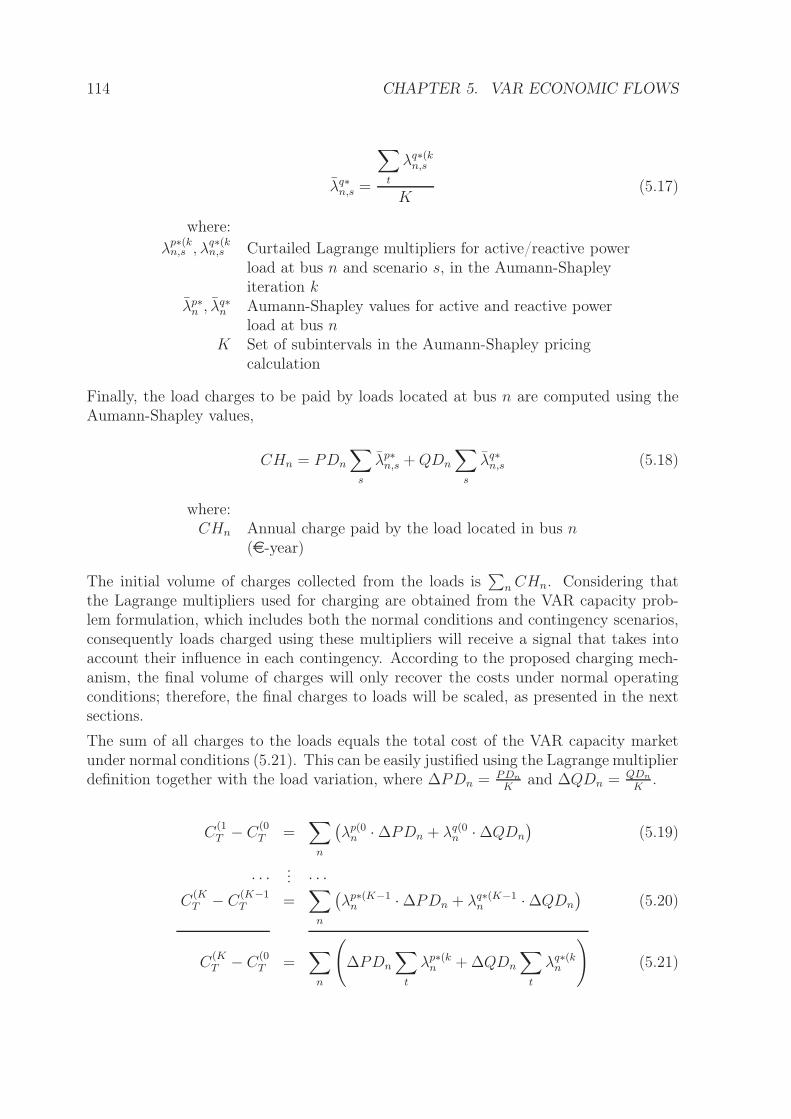
114 CHAPTER 5. VAR ECONOMIC FLOWS
λq∗n,s =
∑
t
λq∗(kn,s
K(5.17)
where:λ
p∗(kn,s , λ
q∗(kn,s Curtailed Lagrange multipliers for active/reactive power
load at bus n and scenario s, in the Aumann-Shapleyiteration k
λp∗n , λq∗
n Aumann-Shapley values for active and reactive powerload at bus n
K Set of subintervals in the Aumann-Shapley pricingcalculation
Finally, the load charges to be paid by loads located at bus n are computed using theAumann-Shapley values,
CHn = PDn
∑
s
λp∗n,s + QDn
∑
s
λq∗n,s (5.18)
where:CHn Annual charge paid by the load located in bus n
(e-year)
The initial volume of charges collected from the loads is∑
n CHn. Considering thatthe Lagrange multipliers used for charging are obtained from the VAR capacity prob-lem formulation, which includes both the normal conditions and contingency scenarios,consequently loads charged using these multipliers will receive a signal that takes intoaccount their influence in each contingency. According to the proposed charging mech-anism, the final volume of charges will only recover the costs under normal operatingconditions; therefore, the final charges to loads will be scaled, as presented in the nextsections.
The sum of all charges to the loads equals the total cost of the VAR capacity marketunder normal conditions (5.21). This can be easily justified using the Lagrange multiplierdefinition together with the load variation, where ∆PDn = PDn
Kand ∆QDn = QDn
K.
C(1T − C
(0T =
∑
n
(
λp(0n · ∆PDn + λq(0
n · ∆QDn
)
(5.19)
· · · ... · · ·C
(KT − C
(K−1T =
∑
n
(
λp∗(K−1n · ∆PDn + λq∗(K−1
n · ∆QDn
)
(5.20)
C(KT − C
(0T =
∑
n
(
∆PDn
∑
t
λp∗(kn + ∆QDn
∑
t
λq∗(kn
)
(5.21)
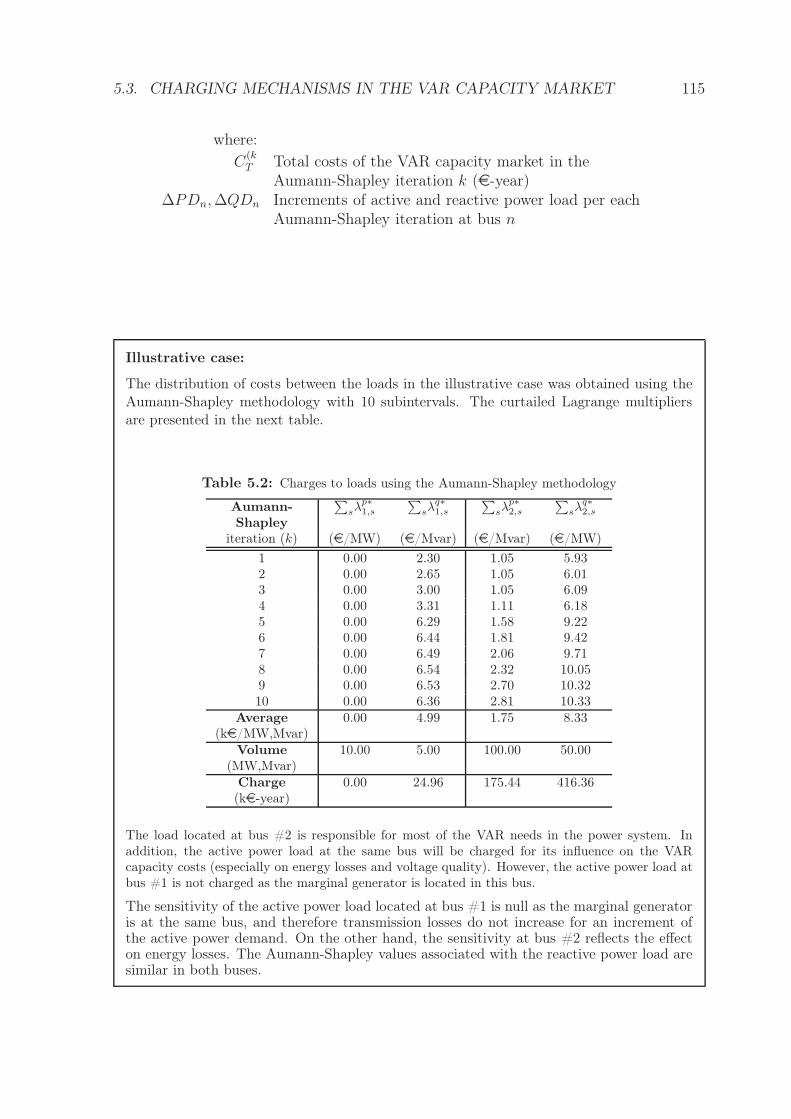
5.3. CHARGING MECHANISMS IN THE VAR CAPACITY MARKET 115
where:C
(kT Total costs of the VAR capacity market in the
Aumann-Shapley iteration k (e-year)∆PDn, ∆QDn Increments of active and reactive power load per each
Aumann-Shapley iteration at bus n
Illustrative case:
The distribution of costs between the loads in the illustrative case was obtained using theAumann-Shapley methodology with 10 subintervals. The curtailed Lagrange multipliersare presented in the next table.
Table 5.2: Charges to loads using the Aumann-Shapley methodology
Aumann-Shapley
∑
sλp∗1,s
∑
sλq∗1,s
∑
sλp∗2,s
∑
sλq∗2,s
iteration (k) (e/MW) (e/Mvar) (e/Mvar) (e/MW)
1 0.00 2.30 1.05 5.932 0.00 2.65 1.05 6.013 0.00 3.00 1.05 6.094 0.00 3.31 1.11 6.185 0.00 6.29 1.58 9.226 0.00 6.44 1.81 9.427 0.00 6.49 2.06 9.718 0.00 6.54 2.32 10.059 0.00 6.53 2.70 10.3210 0.00 6.36 2.81 10.33
Average(ke/MW,Mvar)
0.00 4.99 1.75 8.33
Volume(MW,Mvar)
10.00 5.00 100.00 50.00
Charge(ke-year)
0.00 24.96 175.44 416.36
The load located at bus #2 is responsible for most of the VAR needs in the power system. Inaddition, the active power load at the same bus will be charged for its influence on the VARcapacity costs (especially on energy losses and voltage quality). However, the active power load atbus #1 is not charged as the marginal generator is located in this bus.
The sensitivity of the active power load located at bus #1 is null as the marginal generatoris at the same bus, and therefore transmission losses do not increase for an increment ofthe active power demand. On the other hand, the sensitivity at bus #2 reflects the effecton energy losses. The Aumann-Shapley values associated with the reactive power load aresimilar in both buses.
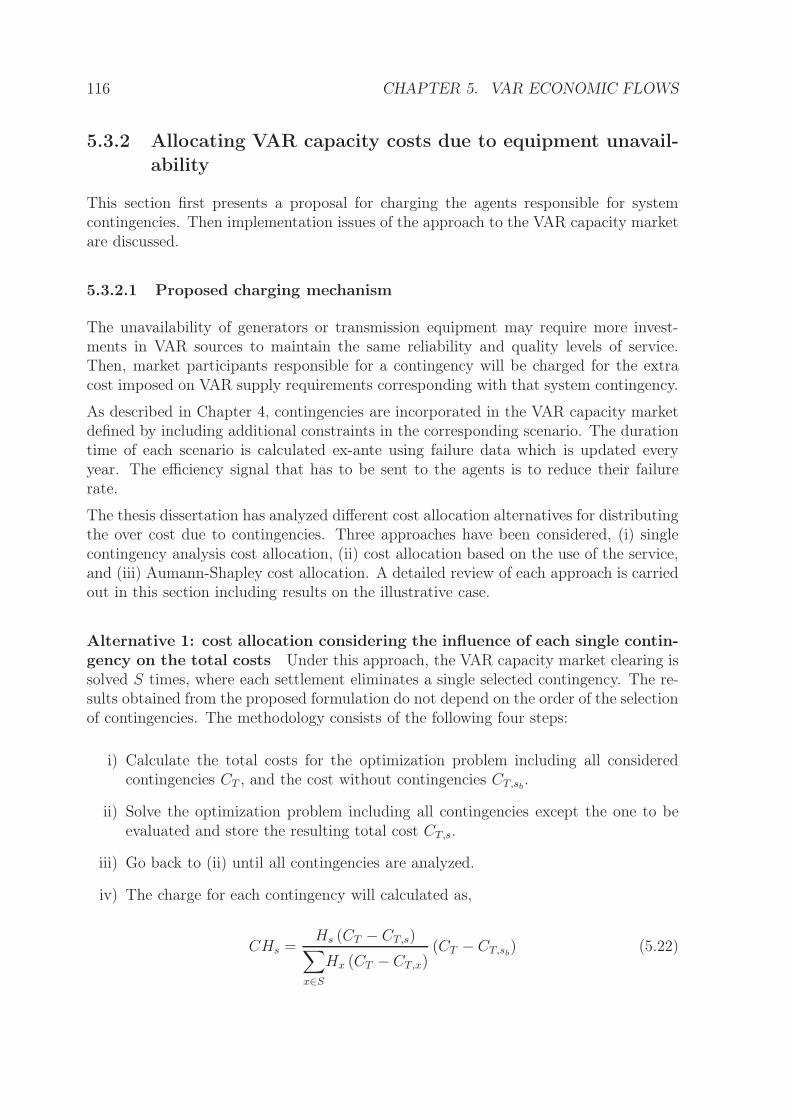
116 CHAPTER 5. VAR ECONOMIC FLOWS
5.3.2 Allocating VAR capacity costs due to equipment unavail-
ability
This section first presents a proposal for charging the agents responsible for systemcontingencies. Then implementation issues of the approach to the VAR capacity marketare discussed.
5.3.2.1 Proposed charging mechanism
The unavailability of generators or transmission equipment may require more invest-ments in VAR sources to maintain the same reliability and quality levels of service.Then, market participants responsible for a contingency will be charged for the extracost imposed on VAR supply requirements corresponding with that system contingency.
As described in Chapter 4, contingencies are incorporated in the VAR capacity marketdefined by including additional constraints in the corresponding scenario. The durationtime of each scenario is calculated ex-ante using failure data which is updated everyyear. The efficiency signal that has to be sent to the agents is to reduce their failurerate.
The thesis dissertation has analyzed different cost allocation alternatives for distributingthe over cost due to contingencies. Three approaches have been considered, (i) singlecontingency analysis cost allocation, (ii) cost allocation based on the use of the service,and (iii) Aumann-Shapley cost allocation. A detailed review of each approach is carriedout in this section including results on the illustrative case.
Alternative 1: cost allocation considering the influence of each single contin-
gency on the total costs Under this approach, the VAR capacity market clearing issolved S times, where each settlement eliminates a single selected contingency. The re-sults obtained from the proposed formulation do not depend on the order of the selectionof contingencies. The methodology consists of the following four steps:
i) Calculate the total costs for the optimization problem including all consideredcontingencies CT , and the cost without contingencies CT,sb
.
ii) Solve the optimization problem including all contingencies except the one to beevaluated and store the resulting total cost CT,s.
iii) Go back to (ii) until all contingencies are analyzed.
iv) The charge for each contingency will calculated as,
CHs =Hs (CT − CT,s)
∑
x∈S
Hx (CT − CT,x)(CT − CT,sb
) (5.22)
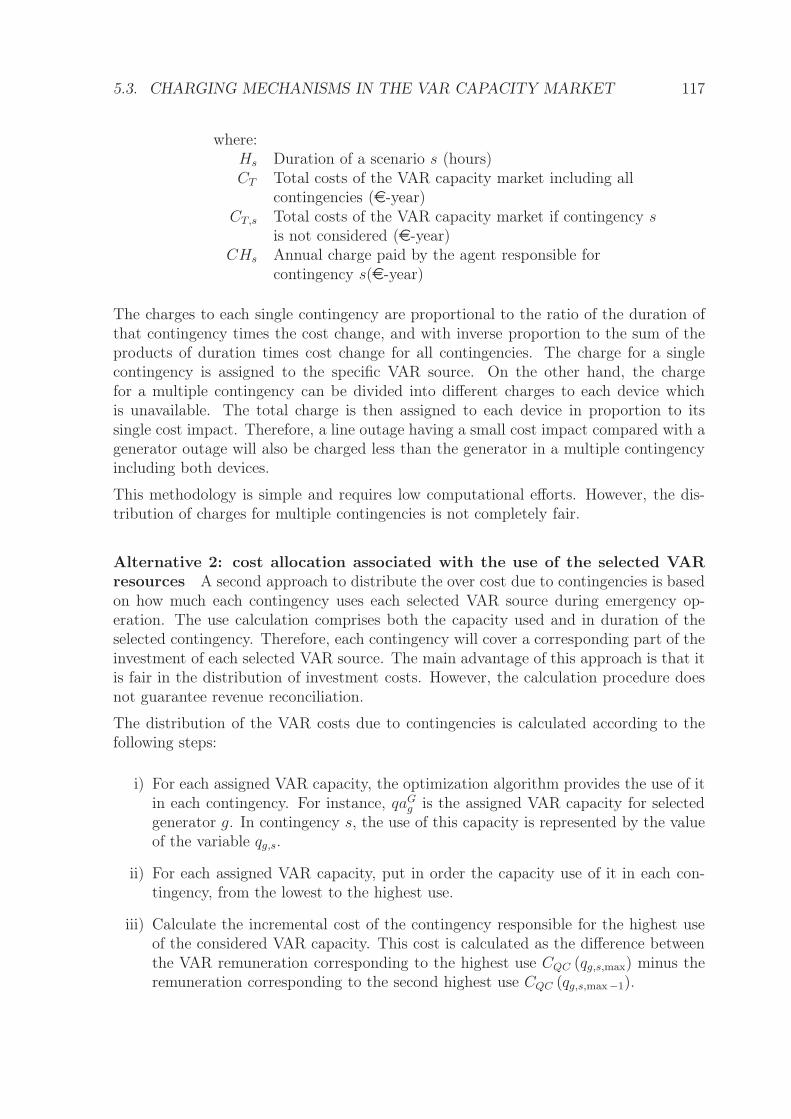
5.3. CHARGING MECHANISMS IN THE VAR CAPACITY MARKET 117
where:Hs Duration of a scenario s (hours)CT Total costs of the VAR capacity market including all
contingencies (e-year)CT,s Total costs of the VAR capacity market if contingency s
is not considered (e-year)CHs Annual charge paid by the agent responsible for
contingency s(e-year)
The charges to each single contingency are proportional to the ratio of the duration ofthat contingency times the cost change, and with inverse proportion to the sum of theproducts of duration times cost change for all contingencies. The charge for a singlecontingency is assigned to the specific VAR source. On the other hand, the chargefor a multiple contingency can be divided into different charges to each device whichis unavailable. The total charge is then assigned to each device in proportion to itssingle cost impact. Therefore, a line outage having a small cost impact compared with agenerator outage will also be charged less than the generator in a multiple contingencyincluding both devices.
This methodology is simple and requires low computational efforts. However, the dis-tribution of charges for multiple contingencies is not completely fair.
Alternative 2: cost allocation associated with the use of the selected VAR
resources A second approach to distribute the over cost due to contingencies is basedon how much each contingency uses each selected VAR source during emergency op-eration. The use calculation comprises both the capacity used and in duration of theselected contingency. Therefore, each contingency will cover a corresponding part of theinvestment of each selected VAR source. The main advantage of this approach is that itis fair in the distribution of investment costs. However, the calculation procedure doesnot guarantee revenue reconciliation.
The distribution of the VAR costs due to contingencies is calculated according to thefollowing steps:
i) For each assigned VAR capacity, the optimization algorithm provides the use of itin each contingency. For instance, qaG
g is the assigned VAR capacity for selectedgenerator g. In contingency s, the use of this capacity is represented by the valueof the variable qg,s.
ii) For each assigned VAR capacity, put in order the capacity use of it in each con-tingency, from the lowest to the highest use.
iii) Calculate the incremental cost of the contingency responsible for the highest useof the considered VAR capacity. This cost is calculated as the difference betweenthe VAR remuneration corresponding to the highest use CQC (qg,s,max) minus theremuneration corresponding to the second highest use CQC (qg,s,max−1).
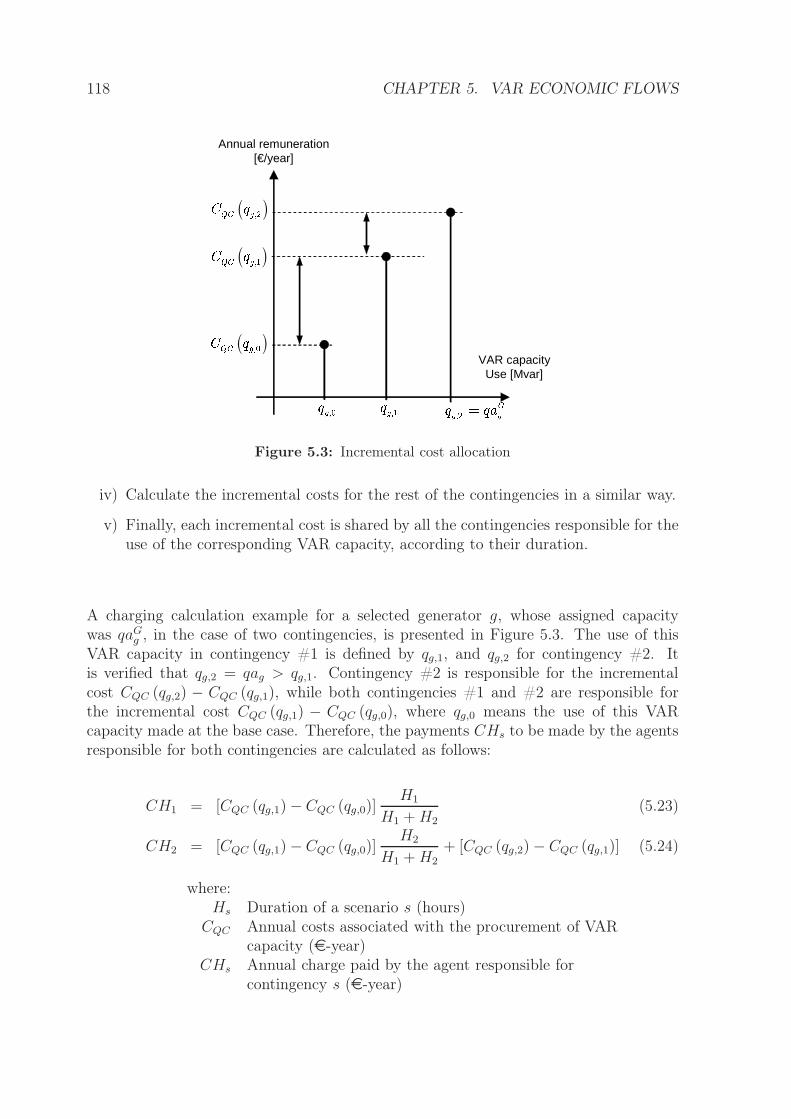
118 CHAPTER 5. VAR ECONOMIC FLOWS
( ) ( )
Annual remuneration[€/year]
VAR capacityUse [Mvar] ( )
Figure 5.3: Incremental cost allocation
iv) Calculate the incremental costs for the rest of the contingencies in a similar way.
v) Finally, each incremental cost is shared by all the contingencies responsible for theuse of the corresponding VAR capacity, according to their duration.
A charging calculation example for a selected generator g, whose assigned capacitywas qaG
g , in the case of two contingencies, is presented in Figure 5.3. The use of thisVAR capacity in contingency #1 is defined by qg,1, and qg,2 for contingency #2. Itis verified that qg,2 = qag > qg,1. Contingency #2 is responsible for the incrementalcost CQC (qg,2) − CQC (qg,1), while both contingencies #1 and #2 are responsible forthe incremental cost CQC (qg,1) − CQC (qg,0), where qg,0 means the use of this VARcapacity made at the base case. Therefore, the payments CHs to be made by the agentsresponsible for both contingencies are calculated as follows:
CH1 = [CQC (qg,1) − CQC (qg,0)]H1
H1 + H2
(5.23)
CH2 = [CQC (qg,1) − CQC (qg,0)]H2
H1 + H2
+ [CQC (qg,2) − CQC (qg,1)] (5.24)
where:Hs Duration of a scenario s (hours)
CQC Annual costs associated with the procurement of VARcapacity (e-year)
CHs Annual charge paid by the agent responsible forcontingency s (e-year)
5.3. CHARGING MECHANISMS IN THE VAR CAPACITY MARKET 119
The sum of both payments equals the remuneration of the selected VAR generator gminus the remuneration.
This methodology requires less computational effort than the previous approach since itonly solves the optimization problem once. However, it lacks fair distribution of chargesin multiple contingencies, and does not guarantee revenue reconciliation.
Alternative 3: Aumann-Shapley cost allocation The analysis presented in thesection 5.3.1 to allocate costs to the loads using the Aumann-Shapley cost allocation canbe easily applied to analyze the influence of each contingency in the total VAR costs.Contingencies can be considered as new agents entering into the VAR capacity marketand demanding new VAR resources. Since the aim of all agents is to obtain the neededVAR at minimum cost, it can be analyzed using the Cooperative Game Theory.
The Aumann-Shapley methodology eliminates the influence of the order of agent en-trance and the impact of the agent size. Moreover, it guarantees charging fairness andrevenue reconciliation. Therefore, the total cost of the VAR capacity market minus thecharges to loads equals the charges to contingencies. In addition, the distribution ofcharges in multiple contingencies can be easily achieved using the sensitivity indices.
Although this alternative requires a higher computational effort, because of the multipleVAR capacity market clearings, it is the selected alternative due to its characteristics offairness in charging distribution for single and multiple contingencies.
5.3.2.2 Implementation of the proposed charging mechanism
This thesis proposes to charge devices responsible for contingencies in order to cover theextra VAR needs under these operating conditions. For instance, the additional VARcapacity needed to meet the security limits in the case of generator unavailability will bepaid by that generator owner. Similarly, the corresponding transmission owner will paythe additional costs due to line unavailability. These charges will be settled according tothe location and influence on VAR costs of each device outage, which is obtained fromlong-term marginal signals based on the Lagrange multipliers using the Aumann-Shapleymethodology.
The procedure to calculate the Aumann-Shapley values is presented in Figure 5.4. Thegenerator and line states are scaled for each of the iterations in the iterative process.Then, for each iteration the VAR capacity market problem is solved. The resultingLagrange multipliers are stored in order to obtain their average values that will settlethe distribution of the charges.
The implementation of the proposed approach requires some considerations on how tomodel the generator unavailability and transmission line trip, which are discussed in thenext paragraphs.
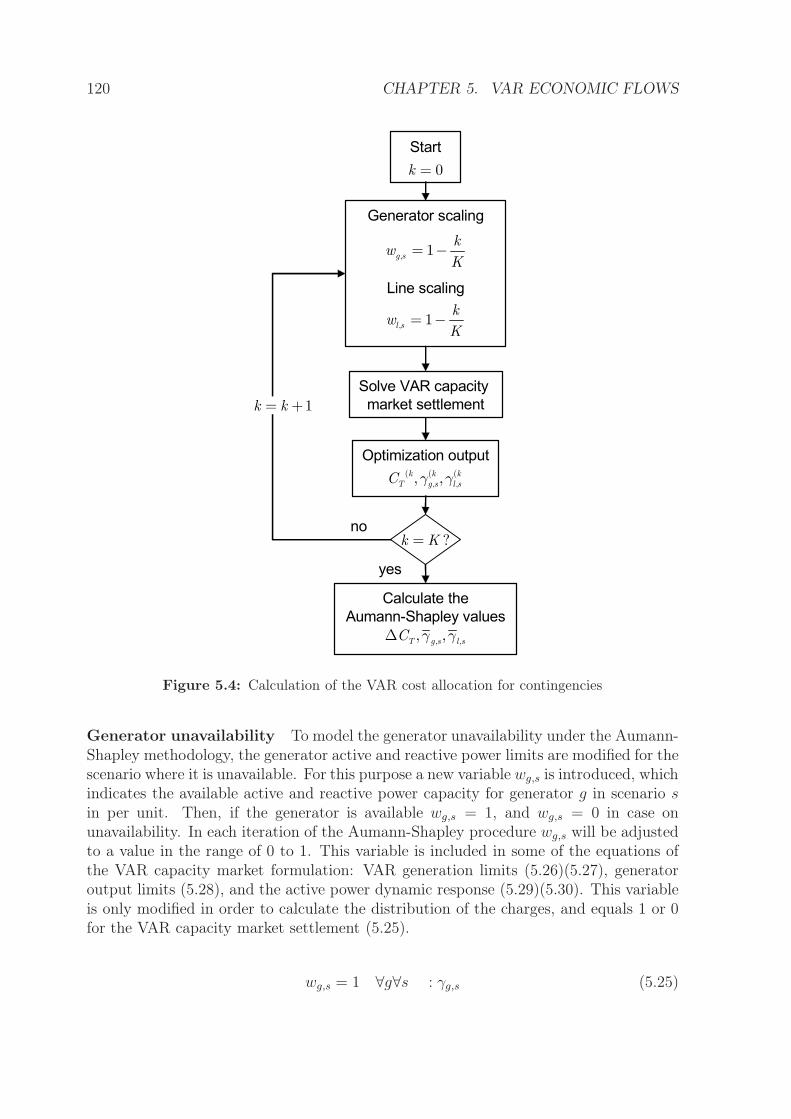
120 CHAPTER 5. VAR ECONOMIC FLOWS
0k =
, 1g s
kw
K= −
Solve VAR capacity
market settlement
( ( (, ,, ,k k k
T g s l sC γ γ
, ,, ,g s l sTC γ γ∆
?k K=
Generator scaling
Line scaling
Optimization output
Calculate the
Aumann-Shapley values
Start
1k k= +
yes
no
, 1l s
kw
K= −
Figure 5.4: Calculation of the VAR cost allocation for contingencies
Generator unavailability To model the generator unavailability under the Aumann-Shapley methodology, the generator active and reactive power limits are modified for thescenario where it is unavailable. For this purpose a new variable wg,s is introduced, whichindicates the available active and reactive power capacity for generator g in scenario sin per unit. Then, if the generator is available wg,s = 1, and wg,s = 0 in case onunavailability. In each iteration of the Aumann-Shapley procedure wg,s will be adjustedto a value in the range of 0 to 1. This variable is included in some of the equations ofthe VAR capacity market formulation: VAR generation limits (5.26)(5.27), generatoroutput limits (5.28), and the active power dynamic response (5.29)(5.30). This variableis only modified in order to calculate the distribution of the charges, and equals 1 or 0for the VAR capacity market settlement (5.25).
wg,s = 1 ∀g∀s : γg,s (5.25)
5.3. CHARGING MECHANISMS IN THE VAR CAPACITY MARKET 121
0 ≤ qAg,s ≤ wg,s · qaA
g ∀g ∈ G , s ∈ S (5.26)
0 ≤ qGg,s ≤ wg,s · qaG
g ∀g ∈ G , s ∈ S (5.27)
wg,s · ug · Pming ≤ pg,s ≤ wg,s · ug · Pmax
g ∀g ∈ G, s ∈ S (5.28)
−wg,s · ∆P dg ≤ pg,s − pg,sb
≤ wg,s · ∆P ug ∀g ∈ G, s 6= sb (5.29)
pg,sgf= pg,sb
+ pgf ,sb
wg,s · Pmaxg − pg,sb
∑
g 6=gf
(
wg,s · Pmaxg − pg,sb
) ∀s ∈ S/sb, g ∈ G/gf (5.30)
The charges to be paid by the generator unavailability in the scenario sgf are obtainedas the average value of the Lagrange multipliers associated with the wg,sgf
equation,where sgf is the scenario where generator g is unavailable. As the Lagrange multipliersare expressed in ke per unit, and the variation of wg,s is from 1 to 0, then the chargesare directly obtained as the average Lagrange multiplier (5.31).
CHsgf=
1
K
∑
k
γ(kg,sgf
(5.31)
where:CHsgf
Charges to generator g that is unavailable in scenariosgf (e-year)
γ(kg,sgf Lagrange multiplier in the Aumann-Shapley iteration k
of the state variable wg,sgf
K Number of iterations in the Aumann-Shapley procedure
If generator g participates in more than one single scenario, then the total charge tothat generator will be calculated as the sum of the single charges for each contingency(5.32).
CHg =∑
s/g=off
CHs =∑
s/g=off
1
K
∑
k
γ(kg,sgf
(5.32)
122 CHAPTER 5. VAR ECONOMIC FLOWS
Transmission line unavailability The unavailability of a transmission line is mod-eled as a variation in the parameters of the system impedance matrix conductance (5.34)and susceptance (5.35). The variation depends on a binary variable wl,s, which definesthe state of the transmission lines, wl,s = 1 if the transmission line l is available, andwl,s = 0 if it is unavailable. Additionally, there is a new constraint associated with theline state variable whose Lagrange multiplier is γl,s (5.33).
wl,s = 1 ∀l, ∀s/sl : γl,s (5.33)
gn,m,sl= gn,m,sb
· wl,sl
gm,n,sl= gm,n,sb
· wl,sl
gn,n,sl= gn,n,sb
+ gn,m,sb· (1 − wl,sl
)gm,m,sl
= gm,m,sb+ gn,m,sb
· (1 − wl,sl)
(5.34)
bn,m,sl= bn,m,sb
· wl,sl
bm,n,sl= bm,n,sb
· wl,sl
bn,n,sl= bn,n,sb
+ bn,m,sb· (1 − wl,sl
)bm,m,sl
= bm,m,sb+ bn,m,sb
· (1 − wl,sl)
(5.35)
where:gn,m,sl
, bn,m,slReal and imaginary part of the admittance matrixcorresponding to buses n and m for scenario sl whereline l is unavailable ()
gn,m,sb, bn,m,sb
Real and imaginary part of the admittance matrixcorresponding to buses n and m for normal operationscenario sb ()
wl,slVariable that defines the state of the transmission line l(0: opened, 1: closed)
For the Aumann-Shapley allocation, the line state variable is fixed within a value from0 to 1 in different steps k (5.36).
wl,s = 1 − k
K(5.36)
Finally, the costs allocated to the unavailability of a line are calculated as the averagevalue of the Lagrange multipliers associated with the constraint (5.37). If the line outageis included in different scenarios, then the total charge for that transmission line ownerwill consider its contribution to each contingency.
CHl =∑
s/l=off
CHsl=
∑
s/l=off
1
K
∑
k
γ(kl,sl
(5.37)
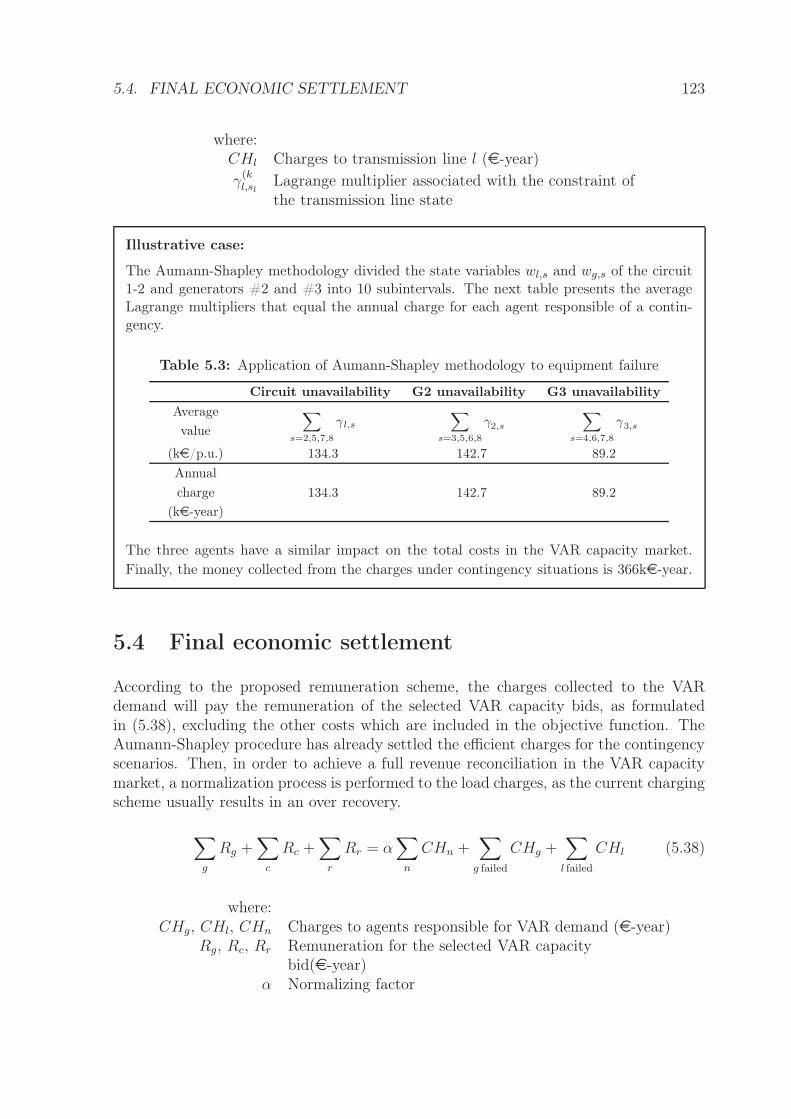
5.4. FINAL ECONOMIC SETTLEMENT 123
where:CHl Charges to transmission line l (e-year)γ
(kl,sl
Lagrange multiplier associated with the constraint ofthe transmission line state
Illustrative case:
The Aumann-Shapley methodology divided the state variables wl,s and wg,s of the circuit1-2 and generators #2 and #3 into 10 subintervals. The next table presents the averageLagrange multipliers that equal the annual charge for each agent responsible of a contin-gency.
Table 5.3: Application of Aumann-Shapley methodology to equipment failure
Circuit unavailability G2 unavailability G3 unavailability
Average
value
∑
s=2,5,7,8
γl,s
∑
s=3,5,6,8
γ2,s
∑
s=4,6,7,8
γ3,s
(ke/p.u.) 134.3 142.7 89.2
Annual
charge
(ke-year)
134.3 142.7 89.2
The three agents have a similar impact on the total costs in the VAR capacity market.
Finally, the money collected from the charges under contingency situations is 366ke-year.
5.4 Final economic settlement
According to the proposed remuneration scheme, the charges collected to the VARdemand will pay the remuneration of the selected VAR capacity bids, as formulatedin (5.38), excluding the other costs which are included in the objective function. TheAumann-Shapley procedure has already settled the efficient charges for the contingencyscenarios. Then, in order to achieve a full revenue reconciliation in the VAR capacitymarket, a normalization process is performed to the load charges, as the current chargingscheme usually results in an over recovery.
∑
g
Rg +∑
c
Rc +∑
r
Rr = α∑
n
CHn +∑
g failed
CHg +∑
l failed
CHl (5.38)
where:CHg, CHl, CHn Charges to agents responsible for VAR demand (e-year)
Rg, Rc, Rr Remuneration for the selected VAR capacitybid(e-year)
α Normalizing factor
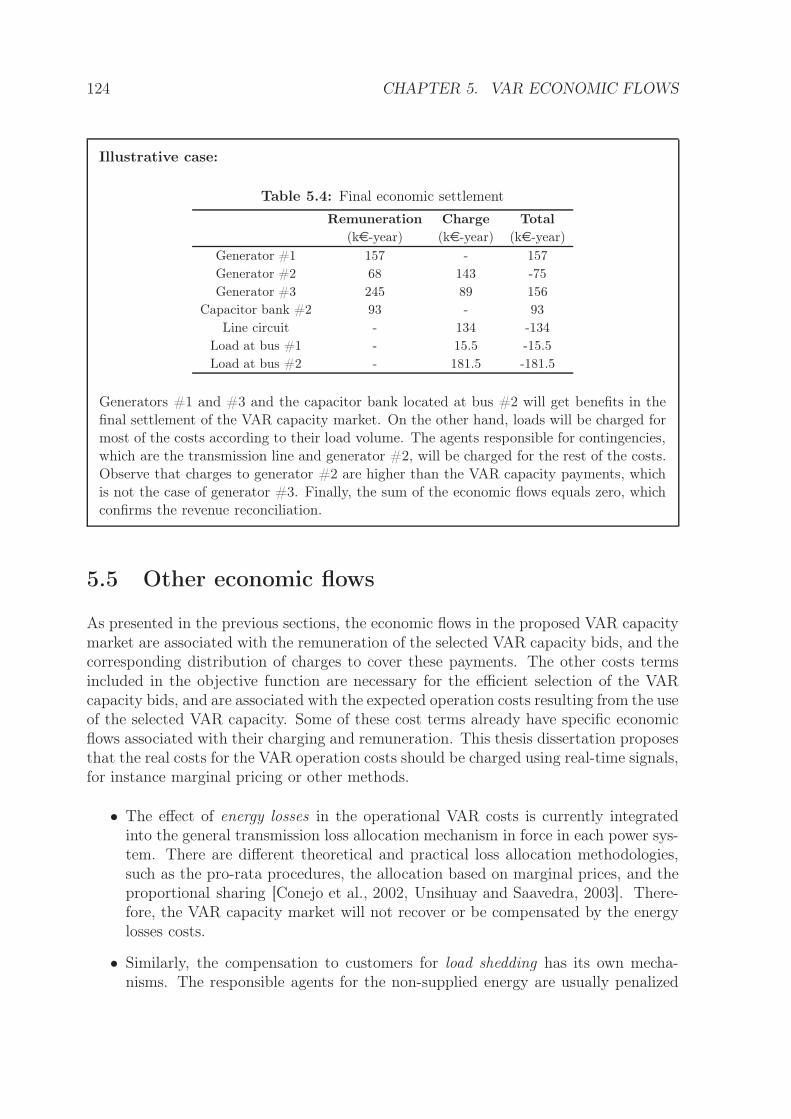
124 CHAPTER 5. VAR ECONOMIC FLOWS
Illustrative case:
Table 5.4: Final economic settlement
Remuneration Charge Total
(ke-year) (ke-year) (ke-year)
Generator #1 157 - 157
Generator #2 68 143 -75
Generator #3 245 89 156
Capacitor bank #2 93 - 93
Line circuit - 134 -134
Load at bus #1 - 15.5 -15.5
Load at bus #2 - 181.5 -181.5
Generators #1 and #3 and the capacitor bank located at bus #2 will get benefits in thefinal settlement of the VAR capacity market. On the other hand, loads will be charged formost of the costs according to their load volume. The agents responsible for contingencies,which are the transmission line and generator #2, will be charged for the rest of the costs.Observe that charges to generator #2 are higher than the VAR capacity payments, whichis not the case of generator #3. Finally, the sum of the economic flows equals zero, whichconfirms the revenue reconciliation.
5.5 Other economic flows
As presented in the previous sections, the economic flows in the proposed VAR capacitymarket are associated with the remuneration of the selected VAR capacity bids, and thecorresponding distribution of charges to cover these payments. The other costs termsincluded in the objective function are necessary for the efficient selection of the VARcapacity bids, and are associated with the expected operation costs resulting from the useof the selected VAR capacity. Some of these cost terms already have specific economicflows associated with their charging and remuneration. This thesis dissertation proposesthat the real costs for the VAR operation costs should be charged using real-time signals,for instance marginal pricing or other methods.
• The effect of energy losses in the operational VAR costs is currently integratedinto the general transmission loss allocation mechanism in force in each power sys-tem. There are different theoretical and practical loss allocation methodologies,such as the pro-rata procedures, the allocation based on marginal prices, and theproportional sharing [Conejo et al., 2002, Unsihuay and Saavedra, 2003]. There-fore, the VAR capacity market will not recover or be compensated by the energylosses costs.
• Similarly, the compensation to customers for load shedding has its own mecha-nisms. The responsible agents for the non-supplied energy are usually penalized
5.6. SUMMARY OF THE VAR CAPACITY MARKET PROCEDURE 125
according to their contribution to the emergency situation. In addition, powersystems currently do not include voltage quality penalties as proposed in (4.18).In order to efficiently distribute the responsibilities under contingency situations(for instance, measuring the impact on energy non-supplied and voltage value ofactive and reactive power unavailability) economic signals can be obtained fromspecific OPF formulations that model the corresponding operating conditions. Forexample, a charging scheme is formulated in (5.39) based on marginal pricing.
CHVn =
∂CV
∂PDn
PDn +∂CV
∂QDn
QDn (5.39)
where:CHV
n Charge for voltage deviations to load located at bus n(e)
CV Real costs for voltage deviations (e)PDn, QDn Active and reactive power demand at bus n (MW,Mvar)
• The charges to cover the regulated payments of the VAR energy can be based onschemes similar to those used for energy losses distribution, among which standsthe real-time VAR marginal pricing. Since the duration of the normal operationsituations is much higher than that of contingencies, loads will be charged for mostof the VAR capacity use during normal operation, as formulated in (5.40). Thesecharges will be distributed among the corresponding generators in proportion totheir real VAR energy production.
CHQEn =
∂CQE
∂PDnPDn +
∂CQE
∂QDnQDn (5.40)
where:CHQE
n Charge for VAR energy to load located at bus n (e)CQE Real costs for VAR energy (e)
• Finally, those generators whose output is redispatched in order to increase theVAR procurement will receive a compensation for the opportunity costs. Similarmechanisms as those proposed for the previous cost terms can be used to distributethese charges among the responsible agents.
5.6 Summary of the VAR capacity market procedure
A general overview of the procedures designed to settle, remunerate and charge in theVAR capacity market are presented in Figure 5.5. First, three independent modules areconsidered, i) data management, ii) VAR capacity market for peak hours and iii) VAR
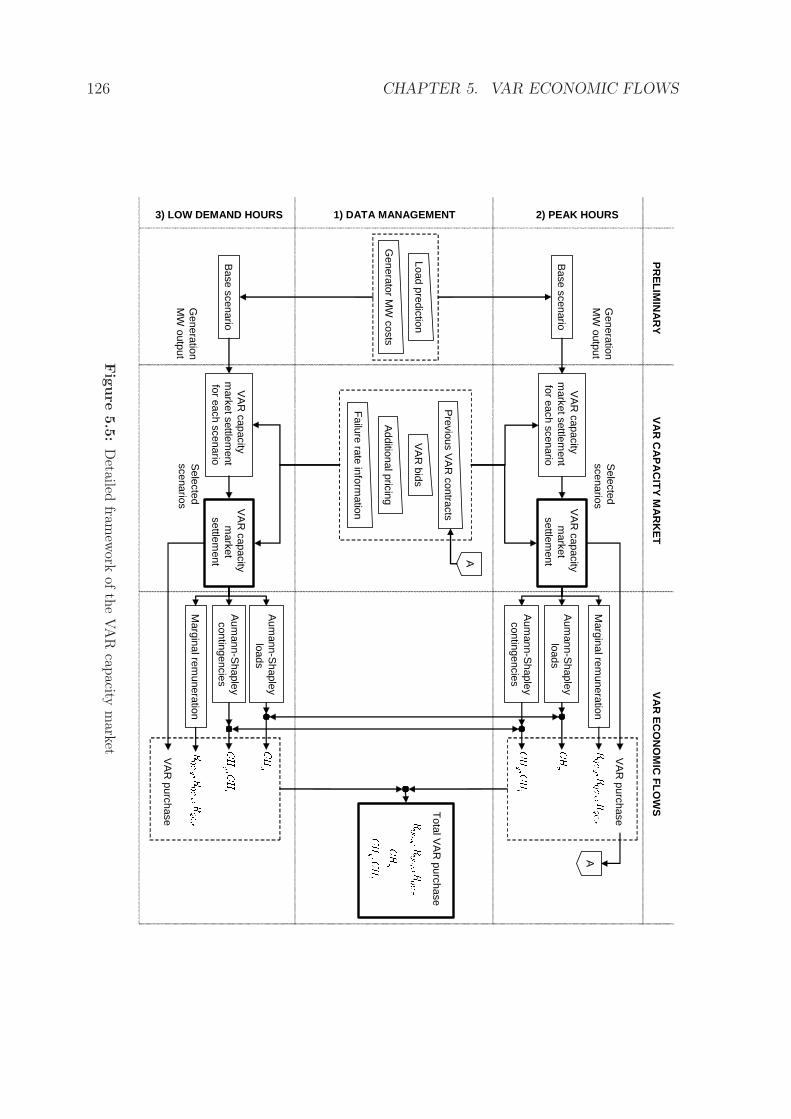
126 CHAPTER 5. VAR ECONOMIC FLOWS
VA
R capacity
market
settlement
VA
R capacity
market settlem
ent for each scenario S
electedscenarios
Base scenario
Generation
MW
output
Previous V
AR
contracts
VA
R bids
Additional pricing
Failure rate inform
ation
Marginal rem
uneration
Aum
ann-Shapley
loads
Aum
ann-Shapley
contingencies
Load prediction
Generator M
W costs
VA
R purchase
Total V
AR
purchase
VA
R capacity
market
settlement
VA
R capacity
market settlem
ent for each scenarioS
electedscenarios
Base scenario
Generation
MW
outputM
arginal remuneration
Aum
ann-Shapley
loads
Aum
ann-Shapley
contingencies
VA
R purchase
PR
EL
IMIN
AR
YV
AR
CA
PA
CIT
Y M
AR
KE
TV
AR
EC
ON
OM
IC F
LO
WS
2) PEAK HOURS3) LOW DEMAND HOURS 1) DATA MANAGEMENTA
A
Fig
ure
5.5
:D
etailedfram
ework
ofth
eVA
Rcap
acitym
arket
5.7. CONCLUSIONS 127
capacity market for low demand hours. In the data management module, the SO collectsall the necessary information for the correct characterization and valuation of the VARsources. Historical data on the generation costs, load demand, and VAR contracts andVAR energy will define the needs for VAR in the following year. On the other hand,the inputs in the VAR capacity auction are the characteristics of each market agent,including VAR bids, failure rates and operating limits. Additionally, parameters forenergy quality valuation in the corresponding power system are needed.
The VAR capacity market for peak and low demand hours is divided into three parts,i) preliminary data management, ii) VAR capacity market settlement, and iii) VARcapacity economic flows. Firstly, variable costs of generators, load and network datawill define the base case scenarios. The information of the failure rates of power systemdevices will identify the main contingency scenarios to be analyzed. For simplicity, onlythose scenarios with the highest impact on VAR needs will be considered. Then, all theinformation for the VAR capacity market is included in the optimization problem, forthe base scenario and all the selected contingencies, and the then finally VAR capacitymarket is settled. The selected VAR capacity will be an input for the VAR capacitymarket in low demand hours.
The sensitivity coefficients obtained from the optimization problem are the basis forthe remuneration and charging of the market agents. The remuneration of the VARprocurement is based on marginal pricing. An additional analysis with the Aumann-Shapley methodology is needed to distribute the charges between the VAR demandagents.
A similar procedure is used for the VAR capacity market in low demand hours. VARneeds are determined considering specific base scenarios, together with the results ofthe previously solved VAR market for peak hours. Finally, the resulting selected VARcapacity, payments to the VAR procurement, and charges to VAR demand are obtainedas the sum of the outcomes of both VAR capacity markets.
5.7 Conclusions
This chapter has presented the remuneration mechanism for the selected VAR sourcesand a charging methodology for the demand in the VAR capacity market (see Figure5.6). The main objective in the design of the mechanism for remuneration and chargingis to send efficient cost and location signals to the participating agents in the VARcapacity market. For this aim, it has been found that the remuneration and chargingschemes should be based on marginal pricing which differentiates short term and longterm price signals.
On the one hand, the selected bids for VAR capacity will be remunerated using long-termmarginal prices which are obtained from the VAR capacity market formulation.
On the other hand, charges will distinguish loads, which will pay for the VAR capacityinstalled in the base case, and agents responsible for contingencies that will assume
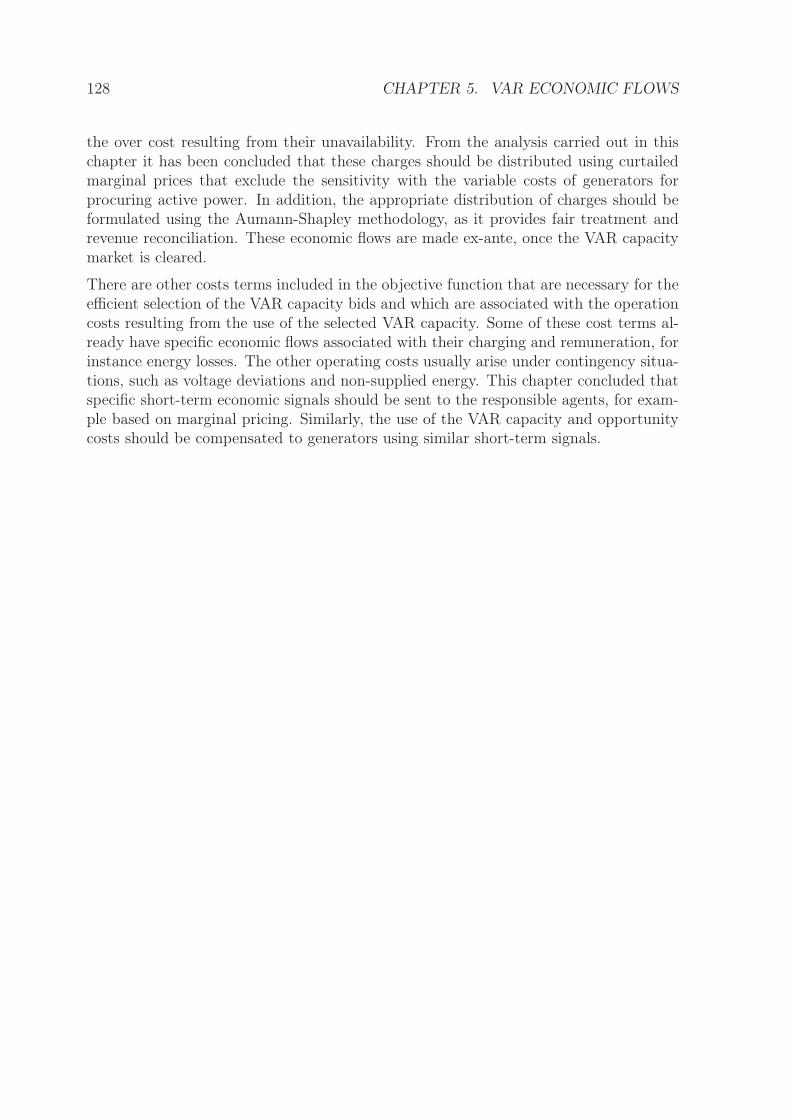
128 CHAPTER 5. VAR ECONOMIC FLOWS
the over cost resulting from their unavailability. From the analysis carried out in thischapter it has been concluded that these charges should be distributed using curtailedmarginal prices that exclude the sensitivity with the variable costs of generators forprocuring active power. In addition, the appropriate distribution of charges should beformulated using the Aumann-Shapley methodology, as it provides fair treatment andrevenue reconciliation. These economic flows are made ex-ante, once the VAR capacitymarket is cleared.
There are other costs terms included in the objective function that are necessary for theefficient selection of the VAR capacity bids and which are associated with the operationcosts resulting from the use of the selected VAR capacity. Some of these cost terms al-ready have specific economic flows associated with their charging and remuneration, forinstance energy losses. The other operating costs usually arise under contingency situa-tions, such as voltage deviations and non-supplied energy. This chapter concluded thatspecific short-term economic signals should be sent to the responsible agents, for exam-ple based on marginal pricing. Similarly, the use of the VAR capacity and opportunitycosts should be compensated to generators using similar short-term signals.
5.7. CONCLUSIONS 129
Marginal
remuneration
•Long term curtailed
marginal pricing
•Aumann-Shapley
•Ex ante
•Long term curtailed
marginal pricing
•Aumann-Shapley
•Ex ante
nCH ,g
lCHCH
, , ,
QCg
QCc
QCr
R R R
VAR DEMAND
MECHANISM-PRODUCT
VAR SUPPLIER
LONG-TERM SIGNALS SHORT TERM SIGNALS
Loads
•Active power
•Reactive power
System contingencies
•Generators
•Transmission lines
•Generators
•Capacitor banks
•Shunt reactors
•SVCs
•STATCOM devices
VAR capacity
Normal
operation
Real use
remuneration
•Short term signals
•Ex post
•Short term signals
•Ex post
Loads
•Active power
•Reactive power
Generators
System contingencies
•Generators
•Transmission lines
Real operating
VAR costs
•Regulated payment to
generators
•Redispatch due to VAR
management
•Voltage quality penalties
•ENS
DSOs, loads, …
VAR capacity
Contingency
operation
Fig
ure
5.6
:R
esum
eof
the
econ
omic
flow
sin
the
VA
Rca
pac
ity
mar
ket
130 BIBLIOGRAPHY
5.8 References
[Aumann and Shapley, 1975] Aumann, R. J. and Shapley, L. S. (1975). Values of non-atomic games. Bull. Amer. Math. Soc. 81 (1975).
[Barbosa, 1998] Barbosa, L. G. (1998). Estudo de Alternativas de Partição de custosde Potència Reativa em Sistemas de Transmissão em Ambientes Competitivos. PhDthesis, Pontificia Universidade Catolica do Rio de Janeiro.
[Billera and Heath, 1982] Billera, L. J. and Heath, D. C. (1982). Allocation of sharedcosts: A set of axioms yielding a unique procedure. Mathematical Operation Research,7(1):32–39.
[Conejo et al., 2002] Conejo, A. J., Arroyo, J. M., Alguacil, N., and Guijarro, A. L.(2002). Transmission loss allocation: a comparison of different practical algorithms.IEEE Transactions on Power Systems, 17(3):571–576.
[FERC, 2005] FERC (2005). Principles for efficient and reliable reactive power supplyand consumption. Staff Report, Docket No. AD05-1-000.
[Lin et al., 2006] Lin, X. J., Yu, C. W., Xu, N., Chung, C. Y., and Wu, H. (2006).Reactive power service cost allocation using aumann-shapley method. IEE Proceedingson Generation, Transmission and Distribution, 153(5):540–546.
[PSR, 2005] PSR (2005). Allocation of transmission service costs. Power System Re-search, Inc.
[Ribeiro, 2005] Ribeiro, P. M. (2005). Remuneraçao dos Serviços Ancilares de Suportede Potència Reativa e Reserva de Potència Quando Providos por Geradores. PhDthesis, Pontificia Universidade Catolica do Rio de Janeiro.
[Ribeiro et al., 2004] Ribeiro, P. M., Marzano, L. G. B., Soto, J. R. O., and Melo, A.C. G. (2004). Methodology for pricing the genration reserve and the reactive powersupport as ancillary service provided by generators. In IX SEPOPE, Rio de Janeiro.
[Unsihuay and Saavedra, 2003] Unsihuay, C. and Saavedra, O. R. (2003). Comparativestudies on transmission loss allocation methods for competitive electricity markets.Power Tech Conference Proceedings, 2003 IEEE Bologna, 3.
[Young, 1994] Young, H. P. (1994). Cost allocation. Chapter 34 in Handbook of Gametheory, 2.
CHAPTER 6
Case Study
In the previous chapters, a proposal for the regulation of the VQ service was presented.A simple illustrative case was used throughout the description of the VAR capacity
market to illustrate the main concepts of the proposal. This chapter includes a largercase study, with 39 buses, and 10 generation units, emulating a voltage control area ina real power system.
First, the case study is presented, including a brief description of the power systemand the bids for the VAR capacity market. Then, the annual auction is cleared usingthe formulation proposed in the previous chapters. The results are first analyzed froma technical point of view, identifying the main voltage control actions. Finally, theeconomic flows for the VAR capacity market are settled, comprising the remunerationof the VAR procurement, and the charges to the VAR demand.
131
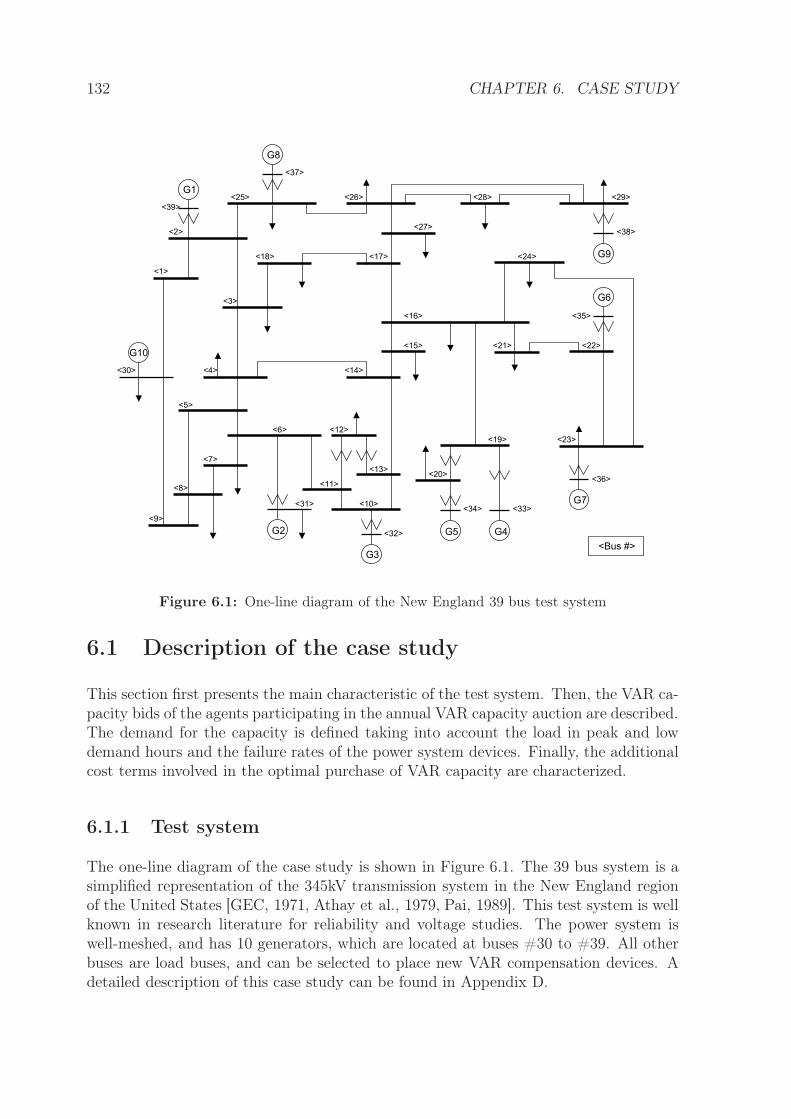
132 CHAPTER 6. CASE STUDY
G6
G7
G9
<11>
<13>
<14>
<15>
<20>
<22>
<23>
<24>
<35>
G10
G1
<3>
<4>
<5>
<7>
<8>
<9>
<39>
G8
<37>
<28>
G3
G2
<1>
G5 G4
<25> <26> <29>
<27><2> <38>
<18> <17>
<16>
<21>
<30>
<6> <12>
<19>
<36>
<10><31><34> <33>
<32>
<Bus #>
Figure 6.1: One-line diagram of the New England 39 bus test system
6.1 Description of the case study
This section first presents the main characteristic of the test system. Then, the VAR ca-pacity bids of the agents participating in the annual VAR capacity auction are described.The demand for the capacity is defined taking into account the load in peak and lowdemand hours and the failure rates of the power system devices. Finally, the additionalcost terms involved in the optimal purchase of VAR capacity are characterized.
6.1.1 Test system
The one-line diagram of the case study is shown in Figure 6.1. The 39 bus system is asimplified representation of the 345kV transmission system in the New England regionof the United States [GEC, 1971, Athay et al., 1979, Pai, 1989]. This test system is wellknown in research literature for reliability and voltage studies. The power system iswell-meshed, and has 10 generators, which are located at buses #30 to #39. All otherbuses are load buses, and can be selected to place new VAR compensation devices. Adetailed description of this case study can be found in Appendix D.
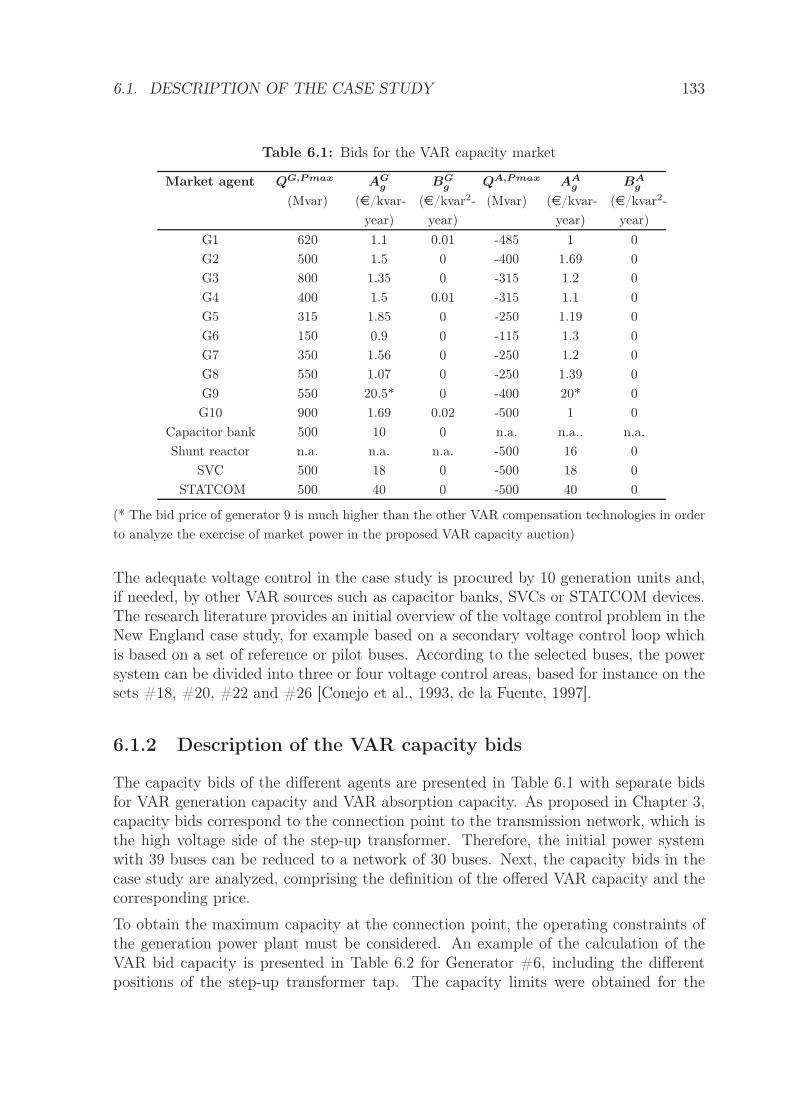
6.1. DESCRIPTION OF THE CASE STUDY 133
Table 6.1: Bids for the VAR capacity market
Market agent QG,P max AGg BG
g QA,P max AAg BA
g
(Mvar) (e/kvar-
year)
(e/kvar2-
year)
(Mvar) (e/kvar-
year)
(e/kvar2-
year)
G1 620 1.1 0.01 -485 1 0
G2 500 1.5 0 -400 1.69 0
G3 800 1.35 0 -315 1.2 0
G4 400 1.5 0.01 -315 1.1 0
G5 315 1.85 0 -250 1.19 0
G6 150 0.9 0 -115 1.3 0
G7 350 1.56 0 -250 1.2 0
G8 550 1.07 0 -250 1.39 0
G9 550 20.5* 0 -400 20* 0
G10 900 1.69 0.02 -500 1 0
Capacitor bank 500 10 0 n.a. n.a.. n.a.
Shunt reactor n.a. n.a. n.a. -500 16 0
SVC 500 18 0 -500 18 0
STATCOM 500 40 0 -500 40 0
(* The bid price of generator 9 is much higher than the other VAR compensation technologies in order
to analyze the exercise of market power in the proposed VAR capacity auction)
The adequate voltage control in the case study is procured by 10 generation units and,if needed, by other VAR sources such as capacitor banks, SVCs or STATCOM devices.The research literature provides an initial overview of the voltage control problem in theNew England case study, for example based on a secondary voltage control loop whichis based on a set of reference or pilot buses. According to the selected buses, the powersystem can be divided into three or four voltage control areas, based for instance on thesets #18, #20, #22 and #26 [Conejo et al., 1993, de la Fuente, 1997].
6.1.2 Description of the VAR capacity bids
The capacity bids of the different agents are presented in Table 6.1 with separate bidsfor VAR generation capacity and VAR absorption capacity. As proposed in Chapter 3,capacity bids correspond to the connection point to the transmission network, which isthe high voltage side of the step-up transformer. Therefore, the initial power systemwith 39 buses can be reduced to a network of 30 buses. Next, the capacity bids in thecase study are analyzed, comprising the definition of the offered VAR capacity and thecorresponding price.
To obtain the maximum capacity at the connection point, the operating constraints ofthe generation power plant must be considered. An example of the calculation of theVAR bid capacity is presented in Table 6.2 for Generator #6, including the differentpositions of the step-up transformer tap. The capacity limits were obtained for the
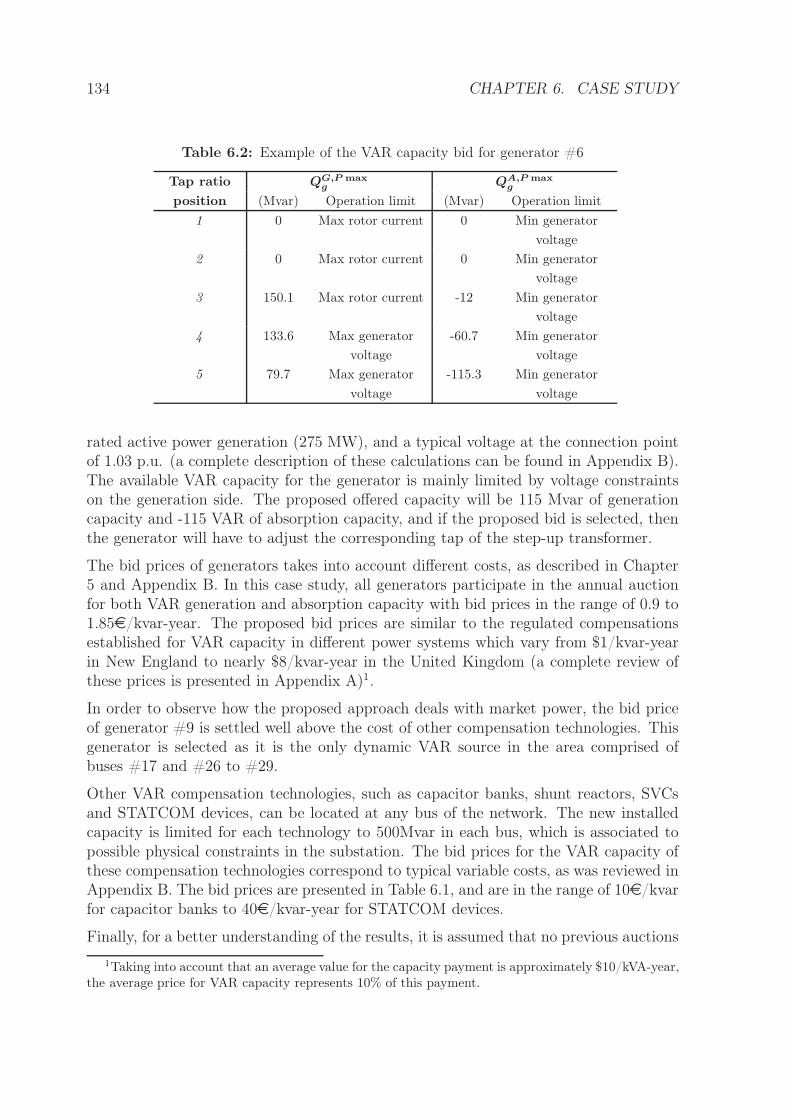
134 CHAPTER 6. CASE STUDY
Table 6.2: Example of the VAR capacity bid for generator #6
Tap ratio QG,P max
g QA,P max
g
position (Mvar) Operation limit (Mvar) Operation limit
1 0 Max rotor current 0 Min generator
voltage
2 0 Max rotor current 0 Min generator
voltage
3 150.1 Max rotor current -12 Min generator
voltage
4 133.6 Max generator
voltage
-60.7 Min generator
voltage
5 79.7 Max generator
voltage
-115.3 Min generator
voltage
rated active power generation (275 MW), and a typical voltage at the connection pointof 1.03 p.u. (a complete description of these calculations can be found in Appendix B).The available VAR capacity for the generator is mainly limited by voltage constraintson the generation side. The proposed offered capacity will be 115 Mvar of generationcapacity and -115 VAR of absorption capacity, and if the proposed bid is selected, thenthe generator will have to adjust the corresponding tap of the step-up transformer.
The bid prices of generators takes into account different costs, as described in Chapter5 and Appendix B. In this case study, all generators participate in the annual auctionfor both VAR generation and absorption capacity with bid prices in the range of 0.9 to1.85e/kvar-year. The proposed bid prices are similar to the regulated compensationsestablished for VAR capacity in different power systems which vary from $1/kvar-yearin New England to nearly $8/kvar-year in the United Kingdom (a complete review ofthese prices is presented in Appendix A)1.
In order to observe how the proposed approach deals with market power, the bid priceof generator #9 is settled well above the cost of other compensation technologies. Thisgenerator is selected as it is the only dynamic VAR source in the area comprised ofbuses #17 and #26 to #29.
Other VAR compensation technologies, such as capacitor banks, shunt reactors, SVCsand STATCOM devices, can be located at any bus of the network. The new installedcapacity is limited for each technology to 500Mvar in each bus, which is associated topossible physical constraints in the substation. The bid prices for the VAR capacity ofthese compensation technologies correspond to typical variable costs, as was reviewed inAppendix B. The bid prices are presented in Table 6.1, and are in the range of 10e/kvarfor capacitor banks to 40e/kvar-year for STATCOM devices.
Finally, for a better understanding of the results, it is assumed that no previous auctions
1Taking into account that an average value for the capacity payment is approximately $10/kVA-year,the average price for VAR capacity represents 10% of this payment.
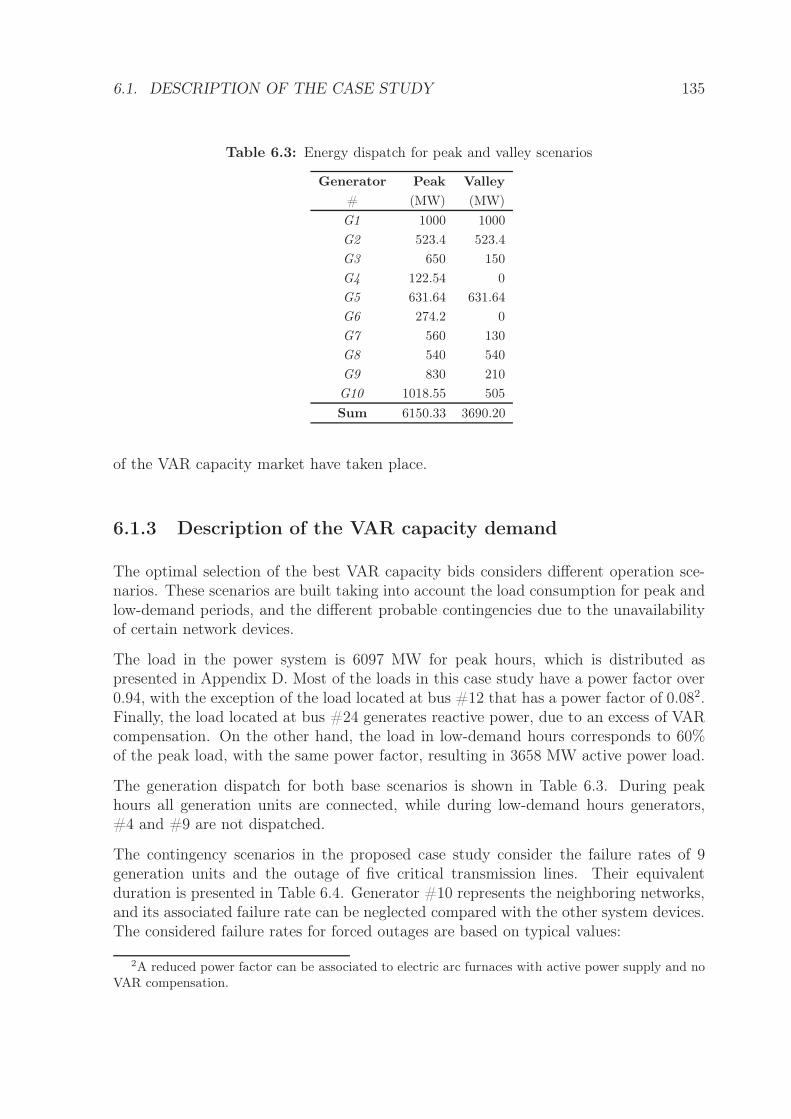
6.1. DESCRIPTION OF THE CASE STUDY 135
Table 6.3: Energy dispatch for peak and valley scenarios
Generator Peak Valley
# (MW) (MW)
G1 1000 1000
G2 523.4 523.4
G3 650 150
G4 122.54 0
G5 631.64 631.64
G6 274.2 0
G7 560 130
G8 540 540
G9 830 210
G10 1018.55 505
Sum 6150.33 3690.20
of the VAR capacity market have taken place.
6.1.3 Description of the VAR capacity demand
The optimal selection of the best VAR capacity bids considers different operation sce-narios. These scenarios are built taking into account the load consumption for peak andlow-demand periods, and the different probable contingencies due to the unavailabilityof certain network devices.
The load in the power system is 6097 MW for peak hours, which is distributed aspresented in Appendix D. Most of the loads in this case study have a power factor over0.94, with the exception of the load located at bus #12 that has a power factor of 0.082.Finally, the load located at bus #24 generates reactive power, due to an excess of VARcompensation. On the other hand, the load in low-demand hours corresponds to 60%of the peak load, with the same power factor, resulting in 3658 MW active power load.
The generation dispatch for both base scenarios is shown in Table 6.3. During peakhours all generation units are connected, while during low-demand hours generators,#4 and #9 are not dispatched.
The contingency scenarios in the proposed case study consider the failure rates of 9generation units and the outage of five critical transmission lines. Their equivalentduration is presented in Table 6.4. Generator #10 represents the neighboring networks,and its associated failure rate can be neglected compared with the other system devices.The considered failure rates for forced outages are based on typical values:
2A reduced power factor can be associated to electric arc furnaces with active power supply and noVAR compensation.
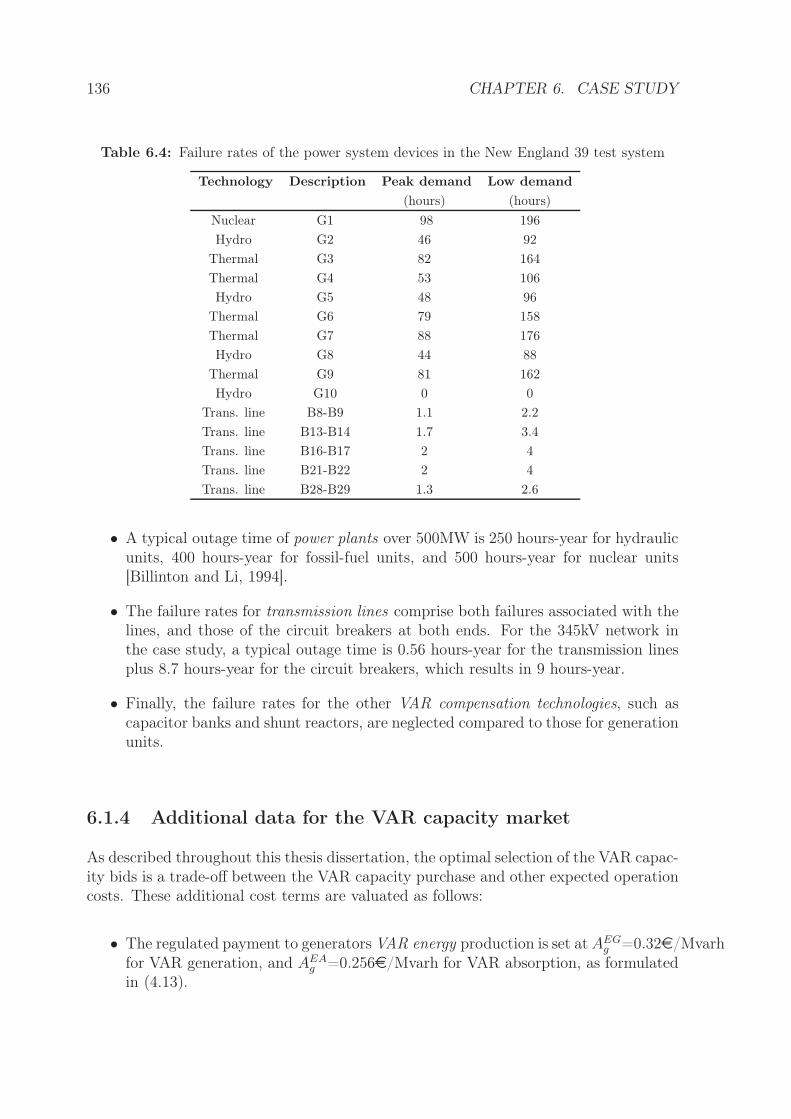
136 CHAPTER 6. CASE STUDY
Table 6.4: Failure rates of the power system devices in the New England 39 test system
Technology Description Peak demand Low demand
(hours) (hours)
Nuclear G1 98 196
Hydro G2 46 92
Thermal G3 82 164
Thermal G4 53 106
Hydro G5 48 96
Thermal G6 79 158
Thermal G7 88 176
Hydro G8 44 88
Thermal G9 81 162
Hydro G10 0 0
Trans. line B8-B9 1.1 2.2
Trans. line B13-B14 1.7 3.4
Trans. line B16-B17 2 4
Trans. line B21-B22 2 4
Trans. line B28-B29 1.3 2.6
• A typical outage time of power plants over 500MW is 250 hours-year for hydraulicunits, 400 hours-year for fossil-fuel units, and 500 hours-year for nuclear units[Billinton and Li, 1994].
• The failure rates for transmission lines comprise both failures associated with thelines, and those of the circuit breakers at both ends. For the 345kV network inthe case study, a typical outage time is 0.56 hours-year for the transmission linesplus 8.7 hours-year for the circuit breakers, which results in 9 hours-year.
• Finally, the failure rates for the other VAR compensation technologies, such ascapacitor banks and shunt reactors, are neglected compared to those for generationunits.
6.1.4 Additional data for the VAR capacity market
As described throughout this thesis dissertation, the optimal selection of the VAR capac-ity bids is a trade-off between the VAR capacity purchase and other expected operationcosts. These additional cost terms are valuated as follows:
• The regulated payment to generators VAR energy production is set at AEGg =0.32e/Mvarh
for VAR generation, and AEAg =0.256e/Mvarh for VAR absorption, as formulated
in (4.13).
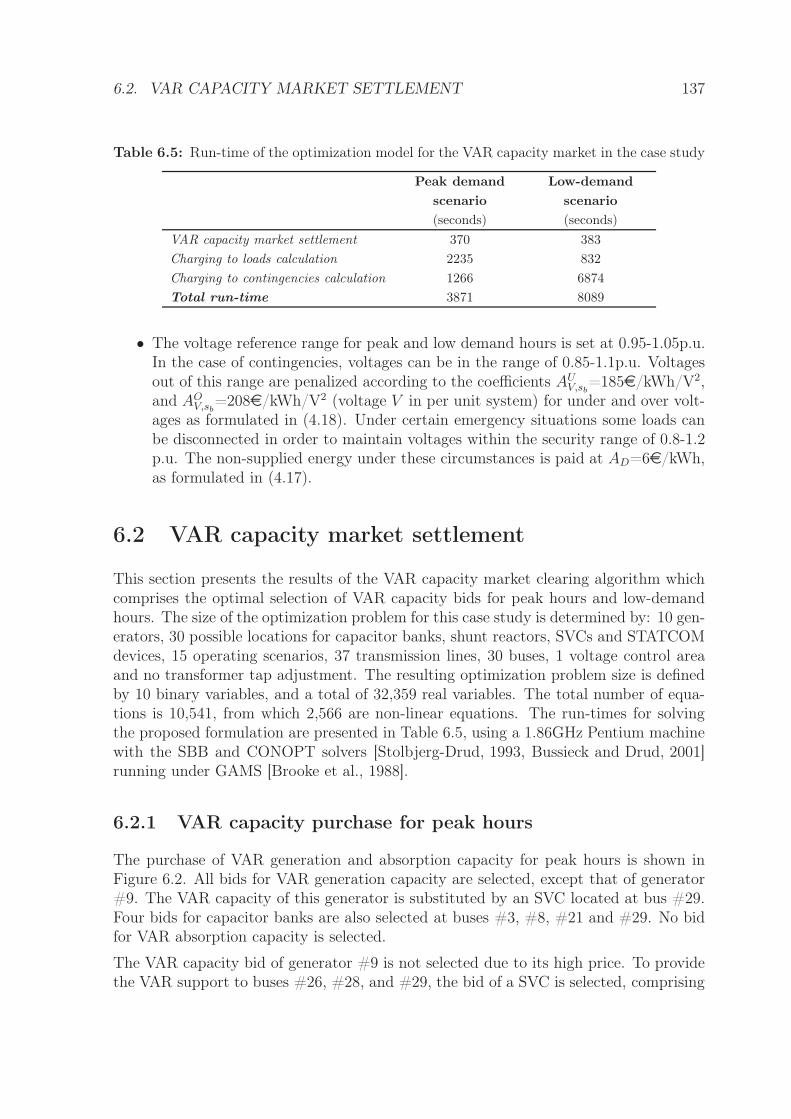
6.2. VAR CAPACITY MARKET SETTLEMENT 137
Table 6.5: Run-time of the optimization model for the VAR capacity market in the case study
Peak demand
scenario
Low-demand
scenario
(seconds) (seconds)
VAR capacity market settlement 370 383
Charging to loads calculation 2235 832
Charging to contingencies calculation 1266 6874
Total run-time 3871 8089
• The voltage reference range for peak and low demand hours is set at 0.95-1.05p.u.In the case of contingencies, voltages can be in the range of 0.85-1.1p.u. Voltagesout of this range are penalized according to the coefficients AU
V,sb=185e/kWh/V2,
and AOV,sb
=208e/kWh/V2 (voltage V in per unit system) for under and over volt-ages as formulated in (4.18). Under certain emergency situations some loads canbe disconnected in order to maintain voltages within the security range of 0.8-1.2p.u. The non-supplied energy under these circumstances is paid at AD=6e/kWh,as formulated in (4.17).
6.2 VAR capacity market settlement
This section presents the results of the VAR capacity market clearing algorithm whichcomprises the optimal selection of VAR capacity bids for peak hours and low-demandhours. The size of the optimization problem for this case study is determined by: 10 gen-erators, 30 possible locations for capacitor banks, shunt reactors, SVCs and STATCOMdevices, 15 operating scenarios, 37 transmission lines, 30 buses, 1 voltage control areaand no transformer tap adjustment. The resulting optimization problem size is definedby 10 binary variables, and a total of 32,359 real variables. The total number of equa-tions is 10,541, from which 2,566 are non-linear equations. The run-times for solvingthe proposed formulation are presented in Table 6.5, using a 1.86GHz Pentium machinewith the SBB and CONOPT solvers [Stolbjerg-Drud, 1993, Bussieck and Drud, 2001]running under GAMS [Brooke et al., 1988].
6.2.1 VAR capacity purchase for peak hours
The purchase of VAR generation and absorption capacity for peak hours is shown inFigure 6.2. All bids for VAR generation capacity are selected, except that of generator#9. The VAR capacity of this generator is substituted by an SVC located at bus #29.Four bids for capacitor banks are also selected at buses #3, #8, #21 and #29. No bidfor VAR absorption capacity is selected.
The VAR capacity bid of generator #9 is not selected due to its high price. To providethe VAR support to buses #26, #28, and #29, the bid of a SVC is selected, comprising
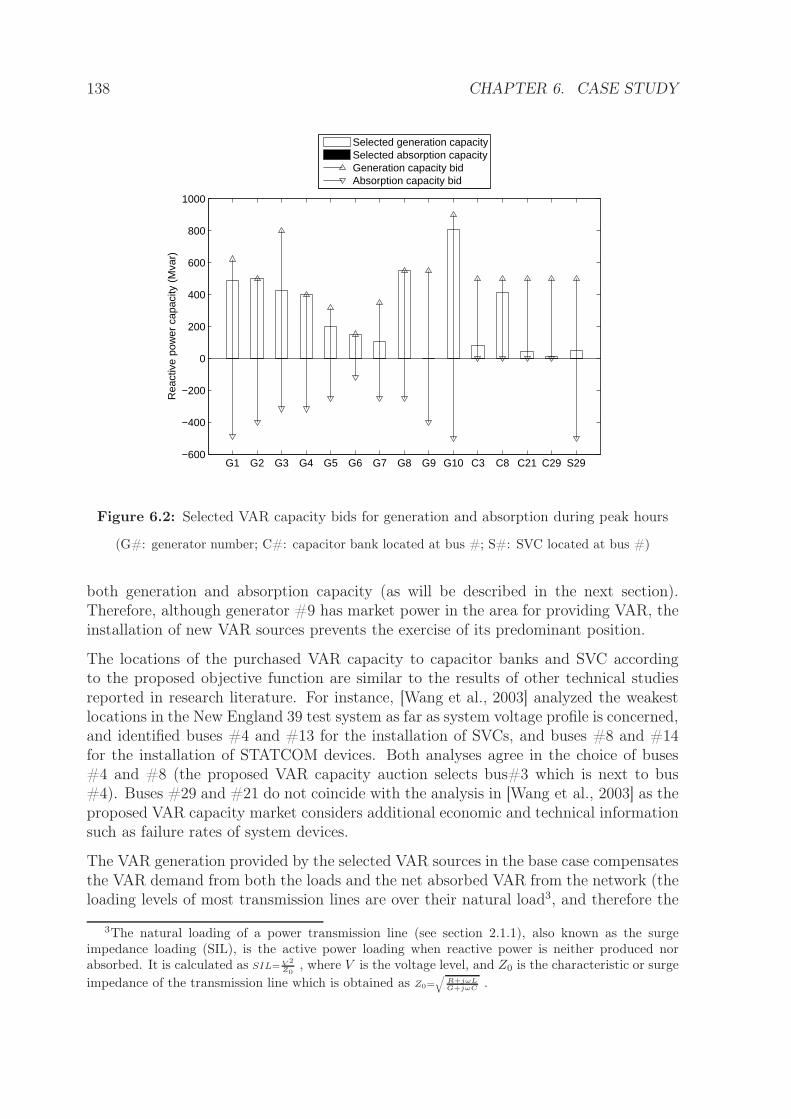
138 CHAPTER 6. CASE STUDY
G1 G2 G3 G4 G5 G6 G7 G8 G9 G10 C3 C8 C21 C29 S29−600
−400
−200
0
200
400
600
800
1000
Rea
ctiv
e po
wer
cap
acity
(M
var)
Selected generation capacitySelected absorption capacityGeneration capacity bidAbsorption capacity bid
Figure 6.2: Selected VAR capacity bids for generation and absorption during peak hours
(G#: generator number; C#: capacitor bank located at bus #; S#: SVC located at bus #)
both generation and absorption capacity (as will be described in the next section).Therefore, although generator #9 has market power in the area for providing VAR, theinstallation of new VAR sources prevents the exercise of its predominant position.
The locations of the purchased VAR capacity to capacitor banks and SVC accordingto the proposed objective function are similar to the results of other technical studiesreported in research literature. For instance, [Wang et al., 2003] analyzed the weakestlocations in the New England 39 test system as far as system voltage profile is concerned,and identified buses #4 and #13 for the installation of SVCs, and buses #8 and #14for the installation of STATCOM devices. Both analyses agree in the choice of buses#4 and #8 (the proposed VAR capacity auction selects bus#3 which is next to bus#4). Buses #29 and #21 do not coincide with the analysis in [Wang et al., 2003] as theproposed VAR capacity market considers additional economic and technical informationsuch as failure rates of system devices.
The VAR generation provided by the selected VAR sources in the base case compensatesthe VAR demand from both the loads and the net absorbed VAR from the network (theloading levels of most transmission lines are over their natural load3, and therefore the
3The natural loading of a power transmission line (see section 2.1.1), also known as the surgeimpedance loading (SIL), is the active power loading when reactive power is neither produced norabsorbed. It is calculated as SIL= V 2
Z0, where V is the voltage level, and Z0 is the characteristic or surge
impedance of the transmission line which is obtained as Z0=
√
R+jωLG+jωC
.
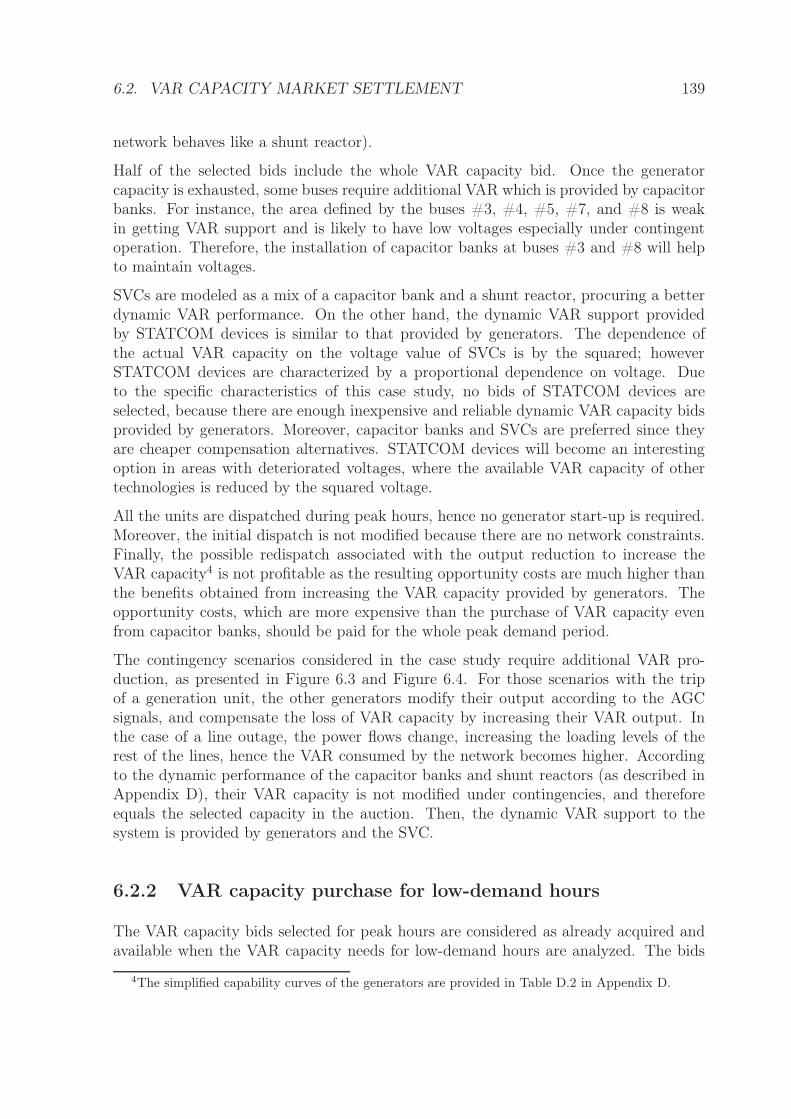
6.2. VAR CAPACITY MARKET SETTLEMENT 139
network behaves like a shunt reactor).
Half of the selected bids include the whole VAR capacity bid. Once the generatorcapacity is exhausted, some buses require additional VAR which is provided by capacitorbanks. For instance, the area defined by the buses #3, #4, #5, #7, and #8 is weakin getting VAR support and is likely to have low voltages especially under contingentoperation. Therefore, the installation of capacitor banks at buses #3 and #8 will helpto maintain voltages.
SVCs are modeled as a mix of a capacitor bank and a shunt reactor, procuring a betterdynamic VAR performance. On the other hand, the dynamic VAR support providedby STATCOM devices is similar to that provided by generators. The dependence ofthe actual VAR capacity on the voltage value of SVCs is by the squared; howeverSTATCOM devices are characterized by a proportional dependence on voltage. Dueto the specific characteristics of this case study, no bids of STATCOM devices areselected, because there are enough inexpensive and reliable dynamic VAR capacity bidsprovided by generators. Moreover, capacitor banks and SVCs are preferred since theyare cheaper compensation alternatives. STATCOM devices will become an interestingoption in areas with deteriorated voltages, where the available VAR capacity of othertechnologies is reduced by the squared voltage.
All the units are dispatched during peak hours, hence no generator start-up is required.Moreover, the initial dispatch is not modified because there are no network constraints.Finally, the possible redispatch associated with the output reduction to increase theVAR capacity4 is not profitable as the resulting opportunity costs are much higher thanthe benefits obtained from increasing the VAR capacity provided by generators. Theopportunity costs, which are more expensive than the purchase of VAR capacity evenfrom capacitor banks, should be paid for the whole peak demand period.
The contingency scenarios considered in the case study require additional VAR pro-duction, as presented in Figure 6.3 and Figure 6.4. For those scenarios with the tripof a generation unit, the other generators modify their output according to the AGCsignals, and compensate the loss of VAR capacity by increasing their VAR output. Inthe case of a line outage, the power flows change, increasing the loading levels of therest of the lines, hence the VAR consumed by the network becomes higher. Accordingto the dynamic performance of the capacitor banks and shunt reactors (as described inAppendix D), their VAR capacity is not modified under contingencies, and thereforeequals the selected capacity in the auction. Then, the dynamic VAR support to thesystem is provided by generators and the SVC.
6.2.2 VAR capacity purchase for low-demand hours
The VAR capacity bids selected for peak hours are considered as already acquired andavailable when the VAR capacity needs for low-demand hours are analyzed. The bids
4The simplified capability curves of the generators are provided in Table D.2 in Appendix D.
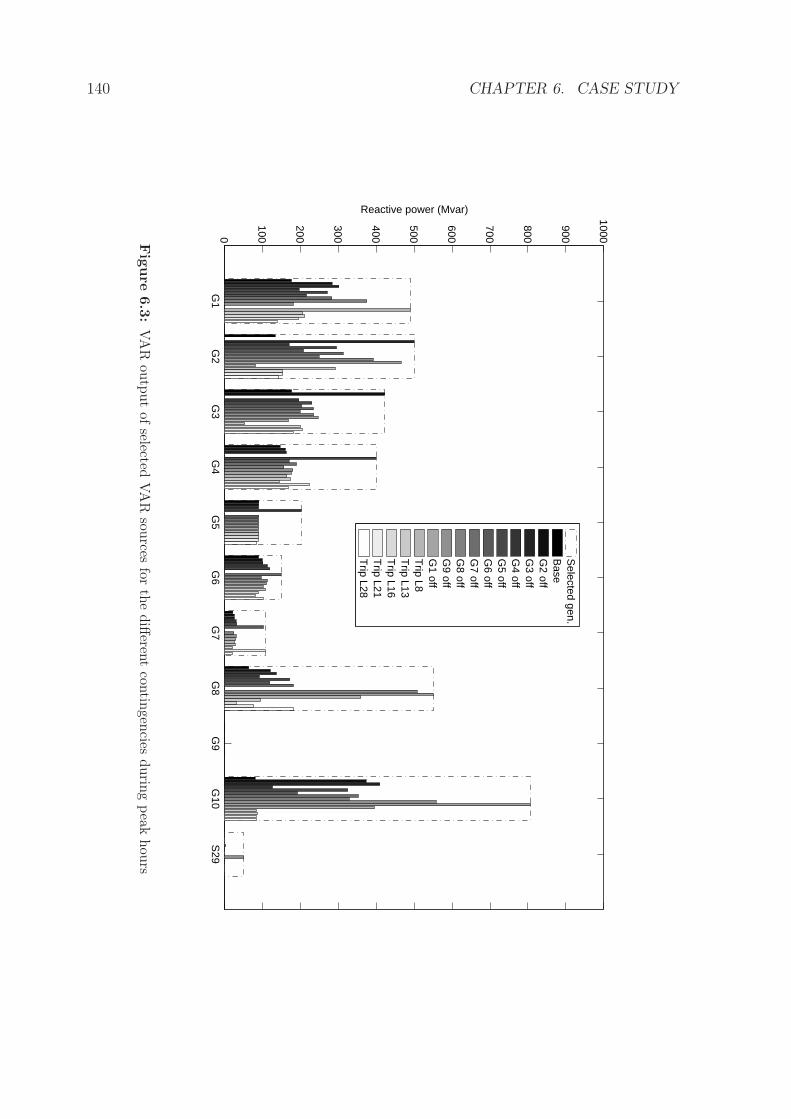
140 CHAPTER 6. CASE STUDY
G1
G2
G3
G4
G5
G6
G7
G8
G9
G10
S29
0
100
200
300
400
500
600
700
800
900
1000
Reactive power (Mvar)
Selected gen.
Base
G2 off
G3 off
G4 off
G5 off
G6 off
G7 off
G8 off
G9 off
G1 off
Trip L8
Trip L13
Trip L16
Trip L21
Trip L28
Fig
ure
6.3
:VA
Rou
tput
ofselected
VA
Rsou
rcesfor
the
diff
erent
contin
gencies
durin
gpeak
hou
rs
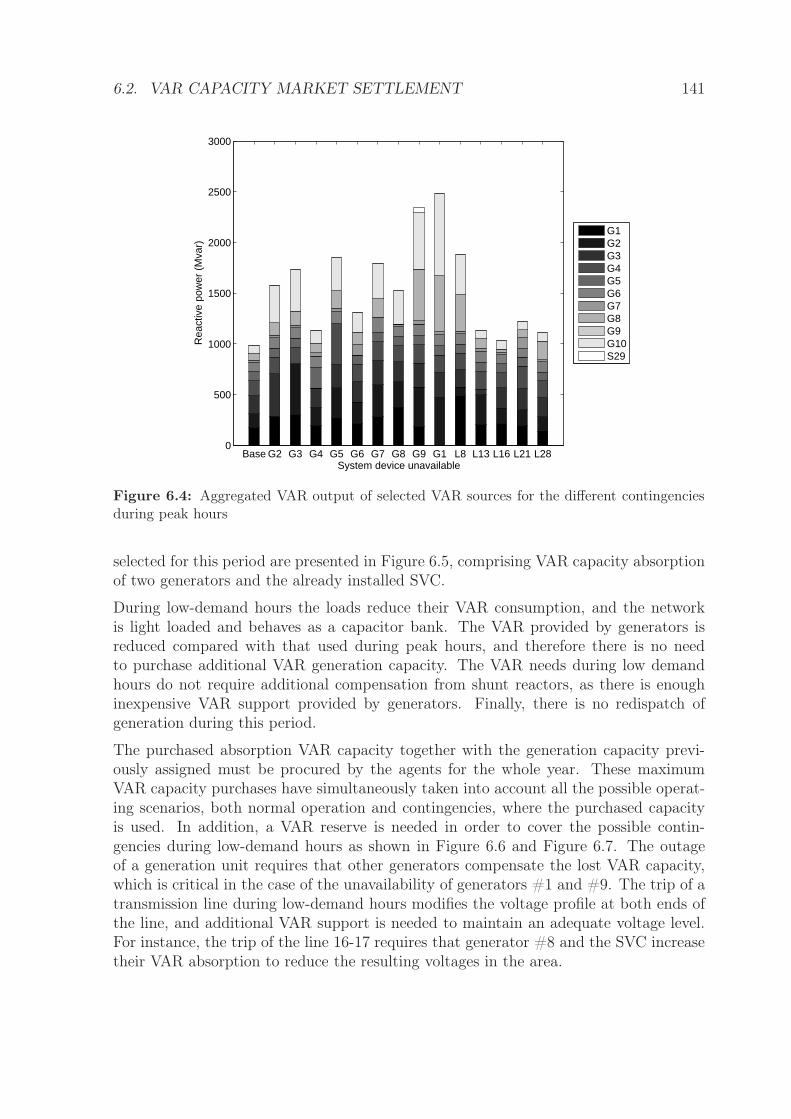
6.2. VAR CAPACITY MARKET SETTLEMENT 141
Base G2 G3 G4 G5 G6 G7 G8 G9 G1 L8 L13 L16 L21 L280
500
1000
1500
2000
2500
3000
System device unavailable
Rea
ctiv
e po
wer
(M
var)
G1G2G3G4G5G6G7G8G9G10S29
Figure 6.4: Aggregated VAR output of selected VAR sources for the different contingenciesduring peak hours
selected for this period are presented in Figure 6.5, comprising VAR capacity absorptionof two generators and the already installed SVC.
During low-demand hours the loads reduce their VAR consumption, and the networkis light loaded and behaves as a capacitor bank. The VAR provided by generators isreduced compared with that used during peak hours, and therefore there is no needto purchase additional VAR generation capacity. The VAR needs during low demandhours do not require additional compensation from shunt reactors, as there is enoughinexpensive VAR support provided by generators. Finally, there is no redispatch ofgeneration during this period.
The purchased absorption VAR capacity together with the generation capacity previ-ously assigned must be procured by the agents for the whole year. These maximumVAR capacity purchases have simultaneously taken into account all the possible operat-ing scenarios, both normal operation and contingencies, where the purchased capacityis used. In addition, a VAR reserve is needed in order to cover the possible contin-gencies during low-demand hours as shown in Figure 6.6 and Figure 6.7. The outageof a generation unit requires that other generators compensate the lost VAR capacity,which is critical in the case of the unavailability of generators #1 and #9. The trip of atransmission line during low-demand hours modifies the voltage profile at both ends ofthe line, and additional VAR support is needed to maintain an adequate voltage level.For instance, the trip of the line 16-17 requires that generator #8 and the SVC increasetheir VAR absorption to reduce the resulting voltages in the area.
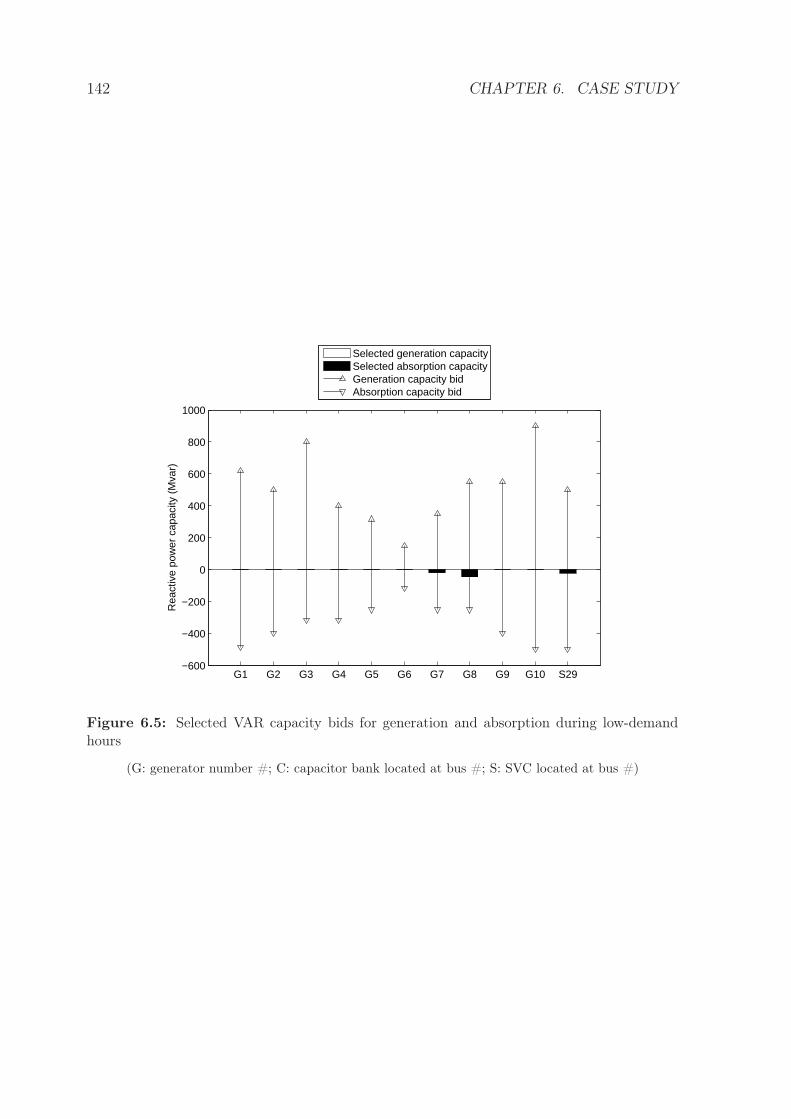
142 CHAPTER 6. CASE STUDY
G1 G2 G3 G4 G5 G6 G7 G8 G9 G10 S29−600
−400
−200
0
200
400
600
800
1000
Rea
ctiv
e po
wer
cap
acity
(M
var)
Selected generation capacitySelected absorption capacityGeneration capacity bidAbsorption capacity bid
Figure 6.5: Selected VAR capacity bids for generation and absorption during low-demandhours
(G: generator number #; C: capacitor bank located at bus #; S: SVC located at bus #)
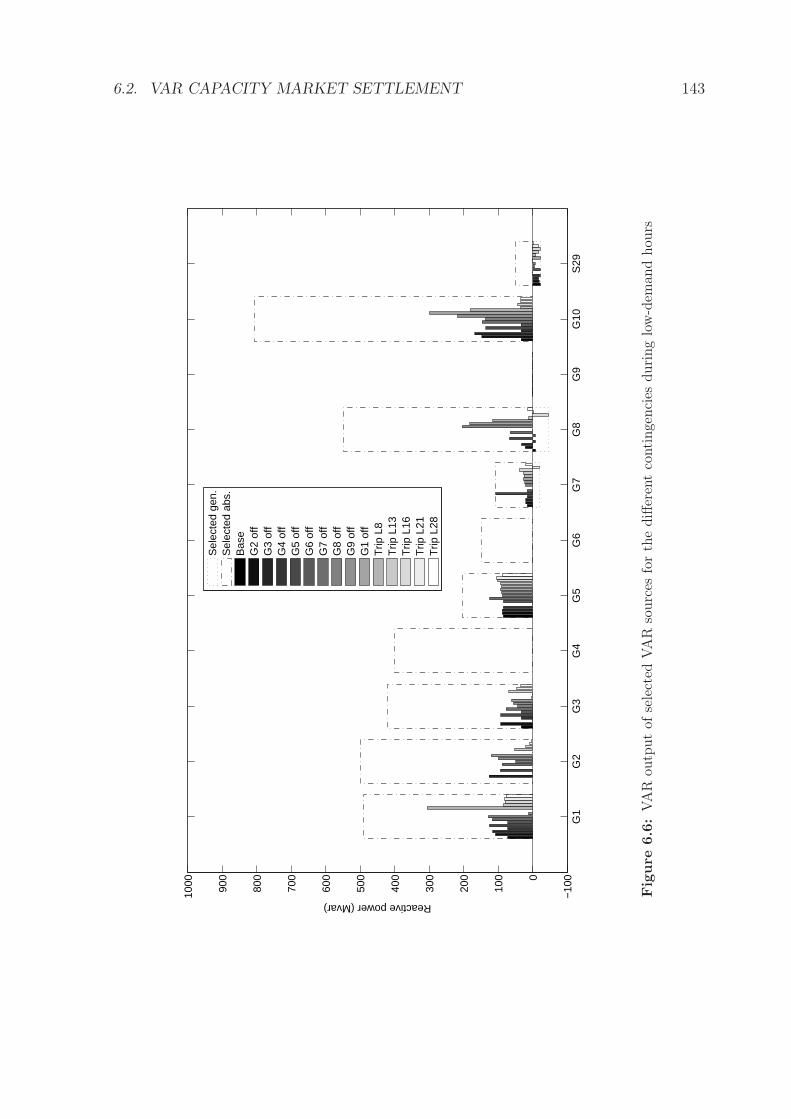
6.2. VAR CAPACITY MARKET SETTLEMENT 143
G1
G2
G3
G4
G5
G6
G7
G8
G9
G10
S29
−10
00
100
200
300
400
500
600
700
800
900
1000
Reactive power (Mvar)
Sel
ecte
d ge
n.S
elec
ted
abs.
Bas
eG
2 of
fG
3 of
fG
4 of
fG
5 of
fG
6 of
fG
7 of
fG
8 of
fG
9 of
fG
1 of
fT
rip L
8T
rip L
13T
rip L
16T
rip L
21T
rip L
28
Fig
ure
6.6
:VA
Rou
tput
ofse
lect
edVA
Rso
urc
esfo
rth
ediff
eren
tco
ntinge
nci
esduring
low
-dem
and
hou
rs
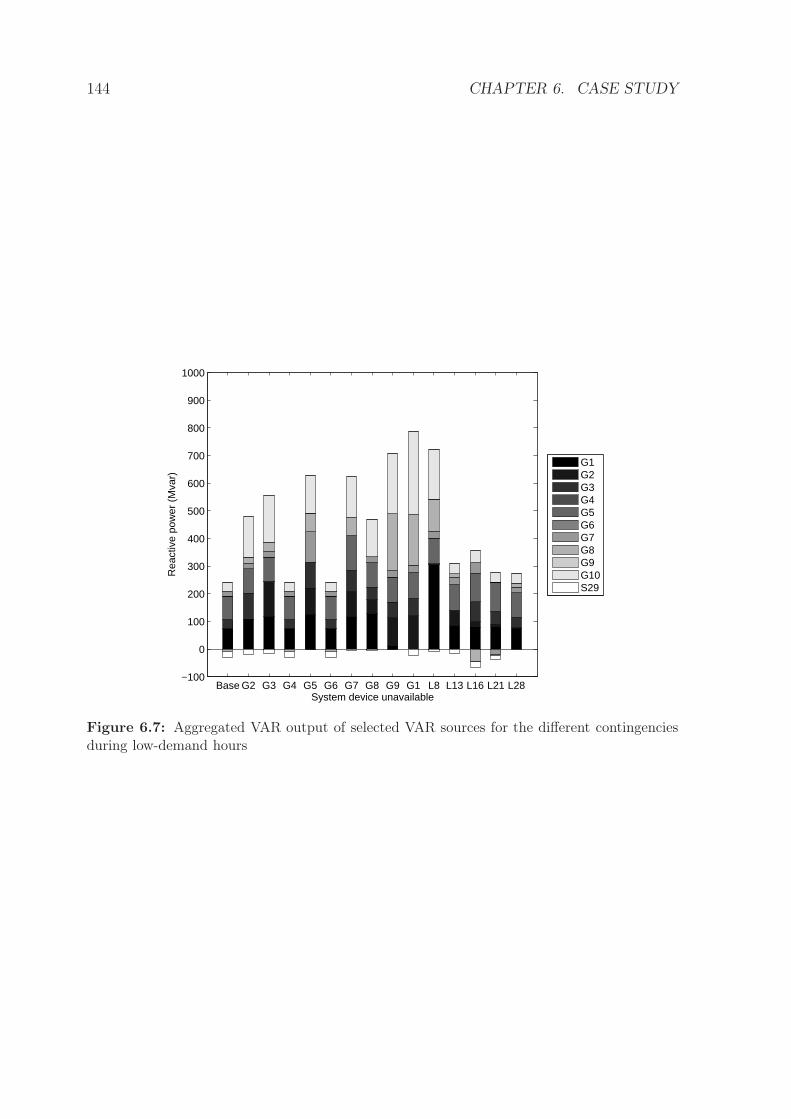
144 CHAPTER 6. CASE STUDY
Base G2 G3 G4 G5 G6 G7 G8 G9 G1 L8 L13 L16 L21 L28−100
0
100
200
300
400
500
600
700
800
900
1000
System device unavailable
Rea
ctiv
e po
wer
(M
var)
G1G2G3G4G5G6G7G8G9G10S29
Figure 6.7: Aggregated VAR output of selected VAR sources for the different contingenciesduring low-demand hours
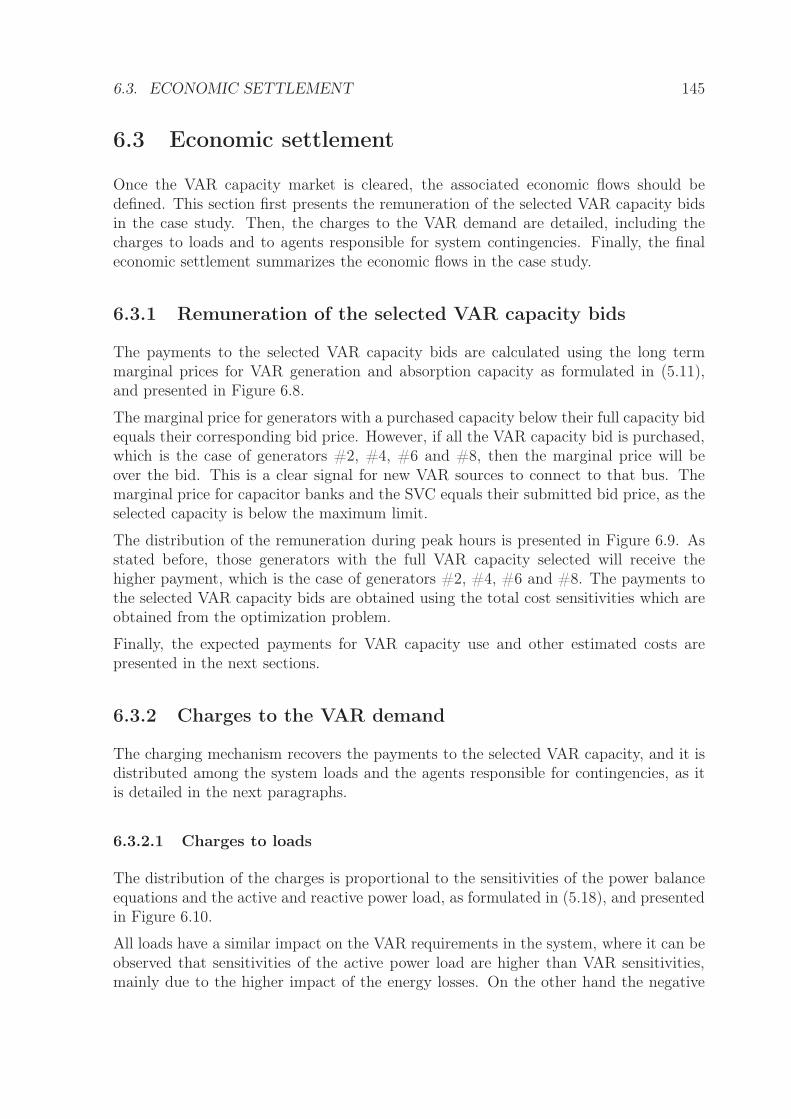
6.3. ECONOMIC SETTLEMENT 145
6.3 Economic settlement
Once the VAR capacity market is cleared, the associated economic flows should bedefined. This section first presents the remuneration of the selected VAR capacity bidsin the case study. Then, the charges to the VAR demand are detailed, including thecharges to loads and to agents responsible for system contingencies. Finally, the finaleconomic settlement summarizes the economic flows in the case study.
6.3.1 Remuneration of the selected VAR capacity bids
The payments to the selected VAR capacity bids are calculated using the long termmarginal prices for VAR generation and absorption capacity as formulated in (5.11),and presented in Figure 6.8.
The marginal price for generators with a purchased capacity below their full capacity bidequals their corresponding bid price. However, if all the VAR capacity bid is purchased,which is the case of generators #2, #4, #6 and #8, then the marginal price will beover the bid. This is a clear signal for new VAR sources to connect to that bus. Themarginal price for capacitor banks and the SVC equals their submitted bid price, as theselected capacity is below the maximum limit.
The distribution of the remuneration during peak hours is presented in Figure 6.9. Asstated before, those generators with the full VAR capacity selected will receive thehigher payment, which is the case of generators #2, #4, #6 and #8. The payments tothe selected VAR capacity bids are obtained using the total cost sensitivities which areobtained from the optimization problem.
Finally, the expected payments for VAR capacity use and other estimated costs arepresented in the next sections.
6.3.2 Charges to the VAR demand
The charging mechanism recovers the payments to the selected VAR capacity, and it isdistributed among the system loads and the agents responsible for contingencies, as itis detailed in the next paragraphs.
6.3.2.1 Charges to loads
The distribution of the charges is proportional to the sensitivities of the power balanceequations and the active and reactive power load, as formulated in (5.18), and presentedin Figure 6.10.
All loads have a similar impact on the VAR requirements in the system, where it can beobserved that sensitivities of the active power load are higher than VAR sensitivities,mainly due to the higher impact of the energy losses. On the other hand the negative
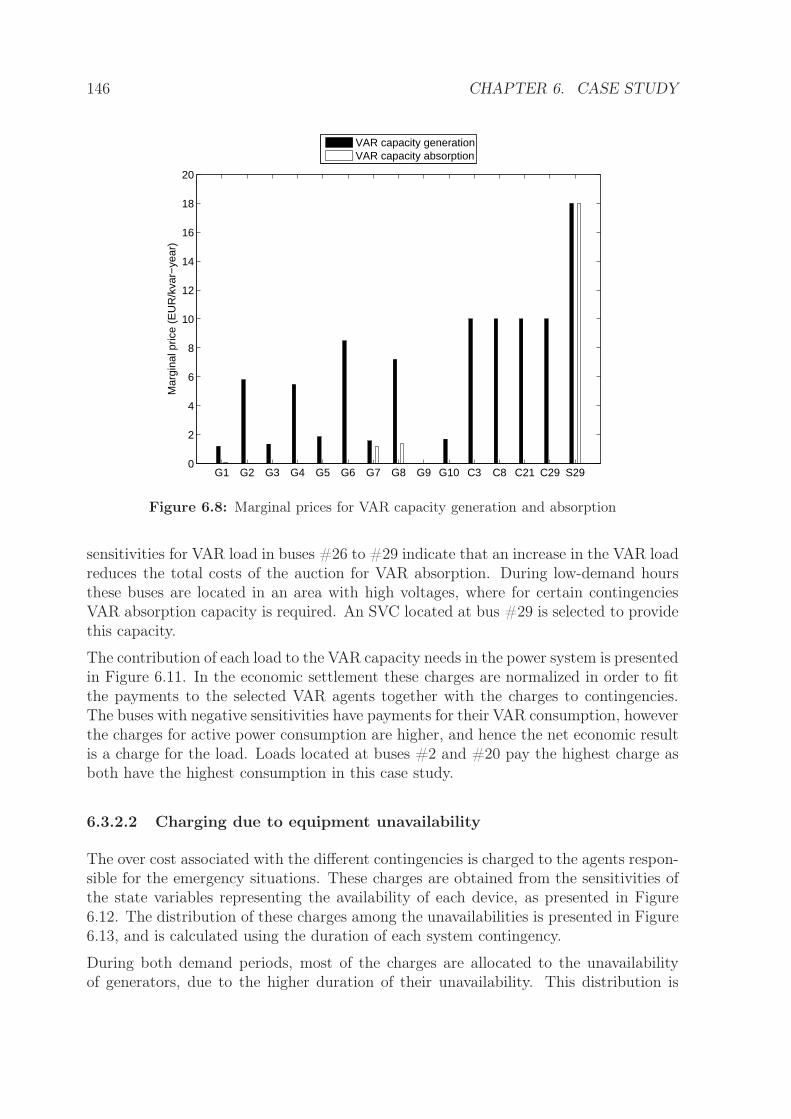
146 CHAPTER 6. CASE STUDY
G1 G2 G3 G4 G5 G6 G7 G8 G9 G10 C3 C8 C21 C29 S290
2
4
6
8
10
12
14
16
18
20M
argi
nal p
rice
(EU
R/k
var−
year
)
VAR capacity generationVAR capacity absorption
Figure 6.8: Marginal prices for VAR capacity generation and absorption
sensitivities for VAR load in buses #26 to #29 indicate that an increase in the VAR loadreduces the total costs of the auction for VAR absorption. During low-demand hoursthese buses are located in an area with high voltages, where for certain contingenciesVAR absorption capacity is required. An SVC located at bus #29 is selected to providethis capacity.
The contribution of each load to the VAR capacity needs in the power system is presentedin Figure 6.11. In the economic settlement these charges are normalized in order to fitthe payments to the selected VAR agents together with the charges to contingencies.The buses with negative sensitivities have payments for their VAR consumption, howeverthe charges for active power consumption are higher, and hence the net economic resultis a charge for the load. Loads located at buses #2 and #20 pay the highest charge asboth have the highest consumption in this case study.
6.3.2.2 Charging due to equipment unavailability
The over cost associated with the different contingencies is charged to the agents respon-sible for the emergency situations. These charges are obtained from the sensitivities ofthe state variables representing the availability of each device, as presented in Figure6.12. The distribution of these charges among the unavailabilities is presented in Figure6.13, and is calculated using the duration of each system contingency.
During both demand periods, most of the charges are allocated to the unavailabilityof generators, due to the higher duration of their unavailability. This distribution is
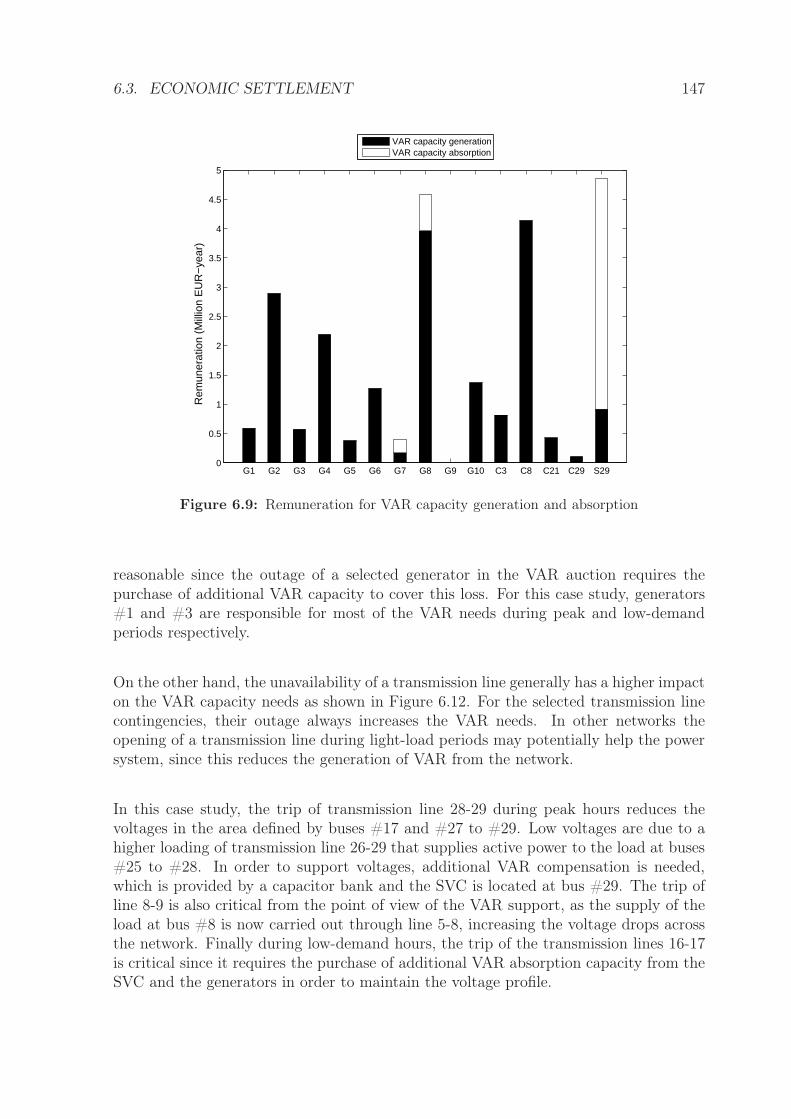
6.3. ECONOMIC SETTLEMENT 147
G1 G2 G3 G4 G5 G6 G7 G8 G9 G10 C3 C8 C21 C29 S290
0.5
1
1.5
2
2.5
3
3.5
4
4.5
5
Rem
uner
atio
n (M
illio
n E
UR
−ye
ar)
VAR capacity generationVAR capacity absorption
Figure 6.9: Remuneration for VAR capacity generation and absorption
reasonable since the outage of a selected generator in the VAR auction requires thepurchase of additional VAR capacity to cover this loss. For this case study, generators#1 and #3 are responsible for most of the VAR needs during peak and low-demandperiods respectively.
On the other hand, the unavailability of a transmission line generally has a higher impacton the VAR capacity needs as shown in Figure 6.12. For the selected transmission linecontingencies, their outage always increases the VAR needs. In other networks theopening of a transmission line during light-load periods may potentially help the powersystem, since this reduces the generation of VAR from the network.
In this case study, the trip of transmission line 28-29 during peak hours reduces thevoltages in the area defined by buses #17 and #27 to #29. Low voltages are due to ahigher loading of transmission line 26-29 that supplies active power to the load at buses#25 to #28. In order to support voltages, additional VAR compensation is needed,which is provided by a capacitor bank and the SVC is located at bus #29. The trip ofline 8-9 is also critical from the point of view of the VAR support, as the supply of theload at bus #8 is now carried out through line 5-8, increasing the voltage drops acrossthe network. Finally during low-demand hours, the trip of the transmission lines 16-17is critical since it requires the purchase of additional VAR absorption capacity from theSVC and the generators in order to maintain the voltage profile.
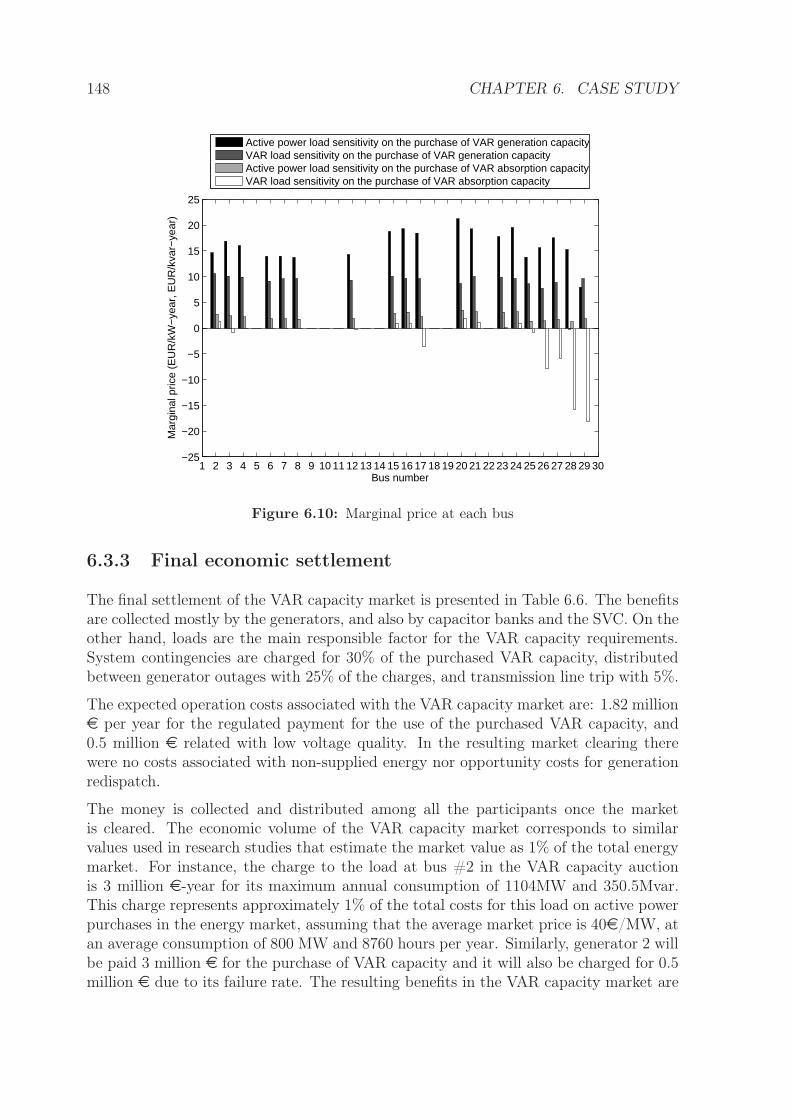
148 CHAPTER 6. CASE STUDY
1 2 3 4 5 6 7 8 9 10 11 12 13 14 15 16 17 18 19 20 21 22 23 24 25 26 27 28 29 30−25
−20
−15
−10
−5
0
5
10
15
20
25
Mar
gina
l pric
e (E
UR
/kW
−ye
ar, E
UR
/kva
r−ye
ar)
Bus number
Active power load sensitivity on the purchase of VAR generation capacityVAR load sensitivity on the purchase of VAR generation capacityActive power load sensitivity on the purchase of VAR absorption capacityVAR load sensitivity on the purchase of VAR absorption capacity
Figure 6.10: Marginal price at each bus
6.3.3 Final economic settlement
The final settlement of the VAR capacity market is presented in Table 6.6. The benefitsare collected mostly by the generators, and also by capacitor banks and the SVC. On theother hand, loads are the main responsible factor for the VAR capacity requirements.System contingencies are charged for 30% of the purchased VAR capacity, distributedbetween generator outages with 25% of the charges, and transmission line trip with 5%.
The expected operation costs associated with the VAR capacity market are: 1.82 millione per year for the regulated payment for the use of the purchased VAR capacity, and0.5 million e related with low voltage quality. In the resulting market clearing therewere no costs associated with non-supplied energy nor opportunity costs for generationredispatch.
The money is collected and distributed among all the participants once the marketis cleared. The economic volume of the VAR capacity market corresponds to similarvalues used in research studies that estimate the market value as 1% of the total energymarket. For instance, the charge to the load at bus #2 in the VAR capacity auctionis 3 million e-year for its maximum annual consumption of 1104MW and 350.5Mvar.This charge represents approximately 1% of the total costs for this load on active powerpurchases in the energy market, assuming that the average market price is 40e/MW, atan average consumption of 800 MW and 8760 hours per year. Similarly, generator 2 willbe paid 3 million e for the purchase of VAR capacity and it will also be charged for 0.5million e due to its failure rate. The resulting benefits in the VAR capacity market are
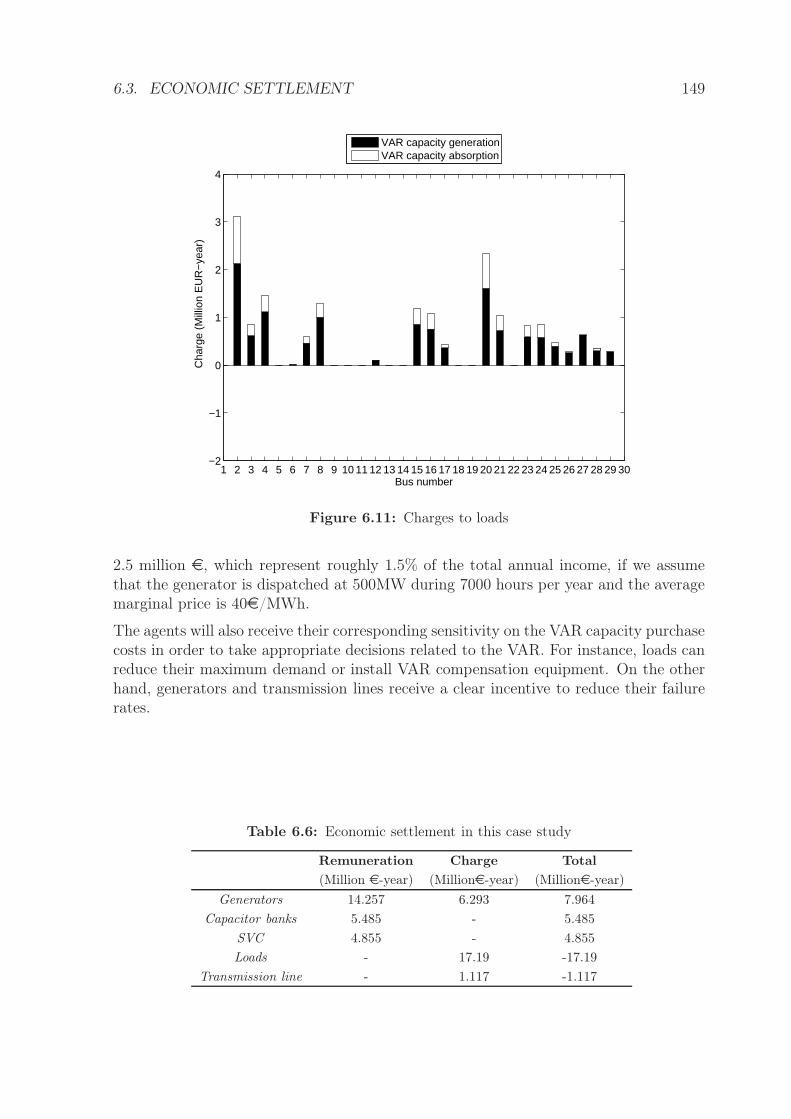
6.3. ECONOMIC SETTLEMENT 149
1 2 3 4 5 6 7 8 9 10 11 12 13 14 15 16 17 18 19 20 21 22 23 24 25 26 27 28 29 30−2
−1
0
1
2
3
4
Bus number
Cha
rge
(Mill
ion
EU
R−
year
)
VAR capacity generationVAR capacity absorption
Figure 6.11: Charges to loads
2.5 million e, which represent roughly 1.5% of the total annual income, if we assumethat the generator is dispatched at 500MW during 7000 hours per year and the averagemarginal price is 40e/MWh.
The agents will also receive their corresponding sensitivity on the VAR capacity purchasecosts in order to take appropriate decisions related to the VAR. For instance, loads canreduce their maximum demand or install VAR compensation equipment. On the otherhand, generators and transmission lines receive a clear incentive to reduce their failurerates.
Table 6.6: Economic settlement in this case study
Remuneration Charge Total
(Million e-year) (Millione-year) (Millione-year)
Generators 14.257 6.293 7.964
Capacitor banks 5.485 - 5.485
SVC 4.855 - 4.855
Loads - 17.19 -17.19
Transmission line - 1.117 -1.117
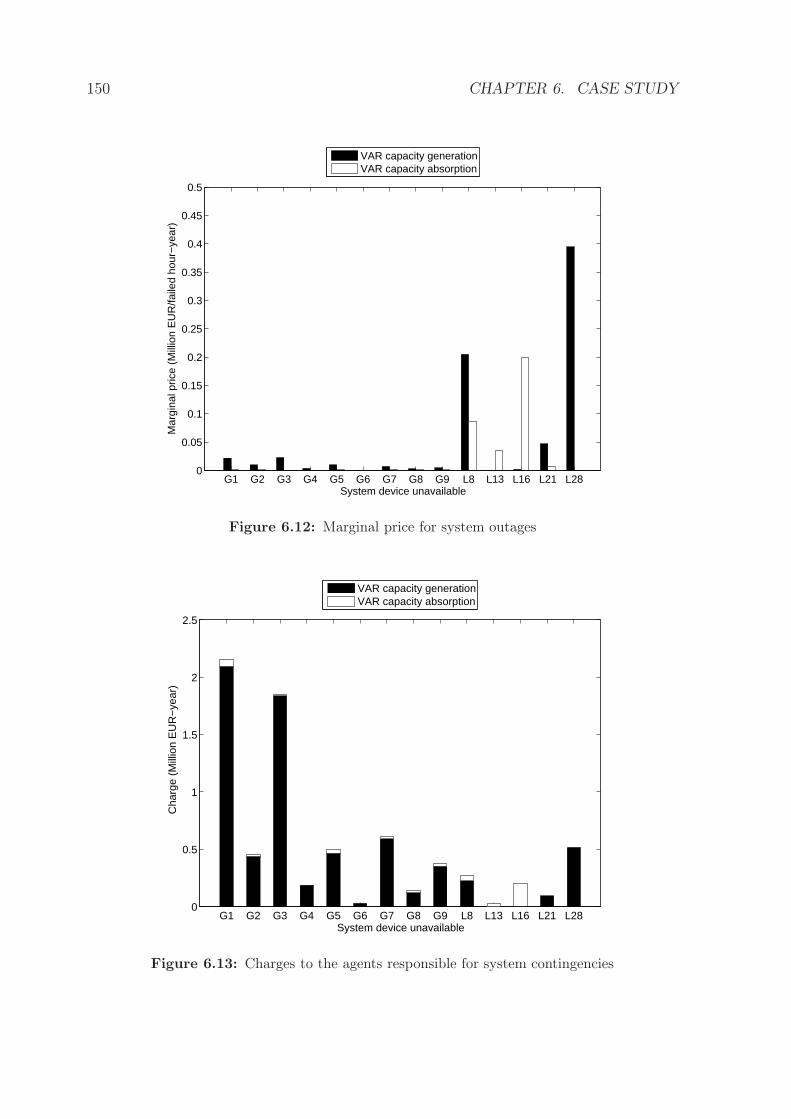
150 CHAPTER 6. CASE STUDY
G1 G2 G3 G4 G5 G6 G7 G8 G9 L8 L13 L16 L21 L280
0.05
0.1
0.15
0.2
0.25
0.3
0.35
0.4
0.45
0.5
Mar
gina
l pric
e (M
illio
n E
UR
/faile
d ho
ur−
year
)
System device unavailable
VAR capacity generationVAR capacity absorption
Figure 6.12: Marginal price for system outages
G1 G2 G3 G4 G5 G6 G7 G8 G9 L8 L13 L16 L21 L280
0.5
1
1.5
2
2.5
System device unavailable
Cha
rge
(Mill
ion
EU
R−
year
)
VAR capacity generationVAR capacity absorption
Figure 6.13: Charges to the agents responsible for system contingencies
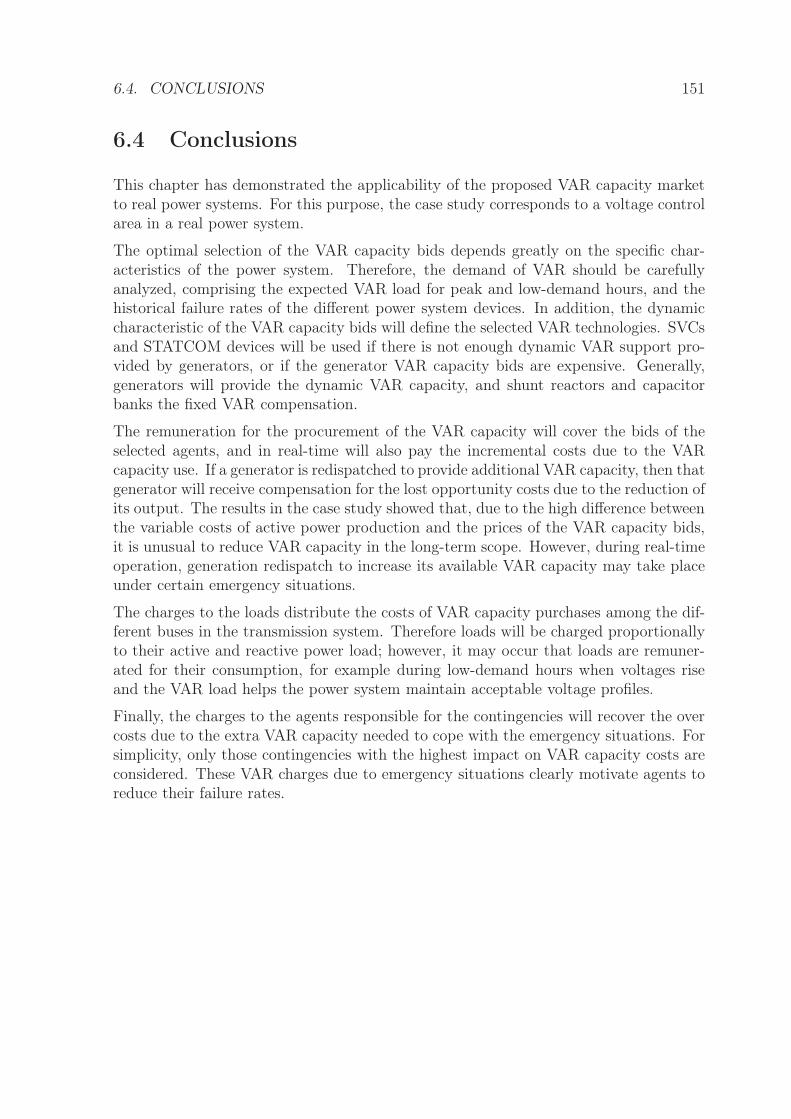
6.4. CONCLUSIONS 151
6.4 Conclusions
This chapter has demonstrated the applicability of the proposed VAR capacity marketto real power systems. For this purpose, the case study corresponds to a voltage controlarea in a real power system.
The optimal selection of the VAR capacity bids depends greatly on the specific char-acteristics of the power system. Therefore, the demand of VAR should be carefullyanalyzed, comprising the expected VAR load for peak and low-demand hours, and thehistorical failure rates of the different power system devices. In addition, the dynamiccharacteristic of the VAR capacity bids will define the selected VAR technologies. SVCsand STATCOM devices will be used if there is not enough dynamic VAR support pro-vided by generators, or if the generator VAR capacity bids are expensive. Generally,generators will provide the dynamic VAR capacity, and shunt reactors and capacitorbanks the fixed VAR compensation.
The remuneration for the procurement of the VAR capacity will cover the bids of theselected agents, and in real-time will also pay the incremental costs due to the VARcapacity use. If a generator is redispatched to provide additional VAR capacity, then thatgenerator will receive compensation for the lost opportunity costs due to the reduction ofits output. The results in the case study showed that, due to the high difference betweenthe variable costs of active power production and the prices of the VAR capacity bids,it is unusual to reduce VAR capacity in the long-term scope. However, during real-timeoperation, generation redispatch to increase its available VAR capacity may take placeunder certain emergency situations.
The charges to the loads distribute the costs of VAR capacity purchases among the dif-ferent buses in the transmission system. Therefore loads will be charged proportionallyto their active and reactive power load; however, it may occur that loads are remuner-ated for their consumption, for example during low-demand hours when voltages riseand the VAR load helps the power system maintain acceptable voltage profiles.
Finally, the charges to the agents responsible for the contingencies will recover the overcosts due to the extra VAR capacity needed to cope with the emergency situations. Forsimplicity, only those contingencies with the highest impact on VAR capacity costs areconsidered. These VAR charges due to emergency situations clearly motivate agents toreduce their failure rates.
152 BIBLIOGRAPHY
6.5 References
[Athay et al., 1979] Athay, T., Podmore, R., and Virmani, S. (1979). A practicalmethod for the direct analysis of transient stability. IEEE Transactions on PowerApparatus and Systems, pages 573–584.
[Billinton and Li, 1994] Billinton, R. and Li, W. (1994). Reliability Assessment of Elec-tric Power Systems Using Monte Carlo Methods. Plenum Press.
[Brooke et al., 1988] Brooke, A., Kendrick, D., Meeraus, A., et al. (1988). GAMS: AUser’s Guide. The Scientific Press.
[Bussieck and Drud, 2001] Bussieck, M. and Drud, A. (2001). Sbb:A new solver for mixed integer nonlinear programming. Slides:www.gams.com/presentations/or01/sbb.pdf; SBB user manual (2002):www.gams.com/solvers/sbb.pdf.
[Conejo et al., 1993] Conejo, A., Gómez, T., and de la Fuente, J. (1993). Pilot-busselection for secondary voltage control. European Transactions on Electrical PowerEngineering, 3(5):359–366.
[de la Fuente, 1997] de la Fuente, J. I. (1997). Configuración del control jerárquico detensiones en un sistema de energía eléctrica. PhD Thesis, Universidad Pontificia deComillas, Madrid (Spain).
[GEC, 1971] GEC (1971). Power-system equivalents. final report on electric researchcouncil project rp90-4, general electric company. page Pages: 196.
[Pai, 1989] Pai, M. (1989). Energy Function Analysis for Power System Stability.Kluwer Academic Pub.
[Stolbjerg-Drud, 1993] Stolbjerg-Drud, A. (1993). Gams/conopt. GAMS-The SolverManuals. Washington DC: GAMS Development Corporation.
[Wang et al., 2003] Wang, H., Li, H., and Chen, H. (2003). Coordinated secondaryvoltage control to eliminate voltage violations in power system contingencies. IEEETransactions on Power Systems, 18(2):588–595.
CHAPTER 7
Conclusions, contributions and future
research
This last chapter is dedicated to present the main conclusions that resulted fromthe research carried out in this thesis dissertation. First, the conclusions of this
work are presented. Then this chapter describes the original contributions that resultedwhile pursuing the general objective of this thesis. Finally, some future lines of researchstemming from the developments of this thesis are identified.
153
154 CHAPTER 7. CONCLUSIONS
7.1 Conclusions
The analysis of recent power system blackouts has found that current regulatory mech-anisms for voltage control and reactive power management do not send efficient locationand economic signals, in order to provide incentives for VAR sources to guarantee systemsecurity. Therefore, there is a need to develop competitive schemes for the procurementof the VQ service, with the objective of economic efficiency, quality of service, andguarantees of the security of supply.
A detailed study of the voltage control service showed that nowadays the most im-portant agents who participate in the service are generators, capacitor banks, shuntreactors, SVCs and STATCOM devices. The different demand agents of the VQ service:loads (including both active and reactive power consumption), and system contingen-cies comprising the failure of generators or other power system devices have also beenidentified.
The definition of a competitive scheme for the procurement of the VQ service requiresthe unbundling of the different activities that integrate the electricity market. In theVQ service a main product is identified: the VAR capacity. The trading of this productrequires certain homogeneity, which is provided by characterizing agents with theirdynamic performance. As the time-frame for the installation of new VAR sources orthe upgrading of the existing ones is generally less than one year, an annual periodicityfor the proposed auction guarantees competition between already installed devices andnew ones. This thesis dissertation therefore proposes a regulatory scheme for the VQservice based on an annual auction for the VAR capacity.
The proposed VAR capacity market is modeled and cleared using an optimization formu-lation. The resulting model is relatively complex, as it includes non-linear equations andbinary variables. Notwithstanding current commercial solvers can manage this problemefficiently and in a reasonable amount of time (the VAR market clearing in a real volt-age control area, including 10 generators and 30 buses, can be solved in 3 hours using adomestic computer). The objective function of the proposed formulation must take intoaccount all the costs related with the procurement of VAR capacity, which comprisesthe purchase of capacity and other expected costs, such as energy losses costs, voltagequality penalties, and costs for non-supplied energy. The formulation should also con-sider the technical constraints of the operation in a real power system together with theeconomic arrangements in the proposed market.
The design scheme for the economic flows in the proposed market should focus on send-ing efficient economic and location signals to the agents involved in the VQ service. Theremuneration mechanism based on long-term marginal prices guarantees that agents re-cover their bid. In addition, if the bid capacity is exhausted, an additional compensationwill encourage new VAR agents to participate in the market.
The charges for the agents demanding the VQ service must measure their impact onthe costs associated with the VAR capacity market. The calculation of the chargesto the loads should consider the compound effect of active power and reactive power
7.2. ORIGINAL CONTRIBUTIONS 155
consumption. The analysis has shown that the costs sensitivities of reactive power arehigher than those of active power; however, the effect of the active power should not beneglected, as it clearly impacts on losses and on the voltage profile.
The unavailability of generators and transmission lines increases the costs of the pur-chase of VAR capacity because additional fast VAR resources are needed to guaranteethe system security under these emergency scenarios. The cost sharing among thecontingencies can be calculated using sensitivity analysis of the state variables for theoutage devices. Hence the resulting charges send efficient signals that encourage themto reduce their failure rates. According to the analysis and results of the case study,the impact on the purchase of VAR capacity of generator unavailability is higher thanthe trip of transmission lines. The main reason for this is that a failed generator withalready purchased VAR capacity requires the purchase of additional fast VAR to coverthe lost capacity. The application of the Cooperative Game Theory to the distributionof the charges guarantees the incurred cost recovery and the fair distribution among theresponsible agents, both for loads and contingencies.
The applicability of the proposed competitive approach for the VAR capacity markethas been verified with a case study that emulates a voltage area in a real power system.The results have shown that market power of generators is mitigated by the installationof other VAR sources, such as capacitor banks and SVCs. In addition, the installation ofVAR compensation devices is a more economic alternative to redispatching of generators.The VAR support provided by SVCs is preferred to capacitor banks and shunt reactors inthose locations where contingencies require a fast VAR support. Moreover, STATCOMdevices become an interesting alternative to SVCs in locations with scarce VAR capacityand with very low voltage profiles.
7.2 Original contributions
The development of this thesis has yielded a number of original contributions that canbe categorized into regulatory and modeling contributions.
7.2.1 Regulatory contributions
A first contribution of this thesis is the definition of the main products associated withvoltage control and reactive power management service, included in chapters 2 and 3,which are VAR capacity and VAR use. In addition, the VAR capacity product has beencharacterized in order to settle a homogeneous product which can be traded freely incompetitive markets.
A second contribution of this thesis is the design of an original regulatory framework forthe procurement of the VQ service, which has been traditionally based on mandatorymechanism or under bilateral contracts. The original proposal, included in Chapter3, presents a transparent market based on an annual auction where the product VAR
156 CHAPTER 7. CONCLUSIONS
capacity is priced and traded. The market clearing takes into account the economic andtechnical characteristics of the supplying agents and provides fair treatment for all themarket participants.
Finally, a third contribution is the design of a scheme for remuneration and payment inthe proposed VAR capacity market which sends efficient economic and location signalsto all participants.
7.2.2 Modeling contributions
This thesis dissertation has presented a novel algorithm for the selection of the VARcapacity bids under the current market proposal. The original contributions in theformulation for the VAR market settlement are provided in Chapter 4:
i) The objective function in the proposed market includes penalties associated withvoltage quality (Section 4.3.1.3). These penalties are based on a valuation thatmeasures the economical impact on the distributor costs of the voltage deviations,as described in Appendix D.
ii) The objective function also takes into account the costs associated with the re-dispatch of generator units to provide additional VAR capacity (Section 4.3.1.4).Hence, the output of generators can be reduced, or even generators can be startedup in order to increase the procurement of VAR capacity.
iii) The formulation for VAR purchase considers a set of possible contingency scenarios(Section 4.3.2.5), and the dynamic performance of the VAR sources to cope withthese emergency situations (Section 4.3.2.4).
Furthermore, in Chapter 5, this thesis also includes original contributions to settle theeconomic flows in the proposed VAR capacity market, among which stand:
i) The payments to the selected VAR agents are based on long-term marginal pricesfor reactive power (Section 5.2).
ii) The charges to the loads in the proposed market take into account both the effectof the active and reactive power load in the total costs of the market (Section5.3.1).
iii) The economic flows also consider charges to the responsible agents of the systemcontingencies. These charges are computed using the information provided by theLagrange multipliers that define the state of the failed devices (Section 5.3.2).
iv) In order to send efficient economic signals, the effect of the variable costs of activepower production is eliminated when calculating the previous Lagrange multipliers(Section 4.4.3).
7.3. FUTURE RESEARCH 157
7.3 Future research
The development of this thesis has lead to a number of future lines of research whoseexploration is likely to yield interesting results. This section tries to summarize themand justify their relevance.
i) A natural continuation of this work is the implementation of the proposed VARcapacity market in a real power system, such as the Spanish network. During theimplementation process, the mathematical formulation could be improved includ-ing additional specific characteristics of the Spanish power system.
ii) The regulatory and the modeling proposals presented in this thesis for the voltagecontrol service can be applied to introduce competition in other ancillary services.For instance, the purchase of supplemental active power reserve (used to restorethe spinning and the non-spinning active power reserves that are used during acontingency situation), or the selection of the black-start units (generators that areable to start themselves up without support from the grid, and have sufficient realand reactive capability to be useful in energizing pieces of the transmission systemand starting additional generators). The optimal procurement of the previousancillary services is a trade-off between the costs of purchasing a volume of serviceand the costs associated with the security of supply.
iii) The increasing penetration of distributed generation in sub-transmission systemsposes a new challenge and an opportunity for voltage control in these networks.The distributed generation should receive similar efficient signals as the ones pro-posed in this thesis, in order to help the power system security and economicefficiency. For this purpose the basis of the proposed VAR capacity market canbe applied to sub-transmission networks, taking into account the specific charac-teristics of these power systems.

158 CHAPTER 7. CONCLUSIONS
APPENDIX A
International review of the VQ service
In Chapter 2 a summary of the regulatory models for the VQ service was presented.For a better understanding of the distinctive features of each power system, a de-
tailed analysis is carried out in this appendix. The analysis is focused on the innovativeproposals for the VQ service in Spain and the United Kingdom. In addition, a com-parative review of other regulatory frameworks in Europe, the United States and othercountries is presented.
159
160 APPENDIX A. INTERNATIONAL REVIEW
A.1 The VQ service in Spain
This section presents a review of the reactive power support and voltage control manage-ment in the Spanish transmission network. First, a general description of the Spanishelectricity market is presented. Then, the two market mechanisms for reactive powerand voltage control are described, and the SO tools and the generator controls for volt-age and VAR management are detailed. Finally, an analysis of the current situation iscarried out and recommendations for future developments are proposed.
A.1.1 Description of the Spanish electricity market
The Spanish electricity market which started on January 1, 1998 is managed by twoseparate entities: The Market Operator (OMEL) and the System Operator (REE).OMEL runs the day-ahead energy market, based on an hourly matching of generationand demand bids. On the other hand, REE is responsible for the secure operation ofthe power system and manages the ancillary services markets.
In December 2006 the Spanish Power System had a total generation capacity of 78754MW,to cover the peak demand of 42153MW [REE, 2006]. REE is the owner of the transmis-sion system, which has a total length of 33.197 km (including 400kV and 220kV voltagelevels), and the sum of the transformer capacity is 51.872MVA.
The technical operation of the Spanish power system is regulated by different OperatingProcedures [REE, 1998]. The ones related with voltage control are:
• P.O.-1.1 Operation and security principles.
• P.O.-1.3 Admissible voltages in the transmission network.
• P.O.-3.2 System constraint management.
• P.O.-7.4 Voltage control ancillary service.
• P.O.-8.3 Voltage control definition.
A.1.2 Voltage control and VAR management
The Spanish voltage control and reactive power management is based on two marketmechanisms for its procurement:
i) The voltage control ancillary service which is provided by a a set of VAR resources,whose regulation capacity is assigned through an annual auction, and the real-timeoperation is managed by REE.
A.1. THE VQ SERVICE IN SPAIN 161
ii) The constraint management that is a mechanism used to solve congestion andlow-voltage problems in the transmission network after the day-ahead market iscleared. To solve these constraints, REE ask generators to modify their outputsaccording to their submitted bids.
These two mechanisms for voltage control management are presented in detail in thefollowing subsections.
A.1.2.1 Voltage control Ancillary Service
This service is defined in the Operating Procedure P.O.-7.4 (March 2000) [REE, 2000].Regarding regulation capacity that should be provided annually by VAR sources thereare two different requirements. First, a mandatory regulation capacity and VAR obliga-tions have been set for all market participants. There is no remuneration for this part ofthe service. Additionally, market participants may offer an additional regulation capac-ity or VAR provision, submitting quantities at a regulated price in the annual auction.On the other hand, VAR sources are scheduled and controlled by REE on a daily basis.
At present, the market for the additional capacity has not yet been implemented. Underthe current situation, only the mandatory capacity requirements must be fulfilled bygenerators and the reference voltage ranges must also be followed. These ranges arepublished every year by REE, for every power system area and for specific buses, andare obtained by off-line optimization studies. REE actually follows the voltage controlservice and publishes the measures for the service. If a generation plant does not fulfillthe mandatory requirements no penalty is applied, however the anomalous situation iscommunicated to the Energy Regulatory Institutions.
The structure of the voltage control service comprises different issues, which are detailedin the next paragraphs: voltage control suppliers, service procurement and monitoring,economic flows, and an illustrative example.
A.1.2.1.1 Service suppliers Only market participants connected to the transmis-sion network can provide this service:
• Generators. The service is provided by generation units connected to the sametransmission bus, with installed capacity equal to or exceeding 30 MW.
• Transmission companies. This includes REE and other companies who own partof the 220 kV grid.
• Qualified non-regulated consumers, with a contracted demand of above 15 MW.
• Distribution companies.
162 APPENDIX A. INTERNATIONAL REVIEW
A.1.2.1.2 Service procurement The mandatory regulation capacity requirementsand additional procurement are differentiated:
• Mandatory VAR generation and absorption regulation capacity ranges are de-fined as follows:
– Generators: the mandatory VAR output expressed as a percentage of themaximum MW output is a function of the transmission voltage (solid linesin Figure A.1 and Figure A.2). Both magnitudes, VAR outputs and volt-ages, are specified for the transmission High Voltage busbar of the generationsubstation. If the generation unit cannot reach the mandatory VAR require-ments, it must carry out the needed investments.
– Transmission companies: all the installed VAR resources should be availableto provide the service.
– Qualified consumers and distribution companies: power factor ranges are de-fined in three time frames, peak hours (cos φ ≥ 0.95 inductive), flat hours(cos φ ≤ 1 inductive) and valley hours (0.95 ≤ cos φ ≤ 1 both inductive).
• Additional VAR generation and absorption regulation capacity ranges are definedas follows:
– Generators can bid quantity, but not price, of exceeding reactive power reg-ulation capacity, both for generation and absorption. Different bids can besubmitted for each month and main transformer tap ratios. Each bid includestwo tables, one for reactive power generation capacity, and one for reactivepower absorption capacity, as presented in Table A.1. To verify the submit-ted values, detailed technical data from the generation plant is required byREE.
– Qualified consumers and distribution companies can offer their exceedingVAR capacity, structured in bids for each month and demand period (peak,flat, and valley hours).
In an annual auction REE assigns the additional VAR regulation capacity to eachservice provider, trying to minimize additional payments.
A.1.2.1.3 Service monitoring REE supervises the performance of the voltagecontrol service using measures received at the CECOEL (which in Spanish stands forCentro de Control Eléctrico). Active and reactive power flows and voltages in the trans-mission buses are registered every 5 minutes for generators and every 10 minutes for con-sumers. In the case of measurement errors, the values coming from the state-estimatorsoftware are used instead.
After the day-ahead market REE will compute daily the hour-reference-voltages forevery controlled transmission bus. Currently REE only provides voltage reference rangesfor some system areas and specific buses.
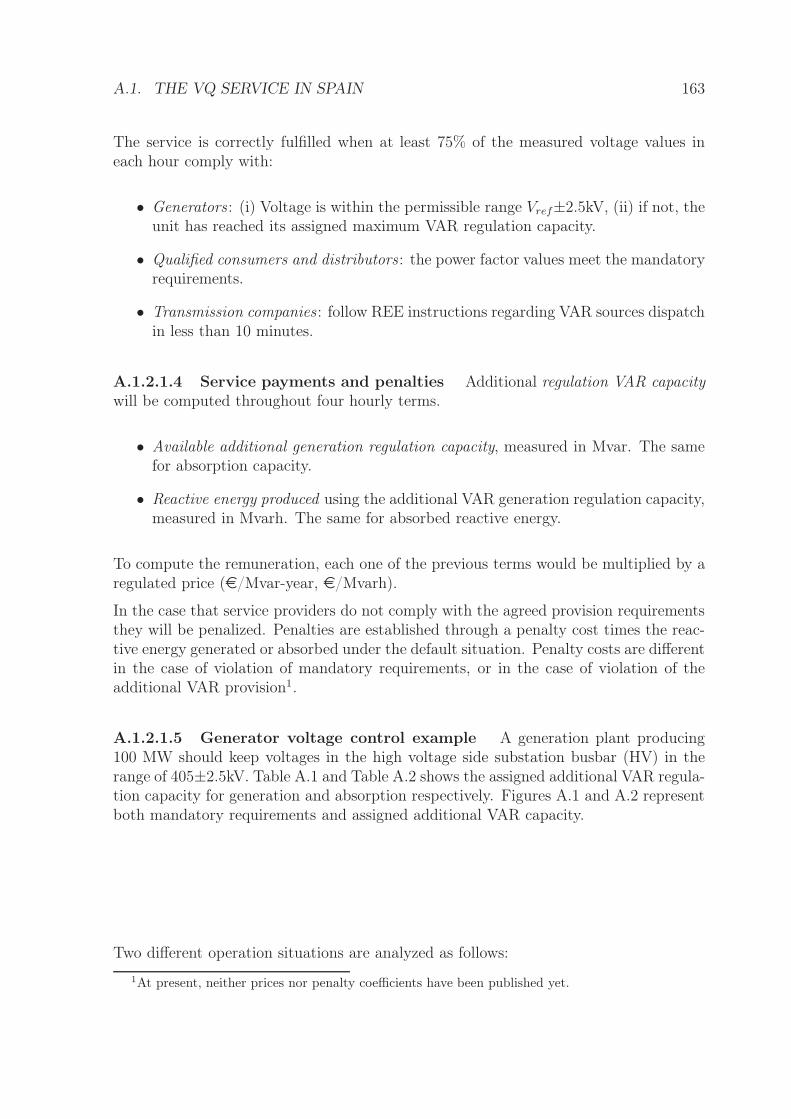
A.1. THE VQ SERVICE IN SPAIN 163
The service is correctly fulfilled when at least 75% of the measured voltage values ineach hour comply with:
• Generators: (i) Voltage is within the permissible range Vref±2.5kV, (ii) if not, theunit has reached its assigned maximum VAR regulation capacity.
• Qualified consumers and distributors: the power factor values meet the mandatoryrequirements.
• Transmission companies: follow REE instructions regarding VAR sources dispatchin less than 10 minutes.
A.1.2.1.4 Service payments and penalties Additional regulation VAR capacitywill be computed throughout four hourly terms.
• Available additional generation regulation capacity, measured in Mvar. The samefor absorption capacity.
• Reactive energy produced using the additional VAR generation regulation capacity,measured in Mvarh. The same for absorbed reactive energy.
To compute the remuneration, each one of the previous terms would be multiplied by aregulated price (e/Mvar-year, e/Mvarh).
In the case that service providers do not comply with the agreed provision requirementsthey will be penalized. Penalties are established through a penalty cost times the reac-tive energy generated or absorbed under the default situation. Penalty costs are differentin the case of violation of mandatory requirements, or in the case of violation of theadditional VAR provision1.
A.1.2.1.5 Generator voltage control example A generation plant producing100 MW should keep voltages in the high voltage side substation busbar (HV) in therange of 405±2.5kV. Table A.1 and Table A.2 shows the assigned additional VAR regula-tion capacity for generation and absorption respectively. Figures A.1 and A.2 representboth mandatory requirements and assigned additional VAR capacity.
Two different operation situations are analyzed as follows:
1At present, neither prices nor penalty coefficients have been published yet.
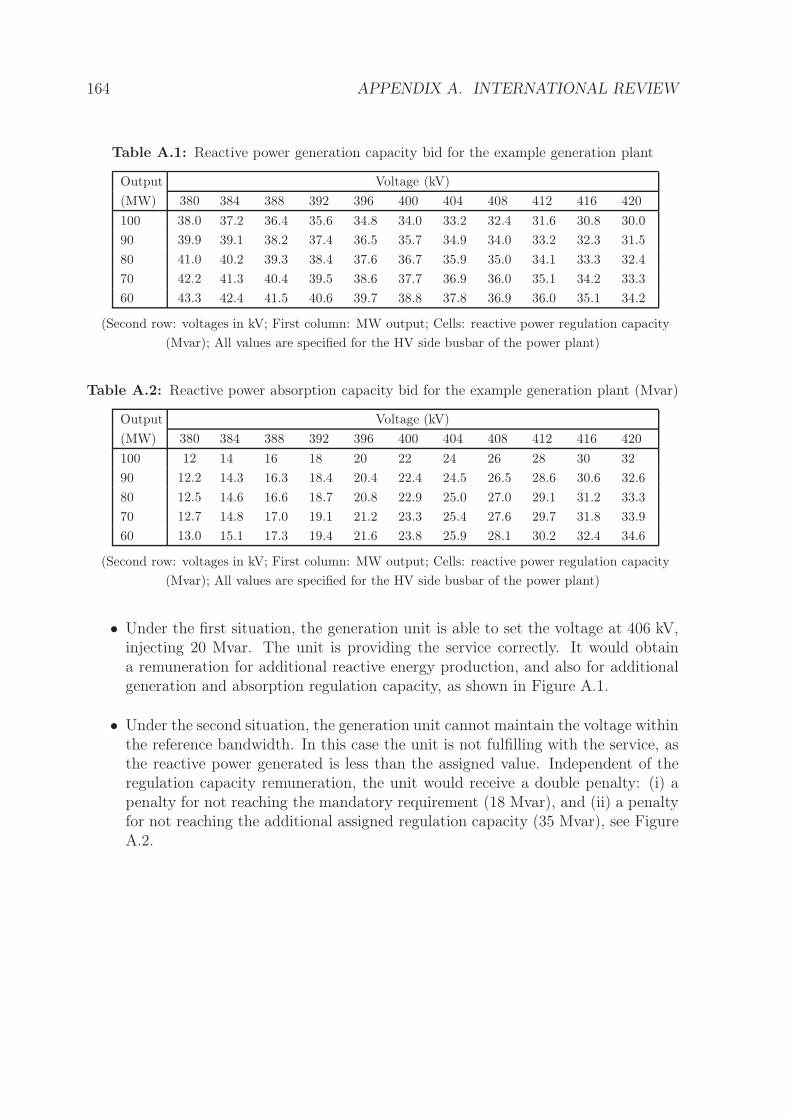
164 APPENDIX A. INTERNATIONAL REVIEW
Table A.1: Reactive power generation capacity bid for the example generation plant
Output Voltage (kV)
(MW) 380 384 388 392 396 400 404 408 412 416 420
100 38.0 37.2 36.4 35.6 34.8 34.0 33.2 32.4 31.6 30.8 30.0
90 39.9 39.1 38.2 37.4 36.5 35.7 34.9 34.0 33.2 32.3 31.5
80 41.0 40.2 39.3 38.4 37.6 36.7 35.9 35.0 34.1 33.3 32.4
70 42.2 41.3 40.4 39.5 38.6 37.7 36.9 36.0 35.1 34.2 33.3
60 43.3 42.4 41.5 40.6 39.7 38.8 37.8 36.9 36.0 35.1 34.2
(Second row: voltages in kV; First column: MW output; Cells: reactive power regulation capacity
(Mvar); All values are specified for the HV side busbar of the power plant)
Table A.2: Reactive power absorption capacity bid for the example generation plant (Mvar)
Output Voltage (kV)
(MW) 380 384 388 392 396 400 404 408 412 416 420
100 12 14 16 18 20 22 24 26 28 30 32
90 12.2 14.3 16.3 18.4 20.4 22.4 24.5 26.5 28.6 30.6 32.6
80 12.5 14.6 16.6 18.7 20.8 22.9 25.0 27.0 29.1 31.2 33.3
70 12.7 14.8 17.0 19.1 21.2 23.3 25.4 27.6 29.7 31.8 33.9
60 13.0 15.1 17.3 19.4 21.6 23.8 25.9 28.1 30.2 32.4 34.6
(Second row: voltages in kV; First column: MW output; Cells: reactive power regulation capacity
(Mvar); All values are specified for the HV side busbar of the power plant)
• Under the first situation, the generation unit is able to set the voltage at 406 kV,injecting 20 Mvar. The unit is providing the service correctly. It would obtaina remuneration for additional reactive energy production, and also for additionalgeneration and absorption regulation capacity, as shown in Figure A.1.
• Under the second situation, the generation unit cannot maintain the voltage withinthe reference bandwidth. In this case the unit is not fulfilling with the service, asthe reactive power generated is less than the assigned value. Independent of theregulation capacity remuneration, the unit would receive a double penalty: (i) apenalty for not reaching the mandatory requirement (18 Mvar), and (ii) a penaltyfor not reaching the additional assigned regulation capacity (35 Mvar), see FigureA.2.
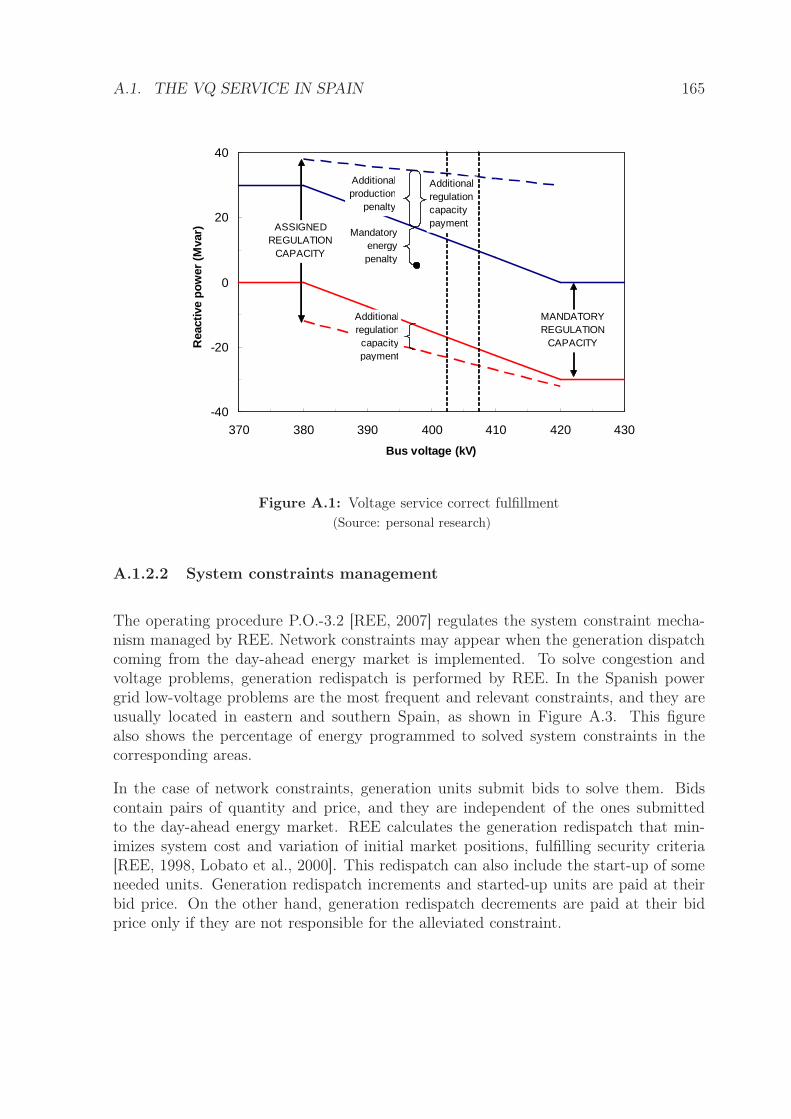
A.1. THE VQ SERVICE IN SPAIN 165
-40
-20
0
20
40
370 380 390 400 410 420 430
Bus voltage (kV)
Rea
ctiv
e p
ower
(M
var) Mandatory
energypenalty
Additional production
penalty
Additional regulationcapacity payment
Additionalregulation capacity payment
MANDATORYREGULATION
CAPACITY
ASSIGNEDREGULATION
CAPACITY
Figure A.1: Voltage service correct fulfillment
(Source: personal research)
A.1.2.2 System constraints management
The operating procedure P.O.-3.2 [REE, 2007] regulates the system constraint mecha-nism managed by REE. Network constraints may appear when the generation dispatchcoming from the day-ahead energy market is implemented. To solve congestion andvoltage problems, generation redispatch is performed by REE. In the Spanish powergrid low-voltage problems are the most frequent and relevant constraints, and they areusually located in eastern and southern Spain, as shown in Figure A.3. This figurealso shows the percentage of energy programmed to solved system constraints in thecorresponding areas.
In the case of network constraints, generation units submit bids to solve them. Bidscontain pairs of quantity and price, and they are independent of the ones submittedto the day-ahead energy market. REE calculates the generation redispatch that min-imizes system cost and variation of initial market positions, fulfilling security criteria[REE, 1998, Lobato et al., 2000]. This redispatch can also include the start-up of someneeded units. Generation redispatch increments and started-up units are paid at theirbid price. On the other hand, generation redispatch decrements are paid at their bidprice only if they are not responsible for the alleviated constraint.
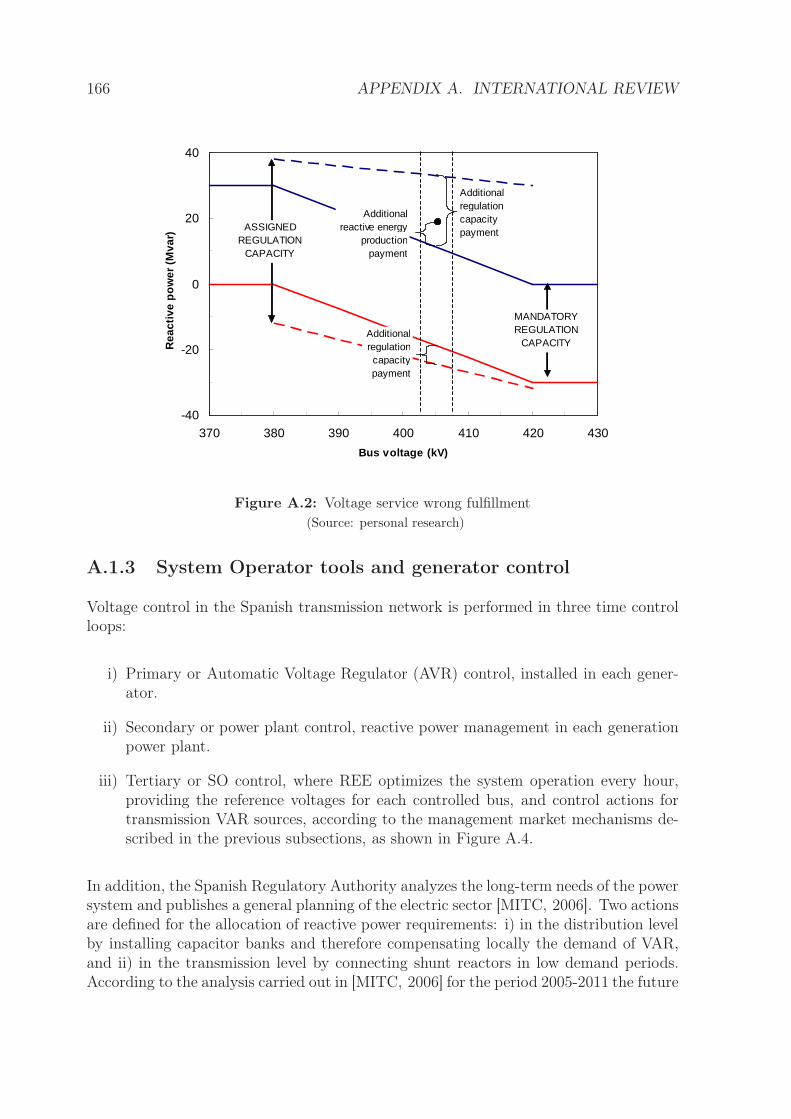
166 APPENDIX A. INTERNATIONAL REVIEW
-40
-20
0
20
40
370 380 390 400 410 420 430
Bus voltage (kV)
Rea
ctiv
e p
ow
er (
Mva
r)
Additional reactive energy
production payment
Additionalregulation capacity payment
Additionalregulation capacity payment
MANDATORYREGULATION
CAPACITY
ASSIGNEDREGULATION
CAPACITY
Figure A.2: Voltage service wrong fulfillment
(Source: personal research)
A.1.3 System Operator tools and generator control
Voltage control in the Spanish transmission network is performed in three time controlloops:
i) Primary or Automatic Voltage Regulator (AVR) control, installed in each gener-ator.
ii) Secondary or power plant control, reactive power management in each generationpower plant.
iii) Tertiary or SO control, where REE optimizes the system operation every hour,providing the reference voltages for each controlled bus, and control actions fortransmission VAR sources, according to the management market mechanisms de-scribed in the previous subsections, as shown in Figure A.4.
In addition, the Spanish Regulatory Authority analyzes the long-term needs of the powersystem and publishes a general planning of the electric sector [MITC, 2006]. Two actionsare defined for the allocation of reactive power requirements: i) in the distribution levelby installing capacitor banks and therefore compensating locally the demand of VAR,and ii) in the transmission level by connecting shunt reactors in low demand periods.According to the analysis carried out in [MITC, 2006] for the period 2005-2011 the future
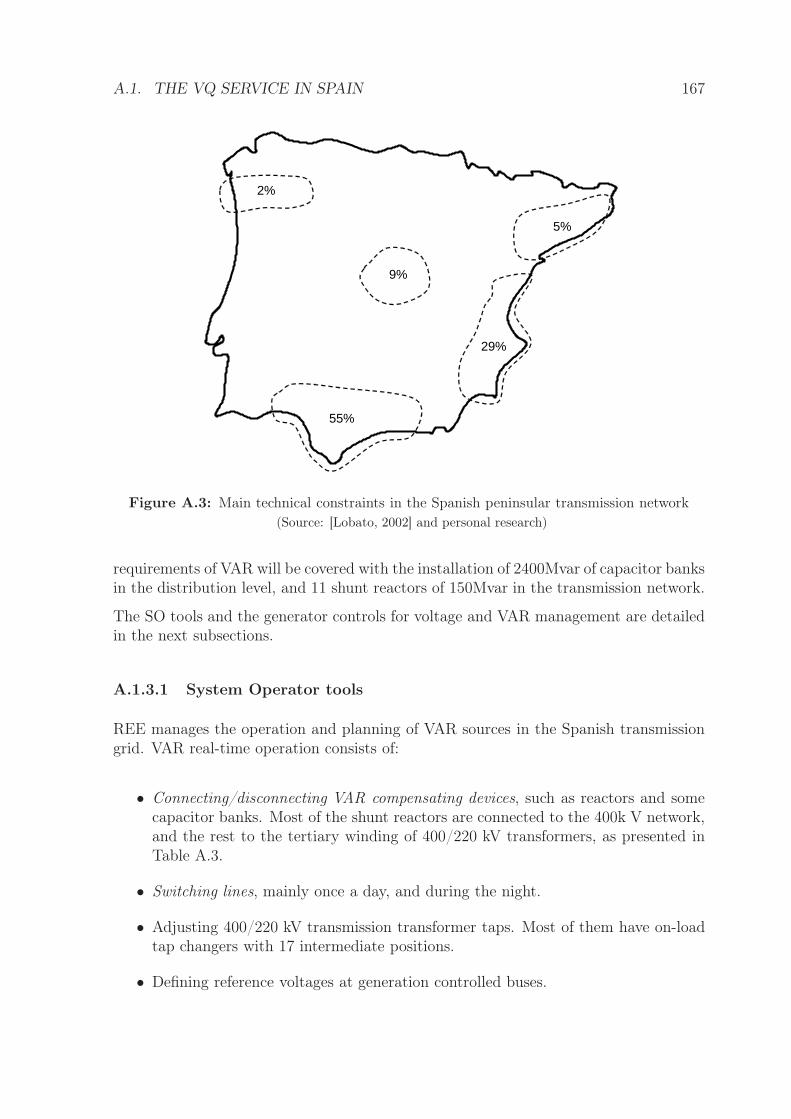
A.1. THE VQ SERVICE IN SPAIN 167
9%
55%
29%
2%
5%
Figure A.3: Main technical constraints in the Spanish peninsular transmission network
(Source: [Lobato, 2002] and personal research)
requirements of VAR will be covered with the installation of 2400Mvar of capacitor banksin the distribution level, and 11 shunt reactors of 150Mvar in the transmission network.
The SO tools and the generator controls for voltage and VAR management are detailedin the next subsections.
A.1.3.1 System Operator tools
REE manages the operation and planning of VAR sources in the Spanish transmissiongrid. VAR real-time operation consists of:
• Connecting/disconnecting VAR compensating devices, such as reactors and somecapacitor banks. Most of the shunt reactors are connected to the 400k V network,and the rest to the tertiary winding of 400/220 kV transformers, as presented inTable A.3.
• Switching lines, mainly once a day, and during the night.
• Adjusting 400/220 kV transmission transformer taps. Most of them have on-loadtap changers with 17 intermediate positions.
• Defining reference voltages at generation controlled buses.
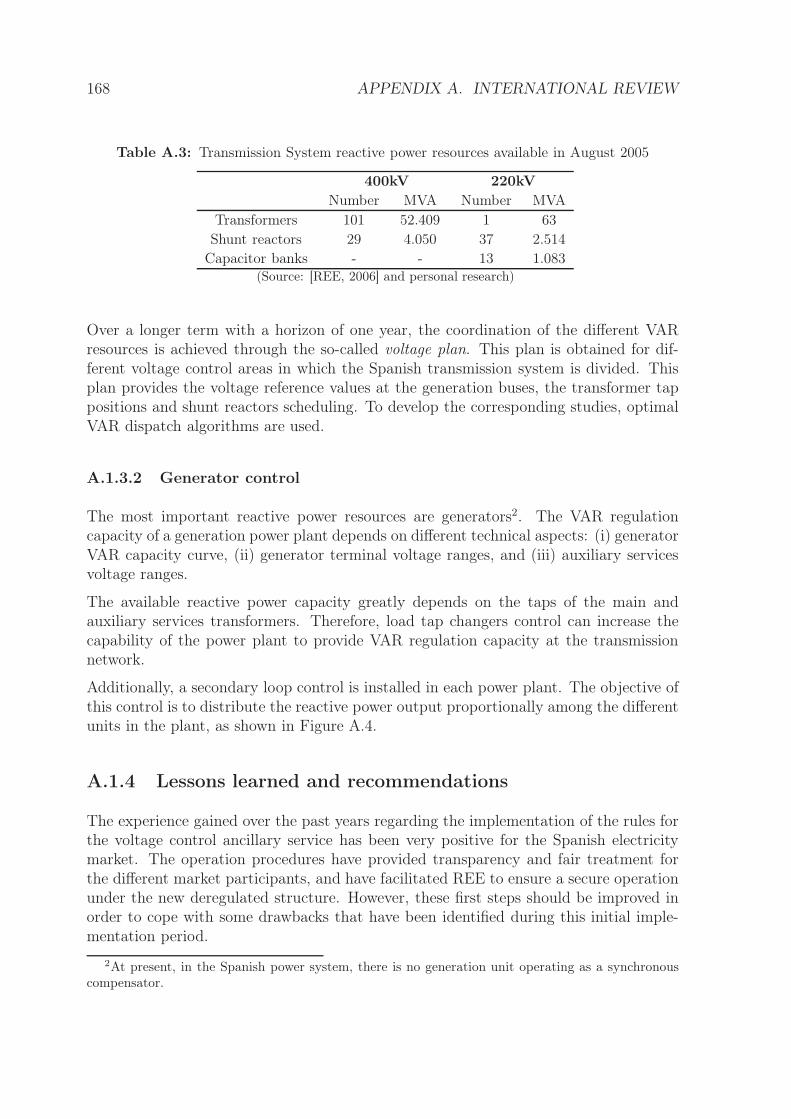
168 APPENDIX A. INTERNATIONAL REVIEW
Table A.3: Transmission System reactive power resources available in August 2005
400kV 220kV
Number MVA Number MVA
Transformers 101 52.409 1 63
Shunt reactors 29 4.050 37 2.514
Capacitor banks - - 13 1.083(Source: [REE, 2006] and personal research)
Over a longer term with a horizon of one year, the coordination of the different VARresources is achieved through the so-called voltage plan. This plan is obtained for dif-ferent voltage control areas in which the Spanish transmission system is divided. Thisplan provides the voltage reference values at the generation buses, the transformer tappositions and shunt reactors scheduling. To develop the corresponding studies, optimalVAR dispatch algorithms are used.
A.1.3.2 Generator control
The most important reactive power resources are generators2. The VAR regulationcapacity of a generation power plant depends on different technical aspects: (i) generatorVAR capacity curve, (ii) generator terminal voltage ranges, and (iii) auxiliary servicesvoltage ranges.
The available reactive power capacity greatly depends on the taps of the main andauxiliary services transformers. Therefore, load tap changers control can increase thecapability of the power plant to provide VAR regulation capacity at the transmissionnetwork.
Additionally, a secondary loop control is installed in each power plant. The objective ofthis control is to distribute the reactive power output proportionally among the differentunits in the plant, as shown in Figure A.4.
A.1.4 Lessons learned and recommendations
The experience gained over the past years regarding the implementation of the rules forthe voltage control ancillary service has been very positive for the Spanish electricitymarket. The operation procedures have provided transparency and fair treatment forthe different market participants, and have facilitated REE to ensure a secure operationunder the new deregulated structure. However, these first steps should be improved inorder to cope with some drawbacks that have been identified during this initial imple-mentation period.
2At present, in the Spanish power system, there is no generation unit operating as a synchronouscompensator.
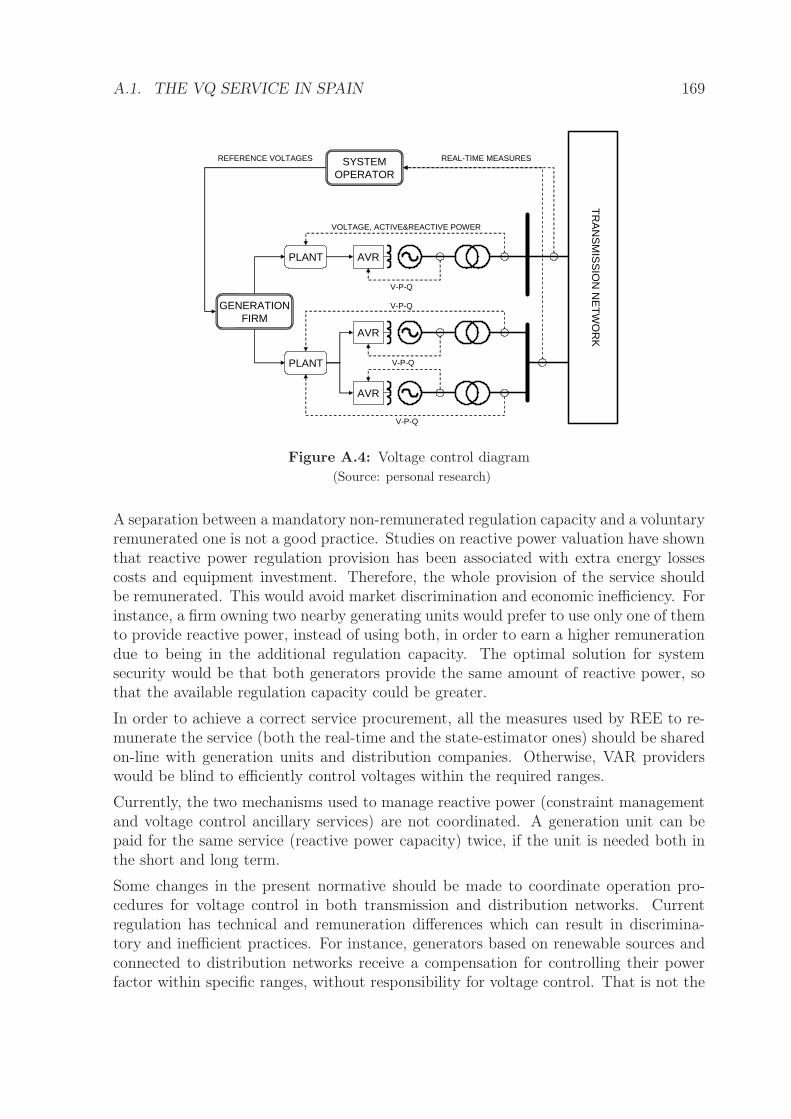
A.1. THE VQ SERVICE IN SPAIN 169
AVR
AVR
AVRPLANT
PLANT
GENERATIONFIRM
SYSTEMOPERATOR
REAL-TIME MEASURESREFERENCE VOLTAGES
TR
AN
SM
ISS
ION
NE
TW
OR
K
VOLTAGE, ACTIVE&REACTIVE POWER
V-P-Q
V-P-Q
V-P-Q
V-P-Q
Figure A.4: Voltage control diagram
(Source: personal research)
A separation between a mandatory non-remunerated regulation capacity and a voluntaryremunerated one is not a good practice. Studies on reactive power valuation have shownthat reactive power regulation provision has been associated with extra energy lossescosts and equipment investment. Therefore, the whole provision of the service shouldbe remunerated. This would avoid market discrimination and economic inefficiency. Forinstance, a firm owning two nearby generating units would prefer to use only one of themto provide reactive power, instead of using both, in order to earn a higher remunerationdue to being in the additional regulation capacity. The optimal solution for systemsecurity would be that both generators provide the same amount of reactive power, sothat the available regulation capacity could be greater.
In order to achieve a correct service procurement, all the measures used by REE to re-munerate the service (both the real-time and the state-estimator ones) should be sharedon-line with generation units and distribution companies. Otherwise, VAR providerswould be blind to efficiently control voltages within the required ranges.
Currently, the two mechanisms used to manage reactive power (constraint managementand voltage control ancillary services) are not coordinated. A generation unit can bepaid for the same service (reactive power capacity) twice, if the unit is needed both inthe short and long term.
Some changes in the present normative should be made to coordinate operation pro-cedures for voltage control in both transmission and distribution networks. Currentregulation has technical and remuneration differences which can result in discrimina-tory and inefficient practices. For instance, generators based on renewable sources andconnected to distribution networks receive a compensation for controlling their powerfactor within specific ranges, without responsibility for voltage control. That is not the
170 APPENDIX A. INTERNATIONAL REVIEW
case for generators connected to transmission networks. Furthermore, distribution op-erators currently cannot manage all the reactive power resources in their networks, suchas distributed generation, to contribute to voltage control in the transmission network.
Finally, under the new common electric market between Spain and Portugal (MIBEL)a harmonization of the different operating proceedings should be achieved. Currently,Portugal defines the VQ service regulation in Condiçoes técnicas de ligaçao à rede na-cional de transporte in [DDR, 2000], where generators are required to work within apower factor 0.85 producing VAR to 0.9 absorbing VAR.
A.2 The VQ service in the United Kingdom
This section presents a review of the reactive power management in the United Kingdom.First, a general description of the electricity market is presented. Then, the reactivepower balancing service is described, and the SO tools and the generator controls forvoltage and VAR management detailed. Finally, an analysis of the current experienceis presented.
A.2.1 The electricity market in the United Kingdom
The electricity market in the United Kingdom began in 1991, and was reviewed in 2001with the name of NETA. The electricity trading arrangements under NETA consist ofthree elements: a physical contracts market, a balancing mechanism, and the ancillaryservices markets. The National Grid Company (NGC) is the Transmission SystemOperator, and it is also responsible for the ancillary services management, consisting of:frequency control, reserve management and energy balance, reactive power and voltagecontrol, and black start. All these services are provided predominantly by generatorsunder contracts by NGC. Contracts are obtained via a tendering process or bilateralnegotiations. Like other power systems, the costs associated with the ancillary servicesare passed through the load, with an uplift in the transmission tariff.
The cost for the purchase of ancillary services in the period 2007/08 is distributedas follows: 64 £ million for reactive power service, 106 £ million for frequency re-sponse, 39 £ million for fast active power reserve, and 65 £ million for standing reserve[OFGEM, 2007].
The peak demand in 2002 was 54.6GWh, and the annual consumption was 309.2TWh.The capacity mix is based mainly on coal fired power plants (45%), gas turbines (31%),and nuclear units (16%).
A.2.2 The reactive power balancing service
The next paragraphs describe the main issues of the VAR balancing service, comprisingvoltage control service procurement and monitoring, economic flows, and an illustrative
A.2. THE VQ SERVICE IN THE UNITED KINGDOM 171
example.
A.2.2.1 Service procurement
The reactive power balancing service is required for generation units connected to thetransmission system, with a capacity of over 30MW. NGC establishes two ranges forthe VAR service procurement, a mandatory VAR service procurement and an enhancedreactive power service.
• The mandatory VAR service is the provision of regulating reactive power output.At any given active power generation point, generators may be requested to pro-duce or absorb reactive power to help manage system voltages close to its point ofconnection. According to the Grid Code CC 6.3.2. [NGC, 2007a], all synchronousgenerating units must be capable of supplying rated MW at any point between thelimits 0.85 power factor lagging and 0.95 power factor leading at the generatingunit terminals. Generally, non-synchronous generators must be capable of sup-plying their rated MW output at any point between the limits 0.95 power factorlagging and 0.95 power factor leading at the connecting point to the transmissionnetwork.
• The enhanced VAR service is the provision of (i) voltage support which exceedsthe minimum technical requirement of the mandatory VAR service (including Syn-chronous Compensation), and/or (ii) the VAR capability from any other plant orapparatus which can generate or absorb reactive power (including Static Compen-sation equipment) that is not required to provide the obligatory reactive powerservice.
The enhanced VAR service is procured with tenders, which are held every six months,starting on April 1 and October 1 respectively. Before the VAR tender is called, inorder to participate in the tender, generators must submit a bid for VAR. Bids includethree terms, (i) utilization prices (£/Mvarh), available capability prices (£/Mvar/h),and synchronized capability prices (£/Mvar/h). Prices are associated to four VARcapacity ranges, defined by three points of VAR absorption capacity, and three pointsfor VAR generation capacity (see Figure A.5). All tenders are submitted in periodscorresponding to whole calendar months, in order to be no less than twelve consecutivemonths and in multiples of six months.
If the generator bid is selected in the tender, in accordance with the evaluation criteriaspecified in the Grid Code [NGC, 2007a], then the generator will be granted with amarket agreement with the SO. On the other hand, if a tender is not successful and thegenerator is required to provide the mandatory VAR service, then the generator willcontinue on the default arrangements for the mandatory requirements.
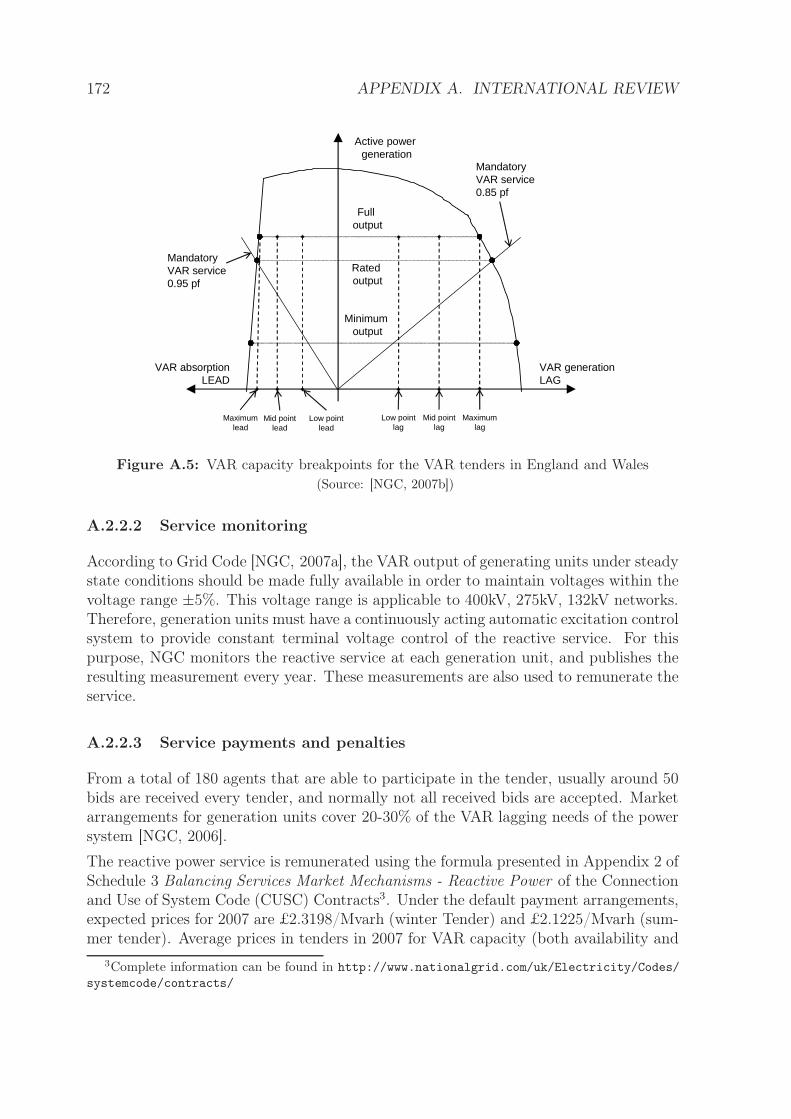
172 APPENDIX A. INTERNATIONAL REVIEW
VAR generationLAG
VAR absorptionLEAD
Active powergeneration
Mandatory VAR service0.85 pf
Low pointlag
Mid pointlag
Maximumlag
Maximumlead
Mid pointlead
Low pointlead
Rated output
Full output
Minimum output
Mandatory VAR service0.95 pf
Figure A.5: VAR capacity breakpoints for the VAR tenders in England and Wales
(Source: [NGC, 2007b])
A.2.2.2 Service monitoring
According to Grid Code [NGC, 2007a], the VAR output of generating units under steadystate conditions should be made fully available in order to maintain voltages within thevoltage range ±5%. This voltage range is applicable to 400kV, 275kV, 132kV networks.Therefore, generation units must have a continuously acting automatic excitation controlsystem to provide constant terminal voltage control of the reactive service. For thispurpose, NGC monitors the reactive service at each generation unit, and publishes theresulting measurement every year. These measurements are also used to remunerate theservice.
A.2.2.3 Service payments and penalties
From a total of 180 agents that are able to participate in the tender, usually around 50bids are received every tender, and normally not all received bids are accepted. Marketarrangements for generation units cover 20-30% of the VAR lagging needs of the powersystem [NGC, 2006].
The reactive power service is remunerated using the formula presented in Appendix 2 ofSchedule 3 Balancing Services Market Mechanisms - Reactive Power of the Connectionand Use of System Code (CUSC) Contracts3. Under the default payment arrangements,expected prices for 2007 are £2.3198/Mvarh (winter Tender) and £2.1225/Mvarh (sum-mer tender). Average prices in tenders in 2007 for VAR capacity (both availability and
3Complete information can be found in http://www.nationalgrid.com/uk/Electricity/Codes/
systemcode/contracts/
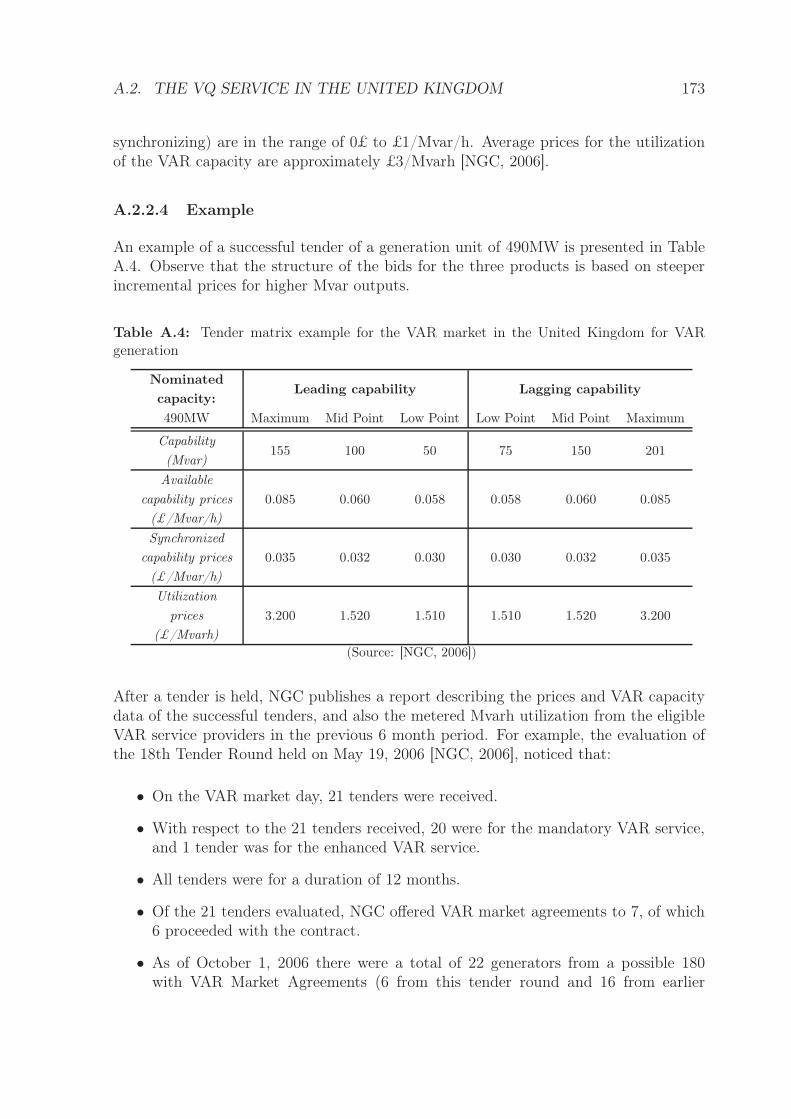
A.2. THE VQ SERVICE IN THE UNITED KINGDOM 173
synchronizing) are in the range of 0£ to £1/Mvar/h. Average prices for the utilizationof the VAR capacity are approximately £3/Mvarh [NGC, 2006].
A.2.2.4 Example
An example of a successful tender of a generation unit of 490MW is presented in TableA.4. Observe that the structure of the bids for the three products is based on steeperincremental prices for higher Mvar outputs.
Table A.4: Tender matrix example for the VAR market in the United Kingdom for VARgeneration
Nominated
capacity:Leading capability Lagging capability
490MW Maximum Mid Point Low Point Low Point Mid Point Maximum
Capability
(Mvar)155 100 50 75 150 201
Available
capability prices
(£/Mvar/h)
0.085 0.060 0.058 0.058 0.060 0.085
Synchronized
capability prices
(£/Mvar/h)
0.035 0.032 0.030 0.030 0.032 0.035
Utilization
prices
(£/Mvarh)
3.200 1.520 1.510 1.510 1.520 3.200
(Source: [NGC, 2006])
After a tender is held, NGC publishes a report describing the prices and VAR capacitydata of the successful tenders, and also the metered Mvarh utilization from the eligibleVAR service providers in the previous 6 month period. For example, the evaluation ofthe 18th Tender Round held on May 19, 2006 [NGC, 2006], noticed that:
• On the VAR market day, 21 tenders were received.
• With respect to the 21 tenders received, 20 were for the mandatory VAR service,and 1 tender was for the enhanced VAR service.
• All tenders were for a duration of 12 months.
• Of the 21 tenders evaluated, NGC offered VAR market agreements to 7, of which6 proceeded with the contract.
• As of October 1, 2006 there were a total of 22 generators from a possible 180with VAR Market Agreements (6 from this tender round and 16 from earlier
174 APPENDIX A. INTERNATIONAL REVIEW
tender rounds). Any generator on a Reactive Power Market Agreement that com-menced on October 1, 2006 cannot be tendered again until Tender Round 20 (foragreements commencing on October 1, 2007) at the earliest, due to the 12-monthminimum agreement duration.
A.2.3 System Operator tools for voltage control
The NGC has economic incentives to reduce congestion across the network. In this sense,NGC has highly increased the number of VAR sources from the 90’s to nowadays, from3000Mvars to 19000Mvars of mechanically switched capacitors, 9000Mvars of SVCs, and4000Mvars of Quadrature boosters4 [FERC, 2005]. Most of these devices can be movedbetween substations in order to cover local voltage problems.
A.2.4 Lessons learned and recommendations
Current experience regarding VAR management in the United Kingdom shows that20% of the VAR support is provided by generators, and the rest by other VAR sources.The successful VAR management by NGC has achieved a reduction by 90% of thenetwork congestion costs since 1993 [Oren et al., 2002]. This objective is the result ofa combination of operational improvements, enhanced forecasting, investments in thetransmission network, and an efficient VAR market management.
A.3 The VQ service in Europe
This section presents a complete review of the VQ service in 18 European countries5.The review includes a comparison of the different technical requirements for the VQcontrol, and the economic analysis of the VQ service procurement.
A.3.1 Technical issues of the VQ control
First, a comparative analysis of the technical features in the VQ service is presented inTable A.5 and Table A.6. In all power systems throughout Europe the VQ service isincluded among the Ancillary Services of the electric power supply. In addition, thisservice is managed by the corresponding SO.
4Devices similar to phase shifters.5The countries analyzed in the tables are: AU Austria (VERBUND http://www.verbund.at),
BE Belgium, CZ Czech Republic (CEPS http://www.ceps.cz), DN Denmark (Energinet http:
//www.energinet.dk), FI Finland, FR France (RTE http://www.rte-france.com), DE Germany(DVG), HU Hungary, IT Italy, IC Iceland, IR Ireland (EIRGRID http://www.eirgrid.ie), NEThe Netherlands, NO Norway, PL Poland (PSE http://www.pse-operator.pl), PO Portugal (RENhttp://www.ren.pt), ES Spain (REE http://www.ree.es), SW Sweden, SL Slovakia (SEPSAShttp://www.sepsas.sk), and the UK United Kingdom (NGC http://www.nationalgrid.com/uk/).
A.3. THE VQ SERVICE IN EUROPE 175
From the review, most SOs require the VQ service to be provided in real-time voltagecontrol which is achieved mainly by generators. The requirements for the VQ serviceusually lay on generators. Some countries also include specific requirements for theVAR sources owned by the transmission network owners. The size of generators thatare entitled to participate in the VQ service is sometimes limited with a minimum MVAor MW requirement. Some examples are Spain, Germany or the United Kingdom, witha minimum installed capacity of 30MW. The monitorization of the procurement in theVQ service is based on the metering of voltage in certain buses of the transmissionnetwork, together with the actual VAR procurement of each VAR source.
In France all generators connected to networks over 225kV should have the ability toparticipate in the secondary voltage control. The dynamic response of the participatinggenerators is monitored on-line, and should be compliant with a specific V/Q capabil-ity diagram and a response time (usually less than 60 seconds) [Margotin et al., 2006,RTE, 2006].
The definition of the volume of VAR service is usually settled using historical data onannual plans, and updated in some countries before the energy market is cleared.
The mandatory requirements for generators in the VQ service are defined using a powerfactor range or a tangent range6. The point where the procurement is measured canbe the generator terminals, or the connection point to the transmission network (alsocalled Point of Delivery POD). In order to compare the VAR requirements of the differentcountries, all values have been calculated at the POD7. The VAR requirements in thePOD are normally in the range of 40% Pn of VAR absorption, and 50% of Pn for VARgeneration8. The Spanish mandatory VAR capacity is the least restrictive, with a rangeof 15% for both VAR generation and absorption, compared with the requirements inthe Netherlands of 75% of Pn. The less restrictive the power factor requirements, themore additional VAR support from other VAR sources is required.
A.3.2 Economic issues of the VQ service
Table A.7 and Table A.8 present a comparative review of the economical issues associ-ated with the VQ service. According to the review, in most of the countries analyzed,
6The power factor is calculated as cosφ = P√P 2+Q2
,and the tangent as tanφ = QP
, where P is the
active power and Q the reactive power produced by the generator, and φ the phase angle between thevoltage and current signals.
7In this calculation it has been assumed that the step-up transformer of each generator has the samerated power as the generator, and a 12% short-circuit impedance.
8The VAR generated or produced by a generator are also referred to as VAR lagging and capacitiveVAR. On the other hand, the VAR absorbed or consumed are referred to as VAR leading and inductiveVAR.
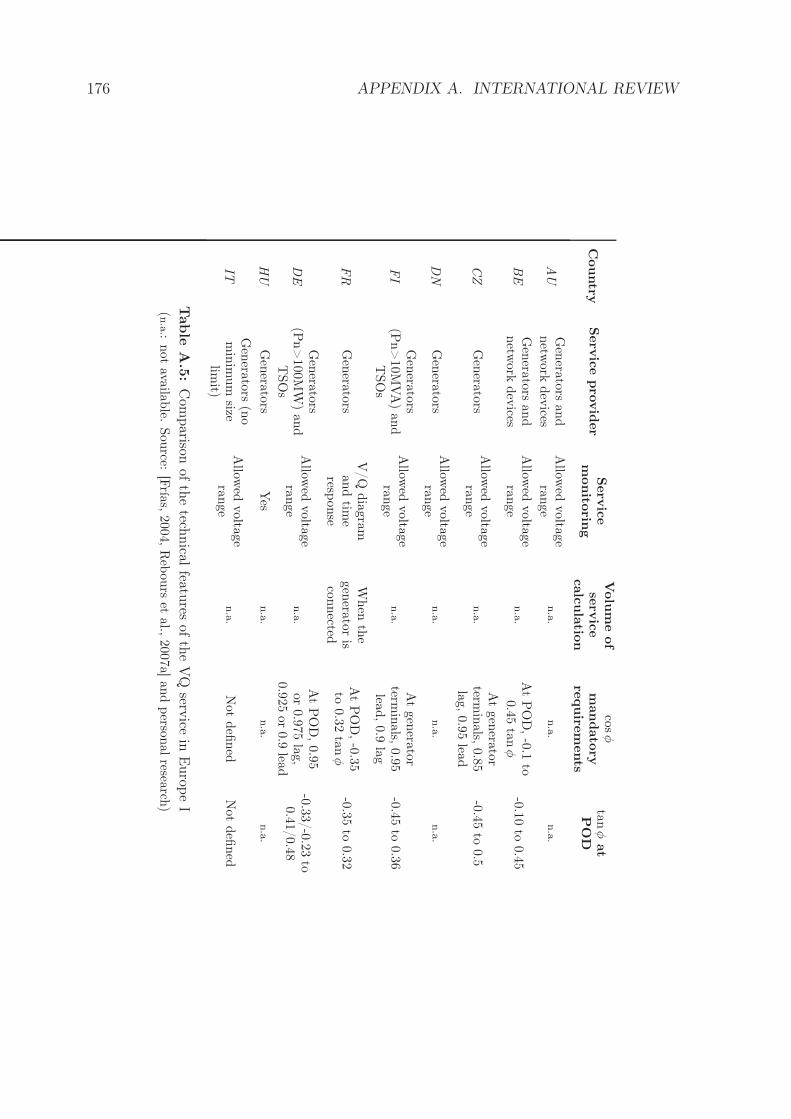
176 APPENDIX A. INTERNATIONAL REVIEW
Country
Serv
ice
pro
vid
er
Serv
ice
monito
ring
Volu
me
of
serv
ice
calc
ula
tion
cosφ
mandato
ryre
quire
ments
tan
φat
PO
D
AU
Gen
erato
rsand
netw
ork
dev
icesA
llowed
volta
ge
range
n.a
.n.a
.n.a
.
BE
Gen
erato
rsand
netw
ork
dev
icesA
llowed
volta
ge
range
n.a
.A
tP
OD
,-0
.1to
0.4
5ta
nφ
-0.1
0to
0.4
5
CZ
Gen
erato
rsA
llowed
volta
ge
range
n.a
.
At
gen
erato
rterm
inals,
0.8
5la
g,0.9
5lea
d-0
.45
to0.5
DN
Gen
erato
rsA
llowed
volta
ge
range
n.a
.n.a
.n.a
.
FI
Gen
erato
rs(P
n>
10M
VA
)and
TSO
s
Allow
edvolta
ge
range
n.a
.
At
gen
erato
rterm
inals,
0.9
5lea
d,0.9
lag
-0.4
5to
0.3
6
FR
Gen
erato
rsV
/Q
dia
gra
mand
time
response
When
the
gen
erato
ris
connected
At
PO
D,-0
.35
to0.3
2ta
nφ
-0.3
5to
0.3
2
DE
Gen
erato
rs(P
n>
100M
W)
and
TSO
s
Allow
edvolta
ge
range
n.a
.
At
PO
D,0.9
5or
0.9
75
lag,
0.9
25
or
0.9
lead
-0.3
3/-0
.23
to0.4
1/0.4
8
HU
Gen
erato
rsYes
n.a
.n.a
.n.a
.
ITG
enera
tors
(no
min
imum
sizelim
it)
Allow
edvolta
ge
range
n.a
.N
ot
defi
ned
Not
defi
ned
Table
A.5
:C
omparison
ofth
etech
nical
features
ofth
eV
Qserv
icein
Europ
eI
(n.a
.:not
availa
ble.
Source:
[Fría
s,2004,
Reb
ours
etal.,
2007a]
and
perso
nalresea
rch)
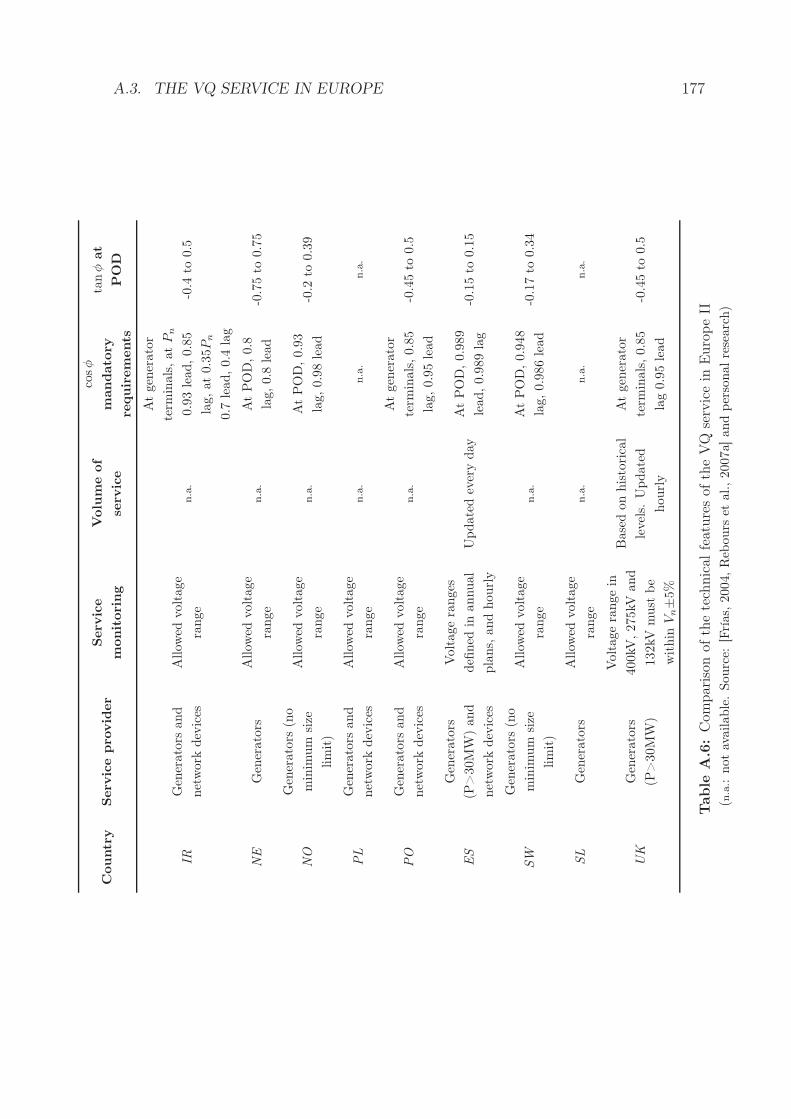
A.3. THE VQ SERVICE IN EUROPE 177C
ountr
yServ
ice
pro
vid
er
Serv
ice
monit
ori
ng
Volu
me
of
serv
ice
cosφ
mandato
ry
requir
em
ents
tan
φat
PO
D
IRG
ener
ato
rsand
net
work
dev
ices
Allow
edvoltage
range
n.a
.
At
gen
erato
r
term
inals
,at
Pn
0.9
3le
ad,0.8
5
lag,at
0.3
5P
n
0.7
lead,0.4
lag
-0.4
to0.5
NE
Gen
erato
rsA
llow
edvoltage
range
n.a
.A
tP
OD
,0.8
lag,0.8
lead
-0.7
5to
0.7
5
NO
Gen
erato
rs(n
o
min
imum
size
lim
it)
Allow
edvoltage
range
n.a
.A
tP
OD
,0.9
3
lag,0.9
8le
ad
-0.2
to0.3
9
PL
Gen
erato
rsand
net
work
dev
ices
Allow
edvoltage
range
n.a
.n.a
.n.a
.
PO
Gen
erato
rsand
net
work
dev
ices
Allow
edvoltage
range
n.a
.
At
gen
erato
r
term
inals
,0.8
5
lag,0.9
5le
ad
-0.4
5to
0.5
ES
Gen
erato
rs
(P>
30M
W)
and
net
work
dev
ices
Voltage
ranges
defi
ned
inannual
pla
ns,
and
hourl
y
Update
dev
ery
day
At
PO
D,0.9
89
lead,0.9
89
lag
-0.1
5to
0.1
5
SW
Gen
erato
rs(n
o
min
imum
size
lim
it)
Allow
edvoltage
range
n.a
.A
tP
OD
,0.9
48
lag,0.9
86
lead
-0.1
7to
0.3
4
SL
Gen
erato
rsA
llow
edvoltage
range
n.a
.n.a
.n.a
.
UK
Gen
erato
rs
(P>
30M
W)
Voltage
range
in
400kV
,275kV
and
132kV
must
be
within
Vn±
5%
Base
don
his
tori
cal
level
s.U
pdate
d
hourl
y
At
gen
erato
r
term
inals
,0.8
5
lag
0.9
5le
ad
-0.4
5to
0.5
Table
A.6
:C
ompar
ison
ofth
ete
chnic
alfe
ature
sof
the
VQ
serv
ice
inE
uro
pe
II
(n.a
.:not
available
.Sourc
e:[F
rías,
2004,
Reb
ours
etal.,2007a]
and
per
sonalre
searc
h)
178 APPENDIX A. INTERNATIONAL REVIEW
the VQ service is procured via mandatory mechanisms. In Sweden, Italy and Icelandthe procurement of the service is not yet remunerated. On the other hand, the VQservice is provided with bilateral and negotiated contracts between the supplying agentsand the SO in the majority of European countries. Under these contracts the pricecan be regulated, which is the most common option, or agreed between the SO and theagents. Finally, only some advanced regulation has provided competition to the VQservice in the United Kingdom. The frequency of the markets or bilateral tenders forVAR support varies from 6 months in the United Kingdom, to one year in Spain or twoyears in France. The procedure to select the best VAR sources to supply the VQ serviceis mainly based on technical issues regarding the security of the operation of the powersystem. Additionally, in those power systems with competitive mechanisms for VARprocurement, the bids of the supplying agents are also considered. The remuneration ofthe selected agents (both under mandatory procurement or competitive mechanisms) isbased on the investments and use in the VAR sources in most of the countries. Someregulations also design specific compensation for the opportunity costs due to activepower reduction to increase the VAR support, such as in Germany.
The remuneration for VAR support in France differentiates “sensitive areas” and “non-sensitive areas” for voltage support which are defined by the SO. Generators locatedin “sensitive areas” are paid a fixed annual payment for participating in the voltagesupport. In addition, a variable payment is paid to all generators over the maximumVAR generation and absorption capacity, only for the hours where the generator isconnected to the network. The variable payment can be increased by 50% in case thegenerator participates in the secondary voltage control [RTE, 2006, Bertolini, 2007].
The resulting VAR regulated/market prices vary from e0.07/MVA/hour in France ande0.11/Mvar/hour in Spain to e1.5/Mvar/hour in the United Kingdom for the avail-able VAR capacity. The variable payment for VAR energy in Europe varies frome0.057/Mvarh in France and e0.5/Mvarh in Spain, to e4.5/Mvarh in the United King-dom.
Finally, the cost of the VQ service is usually recovered through the transmission systemtariffs. These tariffs differentiate end-users charges by voltage-level, average power-factor, among others.
In conclusion, the successful experience concerning the VQ service in the United King-dom can help to improve the regulations in other countries. As the regulatory proposalsfor the service in most countries are very recent, there is currently not enough experi-ence. However, regulators should be encouraged to introduce competitive mechanismsfor the procurement of the VQ service, so that economic and technical efficiency will beimproved.
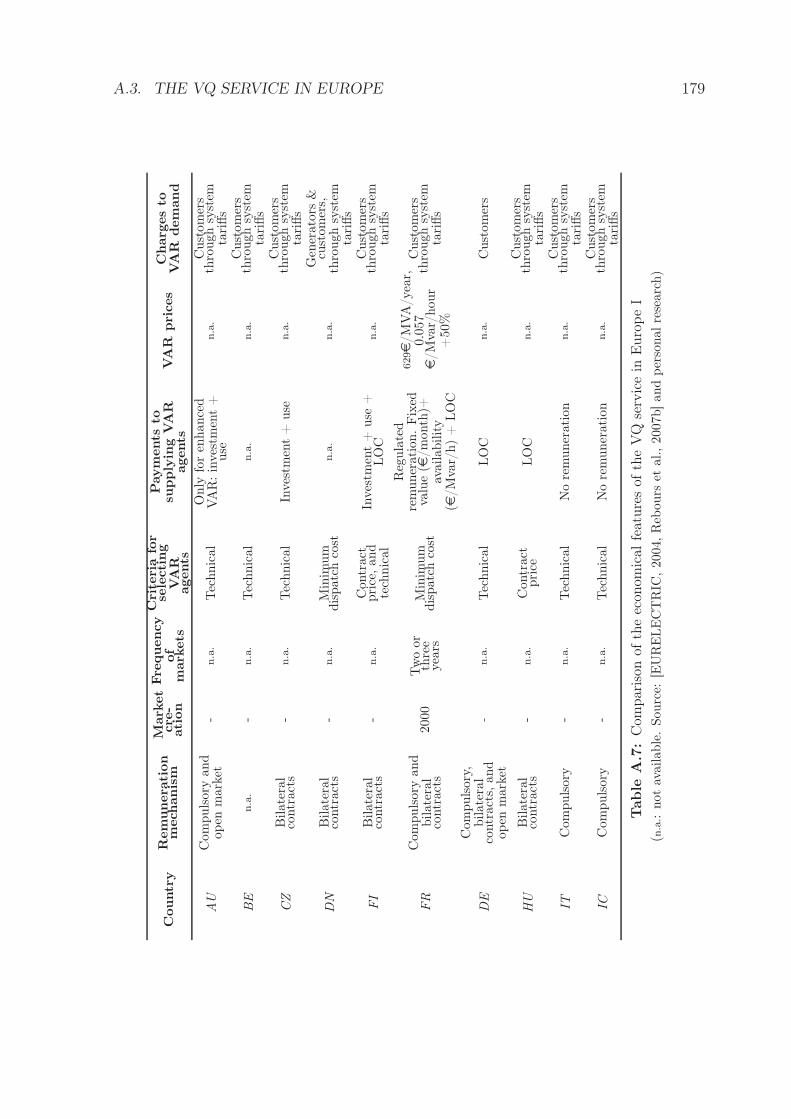
A.3. THE VQ SERVICE IN EUROPE 179
Countr
yR
em
unera
tion
mech
anis
mM
ark
et
cre
-ati
on
Fre
quency
of
mark
ets
Cri
teri
afo
rse
lecti
ng
VA
Ragents
Paym
ents
tosu
pply
ing
VA
Ragents
VA
Rpri
ces
Charg
es
toVA
Rdem
and
AU
Com
puls
ory
and
open
mark
et-
n.a
.Tec
hnic
al
Only
for
enhance
dVA
R:in
ves
tmen
t+
use
n.a
.C
ust
om
ers
thro
ugh
syst
emta
riffs
BE
n.a
.-
n.a
.Tec
hnic
al
n.a
.n.a
.C
ust
om
ers
thro
ugh
syst
emta
riffs
CZ
Bilate
ral
contr
act
s-
n.a
.Tec
hnic
al
Inves
tmen
t+
use
n.a
.C
ust
om
ers
thro
ugh
syst
emta
riffs
DN
Bilate
ral
contr
act
s-
n.a
.M
inim
um
dis
patc
hco
stn.a
.n.a
.
Gen
erato
rs&
cust
om
ers,
thro
ugh
syst
emta
riffs
FI
Bilate
ral
contr
act
s-
n.a
.C
ontr
act
pri
ce,and
tech
nic
al
Inves
tmen
t+
use
+LO
Cn.a
.C
ust
om
ers
thro
ugh
syst
emta
riffs
FR
Com
puls
ory
and
bilate
ral
contr
act
s2000
Tw
oor
thre
eyea
rsM
inim
um
dis
patc
hco
st
Reg
ula
ted
rem
uner
ation.
Fix
edva
lue
(e/m
onth
)+av
ailability
(e/M
var/
h)
+LO
C
629e
/M
VA
/yea
r,0.0
57
e/M
var/
hour
+50%
Cust
om
ers
thro
ugh
syst
emta
riffs
DE
Com
puls
ory
,bilate
ral
contr
act
s,and
open
mark
et
-n.a
.Tec
hnic
al
LO
Cn.a
.C
ust
om
ers
HU
Bilate
ral
contr
act
s-
n.a
.C
ontr
act
pri
ceLO
Cn.a
.C
ust
om
ers
thro
ugh
syst
emta
riffs
ITC
om
puls
ory
-n.a
.Tec
hnic
al
No
rem
uner
ation
n.a
.C
ust
om
ers
thro
ugh
syst
emta
riffs
ICC
om
puls
ory
-n.a
.Tec
hnic
al
No
rem
uner
ation
n.a
.C
ust
om
ers
thro
ugh
syst
emta
riffs
Table
A.7
:C
ompar
ison
ofth
eec
onom
ical
feat
ure
sof
the
VQ
serv
ice
inE
uro
pe
I
(n.a
.:not
available
.Sourc
e:[E
UR
ELE
CT
RIC
,2004,
Reb
ours
etal.,2007b]and
per
sonalre
searc
h)
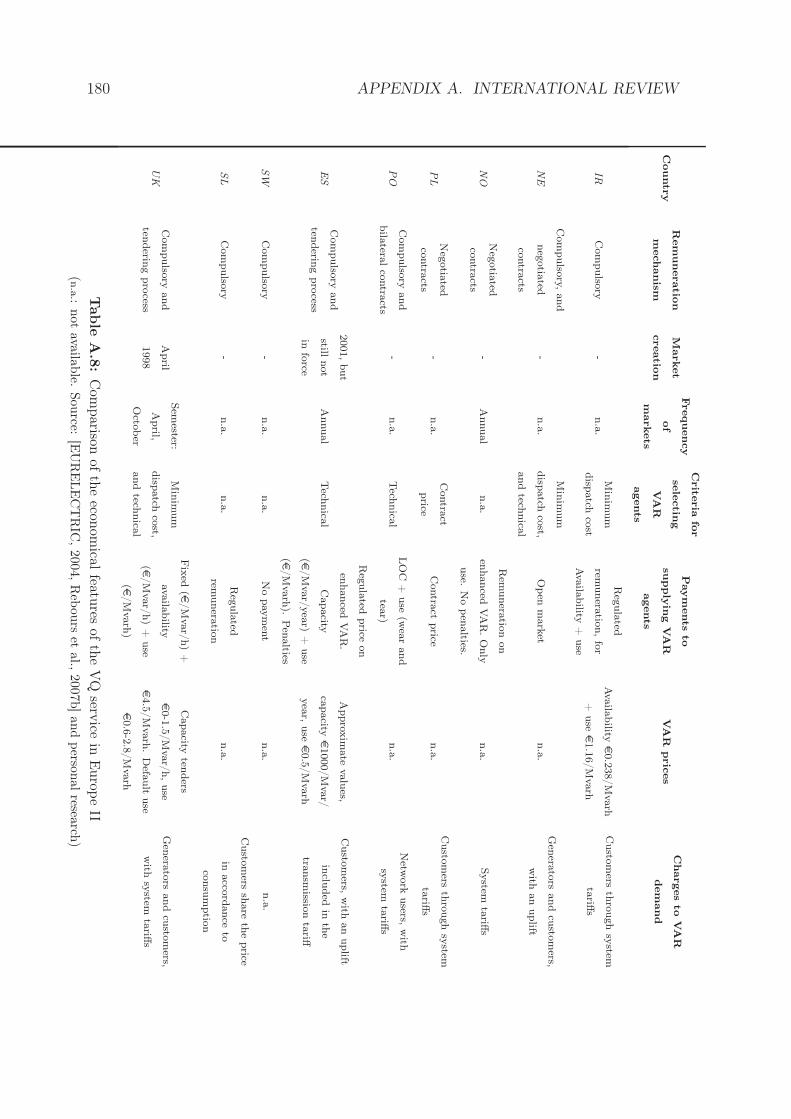
180 APPENDIX A. INTERNATIONAL REVIEW
Countr
yR
em
uneratio
n
mechanism
Market
creatio
n
Frequency
of
markets
Crite
ria
for
sele
ctin
g
VA
R
agents
Paym
ents
to
supply
ing
VA
R
agents
VA
Rpric
es
Charges
toVA
R
dem
and
IRC
om
pulso
ry-
n.a
.M
inim
um
disp
atch
cost
Reg
ula
ted
remunera
tion,fo
r
Ava
ilability
+use
Ava
ilability
e0.2
38/M
varh
+usee
1.1
6/M
varh
Custo
mers
thro
ugh
system
tariff
s
NE
Com
pulso
ry,and
neg
otia
ted
contra
cts
-n.a
.
Min
imum
disp
atch
cost,
and
technica
l
Open
mark
etn.a
.G
enera
tors
and
custo
mers,
with
an
uplift
NO
Neg
otia
ted
contra
cts-
Annual
n.a
.
Rem
unera
tion
on
enhanced
VA
R.O
nly
use.
No
pen
alties.
n.a
.System
tariff
s
PL
Neg
otia
ted
contra
cts-
n.a
.C
ontra
ct
price
Contra
ctprice
n.a
.C
usto
mers
thro
ugh
system
tariff
s
PO
Com
pulso
ryand
bila
teralco
ntra
cts-
n.a
.Tech
nica
lLO
C+
use
(wea
rand
tear)
n.a
.N
etwork
users,
with
system
tariff
s
ES
Com
pulso
ryand
tenderin
gpro
cess
2001,but
stillnot
info
rce
Annual
Tech
nica
l
Reg
ula
tedprice
on
enhanced
VA
R.
Capacity
(e
/M
var/
yea
r)+
use
(e
/M
varh
).Pen
alties
Approx
imate
valu
es,
capacity
e1000/M
var/
yea
r,usee
0.5
/M
varh
Custo
mers,
with
an
uplift
inclu
ded
inth
e
transm
ission
tariff
SW
Com
pulso
ry-
n.a
.n.a
.N
opay
men
tn.a
.n.a
.
SL
Com
pulso
ry-
n.a
.n.a
.R
egula
ted
remunera
tion
n.a
.
Custo
mers
share
the
price
inacco
rdance
to
consu
mptio
n
UK
Com
pulso
ryand
tenderin
gpro
cess
April
1998
Sem
ester:
April,
Octo
ber
Min
imum
disp
atch
cost,
and
technica
l
Fix
ed(e
/M
var/
h)
+
availa
bility
(e
/M
var/
h)
+use
(e
/M
varh
)
Capacity
tenders
e0-1
.5/M
var/
h,use
e4.5
/M
varh
.D
efault
use
e0.6
-2.8
/M
varh
Gen
erato
rsand
custo
mers,
with
system
tariff
s
Table
A.8
:C
omparison
ofth
eecon
omical
features
ofth
eV
Qserv
icein
Europ
eII
(n.a
.:not
availa
ble.
Source:
[EU
RE
LE
CT
RIC
,2004,
Reb
ours
etal.,
2007b]and
perso
nalresea
rch)
A.4. THE VQ SERVICE IN THE UNITED STATES AND OTHER COUNTRIES181
A.4 The VQ service in the United States and other
countries
This section presents a comparative review of the VQ service in different power sys-tems in the United States [Alvarado et al., 2003], and other representative countriesaround the world, such as Australia [NEMMCO, 2005], New Zealand [ELCOM, 2004],Argentina [ENRE, 2002], and Brazil [Frías, 2004]. This section first analyzes the tech-nical issues of the voltage control, and then compares the economic characteristics ofthe VAR procurement schemes.
A.4.1 Technical issues of the VQ control
In the United States each power system can determine its own electricity policy for VARprocurement and compensation. In addition, the FERC9 proposes some guidelines forthe development of efficient regulatory mechanisms for the energy supply. Among oth-ers, the FERC published the Order No. 888 [FERC, 1996] where six ancillary servicesare defined, including the reactive supply and voltage control from generation sources.In this Order it was concluded that these services should be included in the transmissionaccess tariff. The FERC considered that the VQ service should be unbundled for gener-ation facilities from the basic transmission services. Currently, there is a wide range ofexperiences concerning the practical implementation of these rules within the differentstates.
Additionally, according to Order No.2003 [FERC, 2003] the Commission emphasizedthat generators connected to the transmission network should not be compensated ifthey operate within a power factor at the connection point of 0.95 leading and 0.95lagging. Moreover, if they work over this minimum requirement, then generators shouldbe compensated. Within the FERC proposal, CAISO and PJM [PJM, 2003, PJM, 2005]have defined more severe power factor requirements for VAR absorption, based on 0.9lagging and 0.95 leading. Other power systems, such as New York ISO and New EnglandISO, defined specific power factor requirements based on annual testing of the VARcapability of generators. These tests vary from an annual periodicity in New York ISOto every two years in Texas, and to a period test every five years in New England andPJM [Kueck et al., 2006]. There are some additional requirements for generators toparticipate in the VQ control, for instance in PJM generators have to be under thecontrol of a voltage control area operator.
The requirements concerning the power factor ranges for generators are similar in theother countries analyzed, which define a gap of 0.9 lagging and 0.93 leading (see TableA.9). In Argentina [ENRE, 2002], generators have to provide their full VAR capabilitycurve in order to help TSOs to maintain voltages within certain operation ranges. Under
9The Federal Energy Regulatory Commission is an independent regulatory agency within the UnitedStates Department of Energy. The responsibility of the FERC is to regulate the interstate transmissionof electricity, natural gas, and oil. http://www.ferc.gov
182 APPENDIX A. INTERNATIONAL REVIEW
normal conditions 90% VAR capacity should be permanently available. In addition,under special situations 100% of VAR capacity can be required during 20 minutes, every40 minutes. In Brazil [ELECTROBRAS, 1998, ONS, 2003] generators must send theircapability curves to the SO in order to be integrated in the energy dispatch. Finally,Australia and New Zealand have similar power factor requirements, and the volumeof VAR needs is adjusted for every energy market period, which is half an hour. Forevery period, and after static compensation and VAR capacity for generators are used,synchronous compensators and active power curtailment to increase VAR may be called.
A.4.2 Economic issues of the VQ service
In most of the power systems the VQ service is compulsory (see Table A.10). However,there are other alternatives, such as bilateral trading in California, New Zealand andBrazil, or using a tendering process in Australia. In California, if more VAR thanthe mandatory requirements is needed, the SO uses reliability must-run contracts withgenerators that are remunerated only in the case of active power reduction. Finally, someregulators such as NYISO and Argentina settle penalties in the case of non-fulfillment ofthe VQ service to the extent that in Argentina [ENRE, 2002] generators can be deniedaccess to the energy market.
For most power systems, the VAR requirements are based on technical requirements,and their allocation is updated on an annual basis, with the exception of Argentinawhere it is updated with a monthly analysis.
The remuneration for the selected VAR supplying agents recognize the costs for in-vestments and the opportunity costs, with the corresponding VAR capacity and LOCremuneration. New England, Brazil and New Zealand also remunerate for the use ofVAR sources cost, which are only recognized for synchronous compensators in Australia.In Brazil [ELECTROBRAS, 1998, ONS, 2003] generators are paid ex-post on an annualbasis, once the real costs of the VQ service are computed. The scarce data on VARprices show that remuneration in New York for VAR capacity $0.2/Mvar/h, is in therange of the prices in Europe. Finally, the cost derived from the VQ service is integratedinto the transmission system tariff which is charged to the end-customers.
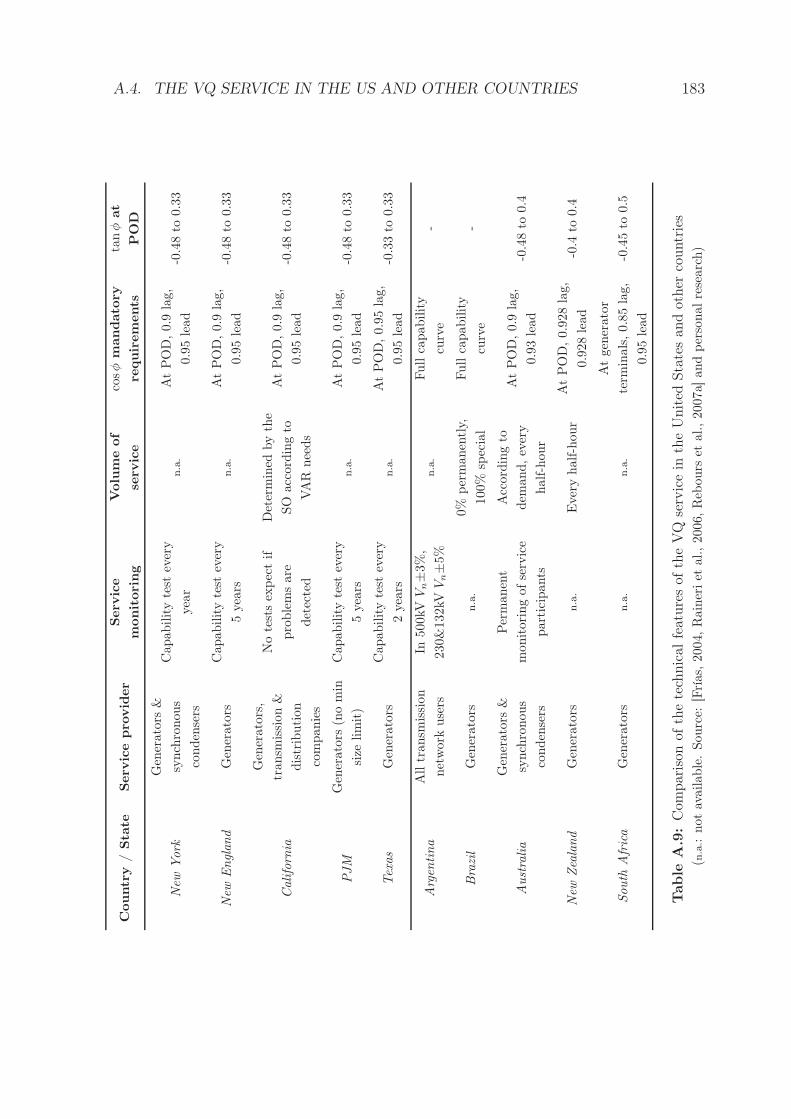
A.4. THE VQ SERVICE IN THE US AND OTHER COUNTRIES 183
Countr
y/
Sta
teServ
ice
pro
vid
er
Serv
ice
monit
ori
ng
Volu
me
of
serv
ice
cosφ
mandato
ry
requir
em
ents
tan
φat
PO
D
New
York
Gen
erato
rs&
synch
ronous
conden
sers
Capability
test
ever
y
yea
rn.a
.A
tP
OD
,0.9
lag,
0.9
5le
ad
-0.4
8to
0.3
3
New
England
Gen
erato
rsC
apability
test
ever
y
5yea
rsn.a
.A
tP
OD
,0.9
lag,
0.9
5le
ad
-0.4
8to
0.3
3
Califo
rnia
Gen
erato
rs,
transm
issi
on
&
dis
trib
ution
com
panie
s
No
test
sex
pec
tif
pro
ble
ms
are
det
ecte
d
Det
erm
ined
by
the
SO
acc
ord
ing
to
VA
Rnee
ds
At
PO
D,0.9
lag,
0.9
5le
ad
-0.4
8to
0.3
3
PJM
Gen
erato
rs(n
om
in
size
lim
it)
Capability
test
ever
y
5yea
rsn.a
.A
tP
OD
,0.9
lag,
0.9
5le
ad
-0.4
8to
0.3
3
Tex
as
Gen
erato
rsC
apability
test
ever
y
2yea
rsn.a
.A
tP
OD
,0.9
5la
g,
0.9
5le
ad
-0.3
3to
0.3
3
Arg
entina
All
transm
issi
on
net
work
use
rs
In500kV
Vn±
3%
,
230&
132kV
Vn±
5%
n.a
.Full
capability
curv
e-
Bra
zil
Gen
erato
rsn.a
.0%
per
manen
tly,
100%
spec
ial
Full
capability
curv
e-
Aust
ralia
Gen
erato
rs&
synch
ronous
conden
sers
Per
manen
t
monitori
ng
ofse
rvic
e
part
icip
ants
Acc
ord
ing
to
dem
and,ev
ery
half-h
our
At
PO
D,0.9
lag,
0.9
3le
ad
-0.4
8to
0.4
New
Zea
land
Gen
erato
rsn.a
.E
ver
yhalf-h
our
At
PO
D,0.9
28
lag,
0.9
28
lead
-0.4
to0.4
South
Afr
ica
Gen
erato
rsn.a
.n.a
.
At
gen
erato
r
term
inals
,0.8
5la
g,
0.9
5le
ad
-0.4
5to
0.5
Table
A.9
:C
ompar
ison
ofth
ete
chnic
alfe
ature
sof
the
VQ
serv
ice
inth
eU
nited
Sta
tes
and
other
countr
ies
(n.a
.:not
available
.Sourc
e:[F
rías,
2004,
Rain
eriet
al.,2006,
Reb
ours
etal.,2007a]
and
per
sonalre
searc
h)
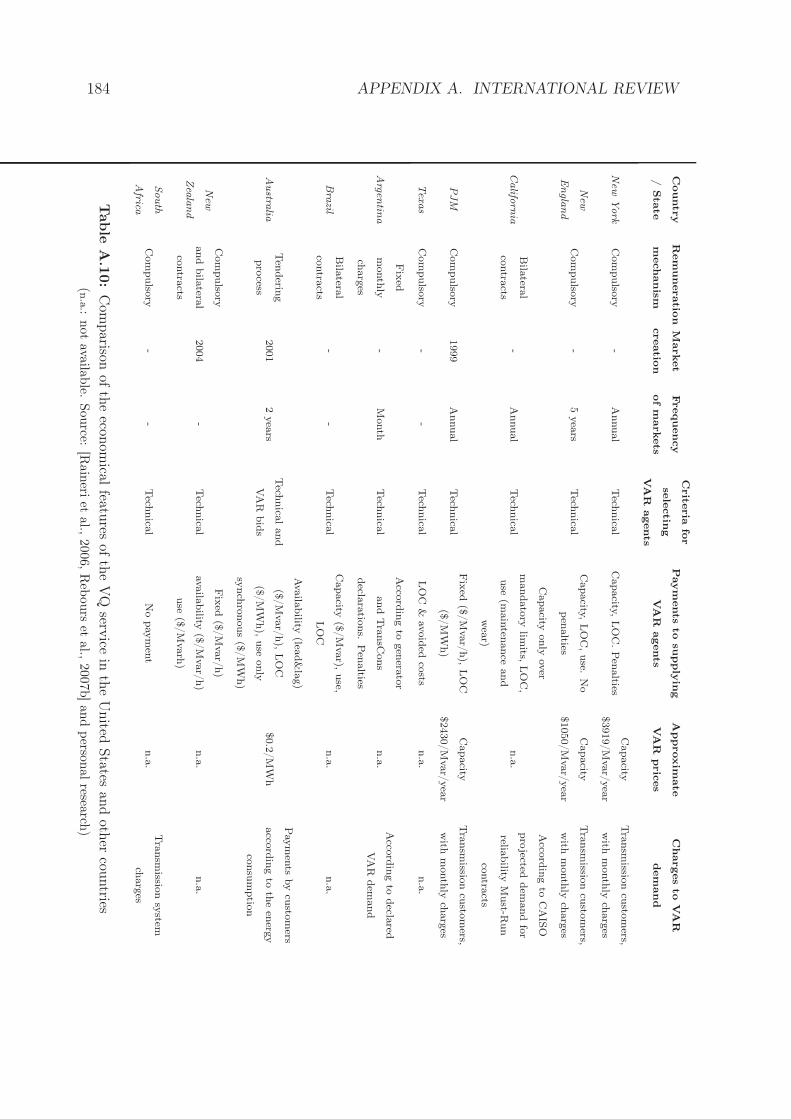
184 APPENDIX A. INTERNATIONAL REVIEW
Countr
y
/Sta
te
Rem
uneratio
n
mechanism
Market
creatio
n
Frequency
ofm
arkets
Crite
ria
for
sele
ctin
g
VA
Ragents
Paym
ents
tosu
pply
ing
VA
Ragents
Approxim
ate
VA
Rpric
es
Charges
toVA
R
dem
and
New
York
Com
pulso
ry-
Annual
Tech
nica
lC
apacity,
LO
C.Pen
alties
Capacity
$3919/M
var/
yea
r
Tra
nsm
ission
custo
mers,
with
month
lych
arg
es
New
Engla
nd
Com
pulso
ry-
5yea
rsTech
nica
lC
apacity,
LO
C,use.
No
pen
alties
Capacity
$1050/M
var/
yea
r
Tra
nsm
ission
custo
mers,
with
month
lych
arg
es
Califo
rnia
Bila
teral
contra
cts-
Annual
Tech
nica
l
Capacity
only
over
mandato
rylim
its,LO
C,
use
(main
tenance
and
wea
r)
n.a
.
Acco
rdin
gto
CA
ISO
pro
jecteddem
and
for
reliability
Must-R
un
contra
cts
PJM
Com
pulso
ry1999
Annual
Tech
nica
lFix
ed($
/M
var/
h),
LO
C
($/M
Wh)
Capacity
$2430/M
var/
yea
r
Tra
nsm
ission
custo
mers,
with
month
lych
arg
es
Texas
Com
pulso
ry-
-Tech
nica
lLO
C&
avoid
edco
stsn.a
.n.a
.
Arg
entin
a
Fix
ed
month
ly
charg
es
-M
onth
Tech
nica
l
Acco
rdin
gto
gen
erato
r
and
Tra
nsC
ons
decla
ratio
ns.
Pen
alties
n.a
.A
ccord
ing
todecla
red
VA
Rdem
and
Bra
zilB
ilatera
l
contra
cts-
-Tech
nica
lC
apacity
($/M
var),
use,
LO
Cn.a
.n.a
.
Austra
liaTen
derin
g
pro
cess2001
2yea
rsTech
nica
land
VA
Rbid
s
Ava
ilability
(lead&
lag)
($/M
var/
h),
LO
C
($/M
Wh),
use
only
synch
ronous
($/M
Wh)
$0.2
/M
Wh
Pay
men
tsby
custo
mers
acco
rdin
gto
the
energ
y
consu
mptio
n
New
Zea
land
Com
pulso
ry
and
bila
teral
contra
cts
2004
-Tech
nica
l
Fix
ed($
/M
var/
h)
availa
bility
($/M
var/
h)
use
($/M
varh
)
n.a
.n.a
.
South
Africa
Com
pulso
ry-
-Tech
nica
lN
opay
men
tn.a
.Tra
nsm
ission
system
charg
es
Table
A.1
0:
Com
parison
ofth
eecon
omical
features
ofth
eV
Qserv
icein
the
United
States
and
other
countries
(n.a
.:not
availa
ble.
Source:
[Rain
eriet
al.,
2006,
Reb
ours
etal.,
2007b]and
perso
nalresea
rch)
A.5. REFERENCES 185
A.5 References
[Alvarado et al., 2003] Alvarado, F., Borissov, B., and Kirsch, L. D. (2003). Reactivepower as an identifiable ancillary service. Transmission Administrator of Alberta,Ltd., Alberta, Canada.
[Bertolini, 2007] Bertolini, P. (2007). Present and future of ancillary services in france.Presented at EES-UETP New challenges to ancillary services regulation and opera-tionsystéme.
[DDR, 2000] DDR (2000). Regulamento da rede de transporte. Despacho No.10315/200. Direcçao-Geral da Energia. Ministério da Economia. Diário da República-IISérie, pages 8663–8673.
[ELCOM, 2004] ELCOM (2004). Recommended approach regarding dispatch of gener-ators for voltage support. The Electricity Commission, New Zealand.
[ELECTROBRAS, 1998] ELECTROBRAS (1998). Serviços ancilares. Working paper98/2/2-2, ELECTROBRAS, Brazil.
[ENRE, 2002] ENRE (2002). Anexo 4: Control de tensión y despacho de potenciareactiva. Energy Secretary, Resolution SE 0106/2002. Official Bulletin, Argentina,1(28.899):8–10.
[EURELECTRIC, 2004] EURELECTRIC (2004). Ancillary services. unbundling elec-tricity products, an emerging market. Technical report, Thermal Working Group.Union of the Electricity Industry.
[FERC, 1996] FERC (1996). Promoting wholesale competition through open accessnondiscriminatory services by public utilities and recovery of stranded costs by publicutilities and transmitting utilities, order no. 888. FERC Stats, & Regs. RegulationPreambles.
[FERC, 2003] FERC (2003). Standarization of generation interconnection agreementsand procedures, order no.2003, 68 fed. reg. 49,845. FERC Stats, & Regs. RegulationPreambles.
[FERC, 2005] FERC (2005). Principles for efficient and reliable reactive power supplyand consumption. Staff Report, Docket No. AD05-1-000.
[Frías, 2004] Frías, P. (2004). Gestión optimizada del control de tensiones y gestión dela potencia reactiva. aplicación al caso español. Trabajo de Investigación. Instituto deInvestigación Tecnológica, Universidad Pontificia Comillas (Madrid, Spain).
[Kueck et al., 2006] Kueck, J., Kirby, B., Rizy, D., Li, F., and Fall, N. (2006). Reactivepower from distributed energy. The Electricity Journal, 19(10):27–38.
186 BIBLIOGRAPHY
[Lobato, 2002] Lobato, E. (2002). Gestión centralizada de restricciones técnicas en mer-cados de energía eléctrica. Aplicación al caso español. PhD thesis, Universidad Pon-tificia Comillas.
[Lobato et al., 2000] Lobato, E., Rouco, L., Gómez, T., Echavarren, F., Navarrete,M. I., Casanova, R., and López, G. (2000). Solution of daily voltage constraintsin the spanish electricity market. Proceedings of the 2000 IEEE Summer Meeting,4:7–9.
[Margotin et al., 2006] Margotin, T., Juston, P., Houry, M., Morales, G., Bertolini, P.,and Burnel, D. (2006). Reactive power support on the french power system: genera-tion units performance monitoring. IEEE Mediterranean Electrotechnical Conference,2006. MELECON 2006., pages 906–909.
[MITC, 2006] MITC (2006). Planificación de los sectores de electricidad y gas 2002-2011. revisión 2005-2011. Ministerio de Industria, Turismo y Comercio, SecretaríaGeneral de Energía.
[NEMMCO, 2005] NEMMCO (2005). Non-market ancillary services agreement. No78907631.doc.
[NGC, 2006] NGC (2006). Reactive market report. eighteenth tender round for obliga-tory and enhanced reactive power services. for reactive market agreements effective 1october 2006. Technical report, National Grid Company.
[NGC, 2007a] NGC (2007a). The grid code. Technical report, National Grid.
[NGC, 2007b] NGC (2007b). Reactive power market. obligatory and enhanced reactivepower services. invitation to tender and guidance notes for the completion of tenders.Technical report, National Grid.
[OFGEM, 2007] OFGEM (2007). National grid electricity transmission system operatorincentives from 1 april 2007. Technical report, National Grid Company.
[ONS, 2003] ONS (2003). Administraçao dos serviços ancilares - introduçao. OperadorNacional do Sistema Elétrico, Submódulo 14.1.
[Oren et al., 2002] Oren, S., Gross, G., and Alvarado, F. (2002). Alternative businessmodels for transmission system investment and operations.
[PJM, 2003] PJM (2003). Second revised rate schedule ferc no.24. Original sheetNo.102.
[PJM, 2005] PJM (2005). Pjm open access transmission tariff.
[Raineri et al., 2006] Raineri, R., Ríos, S., and Schiele, D. (2006). Technical and eco-nomic aspects of ancillary services markets in the electric power industry: an inter-national comparison. Energy Policy, 34(13):1540–1555.
BIBLIOGRAPHY 187
[Rebours et al., 2007a] Rebours, Y. G., Kirschen, D. S., Trotignon, M., and Rossig-nol, S. (2007a). A survey of frequency and voltage control ancillary services part i:Technical features. IEEE Transactions on Power Systems, 22(1):350–357.
[Rebours et al., 2007b] Rebours, Y. G., Kirschen, D. S., Trotignon, M., and Rossig-nol, S. (2007b). A survey of frequency and voltage control ancillary services part ii:Economic features. IEEE Transactions on Power Systems, 22(1):358–366.
[REE, 1998] REE (1998). Procedimientos de operación del sistema eléctrico. Red Eléc-trica de España.
[REE, 2000] REE (2000). P.o. 7.4 servicio complementario de control de tensión de lared de transporte. Red Eléctrica de España. Boletín Oficial del Estado, 19 march,2000.
[REE, 2006] REE (2006). El sistema eléctrico español. Red Eléctrica de España.
[REE, 2007] REE (2007). P.o. 3.2. resolución de restricciones técnicas. Red Eléctrica deEspaña. Boletín Oficial del Estado, 29 june, 2007.
[RTE, 2006] RTE (2006). Contract de participation aux services systéme. Gestionnnairedu Réseau de Transport d’électricité, Paris.

188 BIBLIOGRAPHY
APPENDIX B
Bid definition for VAR capacity market
participants
This appendix presents an approach to build the capacity bids for the proposed VARcapacity market. VAR bids are defined by an available VAR capacity and a cor-
responding price. First capacity bids for generators are analyzed, where the calculationof the available VAR capacity is performed with an original approach. Then, the costassociated with the availability and use of the VAR capacity into the proposed marketis described. Finally, the bids of other VAR compensation devices are analyzed fromthe technical an cost point of view.
189
190 APPENDIX B. VAR CAPACITY BIDS
B.1 Generator VAR bids
This section describes how to build the generator VAR capacity bids for the proposedmarket. First, the available VAR capacity of a power plant is characterized, whichis mainly limited by the capability diagram of the alternator and the operating limitsinside the power plant. Then, the costs associated with the available VAR capacity aredetailed. Finally, the previous cost characterization is used to propose a bid structurefor the VAR capacity market presented in this thesis dissertation.
B.1.1 VAR capacity
The calculation of the available VAR capacity of a power plant comprises the followingsteps: (i) calculation of the capability diagram of the alternator, (ii) description of theoperating constraints in the power plant, and (iii) definition of an algorithm to calculatethe resulting VAR capacity. These three issues are described in the next subsections,and an illustrative example is also included.
B.1.1.1 Capability diagram of an alternator
The capability diagram of an alternator (see an example in Figure B.1) is a graph whichshows the active power and reactive power capability limits within which the alternator isexpected to operate under steady state conditions, as defined by the manufacturer. Dif-ferent capability curves are defined for specific voltage values at the generator terminals,and also for conditions of the coolant used to refrigerate the generator. These diagramsare obtained from theoretical models of the alternator [Adibi and Milanicz, 1994], andthen evaluated using empirical testing [Nilsson et al., 1994, Panvini and Yohn, 1995].
The reactive capability diagram of any alternator has three distinct limiting curves. Thecurve that is parallel to the active power axis for VAR generation represents the limit ofthe ability to cool the generator rotor when over-excited to produce VAR1. The curvethat is parallel to the VAR axis for active power generation represents the limit of theability to cool the armature windings2. Finally, the curve that is parallel to the activepower axis, on the VAR absorption side, represents the limit of the ability to cool theend-turns/end iron, when reactive current is flowing and there is no reduced magneticfield from the rotor. The inability to cool the end-turns/end iron is the major reasonwhy most alternators would not be operating with a large leading VAR power factor,absorbing VAR.
1Under this operating condition, the direct current injected in the rotor windings is at its ratedvalue.
2The current flowing in the stator armature is at its rated value, increasing the heat of the armature.
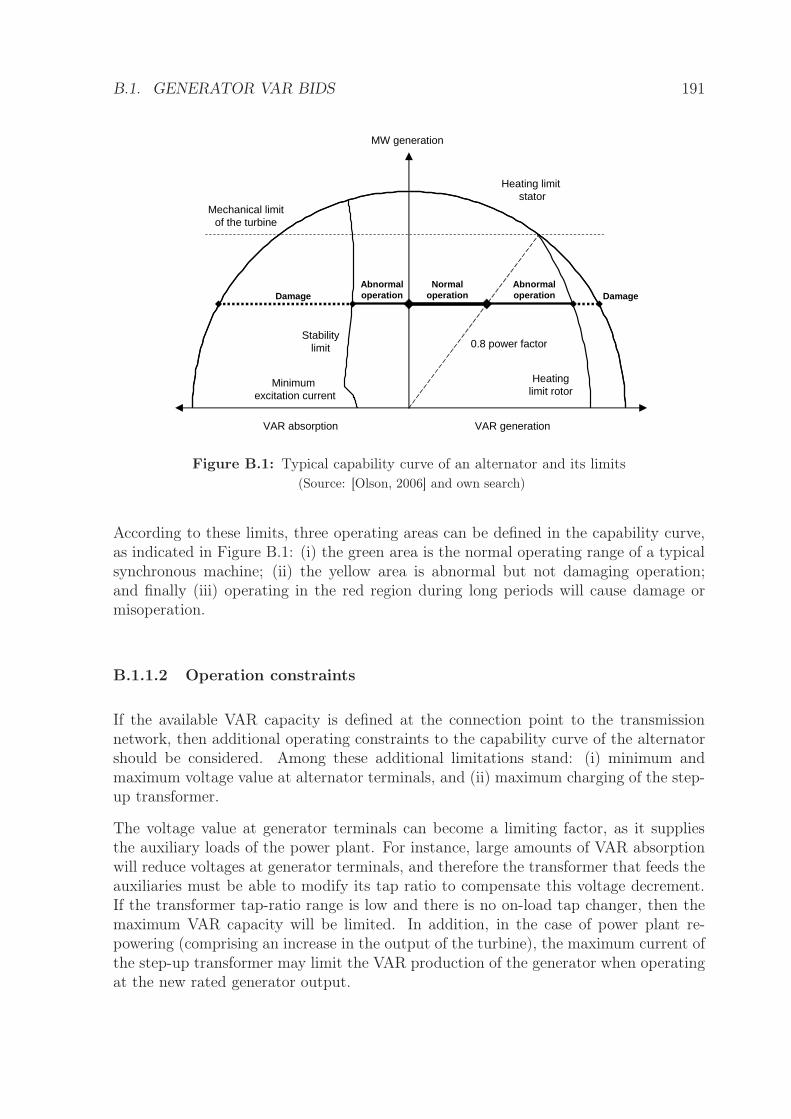
B.1. GENERATOR VAR BIDS 191
Heating limit stator
Heatinglimit rotor
VAR absorption VAR generation
Stabilitylimit
Minimum excitation current
MW generation
Mechanical limitof the turbine
NormaloperationDamage Damage
Abnormaloperation
Abnormaloperation
0.8 power factor
Figure B.1: Typical capability curve of an alternator and its limits
(Source: [Olson, 2006] and own search)
According to these limits, three operating areas can be defined in the capability curve,as indicated in Figure B.1: (i) the green area is the normal operating range of a typicalsynchronous machine; (ii) the yellow area is abnormal but not damaging operation;and finally (iii) operating in the red region during long periods will cause damage ormisoperation.
B.1.1.2 Operation constraints
If the available VAR capacity is defined at the connection point to the transmissionnetwork, then additional operating constraints to the capability curve of the alternatorshould be considered. Among these additional limitations stand: (i) minimum andmaximum voltage value at alternator terminals, and (ii) maximum charging of the step-up transformer.
The voltage value at generator terminals can become a limiting factor, as it suppliesthe auxiliary loads of the power plant. For instance, large amounts of VAR absorptionwill reduce voltages at generator terminals, and therefore the transformer that feeds theauxiliaries must be able to modify its tap ratio to compensate this voltage decrement.If the transformer tap-ratio range is low and there is no on-load tap changer, then themaximum VAR capacity will be limited. In addition, in the case of power plant re-powering (comprising an increase in the output of the turbine), the maximum current ofthe step-up transformer may limit the VAR production of the generator when operatingat the new rated generator output.
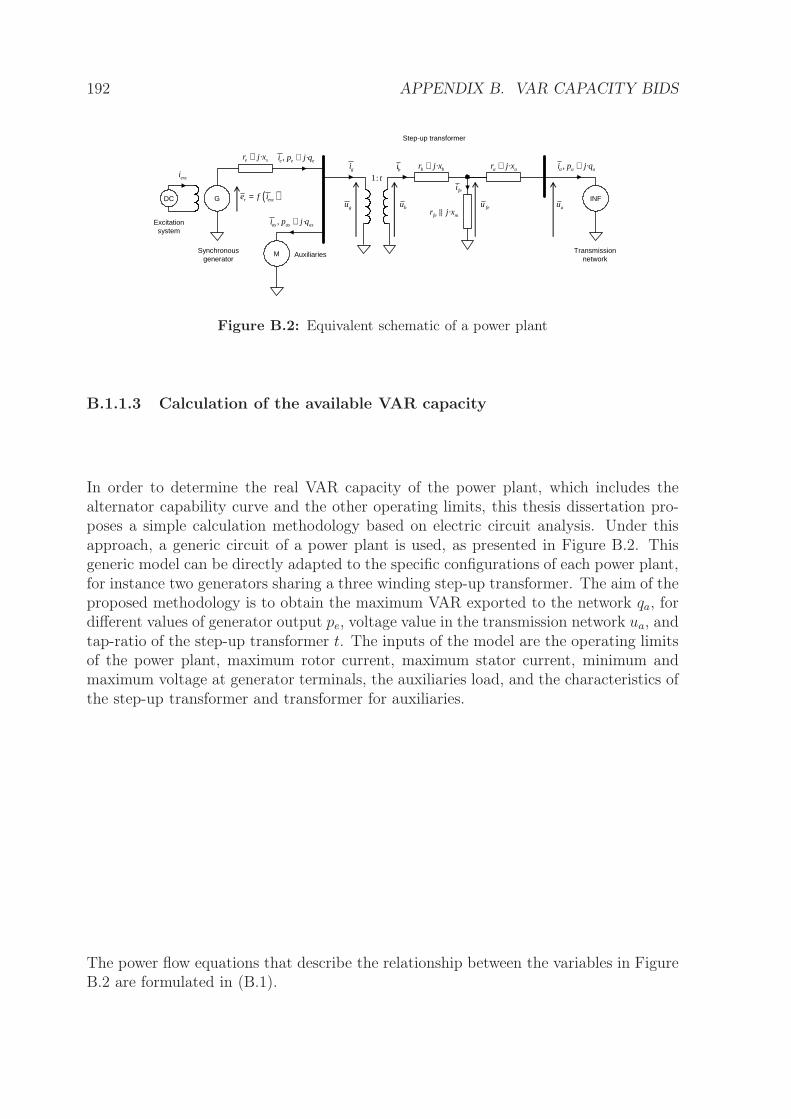
192 APPENDIX B. VAR CAPACITY BIDS
INFG
M
DC
exci
·e sr j x+·b br j x+ ·a ar j x+gi
, ·as as asi p j q+
, ·e e ei p j q+, ·a a ai p j q+bi
( )r exce f i=bugu
fei
feu au·fe mr j x
1: t
Auxiliaries
Excitationsystem
Synchronousgenerator
Transmissionnetwork
Step-up transformer
Figure B.2: Equivalent schematic of a power plant
B.1.1.3 Calculation of the available VAR capacity
In order to determine the real VAR capacity of the power plant, which includes thealternator capability curve and the other operating limits, this thesis dissertation pro-poses a simple calculation methodology based on electric circuit analysis. Under thisapproach, a generic circuit of a power plant is used, as presented in Figure B.2. Thisgeneric model can be directly adapted to the specific configurations of each power plant,for instance two generators sharing a three winding step-up transformer. The aim of theproposed methodology is to obtain the maximum VAR exported to the network qa, fordifferent values of generator output pe, voltage value in the transmission network ua, andtap-ratio of the step-up transformer t. The inputs of the model are the operating limitsof the power plant, maximum rotor current, maximum stator current, minimum andmaximum voltage at generator terminals, the auxiliaries load, and the characteristics ofthe step-up transformer and transformer for auxiliaries.
The power flow equations that describe the relationship between the variables in FigureB.2 are formulated in (B.1).
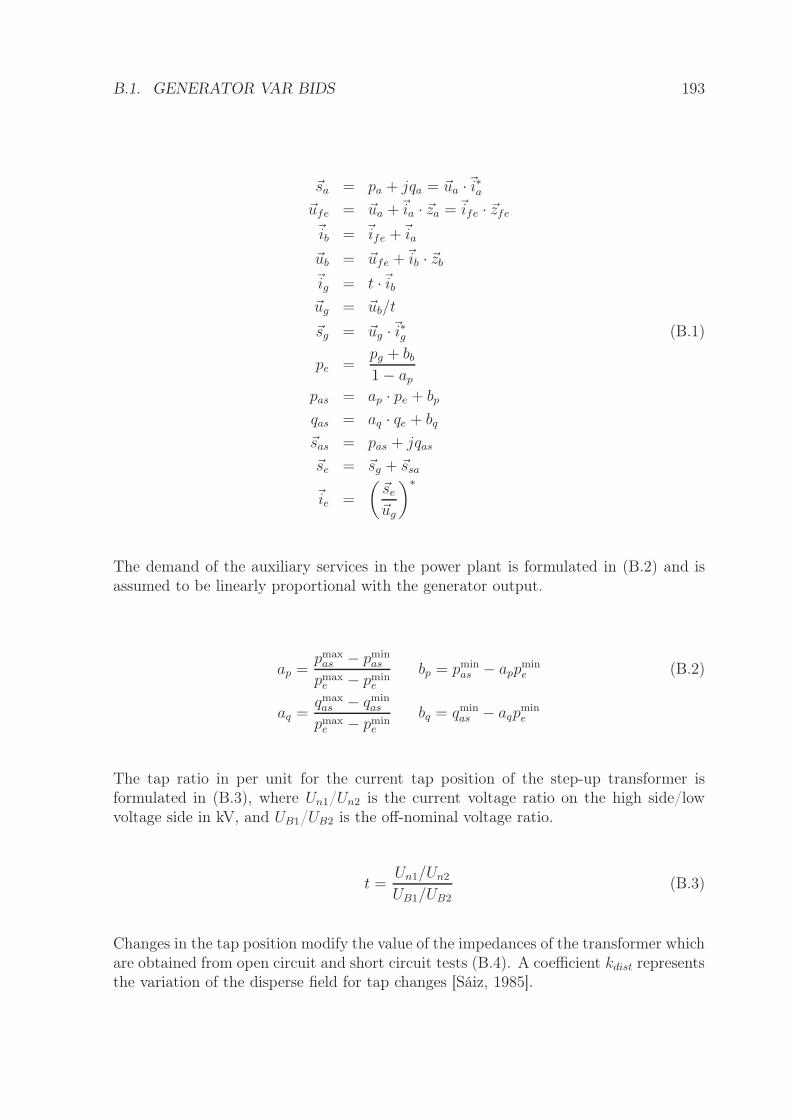
B.1. GENERATOR VAR BIDS 193
~sa = pa + jqa = ~ua ·~i∗a~ufe = ~ua +~ia · ~za =~ife · ~zfe
~ib = ~ife +~ia
~ub = ~ufe +~ib · ~zb
~ig = t ·~ib~ug = ~ub/t
~sg = ~ug ·~i∗g (B.1)
pe =pg + bb
1 − ap
pas = ap · pe + bp
qas = aq · qe + bq
~sas = pas + jqas
~se = ~sg + ~ssa
~ie =
(
~se
~ug
)∗
The demand of the auxiliary services in the power plant is formulated in (B.2) and isassumed to be linearly proportional with the generator output.
ap =pmax
as − pminas
pmaxe − pmin
e
bp = pminas − app
mine (B.2)
aq =qmaxas − qmin
as
pmaxe − pmin
e
bq = qminas − aqp
mine
The tap ratio in per unit for the current tap position of the step-up transformer isformulated in (B.3), where Un1/Un2 is the current voltage ratio on the high side/lowvoltage side in kV, and UB1/UB2 is the off-nominal voltage ratio.
t =Un1/Un2
UB1/UB2(B.3)
Changes in the tap position modify the value of the impedances of the transformer whichare obtained from open circuit and short circuit tests (B.4). A coefficient kdist representsthe variation of the disperse field for tap changes [Sáiz, 1985].
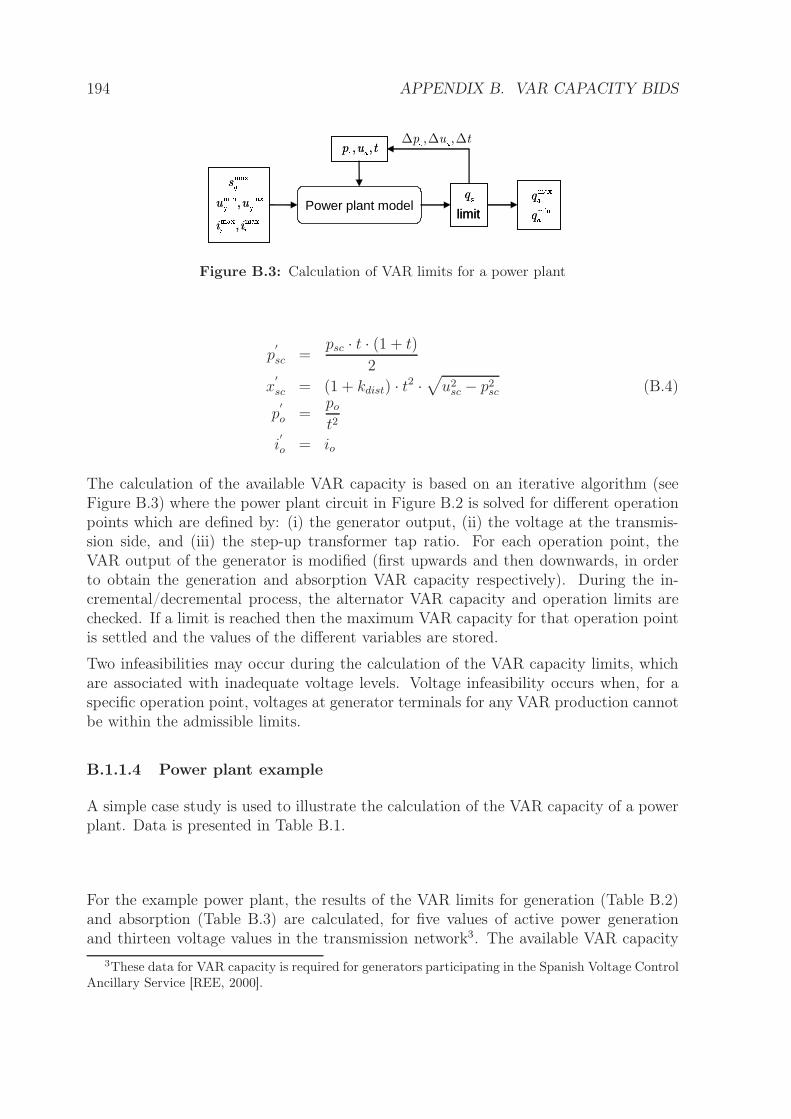
194 APPENDIX B. VAR CAPACITY BIDS
Power plant model
qqqqqlimit
qlimit
, u u , i i
s , u u , i i
s , , p u t, , p u t, , p u t∆ ∆ ∆
Figure B.3: Calculation of VAR limits for a power plant
p′
sc =psc · t · (1 + t)
2
x′
sc = (1 + kdist) · t2 ·√
u2sc − p2
sc (B.4)
p′
o =po
t2
i′
o = io
The calculation of the available VAR capacity is based on an iterative algorithm (seeFigure B.3) where the power plant circuit in Figure B.2 is solved for different operationpoints which are defined by: (i) the generator output, (ii) the voltage at the transmis-sion side, and (iii) the step-up transformer tap ratio. For each operation point, theVAR output of the generator is modified (first upwards and then downwards, in orderto obtain the generation and absorption VAR capacity respectively). During the in-cremental/decremental process, the alternator VAR capacity and operation limits arechecked. If a limit is reached then the maximum VAR capacity for that operation pointis settled and the values of the different variables are stored.
Two infeasibilities may occur during the calculation of the VAR capacity limits, whichare associated with inadequate voltage levels. Voltage infeasibility occurs when, for aspecific operation point, voltages at generator terminals for any VAR production cannotbe within the admissible limits.
B.1.1.4 Power plant example
A simple case study is used to illustrate the calculation of the VAR capacity of a powerplant. Data is presented in Table B.1.
For the example power plant, the results of the VAR limits for generation (Table B.2)and absorption (Table B.3) are calculated, for five values of active power generationand thirteen voltage values in the transmission network3. The available VAR capacity
3These data for VAR capacity is required for generators participating in the Spanish Voltage ControlAncillary Service [REE, 2000].
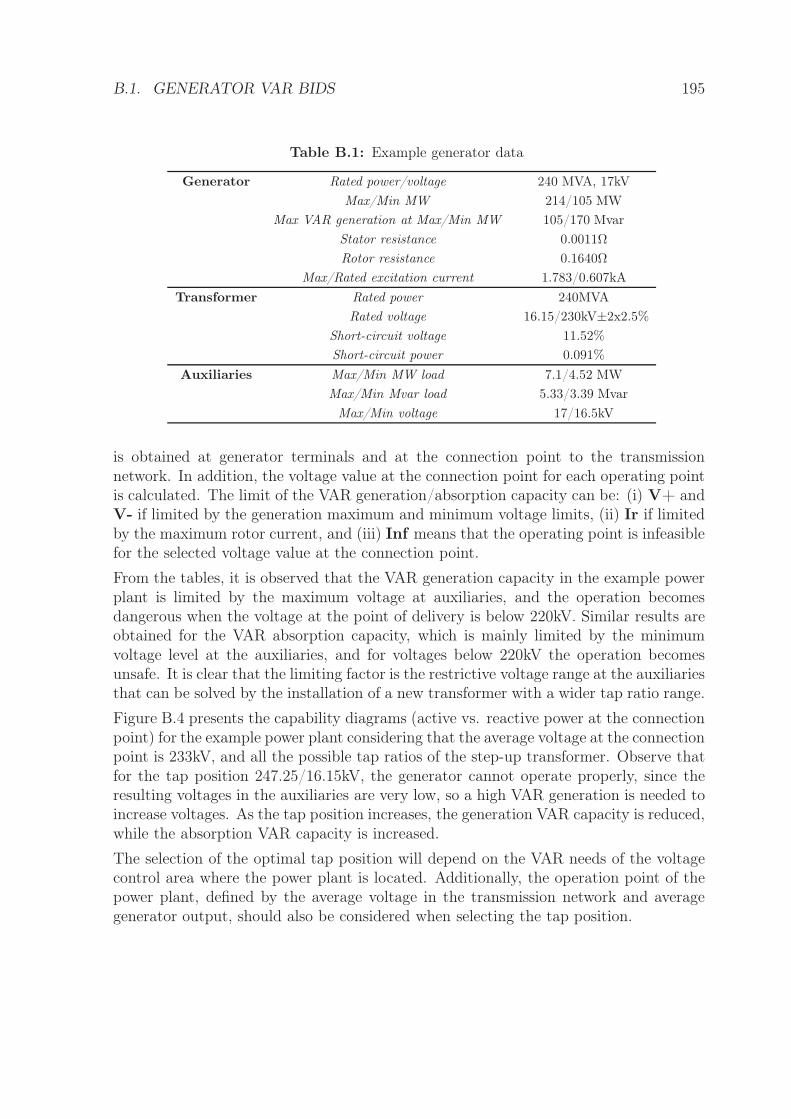
B.1. GENERATOR VAR BIDS 195
Table B.1: Example generator data
Generator Rated power/voltage 240 MVA, 17kV
Max/Min MW 214/105 MW
Max VAR generation at Max/Min MW 105/170 Mvar
Stator resistance 0.0011Ω
Rotor resistance 0.1640Ω
Max/Rated excitation current 1.783/0.607kA
Transformer Rated power 240MVA
Rated voltage 16.15/230kV±2x2.5%
Short-circuit voltage 11.52%
Short-circuit power 0.091%
Auxiliaries Max/Min MW load 7.1/4.52 MW
Max/Min Mvar load 5.33/3.39 Mvar
Max/Min voltage 17/16.5kV
is obtained at generator terminals and at the connection point to the transmissionnetwork. In addition, the voltage value at the connection point for each operating pointis calculated. The limit of the VAR generation/absorption capacity can be: (i) V+ andV- if limited by the generation maximum and minimum voltage limits, (ii) Ir if limitedby the maximum rotor current, and (iii) Inf means that the operating point is infeasiblefor the selected voltage value at the connection point.
From the tables, it is observed that the VAR generation capacity in the example powerplant is limited by the maximum voltage at auxiliaries, and the operation becomesdangerous when the voltage at the point of delivery is below 220kV. Similar results areobtained for the VAR absorption capacity, which is mainly limited by the minimumvoltage level at the auxiliaries, and for voltages below 220kV the operation becomesunsafe. It is clear that the limiting factor is the restrictive voltage range at the auxiliariesthat can be solved by the installation of a new transformer with a wider tap ratio range.
Figure B.4 presents the capability diagrams (active vs. reactive power at the connectionpoint) for the example power plant considering that the average voltage at the connectionpoint is 233kV, and all the possible tap ratios of the step-up transformer. Observe thatfor the tap position 247.25/16.15kV, the generator cannot operate properly, since theresulting voltages in the auxiliaries are very low, so a high VAR generation is needed toincrease voltages. As the tap position increases, the generation VAR capacity is reduced,while the absorption VAR capacity is increased.
The selection of the optimal tap position will depend on the VAR needs of the voltagecontrol area where the power plant is located. Additionally, the operation point of thepower plant, defined by the average voltage in the transmission network and averagegenerator output, should also be considered when selecting the tap position.
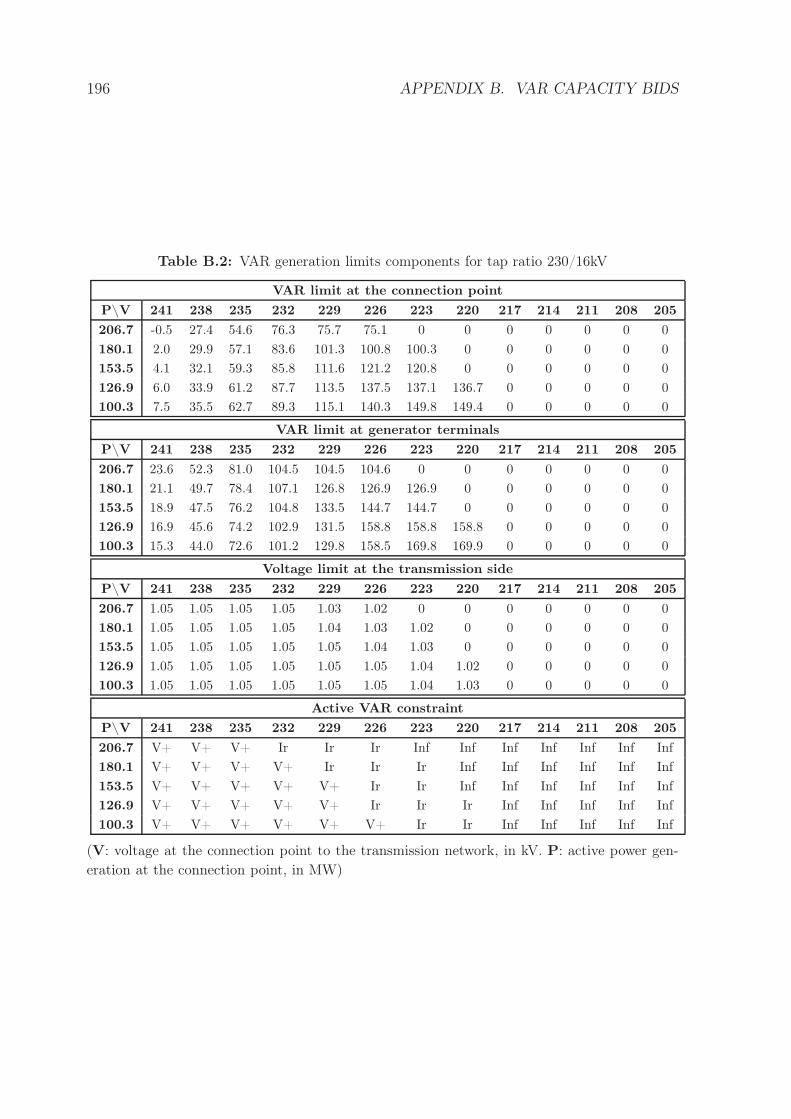
196 APPENDIX B. VAR CAPACITY BIDS
Table B.2: VAR generation limits components for tap ratio 230/16kV
VAR limit at the connection point
P\V 241 238 235 232 229 226 223 220 217 214 211 208 205
206.7 -0.5 27.4 54.6 76.3 75.7 75.1 0 0 0 0 0 0 0
180.1 2.0 29.9 57.1 83.6 101.3 100.8 100.3 0 0 0 0 0 0
153.5 4.1 32.1 59.3 85.8 111.6 121.2 120.8 0 0 0 0 0 0
126.9 6.0 33.9 61.2 87.7 113.5 137.5 137.1 136.7 0 0 0 0 0
100.3 7.5 35.5 62.7 89.3 115.1 140.3 149.8 149.4 0 0 0 0 0
VAR limit at generator terminals
P\V 241 238 235 232 229 226 223 220 217 214 211 208 205
206.7 23.6 52.3 81.0 104.5 104.5 104.6 0 0 0 0 0 0 0
180.1 21.1 49.7 78.4 107.1 126.8 126.9 126.9 0 0 0 0 0 0
153.5 18.9 47.5 76.2 104.8 133.5 144.7 144.7 0 0 0 0 0 0
126.9 16.9 45.6 74.2 102.9 131.5 158.8 158.8 158.8 0 0 0 0 0
100.3 15.3 44.0 72.6 101.2 129.8 158.5 169.8 169.9 0 0 0 0 0
Voltage limit at the transmission side
P\V 241 238 235 232 229 226 223 220 217 214 211 208 205
206.7 1.05 1.05 1.05 1.05 1.03 1.02 0 0 0 0 0 0 0
180.1 1.05 1.05 1.05 1.05 1.04 1.03 1.02 0 0 0 0 0 0
153.5 1.05 1.05 1.05 1.05 1.05 1.04 1.03 0 0 0 0 0 0
126.9 1.05 1.05 1.05 1.05 1.05 1.05 1.04 1.02 0 0 0 0 0
100.3 1.05 1.05 1.05 1.05 1.05 1.05 1.04 1.03 0 0 0 0 0
Active VAR constraint
P\V 241 238 235 232 229 226 223 220 217 214 211 208 205
206.7 V+ V+ V+ Ir Ir Ir Inf Inf Inf Inf Inf Inf Inf
180.1 V+ V+ V+ V+ Ir Ir Ir Inf Inf Inf Inf Inf Inf
153.5 V+ V+ V+ V+ V+ Ir Ir Inf Inf Inf Inf Inf Inf
126.9 V+ V+ V+ V+ V+ Ir Ir Ir Inf Inf Inf Inf Inf
100.3 V+ V+ V+ V+ V+ V+ Ir Ir Inf Inf Inf Inf Inf
(V: voltage at the connection point to the transmission network, in kV. P: active power gen-
eration at the connection point, in MW)
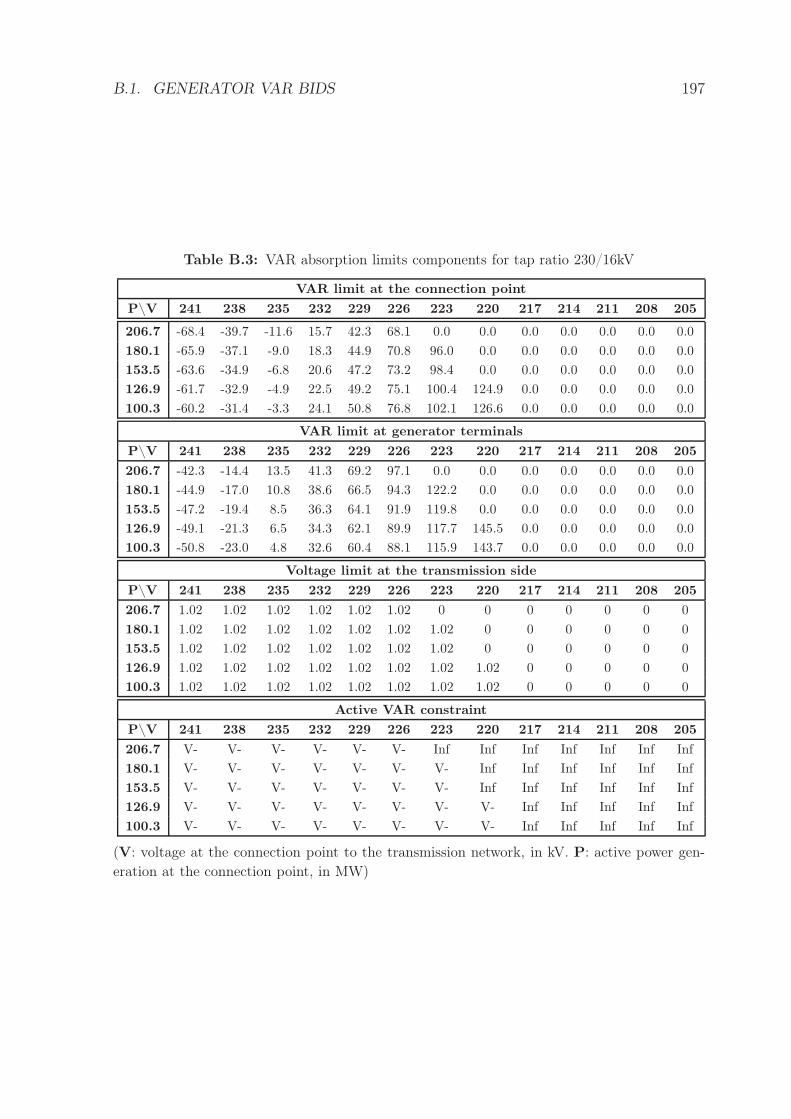
B.1. GENERATOR VAR BIDS 197
Table B.3: VAR absorption limits components for tap ratio 230/16kV
VAR limit at the connection point
P\V 241 238 235 232 229 226 223 220 217 214 211 208 205
206.7 -68.4 -39.7 -11.6 15.7 42.3 68.1 0.0 0.0 0.0 0.0 0.0 0.0 0.0
180.1 -65.9 -37.1 -9.0 18.3 44.9 70.8 96.0 0.0 0.0 0.0 0.0 0.0 0.0
153.5 -63.6 -34.9 -6.8 20.6 47.2 73.2 98.4 0.0 0.0 0.0 0.0 0.0 0.0
126.9 -61.7 -32.9 -4.9 22.5 49.2 75.1 100.4 124.9 0.0 0.0 0.0 0.0 0.0
100.3 -60.2 -31.4 -3.3 24.1 50.8 76.8 102.1 126.6 0.0 0.0 0.0 0.0 0.0
VAR limit at generator terminals
P\V 241 238 235 232 229 226 223 220 217 214 211 208 205
206.7 -42.3 -14.4 13.5 41.3 69.2 97.1 0.0 0.0 0.0 0.0 0.0 0.0 0.0
180.1 -44.9 -17.0 10.8 38.6 66.5 94.3 122.2 0.0 0.0 0.0 0.0 0.0 0.0
153.5 -47.2 -19.4 8.5 36.3 64.1 91.9 119.8 0.0 0.0 0.0 0.0 0.0 0.0
126.9 -49.1 -21.3 6.5 34.3 62.1 89.9 117.7 145.5 0.0 0.0 0.0 0.0 0.0
100.3 -50.8 -23.0 4.8 32.6 60.4 88.1 115.9 143.7 0.0 0.0 0.0 0.0 0.0
Voltage limit at the transmission side
P\V 241 238 235 232 229 226 223 220 217 214 211 208 205
206.7 1.02 1.02 1.02 1.02 1.02 1.02 0 0 0 0 0 0 0
180.1 1.02 1.02 1.02 1.02 1.02 1.02 1.02 0 0 0 0 0 0
153.5 1.02 1.02 1.02 1.02 1.02 1.02 1.02 0 0 0 0 0 0
126.9 1.02 1.02 1.02 1.02 1.02 1.02 1.02 1.02 0 0 0 0 0
100.3 1.02 1.02 1.02 1.02 1.02 1.02 1.02 1.02 0 0 0 0 0
Active VAR constraint
P\V 241 238 235 232 229 226 223 220 217 214 211 208 205
206.7 V- V- V- V- V- V- Inf Inf Inf Inf Inf Inf Inf
180.1 V- V- V- V- V- V- V- Inf Inf Inf Inf Inf Inf
153.5 V- V- V- V- V- V- V- Inf Inf Inf Inf Inf Inf
126.9 V- V- V- V- V- V- V- V- Inf Inf Inf Inf Inf
100.3 V- V- V- V- V- V- V- V- Inf Inf Inf Inf Inf
(V: voltage at the connection point to the transmission network, in kV. P: active power gen-
eration at the connection point, in MW)
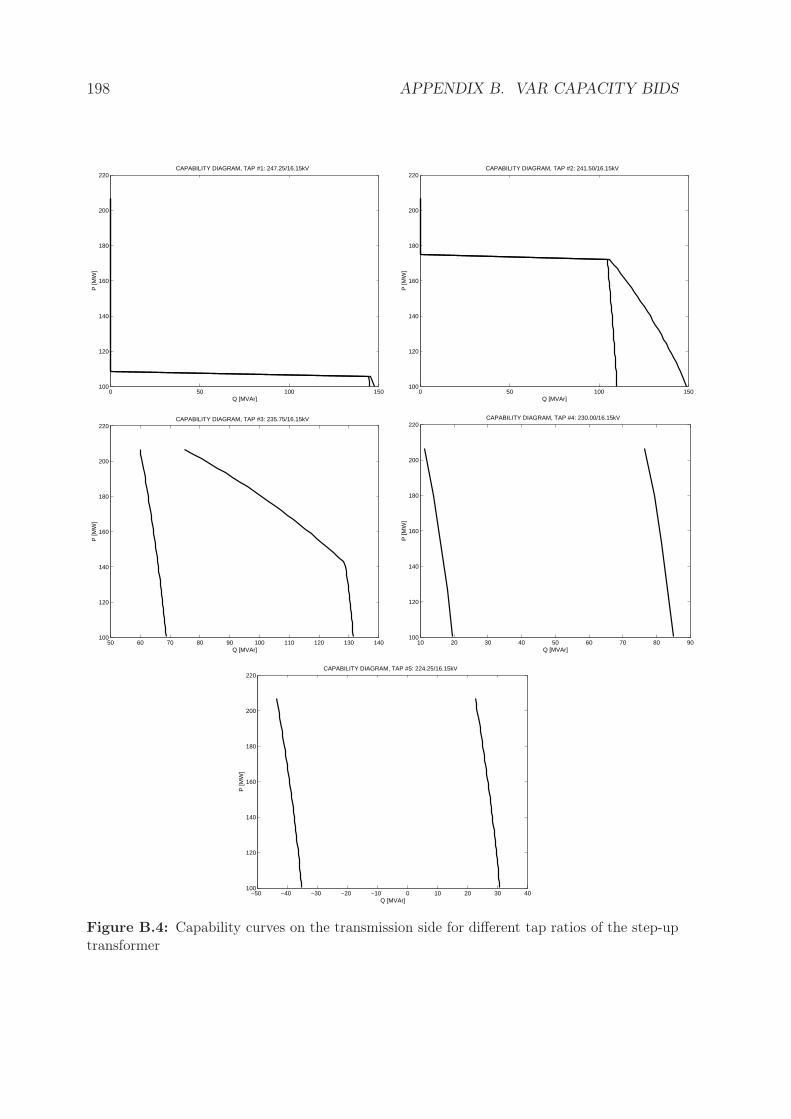
198 APPENDIX B. VAR CAPACITY BIDS
0 50 100 150100
120
140
160
180
200
220
Q [MVAr]
P [M
W]
CAPABILITY DIAGRAM, TAP #1: 247.25/16.15kV
0 50 100 150100
120
140
160
180
200
220
Q [MVAr]P
[MW
]
CAPABILITY DIAGRAM, TAP #2: 241.50/16.15kV
50 60 70 80 90 100 110 120 130 140100
120
140
160
180
200
220
Q [MVAr]
P [M
W]
CAPABILITY DIAGRAM, TAP #3: 235.75/16.15kV
10 20 30 40 50 60 70 80 90100
120
140
160
180
200
220
Q [MVAr]
P [M
W]
CAPABILITY DIAGRAM, TAP #4: 230.00/16.15kV
−50 −40 −30 −20 −10 0 10 20 30 40100
120
140
160
180
200
220
Q [MVAr]
P [M
W]
CAPABILITY DIAGRAM, TAP #5: 224.25/16.15kV
Figure B.4: Capability curves on the transmission side for different tap ratios of the step-uptransformer
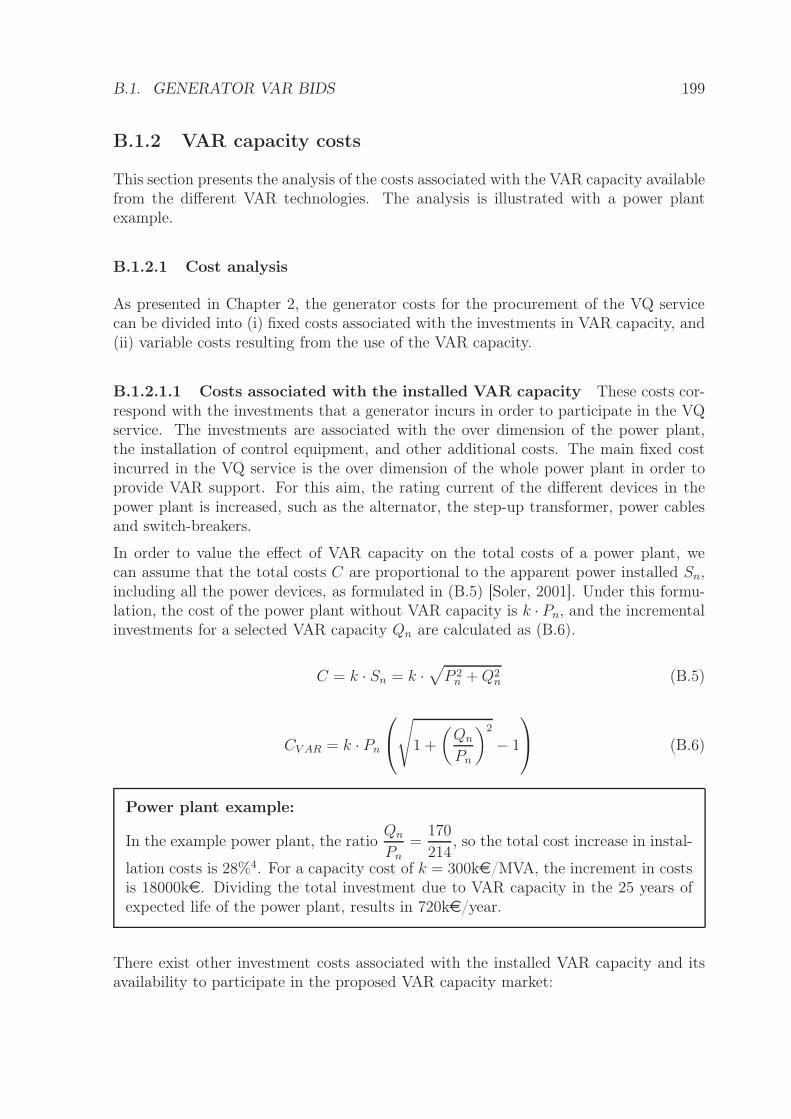
B.1. GENERATOR VAR BIDS 199
B.1.2 VAR capacity costs
This section presents the analysis of the costs associated with the VAR capacity availablefrom the different VAR technologies. The analysis is illustrated with a power plantexample.
B.1.2.1 Cost analysis
As presented in Chapter 2, the generator costs for the procurement of the VQ servicecan be divided into (i) fixed costs associated with the investments in VAR capacity, and(ii) variable costs resulting from the use of the VAR capacity.
B.1.2.1.1 Costs associated with the installed VAR capacity These costs cor-respond with the investments that a generator incurs in order to participate in the VQservice. The investments are associated with the over dimension of the power plant,the installation of control equipment, and other additional costs. The main fixed costincurred in the VQ service is the over dimension of the whole power plant in order toprovide VAR support. For this aim, the rating current of the different devices in thepower plant is increased, such as the alternator, the step-up transformer, power cablesand switch-breakers.
In order to value the effect of VAR capacity on the total costs of a power plant, wecan assume that the total costs C are proportional to the apparent power installed Sn,including all the power devices, as formulated in (B.5) [Soler, 2001]. Under this formu-lation, the cost of the power plant without VAR capacity is k · Pn, and the incrementalinvestments for a selected VAR capacity Qn are calculated as (B.6).
C = k · Sn = k ·√
P 2n + Q2
n (B.5)
CV AR = k · Pn
√
1 +
(
Qn
Pn
)2
− 1
(B.6)
Power plant example:
In the example power plant, the ratioQn
Pn
=170
214, so the total cost increase in instal-
lation costs is 28%4. For a capacity cost of k = 300ke/MVA, the increment in costsis 18000ke. Dividing the total investment due to VAR capacity in the 25 years ofexpected life of the power plant, results in 720ke/year.
There exist other investment costs associated with the installed VAR capacity and itsavailability to participate in the proposed VAR capacity market:
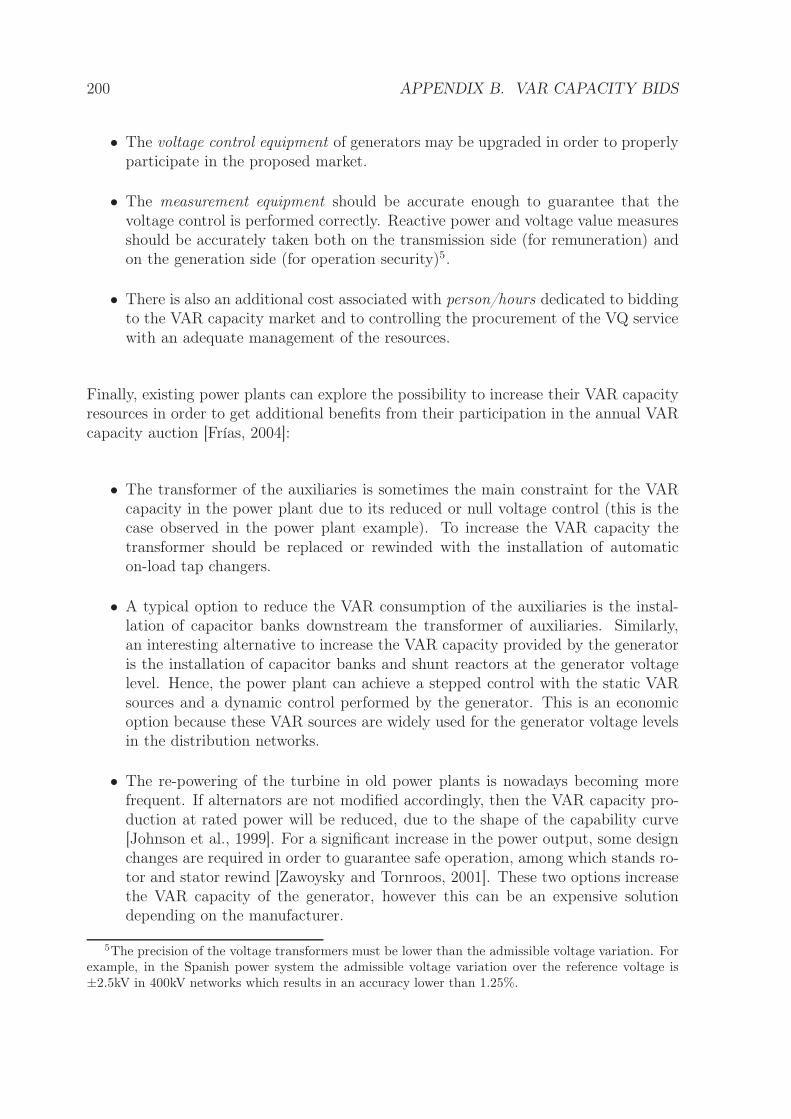
200 APPENDIX B. VAR CAPACITY BIDS
• The voltage control equipment of generators may be upgraded in order to properlyparticipate in the proposed market.
• The measurement equipment should be accurate enough to guarantee that thevoltage control is performed correctly. Reactive power and voltage value measuresshould be accurately taken both on the transmission side (for remuneration) andon the generation side (for operation security)5.
• There is also an additional cost associated with person/hours dedicated to biddingto the VAR capacity market and to controlling the procurement of the VQ servicewith an adequate management of the resources.
Finally, existing power plants can explore the possibility to increase their VAR capacityresources in order to get additional benefits from their participation in the annual VARcapacity auction [Frías, 2004]:
• The transformer of the auxiliaries is sometimes the main constraint for the VARcapacity in the power plant due to its reduced or null voltage control (this is thecase observed in the power plant example). To increase the VAR capacity thetransformer should be replaced or rewinded with the installation of automaticon-load tap changers.
• A typical option to reduce the VAR consumption of the auxiliaries is the instal-lation of capacitor banks downstream the transformer of auxiliaries. Similarly,an interesting alternative to increase the VAR capacity provided by the generatoris the installation of capacitor banks and shunt reactors at the generator voltagelevel. Hence, the power plant can achieve a stepped control with the static VARsources and a dynamic control performed by the generator. This is an economicoption because these VAR sources are widely used for the generator voltage levelsin the distribution networks.
• The re-powering of the turbine in old power plants is nowadays becoming morefrequent. If alternators are not modified accordingly, then the VAR capacity pro-duction at rated power will be reduced, due to the shape of the capability curve[Johnson et al., 1999]. For a significant increase in the power output, some designchanges are required in order to guarantee safe operation, among which stands ro-tor and stator rewind [Zawoysky and Tornroos, 2001]. These two options increasethe VAR capacity of the generator, however this can be an expensive solutiondepending on the manufacturer.
5The precision of the voltage transformers must be lower than the admissible voltage variation. Forexample, in the Spanish power system the admissible voltage variation over the reference voltage is±2.5kV in 400kV networks which results in an accuracy lower than 1.25%.
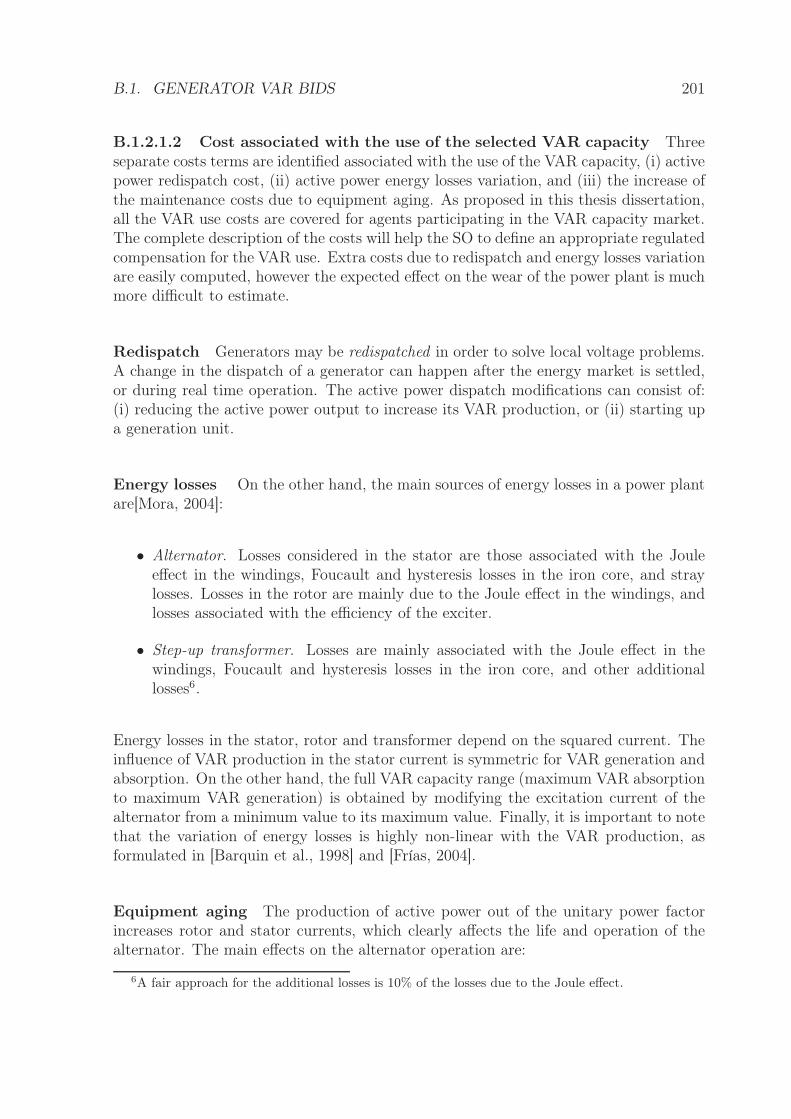
B.1. GENERATOR VAR BIDS 201
B.1.2.1.2 Cost associated with the use of the selected VAR capacity Threeseparate costs terms are identified associated with the use of the VAR capacity, (i) activepower redispatch cost, (ii) active power energy losses variation, and (iii) the increase ofthe maintenance costs due to equipment aging. As proposed in this thesis dissertation,all the VAR use costs are covered for agents participating in the VAR capacity market.The complete description of the costs will help the SO to define an appropriate regulatedcompensation for the VAR use. Extra costs due to redispatch and energy losses variationare easily computed, however the expected effect on the wear of the power plant is muchmore difficult to estimate.
Redispatch Generators may be redispatched in order to solve local voltage problems.A change in the dispatch of a generator can happen after the energy market is settled,or during real time operation. The active power dispatch modifications can consist of:(i) reducing the active power output to increase its VAR production, or (ii) starting upa generation unit.
Energy losses On the other hand, the main sources of energy losses in a power plantare[Mora, 2004]:
• Alternator. Losses considered in the stator are those associated with the Jouleeffect in the windings, Foucault and hysteresis losses in the iron core, and straylosses. Losses in the rotor are mainly due to the Joule effect in the windings, andlosses associated with the efficiency of the exciter.
• Step-up transformer. Losses are mainly associated with the Joule effect in thewindings, Foucault and hysteresis losses in the iron core, and other additionallosses6.
Energy losses in the stator, rotor and transformer depend on the squared current. Theinfluence of VAR production in the stator current is symmetric for VAR generation andabsorption. On the other hand, the full VAR capacity range (maximum VAR absorptionto maximum VAR generation) is obtained by modifying the excitation current of thealternator from a minimum value to its maximum value. Finally, it is important to notethat the variation of energy losses is highly non-linear with the VAR production, asformulated in [Barquin et al., 1998] and [Frías, 2004].
Equipment aging The production of active power out of the unitary power factorincreases rotor and stator currents, which clearly affects the life and operation of thealternator. The main effects on the alternator operation are:
6A fair approach for the additional losses is 10% of the losses due to the Joule effect.
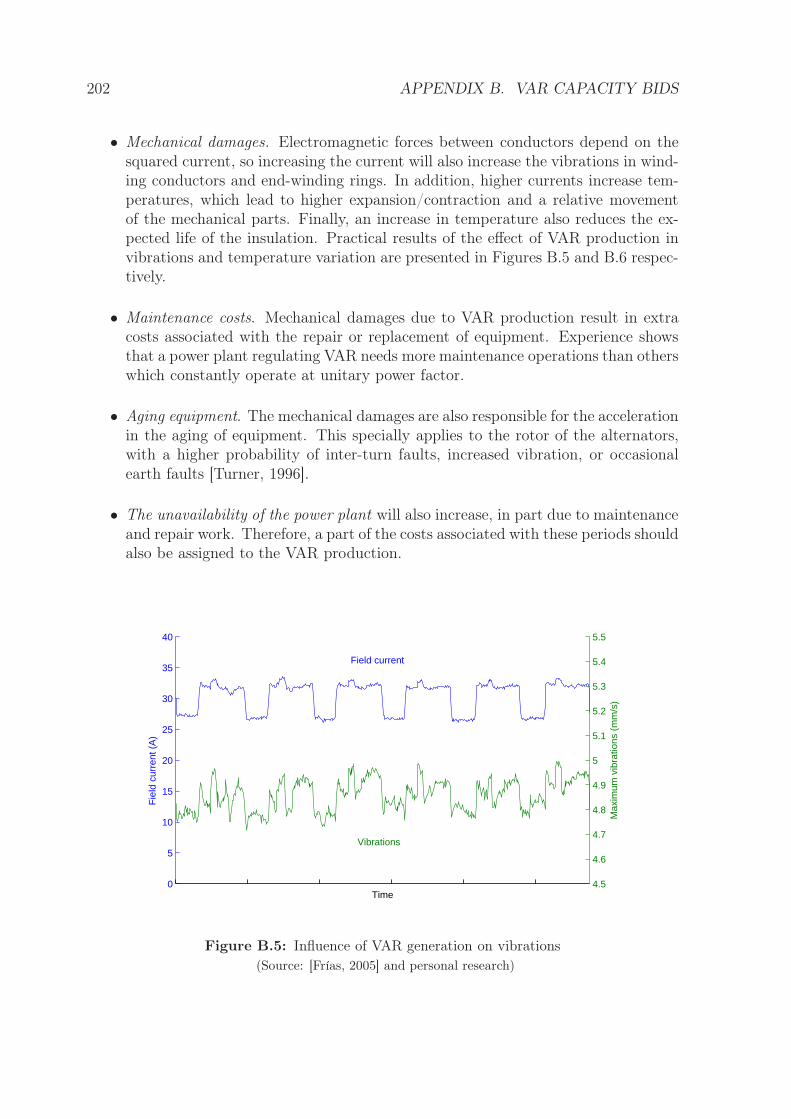
202 APPENDIX B. VAR CAPACITY BIDS
• Mechanical damages. Electromagnetic forces between conductors depend on thesquared current, so increasing the current will also increase the vibrations in wind-ing conductors and end-winding rings. In addition, higher currents increase tem-peratures, which lead to higher expansion/contraction and a relative movementof the mechanical parts. Finally, an increase in temperature also reduces the ex-pected life of the insulation. Practical results of the effect of VAR production invibrations and temperature variation are presented in Figures B.5 and B.6 respec-tively.
• Maintenance costs. Mechanical damages due to VAR production result in extracosts associated with the repair or replacement of equipment. Experience showsthat a power plant regulating VAR needs more maintenance operations than otherswhich constantly operate at unitary power factor.
• Aging equipment. The mechanical damages are also responsible for the accelerationin the aging of equipment. This specially applies to the rotor of the alternators,with a higher probability of inter-turn faults, increased vibration, or occasionalearth faults [Turner, 1996].
• The unavailability of the power plant will also increase, in part due to maintenanceand repair work. Therefore, a part of the costs associated with these periods shouldalso be assigned to the VAR production.
0
5
10
15
20
25
30
35
40
Fie
ld c
urre
nt (
A)
4.5
4.6
4.7
4.8
4.9
5
5.1
5.2
5.3
5.4
5.5
Time
Max
imum
vib
ratio
ns (
mm
/s)
Vibrations
Field current
Figure B.5: Influence of VAR generation on vibrations
(Source: [Frías, 2005] and personal research)
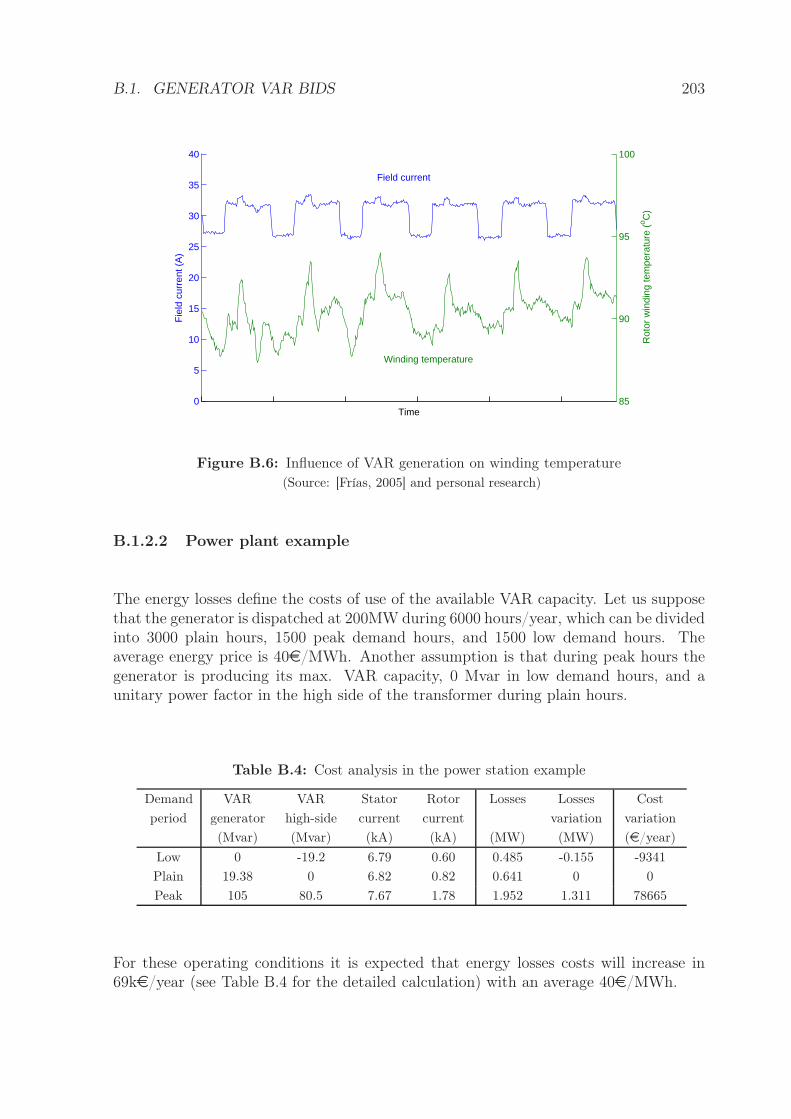
B.1. GENERATOR VAR BIDS 203
0
5
10
15
20
25
30
35
40
Fie
ld c
urre
nt (
A)
85
90
95
100
Time
Rot
or w
indi
ng te
mpe
ratu
re (
o C)
Winding temperature
Field current
Figure B.6: Influence of VAR generation on winding temperature
(Source: [Frías, 2005] and personal research)
B.1.2.2 Power plant example
The energy losses define the costs of use of the available VAR capacity. Let us supposethat the generator is dispatched at 200MW during 6000 hours/year, which can be dividedinto 3000 plain hours, 1500 peak demand hours, and 1500 low demand hours. Theaverage energy price is 40e/MWh. Another assumption is that during peak hours thegenerator is producing its max. VAR capacity, 0 Mvar in low demand hours, and aunitary power factor in the high side of the transformer during plain hours.
Table B.4: Cost analysis in the power station example
Demand
period
VAR
generator
VAR
high-side
Stator
current
Rotor
current
Losses Losses
variation
Cost
variation
(Mvar) (Mvar) (kA) (kA) (MW) (MW) (e/year)
Low 0 -19.2 6.79 0.60 0.485 -0.155 -9341
Plain 19.38 0 6.82 0.82 0.641 0 0
Peak 105 80.5 7.67 1.78 1.952 1.311 78665
For these operating conditions it is expected that energy losses costs will increase in69ke/year (see Table B.4 for the detailed calculation) with an average 40e/MWh.
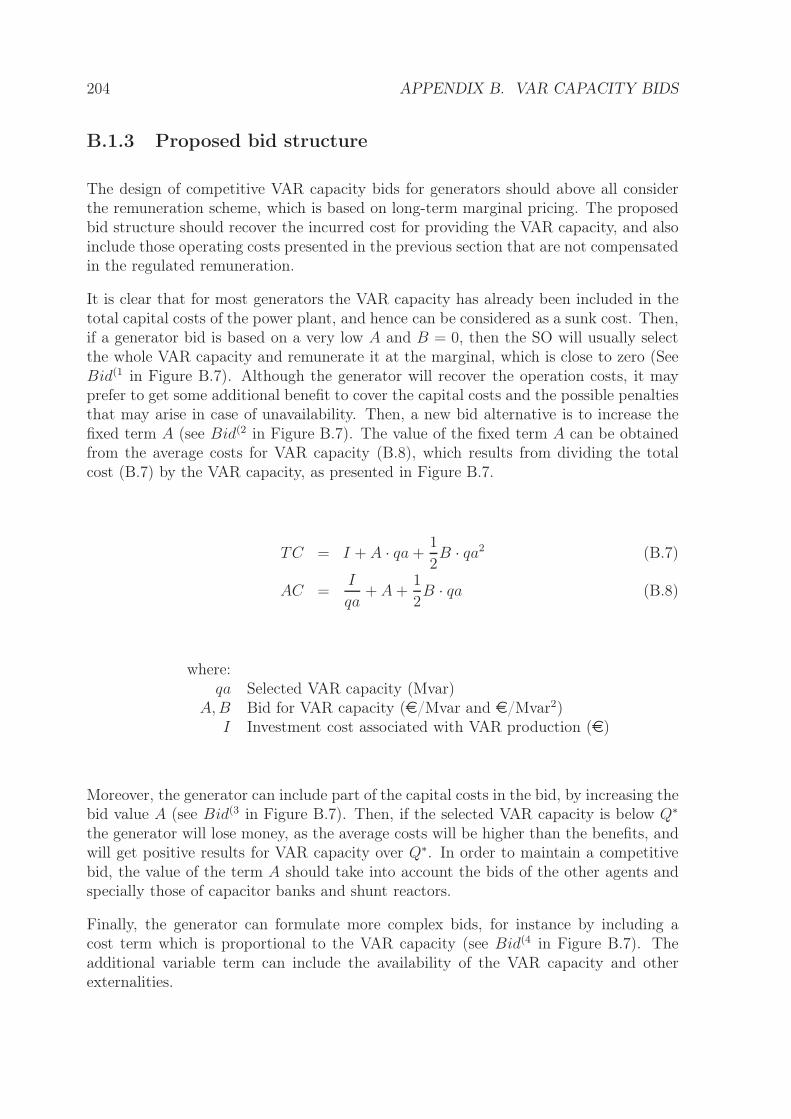
204 APPENDIX B. VAR CAPACITY BIDS
B.1.3 Proposed bid structure
The design of competitive VAR capacity bids for generators should above all considerthe remuneration scheme, which is based on long-term marginal pricing. The proposedbid structure should recover the incurred cost for providing the VAR capacity, and alsoinclude those operating costs presented in the previous section that are not compensatedin the regulated remuneration.
It is clear that for most generators the VAR capacity has already been included in thetotal capital costs of the power plant, and hence can be considered as a sunk cost. Then,if a generator bid is based on a very low A and B = 0, then the SO will usually selectthe whole VAR capacity and remunerate it at the marginal, which is close to zero (SeeBid(1 in Figure B.7). Although the generator will recover the operation costs, it mayprefer to get some additional benefit to cover the capital costs and the possible penaltiesthat may arise in case of unavailability. Then, a new bid alternative is to increase thefixed term A (see Bid(2 in Figure B.7). The value of the fixed term A can be obtainedfrom the average costs for VAR capacity (B.8), which results from dividing the totalcost (B.7) by the VAR capacity, as presented in Figure B.7.
TC = I + A · qa +1
2B · qa2 (B.7)
AC =I
qa+ A +
1
2B · qa (B.8)
where:qa Selected VAR capacity (Mvar)
A, B Bid for VAR capacity (e/Mvar and e/Mvar2)I Investment cost associated with VAR production (e)
Moreover, the generator can include part of the capital costs in the bid, by increasing thebid value A (see Bid(3 in Figure B.7). Then, if the selected VAR capacity is below Q∗
the generator will lose money, as the average costs will be higher than the benefits, andwill get positive results for VAR capacity over Q∗. In order to maintain a competitivebid, the value of the term A should take into account the bids of the other agents andspecially those of capacitor banks and shunt reactors.
Finally, the generator can formulate more complex bids, for instance by including acost term which is proportional to the VAR capacity (see Bid(4 in Figure B.7). Theadditional variable term can include the availability of the VAR capacity and otherexternalities.
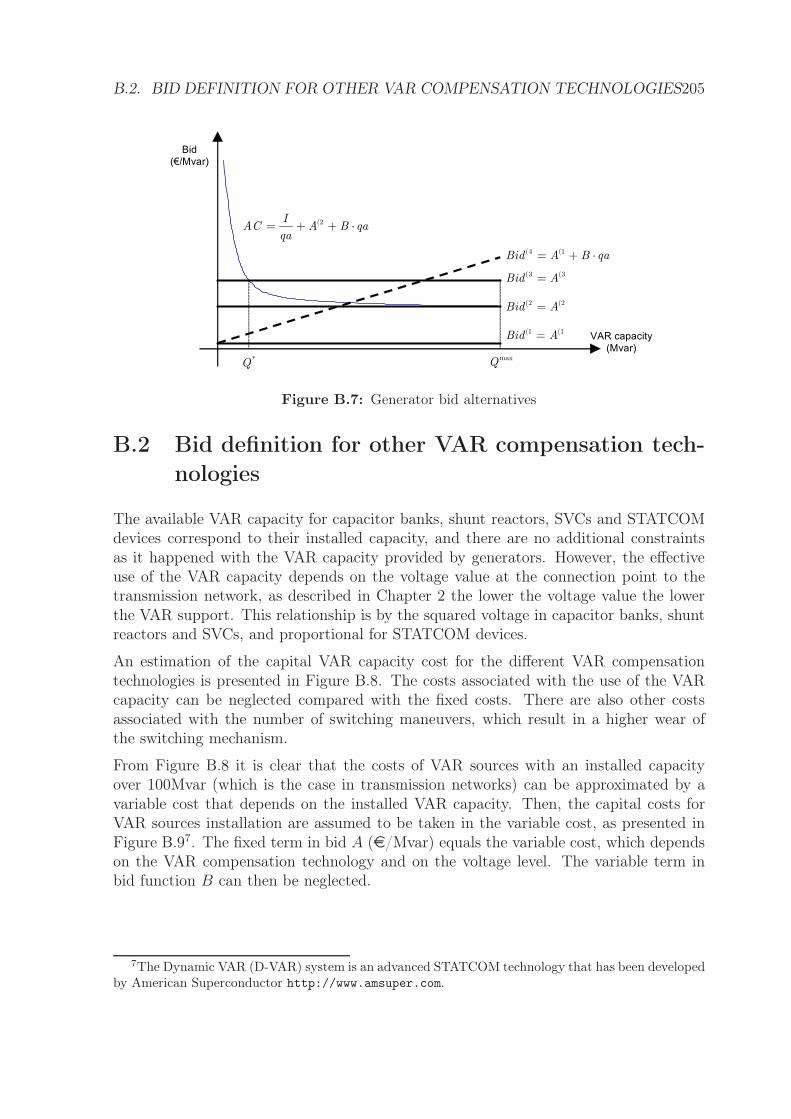
B.2. BID DEFINITION FOR OTHER VAR COMPENSATION TECHNOLOGIES205
maxQ*Q
Bid
(€/Mvar)
VAR capacity
(Mvar)
(3 (3Bid A=
(4 (1Bid A B qa= + ⋅
(1 (1Bid A=
(2 (2Bid A=
(2IAC A B qa
qa= + + ⋅
Figure B.7: Generator bid alternatives
B.2 Bid definition for other VAR compensation tech-
nologies
The available VAR capacity for capacitor banks, shunt reactors, SVCs and STATCOMdevices correspond to their installed capacity, and there are no additional constraintsas it happened with the VAR capacity provided by generators. However, the effectiveuse of the VAR capacity depends on the voltage value at the connection point to thetransmission network, as described in Chapter 2 the lower the voltage value the lowerthe VAR support. This relationship is by the squared voltage in capacitor banks, shuntreactors and SVCs, and proportional for STATCOM devices.
An estimation of the capital VAR capacity cost for the different VAR compensationtechnologies is presented in Figure B.8. The costs associated with the use of the VARcapacity can be neglected compared with the fixed costs. There are also other costsassociated with the number of switching maneuvers, which result in a higher wear ofthe switching mechanism.
From Figure B.8 it is clear that the costs of VAR sources with an installed capacityover 100Mvar (which is the case in transmission networks) can be approximated by avariable cost that depends on the installed VAR capacity. Then, the capital costs forVAR sources installation are assumed to be taken in the variable cost, as presented inFigure B.97. The fixed term in bid A (e/Mvar) equals the variable cost, which dependson the VAR compensation technology and on the voltage level. The variable term inbid function B can then be neglected.
7The Dynamic VAR (D-VAR) system is an advanced STATCOM technology that has been developedby American Superconductor http://www.amsuper.com.
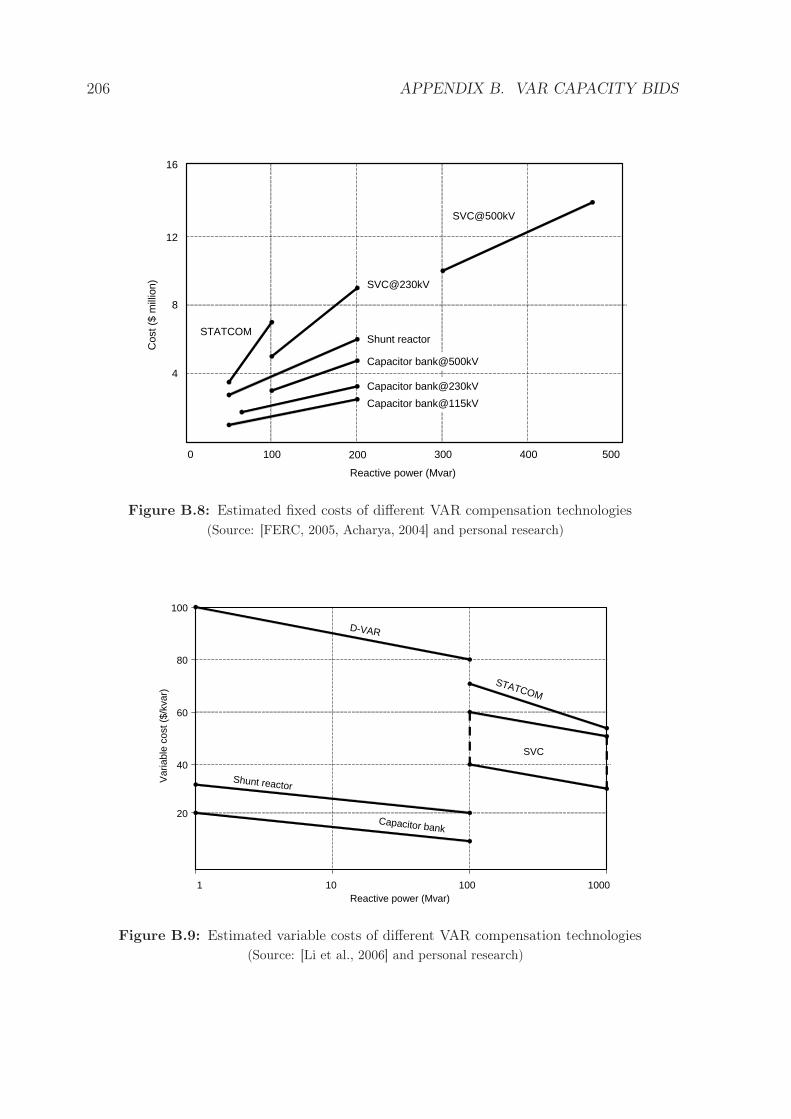
206 APPENDIX B. VAR CAPACITY BIDS
Reactive power (Mvar)
Cos
t ($
mill
ion)
0 500
8
4
STATCOM
SVC@500kV
12
16
100 200 300 400
SVC@230kV
Capacitor bank@115kV
Shunt reactor
Capacitor bank@230kV
Capacitor bank@500kV
Figure B.8: Estimated fixed costs of different VAR compensation technologies
(Source: [FERC, 2005, Acharya, 2004] and personal research)
Reactive power (Mvar)
Var
iabl
e co
st (
$/kv
ar)
1
20
10 100 1000
80
60
100
40
Capacitor bank
Shunt reactor
STATCOM
SVC
D-VAR
Figure B.9: Estimated variable costs of different VAR compensation technologies
(Source: [Li et al., 2006] and personal research)
B.3. REFERENCES 207
B.3 References
[Acharya, 2004] Acharya, N. (2004). Facts and figures about facts. Training Workshopon FACTS application, Energy, AIT.
[Adibi and Milanicz, 1994] Adibi, M. M. and Milanicz, D. P. (1994). Reactive capabilitylimitation of synchronous machines. IEEE Transactions on Power Systems, 9(1):29–40.
[Barquin et al., 1998] Barquin, J., Soler, D., Largo, O., Relano, G., and de la Fuente, I.(1998). On the Cost of the Reactive Power Generation and Voltage Support Service.Symposium on Bulk Power System Dynamics and Control IV.
[FERC, 2005] FERC (2005). Principles for efficient and reliable reactive power supplyand consumption. Staff Report, Docket No. AD05-1-000.
[Frías, 2004] Frías, P. (2004). Gestión optimizada del control de tensiones y gestión dela potencia reactiva. aplicación al caso español. Trabajo de Investigación. Instituto deInvestigación Tecnológica, Universidad Pontificia Comillas (Madrid, Spain).
[Frías, 2005] Frías, P. (2005). Seguimiento del control del factor de potencia de plantasde cogeneración conforme al r.d. 436 de 2004. Internal report.
[Johnson et al., 1999] Johnson, M. G., Hydro, G. E., and Peterborough, O. (1999). Re-cent generator uprate case studies. Electric Machines and Drives, 1999. InternationalConference IEMD’99, pages 821–823.
[Li et al., 2006] Li, F., Kueck, J., Rizy, T., King, T., and Incorporated, E. (2006). Apreliminary analysis of the economics of using distributed energy as a source of reac-tive power supply. Prepared for the U.S. Department of Energy. Oak Ridge NationalLaboratory and Energetics Incorporated.
[Mora, 2004] Mora, J. J. F. (2004). Máquinas eléctricas. McGraw-Hill.
[Nilsson et al., 1994] Nilsson, N. E., Mercurio, J., Co, O. E., and Akron, O. H. (1994).Synchronous generator capability curve testing and evaluation. IEEE Transactionson Power Delivery, 9(1):414–424.
[Olson, 2006] Olson, G. (2006). Impact of leading power factors on synchronous alter-nators. Technical information from Cummins Power Generation, 1(601).
[Panvini and Yohn, 1995] Panvini, A. and Yohn, T. J. (1995). Field assessment of gen-erators reactive capability. IEEE Transactions on Power Systems, 10(1):288–296.
[REE, 2000] REE (2000). P.o. 7.4 servicio complementario de control de tensión de lared de transporte. Red Eléctrica de España. Boletín Oficial del Estado, 19 march,2000.
208 BIBLIOGRAPHY
[Sáiz, 1985] Sáiz, A. (1985). Apuntes de máquinas eléctricas. Universidad PontificiaComillas, 1.
[Soler, 2001] Soler, D. (2001). Modelos regulatorios de los servicios complementarios degeneración y red en sistemas de energía eléctrica. PhD thesis, Universidad PontificiaComillas.
[Turner, 1996] Turner, P. J. (1996). Provision of reactive power from generating plant.In Economic Provision of Reactive Power for System Voltage Control (Digest No.1996/190), IEE Colloquium on, page 3/1.
[Zawoysky and Tornroos, 2001] Zawoysky, R. J. and Tornroos, K. C. (2001). Ge gener-ator rotor design, operational issues, and refurbishment options. GE Power SystemReport, GER-4212.
APPENDIX C
Voltage value
The aim of this appendix is to estimate the value to the distributor of the voltageat the connection point to the transmission network. First, the different cost com-
ponents of the voltage quality are identified. Then, an original quantitative analysisestimates the real costs using a power flow simulation for a small case study.
209
210 APPENDIX C. VOLTAGE VALUE
C.1 Cost components of voltage quality
Distribution System Operators (DSOs) are responsible for the supply of energy to theend-users within specific quality standards. The voltage value is a measure of the qualityof supply. DSOs manage the voltage value across their networks with the help of cer-tain control equipment such as transformers with on-load tap changers, capacitor banks,voltage regulators, and in recent years distributed generation[Peças et al., 2005]. Theoptimal management of these voltage control sources has been traditionally a productiveresearch area [Lu and Hsu, 1997, Nerves and Savet, 2006]. Nowadays, distributed gen-eration is not fully integrated into the distribution network management, and therefore,although its potential is very high, the real contribution to voltage control managementcan be neglected.
An adequate voltage control guarantees voltage quality, and additionally can reducethe energy losses. Distribution networks are characterized by a higher ratio of resis-tance/reactance than that of the transmission networks, therefore energy losses becomequite economically important, as nearly 50% of the total losses in the power system areconsumed in the distribution networks.
Current regulatory practices on VAR management in transmission networks charge theDSOs if they consume energy with a power factor out of a pre-specified range1. Thischarging mechanism valuates the needs of VAR support in the transmission network dueto the VAR load supplied to the DSOs. In this thesis dissertation, an advanced method-ology to value the Voltage Control service in the distribution networks is proposed inorder to incorporate it on the transmission-side of the VQ service.
For this purpose, the costs of voltage support from the DSO point of view can be dividedinto three components, (i) energy losses of the distribution network, (ii) equipmentoperation cost, and (iii) non-supplied energy.
• Each power system has its own mechanism for charging energy losses. Most ofthese mechanisms agree that the DSO must receive a signal to minimize energylosses. Therefore by using adequate voltage control the DSO can benefit fromenergy losses reduction.
• The equipment operation cost is mainly focused on the wear and tear of the tapchangers installed in the power transformers. The cost of an on-load tap changerrepresents approximately 5 to 10% of the total investment cost in a distributiontransformer [Spence and Hall, 1995]. Yet the tap-changer is a critical device of thetransformer that determines its reliability, as experience has shown that on-loadtap changers cause the majority of transformer system failures [Bossi et al., 1983].A failure in the tap-changer will require the replacement of the transformer unit,
1In Spain, according to the P.O.-7.4 [REE, 2000], during peak hours the DSO should not consumemore than 33% of the active power load (power factor 0.95 inductive), during valley hours the DSOshould not generate VAR (power factor 1), and during plain hours the VAR consumed by the DSOshould be in the range of 0-33% of the active power load.
C.2. QUANTITATIVE ANALYSIS 211
and an energy curtailment may be required if there is not a bypass transformer.The cost associated with a single tap change can be obtained by dividing thetotal investment cost per MVA of the transformer by the maximum numberof tap changes. Nowadays, the investment cost is approximately e15000/MVA[Handley et al., 2001], and a usual maximum number of daily maneuvers in apower transformer is 11 changes/day [Lamont and Fu, 1999].
• When voltage in the distribution network falls below a minimum value, then pro-tection equipment will selectively disconnect load. Each power system has itsown criteria for load shedding. The compensation to the loads that have beenshed also depends on the country, and domestic and industrial customers may bedifferentiated. In Europe, the price that regulators set for non-supplied energyvaries between e0.5/kWh in Norway to 9e/kWh in France [Malaman et al., 2001,Billinton, 2002].
C.2 Quantitative analysis
The qualitative analysis performed in the previous section showed that voltage at theconnection point to the transmission network can be valued according to the influence onenergy losses, VAR equipment operating cost, and expected non-supplied energy. Thissection presents a numerical approach to the voltage value using a case study represent-ing a distribution feeder. First, the distribution network case study data is presented.Then, an original formulation to calculate the power flows and the corresponding costs ispresented. Finally, the costs associated with the voltage control in distribution networksare analyzed.
C.2.1 Distribution network example
The distribution network presented in Figure C.1 is connected to the transmission net-work in 400kV with a transformer, and then distributes the energy reducing the voltagelevel to 132kV, 20kV and 400V. For simplicity, all loads are connected in 400V, and theirvalue is 100kW with a power factor of 0.8 each. The main characteristics of the networkare shown in Table C.1 and Table C.2. Figure C.1 shows one single feeder per voltagelevel and assumes that the other feeders have identical structures.
For the quantitative analysis, it is assumed that the cost of non-supplied energy is350e/MWh, and energy losses are paid at 60e/MWh. The expected life of the power
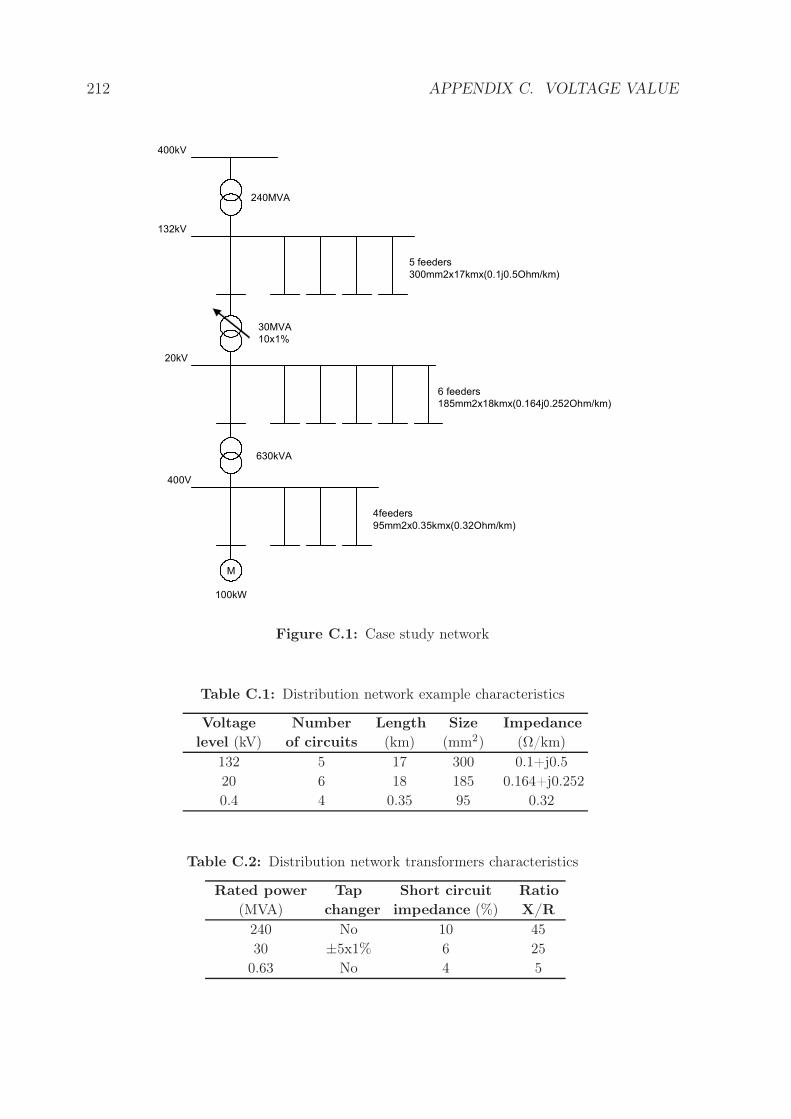
212 APPENDIX C. VOLTAGE VALUE
M
630kVA
30MVA
10x1%
240MVA
20kV
132kV
400kV
400V
100kW
5 feeders
300mm2x17kmx(0.1j0.5Ohm/km)
6 feeders
185mm2x18kmx(0.164j0.252Ohm/km)
4feeders
95mm2x0.35kmx(0.32Ohm/km)
Figure C.1: Case study network
Table C.1: Distribution network example characteristics
Voltage
level (kV)
Number
of circuits
Length
(km)
Size
(mm2)
Impedance
(Ω/km)
132 5 17 300 0.1+j0.5
20 6 18 185 0.164+j0.252
0.4 4 0.35 95 0.32
Table C.2: Distribution network transformers characteristics
Rated power
(MVA)
Tap
changer
Short circuit
impedance (%)
Ratio
X/R
240 No 10 45
30 ±5x1% 6 25
0.63 No 4 5
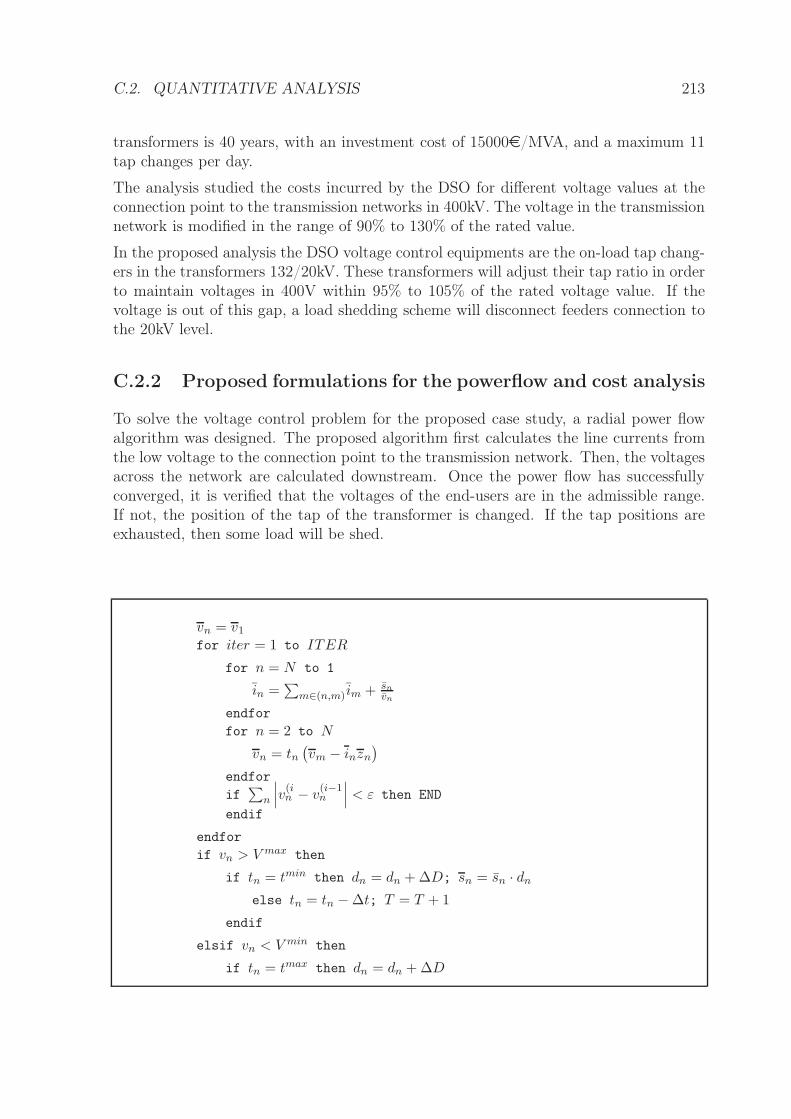
C.2. QUANTITATIVE ANALYSIS 213
transformers is 40 years, with an investment cost of 15000e/MVA, and a maximum 11tap changes per day.
The analysis studied the costs incurred by the DSO for different voltage values at theconnection point to the transmission networks in 400kV. The voltage in the transmissionnetwork is modified in the range of 90% to 130% of the rated value.
In the proposed analysis the DSO voltage control equipments are the on-load tap chang-ers in the transformers 132/20kV. These transformers will adjust their tap ratio in orderto maintain voltages in 400V within 95% to 105% of the rated voltage value. If thevoltage is out of this gap, a load shedding scheme will disconnect feeders connection tothe 20kV level.
C.2.2 Proposed formulations for the powerflow and cost analysis
To solve the voltage control problem for the proposed case study, a radial power flowalgorithm was designed. The proposed algorithm first calculates the line currents fromthe low voltage to the connection point to the transmission network. Then, the voltagesacross the network are calculated downstream. Once the power flow has successfullyconverged, it is verified that the voltages of the end-users are in the admissible range.If not, the position of the tap of the transformer is changed. If the tap positions areexhausted, then some load will be shed.
vn = v1
for iter = 1 to ITER
for n = N to 1
in =∑
m∈(n,m) im + sn
vn
endfor
for n = 2 to N
vn = tn(
vm − inzn
)
endfor
if∑
n
∣
∣
∣v(in − v
(i−1n
∣
∣
∣ < ε then END
endif
endfor
if vn > V max then
if tn = tmin then dn = dn + ∆D; sn = sn · dn
else tn = tn − ∆t; T = T + 1
endif
elsif vn < V min then
if tn = tmax then dn = dn + ∆D
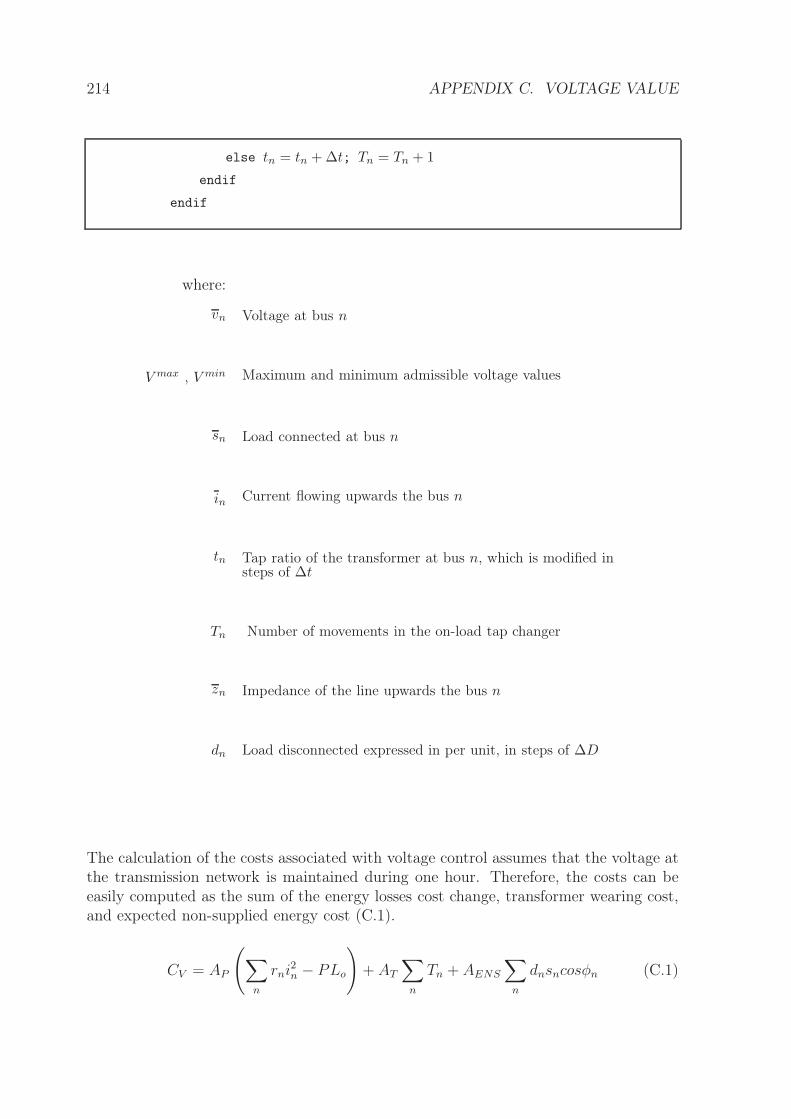
214 APPENDIX C. VOLTAGE VALUE
else tn = tn + ∆t; Tn = Tn + 1
endif
endif
where:
vn Voltage at bus n
V max , V min Maximum and minimum admissible voltage values
sn Load connected at bus n
in Current flowing upwards the bus n
tn Tap ratio of the transformer at bus n, which is modified insteps of ∆t
Tn Number of movements in the on-load tap changer
zn Impedance of the line upwards the bus n
dn Load disconnected expressed in per unit, in steps of ∆D
The calculation of the costs associated with voltage control assumes that the voltage atthe transmission network is maintained during one hour. Therefore, the costs can beeasily computed as the sum of the energy losses cost change, transformer wearing cost,and expected non-supplied energy cost (C.1).
CV = AP
(
∑
n
rni2n − PLo
)
+ AT
∑
n
Tn + AENS
∑
n
dnsncosφn (C.1)
C.2. QUANTITATIVE ANALYSIS 215
where:AP Cost of the active power purchased by the distributor
(e/MWh)rn Resistance of the line upwards from the bus n (Ω)
in Current flowing upwards from the bus n (Amp)
PLo Calculated losses for voltage at the connection point 1p.u. (MW)
AT Cost for the wear of the transformer tap-changer(e/tap-change)
Tn Number of movements in the on-load tap changer
AENS Impedance of the line upwards from the bus n(e/MWh)
dn Load disconnected expressed in per unit, in steps of ∆D(MW)
sn, φn Load connected at bus n (MVA) with power factorcos φn
C.2.3 Technical and economic analysis
An example of the voltage control for voltage on the transmission side of 0.9 p.u. isshown in Figure C.2. The transformers of 30MVA move four taps upwards to correctthe low voltages. However, the voltage value at the end-users is still below the referencerange, so load shedding will be required.
The costs associated with the operation of the transformers of 30MVA are shown inFigure C.3. The cost increases as voltage falls or rises out of a dead voltage band. Ifvoltage in the end consumer is not in the admissible range, then load will be shed toraise voltages, producing additional costs (see Figure C.4 ). Finally, energy losses clearlydecrease for high voltages, as shown in Figure C.5.
The total costs associated with voltage magnitude on the transmission side are obtainedas the sum of the previous costs terms (C.1). According to Figure C.6 three differentcost regions can be identified:
i) For voltages within 1.025p.u. and 1.125p.u., costs associated with voltage controlcan be neglected.
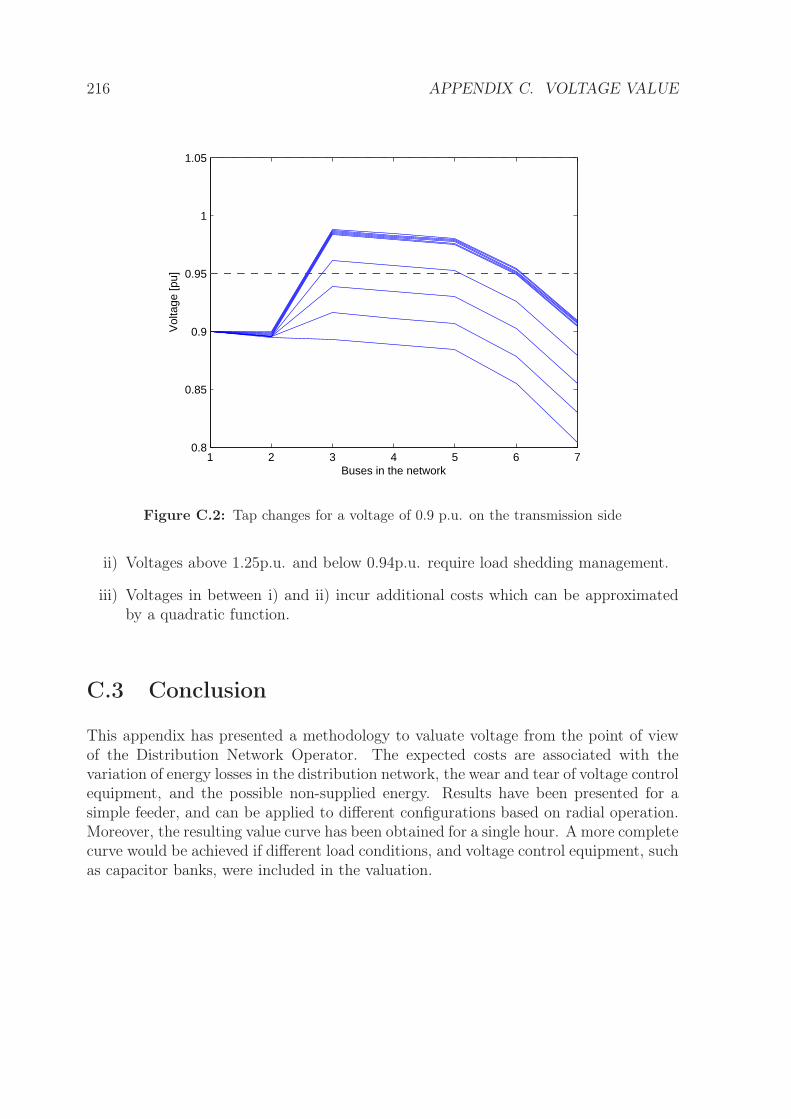
216 APPENDIX C. VOLTAGE VALUE
1 2 3 4 5 6 70.8
0.85
0.9
0.95
1
1.05
Buses in the network
Vol
tage
[pu]
Figure C.2: Tap changes for a voltage of 0.9 p.u. on the transmission side
ii) Voltages above 1.25p.u. and below 0.94p.u. require load shedding management.
iii) Voltages in between i) and ii) incur additional costs which can be approximatedby a quadratic function.
C.3 Conclusion
This appendix has presented a methodology to valuate voltage from the point of viewof the Distribution Network Operator. The expected costs are associated with thevariation of energy losses in the distribution network, the wear and tear of voltage controlequipment, and the possible non-supplied energy. Results have been presented for asimple feeder, and can be applied to different configurations based on radial operation.Moreover, the resulting value curve has been obtained for a single hour. A more completecurve would be achieved if different load conditions, and voltage control equipment, suchas capacitor banks, were included in the valuation.
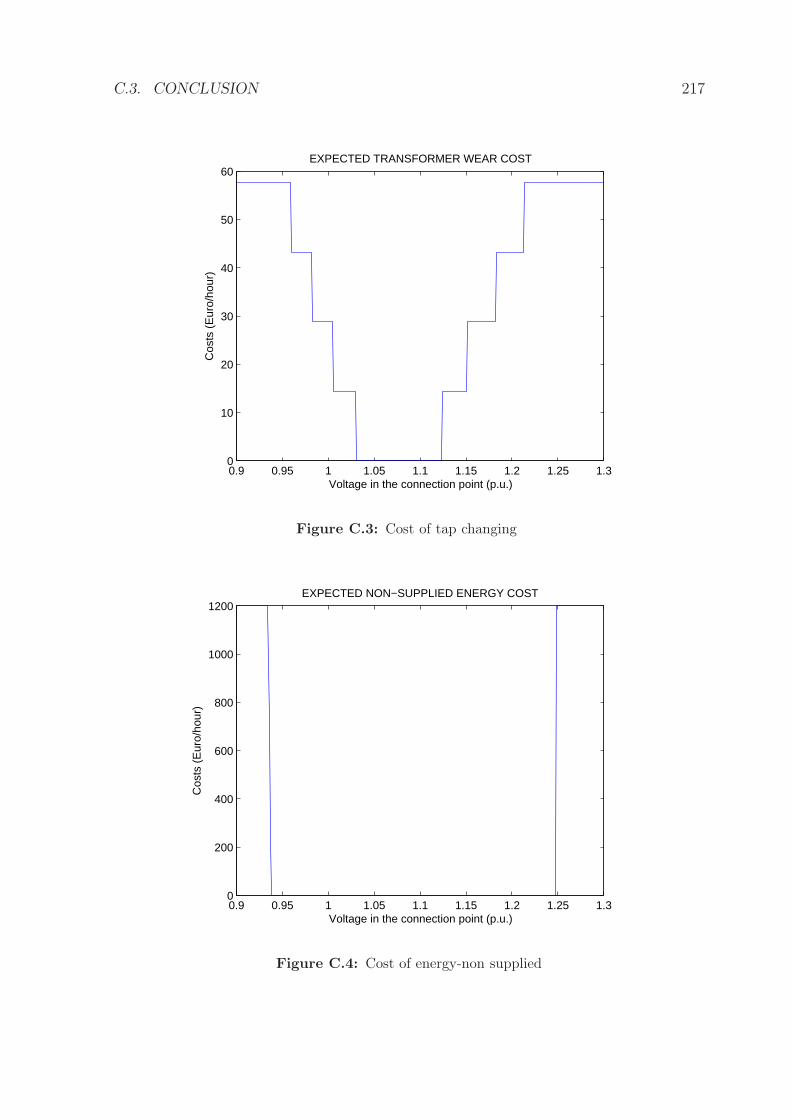
C.3. CONCLUSION 217
0.9 0.95 1 1.05 1.1 1.15 1.2 1.25 1.30
10
20
30
40
50
60EXPECTED TRANSFORMER WEAR COST
Voltage in the connection point (p.u.)
Cos
ts (
Eur
o/ho
ur)
Figure C.3: Cost of tap changing
0.9 0.95 1 1.05 1.1 1.15 1.2 1.25 1.30
200
400
600
800
1000
1200EXPECTED NON−SUPPLIED ENERGY COST
Voltage in the connection point (p.u.)
Cos
ts (
Eur
o/ho
ur)
Figure C.4: Cost of energy-non supplied
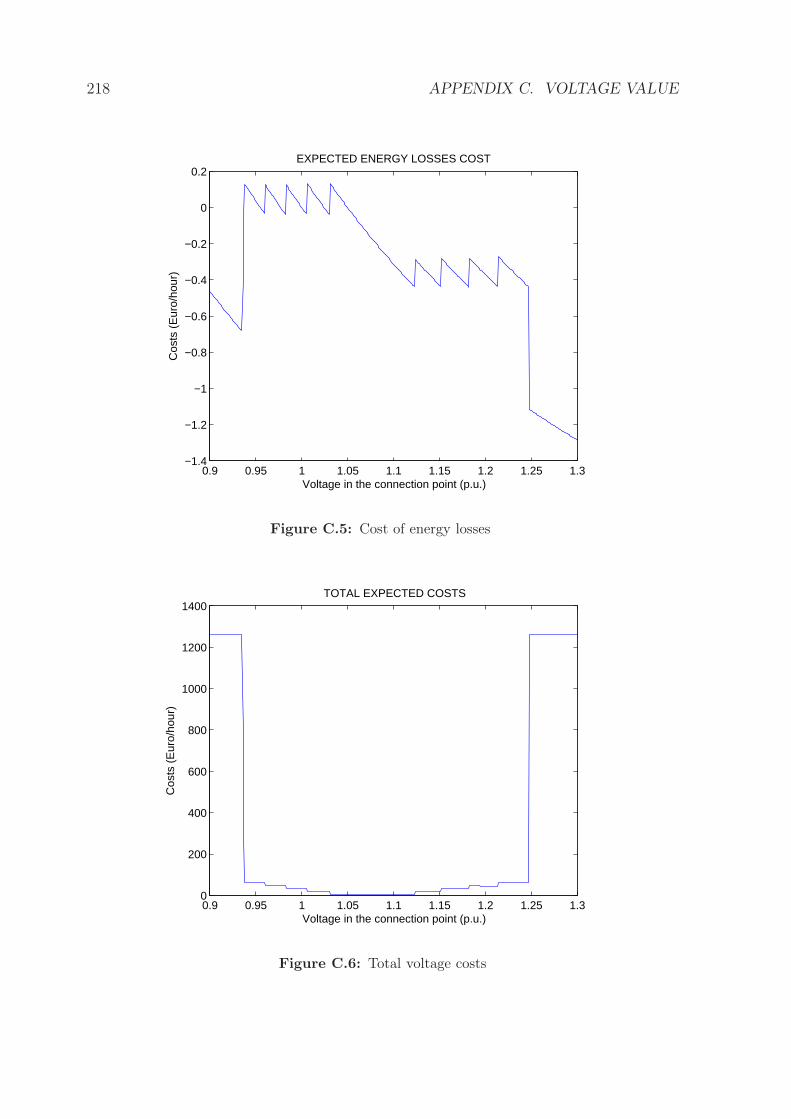
218 APPENDIX C. VOLTAGE VALUE
0.9 0.95 1 1.05 1.1 1.15 1.2 1.25 1.3−1.4
−1.2
−1
−0.8
−0.6
−0.4
−0.2
0
0.2EXPECTED ENERGY LOSSES COST
Voltage in the connection point (p.u.)
Cos
ts (
Eur
o/ho
ur)
Figure C.5: Cost of energy losses
0.9 0.95 1 1.05 1.1 1.15 1.2 1.25 1.30
200
400
600
800
1000
1200
1400TOTAL EXPECTED COSTS
Voltage in the connection point (p.u.)
Cos
ts (
Eur
o/ho
ur)
Figure C.6: Total voltage costs
C.4. REFERENCES 219
C.4 References
[Billinton, 2002] Billinton, R. (2002). Economic cost of non-supply. Power EngineeringSociety Winter Meeting, 2002. IEEE, 2.
[Bossi et al., 1983] Bossi, A., Dind, J. E., Frisson, J. M., Khoudiakov, U., Light, H. F.,Narke, D. V., Tournier, Y., and Verdon, J. (1983). J. an international survey offailures in large power transformers in service final report of the cigré working group12.05. Electra, pages 21–48.
[Handley et al., 2001] Handley, B., Redfern, M., and White, S. (2001). On load tap-changer conditioned based maintenance. IEE Proceedings on Generation, Transmis-sion and Distribution, 148(4):296–300.
[Lamont and Fu, 1999] Lamont, J. W. and Fu, J. (1999). Cost analysis of reactive powersupport. IEEE Transactions on Power Systems, 14(3):890–898.
[Lu and Hsu, 1997] Lu, F. C. and Hsu, Y. Y. (1997). Fuzzy dynamic programmingapproach to reactive power/voltagecontrol in a distribution substation. IEEE Trans-actions on Power Systems, 12(2):681–688.
[Malaman et al., 2001] Malaman, R., Afonso, J., Lo Schiavo, L., Romero, A., Sepul-veda, C., Vrolijk, R., and Wharmby, B. (2001). Quality of electricity supply: Initialbenchmarking on actual levels, standards and regulatory strategies. Council of Euro-pean Energy Regulators (CEER).
[Nerves and Savet, 2006] Nerves, A. C. and Savet, F. J. (2006). Voltage and reactive-power control optimization in a distribution system. TENCON 2006. 2006 IEEERegion 10 Conference, pages 1–4.
[Peças et al., 2005] Peças, J. A., Mendonça, A., Fonseca, N., and Seca, L. (2005). Volt-age and reactive power control provided by dg units. CIGRE SYMPOSIUM: PowerSystems with Dispersed Generation, Athens, Greece, April.
[REE, 2000] REE (2000). P.o. 7.4 servicio complementario de control de tensión de lared de transporte. Red Eléctrica de España. Boletín Oficial del Estado, 19 march,2000.
[Spence and Hall, 1995] Spence, G. and Hall, A. C. (1995). On-load tap-changers cur-rent experience and future development: Users experience and perspective. Develop-ments On-Load Tapchangers: Current Experience and Future, IEE European Seminaron, page 1.

220 BIBLIOGRAPHY
APPENDIX D
Case study data
This appendix includes the detailed technical and economic data used in Chapter 6for the case study.
221
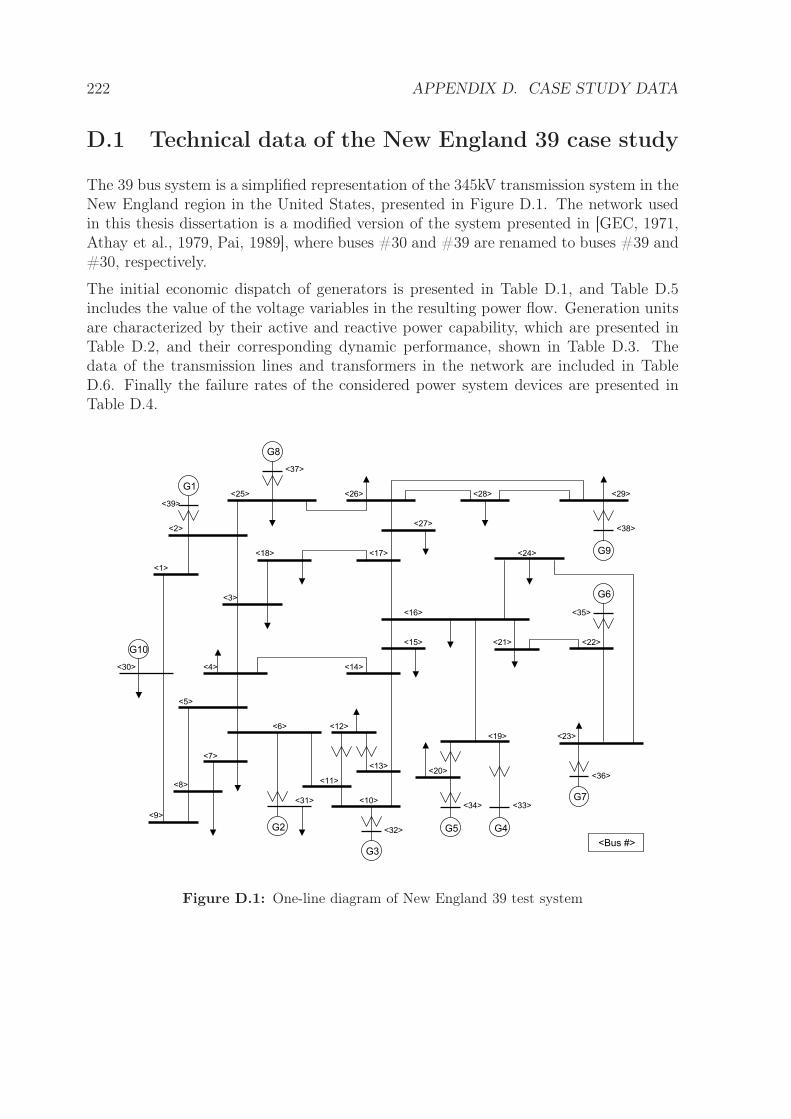
222 APPENDIX D. CASE STUDY DATA
D.1 Technical data of the New England 39 case study
The 39 bus system is a simplified representation of the 345kV transmission system in theNew England region in the United States, presented in Figure D.1. The network usedin this thesis dissertation is a modified version of the system presented in [GEC, 1971,Athay et al., 1979, Pai, 1989], where buses #30 and #39 are renamed to buses #39 and#30, respectively.
The initial economic dispatch of generators is presented in Table D.1, and Table D.5includes the value of the voltage variables in the resulting power flow. Generation unitsare characterized by their active and reactive power capability, which are presented inTable D.2, and their corresponding dynamic performance, shown in Table D.3. Thedata of the transmission lines and transformers in the network are included in TableD.6. Finally the failure rates of the considered power system devices are presented inTable D.4.
G6
G7
G9
<11>
<13>
<14>
<15>
<20>
<22>
<23>
<24>
<35>
G10
G1
<3>
<4>
<5>
<7>
<8>
<9>
<39>
G8
<37>
<28>
G3
G2
<1>
G5 G4
<25> <26> <29>
<27><2> <38>
<18> <17>
<16>
<21>
<30>
<6> <12>
<19>
<36>
<10><31><34> <33>
<32>
<Bus #>
Figure D.1: One-line diagram of New England 39 test system
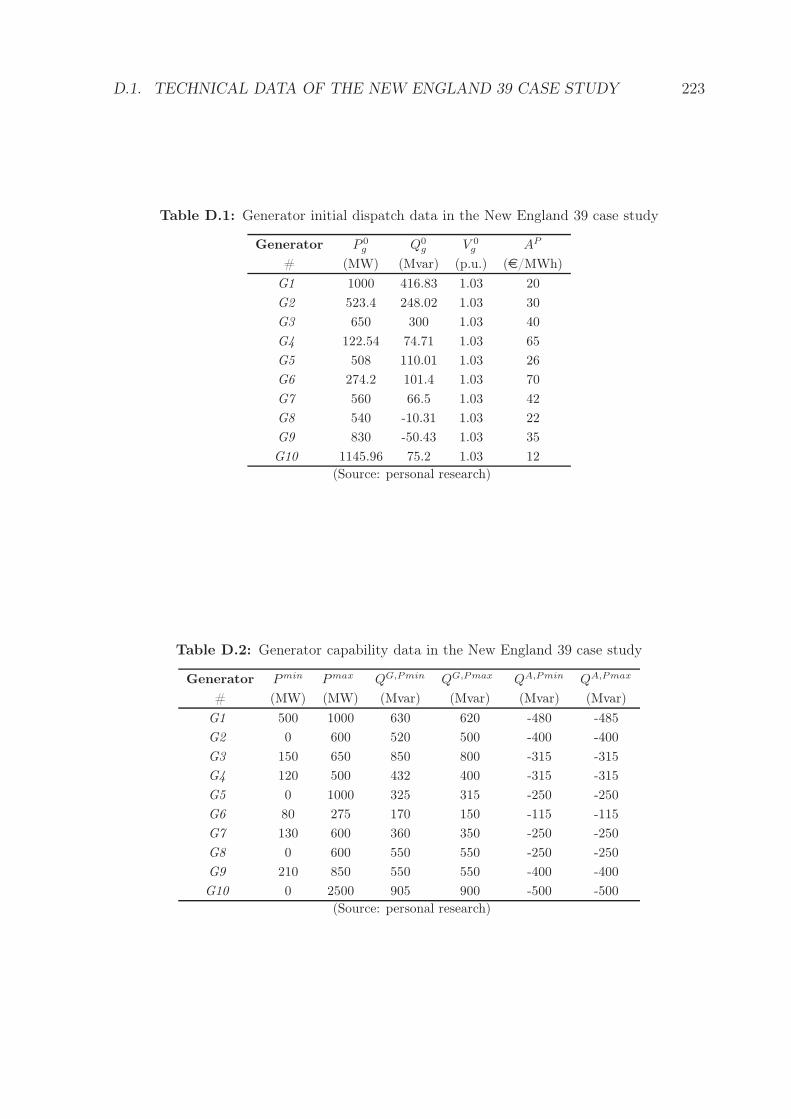
D.1. TECHNICAL DATA OF THE NEW ENGLAND 39 CASE STUDY 223
Table D.1: Generator initial dispatch data in the New England 39 case study
Generator P 0g Q0
g V 0g AP
# (MW) (Mvar) (p.u.) (e/MWh)
G1 1000 416.83 1.03 20
G2 523.4 248.02 1.03 30
G3 650 300 1.03 40
G4 122.54 74.71 1.03 65
G5 508 110.01 1.03 26
G6 274.2 101.4 1.03 70
G7 560 66.5 1.03 42
G8 540 -10.31 1.03 22
G9 830 -50.43 1.03 35
G10 1145.96 75.2 1.03 12
(Source: personal research)
Table D.2: Generator capability data in the New England 39 case study
Generator Pmin Pmax QG,Pmin QG,Pmax QA,Pmin QA,Pmax
# (MW) (MW) (Mvar) (Mvar) (Mvar) (Mvar)
G1 500 1000 630 620 -480 -485
G2 0 600 520 500 -400 -400
G3 150 650 850 800 -315 -315
G4 120 500 432 400 -315 -315
G5 0 1000 325 315 -250 -250
G6 80 275 170 150 -115 -115
G7 130 600 360 350 -250 -250
G8 0 600 550 550 -250 -250
G9 210 850 550 550 -400 -400
G10 0 2500 905 900 -500 -500
(Source: personal research)
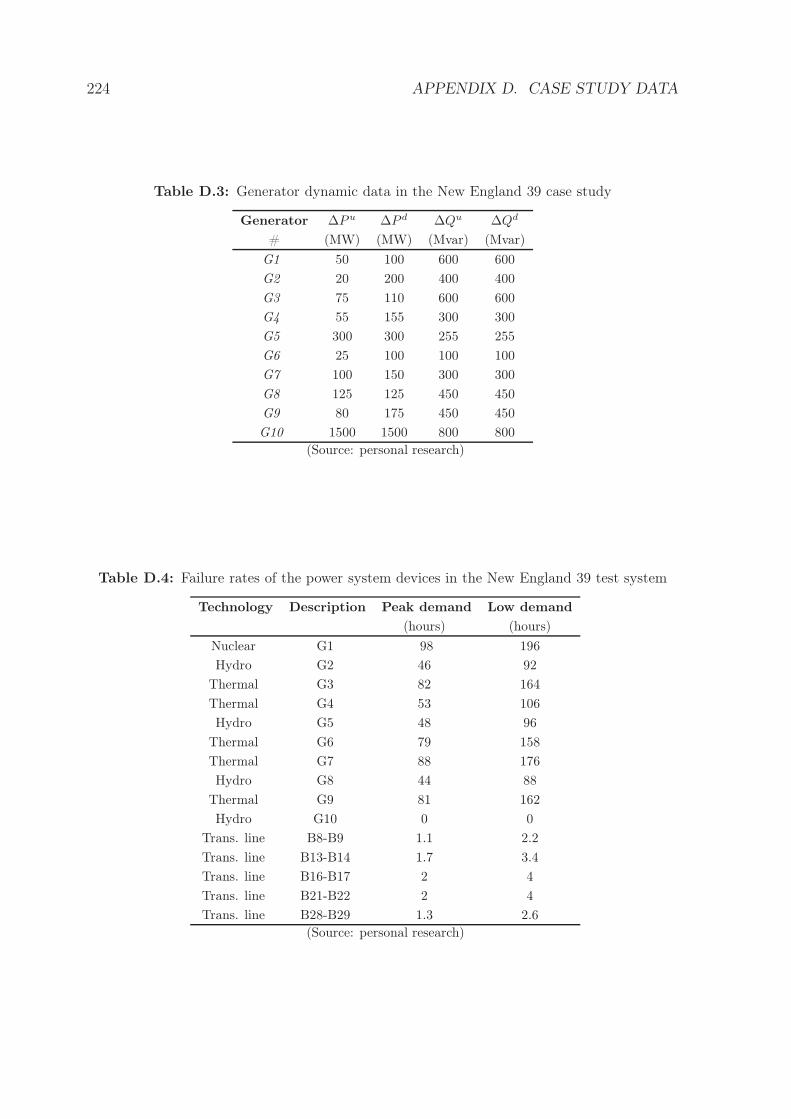
224 APPENDIX D. CASE STUDY DATA
Table D.3: Generator dynamic data in the New England 39 case study
Generator ∆Pu ∆P d ∆Qu ∆Qd
# (MW) (MW) (Mvar) (Mvar)
G1 50 100 600 600
G2 20 200 400 400
G3 75 110 600 600
G4 55 155 300 300
G5 300 300 255 255
G6 25 100 100 100
G7 100 150 300 300
G8 125 125 450 450
G9 80 175 450 450
G10 1500 1500 800 800
(Source: personal research)
Table D.4: Failure rates of the power system devices in the New England 39 test system
Technology Description Peak demand Low demand
(hours) (hours)
Nuclear G1 98 196
Hydro G2 46 92
Thermal G3 82 164
Thermal G4 53 106
Hydro G5 48 96
Thermal G6 79 158
Thermal G7 88 176
Hydro G8 44 88
Thermal G9 81 162
Hydro G10 0 0
Trans. line B8-B9 1.1 2.2
Trans. line B13-B14 1.7 3.4
Trans. line B16-B17 2 4
Trans. line B21-B22 2 4
Trans. line B28-B29 1.3 2.6
(Source: personal research)
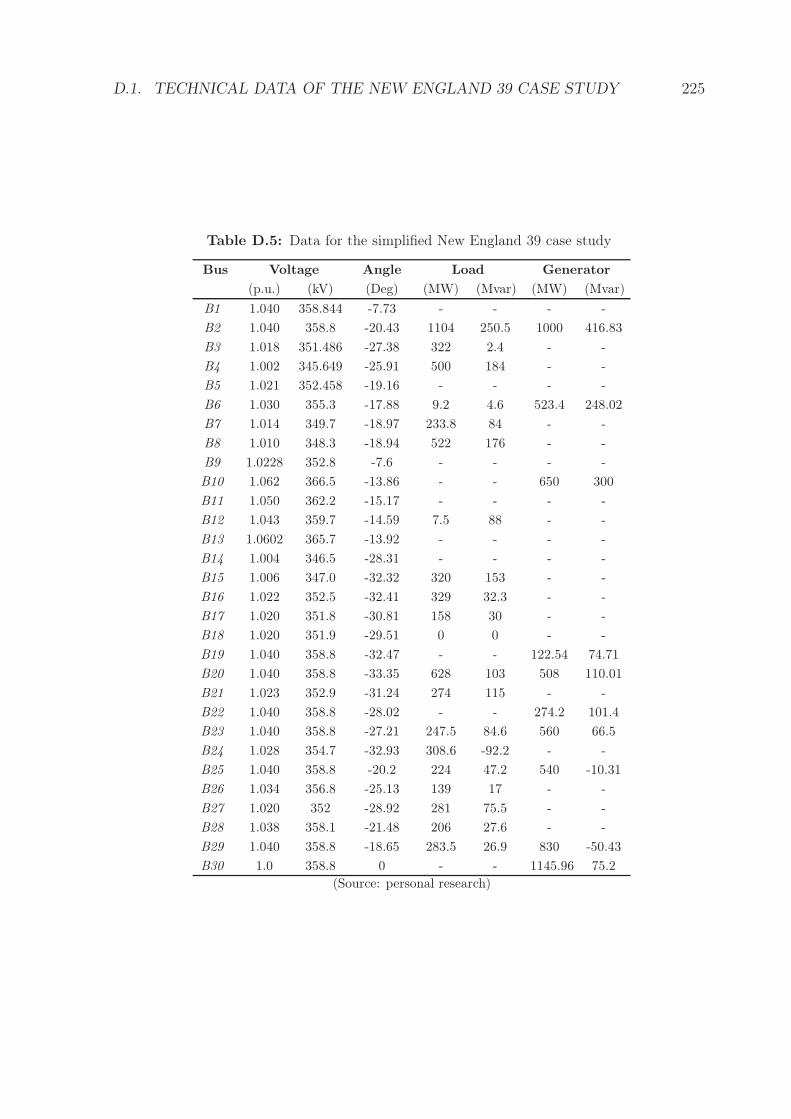
D.1. TECHNICAL DATA OF THE NEW ENGLAND 39 CASE STUDY 225
Table D.5: Data for the simplified New England 39 case study
Bus Voltage Angle Load Generator
(p.u.) (kV) (Deg) (MW) (Mvar) (MW) (Mvar)
B1 1.040 358.844 -7.73 - - - -
B2 1.040 358.8 -20.43 1104 250.5 1000 416.83
B3 1.018 351.486 -27.38 322 2.4 - -
B4 1.002 345.649 -25.91 500 184 - -
B5 1.021 352.458 -19.16 - - - -
B6 1.030 355.3 -17.88 9.2 4.6 523.4 248.02
B7 1.014 349.7 -18.97 233.8 84 - -
B8 1.010 348.3 -18.94 522 176 - -
B9 1.0228 352.8 -7.6 - - - -
B10 1.062 366.5 -13.86 - - 650 300
B11 1.050 362.2 -15.17 - - - -
B12 1.043 359.7 -14.59 7.5 88 - -
B13 1.0602 365.7 -13.92 - - - -
B14 1.004 346.5 -28.31 - - - -
B15 1.006 347.0 -32.32 320 153 - -
B16 1.022 352.5 -32.41 329 32.3 - -
B17 1.020 351.8 -30.81 158 30 - -
B18 1.020 351.9 -29.51 0 0 - -
B19 1.040 358.8 -32.47 - - 122.54 74.71
B20 1.040 358.8 -33.35 628 103 508 110.01
B21 1.023 352.9 -31.24 274 115 - -
B22 1.040 358.8 -28.02 - - 274.2 101.4
B23 1.040 358.8 -27.21 247.5 84.6 560 66.5
B24 1.028 354.7 -32.93 308.6 -92.2 - -
B25 1.040 358.8 -20.2 224 47.2 540 -10.31
B26 1.034 356.8 -25.13 139 17 - -
B27 1.020 352 -28.92 281 75.5 - -
B28 1.038 358.1 -21.48 206 27.6 - -
B29 1.040 358.8 -18.65 283.5 26.9 830 -50.43
B30 1.0 358.8 0 - - 1145.96 75.2
(Source: personal research)
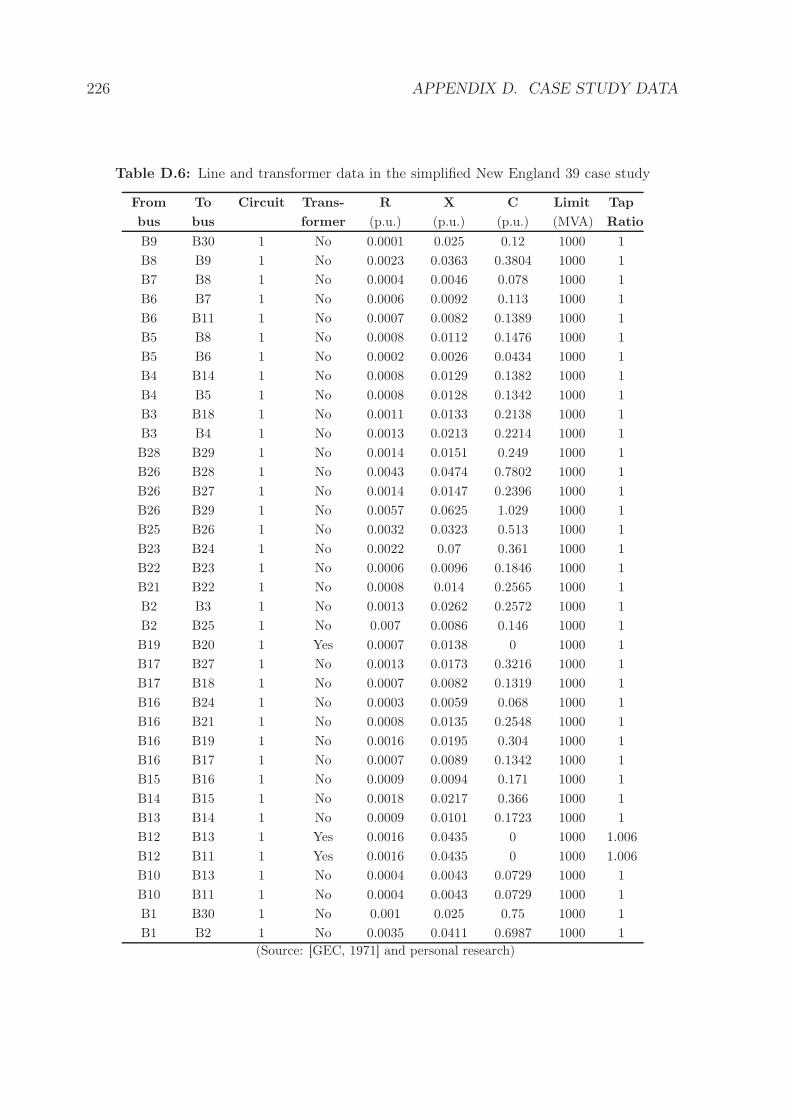
226 APPENDIX D. CASE STUDY DATA
Table D.6: Line and transformer data in the simplified New England 39 case study
From To Circuit Trans- R X C Limit Tap
bus bus former (p.u.) (p.u.) (p.u.) (MVA) Ratio
B9 B30 1 No 0.0001 0.025 0.12 1000 1
B8 B9 1 No 0.0023 0.0363 0.3804 1000 1
B7 B8 1 No 0.0004 0.0046 0.078 1000 1
B6 B7 1 No 0.0006 0.0092 0.113 1000 1
B6 B11 1 No 0.0007 0.0082 0.1389 1000 1
B5 B8 1 No 0.0008 0.0112 0.1476 1000 1
B5 B6 1 No 0.0002 0.0026 0.0434 1000 1
B4 B14 1 No 0.0008 0.0129 0.1382 1000 1
B4 B5 1 No 0.0008 0.0128 0.1342 1000 1
B3 B18 1 No 0.0011 0.0133 0.2138 1000 1
B3 B4 1 No 0.0013 0.0213 0.2214 1000 1
B28 B29 1 No 0.0014 0.0151 0.249 1000 1
B26 B28 1 No 0.0043 0.0474 0.7802 1000 1
B26 B27 1 No 0.0014 0.0147 0.2396 1000 1
B26 B29 1 No 0.0057 0.0625 1.029 1000 1
B25 B26 1 No 0.0032 0.0323 0.513 1000 1
B23 B24 1 No 0.0022 0.07 0.361 1000 1
B22 B23 1 No 0.0006 0.0096 0.1846 1000 1
B21 B22 1 No 0.0008 0.014 0.2565 1000 1
B2 B3 1 No 0.0013 0.0262 0.2572 1000 1
B2 B25 1 No 0.007 0.0086 0.146 1000 1
B19 B20 1 Yes 0.0007 0.0138 0 1000 1
B17 B27 1 No 0.0013 0.0173 0.3216 1000 1
B17 B18 1 No 0.0007 0.0082 0.1319 1000 1
B16 B24 1 No 0.0003 0.0059 0.068 1000 1
B16 B21 1 No 0.0008 0.0135 0.2548 1000 1
B16 B19 1 No 0.0016 0.0195 0.304 1000 1
B16 B17 1 No 0.0007 0.0089 0.1342 1000 1
B15 B16 1 No 0.0009 0.0094 0.171 1000 1
B14 B15 1 No 0.0018 0.0217 0.366 1000 1
B13 B14 1 No 0.0009 0.0101 0.1723 1000 1
B12 B13 1 Yes 0.0016 0.0435 0 1000 1.006
B12 B11 1 Yes 0.0016 0.0435 0 1000 1.006
B10 B13 1 No 0.0004 0.0043 0.0729 1000 1
B10 B11 1 No 0.0004 0.0043 0.0729 1000 1
B1 B30 1 No 0.001 0.025 0.75 1000 1
B1 B2 1 No 0.0035 0.0411 0.6987 1000 1
(Source: [GEC, 1971] and personal research)
D.2. REFERENCES 227
D.2 References
[Athay et al., 1979] Athay, T., Podmore, R., and Virmani, S. (1979). A practicalmethod for the direct analysis of transient stability. IEEE Transactions on PowerApparatus and Systems, pages 573–584.
[GEC, 1971] GEC (1971). Power-system equivalents. final report on electric researchcouncil project rp90-4, general electric company. page Pages: 196.
[Pai, 1989] Pai, M. (1989). Energy Function Analysis for Power System Stability.Kluwer Academic Pub.


