Embed Size (px)
Citation preview
1111
Dr. Edward Altman
NYU Stern School of Business
Models for Predicting Financial
Distress: Z-Score After 50 Years,
What Have We Learned?
GSCFM Program
NACM
Washington, D.C.
June 25, 2018
Sessions 1 & 2
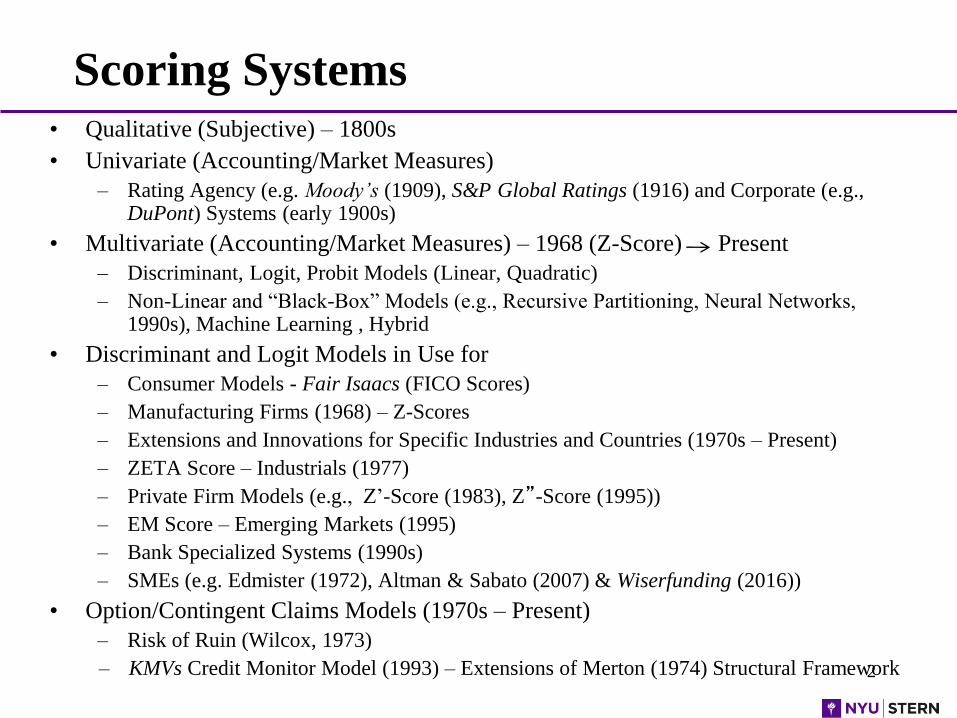
Scoring Systems
2
• Qualitative (Subjective) – 1800s
• Univariate (Accounting/Market Measures)
– Rating Agency (e.g. Moody’s (1909), S&P Global Ratings (1916) and Corporate (e.g., DuPont) Systems (early 1900s)
• Multivariate (Accounting/Market Measures) – 1968 (Z-Score) Present
– Discriminant, Logit, Probit Models (Linear, Quadratic)
– Non-Linear and “Black-Box” Models (e.g., Recursive Partitioning, Neural Networks, 1990s), Machine Learning , Hybrid
• Discriminant and Logit Models in Use for
– Consumer Models - Fair Isaacs (FICO Scores)
– Manufacturing Firms (1968) – Z-Scores
– Extensions and Innovations for Specific Industries and Countries (1970s – Present)
– ZETA Score – Industrials (1977)
– Private Firm Models (e.g., Z’-Score (1983), Z”-Score (1995))
– EM Score – Emerging Markets (1995)
– Bank Specialized Systems (1990s)
– SMEs (e.g. Edmister (1972), Altman & Sabato (2007) & Wiserfunding (2016))
• Option/Contingent Claims Models (1970s – Present)
– Risk of Ruin (Wilcox, 1973)
– KMVs Credit Monitor Model (1993) – Extensions of Merton (1974) Structural Framework
3
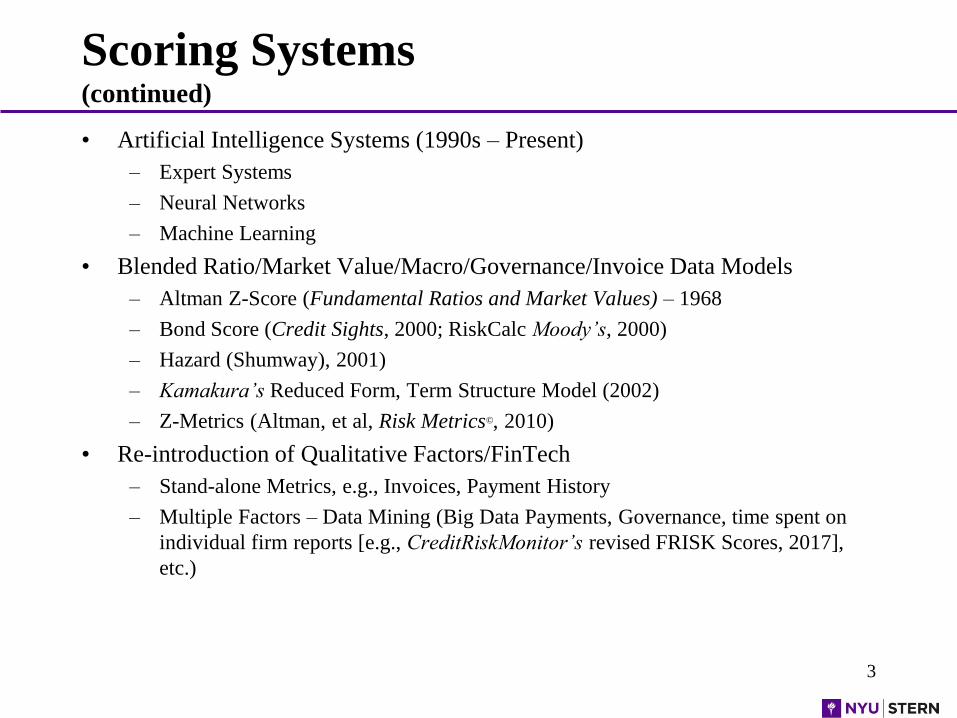
Scoring Systems(continued)
• Artificial Intelligence Systems (1990s – Present)
– Expert Systems
– Neural Networks
– Machine Learning
• Blended Ratio/Market Value/Macro/Governance/Invoice Data Models
– Altman Z-Score (Fundamental Ratios and Market Values) – 1968
– Bond Score (Credit Sights, 2000; RiskCalc Moody’s, 2000)
– Hazard (Shumway), 2001)
– Kamakura’s Reduced Form, Term Structure Model (2002)
– Z-Metrics (Altman, et al, Risk Metrics©, 2010)
• Re-introduction of Qualitative Factors/FinTech
– Stand-alone Metrics, e.g., Invoices, Payment History
– Multiple Factors – Data Mining (Big Data Payments, Governance, time spent on
individual firm reports [e.g., CreditRiskMonitor’s revised FRISK Scores, 2017],
etc.)
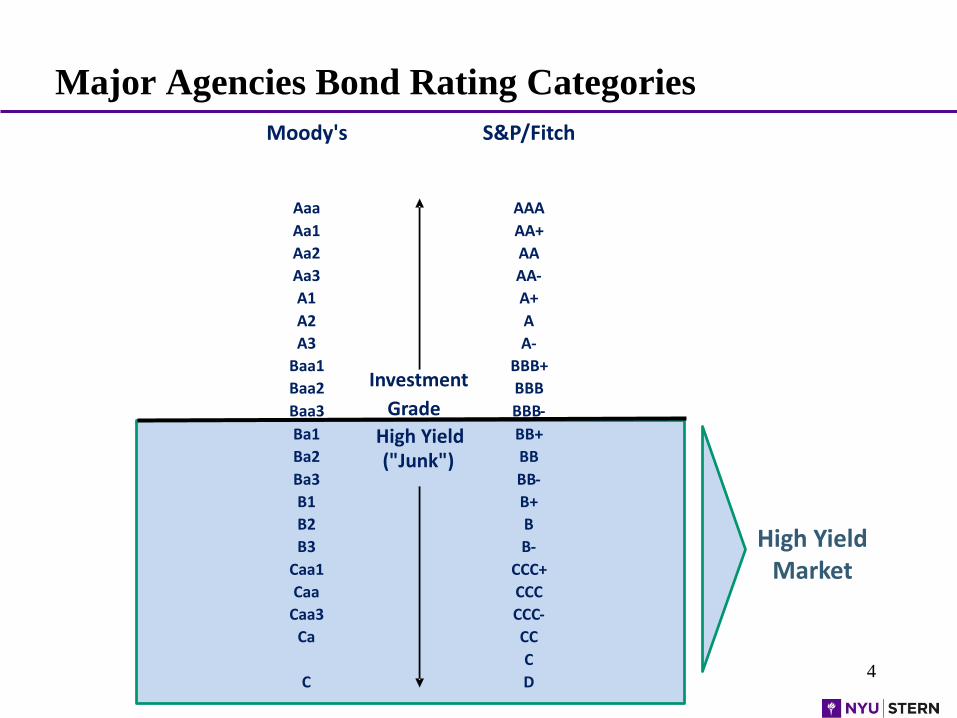
Major Agencies Bond Rating Categories
4
Moody's S&P/Fitch
Aaa AAA
Aa1 AA+
Aa2 AA
Aa3 AA-
A1 A+
A2 A
A3 A-
Baa1 BBB+
Baa2 Investment BBB
Baa3 Grade BBB-
Ba1 High Yield BB+
Ba2 ("Junk") BB
Ba3 BB-
B1 B+
B2 B
B3 B-
Caa1 CCC+
Caa CCC
Caa3 CCC-
Ca CC
C
C D
High YieldMarket
5
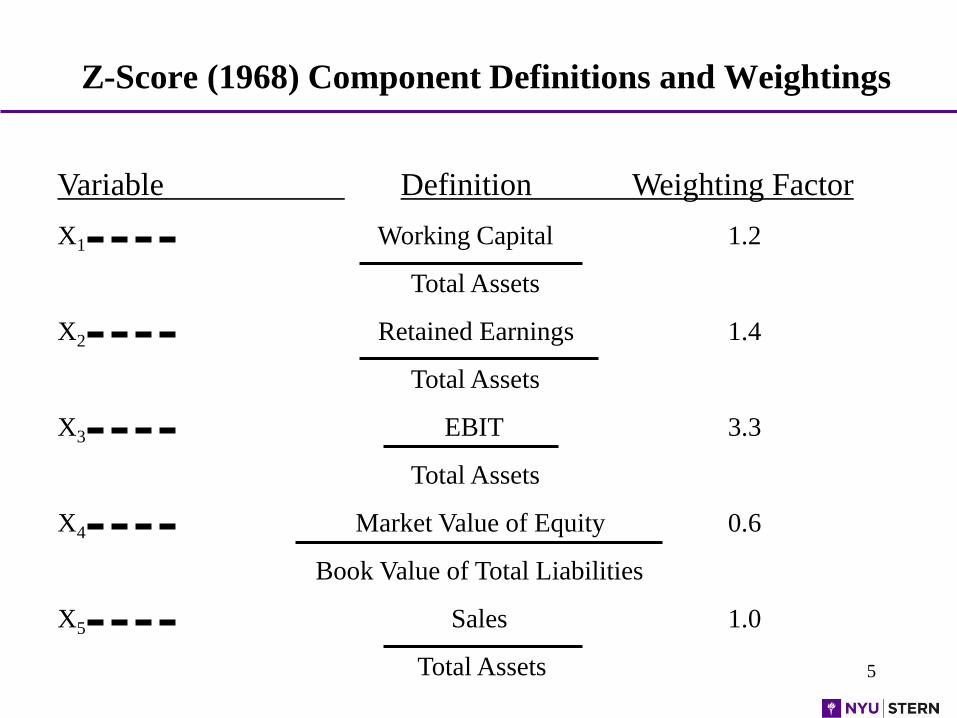
Z-Score (1968) Component Definitions and Weightings
Variable Definition Weighting Factor
X1 Working Capital 1.2
Total Assets
X2 Retained Earnings 1.4
Total Assets
X3 EBIT 3.3
Total Assets
X4 Market Value of Equity 0.6
Book Value of Total Liabilities
X5 Sales 1.0
Total Assets
6
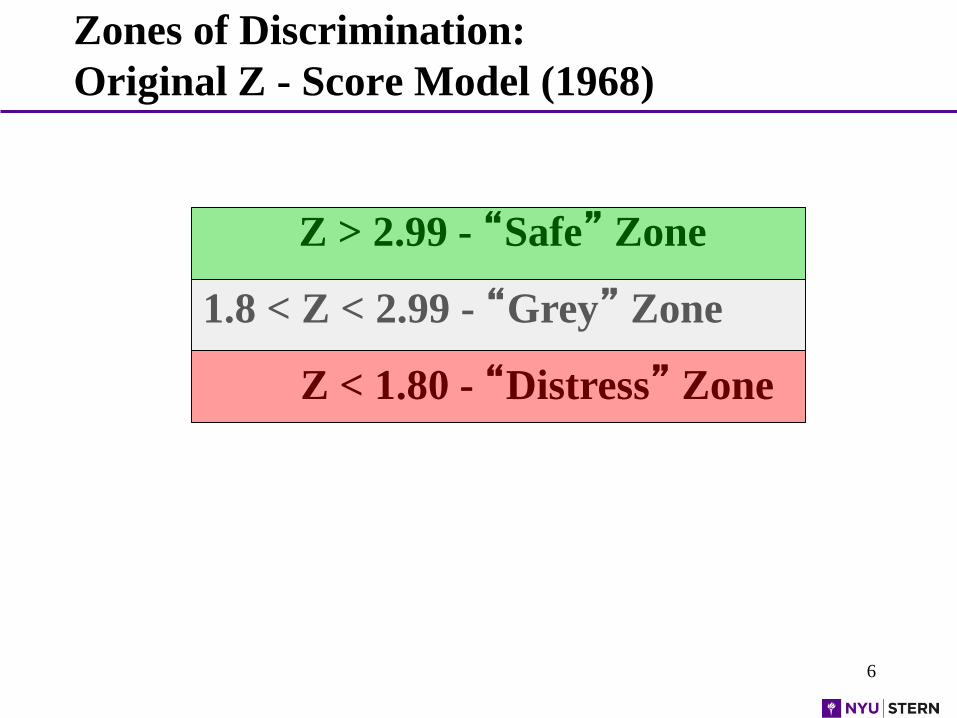
Zones of Discrimination:
Original Z - Score Model (1968)
Z > 2.99 - “Safe” Zone
1.8 < Z < 2.99 - “Grey” Zone
Z < 1.80 - “Distress” Zone
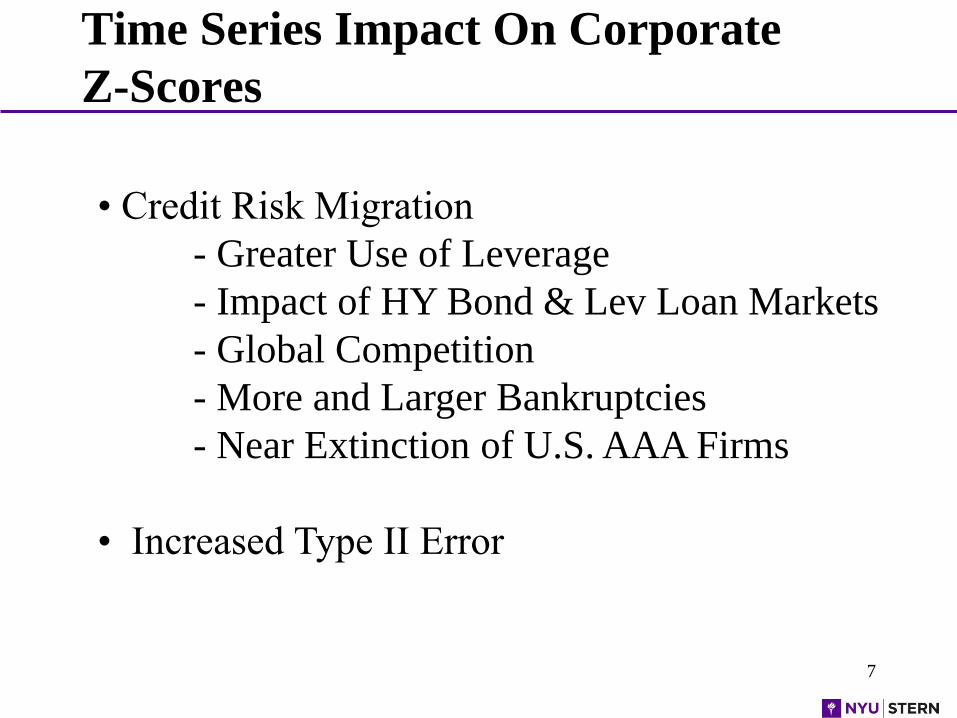
Time Series Impact On Corporate
Z-Scores
7
• Credit Risk Migration
- Greater Use of Leverage
- Impact of HY Bond & Lev Loan Markets
- Global Competition
- More and Larger Bankruptcies
- Near Extinction of U.S. AAA Firms
• Increased Type II Error
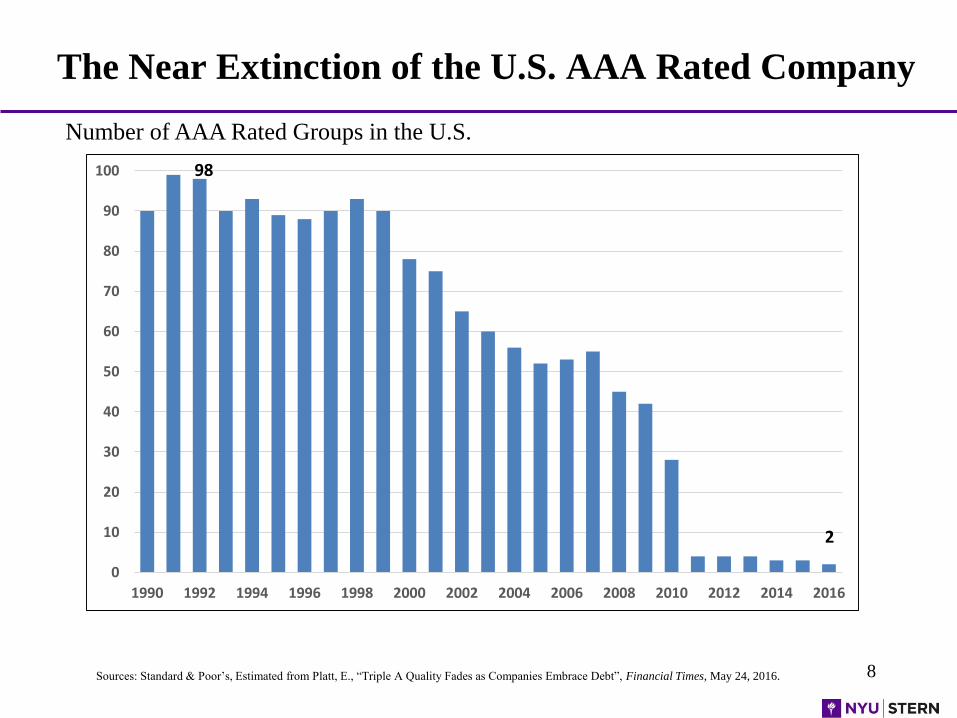
The Near Extinction of the U.S. AAA Rated Company
8Sources: Standard & Poor’s, Estimated from Platt, E., “Triple A Quality Fades as Companies Embrace Debt”, Financial Times, May 24, 2016.
Number of AAA Rated Groups in the U.S.
0
10
20
30
40
50
60
70
80
90
100
1990 1992 1994 1996 1998 2000 2002 2004 2006 2008 2010 2012 2014 2016
2
98
9
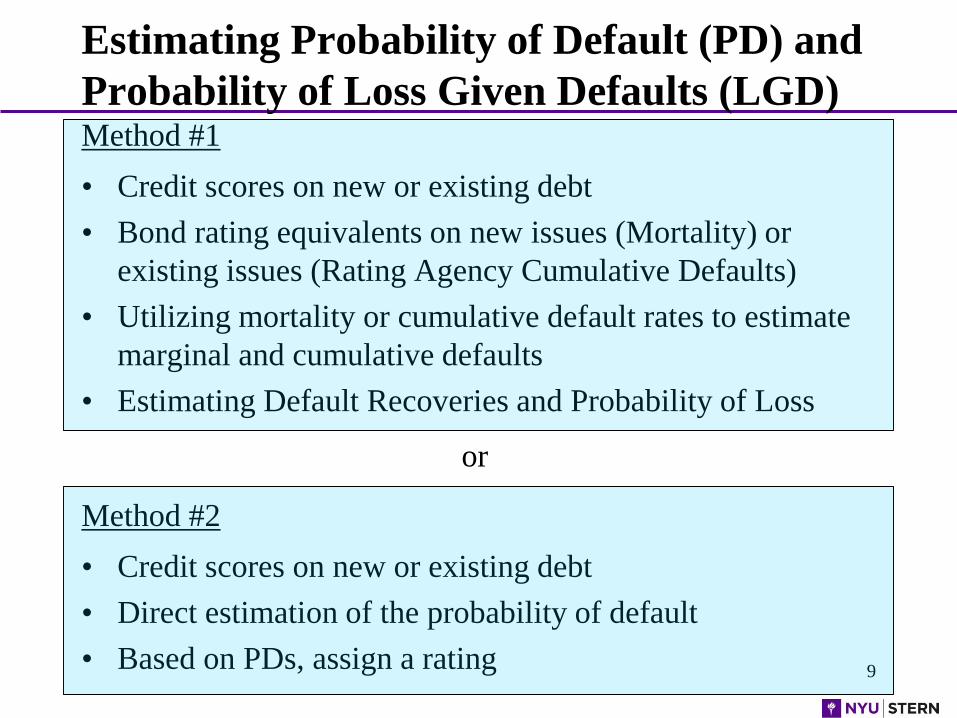
Estimating Probability of Default (PD) and
Probability of Loss Given Defaults (LGD)Method #1
• Credit scores on new or existing debt
• Bond rating equivalents on new issues (Mortality) or
existing issues (Rating Agency Cumulative Defaults)
• Utilizing mortality or cumulative default rates to estimate
marginal and cumulative defaults
• Estimating Default Recoveries and Probability of Loss
Method #2
• Credit scores on new or existing debt
• Direct estimation of the probability of default
• Based on PDs, assign a rating
or
10
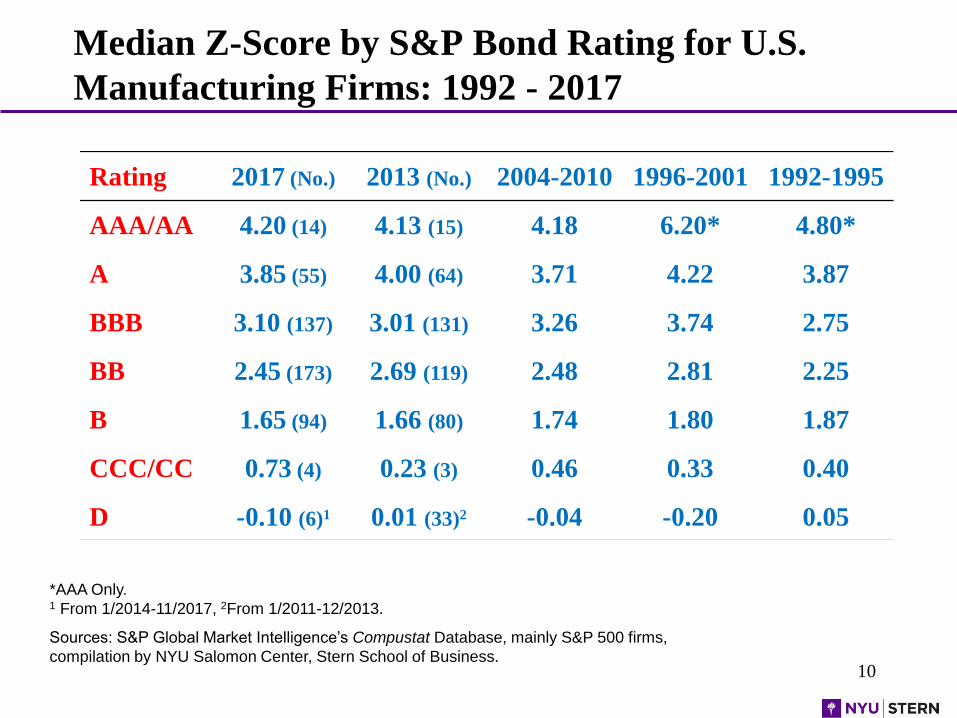
Median Z-Score by S&P Bond Rating for U.S.
Manufacturing Firms: 1992 - 2017
Sources: S&P Global Market Intelligence’s Compustat Database, mainly S&P 500 firms,
compilation by NYU Salomon Center, Stern School of Business.
Rating 2017 (No.) 2013 (No.) 2004-2010 1996-2001 1992-1995
AAA/AA 4.20 (14) 4.13 (15) 4.18 6.20* 4.80*
A 3.85 (55) 4.00 (64) 3.71 4.22 3.87
BBB 3.10 (137) 3.01 (131) 3.26 3.74 2.75
BB 2.45 (173) 2.69 (119) 2.48 2.81 2.25
B 1.65 (94) 1.66 (80) 1.74 1.80 1.87
CCC/CC 0.73 (4) 0.23 (3) 0.46 0.33 0.40
D -0.10 (6)1 0.01 (33)2 -0.04 -0.20 0.05
*AAA Only.1 From 1/2014-11/2017, 2From 1/2011-12/2013.
11
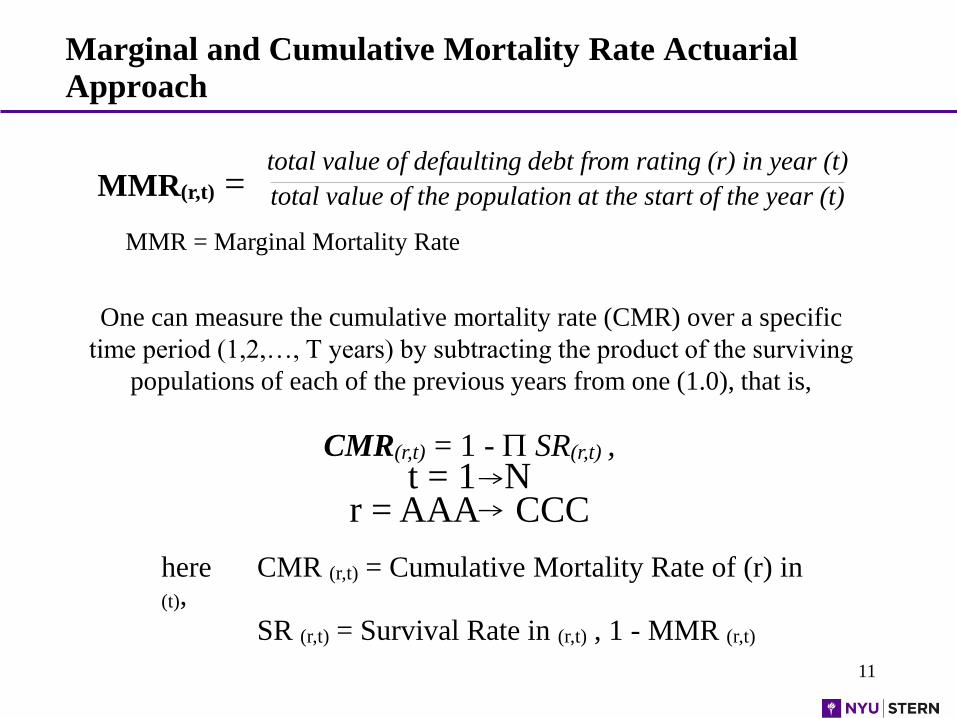
Marginal and Cumulative Mortality Rate Actuarial
Approach
One can measure the cumulative mortality rate (CMR) over a specific
time period (1,2,…, T years) by subtracting the product of the surviving
populations of each of the previous years from one (1.0), that is,
MMR(r,t) =total value of defaulting debt from rating (r) in year (t)
total value of the population at the start of the year (t)
MMR = Marginal Mortality Rate
CMR(r,t) = 1 - SR(r,t) ,t = 1 N
r = AAA CCC
here CMR (r,t) = Cumulative Mortality Rate of (r) in (t),
SR (r,t) = Survival Rate in (r,t) , 1 - MMR (r,t)
12
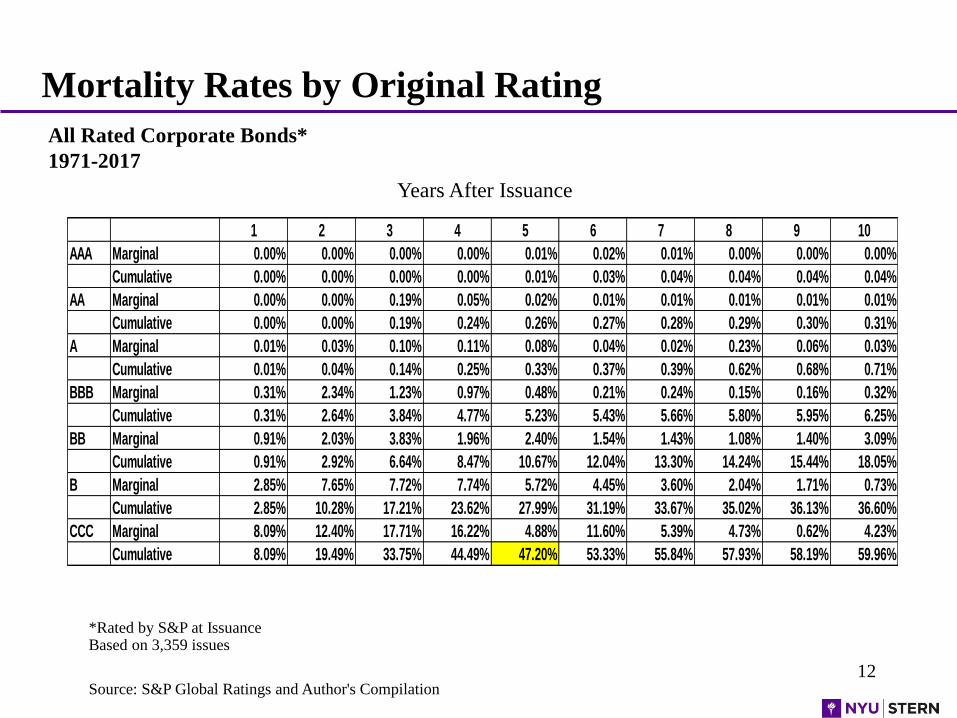
All Rated Corporate Bonds*
1971-2017
Mortality Rates by Original Rating
*Rated by S&P at IssuanceBased on 3,359 issues
Source: S&P Global Ratings and Author's Compilation
Years After Issuance
1 2 3 4 5 6 7 8 9 10
AAA Marginal 0.00% 0.00% 0.00% 0.00% 0.01% 0.02% 0.01% 0.00% 0.00% 0.00%
Cumulative 0.00% 0.00% 0.00% 0.00% 0.01% 0.03% 0.04% 0.04% 0.04% 0.04%
AA Marginal 0.00% 0.00% 0.19% 0.05% 0.02% 0.01% 0.01% 0.01% 0.01% 0.01%
Cumulative 0.00% 0.00% 0.19% 0.24% 0.26% 0.27% 0.28% 0.29% 0.30% 0.31%
A Marginal 0.01% 0.03% 0.10% 0.11% 0.08% 0.04% 0.02% 0.23% 0.06% 0.03%
Cumulative 0.01% 0.04% 0.14% 0.25% 0.33% 0.37% 0.39% 0.62% 0.68% 0.71%
BBB Marginal 0.31% 2.34% 1.23% 0.97% 0.48% 0.21% 0.24% 0.15% 0.16% 0.32%
Cumulative 0.31% 2.64% 3.84% 4.77% 5.23% 5.43% 5.66% 5.80% 5.95% 6.25%
BB Marginal 0.91% 2.03% 3.83% 1.96% 2.40% 1.54% 1.43% 1.08% 1.40% 3.09%
Cumulative 0.91% 2.92% 6.64% 8.47% 10.67% 12.04% 13.30% 14.24% 15.44% 18.05%
B Marginal 2.85% 7.65% 7.72% 7.74% 5.72% 4.45% 3.60% 2.04% 1.71% 0.73%
Cumulative 2.85% 10.28% 17.21% 23.62% 27.99% 31.19% 33.67% 35.02% 36.13% 36.60%
CCC Marginal 8.09% 12.40% 17.71% 16.22% 4.88% 11.60% 5.39% 4.73% 0.62% 4.23%
Cumulative 8.09% 19.49% 33.75% 44.49% 47.20% 53.33% 55.84% 57.93% 58.19% 59.96%
13
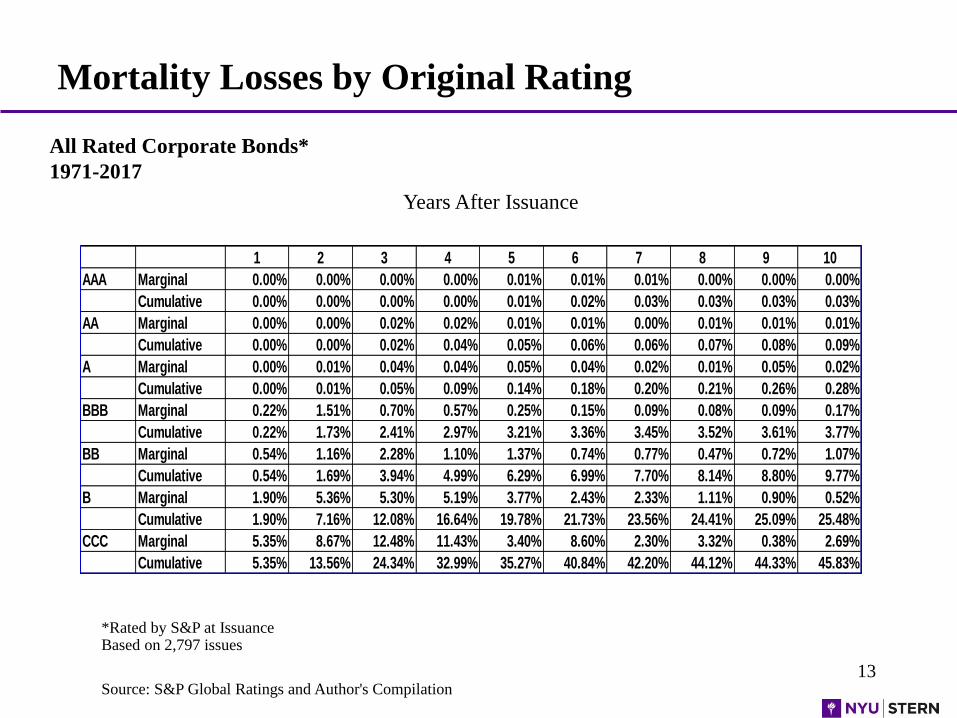
All Rated Corporate Bonds*
1971-2017
Mortality Losses by Original Rating
*Rated by S&P at IssuanceBased on 2,797 issues
Source: S&P Global Ratings and Author's Compilation
Years After Issuance
1 2 3 4 5 6 7 8 9 10
AAA Marginal 0.00% 0.00% 0.00% 0.00% 0.01% 0.01% 0.01% 0.00% 0.00% 0.00%
Cumulative 0.00% 0.00% 0.00% 0.00% 0.01% 0.02% 0.03% 0.03% 0.03% 0.03%
AA Marginal 0.00% 0.00% 0.02% 0.02% 0.01% 0.01% 0.00% 0.01% 0.01% 0.01%
Cumulative 0.00% 0.00% 0.02% 0.04% 0.05% 0.06% 0.06% 0.07% 0.08% 0.09%
A Marginal 0.00% 0.01% 0.04% 0.04% 0.05% 0.04% 0.02% 0.01% 0.05% 0.02%
Cumulative 0.00% 0.01% 0.05% 0.09% 0.14% 0.18% 0.20% 0.21% 0.26% 0.28%
BBB Marginal 0.22% 1.51% 0.70% 0.57% 0.25% 0.15% 0.09% 0.08% 0.09% 0.17%
Cumulative 0.22% 1.73% 2.41% 2.97% 3.21% 3.36% 3.45% 3.52% 3.61% 3.77%
BB Marginal 0.54% 1.16% 2.28% 1.10% 1.37% 0.74% 0.77% 0.47% 0.72% 1.07%
Cumulative 0.54% 1.69% 3.94% 4.99% 6.29% 6.99% 7.70% 8.14% 8.80% 9.77%
B Marginal 1.90% 5.36% 5.30% 5.19% 3.77% 2.43% 2.33% 1.11% 0.90% 0.52%
Cumulative 1.90% 7.16% 12.08% 16.64% 19.78% 21.73% 23.56% 24.41% 25.09% 25.48%
CCC Marginal 5.35% 8.67% 12.48% 11.43% 3.40% 8.60% 2.30% 3.32% 0.38% 2.69%
Cumulative 5.35% 13.56% 24.34% 32.99% 35.27% 40.84% 42.20% 44.12% 44.33% 45.83%
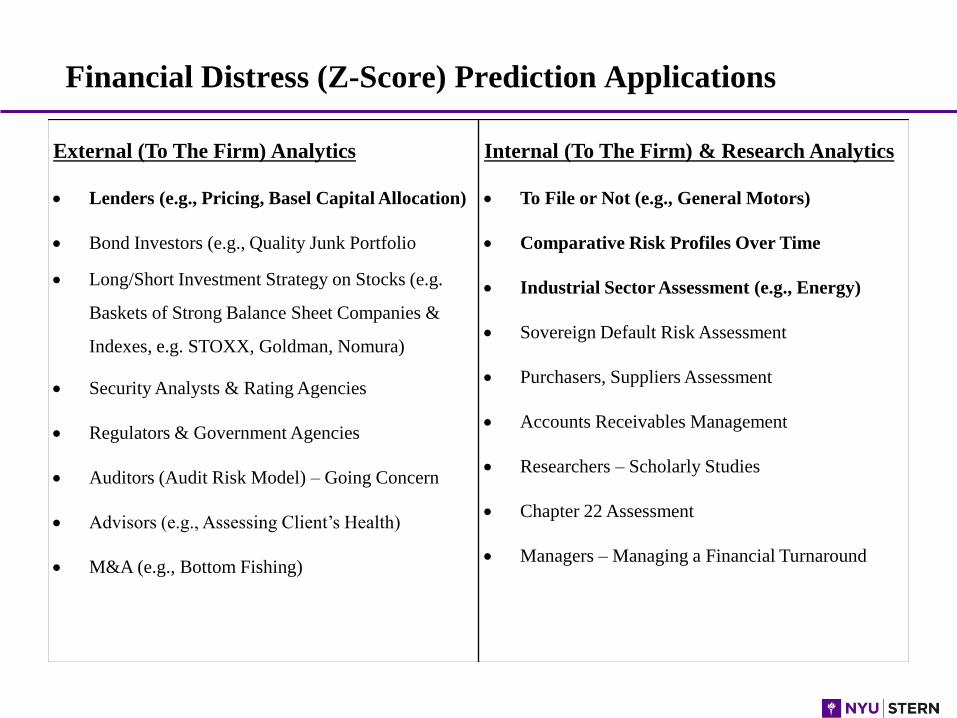
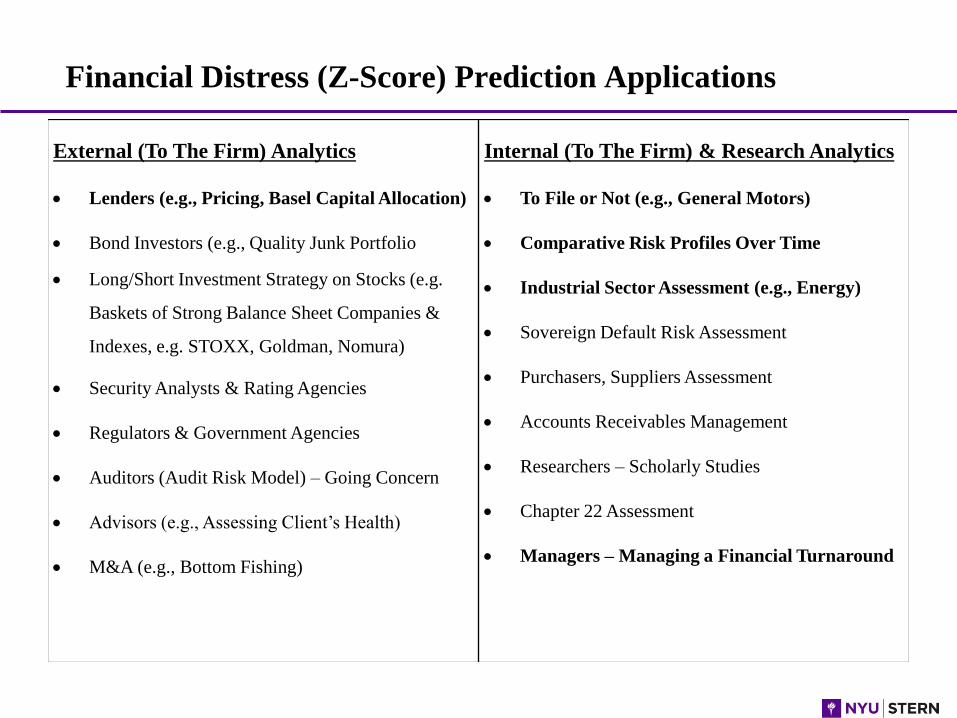
Financial Distress (Z-Score) Prediction Applications
External (To The Firm) Analytics
• Lenders (e.g., Pricing, Basel Capital Allocation)
• Bond Investors (e.g., Quality Junk Portfolio
• Long/Short Investment Strategy on Stocks (e.g.
Baskets of Strong Balance Sheet Companies &
Indexes, e.g. STOXX, Goldman, Nomura)
• Security Analysts & Rating Agencies
• Regulators & Government Agencies
• Auditors (Audit Risk Model) – Going Concern
• Advisors (e.g., Assessing Client’s Health)
• M&A (e.g., Bottom Fishing)
Internal (To The Firm) & Research Analytics
• To File or Not (e.g., General Motors)
• Comparative Risk Profiles Over Time
• Industrial Sector Assessment (e.g., Energy)
• Sovereign Default Risk Assessment
• Purchasers, Suppliers Assessment
• Accounts Receivables Management
• Researchers – Scholarly Studies
• Chapter 22 Assessment
• Managers – Managing a Financial Turnaround
15
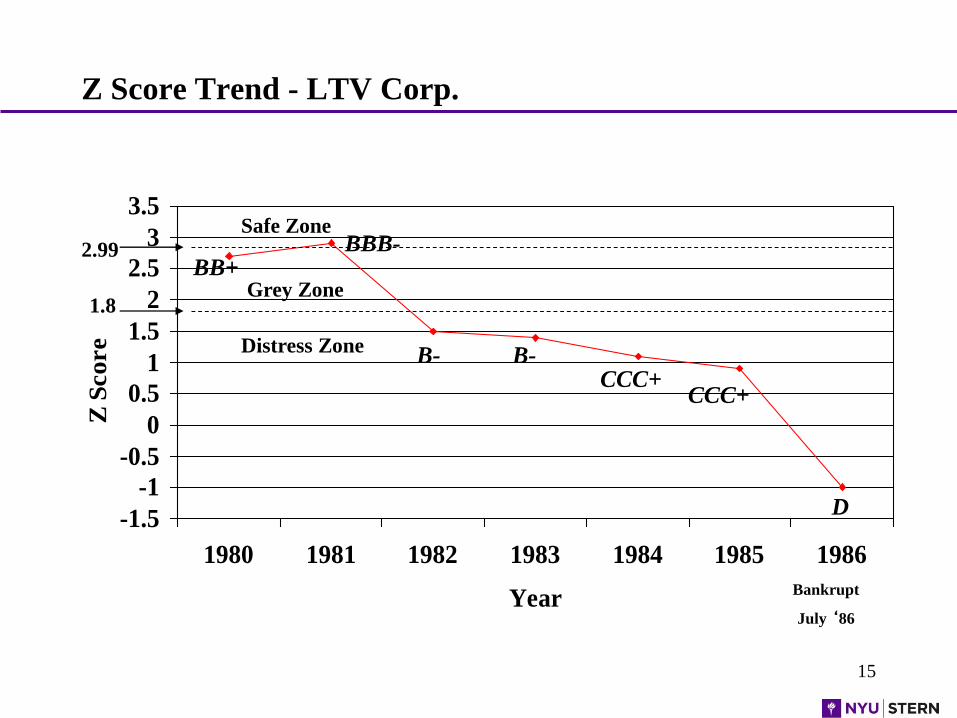
Z Score Trend - LTV Corp.
-1.5
-1
-0.5
0
0.5
1
1.5
2
2.5
3
3.5
1980 1981 1982 1983 1984 1985 1986
Year
Z S
co
re
Grey Zone
Bankrupt
July ‘86
Safe Zone
Distress Zone
2.99
1.8
BB+BBB-
B- B-CCC+
CCC+
D
16
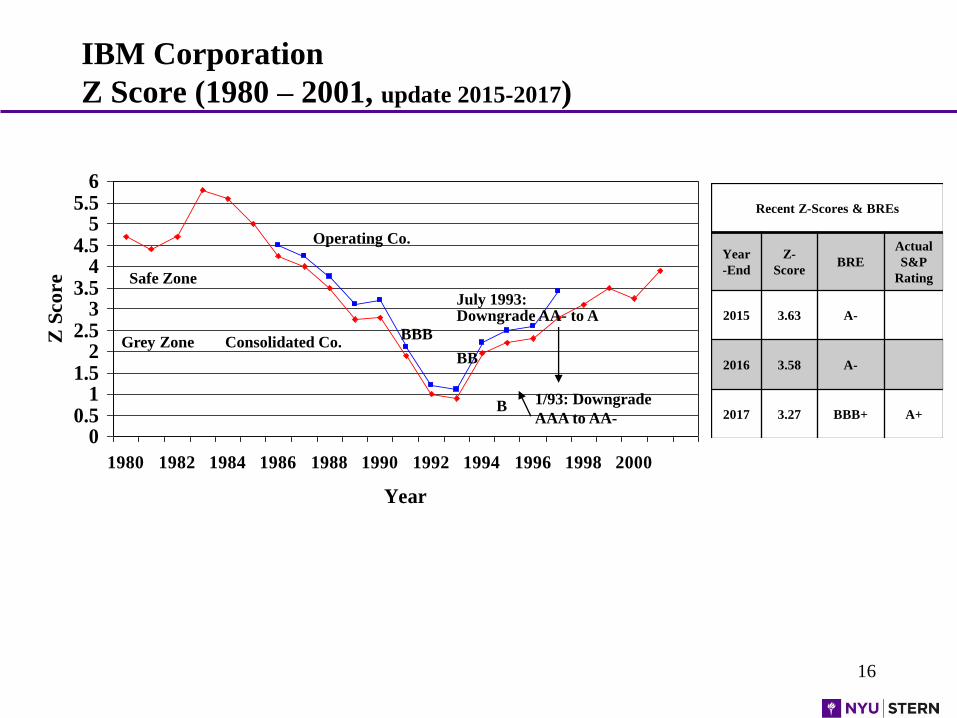
IBM Corporation
Z Score (1980 – 2001, update 2015-2017)
00.5
11.5
22.5
33.5
44.5
55.5
6
1980 1982 1984 1986 1988 1990 1992 1994 1996 1998 2000
Year
Z S
co
re
Operating Co.
Safe Zone
Consolidated Co.Grey ZoneBBB
BB
B 1/93: Downgrade
AAA to AA-
July 1993: Downgrade AA- to A
Recent Z-Scores & BREs
Year
-End
Z-
Score BRE
Actual
S&P
Rating
2015 3.63 A-
2016 3.58 A-
2017 3.27 BBB+ A+
17Note: Consolidated Annual Results. Data Source: S&P Global Market Intelligence’s S&P Capital IQ platform, Bloomberg., Edgar
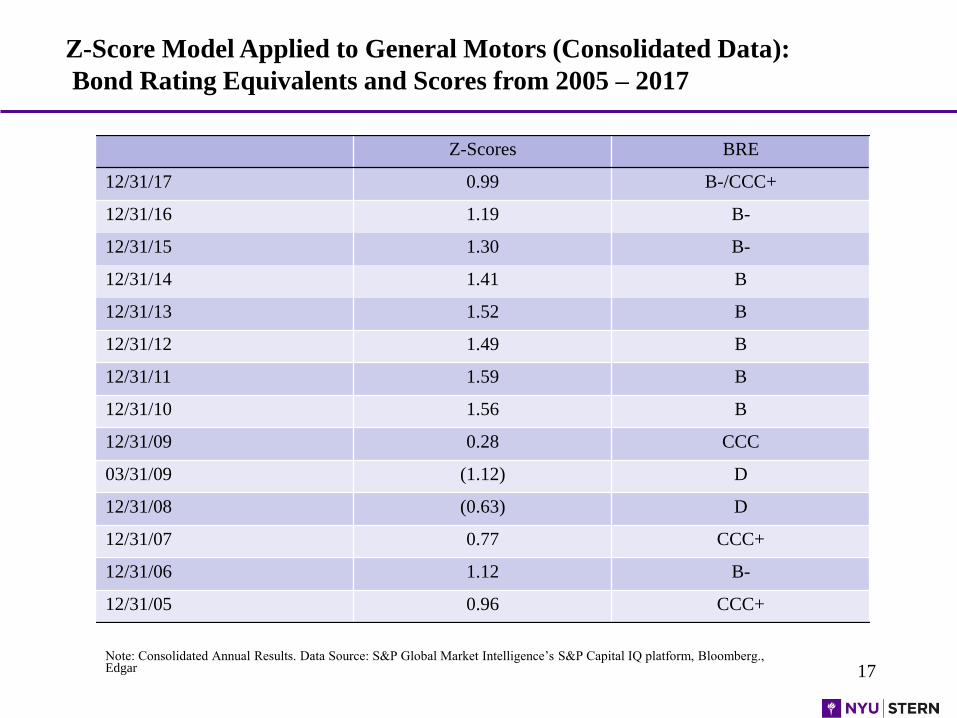
Z-Scores BRE
12/31/17 0.99 B-/CCC+
12/31/16 1.19 B-
12/31/15 1.30 B-
12/31/14 1.41 B
12/31/13 1.52 B
12/31/12 1.49 B
12/31/11 1.59 B
12/31/10 1.56 B
12/31/09 0.28 CCC
03/31/09 (1.12) D
12/31/08 (0.63) D
12/31/07 0.77 CCC+
12/31/06 1.12 B-
12/31/05 0.96 CCC+
Z-Score Model Applied to General Motors (Consolidated Data):
Bond Rating Equivalents and Scores from 2005 – 2017
18
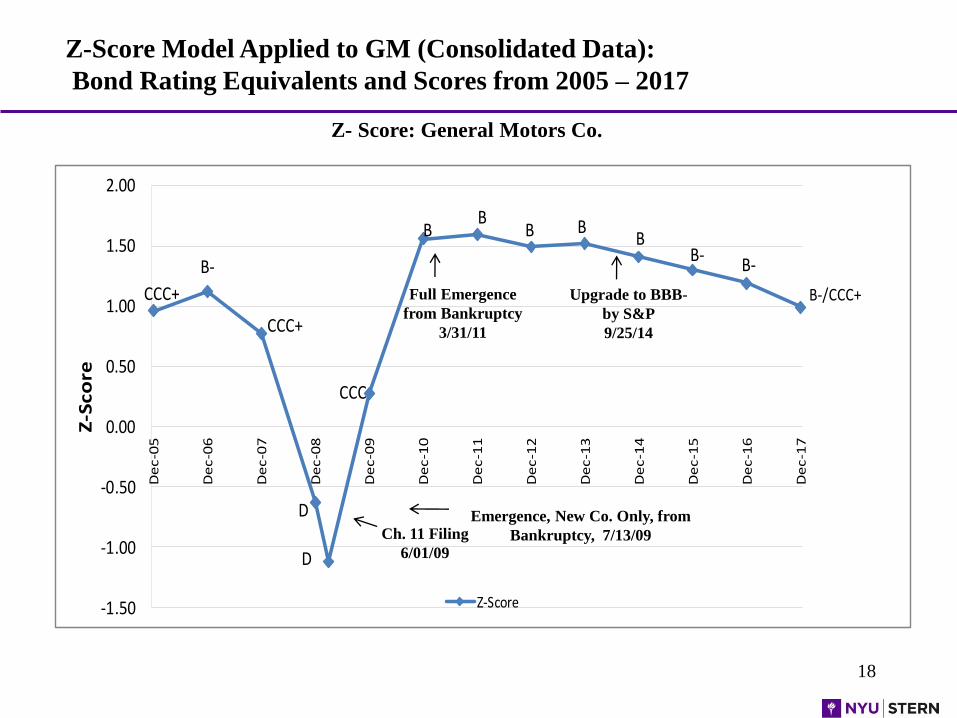
Z-Score Model Applied to GM (Consolidated Data):
Bond Rating Equivalents and Scores from 2005 – 2017
Z- Score: General Motors Co.
CCC+
B-
CCC+
D
CCC
BB
D
B BB
B-B-
B-/CCC+
-1.50
-1.00
-0.50
0.00
0.50
1.00
1.50
2.00
De
c-0
5
De
c-0
6
De
c-0
7
De
c-0
8
De
c-0
9
De
c-1
0
De
c-1
1
De
c-1
2
De
c-1
3
De
c-1
4
De
c-1
5
De
c-1
6
De
c-1
7
Z-S
co
re
Z-Score
Full Emergence
from Bankruptcy
3/31/11
Upgrade to BBB-
by S&P
9/25/14
Ch. 11 Filing
6/01/09
Emergence, New Co. Only, from
Bankruptcy, 7/13/09
19
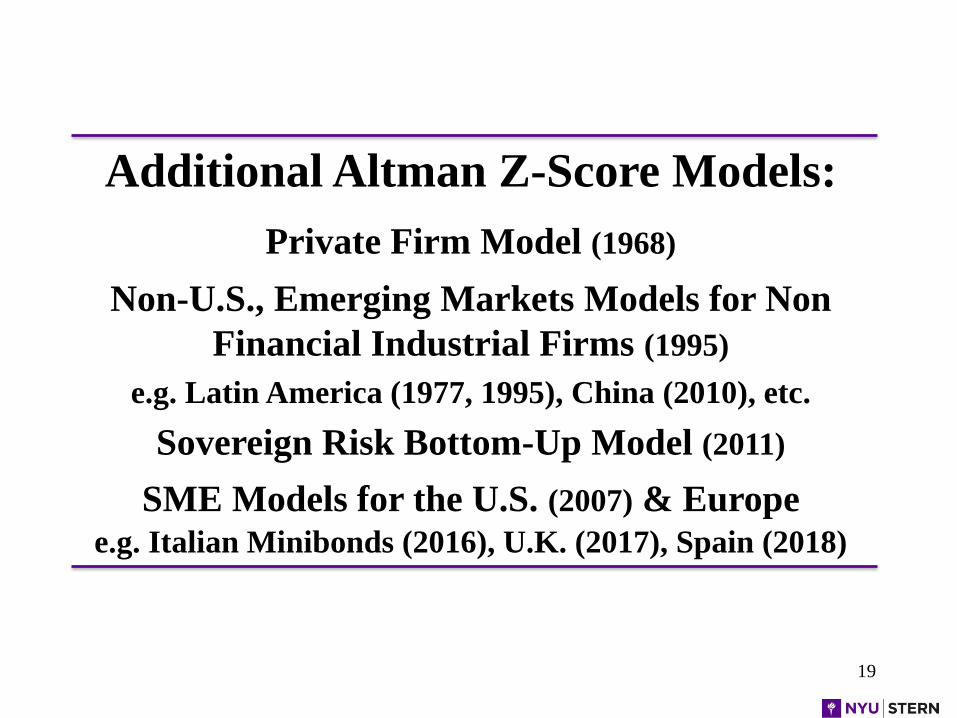
Additional Altman Z-Score Models:
Private Firm Model (1968)
Non-U.S., Emerging Markets Models for Non
Financial Industrial Firms (1995)
e.g. Latin America (1977, 1995), China (2010), etc.
Sovereign Risk Bottom-Up Model (2011)
SME Models for the U.S. (2007) & Europe e.g. Italian Minibonds (2016), U.K. (2017), Spain (2018)

20
Italian High-Yield Bond Market
Our Work with U.S. H.Y. Bond Market, Classis Capital,
Italian Borsa, & Wiserfunding
Providing a Credit Market Discipline to the Italian Mini-bond
Market
Models to Assess the Risk & Return Trade-Off for Investors &
Issuers of Mini-bonds
21
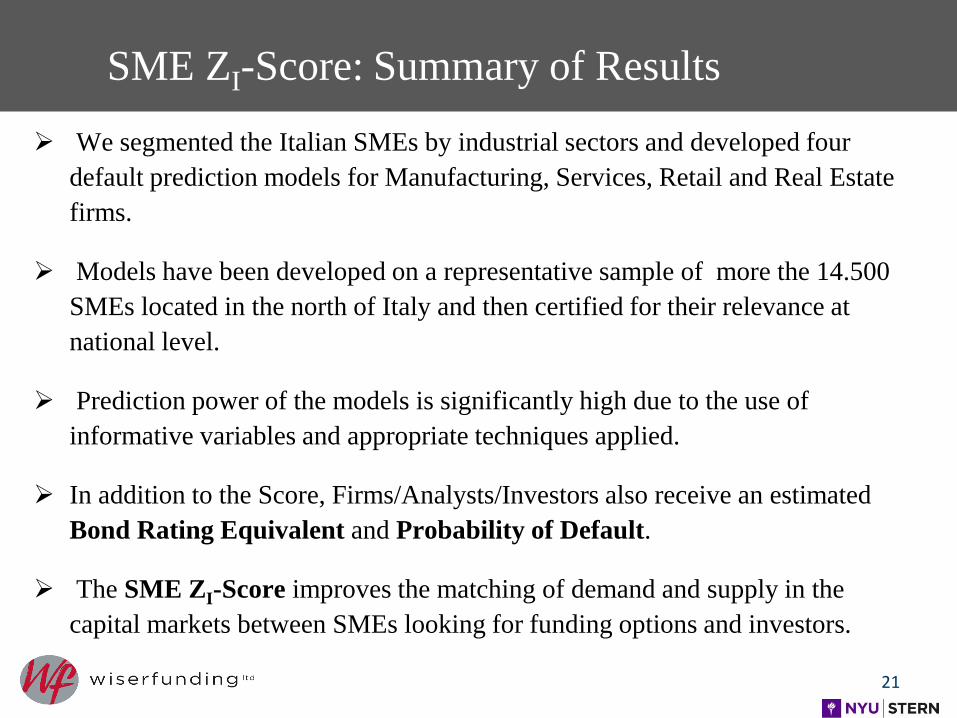
SME ZI-Score: Summary of Results
➢ We segmented the Italian SMEs by industrial sectors and developed four
default prediction models for Manufacturing, Services, Retail and Real Estate
firms.
➢ Models have been developed on a representative sample of more the 14.500
SMEs located in the north of Italy and then certified for their relevance at
national level.
➢ Prediction power of the models is significantly high due to the use of
informative variables and appropriate techniques applied.
➢ In addition to the Score, Firms/Analysts/Investors also receive an estimated
Bond Rating Equivalent and Probability of Default.
➢ The SME ZI-Score improves the matching of demand and supply in the
capital markets between SMEs looking for funding options and investors.
22
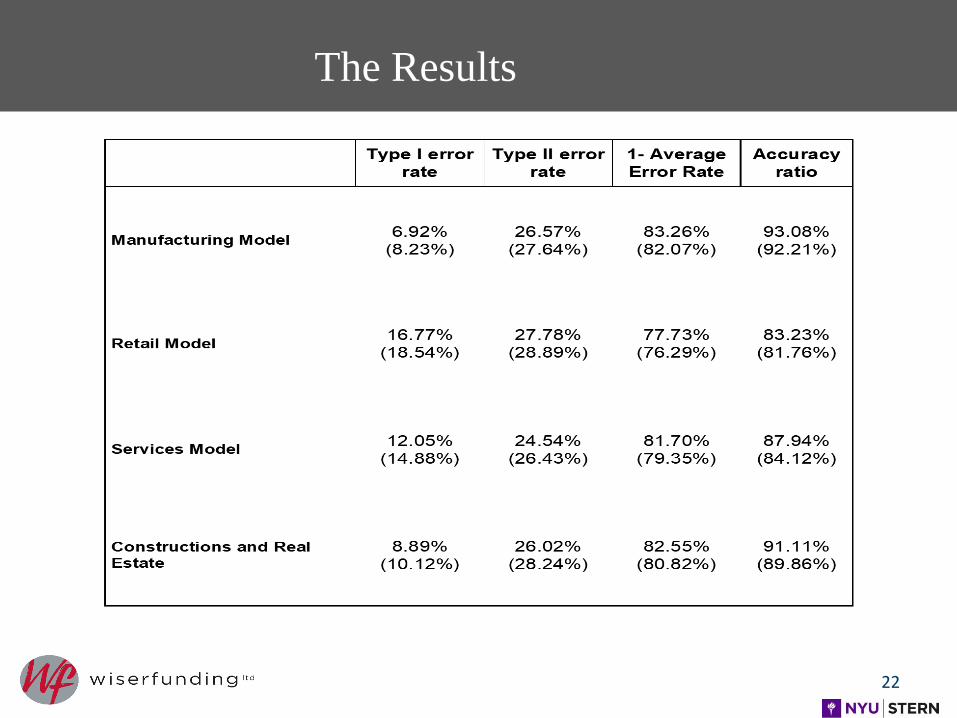
The Results
23
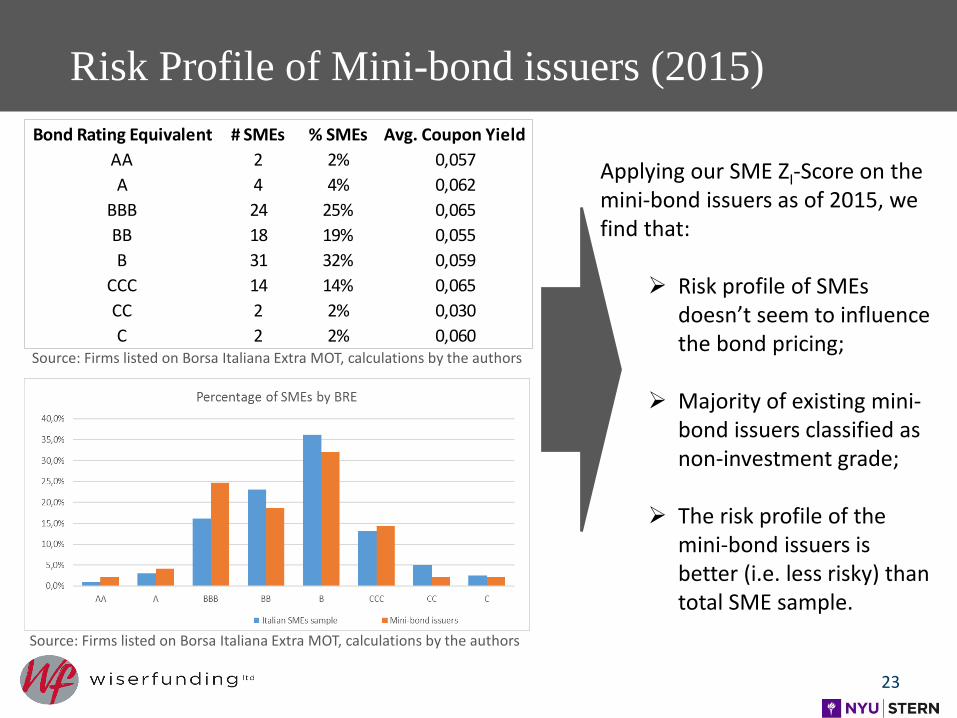
Risk Profile of Mini-bond issuers (2015)
Source: Firms listed on Borsa Italiana Extra MOT, calculations by the authors
Source: Firms listed on Borsa Italiana Extra MOT, calculations by the authors
Bond Rating Equivalent # SMEs % SMEs Avg. Coupon Yield
AA 2 2% 0,057
A 4 4% 0,062
BBB 24 25% 0,065
BB 18 19% 0,055
B 31 32% 0,059
CCC 14 14% 0,065
CC 2 2% 0,030
C 2 2% 0,060
Applying our SME ZI-Score on the mini-bond issuers as of 2015, we find that:
➢ Risk profile of SMEs doesn’t seem to influence the bond pricing;
➢ Majority of existing mini-bond issuers classified as non-investment grade;
➢ The risk profile of the mini-bond issuers is better (i.e. less risky) than total SME sample.
24
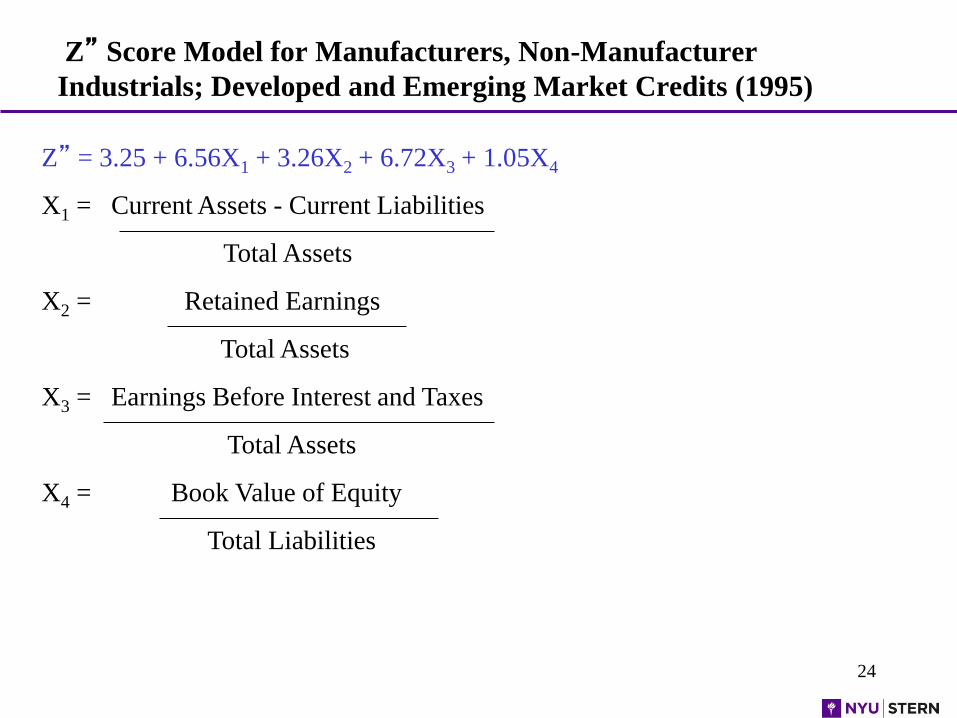
Z” Score Model for Manufacturers, Non-Manufacturer
Industrials; Developed and Emerging Market Credits (1995)
Z” = 3.25 + 6.56X1 + 3.26X2 + 6.72X3 + 1.05X4
X1 = Current Assets - Current Liabilities
Total Assets
X2 = Retained Earnings
Total Assets
X3 = Earnings Before Interest and Taxes
Total Assets
X4 = Book Value of Equity
Total Liabilities
25
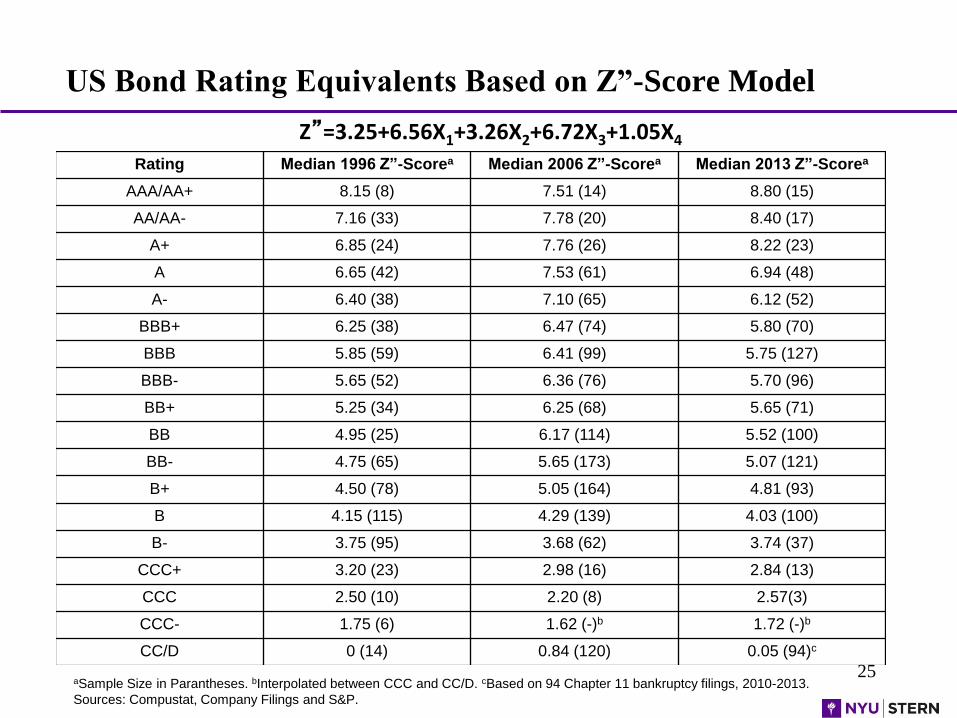
US Bond Rating Equivalents Based on Z”-Score Model
Z”=3.25+6.56X1+3.26X2+6.72X3+1.05X4
aSample Size in Parantheses. bInterpolated between CCC and CC/D. cBased on 94 Chapter 11 bankruptcy filings, 2010-2013.
Sources: Compustat, Company Filings and S&P.
Rating Median 1996 Z”-Scorea Median 2006 Z”-Scorea Median 2013 Z”-Scorea
AAA/AA+ 8.15 (8) 7.51 (14) 8.80 (15)
AA/AA- 7.16 (33) 7.78 (20) 8.40 (17)
A+ 6.85 (24) 7.76 (26) 8.22 (23)
A 6.65 (42) 7.53 (61) 6.94 (48)
A- 6.40 (38) 7.10 (65) 6.12 (52)
BBB+ 6.25 (38) 6.47 (74) 5.80 (70)
BBB 5.85 (59) 6.41 (99) 5.75 (127)
BBB- 5.65 (52) 6.36 (76) 5.70 (96)
BB+ 5.25 (34) 6.25 (68) 5.65 (71)
BB 4.95 (25) 6.17 (114) 5.52 (100)
BB- 4.75 (65) 5.65 (173) 5.07 (121)
B+ 4.50 (78) 5.05 (164) 4.81 (93)
B 4.15 (115) 4.29 (139) 4.03 (100)
B- 3.75 (95) 3.68 (62) 3.74 (37)
CCC+ 3.20 (23) 2.98 (16) 2.84 (13)
CCC 2.50 (10) 2.20 (8) 2.57(3)
CCC- 1.75 (6) 1.62 (-)b 1.72 (-)b
CC/D 0 (14) 0.84 (120) 0.05 (94)c
26
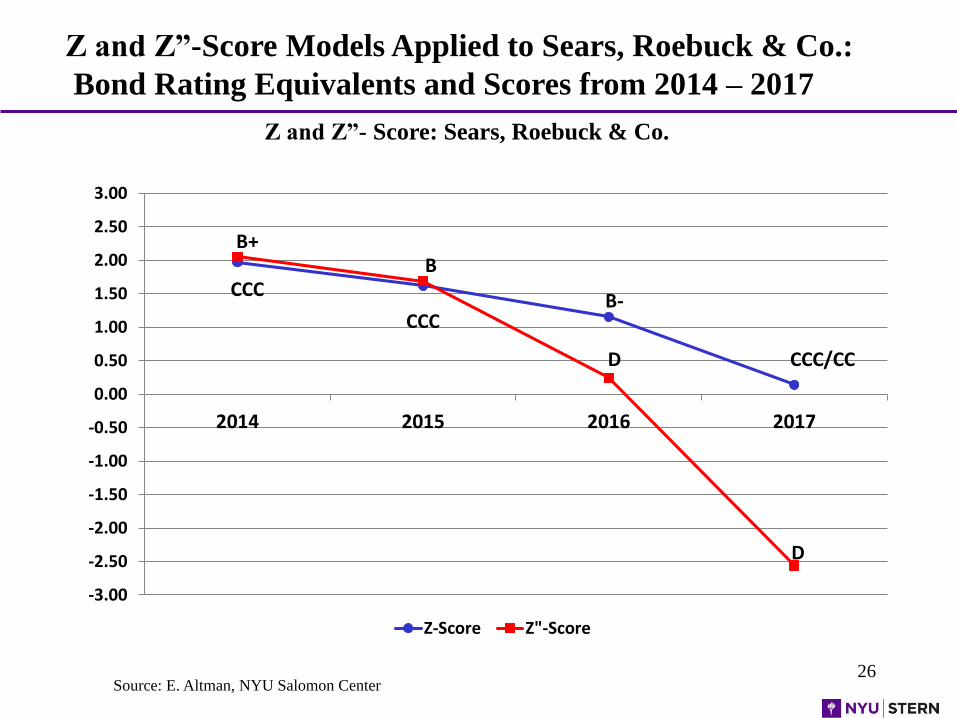
Z and Z”-Score Models Applied to Sears, Roebuck & Co.:
Bond Rating Equivalents and Scores from 2014 – 2017
Z and Z”- Score: Sears, Roebuck & Co.
-3.00
-2.50
-2.00
-1.50
-1.00
-0.50
0.00
0.50
1.00
1.50
2.00
2.50
3.00
2014 2015 2016 2017
Z-Score Z"-Score
D
B+B
B-
D
CCC
CCC
Source: E. Altman, NYU Salomon Center
CCC/CC
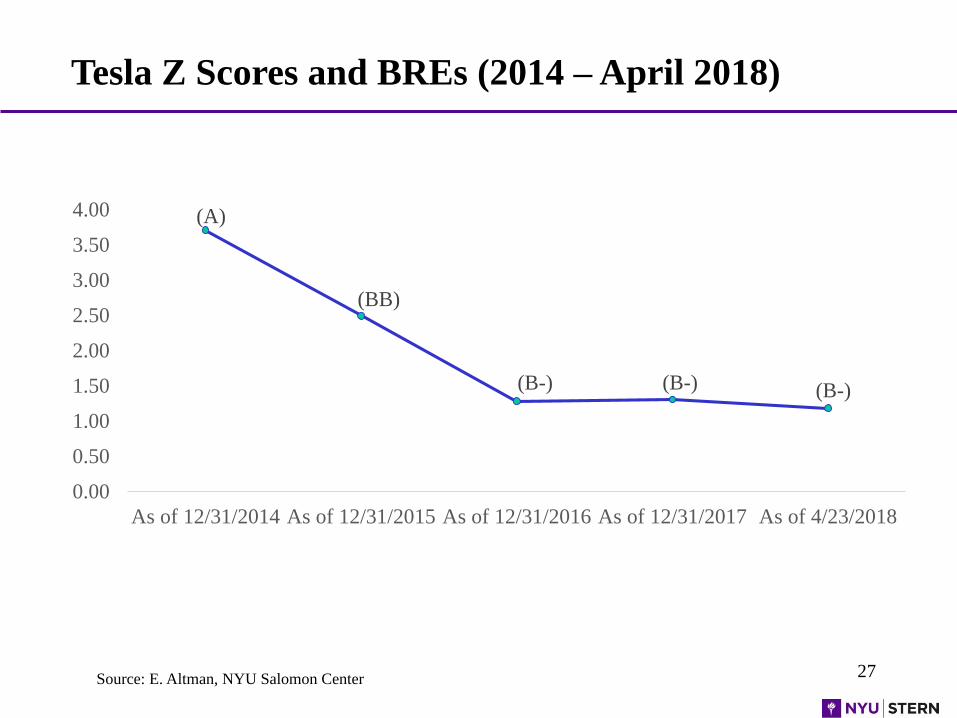
Tesla Z Scores and BREs (2014 – April 2018)
27
(A)
(BB)
(B-) (B-) (B-)
0.00
0.50
1.00
1.50
2.00
2.50
3.00
3.50
4.00
As of 12/31/2014 As of 12/31/2015 As of 12/31/2016 As of 12/31/2017 As of 4/23/2018
Source: E. Altman, NYU Salomon Center
MANAGING A FINANCIAL TURNAROUND:
APPLICATIONS OF THE Z-SCORE MODEL
THE GTI CASE
28
Financial Distress (Z-Score) Prediction Applications
External (To The Firm) Analytics
• Lenders (e.g., Pricing, Basel Capital Allocation)
• Bond Investors (e.g., Quality Junk Portfolio
• Long/Short Investment Strategy on Stocks (e.g.
Baskets of Strong Balance Sheet Companies &
Indexes, e.g. STOXX, Goldman, Nomura)
• Security Analysts & Rating Agencies
• Regulators & Government Agencies
• Auditors (Audit Risk Model) – Going Concern
• Advisors (e.g., Assessing Client’s Health)
• M&A (e.g., Bottom Fishing)
Internal (To The Firm) & Research Analytics
• To File or Not (e.g., General Motors)
• Comparative Risk Profiles Over Time
• Industrial Sector Assessment (e.g., Energy)
• Sovereign Default Risk Assessment
• Purchasers, Suppliers Assessment
• Accounts Receivables Management
• Researchers – Scholarly Studies
• Chapter 22 Assessment
• Managers – Managing a Financial Turnaround
QUALITY JUNK STRATEGY
30
0
500
1,000
1,500
2,000
2,500
3,000
3,500
4,000
4,500
5,000
0.00 1.00 2.00 3.00 4.00 5.00 6.00 7.00 8.00
OA
S (
bp
)
Z"-Score (BRE)BBB-BB
A
B
C
D
A
B
C
D
B-CCC- BBB-BB
A
B
C
D
A
B
C
D
B-CCC-
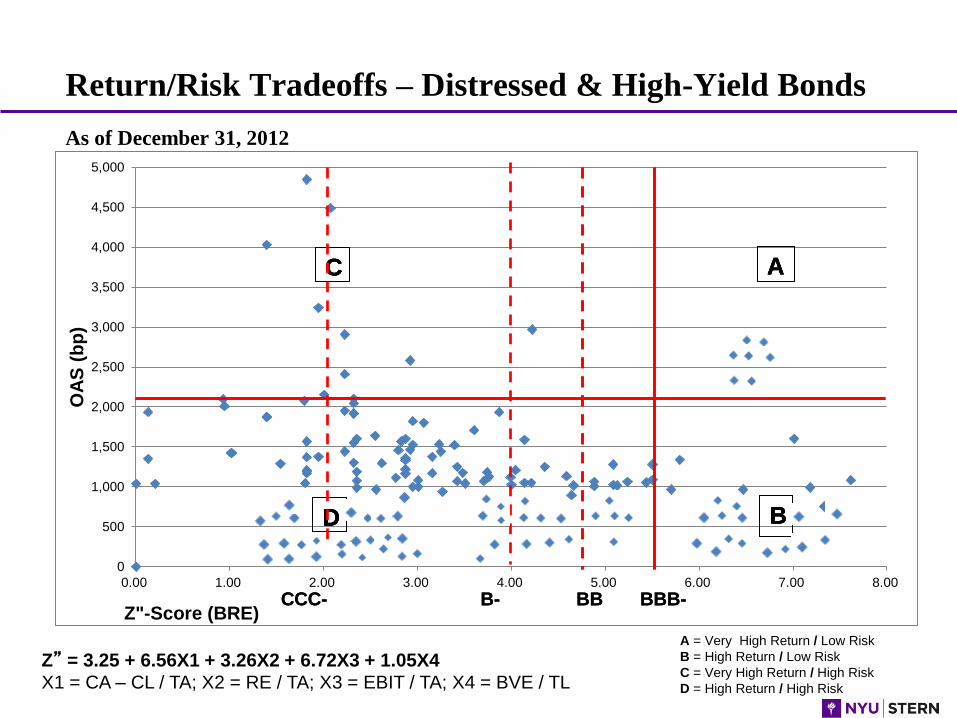
Return/Risk Tradeoffs – Distressed & High-Yield Bonds
Z” = 3.25 + 6.56X1 + 3.26X2 + 6.72X3 + 1.05X4
X1 = CA – CL / TA; X2 = RE / TA; X3 = EBIT / TA; X4 = BVE / TL
A = Very High Return / Low Risk
B = High Return / Low Risk
C = Very High Return / High Risk
D = High Return / High Risk
As of December 31, 2012
Objectives
• To demonstrate that specific management tools which work are
available in crisis situations
• To illustrate that predictive models can be turned “inside out” and used
as internal management tools to, in effect, reverse their predictions
• To illustrate an interactive, as opposed to a passive, approach to
financial decision making
32
Physical Facilities & Financial Situation
• 7 Manufacturing facilities (California to New York)
• 3 Offices locations (California to Germany)
• American Stock Exchange Listed Company
• Incorporated in late 1960’s
• Successful IPO through early 1970’s
33
Financial Changes at GTI
• Working Capital decreased by $6 million
• Retained Earnings decreased by $2 million
• A $2 million loss incurred
• Net Worth decreased from $6,207 to $4,370
• Market Value of Equity decreased by 50%
• Sales decreased by 50%
34
Ethical Consideration
• Pressure led to “Corner Cutting”
• Returns not reported
• Bad inventory (and too much of it)
• Questionable Deferrals and Reserves levels
35
Employee Moral & Attitude
• Internally Competitive
• Angry
• Insecure
36
Management’s Responsibility
• “PROTECT and ENHANCE
the Stockholders Investment in GTI”
(Words of the new CEO)
37
Material to be Covered
• Condition of GTI in June of 1975
• Management & Control changes
• Definition of Management’s Responsibility
• Description of Management tools used
• Caveats for a successful Turnaround
38
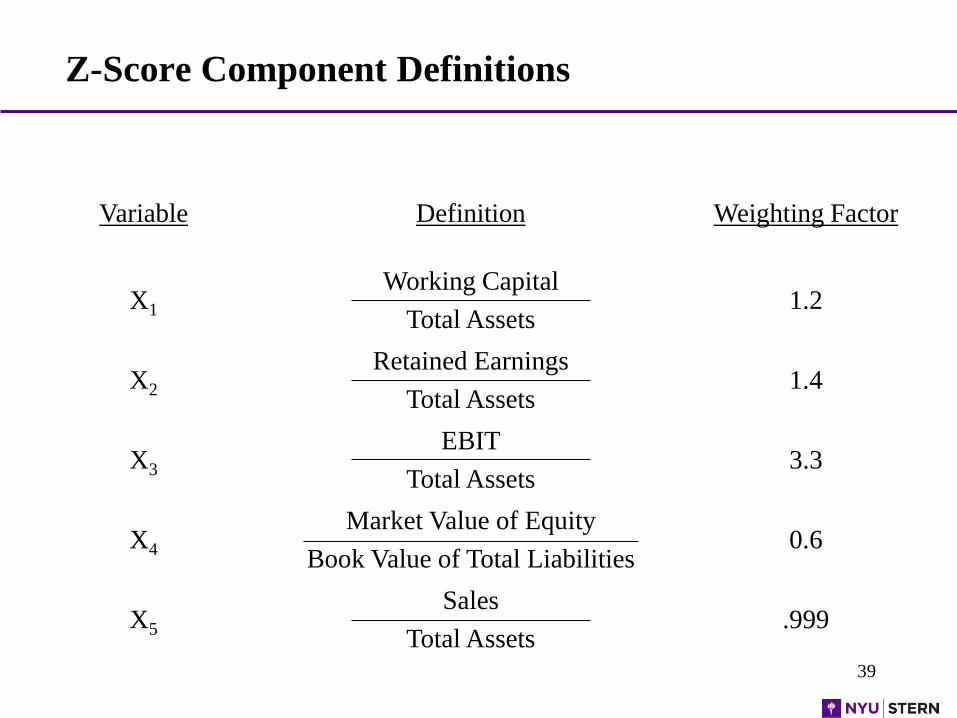
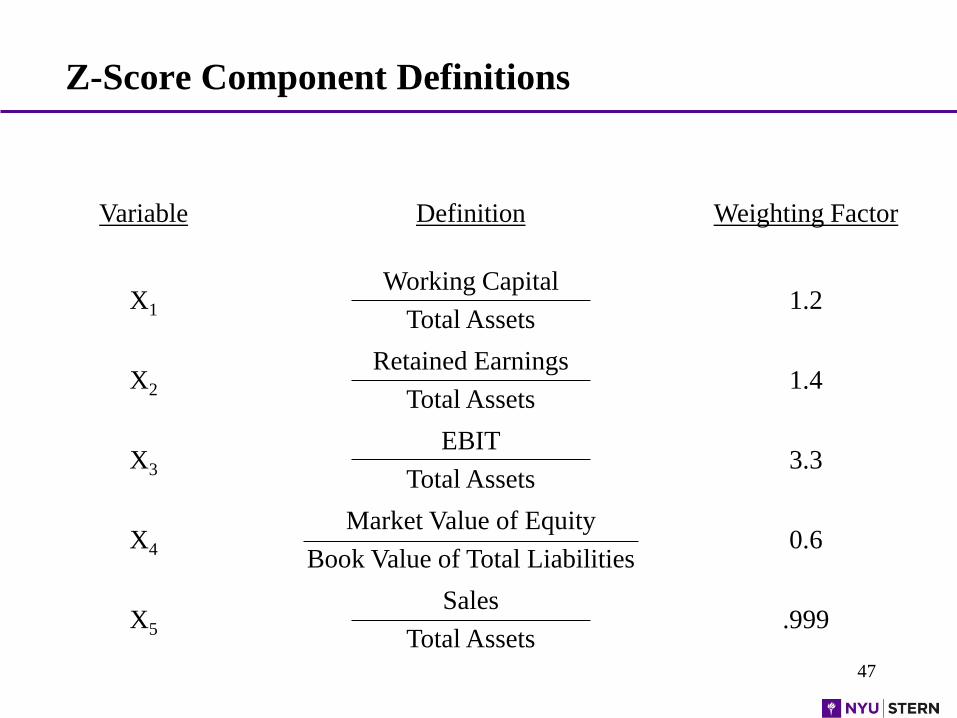
Z-Score Component Definitions
Variable Definition Weighting Factor
X1
Working Capital
Total Assets1.2
X2
Retained Earnings
Total Assets1.4
X3
EBIT
Total Assets3.3
X4
Market Value of Equity
Book Value of Total Liabilities0.6
X5
Sales
Total Assets.999
39

Z-Score Distressed Firm Predictor:
Application to GTI Corporation (1972 – 1975)
0.00
1.00
2.00
3.00
4.00
5.00
6.00
1972 1973 1974 1975
Z-Score
EPS = $0.09
EPS = $0.52
EPS = $0.19
EPS = ($1.27)
Distress
Zone
Grey
Zone
Safe
Zone
40
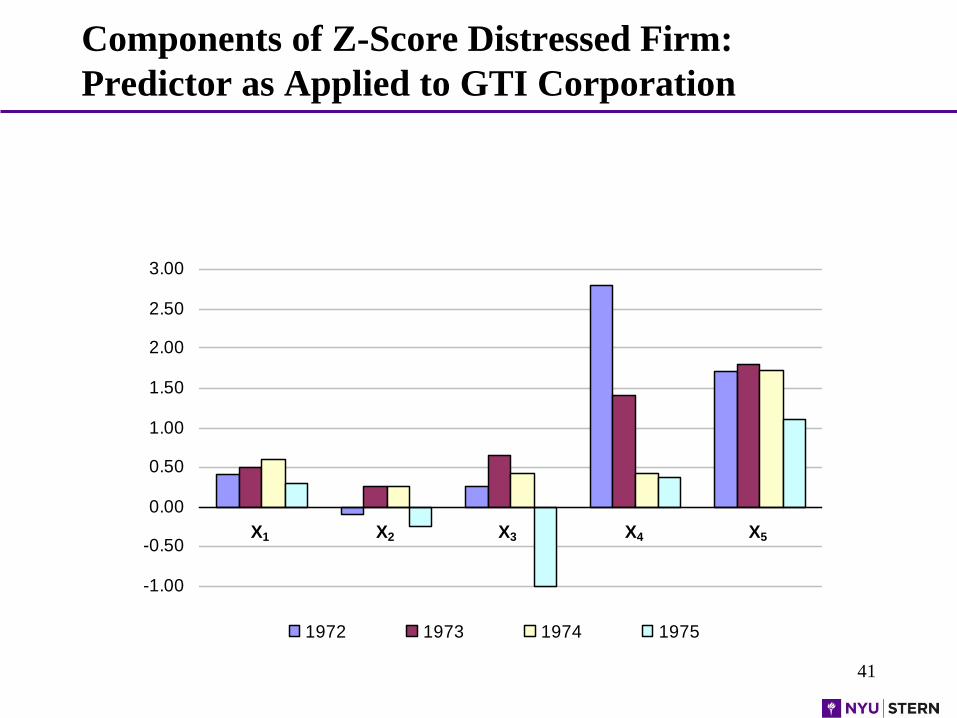
Components of Z-Score Distressed Firm:
Predictor as Applied to GTI Corporation
-1.00
-0.50
0.00
0.50
1.00
1.50
2.00
2.50
3.00
1972 1973 1974 1975
X1 X2 X3 X4 X5
41
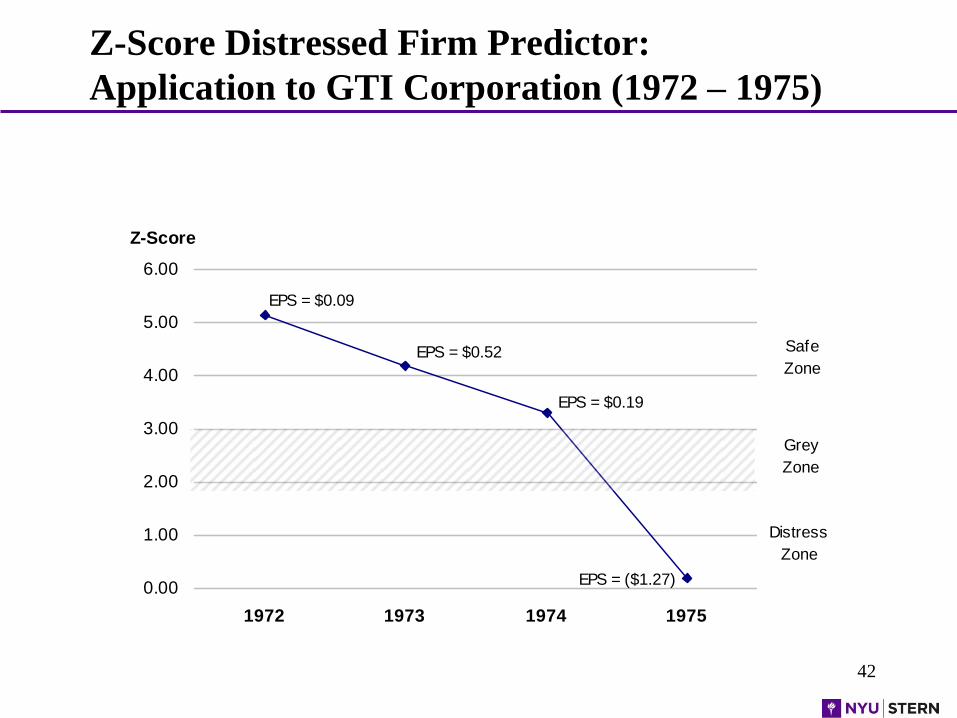
Z-Score Distressed Firm Predictor:
Application to GTI Corporation (1972 – 1975)
0.00
1.00
2.00
3.00
4.00
5.00
6.00
1972 1973 1974 1975
Z-Score
EPS = $0.09
EPS = $0.52
EPS = $0.19
EPS = ($1.27)
Distress
Zone
Grey
Zone
Safe
Zone
42
Management Tools Used
• Altman’s Distressed Firm Predictor (Z-Score)
• Function / Location Matrix
• Financial Statements
• Planning Systems
• Trend Charts
43
Strategy
• Strategy #1: Reduce Personnel & Eliminate Capital Spending
• Reason: Reverse Cash drain
• Tool: Source and Application of Funds
• Timing: Immediate
44
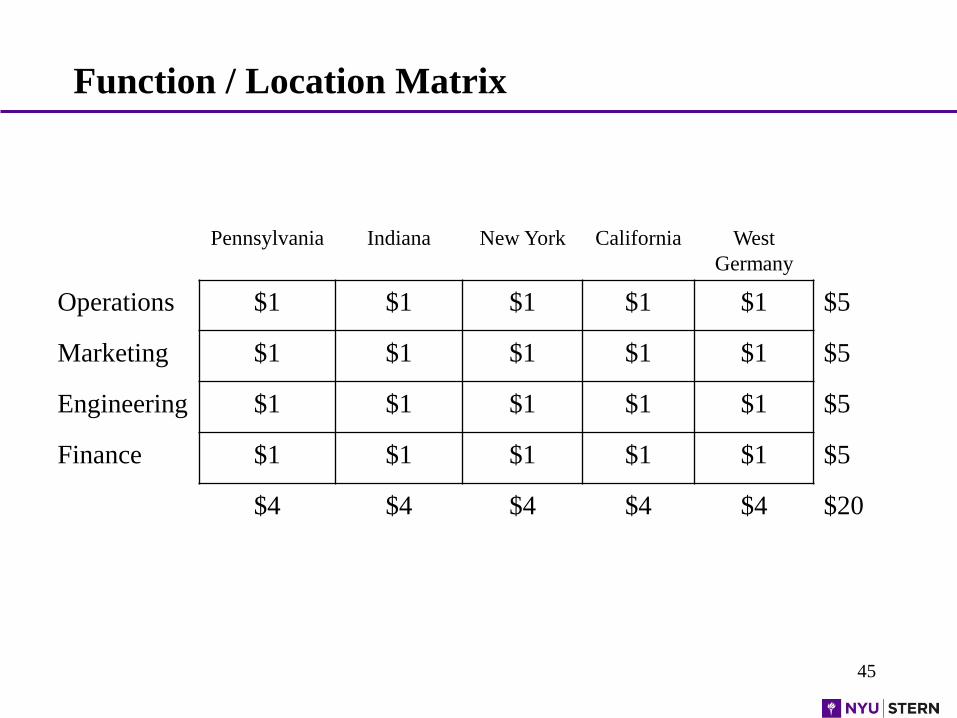
Function / Location Matrix
Pennsylvania Indiana New York California West
Germany
Operations $1 $1 $1 $1 $1 $5
Marketing $1 $1 $1 $1 $1 $5
Engineering $1 $1 $1 $1 $1 $5
Finance $1 $1 $1 $1 $1 $5
$4 $4 $4 $4 $4 $20
45
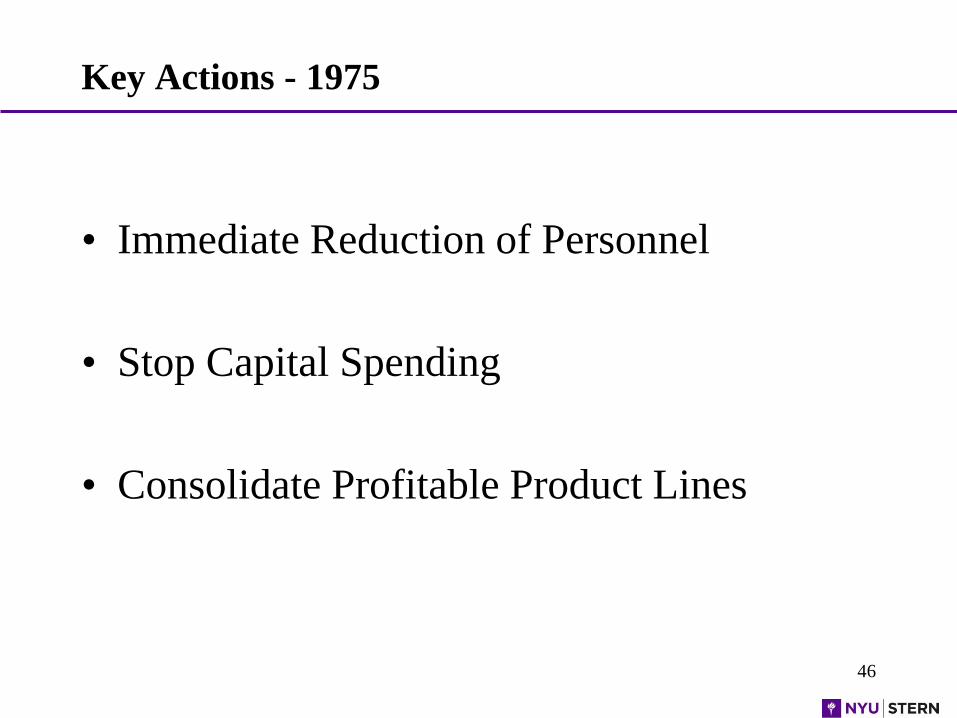
Key Actions - 1975
• Immediate Reduction of Personnel
• Stop Capital Spending
• Consolidate Profitable Product Lines
46
Z-Score Component Definitions
Variable Definition Weighting Factor
X1
Working Capital
Total Assets1.2
X2
Retained Earnings
Total Assets1.4
X3
EBIT
Total Assets3.3
X4
Market Value of Equity
Book Value of Total Liabilities0.6
X5
Sales
Total Assets.999
47
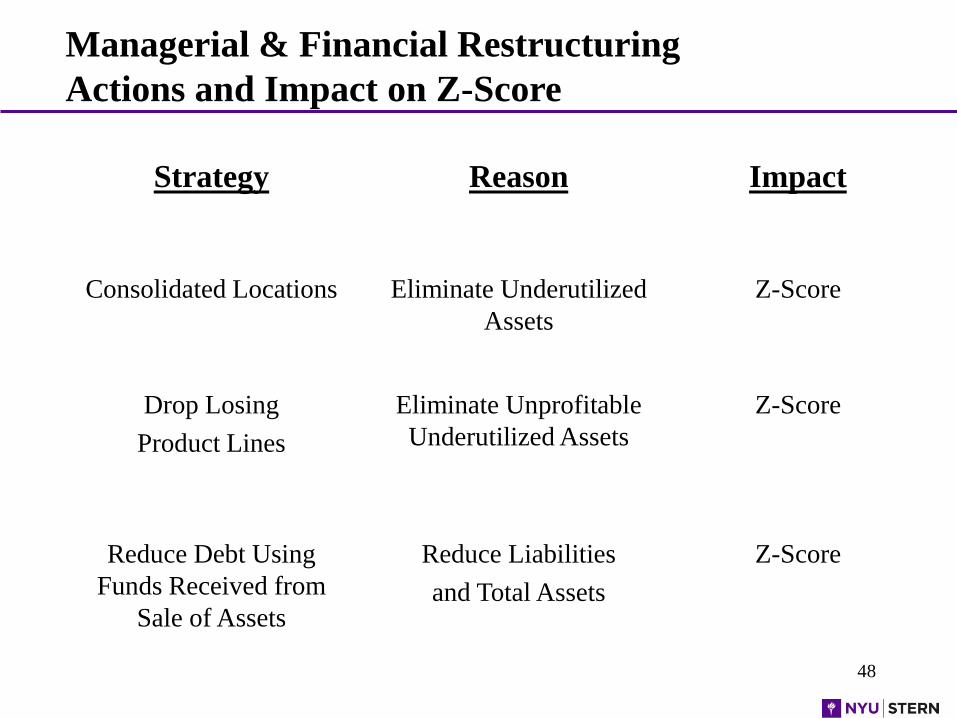
Strategy Reason Impact
Consolidated Locations Eliminate Underutilized
Assets
Z-Score
Drop Losing
Product Lines
Eliminate Unprofitable
Underutilized Assets
Z-Score
Reduce Debt Using
Funds Received from
Sale of Assets
Reduce Liabilities
and Total Assets
Z-Score
Managerial & Financial Restructuring
Actions and Impact on Z-Score
48
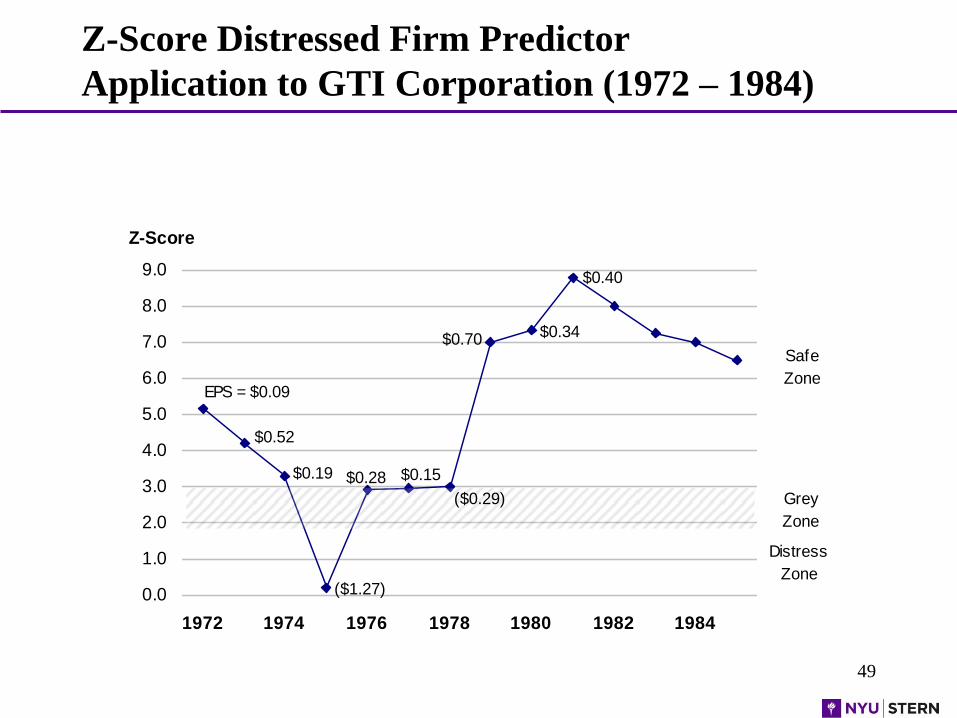
Z-Score Distressed Firm Predictor
Application to GTI Corporation (1972 – 1984)
0.0
1.0
2.0
3.0
4.0
5.0
6.0
7.0
8.0
9.0
1972 1974 1976 1978 1980 1982 1984
Z-Score
EPS = $0.09
$0.52
$0.19
($1.27)
Distress
Zone
Grey
Zone
Safe
Zone
$0.15$0.28
($0.29)
$0.70 $0.34
$0.40
49
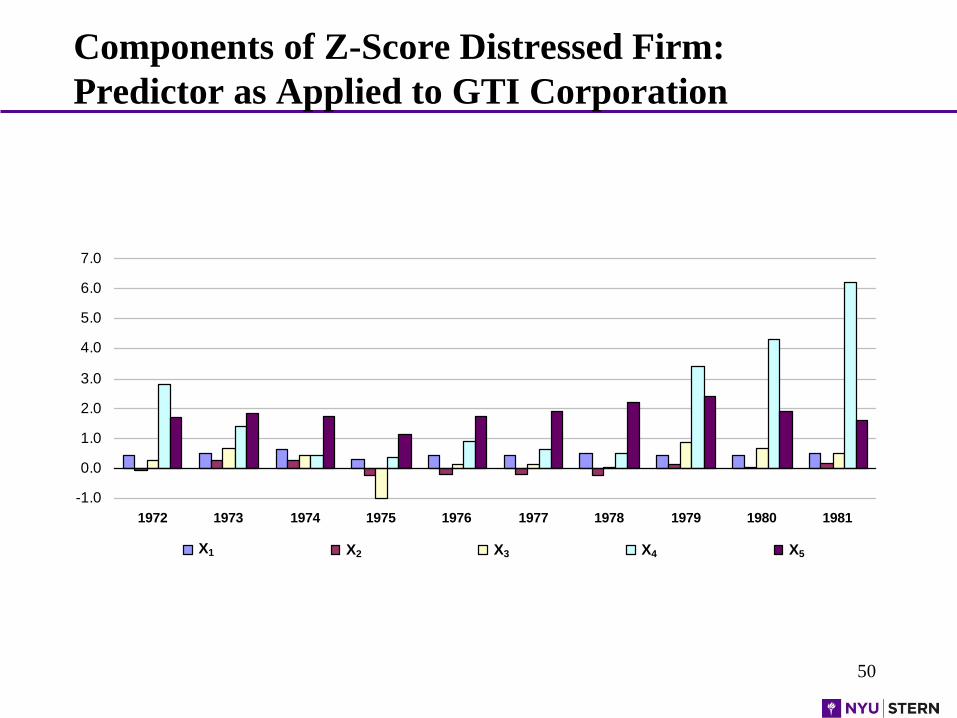
Components of Z-Score Distressed Firm:
Predictor as Applied to GTI Corporation
-1.0
0.0
1.0
2.0
3.0
4.0
5.0
6.0
7.0
1972 1973 1974 1975 1976 1977 1978 1979 1980 1981
X1 X2 X3 X4 X5
50
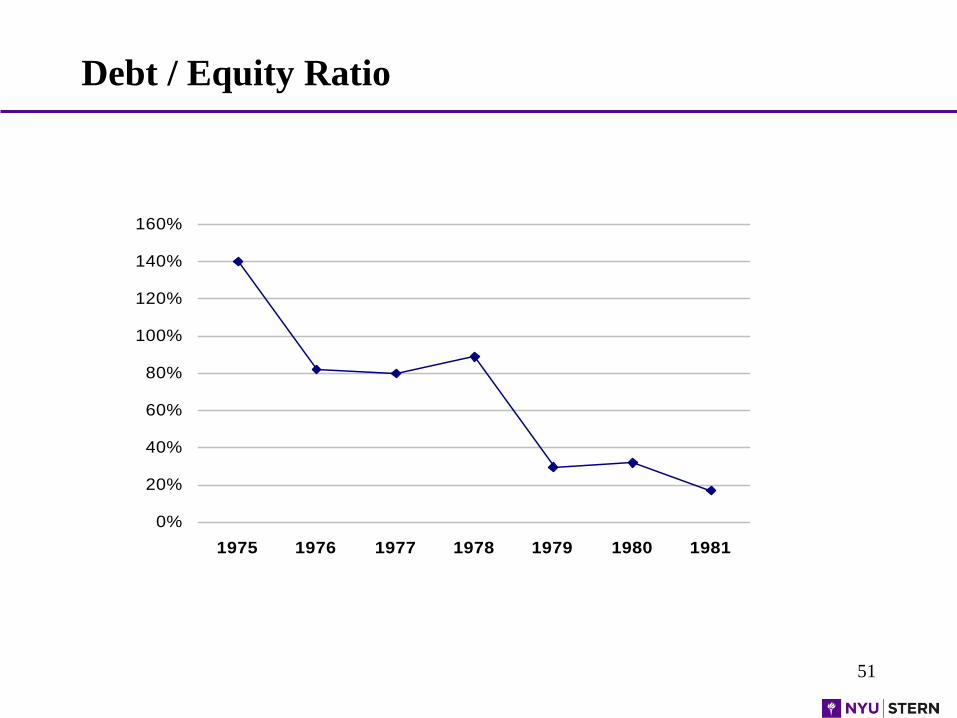
Debt / Equity Ratio
0%
20%
40%
60%
80%
100%
120%
140%
160%
1975 1976 1977 1978 1979 1980 1981
51
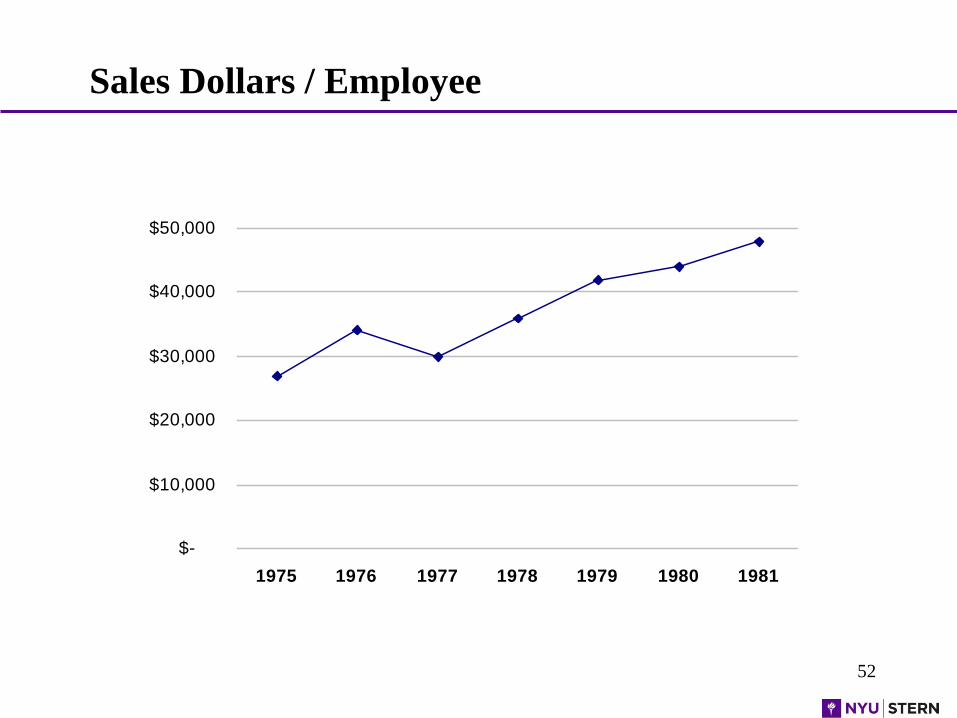
Sales Dollars / Employee
$-
$10,000
$20,000
$30,000
$40,000
$50,000
1975 1976 1977 1978 1979 1980 1981
52