Embed Size (px)
Citation preview
Veget Hist Archaeobot (2006) 15: 151–168DOI 10.1007/s00334-005-0008-8
ORIGINAL ARTICLE
Mona Court-Picon · Alexandre Buttler ·Jacques-Louis de Beaulieu
Modern pollen/vegetation/land-use relationships in mountainenvironments: an example from the Champsaur valley (French Alps)
Received: 18 September 2004 / Accepted: 23 June 2005 / Published online: 1 March 2006C© Springer-Verlag 2005
Abstract This study aims at elucidating modern pollenspectra/environmental data relationships from both naturaland human-induced vegetation types as an aid for palaeo-ecological reconstructions. A set of 51 surface moss pol-sters was sampled from different vegetation and land-usetypes in the Champsaur area (French Alps) and analysed toobtain modern pollen analogues of ancient cultural land-scapes in mountain ecosystems. Samples were selectedfrom grazed areas, mown meadows, cultivated fields, fallowland and deciduous and coniferous forests. Vegetation com-position around the sampling points and seventeen types ofenvironmental variables (e.g., management type, soil andtopography) were collected all for these 51 sites. Patternsof modern local pollen variation in relation to the envi-ronmental variables were explored by means of canonicalcorrespondence analysis (CCA) and associated statisticaltests. This correlative model allows us to determine themajor explanatory variables and to identify taxa indicativeof particular anthropogenic activities, and thus may help tocalibrate fossil pollen assemblages.
The indicator pollen types are evaluated in the light ofcomparable material from lowland and mid-elevation ar-eas of western Europe. The results of the French data-set
Communicated by F. Bittmann
M. Court-Picon (�) · J.-L. de BeaulieuInstitut Mediterraneen d’Ecologie et de Paleoecologie IMEP,UMR CNRS 6116, Europole Mediterraneen de l’Arbois,Batiment Villemin — BP 80,13545 Aix-en-Provence, Francee-mail: [email protected]
M. Court-Picon · A. ButtlerLaboratoire de Chrono-Ecologie, UMR CNRS 6565, Universitede Franche-Conte,16 route de Gray,25030 Besancon Cedex, France
A. ButtlerLaboratory of Ecological Systems—ECOS, Swiss FederalResearch Institute WSL and Swiss Federal Institute ofTechnology EPFL,Ecublens, 1015 Lausanne, Switzerland
confirm some of the conclusions drawn from the NorthEuropean data-sets, but also show some site specific fea-tures. Pollen markers with a broader global significancecommon to other regions include Rhinanthus type, Api-aceae and Dipsacaceae for mown meadows, Urtica type,Plantago media/major, Trifolium type and Potentilla typefor grazed areas, and Cerealia type, Centaurea cyanus,and Polygonum aviculare for cultivated fields. New pollenanthropogenic indicators typical of our study area are San-guisorba officinalis, Vicia type (mowing), Lotus type, Ono-brychis type, Centaurea nigra type, Serratula type (graz-ing), Sinapis type and Papaver rhoeas (cultivation). Thisstudy provides potentially valuable analogues for human-induced vegetation types, and it may then become possibleto interpret more objectively local pollen diagrams fromAlpine mountain environments in terms of past culturallandscape development.
Keywords Surface pollen samples . Modern pollenland-use relationships . Anthropogenic indicators .Numerical analyses . French Alps
Introduction
To trace human signatures in pollen diagrams, palaeoecolo-gists generally focus on palynological indicators of humanimpact on the landscape during the Holocene. The con-cept of anthropogenic indicators relies on the occurrence inpollen records of particular species highly correlated withhuman activities, e.g., cultivated plants, weeds and otherapophytes. Fossil pollen sequences are interpreted qual-itatively with the help of these pollen taxa indicative ofdifferent human activities such as cultivation, pastur-ing, trampling, settlement and mowing. This so-called“indicator-species” approach is the most widely usedmethod for tracing the history of habitation and its chang-ing intensity over time. The identification of the indi-vidual taxa representative of specific human practices isbased on actual field observations and a thorough literature

152
review. Ultimately, these taxa are grouped according to theirindicator value with regard to various land-use categoriesand habitats (Behre 1981; Vorren 1986; Hicks 1988, 1992).Alternative techniques such as modern pollen/land-use re-lationships have been less commonly used in Europe forqualitative reconstructions of past cultural landscapes fromfossil pollen data (e.g., Vuorela 1973; Hall 1988; Hicks1992, 1993; Diot 1999).
Beyond the exploration of anthropogenic dynamics(presence of human activities, abandonment phases),research today is tending towards reconstructions at a finerscale of the different types of human practices pursuedsince the onset of agriculture. It increasingly attempts toevaluate the nature, the extent and the duration of humanactivities. In this context, and in order to interpret moreaccurately fossil pollen spectra, the criteria used for recon-structing human impacts as recorded in pollen diagramsalways need to be improved, and indeed pollen analystsmust search for better-performing tools. It is necessaryfirstly to ascertain what type of pollen evidence can beconsidered as indicative in term of practices, and secondlyto assess the level of representation of these pollen groupswhich may be regarded as significant. For this purpose, the“comparative” approach (Wright 1967), involving modernpollen analogues, has been applied to human-inducedvegetation types through numerical methods (Berglund etal. 1986; Gaillard et al. 1992, 1994; Hicks and Birks 1996;Brostrom et al. 1998; Makohonienko et al. 1998; Hjelle1999; Rasanen 2001; Galop et al. 2003; Mazier et al. inpress). This general research strategy has proved capableof providing an improved evaluation of anthropogenicindicators and offers the possibility of a more complete,and hopefully more reliable, interpretation of fossil pollenassemblages.
However, the very few reconstructions of past plantcommunities involving modern pollen spectra in human-influenced vegetation types that have been attempted arefor some areas of northern Europe only, while mountainenvironments in southerly countries have still hardly beeninvestigated (Galop et al. 2003; Mazier et al. in press).Among these areas the French Alps almost totally lackmodern pollen data, particularly with respect to vegetationtypes growing in response to human activities. The useof the results obtained in northern Europe to aid interpre-tation of fossil pollen sequences from high-altitude sitesin southern France appears to be controversial. Studiesof pollen/vegetation relationships carried out in mountainareas have shown that it is not possible to apply the lowlandpollen representation models to high-altitude sites (e.g.,Markgraf 1980; Barthelemy and Jolly 1989; Brugiapagliaet al. 1998; Ortu 2002; Ortu et al. 2005). The aim ofthe present study is thus to characterise modern pollenevidence of anthropogenic interference specifically for theFrench Alps. We concentrate here on the Champsaur valleywhich has considerable potential for modern analogues ofpast land-uses as some farmers still practice traditional orsemi-traditional land-use of their mown meadows and cul-tivated fields due to, among other things, the steep slopes.
The objectives of this paper are: (i) to investigate if the dif-ferent types of human activities can be recognised and dis-tinguished from natural vegetation types by surface pollenanalysis, (ii) to assess the influence of environmental vari-ables on those pollen assemblages, and thus to analyse theoverall relationships between pollen assemblages and bothvegetation and land-use at the local scale, and (iii) to iden-tify specific taxa characteristic of each particular land-usepractice.
Study area
The study area covers all the Champsaur (550 km2) in theupper Drac valley (High-Alps, France). The valley delim-its the southern portion of the Ecrins massif in the centralFrench Alps (Fig. 1) and belongs to the peripheral part ofthe Ecrins National Park. The region is subdivided into twomajor zones: in the western part, the Lower Champsaurat middle elevation (below 2000 m a.s.l.), is a wide openvalley on schistose marl bedrock with fertile soils, and theUpper Champsaur in the eastern part, with increasing ele-vation (above 1500 m and up to 3200 m a.s.l.), steep slopesand poor soils on hard acidic bedrock. Therefore, despitethe small extent of the study area, there is a noticeable cli-matic range with mean annual temperatures varying from6 to 9◦C in the Lower Champsaur, and from 4 to 6◦C inthe Upper Champsaur. The climate of the western part issubject to Mediterranean influences with 1100 mm annualrainfall, mostly in autumn and winter (Meteo-France). TheUpper Champsaur area is cooler and wetter; the mean an-nual precipitation ranges from 1500 to 2000 mm and snowcovers the ground for more than 4 months per year.
The vegetation is a mosaic formed by a great varietyof plant communities. This diversity is due to importantenvironmental differences in altitude, aspect, topographyand human usage. Coniferous woodlands are those most
Fig. 1 Location of the 51 sampling sites selected in differentvegetation/land-use types of the Champsaur valley in the southernFrench Alps for surface pollen sampling (moss polsters), vegetationinventories and environment/land-use characterisation. The 51 sam-pling sites are marked with black dots; each rectangle representsseveral sampling sites located close to each other. The central partof the Ecrins National Park is indicated in dark grey and the pe-ripheral part in pale grey. The various managements and other sitedescriptions are given in Table 1

153
prevalent in the region with Larix decidua Mill. rangingfrom 1100 to 2100 m a.s.l., Pinus sylvestris L. from theflood plain up to 1600 m a.s.l. on southern exposures, andAbies alba Mill. on northern exposures (Cadel et al. 1963).The subalpine belt is a patchy woodland mosaic of Larixdecidua Mill., Alnus alnobetula (=A. viridis (Chaix) DC.),and, in some places, Pinus uncinata Mill. and Pinus cem-bra L. Heathlands and other scrub vegetation, composed ofArctostaphyllos uva-ursi (L.) Spreng, Juniperus communisL., Rhododendron ferrugineum L., Vaccinium myrtillus L.,V. uliginosum L. and V. vitis–idaea L., also occur as per-manent communities on slopes with little soil, being theresult of human disturbances (Gobert et al. 1966). Patchesof deciduous forest (Fagus sylvatica L., Quercus pubescensWilld.) are confined to the lower areas along the Drac river-banks and on the southern slopes. However, most of thewoodland area has been cleared and open lands influencedby agropastoral activities are the predominant landscapetypes in the valley. Agriculture is intensively developedon fluvioglacial deposits in the Lower Champsaur, char-acterised by a landscape with many hedgerows (bocage),whereas pastures for summer grazing predominate on thesteep slopes of the higher eastern part. The tree-line oc-curs between 1800 and 2100 m in the eastern highlands.Areas above 2300 m a.s.l. consist of boulders and shortgrasslands dominated by Carex curvula All. and Nardusstricta L. Glaciers occur in some places at elevations above2700 m.
Materials and methods
Site selection and investigated vegetation types
Fifty-one sites were selected for collection of surfacepollen samples in the most important semi-natural andhuman-induced vegetation types of the study area (Fig. 1),based on advice given by Gaillard et al. (1992, 1994),Emanuelsson et al. (1998) and Makohonienko et al. (1998).Sites had to be located in areas with “old-fashioned”land-use management of various types, traditional orsemi-traditional. Because the major aim of this study wasto reconstruct past cultural landscapes, the modern pollenspectra had to come from areas where one could assumethat analogues for past landscapes still existed.
The 51 samples collected within these sites range alonga west-east gradient, from mid elevation in the flood plain(870 m a.s.l.) to high elevation above the tree-line (2180 ma.s.l.). Since it is specifically the vegetation changes causedby human influences which are of greatest interest, empha-sis was given to samples from cultivated fields, pastures,grazed forests, meadows and abandoned lands. Apart fromthese anthropogenic situations, the selected sites also in-cluded deciduous and coniferous forests with varying de-grees of openness, hedgerows with and without pollard-ing, abandoned dry grasslands and wetlands. The exactlocation and description of each sampling site is listed inTable 1.
Field methods: vegetation and pollen data
The field methods were based on earlier investigationsof pollen/vegetation/land-use relationships in northernEurope (Berglund et al. 1986; Gaillard et al. 1992, 1994;Hjelle 1999) and thus broadly follow their methods. At eachsite, a vegetation description, using the Braun-Blanquetabundance/dominance scale (Braun-Blanquet 1979), wasmade of a 10×10 m quadrat within a homogeneous rep-resentative stand of the plant community. The percentagecover of four vegetation layers was recorded: mosses, herbs,dwarf shrubs, and shrub plus trees. In some cases, how-ever, traditionally managed vegetation types we wished toinvestigate were small patches surrounded by semi-naturalor other human-induced vegetation types, and therefore asmaller quadrat had to be surveyed. Notes on the plant com-munities occurring within a radius of 100 m, and vegetationrecords at a broader scale using the GIS-maps of the EcrinsNational Park, were also made to aid in distinguishing be-tween pollen of local, extra-local or regional origin (Heim1970). Plant nomenclature follows Kerguelen (1993).
The modern pollen samples were collected within eachone hundred-square-metre plot. Since moss polsters arelikely integrating more or less 5 years of pollen rain (e.g.,Andersen 1970; Vuorela 1973), they were chosen insteadof pollen traps. Also this method is justified by the fact thatcomparisons with fossil pollen spectra from sediments areenvisaged (Berglund et al. 1986; Gaillard et al. 1992, 1994;Hicks and Birks 1996; Hjelle 1997, 1998, 1999; Rasanen2001). Furthermore moss samples have been shown to bereliable in studies of modern pollen deposition when rel-ative frequencies of pollen types are needed (Heim 1970;Boyd 1986). Several moss polsters were randomly takenfrom the central part of each vegetation sampling quadratand pooled together in one sample (Gaillard et al. 1992,1994). The pollen data are represented in a simplified dia-gram showing percentage values for the 51 moss samplesand 40 selected pollen taxa (Fig. 2). Samples are groupedaccording to the main vegetation and land-use types at eachsampling site, according to the initial sampling strategy andfield description (Table 1).
Field work was conducted prior to mowing (Hjelle 1998,1999) during summer 2002.
Environmental variables
At each sampling site records were made of anthro-pogenic, vegetation and environmental variables (Table 2).The farmer/user was interviewed about the managementscheme, and the variables mowing, grazing, type of ani-mal, burning and pollarding, together with the frequencyof the practice, were recorded. Grazing pressure was givenon an ordinal scale from 0 to 4 as follows: no grazing (0),site grazed for a few weeks (1), site heavily grazed (2),site intensively grazed (3), wayside flock shed (4). Mowingand burning frequencies were also ordered in three classes:no mowing/burning (0), occasional (1), regular/each year(2). Other variables—whether the site investigated was a
154
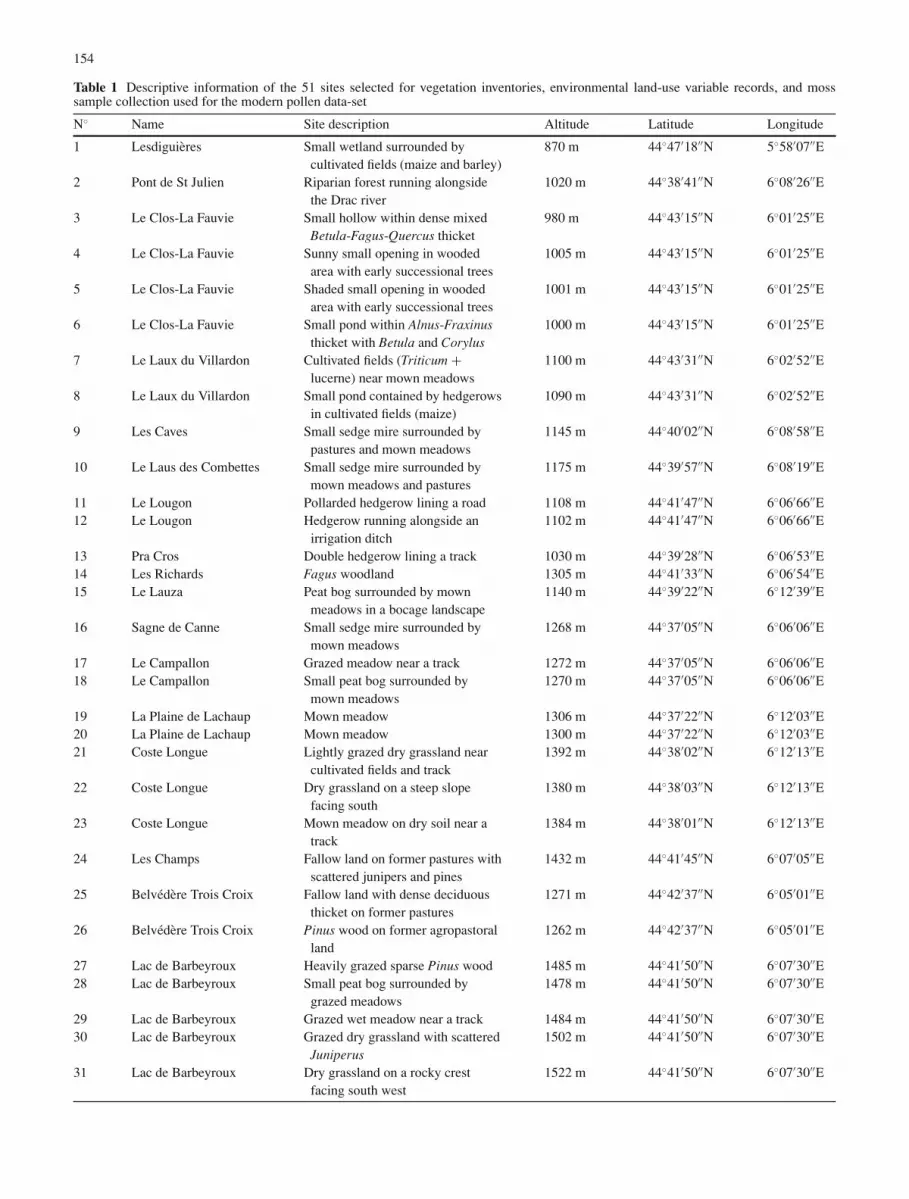
Table 1 Descriptive information of the 51 sites selected for vegetation inventories, environmental land-use variable records, and mosssample collection used for the modern pollen data-set
N◦ Name Site description Altitude Latitude Longitude
1 Lesdiguieres Small wetland surrounded bycultivated fields (maize and barley)
870 m 44◦47′18′′N 5◦58′07′′E
2 Pont de St Julien Riparian forest running alongsidethe Drac river
1020 m 44◦38′41′′N 6◦08′26′′E
3 Le Clos-La Fauvie Small hollow within dense mixedBetula-Fagus-Quercus thicket
980 m 44◦43′15′′N 6◦01′25′′E
4 Le Clos-La Fauvie Sunny small opening in woodedarea with early successional trees
1005 m 44◦43′15′′N 6◦01′25′′E
5 Le Clos-La Fauvie Shaded small opening in woodedarea with early successional trees
1001 m 44◦43′15′′N 6◦01′25′′E
6 Le Clos-La Fauvie Small pond within Alnus-Fraxinusthicket with Betula and Corylus
1000 m 44◦43′15′′N 6◦01′25′′E
7 Le Laux du Villardon Cultivated fields (Triticum +lucerne) near mown meadows
1100 m 44◦43′31′′N 6◦02′52′′E
8 Le Laux du Villardon Small pond contained by hedgerowsin cultivated fields (maize)
1090 m 44◦43′31′′N 6◦02′52′′E
9 Les Caves Small sedge mire surrounded bypastures and mown meadows
1145 m 44◦40′02′′N 6◦08′58′′E
10 Le Laus des Combettes Small sedge mire surrounded bymown meadows and pastures
1175 m 44◦39′57′′N 6◦08′19′′E
11 Le Lougon Pollarded hedgerow lining a road 1108 m 44◦41′47′′N 6◦06′66′′E12 Le Lougon Hedgerow running alongside an
irrigation ditch1102 m 44◦41′47′′N 6◦06′66′′E
13 Pra Cros Double hedgerow lining a track 1030 m 44◦39′28′′N 6◦06′53′′E14 Les Richards Fagus woodland 1305 m 44◦41′33′′N 6◦06′54′′E15 Le Lauza Peat bog surrounded by mown
meadows in a bocage landscape1140 m 44◦39′22′′N 6◦12′39′′E
16 Sagne de Canne Small sedge mire surrounded bymown meadows
1268 m 44◦37′05′′N 6◦06′06′′E
17 Le Campallon Grazed meadow near a track 1272 m 44◦37′05′′N 6◦06′06′′E18 Le Campallon Small peat bog surrounded by
mown meadows1270 m 44◦37′05′′N 6◦06′06′′E
19 La Plaine de Lachaup Mown meadow 1306 m 44◦37′22′′N 6◦12′03′′E20 La Plaine de Lachaup Mown meadow 1300 m 44◦37′22′′N 6◦12′03′′E21 Coste Longue Lightly grazed dry grassland near
cultivated fields and track1392 m 44◦38′02′′N 6◦12′13′′E
22 Coste Longue Dry grassland on a steep slopefacing south
1380 m 44◦38′03′′N 6◦12′13′′E
23 Coste Longue Mown meadow on dry soil near atrack
1384 m 44◦38′01′′N 6◦12′13′′E
24 Les Champs Fallow land on former pastures withscattered junipers and pines
1432 m 44◦41′45′′N 6◦07′05′′E
25 Belvedere Trois Croix Fallow land with dense deciduousthicket on former pastures
1271 m 44◦42′37′′N 6◦05′01′′E
26 Belvedere Trois Croix Pinus wood on former agropastoralland
1262 m 44◦42′37′′N 6◦05′01′′E
27 Lac de Barbeyroux Heavily grazed sparse Pinus wood 1485 m 44◦41′50′′N 6◦07′30′′E28 Lac de Barbeyroux Small peat bog surrounded by
grazed meadows1478 m 44◦41′50′′N 6◦07′30′′E
29 Lac de Barbeyroux Grazed wet meadow near a track 1484 m 44◦41′50′′N 6◦07′30′′E30 Lac de Barbeyroux Grazed dry grassland with scattered
Juniperus1502 m 44◦41′50′′N 6◦07′30′′E
31 Lac de Barbeyroux Dry grassland on a rocky crestfacing south west
1522 m 44◦41′50′′N 6◦07′30′′E

155
Table 1 Continued
N◦ Name Site description Altitude Latitude Longitude
32 Lac de Barbeyroux Lightly grazed open Larixwoodland
1515 m 44◦41′50′′N 6◦07′30′′E
33 Lac de Faudon Lightly grazed open larix thicketwith a few Juniperus and Pinus
1588 m 44◦36′10′′N 6◦12′58′′E
34 Lac de Faudon Dense shore-line meadow withgrasses frequently grazed
1577 m 44◦36′10′′N 6◦12′58′′E
35 Lac de Faudon Hiking track near the lake withheavy cattle trampling pressure
1578 m 44◦36′10′′N 6◦12′58′′E
36 Lac de Faudon Heavily grazed grassland withscattered Crataegus and Juniperus
1581 m 44◦36′10′′N 6◦12′58′′E
37 Libouse Heavily grazed wet meadow at theedge of a peat bog
1455 m 44◦38′01′′N 6◦13′25′′E
38 Libouse Track running between a peat bogand a dense Larix forest
1456 m 44◦38′01′′N 6◦13′25′′E
39 Libouse Grazed dense Larix forest 1460 m 44◦38′01′′N 6◦13′25′′E40 Libouse Heavily grazed dense Larix forest 1465 m 44◦38′01′′N 6◦13′25′′E41 Lac des Lauzons Herb rich meadow with Nardus
stricta formerly heavily grazed2180 m 44◦47′01′′N 6◦17′19′′E
42 Lac des Lauzons Grazed meadow formerly manurednear archaeological stalls
2185 m 44◦47′01′′N 6◦17′19′′E
43 Lac des Lauzons Small peat bog formerly exploited 2175 m 44◦47′01′′N 6◦17′19′′E44 Lac des Lauzons Water hole within the exploited part
of the peat bog2175 m 44◦47′01′′N 6◦17′19′′E
45 Lac des Lauzons Wet meadow, transition betweenpeat bog and grazed grassland
2180 m 44◦47′01′′N 6◦17′19′′E
46 Lac des Lauzons Dry grassland on a little rocky brow 2185 m 44◦47′01′′N 6◦17′19′′E47 Lac des Lauzons Herbaceous formation in the middle
of an archaeological large byre2190 m 44◦47′01′′N 6◦17′19′′E
48 Lac des Lauzons Lightly grazed dry grassland on asteep slope facing south west
2190 m 44◦47′01′′N 6◦17′19′′E
49 Lac des Lauzons Lightly grazed grassland on analluvial cone near a rocky glacier
2190 m 44◦47′01′′N 6◦17′19′′E
50 Lac des Lauzons High altitude wayside flock shednear archaeological vestiges
2180 m 44◦47′01′′N 6◦17′19′′E
51 Lac des Lauzons Wet meadow formerly heavilygrazed with scatteredRhododendron
2180 m 44◦47′01′′N 6◦17′19′′E
cultivated field or not, a wetland or not, and whether therewere any “clapiers” (heaps of stones resulting from stonepicking from cultural fields), cattle tracks and/or hedgerowsin the direct vicinity of the sampling points—were recordedas presence/absence variables. Contrary to Gaillard et al.(1992) and Hjelle (1999), the type of grazing animals wasnot taken into account since the livestock in the study re-gion had always been mixed until recently (second partof the 20th century). Moreover, the proportions of thesedifferent types of animals have changed considerably overabout thirty years (Bazin 1996).
Some other environmental data were extracted from GIS-maps of the Ecrins National Park. They include vari-ous types of climatic, geographic (altitude, slope, expo-sure), edaphic and land-use data for the selected sites.Slope was later transformed into a scale from 0 (flat)
to 6 (vertical). The sites were classified into edaphic re-gions: non-calcareous schist and mica-schist (01), moraineand rocky glacier (02), schistose marl (03), siliceous scree(04) and fluvioglacial alluvium (05). Overall, a total of31 “explanatory” variables were recorded and allocated tothree general environmental variable types, namely land-use/anthropogenic, vegetation, and other site characteris-tics.
Laboratory procedures
The moss polsters for pollen analysis were preparedaccording to standard procedures (Berglund andRalska-Jasiewiczowa 1986), using heating in 10% NaOHfor 20 min, sieving, HCl- and HF-treatment (only if

156
Fig. 2 Simplified pollen diagram showing percentage values for the51 moss samples and 40 selected pollen taxa. Samples are groupedaccording to the main vegetation and land-use types at each samplingsite. The site numbers are those in Fig. 1 and Table 1. The white barsshow samples collected on peat bogs and other wetlands. All valuesare expressed as percentage of total terrestrial pollen sum but exclud-ing spores, aquatics and mire taxa. The presence of taxa with low
percentages (<1%) is indicated by a filled circle. Abbreviations: DF= deciduous forests; B = bocage; W = wetlands and peat bogs; H =hedgerows; Cfi = cultivated fields; CF = coniferous forest; L = larchforests; LP = mixed larch-pine forests; P = pinewoods; GF = grazedforests; GM = grazed meadows; ALP = high altitude pastures; MM= mown meadows; DL = dry grasslands
mineral material was present), acetolysis, centrifuging,filtering, and mounting in glycerol. Soil particles stickingto the mosses were removed before chemical processing inorder to reduce contamination by pollen grains older thanthe mosses. The pollen analysis was performed using oilimmersion objectives at a magnification of 500×. Between400 and 1000 pollen grains were counted for each sample,excluding grains of aquatic and wetland species. Pollenanalysis was performed at high taxonomic detail, usingthe IMEP reference collection, the photographic atlas pub-lished by Reille (1992, 1995, 1998) and the available keys.Pollen taxonomy and nomenclature generally follows Fae-gri and Iversen (1989) and Moore et al. (1991). Separationbetween wild and cultivated grasses and within cereals wasbased on Beug (1961) and Andersen (1978). The pollentypes used in the present paper generally follow Moore etal. (1991). Spores were also counted and identified usingLopez-Saez et al. (1998) and van Geel et al. (2003). A totalof 158 pollen and spore taxa was identified. Detailed count-ing of microscopic charcoal particles was done at the sametime as pollen counting. Two pollen sums were employedin the analysis. The results are summarised in a total terres-
trial pollen diagram, drawn using GpalWin (Goeury 1997),where the basic sum for the calculation of percentages istotal pollen (AP + NAP) excluding spores and aquatic andmire taxa. For further analyses, herbaceous pollen percent-ages were also calculated from a basic sum including NAPonly.
Numerical analyses
Correspondence analysis (CA) and clustering were usedfirstly to investigate the overall pattern in both the contem-porary pollen and vegetation assemblages (Court-Piconet al. 2005). Pollen and vegetation data were classified intogroups by cluster analysis using the programs Progiciel Rversion 4.0 (Casgrain and Legendre 2001) and MULVA-5(Wildi and Orloci 1996) respectively (Table 3). Combinedwith CA, these analyses were performed in order to findout whether the variations in the pollen and vegetation datawere consistent and relevant to the purpose of the study (i.e.,if human-influenced vegetation types are distinguishedby their pollen assemblages), whether these variations

157
Fig. 2 Continued
were explained by common pollen types, to analysecorrelations between pollen taxa, and to indicate the majorenvironmental gradients responsible for the variationsobserved.
The relationship between the gradients in the pollen dataand the environmental and land-use explanatory variableswas then investigated using direct ordination by means of
canonical correspondence analysis (CCA), the constrainedor canonical form of CA (ter Braak 1986, 1987). Theordination axes are selected to be maximally related tolinear combinations of the explanatory variables and thestatistical significance of the canonical model can betested. Thus the pollen taxa, which are the response vari-ables, are constrained by the predictor, in this case the
Table 2 List of the environmental and land-use variables recorded ateach modern pollen sampling site. All variables are quantitative, con-tinuous variables except those recorded as 0/1 (absent/present nomi-nal variables) and grazing pressure, burning and mowing, which arerecorded as ordinal variables in five and three classes, respectively.Grazing pressure was given on an ordinal scale from 0 to 4 as follows:no grazing (0), site grazed a few weeks (1), site highly grazed (2), site
intensively grazed (3), wayside flock shed (4). Mowing and burningfrequencies were also ordered in three classes: no mowing/burning(0), occasional (1), regular/each year (2). The slope ranges from 0(flat) to 6 (vertical). The sites were classified into edaphic regions:non-calcareous schist and mica-schist (1), moraine and rocky glacier(2), schistose marl (3), siliceous scree (4) and fluvioglacial alluvium(5)
Anthropogenic variables Vegetation variables Other site characteristicsVariable Unit Variable Unit Variable Unit Variable Unit Variable Unit
Cultivation 0/1 Moss cover % Altitude m Slope 0 0/1 Exposure N 0/1Dry stones 0/1 Total herb cover % Slope 1 0/1 Exposure S 0/1Track 0/1 Total dwarf shrub
cover% Substratum 01 0/1 Slope 2 0/1 Exposure E 0/1
Grazing pressure 0–4 Total shrub cover % Substratum 02 0/1 Slope 3 0/1 Exposure W 0/1Burning 0–2 Total tree cover % Substratum 03 0/1 Slope 4 0/1 Exposure SE 0/1Mowing 0–2 Wetland 0/1 Substratum 04 0/1 Slope 5 0/1 Exposure SW 0/1
Hedgerows 0/1 Substratum 05 0/1 Slope 6 0/1 Exposure NW 0/1

158
Table 3 Clustering analyses of vegetation and modern pollen data in the 51 sites, according to Court-Picon et al. (2005)
(a) Typology of the vegetation data-setVegetation groups DescriptionGroup A Typical flora of herbaceous vegetation subject to continuous humidity (edges of ponds, marshes and peat bogs)Group B Woody sites weakly or not influenced by human activities (riparian forest, hedgerows and natural forests)Group C High altitude sites with a herb flora characteristic of typical mountain pastures (alps) and wayside flock shedsGroup D Sites situated above the timberline characterised by soil acidification and dominated by Nardus strictaGroup E Dry grasslands on calcareous substrate and rocky ground dominated by Bromus erectus and ovine festuca ovinaGroup F More or less highly grazed areas (grasslands, undergrowth of forests, abandoned mown meadows, fallow lands)Group G Current mown meadows (alliance Arrhenatherion), which have never been subjected to high grazing pressureGroup H Land under cultivation(b) Clustering analysis of the modern pollen data-setPollen data groups DescriptionGroup 1 Wayside flock shed sampled at high altitude on the Lauzons plateauGroup 2 Deciduous forests, hedgerows and riparian forests, but also wetland sites in the heart of the dense bocageGroup 3 Lightly grazed or abandoned open and semi-open sites formerly farmed, where secondary succession occursGroup 4 Bogs, mires and wetlands from either low or high altitude areasGroup 5 Cultivated fields or sites in the direct vicinity, linked to the occurrence of Cerealia type and associated plantsGroup 6a Traditional mown meadowsGroup 6b Open grazed sites from Lower ChampsaurGroup 6c Forested grazed areasGroup 6d Grazed sites from high elevation areas
land-use and other environmental variables collected oneach site. In the CCA scatter plot quantitative variables, aswell as semi-quantitative variables, which are consideredlike quantitative ones, are represented by arrows, and qual-itative explanatory variables are represented by their cen-troids. Variables with long arrows and most outlying cen-troids can best be interpreted in the scatter diagram of theordination axes. Distance between object-points, species-points and between centroid-points, or between each other,are interpreted, respectively, as a mutual resemblance orcontribution. The orthogonal projection of any species-points onto the arrow of a quantitative variable representsits ecological optimum. In order to improve the interpreta-tion of the main patterns of variation in the pollen data, thedifferent groups identified by the clustering method (Ta-ble 3) have been transferred to the CCA ordination plot.A Monte Carlo permutation procedure was used to testthe statistical significance of the environmental variablesin CCA (ter Braak 1988, 1990). To investigate how thegradients in the pollen data could be explained by the maingradients in the vegetation data, the vegetation data weretreated as explanatory variables in CCA. This was achievedby using the sample scores on the first four CA ordinationaxes of the vegetation data as predictor variables in CCA(Hjelle 1999). Vegetation groups from the typological anal-ysis (Table 3) were also used as explanatory variables inCCA (Rasanen 2001).
Ordinations of the data were implemented by thecomputer program CANOCO version 4.0 (ter Braak andSmilauer 1998). The pollen percentage data were logtransformed prior to analysis (ter Braak 1990). All theresults were plotted using the program COREL DRAWv. 10.
Results and interpretation
Pollen diagram
The pollen spectra of the 51 surface samples are presentedin a synthetic diagram for 40 selected taxa (Fig. 2), whichtakes into account all the arboreal, shrub and herb pollentaxa. This kind of representation shows the pollen reflec-tion of the different land-use types in the context of thetypical mosaic landscape of the Champsaur (Hicks 1988,1992). The diagram, including all the components of thedifferent vegetation strata, gives information about recip-rocal influences between AP (displayed to the left) andNAP (displayed to the right) and offers the possibility ofevaluating the extra-local, regional and long-distancepollen components (Heim 1970). The taxa have been ar-ranged to the growth habit of the parent plant as arborealpollen, non-arboreal pollen, and excluded categories, andaccording to their successive occurrence and abundance inthe vegetation types.
Arboreal/non-arboreal pollen relationships (AP/NAP)
Arboreal pollen types, notably Pinus sylvestris type,dominate nearly all the moss polsters, so that herb anddwarf-shrub pollen is only poorly represented, generallyshowing relatively low values, except for a few cases (forexample Rumex in samples 50 and 42, and Cyperaceae inmodern spectra 43, 16, 18, 15, 28 and 34) and for Poaceae.This is the case even above the tree-line and suggests thatthese taxa are over-represented in the pollen assemblages.Indeed, even though trees are not growing in the vicinity

159
of any of the sites sampled on the Lauzons plateau in theUpper Champsaur (ALP), all the surface samples containAP pollen. The AP/NAP ratio is thus never below 20%and even in highly deforested sites AP can reach morethan 60%. In these cases, high percentages of AP includeextra-local pollen as well as pollen from small stands orscattered trees with good pollen production and dispersalcapacities, such as Pinus sylvestris type. The pollensamples from forested sites are generally characterisedby high amounts of AP, up to 95%, either in deciduous(site 3) or coniferous woodlands (pinewood from site26). However, two sites have lower AP values: a stronglygrazed pine forest (sample 27) and a densely woodedLarix forest (sample 40). The open structure of the former,and the fact that this small patch of forest is surrounded bylarge open pastures, may explain the under-representationof AP taxa, whereas in the latter it is due to the well-knownunder-representation of Larix pollen associated with adense tree cover which does not allow extra-local treepollen to come inside the forest.
The most abundant herb pollen is that of Poaceae whichis well represented in several different types of ecologicalconditions, e.g., mown meadows (MM), grazed or formerlyhighly grazed sites (ALP and GM), semi-natural grasslands(DL and W) and largely open woodlands which are fre-quently grazed by cattle (GF and L). Except in Larix forests,the proportions of Poaceae are globally less than in openareas; a large amount of this herb pollen type may thereforebe considered as an indicator of open and highly deforestedconditions. Some other NAP taxa have been recorded in allsamples, from open or forested sites. These are notablyArtemisia, Galium type, Rumex, Ranunculaceae, Cichori-oideae and Cyperaceae. Even Cerealia type occurred insome forested sites.
Woodlands and bocage system
The different types of woodlands are generally clearlydistinguished by their modern pollen assemblages. Inspite of the high proportion of extra-local pine pollen, thedeciduous woodlands investigated or sites close to a forestedge, such as Fagus groves (sample 14), thickets of decid-uous shrubs and trees (samples 3, 4, 5 and 6) and riversideforests (sample 2), are found to have palynological charac-teristics representative of the arboreal composition of theirvegetation. The modern pollen spectra of these sites arethus dominated, respectively, by Fagus sylvatica, Betulaand Alnus incana/glutinosa, associated with 5 to 10% ofCorylus avellana, Quercus (deciduous type) and Fraxinusexcelsior in all of these broad-leaved tree forests. Modernpollen spectra from hedgerows (samples 11, 12, 13) aredistinguished from these woodlands by the predominanceof Quercus type deciduous and Fraxinus excelsior inaccordance with the tree cover observed for these species.Peat bogs and wetlands situated inside the hedgerownetwork area (samples 9, 10, 15) show higher valuesof herb pollen, notably Poaceae and Cyperaceae, andalso tree pollen spectra intermediate to the assemblages
characteristic of hedgerows and the pollen rain from shrubvegetation growing around and on these bogs, which aredominated by Alnus, Salix and occasionally Populus.
Pinus sylvestris type is the most abundant taxon in all theconiferous forests, either in Pinus or Larix forests. Morethan 80% is recorded in the modern pollen assemblagesfrom Pinus forests. It is also well represented in the pollenrain in dense Larix forests where it reaches 30 to 55%, whileLarix is only poorly represented with percentages neverexceeding 10%. However, the record of Larix stomatesin all samples from sites where Larix trees are present(samples 32, 38, 39, 40 and 37), while no Pinus stomatesare found, allows the detection of whether Larix trees orforests developed locally, despite the more abundant Pinuspollen in these samples.
Mowing and grazing
The pollen spectra from the open vegetation types, such asmore or less grazed areas and mown meadows, differ sig-nificantly from those of the forest sites, in spite of the over-whelming dominance of Pinus sylvestris type pollen. Theyare characterised by higher NAP percentages and a morediverse pollen assemblage of herbaceous taxa. The grazedsites and mown meadows show high values of Poaceaepollen (up to 50%) associated with some pollen of Ranun-culaceae, Cichorioideae, Brassicaceae, Chenopodiaceae,Apiaceae, Galium type, Artemisia, Rumex, Plantago lance-olata, P. media/major, Cerastium type and Trifolium type.
It is, however, noteworthy that the proportion of Poaceaedecreases with the grazing pressure. This is explained by ahigh trampling effect combined with eating preferences ofcattle for most grass species of this family (Groenman-vanWaateringe 1993). The high-altitude wayside flock shedsare characterised by high percentages of Rumex (samples50, 42 and 47). Cichorioideae and Apiaceae appear to bemore abundant in the mown meadows, whereas grazed sitesshow slightly higher amounts of Ranunculaceae, Chenopo-diaceae, Helianthemum, Potentilla type, Lotus type, Serrat-ula type, Centaurea nigra type and Juniperus. Moreover,Plantago media/major and Urtica type seem to be closelydependant on grazing pressure.
Among the sites where grazing animals are frequentlyencountered, the high-altitude mountain pastures (alps)are characterised by the occurrence of Plantago alpinapollen which is not recorded in the low- and mid-altitudesites. In contrast, Helianthemum pollen has a tendency tobe better represented in dry and lightly grazed grasslandsof the supramediterranean and montane vegetation belt(samples 21, 22, 30 and 31). Conversely, Saxifragaoppositifolia type pollen (containing here several speciessuch as S. aizoides, S. cuneifolia and/or S. androsacea)occurs more frequently in grazed meadows subject totemporary moisture due to a water table near the surface,the proximity of wetlands or waterways, or prolonged snowcover. In grazed sites, the spores derived from coprophilousfungi that develop on manure, dung and other animalfaeces (type 55A; van Geel et al. 2003) are abundant.

160
Cultivated areas
The group of cultivated fields include a Triticum field(sample 7), but also two small wetlands situated in theheart of wide Zea mays cultivation (sample 8) and at themargin of a patchy Hordeum/Zea mays field cultivated area(sample 1). All the pollen assemblages from these cultiva-tion zones are significantly different from the others andcontain Cerealia type pollen, which attains here its highestvalues. Its percentages, however, never account for morethan 10%, which thus confirm the poor pollen productionand dispersal capacities of cereals (Heim 1970; Vuorela1973; Beaulieu 1977; Behre 1981; Hall 1988; Ruffaldi1994; Makohonienko et al. 1998; Diot 1999). Besides thecrop actually cultivated at the sites, good indicator taxa ofcultivated fields, such as Centaurea cyanus type, Papaverrhoeas, Polygonum aviculare and Sinapis type are found.Note that most samples contain Brassicaceae pollen grains,but the highest frequencies are mainly registered in spectrafrom sites located in cultivated areas. Ranunculaceae, Gal-ium type, Urtica type and Plantago lanceolata, which aretraditionally associated with grazing (Behre 1981), also oc-cur in these pollen assemblages. Although Artemisia pollencontains species generally ascribed to ruderal communitiesand occurs systematically in all pollen spectra, the highestpercentage of this taxon is registered in the group of culti-vated fields. This pollen type has been reported by Hjelle(1997), Makohonienko et al. (1998) and Bunting (2003) asbeing produced in high amounts and being well dispersed inall open landscape types. Polygonum aviculare also occurssporadically in grazed and/or mown meadows. Centaureacyanus pollen seems to be well-dispersed (Makohonienkoet al. 1998) as it is recorded in several other vegetationtypes, even sometimes in forested sites, whereas the plant isstrictly characteristic of ploughed cultivated fields. Poaceaepollen here has generally lower values than in pastoral areasand mown meadows.
The herbaceous pollen types identified involve a greatnumber of plant species, each sensitive to different environ-mental conditions and with various ecological tolerances.Moreover, some of these types can occur in all the an-thropogenic situations investigated, and sometimes even insites with little human influence. We thus applied numeri-cal analyses in an attempt to reveal the diagnostic features(Hicks and Birks 1996) and the indicator taxa of the differ-ent types of human practices in the Champsaur valley.
Relationships between vegetation, land-use and pollenassemblages using CCA
As our study aims at emphasising pollen/vegetation/land-use relationships at a very local scale, we present here onlythe analysis performed on the non-arboreal pollen. Indeed,although extra-local and regional non-arboreal pollen ispresent in the modern pollen spectra, herbaceous pollenassemblages appear to reflect predominantly local vegeta-tion rather than wider landscape units, as also demonstratedby Hjelle (1999). Caseldine and Pardoe (1994) and Pardoe
(2001) have also shown that this approach (a NAP sum)precludes possible effects of extra-local, regional and/orlong distance transport of arboreal pollen and the signalsproduced by the indicator taxa, which are often poorlyrepresented in the pollen assemblages, are displayed moreclearly. The preliminary cluster and correspondence ana-lyses of the complete vegetation and contemporary pollendata-sets we presented in a previous paper (Court-Piconet al. 2005) suggested that the variation in the vegetationand pollen assemblages is strongly correlated to moistureand altitudinal gradients, to such a degree that possiblerelationships between pollen and land-use are largely ob-scured. Therefore altitude, exposure, slope, substratum andwetland variables were used as covariables in the CCA in anattempt to allow for the variance associated with site type(Odgaard and Rasmussen 1998; Rasanen 2001; Mazier etal. in press). Fig. 3 shows the CCA plot (axes 1 and 2)of the 51 modern pollen samples and 52 selected herbpollen and spore types in relation to 24 explanatory vari-ables. All these 24 environmental variables explain 41.7%of the variation in the pollen data, whereas 48.7% is ex-plained by the covariables. Axis 1 contrasts wooded siteson the negative side of the plot with cultivated fields, grazedand/or mown sites that are usually treeless on the positiveside. Axis 2 contrasts grazed sites on the negative side withmown meadows or dry grasslands on the positive side. CCAaxis 2 also contrasts samples collected under hedgerowswith more or less dense forested sites. Although axis 1 isstatistically significant (P=0.05, Monte Carlo permutationtests, 999 permutations), axis 2 is not (P=0.11). The twoaxes capture 21% of the variation in the modern pollendata.
The five highly significant explanatory variables(P<0.05, after 999 unrestricted permutations) alone ac-count for 31.1% of the variance in the pollen data-set(36.6% with the addition of the grazing pressure variable),indicating that management and vegetation type are themost important environmental variables, when site effectssuch as slope, substratum and exposure are partialled out.
In Fig. 3b, the relationship between pollen and spore taxaand 6 selected environmental variables is depicted. Thereis a clear association between cultivation and cultivatedtaxa, Cerealia type and Zea mays, but also with other taxaassociated with harvest such as Sinapis type, Centaureacyanus, and Papaver rhoeas, which are strongly correlatedto CCA axis 1. Sanguisorba officinalis, Rhinanthus type,Vicia type, Apiaceae, Dipsacaeae and some species of Ci-chorioideae are largely associated with mowing. Plantagomedia/major, Lotus type, Urtica type, Centaurea nigratype, Potentilla type and Scrophulariaceae, and also Tri-folium type, Serratula type, Onobrychis type, Euphorbia,Prunella type and the fungal spore type 55A are best relatedto grazing. Caryophyllaceae, such as Lychnis type, Sagina,Cerastium type and Dianthus type, and also Helianthemumand Veronica type, occur in the driest grasslands encoun-tered in the Champsaur valley which are generally not oftenfrequented by grazing animals. Mercurialis, Geranium andHypericum characterise the herbaceous layer of deciduousforested areas and hedgerows; Epilobium, Filipendula and

161
Fig. 3 Partial canonical correspondence analysis (CCA) biplots ofthe pollen data in relation to 24 vegetation and land-use variables onCCA axes 1 and 2 (CCA1: 12.4%, λ1: 0.11; CCA2: 8.6%, λ2: 0.07).Environmental variables used as covariables are altitude, exposure,slope, substratum and wetland. (a) CCA plot of the 51 pollensurface samples with the pollen data clusters given in the symbolsaccording to Table 3 and the predictor environmental variables. Thevegetation/land-use variables are represented by arrows (quantitativeand ordinal variables) or large black dots (dichotomous variables).Significant environmental variables with the first two axes (P<0.05,999 permutations tests, except for Grazing pressure with P=0.10) areshown in bold. Abbreviations: CULT = cultivation; Dry Sto = Drystones; Graz press = grazing pressure; MC = moss cover; HC = totalherb cover; DSC = total dwarf shrub cover; SC = total shrub cover;TC = total tree cover; VTA = vegetation type A; VTB = vegetationtype B; VTC = vegetation type C; VTD = vegetation type D; VTE =vegetation type E; VTF = vegetation type F; VTG = vegetation typeG; VTH = vegetation type H; CA1-2 = first two axes in correspon-dence analysis of the vegetation data. (b) CCA plot of 52 selectedpollen and spore types and the sixth more significant vegetation andland-use variables. Abbreviations: t = type; Plant lan = Plantagolanceolata; Plant med = Plantago media/major; Cent nigr =Centaurea nigra type; Onob = Onobrychis type; Sile = Silene type;Ser = Serratula type; Trif = Trifolium type; Euph = Euphorbia; Pote= Potentilla type; Prun = Prunella type; Camp = Campanula type;Ran = Ranunculaceae; Poa = Poaceae; Cera = Cerastium type; Cich= Cichorioideae; Scro = Scrophulariaceae; Heli = Helianthemum;Dian = Dianthus type, Anth = Anthemis type; Gal = Galiumtype; Chen = Chenopodiaceae; Ono = Ononis type; Saxi oppo= Saxifraga oppositifolia type; Rum = Rumex; Vero = Veronicatype
Thalictrum, which are also situated in the left half ofthe plot, are thus linked to wooded sites, especiallyriparian forests and hedgerows running alongside brooksor irrigation ditches.
Several taxa are situated near the origin, suggesting thatthey have little relation to the measured local environmentalvariables (ter Braak 1986; Gaillard et al. 1994) or they maybe commonly recorded in most of the sites investigated andcharacterised by various environmental conditions and dif-ferent types of land-use (Mazier et al. in press). When onelooks at the species scores along the first two CCA axes, itappears that Artemisia, Polygonum aviculare and Chenopo-diaceae are recorded both in cultivated fields and highlygrazed sites. The positions of Campanula type, Veronicatype and Cerastium type are influenced by the high val-ues of these taxa in dry grasslands and mown meadows onfiltering soils. Poaceae, Ranunculaceae, Ononis type, An-themis type, Aster type, but also Rumex, Galium type andto a lesser extent Plantago lanceolata are found close tothe origin, reflecting their common presence and/or theirimportance in all the human-influenced vegetation typesinvestigated.
Discussion
Pollen/land-use/environment relationships
Previous numerical studies (cluster and correspondenceanalyses) carried out independently on both the vegeta-tion and pollen data-sets have shown that the classifica-tion of the pollen data was not in accordance with thevegetation data for all sites (Table 3), and that these dis-crepancies are mainly due to differences in pollen pro-duction and pollen dispersal of the different pollen types(Court-Picon et al. 2005). Inspection of the pollen diagrampresented in this paper, showing both arboreal and non-arboreal pollen, confirms this assumption. The most strik-ing feature is the strong pollen signal of Pinus sylvestrisover the whole study area, especially for places where noother efficient wind-pollinated plants are locally common.This is notably the case for open lands as herb taxa aregenerally under-represented compared to arboreal pollen.These under-represented herb species are autogamous andcleistogamous flowers, such as cereals, or entomophilousor specialized zoophilous flowers, which are particularlyabundant in both in grazed and mown vegetation, withlow pollen production and poor dispersal, and which pro-mote the inclusion of extra-local and regional pollen. Inintensively grazed sites the pollen production of localplants is reduced or even suppressed due to overgrazing(Groenman-van Waateringe 1993; Hjelle 1998), and Pinuspollen, which originates from some distance away, is thusparticularly abundant in the pollen assemblages (Markgraf1980; Hjelle 1999). The same is true for early-mown mead-ows. This over-representation of Pinus in the pollen as-semblages is well documented and numerous authors havealready reported that incoming Pinus pollen may dominatepollen spectra from sites where this taxon is absent (e.g.,

162
Heim 1970; de Beaulieu 1977; Ruffaldi 1994; Markgraf1980; Brostrom et al. 1998; Brugiapaglia et al. 1998; Ortu2002; Ortu et al. 2005). Some moss pollen spectra from de-ciduous forested sites and Larix woodlands also have highpercentages of Pinus pollen, which proves that the highPinus pollen percentages are not only restricted to the sur-face samples from wetlands and other open sites. In thecase of Larix forests, the well-known under-representationof Larix pollen (e.g., de Beaulieu 1977) explains the goodrepresentation of Pinus pollen even beneath a dense canopy.The deciduous woodlands we investigated were found tobe relatively open with some clearings that allow Pinuspollen to seep through the canopy, as discussed by Hicksand Birks (1996), Makohonienko et al. (1998) and Bunting(2002). Moreover, the Champsaur area is characterised by afine-scale mosaic landscape with small patches of differentvegetation units which accentuates this incoming pollen,and hence also explains the misclassifications of somemodern pollen samples in the groups compared to thoseobtained from the vegetation analysis. Indeed, the diagramsuggests that the sites are not forming distinctly separatedclear specific units but rather a continuous gradient acrossthe different natural and human-influenced vegetation typesinvestigated in the Champsaur valley. For the same reasons,rather high amounts of NAP can also be found in forestedsites. Anemophilous herb taxa, such as Artemisia, Plantagolanceolata, Rumex, Urtica type, Chenopodiaceae and Bras-sicaceae, can also be well dispersed at an extra-local scaleand thus contribute to the discrepancies observed betweenpollen and vegetation assemblages in open vegetation typeseven when a NAP pollen sum is considered.
The relationships of the gradients in the pollen data tothe environmental variables, and between these various en-vironmental variables, were investigated using CCA. FromFig. 3, it appears that mowing is today associated with burn-ing, which is frequently used by farmers of the region toprevent the expansion of possible early successional shrubsand trees, and to enrich the soil and promote hay produc-tion. Mown meadows have a high herbaceous layer coverand are found on favourable aspects, occurring on relativelydry and filtering soils. Contrary to the results of Berglundet al. (1986), Gaillard et al. (1992, 1994), Makohonienkoet al. (1998) and Hjelle (1999), who had some difficul-ties in distinguishing between mown meadows and pasturecommunities on the basis of pollen assemblages, grazingpressure is here negatively related to mowing and has apositive relationship to trackways. It seems thus possibleto distinguish mown meadows from grazed areas by theirpollen assemblages using the CCA model. This speaks forthe sensitivity and validity of our CCA model with mois-ture and altitude gradients used as covariables. Cultivationis highly positively correlated to CCA axis 1 and is asso-ciated with the presence of dry stone heaps in the directvicinity of the sampling point. In the Champsaur valleystones are traditionally regularly taken off cultivated fields,particularly when they need to be ploughed, but also offsome mown meadows and pastures, and are then accumu-lated in stone walls running alongside the fields. Woodyplant cover (i.e. tree cover, shrub cover and dwarf shrub
cover) and hedgerow have their best fit on the negative sideof axis 1. These variables were also associated with the sec-ond axis in the CA of the vegetation data, which reflected adense canopy/more open vegetation gradient (Court-Piconet al. 2005), and with the vegetation type B which groupedall the forested and linear wooded structures investigated(Table 3). They are also connected to the variables mosscover and CA axis 2, both corresponding to a soil moisturegradient, which is in accordance with the idea of a morehumid soil and herbaceous layer under a dense tree coverrather than on open ground in full sunshine.
In order to compare the distribution of the individualsites with the scores of the environmental variables, andto give the range of each modern pollen sample group, theresults of the pollen data classification were plotted ontothe CCA diagram. In Fig. 3a, it is clear that the cultivatedsites (group 5) are concentrated in the extreme right partof the CCA plot where they are well separated from sitescharacterised by other land-uses such as mowing and graz-ing. This group is situated in accordance with the centroidof the nominal variable for cultivation, but also with thevegetation type H, taken as an explanatory variable andwhich is strongly positively correlated to CCA axis 1. Thescores of the mown sites (group 6a) are distributed in theupper half of the plot along CCA axis 2 and are also clearlyseparated from the other sites. Investigated grazed sites,group 1 in high-altitude areas above the tree-line, group6b in open landscapes of the Lower Champsaur and group6c in forested areas, are mainly distributed in the lowerright side of the plot. On the basis of data presented here,it appears that it is thus not possible to distinguish reliablybetween trampled (wayside flock sheds) and excessivelygrazed grounds using the composition of pollen deposi-tion assemblage (groups 1 and 6b, respectively). It is alsodifficult to distinguish the pollen spectra of some formerlyhighly pastured fallow lands, which now have a particularlydense shrub cover with early successional trees (group 3),and forested sites, the herb undergrowth of which is to-day strongly influenced by the presence of grazing animals(group 6c), from those of open areas subject to a compa-rable grazing pressure (group 6b) using their herb pollenassemblages. This may be due to the fact that moss polstersrecord several years of pollination and thus record pollenfrom herb plants characteristic of grazed areas that today donot grow on the sampled sites from fallow lands but werepresent there in the recent past (Hjelle 1997; Court-Piconet al. 2005). In contrast, some other sites from group 3that are today still open lands but lightly grazed are how-ever associated with the driest grasslands in the upper rightquadrant of the plot. Grazed sites with scores similar to drygrasslands are pastures not often frequented by cattle, andare situated on a favourable aspect (facing south) on shal-low or filtering soils. It may therefore be very difficult insome cases to separate light grazing, which does not alterthe vegetation in a way that would be visible in pollenanalysis (Rasanen 2001), from other open lands domi-nated by herb rich vegetation assemblages. In this case,problems of pollen determination may be involved; mostof the genera and species of herbaceous plants from

163
various vegetation types are identified at the family or gen-era level, which leads to some homogenisation of pollenassemblages. The scores of the wooded sites (groups 2 and6c, and some samples from group 3) are almost all situatedin the left side of the CCA plot (Fig. 3a). Moreover, severalsites, corresponding to samples collected under hedgerowtree layers and open wooded meadows closely surroundedby dense hedgerows, are situated in the upper left quad-rant of the plot. This thus shows that these two differentstructures of wooded sites, woodland and hedgerows, canbe distinguished by their herb pollen assemblage in ourCCA model. These sites are associated with other sitesfrom clustering group 4 containing peat bogs, mires andwetlands which are redistributed all over the CCA plot ac-cording to their surrounding vegetation and land-uses, sincethe nominal variable wetland has been considered as a co-variable. Those situated in the upper left quadrant are smallwetlands in mown meadow landscape, closely girdled byhedgerows. Wetland sites with scores similar to grazed sitesin the lower right quadrant are directly surrounded by pas-tures on fresh or wet soils, or may themselves be grazedby cattle (peat bogs). The same is true for the clusteringgroup 6d which groups high-altitude sites, scattered on theCCA plot with grazed sites or dry grasslands. The use of“wetland” and “altitude” as covariables in the CCA mayexplain the fact that the scores of all explanatory variablesrelated to moisture and elevation (moss cover, vegetationgroups A, C and D) are close to the origin, suggesting theirslight and statistically insignificant effect on modern pollenassemblages.
CCA and Monte Carlo permutation tests suggest thatmowing and cultivation produce statistically significant anddistinctive pollen assemblages and thus that there are differ-ences in the pollen assemblages between the various typesof human-influenced vegetation. It is then expected that in-dicator pollen taxa for each of these anthropogenic vegeta-tion types may be identified from the CCA model. However,these tests also suggest that it is very difficult to identifyunambiguously the effects of non-intensive grazing, espe-cially when it takes place in forests or in patchy forestedlandscapes such as the hedgerow landscape system.
Indicator taxa for agropastoral activities
Visual interpretation of the pollen diagram and thenumerical analyses performed on our modern pollendata-set in relation to environmental variables provide anindication of those taxa which occur exclusively or mostcommonly under certain land-uses, which may thereforebe identified as pollen taxa markers for each investigatedhuman practice prevailing in the Champsaur valley. Someare expected and thus confirm some of the conclusionsdrawn from similar studies carried out in northern Europe(Berglund et al. 1986; Gaillard et al. 1992, 1994; Hicksand Birks 1996; Makohonienko et al. 1998; Odgaard andRasmussen 1998; Hjelle 1999; Rasanen 2001) and in theFrench Pyrenean Mountains (Mazier et al. in press). It isnotably the case for the determination of anthropogenic
indicator taxa such as Cerealia type, Centaurea cyanus,Scleranthus annuus, Polygonum aviculare and, to a lesserextent, some Brassicaceae, indicating cultivation andRhinanthus type (Gaillard et al. 1992, 1994; Hjelle 1999),Apiaceae (Gaillard et al. 1992, 1994; Makohonienko et al.1998; Hjelle 1999), Dipsacaceae (Hjelle 1999) and someCichorioideae (Gaillard et al. 1992, 1994; Makohonienkoet al. 1998), which appear to be characteristic of regularmowing. Furthermore high percentages of Urtica type,Plantago media/major, Potentilla type (Hicks and Birks1996; Makohonienko et al. 1998; Hjelle 1999; Mazier et al.in press), but also Juniperus and Trifolium type (Gaillardet al. 1992; Makohonienko et al. 1998) are conditionedby grazing, trampling and the nitrophilous character of thevegetation type. Spores of coprophilous fungi type 55Aseem also to be closely connected to grazing, and yet thesemicrofossils are generally neglected as palaeoenvironmen-tal indicators. They have been described and illustrated,and their indicator value discussed in terms of pastoralpractices by Lopez-Saez et al. (1998) and van Geel et al.(2003).
In contrast, Chenopodiaceae, Ranunculaceae, Artemisia,Rumex and Galium type, generally ascribed to ruderalcommunities (Behre 1981), are found in all human-influenced vegetation types. These taxa have thus littleecological significance and hence low indicative value,as discussed by Hicks and Birks (1996), Makohonienkoet al. (1998) and Mazier et al. (in press). The same istrue for the Poaceae which occur in all our modern pollenassemblages, sometimes with high percentages. They showno clear relationships with one anthropogenic variable andare not likely to provide useful indicators of any particularhuman practice in this region; at the very most theyindicate open herbaceous environments. Obviously morethan one species is probably involved and so the indicativevalue is reduced. This comment echoes the remarks madeby Brostrom et al. (1998) who have shown that Poaceaeare positively correlated to the landscape unit “open” andsuggest that this taxon may be representative of all types ofopen land. Appearance of all these taxa in the pollen spec-tra reveals a general anthropogenic context at extra-localand regional scales and should be interpreted with caution.Nevertheless, Brun (2002) points out that, in our mid-latitude regions, the genera Rumex and Artemisia compriseonly a few species which have rather homogeneousecological requirements. The author showed that thesetwo taxa should be classified in the “nitrophilous ungrazedplant communities” phytoecological association. Withinthis vegetation type, she found that Artemisia appears tocharacterise fallow lands resulting from former cultivatedfields and may also be encountered in sites still under cul-tivation, and that Rumex most frequently occurs in more orless humid trampled lands. These conclusions support theresults of the visual and numerical analyses performed onour modern pollen data-set with Rumex and Artemisia oc-curring in all land-uses, but having a tendency respectivelyto be more common in trampled, highly grazed pasturesand settlements, and in cultivated field edges and fallowlands.

164
These pollen taxa have been identified by almost allthe other authors in different regions with various eco-logical conditions and fit in with the traditional indica-tors of cultivated fields, meadows and pastures defined byBehre (1981), Vorren (1986) and Hicks (1988, 1992). Allthese taxa may thus be considered as general anthropogenicpollen markers valid for the whole Europe.
If our results on anthropogenic pollen markers as a wholeare in accordance with those of the studies carried out inPoland and Scandinavia, there are some dissimilaritiesregarding the importance of the identified pollen indicatortaxa in each of the human-influenced vegetation types.Indeed, in these previous studies, Plantago lanceolata andRumex generally reach higher values in mown meadows,where they are favoured because the plants are allowedto flower and to ripen their seeds before they are mowed,whereas grazing may prevent flowering in grazed areas(Groenman-van Waateringe 1986; Gaillard et al. 1992,1994; Hjelle 1999). In Champsaur, early mowing mayexplain the low percentages of these taxa that are not onlyrecorded in mown meadows, but frequently occur in lightlyto moderately grazed grasslands (P. lanceolata and Rumex)and around high-altitude wayside flock sheds in the case ofR. pseudoalpinus, which is a species avoided by animals.Other studies have found P. lanceolata to be associatedwith ploughed meadows, cultivated fields and/or fallowlands (Makohonienko et al. 1998; Odgaard and Rasmussen1998). Their results thus support the hypotheses proposedby Groenman-van Waateringe (1986) and Latalowa (1992)who suggested that this taxon could be an indicator speciesof early agriculture. In France, Richard and Gery (1993)have also associated the occurrence of P. lanceolata withfallow lands and proposed this taxon as being a sign of thefirst rotational farming systems, embracing cultivation fol-lowed by fallow, recorded in the French Jura. All these re-sults contrast with the idea that P. lanceolata is a diagnosticindicator of grazing and even of high grazing pressure (e.g.,Turner 1964). Behre (1981, 1990) has already noted that inthe interpretation of numerous European pollen diagramsP. lanceolata is overestimated as a pure indicator speciesof grazing. Indeed, if his works have shown that this taxonreaches high percentages in pastures, the author indicatesthat it also plays a significant role in the re-colonisationof abandoned cultivated land and may be encounteredin several other open human-disturbed vegetation types,sometimes with considerable values. Moreover, Behre(1981, 1990) demonstrated that high grazing pressure doesnot necessary lead to high percentages of P. lanceolata inthese pollen assemblages (as is the case in grazed forestand treeless heaths on dry sandy soil). In the present paper,the pollen diagram and the CCA results show that P. lance-olata pollen is recorded sporadically in all anthropogenicvegetation types, but has a tendency to be best representedin areas under cultivation and especially in open grazedsites. In conclusion about this taxon, it may be stated that P.lanceolata is without a doubt a relevant indicator of humanoccupation since it is very closely associated with humanactivity. In accordance with the observations of Behre(1981), it is indeed an important indicator of a cattle-based
economy, but in some cases its presence may, however,indicate arable farming. In connection with this, our resultshave also shown that P. media/major, closely linked totrampling, grazing pressure and soil nutrient enrichment,represents a much better pastoral indicator than P. lance-olata. This statement supports those of Richard and Gery(1993) and Brun (2002), who assert that P. media/majoris a good indicator of the proximity of settlements andtrampled ground after consideration of the present-dayecology and phytosociology of these Plantago species.
The discrepancies observed between the results obtainedfrom the different regions studied raise the question asto whether it is relevant to use the “indicator approach”with markers identified for northern European countriesto interpret fossil pollen diagrams from southern and/ormountainous areas. It is obvious that not only the an-thropogenic pollen types identified involve distinct nativespecies (alpine herb plant species are of course not thesame than those found in the Scandinavian lowlands andthus have a different ecology), but the mown meadows andpastures selected in the Champsaur valley are also of typesother than those of northern Europe (Swedish, Norwegian,Polish or German) and are certainly subject to differentagropastoral practices. This reason may be put forward,for example, to explain the discrepancies observed forthe genera Hypericum and Epilobium between our resultsand those from Finland and Norway. In contrast to Hicks(1992) and Hicks and Birks (1996) who have foundEpilobium to be correlated to tracks and farms, this taxonappears here with Thalictrum to be strongly correlatedto riparian forests and hedgerows (Fig. 3). It is clear thatthe species involved here are different: in our study, T.aquilegifolium (occurring in deciduous humid woodlandsand shaded wet meadows), T. minus (forest edges), andEpilobium hirsutum, E. palustre (ditches and wetlands,along which, in Champsaur, hedgerows are frequentlyrunning), and/or E. montanum (fresh deciduous woodlandundergrowth), are the most probable, whereas other speciesmust be present in the Scandinavian studies. In the case ofHypericum, we found this pollen taxon close to deciduousforested sites as in Gaillard et al. (1992), but Hicks andBirks (1996) and Hjelle (1999) associated it with farmsand field cover. Among the native species which growin the region we investigated, H. hirsutum (rather humidwoodlands, forest edges) and /or H. tetrapterum (foundin wetlands surrounded by hedgerows) are certainly thespecies included in our Hypericum pollen type. The factthat pollen identifications were not all performed to a com-parable level may also explain some differences observedbetween authors. This is notably the case for Trifoliumtype, which in this study is associated with grazed sites,whereas Hjelle (1999) and Gaillard et al. (1992, 1994),who have attempted to make a pollen-analytical separationof T. pratense type and T. repens type, showed that T.pratense type seems more connected to mowing than tograzing. On the other hand, several other pollen taxa,newly identified in the present paper, and which thushad not been determined in the previous studies carriedout in human-influenced environments, emerge from the

165
numerical analyses we performed. These taxa maytherefore be considered as good pollen markers of human-induced vegetation types for our study area only. Examplesof these include Vicia type and Sanguisorba officinalis formown meadows, Papaver rhoeas and Sinapis type almostexclusively occurring in cultivated fields, and Onobrychistype, Lotus type, Centaurea nigra type, Serratula type andto a lesser extent Scrophularia type, for pastures. Sincethese characteristic taxa are all poorly represented (lowpollen producers) in pollen assemblages, our results high-light the importance of rare pollen and spore types whichcan also provide useful additional information. In contrast,other herb pollen taxa identified as indicative in northernareas were not recorded in our modern pollen data-set.These include Spergula arvensis (Behre 1981; Hicks 1988,1992; Hicks and Birks 1996), Agrostemma githago (Behre1981; Gaillard et al. 1994; Makohonienko et al. 1998),Fallopia convolvulus and Polygonum persicaria (Behre1981; Makohonienko et al. 1998), Stachys type (Hicks1988), Elymus repens (Hicks 1992; Hicks and Birks 1996)and Jasione montana (Makohonienko et al. 1998) associ-ated with cultivation and fallow lands; and Melampyrum,Calluna vulgaris (Behre 1981; Gaillard et al. 1992, 1994),Pteridium aquilinum and Polypodium vulgare (Behre1981) associated with dry pastures and grazed forests.Some of the species involved in these pollen types arenot present today in our region studied (e.g., Agrostemma,Jasione, Pteridium) or are very rarely found (e.g.,Spergula arvensis is only found twice between 1250 and1400 m a.s.l., Fallopia convolvulus occurs in only fivedifferent places and Elymus repens in only four), whichmay be the reason why they were not recorded in ourmodern pollen assemblages (Chas 1994). However, asemphasised by Hicks and Birks (1996), it would be wrongto follow blindly the results of our numerical analyses andexclude other taxa, which have been identified in otheranthropogenic situations and, by their autecology, stillthrow valuable light on the types of land-use in the directvicinity of the sampling point. Indeed, the agriculturaltools and their use, in conjunction with the cultivationsystem, play an important role in determining the weedflora of a cultivated area, and the indicator taxa involvedmay thus be significantly different according to the periodunder consideration (Behre 1981).
Conclusions
This analysis of modern pollen surface samples from dif-ferent natural and human-induced vegetation types in theFrench Alps has allowed to display the relationships be-tween pollen and plant assemblages, and also betweenpollen spectra and various land-use practices. These in-vestigations are of prime importance for palynologists andtheir implications for palaeoenvironmental reconstructionin the study area are many:
1. Visual interpretation of the pollen diagram revealedthat high pollen producers and long-distance dispersed
pollen taxa, especially Pinus, are dominant in almost allof the samples despite the large variation of landscapeopenness within the selected area. This is mainly dueto complex pollen dispersal and increased extra-local,regional and long-distance pollen transport which char-acterise mountainous environments, and confirms thefact that pollen/vegetation relationship models exploredfor lowland areas can not be applied to the interpretationof high-altitude pollen assemblages.
2. The results of CCA of 51 modern pollen spectra and24 environmental and land-use variables demonstrated,however, that it is possible not only to differentiate be-tween various kinds of anthropogenic vegetation typesthrough pollen assemblages, but also to obtain distinctpollen markers for these human-influenced vegetationtypes. Although the anthropogenic variables do not ex-plain the major part of the variance in pollen assem-blages, they contributed significantly to the variation inour data-set. This could be considered a promising resultconsidering the well-known feature of pollen mixing inmountainous areas, and because of the close botanicalsimilarity in the species composition of some differenttypes of human-influenced vegetation.
3. Although the results are found to be broadly compa-rable with published results from Scandinavia, Polandand the Pyrenees, and with the classical anthropogenicindicators defined by Behre (1981) and Hicks (1988,1992) for northern European countries, several modernpollen markers were identified for the first time. Newpollen anthropogenic indicators typical to our study areaare Sanguisorba officinalis, Vicia type (mowing), Lotustype, Onobrychis type, Centaurea nigra type, Serrat-ula type (grazing), Sinapis type and Papaver rhoeas(cultivation). Further analyses of other modern pollendata-sets should be undertaken in neighbouring valleysin order to determine whether these indicator taxa arerelevant for the entire Alpine Massif or are only usefulin the interpretation of anthropogenic signals in pollendiagrams from the Champsaur valley.
4. Notwithstanding this, the modern pollen assemblagesfrom human-influenced vegetation types of the Champ-saur valley differ from those of northern Europe, andthus illustrate the importance of collecting an extensivenetwork of pollen samples to capture the signature ofall traditional land-use managements still present in theAlps for an interpretation of fossil assemblages fromthese areas. The modern pollen/land-use relationshipmodel we established thus provides new insights whichwill aid in the interpretation of fossil pollen records fromthis mountainous region. Later, this data-set will be usedfurther for past cultural landscape reconstructions, sincemodern pollen assemblages can be compared with fos-sil pollen spectra from sites sampled in the same areaof study using the CCA model (Court-Picon et al. inpreparation).
5. Several improvements could be made in the future. Theinvestigated sites do not cover the whole variety of vege-tation structures and land-use types occurring within thearea of study. Other cultivated field types should be taken

166
into account, such as different cereal or fodder crops andvarious systems of cultivation, but also the effect of sizeand distance to each of these fields on pollen assem-blages would give additional valuable information. Thesame is true for mown and grazed meadows, with alsothe frequency of mowing, the grazing period, etc. Whenmore complete, this new modern pollen data-set willoffer the possibility of testing the effects of the differ-ent land-use variables independently from each otherby partialling out other environmental variables, and toevaluate more precisely the indicative value of each char-acteristic pollen taxon by means of weighted averaging(Gaillard et al. 1992; Hicks and Birks 1996).
6. As suggested by Gaillard et al. (1992), Makohonienkoet al. (1998) and Hjelle (1999), a future step wouldbe the study of pollen/land-use relationships over abroader geographical region. The different data-setscould be combined and used in their entirety. Accordingto these authors, the total data-set may then become abetter tool in the reconstruction of past land-uses fromfossil pollen data, as it will include a broader range ofvegetation and land-use types. This approach wouldindeed help in the search for analogues of past culturallandscapes that no longer exist in one region, but maystill occur in another region. However our study hashighlighted the danger of interpreting anthropogenicpollen signals with the aid of pollen markers whichhave been identified in other countries, since the speciesinvolved are not the same. At least this approach isinteresting as it would allow us to test whether theindicator pollen taxa we have determined for our studyarea are relevant in other countries, and it would givethe possibility of estimating pollen indicator valuesfor different land-uses from different geographicalareas.
Acknowledgements V. Andrieu-Ponel and P. Ponel are thankedfor their help in collecting moss polsters. P. Salomez and R. Bonetparticipated in the field work (collection of vegetation data) andhelped with the selection of ancient agricultural landscapes in theChampsaur valley. Benefit was derived from their experience con-cerning the vegetation and traditional land-use of the area. Thanksare due to M. Sweetko and S. Brewer for their improvement of theEnglish text. M.-J. Gaillard and S. Hicks made constructive remarksabout a preliminary version of the manuscript. V. Autin researchedthe literature and produced the list of references. This study was fi-nanced by the CNRS (Centre National de la Recherche Scientifique)programme “Foret et Troupeau dans les Alpes francaises du Suddu Tardiglaciaire a l’epoque actuelle” which was initiated after theconvincing results obtained by the programme “Paleoenvironnementet dynamiques de l’anthropisation de la montagne basque” in thePyrenean Mountains directed by Didier Galop. The Ecrins NationalPark (PNE) provided logistic support and permission for collection
References
Andersen ST (1970) The relative pollen productivity and pollen rep-resentation of north European trees, and correction factors fortree pollen spectra, determined by surface pollen analyses fromforests. Danmarks Geologiske Undersogelse, Raekke II 96:1–99
Andersen ST (1978) Identification of wild grass and cereal pollen.D.G.U., Arborg 69–92
Barthelemy L, Jolly MC (1989) Milieux de montagne et palynologie.Acta Biologica Montana 9:325–332
Bazin G (1996) Population et activite agricole dans les communesdu parc national des Ecrins. PNE-INRA, Gap
Beaulieu J-L de (1977) Contribution pollenanalytique a l’histoiretardiglaciaire et holocene de la vegetation des Alpesmeridionales francaises. These de sciences, Universited’Aix-Marseille III
Behre K-E (1981) The interpretation of anthropogenic indicators inpollen diagrams. Pollen et Spores 23:225–245
Behre K-E (1990) Some reflections on anthropogenic indicatorsand the record of prehistoric occupations phases in pollendiagrams from the Near East. In: Bottema S, Entjes-NieborgG, Zeist W van (eds) Man’s role in the Shaping of the EasternMediterranean Landscape. Rotterdam, pp 219–230
Berglund BE, Ralska-Jasiewiczowa M (1986) Pollen analysis andpollen diagrams. In: Berglund BE (ed) Handbook of holocenepalaeoecology and palaeohydrology. Wiley, Chichester, pp455–484
Berglund BE, Persson T, Emanuelsson U, Persson S (1986)Pollen/vegetation relationships in grazed and mowed plant com-munities of South Sweden. In: Behre K-E (ed) Anthropogenicindicators in pollen diagrams. Balkema, Rotterdam, pp 37–51
Beug H-J (1961) Leitfaden der Pollenbestimmung. Fischer, StuttgartBoyd WE (1986) The role of mosses in modern pollen analysis: the
influence of moss morphology on pollen entrapment. Pollen etSpores 28:243–256
Braak CJF ter (1986) Canonical correspondence analysis: a neweigenvector technique for multivariate direct gradient analysis.Ecology 67:1167–1179
Braak CJF ter (1987) Ordination. In: Jongman RHG, Braak CJFter, Tongeren OFR van (eds) Data analysis in community andlandscape ecology. Pudoc, Wageningen, pp 91–173
Braak CJF ter (1988) CANOCO—a FORTRAN program forCanonical Community Ordination. Microcomputer Power,Ithaca, New York
Braak CJF ter (1990) Update notes: CANOCO version 3.10.Agricultural Mathematics Group, Wageningen
Braak CJF ter, Smilauer P (1998) CANOCO Reference Manual.User’s Guide to Canoco for Windows. Software for CanonicalCommunity Ordination (version 4), Wageningen, Centre forBiometry
Braun-Blanquet J (1979) Fitosociologica. Blume, MadridBrostrom A, Gaillard M-J, Ihse M, Odgaard B (1998) Pollen-
landscape relationships in modern analogues of ancient culturallandscapes in southern Sweden—a first step towards quantifi-cation of vegetation openness in the past. Veg Hist Archaeobot7:189–201
Brugiapaglia E, Beaulieu J-L de, Guiot J, Reille M (1998) Transectde pluie pollinique et etagement de la vegetation dans le massifdu Taillefer (Isere, France). Geographie physique et Quaternaire52:209–218
Brun C (2002) Les plantes ruderales, marqueurs polliniquesd’anthropisation. Catalogue actuel et essai de confrontation auxdonnees fossiles dans le Massif jurassien. DEA Laboratoire deChrono-Ecologie UMR 6565 CNRS. Besancon, Universite deFranche-Comte
Bunting MJ (2002) Detecting woodland remnants in culturallandscapes: modern pollen deposition around small woodlandsin northwest Scotland. The Holocene 12:291–301
Bunting MJ (2003) Pollen-vegetation relationships in non-arborealmoorland taxa. Rev Palaeobot Palynol 125:285–298
Cadel G, Ozenda P, Tonnel A (1963) Feuille de Saint-Bonnet (33–37). Document pour la carte de la vegetation des Alpes I:47–89
Caseldine C, Pardoe H (1994) Surface pollen studies fromalpine/sub-alpine southern Norway: application to Holocenedata. Rev Palaeobot Palynol 82:1–15
Casgrain P, Legendre P (2001) The R Package for Multivariate andSpatial Analysis, version 4.0 User’s Manual. Departement desciences biologiques. Universite de Montreal
167
Chas E (1994) Atlas de la Flore des Hautes-Alpes. ConservatoireBotanique National Alpin de Gap-Charance, Conservatoiredes Espaces Naturels de Provence et des Alpes du Sud, ParcNational des Ecrins, Gap
Court-Picon M, Buttler A, Beaulieu J-L de (2005) Modern pollen-vegetation relationships in the Champsaur valley (French Alps)and their potential in the interpretation of fossil pollen recordsof past cultural landscapes. Rev Palaeobot Palynol 135:13–39
Diot M-F (1999) Pollen analysis of wild and domestic wheats underexperimental cultivation. In: Anderson PC (ed) Prehistory ofagriculture, New Experimental and Ethnographic Approaches,Los Angeles, pp 66–69
Emanuelsson U, Greig J, Bjorkman L, Makohonienko M, LeeuwenJFN van (1998) The selection of modern analogues and formerland uses. In: Gaillard M-J, Berglund BE, Frenzel B, HuckriedeU (eds) Quantification of land surfaces cleared of forestsduring the Holocene—Modern pollen/vegetation/landscaperelationships as an aid to the interpretation of fossil pollendata. Palaoklimaforschung/Palaeoclimate Research 27. Fischer,Stuttgart, pp 135–140
Faegri K, Iversen J (1989) Textbook of pollen analysis, 4th edn.Wiley, Chichester
Gaillard M-J, Birks HJB, Emanuelsson U, Berglund BE (1992)Modern pollen-land-use relationships as an aid in the recon-struction of past land-uses and cultural landscapes: an examplefrom south Sweden. Veg Hist Archaeobot 1:3–17
Gaillard M-J, Birks HJB, Emanuelsson U, Karlsson S, LagerasL, Olausson D (1994) Application of modern pollen-land-userelationships to the interpretation of pollen diagrams - recon-structions of land-use history in south Sweden, 3000-0 BP. RevPalaeobot Palynol 82:47–73
Galop D, Mazier F, Lopez-Saez JA, Vanniere B (2003) Palynologieet histoire des activites humaines en milieu montagnard.Bilan provisoire des recherches et nouvelles orientationsmethodologiques sur le versant nord des Pyrenees. Archeologiedu Midi Medieval 21:159–170
Geel B van, Buurman J, Brinkkemper O, Schelvis I, Aptroot A,Reenen G van, Hakbijl T (2003) Environmental reconstructionof a Roman period settlement site in Uitgeest (The Netherlands),with special reference to coprophilous fungi. J Archaeol Sci30:873–883
Gobert J, Ozenda P, Tonnel A (1966) Carte de la vegetation de laFrance au 1/200 000, feuille 60, Gap. CNRS, Toulouse
Goeury C (1997) GpalWin: gestion, traitement et representation desdonnees de la paleoecologie. Actes du XVeme Symposium del’Association des Palynologues de langue Francaise, Lyon, pp1–31
Groenman-van Waateringe W (1986) Grazing possibilities in theNeolithic of the Netherlands based on palynological data. In:Behre K-E (ed) Anthropogenic Indicators in Pollen Diagrams.Balkema, Rotterdam, pp 187–202
Groenman-van Waateringe W (1993) The effects of grazing on thepollen production of grasses. Veg Hist Archaeobot 2:157–162
Hall VA (1988) The role of harvesting techniques in the dispersal ofpollen grains of Cerealia. Pollen et Spores 30:265–270
Heim J (1970) Les relations entre les spectres polliniques recents et lavegetation actuelle en Europe occidentale. Laboratoire de Paly-nologie et de Phytosociologie. Louvain, Universite de Louvain
Hicks S (1988) The representation of different farming practicesin pollen diagrams from northern Finland. In: Birks HH, BirksHJB, Kaland PE, Moe D (eds) The cultural landscape—past,present and future. Cambridge University Press, Cambridge, pp189–207
Hicks S (1992) Modern pollen deposition and its use in interpretingthe occupation history of the island Hailuoto, Finland. Veg HistArchaeobot 1:75–86
Hicks S (1993) Present and past pollen records of Lapland forests.Rev Palaeobot Palynol 82:17–35
Hicks S, Birks HJB (1996) Numerical analysis of modern and fossilpollen spectra as a tool for elucidating the nature of fine-scalehuman activities in boreal areas. Veg Hist Archaeobot 5:257–272
Hjelle KL (1997) Relationships between pollen and plants inhuman-influenced vegetation types using presences-absencedata in western Norway. Rev Palaeobot Palynol 99:1–16
Hjelle KL (1998) Herb pollen representation in surfaces mosssamples from mown meadows and pastures in western Norway.Veg Hist Archaeobot 7:79–96
Hjelle KL (1999) Modern pollen assemblages from mown andgrazed vegetation types in western Norway. Rev PalaeobotPalynol 107:55–91
Kerguelen M (1993) Index Synonymique de la Flore de France.Collection Patrimoines Naturels 8. Museum National d’HistoireNaturelle, Paris
Latalowa M (1992) Man and vegetation in the pollen diagramsfrom Wolin island (NW Poland). Acta Palaeobotanica 32:123–249
Lopez-Saez JA, Geel B van, Farbos-Texier S, Diot M-F (1998)Remarques paleoecologiques a propos de quelques palynomor-phes non-polliniques provenant de sediments quaternairesen France. Revue de Paleobiologie de Geneve 17:445–459
Makohonienko M, Gaillard M-J, Tobolski K (1998) Modernpollen/land-use relationships in ancient cultural land-scapes of northwestern Poland, with an emphasis onmowing, grazing, and crop cultivation. In: Gaillard M-J,Berglund BE, Frenzel B, Huckriede U (eds) Quantifi-cation of land surfaces cleared of forests during theHolocene—Modern pollen/vegetation/landscape relation-ships as an aid to the interpretation of fossil pollen data.Palaoklimaforschung/Palaeoclimate Research 27. Fischer,Stuttgart, pp 85–101
Markgraf V (1980) Pollen dispersal in mountain area. Grana19:127–146
Moore PD, Webb JA, Collinson ME (1991) Pollen analysis, 2ndedn. Blackwell, Oxford
Mazier F, Galop D, Brun C, Buttler A (in press) Modern pollenassemblages from grazed vegetation in the Western PyreneanMountains (France). The Holocene
Odgaard BV, Rasmussen P (1998) The use of historical dataand sub-recent (a.d. 1800) pollen assemblages to quan-tify vegetation/pollen relationships. In: Gaillard M-J,Berglund BE, Frenzel B, Huckriede U (eds) Quantifi-cation of land surfaces cleared of forests during theHolocene—Modern pollen/vegetation/landscape relation-ships as an aid to the interpretation of fossil pollen data.Palaoklimaforschung/Palaeoclimate Research 27. Fischer,Stuttgart, pp 67–75
Ortu E (2002) Reconstruction sur base pollinique de la dynamiquede la vegetation tardiglaciaire et holocene dans les Alpesmaritimes italiennes. These de sciences, Universite de Droit,d’Economie et des Sciences d’Aix-Marseille III
Ortu E, David F, Caramiello R (2005) Effet des parametres locauxsur le developpement de la vegetation dans le vallon de St.Anna di Vanidio (Alpes-Maritimes, Italie). Ecoscience 12:122–135
Pardoe HS (2001) The representation of taxa in surface pollenspectra on alpine and sub-alpine glacier forelands in southernNorway. Rev Palaeobot Palynol 117:63–78
Rasanen S (2001) Tracing and interpreting fine-scale human impactin northern Fennoscandia with the aid of modern pollenanalogues. Veg Hist Archaeobot 10:211–218
Reille M (1992) Pollen et Spores d’Europe et d’Afrique duNord. Marseille, Laboratoire de botanique historique et depalynologie
Reille M (1995) Pollen et Spores d’Europe et d’Afrique du Nord—Supplement 1. Marseille, Laboratoire de botanique historiqueet palynologie
Reille M (1998) Pollen et Spores d’Europe et d’Afrique du Nord—Supplement 2. Marseille, Laboratoire de botanique historique etpalynologie
Richard H, Gery S (1993) Variations in pollen proportions ofPlantago lanceolata and P. major/media at a Neolithic lakedwelling, lake Chalain, France. Veg Hist Archaeobot 2:79–88

168
Ruffaldi P (1994) Relationship between recent pollen spectra andcurrent vegetation around the Cerin peat bog (Ain, France). RevPalaeobot Palynol 82:97–112
Turner J (1964) The anthropogenic factor in vegetational history.New Phytol 63:73–89
Vorren K (1986) The impact of early agriculture on the vegetationof Northen Norway. A discussion of anthropogenic indicatorsin biostratigraphical data. In: Behre KE (ed) Anthropogenicindicators in pollen diagrams. Balkema, Rotterdam, pp 1–18
Vuorela I (1973) Relative pollen rain around cultivated fields. ActaBotanica Fennica 102:1–27
Wildi O, Orloci L (1996) Numerical exploration of communitypatterns, A guide to the use of MULVA-5. SPB AcademicPublishing, Amsterdam
Wright HE (1967) The use of pollen surface samples in Quaternarypollen analysis. Rev Palaeobot Palynol 2:321–330


