Embed Size (px)
Citation preview
i
SMART
SAVE
Modernising Hong Kong’s Water Management Policy PART II
SUSTAINABLE Water Infrastructure: TOWARDS A DIVERSIFIED WATER SUPPLY
December 2019
ii 1
AcknowledgementsThis report was prepared by Civic Exchange with the generous financial support of WYNG Foundation. Civic Exchange would like to express our sincere appreciation to Chairman Anthony Ng and CEO Yan-yan Yip of WYNG Foundation for their advice and support to the Civic Exchange team throughout the research process.
We would like to thank and acknowledge the contributions of Fellow Dr Frederick Lee, Senior Advisor Natalie Chan, Programme Manager Yvonne Law, Operations Manager John So, Researcher Jonathan Lin and Communications Coordinator Hillary Leung of Civic Exchange for their diligence in reviewing and editing this report, and their overall management and co-ordination of the project. The report also benefited from valuable inputs from the Centre for Water Technology and Policy and the Department of Civil Engineering of The University of Hong Kong, Water Supplies Department and Drainage Services Department of The Government of the Hong Kong Special Administrative Region, as well as other individuals, too numerous to name individually, who gave their time and professional insights.
About Civic ExchangeCivic Exchange is an independent Hong Kong public-policy think tank established in 2000. We use in-depth research and dialogue to inform policy and engage stakeholders on addressing environmental and development challenges in Hong Kong. Civic Exchange has been ranked among the top 50 environmental think tanks in the world by the Lauder Institute at the University of Pennsylvania since 2011. For more information, visit www.civic-exchange.org
About the AdvisorFrederick Lee is a Fellow of Civic Exchange. Dr Lee is the Director of the Water Governance Research Programme and Associate Director of the Policy for Sustainability Lab at the Faculty of Social Sciences of the University of Hong Kong. He is also Project Co-Investigator of the JC-WISE Water Initiative on Sustainability and Engagement at HKU. His research focuses on water governance and water policy issues in Hong Kong and the Pearl River Delta region. Dr Lee, who holds a PhD Degree in Urban Planning from MIT, has published in international journals and co-edited books including Asia’s Environmental Movements: Comparative Perspectives and Cultural Heritage Management in China: Preserving the Cities of the Pearl River Delta.
About the AuthorDavid von Eiff is an associate researcher of Civic Exchange with a focus on economic and public policy issues. Most recently, Dr von Eiff has been working on economic, sustainability and climate change issues associated with water supply management decisions. He previously spent 8 years working with a consulting company as a regulatory specialist in Environmental, Health & Safety Management Systems, having clients across a wide range of industries. Dr von Eiff holds a Doctor of Philosophy from the City University of Hong Kong and a Master of Science in Environmental Economics and Public Policy from Rensselaer Polytechnic Institute in the United States.
1
Hong Kong imports most of its freshwater from the Dongjiang River Basin under an agreement with the Mainland authorities: a costly option for Hong Kong’s water security. The price of public water services have significantly increased, and is only set to become more expensive due to increasing competition from higher priority uses, such as maintaining the ecological function of rivers and generating hydropower. The Water Supplies Department (WSD) has also expressed concern
over potential increases in demand for water from rapidly growing cities along the Dongjiang. Other uses of the river, including the support of greater river traffic, increase competition for water resources. Hong Kong’s ageing water infrastructure further wastes the available supply through pipeline leaks, while growing population adds to the demand.
Despite government efforts to address overconsumption through initiatives like the Let’s Save 10L Water campaign, which is part of the WSD’s Total Water Management policy,1 and also in spite of high usage of seawater to flush toilets (approximately 20% of the total water supply), Hong Kong’s 2017 per capita freshwater use is around 21% higher than the global average of 110 litres per day.2 When flushing and all other water uses are taken into account, total consumption is over 220 litres per day: double the world average.
It is clear that Hong Kong needs to find alternative sources of water. Civic Exchange has previously examined the need for integrated water management in Hong Kong through the Liquid Assets Series. Its most recent study in partnership with ADM Capital Foundation and WYNG Foundation, The Illusion of Plenty (2017), provided insight into the water scarcity issues Hong Kong is facing today, and called for bolder initiatives to spur much-needed water conservation efforts.3
The key objective of this report is to explore how Hong Kong’s water infrastructure can best be deployed to meet the growing pressure on its water resources, which is driven by growing population, economic growth in the Greater Bay Area, and climate change. Not only does Hong Kong have the responsibility to ensure everyone in the region has the right to water, but Hong Kong must strengthen our own water security by increasing reliance on sources that do not depend on the natural water cycle. This research analyses both current water resources – local yield, Dongjiang water and seawater for flushing – and also sources with potential for wider use proposed by WSD, such as desalinated water and recycled water (harvested rainwater, treated grey water and reclaimed water), to determine their overall potential, while considering Hong Kong’s holistic goals as set out in its Climate Action Plan 2030+ report.
PREFACE
2 3
Civic Exchange hopes that this report will allow us to look at the water supply in an integrated and long-term way and propose solutions that could modernise the city’s overall water infrastructure into one that is sustainable, flexible and resilient while operating in financially, technologically and energy efficient ways that can take us into 2030 and beyond.
This report is divided into seven sections. The first section provides a brief background on the current water sources (or taps, as referred to by WSD) and water use in Hong Kong. The following five sections each evaluates the potential of one of the current and proposed sources. The final section presents recommendations for a way forward based on the analysis contained within each section.
This report’s sister paper, “Conservation and Consumption: Towards a Water-Smart Hong Kong”, examines where and how water is used in Hong Kong to facilitate effective strategies and policy measures that could promote conservation and decrease waste.
Natalie ChanSenior AdvisorCivic Exchange
3
ACRONYMS AND ABBREVIATIONS
DPR Direct Potable ReuseDSD Drainage Services DepartmentGDI Guangdong Investment LimitedHKD Hong Kong DollarIPR Indirect Potable ReuseMED Multi-Effect Distillation
LIST OF FIGURESFigure 1 Fresh Water Consumption in 2016, by Sector (in million m3) and as a Percentage of Total ConsumptionFigure 2 Residential Fresh Water Consumption by Application as a Percentage of TotalFigure 3 Diversification of Water Resources Figure 4 Rainfall Distribution and Catchment Areas Figure 5 Local Storage Capacity: Current and 10-Year Average Reservoir Storage Positions (in million m3)Figure 6 GDI Revenue and Operating Profit Related to Water UtilisationFigure 7 Factors for Consideration in Agreement Renewal NegotiationFigure 8 Typical Seawater Supply System (Schematic)Figure 9 Seawater Supply Zones and Location of Proposed New TownsFigure 10 Happy Valley Water Harvesting SystemFigure 11 Summary of DSD Water HarvestingFigure 12 The Urban Water CycleFigure 13 Wastewater Treatment DefinitionsFigure 14 Location of 11 Pilot Water Reclamation Plants at DSD’s Faciliites in Three GroupsFigure 15 Water Reclamation ProcessFigure 16 Examples of Domestic Water End Uses in Sydney, AustraliaFigure 17 Diagrams of Different Water Reuse RegimesFigure 18 Faecal & Total Coliform (Means)Figure 19 Reclaimed Water Reuse Trend in California, with Regional Variations in AdoptionFigure 20 Comparison of Major Desalination Technologies
LIST OF TABLESTable 1 Annual Rainfall, Local Yield and Collection PercentageTable 2 Monthly Average Inflows after Accounting for Evaporation, Seepage and Other Losses (in million m3) Table 3 Quantity of Dongjiang Water Supplied, 1989-2015 (in million m3)Table 4 Agreement Price of Dongjiang WaterTable 5 Annual Seawater and Fresh Water Flushing Volumes Based on Assumed Flushing Volumes (in million m3)Table 6 Capital Cost Estimations of the Seawater Flushing System at Different Supply Volumes (in million HK$)Table 7 Urban Land in Hong KongTable 8 DSD Treatment Plants by TypeTable 9 Suggested Water Recycling Treatment and Uses
MSF Multi-Stage FlashNPSTW Ngong Ping Sewage Treatment WorksRO Reverse OsmosisTWM Total Water ManagementUSD United States DollarWSD Water Supplies Department
4 5
CONTENTSPreface .................................................................................................................................. 1Acronyms and Abbreviations ................................................................................................ 3List of Figures ........................................................................................................................ 3List of Tables .......................................................................................................................... 3Executive Summary ............................................................................................................... 5
1 INTRODUCTION: HONG KONG’S WATER RESOURCES .............................................. 16
2 LOCAL YIELD ...................................................................................................... 20 2.1. Providing water for a barren rock 2.2. Reservoir capacity in Hong Kong 2.3. Achieving balance to maximize local collection
3 DONGJIANG WATER ............................................................................................ 26 3.1. The growing cost of water security 3.2. Particulars related to the Dongjiang agreement 3.3. Purchase agreement management and economics 3.4. Rethinking our position
4 SEAWATER FLUSHING ......................................................................................... 34 4.1. A historic solution 4.2. Economics of flushing in Hong Kong 4.3. Estimating current costs and usage 4.4. Waves of change
5 RECYCLED WATER .............................................................................................. 42 5.1. Harvested rainwater and treated grey water 5.2. Reclaimed water
6 DESALINATED WATER ......................................................................................... 62 6.1. Previous experience 6.2. Desalination and Hong Kong’s broader goals 6.3. Desalination approaches 6.4. From one vulnerability to another
7 Conclusion and recommendations ............................................................... 67 7.1. Set an ambitious vision for the deployment of reclaimed water in non-potable uses 7.2. Reconsider the necessary conditions for deploying desalination as a backup option of freshwater supply 7.3. Develop a closer partnership between WSD and DSD 7.4. Increase granularity and transparency of data to improve water supply planning
Endnotes ............................................................................................................................. 72
5
EXECUTIVE SUMMARY
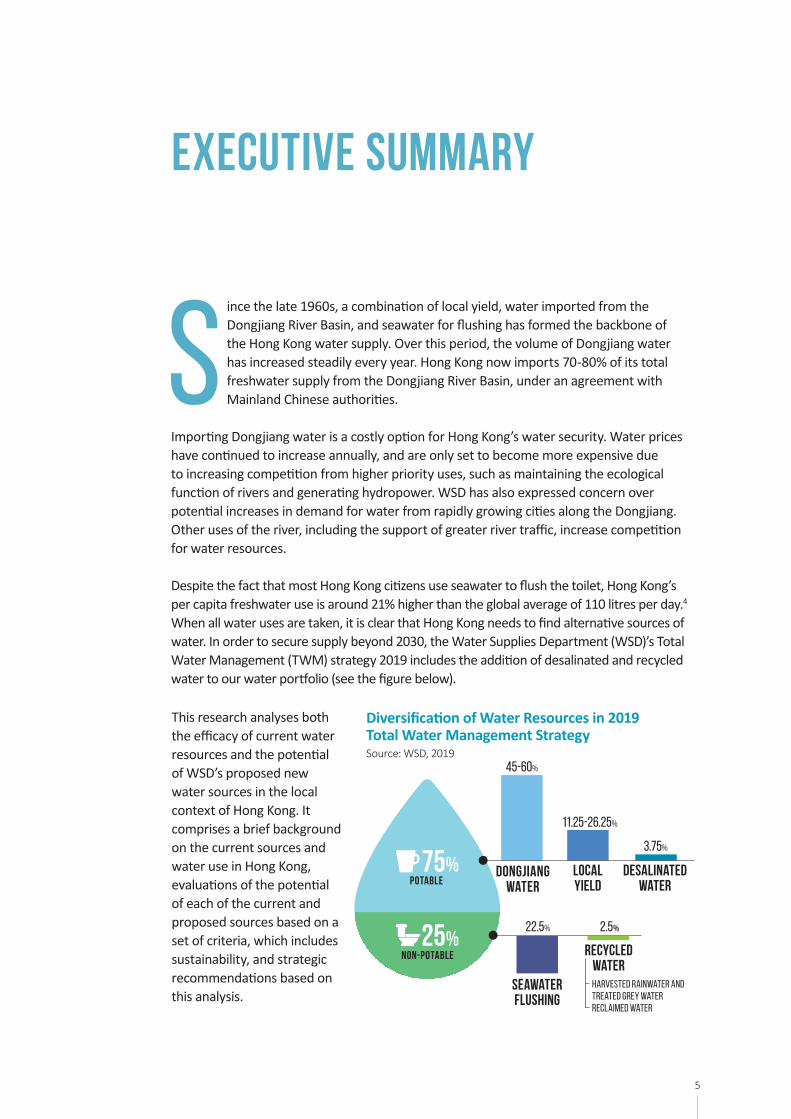
S ince the late 1960s, a combination of local yield, water imported from the Dongjiang River Basin, and seawater for flushing has formed the backbone of the Hong Kong water supply. Over this period, the volume of Dongjiang water has increased steadily every year. Hong Kong now imports 70-80% of its total freshwater supply from the Dongjiang River Basin, under an agreement with Mainland Chinese authorities.
Importing Dongjiang water is a costly option for Hong Kong’s water security. Water prices have continued to increase annually, and are only set to become more expensive due to increasing competition from higher priority uses, such as maintaining the ecological function of rivers and generating hydropower. WSD has also expressed concern over potential increases in demand for water from rapidly growing cities along the Dongjiang. Other uses of the river, including the support of greater river traffic, increase competition for water resources.
Despite the fact that most Hong Kong citizens use seawater to flush the toilet, Hong Kong’s per capita freshwater use is around 21% higher than the global average of 110 litres per day.4 When all water uses are taken, it is clear that Hong Kong needs to find alternative sources of water. In order to secure supply beyond 2030, the Water Supplies Department (WSD)’s Total Water Management (TWM) strategy 2019 includes the addition of desalinated and recycled water to our water portfolio (see the figure below).
This research analyses both the efficacy of current water resources and the potential of WSD’s proposed new water sources in the local context of Hong Kong. It comprises a brief background on the current sources and water use in Hong Kong, evaluations of the potential of each of the current and proposed sources based on a set of criteria, which includes sustainability, and strategic recommendations based on this analysis.
45-60%
LOCAL YIELD
DONGJIANG WaTER
11.25-26.25%
Desalinated water
3.75%
SEAWaTERFLUSHING
RECYCLED water
22.5% 2.5%
Harvested rainwater AND treated grey waterReclaimed water
25%NON-POTABLE
POTABLE75%
Diversification of Water Resources in 2019 Total Water Management StrategySource: WSD, 2019
6 7
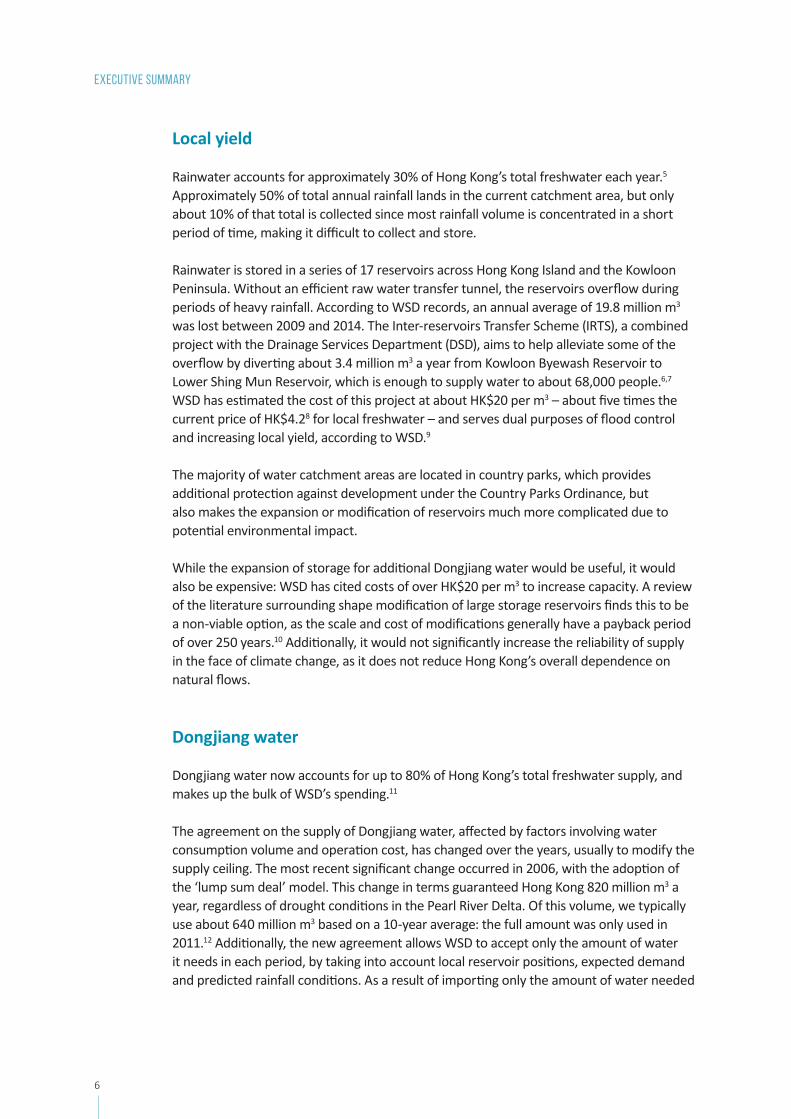
Local yield
Rainwater accounts for approximately 30% of Hong Kong’s total freshwater each year.5 Approximately 50% of total annual rainfall lands in the current catchment area, but only about 10% of that total is collected since most rainfall volume is concentrated in a short period of time, making it difficult to collect and store.
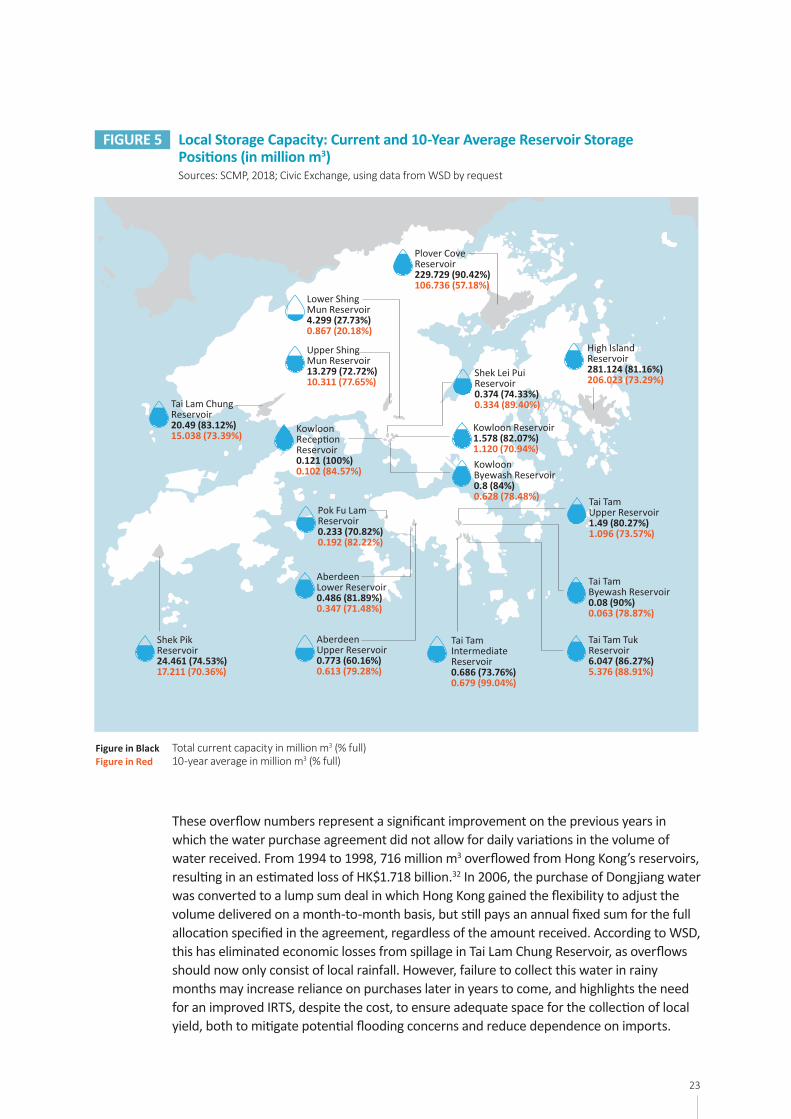
Rainwater is stored in a series of 17 reservoirs across Hong Kong Island and the Kowloon Peninsula. Without an efficient raw water transfer tunnel, the reservoirs overflow during periods of heavy rainfall. According to WSD records, an annual average of 19.8 million m3 was lost between 2009 and 2014. The Inter-reservoirs Transfer Scheme (IRTS), a combined project with the Drainage Services Department (DSD), aims to help alleviate some of the overflow by diverting about 3.4 million m3 a year from Kowloon Byewash Reservoir to Lower Shing Mun Reservoir, which is enough to supply water to about 68,000 people.6,7 WSD has estimated the cost of this project at about HK$20 per m3 – about five times the current price of HK$4.28 for local freshwater – and serves dual purposes of flood control and increasing local yield, according to WSD.9
The majority of water catchment areas are located in country parks, which provides additional protection against development under the Country Parks Ordinance, but also makes the expansion or modification of reservoirs much more complicated due to potential environmental impact.
While the expansion of storage for additional Dongjiang water would be useful, it would also be expensive: WSD has cited costs of over HK$20 per m3 to increase capacity. A review of the literature surrounding shape modification of large storage reservoirs finds this to be a non-viable option, as the scale and cost of modifications generally have a payback period of over 250 years.10 Additionally, it would not significantly increase the reliability of supply in the face of climate change, as it does not reduce Hong Kong’s overall dependence on natural flows.
Dongjiang water
Dongjiang water now accounts for up to 80% of Hong Kong’s total freshwater supply, and makes up the bulk of WSD’s spending.11
The agreement on the supply of Dongjiang water, affected by factors involving water consumption volume and operation cost, has changed over the years, usually to modify the supply ceiling. The most recent significant change occurred in 2006, with the adoption of the ‘lump sum deal’ model. This change in terms guaranteed Hong Kong 820 million m3 a year, regardless of drought conditions in the Pearl River Delta. Of this volume, we typically use about 640 million m3 based on a 10-year average: the full amount was only used in 2011.12 Additionally, the new agreement allows WSD to accept only the amount of water it needs in each period, by taking into account local reservoir positions, expected demand and predicted rainfall conditions. As a result of importing only the amount of water needed
EXECUTIVE SUMMARY
7
in lieu of being required to accept a fixed amount, medium-sized reservoirs, such as Tai Lam Chung, have been less subject to overflows, and adjusting the timing of purchases has made it possible for additional local yield to be stored. Additionally, when reservoir overflows do occur, according to WSD, it is now only local water that is lost, making overflows less costly. While this may seem like a good deal, it does have some drawbacks. Hong Kong is required to pay the full amount stipulated in the agreement, regardless of how much water it actually uses, meaning the true cost of the water is actually higher than that listed in the purchase agreement. Since WSD has frozen water charges since February 1995, only about 30% of its income comes from tariffs, while the rest is covered by subsidies (i.e. contribution on rates).
As demand for water in Hong Kong continues to grow, and without significant alternative sources of supply, Hong Kong will inevitably rely increasingly on Dongjiang water. Hong Kong can consider renegotiating the nature of its agreement with the Guangdong authorities to safeguard the interests of Hong Kong, particularly regarding cost. There are certain forms a new deal could take to maintain stability of Dongjiang water prices over the years, or set a lower fixed portion with a variable portion available as needed, which could even be charged at a higher price to encourage conservation efforts. There are still potential savings here, as Hong Kong would only need to pay for what it used, instead of the full bulk rate paid now. There are also benefits available to the Pearl River Delta here, as moving Hong Kong away from dependence on this water frees it up for other cities in the Delta like Shenzhen, which are facing severe future water shortages.
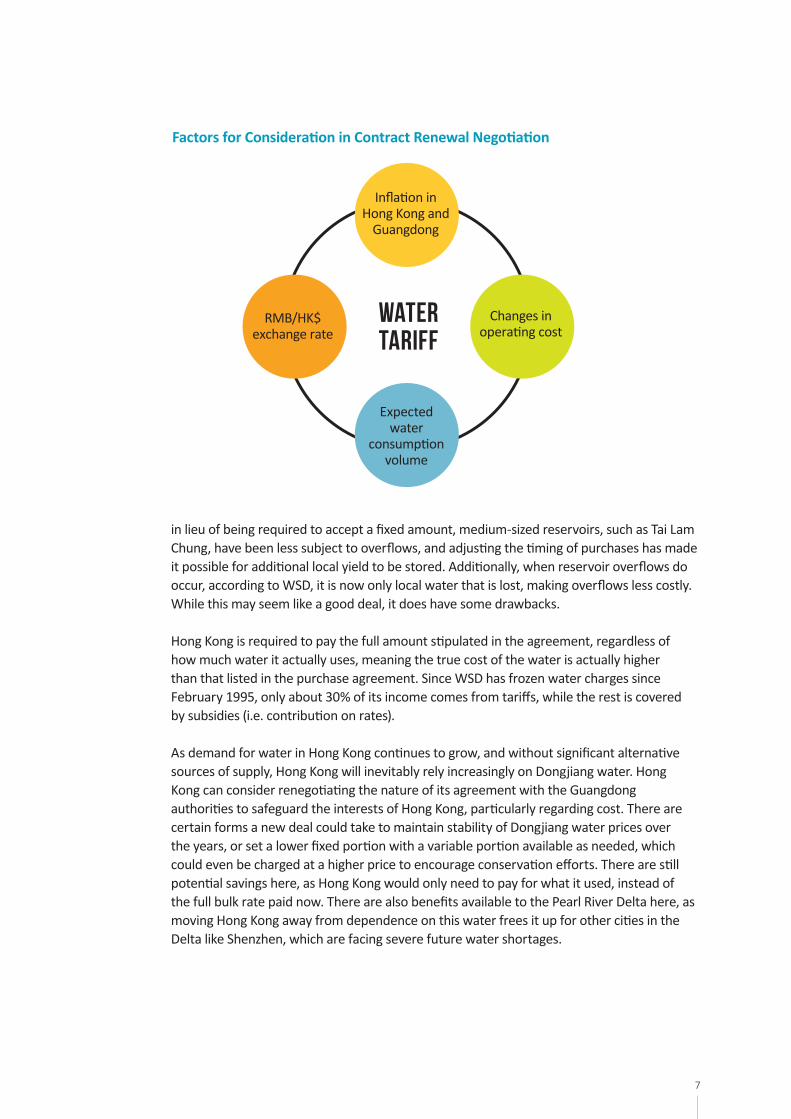
WATER TARIFF
Inflation in Hong Kong and
Guangdong
RMB/HK$ exchange rate
Changes in operating cost
Expected water
consumption volume
Factors for Consideration in Contract Renewal Negotiation
8 9
Since Dongjiang water makes up the single largest portion of annual costs, it is becoming an impediment to growth in research and investment in alternative technologies. With the user-pay principle unable to be realised as discussed in our sister report, “Conservation and Consumption: Towards a Water-Smart Hong Kong”, Dongjiang water has put WSD in constant deficit. Without any of its own internal funds, WSD cannot conduct any research or undertake any projects unless it receives additional funds from the Hong Kong Legislative Council (LegCo), which already grants it nearly HK$7 billion a year in subsidies.
In order to control costs and ensure it can continue to maintain a secure and economical water supply for its citizens, Hong Kong must develop alternatives to lessen its reliance on Dongjiang water. Additionally, Dongjiang water is still susceptible to changes in natural flow, and in the event of a severe drought, there is always the potential for a shortfall, regardless of what the agreement guarantees. While it will unlikely be economically practical for Hong Kong not to purchase water, a reduction in this reliance will increase the overall resilience of the water supply mix in the face of population and economic growth, competition in the PRD on water resources and global climate change.
Seawater flushing
Hong Kong is one of the few coastal cities that maintains a dual-reticulation, or separated, plumbing system to deliver both fresh and seawater. The latter is used for toilet flushing. For the last 60 years, this system has been integral in ensuring Hong Kong’s water security by offsetting a significant proportion of freshwater use. The economics of its further expansion and future use are, however, less clear.
WSD decided to begin supplying seawater free of charge in 1972 to increase adoption. While it did not directly charge for the seawater, due to the inability to meter its use, the Department intended to recover system costs indirectly through the drinking water tariff. Despite initial difficulties in convincing people to adopt seawater flushing, WSD’s policy and pricing efforts have resulted in seawater being supplied to approximately 85% of the population for flushing, as of 2017, accounting for 22% of the total water supply.13 This supply comes a relatively low average unit cost when compared to that of freshwater (a blend of Dongjiang water and local yield) at HK$16.6 per m3. Daily per capita flushing water consumption has increased continuously in the last decade.
Studies have found that the two most important factors determining whether seawater flushing is economical are population density and distance from the coast. The population density should exceed 3,000 people per km2, and the seawater should be pumped less than 30 km, or even less if the elevation is high. As Hong Kong continues to develop and its population migrate into less dense areas away from the coast, the factors that made the system cost-effective will begin to diminish.
WSD has begun to address this issue by looking into alternative flushing water supplies for areas far from the coast, such as the New Territories, where the use of seawater flushing is economically inefficient compared to those of freshwater and other alternatives such as harvested rainwater and reclaimed water. These alternatives also provide WSD with more flexibility, as they can be leveraged to cover non-potable demand beyond flushing.
EXECUTIVE SUMMARY
9
As Hong Kong adopts more green building standards, with special regard to dual flush toilets, the overall demand for flushing water will begin to decrease. WSD estimates that on average, Hong Kong residents used 92.3 litres per day for flushing their toilets in 2016, based on both seawater and freshwater usage. If Hong Kong adopts a level of technology equivalent to that of Singapore14 or Macau15, which use 28.8 and 35 litres per day respectively, WSD would only need to supply approximately 100 million m3 of seawater for flushing to seawater end users. At this rate, the unit cost of seawater flushing would potentially be as high as HK$7.87, due to the increasing proportion of capital cost in each unit. That would make other alternatives more cost-effective for WSD, not to mention the external impacts, such as those on building owners who would no longer have to worry about the increased corrosion of their appliances resulting from seawater, which are not typically considered in these analyses.
Recycled water
WSD is looking into increasing the network coverage of lower grade water by expanding the use of seawater flushing and recycled water, comprising harvested rainwater, treated grey water and reclaimed water, for non-potable purposes.
Harvested rainwater and treated grey water Harvested rainwater is the rainwater collected from surfaces such as roofs and stored for future use, whereas grey water is the water collected from showers, kitchen sinks and laundry machines etc. that can then be treated for use. By mid-2019, rainwater harvesting or grey water recycling systems have been installed in new buildings as part of approximately 100 government projects, which is in line with the government’s green building policies.16 The new development of the Anderson Road Quarry Site, which will be discussed in section 5.1, plans to use a combination of rainwater harvesting and grey water recycling systems, installed and managed by WSD, to offset freshwater usage for flushing.
Based on studies carried out across Australia, the cost of rainwater harvesting is highly variable and will most likely be greater than other low-cost alternatives on the Hong Kong market.17 A study carried out in Hong Kong found that a typical rooftop harvesting system was only able to provide 25% of the water required for washing machines in a high-rise building.18 It found that a minimum catchment area of 900 m2 would be necessary for the system to be financially viable, with an ideal catchment of about 2,000 m2 for a typical Hong Kong residential building. This amount of space would make harvesting generally unattractive and potentially impractical for a typical private building.
While the use of rainwater harvesting is limited by the high costs associated with land and limited available space, the ability to collect runoff in urban areas would be beneficial for reducing flash flooding during periods of high rainfall. The expansion of reservoirs and harvesting would be of greater benefit as a way of preventing flooding than as a means to support drinking water supply, as their reliance on natural flows does little to increase overall resilience in times of drought.
10 11
If WSD and DSD can work closely together, it would be possible to divert rainfall during periods in which flooding has historically been problematic, thereby reducing the impact and damage caused by these events over time. By combining the value of flood prevention with water resources, projects that were considered too expensive may become economically viable.
Reclaimed waterReclaimed water is essentially wastewater that has been treated to standards consistent with local water quality regulations. It is becoming an increasingly common water resource around the globe, particularly for potable use. In Hong Kong, it can be used to offset freshwater demand, similar to current use of seawater for flushing.
While treating reclaimed water to potable standards would not be practical or economically viable in Hong Kong, it can compete with freshwater supply alternatives such as desalinated water and Dongjiang water for a range of non-potable uses. Due to a wide range of potential applications, freshwater demand can be partially offset, particularly in the non-domestic sectors. However wide-scale implementation will face challenges in both public acceptance and the development of necessary infrastructure and institutional knowledge.
DSD has already launched a pilot scheme to gain experience and determine the feasibility of reclaimed water use in Hong Kong. Commissioned in 2006, the Ngong Ping Sewage Treatment Works (Ngong Ping STW) on Lantau Island became both the first tertiary treatment works and reclaimed water facility to operate in Hong Kong. The plant provides sewage treatment for approximately 40,000 residents and tourists, delivering 140 m3 per day of reclaimed water for irrigation, fish rearing and toilet flushing.19 According to DSD, Ngong Ping STW makes use of advanced chemical, biological, filtering and disinfection processes to ensure that the reclaimed water provided is purified, odourless and safe for a wide range of non-potable uses.
DSD also commissioned 11 additional small-scale water reclamation trial plants in 2010.20 Based on the results of these pilot tests, DSD found that plants that received non-saline wastewater that had undergone secondary treatment required less energy and chemical input, while the plants that received saline effluent following primary treatment required significantly more energy, at times on a par with desalination.
For Hong Kong, the adoption of reclaimed water for flushing and other non-potable uses, in particular in the New Territories, makes sense from both an economic perspective and for environmental resilience. However, the overall ability to harness this resource outside of these areas, to replace freshwater flushing or for provision to the industrial and commercial sectors, is hampered by the presence of seawater in the wastewater stream, which makes reclamation difficult and expensive. Additionally, the majority of Hong Kong’s wastewater treatment plants rated as preliminary, primary, or minor secondary, which do not produce treated water of a suitable quality for reuse. Further, the wastewater streams treated at
EXECUTIVE SUMMARY
11
these plants are brackish, meaning the potential applications of reclaimed water are limited without significant capital investment or operational expenses on the part of DSD.
Based on WSD estimates, reclaimed water can be provided for non-potable uses in Hong Kong for about HK$6.5 per m3, making it 35% cheaper than the current cost of Dongjiang water, in addition to being a drought-resilient resource. By investing in technologies that will make it possible to harvest and supply this water for a wide range of non-potable uses, Hong Kong can secure a low-cost water resource that is drought-resilient and provides environmental benefits in terms of both reduced energy usage and improved local water quality.
Desalinated Water
Desalinated water is currently planned to contribute 5% of projected total freshwater demand beginning in 2023, on a stand-by basis. It is important to take into account how the technology for this alternative water resource fits in with Hong Kong’s other goals. These include the Hong Kong 2030+ Plan, which calls not just for an adequate water supply, but for a “smart, green and resilient infrastructure that should be well-integrated for better synergy and land efficiency.”21
In spite of its drought-resilient nature, desalination is energy-intensive and potentially environmentally damaging. This high energy intensity makes desalination costly and can lead to significant increases in carbon emissions if the fuel mix used to produce this energy comes from coal or fossil fuels. For these reasons, its large-scale use is not advisable in Hong Kong. Considering that Hong Kong is looking for solutions that are climate-resilient and green, this strategy of producing 5% or more of fresh water from desalination is counter-productive to those goals.
While Hong Kong lacks local water resources, its access to Dongjiang water from Guangdong is currently cheaper than desalination and may remain so under future purchase agreements. Furthermore, water reclamation presents a similarly drought-resilient water source that can produce high-quality water with less energy and at a lower cost. When viewed in this context, it is difficult to support the advocacy by LegCo and WSD for significant investment in desalination.
That is not to say that desalination will never be a practical option. There are several technologies under development, such as electro-desalination which is being pilot tested in Singapore, that have the potential to lower the energy requirements of desalination, but they are still operating at the lab or pilot level and have yet to be proven on the scale needed to be commercially viable. The use of renewable energy could also make desalination more attractive by offsetting both energy costs and associated emissions. However, until these technologies become available, desalination will remain impractical for Hong Kong, as it would prove costly for its residents.
12 13
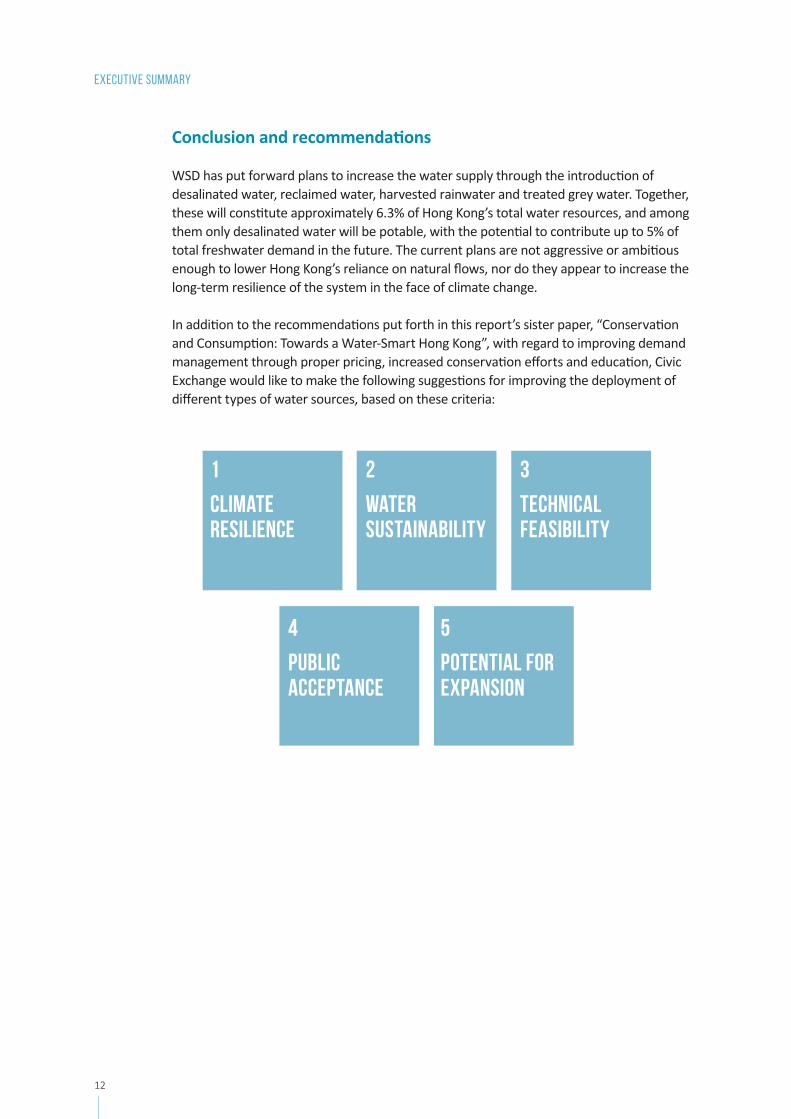
Conclusion and recommendations
WSD has put forward plans to increase the water supply through the introduction of desalinated water, reclaimed water, harvested rainwater and treated grey water. Together, these will constitute approximately 6.3% of Hong Kong’s total water resources, and among them only desalinated water will be potable, with the potential to contribute up to 5% of total freshwater demand in the future. The current plans are not aggressive or ambitious enough to lower Hong Kong’s reliance on natural flows, nor do they appear to increase the long-term resilience of the system in the face of climate change.
In addition to the recommendations put forth in this report’s sister paper, “Conservation and Consumption: Towards a Water-Smart Hong Kong”, with regard to improving demand management through proper pricing, increased conservation efforts and education, Civic Exchange would like to make the following suggestions for improving the deployment of different types of water sources, based on these criteria:
EXECUTIVE SUMMARY
1
Climate resilience
2
Water sustainability
3
Technical feasibility
4
Public acceptance
5
POTENTIAL FOR EXPANSION
13
Water Resource Snapshot
CURRENT AVERAGE UNIT PRICE
CLIMATE RESILIENCE
ADAPTABILITY
POTABLE
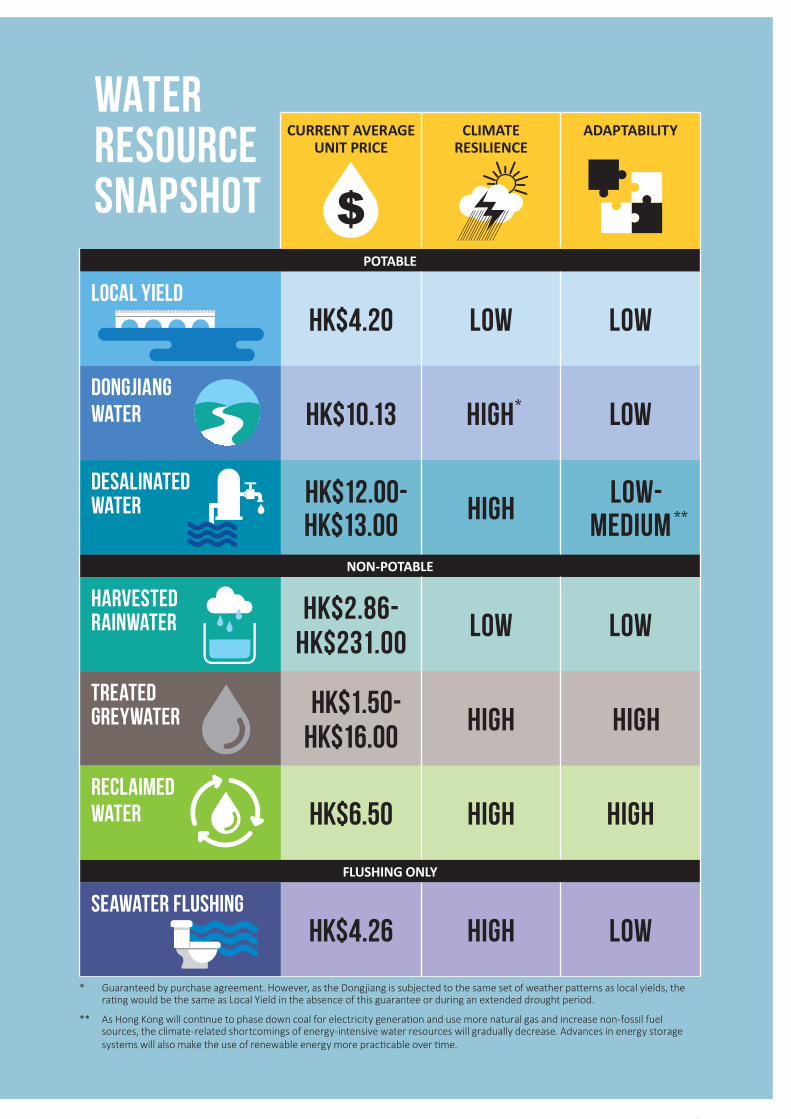
Local yieldHK$4.20 Low Low
Dongjiang water HK$10.13 High* LOW
Desalinated water HK$12.00-
HK$13.00 High Low- Medium
NON-POTABLE
HarvestED RAINWATER HK$2.86-
HK$231.00Low Low
TREATED GREYWATER HK$1.50-
HK$16.00High HIGH
Reclaimed Water HK$6.50 High High
FLUSHING ONLY
Seawater FLUSHINGHK$4.26 High Low
* Guaranteedbypurchaseagreement.However,astheDongjiangissubjectedtothesamesetofweatherpatternsaslocalyields,theratingwouldbethesameasLocalYieldintheabsenceofthisguaranteeorduringanextendeddroughtperiod.
** AsHongKongwillcontinuetophasedowncoalforelectricitygenerationandusemorenaturalgasandincreasenon-fossilfuelsources,theclimate-relatedshortcomingsofenergy-intensivewaterresourceswillgraduallydecrease.Advancesinenergystoragesystemswillalsomaketheuseofrenewableenergymorepracticableovertime.
14 15
1. Set an ambitious vision for the deployment of reclaimed water in non-potable usesCurrently, WSD plans to deploy just 2.5% of recycled water, which includes reclaimed water as well as harvested rainwater and treated grey water, for non-potable uses, with no further breakdown of these uses due to the relative insignificance of this source. We propose a more ambitious vision of 20% should be set to cover non-potable uses, including freshwater flushing (7.9%) and the demands of the construction and industrial sectors (2.2% and 6.1% of total water demand, respectively). In other words, the 20% of reclaimed water represents savings of 197 million m3 or the freshwater usage of the entire government establishments and flushing sector. This seemingly ambitious vision of 20% can be achieved through efforts to increase public acceptance and the development of necessary infrastructure and institutional knowledge to deliver it.
Replacement of freshwater flushing with reclaimed water in existing areas and future new town developments makes sense from both a logistical and an economic perspective, as it is too expensive to supply them with seawater, due to the cost of transmission.
2. Reconsider the necessary conditions for deploying desalination as a backup option of freshwater supplyWhile WSD has regarded desalination as a strategic water resource which is not susceptible to the impacts of climate change and could provide Hong Kong with a drought-proof source of water, we must consider the overall impacts of the technology when deciding how much to invest in it. Producing our water through desalination has the potential to substantially increase associated electricity demand, particularly once distribution is considered, which will lead to corresponding increases in greenhouse gas emissions, exacerbating climate change effects such as droughts in the future. Further, the potential impacts of desalination on the water supply could be more easily and cheaply met with improved conservation and policy efforts, such as the suggestions put forth in our sister paper, “Conservation and Consumption: Towards a Water-Smart Hong Kong”.
Beyond the climate change links, researchers have become increasingly concerned with impacts on marine biodiversity and ecosystems linked to desalination operations. Sourcing freshwater using methods that are less energy-intensive and have less impact on the environment, in conjunction with adherence to strict water conservation measures, is preferable for both economic and environmental reasons in most situations.
3. Develop a closer partnership between WSD and DSDIn the Local Yield and Harvested Rainwater sections, we discuss how reservoir balancing and additional harvesting are inefficient methods for increasing Hong Kong’s water resources due to their high cost. However, when benefits associated with reduced flooding are considered, the economics of these projects is impacted significantly. When WSD and DSD work together to develop shared solutions, these external benefits can be considered in tandem with benefits to water supply, making projects that are traditionally considered too expensive from the perspective of either department more cost-effective. This approach would also be more in line with the goals put forward in the Hong Kong 2030+ strategy, which considers the city’s blue infrastructure in a more holistic way.
EXECUTIVE SUMMARY
15
4. Increase granularity and transparency of data to improve water supply planningCurrently, seawater flushing is entirely unmetered while freshwater flushing is only metered at the building level. This makes it difficult to accurately determine usage and leakage within the system accurately, as the number of users of each type is unknown. Information provided to users at the household level is therefore incomplete, as this usage must be estimated. Further complicating matters is the lack of timely access to this information, as water bills are only generated once every four months, which makes it difficult for users to quickly notice and respond to leaks, or receive positive feedback about conservation efforts.
Upgrading the network to include broad coverage of smart meters is needed not only to inform WSD how much water is used, but also to increase the awareness of end users, as well as to encourage conservation and accelerate responses to leakages. As long as this data is unavailable, it will be impossible to determine the true efficiency of the system and to compare it with potential alternatives. Billing systems could also be redesigned to include more accurate information and allow for usage comparisons across local areas and with the city average. While the conservation benefits of access to usage data are described in our sister paper, “Conservation and Consumption: Towards a Water-Smart Hong Kong”, it would also allow WSD to assess more accurately the volume of flushing water used and would better highlight the economics of seawater flushing versus its alternatives going forward.
16 17
Introduction:
Hong Kong’s water resources
Ever since it was founded, Hong Kong has been forced to be both proactive and innovative in its efforts to expand drinking water supplies, to ensure they meet the challenges posed by the ever-growing needs of both its population and economy. By the late 1950s, its local supplies, which came from rainfall stored in reservoirs, were under significant strain and would soon be insufficient to meet the burgeoning post-war population’s growing demand for water. Alternative sources, such as desalinated water and seawater, were pursued to maximise local resources and limit water imports due to the colonial government’s concern about buying water from Mainland China. When the global energy crisis hit in the 1970s, desalinated water became untenable due to the high energy costs entailed, and the local government had no other but to increase reliance on water imports to secure a stable water supply and prevent the need for rationing. This combination of local yield, Dongjiang water and seawater flushing has formed the backbone of the water supply since they began in the late 1960s. Over this time, this initially small volume of Dongjiang water has increased steadily every year, and now makes up the bulk of Hong Kong’s water resources, accounting for between 70% and 80% of total freshwater use, which stands at 980 million m3 in 2017.22 According to the Guangdong Province’s water resources department, the annual average flow of the Dongjiang during the past three years was 25.4 billion m3, 23% lower than the historical average of 33.1 billion m3 from 1956 to 2005.23 In comparison, the annual consumption of raw water from the Dongjiang by residents of Hong Kong and eight key cities in Guangdong amounts to over 10 billion m3, suggesting the growing risk of a water shortage in the near future.24
Continuing to rely on such a large percentage of Dongjiang water, which is susceptible to changes in flow due to climate change, would therefore be a riskier proposition going forward, both in terms of the price of supply for Hong Kong, and in terms of the overall quantity for the Pearl River Delta. Of the three current water resources, only local yield and purchased water are relied on to meet daily requirements for drinking water, showering, cooking and all other activities apart from toilet flushing
1
17
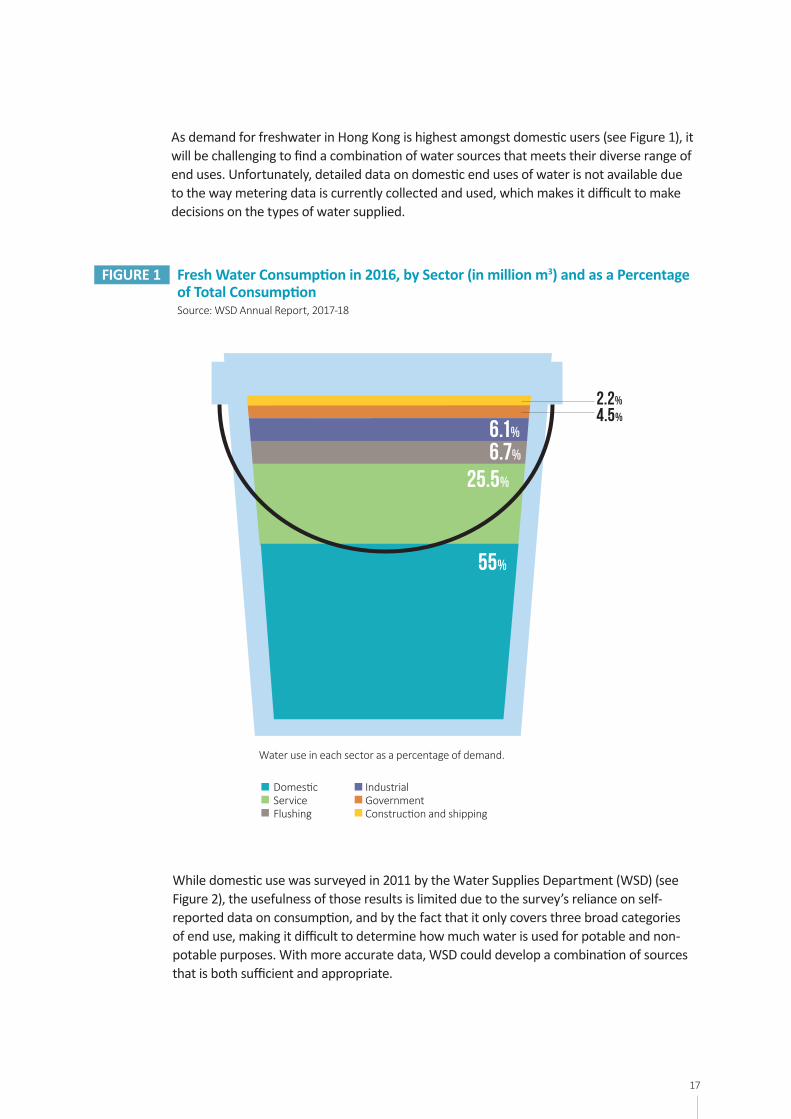
As demand for freshwater in Hong Kong is highest amongst domestic users (see Figure 1), it will be challenging to find a combination of water sources that meets their diverse range of end uses. Unfortunately, detailed data on domestic end uses of water is not available due to the way metering data is currently collected and used, which makes it difficult to make decisions on the types of water supplied.
FIGURE 1 Fresh Water Consumption in 2016, by Sector (in million m3) and as a Percentage of Total Consumption
Source:WSDAnnualReport,2017-18
Water use in each sector as a percentage of demand.
DomesticService Flushing
IndustrialGovernmentConstructionandshipping
55%
25.5%
6.7%
2.2%
4.5%
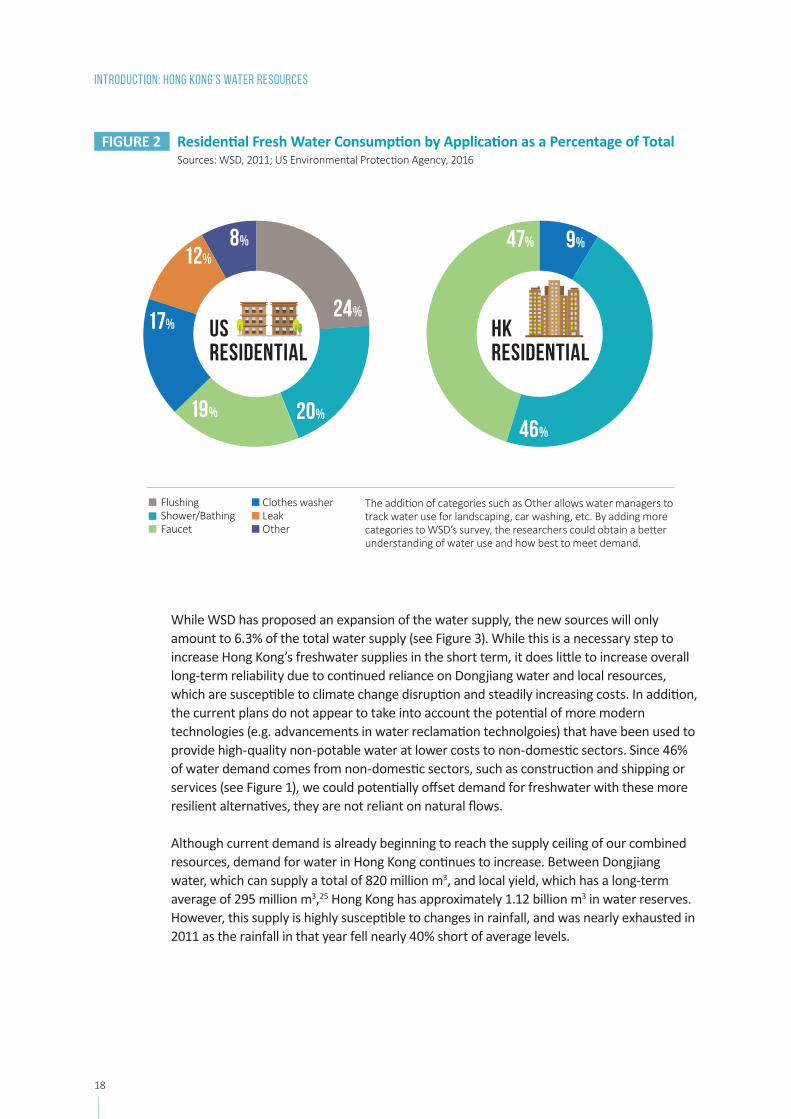
While domestic use was surveyed in 2011 by the Water Supplies Department (WSD) (see Figure 2), the usefulness of those results is limited due to the survey’s reliance on self-reported data on consumption, and by the fact that it only covers three broad categories of end use, making it difficult to determine how much water is used for potable and non-potable purposes. With more accurate data, WSD could develop a combination of sources that is both sufficient and appropriate.
6.1%
18 19
While WSD has proposed an expansion of the water supply, the new sources will only amount to 6.3% of the total water supply (see Figure 3). While this is a necessary step to increase Hong Kong’s freshwater supplies in the short term, it does little to increase overall long-term reliability due to continued reliance on Dongjiang water and local resources, which are susceptible to climate change disruption and steadily increasing costs. In addition, the current plans do not appear to take into account the potential of more modern technologies (e.g. advancements in water reclamation technolgoies) that have been used to provide high-quality non-potable water at lower costs to non-domestic sectors. Since 46% of water demand comes from non-domestic sectors, such as construction and shipping or services (see Figure 1), we could potentially offset demand for freshwater with these more resilient alternatives, they are not reliant on natural flows.
Although current demand is already beginning to reach the supply ceiling of our combined resources, demand for water in Hong Kong continues to increase. Between Dongjiang water, which can supply a total of 820 million m3, and local yield, which has a long-term average of 295 million m3,25 Hong Kong has approximately 1.12 billion m3 in water reserves. However, this supply is highly susceptible to changes in rainfall, and was nearly exhausted in 2011 as the rainfall in that year fell nearly 40% short of average levels.
TheadditionofcategoriessuchasOtherallowswatermanagerstotrackwateruseforlandscaping,carwashing,etc.ByaddingmorecategoriestoWSD’ssurvey,theresearcherscouldobtainabetterunderstanding of water use and how best to meet demand.
FIGURE 2 Residential Fresh Water Consumption by Application as a Percentage of Total Sources:WSD,2011;USEnvironmentalProtectionAgency,2016
Introduction: Hong Kong’s water resources
FlushingShower/BathingFaucet
ClotheswasherLeakOther
US Residential
HK Residential
46%
47% 9%
20%19%
17%24%
12%8%
19
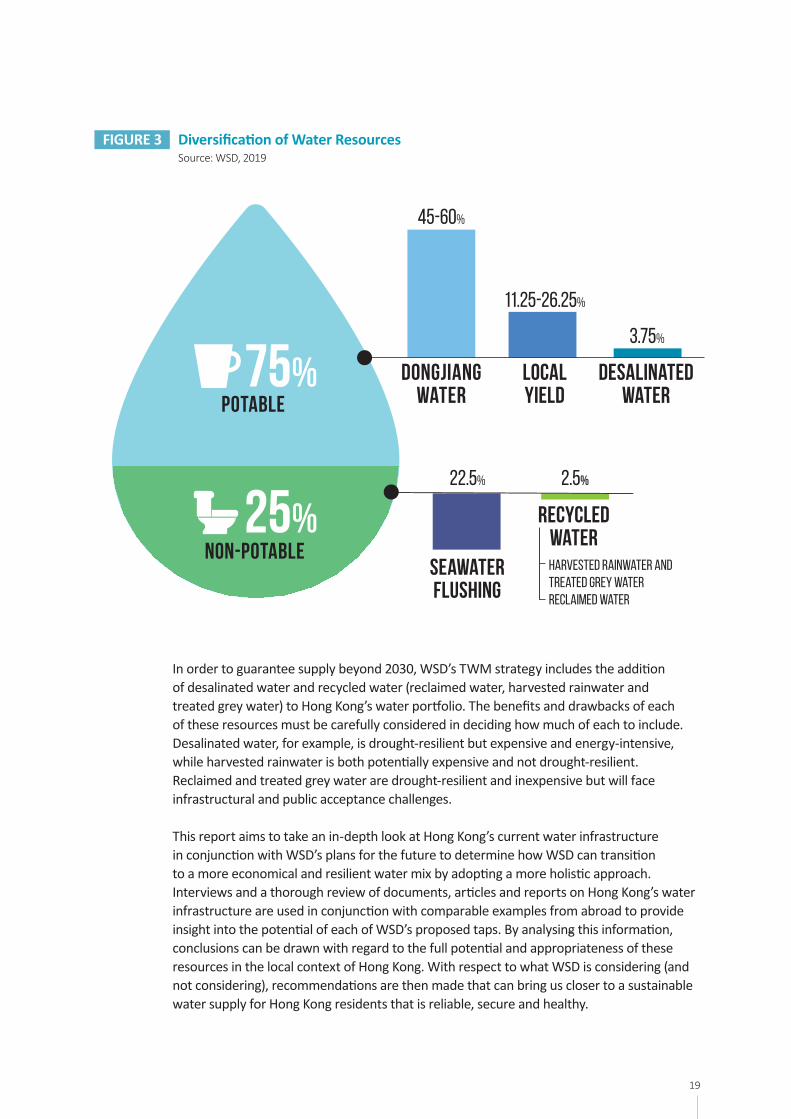
FIGURE 3 Diversification of Water Resources Source: WSD, 2019
In order to guarantee supply beyond 2030, WSD’s TWM strategy includes the addition of desalinated water and recycled water (reclaimed water, harvested rainwater and treated grey water) to Hong Kong’s water portfolio. The benefits and drawbacks of each of these resources must be carefully considered in deciding how much of each to include. Desalinated water, for example, is drought-resilient but expensive and energy-intensive, while harvested rainwater is both potentially expensive and not drought-resilient. Reclaimed and treated grey water are drought-resilient and inexpensive but will face infrastructural and public acceptance challenges.
This report aims to take an in-depth look at Hong Kong’s current water infrastructure in conjunction with WSD’s plans for the future to determine how WSD can transition to a more economical and resilient water mix by adopting a more holistic approach. Interviews and a thorough review of documents, articles and reports on Hong Kong’s water infrastructure are used in conjunction with comparable examples from abroad to provide insight into the potential of each of WSD’s proposed taps. By analysing this information, conclusions can be drawn with regard to the full potential and appropriateness of these resources in the local context of Hong Kong. With respect to what WSD is considering (and not considering), recommendations are then made that can bring us closer to a sustainable water supply for Hong Kong residents that is reliable, secure and healthy.
45-60%
LOCAL YIELD
DONGJIANG WaTER
11.25-26.25%
Desalinated water
3.75%
SEAWaTERFLUSHING
RECYCLED water
22.5% 2.5%
Harvested rainwater AND treated grey waterReclaimed water
25%NON-POTABLE
POTABLE75%
20 21
Local yield
Hong Kong has relied upon local yield, provided by rainfall and stored in reservoirs, for most of its history. While this resource has been dwarfed by Dongjiang water in recent decades, it is still one of the most important water resources we have, providing approximately 30% of total freshwater supplies each year.26 While Hong Kong does receive a significant amount of rainfall each year, further collection is hampered by highly uneven rainfall distribution and frequency.27 The current catchment areas are those that receive the bulk of all rainfall, making further expansion difficult and expensive, and meaning only marginal improvements are practical. Some additional projects may, however, become more attractive through closer partnering with DSD, which would allow for flood control benefits to be included in their assessments.
2.1. Providing water for a barren rock
Hong Kong’s nickname of “a barren rock” is partially due to its lack of local water resources. With no naturally occurring lakes or rivers and insubstantial ground water resources, most of the freshwater in Hong Kong was supplied by just five wells when the colony was founded in 1841.28 As the colony began to grow, economic and population growth pressures forced the government to deal with increasing demand for water; the private sector had little desire to involve itself in this aspect of Hong Kong’s infrastructure, due to the difficulty involved.29 Efforts to meet growing demand consisted solely of the development of local catchment for the collection of rainfall. This entailed the construction of impounding reservoirs (basins in the valley of a stream or river) and the designation of corresponding protected impounding grounds. These reservoirs would constitute the entirety of the water supply for over 100 years, until the development of the seawater flushing system and the agreement to purchase water from the Dongjiang.
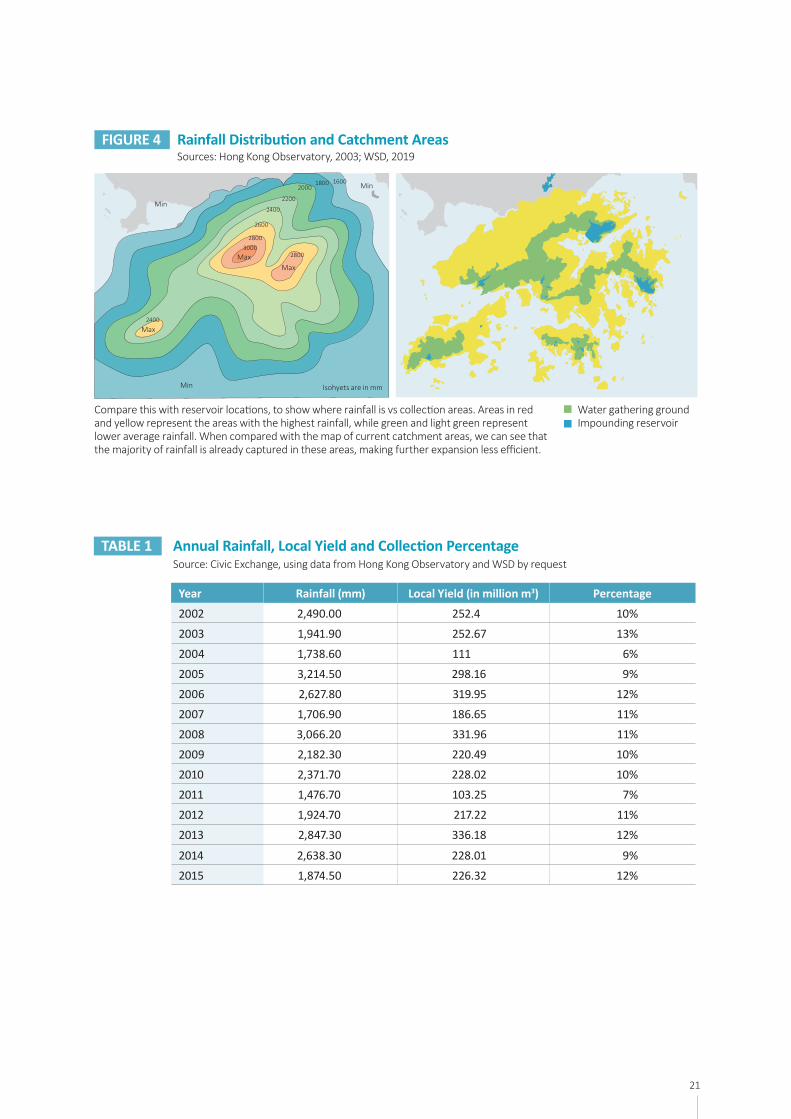
Converting significant volumes of local rainfall into local yield is complicated, as rainfall in Hong Kong is not evenly distributed across the territory or throughout the year (see Figure 4). The amount of runoff collected depends on the capacity of the soil to absorb it, and efforts to increase local yield have led to a policy of afforestation in catchment areas. Approximately 50% of total annual rain falls in the current catchment areas, but only about 10% of that annual total is collected due to its highly concentrated nature (see Table 1).
2
21
FIGURE 4 Rainfall Distribution and Catchment Areas Sources:HongKongObservatory,2003;WSD,2019
Comparethiswithreservoirlocations,toshowwhererainfallisvscollectionareas.Areasinredandyellowrepresenttheareaswiththehighestrainfall,whilegreenandlightgreenrepresentloweraveragerainfall.Whencomparedwiththemapofcurrentcatchmentareas,wecanseethatthemajorityofrainfallisalreadycapturedintheseareas,makingfurtherexpansionlessefficient.
Year Rainfall (mm) Local Yield (in million m3) Percentage
2002 2,490.00 252.4 10%
2003 1,941.90 252.67 13%
2004 1,738.60 111 6%
2005 3,214.50 298.16 9%
2006 2,627.80 319.95 12%
2007 1,706.90 186.65 11%
2008 3,066.20 331.96 11%
2009 2,182.30 220.49 10%
2010 2,371.70 228.02 10%
2011 1,476.70 103.25 7%
2012 1,924.70 217.22 11%
2013 2,847.30 336.18 12%
2014 2,638.30 228.01 9%
2015 1,874.50 226.32 12%
TABLE 1 Annual Rainfall, Local Yield and Collection Percentage Source:CivicExchange,usingdatafromHongKongObservatoryandWSDbyrequest
Water gathering groundImpounding reservoir
MaxMax
Min
Min
Min
1600
30002800
2800
2600
2400
2200
20001800
Isohyets are in mm
Max2400
22 23
These factors have resulted in an average local yield of just under 300 million m3 during the last 30 years, based on WSD reservoir inflow data (see Table 2) equivalent to about half of overall reservoir capacity. While storage capacity is more than sufficient to collect this existing catchment yield, additional space is needed to receive Dongjiang water prior to treatment. As a result, increasing demand for freshwater, whether harvested locally or externally, will put increasing pressure on reservoir capacity.
TABLE 2 Monthly Average Inflows after Accounting for Evaporation, Seepage and Other Losses (in million m3) Source:CivicExchange,usingdatafromWSDbyrequest
Flows in December are low due to annual maintenance of the water transfer system.
Month Average Inflows in million m3
(1989–2015)
Average Purchased in million m3
(1989–2015)
Combined Inflows in million m3
January -0.333 64.872 64.539
February 1.185 67.336 68.522
March 2.296 65.836 68.133
April 13.333 68.936 82.270
May 34.852 64.227 99.079
June 70.741 56.182 126.923
July 60.222 54.018 114.240
August 61.037 53.091 114.128
September 42.889 58.491 101.380
October 11.852 68.620 80.472
November 1.741 66.070 67.811
December -0.333 6.580 6.247
Average Annual Total 299.482 694.259 993.744
LOCAL YIELD
2.2. Reservoir capacity in Hong Kong
Since there are no natural lakes, substantial rivers or groundwater resources, all local yield consists of rainwater collected from local catchment areas that is stored in a series of 17 reservoirs across Hong Kong Island, Kowloon Peninsula and the New Territories (see Figure 5). While there are a significant number of reservoirs, 87% of total capacity comes from just two: Plover Cove and High Island, which were constructed in 1968 and 1978, respectively. The remaining reservoirs are small and lack an efficient raw water transfer tunnel,30 leading to overflows during periods of heavy rainfall, with an average 19.8 million m3 lost per year between 2009 and 2014, peaking at 40 million m3 in 2013, according to WSD’s records. A combined project with the DSD called the Inter-reservoirs Transfer Scheme (IRTS), to be completed by 2022, aims to help alleviate some of these overflows by diverting about 3.4 million m3 a year from Kowloon Byewash Reservoir to Lower Shing Mun Reservoir, which is enough to supply water to about 68,000 people per year. WSD has estimated the cost of this project at about HK$20 per m3 – about five times the current price of HK$4.231 for local freshwater – which serves the dual purposes of flood control and increasing local yield.
23
These overflow numbers represent a significant improvement on the previous years in which the water purchase agreement did not allow for daily variations in the volume of water received. From 1994 to 1998, 716 million m3 overflowed from Hong Kong’s reservoirs, resulting in an estimated loss of HK$1.718 billion.32 In 2006, the purchase of Dongjiang water was converted to a lump sum deal in which Hong Kong gained the flexibility to adjust the volume delivered on a month-to-month basis, but still pays an annual fixed sum for the full allocation specified in the agreement, regardless of the amount received. According to WSD, this has eliminated economic losses from spillage in Tai Lam Chung Reservoir, as overflows should now only consist of local rainfall. However, failure to collect this water in rainy months may increase reliance on purchases later in years to come, and highlights the need for an improved IRTS, despite the cost, to ensure adequate space for the collection of local yield, both to mitigate potential flooding concerns and reduce dependence on imports.
FIGURE 5 Local Storage Capacity: Current and 10-Year Average Reservoir Storage Positions (in million m3) Sources:SCMP,2018;CivicExchange,usingdatafromWSDbyrequest
Tai Tam Intermediate Reservoir0.686 (73.76%)0.679 (99.04%)
Aberdeen Lower Reservoir0.486 (81.89%)0.347 (71.48%)
Pok Fu Lam Reservoir0.233 (70.82%)0.192 (82.22%)
Aberdeen Upper Reservoir0.773 (60.16%)0.613 (79.28%)
Tai Tam Byewash Reservoir0.08 (90%)0.063 (78.87%)
Tai Tam Upper Reservoir1.49 (80.27%)1.096 (73.57%)
Tai Tam Tuk Reservoir6.047 (86.27%)5.376 (88.91%)
Kowloon Byewash Reservoir0.8 (84%)0.628 (78.48%)
Kowloon Reservoir1.578 (82.07%)1.120 (70.94%)
Kowloon Reception Reservoir0.121 (100%)0.102 (84.57%)
Shek Pik Reservoir24.461 (74.53%)17.211 (70.36%)
Shek Lei Pui Reservoir0.374 (74.33%)0.334 (89.40%)Tai Lam Chung
Reservoir20.49 (83.12%)15.038 (73.39%)
Lower Shing Mun Reservoir4.299 (27.73%)0.867 (20.18%)
Upper Shing Mun Reservoir13.279 (72.72%)10.311 (77.65%)
Plover Cove Reservoir229.729 (90.42%)106.736 (57.18%)
High Island Reservoir281.124 (81.16%)206.023 (73.29%)
Totalcurrentcapacityinmillionm3(%full)10-yearaverageinmillionm3(%full)
Figure in Black Figure in Red
24 25
Collection of rainfall occurs entirely within protected water-gathering grounds, whose development is highly regulated to ensure they remain in a natural state. These water-gathering grounds are designated and managed by several different government departments, including WSD, the Environmental Protection Department (EPD), the Agriculture, Fisheries and Conservation Department, and the Lands Department. Nearly one-third of Hong Kong’s land has been set aside for the development of these areas, which include catchment areas and catchwater drainage systems encompassing 120 km and 17 reservoirs. These ensure that collected rainwater is as clean as possible and minimises treatment costs. Much of this area is located in country parks, which provide additional protection against development under the Country Parks Ordinance, but also make the expansion or modification of reservoirs much more complicated due to potential environmental impacts.
While the total volume of rainfall collected increased with the expansion of reservoir capacity in the late 1960s and 70s, this water source peaked in 1983, when a total 436 million m3 was collected: 74.4% of total reservoir capacity. In 1997, which saw the highest total rainfall on record, only 224 million m3 of rainwater was collected, about 38% of total reservoir capacity. Since that year, the average rainfall collected in reservoirs has decreased by 12% even though rainfall is approximately 6% higher than it was pre-1997. This may be due to the uneven rainfall pattern through the year, meaning that most rainfall volume is concentrated in a short period of time. This uneven pattern leads to situations where wet months see overflows, while the dryer months have net negative inflows on average, accounting for evaporation and seepage (see Table 2). To compensate for this lower rainfall, WSD imports more water in months with less rain and less during the wet months.
There have also been suggestions to deepen local reservoirs to increase their overall capacity.33 This expanded capacity could then in theory be used to collect additional local yield, or to store excess Dongjiang water. Yet, the additional collection of local sources would likely be minimal, as overflows have already been significantly reduced by changing the timing of purchases. Additionally, deepening reservoirs may put additional strain on the dams as a function of the higher storage volume, according to WSD, requiring reinforcement of the existing structures, which would be complex and expensive due to their locations in protected country parks.
While the storage of additional Dongjiang water would be useful, it would also be expensive, as WSD has cited costs of over HK$20 per m3 to increase capacity. A review of the literature associated with shape modification of large storage reservoirs finds this to be a non-viable option, as the scale and cost of modifications generally have a payback period of over 250 years.34 Additionally, it would not significantly increase the reliability of the supply in the face of climate change, as it does not reduce the overall dependency on natural flows.
LOCAL YIELD
25
While rainfall may be plentiful, year-to-year variation and the highly concentrated nature of the flows make it impossible to provide an adequate supply without additional sources. Under the latest three-year agreement with the Guangdong authorities, Hong Kong is provided with 820 million m3 of raw water annually, which must also be stored in reservoirs so it can be treated for distribution. Increasing demand for water will therefore put increasing pressure on the limited reservoir storage capacity, which acts as a restriction on both of these sources. As demand continues to grow, gaining access to additional Dongjiang water will be difficult, as Hong Kong lacks the space to store it. Most of the Dongjiang water is sent to Plover Cove before it can be distributed to end users, which reveals a need to develop local water sources that can bypass the reservoirs and be distributed directly to end users.
2.3 Achieving balance to maximize local collection
Hong Kong’s current reservoirs are, on average, more than sufficient for collecting the volume of rainfall that runs off the local catchment areas. Efforts to expand them will be difficult and expensive, as they are located in protected areas and many are now considered to be historical landmarks. Rather, working closely with DSD, as in the case of the IRTS, will allow for the diversion of rainfall during periods in which flooding has historically been problematic, reducing the impact and damage caused by these events over time, alongside an increase in water resources from local yield.
26 27
Dongjiang water
Hong Kong’s water supply would not have been stable without the use of Dongjiang water, which has grown from a small proportion of water consumed in the 1960s to up to 80% of supply today. While it was initially a cheap and reliable source of water for Hong Kong, the price has steadily increased in recent years to around HK$10 per m3 after treatment, and now makes up the bulk of WSD’s spending, according to the financial breakdown presented in its annual reports.35
One feature of the Dongjiang agreement is the guarantee that Hong Kong will receive 100% of its allocated volume, regardless of drought or other unforeseen circumstances. While other cities receiving water from the Dongjiang will have their water deliveries reduced, Hong Kong will not face that same challenge. Given the expected adverse impact of climate change, the risk of water stress will continue to grow, and the cost of this insurance will inevitably continue to rise, as it has during the last 10 years, from $2.3 in 2009 to $5.9 per m3 today.
Hong Kong is required to pay the full amount stipulated in the agreement, regardless of how much water it actually uses, meaning the true cost of the water is actually higher than that listed in the purchase agreement. Therefore, to maintain an affordable water price and enhance the resilience of Hong Kong’s water supply, the deployment of other taps should be explored to ensure demand can be met more efficiently and effectively, and in ways that make sense for both Hong Kong and the Pearl River Delta as a whole.
3.1 The growing cost of water security
At the end of World War II in 1945, Hong Kong’s population was only 650,000, but rose by nearly 2.4 times to 1.55 million by the end of 1946 due to a combination of factors occurring around the globe.36 This rapid population growth continued for decades, reaching 3.7 million in 1966: which represents a population almost six times larger in just 21 years.37
3
27
Compounding the pressures of population increase, local water resources were beginning to reach their limits. The two largest reservoirs, Plover Cove and High Island, were yet to be constructed, and two of the largest droughts in history would occur in 1963 and 1967. The large population increase combined with these severe droughts led to periods in which running water was restricted to as few as four hours every four days, meaning people needed to collect and store four days’ worth of water.38 While the government invested heavily in expanding reservoirs and alternatives like desalination, it was necessary to purchase water to secure a stable water supply.
Between 1961 and 1979, Hong Kong purchased a relatively moderate amount – about 20-30% of its total supply – through the Dongjiang agreement.39 As the population and living standards continued to rise and local water supplies remained constant, that percentage rose to 70-80% of the total supply, depending on the year, making it Hong Kong’s main source of water. As Hong Kong has become more dependent upon these purchases, so too have the upriver cities in the Pearl River Delta, leading to increased costs for the water received. While Hong Kong will always need to purchase water to meet its demand for freshwater, close attention should be paid to both the quantity stipulated in the agreement and the costs paid.
3.2 Particulars related to the Dongjiang agreement
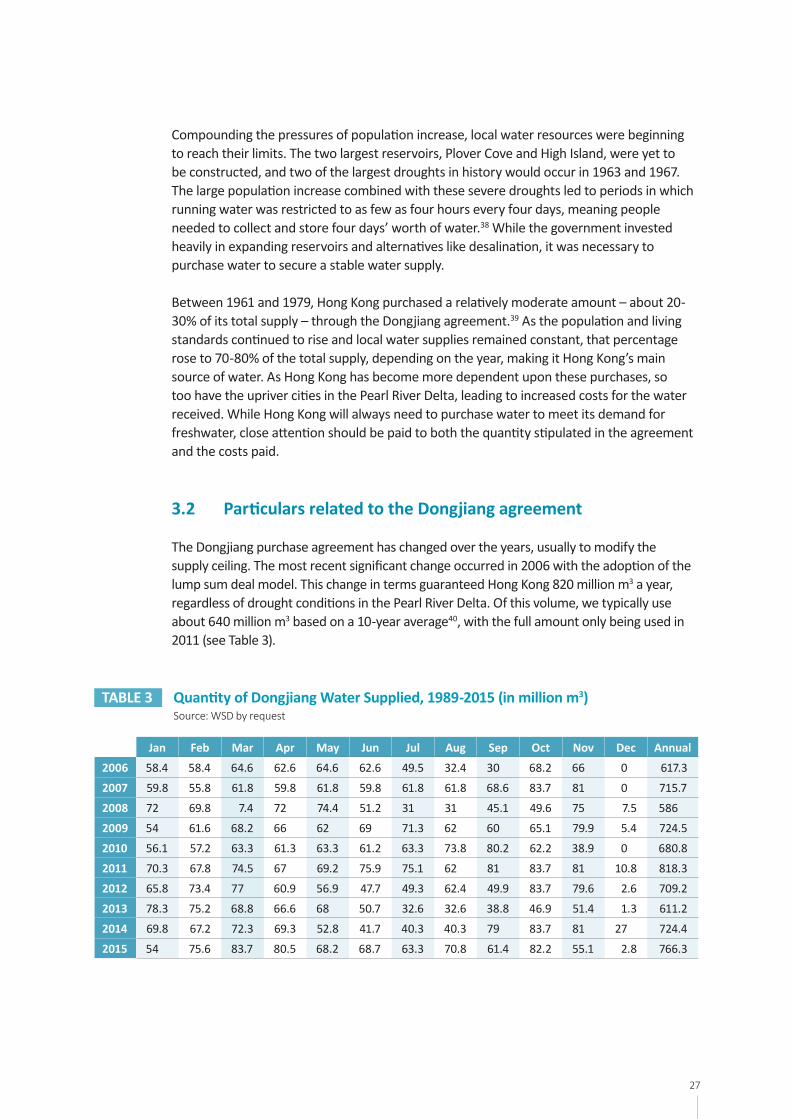
The Dongjiang purchase agreement has changed over the years, usually to modify the supply ceiling. The most recent significant change occurred in 2006 with the adoption of the lump sum deal model. This change in terms guaranteed Hong Kong 820 million m3 a year, regardless of drought conditions in the Pearl River Delta. Of this volume, we typically use about 640 million m3 based on a 10-year average40, with the full amount only being used in 2011 (see Table 3).
TABLE 3 Quantity of Dongjiang Water Supplied, 1989-2015 (in million m3) Source:WSDbyrequest
Jan Feb Mar Apr May Jun Jul Aug Sep Oct Nov Dec Annual
2006 58.4 58.4 64.6 62.6 64.6 62.6 49.5 32.4 30 68.2 66 0 617.3
2007 59.8 55.8 61.8 59.8 61.8 59.8 61.8 61.8 68.6 83.7 81 0 715.7
2008 72 69.8 7.4 72 74.4 51.2 31 31 45.1 49.6 75 7.5 586
2009 54 61.6 68.2 66 62 69 71.3 62 60 65.1 79.9 5.4 724.5
2010 56.1 57.2 63.3 61.3 63.3 61.2 63.3 73.8 80.2 62.2 38.9 0 680.8
2011 70.3 67.8 74.5 67 69.2 75.9 75.1 62 81 83.7 81 10.8 818.3
2012 65.8 73.4 77 60.9 56.9 47.7 49.3 62.4 49.9 83.7 79.6 2.6 709.2
2013 78.3 75.2 68.8 66.6 68 50.7 32.6 32.6 38.8 46.9 51.4 1.3 611.2
2014 69.8 67.2 72.3 69.3 52.8 41.7 40.3 40.3 79 83.7 81 27 724.4
2015 54 75.6 83.7 80.5 68.2 68.7 63.3 70.8 61.4 82.2 55.1 2.8 766.3
28 29
DONGJIANG water
TABLE 4 Agreement Price of Dongjiang Water Source:WSDAnnualReports1999-2017
Year Supply Ceiling (in million m3)
Actual Volume Supplied
(in millions m3)
Purchase Price (in millions of HK$)
Cost per m3 (HK$)* Reported
Actual Cost per m3 (HK$)
2006 820 617 2,494.80 3.04 4.04
2007 820 716 2,494.80 3.04 3.49
2008 820 586 2,494.80 3.04 4.26
2009 820 725 2,624.10 3.20 3.62
2010 820 681 3,146.00 3.84 4.62
2011 820 818 3,344.00 4.08 4.09
2012 820 709 3,538.70 4.32 4.99
2013 820 611 3,743.30 4.57 6.12
2014 820 724 3,959.34 4.83 5.47
2015 820 766 4,222.79 5.15 5.51
2016 820 629 4,491.52 5.48 7.14
2017 820 651 4,778.29 5.83 7.33
Additionally, the new format allows WSD to accept only the amount of water it needs in each period, based on expected rainfall, demand and other factors affecting supply. As a result, the occurance of overflows in medium reservoirs, such as Tai Lam Chung, has been reduced, while adjusting the timing of purchases has made it possible for additional local yield to be stored. Additionally, when reservoir overflows do occur, according to WSD, it is now only local water that is lost, making overflows less costly. While this may seem like a good deal, it does have some drawbacks.
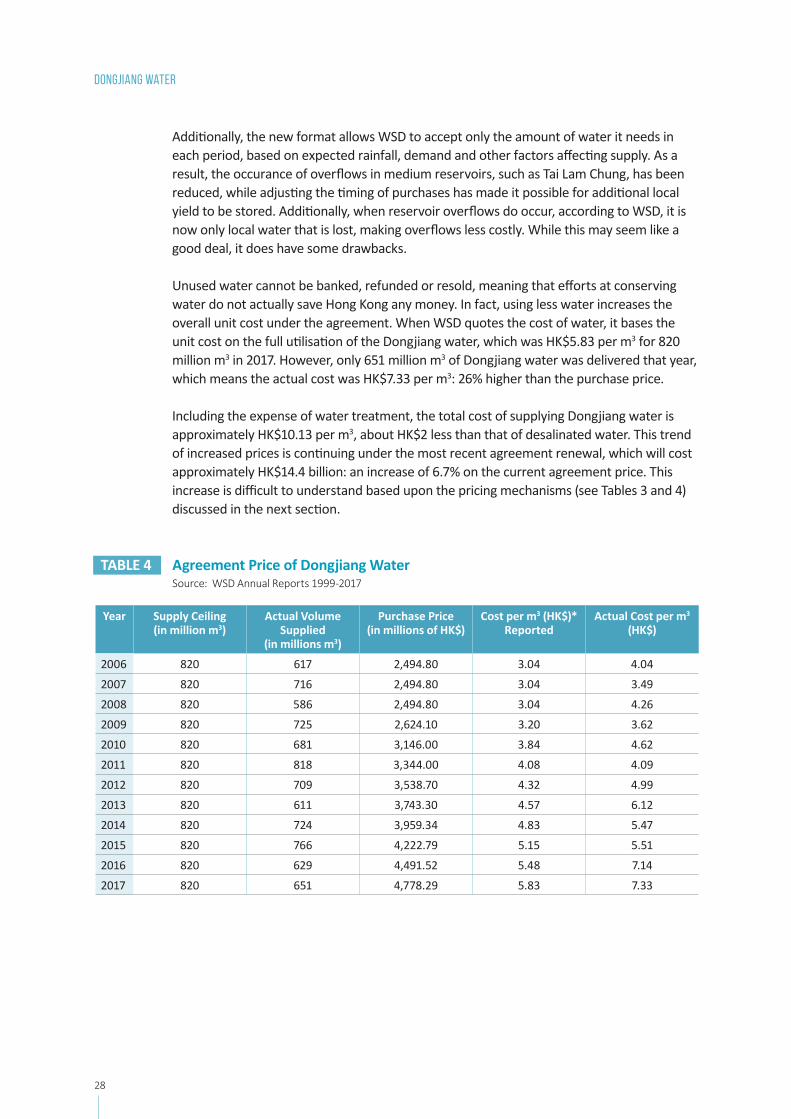
Unused water cannot be banked, refunded or resold, meaning that efforts at conserving water do not actually save Hong Kong any money. In fact, using less water increases the overall unit cost under the agreement. When WSD quotes the cost of water, it bases the unit cost on the full utilisation of the Dongjiang water, which was HK$5.83 per m3 for 820 million m3 in 2017. However, only 651 million m3 of Dongjiang water was delivered that year, which means the actual cost was HK$7.33 per m3: 26% higher than the purchase price.
Including the expense of water treatment, the total cost of supplying Dongjiang water is approximately HK$10.13 per m3, about HK$2 less than that of desalinated water. This trend of increased prices is continuing under the most recent agreement renewal, which will cost approximately HK$14.4 billion: an increase of 6.7% on the current agreement price. This increase is difficult to understand based upon the pricing mechanisms (see Tables 3 and 4) discussed in the next section.
29
3.3 Purchase agreement management and economics
The water purchase agreement between Hong Kong and Mainland China is renewed every three years after negotiation by the Development Bureau. In the 2017 report by ADM Capital Foundation and Civic Exchange, The Illusion of Plenty,41 several factors that have potentially influenced the price of the agreement were discussed, including competition among cities in the Pearl River Delta, climate change and changes in the economic importance of Hong Kong to the Delta and Mainland China in general. However, there has been little discussion of the nature and history of the purchase agreement, or its effect on WSD’s balance sheet and the company that oversees it, so the discussion here will focus on these topics.
While the Development Bureau is responsible for the negotiation and signing of the purchase agreement, WSD is responsible for paying for it. Since WSD froze tariff rates for consumers in February 1995, it has made a commitment to minimising its costs, in line with WSD’s operating principles and Hong Kong Basic Law. This commitment has led to WSD keeping cost increases with regards to staffing and operational expenses in most years to 0% when adjusted for inflation. However, the cost of the water purchase agreement has continued to increase as a percentage of WSD’s expenses, growing from 39% of overall outgoings in the year 1999/2000 to 45% in 2017/18, making it the WSD’s single largest expenditure.42
Additionally, as a result of the tariff freeze, only about 30% of WSD’s income comes from tariffs, while the rest is covered by rates. This means that the cost of the purchase agreement is entirely covered by government subsidies, representing a massive tax transfer and a breakdown in WSD’s user pays principle. This may result in a lack of funding for training, research and development, and an inability to reinvest in the system that was noted in The Illusion of Plenty.
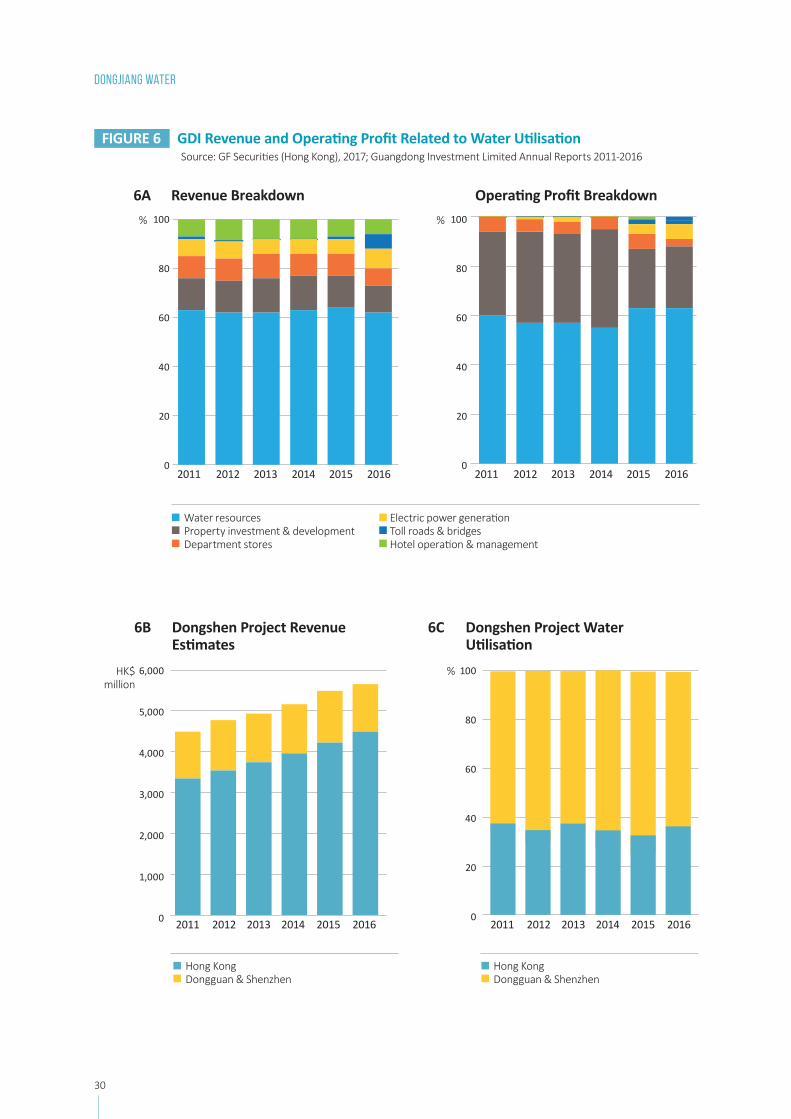
On the Guangdong side, the purchase agreement is overseen by Guangdong Investment Limited (GDI), a subsidiary of Guangdong Holdings, which is a wholly-owned subsidiary of the Guangdong Provincial People’s Government. GDI’s primary businesses are property, infrastructure, energy and water supply under the Dongshen project (see Figure 6A), which supplies drinking water to Hong Kong and the Shenzhen and Dongguan regions. Under a concession agreement, the Dongshen project grants GDI the right to operate, maintain and develop infrastructure and to supply and sell unprocessed raw water to its users. This concession was granted in 2000 and is set to run for 30 years.
30 31
DONGJIANG water
FIGURE 6 GDI Revenue and Operating Profit Related to Water Utilisation Source:GFSecurities(HongKong),2017;GuangdongInvestmentLimitedAnnualReports2011-2016
6A Revenue Breakdown100
80
60
40
20
0
%
2011 2012 2013 2014 2015 2016
Operating Profit Breakdown100
80
60
40
20
0
%
2011 2012 2013 2014 2015 2016
Water resourcesPropertyinvestment&developmentDepartment stores
ElectricpowergenerationTollroads&bridgesHoteloperation&management
6B Dongshen Project Revenue Estimates
6,000
5,000
4,000
3,000
2,000
1,000
0
HK$ million
Hong KongDongguan&Shenzhen
2011 2012 2013 2014 2015
Hong KongDongguan&Shenzhen
2016
100
80
60
40
20
0
%
6C Dongshen Project Water Utilisation
2011 2012 2013 2014 2015 2016
31
While GDI is involved in several businesses, the bulk of its revenue comes from operating the water purchase agreement. On average, about 60% of both revenue and profit comes from the management of water resources (see Figure 6A), with most of that revenue coming from the water sold to Hong Kong. In 2016, out of the HK$5.66 billion in revenue GDI earned selling water, HK$4.49 billion came from Hong Kong, with GDI netting a pretax profit of 57% on that water. Yet despite representing the bulk of the revenue, Hong Kong does not receive most of the water. Nearly 63% of the water sold is to Shenzhen and Dongguan, yet they account for only 20% of revenue (see Figures 6B and 6C). This is due to the lower agreement price of only HK$1 per m3 that these areas pay, which has been steady since 2011, unlike Hong Kong’s agreement price (see Table 4).
It is important to note that the revenue earned by GDI is determined by the lump sum agreement that is negotiated every three years. As a result, GDI’s revenues have steadily increased by about 3% per year, regardless of the volume of water sold. Accordingly, its overall profits are somewhat variable, but analysts do not expect them to decrease.43 Analysts studying GDI’s growth potential have noted that while Hong Kong’s water agreement price has been steadily increasing (see Table 4), other Chinese cities such as Beijing have faced even higher rates of increases: up to 24.9% over a five-year period. Based on the higher living standards and wages in Hong Kong, the government here is expected to accept a higher water purchase price. As demand for water in Hong Kong continues to increase without significant growth in alternatives, Hong Kong will inevitably rely more on Dongjiang water.
Civic Exchange has previously pointed out this large profit in the Liquid Assets Series,44 which includes some additional discussion on the formation of GDI and its management of the Dongshen water agreement as a high-quality financial asset. When discussing this issue with WSD, the Department pointed out that as GDI is part of the Guangdong government, a portion of those profits could be used to compensate those living in the watershed areas, who cannot develop their land or have given up land for the development of water infrastructure. While there is no evidence of this in the company’s literature or financial statements, it is possible that such a scheme is carried out separately. In this case, it should be made more transparent. This would also provide a reason for Hong Kong to lessen its reliance on Dongjiang water, in order to ease these conservation pressures on upstream areas and potentially lower the cost of water.
Unfortunately, a more in-depth analysis of the actual agreement is not possible without access to it. While members of LegCo Panel on Development were briefed on the agreement, WSD had to seek approval from Guangdong authorities prior to allowing the council to review the agreement.45 Information requests to access the agreement were declined by WSD under paragraph 2.4(a) of the Code on Access to Information, which reads: “Information the disclosure of which would harm or prejudice the conduct of external affairs, or relations with other governments or with international organizations.”46 It is unclear how this applies to the agreement, which is not available for public scrutiny, despite being entirely taxpayer-funded.
32 33
DONGJIANG water
3.4 Rethinking our position
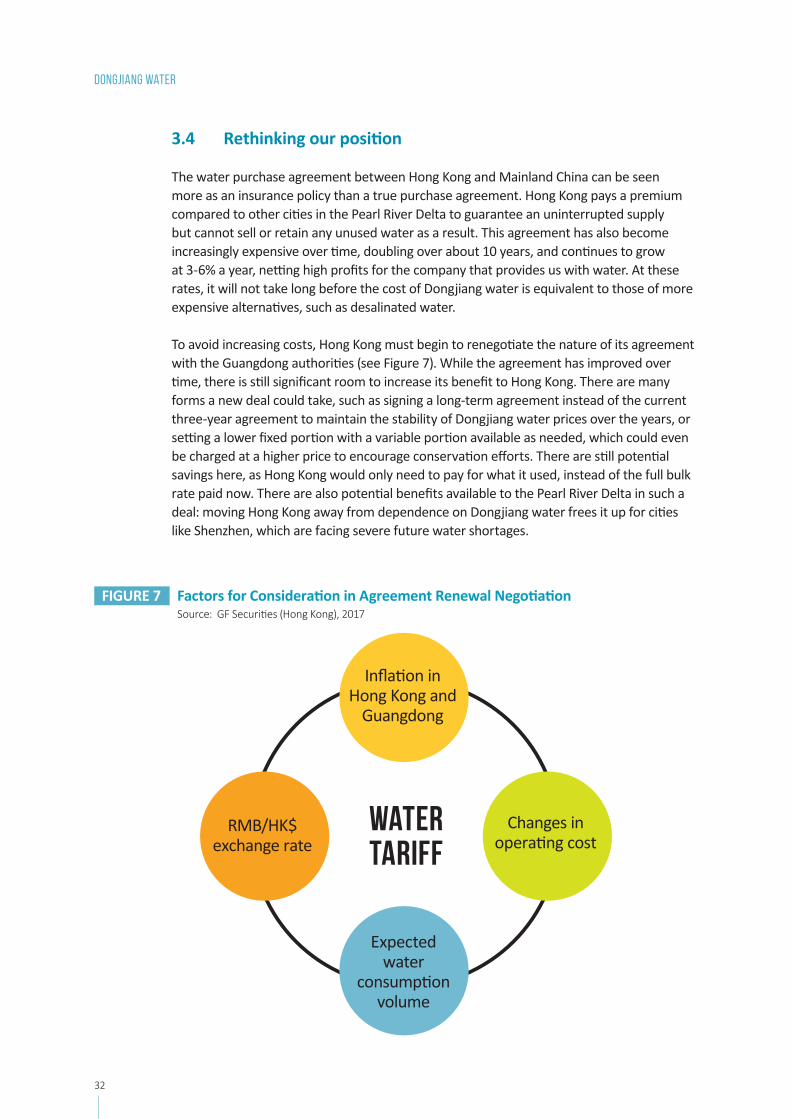
The water purchase agreement between Hong Kong and Mainland China can be seen more as an insurance policy than a true purchase agreement. Hong Kong pays a premium compared to other cities in the Pearl River Delta to guarantee an uninterrupted supply but cannot sell or retain any unused water as a result. This agreement has also become increasingly expensive over time, doubling over about 10 years, and continues to grow at 3-6% a year, netting high profits for the company that provides us with water. At these rates, it will not take long before the cost of Dongjiang water is equivalent to those of more expensive alternatives, such as desalinated water.
To avoid increasing costs, Hong Kong must begin to renegotiate the nature of its agreement with the Guangdong authorities (see Figure 7). While the agreement has improved over time, there is still significant room to increase its benefit to Hong Kong. There are many forms a new deal could take, such as signing a long-term agreement instead of the current three-year agreement to maintain the stability of Dongjiang water prices over the years, or setting a lower fixed portion with a variable portion available as needed, which could even be charged at a higher price to encourage conservation efforts. There are still potential savings here, as Hong Kong would only need to pay for what it used, instead of the full bulk rate paid now. There are also potential benefits available to the Pearl River Delta in such a deal: moving Hong Kong away from dependence on Dongjiang water frees it up for cities like Shenzhen, which are facing severe future water shortages.
FIGURE 7 Factors for Consideration in Agreement Renewal Negotiation Source:GFSecurities(HongKong),2017
WATER TARIFF
Inflation in Hong Kong and
Guangdong
RMB/HK$ exchange rate
Changes in operating cost
Expected water
consumption volume
33
Since Dongjiang water makes up the single largest portion of annual costs of WSD, it is becoming an impediment to its growth in research and investment in alternative technologies. With the user-pay principle unable to be realised as discussed in our sister report, “Conservation and Consumption: Towards a Water-Smart Hong Kong”, Dongjiang water has put WSD in constant deficit. Without any of its own internal funds, WSD cannot conduct any research or undertake any projects without receiving additional funds from the LegCo, which already endorses nearly HK$7 billion a year in subsidies to WSD.
In order to control costs and ensure it can continue to maintain a secure and economical water supply for its citizens, Hong Kong must begin to aggressively develop alternatives to lessen its reliance on Dongjiang water. The mechanism by which water charges are determined must also become more transparent. Additionally, Dongjiang water is still susceptible to natural flows, and in the event of a severe drought, there is always the potential for a shortfall, regardless of what the agreement guarantees. While it will most likely never be economically practical for Hong Kong not to purchase water, a reduction in this reliance will increase the overall resilience of the water supply mix in the face of global climate change and free up an additional portion for the neighbouring cities in the Pearl River Delta.
34 35
Seawater flushing 4
Seawater used for flushing serves to offset approximately 21% of total water demand at a relatively low average unit of HK$4.26 per m3 compared to that of freshwater (a blend of Dongjiang water and local yield) at HK$16.6 per m3.47 As Hong Kong’s development expands into less dense areas further away from the coast and modernises its plumbing fixtures, the role of seawater flushing will need to be re-evaluated. In areas far from the coast, such as parts of the New Territories, flushing with seawater is economically inefficient compared to both freshwater and other alternatives such as harvested and reclaimed water, primarily due to transfer costs such as pumping.
Additionally, it is difficult to determine how efficient parts of the current network are compared to these alternatives, due to a lack of accurate district-level cost and consumption data. As green building standards are adopted and the flushing system becomes more efficient, the economics of the seawater flushing system will begin to break down. A plan must be in place to replace it with viable alternatives before that time.
4.1 A historic solution
While seawater flushing is one of the current water resources, it serves a fundamentally different purpose than those of the others. While Dongjiang water and local yield provide freshwater for drinking, showering and other purposes, the only purpose of seawater is for toilet flushing. While seawater is not drinkable or useable for other purposes beyond flushing, it frees up freshwater resources that would otherwise be needed to provide this service. Due to its unlimited supply and yet limited role, seawater flushing is neither typically included in discussions about water use nor in WSD’s per capita water use calculations.
Hong Kong’s seawater flushing system has its origins in the 1950s, when political and environmental pressures forced the colonial government to seriously begin considering options to supplement its freshwater supply through supply diversification. Before the 1950s, the government’s main strategy to increase the supply of freshwater was through the expansion of local catchment to maximise rainfall capture and the construction of reservoirs for rainfall storage. This approach began to reach its limits in the late 1950s as a drastic increase in population and economic growth meant demand for water rose rapidly and quickly began to strain local resources.
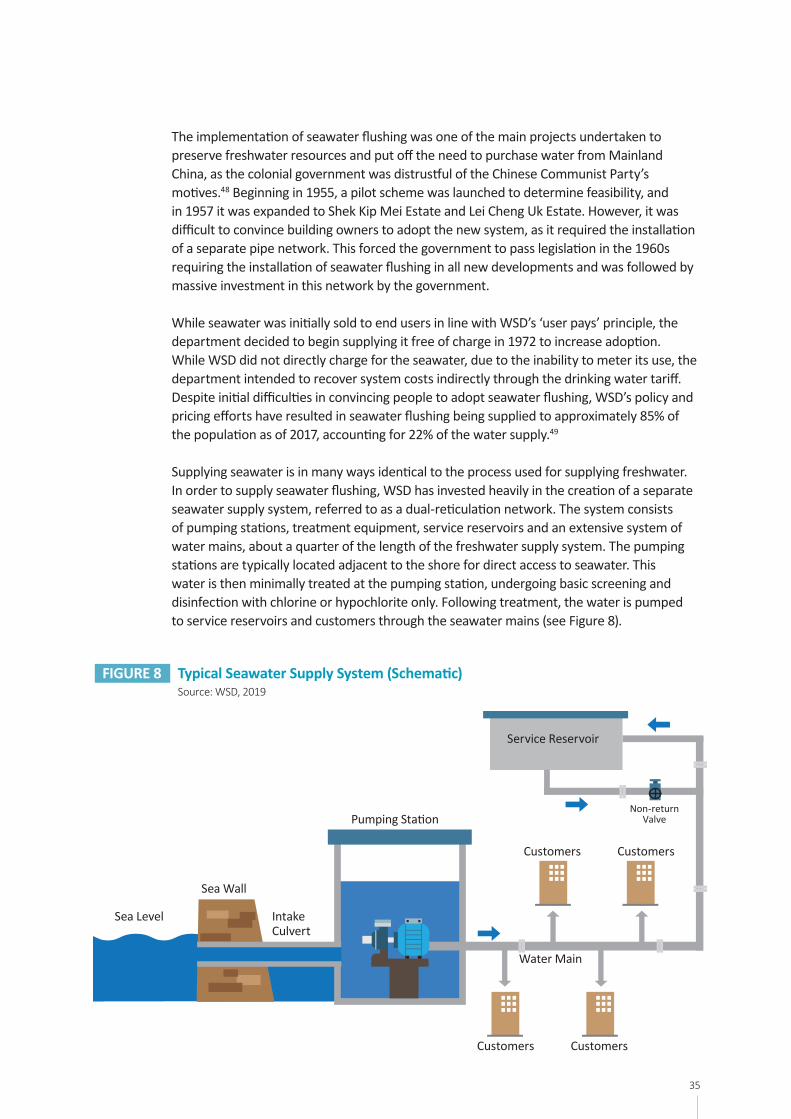
35
The implementation of seawater flushing was one of the main projects undertaken to preserve freshwater resources and put off the need to purchase water from Mainland China, as the colonial government was distrustful of the Chinese Communist Party’s motives.48 Beginning in 1955, a pilot scheme was launched to determine feasibility, and in 1957 it was expanded to Shek Kip Mei Estate and Lei Cheng Uk Estate. However, it was difficult to convince building owners to adopt the new system, as it required the installation of a separate pipe network. This forced the government to pass legislation in the 1960s requiring the installation of seawater flushing in all new developments and was followed by massive investment in this network by the government.
While seawater was initially sold to end users in line with WSD’s ‘user pays’ principle, the department decided to begin supplying it free of charge in 1972 to increase adoption. While WSD did not directly charge for the seawater, due to the inability to meter its use, the department intended to recover system costs indirectly through the drinking water tariff. Despite initial difficulties in convincing people to adopt seawater flushing, WSD’s policy and pricing efforts have resulted in seawater flushing being supplied to approximately 85% of the population as of 2017, accounting for 22% of the water supply.49
Supplying seawater is in many ways identical to the process used for supplying freshwater. In order to supply seawater flushing, WSD has invested heavily in the creation of a separate seawater supply system, referred to as a dual-reticulation network. The system consists of pumping stations, treatment equipment, service reservoirs and an extensive system of water mains, about a quarter of the length of the freshwater supply system. The pumping stations are typically located adjacent to the shore for direct access to seawater. This water is then minimally treated at the pumping station, undergoing basic screening and disinfection with chlorine or hypochlorite only. Following treatment, the water is pumped to service reservoirs and customers through the seawater mains (see Figure 8).
FIGURE 8 Typical Seawater Supply System (Schematic) Source: WSD, 2019
Sea Level
Sea Wall
Intake Culvert
Pumping Station
Service Reservoir
Water Main
Customers Customers
Customers Customers
Non-return Valve
36 37
Seawater flushing
Despite requirements that corrosion-resistant materials be used for the construction of seawater mains since the 1960s, their service lives are typically shorter than those of freshwater mains. While the service lives of the latter are between 30 to 50 years, depending on the ground conditions, seawater mains typically depreciate financially after 20 years, due to saline water corrosion.50
This higher rate of corrosion is evident in the number of mains that burst every year. While there were on average roughly the same number of burst of fresh and seawater mains, maintenance work done by WSD significantly reduced the number of freshwater mains burst in 2017, leading to a total of 36 freshwater and 52 seawater mains bursts, which represented a significant reduction in freshwater main bursts.51 However, the seawater supply system is only a quarter the size of the freshwater system, and the number of bursts in 2017 remained unchanged from the previous year. Due to the corrosive nature of seawater and the high pressure required to pump it from sea level, the rate of seawater mains burst per kilometre of pipe is four to seven times higher than that of freshwater.
Expansion of the seawater flushing system to its current size was possible due to WSD’s strong commitment to conserving freshwater resources. While all new buildings in the seawater flushing zones are required to use seawater, WSD has provided a strong incentive for older buildings to convert. Today, the supply of seawater for flushing is essentially free as it has no tariff associated with it, and it is not metered. WSD does not even charge a sewage tariff for flushing supplies. As a result, homes that receive seawater for flushing will pay nothing for the supply or disposal of their flushing water, while those that continue to receive freshwater have to pay the going rate for its supply. This provides a strong incentive for buildings to convert from freshwater to seawater to save money and conserve freshwater resources.
The seawater flushing system currently consists of about 35 seawater pumping stations, which can pump approximately 2.1 million m3 per day of seawater to 54 service reservoirs, with a combined capacity of 0.3 million m3.52 Seawater is then conveyed through a network of mains totalling 1,605 km in length to approximately 6.22 million of WSD’s customers.53 This seawater infrastructure represents a total capital investment of HK$11.77 billion, representing approximately 14% of WSD’s total capital assets.54 Operation and administrative expenses associated with distributing seawater in 2017 amounted to HK$1.11 billion (according to WSD email correspondence) for a supply of 260 million m3, which implies a unit cost of HK$4.26 per m3. However, further expansion of the system into more remote areas is becoming increasingly expensive, requiring significantly more capital investment. As the cost of the network grows, it will be less competitive compared to alternative water resources.
37
4.2 Economics of flushing in Hong Kong
Freshwater flushing systems in Tung Chung’s existing developments are being replaced by seawater flushing systems in phases, with plans for completion by end-2023.55 While seawater is more cost-effective than freshwater and reclaimed water in terms of its average price, the assumptions that go into determining that average are extremely important in concluding when and where we should consider alternatives. The cost of providing seawater is dependent upon the distance it is pumped, the size of the population receiving it and how much those users consume, which in turn depends on the efficiency of the toilets used in a given building. The accuracy of assumptions regarding this data will therefore impact how cost-effective the system is.
Hong Kong is a densely populated coastal city, making it an ideal location for the establishment of a seawater flushing system. Since the construction of the seawater flushing system in the 1950s, several studies have been conducted on the overall economics of such systems,56 and pilots such as the one in Qingdao57 have been launched to test their suitability. These studies have found that the two most important factors determining whether seawater flushing is economical are population density and distance from the coast: the population density should exceed 3,000 people per km2, and the seawater should be pumped less than 30 km, and even less if the elevation is high.
These factors are clearly applicable in Hong Kong and are reflected in the low price that users pay for seawater. According to WSD, the unit price of HK$4.26 per m3 (based on 2017 data) for supplying seawater is a blended average, meaning it represents the average price for all districts. At this price, the average district is best served by seawater, as it is cheaper than freshwater (HK$16.6 per m3 production cost)58 and even reclaimed water (an estimated HK$6.5). However, these economics begin to break down as the system expands away from the densely packed areas it was designed to serve and begins to move further away from the coast and into the New Territories and proposed new town areas (see Figure 9).
Expansion of the seawater flushing system in 2014-15 to the Northwest New Territories added coverage to an additional 5% of the population at a cost of HK$996.4 million,59 about 10% of the overall cost of the system. While the unit cost of supplying water to this area is unknown, changes in the average cost of supply give a general idea of the magnitude of the impact. Prior to this expansion, the average cost of the seawater supply was stated to be HK$3.4 per m3,60 which has now increased 25% to HK$4.26. For a 5% increase in supply to cause such a surge in the price, the cost of supplying this new area must have been significantly higher than that of supplying existing areas. This increase appears to be in line with a study conducted by WSD in 2012 prior to the expansion, in which they estimated the unit cost of supplying seawater for flushing to the Northeast New Territories to be HK$10.4 per m3.61 These examples illustrate the potential economic impact of expanding the seawater supply over a longer distance, when compared to alternatives such as recycled water.
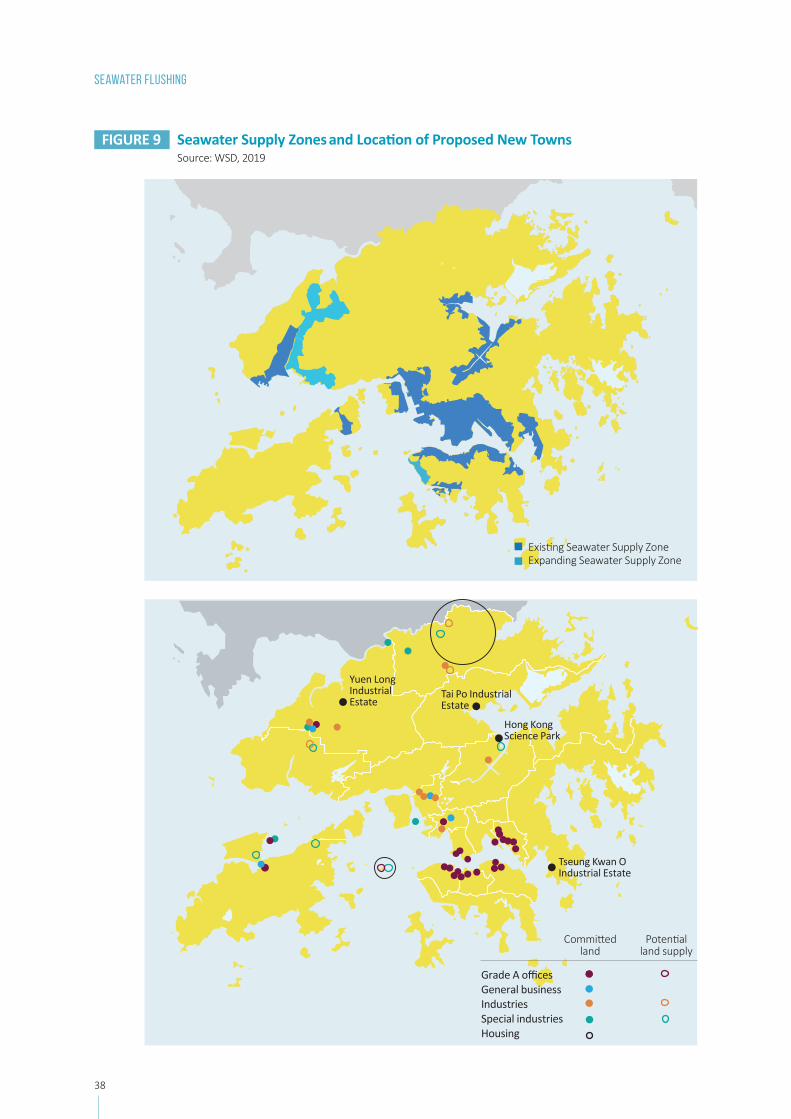
38 39
Seawater flushing
FIGURE 9 Seawater Supply Zones and Location of Proposed New Towns Source: WSD, 2019
ExistingSeawaterSupplyZoneExpandingSeawaterSupplyZone
Yuen Long Industrial Estate
Hong Kong Science Park
Tai Po Industrial Estate
Tseung Kwan O Industrial Estate
Grade A officesGeneral businessIndustriesSpecial industriesHousing
Committedland
Potentiallandsupply
39
4.3 Estimating current costs and usage
Aside from distance, the other factor crucial to the efficiency of seawater flushing is population density. A dense population helps offset the costs associated with developing a secondary supply network, and minimises the cost of pumping the water, as the majority of the population served is in one area. This makes Hong Kong an ideal place for implementing this technology, meaning overall capital costs are kept low: just 15% of the overall cost of the water supply system.
The second aspect of high density is high volume. According to WSD, 85% of the population covered by the seawater network – approximately 6.14 million people – were supplied with 260 million m3 of seawater for flushing in 2016, or 21% of the total water supply. This high volume is necessary to keep the unit cost of flushing low, as it helps mitigate the cost of the additional capital. However, it is unclear whether this high supply volume will be necessary in the future, due to potential inaccuracies in the assumptions WSD works on when estimating usage.
WSD estimates that on average, Hong Kong residents used 92.3 litres per day for flushing their toilets in 2016, based on both seawater and freshwater usage. However, this rate is very high when compared to examples around the world. The average flushing volume in England and Wales is only 51 litres per day,62 while it is as low as 35 in Macau63 and 26.6 in Singapore.64 These areas may not represent ideal comparisons, however, as they have more expensive water tariffs, which may encourage the installation of more efficient appliances, as seen in Singapore.
Looking at Hong Kong’s own plumbing code, the maximum flush volume is limited to 15 litres per flush.65 On average, it is estimated that people flush 5.1 times per day, meaning that we would expect to see an average usage of around 76.5 litres per day. That figure is also in line with global estimates based on homes with older toilets, which use an estimated 72 litres on average. If this level of usage is assumed, the implied amount of unaccounted water in the seawater flushing network increases to 38% (see Table 5), which is essentially what we see in the freshwater system.66 This rate also seems reasonable given the significantly higher rate of mains burst with higher pressure. Unfortunately, there is insufficient detail in the data to determine how much flushing water people truly require.
Currently, the stated amount of water used per capita is based on a series of assumptions about the nature of the system, including the population served, the leakage rate and the volume consumed. Since seawater is not metered, it is not possible to know for certain how much of the water supplied is used. Additionally, while the number of people living in areas supplied with seawater is known, the actual number of those who receive seawater is not known, as not all buildings in the area receive seawater, and freshwater for flushing is only metered at the building level. The number of freshwater users is also variable throughout the year, as buildings are converted, or seawater supplies are disrupted. The only known number is the volume of freshwater metered, which was equal to 52 million m3 in 2016 (see Table 5). Based on that number, we would need a population of 1.55 million, instead of 1.2 million, receiving freshwater for flushing, and just under 80% of the population covered by seawater supply.
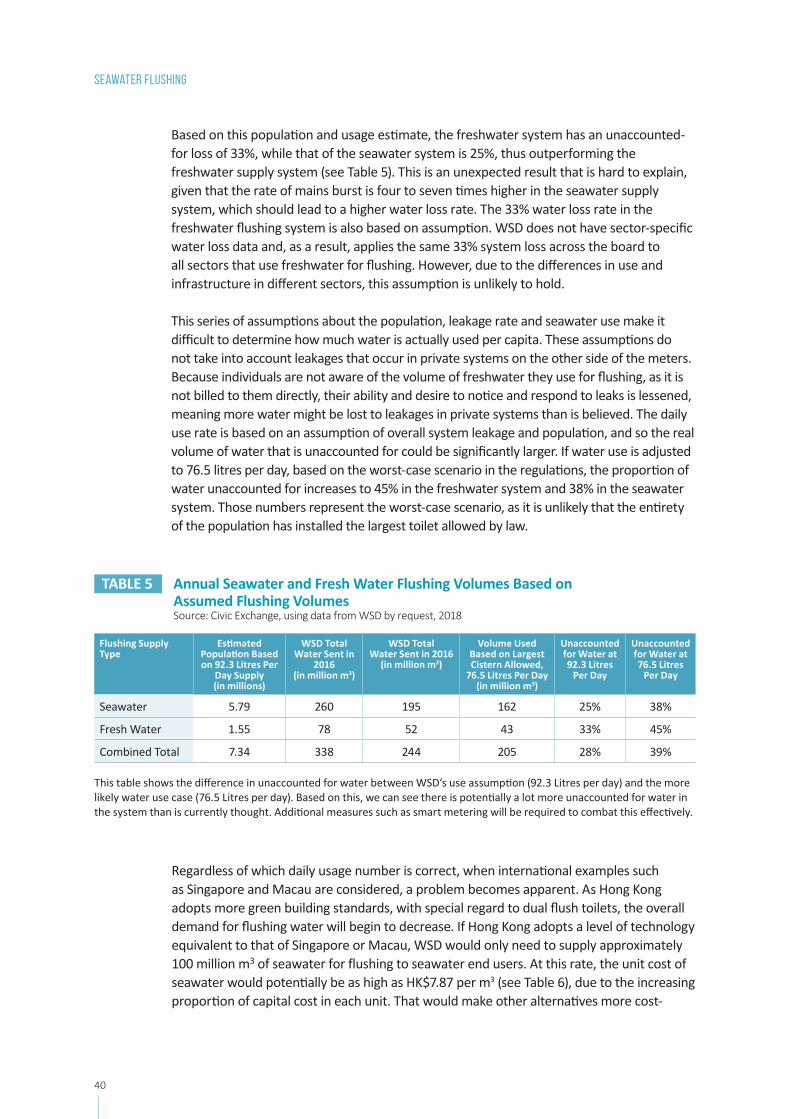
40 41
Seawater flushing
Based on this population and usage estimate, the freshwater system has an unaccounted-for loss of 33%, while that of the seawater system is 25%, thus outperforming the freshwater supply system (see Table 5). This is an unexpected result that is hard to explain, given that the rate of mains burst is four to seven times higher in the seawater supply system, which should lead to a higher water loss rate. The 33% water loss rate in the freshwater flushing system is also based on assumption. WSD does not have sector-specific water loss data and, as a result, applies the same 33% system loss across the board to all sectors that use freshwater for flushing. However, due to the differences in use and infrastructure in different sectors, this assumption is unlikely to hold.
This series of assumptions about the population, leakage rate and seawater use make it difficult to determine how much water is actually used per capita. These assumptions do not take into account leakages that occur in private systems on the other side of the meters. Because individuals are not aware of the volume of freshwater they use for flushing, as it is not billed to them directly, their ability and desire to notice and respond to leaks is lessened, meaning more water might be lost to leakages in private systems than is believed. The daily use rate is based on an assumption of overall system leakage and population, and so the real volume of water that is unaccounted for could be significantly larger. If water use is adjusted to 76.5 litres per day, based on the worst-case scenario in the regulations, the proportion of water unaccounted for increases to 45% in the freshwater system and 38% in the seawater system. Those numbers represent the worst-case scenario, as it is unlikely that the entirety of the population has installed the largest toilet allowed by law.
TABLE 5 Annual Seawater and Fresh Water Flushing Volumes Based on Assumed Flushing Volumes Source:CivicExchange,usingdatafromWSDbyrequest,2018
Flushing Supply Type
Estimated Population Based on 92.3 Litres Per
Day Supply (in millions)
WSD Total Water Sent in
2016(in million m3)
WSD Total Water Sent in 2016
(in million m3)
Volume Used Based on Largest Cistern Allowed,
76.5 Litres Per Day (in million m3)
Unaccounted for Water at 92.3 Litres
Per Day
Unaccounted for Water at 76.5 Litres
Per Day
Seawater 5.79 260 195 162 25% 38%
Fresh Water 1.55 78 52 43 33% 45%
Combined Total 7.34 338 244 205 28% 39%
This table shows the difference in unaccounted for water between WSD’s use assumption (92.3 Litres per day) and the more likely water use case (76.5 Litres per day). Based on this, we can see there is potentially a lot more unaccounted for water in the system than is currently thought. Additional measures such as smart metering will be required to combat this effectively.
Regardless of which daily usage number is correct, when international examples such as Singapore and Macau are considered, a problem becomes apparent. As Hong Kong adopts more green building standards, with special regard to dual flush toilets, the overall demand for flushing water will begin to decrease. If Hong Kong adopts a level of technology equivalent to that of Singapore or Macau, WSD would only need to supply approximately 100 million m3 of seawater for flushing to seawater end users. At this rate, the unit cost of seawater would potentially be as high as HK$7.87 per m3 (see Table 6), due to the increasing proportion of capital cost in each unit. That would make other alternatives more cost-
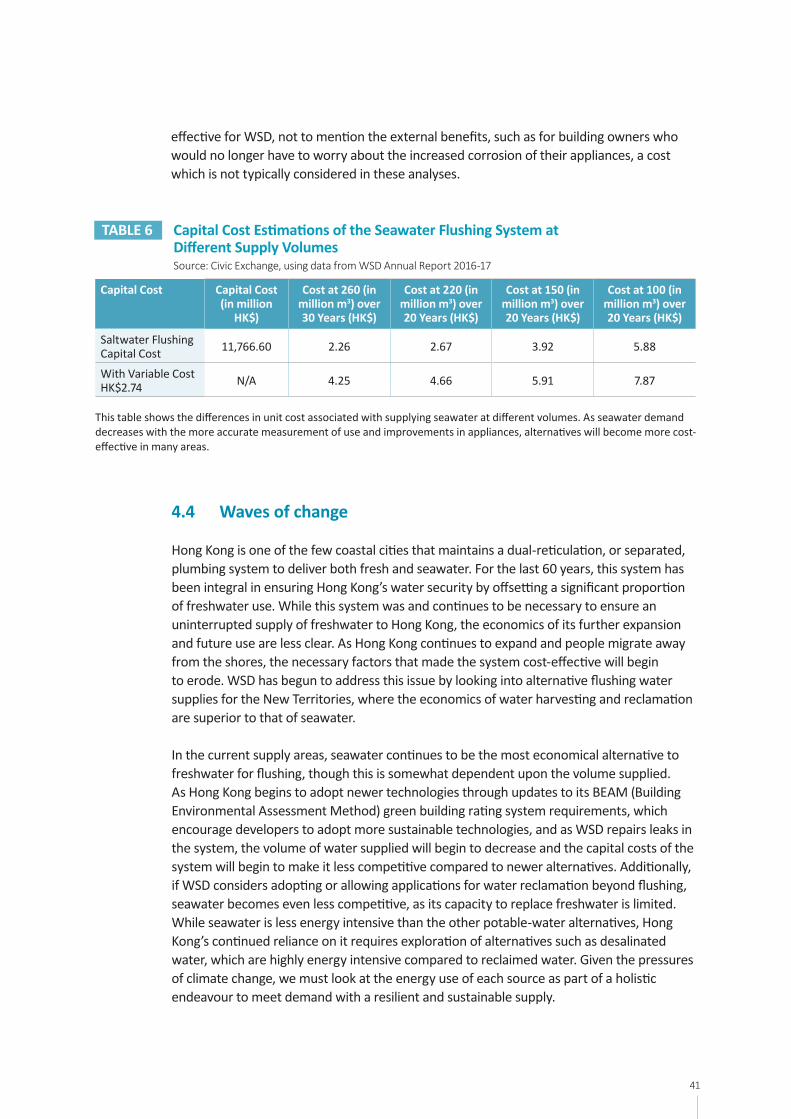
41
TABLE 6 Capital Cost Estimations of the Seawater Flushing System at Different Supply Volumes
Source:CivicExchange,usingdatafromWSDAnnualReport2016-17
Capital Cost Capital Cost (in million
HK$)
Cost at 260 (in million m3) over 30 Years (HK$)
Cost at 220 (in million m3) over 20 Years (HK$)
Cost at 150 (in million m3) over 20 Years (HK$)
Cost at 100 (in million m3) over 20 Years (HK$)
Saltwater Flushing Capital Cost 11,766.60 2.26 2.67 3.92 5.88
With Variable Cost HK$2.74 N/A 4.25 4.66 5.91 7.87
This table shows the differences in unit cost associated with supplying seawater at different volumes. As seawater demand decreases with the more accurate measurement of use and improvements in appliances, alternatives will become more cost-effective in many areas.
effective for WSD, not to mention the external benefits, such as for building owners who would no longer have to worry about the increased corrosion of their appliances, a cost which is not typically considered in these analyses.
4.4 Waves of change
Hong Kong is one of the few coastal cities that maintains a dual-reticulation, or separated, plumbing system to deliver both fresh and seawater. For the last 60 years, this system has been integral in ensuring Hong Kong’s water security by offsetting a significant proportion of freshwater use. While this system was and continues to be necessary to ensure an uninterrupted supply of freshwater to Hong Kong, the economics of its further expansion and future use are less clear. As Hong Kong continues to expand and people migrate away from the shores, the necessary factors that made the system cost-effective will begin to erode. WSD has begun to address this issue by looking into alternative flushing water supplies for the New Territories, where the economics of water harvesting and reclamation are superior to that of seawater.
In the current supply areas, seawater continues to be the most economical alternative to freshwater for flushing, though this is somewhat dependent upon the volume supplied. As Hong Kong begins to adopt newer technologies through updates to its BEAM (Building Environmental Assessment Method) green building rating system requirements, which encourage developers to adopt more sustainable technologies, and as WSD repairs leaks in the system, the volume of water supplied will begin to decrease and the capital costs of the system will begin to make it less competitive compared to newer alternatives. Additionally, if WSD considers adopting or allowing applications for water reclamation beyond flushing, seawater becomes even less competitive, as its capacity to replace freshwater is limited. While seawater is less energy intensive than the other potable-water alternatives, Hong Kong’s continued reliance on it requires exploration of alternatives such as desalinated water, which are highly energy intensive compared to reclaimed water. Given the pressures of climate change, we must look at the energy use of each source as part of a holistic endeavour to meet demand with a resilient and sustainable supply.
42 43
Recycled water
Further to using seawater for flushing, WSD is looking into expanding the use of recycled water, comprising harvested rainwater, treated grey water and reclaimed water, for non-potable purposes.67 This expansion would increase the network coverage of lower grade water (seawater and recycled water) flushing from 85% of the total population to 90%, further decreasing the freshwater demand for such use.
5.1 Harvested rainwater and treated grey water
Harvested rainwater is that which is collected from surfaces, such as roofs and roads, and stored for future use, whereas grey water is collected from showers, kitchen sinks and laundry machines and other appliances to be treated for use. Greywater does not include water from slop sinks, toilets, urinals or other highly contaminated sources. By mid-2019, rainwater harvesting, or grey water recycling systems have already been installed in new buildings of approximately 100 government projects, which is in line with the government’s green building policies. The new development of the Anderson Road Quarry Site, which will be discussed in section 5.1, is planned to use a combination of both rainwater harvesting and grey water recycling systems which will be installed and managed by WSD to offset freshwater for flushing use at the site.
Contrary to grey water recycling, which has a stable supply of water within the system that can be calculated based on daily water use, rainwater harvesting depends on the natural water cycle and hence has a lower climate resilience. Due to their small scale and the decentralised nature of their installation and use, the government will have the least control over the installation of these recycling systems. While the building of water recycling facilities in government buildings is carried out by WSD, implementing facilities in non-government buildings will depend upon the owners of such individual buildings. As the economics and feasibility of recycling are site specific, meaning they will differ by building, it will be difficult for existing buildings to justify retrofitting without incentives, meaning they are more inclined to solely depend on the conventional freshwater supply system that relies upon local yield and Dongjiang water. In other words, the use of treated grey water and rainwater presents more challenges to WSD, as it requires managing and minimizing resistance from stakeholders in the long run.
5
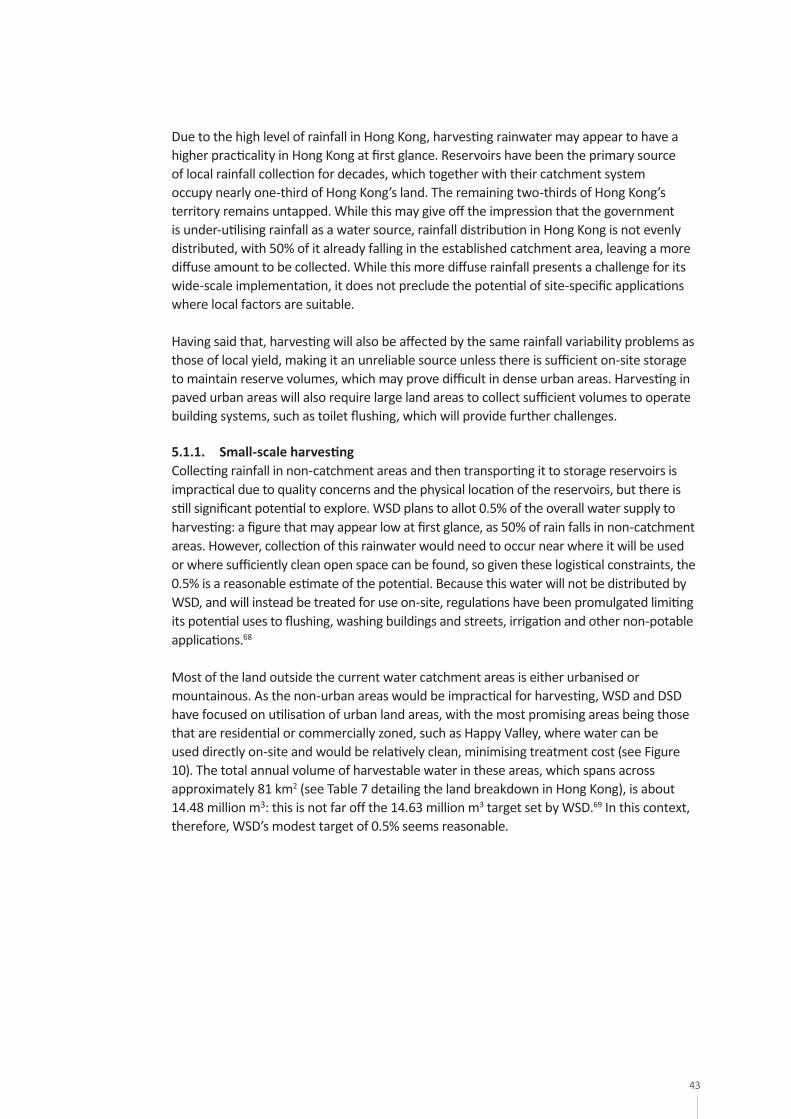
43
Due to the high level of rainfall in Hong Kong, harvesting rainwater may appear to have a higher practicality in Hong Kong at first glance. Reservoirs have been the primary source of local rainfall collection for decades, which together with their catchment system occupy nearly one-third of Hong Kong’s land. The remaining two-thirds of Hong Kong’s territory remains untapped. While this may give off the impression that the government is under-utilising rainfall as a water source, rainfall distribution in Hong Kong is not evenly distributed, with 50% of it already falling in the established catchment area, leaving a more diffuse amount to be collected. While this more diffuse rainfall presents a challenge for its wide-scale implementation, it does not preclude the potential of site-specific applications where local factors are suitable.
Having said that, harvesting will also be affected by the same rainfall variability problems as those of local yield, making it an unreliable source unless there is sufficient on-site storage to maintain reserve volumes, which may prove difficult in dense urban areas. Harvesting in paved urban areas will also require large land areas to collect sufficient volumes to operate building systems, such as toilet flushing, which will provide further challenges.
5.1.1. Small-scale harvestingCollecting rainfall in non-catchment areas and then transporting it to storage reservoirs is impractical due to quality concerns and the physical location of the reservoirs, but there is still significant potential to explore. WSD plans to allot 0.5% of the overall water supply to harvesting: a figure that may appear low at first glance, as 50% of rain falls in non-catchment areas. However, collection of this rainwater would need to occur near where it will be used or where sufficiently clean open space can be found, so given these logistical constraints, the 0.5% is a reasonable estimate of the potential. Because this water will not be distributed by WSD, and will instead be treated for use on-site, regulations have been promulgated limiting its potential uses to flushing, washing buildings and streets, irrigation and other non-potable applications.68
Most of the land outside the current water catchment areas is either urbanised or mountainous. As the non-urban areas would be impractical for harvesting, WSD and DSD have focused on utilisation of urban land areas, with the most promising areas being those that are residential or commercially zoned, such as Happy Valley, where water can be used directly on-site and would be relatively clean, minimising treatment cost (see Figure 10). The total annual volume of harvestable water in these areas, which spans across approximately 81 km2 (see Table 7 detailing the land breakdown in Hong Kong), is about 14.48 million m3: this is not far off the 14.63 million m3 target set by WSD.69 In this context, therefore, WSD’s modest target of 0.5% seems reasonable.
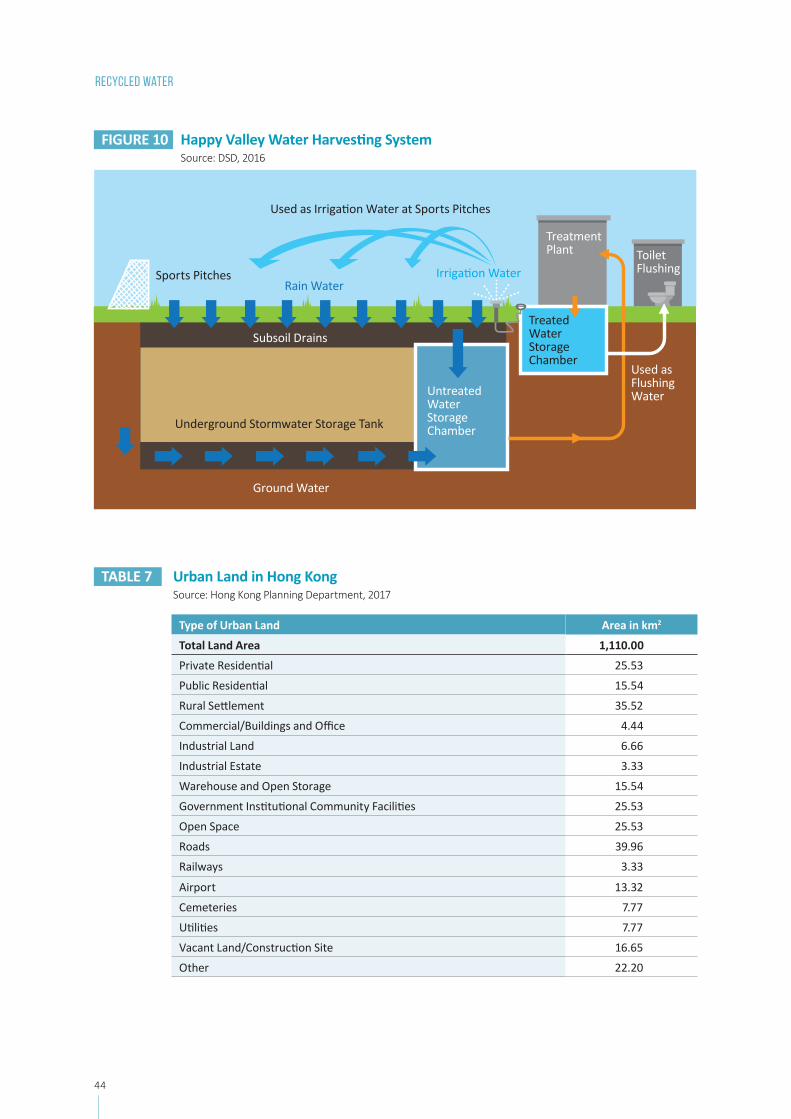
44 45
Recycled water
Type of Urban Land Area in km2
Total Land Area 1,110.00
Private Residential 25.53
Public Residential 15.54
Rural Settlement 35.52
Commercial/Buildings and Office 4.44
Industrial Land 6.66
Industrial Estate 3.33
Warehouse and Open Storage 15.54
Government Institutional Community Facilities 25.53
Open Space 25.53
Roads 39.96
Railways 3.33
Airport 13.32
Cemeteries 7.77
Utilities 7.77
Vacant Land/Construction Site 16.65
Other 22.20
TABLE 7 Urban Land in Hong Kong Source:HongKongPlanningDepartment,2017
FIGURE 10 Happy Valley Water Harvesting System Source: DSD, 2016
Sports Pitches
Used as Irrigation Water at Sports Pitches
Underground Stormwater Storage Tank
Ground Water
Subsoil Drains
Untreated Water Storage Chamber
Treated Water Storage Chamber
Used as Flushing Water
Treatment Plant Toilet
FlushingRain Water
Irrigation Water
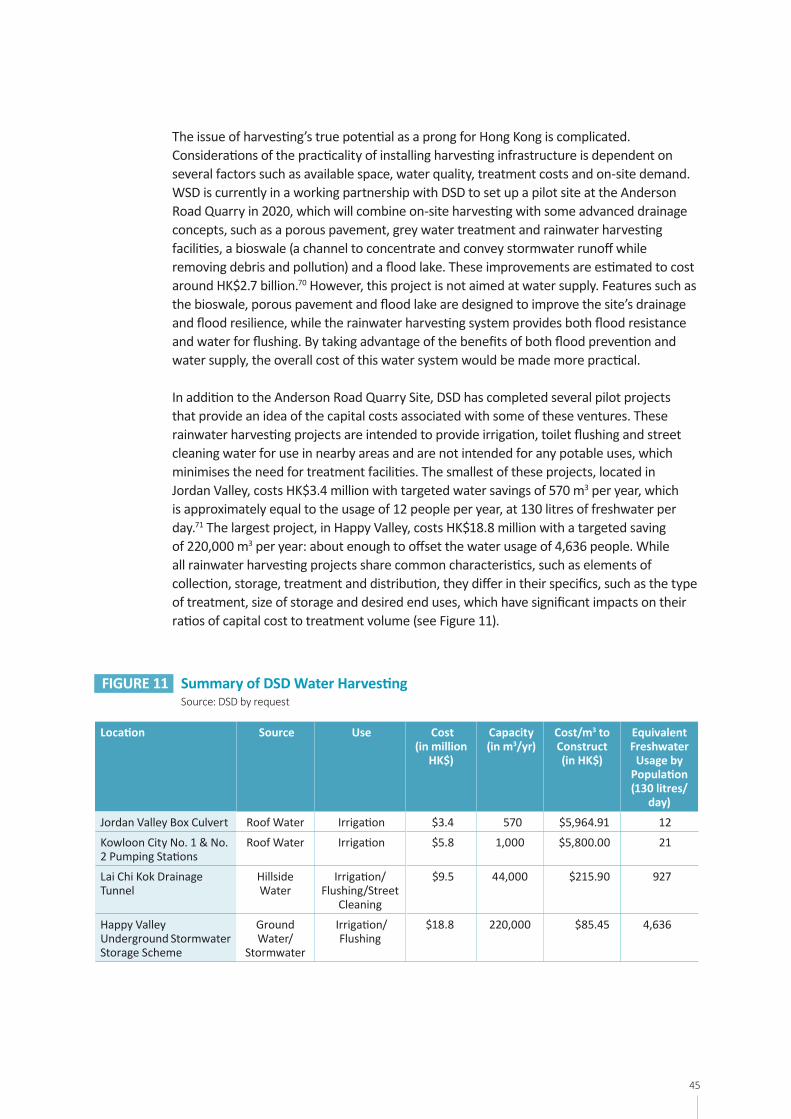
45
FIGURE 11 Summary of DSD Water Harvesting Source:DSDbyrequest
Location Source Use Cost (in million
HK$)
Capacity (in m3/yr)
Cost/m3 to Construct (in HK$)
Equivalent Freshwater
Usage by Population (130 litres/
day)
Jordan Valley Box Culvert Roof Water Irrigation $3.4 570 $5,964.91 12
Kowloon City No. 1 & No. 2 Pumping Stations
Roof Water Irrigation $5.8 1,000 $5,800.00 21
Lai Chi Kok DrainageTunnel
Hillside Water
Irrigation/Flushing/Street
Cleaning
$9.5 44,000 $215.90 927
Happy ValleyUnderground Stormwater Storage Scheme
Ground Water/
Stormwater
Irrigation/Flushing
$18.8 220,000 $85.45 4,636
The issue of harvesting’s true potential as a prong for Hong Kong is complicated. Considerations of the practicality of installing harvesting infrastructure is dependent on several factors such as available space, water quality, treatment costs and on-site demand. WSD is currently in a working partnership with DSD to set up a pilot site at the Anderson Road Quarry in 2020, which will combine on-site harvesting with some advanced drainage concepts, such as a porous pavement, grey water treatment and rainwater harvesting facilities, a bioswale (a channel to concentrate and convey stormwater runoff while removing debris and pollution) and a flood lake. These improvements are estimated to cost around HK$2.7 billion.70 However, this project is not aimed at water supply. Features such as the bioswale, porous pavement and flood lake are designed to improve the site’s drainage and flood resilience, while the rainwater harvesting system provides both flood resistance and water for flushing. By taking advantage of the benefits of both flood prevention and water supply, the overall cost of this water system would be made more practical.
In addition to the Anderson Road Quarry Site, DSD has completed several pilot projects that provide an idea of the capital costs associated with some of these ventures. These rainwater harvesting projects are intended to provide irrigation, toilet flushing and street cleaning water for use in nearby areas and are not intended for any potable uses, which minimises the need for treatment facilities. The smallest of these projects, located in Jordan Valley, costs HK$3.4 million with targeted water savings of 570 m3 per year, which is approximately equal to the usage of 12 people per year, at 130 litres of freshwater per day.71 The largest project, in Happy Valley, costs HK$18.8 million with a targeted saving of 220,000 m3 per year: about enough to offset the water usage of 4,636 people. While all rainwater harvesting projects share common characteristics, such as elements of collection, storage, treatment and distribution, they differ in their specifics, such as the type of treatment, size of storage and desired end uses, which have significant impacts on their ratios of capital cost to treatment volume (see Figure 11).
46 47
These design specifics, along with water quality characteristics, will have a major impact on operating costs. Based on a number of case studies carried out across Australia, these variables resulted in cost per m3 for these systems varying from HK$2.81 to HK$227.22,72 meaning cost is both highly variable and may be greater than that of low-cost alternatives on the Hong Kong market. Additionally, a study carried out in Hong Kong found that a typical rooftop-style system was only able to provide 25% of the water needed to meet demand created by washing machines in a high-rise building.73 It found that a minimum area of 900 m2 would be necessary for the system to be financially viable, with an ideal catchment area of about 2,000 m2 for a typical Hong Kong residential building. This amount of space would make rainwater harvesting generally unattractive for a typical private building and seems to generally correspond with what we see in Figure 12 regarding the size and location of DSD’s current projects as well. Rainwater harvesting projects must be implemented on a large scale to become an economically viable alternative water resource. In the absence of additional incentives in place to offset the costs and space required, this is not the most attractive water supply option for Hong Kong.
While the use of non-protected catchment is common in Singapore,74 that is only possible due to the country’s long-standing holistic water planning policy, which has significantly limited the types of development that can occur in those areas to minimise the impact on water quality. The resulting developments in unprotected catchment areas are restricted to residential developments and non-polluting industries, limiting the potential for contamination and mitigating increases in treatment costs. Hong Kong, on the other hand, with dense development and significant urbanisation, has a greater variety of zones, with buildings containing a mix of residential, commercial (restaurants and auto shops) and even industrial uses in some cases, which would make this approach unviable.
5.1.2. Focus on balance to increase flood controlWhile the use of rainwater harvesting is limited by the high costs associated with land and competition for available space, the ability to collect runoff in urban areas will be beneficial for reducing flash flooding during periods of high rainfall. Similar to that of reservoirs, the expansion of rainwater harvesting would have more benefit as a way of preventing flooding than as an additional source of drinking water, as its reliance on natural flows does little to increase overall resilience in times of drought.
By partnering closely with DSD early in the project design process, as we see in the Anderson Road Quarry case, rainwater harvesting can be used as a part of an advanced and integrated drainage system to minimize flooding and provide water for non-potable demand. By combining drainage approaches like flood ponds and bioswales with harvesting, we can mitigate the cost of these features and make them more attractive to developers, while increasing flood resilience and resistance at the same time.
Recycled water
47
5.2 Reclaimed water
As part of its TWM strategy and commitment to improving Hong Kong’s water supply, WSD has introduced a combination of different measures with the aim of increasing supply resilience in the face of climate change, along with any other future uncertainties or challenges. To achieve this desired resilience, alternative water supplies to those reliant on natural flows (i.e. surface water and rainfall) are beginning to be investigated, with current plans calling for up to 1.5% of water demand to be met through the introduction of reclaimed water, wastewater that has been treated to a high standard, for flushing.
While reclaimed water is becoming an increasingly common water resource around the globe, for both potable and non-potable uses, the majority are non-potable and are used to offset freshwater demand. This is similar to how Hong Kong currently uses seawater to offset freshwater for flushing, but can be extended to myriad other uses, as the water is not salty and is of high quality. It has great potential for Hong Kong as a new source of water for flushing and other non-potable uses, and even as a potential replacement for seawater in the future.
While treating reclaimed water to potable standards would not be a practical choice or economically viable in Hong Kong, it can compete with freshwater supply alternatives such as desalinated water and Dongjiang water for a range of non-potable uses. However, its wide-scale implementation will face many challenges in terms of both public acceptance and the development of necessary infrastructure. If these hurdles can be overcome, it could provide Hong Kong with a reliable and economic alternative to desalination and water purchases by providing sufficient capacity to take their places in applications that do not require potable water.
In the near term, reclaimed water will be supplied to the northeastern part of the New Territories for flushing, starting with Sheung Shui and Fanling in 2022,75 due to the high cost of providing seawater to those inland areas, which was estimated to be over HK$10 per m3.76 A public consultation to determine attitudes to the use of reclaimed water was launched in November 2018, with final comments on a range of issues, including additional potential non-potable uses, due in mid-December. The results of the consultation were not available at the time of writing.
If Hong Kong’s long-term water security plan truly aims to use alternative sources of water as one of its pillars,77 expansion beyond the planned 1.5% stated in the current TWM strategy will be key to ensuring an adequate, resilient supply. For example, while 85% of Hong Kong’s residents receive seawater for flushing, 15% still receive freshwater through temporary flushing mains. Supplying this portion of the population with freshwater for flushing consumes 7.9% of total freshwater demand. If reclaimed water and other alternative water sources could be leveraged in flushing, Hong Kong could save this percentage, on top of the initial 1.5%, for a combined saving of 9.4% of freshwater resources. This volume of water would then be available for meeting potable demand, effectively increasing our water resources.
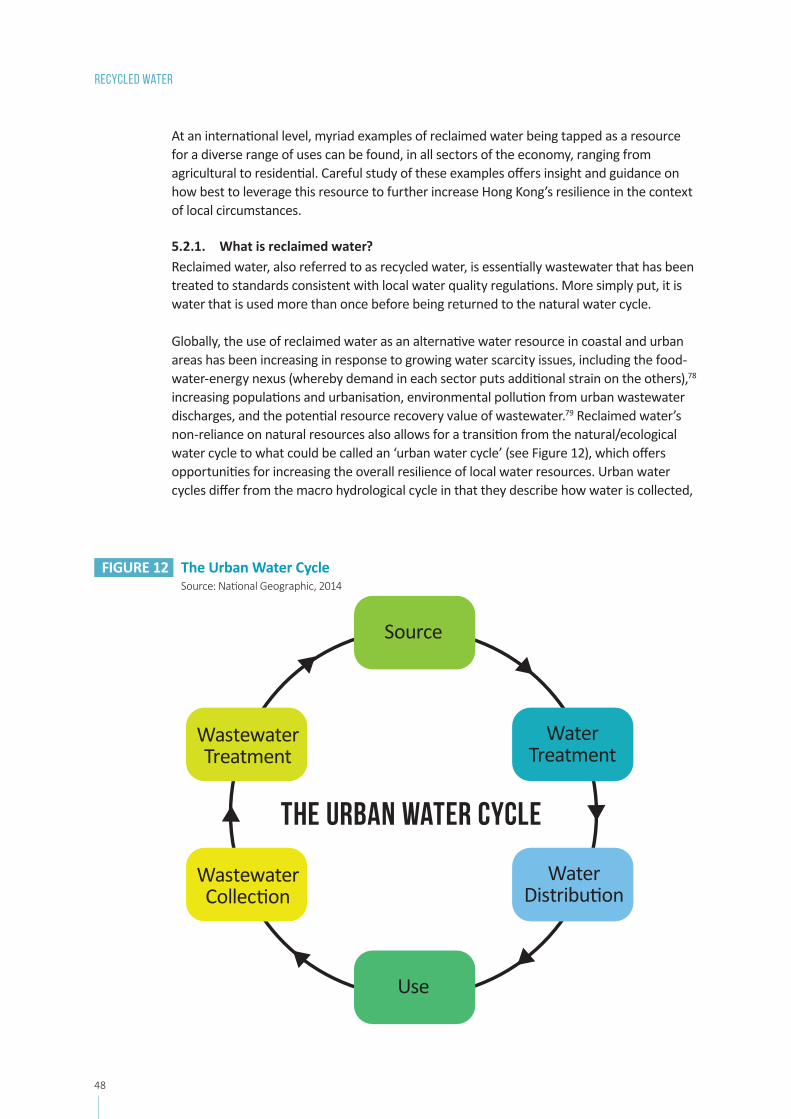
48 49
At an international level, myriad examples of reclaimed water being tapped as a resource for a diverse range of uses can be found, in all sectors of the economy, ranging from agricultural to residential. Careful study of these examples offers insight and guidance on how best to leverage this resource to further increase Hong Kong’s resilience in the context of local circumstances.
5.2.1. What is reclaimed water?Reclaimed water, also referred to as recycled water, is essentially wastewater that has been treated to standards consistent with local water quality regulations. More simply put, it is water that is used more than once before being returned to the natural water cycle.
Globally, the use of reclaimed water as an alternative water resource in coastal and urban areas has been increasing in response to growing water scarcity issues, including the food-water-energy nexus (whereby demand in each sector puts additional strain on the others),78 increasing populations and urbanisation, environmental pollution from urban wastewater discharges, and the potential resource recovery value of wastewater.79 Reclaimed water’s non-reliance on natural resources also allows for a transition from the natural/ecological water cycle to what could be called an ‘urban water cycle’ (see Figure 12), which offers opportunities for increasing the overall resilience of local water resources. Urban water cycles differ from the macro hydrological cycle in that they describe how water is collected,
Recycled water
FIGURE 12 The Urban Water Cycle Source:NationalGeographic,2014
The Urban water cycle
Source
Water Treatment
Wastewater Treatment
Water Distribution
Wastewater Collection
Use
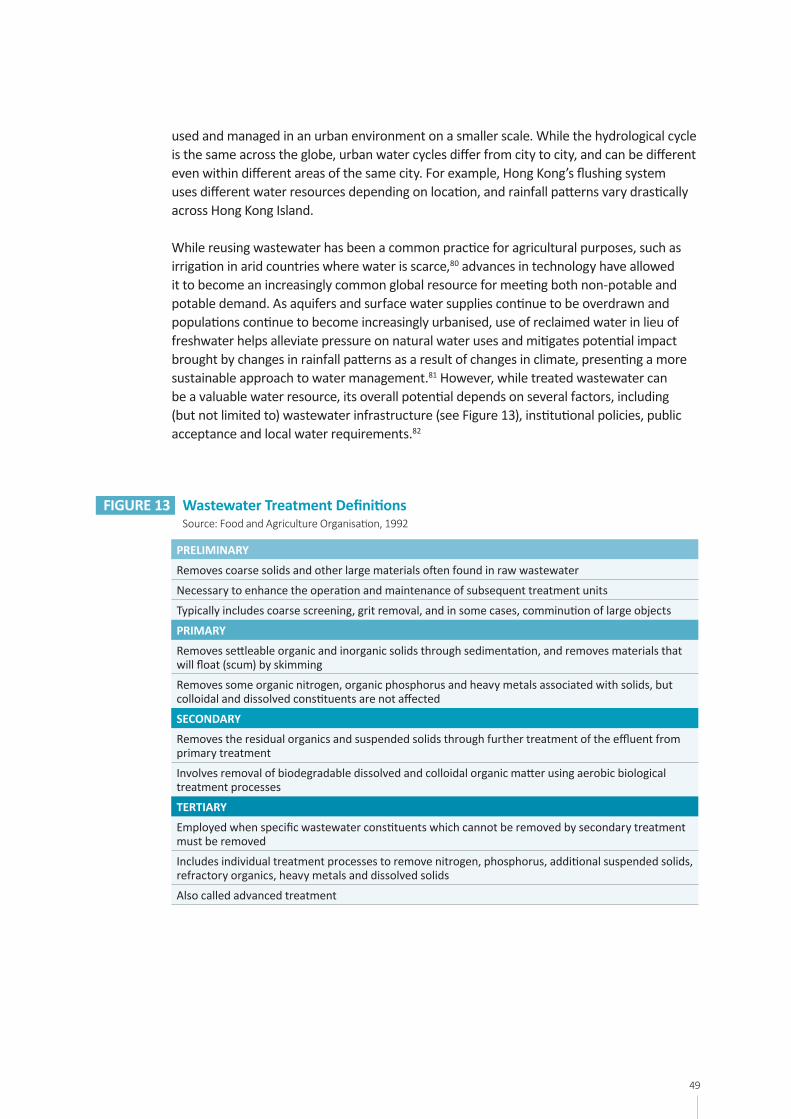
49
used and managed in an urban environment on a smaller scale. While the hydrological cycle is the same across the globe, urban water cycles differ from city to city, and can be different even within different areas of the same city. For example, Hong Kong’s flushing system uses different water resources depending on location, and rainfall patterns vary drastically across Hong Kong Island.
While reusing wastewater has been a common practice for agricultural purposes, such as irrigation in arid countries where water is scarce,80 advances in technology have allowed it to become an increasingly common global resource for meeting both non-potable and potable demand. As aquifers and surface water supplies continue to be overdrawn and populations continue to become increasingly urbanised, use of reclaimed water in lieu of freshwater helps alleviate pressure on natural water uses and mitigates potential impact brought by changes in rainfall patterns as a result of changes in climate, presenting a more sustainable approach to water management.81 However, while treated wastewater can be a valuable water resource, its overall potential depends on several factors, including (but not limited to) wastewater infrastructure (see Figure 13), institutional policies, public acceptance and local water requirements.82
FIGURE 13 Wastewater Treatment Definitions Source:FoodandAgricultureOrganisation,1992
PRELIMINARY
Removes coarse solids and other large materials often found in raw wastewater
Necessary to enhance the operation and maintenance of subsequent treatment units
Typically includes coarse screening, grit removal, and in some cases, comminution of large objects
PRIMARY
Removes settleable organic and inorganic solids through sedimentation, and removes materials that will float (scum) by skimming
Removes some organic nitrogen, organic phosphorus and heavy metals associated with solids, but colloidal and dissolved constituents are not affected
SECONDARY
Removes the residual organics and suspended solids through further treatment of the effluent from primary treatment
Involves removal of biodegradable dissolved and colloidal organic matter using aerobic biological treatment processes
TERTIARY
Employed when specific wastewater constituents which cannot be removed by secondary treatment must be removed
Includes individual treatment processes to remove nitrogen, phosphorus, additional suspended solids, refractory organics, heavy metals and dissolved solids
Also called advanced treatment
50 51
5.2.2. Current uses of reclaimed water in Hong KongWhile the recently completed public consultation on the implementation of reclaimed water for flushing in the New Territories may give the impression that Hong Kong lacks experience with water reclamation, this is not the case. In 2003, an inter-departmental working group led by WSD and involving DSD and the EPD was established to explore potential uses for reclaimed water.83 Following its formation, the group conducted a public opinion survey and determined that the uses of reclaimed water should be limited to non-potable applications, due to low public acceptance of potential potable uses at that time.84
Based on these findings, DSD decided to launch a pilot scheme as a means of gaining experience and to determine the feasibility of reclaimed water reuse in the territory. Commissioned in 2006, the Ngong Ping STW located in Ngong Ping, Lantau Island, became both the first tertiary treatment works and reclaimed water facility to operate in Hong Kong. The plant provides sewage treatment for approximately 40,000 residents and tourists and was designed with a treatment capacity of 2,000 m3 per day. The plant currently treats an average of 450 m3 per day of wastewater, and provides 140 m3 per day of reclaimed water for irrigation, fish rearing and toilet flushing.85 According to DSD, Ngong Ping STW makes use of advanced chemical, biological, filtering and disinfection processes to ensure that the reclaimed water provided is purified, odourless and safe for a wide range of non-potable uses.
Subsequent to the Ngong Ping pilot scheme, DSD commissioned 11 additional small-scale water reclamation trial plants in 2010 to gain a better understanding of how the technologies had changed during the last seven years, and study the effects different types of wastewater had on water reclamation.86 These plants were designed with different scales and technologies (see Figure 14), such as membrane bioreactors and reverse osmosis, and provided non-potable reclaimed water for in-house uses including flushing. Based on the results of these pilot tests, DSD found that plants that received non-saline wastewater that had undergone secondary treatment required less energy and chemical input, while the plants that received saline effluent following primary treatment required significantly more energy, at times on a par with desalination.
Recycled water
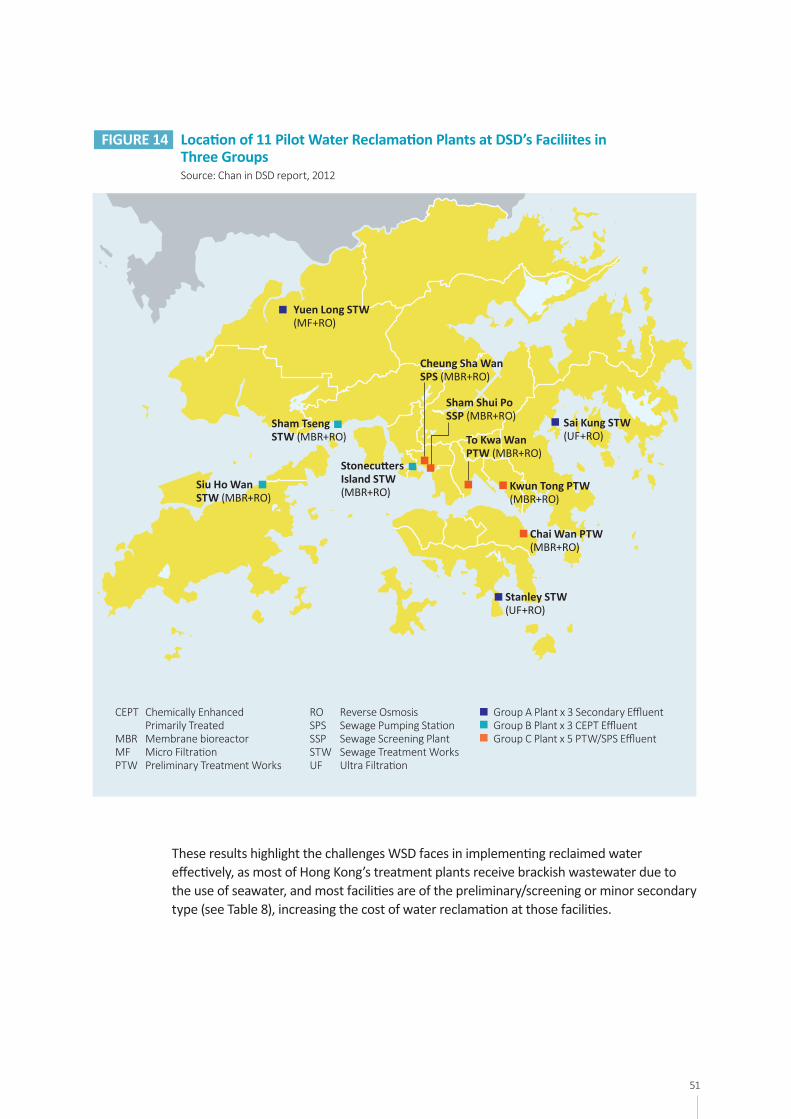
51
FIGURE 14 Location of 11 Pilot Water Reclamation Plants at DSD’s Faciliites in Three Groups Source: Chan in DSD report, 2012
GroupAPlantx3SecondaryEffluentGroupBPlantx3CEPTEffluentGroupCPlantx5PTW/SPSEffluent
Yuen Long STW (MF+RO)
Stanley STW (UF+RO)
Siu Ho Wan STW (MBR+RO)
Sham Tseng STW (MBR+RO)
Stonecutters Island STW (MBR+RO) Kwun Tong PTW
(MBR+RO)
Cheung Sha Wan SPS (MBR+RO)
Sham Shui Po SSP (MBR+RO)
To Kwa Wan PTW (MBR+RO)
Sai Kung STW (UF+RO)
Chai Wan PTW (MBR+RO)
CEPT ChemicallyEnhanced PrimarilyTreatedMBR MembranebioreactorMF MicroFiltrationPTW PreliminaryTreatmentWorks
RO ReverseOsmosisSPS SewagePumpingStationSSP SewageScreeningPlantSTW SewageTreatmentWorksUF UltraFiltration
These results highlight the challenges WSD faces in implementing reclaimed water effectively, as most of Hong Kong’s treatment plants receive brackish wastewater due to the use of seawater, and most facilities are of the preliminary/screening or minor secondary type (see Table 8), increasing the cost of water reclamation at those facilities.
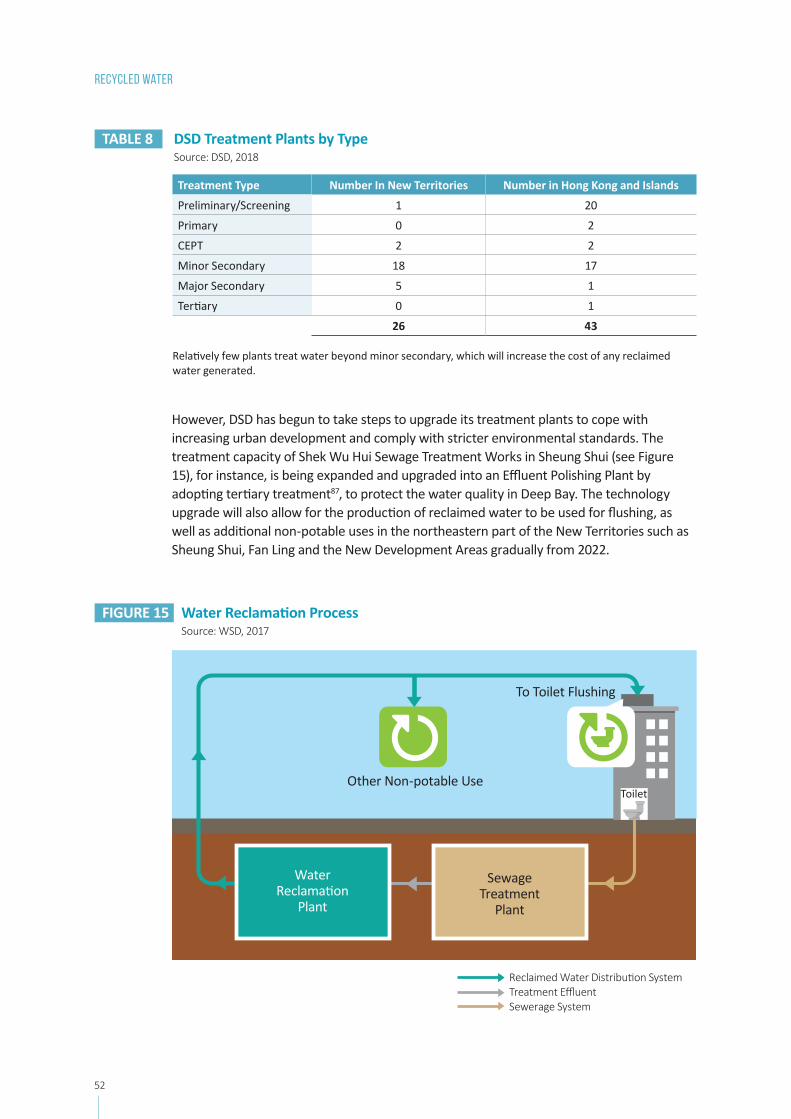
52 53
Recycled water
TABLE 8 DSD Treatment Plants by Type Source: DSD, 2018
Treatment Type Number In New Territories Number in Hong Kong and Islands
Preliminary/Screening 1 20
Primary 0 2
CEPT 2 2
Minor Secondary 18 17
Major Secondary 5 1
Tertiary 0 1
26 43
Relatively few plants treat water beyond minor secondary, which will increase the cost of any reclaimed water generated.
However, DSD has begun to take steps to upgrade its treatment plants to cope with increasing urban development and comply with stricter environmental standards. The treatment capacity of Shek Wu Hui Sewage Treatment Works in Sheung Shui (see Figure 15), for instance, is being expanded and upgraded into an Effluent Polishing Plant by adopting tertiary treatment87, to protect the water quality in Deep Bay. The technology upgrade will also allow for the production of reclaimed water to be used for flushing, as well as additional non-potable uses in the northeastern part of the New Territories such as Sheung Shui, Fan Ling and the New Development Areas gradually from 2022.
FIGURE 15 Water Reclamation Process Source: WSD, 2017
Water Reclamation
Plant
Sewage Treatment
Plant
Other Non-potable Use
To Toilet Flushing
Toilet
ReclaimedWaterDistributionSystemTreatmentEffluentSewerage System
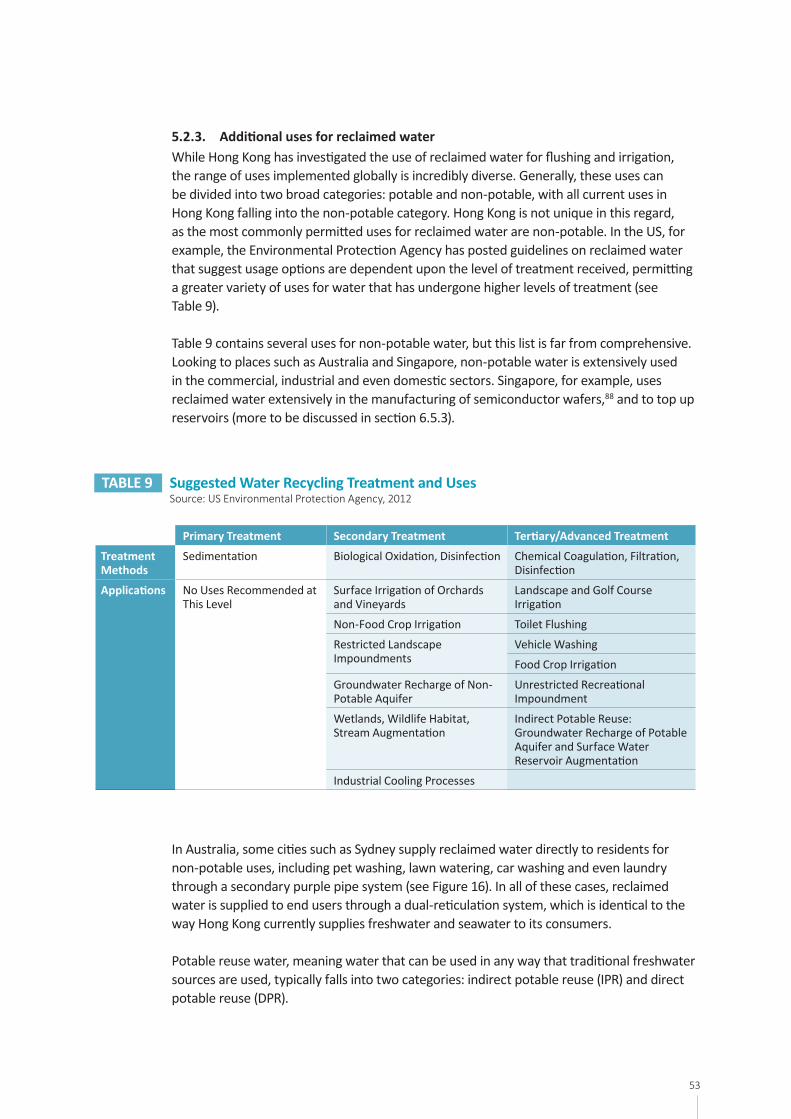
53
5.2.3. Additional uses for reclaimed waterWhile Hong Kong has investigated the use of reclaimed water for flushing and irrigation, the range of uses implemented globally is incredibly diverse. Generally, these uses can be divided into two broad categories: potable and non-potable, with all current uses in Hong Kong falling into the non-potable category. Hong Kong is not unique in this regard, as the most commonly permitted uses for reclaimed water are non-potable. In the US, for example, the Environmental Protection Agency has posted guidelines on reclaimed water that suggest usage options are dependent upon the level of treatment received, permitting a greater variety of uses for water that has undergone higher levels of treatment (see Table 9).
Table 9 contains several uses for non-potable water, but this list is far from comprehensive. Looking to places such as Australia and Singapore, non-potable water is extensively used in the commercial, industrial and even domestic sectors. Singapore, for example, uses reclaimed water extensively in the manufacturing of semiconductor wafers,88 and to top up reservoirs (more to be discussed in section 6.5.3).
TABLE 9 Suggested Water Recycling Treatment and Uses Source:USEnvironmentalProtectionAgency,2012
Primary Treatment Secondary Treatment Tertiary/Advanced Treatment
Treatment Methods
Sedimentation Biological Oxidation, Disinfection Chemical Coagulation, Filtration, Disinfection
Applications No Uses Recommended at This Level
Surface Irrigation of Orchards and Vineyards
Landscape and Golf Course Irrigation
Non-Food Crop Irrigation Toilet Flushing
Restricted Landscape Impoundments
Vehicle Washing
Food Crop Irrigation
Groundwater Recharge of Non-Potable Aquifer
Unrestricted Recreational Impoundment
Wetlands, Wildlife Habitat, Stream Augmentation
Indirect Potable Reuse: Groundwater Recharge of Potable Aquifer and Surface Water Reservoir Augmentation
Industrial Cooling Processes
In Australia, some cities such as Sydney supply reclaimed water directly to residents for non-potable uses, including pet washing, lawn watering, car washing and even laundry through a secondary purple pipe system (see Figure 16). In all of these cases, reclaimed water is supplied to end users through a dual-reticulation system, which is identical to the way Hong Kong currently supplies freshwater and seawater to its consumers.
Potable reuse water, meaning water that can be used in any way that traditional freshwater sources are used, typically falls into two categories: indirect potable reuse (IPR) and direct potable reuse (DPR).
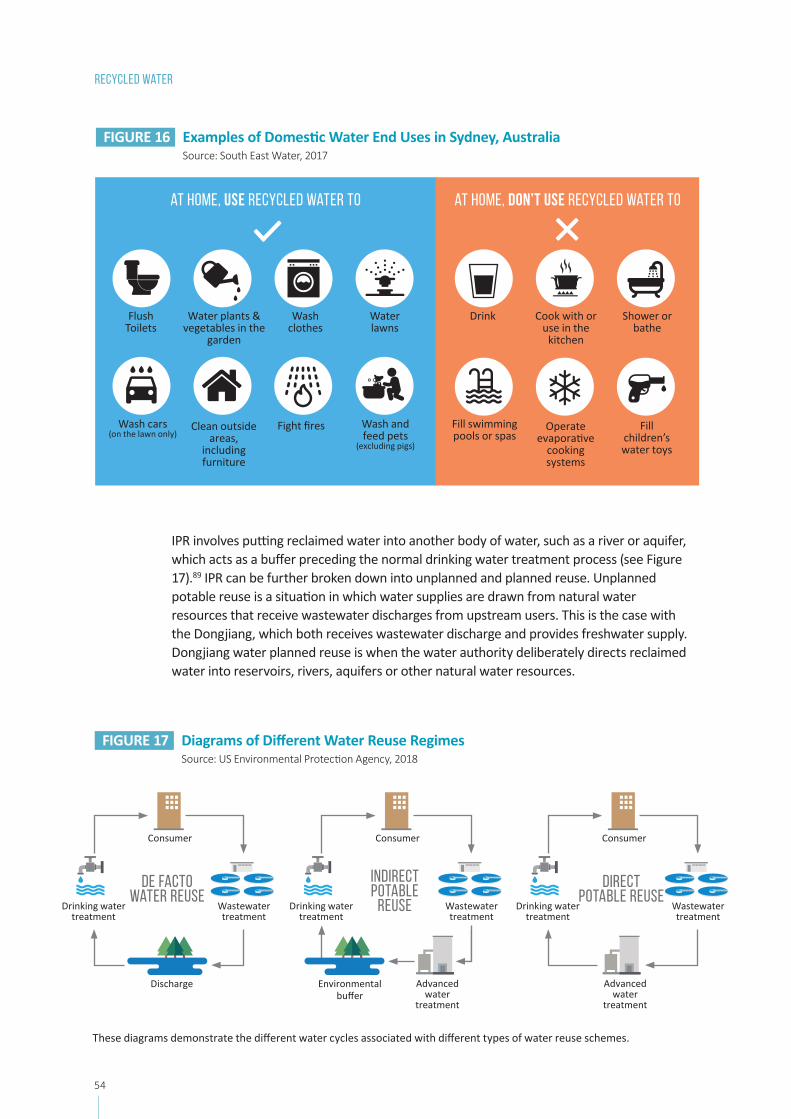
54 55
Recycled water
FIGURE 16 Examples of Domestic Water End Uses in Sydney, Australia
Source: South East Water, 2017
At home, use recycled water to At home, DON’T use recycled water to
Flush Toilets
Water plants & vegetables in the
garden
Wash clothes
Water lawns
Wash cars (on the lawn only)
Clean outside areas,
including furniture
Fight fires Wash and feed pets
(excluding pigs)
Drink Cook with or use in the
kitchen
Shower or bathe
Fill swimming pools or spas
Operate evaporative
cooking systems
Fill children’s water toys
IPR involves putting reclaimed water into another body of water, such as a river or aquifer, which acts as a buffer preceding the normal drinking water treatment process (see Figure 17).89 IPR can be further broken down into unplanned and planned reuse. Unplanned potable reuse is a situation in which water supplies are drawn from natural water resources that receive wastewater discharges from upstream users. This is the case with the Dongjiang, which both receives wastewater discharge and provides freshwater supply. Dongjiang water planned reuse is when the water authority deliberately directs reclaimed water into reservoirs, rivers, aquifers or other natural water resources.
FIGURE 17 Diagrams of Different Water Reuse Regimes
Source:USEnvironmentalProtectionAgency,2018
These diagrams demonstrate the different water cycles associated with different types of water reuse schemes.
DE FActo Water REUSE
Consumer
Wastewater treatment
Drinking water treatment
Discharge
indirect potable
reuse
Consumer
Wastewater treatment
Drinking water treatment
Environmental buffer
Advancedwater
treatment
direct potable reuse
Consumer
Wastewater treatment
Drinking water treatment
Advancedwater
treatment
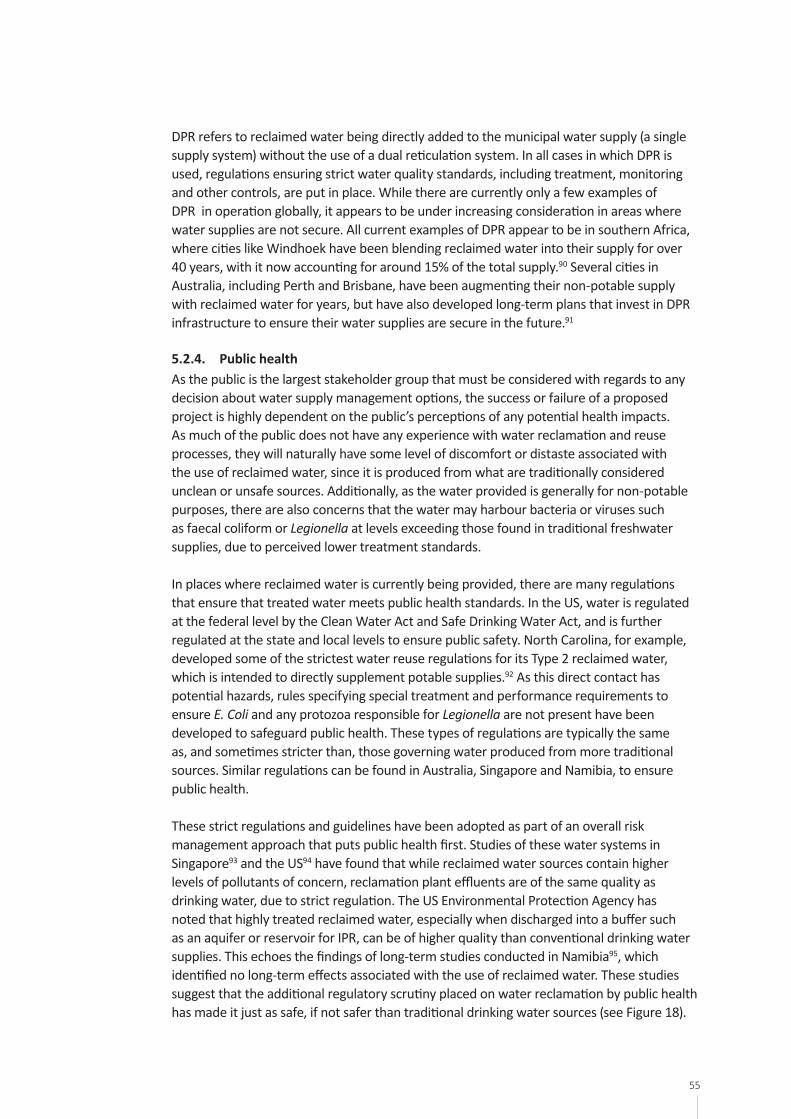
55
DPR refers to reclaimed water being directly added to the municipal water supply (a single supply system) without the use of a dual reticulation system. In all cases in which DPR is used, regulations ensuring strict water quality standards, including treatment, monitoring and other controls, are put in place. While there are currently only a few examples of DPR in operation globally, it appears to be under increasing consideration in areas where water supplies are not secure. All current examples of DPR appear to be in southern Africa, where cities like Windhoek have been blending reclaimed water into their supply for over 40 years, with it now accounting for around 15% of the total supply.90 Several cities in Australia, including Perth and Brisbane, have been augmenting their non-potable supply with reclaimed water for years, but have also developed long-term plans that invest in DPR infrastructure to ensure their water supplies are secure in the future.91
5.2.4. Public healthAs the public is the largest stakeholder group that must be considered with regards to any decision about water supply management options, the success or failure of a proposed project is highly dependent on the public’s perceptions of any potential health impacts. As much of the public does not have any experience with water reclamation and reuse processes, they will naturally have some level of discomfort or distaste associated with the use of reclaimed water, since it is produced from what are traditionally considered unclean or unsafe sources. Additionally, as the water provided is generally for non-potable purposes, there are also concerns that the water may harbour bacteria or viruses such as faecal coliform or Legionella at levels exceeding those found in traditional freshwater supplies, due to perceived lower treatment standards.
In places where reclaimed water is currently being provided, there are many regulations that ensure that treated water meets public health standards. In the US, water is regulated at the federal level by the Clean Water Act and Safe Drinking Water Act, and is further regulated at the state and local levels to ensure public safety. North Carolina, for example, developed some of the strictest water reuse regulations for its Type 2 reclaimed water, which is intended to directly supplement potable supplies.92 As this direct contact has potential hazards, rules specifying special treatment and performance requirements to ensure E. Coli and any protozoa responsible for Legionella are not present have been developed to safeguard public health. These types of regulations are typically the same as, and sometimes stricter than, those governing water produced from more traditional sources. Similar regulations can be found in Australia, Singapore and Namibia, to ensure public health.
These strict regulations and guidelines have been adopted as part of an overall risk management approach that puts public health first. Studies of these water systems in Singapore93 and the US94 have found that while reclaimed water sources contain higher levels of pollutants of concern, reclamation plant effluents are of the same quality as drinking water, due to strict regulation. The US Environmental Protection Agency has noted that highly treated reclaimed water, especially when discharged into a buffer such as an aquifer or reservoir for IPR, can be of higher quality than conventional drinking water supplies. This echoes the findings of long-term studies conducted in Namibia95, which identified no long-term effects associated with the use of reclaimed water. These studies suggest that the additional regulatory scrutiny placed on water reclamation by public health has made it just as safe, if not safer than traditional drinking water sources (see Figure 18).
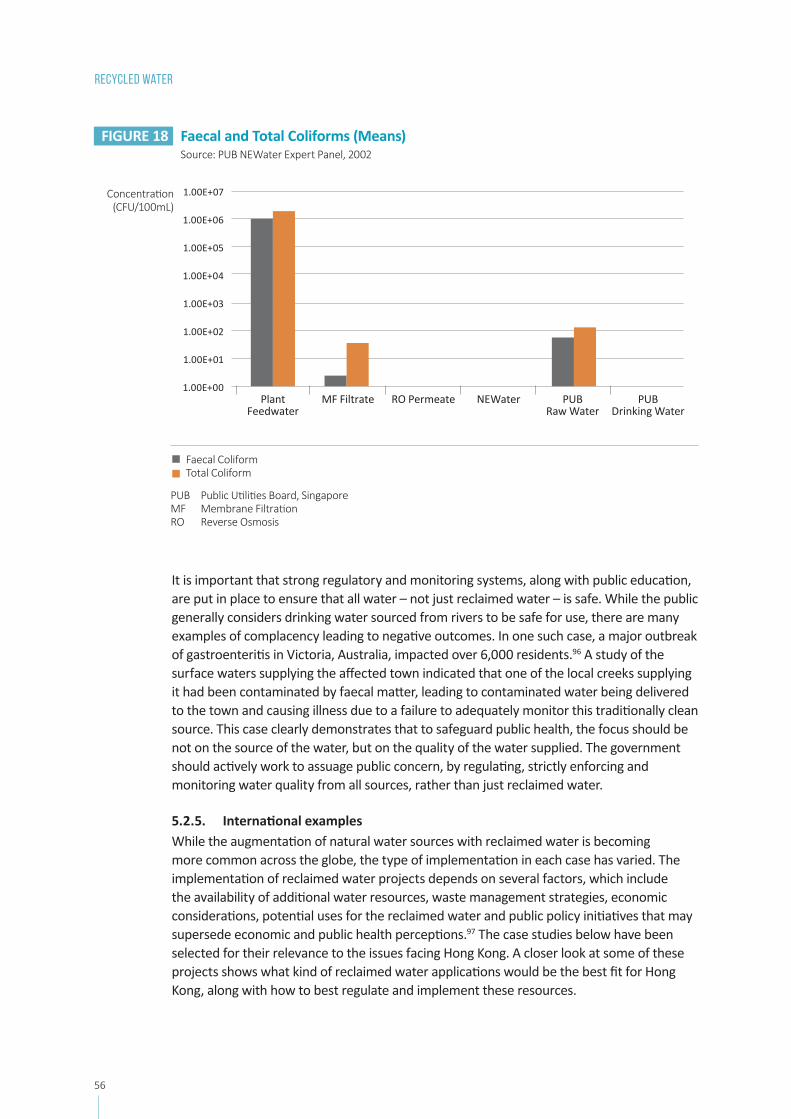
56 57
Recycled water
FIGURE 18 Faecal and Total Coliforms (Means)
Source:PUBNEWaterExpertPanel,2002
1.00E+07
1.00E+06
1.00E+05
1.00E+04
1.00E+03
1.00E+02
1.00E+01
1.00E+00
Concentration(CFU/100mL)
Plant Feedwater
MF Filtrate RO Permeate NEWater PUB Raw Water
PUB Drinking Water
FaecalColiform TotalColiform
PUB PublicUtilitiesBoard,SingaporeMF MembraneFiltrationRO ReverseOsmosis
It is important that strong regulatory and monitoring systems, along with public education, are put in place to ensure that all water – not just reclaimed water – is safe. While the public generally considers drinking water sourced from rivers to be safe for use, there are many examples of complacency leading to negative outcomes. In one such case, a major outbreak of gastroenteritis in Victoria, Australia, impacted over 6,000 residents.96 A study of the surface waters supplying the affected town indicated that one of the local creeks supplying it had been contaminated by faecal matter, leading to contaminated water being delivered to the town and causing illness due to a failure to adequately monitor this traditionally clean source. This case clearly demonstrates that to safeguard public health, the focus should be not on the source of the water, but on the quality of the water supplied. The government should actively work to assuage public concern, by regulating, strictly enforcing and monitoring water quality from all sources, rather than just reclaimed water.
5.2.5. International examplesWhile the augmentation of natural water sources with reclaimed water is becoming more common across the globe, the type of implementation in each case has varied. The implementation of reclaimed water projects depends on several factors, which include the availability of additional water resources, waste management strategies, economic considerations, potential uses for the reclaimed water and public policy initiatives that may supersede economic and public health perceptions.97 The case studies below have been selected for their relevance to the issues facing Hong Kong. A closer look at some of these projects shows what kind of reclaimed water applications would be the best fit for Hong Kong, along with how to best regulate and implement these resources.
57
5.2.5.1. California: adoption through regulatory changeCalifornia’s experience with water reuse began back in the 1890s, when farmers near urban areas began using untreated wastewater for agricultural purposes. Raw sewage was also used for landscaping purposes in Golden Gate Park until 1932, when the McQueen treatment plant began to supply treated water.98 By 1955, the use had expanded to flushing, with the El Tovar hotel being one of the first to implement this practice.99 Following the implementation of the Clean Water Act in 1972, California began to upgrade its wastewater treatment, leading to a significant diversification in the permitted uses (see Figure 19).100
FIGURE 19 Reclaimed Water Reuse Trend in California, with Regional Variations in Adoption Source:NRDCPacificInstitute,2014
2010
800
700
600
500
400
300
200
100
01970
thousand acre-feet
1975 1980 1985 1990 1995 2000 2005year
AgriculturalirrigationUrbanirrigationGroundwater rechargeCommercialandindustrialEnvironmentRecreationGeothermalenergyOther
37%
23%
19%
9%4%
4%
2%
2%
Early uses were based around groundwater resource augmentation, which were meant to protect aquifers from becoming overdrawn and being infiltrated by seawater. Los Angeles and the West Basin have been putting reclaimed water in their aquifers since the 1950s, and it is estimated that nearly 23% of the potable water supplied qualifies as unplanned potable reuse, providing a sizeable proportion of freshwater demand. The continued integration and expansion of reclaimed water into the supply system is an integral part of California’s water strategy, and has been recognised as such by state law,101 which encourages the study of direct potable reuse to drought-proof supplies.
These efforts have resulted in 47 approved uses of reclaimed water in California at the state level. While no municipality currently employs all the permitted uses, they have the flexibility to pick and choose the ones that best suit their circumstances. To encourage municipalities to expand their non-potable use programmes, the state updated its permit programme to approve all 47 uses at once instead of forcing municipalities to apply for each use.102 There are also several programmes such as the Water Recycling Facilities Planning Grant Programme and the Water Recycling Construction Programme that offer grants and low-interest loans for public agencies to investigate the feasibility of reclaimed water projects, with hopes of securing 30-50% of the supply by 2050.
58 59
California provides a clear example of the importance of proactive research and regulation to encourage wastewater reclamation adoption across a diversity of uses, while assuring the public that water quality will be maintained. The importance of proper funding and communication are also highlighted here, which signals the government’s commitment towards these long-term investments to the public.
5.2.5.2. Colorado: failure to adopt due to lack of coordinationDenver Water, the water supply authority for the City and County of Denver, first began to examine alternative water sources for direct potable reuse in the late 1980s. After seven years and a cost of approximately HK$235 million, Denver Water developed a process that utilised a suite of treatment methods to remove a broad spectrum of bacteria and pollutants from water, ensuring it would meet all local and national drinking water safety standards.103 Based on the study, the water authority verified that its system was reliable and would not impact public health.
After the Environmental Protection Agency denied the water authority permission to build the Two Forks Dam in 1990, a decision was made to supply Denver International Airport with reclaimed water for IPR to conserve water resources and put their newly developed technology to use. Unfortunately, the Denver Metro Wastewater Reclamation District, which was a separate authority overseeing sewage, had already expanded a nearby plant to provide wastewater treatment for the airport. This prevented the water authority from implementing its system, highlighting the institutional problems that can occur when different agencies are tasked with managing water resources, due to a lack of communication and coordination.
The importance of communication between agencies with similar missions is clear, if overlap and other forms of wasted investment are to be avoided. This lesson is of particular use to Hong Kong, which has a siloed, hierarchical government structure, with many players involved in water management activities. The need for a method to cut through these barriers, either by the creation of new agencies to facilitate communication or merging agencies with significantly similar duties, creating clear accountability for agencies, is key to avoid this kind of mistake.
5.2.5.3. Singapore: maximising potentialSingapore’s demand for water among various sectors, its standard of living, residential incomes and overall water resources are similar to Hong Kong’s. These commonalities make Singapore a valuable comparison point. Singapore is also dependent upon imported water for the majority of its supply, which it receives through an agreement with Malaysia that is periodically renegotiated, leaving its long-term position insecure with regard to the overall cost and other terms. Due to this insecurity, Singapore has developed an aggressive and holistic water policy, with a plan to meet up to 55% of its total demand from reclaimed water, or NEWater. NEWater has several advantages over desalination for Singapore, one of which is lower energy costs. An expert panel determined that NEWater consumes only 0.7-0.9 kWh per m3, while recovering 80% of treated wastewater.104
Recycled water
59
NEWater is currently used for both non-potable and indirect potable reuse, with non-potable water sent directly to consumers through a separate supply system. The majority of NEWater produced is used by the country’s industrial sector, while up to 10% is placed in reservoirs for reuse. This indirect reuse was authorised after studies found the water reclamation process was effective at killing bacteria.105 A 2002 survey showed broad public acceptance, with 82% of respondents indicating willingness to drink reclaimed water directly,106 a significant increase from when NEWater was first proposed and introduced. This high level of acceptance speaks to the efforts Singapore and the Public Utilities Board have put into public education, communication and monitoring to ensure NEWater would not negatively impact the public’s wellbeing and would be well-received.
Singapore provides an example of a place that has put all of its resources, whether they be financial, land based, or technological, to work to maximize its water supply. All aspects of Singapore’s society, including urban planning and education, are designed to ensure an adequate water supply. Further, no options are ever written off as impractical, as periodic reviews are done to see how technologies such as desalination have changed. This holistic, long-term, and forwards-thinking approach involves all aspects of society in ensuring water supply needs are met.
5.2.5.4. Windhoek: demonstrating long-term safety Despite an average rainfall of 250 mm per year, Namibia suffers from a severe lack of freshwater resources: 83% of its water evaporates and only 1% filters down to replenish the groundwater that the country relies on to satisfy 40% of its demand for water.107 As a result, water consumption in the capital Windhoek has to be carefully regulated. In addition to full groundwater utilisation, Windhoek has exploited all surface water within 500 km to meet growing demand, due to a combination of pressures from population and economic growth in tandem with rising living standards.108 Because the further exploitation of surface water was impractically expensive, in 1968 the city commissioned the Goreangab water reclamation plant for direct potable reuse, which supplied a blend of fresh and reclaimed water directly to consumers.109
As the longest running DPR facility in the world, the plant’s technology has required continuous upgrades to keep up with changes in demand and drinking water standards. The plant now supplies approximately 350,000 of Windhoek’s residents with reclaimed water, around 15% of the city’s drinking water supply.110 Depending on seasonal demand, 35-50% of reclaimed water is used to augment surface water supplies, recharge aquifers and for irrigation.111
60 61
While the scheme has been widely accepted by the public, not all inhabitants receive reclaimed water. This situation presents an ideal opportunity to study the health effects of potable reuse over an extended period, and to this end, many studies have been conducted to determine whether there have been any adverse effects from drinking the water. The results of these epidemiological studies comparing the two populations have shown no increased incidence of illness or disease associated with the water reuse process in Windhoek,112 demonstrating reclaimed water’s potential as a safe alternative future water source, with proper treatment and regulation.
As the longest running DPR facility in the world, Windhoek has demonstrated that reclaimed water does not represent a public health hazard. This example highlights how the public can grow to trust a utility when they demonstrate competence, with no major incidents occurring that have harmed public health. In fact, due to the cautious approach taken by the water utility, Windhoek has shown that reclaimed water can perhaps be higher quality than more traditional water sources. Close study of this example can provide Hong Kong with a greater understanding of how to communicate with the public and what is necessary to bring the public on board with uses of reclaimed water that they may traditionally be put off by.
5.2.6. Reclaimed water potential in Hong KongReclaimed water has a wide range of potential potable and non-potable applications, depending on local resources. For Hong Kong, the adoption of reclaimed water for flushing and other non-potable uses, in particular in the New Territories, makes sense from the persepctives of both economic and environmental resilience. However, potable uses will remain economically unviable due to the need for further treatment to meet drinking water standards and ensure public health protection.
Overall, the ability to harness this resource to replace freshwater flushing or for provision to the industrial and commercial sectors is hampered by the presence of seawater in the wastewater stream, which makes reclamation difficult and expensive. Additionally, the majority of Hong Kong’s wastewater treatment plants are rated as preliminary, primary, or minor secondary, meaning they are not suitable for most reclaimed water uses (see Table 9). Further, the wastewater stream treated at these plants is brackish, meaning the potential applications of reclaimed water are limited without significant capital investment on the part of DSD.
In terms of supplying water for flushing, the seawater system has a distinct economic advantage over other sources of water due to the compact size of the city. At an average cost of only HK$4.26 per m3, it is even cheaper than the supply of local yield. Additionally, with the cost of purchasing water approaching that of desalination, the ability to offset its use is becoming more important, as this price reflects the pressure on the resource within Mainland China. Based on WSD estimates, reclaimed water can be provided in Hong Kong for about HK$6.5 per m3, making it 65% of the cost of Dongjiang water and a more drought-resilient resource. By investing in technologies that will make it possible to harvest and
Recycled water
61
supply this water for a wide range of non- potable uses, Hong Kong can secure a low-cost water resource that is drought-resilient and provides environmental benefits in terms of both reduced energy usage and improved local water quality. This also creates the potential for the establishment of a more distributed system which could save both the energy and water loss of transmission. More localised data is necessary to determine the optimal size of such a system.
Economics aside, the successful implementation of reclaimed water projects hinges on many factors, with two of the most important being public acceptance and institutional expertise. As a result, coordination of projects, responsibilities and communication between Hong Kong’s two major water agencies, DSD and WSD, and the public will need to increase for reclaimed water to be utilised at its full potential. This interagency coordination is not only necessary to provide education and prevent duplication of efforts (as DSD oversees wastewater while WSD maintains authority over the water supply), but also build public trust in the institutions, as their ability to work with one another will be a positive factor in ensuring a safe and resilient drinking water supply.
62 63
DesalinatED WATER
Desalination has been adopted or is under consideration as a water resource in arid and water-deprived countries around the world. While the choice to desalinate is clear for countries that do not have access to sufficient freshwater resources, such as Saudi Arabia and Israel, countries like Singapore and Australia instead balance this decision against the costs and risks of other water resources. If this balance is not carefully considered, expensive investments in desalination plants could end up being left dormant, as is the case in Melbourne, where the desalination facilities are currently operating at a very low percentage of their overall capacity. Singapore, in contrast, plans to increase its desalination capacity as part of its long-term water management strategy.
The motives of Singapore, which expects at least 30% of its water resources to come from this tap after major investment, are different to those of Hong Kong. Singapore purchases water at HK$0.22 per m3 from Malaysia, a fraction of the cost that Hong Kong faces, but does not wish to continue this arrangement in the future. In order to fully replace purchased water as a source, Singapore is willing to adopt more expensive and energy-intensive technologies to ensure self-sufficiency.
In Hong Kong’s case, major investment in desalination appears to be impractical in light of current water resources. While desalination presents a reliable drought-resistant water resource, its large-scale use is not advisable due to its high energy demands and cost compared to other resources. While Hong Kong lacks local water resources, our access to Dongjiang water from Guangdong is currently cheaper than desalination and may remain so under future purchase agreements. Reclaimed water presents a similarly drought-resilient water source that can produce high-quality water with less energy and at a lower cost. When viewed in this context, it is difficult to support the advocacy by the government for significant investment in desalination.
6.1. Previous experience
Hong Kong’s first experience with desalination occurred during its time as a British colony, as an effort to avoid purchasing water from Mainland China. As a result of the droughts in 1963, the government resurrected the idea of constructing a desalination plant, going so far as to invite the US to participate in its design, as the US was concerned by Mainland China’s increasing role in providing water. By 1977, the plant was up and running and producing 272,000 m3 a day,113 or nearly 100 million m3 per year, making it larger than any other in the
6
63
world at the time, and interestingly, than the one currently being designed in Tseung Kwan O. With the completion of Plover Cove and High Island reservoirs in conjunction with the exploitation of seawater resources, the government felt it would be able to minimise the importation of water for some time.
However, financial constraints and the approaching handover to Mainland China would eventually force a shift in policy. Capital expenditure on the water supply represented a large portion of the government’s overall budget, hovering at around 10% a year,114 while purchases of water represented 11% of water expenditures or about 1% of overall expenditures. The choice not to be dependent on Chinese imports, despite the overall lower costs, reflected the British Government’s desire to minimise the greater risk of political influence by the Chinese Government beyond the water supply. Following the 1979 Sino-British dialogues, however, this stance no longer made political or economic sense, as British influence was set to decline, and Hong Kong would no longer be a colony. As the Hong Kong-China border was replaced by the “one country, two systems” model, the increasing reliance on purchasing water became a matter of practicality, and development of local supplies was put on hold due to the costs, both political and economic.
6.2. Desalination and Hong Kong’s broader goals
Desalination, the most significant proposed additional water source under consideration by WSD in its TWM strategy,115 is planned to contribute up to 5% of projected freshwater demand after 2023. It is important to take into account how this alternative water resource fits with Hong Kong’s other goal, including the Hong Kong 2030+ plan, which calls not just for an adequate water supply, but also a “smart, green and resilient infrastructure that should be well-integrated for better synergy and land efficiency.”116
We can look to Singapore for an example of a country that has incorporated a significant proportion of desalinated water into its long-term water strategy. Currently, Singapore has four water sources: imported water, NEWater (reclaimed water), desalinated water and local catchment. Much like Hong Kong, it receives a significant proportion of its water from imports – up to 60% – with NEWater capable of supplying a maximum of 40%, desalination up to 30%, and local resources supplying a maximum of 10%.117 Singapore’s investment in these manufactured resources has driven down the percentage of water used in the mix from the River Johor that flows from Malaysia from an average of 50% to an average of 40% in recent years. This has not, however, been driven by a desire to reduce costs or build climate resilience into the system, as these manufactured sources are significantly more expensive and energy-intensive than imported water.
Unlike that of Hong Kong, Singapore’s investment is primarily driven by a policy of self-sufficiency. While we argue that Hong Kong should begin purchasing less water from Guangdong, our assessment is based on the rising cost of water purchases, the potential future competition of need from cities upriver and the need to make the system more resilient to changes in rainfall by introducing resources immune to changes in natural flows. Singapore, however, has a different relationship with Malaysia that makes self-sufficiency a higher priority than these other goals.
64 65
DesalinatED WATER
Importing water from the Johor is governed by two agreements, one signed in 1962 and the other in 1990, both of which will expire in 2061.118 While those agreements provide Singapore with a secure, low-cost water supply, at only HK$0.22 per m3, the country does not wish to rely on the renewal of this supply in 2061 and plans to phase out this source before then due to regional politics. As for Hong Kong, the complete phasing-out of Dongjiang water would not make sense from an economic or environmental standpoint, making a minimal investment in desalination the most practical option when compared to alternatives such as reclaimed water.
6.3. Desalination approaches
There are several technologies under development, such as electro-desalination in Singapore, that have the potential to lower the energy requirements of desalination, but they are still operating at the lab or pilot level and have yet to be proven on the scale needed to be commercially viable. While Singapore’s pilot-scale plant has shown that this technology has the potential to desalinate water more efficiently than current technologies, it still faces many limitations that must be overcome. Most critically, the technology can only currently remove salts from the water, meaning that other superfluous substances must be removed through additional treatment methods, making the overall process less efficient.119 In addition, while the new technology is more efficient at treating highly concentrated salt solutions, it has not yet been shown to be more efficient when it comes to the treatment of real seawater.120
Currently, three major desalination technologies are used commercially (see Figure 20): reverse osmosis (RO), multi-stage flash (MSF) and multi-effect distillation (MED). MSF is the oldest desalination technology and was used at Hong Kong’s Lok On Pai desalting plant back in 1970. MSF works by heating water under high pressure and then passing the water through a series of lower pressure chambers, which causes the water to boil and evaporate. The water vapour then condenses and is collected as freshwater. MED is similar but utilises the heat from each earlier chamber to assist in evaporation, requiring slightly less energy.
Types Technique Energy Consumption (ranked)
Water Recovery Rate (ranked)
Purity of Water
MSF Thermal-based Highest Lowest High-purity
MED Thermal-based Middle Middle High-purity
RO Membrane-based Lowest Highest Membrane susceptible to
fouling, leading to lower quality
FIGURE 20 Comparison of Major Desalination Technologies Source: LegislativeCouncil,2015
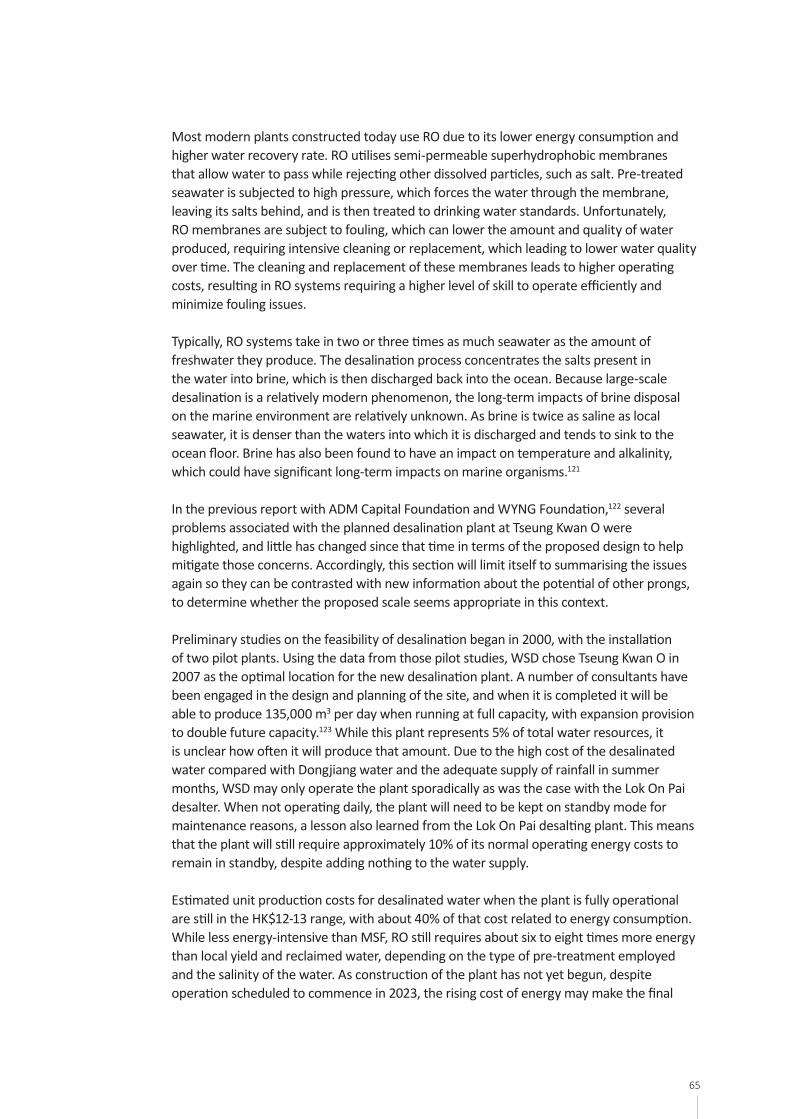
65
Most modern plants constructed today use RO due to its lower energy consumption and higher water recovery rate. RO utilises semi-permeable superhydrophobic membranes that allow water to pass while rejecting other dissolved particles, such as salt. Pre-treated seawater is subjected to high pressure, which forces the water through the membrane, leaving its salts behind, and is then treated to drinking water standards. Unfortunately, RO membranes are subject to fouling, which can lower the amount and quality of water produced, requiring intensive cleaning or replacement, which leading to lower water quality over time. The cleaning and replacement of these membranes leads to higher operating costs, resulting in RO systems requiring a higher level of skill to operate efficiently and minimize fouling issues.
Typically, RO systems take in two or three times as much seawater as the amount of freshwater they produce. The desalination process concentrates the salts present in the water into brine, which is then discharged back into the ocean. Because large-scale desalination is a relatively modern phenomenon, the long-term impacts of brine disposal on the marine environment are relatively unknown. As brine is twice as saline as local seawater, it is denser than the waters into which it is discharged and tends to sink to the ocean floor. Brine has also been found to have an impact on temperature and alkalinity, which could have significant long-term impacts on marine organisms.121
In the previous report with ADM Capital Foundation and WYNG Foundation,122 several problems associated with the planned desalination plant at Tseung Kwan O were highlighted, and little has changed since that time in terms of the proposed design to help mitigate those concerns. Accordingly, this section will limit itself to summarising the issues again so they can be contrasted with new information about the potential of other prongs, to determine whether the proposed scale seems appropriate in this context.
Preliminary studies on the feasibility of desalination began in 2000, with the installation of two pilot plants. Using the data from those pilot studies, WSD chose Tseung Kwan O in 2007 as the optimal location for the new desalination plant. A number of consultants have been engaged in the design and planning of the site, and when it is completed it will be able to produce 135,000 m3 per day when running at full capacity, with expansion provision to double future capacity.123 While this plant represents 5% of total water resources, it is unclear how often it will produce that amount. Due to the high cost of the desalinated water compared with Dongjiang water and the adequate supply of rainfall in summer months, WSD may only operate the plant sporadically as was the case with the Lok On Pai desalter. When not operating daily, the plant will need to be kept on standby mode for maintenance reasons, a lesson also learned from the Lok On Pai desalting plant. This means that the plant will still require approximately 10% of its normal operating energy costs to remain in standby, despite adding nothing to the water supply.
Estimated unit production costs for desalinated water when the plant is fully operational are still in the HK$12-13 range, with about 40% of that cost related to energy consumption. While less energy-intensive than MSF, RO still requires about six to eight times more energy than local yield and reclaimed water, depending on the type of pre-treatment employed and the salinity of the water. As construction of the plant has not yet begun, despite operation scheduled to commence in 2023, the rising cost of energy may make the final
66 67
DesalinatED WATER
unit price even higher by the time the plant is completed, making it even less attractive when compared to other alternatives, unless future changes in technology to increase its efficiency can be incorporated into the final design.
6.4. From one vulnerability to another
While desalination can add an additional 5-10% to the water supply, providing sufficient extra capacity to cover shortfalls, it is unclear how much impact this would have in an extended drought situation like Hong Kong saw in 1963 and 1967. Additionally, desalination is energy-intensive and potentially environmentally damaging.124 Considering that Hong Kong is looking for solutions that are climate-resilient and green, this strategy is counter-productive to those goals. With several more sustainable, environmentally friendly and economical options, such as treating grey water and sewage, the benefits of desalination in the near term are unclear.
That is not to say that desalination will never be a practical option. New technologies are constantly being researched, and low-energy desalination is currently being implemented at the lab scale. In Singapore, Siemens has demonstrated a process that could desalinate seawater using just 1.65 kWh per m3, less than half of that required by current RO technologies.125 Other less energy-intensive technologies are also being lab-tested in Korea, meaning that commercial-scale desalination could become cost-competitive in the near future. The use of renewable energy could also make desalination more attractive by offsetting both energy costs and associated emissions. While no major desalination plant currently relies on renewable energy to produce water, due to issues with adequate energy availability, reliability and cost among other technical challenges,126 this hurdle may eventually be overcome. Reducing energy costs by half would make desalination competitive with Dongjiang water today, and even cheaper in the future. However, until these technologies become available, desalination will remain impractical for Hong Kong as it would prove costly for its residents.
67
Conclusion and recommendations
Through an analysis of the current infrastructure, water resources and the WSD’s proposed changes to this mix, this paper has highlighted several issues related to Hong Kong’s long-term strategy for securing a stable, resilient and sustainable supply of water. In addition to the demand management measures presented in this report’s sister paper “Conservation and Consumption: Towards a Water-Smart Hong Kong”, WSD has put forward plans to increase the supply through the introduction of desalinated water, harvested rainwater, treated grey water and reclaimed water, which will constitute approximately 6.3% of Hong Kong’s total water resources. However, as we have noted, among these new reserves, only desalinated water will contribute to 5% of potable resources and the current plans are not aggressive or ambitious enough to lower our reliance on natural flows, nor do they appear to increase the long-term resilience of the system in the face of climate change.
In designing its current plan, and despite the plan’s increasing cost amid constantly improving lower-cost alternatives, Hong Kong has essentially decided to maintain the status quo of reliance on Dongjiang water, which is dependent on natural flows. This indicates a rather myopic approach, as it does not account for the effects of climate change on rainfall variability, or changes to the economic and population growth of the Pearl River Delta, which will increase the overall vulnerability of the supply. Furthermore, it does not take into consideration the broader development goals put forth in the Hong Kong 2030+ strategy, which aim to upgrade existing waterworks infrastructure or build new facilities that are smart, green and resilient. In many ways, the current plan runs counter to these goals, as it seeks to procure 5% of supply through desalination, which would require significant additional electricity, thus worsening local air pollution concerns and potentially exacerbating the effects of long-term climate change.
WSD is already one of the largest energy consumers in Hong Kong, accounting for 53.8% of government electricity use in 2015.127 Given that Hong Kong’s present fuel mix is heavily fossil fuel-based, switching to desalination as a water resource would further increase its carbon footprint, as the production of each m3 of water requires six to eight times as much electricity as our current freshwater does during production and distribution. The planned
7
68 69
investment in desalination would potentially increase WSD’s current energy use by 30-40%, while significant investment in this technology would have an even greater impact.128 This massive increase in energy use would require Hong Kong to invest in greater local electrical capacity or further increase its imports from Mainland China, potentially increasing costs for all users. In lieu of desalination, a focus on resilience and sustainability – as outlined in the Hong Kong 2030+ strategy – suggests that Hong Kong should place greater emphasis on less energy-intensive water resources and begin increasing their investment in renewable energy capacity as an additional measure.
By focusing on reclaimed water, harvested rainwater or grey water, which can be treated to be fit for purpose, WSD could develop a less energy-intensive plan than through desalination. Depending on the water quality and treatment level, these alternatives have been found to use a level of energy that is not significantly higher than that of the current water mix. In fact, treated sewage can even have a lower energy cost than seawater flushing in some cases. Over time, a focus on reclaimed water could demonstrate other potential benefits as well, as treatment of saline wastewater presents DSD with challenges that increase the cost of waste treatment. The higher treatment standards for reclaimed water production could also produce environmental benefits, as the sewage that is discharged to the environment would be less harmful. Much like their current efforts with seawater flushing, WSD can encourage or require new building developments to adopt reclaimed water systems, and existing developments can be encouraged to retrofit their systems as the technology is rolled out.
By expanding lower grade water to cover non-potable uses beyond flushing, Hong Kong’s limited freshwater resources could be saved for potable purposes, while the water supply’s overall vulnerability to fluctuations in the natural water cycle could be reduced, thereby boosting the city’s drought resilience. Following WSD’s current model of a centralised water distribution system, implementation of reclaimed water would require DSD to upgrade current plants rather than construct new facilities, which is a good use of limited land resources. However, reclaimed water technologies also present WSD with the opportunity to decentralise this aspect of the water supply in the future, lowering pumping costs and minimising energy requirements. As Hong Kong becomes increasingly integrated into the Greater Bay Area, it must begin to take a more holistic and forward-looking approach that considers these issues, which have traditionally been considered exogenous to the water supply policy planning process.
In addition to the recommendations put forth in this report’s sister paper, “Conservation and Consumption: Towards a Water-Smart Hong Kong”, with regard to improving demand management through proper pricing, increased conservation efforts and education, we would like to make the following suggestions for improving the deployment of different water sources, based on these criteria:
Conclusion and recommendations
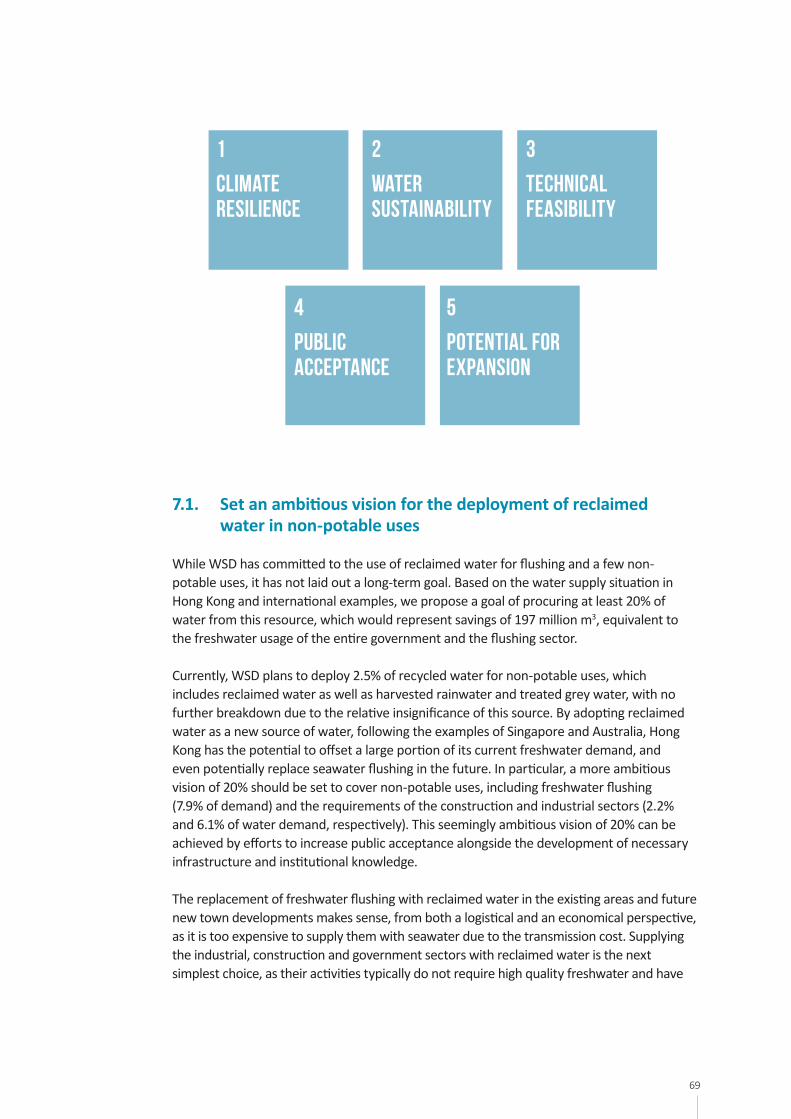
69
1
Climate resilience
2
Water sustainability
3
Technical feasibility
4
Public acceptance
5
POTENTIAL FOR EXPANSION
7.1. Set an ambitious vision for the deployment of reclaimed water in non-potable uses
While WSD has committed to the use of reclaimed water for flushing and a few non-potable uses, it has not laid out a long-term goal. Based on the water supply situation in Hong Kong and international examples, we propose a goal of procuring at least 20% of water from this resource, which would represent savings of 197 million m3, equivalent to the freshwater usage of the entire government and the flushing sector.
Currently, WSD plans to deploy 2.5% of recycled water for non-potable uses, which includes reclaimed water as well as harvested rainwater and treated grey water, with no further breakdown due to the relative insignificance of this source. By adopting reclaimed water as a new source of water, following the examples of Singapore and Australia, Hong Kong has the potential to offset a large portion of its current freshwater demand, and even potentially replace seawater flushing in the future. In particular, a more ambitious vision of 20% should be set to cover non-potable uses, including freshwater flushing (7.9% of demand) and the requirements of the construction and industrial sectors (2.2% and 6.1% of water demand, respectively). This seemingly ambitious vision of 20% can be achieved by efforts to increase public acceptance alongside the development of necessary infrastructure and institutional knowledge.
The replacement of freshwater flushing with reclaimed water in the existing areas and future new town developments makes sense, from both a logistical and an economical perspective, as it is too expensive to supply them with seawater due to the transmission cost. Supplying the industrial, construction and government sectors with reclaimed water is the next simplest choice, as their activities typically do not require high quality freshwater and have
70 71
low public exposure, as it is not used for food preparation, showering or other domestic needs. The service sector is the most challenging from a public acceptance standpoint as it includes hotels and restaurants, and many of its activities involve the use of water that will be directly consumed by the public. Large-scale production of reclaimed water will also be complicated by logistical constraints. As sewage treatment is currently highly centralised at Stonecutter Island, WSD will need to work with DSD to create a decentralised reclaimed water treatment system, which is not a feasible short or mid-term goal. While production of a higher percentage will be possible in the long term, it would be impractical to set a more ambitious goal at this time.
This initial expansion, aimed at replacing flushing and non-potable uses such as building systems operation, dust suppression, concrete manufacturing, landscaping and building washing, would also lay the necessary groundwork for further non-potable uses to offset Dongjiang water use. As WSD gains experience and demonstrates the safety of this resource, they will build up the level of public trust necessary for the system’s future expansion. Adding more uses, in tandem with increased penetration into seawater flushing areas, will provide dual benefits in the long-term, both by providing a more economical and resilient water supply, and by lowering the burden on DSD, as it will be treating progressively less salty water in the long term.
7.2. Reconsider the necessary conditions for deploying desalination as a backup option of freshwater supply
While desalination has been regarded as a strategic water resource which is not susceptible to the impacts of climate change and could provide Hong Kong with a drought-proof source of water, we must consider the overall impacts of the technology when deciding how much to invest in it. WSD is currently one of the largest users of electricity in Hong Kong and producing water through desalination has the potential to substantially increase associated electrical use, particularly once distribution is considered. This increased demand for electricity will lead to corresponding increases in greenhouse gas production, exacerbating climate change effects such as droughts in the future. Further, the potential impacts of desalination on the water supply could be more easily, and cheaply, met with improved conservation and policy efforts, such as the suggestions put forth in our sister paper, “Conservation and Consumption: Towards a Water-Smart Hong Kong”.
Beyond the effect on climate change, researchers have become increasingly concerned with impacts on marine biodiversity and ecosystems linked to desalination operations, such as brine disposal, which severely affects the reproduction and growth of marine organisms. In line with the principles of the water-energy nexus, sourcing freshwater using methods that are less energy-intensive and have less impact on the environment, in conjunction with adherence to strict water conservation measures, is preferable for both economic and environmental reasons in most situations.
Conclusion and recommendations
71
7.3. Develop a closer partnership between WSD and DSD
In the Local Yield and Harvested Rainwater and Treated Grey Water sections, we discussed how reservoir balancing and additional harvesting are inefficient methods for increasing Hong Kong’s water resources due to their high costs. However, when benefits associated with reduced flooding are considered, the economics of these projects can differ significantly. The external benefits brought by closer partnerships between WSD and DSD can be considered in tandem with the water supply benefits, making projects that are traditionally considered too expensive from the perspective of either agency more cost-effective due to the combination of benefits. This approach would also be more in line with the goals put forward in Hong Kong 2030+, which considers the city’s blue infrastructure in a more holistic way.
While WSD has begun to work more closely with DSD through projects such as the Anderson Road Quarry, which will utilise reclaimed water from sinks for flushing, more integrated planning and consideration are both required to maximize local benefits. As both DSD and WSD impact each other through their decision-making, the net benefits and costs for each department should be considered to create a more holistic approach to managing our water resources.
7.4. Increase granularity and transparency of data to improve water supply planning
Currently, seawater flushing is entirely unmetered while freshwater flushing is only metered at the building level. This makes it difficult to accurately determine usage and leakage within the system accurately, as the number of users of each type is unknown. Information provided to users at the household level is therefore incomplete, as this usage must be estimated. Further complicating matters is the lack of timely access to this information, as water bills are only generated once every four months, which makes it difficult for users to quickly notice and respond to leaks, or receive positive feedback about conservation efforts.
Upgrading the network to include broad coverage of smart meters is needed not only to inform WSD how much water is used, but also to increase the awareness of end users, as well as to encourage conservation and accelerate responses to leakages. As long as this data is unavailable, it will be impossible to determine the true efficiency of the system and to compare it with potential alternatives. Billing systems could also be redesigned to include more accurate information and allow for usage comparisons across local areas and with the city average. While the conservation benefits of access to usage data are described in our sister paper, “Conservation and Consumption: Towards a Water-Smart Hong Kong”, it would also allow WSD to assess more accurately the volume of flushing water used and would better highlight the economics of seawater flushing versus its alternatives going forward.
72 73
ENDNOTES
1. WaterSuppliesDepartment,HistoryofWaterSupplyinHongKong(1946-2007)TotalWaterManagement, 2008, HongKong:HKSARGovernment,https://www.wsd.gov.hk/filemanager/en/share/pdf/TWM.pdf(accessed15October2018).
2. WaterSuppliesDepartment,AnnualReport2017-18, HongKong:HKSARGovernment,https://www.wsd.gov.hk/filemanager/common/annual_report/2017_18/common/pdf/wsd_annual_report2017-2018.pdf(accessedSeptember2019).
3. ADMCapitalFoundationandCivicExchange,TheIllusionofPlenty,May2017.https://civic-exchange.org/report/water2017/(accessed15October2018).
4. WaterSuppliesDepartment,AnnualReport2017-18, HongKong:HKSARGovernment,https://www.wsd.gov.hk/filemanager/common/annual_report/2017_18/common/pdf/wsd_annual_report2017-2018.pdf(accessedSeptember2019).
5. LegislativeCouncilSecretariat,ResearchBrief:Waterresources in Hong Kong,June2015,HongKong:HKSARGovernment,https://www.legco.gov.hk/research-publications/english/1415rb05-water-resources-in-hong-kong-20150611-e.pdf(accessedNovember2018).
6. Audit Commission,Chapter4:ManagementofWaterSupplyand Demand,No.64,1April2015,HongKong:HKSARGovernment,https://www.aud.gov.hk/pdf_e/e64ch04.pdf(accessed7November2018).
7. WaterSuppliesDepartment,TotalWaterManagementStrategy 2019,September2019,HongKong:HKSARGovernment,https://www.wsd.gov.hk/en/core-businesses/total-water-management-strategy/twm-review/index.html(accessed6September2019).
8. ADMCapitalFoundationandCivicExchange,TheIllusionofPlenty,May2017,https://civic-exchange.org/wp-content/uploads/2017/05/Water-Report-English-final.pdf(accessed15October2018).
9. WaterSuppliesDepartment,TotalWaterManagementStrategy 2019,September2019,HongKong:HKSARGovernment,https://www.wsd.gov.hk/en/core-businesses/total-water-management-strategy/twm-review/index.html(accessed6September2019).
10. McJannet,D.,Cook,F.andBurn,S.,EvaporationReductionbyManipulationofSurfaceAreatoVolumeRatios:Overview,AnalysisandEffectiveness, 2008, Urban Water SecurityResearchAlliance,http://www.urbanwateralliance.org.au/publications/UWSRA-tr8.pdf(accessed7November2018).
11. WaterSuppliesDepartment,AnnualReport2017-18, HongKong:HKSARGovernment,https://www.wsd.gov.hk/filemanager/common/annual_report/2017_18/common/pdf/wsd_annual_report2017-2018.pdf(accessedSeptember2019).
12. DongjiangwaterfiguresfortheseyearswereobtainedfromWSDinformationrequests.
13. WaterSuppliesDepartment,AnnualReport2017-18, HongKong:HKSARGovernment,https://www.wsd.gov.hk/filemanager/common/annual_report/2017_18/common/pdf/wsd_annual_report2017-2018.pdf(accessedSeptember2019).
14. Teo,G.,“Showering,flushingaccountfornearlyhalfofwaterusedinhomes:PUBstudy,”ChannelNewsAsia, 2 March 2018,https://www.channelnewsasia.com/news/singapore/showering-flushing-account-for-half-of-water-used-in-homes-10002178;Wong,D.,“Homesnowhavemorewater-efficientfittings;showersstillusemostwater:PUBstudy,”StraitsTimes,1March2018,https://www.straitstimes.com/singapore/half-of-all-water-fittings-in-households-are-efficient-showering-still-uses-most-water-in.
15. PersonalCorrespondencewithMacauWater,November2018.
16. WaterSuppliesDepartment,TotalWaterManagementStrategy 2019,September2019,HongKong:HKSARGovernment,https://www.wsd.gov.hk/en/core-businesses/total-water-management-strategy/twm-review/index.html(accessed6September2019).
17. DepartmentofEnvironmentandConservation,Managing UrbanStormwater:HarvestingandReuse,April2006,NewSouthWales:GovernmentofAustralia,https://www.environment.nsw.gov.au/-/media/OEH/Corporate-Site/Documents/Water/Water-quality/managing-urban-stormwater-harvesting-reuse-060137.pdf(accessedNovember2018).
18. Gao,X.,Kim,Y.andLee,H.W.(2014),“Life-cycleCostAnalysisofUsingRainwaterHarvestingSystemsinHongKongResidentialBuildings,”JournaloftheKoreanHousingAssociation,Vol.25,pp.53-62.
19. Drainage Services Department, NgongPingSewageTreatmentWorks,March2009,HongKong:HKSARGovernment,https://www.dsd.gov.hk/EN/Files/publications_publicity/publicity_materials/leaflets_booklets_factsheets/NgongPing_STW.pdf(accessedNovember2018).
20. Chan, H., WaterReclamationTrialProjectsinDrainageServices Department, 2012, Drainage Services Department, https://www.dsd.gov.hk/EN/Files/Technical_Manual/technical_papers/EMP1202.pdf.
21. DevelopmentBureauandPlanningDepartment,Hong Kong 2030+:TowardaPlanningVisionandStrategyTranscending2030,HongKong:HKSARGovernment,https://www.hk2030plus.hk/document/2030+Booklet_Eng.pdf(accessed15October2018).
22. WaterSuppliesDepartment,AnnualReport2017-18, HongKong:HKSARGovernment,https://www.wsd.gov.hk/filemanager/common/annual_report/2017_18/common/pdf/wsd_annual_report2017-2018.pdf(accessedSeptember2019).
23. Guangdong Water Authority, 廣東省水利廳:(廣東省水資源公報),2015,GuangdongProvince:China,http://www.gdwater.gov.cn/zwgk/tjsj/szygb/szygb2015/(accessedNovember2018).
24. Zhou,J.,Guangdong Investment(270HK),20July2017,GFSecurities(HongKong)BrokerageLimited,https://www.gfgroup.com.hk/docs/gfgroup/securities/Report/CorporateReport/CorpReport_20170720_270_e.pdf(accessed5December2018);Yang,L.E.,Chan,F.K.S.andScheffran,J.(2016),“Climatechange,watermanagementandstakeholderanalysisintheDongjiangRiverbasininSouthChina,”InternationalJournalofWaterResourcesDevelopment,Vol.34,No.2,pp.166-191.
73
25. WaterSuppliesDepartment,AnnualReport2017-18, HongKong:HKSARGovernment,https://www.wsd.gov.hk/filemanager/common/annual_report/2017_18/common/pdf/wsd_annual_report2017-2018.pdf(accessedSeptember2019).
26. LegislativeCouncilSecretariat,ResearchBrief:Waterresources in Hong Kong,June2015,HongKong:HKSARGovernment,https://www.legco.gov.hk/research-publications/english/1415rb05-water-resources-in-hong-kong-20150611-e.pdf(accessedNovember2018).
27. HongKongObservatory,“ClimateofHongKong,”2003,HongKong:HKSARGovernment,https://www.weather.gov.hk/cis/climahk_e.htm(accessedOctober2018).
28. Ho,P.(2001),WaterforaBarrenRock:150YearsofWaterSupplyinHongKong,CommercialPress.
29. Ibid.
30. Audit Commission, Chapter4:ManagementofWaterSupplyand Demand,No.64,1April2015,HongKong:HKSARGovernment,https://www.aud.gov.hk/pdf_e/e64ch04.pdf(accessed5January2019).
31. ADMCapitalFoundationandCivicExchange,TheIllusionofPlenty,May2017,https://civic-exchange.org/wp-content/uploads/2017/05/Water-Report-English-final.pdf(accessed15October2018).
32. Liu,S.,LiquidAssetsIV:HongKong’sWaterResourceManagementunder“OneCountry,TwoSystems”,July2013,CivicExchange,https://civic-exchange.org/wp-content/uploads/2013/07/569-201307WATER_LiquidAssets4_en.pdf(accessedNovember2018).
33. Ulrich,P.,“HongKongneedsPloverCoveReservoirtobetwiceasdeepforbetterwatersecurityamidglobalwarming,”SouthChinaMorningPost,13July2017,https://www.scmp.com/comment/insight-opinion/article/2102467/hong-kong-needs-plover-cove-reservoir-be-twice-deep-better(accessedOctober2018).
34. McJannet,D.,Cook,F.andBurn,S.,EvaporationReductionbyManipulationofSurfaceAreatoVolumeRatios:Overview,AnalysisandEffectiveness, 2008, Urban Water Security ResearchAlliance,http://www.urbanwateralliance.org.au/publications/UWSRA-tr8.pdf(accessed5October2018).
35. WaterSuppliesDepartment,AnnualReports1999-2018, HongKong:HKSARGovernment,https://www.wsd.gov.hk/en/publications-and-statistics/pr-publications/list-of-publications/annual-report-water-supplies-department-archive/index.html(accessedSeptember2019).
36. Thesefactorsincluded,butwerenotlimitedto,politicalinstabilityinChina,theriseoftheChineseCommunistPartyand the start of the Korean War.
37. CensusandStatisticsDepartment,HongKongStatistics1947-1967,1September1969,HongKong:HKSARGovernment,https://www.statistics.gov.hk/pub/hist/1961_1970/B10100031967AN67E0100.pdf(accessed30October2018).
38. Ho,P.(2001),WaterforaBarrenRock:150YearsofWaterSupplyinHongKong,CommercialPress.
39. Chen,Y.D.(2001),“SustainableDevelopmentandManagementofWaterResourcesforUrbanSupplyinHongKong,”WaterInternational,Vol.26,No.1,pp.119-128.
40. PurchasedwaterfiguresfortheseyearswereobtainedfromWSDinformationrequests.
41. ADMCapitalFoundationandCivicExchange,TheIllusionofPlenty,May2017,https://civic-exchange.org/wp-content/uploads/2017/05/Water-Report-English-final.pdf(accessed15October2018).
42. WaterSuppliesDepartment,AnnualReports1999-2018, HongKong:HKSARGovernment,https://www.wsd.gov.hk/en/publications-and-statistics/pr-publications/list-of-publications/annual-report-water-supplies-department-archive/index.html(accessedOctober2019).
43. Zhou,J.,Guangdong Investment(270HK),20July2017,GFSecurities(HongKong)BrokerageLimited,https://www.gfgroup.com.hk/docs/gfgroup/securities/Report/CorporateReport/CorpReport_20170720_270_e.pdf(accessed5December2018).
44. Liu,S.,LiquidAssetsIV:HongKong’sWaterResourceManagementunder“OneCountry,TwoSystems”,July2013,CivicExchange,https://civic-exchange.org/wp-content/uploads/2013/07/569-201307WATER_LiquidAssets4_en.pdf(accessedNovember2018).
45. PersonalcommunicationwithWSD,October2018.
46. “Part2:Informationwhichmayberefused,”HongKong:HKSARGovernment,https://www.access.gov.hk/en/codeonacctoinfo/part2.html(accessed8April2018).
47. WaterSuppliesDepartment,AnnualReport2017-18, HongKong:HKSARGovernment,https://www.wsd.gov.hk/filemanager/common/annual_report/2017_18/common/pdf/wsd_annual_report2017-2018.pdf(accessedSeptember2019).
48. Lee,N.K.(2014),“TheChangingNatureofBorder,ScaleandtheProductionofHongKong’sWaterSupplySystemsince1959,”InternationalJournalofUrbanandRegionalResearch, Vol.38,No.3,pp.903-921.
49. WaterSuppliesDepartment,AnnualReport2017-18, HongKong:HKSARGovernment,https://www.wsd.gov.hk/filemanager/common/annual_report/2017_18/common/pdf/wsd_annual_report2017-2018.pdf(accessedSeptember2019).
50. ThiscorrosionalsoaffectsequipmentinstalledinsidebuildingsbutisnotpartofWSD’scostconsiderations,asthesecostsarebornebybuildingownersorendusers,andarethereforeexternaltoWSD’sdecisionmaking.
51. WaterSuppliesDepartment,RepliestoQuestionsRaisedbyFinanceCommitteeMembersExaminingtheEstimatesofExpenditures2018-19,31March2018,HongKong:HKSARGovernment,https://www.wsd.gov.hk/filemanager/en/share/pdf/sfc_e_2018-19.pdf(accessed7April2018).
52. WaterSuppliesDepartment,AnnualReport2017-18, HongKong:HKSARGovernment,https://www.wsd.gov.hk/filemanager/common/annual_report/2017_18/common/pdf/wsd_annual_report2017-2018.pdf(accessedSeptember2019).
53. Ibid.
54. WaterSuppliesDepartment,AnnualReport2016-17, Hong Kong:HKSARGovernment,https://www.wsd.gov.hk/filemanager/common/annual_report/2016_17/common/pdf/wsd_annual_report2016-2017.pdf(accessed9June2019).
55. WaterSuppliesDepartment,TotalWaterManagementStrategy 2019,September2019,HongKong:HKSARGovernment,https://www.wsd.gov.hk/en/core-businesses/total-water-management-strategy/twm-review/index.html(accessed6September2019).
74 75
56. Liu,X.etal.(2016),“SustainableApplicationofaNovelWaterCycleUsingSeawaterforToiletFlushing,”Engineering,Vol.2,pp.460-469.
57. Wen,W.etal.,WaterEnergyNexusinUrbanWaterSourceSelection:ACaseStudyfromQingdao,March2017,WorldResourceInstitute,https://wriorg.s3.amazonaws.com/s3fs-public/Water_Energy_Nexus_in_Urban_Water_Source_Selection_A_Case_Study_from_Qingdao_0.pdf?_ga=2.240547718.465287198.1560756393-24704756.1560756393(accessedMarch2019).
58. WaterSuppliesDepartment,AnnualReport2017-18, HongKong:HKSARGovernment,https://www.wsd.gov.hk/filemanager/common/annual_report/2017_18/common/pdf/wsd_annual_report2017-2018.pdf(accessedSeptember2019).
59. “CommissioningofSaltWaterSupplySystemforNorthwestNewTerritories(withphotos),pressreleases,21March2015,HongKong:HKSARGovernment,https://www.info.gov.hk/gia/general/201503/21/P201503210345.htm(accessedDecember2018).
60. LegislativeCouncilSecretariat,ResearchBrief:Waterresources in Hong Kong,June2015,HongKong:HKSARGovernment,https://www.legco.gov.hk/research-publications/english/1415rb05-water-resources-in-hong-kong-20150611-e.pdf(accessedNovember2018).
61. Audit Commission, Chapter4:ManagementofWaterSupplyand Demand,No.64,1April2015,HongKong:HKSARGovernment,https://www.aud.gov.hk/pdf_e/e64ch04.pdf(accessed5September).
62. Aquaterra,Internationalcomparisonsofdomesticpercapitaconsumption, 10 December 2008, Environment Agency,https://webarchive.nationalarchives.gov.uk/20140328161547/http://cdn.environment-agency.gov.uk/geho0809bqtd-e-e.pdf(accessed5Novermeber2018).
63. PersonalCorrespondencewithMacauWater,November2018.
64. Teo,G.,“Showering,flushingaccountfornearlyhalfofwaterusedinhomes:PUBstudy,”ChannelNewsAsia, 2 March 2018,https://www.channelnewsasia.com/news/singapore/showering-flushing-account-for-half-of-water-used-in-homes-10002178;Wong,D.,“Homesnowhavemorewater-efficientfittings;showersstillusemostwater:PUBstudy,”Straits Times,1March2018,https://www.straitstimes.com/singapore/half-of-all-water-fittings-in-households-are-efficient-showering-still-uses-most-water-in(accessed15November2018).
65. WaterSuppliesDepartment,HandbookonPlumbingInstallationforBuildings,March2018,HongKong:HKSARGovernment,https://www.wsd.gov.hk/filemanager/en/content_1369/HBonPIB.pdf(accessed23October2018).
66. InWSD’s2017-18annualreport,meteredwaterusagewas665millionm3,whilethetotalwatervolumesuppliedwas980millionm3.Thismeansthat32%ofwatersuppliedisunaccountedfor.Unaccountedwaterincludesthatusedinwatertreatmentworks,thecleansingofservicereservoirs/watertanksandflushingofgovernmentwatermains,augmentationofthesaltwaterflushingsystems,temporarywatersuppliesduetoemergencyrepairs,recordingoflowerwaterconsumptionbyageingwatermetersandtheunlawfultakingofwater,aswellasleakagesinthegovernmentwatermains.
ENDNOTES
67. WaterSuppliesDepartment,TotalWaterManagementStrategy 2019,September2019,HongKong:HKSARGovernment,https://www.wsd.gov.hk/en/core-businesses/total-water-management-strategy/twm-review/index.html(accessed6September2019).
68. WaterSuppliesDepartment,TechnicalSpecificationsonGreyWaterReuseandRainwaterHarvesting, May 2015, HongKong:HKSARGovernment,https://www.wsd.gov.hk/filemanager/en/content_1459/technical_spec_grey_water_reuse_rainwater_harvest.pdf(accessed25October2018).
69. Ibid.
70. LegislativeCouncil,ItemforPublicWorksSubcommitteeonFinancialCommittee:Head707–NewTownsandUrbanAreaDevelopment,CivilEngineering–Landdevelopment,765CL–DevelopmentofAndersonRoadQuarrySite, PWSC(2017-18)21,18October2017,HongKong:HKSARGovernment,https://www.legco.gov.hk/yr17-18/english/fc/pwsc/papers/p17-21e.pdf(accessed7October2018).
71. DrainageServicesDepartment,“WaterHarvesting,”informationrequestthroughpersonalcorrespondence.
72. DepartmentofEnvironmentandConservation,Managing UrbanStormwater:HarvestingandReuse,April2006,NewSouthWales:GovernmentofAustralia,https://www.environment.nsw.gov.au/-/media/OEH/Corporate-Site/Documents/Water/Water-quality/managing-urban-stormwater-harvesting-reuse-060137.pdf(accessedNovember2018).
73. Gao,X.,Kim,Y.andLee,H.W.(2014),“Life-cycleCostAnalysisofUsingRainwaterHarvestingSystemsinHongKongResidentialBuildings,”JournaloftheKoreanHousingAssociation,Vol.25,pp.53-62.
74. PublicUtilitiesBoard,“WaterfromLocalCatchment,”TheRepublicofSingapore,https://www.pub.gov.sg/watersupply/fournationaltaps/localcatchmentwater(accessedNovember2018).
75. Audit Commission,Chapter4:ManagementofWaterSupplyand Demand,No.64,1April2015,HongKong:HKSARGovernment,https://www.aud.gov.hk/pdf_e/e64ch04.pdf(accessedNovember2018).
76. Audit Commission,Chapter4:ManagementofWaterSupplyand Demand,No.64,1April2015,HongKong:HKSARGovernment,https://www.aud.gov.hk/pdf_e/e64ch04.pdf(accessedNovember2018).
77. PlanningDepartment,HongKong’sClimateActionPlan2030+,October2007,HongKong:HKSARGovernment,https://www.pland.gov.hk/pland_en/p_study/comp_s/hk2030/eng/finalreport/pdf/E_FR.pdf(accessedNovember2018).
78. Wen,H.etal.,WaterEnergyNexusinUrbanWaterSourceSelection:ACaseStudyfromQingdao,March2017,WorldResourcesInstitute,https://wriorg.s3.amazonaws.com/s3fs-public/Water_Energy_Nexus_in_Urban_Water_Source_Selection_A_Case_Study_from_Qingdao_0.pdf?_ga=2.26088504.465287198.1560756393-24704756.1560756393(accessedMarch2019).
79. Safelymanageddrinkingwater,2017,WorldHealthOrganizationandtheUnitedNationsChildren’sFund,https://data.unicef.org/wp-content/uploads/2017/03/safely-managed-drinking-water-JMP-2017-1.pdf(accessedOctober2018).
75
80. Arlosoroff,S.(2007),“WastewaterManagement,Treatment,andReuseinIsrael,”WastewaterReuse-RiskAssessment,Decision-MakingandEnvironmentalSecurity, part of the NATOScienceforPeaceandSecuritybookseries,Spring,Dordrecht,pp.55-64.
81. Esposito,K.,Tsuchihashi,R.,Anderson,J.,Selstrom,J.,The RoleofWaterReclamationinWaterResourcesManagementin the 21st Century.2005,AdvisoryCommitteeonWaterInformation,USDepartmentoftheInterior,USA,https://acwi.gov/swrr/Rpt_Pubs/wef_session107/107_0230.pdf.(accessedNovember2018).
82. UnitedStatesEnvironmentalProtectionAgency,2012GuidelinesforWaterReuse, September 2012, United States, https://www3.epa.gov/region1/npdes/merrimackstation/pdfs/ar/AR-1530.pdf(accessedNovember2018).
83. DevelopmentBureauandWaterSuppliesDepartment,SupplyofRecycledWaterinHongKong:ConsultationDocument,October2018,HongKong:HKSARGovernment,https://www.dsd.gov.hk/EN/Sewerage/Environmental_Consideration/Reclaimed_Water/index.html(accessed11October2019).
84. WaterSuppliesDepartment,SupplyofReclaimedWater:ConsultationDocument,October2018,HongKong:HKSARGovernment,https://www.wsd.gov.hk/filemanager/en/content_1810/supply-of-recycled-water-in-hk-consultation-document-e.pdf(accessedFebruary2019).
85. Drainage Services Department,NgongPingSewageTreatmentWorks,March2009,HongKong:HKSARGovernment,https://www.dsd.gov.hk/EN/Files/publications_publicity/publicity_materials/leaflets_booklets_factsheets/NgongPing_STW.pdf(accessedNovember2018).
86. Chan, H., WaterReclamationTrialProjectsinDrainageServices Department, 2012, Drainage Services Department, https://www.dsd.gov.hk/EN/Files/Technical_Manual/technical_papers/EMP1202.pdf(accessedNovember2018).
87. WaterSuppliesDepartment,TotalWaterManagementStrategy 2019,September2019,HongKong:HKSARGovernment,https://www.wsd.gov.hk/en/core-businesses/total-water-management-strategy/twm-review/index.html(accessed6September2019).
88. InnovationinWaterSingapore:AnR&DpublicationofPUB,Singapore’sNationalWaterAgency,June2016,PublicUtilitiesBoard,TheRepublicofSingapore,https://www.pub.gov.sg/Documents/PUB_Innovation%20in%20Water%20Singapore%2008_web%20%2016%20June%202016.pdf(accessedNovember2018).
89. Jiménez,B.(2014),“WaterRecyclingandReuse,”inWater ReclamationandSustainability,Elsevier,pp.431-454.
90. Menge, J., TreatmentofWastewaterforRe-UseintheDrinkingWaterSystemofWindhoek,2010,https://www.researchgate.net/publication/228674320_Treatment_of_Wastewater_for_re-use_in_the_Drinking_water_system_of_Windhoek.
91. Khan,S.andAnderson,R.(2018),“PotableReuse:ExperiencesinAustralia,”CurrentOpinioninEnvironmentalScience&Health,Vol.2,pp.55-60.
92. NorthCarolinaDepartmentofEnvironmentalQuality,Section.0900–ReclaimedWaterSystems, 1 September 2006,NorthCarolina:UnitedStates,https://www.ncwater.org/Rules_Policies_and_Regulations/Regulation/Sect.0900-ReclaimedWatSys_002.pdf(accessedOctober2018).
93. PublicUtilitiesBoardandMinistryoftheEnvironment,SingaporeWaterReclamationStudy:ExpertPanelReviewand Findings,June2002,TheRepublicofSingapore,http://uwatech.com/wp-content/uploads/2015/11/newater-study-report.pdf(accessedDecember2018).
94. UnitedStatesEnvironmentalProtectionAgency,2012 GuidelinesforWaterReuse,EPA/600/R-12/618,September2012,Washington,D.C.:UnitedStates,https://www3.epa.gov/region1/npdes/merrimackstation/pdfs/ar/AR-1530.pdf(accessedNovember2018).
95. Onyango,L.,Leslie,G.andWood,J.G.,(2014),GlobalPotableReuseCaseStudy4:Windhoek,Namibia, AustralianWaterRecyclingCentreofExcellence,Brisbane:Australia,http://legacywater360.server309.com/wp-content/uploads/2015/07/WQ-Case-Study-4-Windhoek-Namibia-100815.pdf(accessedAugust2019).
96. Radcliffe,J.(2004),WaterRecyclinginAustralia:AReviewUndertakenbytheAustralianAcademyofTechnologicalSciences and Engineering,BPADigital.
97. Mantovani,P.,Abu-Orf,M.andO’ConnorT.,(2001),NonpotableWaterReuseManagementPractices, American SocietyofCivilEngineers,https://ascelibrary.org/doi/pdf/10.1061/40569%282001%29300 (accessed December 2018).
98. Newton,D.etal.,Results,Challenges,andFutureApproachestoCalifornia’sMunicipalWastewaterRecyclingSurvey,(2009),WaterResourcesControlBoardandDepartmentofWaterResources,California:UnitedStates,https://www.waterboards.ca.gov/water_issues/programs/grants_loans/water_recycling/docs/article.pdf(accessedJune2019).
99. ElDoradoIrrigationDistrict,RecycledWaterUseGuidelinesforNon-ResidentialSites,June2003,California:UnitedStates,https://www.eid.org/home/showdocument?id=342(accessedNovember2018).
100.Olivieri,A.W.etal.(2005),“SeasonaltertiarywastewatertreatmentinCalifornia:Ananalysisofpublichealthbenefitsandcosts,”WaterResearch,Vol.39,No.13,pp.3035-3043.
101.StateWaterResourcesControlBoard–CaliforniaEnvironmentalProtectionAgency,WaterQualityControlPolicyforRecycledWater,11December2018,California:UnitedStates,https://www.waterboards.ca.gov/board_decisions/adopted_orders/resolutions/2018/121118_7_final_amendment_oal.pdf(accessedJune2019).
102.StateWaterResourcesControlBoard,RegulationsRelatedToRecycledWater,1October2018,California:UnitedStates,https://www.waterboards.ca.gov/drinking_water/certlic/drinkingwater/documents/lawbook/rwregulations.pdf(accessedSeptember2019).
103.McEwen,B.(1998),“IndirectPotableReuseofReclaimedWater,”inWasterwaterReclamationandReuse:WaterQualityManagementLibrary,Volume10,CRCPress,pp.1211-1267.
104.PublicUtilitiesBoardandMinistryoftheEnvironment,SingaporeWaterReclamationStudy:ExpertPanelReviewand Findings,June2002,TheRepublicofSingapore,http://uwatech.com/wp-content/uploads/2015/11/newater-study-report.pdf(accessedDecember2018).
105. Ibid.
106.Howe,C.andMitchell,C.(2011),WaterSensitiveCities, IWA Publishing.
76
ENDNOTES
107. Veolia,“WINGOC:Waste-watertocleanwater–Windhoek,Namibia,”https://www.veolia.com/africa/en/our-clients/wingoc-wastewater-clean-water-windhoek-namibia.
108.Haarhoff,J.andVanderMerwe,B.(1996),“Twenty-fiveyearsofwastewaterreclamationinWindhoek,Namibia,”WaterScienceandTechnology,Vol.33,No.10-11,pp.25-35.
109.DuPisani,P.andMenge,J.(2013),“DirectpotablereclamationinWindhoek:acriticalreviewdesignphilosophyofnewGoreangabdrinkingwaterreclamationplant,”Water Science&Technology:WaterSupply,Vol.13,No.2,pp.214-226.
110. Menge, J., TreatmentofWastewaterforRe-UseintheDrinkingWaterSystemofWindhoek,2010,https://www.researchgate.net/publication/228674320_Treatment_of_Wastewater_for_re-use_in_the_Drinking_water_system_of_Windhoek(accessed15October2018).
111.Onyango,L.,Leslie,G.andWood,J.G.,GlobalPotableReuseCaseStudy4:Windhoek,Namibia, November 2014, AustralianWaterRecyclingCentreofExcellence,http://vuir.vu.edu.au/32234/1/WQ%2BCase%2BStudy%2B4%2B-%2BWindhoek%2BNamibia%2B100815.pdf(accessedNovember2018).
112.Odendaal,P.E.,VanderWesthuizenJ.L.J.andGrobler,G.J.,“WastewaterReuseinSouthAfrica,”inWastewater ReclamationandReuse:WaterQualityManagementLibrary,Volume10,CRCPress,pp.1163-1191;Onyango,L.,Leslie,G.andWood,J.G.,GlobalPotableReuseCaseStudy4:Windhoek,Namibia,November2014,AustralianWaterRecyclingCentreofExcellence,http://vuir.vu.edu.au/32234/1/WQ%2BCase%2BStudy%2B4%2B-%2BWindhoek%2BNamibia%2B100815.pdf(accessedNovember2018).
113.WaterSuppliesDepartment,“LokOnPaiDesaltingPlant,”informationpacket,HongKong:HKSARGovernment.
114.Ho,P.(2001),WaterforaBarrenRock:150YearsofWaterSupplyinHongKong,CommercialPress;Chen,Y.D.(2001),“SustainableDevelopmentandManagementofWaterResourcesforUrbanSupplyinHongKong,”Water International,Vol.26,No.1,pp.119-128.
115.WaterSuppliesDepartment,TotalWaterManagementStrategy 2019,September2019,HongKong:HKSARGovernment,https://www.wsd.gov.hk/en/core-businesses/total-water-management-strategy/twm-review/index.html(accessed6September2019).
116.DevelopmentBureauandPlanningDepartment,Hong Kong 2030+:TowardaPlanningVisionandStrategyTranscending2030,HongKong:HKSARGovernment,https://www.hk2030plus.hk/document/2030+Booklet_Eng.pdf(accessed23October2018).
117. PublicUtilitiesBoard,“FourNationalTaps,”2018,TheRepublicofSingapore,https://www.pub.gov.sg/watersupply/fournationaltaps(accessedDecember2018);Ghangaa,M.,“Singapore’swatersupply:Wheredoesitcomefrom?”Straits Times,26June2018,https://www.straitstimes.com/singapore/environment/singapores-water-supply-where-does-it-come-from(accessed3November2018).
118.Valerie,C(2019),“Singapore–Malaysiawateragreements”,http://eresources.nlb.gov.sg/infopedia/articles/SIP_1533_2009-06-23.html(accessed15October2019).
119.Campione,A.etal.(2018),“Electrodialysisforwaterdesalination:Acriticalassessmentofrecentdevelopmentsonprocessfundamentals,modelsandapplications,”Desalination,Vol.434,pp.121-160.
120.Jones,E.etal.(2019),“Thestateofdesalinationandbrineproduction:Aglobaloutlook,”ScienceoftheTotalEnvironment,Vol.657,pp.1343-1356.
121.Einav,R.,Harussi,K.andPerry,D.(2003),“Thefootprintofthedesalinationprocessesontheenvironment,”Desalination,Vol.152,No.1-3,pp.141-154.
122.ADMCapitalFoundationandCivicExchange,TheIllusionofPlenty,May2017,https://civic-exchange.org/wp-content/uploads/2017/05/Water-Report-English-final.pdf(accessed15October2018).
123.WaterSuppliesDepartment,TotalWaterManagementStrategy 2019,September2019,HongKong:HKSARGovernment,https://www.wsd.gov.hk/en/core-businesses/total-water-management-strategy/twm-review/index.html(accessed6September2019).
124.TheWorldBank,RenewableEnergyDesalination:AnEmergingSolutiontoClosetheWaterGapintheMiddleEastand North Africa,2012,https://openknowledge.worldbank.org/handle/10986/11963(accessed5November2018).
125.Siemens,“SiemenssuccessfullyconcludedR&Dprojectonlow-energyseawaterdesalination:technologyreadyforfull-scaletesting,”4July2011,TheRepublicofSingapore,https://www.siemens.com/press/en/pressrelease/?press=/en/pressrelease/2011/industry_solutions/iis201106205.htm&content[]=IS&content[]=ISD&content[]=IIA&content[]= DF; InnovationinWaterSingapore:AnR&DpublicationofPUB,Singapore’sNationalWaterAgency, June 2016, PublicUtilitiesBoard,TheRepublicofSingapore,https://www.pub.gov.sg/Documents/PUB_Innovation%20in%20Water%20Singapore%2008_web%20%2016%20June%202016.pdf;PublicUtilitiesBoard,OurWater,OurFuture,June2016,https://www.pub.gov.sg/Documents/PUBOurWaterOurFuture.pdf(accessedDecember2018).
126.TheWorldBank,RenewableEnergyDesalination:AnEmergingSolutiontoClosetheWaterGapintheMiddleEastand North Africa,2012,https://openknowledge.worldbank.org/handle/10986/11963(accessedNovember2018).
127. ADMCapitalFoundationandCivicExchange,TheIllusionofPlenty,May2017.https://civic-exchange.org/report/water2017/(accessed15October2018).
128. Ibid.
DISCLAIMER
This document (the “Document”) has been prepared by Civic Exchange for general introduction, overview and discussion purposes only and does not constitute definitive advice on regulatory, investment or legal issues. It should not be used as a substitute for taking regulatory, financial, tax or legal advice in any specific situation. Information provided in the Document has been obtained from, or is based upon, sources believed to be reliable but have not been independently verified and no guarantee, representation or warranty is made as to its accuracy or completeness. Information contained in this Document is current as of the date specified in the Document and is subject to change without notice. Information contained in this Document relating to unrealised data and projections is indicative only, and has been based on unaudited, internal data and assumptions which have not been independently verified or audited and are subject to material corrections, verifications and amendments. This information is not intended to constitute a comprehensive statement of any matter, and it should not be relied upon as such. None of Civic Exchange, its sponsors, affiliates, officers or agents provides any warranty or representation in respect of information in this Document. In no event will Civic Exchange be liable to any person for any direct, indirect, special or consequential damages arising out of any use of the information contained on this Document, or any other hyperlinked website, including, without limitation, any virus damage, lost profits, business interruption, loss of programs or data on your equipment or otherwise. This Document may provide addresses or hyperlinks which lead to other websites; however Civic Exchange may not have reviewed any such websites, and is not responsible for the content of any such websites or pages. Civic Exchange makes no representation or warranty, expressed or implied, with respect to the accuracy or completeness of any of the information in the Document, and accepts no liability for any errors, omissions or misstatements therein or for any action taken or not taken in reliance on this Document. The Document should not be regarded by recipients as a substitute for the exercise of their own judgment. All statements contained herein are made as of the date of this Document. This Document is for information purposes only and should not be construed as an offer, or solicitation of an offer, to buy or to make any investment.

SMART
SAVE
Modernising Hong Kong’sWater Management PolicyPART II
SUSTAINABLE Water Infrastructure:TOWARDS A DIVERSIFIED WATER SUPPLY
23/F, Chun Wo Commercial Centre, 23-29 Wing Wo Street, Central, Hong KongT (852) 2893 0213 F (852) 3105 9713 www.civic-exchange.org
© Civic Exchange, 2019


