Embed Size (px)
Citation preview

MODIFYING CONCRETE MATRICES
WITH BENEFICIATED DREDGED MATERIAL OR OTHER CLAYEY CONSTITUENTS
Karsten Millrath
Submitted in partial fulfillment of
the requirements for the degree of
Doctor of Philosophy
in the Graduate School of Arts and Science
COLUMBIA UNIVERSITY
2003
© 2003
Karsten Millrath
All Rights Reserved

ABSTRACT
Modifying Concrete Matrices with Beneficiated
Dredged Material or Other Clayey Constituents
Karsten Millrath
Conventional wisdom suggests that for concrete production no clay minerals should
be used, which aside from sands and silts are the main components of dredged
material. It was the main goal of this research to investigate the feasibility of
modifying concrete with clayey components in spite of the initial reservations found
in the literature.
The disposal of dredged material is a challenge most of the harbors worldwide have
to face. Traditionally, the excavated material was dumped in the ocean or other
places next to the dredging site. Today, most of the material is placed in landfills or
specially designed facilities. Diminishing capacities of existing facilities, increasing
volume of contaminated material, new regulatory restrictions, and rising public
awareness towards environmental issues are applying pressure on the port authorities
to search for alternative disposal methods. Ideally such techniques reuse or recycle
the material as a valuable resource. In this work, methods of beneficiating dredged
material for concrete applications were investigated.
The large fraction of sands and silts in dredged material suggested replacing regular
fine aggregate with dredged material. However, the results were not very promising.
In a second approach, dredged material was added as a filler, which introduced
“undesirable” clay minerals as the main active component to a given concrete.
Kaolin served as a model for these minerals. Concrete mixes were thus modified
with untreated or treated dredged material, with natural or thermally activated kaolin,
or selected combinations thereof.
It was found that the loss of workability of fresh concrete required the addition of a
superplasticizer when clayey constituents were used as filler in concrete applications.
However, such components prevented segregation and bleeding. The properties of
fresh concrete, such as coherence, flow, homogeneity, compactability, and air
content depend on the type of filler and superplasticizer. They relate closely to all
physico-chemical and mechanical properties of the hardened product. The amount
of dredged material used as filler can be adjusted to meet given requirements. The
findings are encouraging and indicate that it should be possible to beneficially use
dredged material and other clayey constituents in concrete production.

i
ABSTRACT
LIST OF TABLES
LIST OF FIGURES
ACKNOWLEDGEMENTS
1 INTRODUCTION 1
2 MATERIALS AND FUNDAMENTALS 5
2.1 CEMENT 5
2.2 AGGREGATE 8
2.3 ADMIXTURES AND ADDITIVES 10 2.3.1 Fillers 11 2.3.2 Pozzolans 12 2.3.3 Superplasticizers 13
2.4 CLAYS 16 2.4.1 Types of clay minerals 16 2.4.2 Kaolinite 19 2.4.3 Illite 21 2.4.4 Montmorillonite 22
ii
2.5 DREDGED MATERIAL 23
2.6 CONCRETE 26
2.7 CLAYS AND CONCRETE 28
2.8 DREDGED MATERIAL AND CONCRETE 31
2.9 SELECTED CONCRETE PROPERTIES 34 2.9.1 Chemical Composition 34 2.9.2 Workability 35 2.9.3 Compressive Strength 37
3 TEST PROGRAM 39
3.1 TEST PROTOCOLS 39 3.1.1 Workability 39 3.1.2 Compressive Strength 40 3.1.3 Setting Time 42 3.1.4 Alkali-Silica-Reactivity 42 3.1.5 Tensile Strength 43 3.1.6 Leaching of Contaminants 43 3.1.7 Durability 45
3.2 MATERIALS 46
3.3 DREDGED MATERIAL PROCESSING 48
3.4 TEST PLAN 50
3.4.1 Natural Dredged Material as Aggregate Replacement 50

iii
3.4.2 Dredged Material as Filler 52 3.4.3 Dredged Material and Kaolin as Fillers 52
4 TEST RESULTS 56
4.1 NATURAL DREDGED MATERIAL AS AGGREGATE REPLACEMENT 57
4.2 DREDGED MATERIAL AS FILLER 66
4.3 DREDGED MATERIAL AND KAOLIN AS FILLERS 75
4.4 INFLUENCE OF SUPERPLASTICIZERS 83
5 ANALYSIS AND DISCUSSION OF RESULTS 90
5.1 WORKABILITY 90
5.2 SETTING AND HYDRATION 101
5.3 STRENGTH 106
5.4 DURABILITY 113
6 CONCLUSIONS AND OUTLOOK 116
7 BIBLIOGRAPHY 124
iv
LIST OF TABLES
Table 1 Chemical composition and fineness of portland cement 6
Table 2 Compounds of portland cement Type I 6
Table 3 Dimensional properties of clay minerals 18
Table 4 Chemical compositions of selected mineral fillers 35
Table 5 Chemical composition of selected concrete components 47
Table 6 Level of contamination in dredged material before and after treatment 47
Table 7 Aggregate grading for dredged material as sand replacement 47
Table 8 Test series RN 51
Table 9 Test series NF 53
Table 10 Test series TF 54
Table 11 Test series KF 54
Table 12 Test series NK / NM 55
Table 13 Test results of series RN 58
Table 14 Mortar properties with natural and treated dredged material as filler 67
Table 15 Mortar properties with natural untreated dredged material as filler 69

v
Table 16 Mortar properties with treated dredged material as filler 70
Table 17 Mortar properties of rain chamber test specimens 71
Table 18 Leaching test results after rain chamber test 72
Table 19 Test results of setting time determination and ASR testing 77
Table 20 Mortar properties with dredged material and kaolin as fillers 80
Table 21 Mortar properties with dredged material and metakaolin as fillers 81
Table 22 Influence of superplasticizers SP-Lig and SP-FC on mortar properties 85
Table 23 Relative volume of water required for different fillers 94
Table 24 Relative volume of water required for different mix components 96
Table 25 Evaluation of w/c-ratios of selected mixes 98
Table 26 Conversion of 28-day compressive strength 109
Table 27 Relative 28-day compressive strengths of mixes with dredged
material or kaolin as filler 109
vi
LIST OF FIGURES
Figure 1 Fillers in a given particle arrangement 11
Figure 2 Basic molecular unit of lignosulfonate 14
Figure 3 Basic molecular unit of sulfonated melamine-formaldehyde 14
Figure 4 Basic elements of clay minerals: silica tetrahedral and aluminum
octahedral units 17
Figure 5 Schematic layer-structure of kaolinite: alternate sheets of
gibbsite and silicates form a 1:1 mineral 20
Figure 6 Schematic layer-structure of montmorillonite and illite: a sandwich
layer of one gibbsite sheet between two silicate sheets form 2:1 minerals 21
Figure 7 Typical particle size distribution of dredged material from
NY/NJ Harbor 25
Figure 8 Basic components of concrete 27
Figure 9 Light microscope observation: kaolinite, regular sand, dredged
material, and quartz crystal in dredged material 33
Figure 10 Cone for the “Cone Test” 40
Figure 11 Ring for the “Ring Test” 40
Figure 12 One-inch cylinder for the “Cylinder Test” and two-inch cube for
the “Cube Test” 41

vii
Figure 13 Test set-up for “Rain Chamber Test” 44
Figure 14 Drying process of dredged material: sludge, dried “cakes”, and
ground filler 49
Figure 15 Sub-Series RN-A: Flow and compressive strength versus dredged
material content at constant w/c ratio of 0.70 59
Figure 16 Sub-Series RN-B: Flow and compressive strength versus dredged
material content at variable w/c ratios 60
Figure 17 Sub-Series RN-C with RN-B1: Flow and compressive strength
versus w/c ratio 61
Figure 18 Sub-Series RN-B and RN-C: Compressive strength versus w/c ratio 62
Figure 19 Sub-Series RN-D: Flow and compressive strength versus w/c ratio 62
Figure 20 Sub-Series RN-B and RN-D: Compressive strength versus dredged
material content 63
Figure 21 Insufficient workability caused severe defects on samples containing
10M% dredged material as aggregate replacement 65
Figure 22 Compressive strength of mortar cylinders with different contents
of treated dredged material as filler 70
Figure 23 Relative length changes with time of mortar bars during the
ASTM C1260 test 78
Figure 24 Compressive strength of mortars with different contents of natural
dredged material and kaolin as fillers 82
viii
Figure 25 Compressive strength of mortars with different contents of natural
dredged material and metakaolin as fillers 82
Figure 26 Evaluation of superplasticizer SP-Lig: Compressive strength and
density versus w/c ratio 87
Figure 27 Evaluation of superplasticizer SP-FC: 7 and 28-day compressive
strength in dependence of filler type 88
Figure 28 Influence of w/c ratio on compressive strength and flow 91
Figure 29 Optical microscope observation: Poor consolidation and spreading
of kaolin 103
Figure 30 Optical microscope observation: reference sample without any
filler, sample with 30% dredged material, sample with 30%
kaolin, and sample with 30% metakaolin 104
Figure 31 Scanning electron microscope observation: sample with 22.5%
kaolin and 7.5% dredged material as fillers and reference sample
without any fillers 105
Figure 32 Conversion of the 28-day compressive strength of selected mixes using
Feret’s rule for dilution and Abram’s rule for different w/c ratios 110

ix
ACKNOWLEDGEMENTS
For the personal and professional advice and support I would like to thank Dr. Sofiya
Kozlova, Dr. Semyon Shimanovich, and my advisor, Professor Christian Meyer at the
Department of Civil Engineering and Engineering Mechanics of Columbia University.
Dr. Kozlova and I were the main investigators during the research on the beneficial use
of dredged material from the New York / New Jersey Harbor. Countless discussions and
talks enlarged my knowledge about concrete chemistry and broadened my horizon
resulting in new ideas on how to proceed in research. Especially for the use of admixtures
during concrete production and questions about test protocols, the advice of
Dr. Shimanovich was extremely valuable.
I would like to express my appreciation for the kind help of the Department of Civil
Engineering and Engineering Mechanics at Columbia University. This work was partially
sponsored by Echo Environmental Inc., New York, NY. This support is gratefully
acknowledged. I would also like to thank my family and friends for believing in me and
supporting me in all my decisions.
x
My special thanks go to Professor Meyer, whose enthusiastic help enabled me to achieve
my personal and professional goals while fulfilling the requirements for my degree of
Doctor of Philosophy. He gave me the opportunity to come to New York in 1999 and to
work with and for him during my studies at Columbia University.
Thank you very much!

xi
To Sunshine,
xii

1
1. INTRODUCTION
Concrete is the most commonly used building material worldwide. Its versatility allows
applications for a large number of purposes. Over the last decades, concrete compositions
have been modified with various admixtures. Among these are several waste products,
which were initially added to concrete to reduce a disposal problem, but over the years
showed their ability to alter the concrete properties in a favorable manner. Common
examples are lignosulfonate, silica fume and fly ash.
At Columbia University, research has been conducted on the beneficiation of dredged
material from the Port of New York and New Jersey. This problem is of major concern to
the Greater New York Metropolitan region, because shipping lanes need to be dredged to
keep the Port operable and economically viable. Dredged material consists mainly of sand,
silts, and clay minerals but may contain any of a large number of organic and inorganic
pollutants. The most common disposal method for dredged material is to dump such
material in landfills or specially designed confined disposal facilities. This approach requires
vast storage areas and does not include any productive reuse. Moreover, with increasing
public awareness and legal restrictions such environmentally questionable disposal methods
are becoming less acceptable and alternative techniques are needed.
2
For stabilization and partial immobilization of contaminants, dredged material or
contaminated soils are often mixed with cement [81]. Cement is also the binding material
for concrete production. By combining these two separate applications of cement the idea
of using dredged material in concrete applications was born. The largest fraction of
dredged material is quartz, which also is the most common ingredient of regular concrete
aggregate. This fact led to the suggestion to partially replace regular sand aggregate with
dredged material. However, the physico-chemical nature of dredged material is dominated
by its clay minerals. This chemical prevalence of clays as well as their particle size range
suggest the use of dredged material as filler.
The adsorption capacity of clay minerals is generally much higher when compared with
other concrete constituents. This causes a drastic decrease in workability when clay
minerals are added to concrete mixes. Some clay minerals such as montmorillonite are
capable of swelling, and therefore may initiate structural damage in the hardened concrete
when they change their volume during drying or wetting. Thus, clay minerals are generally
considered harmful for concrete production [18]. On the other hand, it was found that the
thermal activation of kaolinite produces a highly reactive material with a high pozzolanic
contribution that improves concrete properties and has been recently used in concrete
applications [27, 60, 67].

3
The influence of kaolin after thermal treatment on concrete has been the subject of
research in the past few years, but the emphasis of those studies always seemed to be on
the activation rather than the beneficiation of natural clays [11, 29]. Yet, it should be
possible to draw conclusions from the use of kaolin to other clay minerals in general and
dredged material in particular, because of their similar properties, such as specific surface,
surface charge, and activity.
In the past most concrete properties were typically related to its compressive strength. In
recent years, other criteria have been added to define performance. For the purposes of the
research described herein, the main performance criteria were the workability of fresh
concrete and the compressive strength of hardened concrete.
It was the purpose of the present work to answer a number of different questions:
1. According to conventional wisdom, clay minerals should not be used in
concrete compositions because of their detrimental effect on the workability
of fresh concrete and the strength and durability of hardened concrete. What
are the scientific explanations for these detrimental effects, and what are the
specific factors governing this behavior? In other words, how are the
properties of the concrete matrix affected by clayey components, such as
dredged material or kaolin?
2. Under what circumstances is it possible to incorporate clayey materials into
concrete mixes without experiencing negative effects?
4
3. Is it possible to beneficially use dredged material as a concrete constituent,
either as a replacement of fine aggregate or as a filler?
4. Are there possible benefits of incorporating dredged material into the
concrete mix, thereby beneficiating this material, which otherwise imposes a
considerable environmental burden? What treatment methods are necessary
to optimize the beneficial effects of dredged material or to improve certain
concrete properties?
In Chapter 2, an overview will be given of the various types of materials of interest here,
namely cement, aggregate, admixtures (fillers, pozzolans, and superplasticizers), clays and
dredged material. Fundamental properties of these materials will be reviewed, followed by a
general discussion of concrete and how its properties (chemical composition, workability,
and strength) are affected by clays and dredged material.
Chapter 3 outlines the experimental test program, including a detailed description of the
various test protocols. The test results are presented in Chapter 4, and Chapter 5 contains
an in-depth analysis and discussion of these results. Chapter 6 summarizes the major
conclusions and provides an outlook on its significance.

5
2 MATERIALS AND FUNDAMENTALS
2.1 CEMENT
Cement is one of the most important hydraulic binders, which are defined as non-metallic,
inorganic substances. They chemically react with water to form a solid medium. This
reaction should take place under different conditions: under water or above, in a sealed
container or outside. The reaction product, an artificial stone, should remain durably hard
at relatively constant volume in any environment, even under water. Cement meets these
definitions while other binders commonly used for construction do not. Gypsum, for
example, is unstable in water, and the hardening process of lime does not start under water.
Cement is a product generally manufactured from limestone, chalk, clay, sand, or iron ore.
The raw materials are proportioned, ground, blended, and fed into a tilted rotating,
cylindrical kiln reaching temperatures of 2600°F to 3000°F (1430°C to 1650°C). At these
temperatures, the feed melts and fuses into polymineralic products. The chemical reactions
create grayish-black pellets, so-called cement clinker. After cooling, the clinker is ground
into a fine gray powder and about 3-5 % gypsum (by mass) is added. The result is portland
cement [56]. Its reactivity is achieved by grinding the clinker fine enough to create large
specific surfaces of about 400 m2/kg Blaine fineness [26].
6
Because the raw material and the hydration products of portland cement are mostly oxides
the following abbreviated notations are commonly used in cement chemistry [42]:
C CaO S SiO2 A Al2O3
F Fe2O3 / FeO M MgO K K2O
N N2O S SO3 H H2O / (OH)X
The main chemical components of cement are silicium oxide and calcium oxide (Table 1),
both of which are essential for hydraulic binders since the hardening process is based on
calcium-silicate hydrates (C-S-H) [42]. The main compound compositions or clinker phases
and their hydration characteristics are summarized in Table 2. These main components
determine all major properties of the hardened concrete such as microstructure, strength,
and durability but also setting time and even workability.
Table 1 Chemical composition (in % by mass) and fineness of portland cement [38]
ASTM Type SiO2 CaO Al2O3 Fe2O3 MgO SO3 LOI 1) Blaine
I 20.9 64.4 5.2 2.3 2.8 2.9 1.0 370 m2/kg
II 21.7 63.6 4.7 3.6 2.9 2.4 0.8 370 m2/kg
III 21.3 64.9 5.1 2.3 3.0 3.1 0.8 540 m2/kg
IV 24.3 62.3 4.3 4.1 1.8 1.9 0.9 380 m2/kg
V 25.0 64.4 3.4 2.8 1.9 1.6 0.9 380 m2/kg
1) Loss on ignition

7
Table 2 Compounds (clinker phases) of portland cement Type I [26, 50, 74]
Compound Formula Other name % by mass Hydration characteristics
C3S 3(CaO) SiO2 Alite 42-66 Rapid, moderate heat
C2S 2(CaO) SiO2 Belite 9-30 Slow but steady, low heat
C3A 3(CaO) Al2O3 6-14 Very rapid, very high heat
C4AF 4(CaO) Al2O3·Fe2O3 1-12 Moderate heat
Na2SO4/K2SO4 Na2O eq: 0.14-1.5 On surface of clinker
CS
CaSO3·2H2O CaSO3·½H2O
CaSO3
Gypsum Hemihydrate
Anhydrate
Controls setting time, soluble SO4
2- retards hardening of C3A and C4AF
Five major cement types are available in the U.S. as defined by ASTM C150 [4]. Type I is a
general cement, suitable for most purposes. Type II is often used for concrete exposed to
seawater because it offers moderate sulfate resistance (no more than 8% C3A). Type III is
chemically similar to Type I but ground finer to produce higher early strengths. Type IV
generates a specifically low amount of heat from hydration and is thus suitable for mass
concrete structures. The low heat generation is accompanied by slow strength development
at early ages. Type V is highly sulfate resistant with no more than 5% C3A [42]. In this
study, only portland cement of Type I was used.
When cement is exposed to water a chemical reaction, the hydration, begins. During the
first fifteen minutes of the hydration, a gelatinous, semi-permeable layer forms around
cement particles as a product of reactions involving C3A, calcium sulfate and partly C3S.
Eventually some ettringite will crystallize. An inactive phase follows due to supersaturation
8
and hindering of diffusion into the cement grains. After about four hours, differences in
concentration outside and inside the layers cause osmotic pressures high enough to rupture
the membrane. This is the beginning of an acceleration period characterized by an intense
growth of crystals such as portlandite (Ca(OH)2), calcium-silicate-hydrate phases (C-S-H),
calcium-alumino-hydrates (C-A-H), and ettringite. This period lasts until about eight hours
after contact with water and is followed by slow chemical reactions (deceleration stage)
[62]. The C-S-H phases can vary widely in their composition and can be generally
expressed as ClSmHn (similar for C-A-H). Some of the governing reactions involved in
cement hydration are given below [61, 62, 73]:
2 C3S + 6 H → C3S2H3 + 3 CH {1}
2 C2S + 4 H → C3S2H3 + CH {2}
C3A + CH + 12 H → C4AH13 {3}
C4AF + 4 CH + 22 H → C4AH13 + C4FH13 {4}
C3A + 3 CSH2 + 26 H → C3A·3CS·32H (ettringite) {5}
C3A + CSH2 + 10 H → C3A·CS·12H (monosulfate) {6}
2.2 AGGREGATE
Aggregate consists of inert granular materials such as sand, gravel, or crushed stone. ASTM
standards require the aggregate to consist of clean, hard, strong particles and specify tests
to ensure these properties, e.g. ASTM C40, C87, and C142 [5]. It has to be free of
absorbed chemicals or coatings of clay and other fine materials that could have undesirable
effects on certain concrete properties. Clay lumps or friable particles on the aggregate

9
surface may affect the workability and durability and in some cases even cause pop-outs
[18, 38]. Aggregate is divided into two fractions: fine and coarse aggregate, with the
dividing point being a rather arbitrary selected particle size of 0.19 inch (4.75 mm). Gravels
constitute the majority of coarse aggregate, with crushed stone making up most of the
remainder. Fine aggregate is commonly referred to as sand.
Size and shape of the aggregate play an important role in concrete mix design. The void
content between particles determines the amount of cement paste required. Angular
aggregate introduces additional voids. Larger sizes of well-graded aggregate and improved
grading decrease the void content. Absorption and surface moisture of aggregate need to
be measured when selecting aggregate because the internal structure of aggregate may
adsorb or free water. Therefore, the amount of water in the concrete mix design must be
adjusted to include the moisture content of the aggregate [56].
Finer particles have larger specific surfaces and thus require more water. In general, clay
minerals are not desirable concrete ingredients. Whereas activated kaolin or zeolites have
been shown to have beneficial effects, natural clays are typically treated as contaminants to
be avoided. This study will address this problem in great detail.
Under certain conditions, the physico-chemical interaction between products of the
cement hydration and aggregate can have detrimental effects on concrete. A chemical
reaction can occur that involves alkali ions (mostly from portland cement), hydroxyl ions
(as product of the cement hydration), and certain hydrous or amorphous forms of silica
10
(as part of the aggregate) and leads to the formation of alkali-silica gels. These gels are
expansive when in contact with water, which can cause cracking and pop-outs. The
governing mechanisms are the subject of ongoing research [42].
The most important factors that control the so-called Alkali-Silica Reaction (ASR) are the
alkali-content and alkali-reactivity of the individual components, the moisture content of
the structure, and the ambient temperature. The alkali content depends strongly on the
cement composition but various salts may contribute significantly when concrete
constituents originate from marine environments. The likelihood of ASR generally
increases with increasing concentrations of hydroxyl ions in the pore solution of concrete
[42]. While the reaction mechanisms of ASR are not the main subject of this work, tests on
the reactivity of specific mixes were conducted (Section 3.1.4).
2.3 ADMIXTURES AND ADDITIVES
Admixtures and additives generally modify certain properties of fresh or hardened concrete
and are administered to the fresh mix of sand, gravel, water, and cement before setting.
There is no clear distinction between the two terms. Most common types are either named
after their purpose (e.g., air entraining agents, accelerators, retarders, high-range water
reducers or superplasticizers, foaming agents) or after their origin or nature (e.g., silica
fume, fly ash, calcined clays, limestone, ground blast furnace slag). The following sections
focus on fillers, pozzolans, and superplasticizers, which strongly interact with calcium-
aluminates and calcium–alumino-silicates [62].

11
2.3.1 Fillers
Fillers are generally materials of such size that they can fill the voids between larger
particles (Figure 1). For example, only 74% of a given volume can theoretically be filled
with spheres of one size. If a second set of spheres of different size is added, where the
ratio of the two diameters is 0.315, the mix can fill 86% of the volume [34, 72]. In theory,
the volume can be filled completely, if a sufficiently large number of sets of successively
smaller spheres is added.
Figure 1 Fillers in a given particle arrangement
Particles
Filler
12
In concrete, voids between aggregates are filled with a slurry of water and cement, which
hardens, glues the solid particles together, and creates an artificial rock with aggregate
inclusions. If the aggregate grading is optimized such as in the above approach, a minimum
amount of “glue” is required. This is of economic interest because cement is usually the
most expensive concrete component. At the beginning of the 20th century, Fuller and
Thompson conducted first comprehensive tests on the optimum particle grading [24].
Subsequently, researchers concentrated on the grading of the fine particles [e.g., 34, 58].
The term filler in concrete technology usually refers to materials smaller than cement
particles, which have a diameter of 10-30 µm. In general, the porosity, permeability and
durability of concrete depend mostly on the properties of the cement paste, i.e., the denser
the cement matrix the better the concrete performance [33]. Hence, the primary goal of
using fillers in concrete applications is to fill voids between cement particles. Inert fillers,
such as finely ground limestone and quartz, serve only the purpose of filling voids, while
active fillers with pozzolanic properties also contribute to the hydration process.
2.3.2 Pozzolans
Pozzolans were originally defined as natural volcanic ashes (found close to the Italian town
Pozzuoli) and calcinated soils, which react with lime at ambient temperatures in the
presence of water. Nowadays the term pozzolan refers to all siliceous/aluminous materials,
which chemically react with calcium-hydroxide solutions to form compounds possessing
cementitious properties [73].

13
ASTM C618 [5] requires a combined content of SiO2, Al2O3, and Fe2O3 greater than 70%
by mass for a mineral admixture to qualify as a pozzolan (Class N). In addition, the loss of
ignition (LOI) has to be smaller than 10% by mass, and the moisture content is limited to
3% by mass. Popular examples of pozzolans are fly ash, metakaolin and silica fume. Such
materials can be activated during the hydration process of cement, and their contribution is
acknowledged to some degree in the design of concrete mixes [19, 72]. They often form
similar reaction products as the ones associated with cement hydration:
Fly ash: x CH + y S + z H → C3xS2yH3(x-k) + (z-k) H {7}
Metakaolin: 5 CH + AS2 + 5 H → C5AS2H5
With C5AS2H5 consisting of C-S-H, C4AH13, C3AH6, and C2AH8 {8}
Silica fume: x CH + y S + z H → CxSyH(kx+z) + (x-kx) H {9}
(compare with Equations 1-6) [61, 62, 73]. Kaolin and thermally activated kaolin, also
known as metakaolin, are introduced in greater detail in Section 2.4. Their influence on
concrete will be discussed in Chapter 2.7.
2.3.3 Superplasticizers
Superplasticizers are added to the concrete mix to either increase the workability of fresh
concrete for a given water/cement ratio (w/c) or to decrease the w/c for a given
workability. This is the reason why they are commonly referred to as “high-range water
reducers”.
14
Since the 1940s, lignosulfonate has been used as a water-reducer at relatively low cost
because it is based on a waste product of paper mills. Like most other superplasticizers,
lignosulfonate consists of repeatedly chained basic molecular units adding up to a high
molecular weight. Its functional group is sulfonate-based like that of most other
superplasticizers (Figure 2). The main disadvantage of lignosulfonate is the retardation of
the setting process due to its uncontrolled sugar content [62].
Figure 2 Basic molecular unit of lignosulfonate (after [62])
… …
Figure 3 Basic molecular unit of sulfonated melamine-formaldehyde (after [62])
Alternative superplasticizers are generally based on surfactants with hydrophilic and
hydrophobic groups. Most of them are water-soluble polymers with a functional group of
sulfonate (SO3-), e.g., sulfonated naphthalene-formaldehyde condensate or sulfonated
Functional sulfonate group
Functional sulfonate groups

15
melamine-formaldehyde condensate (Figure 3). These polymeric admixtures are usually
added to the fresh concrete mix as salts or solutions thereof. Recent developments in
concrete technology favor superplasticizers based on melamine and/or naphthalene
utilizing sulfonate, phosphonate (PO3-), carboxyl (COOH-), or hydroxyl (OH-) as
functional groups. Often, these admixtures are long-chained polymers with their
hydrophilic and hydrophobic groups projected outwards (comb-polymer) [62].
One physical operating mechanism of superplasticizers is to prevent fine particles from
flocculation. In suspensions, negatively charged plasticizing admixtures are able to
compensate or even reverse particle charges and thus break down agglomerates. This
becomes also visible in sedimentation tests, in which the “sinking” of cement paste in
water or other carrier liquids is studied. After administration of superplasticizers the
cement paste changes its behavior from settling (“all-at-once”) to progressive
sedimentation (“step-by-step”) [71]. Due to electrostatic or Van-der-Waals interactions
cement particles adsorb superplasticizer molecules on their surfaces. This generates
repulsive forces, which are responsible for such deflocculation [62].
In sum, superplastizicers reduce the thickness of the water film around particles necessary
to overcome adhesive forces and change surface charges and thus increase workability.
Highly flowable mix designs were introduced some years ago and guided the development
of self-compacting concrete. The introduction of superplasticizers was the main factor that
made the development of high-strength and high-performance concrete possible [53].
16
2.4 CLAYS
Clays are multi-component systems, in which solid, liquid and gaseous phases can be
present. The solid phase is mostly polycrystalline, commonly with a fraction of 90%
inorganic minerals. Near the surface the solids generally make up about 50% of the volume
and are mostly composed of inorganic components in crystalline formations. Secondary
clay minerals are the most important mineralogical fraction. They are hydrous alumino-
silicates, which have distinctive properties due to their structure, shape, and particle size.
These minerals are responsible for the main characteristic properties of clays [25].
2.4.1 Types of Clay Minerals
Generally, clays can be divided into four major groups [31]:
• the kaolinite group,
• the illite (or clay-mica) group,
• the montmorillonite (or smectite) group,
• the chlorite group.
The following sections will introduce the first three groups but disregard the last one,
which often is not listed as a separate mineral type. Chlorites exhibit a structure similar to
illite and montmorillonite but have intergrown layers. Isomorphous replacement of
aluminum and magnesium is very common. Detailed information on chlorites can be
found in References [25] and [31].

17
Clays are often fine-grained, have cohesive properties, and exhibit some plasticity. The
presence of water affects their behavior markedly. They have to be distinguished from silts,
which are also fine-grained and water affects their behavior, yet they are non-cohesive and
have little plasticity. Clay particles are colloidal-sized (mostly < 1 µm in diameter) and
electrochemically active [31]. Clays belong to the group of phyllosilicates or sheet materials.
Their basic components are silica tetrahedral or aluminum (magnesium) octahedral units,
which can form sheets with quasi-infinite length (Figure 4).
Figure 4 Basic elements of clay minerals: silica tetrahedral and aluminum
octahedral units (after [31])
The substitution of different cations into the octahedral sheets leads to different clay
minerals. This process is usually isomorphous, i.e. the exchanged ions have approximately
the same physical size. If the anions are hydroxyls, the octahedral sheets are called
Oxygen
Oxygen or Hydroxyl
18
gibbsite for aluminum cations and brucite in case of magnesium cations [31]. The various
compositions and combinations lead to minerals with different behavior, yet they all
consist of the two basic sheets.
Table 3 summarizes the most important properties of kaolinite, illite and montmorillonite.
The surface activity depends strongly on the specific surface area, which correlates with
particle size. In comparison to clay minerals, quartz crystals as found in regular sand
aggregate are almost inactive.
Table 3 Dimensional properties of clay minerals (after [31]),
Edge view 1) Thickness Diameter Specific surface area 2)
Unit nm nm m2/g
Kaolinite
50 - 2,000 300 - 4,000 15 (10-20)
Illite 30 10,000 80 (80-100)
Montmorillonite 3 100 – 1000 800 (400-800)
1) General qualitative particle shape 2) Values in parenthesis for specific surfaces after [68]
Clay minerals have usually negative surface charges due to isomorphous substitution of
ions and imperfect crystals, such as “broken” edges. The smaller the particle size and the
higher the specific surface the more likely is the occurrence of charge deficiencies. Thus,
montmorillonite exhibits a much higher attraction to exchangeable cations than kaolinite.
The valence of exchanged ions does not necessarily have to be the same and depends

19
greatly on the environment. Also, the adsorption of dipolar water molecules favors small
particles. As a result, hydrogen bonds tie water molecules to clay crystals. Thus, clay
minerals are almost always found with high moisture contents [31].
2.4.2 Kaolinite
Kaolin or kaolinite is a clay mineral formed by a weathering and modification process over
ages. Once these particles were rocks or mountains, but through ice and water treatment
they were ground to small size. During this aging or weathering process certain
components were washed out so that kaolin has usually a “clean” occurrence. It has a
potential pozzolanic reactivity due to its relatively high content of aluminum-silicates, i.e.,
kaolin may participate in a hydration process that forms stable crystals.
Kaolin consists mainly of polymorph alumino-silicates (Al2Si2O5(OH)4). Its structure is
governed by silicate sheets (Si2O5) tightly bonded to aluminum oxide or hydroxide
sheets (Al2(OH)4 or gibbsite) [31]. These two sheets form one layer, which is 0.72 nm
(i.e. 0.72·10-9 m) thick but can reach indefinite dimensions in the two other directions.
Successive layers are held together by strong hydrogen bonds between hydroxyls of
the gibbsite and oxygens of the silicate sheet (Figure 5). The hydrogen bonds prevent
hydration of single layers but cause formation of minerals with multiple layers. Kaolin
crystals usually consist of 70-100 layers resulting in comparably large clay minerals
(see Table 3).
20
Figure 5
Schematic layer-structure of kaolinite: alternate
sheets of gibbsite and silicates form a 1:1 mineral
(after [31])
Kaolin is widely used in various applications from tablets to rubber and ceramics. Its
particle size suggests a use as filler material. It is odorless, pure and bacteria-free and not
very active so that it can be used for pharmaceutical products. Kaolinite can easily be
blended in rubber, latex, PVC, and other plastics. It smoothens the surface of cardboard
and paper, creating glossy appearances, and is used in blackboard chalk. Kaolin can also
function as the base material for ceramics with excellent properties, such as chemical and
thermal resistance [64].
When activated at high temperatures (around 1300°C) and ground fine enough, kaolinite
turns into a material with partially cementitious properties. For porcelain manufacturing
pure white kaolin is preferred (“China Clay”) while the raw mix for portland cement
production is based on a clay composition called mergel, which often includes high
amounts of kaolin clays. Metakaolin, an important derivative of kaolin, also consists mainly
of alumino-silicates. It is processed from high-purity kaolin clay by calcination at
temperatures of 600-900°C. This thermal activation leads to a partial or complete
breakdown of the crystal lattice structure and forms a highly reactive transition phase [67].

21
2.4.3 Illite
Illite is a 2:1 mineral, i.e., it consists of layers formed by two silicate sheets and one gibbsite
sheet (Figure 6). Isomorphous substitution in the silica sheet occurs frequently in illite
minerals, and its main components are aluminum, calcium and silicium oxides combined
with all sorts of minor compounds, mostly alkalis. Single layers are bonded together by
potassium atoms. Illite has a crystal structure similar to that of mica minerals but is
chemically more active. If any clay mineral can be called regular it is illite. It is not as active
as montmorillonite nor can it easily be activated like kaolin. That is probably the reason for
its relatively limited commercial use.
Figure 6 Schematic layer-structure of montmorillonite (left) and illite (right): a sandwich
layer of one gibbsite sheet between two silicate sheets form 2:1 minerals (after [31])
22
2.4.4 Montmorillonite
Montmorillonite, also known as smectite, is another 2:1 mineral similar to illite. However,
the single layers of two silicate sheets embracing one gibbsite sheet form relatively weak
van-der-Waal’s bonds. In combination with the clay-typical surface charge deficiency,
the interlayer bonds attract water and exchangeable ions [31]. Montmorillonite contains a
relatively high amount of alkalis such as sodium, potassium and magnesium. The two
facing silica sheets are separated by variable water content. Hence, montmorillonite is
susceptible to swelling. Due to the weak bond the number of layers forming one stable
crystal is limited. Therefore the particle size of the very thin flake-like crystals is very small
with a typical thickness of only 3 nm (Table 3).
Montmorillonite is used in construction as the main component of bentonite, e.g. for
in-ground concrete walls and columns (also known as slurry walls). Its plate-shaped
particles create a stable suspension, which is capable to hold load (in general earth and
water pressure) in one direction, and when vibrated or shaken it becomes liquid. These
tixotropic properties make bentonite valuable for temporary installations. Montmorillonite
can swell, holding water up to 1.6 times its own weight [25]. Because of its fineness
montmorillonite can be found in industrial and pharmaceutical applications and even in
chocolate products [31].

23
2.5 DREDGED MATERIAL
Dredged material is naturally accumulated sediment or, in the case of channel deepening
and construction, rock or soil, which is excavated from the bottom of waterways. Dredging
is necessary to maintain or create sufficient navigational depth and to keep harbors
accessible. In addition, environmental remediation may require dredging operations. The
ecological impact of dredging processes and disposal techniques has been studied
thoroughly since the early 1970s. Facing strict environmental regulations, ports worldwide
are currently changing their dredged material management plans to remain economically
viable [44].
Dredged material consists mainly of clays, silts and sand mingled with rocks, debris of
variable sizes, and to some extent organic matter. Dredged material properties change
in time and vary from place to place. Geology, mineralogy, morphology, and composition
strongly depend on the geographic location and as a result, physical and chemical behavior
can vary greatly. Also the type, level of concentration, and chemical activity of
contaminants cover a wide spectrum [45].
Almost any thinkable pollutant can be found in dredged material: from heavy metals, such
as lead and mercury, to organics, such as pesticides and polychlorinated biphenyls (PCBs),
and bacteria, such as E-Coli. Contaminated sediments are very difficult to dispose of in an
environmentally acceptable way, either in designated disposal facilities or for beneficiation.
24
Especially the beneficial use of the fine-grained particle fraction, i.e. clays and silts, poses a
challenge because this tends to attract the pollutants [81, 86].
Usually, the water content of the dredged material is very high and thus, one of the first
steps in any processing train is the dewatering of the material for volume reduction. Often,
stabilization with mineral binders is necessary for safe handling during transportation.
Unless long-term storage is desired dredged material can be treated either partially or
without any separation. Different beneficiation techniques are available. The choice of a
particular treatment depends on the “cleanliness” of the material. In general, the
approaches involve specific chemicals, micro- and macro-organisms (biological
remediation), mechanical or thermal treatment. Their respective advantages and
disadvantages can be found in the literature [e.g. 43, 81].
Sediments found in the Port of New York and New Jersey are generally fine silts and clays
mixed with coarser particles, mainly sand. The fine-particle content changes with location
and time. Typical values quoted in the literature are 80-95% fines [81], or 4-46% clays and
4-54% sands / silts [89]. The mean particle diameter is of the order of 10 µm (Figure 7).
The main mineral components are quartz, mica, albite and feldspar [43].
Clays are generally capable of swelling and water absorption. Their specific surface areas
can be 100 times greater than those of sand, which, in combination with their surface
charge and ion-exchange ability, leads to the sorption of contaminants. Oil products and
salts may cover the fine particles. As a result, fine particles attract each other and

25
conglomerate. The microstructure consists of networks, which form layers of agglomerates
with water intrusions.
Figure 7 Typical particle size distribution of dredged material from NY/NJ Harbor [81]
The two dominating chemical compounds in dredged material are silicium (SiO2) and
aluminum (Al2O3) oxides with fractions of 65-80% and 8-15%, respectively. Since the
NY/NJ Harbor consists of marine estuaries, 1-4% sodium chloride (NaCl) was detected in
various sediments [81]. This saline environment alters the surface charge of clay particles,
making agglomeration more likely to occur.
Due to their relatively large surface-area-to-volume ratio and electro-chemical character,
clay layers are very likely to adsorb heavy metals and oil products. Obviously, this affects
the mode of interaction between contaminants and any admixtures that may be added to
26
treat the material. The influence of various powder admixtures and other additives on
dredged material was the subject of a research project at Columbia University, which led to
the development of a material processing method, which reorganizes the (micro-) structure
and immobilizes contaminants [43, 44, 45, 46]. This treatment will be briefly introduced in
Section 3.3.
2.6 CONCRETE
In its simplest form, concrete is a mixture of cement, water and aggregates (Figure 8).
Typically, a mix contains about 10-15 V% cement, 15-20 V% water, and 60-75 V%
aggregate. In addition, 2-8 % air may be entrained. Cement and water form a slurry or
paste, which covers the surface of aggregates and fills the voids between the particles.
Through a chemical reaction of the cement with water, the hydration, the aggregate is
permanently glued together, forming a rock-like structure, i.e., concrete. Historically, the
ancient Egyptians used concrete-like materials, and the Romans called their synthetic stone
Opus Caementitium, which is the origin of the name “cement” [42, 50, 90].
Because concrete is plastic and formable directly after mixing and strong, durable and hard
after the hydration of the cement, it has become the most common construction material.
Admixtures and additives administered to the fresh mix can modify the behavior of fresh
concrete or properties of the hardened concrete. Progressive research has created recipes
for concrete in countless shapes, for multiple purposes, in severe climates, under various
loads in almost every engineering application thinkable.

27
Figure 8 Basic components of concrete (typical mix without admixtures or additives) [56]
Note: Proportions are based on the volumes of the individual components
However, concrete has to be designed carefully in order to function reliably. Due to its
heterogeneous structure, it can carry heavy loads when under compression, but its capacity
to carry tensile forces is usually neglected for design purposes. Phenomena such as alkali-
silica reaction, carbonatisation, or chemical attack have undesirable long-term effects on
the concrete. Careful consideration and selection of the raw materials is necessary to avoid
partial failure or even collapse of a concrete member during its service life. The
components of concrete most relevant for this study were introduced briefly in the
previous sections.
Fresh concrete and hardened concrete have completely different behavior, therefore both
phases have to be studied separately. While the fresh mix can be characterized mainly by its
workability (mainly flow and “compactability)”, the performance criteria for hardened
concrete can vary considerably (compressive strength, density, chemical resistance, surface
hardness, fracture toughness etc.).
28
Generally, the water content plays the most dominant role in mix optimization. Aggregates
or admixtures with large specific surface areas show high adsorption capacities so that
more water has to be added to achieve sufficient workability. On the other hand, a higher
water-cement ratio is associated with lower strength. The main mechanical properties and
the parameters governing the concrete mix design to meet certain performance criteria are
given in the following sections.
2.7 CLAYS AND CONCRETE
Clays are often considered to jeopardize the production of durable concrete. Specifications
for concrete aggregate suggest that any conglomeratic, thin-layered, narrowly stratified
material with high water absorption and/or capability of cation exchange is undesirable
for concrete production. Clays and limonite are explicitly mentioned as being “potentially
objectionable” [18]. One common way to determine deleterious aggregate components is
to use tests based on specific dyes. The chemicals were originally chosen at a time when all
clays were considered harmful. Modifications were recommended to allow for the use of
kaolinite and smectite in mortar production [93].
Soft and highly absorptive particles may cause cracks in concrete members or, when close
to the surface, even pop-outs. Such soft minerals can be clays, micas, or gypsum.
Laminated clays containing sheet minerals may introduce large volume changes on wetting
and drying, possibly causing disintegration of the structure. Damage may be severe if

29
saturated particles freeze [18]. Due to the fineness of clay minerals, their specific surface
area is exceptionally high, and so is their water adsorption capacity. This imposes a major
problem in fresh concrete, because free water is removed from the mix and the material
becomes sticky and less plastic. As a consequence, a drastic drop in workability is
experienced, making the addition of a superplasticizer imperative [36, 67, 88].
It also was suggested that the initial adsorption might create a water reservoir in the
concrete mix, which acts like a buffer by releasing stored water later during the hydration
process [67]. Work has been conducted on phase changes that take place under alkaline
conditions, under which bentonite and tuffs are converted into zeolites [52, 59, 75].
Zeolites were subjected to research on lightweight and regular concrete [8, 9, 52, 54, 75]. In
the last decade, the thermal activation and calcination of kaolinite was studied, which
established metakaolin as an admixture for concrete production [11, 16, 21, 41, 67, 88, 95].
Some clay minerals are capable of base-exchange reactions. Hence, calcium ions in the pore
solution of concrete may substitute for alkaline bases of clay minerals. In exchange, these
alkalis dissolve into the pore solution to create a more reactive and thus more aggressive
environment, increasing the risk of alkali-aggregate reaction [18]. On the other hand, active
clay minerals such as metakaolin tend to counteract this phenomenon [27, 60, 67]. The
nature of the alkali-aggregate reaction is complex and will not be subject of this work.
However, additional research is suggested.
30
The addition of metakaolin to concrete mixes increases the early strength due to filler
effects and accelerated cement hydration [88]. Metakaolin was shown to increase ASR
resistance [60] by reacting in the presence of water with the calcium hydroxide in the pore
solution to form cementitious CSH phases (see Section 3.2). In addition, crystalline
products containing aluminum are developed such as calcium-aluminate-hydrates and
calcium-alumino-silicate-hydrates (C2ASH, C4AH13, C3AH6) [2]. Due to its pozzolanic
properties, metakaolin can be used as partial cement replacement [65, 66, 85].
Portland cement generally liberates calcium hydroxide (CH) after complete hydration,
usually about 28% of its own weight. Calcium hydroxide does not significantly contribute
to strength and is associated with poor durability. Excessive amounts are undesirable for
this reason. However, the passivation of (steel) reinforcement strongly depends on the high
pH level of concrete. Therefore, some standards give threshold values for the addition of
silica fume to reinforced concrete to ensure sufficient amounts of calcium hydroxide in the
pore solution. Similarly, there may be a threshold value for metakaolin.
The reaction between calcium hydroxide and pozzolans enhances the concrete’s properties
by removing excessive calcium hydroxide and generating additional cementitious phases.
The relatively short experience with clay minerals does not suggest any quantitative
limitation for their use in concrete mix designs due to consumption of calcium hydroxide
but rather because of decreasing workability. However, because of its purity and color-
consistence, metakaolin has been used for architectural concrete [27, 35]. For example, to

31
achieve and maintain light-colored, high-quality concrete, metakaolin was added to mixes
for the Cathedral of Our Lady of the Angels, Los Angeles, CA [69].
This study also employs natural and thermally activated kaolin as fillers in concrete
applications to evaluate the performance of dredged material, and especially of the clay
fraction thereof. Different superplasticizers are administered to the various mixes not only
to improve the workability but also to gain additional understanding of the chemistry
behind the governing reactions.
2.8 DREDGED MATERIAL AND CONCRETE
Typically, dredged material contains up to 90% clay, silt, and fine sand so that it is like a
paste or thick suspension of fine particles when found in natural conditions (often referred
to as "Black Mayonnaise"). It may be contaminated with oil products and contains,
depending on local conditions, up to 80% salt water. In addition, heavy metals and other
toxic substances can be present, which pose a health threat.
Chemical, biological, or thermal treatment methods to beneficiate dredged material have
targeted mostly low performance applications like backfill or cover material. Attempts to
utilize dredged material in bricks by firing them like natural clays were shown to be
technically feasible but did not gain the necessary public acceptance [28, 82, 86]. Separation
of the fines in combination with some soil washing techniques is the most promising and
most established way of beneficiation, although several other areas of application have
32
been explored extensively such as production of cement, light-weight aggregate, glass
products, just to name a few.
The components of dredged material offer several reasons why dredged material should
not be used in concrete production. The salts, organic contaminants, and clay minerals
impose great challenges, because they negatively alter the properties of fresh and hardened
concrete. The pollution with heavy metals may not affect the physical characteristics
directly but raise concern about leaching of contaminants into the surrounding
environment.
The quantitatively dominant sand fraction suggests the use of the material as aggregate
replacement. On the other hand, the chemically and physico-chemically prevailing clay
minerals exhibit similarities to natural clays such as kaolin (Figure 9, a and c). The quartz
minerals in dredged material are much smaller in size than regular sand particles and exhibit
surface defects (Figure 9, b and d). Such imperfections may create a reactive potential.
Therefore, a replacement of fine sand particles should lead to inconsistent results.
However, the use of clay and clayey dredged material was investigated here because the fine
particle range of such material may fill the gap in particle size between cement and
aggregate (filler effect). In addition, the crystalline similarity of clay minerals and the
products of cement hydration (CSH phases) suggests chemical bonding even if no
pozzolanic reaction is expected [88].

33
Figure 9 Light microscope observation [44]:
a) Kaolinite (500x) b) Regular sand (100x)
c) Dredged material (500x) d) Quartz crystal in dredged material (500x)
One of the tasks of this work is to find an optimum or limiting amount of dredged material
in concrete composites. While the use of large amounts of dredged material is desirable to
beneficiate a maximum of such waste material, satisfying concrete specifications such as
sufficient workability and strength are other goals, which may be in conflict and thus
require a compromise. Since dredged material is basically a mixture of sand (a regular
concrete component) and clays (a potential filler), its use in concrete may offer one
possibility to easing the disposal problem of contaminated dredged material.
a b
c d
34
It is highly recommended to reorganize the (micro-) structure of dredged material with a
homogenization treatment developed at Columbia University [43, 44, 45, 46], if such
material is used for commercial products (see Section 3.3). The positive effects of such
prior treatment have been evaluated in those earlier studies. To identify the basic
interactions between dredged material and the other constituents of concrete, such prior
treatment does not seem prerequisite for the purposes of this study.
2.9 SELECTED CONCRETE PROPERTIES
2.9.1 Chemical Composition
It is possible to modify the chemistry of hydration products by proper choice of
the various concrete components, especially clayey admixtures. Equations {1–9} establish
possible reactions during the hardening of cement. The chemical compositions of selected
mineral admixtures are given in Table 4. It will be a goal of this work to evaluate if and
how these components interact and react with the regular concrete matrix. Their chemical
composition not only determines the products of a reaction between the individual
concrete components during the hardening process but it also influences the properties of
fresh concrete by its physicochemical behavior, such as surface charges and capability of
ion-exchange.

35
Table 4 Chemical compositions of selected mineral fillers
Type Base SiO2 Al2O3 Fe2O3 CaO / MgO Na2O / K20
Clay/Sand Dredged material [44] 42-58% 8-13% 4-6% 3-23% 3-4.5%
Clay Bentonite [3] 45-66% 16-22% 2.5-17% 0.8-2% 2-4%
Clay Kaolin [88] 52% 41% 4.3% 0.3% 0.9%
Sand Quartz (fines) ~95 %
2.9.2 Workability
The workability, which is related to flowability and compactability, is probably the most
important property of fresh concrete. It is affected simultaneously by the flow, coherence,
homogeneity, rheology, and consolidation of a given mix. Common tests provide only a
first indication of workability by measuring one of these properties.
A sufficient flow is required to give the concrete its desired form in a given mold. A high
adsorption capacity of any one of the constituent concrete components requires more
water to achieve a certain flow. Generally, coarse aggregate has a negligible adsorption
capacity compared to fine sand particles and especially clays. The finer the particle the
higher the specific surface, and the more water can be bound on the surface. Therefore,
finer mixes, in particular clay minerals, require additional mixing water.
36
The workability of a mix is a function of a number of binder and aggregate parameters,
such as particle size, size distribution, shape, specific surface, surface charges, adsorption
capacity, and chemical composition. This set of variables defines the water content needed
to achieve a certain flow or workability. In this work special emphasis is placed on the role
of workability as a primary criterion in concrete mix design. Rational tools to establish the
necessary relationships are available.
For example, Krell [39] found that a specific mix starts to flow when a sufficiently thick
layer of water is established around each particle. Superplasticizers can decrease the
required film thickness and interact physico-chemically with charged surfaces especially of
cement particles and clay minerals, or homogenize a given slurry or suspension by
deflocculation. Hence, the addition of a superplasticizer either reduces the amount of water
required for a given workability (“high-range water reducers”) or increases the flow of a
mix with a given water content [73].
The role of superplasticizers on workability has already been addressed in Section 2.3.3. It
may be added that superplasticizers increase the flow of a given mix due to increased zeta
potential, increased solid-liquid affinity (dispersion) and steric hindrance (oriented
adsorption). The adsorption of superplasticizers on hydrates and cement particles creates
repulsive forces, which prevent flocculation [57, 62, 73]. It is suggested to wait for a few
minutes during mixing before administering superplasticizers because they are more
effective interacting with hydration products than with cement particles [62, 73].

37
The use of superplasticizers has been associated with secondary effects such as rapid
and unrecoverable loss in slump, retardation, segregation or bleeding [57]. To avoid
such problems, careful evaluation of the appropriate type and dosage is mandatory.
Superplasticizers such as formaldehyde-condensate or melamine-formaldehyde are less
retarding and air-entraining than the older lignosulfonate because they do not have
hydrophobic regions, which are created by repeated polar groups [73]. All three types of
superplasticizers will be evaluated in this work with regard to their effectiveness in reducing
the required volume of water and any secondary effects. In addition, a mixture of various
superplasticizers was evaluated, which had been developed at Columbia University as a by-
product of the research on glass concrete.
The influences of particle size, specific surface, chemical activity, and ultimately, adsorption
of different mineral clayey fillers were evaluated for mixes with or without superplasticizer.
A correlation between type and particle size of mineral additives and workability of various
concrete mixes was sought and it was attempted to predict the water requirement of a
specific composition.
2.9.3 Compressive Strength
Generally, concrete performs exceptionally well in compression while its tensile and
flexural strengths are comparably low. Therefore, concrete is usually classified by its
compressive strength. Other performance criteria may be equally important and recently
38
have gained more and more attention, but the compressive strength remains the most
important property when evaluating certain compositions.
The compressive strength of concrete is governed by the transition phase between
aggregate and cement matrix and the individual strengths of its components. High-
performance concrete derives its properties from an increased formation of CSH phases,
especially in the contact zone between aggregate (basically SiO2) and cement matrix
(Ca(OH)2 and/or CSH) [33, 83].
High strength can be obtained using low water-cement ratios (<0.40), admixtures such as
silica fume and superplasticizers, and following specific production protocols. Researchers
were able to produce a 280 MPa concrete (35,000 psi) using a water/cement ratio of 0.15, a
high dosage of silica fume and superplasticizer, and special laboratory techniques [1].
Reactive powder concrete can reach strengths up to 800 MPa (96,000 psi) if regular sand
aggregate is replaced by metallic powder [2].
In this work, the workability of fresh concrete shall be the primary mix design criterion.
However, for quantifying the performance of the hardened concrete, the compressive
strength will remain the main measure.

39
3 TEST PROGRAM
The workability is one of the major concrete mix criteria to provide the basis for
comparison of individual mixes. Prior flow tests are conducted to find the appropriate
water/cement ratio and dosage of superplasticizers to ensure similar workability, i.e.
comparable flow. The evaluation of the various concrete mixes follows the traditional
common approach of determining the compressive strength. In addition, for selected
mixes also the tensile strength, setting time, alkali-silica reactivity, or leaching performance
are determined, supplemented in selected cases by optical or scanning electron microscopy
(SEM) investigations. These tests are described in the following section.
3.1 TEST PROTOCOLS
3.1.1 Workability
The workability of fresh mortar is evaluated using the “Cone Test” according to ASTM
C230 [4], which determines the flow of a specific mix as an indicator of workability. A
conical ring (2” height, inner diameter of 2.75” at the top and 4” at the base) is filled with
mortar in two steps and then lifted. The mortar is subjected to 25 drops of a standard flow
40
table. Afterwards the diameter of the spread-out material is measured four times with
a standard caliper. The sum of those four measurements provides an index of the
flowability in % (with respect to an empirical reference value). Henceforth, this method
will be referred to as “Cone Test” (Figure 10).
In a modified flow test, a metal ring (1.5” inner diameter and 2” height) replaces the
standard cone. The procedure is similar to the cone test with the exception that the final
flow is the average of four measurements of the radius of the spread-out material in mm.
This method will be referred to as “Ring Test” (Figure 11).
Figure 10 Cone for the “Cone Test” Figure 11 Ring for the “Ring Test”
3.1.2 Compressive Strength
The compressive strength of hardened concrete is determined by the “Cube Test”
according to ASTM C109 [4]. For each test series, six two-inch cubes are prepared for
testing at the age of 7 and 28 days. In a modified test, small cylinders of 1 inch diameter and

41
1 inch height are used instead of cubes. The procedure is similar to that of ASTM C109.
This method will be referred to as “Cylinder Test” (Figure 12). The main advantage of using
small cylinders is the comparably small amount of material required to prepare six cylinders.
However, the accuracy of compressive strength tests with cylinders may be lower than that
with cubes because of the size and shape factors. A correlation between the two tests might
be established.
Figure 12 One-inch cylinder for the “Cylinder Test” and two-inch cube for the “Cube Test”
The use of one-inch cylinders was a compromise between test accuracy and the need for
large amounts of dredged material. The end surfaces of the small cylinders are not perfectly
plane, which affects the strength test results. However, they require far less material than
larger test specimens. For example, one two-inch cube requires the same amount of material
as ten small cylinders. It was assumed that the tests would still yield valid results for
comparative purposes.
42
3.1.3 Setting Time
The setting time of fresh concrete is tested according to ASTM C191 [4]. A procedure after
Vicat is used to measure the penetration depth of a needle at regular time intervals. The
time when the penetration depth is less than 10mm is defined as the setting time, which is
an indication of rate of hydration and strongly depends on the chemical composition of a
mix. The Vicat test is especially helpful if organic components are present, which may act
as retarding agents and delay significantly the setting of a given concrete mix.
3.1.4 Alkali-Silica Reactivity
Two different methods are used to evaluate the concrete reactivity, the ASTM C1260 test
[5] and an autoclave test [36]. In the ASTM C1260 test, 1 by 1 by 10 inch3 mortar bars are
immersed in a bath of sodium-hydroxide solution of 80 ± 2°C, and the bar expansions are
measured. In the autoclave test, the specimens are treated with steam at a temperature of
123°C ± 2°C and a steam pressure of 0.136 to 0.15 MPa. The elevated temperature and
alkaline conditions of the ASTM C 1260 test provide useful results after a period of 16
days [5]. The autoclave conditions maintain sufficient moisture to accelerate a potential
alkali-silica reaction and thus shorten the treatment process to only 24 hours [36].
For each different mix six identical specimens are tested. Three of these are subjected to
the ASTM C1260 test, and the other three are tested in the autoclave, an AMSCO
laboratory unit with a 1 by 0.48 by 0.48m3 chamber that allows simultaneous testing of
43
more than 20 specimens. In the autoclave test, the cooling process and method of length
change measurement follow the procedure of ASTM C151 [4].
3.1.5 Tensile Strength
The tensile strength of hardened concrete is determined in accordance with ASTM C307
[6] by testing three briquet specimens for each case at the age of 28 days.
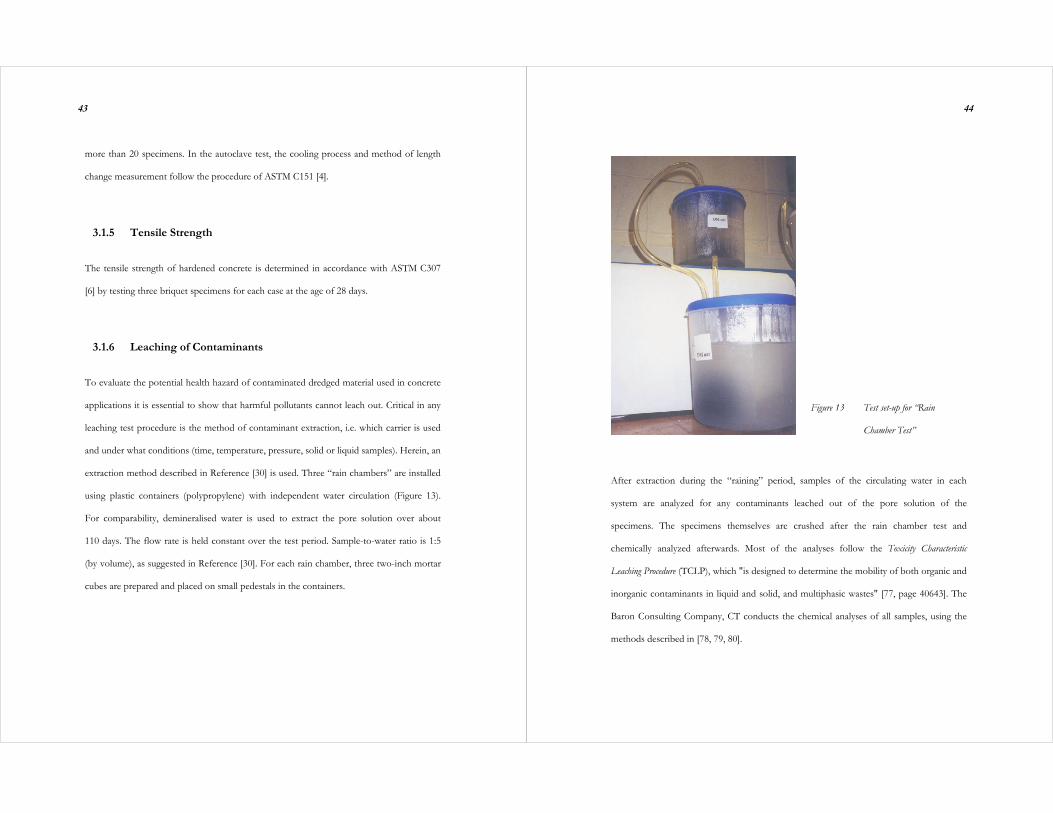
3.1.6 Leaching of Contaminants
To evaluate the potential health hazard of contaminated dredged material used in concrete
applications it is essential to show that harmful pollutants cannot leach out. Critical in any
leaching test procedure is the method of contaminant extraction, i.e. which carrier is used
and under what conditions (time, temperature, pressure, solid or liquid samples). Herein, an
extraction method described in Reference [30] is used. Three “rain chambers” are installed
using plastic containers (polypropylene) with independent water circulation (Figure 13).
For comparability, demineralised water is used to extract the pore solution over about
110 days. The flow rate is held constant over the test period. Sample-to-water ratio is 1:5
(by volume), as suggested in Reference [30]. For each rain chamber, three two-inch mortar
cubes are prepared and placed on small pedestals in the containers.
44
Figure 13 Test set-up for “Rain
Chamber Test”
After extraction during the “raining” period, samples of the circulating water in each
system are analyzed for any contaminants leached out of the pore solution of the
specimens. The specimens themselves are crushed after the rain chamber test and
chemically analyzed afterwards. Most of the analyses follow the Toxicity Characteristic
Leaching Procedure (TCLP), which "is designed to determine the mobility of both organic and
inorganic contaminants in liquid and solid, and multiphasic wastes" [77, page 40643]. The
Baron Consulting Company, CT conducts the chemical analyses of all samples, using the
methods described in [78, 79, 80].

45
3.1.7 Durability
Durability designates the ability of a material to maintain its properties over its service life.
Depending on loading and environmental conditions, concrete can undergo undesirable
changes with time. Especially if unknown detrimental substances are present or if the
chemical composition of a concrete component changes with time and place of origin, as
in the case of dredged material, long-term effects have to be taken into consideration.
Durability is a relatively general term and includes ASR related issues (see Section 2.2),
which can be evaluated using the tests described in Chapter 3.1.4. In addition, the
durability of a given composition is affected by performance during freeze-thaw cycles,
resistance against chemical attack (typically by sulfuric acid or through chloride ingress),
and carbonization. In this work, durability cannot be addressed completely. Further work is
desirable for future research.
As a first approximation of durability performance, the compressive strength of one-inch
cylinders is determined at much higher ages than the customary 7 and 28 days, to detect
possible deterioration over time. During this work, additional durability evaluations are
confined to ASR tests and leaching performance, a rather atypical durability issue, because
of health concerns that may be raised by the contaminants in dredged material.
46
3.2 MATERIALS
Cement: Allentown Cement Portland cement Type I, chemical composition as
shown in Table 5.
Dredged material: Material dredged in November 1999 at Newtown Creek, New Jersey,
chemical composition as shown in Table 5; used either untreated,
dried, or after Columbia University Treatment (CUT, see Chapter 3.3);
contamination before and after CUT treatment as shown in Table 6.
Kaolin: Dry Branch Kaolin Company untreated kaolinite.
Metakaolin: Engelhard MetaMax thermally activated kaolinite, chemical
composition as shown in Table 5.
Aggregate: Non-reactive manufactured sand, with five different sieve curves as
shown in Table 6.
Superplasticizers: SP-Lig: based on lignosulfonate (Darvan 2),
SP-FC: based on formaldehyde-condensate (Tamal),
SP-Mel: based on melamine-formaldehyde (Melment),
SP-Mix: proprietary admixture blended from multiple substances
(37% water by mass).
47
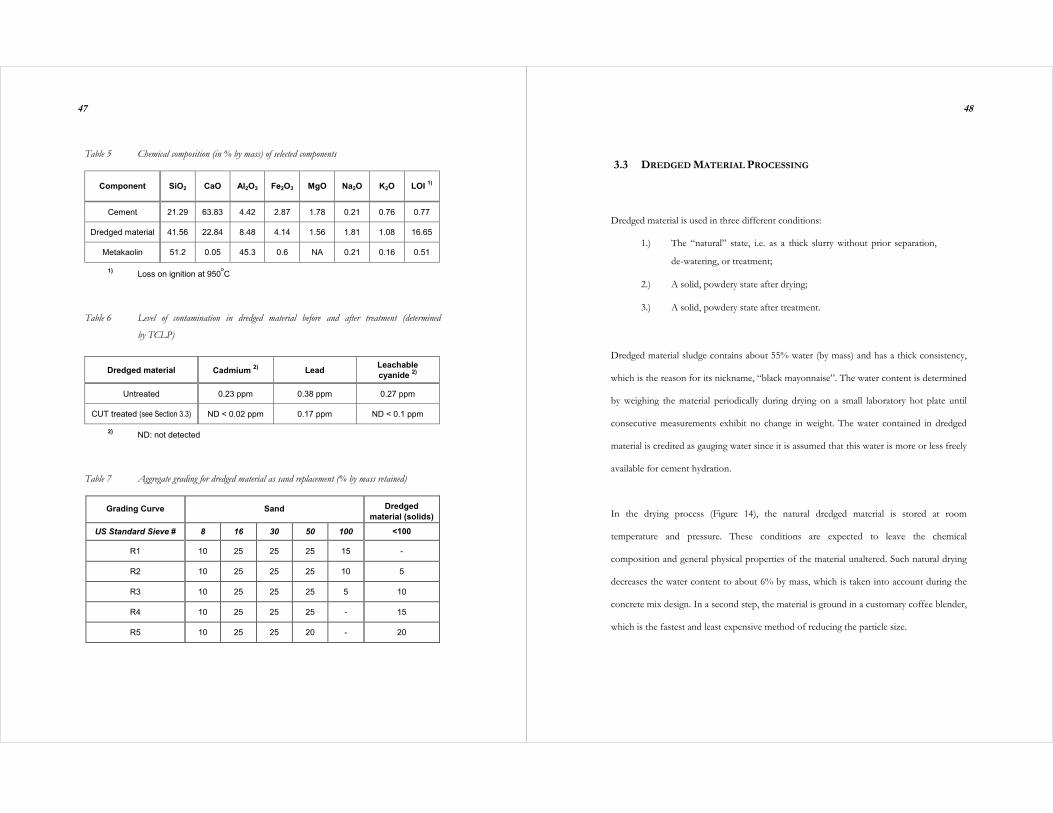
Table 5 Chemical composition (in % by mass) of selected components
Component SiO2 CaO Al2O3 Fe2O3 MgO Na2O K2O LOI 1)
Cement 21.29 63.83 4.42 2.87 1.78 0.21 0.76 0.77
Dredged material 41.56 22.84 8.48 4.14 1.56 1.81 1.08 16.65
Metakaolin 51.2 0.05 45.3 0.6 NA 0.21 0.16 0.51
1) Loss on ignition at 950oC
Table 6 Level of contamination in dredged material before and after treatment (determined
by TCLP)
Dredged material Cadmium 2) Lead Leachable cyanide 2)
Untreated 0.23 ppm 0.38 ppm 0.27 ppm
CUT treated (see Section 3.3) ND < 0.02 ppm 0.17 ppm ND < 0.1 ppm
2) ND: not detected
Table 7 Aggregate grading for dredged material as sand replacement (% by mass retained)
Grading Curve Sand Dredged material (solids)
US Standard Sieve # 8 16 30 50 100 <100
R1 10 25 25 25 15 -
R2 10 25 25 25 10 5
R3 10 25 25 25 5 10
R4 10 25 25 25 - 15
R5 10 25 25 20 - 20
48
3.3 DREDGED MATERIAL PROCESSING
Dredged material is used in three different conditions:
1.) The “natural” state, i.e. as a thick slurry without prior separation,
de-watering, or treatment;
2.) A solid, powdery state after drying;
3.) A solid, powdery state after treatment.
Dredged material sludge contains about 55% water (by mass) and has a thick consistency,
which is the reason for its nickname, “black mayonnaise”. The water content is determined
by weighing the material periodically during drying on a small laboratory hot plate until
consecutive measurements exhibit no change in weight. The water contained in dredged
material is credited as gauging water since it is assumed that this water is more or less freely
available for cement hydration.
In the drying process (Figure 14), the natural dredged material is stored at room
temperature and pressure. These conditions are expected to leave the chemical
composition and general physical properties of the material unaltered. Such natural drying
decreases the water content to about 6% by mass, which is taken into account during the
concrete mix design. In a second step, the material is ground in a customary coffee blender,
which is the fastest and least expensive method of reducing the particle size.

49
Figure 14 Drying process of dredged material: 1) sludge, 2) dried “cakes”, 3) ground filler
After the drying process, the dredged material is much easier to process, handle, and store
than the slurry in its original condition. It appears to be slightly more homogeneous
because large agglomerates with weak bonds may be partially destroyed. As a side effect
small foreign particles, e.g. pieces of woods or metal screws, can be removed manually in
the process.
An alternate treatment procedure was developed at Columbia University [43, 44, 45, 46],
which is referred to as “CUT” and described in a U.S. patent application [37]. The
treatment is based on the physico-chemical reorganization of the (micro-) structure of the
dredged material. The addition of a mineral admixture causes a reaction, during which
agglomerates are destroyed and the structure is spread out. Thereby, the dredged material
properties can be adjusted and homogenized. With the subsequent administration of a
chelating agent contaminants can be encapsulated or permanently immobilized by forming
stable macromolecules. The CUT lowered the contaminant concentrations significantly, as
can be seen in Table 6. After such treatment the material is ground to fine particle size. The
residual water content can be considered to be negligible and need not to be counted for
the gauging water of any concrete mix.
1) 2) 3)
50
3.4 TEST PLAN
3.4.1 Natural Dredged Material as Aggregate Replacement
The first approach to beneficially use dredged material in concrete applications is based on
the assumption that the quantitative dominance of sand-like particles would justify a
replacement of regular aggregate. In Test Series RN (Table 8), the material is used in its
natural untreated condition as sludge with about 55% water content (by mass). The
dredged material amount refers to the dry weight and is given in percentage of the
aggregate. Because dredged material replaces parts of the fine sand, the overall amount of
aggregate remains constant. The aggregate-to-cement ratio (a/c) is 2.25 for all mixes.
In sub-series RN-A, the water-to-cement ratio (w/c) is held constant so that the flow is
expected to decrease with the addition of dredged material. In the second sub-series RN-B,
the w/c ratio is adjusted with increasing dredged material content to achieve comparable
flow. To determine these w/c ratios, prior flow tests were necessary. The same mix
proportions are used in sub-series RN-C as in RN-B, but without dredged material to
permit an evaluation of the dredged material in comparison to fine sand. In sub-series
RN-D, the amount of water required to obtain comparable flow is reduced because of the
administration of a superplasticizer.

51
Table 8 Test series RN (Replacement of aggregate with Natural untreated dredged material)
Name Composition Test
w/c a/c Grading Curve
Dredged Material1) SP-Mix2) Flow Compr.
RN-A1 0.70 2.25 0.70 - 0.70 Ring Cylinder
RN-A2 0.70 2.25 0.70 5 0.70 Ring Cylinder
RN-A3 0.70 2.25 0.70 10 0.70 Ring Cylinder
RN-A4 0.70 2.25 0.70 15 0.70 Ring Cylinder
RN-A5 0.70 2.25 0.70 20 0.70 Ring Cylinder
RN-B1 0.45 2.25 R1 - - Ring Cylinder
RN-B2 0.52 2.25 R2 5 - Ring Cylinder
RN-B3 0.64 2.25 R3 10 - Ring Cylinder
RN-B4 0.75 2.25 R4 15 - Ring Cylinder
RN-B5 0.88 2.25 R5 20 - Ring Cylinder
RN-C2 0.52 2.25 R1 - - Ring Cylinder
RN-C3 0.64 2.25 R1 - - Ring Cylinder
RN-C4 0.75 2.25 R1 - - Ring Cylinder
RN-C5 0.88 2.25 R1 - - Ring Cylinder
RN-D2 0.45 2.25 R2 5 0.6 Ring Cylinder
RN-D3 0.50 2.25 R3 10 1.2 Ring Cylinder
RN-D4 0.57 2.25 R4 15 1.8 Ring Cylinder
RN-D5 3) 0.63 2.25 R5 20 2.3 Ring Cylinder
1) In % by mass of aggregate
2) In % by mass of cement 3) Additional determination of compressive strength test at increased age (durability)
52
3.4.2 Dredged Material as Filler
It is hypothesized that there might be a potential to use dredged material more profitably as
filler rather than aggregate replacement. For that purpose, the material was administered to
the various concrete mixes either without further treatment after drying (Test Series NF,
Table 9) or after CUT treatment (Test Series TF, Table 10). In the following tables, the test
series are grouped according to the additional filler that is used. The amount of filler is
given in percentage of the cement by mass. Further details about these two test series will
be presented in Chapter 4.
3.4.3 Dredged Material and Kaolin as Fillers
After a first analysis of selected test results of Test Series NF-A and TF-A, a dredged
material content of 30% by mass was considered to be large enough to clearly determine
the influence of this material as a filler. At the same time, this percentage is small enough to
not negatively affect all concrete properties and in some cases to even improve its
performance. Because of the similarity between natural clay minerals and the ones present
in dredged material (see Chapter 2.8), the addition of varying amounts of dredged material
and of kaolin is evaluated at a combined content of 30% by mass (Test Series KF, Table
11, and Test Series NK, NM, Table 12).

53
However, clay minerals in dredged material are subject to aging and weathering processes,
which may alter their physicochemical properties. The crystal structures and especially the
surfaces of the minerals contain (partial) defects and may exhibit increased reactivity. The
performance of dredged material filler was therefore compared with that of metakaolin
with well-known pozzolanic properties (Test Series NM, Table 12).
Table 9 Test series NF (Natural untreated dredged material as Filler)
Name Composition Test
w/c a/c Dredged Material1) SP1) Flow Compr. Other2)
NF-A1 0.70 3.0 20 - Ring Cylinder -
NF-A2 0.42 3.0 - Mix 1.0 Ring Cylinder D
NF-A3 0.42 3.0 5 Mix 2.0 Ring Cylinder D
NF-A4 0.42 3.0 10 Mix 3.0 Ring Cylinder D
NF-B1 0.41 3.0 - Mix 2.5 Ring/Cone Cube L
NF-B2 0.48 3.0 30 Mix 2.5 Ring/Cone Cube L
NF-C1 0.52 3.0 - - Ring/Cone - S/A/1260
NF-C2 0.75 3.0 30 - Ring/Cone - S/A/1260
NF-D1 0.54 3.0 - - Ring/Cone Cube T
NF-D2 0.42 3.0 - Lig 0.5 Ring/Cone Cube T
NF-D3 0.81 3.0 30 - Ring/Cone Cube T
NF-D4 0.69 3.0 30 Lig 1.0 Ring/Cone Cube T
NF-D5 0.66 3.0 30 FC 1.0 Ring/Cone Cube T
1) In % by mass of cement
2) S: setting time test A: autoclave ASR test 1260: ASTM C1260 ASR test T: tensile strength test
54
Table 10 Test series TF (Treated dredged material as Filler)
Name Composition Test
w/c a/c Dredged Material1)
SP-Mix1)
Flow Compr. Other
TF-A1 0.70 3.0 20 - Ring Cylinder -
TF-A2 0.50 3.0 20 2.0 Ring Cylinder -
TF-A3 0.55 3.0 30 2.0 Ring Cylinder -
TF-A4 0.60 3.0 35 2.0 Ring Cylinder -
TF-A5 0.65 3.0 40 2.0 Ring Cylinder -
TF-A6 0.70 3.0 45 2.0 Ring Cylinder -
TF-B1 0.42 3.0 30 2.5 Cone Cube L
TF-C1 0.61 3.0 30 - Ring/Cone - S/A/1260
1) In % by mass of cement
2) L: leaching test A: autoclave ASR test S: setting time test 1260: ASTM C1260 ASR test
Table 11 Test series KF (Kaolin as Filler)
Name Composition Test
w/c a/c Kaolin1) SP1) Flow Compr. Other2)
KF-1 0.88 3.0 30 - Ring/Cone Cyl./Cube S/A/
1260/T
KF-2 0.58 3.0 30 Lig 1.0 Ring/Cone Cyl./Cube T
KF-3 0.56 3.0 30 FC 1.0 Ring/Cone Cyl./Cube T
1) In % by mass of cement 2) S: setting time test A: autoclave ASR test
1260: ASTM C1260 ASR test T: tensile strength test

55
Table 12 Test series NK / NM (Natural dredged material, Kaolin and Metakaolin as fillers)
Name Composition Test
w/c a/c Dredged Material1) Clay2)
SP-Mix1)
Flow Compr.
NK-1 0.55 3.0 - - - Ring Cyl./Cube
NK-2 0.63 3.0 - K 30 1.5 Ring Cyl./Cube
NK-3 0.58 3.0 7.5 K 22.5 1.5 Ring Cyl./Cube
NK-4 0.62 3.0 15 K 15 1.5 Ring Cyl./Cube
NK-5 0.65 3.0 22.5 K 7.5 1.5 Ring Cyl./Cube
NM-1 0.66 3.0 30 - 1.5 Ring Cyl./Cube
NM-2 0.62 3.0 22.5 M 7.5 1.5 Ring Cyl./Cube
NM-3 0.58 3.0 15 M 15 1.5 Ring Cyl./Cube
NM-4 0.52 3.0 7.5 M 22.5 1.5 Ring Cyl./Cube
NM-5 0.45 3.0 - M 30 1.5 Ring Cyl./Cube
1) In % by mass of cement
2) Clay mineral content as filler in % by mass of cement: K kaolin, M metakaolin
56
4 TEST RESULTS
As outlined in the overview of Section 3.4, the various test series were arranged with
respect to the materials used, i.e. to determine the effect of a particular constituent in
comparison to a given reference composition (“material oriented”). While the first Test
Series RN with dredged material as aggregate was limited to one additional component and
thus well defined, the other test series were more involved, incorporated various
components in “inter-material” comparisons, were based on previous findings, and
required additional tests. Hence it was necessary to re-group the test results corresponding
to the test performed and also the chronological test sequence (“test oriented”). This
chapter will utilize both ways to present or to group the test results.
The results of preliminary flow tests are not presented here because the data do not
contain much valuable information in spite of the large number of tests that were involved.
For each individual test series, w/c ratio and superplasticizer dosage had to be adjusted to
obtain comparable flow. First, the w/c ratio was varied until the targeted flow was
achieved. Secondly, the superplasticizer dosage was changed and the first step repeated.
For example, to determine the influence of lignosulfonate, the dosage of SP-Lig was varied
in increments of 0.5% from 0% up to 2% by mass of cement. For each of those five

57
values, the w/c ratio was adjusted between two and five times. For three variations per
value, the optimization of the three mixes containing SP-Lig required 45 prior flow tests.
4.1 NATURAL DREDGED MATERIAL AS AGGREGATE REPLACEMENT
Because of its sandy nature it was first attempted to use dredged material as aggregate
replacement in concrete applications (see Section 2.8). This approach appeared to be
promising, because both the liquid and solid phases of the dredged material could be
utilized without prior separation. Test Series RN used natural dredged material, i.e. without
any treatment, as replacement of sand aggregate using the grading curves of Table 7. The
test results are summarized in Table 13 and Figures 15-20.
The samples were grouped into four sub-series. In Sub-Series RN-A, the w/c ratio was
held constant at 0.70, while it was varied in Sub-Series RN-B to obtain comparable flow
(45-50 mm). In Sub-Series RN-C, the same w/c ratios were used as in Sub-Series RN-B but
without dredged material. In Sub-Series RN-D, superplasticizer SP-Mix was administered
to the mixes to reduce the w/c ratio while keeping the flow approximately constant. The
superplasticizer dosage was increased in proportion to the amount of dredged material,
which affected the workability the most. In prior flow tests, the optimum amount of SP-
Mix with respect to dredged material was found to be 5% by mass. The goal of Test Series
RN-A, RN-B, and RN-D was to correlate dredged material content with mechanical
properties. The purpose of Sub-Series RN-C was to determine the influence of salts and
contaminants contained in the dredged material on the concrete strength if any such exists.
58
Table 13 Test results of series RN (Replacement of aggregate with Natural dredged material)
Series w/c Dredged Material
Flow (Ring) Density Compressive strength 1)
Age 28d 7d 28d
Ave CV Ave CV
Units - % 2) mm g/cm3 MPa % MPa %
RN-A1 0.70 - 72 2.10 21.1 4.0 33.0 3.8
RN-A2 0.70 5 63 1.98 24.2 3.1 32.0 3.2
RN-A3 0.70 10 49 1.99 21.0 - 29.4 4.6
RN-A4 0.70 15 39 1.97 21.7 - 34.3 -
RN-A5 0.70 20 32 1.94 19.7 - 30.6 3.1
RN-B1 0.45 - 48 2.21 53.6 - 60.1 -
RN-B2 0.52 5 47 2.14 38.8 4.6 46.8 4.2
RN-B3 0.64 10 46 2.02 24.1 - 30.8 * -
RN-B4 0.75 15 46 1.94 21.8 13.0 35.0 7.9
RN-B5 0.88 20 46 1.82 17.9 10.8 29.8 1.5
RN-C2 0.52 - 59 2.21 48.0 4.8 51.6 -
RN-C3 0.64 - 70 2.15 30.8 5.1 41.3 4.1
RN-C4 0.75 - 74 2.12 21.2 - 30.2 -
RN-C5 0.88 - 75 1.99 15.2 4.7 19.6 2.8
RN-D2 0.45 5 48 2.22 49.2 * - 43.7 * 2.5
RN-D3 0.50 10 47 2.14 33.2 4.3 37.1 0.7
RN-D4 0.57 15 46 2.06 27.4 - 30.1 5.0
RN-D5 0.63 20 46 2.03 25.9 - 36.9 * -
150d 105d 150d
RN-D5 0.63 20 46 1.94 43.4 - 48.0 -
1) Ave: Average strength of 3 specimens CV: Coefficient of variation (if no value is given, less than 3 specimens tested)
2) By mass of aggregate * Test data of low confidence

59
The use of one-inch cylinders throughout Test Series RN was a compromise between test
accuracy and amount of dredged material (see Section 3.1.2). Test data defying expected
trends are marked in Table 13 with asterisks.
The results of Test Series RN permit the following observations:
• At a fixed w/c ratio, an increase in dredged material content from 0 to 20%
by mass of aggregate caused the flow to decrease by more than factor two,
i.e., the workability dropped drastically, whereas the compressive strength
was barely affected (Figure 15). The poor quality of specimens with
insufficient flow can be visualized in Figure 21.
Sub-Series RN-A
0
10
20
30
40
50
60
70
0 5 10 15 20Dredged material content in % (by mass of aggregate)
Strength in MPa
0
10
20
30
40
50
60
70
807d strength28d strengthFlow
Flow in mm
Figure 15 Sub-Series RN-A: Flow and compressive strength versus dredged material content
at constant w/c ratio of 0.70
60
• To maintain a constant flow of about 45-50mm, the w/c-ratio had to
be increased in near-linear proportion to the dredged material content.
As a result, a considerable drop in compressive strength was experienced
(Figure 16). For example, the 28-day strength of the reference mix without
dredged material was cut in half when 20% of the aggregate (by mass) was
replaced by dredged material (RN-B1 and RN-B5).
Sub-Series RN-B
0
10
20
30
40
50
60
70
0 5 10 15 20
Dredged material content in % (by mass of aggregate)
Strength in MPa
0
10
20
30
40
50
60
70
80
7d strength28d strengthFlow
Flow in mm
Figure 16 Sub-Series RN-B: Flow and compressive strength versus dredged material content
at variable w/c ratios
• Increasing the w/c-ratio without adding dredged material caused an
increase in flow and a loss in compressive strength after 28 days that was
almost linearly proportional to the w/c ratio (Figure 17).
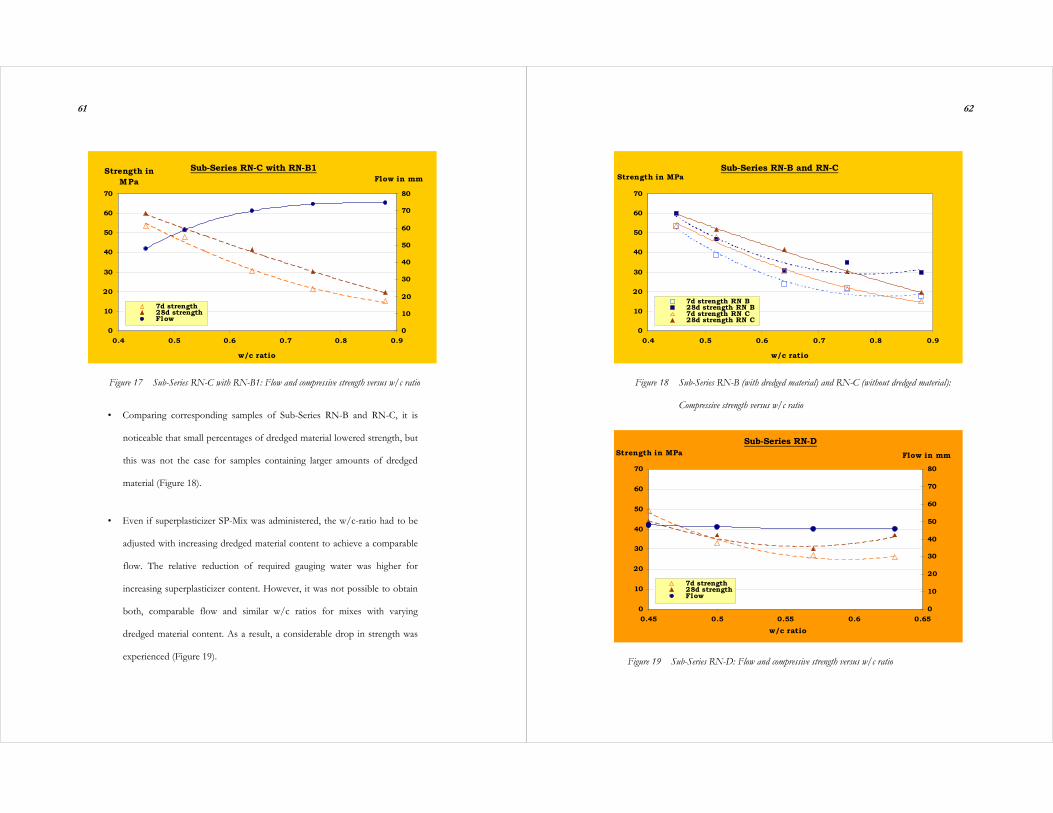
61
Sub-Series RN-C with RN-B1
0
10
20
30
40
50
60
70
0.4 0.5 0.6 0.7 0.8 0.9
w/c ratio
Strength in MPa
0
10
20
30
40
50
60
70
80
7d strength28d strengthFlow
Flow in mm
Figure 17 Sub-Series RN-C with RN-B1: Flow and compressive strength versus w/c ratio
• Comparing corresponding samples of Sub-Series RN-B and RN-C, it is
noticeable that small percentages of dredged material lowered strength, but
this was not the case for samples containing larger amounts of dredged
material (Figure 18).
• Even if superplasticizer SP-Mix was administered, the w/c-ratio had to be
adjusted with increasing dredged material content to achieve a comparable
flow. The relative reduction of required gauging water was higher for
increasing superplasticizer content. However, it was not possible to obtain
both, comparable flow and similar w/c ratios for mixes with varying
dredged material content. As a result, a considerable drop in strength was
experienced (Figure 19).
62
Sub-Series RN-B and RN-C
0
10
20
30
40
50
60
70
0.4 0.5 0.6 0.7 0.8 0.9
w/c ratio
Strength in MPa
7d strength RN B28d strength RN B7d strength RN C28d strength RN C
Figure 18 Sub-Series RN-B (with dredged material) and RN-C (without dredged material):
Compressive strength versus w/c ratio
Sub-Series RN-D
0
10
20
30
40
50
60
70
0.45 0.5 0.55 0.6 0.65w/c ratio
Strength in MPa
0
10
20
30
40
50
60
70
80
7d strength28d strengthFlow
Flow in mm
Figure 19 Sub-Series RN-D: Flow and compressive strength versus w/c ratio

63
• For Sub-Series RN-D, the compressive strengths after 7 and 28 days were
surprisingly similar for dredged material contents of less than 15% by mass
of aggregate, whereas the strength of sample RN-D5 with 20% dredged
material increased considerably from 7 to 28 days (Figure 19).
• By adding a superplasticizer, the same flow of 45-50mm could be achieved
with lower w/c-ratio at a given dredged material content; therefore the
strength had been expected to be higher. However, the test results
confirmed this expectation only for the 7-day strength while corresponding
28-days strengths were very close (Figure 20).
Sub-Series RN-B and-RN D
0
10
20
30
40
50
60
70
0 5 10 15 20Dredged material content in % (by mass of aggregate)
Strength in MPa
7d strength RN B28d strength RN B7d strength RN D28d strength RN D
Figure 20 Sub-Series RN-B (without superplasticizer) and RN-D (with SP-Mix):
Compressive strength versus dredged material content
64
• As a preliminary indicator of durability, the strength development over
extended periods was expected to reveal possible deleterious effects,
especially in combination with the small specimen size. However, the
strength development of series RN-D5 exhibited no irregularities. The
compressive strength increased steadily with time, i.e. after 28 days it was
40% higher than the 7-day strength and after 150 days it was 30% higher
than the 28-day strength (Table 13).
• It was generally experienced that samples with comparably high density
exhibited high compressive strength. Both properties are strongly related to
the w/c ratio.
• A few strength test results deviated from the expected values because of the
small specimen size. As an indication of the reliability of the results, the
coefficient of variation (CV) was determined for all tests with at least three
specimens per data point. For 7-day strength results, the CV was generally
much larger than for 28-day data, and in many cases it was not computed
because of the loss of one measurement.
In sum, the most prominent observation was the loss of workability, which can be
visualized in Figure 21. Insufficient flow caused a porous, inhomogeneous structure and
the samples could not be compacted properly. Poor performance was the consequence.
Due to its sand-like properties, dredged material used as aggregate replacement did not

65
greatly affect the strength. As in regular concrete, strength decreased much more rapidly
with increasing w/c ratio.
Figure 21 Insufficient workability caused severe defects on samples containing 10%
dredged material as aggregate replacement (by mass of aggregate)
The addition of superplasticizer resulted in lower w/c ratios and in considerably higher
compressive strength only after 7 days or when 20% dredged material (by mass of
aggregate) was used. It is suspected that the interaction between dredged material and
superplasticizer increases the reactivity of the mix and simultaneously frees water in the
network structure of dredged material. If no superplasticizer is added this water may be
released only with time, which would explain the different early strengths but similar long-
term behavior of concrete mixes RN-B and RN-D with less than 15% dredged material.
The influence of irregular components such as contaminants in the dredged material could
not clearly be identified. On the other hand, dredged material did affect the rate of
hydration, i.e. the hardening of the concrete specimens. Samples containing 20% dredged
material could be unmolded only two days after casting unlike the other specimens, which
were usually unmolded after 24 hours.
66
In conclusion, the results indicate that replacing up to 20% of aggregate (by mass) with
dredged material may be an acceptable option to beneficially use such material under the
premise of its otherwise problematic disposal. The decrease in workability places this upper
limit on the addition of dredged material. If the w/c ratio is held constant, the strength
may be comparable for samples with and without dredged material, whereas fresh mixes
without dredged material are too liquid to yield good results and samples containing
dredged material exhibit poor workability (sub-series RN-A). In general, the substitution of
dredged material for regular sand lowers the concrete performance but may still be feasible
for applications with lesser requirements. Although present in larger quantities, the quartz
minerals contained in dredged material do not seem to overcome the physico-chemical
prevalence of the clay minerals, which are present in smaller quantities. This suggests the
use of dredged material as filler.
4.2 DREDGED MATERIAL AS FILLER
While in Test Series RN the dredged material was used in its natural condition, i.e. without
any separation, de-watering, or other treatment, in Test Series NF and TF the material
was either dried and ground or underwent preliminary treatment when used as filler
(see Section 3.3). The replacement of 10% regular aggregate (by mass) with dredged
material caused the flow to fall within the target flow range at a w/c ratio of 0.70 and
yielded reasonable results for the compressive strength (RN-A3, Table 13). This
replacement value corresponds to 22.5% dredged material (by mass of cement), which was

67
adjusted to 20% for samples NF-A1 and TF-A1 using the same w/c ratio. The a/c ratio
was increased to 3.0 for all test series incorporating fillers to obtain more representative
mix proportions for concrete production.
When natural dredged material was used as filler, i.e. as an additional component, the flow
of mix NF-A1 dropped to 55% of that of mix RN-A3 (Table 14). In the case of dredged
material after treatment the flow reduction was much less (TF-A1, Table 14). The decrease
had been expected because the mix included additional, much finer material with a
tendency to agglomerate and a comparably high adsorption capacity. However, the density
of samples containing either untreated or treated material increased slightly although the
workability was so poor that sufficient compaction of the fresh concrete was difficult.
Table 14 Mortar properties with natural and treated dredged material as filler
Sample w/c Dredged Material
Flow (Ring) Density Compressive strength 1)
Age 28d 7d 28d
Ave CV Ave CV
Units - % by mass of cement mm g/cm3 MPa % MPa %
RN-A3 2) 0.70 22.5 49 1.993 21.0 - 29.4 4.6
NF-A1 0.70 20 27 1.995 23.3 17.7 29.1 -
TF-A1 0.70 20 41 2.002 26.5 3.3 38.7 10.5
1) Ave: Average strength of 3 specimens CV: Coefficient of variation (if no value is given, less than 3 specimens tested)
2) Untreated dredged material as aggregate replacement and a/c ratio of 2.25
68
The compressive strength was comparable for samples with natural untreated dredged
material whether used as replacement or as filler (RN-A3 and NF-A1, Table 14). This
indicates that the drying and grinding did not substantially alter the physico-chemical
properties of the dredged material. Sample TF-A1 with treated material had a 25% higher
28-day compressive strength than mix RN-N3, which contained natural dredged material.
It can be concluded that the homogenization and re-structuring of the material treatment
effectively improved the properties of the dredged material.
In Sub-Series NF-A2 through NF-A4, the w/c cement ratio was held constant at 0.42,
while the amount of superplasticizer SP-Mix was added in proportion to the amount of
filler. In spite of the superplasticizer, the workability decreased drastically with higher
dredged material content. Also the 7-day strength decreased considerably, while differences
were less significant at the age of 150 days (Table 15). The results indicate that there was
no long-term deleterious effect of the dredged material.
The density was comparable for all three samples NF-A2 through NF-A4 because of two
conflicting trends. On the one hand, sufficiently fine inert material fills the voids between
particles and thus, increases the density. On the other hand, the density of dredged material
is lower than those of the other solid components, which reduces the concrete density after
addition of such material as filler.

69
Table 15 Mortar properties with natural untreated dredged material as filler
Sample w/c Dredged Material SP-Mix Flow
(Ring) Density Compressive strength 1)
Age 150d 7d 150d
Ave CV Ave CV
Units - % 2) % 2) mm g/cm3 MPa % MPa %
NF-A2 0.42 - 1.0 56 2.258 50.2 10.2 71.8 4.5
NF-A3 0.42 5 2.0 37 2.238 43.8 9.9 66.8 5.0
NF-A4 0.42 10 3.0 28 2.243 30.9 12.8 64.5 4.9
1) Ave: Average strength of 3 specimens CV: Coefficient of variation (if no value is given, less than 3 specimens tested)
2) By mass of cement
Insufficient flow usually resulted in specimens with severe defects. Hence, for Sub-Series
TF-A2 through TF-A6, the targeted flow was redefined at 55-60mm, which represents
fairly flowable mixtures. This sub-series was tested to determine the optimum content of
treated dredged material with comparable flow. The w/c ratio had to be increased for
higher filler contents, which led to lower density and compressive strength (Table 16). If
more than 30% treated dredged material (by mass of cement) were added, the density
decreased drastically with higher filler content. Figure 22 visualizes the inverse relationship
between compressive strength and dredged material content. One possible explanation for
the loss of strength is the increase of the w/c ratio to achieve sufficient flowability. A
pozzolanic contribution of the dredged material is doubtful. If such potential existed the
compressive strength should not decrease as dramatically as it did.
70
Table 16 Mortar properties with treated dredged material as filler
Series w/c Dredged Material
Flow (Ring) Density Compressive strength1)
Age 28d 7d 28d
Ave CV Ave CV
Units - % by mass of cement mm g/cm3 MPa % MPa %
NF-A2 0.70 - 56 - 50.2 10.2 602) -
TF-A2 0.50 20 63 2.168 43.6 9.7 54.9 14.9
TF-A3 0.55 30 59 2.171 31.8 14.8 48.8 -
TF-A4 0.60 35 58 2.103 27.7 16.2 37.6 -
TF-A5 0.70 40 60 2.006 20.9 - 29.4 7.7
TF-A6 0.70 45 55 1.856 11.7 6.9 20.3 9.6
1) Ave: Average strength of 3 specimens CV: Coefficient of variation (if no value is given, less than 3 specimens tested)
2) Projected value corresponding to compressive strength after 7 and 150 days (Table 13)
0
10
20
30
40
50
60
70
0 10 20 30 40 50Amount of treated dredged material as filler in % (by mass of cement)
Stre
ngth
in M
Pa
Figure 22 Compressive strength of mortar cylinders with different contents of treated
dredged material as filler (NF-A2, TF-A2 through TF-A6)
7d
28d
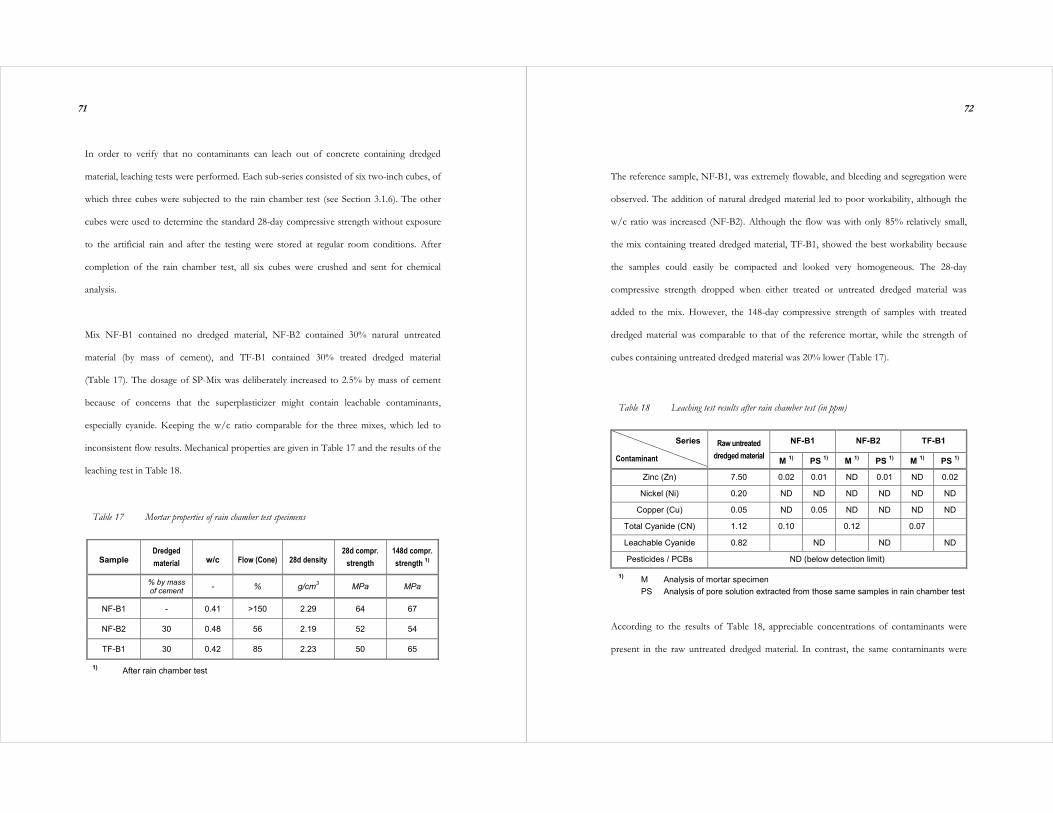
71
In order to verify that no contaminants can leach out of concrete containing dredged
material, leaching tests were performed. Each sub-series consisted of six two-inch cubes, of
which three cubes were subjected to the rain chamber test (see Section 3.1.6). The other
cubes were used to determine the standard 28-day compressive strength without exposure
to the artificial rain and after the testing were stored at regular room conditions. After
completion of the rain chamber test, all six cubes were crushed and sent for chemical
analysis.
Mix NF-B1 contained no dredged material, NF-B2 contained 30% natural untreated
material (by mass of cement), and TF-B1 contained 30% treated dredged material
(Table 17). The dosage of SP-Mix was deliberately increased to 2.5% by mass of cement
because of concerns that the superplasticizer might contain leachable contaminants,
especially cyanide. Keeping the w/c ratio comparable for the three mixes, which led to
inconsistent flow results. Mechanical properties are given in Table 17 and the results of the
leaching test in Table 18.
Table 17 Mortar properties of rain chamber test specimens
Sample Dredged material w/c Flow (Cone) 28d density
28d compr. strength
148d compr. strength 1)
% by mass of cement - % g/cm3 MPa MPa
NF-B1 - 0.41 >150 2.29 64 67
NF-B2 30 0.48 56 2.19 52 54
TF-B1 30 0.42 85 2.23 50 65
1) After rain chamber test
72
The reference sample, NF-B1, was extremely flowable, and bleeding and segregation were
observed. The addition of natural dredged material led to poor workability, although the
w/c ratio was increased (NF-B2). Although the flow was with only 85% relatively small,
the mix containing treated dredged material, TF-B1, showed the best workability because
the samples could easily be compacted and looked very homogeneous. The 28-day
compressive strength dropped when either treated or untreated dredged material was
added to the mix. However, the 148-day compressive strength of samples with treated
dredged material was comparable to that of the reference mortar, while the strength of
cubes containing untreated dredged material was 20% lower (Table 17).
Table 18 Leaching test results after rain chamber test (in ppm)
NF-B1 NF-B2 TF-B1 Series
Contaminant
Raw untreated dredged material M 1) PS 1) M 1) PS 1) M 1) PS 1)
Zinc (Zn) 7.50 0.02 0.01 ND 0.01 ND 0.02
Nickel (Ni) 0.20 ND ND ND ND ND ND
Copper (Cu) 0.05 ND 0.05 ND ND ND ND
Total Cyanide (CN) 1.12 0.10 0.12 0.07
Leachable Cyanide 0.82 ND ND ND
Pesticides / PCBs ND (below detection limit)
1) M Analysis of mortar specimen PS Analysis of pore solution extracted from those same samples in rain chamber test
According to the results of Table 18, appreciable concentrations of contaminants were
present in the raw untreated dredged material. In contrast, the same contaminants were

73
mostly non-detectable in mortar samples. The three compositions did not differ much in
the levels of detectable leachates such as heavy metals and cyanides. There was no
difference in leaching test results, whether cubes were subjected to the rain chamber test or
not. The results show that the cement matrix effectively prevents the leaching of
contaminants.
Contaminant concentrations in mortar samples were far below the levels found in
the natural untreated dredged material. It was shown elsewhere that heavy metals are
detectable even in “clean” aggregate [49]. This may also be the case for cyanides because
comparable levels of total cyanides were found in all mortars, with or without dredged
material. However, the leachable cyanide concentrations in the pore solution were below
the detection limit. Hence, it can be concluded that no cyanide leached out of mortar
samples. Interestingly, the concentration of copper was the highest in the case of reference
sample NF-B1 where it was least expected. The concern that contaminants inside dredged
material might leach out during the service life of concrete members seems to be
unfounded.
During the preparation of the samples for the leaching test, it became clear that there is a
beneficial effect of dredged material as filler because it prevents bleeding. The top surface
of the reference sample was covered with a continuous, dried white-yellow cement-salt-
superplasticizer layer as a result of bleeding. The sides of the same specimens exhibited
signs of segregation. The samples with untreated or treated dredged material did not show
these phenomena. None of the specimens of the three mixes exhibited any irregularities,
74
such as surface damage or severe weathering, after exposure to artificial rain for 16 weeks,
which can be interpreted as satisfying a first durability criterion.
In conclusion, for mortars containing dredged material a target flow greater than 50mm in
the ring test is needed to assure an adequate workability. However, the preliminary flow
test results may not reflect the actual workability completely, depending on the amount of
material of a given batch. The addition of superplasticizer SP-Mix in proportion to the
untreated dredged material content compensates only partially for the decrease in
workability. The use of 10% dredged material (by mass of cement) as filler reduced the
flow of the fresh concrete to half of that of samples without any filler. The 7-day
compressive strength also dropped to about 60%. However, after 150 days the difference
in compressive strength was only about 20%.
Treated dredged material seems to have superior properties compared with natural
material. The compressive strength after 7 and 28 days decreases with the amount of
treated dredged material but not as drastically as in the case of natural untreated material. If
up to 30% treated material (by mass of cement) is used the matrix looks very homogenous.
If more than 30% are added the density decreases and the accompanying strength
reduction is unacceptable. In the subsequent test series the filler content was set to 30% by
mass of cement.
The leaching test showed that the cement matrix is capable of encapsulating contaminants.
It was impossible to extract significant levels of contaminants from any of the specimens.

75
Both, treated and untreated dredged material prevented bleeding of mixes with high
amounts of superplasticizer SP-Mix. None of the samples suffered severe damage while
being exposed to artificial rain for over 100 days.
4.3 DREDGED MATERIAL AND KAOLIN AS FILLERS
Because of the similarity of natural clay minerals and those found in dredged material, the
third part of the test program focussed on the comparison of concrete samples with kaolin
and dredged material (compare Chapters 2.7 and 2.8). The comparably high adsorption
capacity of clay minerals was considered helpful in evaluating the influence of such fillers
on the workability of fresh concrete.
The clay minerals in dredged material are intermingled with various other components,
interact with various contaminants, are exposed to changing conditions, and the crystal
surfaces exhibit defects (see Chapter 2.8). Therefore, their behavior and reactivity may
differ greatly from that of naturally occurring clays, such as kaolinite, which can be found
in relatively pure form. Kaolin can be thermally treated and become metakaolin, which is
highly reactive and pozzolanic. The beneficial effects of metakaolin have been subject to
extensive research and its pozzolanic properties are well known. Based on the assumption
that kaolin acts as an inert filler (lower bound) and metakaolin as a highly reactive filler
(upper bound), an envelope was created to evaluate the pozzolanic contribution of dredged
material if such exists.
76
In a first set of tests the setting time was determined with a Vicat needle in accordance with
ASTM C191 [4]. The ASR reactivity was evaluated following ASTM C1260 [5] and a
procedure for autoclave testing as described in Reference [36]. After the ASR tests, one-
inch cubes were cut from the mortar bars, and the 28-day compressive strengths were
determined with the newly won specimens.
Three different fillers, untreated and treated dredged material and kaolin (samples NF-C2,
TF-C1, and KF-1, respectively) were evaluated and the results compared to those of
reference sample without any filler (NF-C1). The flow was held constant at about 120%
(Cone Test) while the w/c ratios were varied.
Table 19 summarizes the flows, setting times, ASR expansions, and compressive strengths.
It can be seen that treated dredged material barely affected the setting time while the
untreated material delayed it by 105 minutes, an increase of almost 60% (NF-C1, NF-C2
and TF-C1). Concrete with kaolin set after 255 minutes, 75 minutes later than the reference
sample without filler (NF-C1 and KF-1). It was determined in prior tests that mortar
containing metakaolin already set after 120 minutes, compared to sample NF-C1 a
reduction of 33%. Metakaolin had been known to be highly reactive, hence this result was
no surprise.
The studies of potential alkali-silica reactivity (ASR) showed that none of the expansions
exceeded the 0.10% limit for innocuous behavior of the ASTM C1260 specification [5].

77
After autoclave testing mixes TF-C1 and KF-1 exhibited small negative length changes,
which was found to be a sign of innocuous behavior [36]. For mixes NF-C1 and NF-C2
additional ASR testing would be necessary to compare their relative expansions to that of a
reference mix with known reactivity. Figure 23 shows that samples containing treated
dredged material or kaolin also exhibited shrinkage during the first two days of their
exposure to the alkaline solution in the ASTM C1260 test. This early shrinkage may
indicate a high reactivity of the filler [36].
Table 19 Test results of setting time determination and ASR testing
Sample Units NF-C1 NF-C2 TF-C1 KF-1
Filler (30 M% of cement)
- Natural dredged mat.
Treated dredged mat.
Kaolin
w/c 0.52 0.75 0.61 0.88
Flow (Cone) % 124 118 102 123
Flow (Ring) mm 44 45 46 49
Ratio Flow (Cone)/Flow (Ring) 2.82 2.62 2.22 2.51
Setting time min 180 285 175 255
Relative length change after ASTM C1260
% 0.06% 0.04% 0.05% 0.02%
Relative length change after autoclave test
% 0.02% 0.03% -0.01% -0.02%
28d compressive strength (after ASTM C1260)
MPa 45 27 29 20
28d compressive strength (after autoclave test)
MPa 27 15 20 19
78
In both cases, after the autoclave and the ASTM C1260, test sample NF-C1 (without filler)
had the highest 28-day compressive strength. Samples NF-C2 and TF-C1 (with untreated
and treated dredged material, respectively) exhibited about 30 and 40% lower strength. The
strength of sample KF-1 with kaolin after autoclave treatment was almost as high as after
the ASTM C1260 test, whereas in the other cases the samples after autoclaving were about
30-40% weaker than the specimens that underwent the ASTM C1260 test (Table 19).
-0.02%
0.00%
0.02%
0.04%
0.06%
0.08%
0.10%
0 2 4 6 8 10 12 14 16
Duration of ASTM C1260 in days
Tota
l Len
gth
Cha
nge
NF-C1 NF-C2 TF-C1 KF-1
0.10% limit for innocuous behavior [5]
Figure 23 Relative length changes with time of mortar bars during the ASTM C1260 test
Tables 20 and 21 summarize the results of samples containing different amounts of
metakaolin, kaolin, and dredged material, while the combined overall amount of filler was
held constant at 30% by mass of cement (Test Series NK and NM). The incremental
substitution of dredged material for either kaolin or metakaolin should reveal similarities

79
between these materials if such exist and increase our understanding of pozzolanic
properties of dredged material.
In both test series, NK and NM, it was the goal to achieve comparable flow, which
required adjusting the amount of gauging water. The addition of superplasticizer SP-Mix
allowed keeping the w/c ratios comparably low. For example, in the case of NM-4 it had
been determined earlier that a w/c ratio of 0.75 was required to achieve the targeted flow
when no superplasticizer was used. After addition of 1.5% SP-Mix (by mass of cement) the
w/c ratio could be reduced to 0.45. This is a decrease of about 40% gauging water. A
similar comparison was performed for the reference sample without filler (NK-1), where
the addition of SP-Mix lowered the w/c ratio from 0.55 to 0.42, a 25% reduction.
However, in this case the sample with superplasticizer exhibited bleeding and segregation,
which resulted in poor homogeneity of the specimens. Therefore, mix NK-1 was prepared
without any superplasticizer.
The addition of dredged material and kaolin caused a decrease in density with growing
dredged material content. The mean value of the w/c ratios of concrete containing
kaolin and/or dredged material was 0.63 and variations for this value stayed below 8%
(Tables 20 and 21). The compressive strength of cylinders seemed to have a slight
pessimum when 15% kaolin and15% dredged material (by mass of cement) were added,
whereas the cube strength was lowest for a dredged material content of 22.5% and a kaolin
content of 7.5% (Figure 24).
80
Table 20 Mortar properties with dredged material and kaolin as fillers
Units NK-1 NK-2 NK-3 NK-4 NK-5
Dredged material % 1) - - 7.5 15 22.5
Kaolin % 1) - 30 22.5 15 7.5
SP-Mix % 1) - 1.5 1.5 1.5 1.5
w/c - 0.55 0.63 0.58 0.62 0.65
Flow (Cone) % 125 2) 102 101 108 112
7d compr. strength (Cylinder) MPa 26 25 24 21 23
CV of 7d strength (Cylinder) % - 5.4 10.6 - 1.9
7d density of cylinders g/cm3 2.262 2.205 2.203 2.172 2.187
28d compr. strength (Cylinder) MPa 42 40 35 29 36
CV of 28d strength (Cylinder) % - - 1.6 4.4 1.8
28d density of cylinders g/cm3 2.210 2.133 2.144 2.078 2.078
Ratio of 7d strength (Cylinder) / 28d strength (Cylinder) - 1.63 1.65 1.47 1.40 1.54
28d compr. strength (Cube) MPa 57 46 42 39 32
CV of 28d strength (Cube) % 5.7 0.9 7.6 2.4 4.9
28d density of cubes g/cm3 2.204 2.158 2.153 2.143 2.140
Ratio of 28d strength (Cube) / 28d strength (Cylinder) - 1.37 1.13 1.18 1.34 0.93
1) By mass of cement 2) Projected flow corresponding to a flow of 53mm determined with the Ring Test
While samples with untreated dredged material and/or kaolin (NK-2 through NK-5,
NM-1) exhibited lower compressive strength than those without any filler (NK-1), the
strength of samples with metakaolin and/or dredged material exceeded those of the other

81
samples. One reason is the reduction of the w/c ratio with increasing metakaolin content
from 0.66 to 0.45 (NM-1 with only dredged material and NM-5 with only metakaolin,
respectively).
Table 21 Mortar properties with dredged material and metakaolin as fillers
Units NM-1 NM-2 NM-3 NM-4 NM-5
Dredged material % 1) 30 22.5 15 7.5 -
Metakaolin % 1) - 7.5 15 22.5 30
SP-Mix % 1) 1.5 1.5 1.5 1.5 1.5
w/c - 0.66 0.62 0.58 0.52 0.45
Flow (Cone) % 106 109 114 108 120
7d compr. strength (Cylinder) MPa 24 32 42 45 61
CV of 7d strength (Cylinder) % 5.1 4.9 11.0 - 6.4
7d density of cylinders g/cm3 2.169 2.213 2.255 2.259 2.277
28d compr. strength (Cylinder) MPa 34 49 54 62 65
CV of 28d strength (Cylinder) % 10.7 5.7 6.6 4.1 -
28d density of cylinders g/cm3 2.057 2.156 2.193 2.242 2.264
Ratio of 7d strength (Cylinder) / 28d strength (Cylinder) - 1.42 1.54 1.30 1.38 1.05
28d compr. strength (Cube) MPa 37 51 65 78 101
CV of 28d strength (Cube) % 1.9 6.3 2.8 0.9 3.1
28d density of cubes g/cm3 2.099 2.148 2.202 2.214 2.267
Ratio of 28d strength (Cube) / 28d strength (Cylinder) - 1.09 1.02 1.19 1.25 1.57
1) By mass of cement
82
0
10
20
30
40
50
60
70
0 7.5 15 22.5 30Kaolin andDredged materialcontent in % (by mass of cement)
Stre
ngth
in M
Pa
7d cylinder 28d cylinder 28d cube
22.5
30
15 7.5
0
Figure 24 Compressive strength of mortars with different contents of natural dredged material
and kaolin as fillers (Samples NM-1, NK-2 through NK-5)
0
20
40
60
80
100
0 7.5 15 22.5 30Metakaolin anddredged materialcontent in % (by mass of cement)
Stre
ngth
in M
Pa
7d cylinder 28d cylinder 28d cube
22.5
30
15 7.5
0
Figure 25 Compressive strength of mortars with different contents of natural dredged material
and metakaolin as fillers (Sub-Series NM)

83
The test data exhibit an almost linear relationship between strength and metakaolin content
(Figure 25). The density also increases with rising metakaolin amount and equals that of the
reference samples (NK-1) after 28 days when about 15% dredged material and 15%
metakaolin (by mass of cement) were added (NM-3). At the same time the w/c ratios were
about the same for these two series. It has been known that there is a strong inverse
correlation of strength and density with the w/c ratio but the improvement of
homogeneity and isotropy by adding metakaolin may be equally important.
With the exception of sample NM-5, the 28-day compressive strengths were 30-65%
higher than the corresponding 7-day strengths. The average increase was 43%, which
represents a fairly regular value [73]. The ratio of cube strength to cylinder strength
had been expected to be relatively constant but values range widely, from 0.93 to 1.57.
Possible reasons are the scatter of results and difference in compactablity during the
casting of the specimens.
4.4 INFLUENCE OF SUPERPLASTICIZERS
To investigate the (beneficial) influence of various superplasticizers it was decided to test
samples containing four different superplasticizers: 1. SP-Lig, based on lignosulfonate,
2. SP-Mel, based on melamine-formaldehyde, 3. SP-FC, based on formaldehyde-
condensate, and 4. SP-Mix, a blend of various superplasticizers. In preliminary tests, the
optimum dosage for SP-Lig and SP-FC had been found to be 1.0-1.5% by mass of cement.
84
It was impossible to sufficiently liquefy the mixes with SP-Mel, which therefore was not
considered in subsequent tests. In most tests reported herein so far, 1.5% SP-Mix was
used, which equaled about 1.0% dry mass. To be consistent, the same dosage was adopted
for SP-Lig and SP-FC in Sub-Series NF-D and KF.
The major design criterion was the workability, which necessitated slightly modified prior
flow tests. Aside from the requirement of a high flow of >50mm (Ring Test), mixes were
not allowed to exhibit excessive segregation or bleeding, as the reference samples without
filler did. The amount of water was also optimized to address the adsorption of gauging
water by clayey fillers. While the immediate workability decreased, the adsorbed water
might be partially released during the hardening process. As a consequence, the range of
targeted flow was broadened to 50-60mm in order to allow adjustments of the w/c ratios.
The addition of the lignosulfonate-based superplasticizer caused two phenomena. It
introduced voids, which led to a foamy appearance, and it retarded the cement hydration.
Excessive formation of pores caused poor workability at dosages higher than 1.5% by mass
of cement, which was much more pronounced in the case of the reference mix without any
filler than for mixes containing dredged material or kaolin. Hence, in case NF-D2 the
superplasticizer dosage was limited to 0.5%. The retardation effect had been known
previously [62, 73] and affected mainly the mixes with dredged material or kaolin. For this
reason, cylinders were unmolded after 72 instead of the customary 24 hours, while the
cubes had to be removed from their forms prematurely after 24 hours for logistical
reasons. The test results are presented in Table 22 and Figures 26 and 27.

85
Table 22 Influence of superplasticizers SP-Lig and SP-FC on mortar properties
Units NF-D1 NF-D2 NF-D3 NF-D4 NF-D5 KF-1 KF-2 KF-3
Filler (30% by mass of cement) - - - DM DM DM Kaolin Kaolin Kaolin
SP (by mass of cement) % - Lig 0.5 - Lig 1.0 FC 1.0 - Lig 1.0 FC 1.0
w/c - 0.54 0.42 0.81 0.69 0.56 0.88 0.58 0.54
Flow (Cone) % 135 125 126 136 128 99 ~140 ~140
Flow (Ring) mm 57 51 56 56 56 48 58 59
Ratio of Flow (Cone) / Flow (Ring) - 2.37 2.48 2.28 2.44 2.31 2.05 2.41 2.37
7d compr. strength (Cyl.) MPa 23.9 27.2 19.4 19.4 21.6 14.8 22.5 18.7
CV of 7d strength (cylinder) % 2.4 - - - 3.5 - - 6.3
7d density of cylinders g/cm3 2.229 2.150 2.133 2.153 2.095 2.134 2.195 2.076
7d compr. strength (Cube) MPa 27.1 28.5 18.6 15.6 23.2 15.7 27.5 22.6
CV of 7d strength (Cube) % 2.9 - 1.0 4.7 2.6 1.7 8.5 1.3
7d density of cubes g/cm3 2.168 2.020 2.137 2.052 2.025 2.116 2.202 2.073
28d compr. strength (Cyl.) MPa 35.5 37.3 28.8 29.9 32.1 23.6 34.5 34.4
CV of 28d strength (Cyl.) % 12.0 4.2 4.3 2.5 - 8.2 - -
28d density of cylinders g/cm3 2.151 2.094 2.003 2.046 2.045 1.939 2.138 2.055
28d comp. strength (Cube) MPa 41.6 39.1 31.1 25.1 35.3 27.0 42.9 35.0
CV of 28d strength (Cube) % 2.9 6.4 0.7 6.0 2.9 1.7 2.3 3.5
28d density of cubes g/cm3 2.111 2.014 2.015 1.974 1.996 1.977 2.137 2.016
28d tensile strength MPa 3.05 3.31 3.07 3.80 2.80 2.16 - 2.95
CV of 22 % 8.9 10.2 - - - 13.0 - -
86
The following observations could be made:
• Because both flow and w/c ratio were kept approximately constant, it was
possible to gauge the effect of just one variable, namely the addition of either
30% dredged material or kaolin as filler together with 1% superplasticizer (by
mass of cement).
• The addition of superplasticizer SP-Lig lowered the density of reference
samples (without filler) by causing a considerable degree of porosity (compare
NF-D1 and NF-D2). This fact explains why in spite of the much lower w/c
ratio strength results were not significantly higher, as one could expect.
• When the cubes containing untreated dredged material and SP-Lig (NF-D4)
had to be unmolded after 24 hours, it was immediately obvious that they had
not yet hardened sufficiently, because they underwent visible deformations
during and after unmolding. These deformations possibly caused structural
damage, which lowered both density and compressive strength when compared
to the cubes that contained dredged material but no superplasticizer (NF-D3).
In contrast, the cylinders were unmolded after 72 hours and thus had time to
sufficiently harden. Therefore specimens with and without SP-Lig had
comparable strength and density.
• In case of kaolin as filler, the addition of superplasticizer SP-Lig did not
produce the porosity as it did in case of the reference mix without filler
(compare KF-1 and KF-2). It is suspected that the superplasticizer was

87
adsorbed on the surfaces of the clay minerals and thus spread homogeneously
throughout the fresh concrete, thereby preventing the foaming effect. The
result was a substantial increase in strength (and density), which is expected
when lower w/c ratios are made possible (Figure 26).
Influence of lignosulfonate-based superplasticizer SP-Lig
20
25
30
35
40
45
0.4 0.5 0.6 0.7 0.8 0.9
w/c ratio
Strength in MPa
1.90
1.95
2.00
2.05
2.10
2.15
2.20Strength cylinderStrength cubesDensity cylinderDensity cubes
Density in g/ccm
SP-
Lig,
no
fille
r (N
F-D
1)
No
SP,
no
fille
r (N
F-D
2)
SP-
Lig,
Kao
lin (K
F-2)
SP-
Lig,
Dre
dged
Mat
. (N
F-D
4)
No
SP,
Dre
dged
Mat
. (N
F-D
3)
No
SP,
Kao
lin (K
F-1)
Figure 26 Evaluation of superplasticizer SP-Lig: Compressive strength and density versus
w/c ratio (Samples NF-D1 through NF-D4, KF-1 and KF-2)
• The formaldehyde-condensate-based superplasticizer SP-FC did not cause the
delayed setting and porosity as the lignosulfonate-based SP-Lig did. However,
the addition of filler and superplasticizer SP-FC lowered the density of samples
containing either dredged material or kaolin and led to a 20% decrease in
28-day compressive strength (Cube Test) when compared with the reference
sample NF-D1 (Figure 28).
88
• SP-FC allowed to drastically lower the w/c ratios of samples containing
dredged material and kaolin. Thus, the compressive strengths of the modified
concrete increased with the addition of this superplasticizer (compare NF-D3
and NF-D5, KF-1 and KF-3).
Samples NF-D1, NF-D5, and KF-3 w ith comparable flow and w /c ratios
0
10
20
30
40
50
60
70
No fil ler Dredged material Kaolin
Stre
ngth
in M
Pa
28-day strength, cylinder 28-day strength, cubes 7-day strength, cylinder 7-day strength, cubes
Figure 27 Evaluation of superplasticizer SP-FC: 7 and 28-day compressive strength in
dependence of filler type (Samples NF-D1, NF-D5, and KF-3)
• The ratio of compressive strength to tensile strength was the lowest for
samples containing dredged material and the highest for the reference cases
without filler, which indicates that the degree of anisotropy decreases with the
addition of clayey fillers, such as kaolin and dredged material.

89
In conclusion, the addition of formaldehyde-based SP-FC led to the highest reduction of
the w/c ratio for mixes containing dredged material or kaolin as filler. However at the same
time, the compressive strength hardly increased although a drastic change could have been
expected. The lignosulfonate-based SP-Lig performed well only when kaolin was added as
a filler, while it should not be used in combination with dredged material.
The addition of dredged material or kaolin as filler caused a decrease in compressive
strength, but other properties such as homogeneity and coherence could be improved. The
test results indicate that natural untreated dredged material possesses similar properties as
kaolin while treated dredged material can be partially activated. However, a pozzolanic
contribution such as is experienced with metakaolin cannot be expected from dredged
material.
90
5 ANALYSIS AND DISCUSSION OF RESULTS
5.1 WORKABILITY
The term workability generally describes the ease of handling, coherence, and homogeneity
of fresh concrete during mixing, placing, and compaction. Common tests measure only the
slump or flow (e.g., ASTM C143 and ASTM C230 [4]). These tests do not suffice to
completely address the static and dynamic behavior or time-dependent changes related to
workability. The flow tests introduced in Section 3.1.1 provide a first indication of
workability but do not capture the differences between flow and workability.
During the research presented herein, it has been suggested to use dredged material either
as aggregate replacement or as filler in concrete applications. In case of aggregate
replacement, high dredged material contents either drastically decrease the workability or
require additional gauging water, which reduces strength at comparable flow. Figure 28
illustrates the interdependence of compressive strength and flow with the w/c ratio.
Although of generic nature, the graph is based on the data of Test Series RN. If 10%
fine sand (by mass of aggregate) is replaced with dredged material, the flow decreases
drastically, which is visualized as a downward shift of the flow curve. The addition of a
superplasticizer partially compensates for such loss in workability as it causes an upwards

91
shift of the flow curve. These results are generically exemplified by the three flow curves of
Figure 28. However, the strength is also affected by factors other than the w/c ratio so that
strength values corresponding to a particular w/c ratio do not necessarily coincide with the
strength curve of Figure 28.
w/c ratio
Co
mp
ress
ive
stre
ng
th
Flo
w
target flow
Figure 28 Influence of w/c ratio on compressive strength and flow
The primary design criterion in this study was to achieve comparable flow values, as
signified by the “target flow range” of Figure 28. Starting out with a reference mix having
the water/cement ratio (w/c)1, strength S1, and flow F1, which falls within the target range,
the addition of dredged material lowers the flow. To achieve sufficient flow (F2) the larger
ratio (w/c)2 is needed. Although the corresponding strength should theoretically be S2I, as
(w/c)1 (w/c)3 (w/c)2
S1
S2
S3
S3I
S2I
F3 F2 F1
Flow of reference mixFlow of samples with dredged
material and superplasticizer
Flow of samples withdredged material Strength of reference mix
92
suggested by the strength curve, the actually recorded strength S2 was lower than that.
Likewise, by administering a superplasticizer, a reduced ratio (w/c)3 brings the flow within
the target range, F3, but again, the strength S3 was found to be less than the value S3I one
would expect, if strength were only a function of the w/c ratio. It can be concluded that
the replacement of fine aggregate with dredged material has a detrimental effect on the
concrete properties. It was shown that it is far more promising to utilize dredged material
as filler. Its performance can then be compared with that of kaolin, a natural clay.
In general, fillers decrease the flow because of their high adsorption capacities and large
specific surfaces. They interact strongly with superplasticizers especially if their surfaces
are charged. These properties are to some extent related to the particle size. Therefore it
has been attempted to predict the volume of gauging water required to achieve a certain
flow as a function the particle size dP. Krell [39] found that a thin water layer covers
the particles. Only if this film is sufficiently thick, the particles are able to move relative to
each other and the fresh concrete becomes plastic and workable (see Section 2.9.1). Krell
suggested the following formulation to determine that thickness:
10000mS
m100
V
FSF
F
F
F
FW
Wt ⋅⋅
ρ⋅
ε−ε
−= {10}
where tW thickness of water film, in µm
VW Volume of water, in cm3
εF Volume of voids between fine particles, in V-%
mF Mass of fine particles, in g
ρF Density of fine particles, in g/cm3
SSF Specific surface area of fine particles, in cm2/g

93
Neglecting the unit conversion factor, Eq. {10} can be solved for the volume of water
required to create that water film thickness:
F
F
F
FFSFWW
m100
mStVρ
⋅ε−
ε+⋅⋅= {11}
Equation {11} suggests that the water content is directly proportional to the specific
surface. However, the thickness of the water film has to be adjusted for the particle shape,
which also affects the void content. For fine-grained soils, the smallest particle dimension
controls the specific surface in an inverse relationship that has to be adjusted with a shape
factor according to the particle geometry (1D: plate, 2D: prism or rod, 3D: cube or sphere)
[68]. The binder and filler fraction of a given concrete mixture will dominate the required
volume of water due to their fineness. Hence, the influence of regular sand aggregate will
be neglected herein.
Typically, cement has a specific surface area (Blaine) of about 4 m2/g, while that of
metakaolin varies from 12 m2/g [88] to 16.8 m2/g [95]. Assuming tW (comparable water
film thickness) and the second term of Eq. {11} to be constant (neglecting volume of
voids) Eq. 11 allows to compare water requirements for different mixes that contain
additional 30% mineral filler (by mass of cement). The results are listed in Table 23.
94
Table 23 Relative volume of water required for different fillers (Eq. {11})
Main component Filler SSF of the filler Relative VW
30% (by mass of cement) m2/g [31, 39, 60, 68, 74] VW,Mix/VW,Cem
Cement Cement 0.4 1.0
Cement Kaolinite 15 9.4
Cement Illite 80 47
Cement Montmorillonite 600 347
The values of Table 23 are unrealistic because the size distribution and shape of the
particles cannot be ignored. The correct determination of the specific surface becomes
especially difficult for swelling minerals and particles coated with smaller particles. For the
former, aqueous suspensions are preferred, but results can vary drastically when different
measurement techniques are used [68]. Furthermore it was suggested that for particles
with specific surfaces larger than 1 m2/g, surface-related forces control the behavior. To
establish a correlation between specific surface and water requirement of given concrete
mixes is very complicated. A simplified approach is suggested below.
Depending on their shape, particles can be considered one-dimensional (thin plates), two-
dimensional (prisms or rods), or three-dimensional (cubes or spheres), which leads to
adjusting shape factors fsh of 1, 2, or 3, respectively [68]. Since sand and cement particles
can be considered spherical, while clay particles are plate-like, these factors can be applied
to concrete constituents. The geometry and particularly the smallest dimension dP of a
particle determines the specific surface, SSF in an inverse proportional relationship [68]:

95
SWP
shSF Gd
f2S⋅ρ⋅
⋅= {12}
where fsh Component shape factor: 1 for plates, 3 for spheres
dP Particle size
ρW Mass density of water (1 g/cm3)
GSP Specific gravity of the particle mineral
Combining this relationship with Eq. {11}, the following expression for the required water
volume VW is obtained, if voids are ignored:
SPP
FWshW Gd
mtfV
⋅⋅
∝ {13}
Equation {13} identifies only a relative trend rather than an absolute value for the required
amount of water. Values for some materials are listed in Table 24, but assuming constant
thickness of water layer, similar geometry, and negligible shape functions, as well as
ignoring the voids between particles introduces errors that need to be determined.
A new index Wind is introduced for the water requirement of a modified mix, relative to the
volume of gauging water for a reference mix without any additional filler. Assuming that
the water film thickness around each particle is comparable and using Eq. {13}, Wind can
be defined for any given mix as:
∑
∑
=
+
=
⋅
⋅==
i
1N N,SPN,P
N,FN,sh
ji
1N N,SPN,P
N,FN,sh
Gdm
f
Gdm
f
ref,WVadd,WV
indW {14}
96
where VW,add Water volume for a mix with at least one additional component
VW,ref Water volume for the reference mix
i Number of solid components of the reference mix
j Number of additional solid components
fsh,N Component shape factor: 1 for plates, 3 for spheres
mF,N Mass of components
dP,N Particle size
GSP,N Specific gravity of the particle mineral
Table 24 Relative volume of water required for different mix components (Eq. {13})
Component Particle Size (smallest dimension) Relative VW
µm [7, 25, 31, 40, 81] VW,Comp/VW,Cem
Cement 30 1.00
Fine sand aggregate 125 0.28
Coarse sand aggregate 1250 0.03
Dredged material (spheres) 12 2.93
Dredged material (plates) 6 1.95
Kaolin 8 1.46
Illite 3 3.90
Montmorillonite 0.3 39
Similarly, a ratio of the respective water-cement ratios is defined as:
( )( )
ref
add
cw
cw
indW = {15}
where ( )addc
w w/c ratio of a mix with at least one additional component
( )refc
w (experimental) w/c ratio of the reference mix

97
To predict the w/c ratio of a mix containing an additional component (needed to obtain
comparable flow), one may combine Eq. {14} and Eq. {15}:
( ) ( )∑
∑
=
+
=
⋅
⋅⋅=
i
1N N,SPN,P
N,FN,sh
ji
1N N,SPN,P
N,FN,sh
refadd
Gdm
f
Gdm
f
cw
CW {16}
The w/c ratios of mixes with and without filler (dredged material or kaolin) and with
and without superplasticizer (lignosulfonate-based) can be predicted using Eq. {16} and
compared to the actual, measured values as presented (Table 25). The index ref
mix
FlowFlow listed
in the last column of Table 25 is the ratio of the actual flow of a modified mix to that of a
given reference mix. This “flow index” indicates how well the objective of comparable
flow was achieved. Ideally it should always be equal to 1.0.
The results of Table 25 show that the predictions for mixes NF-C2 and NF-D3 with
dredged material are very close to the experimentally determined w/c ratios. It seems that
the assumption of dredged material as a mix of spherical and plate-like particles yields
realistic results, which agrees with the quantitative dominance of sand and silt particles and
the physicochemical prevalence of clay minerals in dredged material. The flow index
exhibits great sensitivity towards changes in the w/c ratio as can clearly be seen in the
reference case NF-C1 and mix NF-D1.
98
In case KF-1 with kaolin as additional component, Eq. {16} suggests a w/c ratio that is
22% below the one determined experimentally. This discrepancy might be caused by the
adsorption of water to the charged surfaces of clay minerals and the capability of particle
agglomerates to confine water in between them. These phenomena contradict the
assumption of similar water film thickness around all particles.
Table 25 Evaluation of w/c-ratios of selected mixes
Mix Filler added Calculated w/c {Eq. 16}
Experimental w/c ref
mix
FlowFlow
Without superplasticizer (assuming similar thickness of water film around particles)
NF-C1 None (reference) - 0.52 1.00
NF-D1 None 0.52 0.54 1.09
30% 1) dredged material (spheres) 0.85
NF-C2 30% 1) dredged material (plates) 0.74
0.75 0.95
30% 1) dredged material (spheres) 0.85
NF-D3 30% 1) dredged material (plates) 0.74
0.81 1.02
KF-1 30% 1) kaolin 0.68 0.88 0.99
With SP-Lig (assuming similar thickness of water film around particles)
NF-D2 None (reference) - 0.42 1.00
30% 1) dredged material (spheres) 0.69
NF-D4 30% 1) dredged material (plates) 0.60
0.69 1.09
KF-2 30% 1) kaolin 0.55 0.58 1.12
1) By mass of cement

99
With the addition of superplasticizer SP-Lig (cases NF-D4 and KF-2), the predicted w/c
ratios are lower than the experimental values. However, if adjustments are made to allow
for the deviation of the flow index from 1.0, Eq. {16} gives even better results. In case of
kaolin as filler, the superplasticizer SP-Lig functions as a deflocculant and surfactant, which
prevents agglomeration and lessens the adsorption of gauging water. These phenomena
become especially obvious in the case of plate-shaped particles with high water adsorption
capacity, such as kaolin. For example, with the addition of SP-Lig the w/c ratio was
reduced by 34% (KF-1 and KF-2), whereas in the reference cases (NF-D1 and NF-D2)
and for mixes with dredged material (NF-D3 and NF-D4) the differences were below 20%.
The ratio of flow according to the Cone Test to the flow determined with the Ring Test
was on average 2.41, with a coefficient of variation of 8.2% (Sections 4.3 and 4.4). The
amount of material in a test sample influences the flow because fine material tends to
adsorb water and to stick to the walls and bottom of the mixing container. With an
increase in batch size it is easier to spread out the fines and to homogenize the mix. This
explains why the w/c ratios determined in prior flow tests (Ring) did not result in
comparable flows for a specific test series.
In conclusion, the addition of clayey components such as dredged material and kaolin
causes a decrease in workability of fresh concrete when compared to that of unmodified
reference mixes. The use of a superplasticizer can improve the workability. Yet, replacing
regular aggregate with untreated natural dredged material causes such drastic decrease in
workability, that even the addition of superplasticizer SP-Mix cannot reduce the w/c ratio
100
to an acceptable level at comparable flow. However, if dredged material or kaolin is added
as a filler, the superplasticizers can reduce w/c ratios while maintaining comparable flow.
The type and dosage of superplasticizer do not only control the flow and workability as
function of the water volume but also affect the homogeneity of the mix and the spreading
of clayey components without agglomeration. The chemical nature of a given
superplasticizer determines if and how strongly it functions as a surfactant or deflocculant
and how it interacts with the individual concrete constituents. Generally, superplasticizers
are much more active if the particle surfaces are charged as it is the case for cement,
(activated) clays, and hydration products. For this reason, it has been suggested to
administer superplasticizers to the fresh concrete about two minutes after the first contact
of cement, clay minerals, and water to increase their effectiveness [73].
The predictions using Eq. 16 were close to the experimentally determined values for
mortars containing dredged material as filler with or without superplasticizer. If kaolin was
added without a superplasticizer, the calculated w/c ratio differed greatly from the actual
value. It is suspected that the adsorption of water on clay surfaces and the agglomeration
of kaolin particles defy the hypothesis of similarly thick water layers. However, if kaolin
and superplasticizer SP-Lig were added to the same mix, Eq. 16 yielded good results.
101
5.2 SETTING AND HYDRATION
It was experienced that samples containing natural dredged material were slower to set and
hydrate than reference samples without dredged material. When more than 15% fine sand
(by mass of aggregate) were replaced with dredged material, samples did not sufficiently
harden to be safely removed from their forms within the first 24 hours. Similarly, samples
that contained natural dredged material as filler needed to remain in their forms for three
days after the lignosulfonate-based superplasticizer was added to the mix (see Section 4.4).
There are several hypotheses on how various substances affect cement hydration. Organic
contaminants as well as heavy metals, such as lead and zinc, may cause retardation or
delayed setting [63]. Although such contaminants may be present in dredged material, it is
believed that the high adsorption capacity of clay minerals is the main cause for the delayed
setting, which was observed for samples with untreated dredged material or with natural
kaolin during the Vicat test when compared to the reference mix without any clayey
constituents (see Section 4.3, Table 19).
Due to the high adsorption capacity of clay minerals, a large fraction of the gauging water
is bound to the surfaces of the fine clay particles and thus, is not freely available for
hydration. With the hydration process continuing, the accessible water diminishes and the
chemical system becomes unbalanced, because there is an insufficient water supply for the
cement to hydrate further. The forces to restore chemical equilibrium increase and at some
point exceed the adsorptive forces, that bind the water to the clay particles. As a result,
102
water is partially released from the clay surfaces and thereby becoming available for cement
hydration. This process slows down the cement hydration and therefore, the addition of
fine particles with high adsorption capacities increases the setting time.
The fine particles of treated dredged material or metakaolin have much lower water
adsorption capacities than their natural counterparts [29]. Therefore the setting time is
barely affected if treated dredged material is added to a mix. However, metakaolin actively
participates in the cement hydration. The activated alumino-silicates accelerate this process
because of their surfaces charges, thereby reducing the setting time (see Section 4.3).
The similarities in their chemical compositions suggest that the hydration products of
cement and those of (activated) clay minerals are comparable. Optical and scanning
electron microscopy (SEM) studies were conducted to verify this assumption. After
determining the 28-day compression strength, small samples were cut from cylindrical
specimens, which contained various amounts of dredged material, kaolin, and/or
metakaolin (Test Series NK and NM). The samples were then polished and coated with
gold for SEM observations.
One of the reasons why clayey components are commonly considered harmful for
concrete products is their tendency to agglomerate and capability of swelling. Figure 29
illustrates an inhomogeneous structure caused by kaolinite clusters, which do not
participate in any hydration process. The picture was taken from Reference [40] as such
agglomerates were not found during the present study.

103
Figure 29 Optical microscope observation [40]: Poor consolidation and spreading of kaolin
Left) Original image
Right) Highlighted areas represent (some) agglomerates of kaolin particles
It is crucial to spread out the clay minerals during the mixing process without allowing the
formation of any such particle agglomeration. The addition of a superplasticizer generally
facilitates the homogenous distribution of fine particles. It can be seen in Figure 30 that the
(micro-) structures of the various mixes look very similar, show no agglomeration, and in
all cases the aggregate is closely embedded in the cement-clay matrix.
The SEM micrographs of Figure 31 suggest that it should be feasible to use clayey
constituents in concrete applications. No irregularities in the inter-particle transition zone
could be detected (Figure 31 a, b) and the structure and growth of hydration products in
the reference and the clay modified concrete exhibited a great degree of similarity in the
two cases (Figure 31 c, d).
104
Figure 30 Optical microscope observation, magnification 4x
a) Reference sample without any filler (NK-1), unpolished and uncoated surface
b) Sample with 30% dredged material (by mass of cement) as filler (NM-1),
c) Sample with 30% kaolin (by mass of cement) as filler (NK-2), polished
d) Sample with 30% metakaolin (by mass of cement) as filler (NM-5),
b, c, d) polished and gold-coated surface
a) b)
c) d)

105
Figure 31 Scanning electron microscope observation, polished and gold-coated surfaces
a) Sample with 22.5% kaolin and 7.5% dredged material (by mass of cement)
as fillers (NK-2), Magnification 100x
b) Sample with 22.5% kaolin and 7.5% dredged material (by mass of cement)
as fillers (NK-2), Magnification 1000x,
c) Sample with 22.5% kaolin and 7.5% dredged material (by mass of cement)
as fillers (NK-2), Magnification 5,000x
d) Reference sample without any fillers (NK-1), Magnification 5,000x
It can be concluded that the setting time was affected by clayey components, but the
hydration process resulted in similar end products after 28 days. It is important to
differentiate between setting and hydration when specific concrete applications are
planned; i.e. the mix design has to be adjusted accordingly, such as meeting requirements
a) b)
c) d)
106
for earliest and latest time for unmolding. The (micro-) structures of all examined samples
were homogeneous and similar to each other without any major inclusions of clay
agglomerates, especially when superplasticizers were used.
5.3 STRENGTH
Figure 28 (in Section 5.1) illustrates the opposing effects of the w/c ratio on the flow
of fresh mixes and the strength of hardened concrete. It appears to be impossible to
optimize these two properties simultaneously. Therefore the mix design either requires a
compromise or favors one of the two criteria. Traditionally, this would be the compressive
strength, while in this work it is comparable flow. Thus, once the mix proportions have
been determined according to workability requirements, the compressive strength and all
other performance characteristics follow. In the first test series, natural untreated dredged
material replaced fine sand aggregate. The compressive strength of samples containing
dredged material as replacement decreases drastically with the amount of material added.
Although this strength reduction suggests an alternative use of dredged material, i.e. as a
filler, the results for aggregate replacement provide some interesting information.
For a given amount of natural dredged material, the administration of superplasticizer
SP-Mix decreased the w/c ratios necessary to maintain comparable flow (Test Series RN-B
and RN-C). The 7-day strengths increased for all samples with lower w/c ratio, but the
28-day strengths were barely effected. It is suspected that the superplasticizer functions as a
surfactant and deflocculant and thereby increases the activity of the mix. This phenomenon

107
is only effective in the early stage of the hardening process while the long-term behavior is
influenced by the release of initially adsorbed water (see Section 5.2). Therefore it can be
expected that the 28-day compressive strength is comparable for cases with or without
superplasticizer.
After the first experience with dredged material as aggregate replacement, it was suggested
to use it as a filler and compare its performance with that of samples modified with
kaolinite. The compressive strength of concrete specimens seems to decrease when clayey
fillers are added to the composition. This may be partially related to increased w/c ratios,
dilution effects, or scatter of test results. Following Abram’s rule, the compressive strength
fc can be expressed as a function of the w/c ratio [42]:
C
W
2
1
)K(
Kcf = {17}
where K1 and K2 are empirical constants.
Equation {17} does not take into account the influence of additional components such as
clayey fillers. In case of the 28-day compressive strength, the constants were calibrated
using average values of the cases without fillers (see Sections 4.3 and 4.4). K1 = 160 and
K2 = 16 were calculated for cylindrical specimens and K1
= 180 and K2 = 15 for cubes.
Using these values in Eq. {17} the strengths of selected mixes containing kaolin and
dredged material as filler can be estimated (Table 26).
108
With the introduction of fillers the relative amount of cement per unit volume decreases.
This dilution effect of additional components affects the compressive strength fc and can
be addressed with a modification of Feret’s law as suggested in Reference [29]:
2
3 WFCFCKcf
+++= {18}
where K3 (empirical) constant
C, F, W Volumes of cement, filler, and water, respectively
The constant in this formula was determined to be K3 = 250 for cylinders and K3
= 280 for
cubes, using the average 28-day compressive strength of the cases where the reference
concrete mixes were used without any modifications (see Sections 4.3 and 4.4). With
these values, the strength conversions were calculated using to Eq. {18} and included in
Table 26 for the same selected cases as for the evaluation of Abram’s rule.
From the data of Table 26, the following observations can be made. Feret’s rule generates
higher values than the experimentally determined strengths. It converts the strength of a
diluted system (with an additional component, e.g. a filler) to that of a reference mix without
any filler so that it is expected to yield higher strengths. Abram’s rule leads to values that
are generally lower than the measured compressive strengths but the difference becomes
smaller with decreasing w/c ratio. Mix NF-D4 defies this trend but it was most drastically
affected by the retardation experienced when the lignosulfonate-based superplasticizer was
used (see Section 4.4). It seems that Eq. {17} and Eq. {18} establish a strength envelope
with Abram’s rule formulating the lower bound and Feret’s rule defining the upper limit
(Figure 32).

109
Table 26 Conversion of 28-day compressive strength (using Eq. {17} and {18})
Cylinder strength Cube strength
Mix Filler 1) SP 1) w/c Measured Feret Abram Measured Feret Abram
NF-D1 None (reference) - 0.54 36 35 36 42 41 42
NF-D3 30% dredged material - 0.81 29 35 17 31 41 20
NF-D4 30% dredged material Lig 1.0% 0.69 30 43 24 25 50 28
NF-D5 30% dredged material FC 1.0% 0.56 32 54 34 35 63 40
NM-1 30% dredged material Mix 1.5% 0.66 34 45 26 37 53 30
KF-1 30% kaolin - 0.88 24 32 14 27 37 17
KF-2 30% kaolin Lig 1.0% 0.58 35 52 32 43 61 37
KF-3 30% kaolin FC 1.0% 0.54 34 56 36 35 66 42
NK-2 30% kaolin Mix 1.5% 0.63 40 48 28 46 55 33
1) By mass of cement
The influence of sample shape and size has been subject of extensive research, and it
is known that the compressive strength decreases with smaller specimen size. This is
commonly explained with the higher degree of statistical homogeneity for large specimens
than for small ones [42, 50]. The strength also decreases with increasing specimen height-
to-width ratio [42].
110
0
10
20
30
40
50
60
70
NF-D1 KF-1 NF-D3 NF-D4 NM-1 NK-2 KF-2 NF-D5 KF-3
Stre
ngth
in M
Pa
Measured (Cylinder) Feret (Cylinder) Abram (Cylinder) Measured (Cube) Feret (Cube) Abram (Cube)
Decreasing w/c ratio
Figure 32 Conversion of the 28-day compressive strength of selected mixes using Feret’s rule
for dilution and Abram’s rule for different w/c ratios
The results presented in this work indicate that there is no strong correlation between
compressive strengths of one-inch cylinders and two-inch cubes of the same batch, as one
would expect (compare Test Series NK and NM). On average, the ratio of cube strength
to cylinder strength was 1.16 (see Sections 4.3 and 4.4), a value that agrees with previous
findings [42, 50]. The coefficient of variation was 15.5%, while differences from the
mean value were as high as 40%. For cube samples that had to be unmolded prematurely
(see Section 4.4) or cylindrical specimens with major surface imperfections, such
discrepancies are to be expected.

111
The addition of kaolin as filler led to a decrease in workability as anticipated. Previous
findings reported a reduction in compressive strength of 40 to 45% when clayey
components such as natural kaolin or illite were added to reference mixes [29, 47]. Possible
reasons for such great strength decrease are the poor workability, caused by the adsorption
of gauging water on the surfaces of clay minerals, and the agglomeration of clay particles,
which decreases the degree of homogenization.
Moukwa [47] reported an increase in compressive toughness when clays are added to
concrete, which he explained with a reduction in the volume of pores. Another possible
reason is the homogenization of the (micro-) structure, which would reduce the degree
of anisotropy and improve ductility.
Similarly, one could expect that the tensile strength increases with the addition of clay
minerals as it was observed when dredged material had been added as filler. It was found
herein that the density decreases with the addition of kaolin (Table 27). The combined
addition of filler and superplasticizers SP-Lig and SP-Mix could prevent this reduction and
as a result the compressive strength was much higher. Similarly, the compressive strength
and density of samples containing dredged material could greatly be improved with the
addition of superplasticizer SP-Mix and partially with SP-FC.
112
Table 27 Relative 28-day compressive strengths of mixes with dredged material or kaolin as filler
Cylinder Cylinder strength Cube strength
Mix Filler 30% 1) SP 1) w/c Density
in g/cm3 fc
in MPa Ratio
fc,add / fc,ref fc
in MPa Ratio
fc,add / fc,ref
NF-D1 None (reference) - 0.54 2.151 35.5 1.00 41.6 1.00
NF-D3 Dredged material - 0.81 2.003 28.8 0.81 31.1 0.75
NF-D4 Dredged material
SP-Lig 1.0% 0.69 2.045 29.9 0.84 25.1 0.60
NF-D5 Dredged material
SP-FC 1.0% 0.56 2.046 32.1 0.90 35.3 0.85
NM-1 Dredged material
Mix 1.5% 0.66 2.057 34.1 0.96 37.3 0.90
KF-1 Kaolin - 0.88 1.939 23.6 0.66 27.0 0.65
KF-2 Kaolin SP-Lig 1.0% 0.58 2.138 34.5 0.97 42.9 1.03
KF-3 Kaolin SP-FC 1.0% 0.54 2.055 34.4 0.97 35 0.84
NK-2 Kaolin SP-Mix 1.5% 0.63 2.133 40.3 1.14 45.7 1.10
1) By mass of cement
In sum, the use of dredged material as replacement for regular sand aggregate is only
recommended for low-end applications, because of the associated concrete strength
reduction. The use of dredged material as filler yielded more promising results, although
the compressive strength generally decreased with the addition of untreated clayey
constituents. Previous research focussed mainly on the replacement of cement by
(pozzolanic) fillers and/or the optimum activation process for a specific mineral admixture.
In this work the beneficial use of thermally activated kaolinite was confirmed.

113
It was shown that also the prior CUT treatment of dredged material led to better results
than when natural untreated dredged material was used as filler. However, it was one of the
objectives of this work to study the behavior of concrete modified with clayey components
as inert filler. A pozzolanic contribution of untreated dredged material or kaolin was not
expected, therefore none of these components were used as partial cement replacement.
The right combination of certain fillers and appropriate superplasticizers seems to give an
optimum concrete composition with superior properties in comparison to those of a
reference mix without any filler. For example, the homogeneity, coherence, and also the
tensile strength could be improved with the addition of natural dredged material as filler.
The compressive strengths of reference mixes without any filler and mixes modified with
dredged material or kaolin were comparably high when the concrete was optimized with
a superplasticizer. Since the amount of cement per unit volume decreases by about 7%
when 30% (by mass of cement) filler is used, the beneficial role that dredged material and
kaolin can play as filler becomes obvious. However, the relatively large statistical scatter of
test results suggests further studies to substantiate these claims.
5.4 DURABILITY
The durability of concrete incorporating clayey materials such as kaolin or dredged material
is a very complex matter. The clay minerals are associated with decrease in workability by
adsorbing gauging water, with increased porosity if their network structure remains intact
during the mixing and placing of concrete, and with poor durability because clay lumps
114
may cause structural damage or even pop-outs by swelling [18, 42, 50]. In addition,
(organic) contaminants in dredged material may affect the concrete performance. It is
therefore crucial to take a closer look at the durability performance of modified concrete.
As shown in Section 5.2, the homogeneity of concrete and its structural integrity is barely
affected, whether it contains various amounts of dredged material and/or kaolin as filler or
not. The clayey constituents are very well spread throughout the matrix. Thorough mixing
and the addition of an appropriate superplasticizer could prevent (harmful) agglomerations
of fine particles. While it is common to reduce the role of one specific concrete admixture
to only one property, the importance of the superplasticizer has to be highlighted with
respect to durability. It was found that the addition of the appropriate superplasticizer:
• Reduces the amount of water required to maintain comparable flow,
• Prevents the agglomeration of fine particles,
• Accelerates the hardening process and enhance the hydration products
by actively interacting with clayey components,
• Eases the homogenous spreading of clay minerals resulting in a lower
degree of anisotropy and improved durability.
It was not within the scope of this work to perform a full-fledged evaluation of the
durability properties of concrete containing clay minerals. However, as a preliminary
indicator, the compressive strengths of one-inch cylinders of selected mixes with or
without dredged material were determined at ages up to 150 days. None of the samples
exhibited irregular behavior and the strength increased steadily with time. In none of the
115
mixes tested in the rain chamber for more than 100 days any surface damage was observed
nor was a decrease in 148-day compressive strength experienced. Thus, all samples passed
these first criteria for durability.
The ASTM C1260 test results showed that all samples could be considered innocuous with
respect to ASR. During the autoclave test the reference sample without any filler exhibited
higher expansion than the samples containing natural or treated dredged material or kaolin.
It can be concluded that none of the clayey constituents contribute to the alkali-silica
reactivity but rather improve the performance of a given reference mix. It is recommended
to test modified concrete compositions for additional durability aspects, such as freeze-
thaw behavior and chemical resistance to sulfates, chlorides, etc.
116
6 CONCLUSIONS AND OUTLOOK
The main components of the concrete matrix are the products of the cement hydration.
While water and cement alone suffice to form a stable matrix that glues together the
aggregate particles, additional components can alter the matrix significantly. Admixtures
such as retarders, superplasticizers, pozzolanic or inert fillers have been established as
valuable tools to improve specific matrix properties and are widely used in concrete
practice, whereas naturally occurring clays are considered harmful unless they are
(thermally) activated.
Dredged material consists to a large extent of clays, can be contaminated with heavy
metals and/or organic components, and has a high salt content due to the original marine
environment. Typical clay minerals are illite, kaolin, and montmorillonite, with kaolin being
a “perfect model” to study clay mineral behavior because it has a high adsorption capacity
and is initially inert but can be thermally activated.
Conventional wisdom discourages the use of material containing clays, salts, and (organic)
contaminants for concrete production. As all of these might be found in dredged material,
it was one objective of this work to investigate the influence of clay minerals on the

117
properties of fresh and hardened concrete. The similarities of clays in dredged material and
naturally occurring clays make it useful to perform a comparative analysis of concrete
modified with either dredged material or kaolin.
Four basic questions were raised in Chapter 1 to define the objectives of the research
described herein. The following paragraphs summarize the major findings, such as to
provide answers to those questions.
1. Why are clay minerals considered harmful for concrete production? How are the properties
of the concrete matrix affected by clayey components?
The workability was expected to be one of the major problems caused by the addition of
clay minerals to concrete mixes. Due to their high adsorption capacity clays decrease the
plasticity of fresh concrete, which can only be compensated for by additional gauging
water. As a result, the strength is expected to decrease. With the addition of
superplasticizers comparable workability can be achieved with lower w/c ratios. It was
attempted to formulate a relationship between particle size of the individual components
and the water volume required to maintain sufficient flow (Equation {16}). After a first
evaluation, the following conclusions can be drawn:
• Once the amount of gauging water has been determined experimentally for a
reference mix, it is possible to calculate the amount of water needed if one or
more additional components are added to the mix. Equation {16} permits
118
relatively accurate predictions of the water required for compact-grained
components such as sand, dredged material, and cement.
• The tendency of kaolin particles to agglomerate and their high adsorption
capacity defy the basic assumption of similar water film thickness around each
particle. The predicted w/c ratios are generally too low in this case.
• Equation {16} yields much better results when kaolin is used as a filler in
combination with a lignosulfonate-based superplasticizer. It is suspected that
the superplasticizer functions as a deflocculant preventing agglomeration of
fine particles and as a surfactant resulting in similar water film thickness. This
assumption is supported by optical and scanning electron microscopy
observations, which identified homogenous (micro-) structures without any
major inclusions of agglomerated clay minerals.
• If agglomeration of clayey particles can be avoided, for example by using a
superplasticizer, it seems possible to predict the required w/c ratio for any
given mix composition for preliminary purposes.
Another major concern associated with clay minerals is the concrete durability. The high
water adsorption capacities, large specific surface areas, and surface charges cause strong
interaction between individual particles, which therefore tend to agglomerate and bind
gauging water to their surfaces. If such agglomerations include clay minerals capable of
swelling, as in the case of montmorillonite, the volumetric changes upon wetting and
drying can cause structural damage, such as pop-outs or disintegration of the concrete
matrix.

119
In general, inclusions of particle clusters cause a drastic decrease in homogeneity, thereby
introducing areas of lower material quality. The possibility of failure within these weak links
affects primarily the durability of concrete modified with clay minerals but also influences
the compressive strength and possibly other mechanical properties as well.
2. Under what circumstances is it possible to incorporate clayey materials into concrete mixes
without experiencing negative effects?
As one could expect, the workability of concrete mixes with constant w/c ratio decreases
with increasing contents of natural untreated dredged material as replacement for
sand aggregate. If the flow (as a measure of workability) is held constant by adding
supplementary gauging water and/or superplasticizer, the compressive strength of samples
decreases in proportion to the replacement level. The workability decreases when either
untreated or treated dredged material is used as filler. The addition of 30% treated dredged
material as filler (by mass of cement), which is equivalent to 7% by mass of concrete seems
to be the upper limit, beyond which the reduction of strength becomes unacceptable. This
value was therefore chosen for most of the subsequent experiments in this study that
involved clay minerals or dredged material as filler.
When concrete is modified with natural dredged material and kaolin at a combined content
of 30% by mass of cement, strength and w/c ratio needed for constant flow show only
little variation. The interaction between a blended superplasticizer and metakaolin allow a
120
drastic reduction of the w/c ratio because of the charged particle surfaces. Combined with
the known pozzolanic contribution of the thermally activated clay, this effect results in very
high compressive strength of samples with increasing metakaolin/dredged material ratio.
The use of an appropriate superplasticizer is necessary to improve concrete properties if
clayey constituents are used as fillers in a given composition. Without the addition of such
superplasticizers either the workability decreases drastically, if no additional water is added,
or the compressive is lowered, if the w/c ratio is increased to maintain comparable flow. A
reasonable tradeoff between these two major concrete properties may still qualify concrete
modified with untreated dredged material or natural kaolin for low-end applications. The
addition of a superplasticizer will broaden the range of potential uses for such material.
Formaldehyde-based or blended superplasticizers seem to deflocculate clayey particles and
thus, improve the homogenous spreading of such components throughout the cement
matrix. They were found to be the key to a successful, i.e. beneficial modification
of concrete with dredged material or natural clays because such superplasticizers can
overcome the high adsorption capacities and tendencies to form agglomerates of the
clayey components. A melamine-based superplasticizer failed to plasticize concrete
containing dredged material or kaolin sufficiently. The addition of a lignosulfonate-based
superplasticizer to concrete with natural dredged material as filler permitted a reduction of
the w/c ratio but retarded the hydration. In addition, large quantities of lignosulfonate
increased the porosity of mortar samples. The strength development was thereby impaired.
This is the reason why other superplasticizers are preferred.

121
3. Is it possible to use dredged material as a concrete constituent, either as a replacement of
fine aggregate or as a filler?
The replacement of regular sand aggregate with natural untreated dredged material causes
either a drastic drop in compressive strength or in workability. Even the addition of a
superplasticizer or high-range water reducer does not permit a reasonable compromise
between required flow and adequate strength. The use of dredged material as filler seems to
be more promising. The addition of up to 30M% (with respect to cement) of treated
dredged material yields acceptable compressive strength at sufficiently high flow. In case of
untreated dredged material, adding a superplasticizer can reduce the excessive loss of
strength, but the performance of treated dredged material as filler was found to be better.
Although crystal defects and surface charges of clay minerals in dredged material suggest a
high reactivity, no evidence of a pozzolanic contribution of dredged material was found.
4. Is it possible to improve certain concrete properties by incorporating dredged material into
the mix, and what treatment methods are necessary to optimize such beneficial effects?
The addition of dredged material or kaolin to fresh concrete prevents segregation and
bleeding and increases the degree of homogeneity. The mixes appear to be more coherent.
Similarly, a lower degree of anisotropy is experienced for mixes incorporating dredged
material in comparison to the reference case without any filler.
122
The Columbia University Treatment (CUT) of dredged material improves the performance
of such material as a filler in concrete applications. The workability and compressive
strength of concrete containing such treated dredged material do not decrease as much as
in the case of untreated dredged material. The treatment homogenizes the material and
changes its physico-chemical properties, such as surface charge, thereby partially activating
the dredged material. Its addition as a filler to concrete mixes without any superplasticizer
does not increase the setting time, whereas untreated material causes a 60% delay. If the
time until unmolding is a mix design criterion, a prior treatment of dredged material may
be imperative. The variation of dredged material properties is expected to decrease with the
CUT treatment. Therefore, it should be easier to accurately predict or adjust material
characteristics of concrete modified with treated dredged material than in the case when
untreated material is added to the mix.
The durability of concrete modified with clayey components has not yet been completely
evaluated. Tested samples containing treated or untreated dredged material or kaolin
passed the preliminary tests, i.e. determination of compressive strength at higher ages,
exposure to artificial rain for over 100 days, leaching test, and alkali-silica reactivity tests
according to the ASTM C1260 protocol and an autoclave procedure.
Cement is often used to stabilize and immobilize contaminated soils, and it was therefore
no surprise that only traces of heavy metals leached out of mortar samples. It has to be
stressed that proper homogenization is required to ensure that the contaminants remain
encapsulated during the entire service-life through the demolition of a concrete member.

123
The beneficial reuse of dredged material, which is classified as hazardous waste, contributes
to the environmentally friendliness of concrete. In this work, 30% filler by mass of cement
was added to the mix, which reduced the amount of cement per unit volume of concrete
by about 7%. Since cement is the component of concrete, which poses the greatest
environmental challenges, such a reduction in demand for cement is significant.
The use of dredged material as aggregate replacement is problematic, even though its
disposal by other means is costly. However, if added to concrete as a filler, dredged
material may become a valuable resource. The amount of filler can be adjusted to meet any
given requirement. Although it may be desirable to use as much dredged material as
possible, the concrete performance needs to remain acceptable. This typically requires a
compromise between sufficient workability and compressive strength, both linked through
the w/c ratio. One solution might be to limit concrete containing relatively large amounts
of dredged material to low-end applications, such as base material for road construction. A
thorough economic and logistical study on a larger scale (demonstration or pilot project) is
needed to show the feasibility of using dredged material and other clayey constituents for
concrete production. Although the remaining durability issues, e.g., chemical resistance and
freeze-thaw performance, need to be addressed, it is believed that both, dredged material
and natural clays can be used beneficially in concrete production, provided the mix design
is optimized with an appropriate superplasticizer.
124
7 BIBLIOGRAPHY
[1] AÏTCIN, P.-C.: Review: Cements of Yesterday and Today, Concrete of Tomorrow. Cement and Concrete Research, Volume 30, 2000, Pages 1349-1359.
[2] AÏTCIN, P.-C., S.L. SARKAR, AND Y. DIATTA: Microstructural Study of Different Types of Very High Strength Concretes. In L.J. STRUBLE AND P.W. BROWN: Microstructural Development During Hydration of Cement, Material Research Society Symposia Proceedings Volume 85, Pittsburgh, 1987.
[3] ASHAPURA GROUP: Products – Bentonite. http://www.ashapura.com (webpage).
[4] AMERICAN SOCIETY FOR TESTING AND MATERIALS (ASTM): Annual Book of ASTM Standards, Section 4: Construction, Vol. 04.01: Cement; Lime; Gypsum. ASTM, Philadelphia, 1998.
[5] AMERICAN SOCIETY FOR TESTING AND MATERIALS (ASTM): Annual Book of ASTM Standards, Section 4: Construction, Vol. 04.02: Concrete and Aggregates. ASTM, Philadelphia, 1998.
[6] AMERICAN SOCIETY FOR TESTING AND MATERIALS (ASTM): Annual Book of ASTM Standards, Section 4: Construction, Vol. 04.05: Chemical-Resistant Materials; Vitrified Clay, Concrete, Fiber-Cement Products; Mortars; Masonry. ASTM, Philadelphia, 1998.

125
[7] BOUGUERRA, A., A. LEDHEM, F. DE BARQUIN, R.M. DHEILLY, AND M. QUÉNEUDEC: Effect of Microstructure on the Mechanical and Thermal Properties of Lightweight Concrete Prepared from Clay, Cement, and Wood Aggregates. Cement & Concrete Research, Volume 28, Issue 8, 1998, Pages 1179-1190.
[8] CHAN, SAMMY Y.N. AND XIHUANG JI: Comparative Study of the Initial Surface Absorption and Chloride Diffusion of High Performance Zeolite, Silica Fume and PFA Concretes. Cement & Concrete Composites, Volume 21, 1999, Pages 293-300.
[9] CHAN, W.W.J. AND C.M.L. WU: Durability of Concrete with High Cement Replacement. Cement & Concrete Research, Volume 30, 2000, Pages 865-879.
[10] CHANDRA, S. AND J. BJÖRNSTRÖM: Influence of Cement and Superplasticizers Type and Dosage on the Fluidity of Cement Mortars – Parts 1 and 2. Cement & Concrete Research, Volume 32, 2002, Pages 1605-1619.
[11] CHOI, HEE-YONG, HEY-ZOO HWANG, MOO-HAN KIM, AND MOON-HAN
KIM: Activating Temperature of Kaolin as a Cement Admixture. KCI Concrete Journal, Volume 13, Issue 1, 2001, Pages 3-9.
[12] COLLOIDAL DYNAMICS: The Clay Minerals. http://www.colloidal-dynamics.com (webpage).
[13] DE CARVALHO, A.J.F., A.A.S. CURVELO, AND J.A.M. AGNELLI: A First Insight on Composites of Thermoplastic Starch and Kaolin. Carbohydrate Polymers, Volume 45, 2001, Pages 189-194.
[14] DETWILER, RACHEL J., JAVED I. BHATTY, GREGORY BARGER, AND ERIC R. HANSEN: Durability of Concrete Containing Calcined Clay. Concrete International, Volume 23, Issue 4, 2001, Pages 43-37.
[15] EL-DIDAMONY, H., K.A. KHALIL, AND M.S. EL-ATTAR: Physicochemical Characteristics of Fired Clay-Limestone Mixes. Cement & Concrete Research, Volume 30, 2000, Pages 7-11.
126
[16] DING, J.-T. AND Z. LI: Effects of Metakaolin and Silica Fume on Properties of Concrete. ACI Materials Journals, Volume 99, Issue 4, 2002, Pages 393-398.
[17] DING, JIAN, YAN FU, AND J.J. BEAUDOIN: Effect of Different Zeolites on Conversion-Prevention in High-Alumina-Cement Products. ACI Materials Journal, Volume 95, Issue 3, 1997, Pages 220-226.
[18] DOLAR-MANTUANI, LUDMILA: Handbook of Concrete Aggregates, A Petrographic and Technical Evaluation. Noyes Publications, Park Ridge, New Jersey, 1983.
[19] DYCKERHOFF AG: Concrete Design: Technical Data from the Field for Field Applications. Author’s Edition, Wiesbaden, Germany, 4th Edition 1994 (in German).
[20] FAM, M.A. AND J.C. SANTAMARINA: Study of Clay-Cement Slurries with Mechanical and Electromagnetic Waves. Journal of Geotechnical Engnieering, Volume 122, Issue 5, 1996, Pages 365-373.
[21] FARDIS, M., G. PAPAVASSILIOU, L. ABULNASR, L. MILJKOVIC, R.J. RUMM, F. MILIA, E. CHANIOTAKIS, AND D. FRANGOULIS: Effect of Clay Minerals on the Hydration of Cement – A NMR Study. Advanced Cement Based Materials, Issue 1, 1994, Pages 243-247.
[22] FRÍAS, MOISÉS AND JOSEPH CABRERA: Pore Size Distribution and Degree of Hydration of Metakaolin-Cement Pastes. Cement & Concrete Research, Volume 30, 2000, Pages 561-569.
[23] FRÍAS, M., M.I. SÁNCHEZ DE ROJAS, AND J. CABRERA: The Effect that the Pozzolanic Reaction of Metakaolin has on the Heat Evolution in Metakaolin-Cement Mortars. Cement & Concrete Research, Volume 30, 2000, Pages 209-216.
[24] FULLER, WILLIAM B. AND SANFORD E. THOMPSON: The Laws of Proportioning Concrete. Transactions of the American Society of Civil Engineers (ASCE), Paper No. 1053, 1907, Pages 67-172.

127
[25] GILLIOT, JACK E.: Clay in Engineering Geology. Developments in Geotechnical Engineering 41. Elsevier, New York, 1987.
[26] GLASSER, F.P., S. DIAMOND, AND D.M. ROY: Hydration Reactions in Cement Pastes Incorporating Fly Ash and Other Pozzolanic Materials. In: LESLIE J. STRUBLE AND PAUL W. BROWN (EDITORS): Microstructural Development During Hydration of Cement, Symposium Held December 2-4, 1986, Boston, Massachusetts, U.S.A. Materials Research Society Symposia Proceedings Volume 85, MRS, Pittsburgh, Pennsylvania, 1987, Pages 167-186.
[27] GRUBER, K.A., T. RAMLOCHAN, A. BODDY, R.D. HOOTON, AND M.D.A. THOMAS: Increasing Concrete Durability with High-Reactivity Metakaolin. Cement & Concrete Composites, Volume 23, 2001, Pages 479-484.
[28] HANSEATEN-STEIN ZIEGELEI GMBH, FREIE UND HANSESTADT HAMBURG, WIRTSCHAFTSBEHÖRDE, STROM- UND HAFENBAU: Bricks Made of Dredged Material – A Pilot Plant. Author’s Edition, Hamburg, Germany, 1997.
[29] HE, CHANGLING, BJARNE OSBÆCK, AND EMIL MAKOVICKY: Pozzolanic Reactions of Six Principal Clay Minerals: Activation, Reactivity Assessments and Technological Effects. Cement & Concrete Research, Volume 25, Issue 8, 1995, Pages 1691-1702.
[30] HOHBERG, I., G.J. DE GROOT, A.M.H. VAN DER VEEN, AND W. WASSING: Development of a Leaching Protocol for Concrete. Waste Management, Volume 20, Issue 2-3, 2000, Pages 177-184.
[31] HOLTZ, ROBERT D. AND WILLIAM D. KOVACS: An Introduction to Geotechnical Engineering. Prentice Hall, Englewood Cliffs, New Jersey, 1981.
[32] KHATIB, J. M. AND S. WILD: Sulphate Resistance of Metakaolin Mortar. Cement & Concrete Research, Volume 28, Issue 1, 1998, Pages 83-92.
[33] KERN, EDGAR: Technology of High-Strength Concrete: Applications and Examples. Special Reprint of Beton, Volume 43, Issue 3, Betonverlag, Düsseldorf, Germany, 1993 (in German).
128
[34] KESSLER, HANS-GERT: Spherical Modeling of Concrete with Discontinuous Aggregate Grading. Betonwerk + Fertigteil-Technik, Volume 60, Issue 11, 1994, Pages 63-76 (in German).
[35] KÖNIG, GERT, FRANK DEHN, AND ANGELIKA SICKER: Bright High Performance Concrete Based on Metakaolin. Beton, Volume 51, Issue 3, 2001, Pages 124-129 (in German).
[36] KOZLOVA, S., K. MILLRATH, C. MEYER, AND S. SHIMANOVICH: A Suggested Screening Test for ASR in Cement-Bound Composites Containing Glass Aggregate Based on Autoclaving. Cement & Concrete Composites, Submitted for publication.
[37] KOZLOVA, S., S. SHIMANOVICH, AND C. MEYER: Method of Treatment of Dredged Material for Beneficial Use. U.S. Patent Application No. PCT/US02/ 08109, March, 2001.
[38] KOSMATKA, STEVEN H., AND WILLIAM C. PANARESE: Design and Control of Concrete Mixtures. 13th Edition, Portland Cement Association, Skokie, IL, 1994.
[39] KRELL, JÜRGEN: The Plasticity of Cement Paste, Mortar, and Concrete and its Dependence on Time. Schriftenreihe der Zementindustrie, Heft 46, Verlag Bau + Technik, Düsseldorf, Germany, 1985 (in German).
[40] LONG, DARREL G. F.: Cretaceous fluvial strata in the Moose River Basin of Ontario, Canada, as a source of kaolin for paper and ceramic industries. Applied Clay Science, Volume 16, Issues 1-2, 2000, Pages 97-115.
[41] MALHOTRA, S. K. AND N.G. DAVE: Investigations into the Effect of Addition of Flyash and Burnt Clay Pozzolana on Certain Engineering Properties of Cement Composites. Cement & Concrete Composites, Volume 21, 1999, Pages 285-291.
[42] METHA, P. KUMAR AND PAULO J.M. MONTEIRO: Concrete: Structure, Properties and Materials. Prentice Hall, New Jersey, NJ, Second Edition 1993.
[43] MILLRATH, K., S. KOZLOVA, S. SHIMANOVICH, AND C. MEYER. Beneficial Use of Dredge Material, Progress Report. Columbia University, New York, NY, 2001.

129
[44] MILLRATH, K., S. KOZLOVA, S. SHIMANOVICH, AND C. MEYER. Beneficial Use of Dredged Material 2, Second Progress Report. Columbia University, New York, NY, 2001.
[45] MILLRATH, K., S. KOZLOVA, C. MEYER, AND S. SHIMANOVICH. New Approach to Beneficiation of Dredged Material as a Filler. World Dredging (Mining & Construction), Volume 37, Issue 11, 2001, Pages 8-20.
[46] MILLRATH, K., S. KOZLOVA, C. MEYER, AND S. SHIMANOVICH: New Approach To Treating The Soft Clay, Silt Fraction Of Dredged Material. In: Proceedings of the Third Specialty Conference on Dredging and Dredged Material Disposal - Dredging ’02, Orlando, FL, May 2002, Article in press.
[47] MOUKWA, M.: Effect of Clays on Fracture Properties of Cement-Bases Materials. Cement & Concrete Research, Volume 23, 1993, Pages 711-723.
[48] MOULIN, E., P. BLANC, AND D. SORRENTINO: Influence on Key Cement Chemical Parameters on the Properties of Metakaolin Blended Cements. Cement & Concrete Composites, Volume 23, 2001, Pages 463-469.
[49] MROUEH, U.-M., P. ESKOLA, AND J. LAINE-YLIJOKI: Life-Cycle Impacts Of The Use Of Industrial By-Products In Road And Earth Construction. Waste Management, Vol. 21, 2001, Pages 271-277.
[50] NEVILLE, A.M.: Properties of Concrete. John Wiley & Sons, New York, New York, Fourth Edition 1997.
[51] O’FARRELL, M., S. WILD, AND B.B. SABIR: Pore Size Distribution and Compressive Strength of Waste Clay Brick Mortar. Cement & Concrete Composites, Volume 23, 2001, Pages 81-91.
[52] PANAYOTOVA, M.I.: Kinetics and Thermodynamics of Copper Ions Removal from Wastewater by Use of Zeolite. Waste Management, Volume 21, 2001, Pages 671-676.
130
[53] PERSSON, BERTIL: Hydration and Strength of High Performance Concrete. Advanced Cement Based Materials, Volume 3, Issue 3/4, 1996, Pages 107-123.
[54] POON, CHI-SUN, SALMAN AZHAR, MIKE ANSON, AND YUK-LUNG WONG: Performance of Metakaolin Concrete at Elevated Temperatures. Cement & Concrete Composites, Volume 25, Issue 1, 2003, Pages 83-89.
[55] POON, C.S., L. LAM, S.C. KOU, AND Z.S. LIN: A Study on the Hydration Rate of Natural Zeolite Blended Cement Pastes. Construction and Building Materials, Volume 13, Issue 8, 1999, 427-432.
[56] PORTLAND CEMENT ASSOCIATION: Homepage. http://www.portcement.org.
[57] PRINCE, W., M. EDWARDS-LAJNEF, AND P.-C. AÏTCIN: Interaction between Ettringite and a Polynaphthalene Sulfonate Superplasticizer in a Cementitious Paste. Cement and Concrete Research, Volume 32, 2002, Pages 79-85.
[58] PUNTKE, WOLFGANG: Basics for Optimizing the Matrix of Concrete and Field Applications. Author’s Edition, Ostfildern, Germany, 1990 (in German).
[59] RAMÍREZ, SUSANA, JAIME CUEVAS, RAQUEL VIGIL, AND SANTIAGO LEGUEY: Hydrothermal Alteration of “La Serrata” Bentonite (Almeira, Spain) by Alkaline Solutions. Applied Clay Science, Article in press, Accepted December 2001.
[60] RAMLOCHAN, TERRENCE, MICHAEL THOMAS, AND KAREN A. GRUBER: The Effect of Metakaolin on Alkali-Silica Reaction in Concrete. Cement & Concrete Research, Volume 30, Issue 3, 2000, Pages 339-344.
[61] RESCHKE, THORSTEN: The Influence of Granulometry of Fine Particles on the Structural Development and Strength of Concrete. Schriftenreihe der Zementindustrie, Heft 62, Verlag Bau + Technik, Düsseldorf, Germany, 2000 (in German).
[62] RONCERO, JOANA: Effect of Superplasticizers on the Behavior of concrete in the Fresh and Hardened States: Implications on High Performance Concrete. Doctoral Thesis, Universitat Politècnica de Catalunya, Barcelona, Spain, June 2000.

131
[63] ROSSETTI, V.A. AND F. MEDICI: Inertization of Toxic Metals in Cement Matrices: Effect on Hydration, Setting and Hardening. Cement & Concrete Research, Volume 25, Issue 6, 1995, Pages 1147- 1152.
[64] RULE, AUDREY C.: Uses of Clay Minerals: Kaolin Clays. Teaching materials. Boise University, Idaho, 1997.
[65] SAAD MORSY, M., S.A. ABO EL-ENEIN, AND G.B. HANNA: Microstructure and Hydration Characteristics of Artificial Pozzolana-Cement Pastes Containing Burnt Kaolinite Clay. Cement & Concrete Research, Volume 27, Issue 9, 1997, Pages 1307-1312.
[66] SAAD MORSY, M., A.F. GABAL, AND S.A. ABO EL-ENEIN: Effect of Temperature on Phase Composition and Microstructure of Artificial Pozzolana-Cement Pastes Containing Burnt Kaolinite Clay. Cement & Concrete Research, Volume 28, Issue 8, 1998, Pages 1157-1163.
[67] SABIR, B.B., S. WILD, AND J. BAI: Metakaolin and Calcined Clays as Pozzolans for Concrete: A Review. Cement & Concrete Composites, Volume 23, Issue 6, 2001, Pages 441-454.
[68] SANTAMARINA, J.C., K.A. KLEIN, Y.H. WANG, AND E. PRENCKE: Specific Surface: Determination and Relevance. Canadian Geotechnical Journal, Volume 39, 2002, Pages 233-241.
[69] SELNA, DAVID AND PAULO J.M. MONTEIRO: Cathedral of Our Lady of the Angels. Concrete International, Volume 23, Issue 11, 2001, Pages 26-33.
[70] SHA, W. AND G.B. PEREIRA: Differential Scanning Calorimetry Study of Ordinary Portland Cement Paste Containing Metakaolin and Theoretical Approach of Metakaolin Activity. Cement & Concrete Composites, Volume 23, 2001, Pages 455-461.
[71] SPANKA, GERHARD, HORST GRUBE, AND GERD THIELEN: Operative Mechanism of Plasticizing Concrete Admixtures. In: GERD THIELEN (EDITOR): Reports on Concrete Technology 1995-1997. Verlag Bau + Technik, Düsseldorf, Germany, 1998, Pages 45-60.
132
[72] SYBERTZ, FRANZ: Evaluating the Effectiveness of Fly Ash as Concrete Admixture. Deutscher Ausschuß für Stahlbeton Heft 434, Beuth Verlag, Berlin, Germany, 1993 (in German).
[73] TAYLOR, H.F.W.: Cement Chemistry. Academic Press, London, UK, 1990.
[74] TENNIS, PAUL D.: Portland Cement Characteristics – 1998. Concrete Technology Today, Volume 20, Issue 2, 1998, Pages 1-3.
[75] TÜRKMENOĞLU, A.G. AND A. TANKUT: Use of Tuffs from Central Turkey as Admixture in Pozzolanic Cements – Assessment of their Petrographical Properties. Cement & Concrete Research, Volume 32, 2002, Pages 629-637.
[76] US ENVIRONMENTAL PROTECTION AGENCY: Hudson River PCBs Site New York – Record of Decision. US EPA, 2002.
[77] US ENVIRONMENTAL PROTECTION AGENCY: 40 CFR PART 260 ET AL.: Hazardous Waste Management System; Land Disposal Restrictions; Final Rule. Federal Register, Part II Environmental Protection Agency: Rules and Regulations, Volume 51, No. 218, November 7, 1988.
[78] US ENVIRONMENTAL PROTECTION AGENCY, SW 846: Method 8260, Volatile Organic Compounds by Gas Chromatography, Mass Spectrometry (GC/MS): Capillary Column Technique. Revision 0, US EPA, July 1992.
[79] US ENVIRONMENTAL PROTECTION AGENCY, SW 846: Method 8260 & 524, Analysis of Aqueous or Solid Hazardous Waste for Volatile Organic Compounds Methods 8260 + 524. US EPA, December 1994.
[80] US ENVIRONMENTAL PROTECTION AGENCY, SW 846: Method 8270D, Semivolatile Organic Compounds by Gas Chromatography, Mass Spectrometry (GC/MS). Revision 4, US EPA, January 1998.
[81] US ENVIRONMENTAL PROTECTION AGENCY, REGION 2, US ARMY CORPS OF
ENGINEERS, NEW YORK DISTRICT, US DEPARTMENT OF ENERGY, BROOKHAVEN
NATIONAL LABORATORY: Fast Track Dredged Material Decontamination

133
Demonstration for the Port of New York and New Jersey, Report to the Congress. National Technical Information Service, Springfield, VA, 1999.
[82] VELLINGA, PIER: Dredging in a Changing Environment. Terra Et Aqua, Issue 87, June 2002, http://www.iadc-dredging.com/terra-et-aqua/2002/87-2.html.
[83] VEREIN DEUTSCHER ZEMENTWERKE E.V.: Activity Report 1996 – 99. Verlag Bau + Technik GmbH, Düsseldorf, Germany, 1999.
[84] VEREIN DEUTSCHER ZEMENTWERKE E.V.: Concrete: Strong, Efficient, Environmentally Compatible. VDZ, Düsseldorf, Germany, 2000 (in German).
[85] VU, D.D., P. STROEVEN, AND V.B. BUI: Strength and Durability Aspects of Calcined Kaolin-blended Portland Cement Mortar and Concrete. Cement & Concrete Composites, Volume 23, 2001, Pages 471-478.
[86] WAKEMAN, THOMAS: Finding Productive Uses for Dredged Material and Contaminated Sediments. In: R. E. RANDALL (Ed.): Proceedings of the 21st Technical Conference of the Western Dredging Association in Houston, TX, June 24-27, 2001. Center for Dredging Studies, Report No.373, Texas A&M University, College Station, TX, 2001, Pages 241-248.
[87] WILD, S. AND J. M. KHATIB: Portlandite Consumption in Metakaolin Cement Pastes and Mortars. Cement & Concrete Research, Volume 27, Issue 1, 1997, Pages 137-146.
[88] WILD, S., J. M. KHATIB, AND A. JONES: Relative Strength, Pozzolanic Activity and Cement Hydration in Superplasticised Metakaolin Concrete. Cement & Concrete Research, Volume 26, Issue 10, 1996, Pages 1537- 544.
[89] WILLIX, BRIGITTA M. AND SARA J. GRAALUM: Beneficial Use and Treatment of Contaminated Sediments Dredged from the Claremont Channel Using Propat®. In: R. E. RANDALL (Ed.): Proceedings of the 21st Technical Conference of the Western Dredging Association in Houston, TX, June 24-27, 2001. Center for Dredging Studies, Report No.373, Texas A&M University, College Station, TX, 2001.
134
[90] WISCHERS, GERD AND WERNER RICHARTZ: The Influence of Composition and Granulometry of Cement on the Structure of Hardened Cement Paste, Part 1. Beton, Volume 32, Issue 9, 1982, Pages 337-341 (in German).
[91] GERD WISCHERS AND WERNER RICHARTZ: The Influence of Composition and Granulometry of Cement on the Structure of Hardened Cement Paste, Part 2. Beton, Volume 32, Issue 10, 1982, Pages 379-387 (in German).
[92] WONG, G. SAM, A. MICHEL ALEXANDER, RICHARD HASKINS, TOY S. POOLE, PHILLIP G. MALONE, AND LILIAN WAKELEY: Portland-Cement Concrete Rheology and Workability: Final Report. U.S. Department of Transportation, Federal Highway Administration, Distributor: National Technical Information Service, Springfield, VA 22161, January 2000.
[93] YOOL, A.I.G., T.P. LEES, AND A. FRIED: Improvements to the Methylene Blue Dye Test for Harmful Clay in Aggregates for Concrete and Mortar. Cement & Concrete Research, Volume 28, Issue 10, 1998, Pages 1417-1428.
[94] YOUSUF, M., A MOLLAH, RAJAN K. VEMPATI, T.-C. LIN, AND DAVID L. COCKE: The Interfacial Chemistry of Solidification/Stabilization of Metals in Cement and Pozzolanic Material Systems. Waste Management, Volume 15, 1995, Pages 137-148.
[95] ZHANG, M.H. AND V.M. MALHOTRA: Characteristics of a Thermally Activated Alumino-Silicate Pozzolanic Material and its Use in Concrete. Cement & Concrete Research, Volume 25, Issue 8, 1995, Pages 1713-1725.
[96] ZIEGLER, FELIX: Heavy Metal Binding in Cement-Based Waste Materials: An Investigation of the Mechanism of Zinc Sorption to Calcium Silicate Hydrates. Doctoral Thesis, Swiss Federal Institute of Technology, Zürich, Switzerland, 2000.


