Embed Size (px)
Citation preview

Frontiers in Integrative Neuroscience www.frontiersin.org April 2010 | Volume 4 | Article 10 | 1
INTEGRATIVE NEUROSCIENCEORIGINAL RESEARCH ARTICLE
published: 13 April 2010doi: 10.3389/fnint.2010.00010
1996; Puce and Perrett, 2003; Tsao and Livingstone, 2008). Noteworthy, previous electrophysiological studies described that some neurons in the lower bank STS respond to stimula-tion of several modalities or exhibit response modulation when a visual stimulus driving the neuron is paired with a stimulus in another modality (Benevento et al., 1977; Bruce et al., 1981; Hikosaka et al., 1988; Barraclough et al., 2005). However, these previous studies were mostly descriptive and quantifi ed multi-sensory infl uences in terms of changes in fi ring rates. It hence remains unclear whether multisensory infl uences enhance the specifi city or reliability of neuron’s responses and permit better discrimination of sensory stimuli, as would be expected from neural counterparts of perceptual benefi ts of sensory integration (Ernst and Bulthoff, 2004; Kayser et al., 2010).
To directly assess the benefi ts of multisensory infl uences for neural representations in the lower bank STS, we quantifi ed the impact of simultaneously presented sounds on responses elicited by the presentation of naturalistic visual scenes. We used methods of information theory and stimulus decoding to quantify whether the responses of STS neurons become more reliable and informa-tive in multisensory contexts. Such analysis can incorporate evi-dence from the full time course of each neurons response and hence avoids the need to interpret the possibly subtle modulations in particular response parameters, such as a neurons average (or peak) fi ring rate, or its latency. Our results demonstrate that STS neurons are sensitive to the congruency of auditory and visual
INTRODUCTIONCombining evidence across different sensory modalities markedly enhances our ability to detect, discriminate or recognize sensory stimuli (Stein and Meredith, 1993). Pinning down where and how multisensory integration by neurons mediates such behavioral ben-efi ts is still an ongoing quest. For the auditory system, for example, it has been shown that stimuli presented in the visual or somatic modalities infl uence acoustic responses already in primary and secondary auditory fi elds (Schroeder and Foxe, 2005; Ghazanfar and Schroeder, 2006; Bizley and King, 2009; Kayser et al., 2009b), and there enhance the reliability and stimulus information encoded by auditory neurons depending on the congruency of acoustic and non-acoustic information (Ghazanfar et al., 2008; Kayser et al., 2010). Concerning the visual system, however, much less is known about the where and how of multisensory infl uences. While multi-sensory infl uences have proven largely elusive in primate primary visual cortex (Wang et al., 2008), it has been recognized that the responses of neurons in higher visual areas, for example in the superior temporal sulcus (STS), can be infl uenced by stimuli in other modalities.
The lower (ventral) bank of the STS (area TEa) receives ana-tomical afferents from visual pathways and neurons in this region form higher visual representations (Seltzer and Pandya, 1978, 1989). In particular, neurons in the ventral bank STS encode information about biological motion and visual objects, such as faces, body parts or other behaviorally relevant objects (Tanaka,
Modulation of visual responses in the superior temporal sulcus by audio-visual congruency
Christoph D. Dahl1, Nikos K. Logothetis1,2 and Christoph Kayser1*
1 Department for Physiology of Cognitive Processes, Max Planck Institute for Biological Cybernetics, Spemannstrasse, Tübingen, Germany2 Division of Imaging Science and Biomedical Engineering, University of Manchester, Manchester, UK
Our ability to identify or recognize visual objects is often enhanced by evidence provided by other sensory modalities. Yet, where and how visual object processing benefi ts from the information received by the other senses remains unclear. One candidate region is the temporal lobe, which features neural representations of visual objects, and in which previous studies have provided evidence for multisensory infl uences on neural responses. In the present study we directly tested whether visual representations in the lower bank of the superior temporal sulcus (STS) benefi t from acoustic information. To this end, we recorded neural responses in alert monkeys passively watching audio-visual scenes, and quantifi ed the impact of simultaneously presented sounds on responses elicited by the presentation of naturalistic visual scenes. Using methods of stimulus decoding and information theory, we then asked whether the responses of STS neurons become more reliable and informative in multisensory contexts. Our results demonstrate that STS neurons are indeed sensitive to the modality composition of the sensory stimulus. Importantly, information provided by STS neurons’ responses about the particular visual stimulus being presented was highest during congruent audio-visual and unimodal visual stimulation, but was reduced during incongruent bimodal stimulation. Together, these fi ndings demonstrate that higher visual representations in the STS not only convey information about the visual input but also depend on the acoustic context of a visual scene.
Keywords: multisensory integration, cross-modal, visual scene, temporal lobe
Edited by:
Micah M. Murray, Université de Lausanne, Switzerland
Reviewed by:
Gregg H. Recanzone, University of California, USAM. Alex Meredith, Virginia Commonwealth University, USA
*Correspondence:
Christoph Kayser, Max Planck Institute for Biological Cybernetics, Spemannstrasse 38, 72076 Tübingen, Germany. e-mail: [email protected]

Frontiers in Integrative Neuroscience www.frontiersin.org April 2010 | Volume 4 | Article 10 | 2
Dahl et al. STS neurons and audio-visual congruency
stimuli and allow better discrimination of different sensory scenes during congruent multisensory conditions than during incongru-ent conditions.
MATERIALS AND METHODSELECTROPHYSIOLOGICAL RECORDINGSNeuronal activity was recorded from the STS of two adult male rhesus monkeys (Macaca mulatta) according to previously detailed procedures (Kayser et al., 2008; Dahl et al., 2009). All procedures were approved by the local authorities (Regierungspräsidium Tübingen) and were in full compliance with the guidelines of the European Community (EUVD 86/609/EEC). Briefl y, recordings were performed in a dark and anechoic booth (Illtec, Illbruck acous-tic) while the animals performed a fi xation task for juice rewards (2° fi xation window for animal 1, 6° for animal 2). The fi xation period included a 500 ms pre-stimulus baseline, 1200 ms of sen-sory stimulation and a 300 ms post-stimulus baseline (Figure 1A). Micro-electrodes (FHC Inc., 2–6 MOhm impedance) were lowered vertically to the STS and signals were amplifi ed using an Alpha Omega system (Alpha Omega) and digitized at 20.83 kHz.
That the neurons analyzed here were indeed recorded from the (ventral) bank of the STS was ascertained as follows: In previous studies the auditory cortices overlying the STS had been character-ized in both animals and had been localized relative to the recording chamber using structural magnetic resonance images. This allowed us to identify the STS using the relative depth to auditory cortex, the systematic occurrence of white matter between auditory cor-tex and STS, and the occurrence of prominent visual responses in the STS. In addition, in one animal the upper bank STS had been characterized in a previous study (Dahl et al., 2009). The units analyzed here were recorded at least 6–7 mm below auditory cor-tex and hence deeper than what was previously investigated in a study focusing on the STS upper bank. And while recording sites in the upper bank are characterized by a heterogeneous mixture of visually preferring, auditory preferring and bimodal units (Dahl et al., 2009), the neurons analyzed here responded well to unimodal visual but not to unimodal auditory stimuli. All this strongly sug-gests that these neurons were recorded from the lower (not upper) bank of the sulcus.
AUDIO-VISUAL STIMULIOur stimuli comprised videos and sounds of behaviorally relevant stimuli, such as videos and sounds of conspecifi c vocalizing ani-mals (coo and grunt calls) and scenes from the animal colony (an animal shaking a cage door, a cage door being opened and closed, and a water bottle being inserted into its attachment). In addition, our stimulus set comprised sounds and videos of another animal (a lion roaring) and an artifi cial looming stimulus (an expanding random dot pattern accompanied by a frequency sweep), which is known to have behavioral relevance to the animals (Ghazanfar et al., 2002). Sounds were presented from two calibrated free fi eld speakers (JBL Professional, positioned 70 cm from the head and 50° to left and right) at an average intensity of 65 dB SPL. Visual stimuli were presented on a 21 inch gamma-corrected monitor and cov-ered a visual fi eld of 24 × 18° (mean luminance 20 cd/m2). Stimuli were presented either as unimodal auditory (sound, condition A) or unimodal visual stimuli (movie, condition V), as congruent
audio-visual pair (sound plus corresponding movie, condition AV), or as incongruent (mis-matching) audio-visual pair (con-dition AVincon). For the incongruency condition we deliberately chose pairs of movies and sounds that neither shared similar objects (e.g. different animals) nor similar temporal properties. Stimulus incongruency was hence defi ned based on ‘semantic’ and physi-cal properties. These four stimulus conditions were presented in a pseudo-random order, and each condition was repeated at least 20 times. For a subset of units we presented two pairs of audio-visual stimuli intermixed, resulting in a total of eight conditions (two movies V
1, V
2; two sounds A
1, A
2; two congruent pairs A
1V
1, A
2V
2;
and two incongruent pairs A1V
2, A
2V
1).
DATA ANALYSISThe spike-sorted activity of single neurons (SUA) and multi-unit clusters (MUA) was extracted using commercial spike-sorting soft-ware (Plexon Offl ine Sorter, Plexon Inc.) after high-pass fi ltering the raw signal at 500 Hz (3rd order Butterworth fi lter). For the present analysis we did not distinguish between single- and multi-unit sites. Spike times were saved at a resolution of 1 ms, and sub-sequently resampled to the minimal time binning considered for the respective analysis (see below). The data was further analyzed in Matlab (Mathworks Inc.), partly relying on a recently developed toolbox for information theoretic calculations (http://www.ibtb.org) (Magri et al., 2009).
DEFINITION OF RESPONSE AMPLITUDE AND RESPONSIVE UNITSFor each unit we extracted its peak response amplitude by deter-mining the peak of the average response to the congruent audio-visual stimulus and computing the number of spikes within an 80-ms window centered on this peak (the same window was used to compute the response for each modality condition). Of all recorded units, we analyzed only those for which the responses to at least one stimulation condition differed signifi cantly from baseline. These were determined by comparing the peak response amplitude in each condition to the response in an 80 ms window during the pre-stimulus baseline period using a t-test, using a critical p-value of p < 10−3. Of the units analyzed in this study, all responded sig-nifi cantly either in the visual or audio-visual condition (or both), but no unit responded signifi cantly to just auditory stimuli.
DECODING ANALYSISTo investigate how the responses of individual units differ between unimodal and bimodal stimulation, and how they are affected by audio-visual congruency, we used stimulus decoding and informa-tion analysis (Quian Quiroga and Panzeri, 2009; Panzeri et al., 2010). This analysis incorporates evidence about both the average response time course as well as the response reliability, and quantifi es how well a linear decoder could tell individual stimuli or conditions apart given a single-trial response. We applied this analysis in two ways: First, to determine how well responses discriminate between the unimodal, bimodal and incongruent bimodal conditions (using V, AV and AVinc as to-be-decoded conditions, Figure 3). Second, to determine how well responses discriminate between different sensory stimuli (different movies/sound pairs), either presented as unimodal, congruent bimodal and incongruent bimodal pairs (using the two stimuli as to-be-decoded conditions, Figure 4).
Frontiers in Integrative Neuroscience www.frontiersin.org April 2010 | Volume 4 | Article 10 | 3
Dahl et al. STS neurons and audio-visual congruency
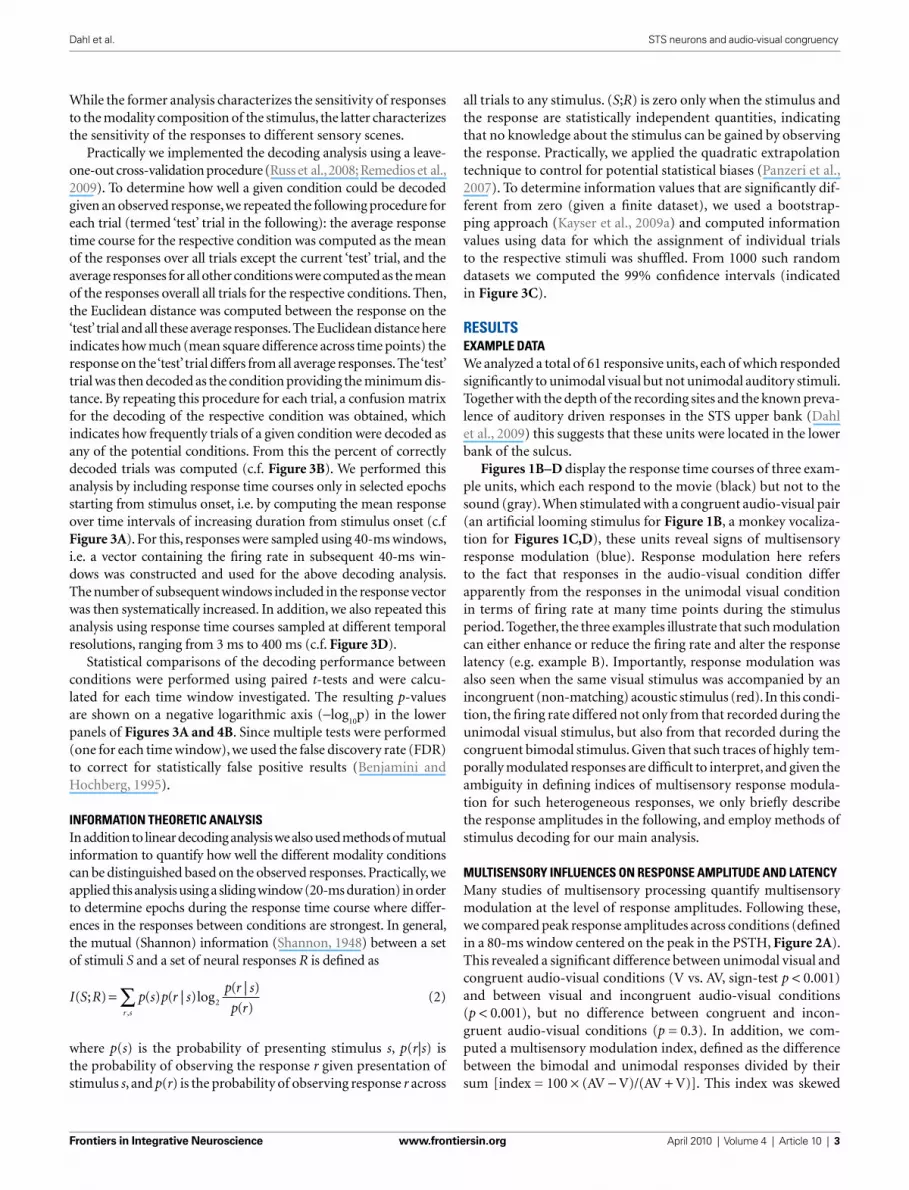
While the former analysis characterizes the sensitivity of responses to the modality composition of the stimulus, the latter characterizes the sensitivity of the responses to different sensory scenes.
Practically we implemented the decoding analysis using a leave-one-out cross-validation procedure (Russ et al., 2008; Remedios et al., 2009). To determine how well a given condition could be decoded given an observed response, we repeated the following procedure for each trial (termed ‘test’ trial in the following): the average response time course for the respective condition was computed as the mean of the responses over all trials except the current ‘test’ trial, and the average responses for all other conditions were computed as the mean of the responses overall all trials for the respective conditions. Then, the Euclidean distance was computed between the response on the ‘test’ trial and all these average responses. The Euclidean distance here indicates how much (mean square difference across time points) the response on the ‘test’ trial differs from all average responses. The ‘test’ trial was then decoded as the condition providing the minimum dis-tance. By repeating this procedure for each trial, a confusion matrix for the decoding of the respective condition was obtained, which indicates how frequently trials of a given condition were decoded as any of the potential conditions. From this the percent of correctly decoded trials was computed (c.f. Figure 3B). We performed this analysis by including response time courses only in selected epochs starting from stimulus onset, i.e. by computing the mean response over time intervals of increasing duration from stimulus onset (c.f Figure 3A). For this, responses were sampled using 40-ms windows, i.e. a vector containing the fi ring rate in subsequent 40-ms win-dows was constructed and used for the above decoding analysis. The number of subsequent windows included in the response vector was then systematically increased. In addition, we also repeated this analysis using response time courses sampled at different temporal resolutions, ranging from 3 ms to 400 ms (c.f. Figure 3D).
Statistical comparisons of the decoding performance between conditions were performed using paired t-tests and were calcu-lated for each time window investigated. The resulting p-values are shown on a negative logarithmic axis (−log
10p) in the lower
panels of Figures 3A and 4B. Since multiple tests were performed (one for each time window), we used the false discovery rate (FDR) to correct for statistically false positive results (Benjamini and Hochberg, 1995).
INFORMATION THEORETIC ANALYSISIn addition to linear decoding analysis we also used methods of mutual information to quantify how well the different modality conditions can be distinguished based on the observed responses. Practically, we applied this analysis using a sliding window (20-ms duration) in order to determine epochs during the response time course where differ-ences in the responses between conditions are strongest. In general, the mutual (Shannon) information (Shannon, 1948) between a set of stimuli S and a set of neural responses R is defi ned as
I R p s p r sp r s
p rr s
( ; ) ( ) ( | )log( | )
( ),
S = ∑ 2
(2)
where p(s) is the probability of presenting stimulus s, p(r|s) is the probability of observing the response r given presentation of stimulus s, and p(r) is the probability of observing response r across
all trials to any stimulus. (S;R) is zero only when the stimulus and the response are statistically independent quantities, indicating that no knowledge about the stimulus can be gained by observing the response. Practically, we applied the quadratic extrapolation technique to control for potential statistical biases (Panzeri et al., 2007). To determine information values that are signifi cantly dif-ferent from zero (given a fi nite dataset), we used a bootstrap-ping approach (Kayser et al., 2009a) and computed information values using data for which the assignment of individual trials to the respective stimuli was shuffl ed. From 1000 such random datasets we computed the 99% confi dence intervals (indicated in Figure 3C).
RESULTSEXAMPLE DATAWe analyzed a total of 61 responsive units, each of which responded signifi cantly to unimodal visual but not unimodal auditory stimuli. Together with the depth of the recording sites and the known preva-lence of auditory driven responses in the STS upper bank (Dahl et al., 2009) this suggests that these units were located in the lower bank of the sulcus.
Figures 1B–D display the response time courses of three exam-ple units, which each respond to the movie (black) but not to the sound (gray). When stimulated with a congruent audio-visual pair (an artifi cial looming stimulus for Figure 1B, a monkey vocaliza-tion for Figures 1C,D), these units reveal signs of multisensory response modulation (blue). Response modulation here refers to the fact that responses in the audio-visual condition differ apparently from the responses in the unimodal visual condition in terms of fi ring rate at many time points during the stimulus period. Together, the three examples illustrate that such modulation can either enhance or reduce the fi ring rate and alter the response latency (e.g. example B). Importantly, response modulation was also seen when the same visual stimulus was accompanied by an incongruent (non-matching) acoustic stimulus (red). In this condi-tion, the fi ring rate differed not only from that recorded during the unimodal visual stimulus, but also from that recorded during the congruent bimodal stimulus. Given that such traces of highly tem-porally modulated responses are diffi cult to interpret, and given the ambiguity in defi ning indices of multisensory response modula-tion for such heterogeneous responses, we only briefl y describe the response amplitudes in the following, and employ methods of stimulus decoding for our main analysis.
MULTISENSORY INFLUENCES ON RESPONSE AMPLITUDE AND LATENCYMany studies of multisensory processing quantify multisensory modulation at the level of response amplitudes. Following these, we compared peak response amplitudes across conditions (defi ned in a 80-ms window centered on the peak in the PSTH, Figure 2A). This revealed a signifi cant difference between unimodal visual and congruent audio-visual conditions (V vs. AV, sign-test p < 0.001) and between visual and incongruent audio-visual conditions (p < 0.001), but no difference between congruent and incon-gruent audio-visual conditions (p = 0.3). In addition, we com-puted a multisensory modulation index, defi ned as the difference between the bimodal and unimodal responses divided by their sum [index = 100 × (AV − V)/(AV + V)]. This index was skewed

Frontiers in Integrative Neuroscience www.frontiersin.org April 2010 | Volume 4 | Article 10 | 4
Dahl et al. STS neurons and audio-visual congruency
towards negative values with an average of −11 ± 2% (Figure 2B). This result suggests that the multisensory modulating observed for these neurons is comparable in amplitude such found for example for visual modulation of neurons in auditory cortex (Ghazanfar et al., 2005; Kayser et al., 2008).
DECODING OF MODALITY COMBINATIONSWhile these fi ndings demonstrate that the responses of visually responsive STS neurons are indeed modulated by the presence of an acoustic stimulus, they fall short of taking into account the complex nature of STS neurons’ responses. Most importantly, the defi nition of response amplitude (and the underlying time window) is arbitrary, and for many units (see examples in Figure 1) periods of response enhancement and suppression both occur within the time course of the response. To take this heterogeneity of responses into account, we used stimulus decoding analysis based on temporal response profi les to quantify the impact of congruent of incongru-ent multisensory stimuli. Our stimulus decoding approach does
FIGURE 1 | Example data. (A) The upper panel illustrates the experimental paradigm. Visual, auditory and combined audio-visual stimuli were presented while the animals performed a visual fi xation task and were separated by baseline periods (silence, gray screen). The lower panel illustrates the recording approach to the lower bank STS. (B–D) Example responses of three units. Line graphs depict the trial-averaged fi ring rate (smoothed by a 20-ms Gaussian
kernel), lower panels display the spike-raster plots for all except the unimodal auditory condition (dots indicate spikes, lines indicate repeats). The left panels display an example frame of the respective movie and spectrograms for the congruent and incongruent sounds. The three examples each illustrate different patterns of auditory modulation of visual responses and different impact of audio-visual congruency. AV: audio-visual congruent; AVinco: audio-visual incongruent.
FIGURE 2 | Modulation of response amplitude. (A) Peak response amplitudes computed using a 80-ms window centered on the peak of the unimodal visual response. Bars indicate the mean and standard error across units. *indicate signifi cant differences, sign-test p < 0.001. The scatter plot displays the same data on a unit by unit basis, displaying the amplitude in each bimodal condition versus the amplitude in the unimodal visual condition. (B) Distribution of the multisensory modulation index across units. The modulation index was defi ned as the percent difference between the bimodal and unimodal responses divided by their sum (index = 100 × (AV − V)/(AV + V).
Frontiers in Integrative Neuroscience www.frontiersin.org April 2010 | Volume 4 | Article 10 | 5
Dahl et al. STS neurons and audio-visual congruency
not make prior assumptions about the potentially relevant response features and used the entire response time course (starting from stimulus onset) as input.
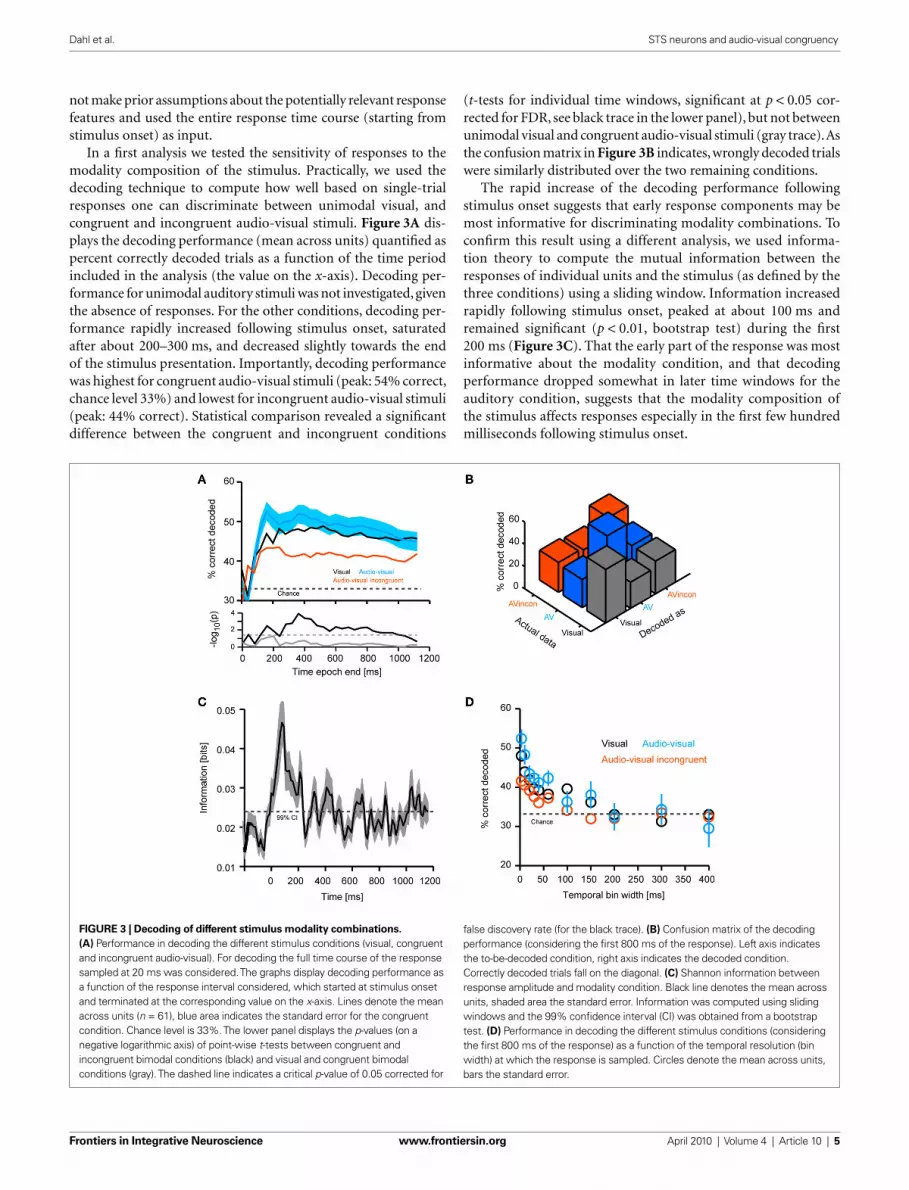
In a fi rst analysis we tested the sensitivity of responses to the modality composition of the stimulus. Practically, we used the decoding technique to compute how well based on single-trial responses one can discriminate between unimodal visual, and congruent and incongruent audio-visual stimuli. Figure 3A dis-plays the decoding performance (mean across units) quantifi ed as percent correctly decoded trials as a function of the time period included in the analysis (the value on the x-axis). Decoding per-formance for unimodal auditory stimuli was not investigated, given the absence of responses. For the other conditions, decoding per-formance rapidly increased following stimulus onset, saturated after about 200–300 ms, and decreased slightly towards the end of the stimulus presentation. Importantly, decoding performance was highest for congruent audio-visual stimuli (peak: 54% correct, chance level 33%) and lowest for incongruent audio-visual stimuli (peak: 44% correct). Statistical comparison revealed a signifi cant difference between the congruent and incongruent conditions
(t-tests for individual time windows, signifi cant at p < 0.05 cor-rected for FDR, see black trace in the lower panel), but not between unimodal visual and congruent audio-visual stimuli (gray trace). As the confusion matrix in Figure 3B indicates, wrongly decoded trials were similarly distributed over the two remaining conditions.
The rapid increase of the decoding performance following stimulus onset suggests that early response components may be most informative for discriminating modality combinations. To confi rm this result using a different analysis, we used informa-tion theory to compute the mutual information between the responses of individual units and the stimulus (as defi ned by the three conditions) using a sliding window. Information increased rapidly following stimulus onset, peaked at about 100 ms and remained signifi cant (p < 0.01, bootstrap test) during the fi rst 200 ms (Figure 3C). That the early part of the response was most informative about the modality condition, and that decoding performance dropped somewhat in later time windows for the auditory condition, suggests that the modality composition of the stimulus affects responses especially in the fi rst few hundred milliseconds following stimulus onset.
FIGURE 3 | Decoding of different stimulus modality combinations.
(A) Performance in decoding the different stimulus conditions (visual, congruent and incongruent audio-visual). For decoding the full time course of the response sampled at 20 ms was considered. The graphs display decoding performance as a function of the response interval considered, which started at stimulus onset and terminated at the corresponding value on the x-axis. Lines denote the mean across units (n = 61), blue area indicates the standard error for the congruent condition. Chance level is 33%. The lower panel displays the p-values (on a negative logarithmic axis) of point-wise t-tests between congruent and incongruent bimodal conditions (black) and visual and congruent bimodal conditions (gray). The dashed line indicates a critical p-value of 0.05 corrected for
false discovery rate (for the black trace). (B) Confusion matrix of the decoding performance (considering the fi rst 800 ms of the response). Left axis indicates the to-be-decoded condition, right axis indicates the decoded condition. Correctly decoded trials fall on the diagonal. (C) Shannon information between response amplitude and modality condition. Black line denotes the mean across units, shaded area the standard error. Information was computed using sliding windows and the 99% confi dence interval (CI) was obtained from a bootstrap test. (D) Performance in decoding the different stimulus conditions (considering the fi rst 800 ms of the response) as a function of the temporal resolution (bin width) at which the response is sampled. Circles denote the mean across units, bars the standard error.

Frontiers in Integrative Neuroscience www.frontiersin.org April 2010 | Volume 4 | Article 10 | 6
Dahl et al. STS neurons and audio-visual congruency
We further determined the importance of the detailed temporal response structure in providing information about the stimulus. To this end, we repeated the decoding analysis using responses sampled at different temporal resolutions, ranging from fi nely sam-pled time courses (3 ms time bins) to response rates in long time windows (400 ms time bins). The result (Figure 3D) demonstrates that different modality combinations can be best discriminated when responses are sampled at a high temporal resolution (below 10 ms). This lets us conclude that temporal response patterns are crucial in providing information about the modality composition of the stimulus and suggests that simple measures such as peak response amplitudes or overall fi ring rates on long time scales fall short of taking the full response structure into consideration.
DECODING OF INDIVIDUAL STIMULIWe next asked whether the multisensory response modulation provides benefi ts for discriminating different sensory scenes, and hence enhances the ability of STS neurons to represent the sensory environment. Using the stimulus decoding approach, we probed whether the performance in discriminating visual scenes is affected by the presence of either congruent or incongruent acoustic stimuli. To this end we analyzed the responses of a subset of units (n = 33), for which responses to two audio-visual scenes were recorded. We then compared the performance in discriminating the two visual scenes (V
1, V
2), the two congruent bimodal scenes (A
1V
1, A
2V
2), and
two scenes in which the same two videos were paired with the same sound, hence once with a congruent and once with an incongruent acoustic context (A
1V
1, A
1V
2).
The response of one example unit is shown in Figure 4A. For this unit, one scene featured a conspecifi c (monkey) vocalization and the other a cage door being opened. Importantly, the responses to the bimodal congruent presentation of both pairs (A
1V
1, A
2V
2)
differed in timing and amplitude, as can be seen in the time courses. As a result, the responses to these congruent pairs could be well dis-criminated (75% correct, using a temporal resolution of 3 ms and the fi rst 600 ms of the response, chance level being 50%). However, pairing the video of the cage door with the sound of the vocalization (incongruent pair) elicited a response whose timing matched that of the congruent vocalization pair, but whose amplitude matched
neither congruent response. As a result, this incongruent combina-tion could not be discriminated from the congruent pairs (A
1V
1
vs. A1V
2, 50% correct, i.e. at chance level). This example suggests
that the degree to which two visual scenes can be discriminated from the responses depends on the acoustic context in which they are presented.
This hypothesis was confi rmed across units (n = 33). Figure 4B displays the performance (mean across units) in decoding sensory scenes presented as different modality combinations. Decoding was highest when distinguishing congruent audio-visual stimuli (peak 80%, blue trace) or two unimodal visual stimuli (76%, black; no signifi cant difference, t-tests, see gray trace in lower panel). However, the ability to discriminate two visual scenes presented in the same acoustic context (e.g. A
1V
1 from A
1V
2) was signifi cantly
reduced compared to the congruent condition for many of the time epochs tested (see black trace in lower panel). The magnitude of this reduction varied between 4–10%, depending on the time win-dow considered. This demonstrates that the sensitivity of visually responsive STS neurons to the acoustic context affects the degree to which different visual scenes can be distinguished given these neurons’ responses.
DISCUSSIONNeurons in the lower bank of STS provide higher tier visual repre-sentations and encode information about complex visual objects such as faces or biological motion (Tanaka, 1996; Puce and Perrett, 2003; Tsao and Livingstone, 2008). Anatomical afferents to this region arise mostly from visual pathways, while projections from association cortices and other multisensory structures are scarce (Seltzer and Pandya, 1978, 1989). As a result, neurons in this region respond well to static and dynamic visual stimuli, but do not exhibit robust (supra-threshold) responses to stimuli in other sensory modalities (though see (Bruce et al., 1981; Hikosaka et al., 1988) for counter examples). Still, results from electrophysiology and functional imaging suggest that neural activity in the lower bank STS can be generally affected by non-visual information (Calvert, 2001; Ghazanfar and Schroeder, 2006), suggesting the presence of modulatory (sub-threshold) infl uences from other sensory modali-ties. Such modulatory multisensory infl uences can be best studied
FIGURE 4 | Decoding of different visual scenes. (A) Response of one example unit to two different congruent bimodal audio-visual pairs (conspecifi c vocalization and cage door being opened) and one incongruent combination. (B) Performance in discriminating two different visual scenes presented either as unimodal visual stimuli, congruent bimodal pairs or two visual scenes presented in the same acoustic context. For decoding the full time course of the response sampled at 20 ms was considered. The graphs display decoding performance as a function of the response interval
considered, which started at stimulus onset and terminated at the corresponding value on the x-axis. Lines denote the mean across units (n = 33), blue area indicates the standard error for the congruent condition. Chance level is 50%. The lower panel displays the p-values (on a negative logarithmic axis) of point-wise t-tests between congruent and incongruent bimodal conditions (black) and visual and congruent bimodal conditions (gray). The dashed line indicates a critical p-value of 0.05 corrected for false discovery rate (for the black trace).

Frontiers in Integrative Neuroscience www.frontiersin.org April 2010 | Volume 4 | Article 10 | 7
Dahl et al. STS neurons and audio-visual congruency
when driving neurons using stimuli in their dominant sensory modality (Dehner et al., 2004; Allman et al., 2009), and as recent results from auditory cortex demonstrate, such modulatory mul-tisensory infl uences can profoundly infl uence the ability of neural responses to carry sensory information (Kayser et al., 2010).
In the present study we investigated sub-threshold modulation of visual neurons by acoustic stimuli. We found that STS neurons are sensitive to the modality composition of the sensory stimulus and that both the timing and the amplitude of responses are affected by simultaneously presented acoustic stimuli. This acoustic modu-lation of visual responses was sensitive to the congruency of sound and video and neurons responses allowed reliable discrimination of unimodal visual or congruent bimodal audio-visual stimuli, but not of incongruent pairs. In addition, we found that STS neurons can well discriminate different visual scenes when presented either as unimodal stimulus or as a congruent audio-visual pair, but the ability to discriminate visual scenes was reduced when presented in incongruent acoustic contexts. Altogether, these results demon-strate that visual neurons in the lower bank STS are modulated by the acoustic context of a visual scene, in a manner that is dependent on the congruency of the stimuli in both modalities, and suggests that higher visual representations in the STS not only convey infor-mation about the visual input but depend on and refl ect also the stimuli acquired by other modalities.
While the performance in discriminating different visual stimuli was signifi cantly reduced during incongruent audio-visual stimu-lation, the magnitude of this effect was rather small (below 10% reduction compared to the congruent condition). When interpret-ing this seemingly small effect, one should keep in mind that our
ability to recognize visual objects, such as the face of an acquainted person, is not abolished when hearing a non-matching sound. Rather, our ability to differentiate supra-threshold (i.e. well vis-ible) objects is only subtly modulated by sounds, such as when we are faster at recognizing a vaguely known person when seeing his face and hearing his voice. In light of this, our fi ndings can be interpreted as demonstrating a considerable impact of sounds on visual representations in the STS.
Our fi nding of multisensory infl uences in higher visual areas begs several questions. For example, how does the acoustic modula-tion tie in with complex feature sensitivities of STS neurons, such as for example sensitivity to faces or body parts (Tsao and Livingstone, 2008; Freiwald et al., 2009)? And how do such multisensory infl u-ences interact with attentional modulation or general arousal? The animals in our experiments were not using the audio-visual stimuli for a particular task, but were highly acquainted with them. In contrast to this, under many circumstances our sensory systems have to fuse or combine novel or behaviorally salient stimuli, and interactions of multisensory stimuli and attention might become prominent in such situations (Driver and Spence, 1998; Lakatos et al., 2009). The present fi ndings provide an initial step, but much work will be required to fi nally understand where and how our brain merges the information provided by the different sensory modalities into a coherent percept.
ACKNOWLEDGMENTSThis work was supported by the Max Planck Society. We are grate-ful to Stefano Panzeri, Shih-Pi Ku and Chris Petkov for comments and inspiring discussions.
REFERENCESAllman, B. L., Keniston, L. P., and
Meredith, M. A. (2009). Not just for bimodal neurons anymore: the contri-bution of unimodal neurons to corti-cal multisensory processing. Brain Topogr. 21, 157–167.
Barraclough, N. E., Xiao, D., Baker, C. I., Oram, M. W., and Perrett, D. I. (2005). Integration of visual and auditory information by superior temporal sulcus neurons responsive to the sight of actions. J. Cogn. Neurosci. 17, 377–391.
Benevento, L. A., Fallon, J., Davis, B. J., and Rezak, M. (1977). Auditory–visual interaction in single cells in the cor-tex of the superior temporal sulcus and the orbital frontal cortex of the macaque monkey. Exp. Neurol. 57, 849–872.
Benjamini, Y., and Hochberg, Y. (1995). Controlling the false discovery rate: a practical and powerful approach to multiple testing. J. Roy. Stat. Soc. Ser. B 57, 289–300.
Bizley, J. K., and King, A. J. (2009). Visual infl uences on ferret auditory cortex. Hear. Res. 258, 55–63.
Bruce, C., Desimone, R., and Gross, C. G. (1981). Visual properties of neurons
in a polysensory area in superior temporal sulcus of the macaque. J. Neurophysiol. 46, 369–384.
Calvert, G. A. (2001). Crossmodal process-ing in the human brain: insights from functional neuroimaging studies. Cereb. Cortex 11, 1110–1123.
Dahl, C., Logothetis, N., and Kayser, C. (2009). Spatial organization of multisen-sory responses in temporal association cortex. J. Neurosci. 29, 11924–11932.
Dehner, L. R., Keniston, L. P., Clemo, H. R., and Meredith, M. A. (2004). Cross-modal circuitry between auditory and somatosensory areas of the cat ante-rior ectosylvian sulcal cortex: a ‘new’ inhibitory form of multisensory con-vergence. Cereb. Cortex 14, 387–403.
Driver, J., and Spence, C. (1998). Crossmodal attention. Curr. Opin. Neurobiol. 8, 245–253.
Ernst, M. O., and Bulthoff, H. H. (2004). Merging the senses into a robust per-cept. Trends Cogn. Sci. (Regul. Ed.) 8, 162–169.
Freiwald, W. A., Tsao, D. Y., and Livingstone, M. S. (2009). A face feature space in the macaque temporal lobe. Nat. Neurosci. 12, 1187–1196.
Ghazanfar, A. A., Chandrasekaran, C., and Logothetis, N. K. (2008). Interactions
between the superior temporal sulcus and auditory cortex mediate dynamic face/voice integration in rhesus mon-keys. J. Neurosci. 28, 4457–4469.
Ghazanfar, A. A., Maier, J. X., Hoffman, K. L., and Logothetis, N. K. (2005). Multisensory integration of dynamic faces and voices in rhesus mon-key auditory cortex. J. Neurosci. 25, 5004–5012.
Ghazanfar, A. A., Neuhoff, J. G., and Logothetis, N. K. (2002). Auditory looming perception in rhesus mon-keys. Proc. Natl. Acad. Sci. U.S.A. 99, 15755–15757.
Ghazanfar, A. A., and Schroeder, C. E. (2006). Is neocortex essentially multisensory? Trends Cogn. Sci. 10, 278–285.
Hikosaka, K., Iwai, E., Saito, H., and Tanaka, K. (1988). Polysensory proper-ties of neurons in the anterior bank of the caudal superior temporal sulcus of the macaque monkey. J. Neurophysiol. 60, 1615–1637.
Kayser, C., Logothetis, N., and Panzeri, S. (2010). Visual enhancement of the information representation in audi-tory cortex. Curr. Biol. 20, 19–24.
Kayser, C., Montemurro, M. A., Logothetis, N., and Panzeri, S. (2009a).
Spike-phase coding boosts and stabi-lizes the information carried by spatial and temporal spike patterns. Neuron 61, 597–608.
Kayser, C., Petkov, C. I., and Logothetis, N. K. (2009b). Multisensory interactions in primate auditory cortex: fMRI and electrophysiology. Hear. Res. 258, 80–88. doi:10.1016/j.heares.2009.02.011.
Kayser, C., Petkov, C. I., and Logothetis, N. K. (2008). Visual modulation of neu-rons in auditory cortex. Cereb. Cortex 18, 1560–1574.
Lakatos, P., O’Connell, M. N., Barczak, A., Mills, A., Javitt, D. C., and Schroeder, C. E. (2009). The leading sense: supramo-dal control of neurophysiological con-text by attention. Neuron 64, 419–430.
Magri, C., Whittingstall, K., Singh, V., Logothetis, N. K., and Panzeri, S. (2009). A toolbox for the fast infor-mation analysis of multiple-site LFP, EEG and spike train recordings. BMC Neurosci. 10, 81.
Panzeri, S., Brunel, N., Logothetis, N., and Kayser, C. (2010). Sensory neu-ral codes using multiplexed temporal scales. Trends Neurosci. 33, 111–120.
Panzeri, S., Senatore, R., Montemurro, M. A., and Petersen, R. S. (2007). Correcting for the sampling bias problem in

Frontiers in Integrative Neuroscience www.frontiersin.org April 2010 | Volume 4 | Article 10 | 8
Dahl et al. STS neurons and audio-visual congruency
could be construed as a potential confl ict of interest.
Received: 11 February 2010; paper pending published: 07 March 2010; accepted: 24 March 2010; published online: 13 April 2010.Citation: Dahl CD, Logothetis NK and Kayser C (2010) Modulation of visual responses in the superior tem-poral sulcus by audio-visual congru-ency. Front. Integr. Neurosci. 4:10. doi: 10.3389/fnint.2010.00010Copyright © 2010 Dahl, Logothetis and Kayser. This is an open-access article subject to an exclusive license agreement between the authors and the Frontiers Research Foundation, which permits unrestricted use, distribution, and reproduction in any medium, provided the original authors and source are credited.
spike train information measures. J. Neurophysiol. 98, 1064–1072.
Puce, A., and Perrett, D. (2003). Electrophysiology and brain imaging of biological motion. Philos. Trans. R. Soc. Lond., B, Biol. Sci. 358, 435–445.
Quian Quiroga, R., and Panzeri, S. (2009). Extracting information from neuro-nal populations: information theory and decoding approaches. Nat. Rev. Neurosci. 10, 173–185.
Remedios, R., Logothetis, N. K., and Kayser, C. (2009). An auditory region in the primate insular cortex responding preferentially to vocal communication sounds. J. Neurosci. 29, 1034–1045.
Russ, B. E., Ackelson, A. L., Baker, A. E., and Cohen, Y. E. (2008). Coding of auditory-stimulus identity in the
auditory non-spatial processing stream. J. Neurophysiol. 99, 87–95.
Schroeder, C. E., and Foxe, J. (2005). Multisensory contributions to low-level, ‘unisensory’ processing. Curr. Opin. Neurobiol. 15, 454–458.
Seltzer, B., and Pandya, D. N. (1978). Afferent cortical connections and architectonics of the superior tem-poral sulcus and surrounding cortex in the rhesus monkey. Brain Res. 149, 1–24.
Seltzer, B., and Pandya, D. N. (1989). Intrinsic connections and architecton-ics of the superior temporal sulcus in the rhesus monkey. J. Comp. Neurol. 290, 451–471.
Shannon, C. E. (1948). A mathematical theory of communication. AT&T Tech. J. 27, 379–423.
Stein, B. E., and Meredith, M. A. (1993). Merging of the Senses. Cambridge: MIT Press.
Tanaka, K. (1996). Inferotemporal cortex and object vision. Annu. Rev. Neurosci. 19, 109–139.
Tsao, D. Y., and Livingstone, M. S. (2008). Mechanisms of face perception. Annu. Rev. Neurosci. 31, 411–437.
Wang, Y., Celebrini, S., Trotter, Y., and Barone, P. (2008). Visuo-auditory interactions in the primary visual cortex of the behaving monkey: electrophysiological evidence. BMC Neurosci. 9, 79.
Conflict of Interest Statement: The authors declare that the research was conducted in the absence of any com-mercial or financial relationships that


