Embed Size (px)
Citation preview

Seediscussions,stats,andauthorprofilesforthispublicationat:https://www.researchgate.net/publication/6576472
Molecularanalysisofhumanendometrium:Short-termtibolonesignalingdifferssignificantlyfromestrogenandestrogen+progestagensignaling
ARTICLEinJOURNALOFMOLECULARMEDICINE·JUNE2007
ImpactFactor:5.11·DOI:10.1007/s00109-006-0146-1·Source:PubMed
CITATIONS
14
READS
15
11AUTHORS,INCLUDING:
HeleniusJKloosterboer
KloosterboerConsultancyandconstructio…
123PUBLICATIONS3,320CITATIONS
SEEPROFILE
CurtWBurger
ErasmusUniversityRotterdam
109PUBLICATIONS2,968CITATIONS
SEEPROFILE
LeenBlok
ErasmusMC
89PUBLICATIONS2,493CITATIONS
SEEPROFILE
Availablefrom:LeenBlok
Retrievedon:03February2016

ORIGINAL ARTICLE
Molecular analysis of human endometrium: short-termtibolone signaling differs significantly from estrogenand estrogen + progestagen signaling
P. Hanifi-Moghaddam & B. Boers-Sijmons &
A. H. A. Klaassens & F. H. van Wijk &
M. A. den Bakker & M. C. Ott & G. L. Shipley &
H. A. M. Verheul & H. J. Kloosterboer & C. W. Burger &
L. J. Blok
Received: 31 August 2006 /Revised: 13 November 2006 /Accepted: 23 November 2006 / Published online: 17 January 2007# Springer-Verlag 2007
Abstract Tibolone, a tissue-selective compound with acombination of estrogenic, progestagenic, and androgenicproperties, is used as an alternative for estrogen or estrogenplus progesterone hormone therapy for the treatment ofsymptoms associated with menopause and osteoporosis.The current study compares the endometrial gene expres-sion profiles after short-term (21 days) treatment withtibolone to the profiles after treatment with estradiol-only
(E2) and E2 + medroxyprogesterone acetate (E2 + MPA) inhealthy postmenopausal women undergoing hysterectomyfor endometrial prolapse. The impact of E2 treatment onendometrial gene expression (799 genes) was much higherthan the effect of tibolone (173 genes) or E2 + MPAtreatment (174 genes). Furthermore, endometrial geneexpression profiles after tibolone treatment show a weaksimilarity to the profiles after E2 treatment (overlap 72
J Mol Med (2007) 85:471–480DOI 10.1007/s00109-006-0146-1
P. Hanifi-Moghaddam : L. J. Blok (*)Department of Reproduction and Development,Erasmus University Medical Center,P.O. Box 1738, 3000 DR Rotterdam, The Netherlandse-mail: [email protected]
B. Boers-Sijmons :A. H. A. Klaassens : F. H. van Wijk :C. W. Burger : L. J. BlokDepartment of Obstetrics and Gynecology,Erasmus University Medical Center,Rotterdam, The Netherlands
M. A. den BakkerDepartment of Pathology, Erasmus University Medical Center,Rotterdam, The Netherlands
M. C. OttOmniViz, Inc.,Maynard, MA, USA
G. L. ShipleyDepartment of Integrative Biology and Pharmacology,University of Texas Houston Health Science Center,Houston, TX, USA
H. A. M. Verheul :H. J. KloosterboerN.V. Organon,Oss, The Netherlands
PAYMAN HANIFI MOGHADDAM
received his Ph.D. in Immuno-genetics from Leiden UniversityMedical Centre, The Nether-lands. He is presently a SeniorResearch Scientist at theDepartment of MolecularDesign and Bioinformaticsat Organon N.V., Oss, TheNetherlands. His current re-search interests include systembiology and complex diseases.
LEEN J BLOK
received his Ph.D. in Biochem-istry from the ErasmusUniversity Rotterdam, TheNetherlands. He is presently anAssistant Professor at theDepartment of Obstetrics andGynaecology at the ErasmusUniversity Medical CenterRotterdam, The Netherlands.His current work involves stud-ies into normal and aberranthormone signaling in the femaleurogenital tract.

genes) and even less profile similarity to E2 + MPAtreatment (overlap 17 genes). Interestingly, 95 tibolone-specific genes were identified. Translation of profilesimilarity into biological processes and pathways showedthat ER-mediated downstream processes, such as cell cycleand cell proliferation, are not affected by E2 + MPA,slightly by tibolone, but are significantly affected by E2. Inconclusion, tibolone treatment results in a tibolone-specificgene expression profile in the human endometrium, whichshares only limited resemblance to E2 and even lessresemblance to E2 + MPA induced profiles.
Keywords Tibolone . Endometrium . Hormone replacementtherapy . Estrogen . Progestagen . Gene expression profiling
Introduction
Unopposed estrogen treatment increases the risk for endo-metrial hyperplasia and subsequent carcinoma. For examplein the HOPE study (Women’s Health, Osteoporosis, Proges-tin, Estrogen study [1, 2]) after 2 years of treatment withconjugated equine estrogens (CEE; 0.625 mg/day), the rateof hyperplasia went up to 27.7%. When the treatment wascombined with medroxyprogesterone acetate (MPA;2.5 mg), incidence of endometrial hyperplasia decreasedto the baseline incidence. Thus, the addition of progesta-gens is necessary for endometrial safety. Progestagenaddition, however, also causes negative side effects likewithdrawal bleeding and an increased breast cancerincidence that was recently documented in the Women’sHealth Initiative [3] and Million Women Study [4].
Tibolone is a synthetic steroid with a unique clinicalprofile within the currently available postmenopausaltherapeutic options. Tibolone shows a tissue-selective modeof action; in the vagina, brain, and bone, tibolone acts as anestrogen, whereas no or slight estrogenic stimulation hasbeen found in breast and endometrium [5–7]. The tissue-selective mode of action of tibolone and its metabolites isdue to the interplay between several mechanisms includingtissue-selective metabolism, enzymatic inactivation oractivation, and differential receptor binding.
During passage through the gastrointestinal tract and theliver, tibolone is converted into three metabolites: two OH-metabolites, 3α-OH-tibolone and 3β-OH-tibolone (exertingestrogenic effects and in vivo present in large amounts) [8],and the Δ4-isomer (exerting progestagenic and androgeniceffects, and in vivo in plasma only present for a relativelyshort period of time) [5, 9]. Besides the metabolism in theliver and intestine, metabolism of tibolone also takes placeinside target tissues. For example, the lack of stimulation ofthe human endometrium after long-term tibolone treatmentmay partly be explained by the dominant presence of the
Δ4-isomer of tibolone. Evidence in support of this tissue-selective metabolism has been found in several in vitro testsystems. Tang et al. [10] have demonstrated that tibolonecan locally be converted in endometrial explants to the Δ4-isomer, and conversion of the 3-OH-metabolites back totibolone, and subsequently to the Δ4-isomer, is anotherpossible mechanism that contributes to the local formationof Δ4-isomer [11]. Furthermore, our own work showed thatin an endometrial cancer cell line, the presence of bioactiveΔ4-isomer could indeed effectively counteract the estro-genic activity of tibolone [12, 13] resulting in a clearpredominant progestagenic effect.
In vivo, long-term tibolone use has been shown not tostimulate the human endometrium, although in clinicalpractice, especially at the beginning of a treatment,increased episodes of spotting and bleeding are observed.In a clinical study, for the first time, we investigated theshort-term (21 days) effects of tibolone on endometrialhistology and gene expression. Previously, we publishedthe histological data [14] and biochemical findings [15],and now we present the molecular changes observed byanalyzing gene expression profiles. The effects of short-term (21 days) treatment with tibolone were compared tothe effects of estradiol alone (E2) and E2 + MPA.
Materials and methods
Participants
This study was designed as a controlled clinical trial. The trialwas registered with National Institutes of Health, registrynumber NCT00294463, found at http://www.clinicaltrials.gov, under the name of Effects of Tibolone Treatment on theEndometrium. Patients who visited our clinics to undergovaginal hysterectomy for treatment of prolapse were eligibleto participate in this study. A description of the inclusion andexclusion criteria and the histological findings of the currentexperiments were documented earlier [14].
The trial was performed in the period before thescheduled surgery. After informed consent, the patientswere sequentially assigned to one of the followingtreatment groups: control group (no hormonal treatment);tibolone group (2.5 mg tibolone (Livial, N.V. Organon,Oss, The Netherlands) administered orally every day,starting 21 days prior to surgery); E2 group (2 mg ofestradiol administered orally every day, starting 21 daysbefore surgery); E2 + MPA group (2 mg estradiol + 5 mgMPA administered orally every day, starting 21 days beforesurgery). The investigators were kept blinded to the patienttreatments during sex hormone-binding globulin (SHBG)measurements (Fig. 1), the cluster and correlation (Fig. 2)analyses, and during validation reverse transcription poly-
472 J Mol Med (2007) 85:471–480

merase chain reaction (RT-PCR; Fig. 4). Investigationswere conducted in accordance with the guidelines in TheDeclaration of Helsinki, and the local ethics committees ofthe participating hospitals approved the study protocol.
Measurement of sex hormone-binding globulin
Sera were collected before the start of treatment and atsurgery, processed and stored at −20°C until measurement.SHBG was measured in sera of the different patient groupsby ABL (Assen, The Netherlands) with a commercially
available and validated AutoDelphia immunoassay andusing the automatic Delfia system 1235 (Wallac Oy, Turku,Finland). The accuracy ranged from 101.1 to 110.9% with acoefficient of variation expressed as percentage of the meanof 1.5–1.8%. By measuring the SHBG values we were ableto verify compliance of the patients to the treatments.
Isolation of pure endometrial tissue and subsequent RNAisolation
Immediately after hysterectomy (within 10 min), part of theuterus was dissected and snap-frozen for RNA isolation.Frozen tissue samples were embedded and 5-μm sectionswere collected in batches of ten. Each first and last section insuch a series was stained and evaluated under the microscopefor the percentage of endometrium and myometrium. Onlythose batches with 100% pure endometrial tissue wereselected for RNA isolation. Tissues were homogenized bysonication and RNA was isolated using Trizol (Invitrogen,Life Technologies, Philadelphia, PA, USA). The concentra-tion, quality, and purity of RNAwere assessed with the use ofthe RNA 6000 Nano assay on the Agilent 2100 Bioanalyzer(Agilent, Palo Alto, CA, USA). Only those RNA samples thatshowed no sign of degradation or contamination by DNAwere used for gene expression profiling.
Con
trol
# 2
Con
trol
# 3
8C
ontr
ol #
21
Con
trol
# 1
2C
ontr
ol #
17
E2+
MP
A #
4E
2+M
PA
# 9
E2+
MP
A #
14
E2+
MP
A #
25
E2+
MP
A #
29
E2+
MP
A #
19
Con
trol
# 2
2C
ontr
ol #
37
Con
trol
# 3
3T
ibol
one
# 1
Tib
olon
e #
26T
ibol
one
# 30
Tib
olon
e #
32T
ibol
one
# 6
Tib
olon
e #
11T
ibol
one
# 16
E2
# 13
E2
# 3
E2
# 8
E2
# 28
E2
# 23
E2
# 24
E2
# 36
a b
Tibolone # 11Tibolone # 32Tibolone # 26Tibolone # 30Tibolone # 1
Tibolone # 16Tibolone # 6
E2 # 28E2 # 8E2 # 3
E2 # 24E2 # 36E2 # 13E2 # 23
Control # 33Control # 22Control # 37Control # 2
Control # 21E2+MPA # 19E2+MPA # 9
E2+MPA # 14E2+MPA # 4
E2+MPA # 29E2+MPA # 25
Control # 38Control # 17Control # 12
Tib
olon
e #
11T
ibol
one
# 32
Tib
olon
e #
26T
ibol
one
# 30
Tib
olon
e #
1T
ibol
one
# 16
Tib
olon
e #
6E
2 #
28E
2 #
8E
2 #
3E
2 #
24E
2 #
36E
2 #
13E
2 #
23C
ontr
ol #
33
Con
trol
# 2
2C
ontr
ol #
37
Con
trol
# 2
Con
trol
# 2
1E
2+M
PA
# 1
9E
2+M
PA
# 9
E2+
MP
A #
14
E2+
MP
A #
4E
2+M
PA
# 2
9E
2+M
PA
# 2
5C
ontr
ol #
38
Con
trol
# 1
7C
ontr
ol #
12
Fig. 2 Cluster and correlation analyses of endometrial geneexpression profiles obtained after short-term (21 days) treatmentwith E2, E2 + MPA, or tibolone. Using statistical analysis, it wasestablished that 3,293 probe sets (representing 2,312 known and 466unknown genes) deviated at least threefold, in at least one patientsample, from the geometrical means of all treated samples. Thesegenes were used for the cluster and correlation analyses. a At the
bottom of the figure, relatedness is indicated. Red indicates genes witha higher expression relative to the geometrical means, while blueindicates genes with a lower expression relative to the geometricalmeans. The numbers (#) behind the treatments indicate the patientnumbers. b The correlation values are between 1 (dark red, diagonalline) and −1 (dark blue, not represented here). The white boxesrepresent no correlation between profiles
Fig. 1 SHBG measurements before and after treatment. Sera werecollected for each patient just before the start of treatment (pre) and21 days later just before hysterectomy (post). The bold lines representthe averages of the measured values
J Mol Med (2007) 85:471–480 473

Gene expression profiling
Gene expression profiles of samples were generated withthe use of Affymetrix U133plus2 GeneChips containing54,614 probe sets, representing approximately 47,000transcripts (Affymetrix, Santa Clara, CA, USA). Onemicrogram of total RNA was used to prepare antisensebiotinylated RNA according to the Affymetrix protocol forgene chip experiments (http://www.affymetrix.com). Thelevel and quality of cRNA was measured on the Agilent2100 Bioanalyzer (Agilent). If a cRNA sample showed anyabnormal pattern, this sample was not used for furtheranalysis and new cRNA was generated. The cRNA wasfragmented with the GeneChip Sample Cleanup Module(Affymetrix). Hybridization, staining, washing, and scan-ning procedures were carried out as described in theGeneChip Expression Analysis technical manual (Affyme-trix). All GeneChips were visually inspected for irregular-ities. All array data is freely accessible from the ErasmusUniversity Medical Center database (ENDO_GROUP_PDATA at http://www.gatcplatform.nl/).
Data analyses
Similarity and correlation between expression profiles
Data normalization was done according to the quantilemethod [16]. Subsequently, all intensity values below 30were set at 30, since our methods reliably identify sampleswith an average intensity value of 30 or more but do notreliably discriminates values between 0 and 30. For eachprobe set, the geometrical mean of the hybridizationintensities of all samples from the subjects was calculated.The level of expression of each gene in every sample wasdetermined relative to this geometric mean and logarithmi-cally transformed (on a base 2 scale) to assign equal weightto gene expression levels with similar relative distances tothe geometrical mean. Deviation from the geometrical meanreflects differential gene expression. Genes whose level ofexpression differed at least threefold, in at least one samplefrom the geometrical means of all treated samples (reflectingup- or downregulation), were selected for further analysis.
The similarity and correlation between expressionprofiles of different treatment groups was investigated withthe use of cluster analysis and the Pearson’s correlation andVisualization tool of Omniviz (Ominviz, Maynard, MA,USA; version 3.8).
Identification of genes with significant differentialexpression
We used significance analysis of microarrays (SAM) [17],implemented in Omniviz to determine genes with signifi-
cantly differential expression between the treatment groups.SAM is a statistical method for identifying differentiallyexpressed genes while controlling the overall false discov-ery rate (FDR). FDR is the percentage of genes identifiedby chance. We have chosen the settings for this analysis insuch a way that the total number of falsely identifieddifferential expressed genes was less than 1 (this meansthat the p value for a certain SAM analysis is smaller than1/number of calculated differentially expressed genes).
Functional and biological classification of genes
The classification of genes into biological processesand functional analyses was done using DAVID (http://david.abcc.ncifcrf.gov), Panther (http://www.panther.appliedbiosystems.com), and Ingenuity Pathway software(http://www.ingenuity.com). In order to identify biologicalprocesses with significantly enriched or depleted genenumbers, the distribution of genes in each hormone-regulated gene list for a particular biological process wascompared to that in a reference gene list. Since aninappropriate reference list would lead to wrongful identi-fication of regulated biological processes, we used tworeference lists: the Affymetrix 133Uplus2 gene list and theNCBI human gene list (n=23,481). The enrichment ordepletion of genes, compared to the NCBI reference list, ina certain biological process indicates significant hormonalregulation (p<10−4). The reason for using different classi-fication software and databases was to verify consistency ofclassification and to enhance reliability of the results.
Real-time quantitative PCR verifications
Validation of microarray expression data was accomplishedby real-time quantitative PCR (RT-qPCR) on ten selectedgenes: CCND1 (cyclinD1), ERα (estrogen receptor α), ERβ(estrogen receptor β), TFF3 (Trefoil factor 3), IGFBP3(insulin-like growth factor binding protein 3), IGF1(insulin-like growth factor 1), VEGF (vascular endothelialgrowth factor), PR (progesterone receptor), CSPG2 (versi-can), HSD17B2 (hydroxysteroid [17] dehydrogenase 2).RT-qPCR was done as previously described [18]. Thesequences of primers and probes used in this study areavailable upon request.
Results
Participants
In total, 30 out of 33 eligible postmenopausal patientsparticipated in this study. The E2 group originally includedeight subjects, but one patient was excluded on the basis of
474 J Mol Med (2007) 85:471–480
a double layer endometrial thickness preceding 4 mm. TheE2 + MPA group originally also included eight subjects, butone patient was excluded on the basis of an abnormalcervical Pap smear test, while another patient had to beexcluded because her surgery was rescheduled. Patients inthe different groups were comparable with respect to age,number of menstrual years, years after menopause, endo-metrial thickness, and body mass index at screening [14].
Different steroid hormone treatments have been reportedin the literature to result in specific changes in the SHBGconcentrations: estrogen treatment will result in an increasein the SHBG levels while tibolone’s androgenic actions inthe liver will result in a reduction of the SHBG levels [19].Therefore, SHBG levels were measured in serum becauseregular use of medication will be reflected in the SHBGlevels. In Fig. 1, it is shown that E2 and E2 + MPAtreatments indeed resulted in a significant increase in serumSHBG levels in all, except one, subjects, while tibolonetreatment resulted in a significant decrease in SHBG levelsin all treated subjects.
Similarity and correlation between expression profiles
Cluster and correlation analysis allows us to visually assessthe similarity between and within groups. The unsupervisedcluster analysis (Fig. 2a) show that endometrial profiles ofcontrol and E2 + MPA treated patients cluster together. Thefact that control samples cluster in two subgroups indicatesa high intra-individual variation. The endometrial profilesof tibolone- and E2-treated patients form the second maincluster. In this cluster, most endometrial profiles fromtibolone- and E2-treated patients separate in two subclus-ters, indicating a higher profile correlation within bothtreatment groups than between treatment groups.
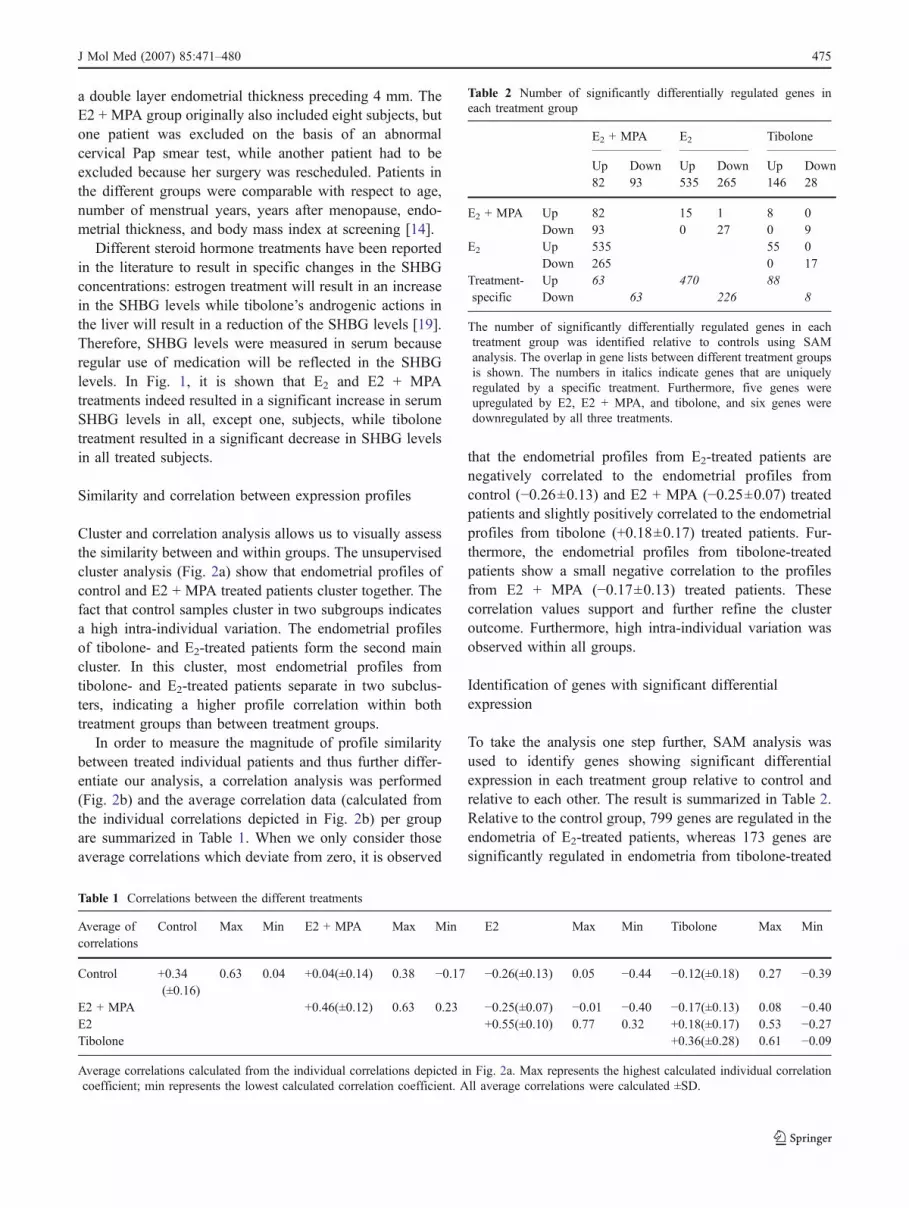
In order to measure the magnitude of profile similaritybetween treated individual patients and thus further differ-entiate our analysis, a correlation analysis was performed(Fig. 2b) and the average correlation data (calculated fromthe individual correlations depicted in Fig. 2b) per groupare summarized in Table 1. When we only consider thoseaverage correlations which deviate from zero, it is observed
that the endometrial profiles from E2-treated patients arenegatively correlated to the endometrial profiles fromcontrol (−0.26±0.13) and E2 + MPA (−0.25±0.07) treatedpatients and slightly positively correlated to the endometrialprofiles from tibolone (+0.18±0.17) treated patients. Fur-thermore, the endometrial profiles from tibolone-treatedpatients show a small negative correlation to the profilesfrom E2 + MPA (−0.17±0.13) treated patients. Thesecorrelation values support and further refine the clusteroutcome. Furthermore, high intra-individual variation wasobserved within all groups.
Identification of genes with significant differentialexpression
To take the analysis one step further, SAM analysis wasused to identify genes showing significant differentialexpression in each treatment group relative to control andrelative to each other. The result is summarized in Table 2.Relative to the control group, 799 genes are regulated in theendometria of E2-treated patients, whereas 173 genes aresignificantly regulated in endometria from tibolone-treated
Table 1 Correlations between the different treatments
Average ofcorrelations
Control Max Min E2 + MPA Max Min E2 Max Min Tibolone Max Min
Control +0.34(±0.16)
0.63 0.04 +0.04(±0.14) 0.38 −0.17 −0.26(±0.13) 0.05 −0.44 −0.12(±0.18) 0.27 −0.39
E2 + MPA +0.46(±0.12) 0.63 0.23 −0.25(±0.07) −0.01 −0.40 −0.17(±0.13) 0.08 −0.40E2 +0.55(±0.10) 0.77 0.32 +0.18(±0.17) 0.53 −0.27Tibolone +0.36(±0.28) 0.61 −0.09
Average correlations calculated from the individual correlations depicted in Fig. 2a. Max represents the highest calculated individual correlationcoefficient; min represents the lowest calculated correlation coefficient. All average correlations were calculated ±SD.
Table 2 Number of significantly differentially regulated genes ineach treatment group
E2 + MPA E2 Tibolone
Up Down Up Down Up Down82 93 535 265 146 28
E2 + MPA Up 82 15 1 8 0Down 93 0 27 0 9
E2 Up 535 55 0Down 265 0 17
Treatment-specific
Up 63 470 88Down 63 226 8
The number of significantly differentially regulated genes in eachtreatment group was identified relative to controls using SAManalysis. The overlap in gene lists between different treatment groupsis shown. The numbers in italics indicate genes that are uniquelyregulated by a specific treatment. Furthermore, five genes wereupregulated by E2, E2 + MPA, and tibolone, and six genes weredownregulated by all three treatments.
J Mol Med (2007) 85:471–480 475

476 J Mol Med (2007) 85:471–480

patients, and 174 genes are significantly regulated inendometria from E2 + MPA treated patients. These resultsindicate that E2 treatment has a much higher impact onendometrial RNA expression than the other treatments.
Upon evaluating the overlap in signaling, it was observedthat 9% of E2-regulated genes are also regulated by tibolone(72 out of 799) and 5% are also regulated by E2 + MPA
treatment (43 out of 799). The overlap between tiboloneand E2 + MPA treatment is about 10% (17 out of 173) andbetween tibolone and E2 treatment is 42% (72 out of 173).Most regulated genes, however, are not regulated by morethan one treatment. These results indicate that all threetreatments result in modulation of expression of, for themajority, uniquely regulated genes (the numbers of unique-ly regulated genes are indicated by the italicized numbers inTable 2) and that a subset of tibolone-regulated genes(42%) overlaps with a limited fraction (9%) of E2-regulatedgenes. The gene list resulting from the SAM analysis isposted at http://www2.eur.nl/fgg/rede/hanifi_moghaddam/.
Functional and biological classification of genes
To gain insight into biological processes affected by thedifferent hormonal treatments (relative to control), genes
Real Time RT-PCR
0
2
4
6
8
10
12
14
16
18
20
Cyclin
D1ERa
ERb
Trefo
il Fac
tor 3
IGFBP3
IGF1
VEGF PR
Versic
an
HSD17B2
Array
0
20
40
60
80
100
120
Cyclin
D1ERa
ERb
Trefo
il Fac
tor 3
IGFBP3
IGF1
VEGF PR
Versic
an
HSD17B2
Fig. 4 Array data compared toRT-PCR results. The array sig-nal intensities (top) of testedgenes were normalized relativeto GAPDH. The RT-PCR sig-nals (bottom) were normalizedrelative to 18sRNA signals.Solid black bars represent datafrom control patients, solidwhite bars represent data fromtibolone-treated patients, dashedgray bars represent data fromE2 + MPA treated patients, andthe solid gray bars representdata from E2-treated patients
�Fig. 3 A gene expression network of E2- and tibolone-regulatedgenes involved in the regulation of the cell cycle. From top to bottom,genes are acting in extracellular space, plasma membrane, cytoplasm,or nucleus. The colors indicate upregulation (red), downregulation(green) or no regulation (not colored). The intensity of colors indicatesthe magnitude of regulation (darker means more pronounced).Relations between genes are indicated with gray lines and functionsof genes by the shape of the gene name boxes. Rectangle Nuclearreceptor, square cytokine, vertical diamond enzyme, horizontaldiamond peptidase, triangle kinase, quadrangle transporter, ellipsetranscription factor, circle other function
J Mol Med (2007) 85:471–480 477

significantly regulated in each treatment group were classi-fied into biological processes (Supplementary Table 3 postedat http://www2.eur.nl/fgg/rede/hanifi_moghaddam/).
The overlap between E2 and tibolone treatment wasfurther evaluated at the level of the cell cycle. In total 112cell cycle genes were regulated by E2 (87 genes upregu-lated, 25 genes downregulated). The E2 treatment sharedonly 18 genes with the tibolone treatment (a total of 22 cellcycle genes were regulated by tibolone treatment). In Fig. 3most of these data were placed in a gene expressionnetwork containing information on the gene name, degreeof downregulation or upregulation, general function, con-nectivity to other genes in the network, and general site ofaction. As indicated by number of regulated genes and theintensities of the colors in Fig. 3, it is clear that E2 treatmenthas a far more pronounced effect on cell cycle genes thantibolone. Survey of the overlapping genes showed that themajority of genes belonged to the families of enzymes andtranscription regulators, and out of the 15 transcriptionregulators that were regulated by E2, only one was alsoregulated by tibolone treatment (Fig. 3). The gene list usedto generate Fig. 3 is posted at http://www2.eur.nl/fgg/rede/hanifi_moghaddam/.
Verification of array results
In Fig. 4, the average outcomes of the quantitative PCRanalysis on CCND1, TFF3, IGFBP3, IGF1, VEGF, CSPG2,ERα, ERβ, PRB, and HSD17B2 are compared to theaverage outcomes of the microarray experiments. Althoughthe absolute values cannot be compared, it was observedthat the RT-qPCR values resembled the microarray dataquite well.
Discussion
The current study is part of a multidisciplinary effort(histological, biochemical, and molecular) to document short-term (21 days) effects of tibolone on the human postmeno-pausal endometrium, in comparison to the effects of short-termE2 and E2 + MPA treatments. In this report we show for thefirst time that the 21-day treatment of postmenopausalpatients with E2, E2 + MPA, or tibolone results in uniquechanges in the endometrial gene expression profiles.
Gene expression profiles and regulated processes
Based on the results of cluster and correlation analyses, weshowed that the endometrial profiles after tibolone treat-ment display a weak similarity to the profiles after E2
treatment and no similarity to control profiles or profilesafter E2 + MPA treatment. Upon analyzing the actual
numbers of significantly regulated genes and the overlap ingene regulation between the treatments, this observationcould be refined further. Based on the number of regulatedgenes, it was determined that the impact of E2 treatment(799 significantly regulated genes) on endometrial geneexpression was much more pronounced than the impact ofthe E2 + MPA (174 significantly regulated) or tibolone (173significantly regulated genes) treatments. Furthermore, alltreatments resulted in regulation of mostly treatment-specific genes: 87% (695 out of 799) of E2-regulated geneswere E2-specific, 72% (125 out of 174) of E2 + MPAregulated genes were treatment-specific, and 55% (95 outof 173) of tibolone regulated genes were tibolone-specific.The overlap in gene regulation between the treatmentsshowed the highest overlap between tibolone- and E2-regulated genes. The absolute number of overlapping genesis 72, which represents 42% of tibolone regulated genes,but only 9% of E2 regulated genes. This indicates thattibolone treatment results in regulation of a minor subset ofE2-regulated genes. It should also be noted in this respectthat the fold modulation of these tibolone/E2-regulatedgenes is much more pronounced in the endometria of E2-treated women (average fold induction is 2.93) than in theendometria of the tibolone-treated women (average foldinduction is 1.97).
Subsequently, the regulated genes were classified intobiological processes. Treatment of women with E2 + MPAdoes not result in the regulation of any, by the Pantherdatabase predefined, biological processes. This result wasnot totally unexpected because cluster and correlationanalysis grouped the endometrial profiles after E2 + MPAtreatment with the endometrial profiles of untreated women(control). However, upon a gene to gene base review ofexpression, we could show specific regulation of a numberof implantation- and decidualization-related genes: fibrillin[20], hydroxyprostaglandin dehydrogenase [21], glycodelin[22], IGFBP1 [23], LEFTY2 [24], osteopontin [25],granzymeA and B [26], glutathione peroxidase [27] andmore. Regulation of these genes is consistent with aprofound effect of progesterone on implantation and earlypregnancy.
It was also shown that tibolone and E2 treatments resultin significant regulation of processes involved in cell cycleregulation. Upon placing the E2- and tibolone-regulatedgenes involved in cell cycle regulation in one geneexpression network, it becomes clear that estrogens regulatethe cell cycle far more extensively than tibolone does.
Comparing the molecular data with earlier assessedhistological data
Before treatment started, all patients were assessed aspostmenopausal with an inactive endometrium. Upon
478 J Mol Med (2007) 85:471–480

measuring endometrial thickness after treatment, effects ofthe hormonal substitutions were observed [14]. Endometrialthickness increased by 0.5 mm to 1.0 mm (±0.1) aftertibolone treatment, increased to 1.1 mm ((±0.6) after E2 +MPA treatment, and increased to 2.6 mm ((±1.6) after E2
treatment. Assessment of proliferation showed an atrophic/inactive endometrium in the control and E2 + MPA group.Tibolone treatment resulted in a small stimulation, while theendometria of E2-only treated women displayed pro-nounced stimulation. Using Ki67 staining (a marker formitotic activity), the increment in proliferation could beassessed. In tibolone-treated endometria in comparison tocontrol, Ki67 showed 3.5-fold more staining in stromal andapproximately the same staining in glandular cells. For E2 +MPA treatment, these figures were 6.5-fold more instromal and 0.5-fold less in glandular cell, while for E2-only treatment, again there was pronounced stimulation:26.5-fold more staining in stromal cells and 6.6-fold morestaining in glandular cells (microarrays showed significantupregulation of MKI67 only in E2 treated patients). Theoverall conclusion of the histological evaluation was thatshort-term (21 days) tibolone and E2 + MPA treatmentsresulted in a small stimulation of proliferation of mostly thestromal compartment of the endometrium, and that thisstimulation clearly differed from E2 stimulation of theendometrium. Furthermore, it was also clear that thetibolone and E2 + MPA treatments did not display exactlythe same effects on the endometria. Upon comparing thehistological findings with the currently discussed molecularfindings it is clear that both sets of data, for most part, resultin very similar conclusions.
Comparing the molecular data with earlier assessedbiochemical [15] data
During passage through the liver and gastrointestinal tract,tibolone is converted into three metabolites: two hydroxymetabolites, 3α-OH-tibolone and 3β-OH-tibolone (exertingestrogenic effects), and the Δ4-isomer (exerting progesta-genic and androgenic effects) [7, 9]. Hormone measurementsshowed that the metabolite patterns of tibolone in myome-trium (due to tissue shortage the myometrial layer justbeneath the endometrium was used for measuring hormones)are different from those in serum [15]. Whereas low levels ofbioactive metabolites (unconjugated) are found in serum,Δ4-isomer levels are high in the myometrium of mostwomen. This indicates that biochemically in serum, tibolonedisplays weak estrogenic activity, while in the uterus,tibolone progestagenic activities are more pronounced. Thisbiochemical finding is of interest because it may help explainwhy the short-term effects of tibolone on gene expression arepronouncedly different from the effects of E2 alone and alsodifferent from the effects of E2 + MPA.
In summary, by making use of state of the artbioinformatic tools, a detailed analysis could be conducted,which refined our initial cluster analysis and showed thattibolone signaling displays a very limited overlap withestrogen signaling, that tibolone displays no overlap withE2 + MPA signaling, and that tibolone treatment resultsmostly in regulation of a treatment-specific set of genes inthe endometrium. Furthermore, the current data are inagreement with the earlier published histological assess-ment of the same endometrial tissues and seem to besupported by the biochemical assessment of the metabolitesof tibolone.
Acknowledgement This work was sponsored by N.V. Organon,Oss, The Netherlands.
References
1. Pickar JH, Yeh IT, Wheeler JE, Cunnane MF, Speroff L (2003)Endometrial effects of lower doses of conjugated equine estrogensand medroxyprogesterone acetate: two-year substudy results.Fertil Steril 80:1234–1240
2. Pickar JH, Yeh I, Wheeler JE, Cunnane MF, Speroff L (2001)Endometrial effects of lower doses of conjugated equine estrogensand medroxyprogesterone acetate. Fertil Steril 76:25–31
3. Anderson GL, Limacher M, Assaf AR, Bassford T, Beresford SA,Black H, Bonds D, Brunner R, Brzyski R, Caan B, Chlebowski R,Curb D, Gass M, Hays J, Heiss G, Hendrix S, Howard BV, Hsia J,Hubbell A, Jackson R, Johnson KC, Judd H, Kotchen JM, KullerL, LaCroix AZ, Lane D, Langer RD, Lasser N, Lewis CE,Manson J, Margolis K, Ockene J, O’Sullivan MJ, Phillips L,Prentice RL, Ritenbaugh C, Robbins J, Rossouw JE, Sarto G,Stefanick ML, Van Horn L, Wactawski-Wende J, Wallace R,Wassertheil-Smoller S; Women’s Health Initiative Steering Com-mittee (2004) Effects of conjugated equine estrogen in postmen-opausal women with hysterectomy: the Women’s Health Initiativerandomized controlled trial. JAMA 291:1701–1712
4. Beral V, Million Women Study Collaborators (2003) Breastcancer and hormone-replacement therapy in the Million WomenStudy. Lancet 362:419–427
5. Kloosterboer HJ (2004) Tissue-selectivity: the mechanism ofaction of tibolone. Maturitas 48(Suppl 1):S30–S40
6. Kloosterboer HJ (2004) Tissue-selective effects of tibolone on thebreast. Maturitas 49:S5–S15
7. Kloosterboer HJ (2001) Tibolone: a steroid with a tissue-specificmode of action. J Steroid Biochem Mol Biol 76:231–238
8. Timmer CJ, Verheul HA, Doorstam DP (2002) Pharmacokineticsof tibolone in early and late postmenopausal women. Br J ClinPharmacol 54:101–106
9. de Gooyer ME, Deckers GH, Schoonen WG, Verheul HA,Kloosterboer HJ (2003) Receptor profiling and endocrine inter-actions of tibolone. Steroids 68:21–30
10. Tang B, Markiewicz L, Kloosterboer HJ, Gurpide E (1993)Human endometrial 3 beta-hydroxysteroid dehydrogenase/isom-erase can locally reduce intrinsic estrogenic/progestagenic activityratios of a steroidal drug (Org OD 14). J Steroid Biochem MolBiol 45:345–351
11. Schatz F, Kuczynski E, Kloosterboer HJ, Buchwalder L, Tang C,Krikun G, Lockwood CJ (2005) Tibolone and its metabolitesenhance tissue factor and PAI-1 expression in human endometrial
J Mol Med (2007) 85:471–480 479
stromal cells: evidence of progestogenic effects. Steroids 70:840–845
12. Hanifi-Moghaddam P, Gielen SC, Kloosterboer HJ, De GooyerME, Sijbers AM, van Gool AJ, Smid M, Moorhouse M, van WijkFH, Burger CW, Blok LJ (2005) Molecular portrait of theprogestagenic and estrogenic actions of tibolone: behavior ofcellular networks in response to tibolone. J Clin Endocrinol Metab90:973–983
13. Falany JL, Macrina N, Falany CN (2004) Sulfation of tiboloneand tibolone metabolites by expressed human cytosolic sulfo-transferases. J Steroid Biochem Mol Biol 88:383–391
14. Klaassens AH, van Wijk FH, Hanifi-Moghaddam P, Sijmons B,Ewing PC, Ten Kate-Booij MJ, Kooi GS, Kloosterboer HJ, BlokLJ, Burger CW (2006) Histological and immunohistochemicalevaluation of postmenopausal endometrium after 3 weeks oftreatment with tibolone, estrogen only, or estrogen plus progesta-gen. Fertil Steril 86:352–361
15. Verheul HAM, Blok LJ, Burger CW, Hanifi-Moghaddam P,Kloosterboer HJ (2006) Levels of unconjugated and sulfatedmetabolites of tibolone and estradiol in serum, myometrium andvagina of postmenopausal women treated for 21 days withtibolone, estradiol or estradiol plus medroxyprogesterone acetate.J Soc Gynecol Investig (in press)
16. Bolstad BM, Irizarry RA, Astrand M, Speed TP (2003) Acomparison of normalization methods for high density oligonu-cleotide array data based on variance and bias. Bioinformatics19:185–193
17. Tusher VG, Tibshirani R, Chu G (2001) Significance analysis ofmicroarrays applied to the ionizing radiation response. Proc NatlAcad Sci USA 98:5116–5121
18. Deng L, Shipley GL, Loose-Mitchell DS, Stancel GM, BroaddusR, Pickar JH, Davies PJ (2003) Coordinate regulation of theproduction and signaling of retinoic acid by estrogen in the humanendometrium. J Clin Endocrinol Metab 88:2157–2163
19. Odmark IS, Carlstrom K, Jonsson B, Jonasson AF (2006)Conjugated estrogen/progestagen versus tibolone hormone re-
placement therapy in postmenopausal women: effects on carbo-hydrate metabolism and serum sex hormone-binding globulin.Maturitas 53:89–96
20. Fleming S, Bell SC (1997) Localization of fibrillin-1 in humanendometrium and decidua during the menstrual cycle andpregnancy. Hum Reprod 12:2051–2056
21. Cameron ST, Critchley HO, Buckley CH, Kelly RW, Baird DT(1997) Effect of two antiprogestins (mifepristone and onapristone)on endometrial factors of potential importance for implantation.Fertil Steril 67:1046–1053
22. Mueller MD, Vigne JL, Vaisse C, Taylor RN (2000) Glycodelin:a pane in the implantation window. Semin Reprod Med 18:289–298
23. Kim JJ, Fazleabas AT (2004) Uterine receptivity and implantation:the regulation and action of insulin-like growth factor bindingprotein-1 (IGFBP-1), HOXA10 and forkhead transcription factor-1 (FOXO-1) in the baboon endometrium. Reprod Biol Endocrinol2:34
24. Tang M, Mikhailik A, Pauli I, Giudice LC, Fazelabas AT, Tulac S,Carson DD, Kaufman DG, Barbier C, Creemers JW, Tabibzadeh S(2005) Decidual differentiation of stromal cells promotes propro-tein convertase 5/6 expression and lefty processing. Endocrinology146:5313–5320
25. von Wolff M, Bohlmann MK, Fiedler C, Ursel S, Strowitzki T(2004) Osteopontin is up-regulated in human decidual stromalcells. Fertil Steril 81(Suppl 1):741–748
26. Hayakawa S, Nagai N, Kanaeda T, Karasaki-Suzuki M, Ishii M,Chishima F, Satoh K (1999) Interleukin-12 augments cytolyticactivity of peripheral and decidual lymphocytes against chorio-carcinoma cell lines and primary culture human placentaltrophoblasts. Am J Reprod Immunol 41:320–329
27. Riesewijk A, Martin J, van Os R, Horcajadas JA, Polman J,Pellicer A, Mosselman S, Simon C (2003) Gene expressionprofiling of human endometrial receptivity on days LH+2versus LH+7 by microarray technology. Mol Hum Reprod 9:253–264
480 J Mol Med (2007) 85:471–480


