Embed Size (px)
Citation preview
ORIGINAL PAPER
Molecular characterization and mRNA expression of grp78and hsp90A in the estuarine copepod Eurytemora affinis
Benoit Xuereb & Joëlle Forget-Leray & Sami Souissi &Olivier Glippa & David Devreker & Teddy Lesueur &
Sabine Marie & Jean-Michel Danger &
Céline Boulangé-Lecomte
Received: 1 September 2011 /Revised: 9 December 2011 /Accepted: 3 January 2012 /Published online: 1 February 2012# Cell Stress Society International 2012
Abstract The present study aimed to develop a method ofquantification of heat shock protein transcript levels in theestuarine copepod Eurytemora affinis. For that, the full-length cDNA of the 78-kDa glucose-regulated protein (Ea-grp78) and the cytosolic 90-kDa heat shock protein (Ea-hsp90A) from this species have been cloned. These cDNArevealed, respectively, 2,370 and 2,299 bp with 1,971 and2,124 bp open reading frames encoding 656 and 707 aminoacids. Main features, sequence identities and phylogeneticanalysis with other species were described. Then, the ex-pression profiles were analysed using reverse transcription/real-time quantitative PCR method from copepods subjectedto different thermic and osmotic stresses in laboratory, andfrom copepods directly sampled into the natural populationof the Seine Estuary (France) along a salinity gradient.Thermic shock (7.5°C, 22.5°C and 30°C during 90 min)significantly induced increases of transcript quantities
ranged between 1.7- and 19.7-fold the levels observed incontrol conditions (15°C). Hypo- and hyper-osmotic shocks(salinities of 1 and 30 during 90 min) caused a 2-foldinduction of Ea-hsp90A transcript level in comparison tocontrols (salinity of 15) whereas no significant change wasmeasured for Ea-grp78. On the other hand, similar expres-sion profiles were observed for the two transcripts after 72 hof exposition to salinities of 1 and 25 with a significant 2-fold induction observed for the lower salinity. To finish,strong expression inductions of both Ea-grp78 and Ea-hsp90A genes were observed in field copepods sampled atlow salinity during the campaigns of June 2009 and May2010. These results tend to show that the low salinity andthe increase of temperature seem to have a synergic effect onstress condition of copepods.
Keywords Abiotic stress . Copepod . Estuary .
Glucose-regulated protein 78 . Heat shock protein 90
Introduction
The capacity to cope with the insults of environmentalphysical and chemical fluctuations is an essential process,which directly impacts the biogeographical distribution andinteraction of aquatic species. Nowadays, the understandingof variations of physiological traits over large spatial scalesand the ecological significance of the observed variationsare emerging as central questions in ecological physiology(Hofmann 2005). Under stress conditions, cellular functionsand homeostasis are maintained through highly conservedcellular defence mechanisms. One of the most characterizedstress responses is the induction of an evolutionally con-served set of polypeptides termed heat shock proteins(HSPs).
B. Xuereb (*) : J. Forget-Leray : T. Lesueur : S. Marie :J.-M. Danger : C. Boulangé-LecomteFaculté des Sciences et Techniques du Havre, Laboratoired’Ecotoxicologie-Milieux Aquatiques (UPRES EA3222),Fédération SCALE 4116, GDR Ifremer-INRA EXECO,25 Rue Philippe Lebon,76058 Le Havre, Francee-mail: [email protected]
S. Souissi :O. Glippa :D. DevrekerUniversité Lille Nord de France,59000 Lille, France
S. Souissi :O. Glippa :D. DevrekerUSTL, LOG, Station Marine de Wimereux,62930 Wimereux, France
S. Souissi :O. Glippa :D. DevrekerCNRS, UMR 8187,62930 Wimereux, France
Cell Stress and Chaperones (2012) 17:457–472DOI 10.1007/s12192-012-0323-9
HSPs are a large group of molecular chaperones that arefound from prokaryotes to vertebrates and higher plants. HSPsplay an important role in transport, folding, unfolding, assem-bly and disassembly of multi-structured units and degradationof misfolded or aggregated proteins (Mayer and Bukau 2005for review). These tasks are fundamental in many normalcellular processes; however, the need for molecular chaper-ones is accelerated under stressful conditions that could po-tentially damage cellular and molecular structures in cells.HSPs synthesis has been shown to be up-regulated in responseto a wide variety of environmental insults such as thermalstresses, osmotic stresses, anoxia, ultraviolet light irradiation,exposure to inorganic and organic contaminants, as well asinfection by pathogens (Mouneyrac and Roméo 2011;Sørensen et al. 2003 for review). Thus, HSPs are importantfor recovery and survival of organisms (Lindquist 1986).More globally, it has been suggested that HSPs can play animportant role in the ecology and evolution of populations,notably for organisms inhabiting variable environments, mak-ing them interesting biomarkers of stress for ecological phys-iology approaches (Sørensen et al. 2003).
HSP70s and HSP90s are considered as the major chap-erones and constitute the most studied HSP families ineukaryotes. In most of eukaryotic cells, three forms ofHSP70s as well as HSP90s exist with different functionsand intracellular locations, i.e. mitochondrial or chloroplastorganelles, endoplasmic reticulum (ER) lumen and cyto-plasm (Chen et al. 2005a; Karlin and Brocchieri 1998).The mitochondrial and chloroplastic forms of HSP70s andHSP90s are more closely related to their respective prokary-otic counterparts, DnaK and Htpg, than the others eukary-otic forms. GRP78 (78-kDa glucose-regulated protein, alsoreferred to immunoglobulin binding protein BiP) andGRP94 (94-kDa glucose-regulated protein, also referred toHSP90B) are the ER paralogs of HSP70 and HSP90, respec-tively. GRP78 is evolutionary conserved from yeast tohumans, whereas GRP94 has only been identified in verte-brates (Lee 2001 for review). GRPs play notably a key role inthe unfolded protein response (UPR): an adaptive processwhich takes place in response to ER homeostasis disruptionssuch as accumulation of misfolded proteins, Ca2+ depletion oroxidative stress. The cytosolic forms can be divided into theconstitutive and inducible subgroups. Then, in large part ofeukaryotic organisms, the heat shock cognate (HSC) proteins70 that are expressed constitutively and are involved in normalcellular processes can be distinguished from the inducibleHSP70, which are produced under stress conditions. In verte-brates, two cytosolic forms of HSP90, HSP90AA (inducibleform) and HSP90AB (constitutive form), equally exist and arelikely to result from a gene duplication which occurred ap-proximately 500 million years ago (Chen et al. 2005a).
Estuarine aquatic wildlife and particularly zooplanktoniccommunity appears as an interesting model system to
investigate the role of physiological processes such as theHSP synthesis on the ecology of species. Indeed, estuariesare complex ecosystems, which are subjected to markedphysicochemical small-scale changes (mainly salinity, tur-bidity and current flow) associated with tidal cycles and tolarge-scale seasonal variations (essentially temperature). Ca-pacity of aquatic organisms to tolerate those environmentalvariations determines their spatio-temporal repartition alongthe estuarine gradient and their capacity to survive and tooverlap low tolerant-species in such a stressful environment(Laprise and Dodson 1994). The calanoid copepod Euryte-mora affinis is known to have physiological capacities toinvade freshwater environment through the saline gradientof estuaries (Lee 1999; Lee and Peterson 2003). As a result,this species is distributed in a large spectrum of habitatscharacterized by large range of salinity, from hyperhalinesalt marches to lakes and is one of the most commoncopepods of the northern hemisphere estuaries (Lee 1999).In the Seine Estuary (France), E. affinis dominates thezooplankton community during most of the year in theoligohaline and mesohaline zones (salinity from 2.5 to 18)and can frequently be found in the polyhaline zone (salinityfrom 18 to 30; Devreker et al. 2008; Mouny and Dauvin2002). E. affinis plays a key role in the food web of the lowsalinity zone of the Seine Estuary by being one of theprincipal consumers of phytoplankton and detritus and themost abundant prey for mysids, shrimp and fish (Dauvinand Desroy 2005). Due to its ecological interest, severalworks have investigated the effects of environmental factorson E. affinis life traits, its geographical distribution and/orits interactions with others species (Beyrend-Dur et al. 2009;Devreker et al. 2009; Kimmel et al. 2006 for example).However, much less is known about physiological eventsoccurring at lower biological levels. Only some studiesreported the influence of temperature and osmotic stresson pattern of total protein and/or HSP expression in thisspecies (e.g. Gonzalez and Bradley 1994; Hakimzadeh andBradley 1990; Kimmel and Bradley 2001). Although tradi-tional methods of protein expression analysis employed inthese studies are relevant approaches to elucidate the mech-anism of HSP regulation and expression, they rarely allowdiscriminating the different forms of HSP (ER, cytosolic,inducible or constitutive) and they generally require animportant quantity of organisms. An alternative and com-plementary approach is the use of transcriptomic methodsbased on the detection of mRNA. These methods, whichbenefit from the specificity and sensitivity of polymerasechain reaction (PCR)-based procedures, make it possible toinvestigate the role of genes coding for HSPs in greaterdetails. In addition, very little sample material is needed,making the study of small organisms such micro-crustaceanseasier. However, these methods require that the complemen-tary DNA (cDNA) of interest genes have been cloned. To
458 B. Xuereb et al.
date, the cDNA of HSP70 and HSP90 forms have been clonedfrom only one copepod species i.e. the marine harpacticoidTigriopus japonicus (Rhee et al. 2009). More generally, asunderlined by Luan et al. (2010), few reports exist on crusta-cean species.
In this context, the quantification of hsp gene expressionin estuarine copepod species such as E. affinis presents areal interest for ecological physiology practices at largespatial scales and could contribute to better understandthe role of HSPs for ecology and evolution of these crypticpopulations. The present study is a first step, which aims todevelop a method of quantification of hsp gene expressionin E. affinis with a view to future applications in ecologicalphysiology. The investigation was focused on forms ofHSP90 and HSP70 families. We implement here the dataon stress proteins in copepods: (1) the cDNA sequencesencoding grp78 and hsp90A transcripts in E. affinis werecloned and characterized (designed Ea-grp78 and Ea-hsp90), (2) their expression pattern were analysed by re-verse transcription/real-time quantitative PCR (RT-qPCR)from copepods subjected to different thermic and osmoticstresses in laboratory and (3) from copepods directly sam-pled into the natural population of the Seine Estuary along asalinity gradient.
Materials and methods
E. affinis sampling and culture
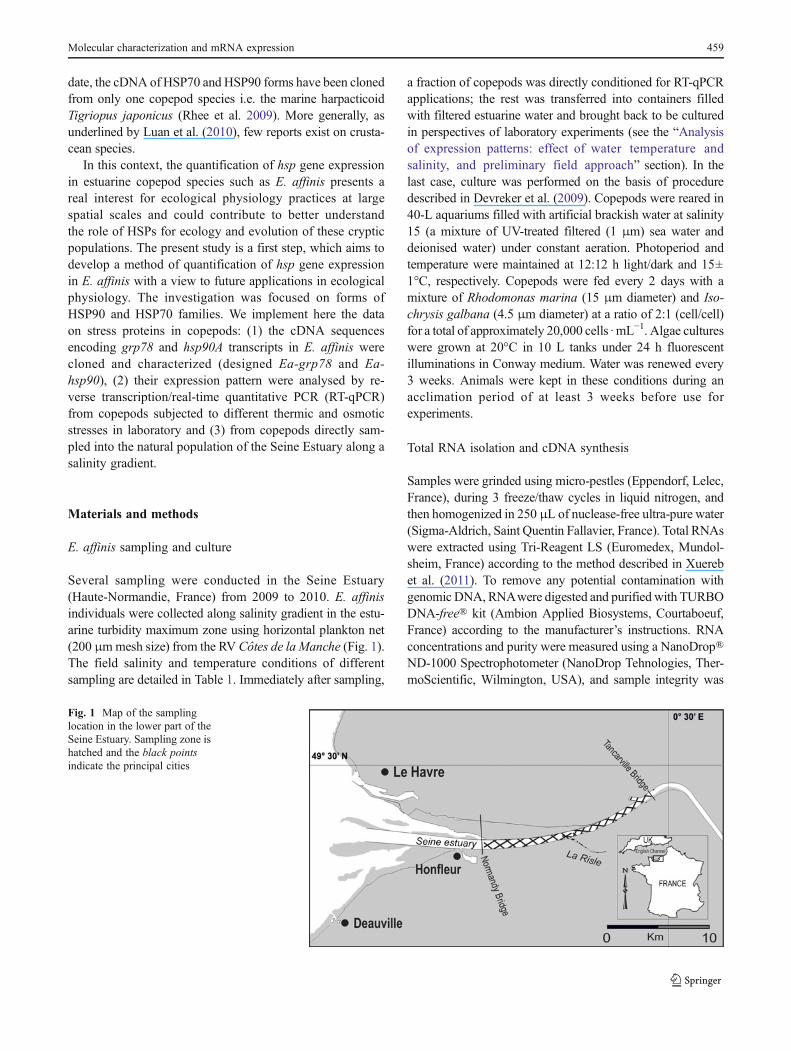
Several sampling were conducted in the Seine Estuary(Haute-Normandie, France) from 2009 to 2010. E. affinisindividuals were collected along salinity gradient in the estu-arine turbidity maximum zone using horizontal plankton net(200 μmmesh size) from the RV Côtes de la Manche (Fig. 1).The field salinity and temperature conditions of differentsampling are detailed in Table 1. Immediately after sampling,
a fraction of copepods was directly conditioned for RT-qPCRapplications; the rest was transferred into containers filledwith filtered estuarine water and brought back to be culturedin perspectives of laboratory experiments (see the “Analysisof expression patterns: effect of water temperature andsalinity, and preliminary field approach” section). In thelast case, culture was performed on the basis of proceduredescribed in Devreker et al. (2009). Copepods were reared in40-L aquariums filled with artificial brackish water at salinity15 (a mixture of UV-treated filtered (1 μm) sea water anddeionised water) under constant aeration. Photoperiod andtemperature were maintained at 12:12 h light/dark and 15±1°C, respectively. Copepods were fed every 2 days with amixture of Rhodomonas marina (15 μm diameter) and Iso-chrysis galbana (4.5 μm diameter) at a ratio of 2:1 (cell/cell)for a total of approximately 20,000 cells ·mL−1. Algae cultureswere grown at 20°C in 10 L tanks under 24 h fluorescentilluminations in Conway medium. Water was renewed every3 weeks. Animals were kept in these conditions during anacclimation period of at least 3 weeks before use forexperiments.
Total RNA isolation and cDNA synthesis
Samples were grinded using micro-pestles (Eppendorf, Lelec,France), during 3 freeze/thaw cycles in liquid nitrogen, andthen homogenized in 250 μL of nuclease-free ultra-pure water(Sigma-Aldrich, Saint Quentin Fallavier, France). Total RNAswere extracted using Tri-Reagent LS (Euromedex, Mundol-sheim, France) according to the method described in Xuerebet al. (2011). To remove any potential contamination withgenomic DNA, RNAwere digested and purified with TURBODNA-free® kit (Ambion Applied Biosystems, Courtaboeuf,France) according to the manufacturer’s instructions. RNAconcentrations and purity were measured using a NanoDrop®ND-1000 Spectrophotometer (NanoDrop Tehnologies, Ther-moScientific, Wilmington, USA), and sample integrity was
Fig. 1 Map of the samplinglocation in the lower part of theSeine Estuary. Sampling zone ishatched and the black pointsindicate the principal cities
Molecular characterization and mRNA expression 459
evaluated after RNA migration in a 2% agarose gel electro-phoresis, before storage at −80°C. Samples exhibited no RNAfragmentation and had 260:280 nm ratios upper than 1.8.Messenger RNA (mRNA) contained in 1 μg of total RNAwere reverse transcribed to complementary first-strand DNA(cDNA) with M-MLV reverse transcriptase Rnase H minus(Promega, Charbonnières, France) using oligo(dT)20 in pres-ence of Recombinant RNasin® Ribonuclease Inhibitor (Prom-ega) according to the method described in Xuereb et al.(2011). Finally, cDNAs (40 μL) were diluted in 60 μL ofultra-pure water and stored in 5 μL aliquots at −20°C.
cDNA cloning and characterization
Degenerate primers (DP) were designed from hsp70 andhsp90 cDNA sequences available on the GenBank databaseby using Primer 3 v.0.4.0 software (http://frodo.wi.mit.edu/primer3/; Table 2). PCR was performed using DyNAzymeTM
II PCR master mix (Finnzymes, Espoo, Finland) under thefollowing conditions: 95°C/4 min; 45 cycles of 95°C/30 s,50°C or 55°C/45 s, 72°C/1 min; and 72°C/5 min. Theamplified PCR products were isolated from 1.2% agarose gel,
cloned into pGEM®-T Vector System (Promega) and trans-formed into competent Escherichia coli cells XL1-Blue (Stra-tagene, Amsterdam, the Netherlands). Sequencing wasperformed by the MilleGen® company (Labège, France) withABI3130XL sequencer (Applied Biosystems) by using Big-Dye® Terminator v3.1 Cycle Sequencing Kit (Applied Bio-systems, Courtaboeuf, France). Membership of the PCRproducts to the hsp70 and hsp90 gene families was verifiedby Blast analysis (http://blast.ncbi.nlm.nih.gov/Blast.cgi).
The full-length cDNA of E. affinis hsp70 and hsp90 wereobtained by RACE PCR using MarathonTM cDNA Ampli-fication Kit (Clontech, Saint Germain en Laye, France)according to the user’s manual. The 5′- and 3′-RACEproducts were amplified by PCR using gene-specificprimers (GSP) specially designed and Adaptor Primer(AP) supplied with the RACE PCR Kit (Table 2). ThePCR cycling parameters were as follows: 94°C/30 s; 5cycles of 94°C/15 s, 62°C/1 min and 72°C/3 min; 5cycles of 94°C/15 s, 62°C/1 min and 70°C/3 min; 25 cyclesof 94°C/15 s, 62°C/1 min and 68°C/3 min; and 72°C/10 min.The final PCR products were both isolated from agarose geland sequenced, as described above, by the MilleGen®
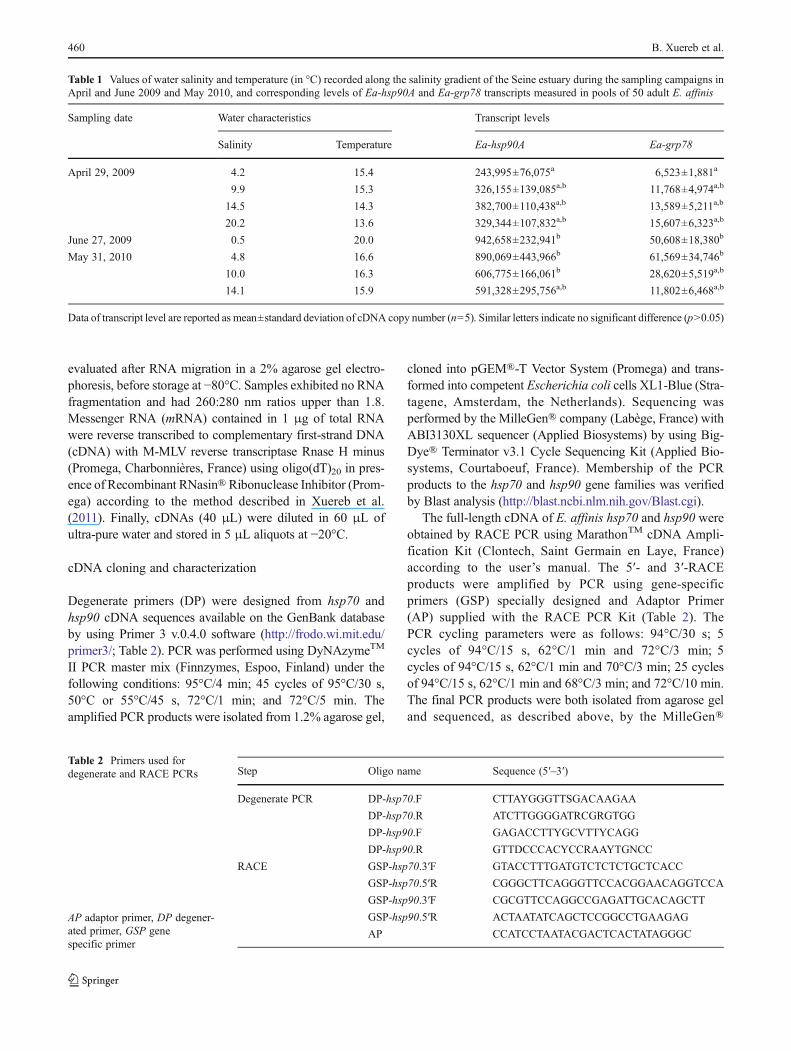
Table 1 Values of water salinity and temperature (in °C) recorded along the salinity gradient of the Seine estuary during the sampling campaigns inApril and June 2009 and May 2010, and corresponding levels of Ea-hsp90A and Ea-grp78 transcripts measured in pools of 50 adult E. affinis
Sampling date Water characteristics Transcript levels
Salinity Temperature Ea-hsp90A Ea-grp78
April 29, 2009 4.2 15.4 243,995±76,075a 6,523±1,881a
9.9 15.3 326,155±139,085a,b 11,768±4,974a,b
14.5 14.3 382,700±110,438a,b 13,589±5,211a,b
20.2 13.6 329,344±107,832a,b 15,607±6,323a,b
June 27, 2009 0.5 20.0 942,658±232,941b 50,608±18,380b
May 31, 2010 4.8 16.6 890,069±443,966b 61,569±34,746b
10.0 16.3 606,775±166,061b 28,620±5,519a,b
14.1 15.9 591,328±295,756a,b 11,802±6,468a,b
Data of transcript level are reported as mean±standard deviation of cDNA copy number (n05). Similar letters indicate no significant difference (p>0.05)
Table 2 Primers used fordegenerate and RACE PCRs
AP adaptor primer, DP degener-ated primer, GSP genespecific primer
Step Oligo name Sequence (5′–3′)
Degenerate PCR DP-hsp70.F CTTAYGGGTTSGACAAGAA
DP-hsp70.R ATCTTGGGGATRCGRGTGG
DP-hsp90.F GAGACCTTYGCVTTYCAGG
DP-hsp90.R GTTDCCCACYCCRAAYTGNCC
RACE GSP-hsp70.3′F GTACCTTTGATGTCTCTCTGCTCACC
GSP-hsp70.5′R CGGGCTTCAGGGTTCCACGGAACAGGTCCA
GSP-hsp90.3′F CGCGTTCCAGGCCGAGATTGCACAGCTT
GSP-hsp90.5′R ACTAATATCAGCTCCGGCCTGAAGAG
AP CCATCCTAATACGACTCACTATAGGGC
460 B. Xuereb et al.
company. The sequences obtained after 5′- and 3′-RACEwereassembled using Geneious ProTM v5.3 software.
The structural analysis of full-length cDNA sequenceswas performed using online softwares. The open readingframes (ORF) of the cDNA were determined using ORFFinder (http://www.ncbi.nlm.nih.gov/projects/gorf/). Theo-retical protein molecular mass and isoelectric points werepredicted using compute pI/Mw tool (http://expasy.org/tools/pi_tool.html). The putative signal peptide wasresearched using SignalP (www.cbs.dtu.dk/services/SignalP).Scans for known amino acid motifs were performed againstProsite and Pfam database (http://myhits.isb-sib.ch/cgi-bin/motif_scan).
The phylogenetic analysis was performed after globalalignment of amino acid E. affinis sequences with counter-parts from 35 and 8 crustacean species for GRP78 and HSP90,respectively. All sequences were collected from the GenBankdatabase. The tree was constructed by Jukes–Cantor geneticdistancemodel and neighbour-joiningmethod using Geneiousv5.4 software (Drummond et al. 2011). Blosum62was used asthe cost matrix. The gap open and gap extension penaltieswere 12 and 3, respectively. HSP70 and HSP90 trees wererespectively rooted using Vibrio proteolyticus DNAK andMytilus galloprovincialis HSP90 as outgroups. The analysisof HSP amino acid conservation was conducted comparingpercent identities generated from pairwise alignments(EMBOSS, European Bioinformatics Institute).
Analysis of expression patterns: effect of water temperatureand salinity, and preliminary field approach
Laboratory experiments The effects of temperature and sa-linity on the expression of characterized hsp genes wereindividually assessed under controlled laboratory condi-tions. During a first experiment, copepods were exposed tothermic or osmotic shocks during 90 min. Adult copepodsof mixed gender (n0300 per replicate) were placed into 50-mL plastic tubes (n03) for each tested conditions (controland treatments). The control copepods were maintained inoptimal temperature (15°C) and salinity (15) conditions(Devreker et al. 2007; 2009). Three thermic shocks (7.5°C,22.5°C and 30°C at the optimum salinity) and 2 osmoticshocks (salinities of 1 and 30, at the optimum temperature)were tested. In a second experiment, copepods were ex-posed during 72 h in 3 different salinities (1, 15 and 25),at the optimal temperature condition, in 40-L aquariums.This experiment was performed under the same light andaeration conditions as in the main culture (see the “E. affinissampling and culture” section). At the end of exposure, forboth experiments, copepod pools of about 250 adults (n03per condition) were recovered by sieving (200 μm meshsize), quickly rinsed with ultra-pure water and placed insterile microtubes before freezing in liquid nitrogen and
storage at −80°C until RNA extraction (see the “TotalRNA isolation and cDNA synthesis” section).
Field experiment The spatio-temporal variability of thestudied hsp gene expression was assessed within the naturalE. affinis population of the Seine Estuary. Copepods weresampled along the salinity gradient on April 29 and June 27,2009 and May 27, 2010 (Fig. 1; Table 1) as described in the“E. affinis sampling and culture” section. It can be underlinedthat copepods were found only at the salinity of 0.5 in June 2009and no copepods were found at salinities upper to 14.1 in May2010. Immediately after sampling, pools of 50 copepods (n05per sampling point) were constituted by gentle pipetting tomaximise the specific selection of adult E. affinis (males andfemales in sexual rest), placed in microtubes and quickly rinsedin ultra-pure water before freezing in liquid nitrogen. At thelaboratory, samples were stored at −80°C until RNA extraction(see the “Total RNA isolation and cDNA synthesis” section).
Quantitative real-time polymerase chain reaction (qPCR)The specific primer sets used for qPCR (Table 3) weredesigned using the “Universal Probe Library” software(Roche Diagnostics). qPCR was carried out in duplicate onthe Rotor-Gene Q 2-plex HRM (Qiagen, Courtaboeuf,France) using the QuantiTect® SYBR® Green PCR Kit(Qiagen), in 20-μL volume containing 5 μL of cDNAsample, 4 μL of ultra-pure water, 1 μL of primers (forwardand reverse; 10 μM) and 10 μL of QuantiTect Master Mix2X. Blank controls were performed for each qPCR run tocheck the absence of contamination by DNA in reagents.After initial denaturation at 95°C/15 min, cDNA were am-plified for 45 cycles of 94°C/15 s, 59°C/20 s and 72°C/15 s.Following the last PCR cycle, all cDNAwere denatured by arapid increase to 95°C and hybridized again for 20 s at 68°C.The melting curve was finally determined during a slowtemperature elevation from 55°C to 99°C (0.2°C s−1). Thespecificity of PCR products was checked by melting curveanalysis and by 1.2% agarose gel electrophoresis. The expres-sion levels of target genes were calculated according to theabsolute quantification method (Chen et al. 2005b; Nadam etal. 2007; Wong and Medrano 2005). The values of quantifi-cation cycle (Cq; cycle number from which fluorescence isdetected above the noise threshold) were collected with Rotor-Gene Q series software (Qiagen) using the comparative quan-tification method. To convert Cq values into cDNA copynumber quantified from 5 μL-aliquot of RT product, a specificstandard curve was established for each primer pair from 10-fold serial dilutions of purified PCR products (from 109 to 101
cDNA copies; in triplicate). For that, a cDNA sample wasamplified with HotStar HiFidelity DNA Polymerase (Qiagen)according to the user’s manual and purified with QIAquickPCR® Purification Kit (Qiagen). cDNA concentration wasdetermined with a NanoDrop® ND-1000 Spectrophotometer
Molecular characterization and mRNA expression 461
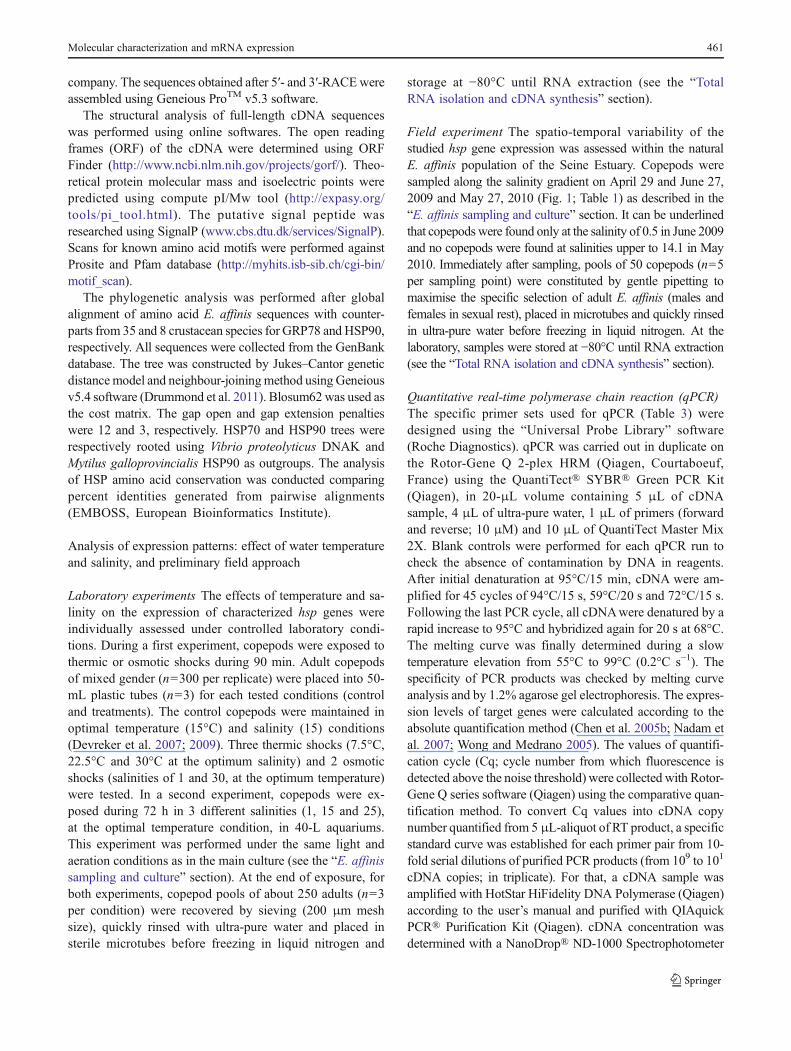
and dilution series were performed in ultra-pure water. Adilution of medium range (corresponding to 105 cDNA copies),defined as standard points, was distributed in 5-μL aliquots andstored at −20°C. This standard point was systematically ampli-fied during the qPCR runs to confirm the reliability of ampli-fication reading and to correct Y-intercept of standard curveequation. The equation and R2 of standard curve, and PCRefficiency (E010^(−1/slope)) of each target genes are presentedin Table 3.
Statistics Statistical procedures were carried out with theStatistica software v7 (Statsoft). Considering small samplesize, only non-parametric analyses are reported here. For thelaboratory experiments, we focused on the differences be-tween the control (i.e. optimal condition) and each treatmentcondition. Concerning thermic treatments, the global differ-ences were tested using non-parametric Kruskal–WallisANOVA rank sum tests (p<0.05), then two-sample compar-isons were performed using Unilateral Mann–Whitney ranksum tests (p<0.05). For salinity treatments, control conditionwas compared to only two “extreme” treatments. So statisticalanalysis focused on the two-sample comparisons were per-formed using Unilateral Mann–Whitney rank sum tests (p<0.05). Concerning the field experiment, inter-group differen-ces were assessed using non-parametric Kruskal–WallisANOVA and multile comparison rank sum tests (p<0.05).
Results
Identification and analysis of full-length cDNA sequences
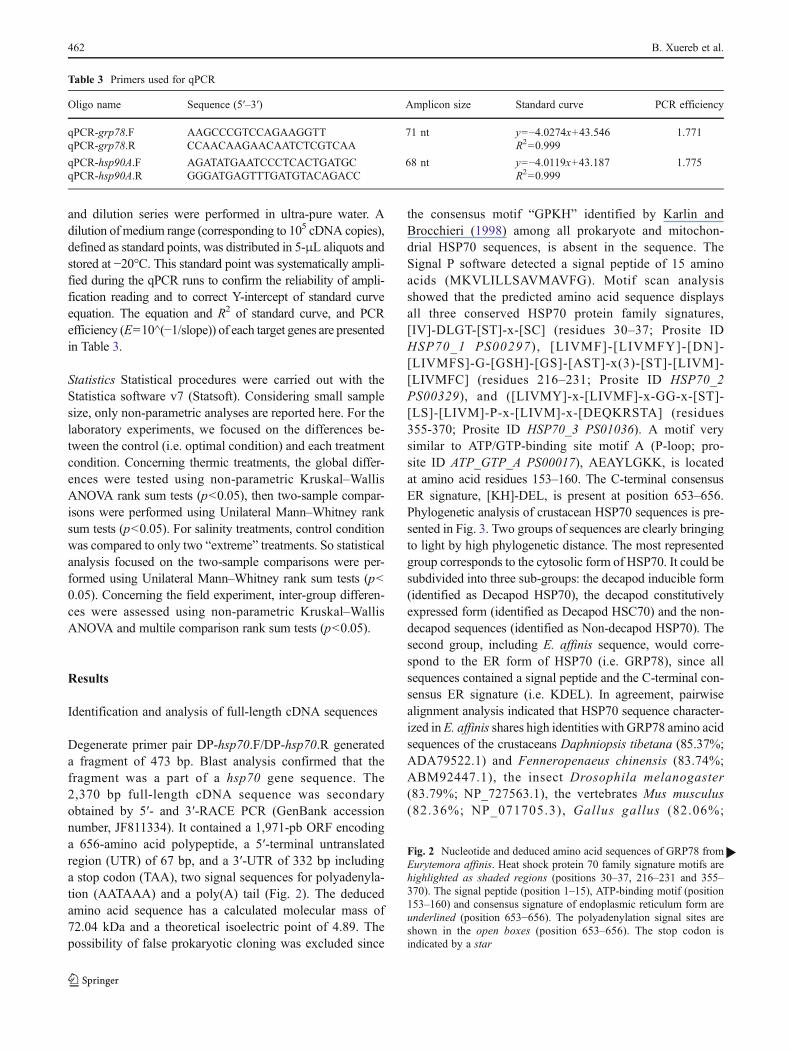
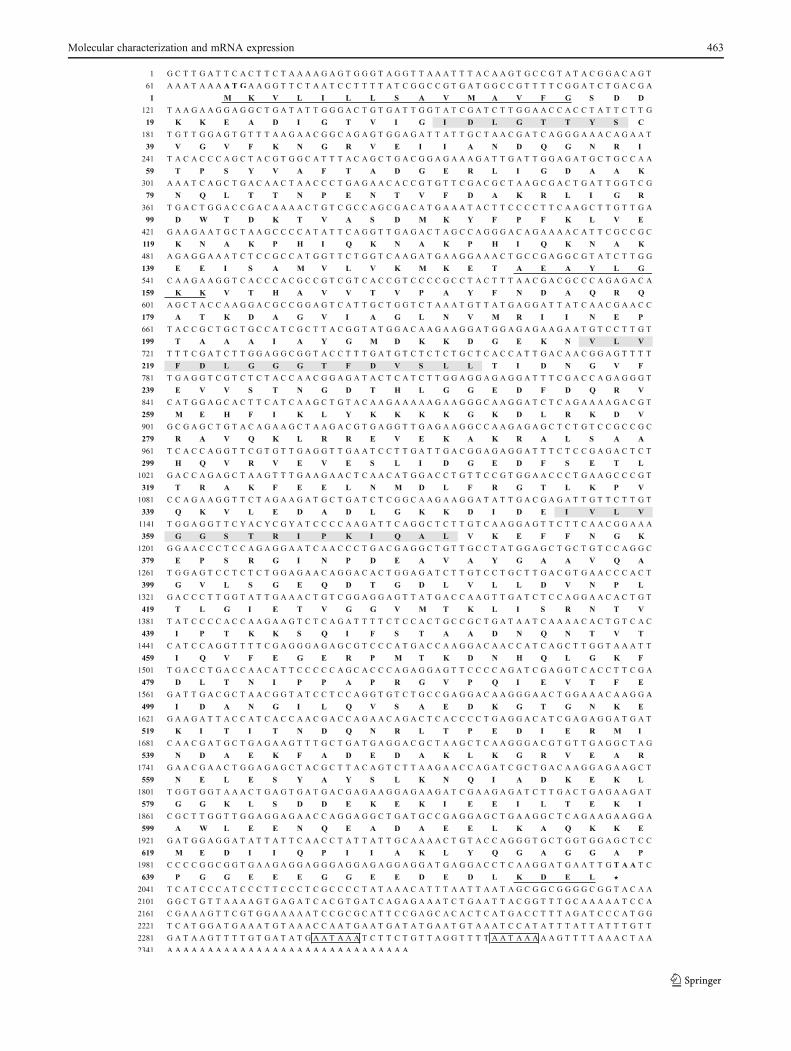
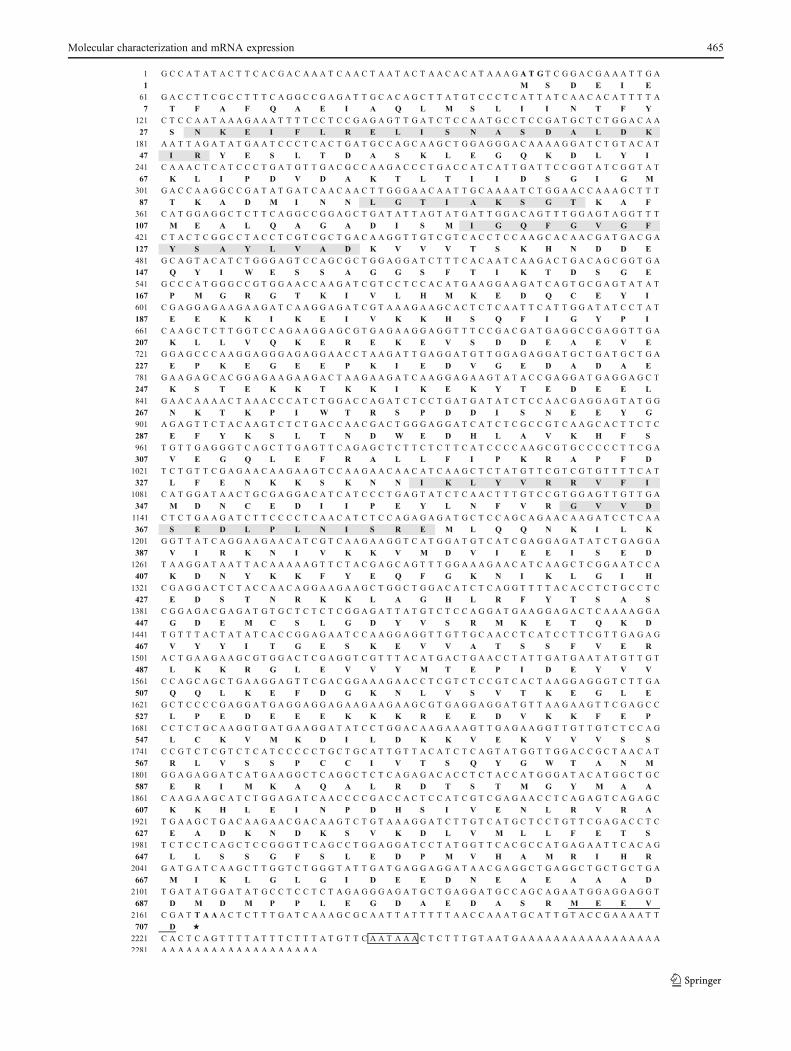
Degenerate primer pair DP-hsp70.F/DP-hsp70.R generateda fragment of 473 bp. Blast analysis confirmed that thefragment was a part of a hsp70 gene sequence. The2,370 bp full-length cDNA sequence was secondaryobtained by 5′- and 3′-RACE PCR (GenBank accessionnumber, JF811334). It contained a 1,971-pb ORF encodinga 656-amino acid polypeptide, a 5′-terminal untranslatedregion (UTR) of 67 bp, and a 3′-UTR of 332 bp includinga stop codon (TAA), two signal sequences for polyadenyla-tion (AATAAA) and a poly(A) tail (Fig. 2). The deducedamino acid sequence has a calculated molecular mass of72.04 kDa and a theoretical isoelectric point of 4.89. Thepossibility of false prokaryotic cloning was excluded since
the consensus motif “GPKH” identified by Karlin andBrocchieri (1998) among all prokaryote and mitochon-drial HSP70 sequences, is absent in the sequence. TheSignal P software detected a signal peptide of 15 aminoacids (MKVLILLSAVMAVFG). Motif scan analysisshowed that the predicted amino acid sequence displaysall three conserved HSP70 protein family signatures,[IV]-DLGT-[ST]-x-[SC] (residues 30–37; Prosite IDHSP70_1 PS00297) , [LIVMF]-[LIVMFY]-[DN]-[LIVMFS]-G-[GSH]-[GS]-[AST]-x(3)-[ST]-[LIVM]-[LIVMFC] (residues 216–231; Prosite ID HSP70_2PS00329), and ([LIVMY]-x-[LIVMF]-x-GG-x-[ST]-[LS]-[LIVM]-P-x-[LIVM]-x-[DEQKRSTA] (residues355-370; Prosite ID HSP70_3 PS01036). A motif verysimilar to ATP/GTP-binding site motif A (P-loop; pro-site ID ATP_GTP_A PS00017), AEAYLGKK, is locatedat amino acid residues 153–160. The C-terminal consensusER signature, [KH]-DEL, is present at position 653–656.Phylogenetic analysis of crustacean HSP70 sequences is pre-sented in Fig. 3. Two groups of sequences are clearly bringingto light by high phylogenetic distance. The most representedgroup corresponds to the cytosolic form of HSP70. It could besubdivided into three sub-groups: the decapod inducible form(identified as Decapod HSP70), the decapod constitutivelyexpressed form (identified as Decapod HSC70) and the non-decapod sequences (identified as Non-decapod HSP70). Thesecond group, including E. affinis sequence, would corre-spond to the ER form of HSP70 (i.e. GRP78), since allsequences contained a signal peptide and the C-terminal con-sensus ER signature (i.e. KDEL). In agreement, pairwisealignment analysis indicated that HSP70 sequence character-ized inE. affinis shares high identities with GRP78 amino acidsequences of the crustaceans Daphniopsis tibetana (85.37%;ADA79522.1) and Fenneropenaeus chinensis (83.74%;ABM92447.1), the insect Drosophila melanogaster(83.79%; NP_727563.1), the vertebrates Mus musculus(82.36%; NP_071705.3), Gallus gallus (82.06%;
Table 3 Primers used for qPCR
Oligo name Sequence (5′–3′) Amplicon size Standard curve PCR efficiency
qPCR-grp78.F AAGCCCGTCCAGAAGGTT 71 nt y0−4.0274x+43.546 1.771qPCR-grp78.R CCAACAAGAACAATCTCGTCAA R200.999
qPCR-hsp90A.F AGATATGAATCCCTCACTGATGC 68 nt y0−4.0119x+43.187 1.775qPCR-hsp90A.R GGGATGAGTTTGATGTACAGACC R200.999
Fig. 2 Nucleotide and deduced amino acid sequences of GRP78 fromEurytemora affinis. Heat shock protein 70 family signature motifs arehighlighted as shaded regions (positions 30–37, 216–231 and 355–370). The signal peptide (position 1–15), ATP-binding motif (position153–160) and consensus signature of endoplasmic reticulum form areunderlined (position 653−656). The polyadenylation signal sites areshown in the open boxes (position 653–656). The stop codon isindicated by a star
b
462 B. Xuereb et al.
Molecular characterization and mRNA expression 463
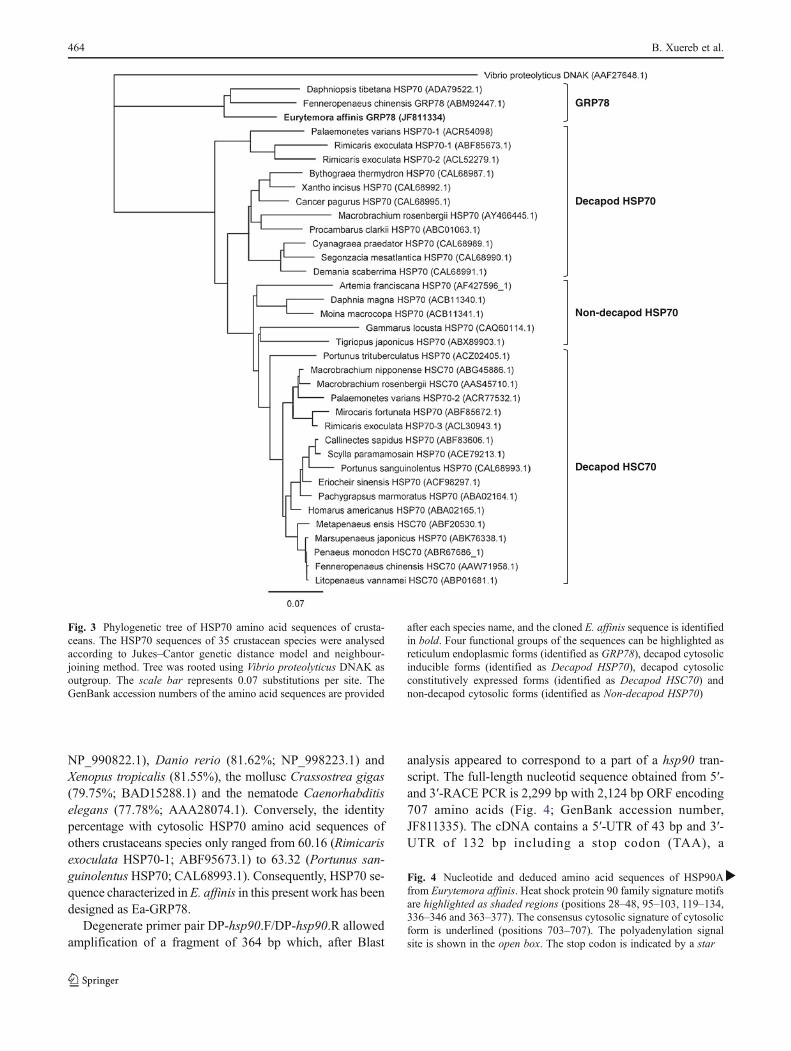
NP_990822.1), Danio rerio (81.62%; NP_998223.1) andXenopus tropicalis (81.55%), the mollusc Crassostrea gigas(79.75%; BAD15288.1) and the nematode Caenorhabditiselegans (77.78%; AAA28074.1). Conversely, the identitypercentage with cytosolic HSP70 amino acid sequences ofothers crustaceans species only ranged from 60.16 (Rimicarisexoculata HSP70-1; ABF95673.1) to 63.32 (Portunus san-guinolentus HSP70; CAL68993.1). Consequently, HSP70 se-quence characterized inE. affinis in this present work has beendesigned as Ea-GRP78.
Degenerate primer pair DP-hsp90.F/DP-hsp90.R allowedamplification of a fragment of 364 bp which, after Blast
analysis appeared to correspond to a part of a hsp90 tran-script. The full-length nucleotid sequence obtained from 5′-and 3′-RACE PCR is 2,299 bp with 2,124 bp ORF encoding707 amino acids (Fig. 4; GenBank accession number,JF811335). The cDNA contains a 5′-UTR of 43 bp and 3′-UTR of 132 bp including a stop codon (TAA), a
GRP78
Decapod HSP70
Non-decapod HSP70
Decapod HSC70
Fig. 3 Phylogenetic tree of HSP70 amino acid sequences of crusta-ceans. The HSP70 sequences of 35 crustacean species were analysedaccording to Jukes–Cantor genetic distance model and neighbour-joining method. Tree was rooted using Vibrio proteolyticus DNAK asoutgroup. The scale bar represents 0.07 substitutions per site. TheGenBank accession numbers of the amino acid sequences are provided
after each species name, and the cloned E. affinis sequence is identifiedin bold. Four functional groups of the sequences can be highlighted asreticulum endoplasmic forms (identified as GRP78), decapod cytosolicinducible forms (identified as Decapod HSP70), decapod cytosolicconstitutively expressed forms (identified as Decapod HSC70) andnon-decapod cytosolic forms (identified as Non-decapod HSP70)
Fig. 4 Nucleotide and deduced amino acid sequences of HSP90Afrom Eurytemora affinis. Heat shock protein 90 family signature motifsare highlighted as shaded regions (positions 28–48, 95–103, 119–134,336–346 and 363–377). The consensus cytosolic signature of cytosolicform is underlined (positions 703–707). The polyadenylation signalsite is shown in the open box. The stop codon is indicated by a star
b
464 B. Xuereb et al.
Molecular characterization and mRNA expression 465
polyadenylation signal and a poly(A) tail. Predicted proteinpresents a calculated molecular mass of 80.77 kDa and apredicted isoelectric point of 4.94. No signal peptide wasdetected with the Signal P software. The deduced aminoacid sequence displays all five conserved amino acid blocksdistinctive of the HSP90 protein family described by Guptaet al. (1995): NKEIFLRELISN-[SA]-SDALDKIR (residues28–48) , LGTIA- [KR] -SGT ( re s idues 95–103) ,IGQFGVGFYSA-[YF]-LVA-[ED] (residues 119–134),IKLYVRRVFI (residues 336–346) and GVVDS-[ED]-DLPLN-[IV]-SRE (residues 363–377; Fig. 4). Motif scananalysis showed that the amino acid sequence is divided intothe ATP binding domain (residues 28–181; Pfam ID HAT-Pase_c PF02518) and the functional domain of HSP90(residues 184–707; Pfam ID HSP90 PF00183). The C-terminal consensus cytosolic motif, MEEVD, appeared atposition 703–707. The alignment from multiple sources ofcytosolic HSP90 underlined a high conservation degreewithin crustaceans, with identities ranging from 77.23%(Exopalaemon carinicauda; ADM88040.1) to 84.10%(T. japonicus; ACA03524.1), and over a wide range of
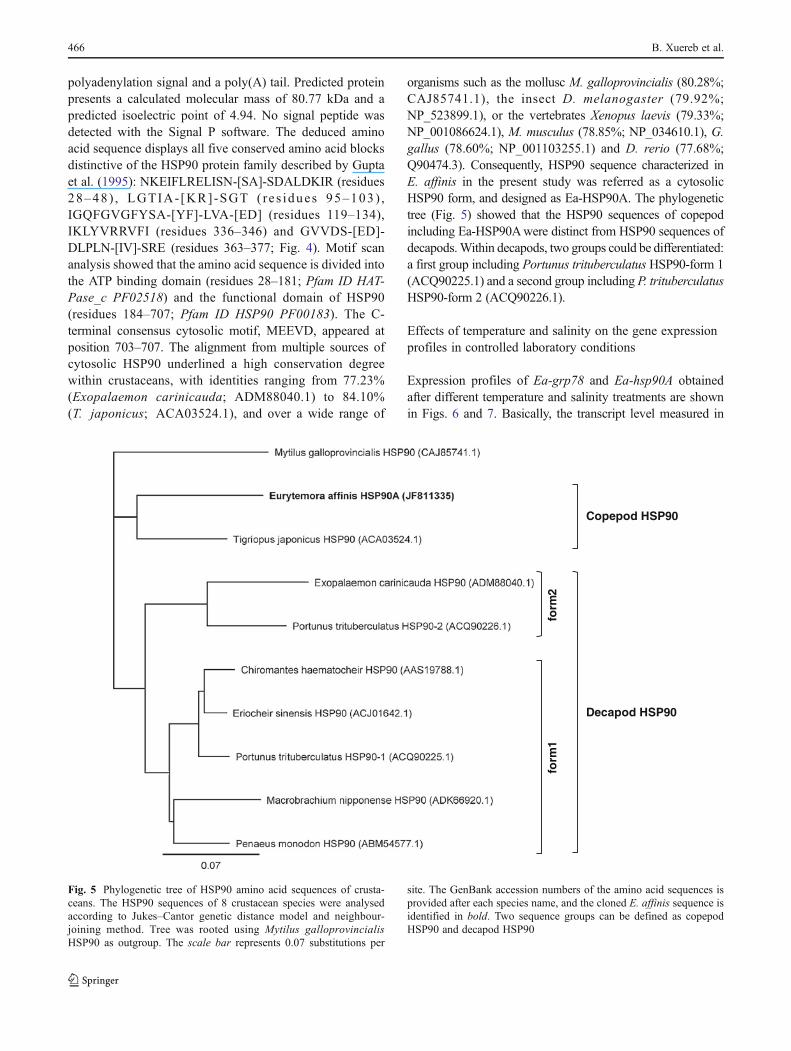
organisms such as the mollusc M. galloprovincialis (80.28%;CAJ85741.1), the insect D. melanogaster (79.92%;NP_523899.1), or the vertebrates Xenopus laevis (79.33%;NP_001086624.1), M. musculus (78.85%; NP_034610.1), G.gallus (78.60%; NP_001103255.1) and D. rerio (77.68%;Q90474.3). Consequently, HSP90 sequence characterized inE. affinis in the present study was referred as a cytosolicHSP90 form, and designed as Ea-HSP90A. The phylogenetictree (Fig. 5) showed that the HSP90 sequences of copepodincluding Ea-HSP90Awere distinct from HSP90 sequences ofdecapods.Within decapods, two groups could be differentiated:a first group including Portunus trituberculatus HSP90-form 1(ACQ90225.1) and a second group including P. trituberculatusHSP90-form 2 (ACQ90226.1).
Effects of temperature and salinity on the gene expressionprofiles in controlled laboratory conditions
Expression profiles of Ea-grp78 and Ea-hsp90A obtainedafter different temperature and salinity treatments are shownin Figs. 6 and 7. Basically, the transcript level measured in
Decapod HSP90
Copepod HSP90
form
2
form
1
Fig. 5 Phylogenetic tree of HSP90 amino acid sequences of crusta-ceans. The HSP90 sequences of 8 crustacean species were analysedaccording to Jukes–Cantor genetic distance model and neighbour-joining method. Tree was rooted using Mytilus galloprovincialisHSP90 as outgroup. The scale bar represents 0.07 substitutions per
site. The GenBank accession numbers of the amino acid sequences isprovided after each species name, and the cloned E. affinis sequence isidentified in bold. Two sequence groups can be defined as copepodHSP90 and decapod HSP90
466 B. Xuereb et al.
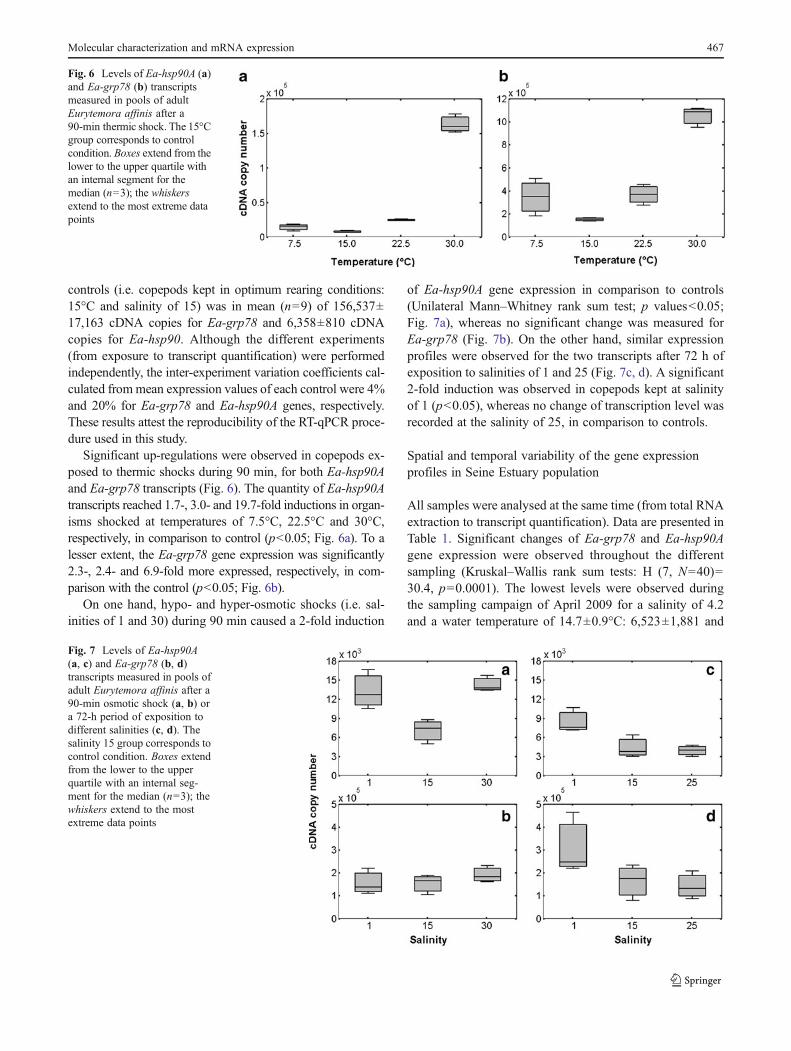
controls (i.e. copepods kept in optimum rearing conditions:15°C and salinity of 15) was in mean (n09) of 156,537±17,163 cDNA copies for Ea-grp78 and 6,358±810 cDNAcopies for Ea-hsp90. Although the different experiments(from exposure to transcript quantification) were performedindependently, the inter-experiment variation coefficients cal-culated frommean expression values of each control were 4%and 20% for Ea-grp78 and Ea-hsp90A genes, respectively.These results attest the reproducibility of the RT-qPCR proce-dure used in this study.
Significant up-regulations were observed in copepods ex-posed to thermic shocks during 90 min, for both Ea-hsp90Aand Ea-grp78 transcripts (Fig. 6). The quantity of Ea-hsp90Atranscripts reached 1.7-, 3.0- and 19.7-fold inductions in organ-isms shocked at temperatures of 7.5°C, 22.5°C and 30°C,respectively, in comparison to control (p<0.05; Fig. 6a). To alesser extent, the Ea-grp78 gene expression was significantly2.3-, 2.4- and 6.9-fold more expressed, respectively, in com-parison with the control (p<0.05; Fig. 6b).
On one hand, hypo- and hyper-osmotic shocks (i.e. sal-inities of 1 and 30) during 90 min caused a 2-fold induction
of Ea-hsp90A gene expression in comparison to controls(Unilateral Mann–Whitney rank sum test; p values<0.05;Fig. 7a), whereas no significant change was measured forEa-grp78 (Fig. 7b). On the other hand, similar expressionprofiles were observed for the two transcripts after 72 h ofexposition to salinities of 1 and 25 (Fig. 7c, d). A significant2-fold induction was observed in copepods kept at salinityof 1 (p<0.05), whereas no change of transcription level wasrecorded at the salinity of 25, in comparison to controls.
Spatial and temporal variability of the gene expressionprofiles in Seine Estuary population
All samples were analysed at the same time (from total RNAextraction to transcript quantification). Data are presented inTable 1. Significant changes of Ea-grp78 and Ea-hsp90Agene expression were observed throughout the differentsampling (Kruskal–Wallis rank sum tests: H (7, N040)030.4, p00.0001). The lowest levels were observed duringthe sampling campaign of April 2009 for a salinity of 4.2and a water temperature of 14.7±0.9°C: 6,523±1,881 and
Fig. 7 Levels of Ea-hsp90A(a, c) and Ea-grp78 (b, d)transcripts measured in pools ofadult Eurytemora affinis after a90-min osmotic shock (a, b) ora 72-h period of exposition todifferent salinities (c, d). Thesalinity 15 group corresponds tocontrol condition. Boxes extendfrom the lower to the upperquartile with an internal seg-ment for the median (n03); thewhiskers extend to the mostextreme data points
Fig. 6 Levels of Ea-hsp90A (a)and Ea-grp78 (b) transcriptsmeasured in pools of adultEurytemora affinis after a90-min thermic shock. The 15°Cgroup corresponds to controlcondition. Boxes extend from thelower to the upper quartile withan internal segment for themedian (n03); the whiskersextend to the most extreme datapoints
Molecular characterization and mRNA expression 467
243,995±76,075 cDNA copies for Ea-hsp90A and Ea-grp78 representing 1- and 1.6-fold the mean level of cope-pods kept in optimum laboratory rearing conditions, respec-tively (see the “Effects of temperature and salinity on the geneexpression profiles in controlled laboratory conditions” sec-tion). The transcription levels recorded at the others salinities(10, 15 and 20) during this sampling campaign did not exceed2.5-fold the mean levels previously observed in laboratorycontrols. Conversely, strong increases of Ea-grp78 and Ea-hsp90A gene expression were observed during sampling cam-paigns of June 2009 and May 2010, for respective watertemperatures of 20.0°C and 16.3±0.4°C. In May 2010, thequantity of transcripts tended to increase gradually inverselyto salinity. The highest expression levels observed for a salin-ity of 4.8 were 10- and 6-fold the mean level of laboratorycontrol for Ea-hsp90A and Ea-grp78, respectively. In thesame way, the expression levels of copepods sampled in June2009, at a salinity of 0.5, were 6- and 8-fold the mean level oflaboratory control for Ea-hsp90A and Ea-grp78, respectively.
Discussion
Characterization of E. affinis GRP78 and HSP90Asequences
In the present study, we characterized the full-length cDNAof the grp78 gene from the calanoid copepod E. affinis,designed as Ea-grp78. To our knowledge, this is the firstreport concerning a grp78 cDNA sequence cloned fromCopepoda. More generally, cDNA sequences of grp78 havebeen cloned from only two other crustacean species, thewater fleas D. tibetana (FJ907314) and the Chinese shrimpF. chinensis (EF032651). The deduced amino acid se-quence, Ea-GRP78, contained the three conserved HSP70family signatures. All homologs of HSP70 proteins displayan N-terminal ATPase domain, which is essential for activechaperone-mediated folding (Bukau and Horwich 1998).Ea-GRP78 displayed a motif very close to ATP/GTP-bind-ing site motif A ([AG]-x(4)-GK-[ST]), AEAYLGKK (resi-dues 153–161). This ATP/GTP-binding site motif was alsofound in GRP78 sequences from D. tibetana (AEAYLGKK,residues 158–166) and F. chinensis (AEAYLGKP, residues156–163; Luan et al. 2009), as well as in cytosolic HSP70sequences of other crustacean species such as the prawnMacrobrachium rosenbergii (AEAFLGST at position 131–138 for Mar-HSC70 and AEAYLGKT at position 71–78 forMar-HSP70; Liu et al. 2004) and the shrimps Microcarisfortunanta and R. exoculata (AEAFLGGT at position 131–138, and AESYLGKK at position 84–91, respectively;Ravaux et al. 2007). The signal peptide at the N terminus andthe consensus tetrapeptide KDEL at the C terminus of theamino acid sequence, ensure the protein targeting to the ER.
Membership of the sequence presently characterized toGRP78 protein group was confirmed by its high identity withGRP78 of a wide range of organisms (from nematodes tomammalians), in comparison to the low identity that it shareswith cytosolic HSP70 forms of other crustacean species. Thephylogenetic tree of known HSP70 sequence within crusta-ceans clearly illustrates the distinction between the group ofGRP78 and the group of cytosolic HSP70. This last group isby far the most represented since it regroupsmore than 90% ofHSP70 sequences characterized in crustaceans. As previouslyreported by Cottin et al. (2010), the sequences of inducibleand constitutive cytosolic forms from decapod crustaceansappeared in separate groups in the phylogenetic tree. Theclassification given by the tree is in accordancewith the resultsof functional studies performed in some species such asPalaemonetes varians and R. exoculata (Cottin et al. 2010)and M. rosembergii (Liu et al. 2004). However, this classifi-cation between inducible and constitutive cytosolic formshighlights a gap of sequence annotation since among 17sequences corresponding to the constitutive cytosolic form,only 6 are clearly identified as HSC70. The classification ofcytosolic forms in non-decapod crustacean species is moredifficult to discuss, because only one sequence is available foreach species, and more generally much lesser works havebeen performed in these organisms in spite of their eco-physiological interest as well their key role in aquaticecosystems.
We also characterized the complete cDNA sequence of acytosolic hsp90 gene from E. affinis, designed Ea-hsp90A(GenBank accession numbers: JF811335), in reference tothe nomenclature system that was proposed by Chen et al.(2005a). The Ea-HSP90A deduced amino acid sequencecontained the five conserved HSP90 family signatures(Gupta 1995), and an ATP-binding domain, essential forbasic functions of HSP90 (Prodomou et al. 1997). In addi-tion, the consensus motif MEEVD at the C terminus sug-gested that Ea-HSP90A belongs to the cytosolic HSP90family (Gupta 1995). In accordance, Ea-HSP90A displayedhigh homologies with cytosolic HSP90 sequences from awide range of organisms including invertebrates and highervertebrates. In crustaceans, only 8 HSP90 sequences areavailable on the GeneBank database, 7 of which have beencloned from decapod species. Only one HSP90 sequencewas known in copepods, which belongs to T. japonicus(ACA03524.1). As expected, Ea-HSP90 displayed the max-imum identity with HSP90 of T. japonicus (84%). In inver-tebrates, it has been considered that a unique cytoplasmicHSP90 exists, which can be encoded by a single or twogenes (Pantzartzi et al. 2009). However, Zhang et al. (2009)isolated two hsp90 mRNA (identified as hsp90-form 1 andhsp90-form 2) with distinct expression patterns, whichencoded two distinct HSP90s, in marine crab Portunustrituberculatus. The phylogenetic analysis, performed in this
468 B. Xuereb et al.
study, indicates that the divergence between the two formsof cytosolic HSP90 occurred among decapod evolution.Indeed, HSP90 sequences of copepods are distinct fromHSP90 sequences of decapods, which subdivided into agroup including P. trituberculatus HSP90-form 1 and anoth-er group including P. trituberculatus HSP90-form 2. Never-theless, this conclusion is speculative and further worksshould be conducted on non-decapod species to confirmthis hypothesis.
Expression patterns of grp78 and hsp90in E. affinis: laboratory and field studies
The RT-real time PCR procedure was successfully adaptedto E. affinis. Although normalization of target gene expres-sion against expression of endogenous genes considered asinvariant (“housekeeping genes” or “reference genes”) iscertainly the most used method in RT-pPCR, we opted, inthis study, for a standardized method of absolute quantifica-tion. Indeed, as underlined by Bustin et al. (2009) no uni-versal reference gene exists and normalizing to a regulatedreference gene will distort data leading to wrong conclu-sions. So stability of a reference gene should be validatedfor both particular tissues or cell types, and experimentaldesigns. In optimal condition, normalization may be im-proved by using the geometric average of multiple validatedreference genes. However, in the context of the presentstudy, validation of reference genes has been very tedioussince our knowledge of transcriptome is limited in lot ofinvertebrate species studied in ecological physiology suchas copepods. Besides, the validation of candidate genes asreference in perspective of in situ application could be verydifficult, if we consider the diversity and the variability ofenvironmental factors, which possibly influence their tran-scription levels. The results showed that the methodologyused in this study is precise and robust. Indeed, although thedifferent laboratory experiments were performed indepen-dently (from exposure to transcript quantification), thequantification of Ea-grp78 and Ea-hsp90A transcripts mea-sured from controls exhibited a low inter-experimentalvariability.
Compared with the progress made in the functional studyof HSP70 cytosolic isoforms, few studies focused onGRP78 or HSP90 in crustaceans. In this paper, the expres-sion patterns of Ea-grp78 and Ea-hsp90A were analysedfrom copepods subjected to different controlled stresses inlaboratory in order to validate their functionality and assessthe potential effects of two important environmental factorsof estuarine ecosystem, temperature and salinity. Transcriptlevels of both genes was significantly induced by thermalheat and cold shocks during 90 min. Ea-hsp90A inductionsof 2- and 3-fold were observed after the shocks at 7.5°C and22.5°C, whereas treatment at 30°C resulted in a radical 20-
fold increase. In a lesser extent, Ea-grp78 was from 2- to 7-fold more expressed in treated copepods. In laboratory aswell as field conditions, the density of E. affinis dropsduring summer temperature (∼20°C) compared to the opti-mal spring temperature of 15°C (Devreker et al. 2010). Inparallel, a very low fecundity of females, coupled with adecrease of potential for recruitment were observed withinthe Seine Estuary population during a long negative anom-aly of late winter temperature observed during 2005 whenthe lowest values of temperatures dropped to 5°C (Devrekeret al. 2010). That tends to show that the low inductions ofhsp genes recorded during our experiment (at 7.5°C and22.5°C) transcribe a thermic stress sufficient to affect lifehistory traits. This observation is in accordance with previ-ous laboratory studies which have shown that very smallamounts of temperature induced HSP can have effects onorganism life traits (Sørensen et al. 2003). It could beinteresting to continue the study of links between hsp geneinductions and life trait alterations in E. affinis to preciseinterpretation of this molecular tool in perspective of phys-iological ecology applications. Similar gene expression pat-terns were reported in hepatopancreas and gills of the crab P.trituberculatus for the two HSP90 isoforms (HSP90-form 1and HSP90-form 2; Zhang et al. 2009). The authors ob-served more important inductions in heat-shocked (30°C)organisms in comparison to cold-shocked (10°C) ones. Theexpression pattern of P. trituberculatus hsp90 from 2 genes,which displays the highest induction levels, is the closest toone described in this study for Ea-hsp90. In the same way,Li et al. (2009) reported important inductions (until 12-foldthe expression level of control) in the Chinese shrimp F.chinensis. Conversely, in spite of the phylogenetic nearbywith E. affinis, very light fluctuations of hsp90 transcriptswere observed in copepod T. japonicus shocked at 35°C(Rhee et al. 2009). Some works have shown that HSP90 canbe also induced by heat shock in other aquatic invertebratessuch as the molluscs Haliotis tuberculata (Farcy et al.2007), Laternula elliptica (Kim et al. 2009) and Haliotisdiscus (Wang et al. 2011). To our knowledge, only Luan etal. (2009) have previously performed functional study ofGRP78 in another crustacean species. In line with ourresults, these authors showed that expression of grp78 wasup-regulated (up to 2.4-fold) by heat shock in the Chineseshrimp F. chinensis. Concerning the effects of salinity, Ea-hsp90 and Ea-grp78 expression were assessed after short-(90 min) and long-term (72 h) exposures to hypo- (salinityof 1) and hyper-osmotic stresses (salinity of 25–30) incomparison with control condition (salinity of 15). Thetwo genes showed different responses after osmotic-shocktreatments. Indeed, after a 90-min exposure, no modificationof Ea-grp78 transcript level was recorded whereas the bothhypo- and hyper-osmotic stresses significantly induced a 2-fold increase of the Ea-hsp90A transcript quantity. Inversely,
Molecular characterization and mRNA expression 469
similar patterns were observed for Ea-hsp90A and Ea-grp78after long-term exposure. A significant 2-fold increase oftranscript levels was observed in copepods kept at the salin-ity of 1, but no fluctuation was recorded at the salinity of 25.Impairment of development and survival of early life stage(i.e. nauplii larval stages) have been previously observed inE. affinis long-term exposed at the salinity of 1 (Devreker etal. 2004). This would agree the stress transcribed by the hspgene inductions recorded in the same conditions. Neverthe-less, the authors equally showed that the long-term exposureto high salinity (25) induced more important and significanteffects on a large range of life history traits (e.g. reproduc-tion and survival of adult stage; Devreker et al. 2007, 2009),whereas no induction of hsp genes was observed in ourstudy excepted for Ea-hsp90A at short-term exposure. So,in opposition to previous discussion about thermic stress,the link between physiological response and the effects onthe life traits is unclear in the case of osmotic stress. Thisgap highlights the need to obtain more detailed understand-ing of eco-physiological role of HSPs. Our results corrobo-rate the works of Spees et al. (2002) that report significantexpression induction of cytosolic HSP90s in the lobsterHomarus americanus after both hypo- and hyper-osmoticshocks. The authors observed an hsp90 induction up to600% and 300% of control transcript level, at low and highsalinities. The greater response observed in lobster com-pared to E. affinis might result in part of the poor osmo-regulative capacities of this stenohaline species. Oppositely,Zhang et al. (2009) have shown that hsp90-form 1 andhsp90-form 2 were down-regulated in the hepatopancreas,muscle and ovary of P. trituberculatus exposed short-term tolow or high salinity. These authors suggested that the os-motic stresses may exceed the tolerance of these tissues andturn lead to the cell death. Some works have shown thathsp90 can also be induced by osmotic shock in other aquaticorganisms such as the Altlantic salmon, Salmo salar (Pan etal. 2000), or the oyster, Crassostrea hongkongensis (Fu etal. 2011). By contrast, to our knowledge, no study hasreported the effect of osmotic stress on the GRP78 synthesislevel.
Most of the published works report the effects of an acuteor repetitive stress on the physiology of organisms exposedin laboratory. Although such approaches are necessary toprovide specific biological response to a given stress incontrolled conditions, they are less representative than field-works since they do not allow adequately assessing thecombination of biotic and abiotic factors found in naturalconditions (Lejeusne et al. 2006). Nevertheless, long-term insitu applications within natural populations are still relative-ly scarce (e.g. Hofmann and Somero 1995; Lejeusne et al.2006; Minier et al. 2000). In the present study, the expres-sion of Ea-grp78 and Ea-hsp90A genes was measured fromcopepods directly sampled into the natural population of the
Seine Estuary along of the salinity gradient, on the occasionof three test campaigns. For that, organisms of adult stage—males and females in sexual rest—were rigorously selectedin order to minimize the potential influence of seasonalpopulation structure variations. On one hand, the levels ofhsp gene expression recorded in April 2009 for water tem-perature of 15°C, stayed relatively constant for salinitiesranged from 5 to 20, and were closed to ones measured incopepods kept in optimal laboratory conditions. Theseresults mean that the copepods sampled at this date did notseem to display physiological stress. That is in accordancewith some previous works, which showed that the spring isthe most favourable period for E. affinis population dynamicin Seine Estuary (Mouny and Dauvin 2002). Indeed, theseauthors recorded maximal density values for this periodwhen temperatures are ranged from 10°C to 15°C. Thesetemperatures equally correspond to the best recruitmentsuccess observed during laboratory study (Devreker et al.2007, 2009). On the other hand, we observed strong induc-tions of hsp gene expression (up to 10- and 6-fold the meanlevel of laboratory control for Ea-hsp90A and Ea-grp78) incopepods sampled at low salinity during the campaign ofJune 2009 and May 2010, when water temperature of SeineEstuary increases. These results tend to show that the lowsalinity and the increase of temperature seem to have asynergic effect on stress condition of copepods. However,other potential biotic or abiotic factors (e.g. pH, dissolvedO2 or pollution) not considered in the present study couldalso greatly influence the expression levels of the two HSPsstudied (Lejeusne et al. 2006). In any case, the resultsobtained during this preliminary fieldwork underline theinterest to estimate and quantify the role of HSPs in theecology of E. affinis during long-term monitoring of naturalpopulations. Therefore, in actual context of environmentalchanges including global warming, pollution and habitatfragmentation, the development and validation of relevantstress indicators is fundamental to improve the detection andthe interpretation of biological consequences on organismsand populations (Sørensen et al. 2003).
Acknowledgements This study is a contribution to ZOOSEINEproject funded by Seine-Aval IV program within the framework ofthe project aiming at building bioindicators based on the estuarinecopepod Eurytemora affinis.
References
Beyrend-Dur D, Souissi S, Devreker D, Winkler G, Hwang J-S (2009)Life cycle traits of two transatlantic populations of Eurytemoraaffinis (Copepoda: Calanoida): salinity effects. J Plankton Res 31(7):713–128
Bukau B, Horwich AL (1998) The Hsp70 and Hsp60 chaperonemachines. Cell 92(3):351–366
470 B. Xuereb et al.
Bustin SA, Benes V, Garson JA, Hellemans J, Huggett J, Kubista M,Mueller R, Nolan T, Pfaffl MW, Shipley GL, Vandesompele J,Wittwer CT (2009) The MIQE guidelines: minimum informationfor publication of quantitative real-time PCR experiments. ClinChem 55(4):611–622
Chen B, Piel WH, Gui L, Bruford E, Monteiro A (2005a) The HSP90family of genes in the human genome: insights into their diver-gence and evolution. Genomics 86(6):627–637
Chen C, Ridzon DA, Broomer AJ, Zhou Z, Lee DH, Nguyen JT,Barbisin M, Xu NL, Mahuvakar VR, Andersen MR, Lao KQ,Livak KJ, Guegler KJ (2005b) Real-time quantification of micro-RNAs by stem–loop RT-PCR. Nucleic Acids Res 33(20):e179
Cottin D, Shillito B, Chertemps T, Thatje S, Léger N, Ravaux J (2010)Comparison of heat-shock responses between the hydrothermalvent shrimp Rimicaris exoculata and the related coastal shrimpPalaemonetes varians. J Exp Mar Biol Ecol 393(1–2):9–16
Dauvin JC, Desroy N (2005) The food web in the lower part of theSeine estuary: a synthesis of existing knowledge. Hydrobiologia540(1–3):13–27
Devreker D, Souissi S, Seuront L (2004) Development and mortality ofthe first naupliar stages of Eurytemora affinis (Copepoda, Cala-noida) under different conditions of salinity and temperature. JExp Mar Biol Ecol 303(1):31–46
Devreker D, Souissi S, Forget-Leray J, Leboulenger F (2007) Effectsof salinity and temperature on the post-embryonic development ofEurytemora affinis (Copepoda; Calanoida) from the Seine estuary: alaboratory study. J Plankton Res 29(suppl 1):i117–i133
Devreker D, Souissi S, Molinero J-C, Nkibuto F (2008) Trade-offs ofthe copepod Eurytemora affinis in mega-tidal estuaries. Insightsfrom high frequency sampling in the Seine Estuary. J PlanktonRes 30(12):1329–1342
Devreker D, Souissi S, Winkler G, Forget-Leray J, Leboulenger F(2009) Effects of salinity, temperature and individual variabilityon the reproduction of Eurytemora affinis (Copepoda; Calanoida)from the Seine estuary: a laboratory study. J Exp Mar Biol Ecol368(2):113–123
Devreker D, Souissi S, Molinero J-C, Beyrend-Dur D, Gomez F,Forget-Leray J (2010) Tidal and annual variability of the popula-tion structure of Eurytemora affinis in the middle part of the SeineEstuary during 2005. Estuar Coast Shelf Sci 89(4):245–255
Drummond AJ, Ashton B, Buxton S, Cheung M, Cooper A, Duran C,Field M, Heled J, Kearse M, Markowitz S, Moir R, Stones-HavasS, Sturrock S, Thierer T, Wilson A (2011) Geneious v5.4, avail-able from http://www.geneious.com/
Farcy E, Serpentini A, Fiévet B, Lebel J-M (2007) Identification ofcDNAs encoding HSP70 and HSP90 in the abalone Haliotistuberculata: transcriptional induction in response to thermal stressin hemocyte primary culture. Comp Biochem Physiol B-Biochemi Molec Biol 146(4):540–550
Fu D, Chen J, Zhang Y, Yu Z (2011) Cloning and expression of a heatshock protein (HSP) 90 gene in the haemocytes of Crassostreahongkongensis under osmotic stress and bacterial challenge. FishShellfish Immun. doi:10.1016/j.fsi.2011.04.011
Gonzalez CRM, Bradley BP (1994) Salinity stress proteins in Euryte-mora affinis. Hydrobiologia 292–293(1):461–468
Gupta RS (1995) Phylogenetic analysis of the 90 kD heat shock familyof protein sequences and an examination of the relationshipamong animals, plants and fungi species. Mol Biol Evol 12(6):1063–1073
Hakimzadeh R, Bradley BP (1990) The heat shock response in thecopepod Eurytemora affinis (POPPE). J Therm Biol 15(1):67–77
Hofmann GE (2005) Patterns of Hsp gene expression in ectothermicmarine organisms on small to large biogeographic scales. IntegrComp Biol 45(2):247–255
Hofmann GE, Somero GN (1995) Evidence for protein damage atenvironmental temperatures: seasonal changes in levels of
ubiquitin conjugates and hsp70 in the intertidal mussel Mytilustrossulus. J Exp Biol 198:1509–1518
Karlin S, Brocchieri L (1998) Heat shock protein 70 family: multiplesequence comparisons, function, and evolution. J Mol Evol 47(5):565–577
Kim M, Ahn I-Y, Kim H, Cheon J, Park H (2009) Molecular charac-terization and induction of heat shock protein 90 in the Antarcticbivalve Laternula elliptica. Cell Stress Chaperon 14(4):363–370
Kimmel DG, Bradley BP (2001) Specific protein responses in thecalanoid copepod Eurytemora affinis (Poppe, 1880) to salinityand temperature variation. J Exp Mar Biol Ecol 266(2):135–149
Kimmel DG, Miller WD, Roman MR (2006) Regional scale climateforcing of mesozooplankton dynamics in Chesapeake Bay. EstuarCoasts 29(3):375–387
Laprise R, Dodson J-J (1994) Environmental variability as a factorcontrolling spatial patterns in distribution and species diversity ofzooplankton in the St. Lawrence Estuary. Mar Ecol Prog Ser 107(1–2):67–81
Lee CE (1999) Rapid and repeated invasions of fresh water by thecopepod Eurytemora affinis. Evolution 53(5):1423–1434
Lee AS (2001) The glucose-regulated proteins: stress induction andclinical applications. Trends Biochem Sci 26(8):504–510
Lee CE, Peterson CH (2003) Effects of developmental acclimation onadult salinity tolerance in the freshwater-invading copepod Eur-ytemora affinis. Physiol Biochem Zool 76(3):296–301
Lejeusne C, Pérez T, Sarrazin V, Chevaldonne P (2006) Baselineexpression of heat-shock proteins (HSPs) of a “thermotolerant”Mediterranean marine species largely influenced by natural tem-perature fluctuations. Can J Fish Aquat Sci 63(9):2028–2037
Li F, Luan W, Zhang C, Zhang J, Wang B, Xie Y, Li S, Xiang J (2009)Cloning of cytoplasmic heat shock protein 90 (FcHSP90) fromFenneropenaeus chinensis and its expression response to heatshock and hypoxia. Cell Stress Chaperon 14(2):161–172
Lindquist S (1986) The heat-shock response. Annu Rev Biochem55:1151–1191
Liu J, Yang W-J, Zhu X-J, Karouna-Renier NK, Rao RK (2004)Molecular cloning and expression of two HSP70 genes in theprawn, Macrobrachium rosenbergii. Cell Stress Chaperon 9(3):313–323
Luan W, Li F, Zhang J, Wang B, Xiang J (2009) Cloning and expres-sion of glucose regulated protein 78 (GRP78) in Fenneropenaeuschinensis. Mol Biol Rep 36(2):289–298
Luan W, Li F, Zhang J, Wen R, Li Y, Xiang J (2010) Identification of anovel inducible cytosolic Hsp70 gene in Chinese shrimp Fenner-openaeus chinensis and comparison of its expression with thecognate Hsc70 under different stresses. Cell Stress Chaperon 15(1):83–93
Mayer MP, Bukau B (2005) Hsp70 chaperones: cellular functions andmolecular mechanism. Cell Mol Life Sci 62(6):670–684
Minier C, Borghi V, Moore MN, Porte C (2000) Seasonal variation ofMXR and stress proteins in the common mussel, Mytilus gallo-provincialis. Aquat Toxicol 50(3):167–176
Mouneyrac C, Roméo M (2011) Stress proteins and the acquisition oftolerance. In: Amiard-Triquet C, Rainbow PS, Roméo M (eds)Tolerance to environmental contaminants. Taylor & FrancisGroup, London, pp 209–228
Mouny P, Dauvin JC (2002) Environmental control of mesozooplanktoncommunity structure in the Seine estuary (English Channel).Oceanol Acta 25(1):13–22
Nadam J, Navarro F, Sanchez P, Moulin C, Georges B, Laglaine A,Pequignot J-M,Morales A, Ryvlin P, Bezin L (2007) Neuroprotectiveeffects of erythropoietin in the rat hippocampus after pilocarpine-induced status epilepticus. Neurobiol Dis 25(2):412–416
Pan F, Zarate JM, Tremblay GC, Bradley TM (2000) Cloning andcharacterization of Salmon hsp90 cDNA: upregulation by thermaland hyperosmotic stress. J Exp Zool 287(3):199–212
Molecular characterization and mRNA expression 471
Pantzartzi CN, Kourtidis A, Drosopoulou E, Yiangou M, Scouras ZG(2009) Isolation and characterization of two cytoplasmic hsp90sfrom Mytilus galloprovincialis (Mollusca: Bivalvia) that contain acomplex promoter with a p53 binding site. Gene 431(1–2):47–54
Prodomou C, Roe SM, O’Brien R, Labdury JE, Piper PW, Pearl LH (1997)Identification and structural characterisation of the ATP/ADP-bindingsite in the Hsp90 molecular chaperone. Cell 90(1):65–75
Ravaux J, Toullec J-Y, Léger N, Lopez P, Gaill F, Shillito B (2007)First hsp70 from two hydrothermal vent shrimps, Mirocaris for-tunata and Rimicaris exoculata: characterization and sequenceanalysis. Gene 386(1-2):162–172
Rhee J-S, Raisuddin S, Lee K-W, Seo JS, Ki J-S, Kim I-C, Park HP,Lee J-S (2009) Heat shock protein (Hsp) gene responses of theintertidal copepod Tigriopus japonicus to environmental toxicants.Comp Biochem Phys C 149(1):104–112
Sørensen JG, Kristensen TN, Loeschcke V (2003) The evolutionary andecological role of heat shock proteins. Ecol Lett 6(11):1025–1037
Spees JL, Chang SA, Snyder MJ, Chang ES (2002) Osmotic inductionof stress-responsive gene expression in the Lobster Homarusamericanus. Biol Bull 203:331–337
Wang N, Whang I, Lee J-S, Lee J (2011) Molecular characterizationand expression analysis of a heat shock protein 90 gene from diskabalone (Haliotis discus). Mol Biol Rep 38(5):3055–3060
Wong ML, Medrano JF (2005) Real-time PCR for mRNA quantitation.Biotechniques 39(1):75–85
Xuereb B, Bezin L, Chaumot A, Budzinski H, Augagneur S, TutundjianR, Garric J, Geffard O (2011) Vitellogenin-like gene expression infreshwater amphipod Gammarus fossarum (Koch, 1835): functionalcharacterization in females and potential for use as endocrine dis-ruption biomarker in males. Ecotoxicol 20(6)):1286–1299
Zhang X-Y, Zhang M-Z, Zheng C-J, Liu J, Hu H-J (2009) Identifica-tion of two hsp90 genes from the marine crab, Portunus trituber-culatus and their specific expression profiles under differentenvironmental conditions. Comp Biochem Phys C 150:465–473
472 B. Xuereb et al.