Embed Size (px)
Citation preview

Visual Neurosciencehttp://journals.cambridge.org/VNS
Additional services for Visual Neuroscience:
Email alerts: Click hereSubscriptions: Click hereCommercial reprints: Click hereTerms of use : Click here
Molecular diversity of visual pigments in Stomatopoda (Crustacea)
MEGAN L. PORTER, MICHAEL J. BOK, PHYLLIS R. ROBINSON and THOMAS W. CRONIN
Visual Neuroscience / Volume 26 / Issue 03 / May 2009, pp 255 265DOI: 10.1017/S0952523809090129, Published online: 18 June 2009
Link to this article: http://journals.cambridge.org/abstract_S0952523809090129
How to cite this article:MEGAN L. PORTER, MICHAEL J. BOK, PHYLLIS R. ROBINSON and THOMAS W. CRONIN (2009). Molecular diversity of visual pigments in Stomatopoda (Crustacea). Visual Neuroscience,26, pp 255265 doi:10.1017/S0952523809090129
Request Permissions : Click here
Downloaded from http://journals.cambridge.org/VNS, IP address: 130.85.86.126 on 16 Aug 2012

Molecular diversity of visual pigments in Stomatopoda(Crustacea)
MEGAN L. PORTER, MICHAEL J. BOK, PHYLLIS R. ROBINSON AND THOMAS W. CRONINDepartment of Biological Sciences, University of Maryland, Baltimore County, Baltimore, Maryland
(RECEIVED February 16, 2009; ACCEPTED May 11, 2009; FIRST PUBLISHED ONLINE June 18, 2009)
Abstract
Stomatopod crustaceans possess apposition compound eyes that contain more photoreceptor types than any otheranimal described. While the anatomy and physiology of this complexity have been studied for more than two decades,few studies have investigated the molecular aspects underlying the stomatopod visual complexity. Based on previousstudies of the structure and function of the different types of photoreceptors, stomatopod retinas are hypothesizedto contain up to 16 different visual pigments, with 6 of these having sensitivity to middle or long wavelengths of light.We investigated stomatopod middle- and long-wavelength-sensitive opsin genes from five species with the hypothesisthat each species investigated would express up to six different opsin genes. In order to understand the evolution ofthis class of stomatopod opsins, we examined the complement of expressed transcripts in the retinas of speciesrepresenting a broad taxonomic range (four families and three superfamilies). A total of 54 unique retinal opsins wereisolated, resulting in 6–15 different expressed transcripts in each species. Phylogenetically, these transcripts formsix distinct clades, grouping with other crustacean opsins and sister to insect long-wavelength visual pigments. Withinthese stomatopod opsin groups, intra- and interspecific clusters of highly similar transcripts suggest that there hasbeen rampant recent gene duplication. Some of the observed molecular diversity is also due to ancient gene duplicationevents within the stem crustacean lineage. Using evolutionary trace analysis, 10 amino acid sites were identified asfunctionally divergent among the six stomatopod opsin clades. These sites form tight clusters in two regions of theopsin protein known to be functionally important: six in the chromophore-binding pocket and four at the cytoplasmicsurface in loops II and III. These two clusters of sites indicate that stomatopod opsins have diverged with respect toboth spectral tuning and signal transduction.
Keywords: Stomatopoda, Opsin, Visual pigment, Molecular evolution
Introduction
Animal visual pigments, and the proteins on which they are based,have long served as model systems for learning how proteinvariation affects function and sensory phenotypes. Composed ofa protein, opsin, coupled to a chromophore derived from a memberof the vitamin A family, visual pigments are the light-sensitivemolecules that initiate the visual signaling cascade and thus serveas the foundation on which visual sensitivity depends. Among dif-ferent animals, a diversity of visual pigments, ranging in numberfrom a single class to more than a dozen spectral types, can be ex-pressed in a single retina. The quality of color vision and theability of a given species to use the available spectrum of envi-ronmental light are determined both by the spectral diversity ofvisual pigments and by the particular wavelengths of maximalabsorbance (kmax) to which they are tuned. For the purposes of thisresearch, we define ultraviolet-sensitive visual pigments as thosewith kmax ranging from 300 to 400 nm, middle-wavelength-sensitivepigments as those with 400–490 nm, and long-wavelength-sensitivepigments as those with greater than 490 nm.
The evolution of the protein component of visual pigments(e.g., opsin) and its role in generating visual pigment spectral di-versity has been investigated most extensively in three taxonomicgroups: vertebrates, cephalopods, and insects (Morris et al., 1993;Yokoyama, 2000; Bowmaker & Hunt, 2006; Frentiu et al., 2007a).These taxa represent the two major groups of photoreceptors andcorrelated opsin classes: the vertebrate ciliary photoreceptors andopsins and the rhabdomeric photoreceptors and opsins found incephalopods, arthropods, and other nonvertebrate groups. Thesegroups also represent a range of variation both in numbers of ex-pressed visual pigments and in numbers of spectral absorption,ranging from visual systems based on a single visual pigment(deep-sea fishes) to ones based on five or more (e.g., birds, dip-terans). Comparative genomic studies in the mosquito Anophelesgambiae (12 opsin genes) and the fruit fly Drosophila melanogaster(8 opsin genes) as well as evolutionary expression studies in but-terflies show that there has been considerable species-specificexpansion via duplication of the opsin genes in insects (Briscoe,2001; Hill et al., 2002; Frentiu et al., 2007b).
The most complex visual system known in terms of photore-ceptor and spectral diversity is found in stomatopod crustaceans(mantis shrimps). Crustacean compound eyes are composed ofseparate optical units called ommatidia, each containing a group
Address correspondence and reprint requests to: Megan L. Porter,Department of Biological Sciences, University of Maryland, BaltimoreCounty, Baltimore, MD 21250. E-mail: [email protected]
255
Visual Neuroscience (2009), 26, 255–265. Printed in the USA.Copyright � 2009 Cambridge University Press 0952-5238/09 $25.00doi:10.1017/S0952523809090129

of eight photoreceptor cells. Based on microspectrophotometric andphysiological characterization, the retinas of single stomatopodspecies contain up to 16 different spectral classes of photo-receptors. This large spectral diversity in the retina is due toa number of specialized ommatidial classes found only instomatopods. In particular, up to six rows of ommatidia form anequatorial region called the midband, where tiered receptors withstructural specializations contain several ultraviolet-sensitive re-ceptor types, eight photoreceptor classes optimized for multichannelcolor vision, and a set of polarization-specific receptors. Addition-ally, the ommatidia outside the midband contain photoreceptors witha middle-wavelength class of visual pigments devoted to spatialvision (Cronin & Marshall, 1989a, 2004; Cronin et al., 2000). Basedon previous studies of the relationship between photoreceptorspectral sensitivity and visual pigment expression, we hypothesizethat each spectral class of stomatopod photoreceptors expresses adifferent opsin gene and therefore a different visual pigment, lead-ing to the expression of up to 16 different opsins in a single retina.
Stomatopods are particularly attractive for studying the evolu-tion of visual pigment structure and function, as their ecology andvisual physiology are well investigated, and the hypothesis of sucha large number of visual pigments offers an unparalleled opportu-nity to track the genetic basis of visual system evolution. Althoughseveral recent studies have successfully expressed rhabdomericopsins in in vitro systems, arthropod opsins are still extremelydifficult to express in vitro, with honeybee ultraviolet- and blue-sensitive visual pigments the only examples to date (Koyanagiet al., 2008; Terakita et al., 2008). It is the large number ofhypothesized visual pigments, however, that makes stomatopodsideal for investigating the molecular mechanisms involved in thespectral tuning rhabdomeric visual pigments. Furthermore, there isvariation throughout the order Stomatopoda in terms of habitat(shallow vs. deep marine) and at the level of eye complexity, withsome species completely lacking the specialized midband, whileothers have midbands with two, three, or six ommatidial rows. Thisdiversity at several levels allows for the comparison of opsin genesfrom multiple spectral classes within a single retina and froma single spectral class across species with varying habitats and eyecomplexities.
While stomatopod crustaceans contain the most complexvisual system known in terms of photoreceptor diversity, thisextreme example of vision has not been well characterized mo-lecularly nor has its evolution from earlier arthropod ancestorsbeen investigated. The extensive receptor spectral variation isthought to be founded on a similar level of opsin genes, but todate, only one study has investigated the underlying genetics ofvisual pigments in any species of mantis shrimp, characterizing3 of the 16 expected opsin transcripts from the retina of theCaribbean species Neogonodactylus oerstedii (Brown, 1996).
Here, we present the first large-scale investigation of opsinexpression, diversity, and evolution in the stomatopod crustaceans.We selected five species for study, representing three of the sevenrecognized superfamilies of Stomatopoda, and amplified tran-scripts within their retinas using primers developed for typicalcrustacean middle- and long-wavelength-sensitive (M/LWS) opsins.Based on microspectrophotometric studies, stomatopods containup to six photoreceptors with M/LWS visual pigments, andcorrespondingly, we expected that the degenerate primers usedwould isolate up to six unique opsin transcripts per species.To investigate the evolutionary history of stomatopod opsin diversity,a representative of each unique transcript was used in phyloge-netic analyses. Finally, evolutionary trace analysis was used to
identify sites that are divergent among stomatopod opsin groups,implying modes of functional diversification.
Materials and methods
Taxon sampling
Determination of stomatopod phylogenetic relationships andtaxonomic diversity followed the classification of Ahyong andHarling (2000). The five species used for this research includedrepresentatives from three of the seven extant superfamilies withinthe Stomatopoda (Table 1). These three superfamilies—the Gon-odactyloidea, Lysiosquilloidea, and Squilloidea—contain ~87% ofextant stomatopod species biodiversity. Furthermore, the chosenspecies span a range of taxonomic distances, so that sequencecomparisons can be made across species within a family, familieswithin a superfamily, and across superfamilies.
RNA extraction, polymerase chain reaction, and sequencing
We expected to recover a large amount of variation in opsin se-quences because we were dealing with a large number of poten-tially similar genes in each species. In addition, we have no a priorihypotheses concerning the diversity of alleles for each gene. Thisposes a difficult situation to characterize using polymerase chainreaction (PCR) methods where the potential for artifacts amongsimilar genes is high. Therefore, we have taken every precautionavailable to minimize the potential for error. Genetic variationamong individuals was eliminated by using a single individual foreach species. Because we expect a large amount of opsin diversitywith high sequence similarity, the potential for PCR artifacts due torecombination (e.g., chimeras) is high (Bradley & Hillis, 1997).The creation of PCR-generated chimeras is correlated with, amongother factors, the type of polymerase used for amplification, thenumber of PCR cycles used, and the diversity of the sequence targetsin the sample (Qiu et al., 2001). To minimize the occurrence ofchimeric artifacts during PCR cycling, we used Taq polymerase,which has a lower percentage of recombination events than othertypes of polymerase (Zylstra et al., 1998). The occurrence of chimericartifacts and Taq incorporation errors were also minimized usingphylogenetic analyses (see next section below). This methodologywas verified using a high-fidelity polymerase as described below ina single species (N. oerstedii) for comparison of clone sequencevariation. A final confirmation of our recovered sequence diver-sity was accomplished by designing gene-specific primers for aN. oerstedii sequence from each major phylogenetic group andamplifying full-length sequences for each selected sequence fromcomplementary DNA (Fig. 1, underlined sequences). These full-length sequences were amplified using Taq polymerase and 30cycles at 95°C for 10 s, 55°C for 30 s, and 68°C for 90 s.
The eyes of each target species were dissected to isolate theretinas, which were either immediately processed or preserved inRNAlater (Qiagen, Valencia, CA) and stored at �20°C untilprocessing. Total RNA was isolated from whole retina using Trizol(Invitrogen, Carlsbad, CA) and used to generate cDNA using 39
Rapid Amplification of cDNA Ends (RACE) methods. First-strandcDNA synthesis was performed using a poly(T) primer with anadded adapter sequence (Oakley & Huber, 2004) and SuperscriptIII Reverse Transcriptase (Invitrogen) according to the manufac-turer’s instructions. Second-strand sequences were generated usingHotMaster Taq (Eppendorf, Westbury, NY) with a primer for theadapter sequence and a degenerate primer designed from crusta-
256 Porter et al.

cean middle-wavelength opsin sequences (LWF1a: TGG TAY CARTWY CCI CCI ATG AA; Porter et al., 2007) and the following PCRcycling parameters: 94°C (30 s) for denaturation, 49°C (30 s) forannealing, and 70°C (2 min) for extension for 45–50 cycles. Thesecycling parameters resulted in just detectable products of theexpected size when run on 1% agarose gels and visualized withethidium bromide. To screen for the possibility of the expression ofmultiple opsin genes, 39 RACE products were purified using theMinElute Gel Extraction Kit (Qiagen) and cloned into the pCR2.1-TOPO vector using the TA Cloning Kit (Invitrogen). Colonies werescreened for inserts by PCR using vector primers and the followingPCR conditions: denaturation at 94°C for 1 min, primer annealingat 55°C for 1 min, and chain extension at 72°C for 1.5 min for30 cycles. Amplified clone products of the expected size were purifiedusing a QIAquick PCR Purification Kit (Qiagen). In order tosequence the entire insert, purified products were sequenced usingthe ABI Big Dye Primer Cycle Sequencing Ready Reaction Kit(Applied Biosystems, Foster City, CA) with the LWF1a primer andthe 1080_mod2F internal degenerate opsin primer (TI MRI GAICAR GCI AAR AAR ATG, modified from Oakley & Huber, 2004)on an ABI PRISM 3100 Automated Capillary Genetic Analyzer(Applied Biosystems, Foster City, CA) automated sequencer.All recovered clone sequences were confirmed to be an opsin bysimilarity searches using the GenBank BLAST software (http://www.ncbi.nlm.nih.gov/BLAST/). Confirmed opsin sequenceswere deposited in GenBank (accession numbers GQ221703-GQ221756).
The error rate for this methodology of characterizing transcriptsequences was assessed by repeating the procedure with a high-fidelity proofreading polymerase for a single species, N. oerstedii.Briefly, cDNA was generated with the Accuscript high-fidelityreverse transcriptase (Stratagene, LaJolla, CA), and second-strandproducts were generated with the PrimeSTAR high-fidelity DNApolymerase (Takara Bio Inc., Madison, WI) and the following PCRconditions: initial denaturation at 95°C for 2 min, followed by 30cycles at 95°C for 15 s, 55°C for 15 s, and 68°C for 90 s. Amplifiedproducts were cloned as previously described. Colonies containinginserts were grown in overnight cultures, and the plasmids werepurified with the QIAprep Spin Miniprep Kit (Qiagen). PlasmidDNA was sequenced directly using the same primers and sequenc-ing protocols as previously described. One hundred additionalclones from this high-fidelity procedure were sequenced as pre-viously described, and the variation and overlap in sequencediversity from a single individual were compared between the
original and the high-fidelity methods. We found that these 100clones from the high-fidelity methods recovered the same set ofsequences as the original methods, which validates the originaltechniques (data not shown).
Phylogenetic methods
To account for the possibility of chimeras in our recovered se-quences, we analyzed all the representative sequences from eachindividual species using the chimera detection program Bellerophon(Huber et al., 2004). Sequences identified as possible chimeraswere manually checked to confirm chimeric origins. Using this pro-cedure, three sequences of the total recovered genes were identifiedas chimeric and removed from subsequent analyses. To estimate thepotentially high Taq incorporation errors in our sequences, thehigh-fidelity clone sequences were compared to the original se-quences obtained from N. oerstedii, a neighbor-joining phylogenywas constructed, and a percent sequence difference was calculatedfor each cluster of sequences on the tree. Using this approach, wecalculated the Taq error to be #2%. To account for this potentialerror, all the isolated stomatopod opsin sequences for each specieswere analyzed using DOTUR v1.53 (Schloss & Handelsman, 2005),implementing the furthest neighbor-clustering algorithm to delineatesequence clusters at the 98% similarity level (e.g., a sequencedistance of 2%). Each of these sequence clusters was considered torepresent copies of a unique opsin transcript, and a single sequencefrom each cluster was chosen for use in subsequent analyses.
The representative sequences of each species were combinedwith other arthropod opsin sequences from GenBank, translated toamino acids, and aligned using ProbCons v1.08 (Do et al., 2005),resulting in a final alignment of 330 amino acid positions. To rootthe tree, a range of out-groups were used, including cephalopodvisual opsins (Loligo subulata—Z49108, Octopus dofleini—X07797,and Sepia officinalis—AF000947), vertebrate melanopsins (Homosapiens—AF147788 and Mus musculus—AF147789), vertebratevisual (Bos taurus—NM_001014890) and nonvisual (Gallus galluspinopsin—U15762) opsins, and G protein–coupled receptors(GPCRs) from the rhodopsin GPCR family (class A) that are clos-ely related to the opsins (H. sapiens GPR52—NM_005684 andH. sapiens MTNR1A—NM_005958). The best fit model of proteinevolution was determined using ProtTest v1.4 (Abascal et al., 2005),and an amino acid maximum likelihood tree was reconstructed usingPhyML (Guindon & Gascuel, 2003; Guindon et al., 2005). Branchsupport values were estimated from 100 PhyML bootstrap replicates
Table 1. Summary of the taxonomy, the expected number of visual pigments (VPs) expressed in the retinas ofstomatopod species characterized in this study, the expected number of middle- and long-wavelength-sensitive(M/LWS) VPs in each species, and the reference for the microspectrophotometric studies for each species leadingto the hypothesized numbers
Superfamily Family SpeciesNumber of
VPsNumber of
M/LWS VPs References
Gonodactyloidea Gonodactylidae Gonodactylus smithii 16 6 Chiao et al. (2000)Neogonodactylus oerstedii 16 6 Cronin and Marshall
(1989b)Odontodactylidae Odontodactylus scyllarus 16 6 Cronin et al.
(1994, 1996)Lysiosquilloidea Nannosquillidae Coronis scolopendra 16 6 Cronin et al. (1993)Squilloidea Squillidae Squilla empusa 1 1 Cronin (1985);
Cronin et al. (1993);Cronin and Jinks (2001)
Visual pigment diversity in Stomatopoda 257

Coronis scolopendra
Gonodactylus smithii
Neogonodactylus oerstedii
Odontodactylus scyllarus
Squilla empusa
Stomatopod Species Key
92
96
77
99
99
76100
100
100
77
100
7386100
9773
93
99
80
97
10081
100
99
99
100
99
81
99
84
0.1
Cs1
Cs2
Cs3Cs6
Cs5Cs4
Cs9
Cs8Cs7
Cs10
Cs12
Cs11
Gs1
Gs3Gs2
Gs10
Gs9
Gs8
Gs7
Gs6
Gs5
Gs4
No1No2
No15
No14
No13
No12
No11
No10
No9
No8**
No7
No6
No5No4
No3
Os1
Os11Os10
Os9Os8
Os7
Os6Os5
Os4Os3
Os2
Se2
Se1
Se6
Se5Se4
Se3
Penaeus monodon (AI253885)
D. melanogaster Rh5 (U67905)Apis mellifera (AF004168)
Manduca sexta (AD004169)Apis mellifera (AF004169)
Manduca sexta (L78081)D. melanogaster Rh4 (AH001040)
D. melanogaster Rh3 (M17718)
D. melanogaster Rh2 (M12896)
D. melanogaster Rh1 (AH001026)
D. melanogaster Rh6 (Z86118)
Hemigrapsus sanguineus (D50583)
Hemigrapsus sanguineus (D50584)Portunus pelagicus (EF110527)
C. erythrocephala (M58334)
Limulus lateral eye (L03781)Limulus ocelli (L03782)
Apis mellifera (U26026)Sphodromantis sp. (X71665)Manduca sexta (L78080)
Procambarus clarkii (S53494)Orconectes virilis (AF003545)
Cambarus ludovicianus (AF003543)
Penaeus monodon (AI770242)
Archaeomysis grebnitzkii (DQ852575)Euphausia superba (DQ852579)
Mysis diluviana (DQ852591)Holmesimysis costata (DQ852586)
Neomysis americana (DQ852598)
Homarus gammarus (DQ852587)
Group A
Group B
Group C
Group D
Group E
Group F
Fig. 1. Phylogenetic tree of stomatopod and selected invertebrate opsins (out-groups not shown, and see text for out-groups used). Tree
was reconstructed using a maximum likelihood analysis of amino acid sequences. Numbers on branches represent bootstrap proportions
from 100 replicates; only bootstrap values above 70% are indicated, and for clarity, values are not shown in clades A and B due to short
branch lengths. Opsin sequences from the five species investigated are labeled by a species designation (Cs, Coronis scolopendra;
Gs, Gonodactylus smithii; No, Neogonodactylus oerstedii; Os, Odontodactylus scyllarus; Se, Squilla empusa) and a sequence number.
The sequence used for three-dimensional homology modeling is indicated by asterisks, and N. oerstedii sequences independently
confirmed using gene-specific primers are underlined.
258 Porter et al.

as bootstrap proportions (BPs). BP values greater than or equal to70% were considered strong support for a clade (Hillis & Bull, 1993).
Without information about the stomatopod genome, it isdifficult to distinguish allelic diversity from gene copy diversity.The most similar duplicated opsin gene copies in model organismsexhibit amino acid similarities in the region from helix (H) I toHVIII, ranging from 75% (D. melanogaster Rh3 and Rh4) to 95%(human red and green cone opsins) to 100% (A. gambiae GPRop1,GPRop2, GPRop3, and GPRop4; Hill et al., 2002). Additionally,we are not aware of any studies that investigate allelic versus genecopy variation in invertebrate opsin genes, making predictions ofthe expected allelic variation difficult. In this study, we providea conservative estimate of the number of opsin gene copies in thegenome of each species by dividing the number of unique tran-scripts (with odd numbers rounded up to the next even number) ineach monophyletic clade of stomatopod opsins by two (assumingtwo alleles per locus) and then summing this number across allmonophyletic clades of stomatopod opsins in the phylogeny.
Duplicated gene functional constraints and divergence analyses
The functional divergence of stomatopod opsins was investigatedusing evolutionary trace analysis (Lichtarge et al., 1996). The evo-lutionary trace method identifies functionally important amino acidresidues by evaluating patterns of sequence conservation acrossclusters of related proteins and has been useful in investigatingopsin functional divergence in vertebrates as well as GPCRfunctioning in general (Madabushi et al., 2004; Carleton et al.,2005). Clusters are identified as monophyletic groups on a phylog-eny. Within each cluster, every site was identified as either com-pletely conserved among all proteins or variable if even one proteincontained a different residue. These traces of each cluster were thencompared, and each site was classified as conserved if the residuewas identical at a site across all clusters, functionally divergent ifthe same within but different among clusters, or as not functionallyimportant (e.g., variability in residue identity at a site results in nodiscernable pattern of conservation by cluster). In order to comparepatterns of residue conservation among clusters of stomatopodopsin sequences, we defined six clusters of stomatopod opsins (seeResults). Group D was excluded from the evolutionary traceanalysis because it only contained two sequences, with an aminoacid similarity of 98.2% (1.8% sequence difference). The remain-ing five groups each contained $15% sequence difference.
To investigate structural and functional impacts of divergenceanalyses, a homology model of a clade A stomatopod opsin (Fig. 1,sequence with asterisk) was constructed. The missing 59 portion of
the stomatopod opsin sequence chosen for modeling was completedusing 59 RACE methods and confirmed using a single set of primersdesigned to isolate the full-length opsin sequence, so that a full-length stomatopod opsin sequence was used to create the homologymodel. The stomatopod opsin homology model was constructedusing the interactive mode of the 3D-JIGSAW v2.0 server(www.bmm.icnet.uk/servers/3djigsaw/; Bates & Sternberg, 1999;Bates et al., 2001; Contreras-Moreira & Bates, 2002) based ona crystal structure of the squid, Todarodes pacificus, rhodopsin at2.5 A (structure 2z73; Murakami & Kouyama, 2008). Since theconstructed stomatopod homology model did not contain informa-tion on the orientation of the chromophore within the bindingpocket, we aligned the new stomatopod structure with the originalsquid structure (2z73.pdb), and the chromophore location andorientation from the squid model were reproduced in our modelfor structural reference to the location of the binding pocket. Sitesidentified by evolutionary trace analysis were mapped onto thestomatopod homology model using Swiss-Pdb Viewer v3.9b1(http://www.expasy.org/spdbv/; Guex & Peitsch, 1997). Through-out the remaining text, amino acid site numbers will be given basedon our alignment, followed by the bovine rhodopsin site number(indicated by Rho #) for comparison.
Results
Characterization of stomatopod opsins
Transcripts of retinally expressed opsins from five stomatopodspecies were sequenced from the beginning of transmembrane HIthrough the end of the 39 UTR. Because the C-terminus of the opsinprotein and the 39 UTR are highly variable and therefore unalign-able, only the 305 amino acid residues encompassing HI throughHVIII were included in subsequent phylogenetic and functionaldivergence analyses. The C-terminus and 39 UTR sequences wereuseful, however, in confirming the uniqueness of the transcripts. Weconsidered variation among transcripts in these regions as additionalsupport for our methods of assessing clone uniqueness. In total, 152clones were screened, resulting in 54 unique opsin transcriptsamong all the species (Table 2). Using primers designed fromcrustacean M/LWS opsins, the number of unique sequences found ina single species ranged from 6 (Squilla empusa) to 15 (N. oerstedii).
All the sequenced transcripts in our five target species containedcharacteristic opsin features, including the chromophore-bindingsite (Rho K296), the (E/D)RY motif at the cytoplasmic end ofHIII, and a glutamic acid at the site of the hypothesized ancestralcounterion (Rho E181; Terakita et al., 2004). The isolated transcripts
Table 2. Summary of the number of clones screened per species, the number of unique stomatopod opsintranscripts found in each species investigated, and the distribution of the transcripts in each species amongphylogenetically distinct groups (A–F)
SpeciesNumber of
clones screenedNumber of
unique sequences
Number of transcriptsper group
Estimated genecopy numberA B C D E F
Gonodactylus smithii 27 10 6 3 0 0 0 1 6Neogonodactylus oerstedii 53 15 4 5 1 2 0 3 9Odontodactylus scyllarus 17 11 4 3 2 0 2 0 6Coronis scolopendra 26 12 10 1 1 0 0 0 7Squilla empusa 29 6 4 1 0 0 1 0 4Total 152 54 28 13 4 2 3 4
Visual pigment diversity in Stomatopoda 259

also included typical rhabdomeric sequence features, such asa tyrosine at the vertebrate counterion site (Rho E113) and an ~14-amino acid indel in cytoplasmic loop (C) III (Porter et al., 2007). Inphylogenetic analyses, all the isolated stomatopod sequences clus-tered with each other and with other crustacean opsins in a groupsister to insect opsins that form long-wavelength-sensitive visualpigments (Fig. 1).
Patterns of gene duplication in stomatopod opsins
Within the main clade of crustacean opsins, our 54 unique sto-matopod sequences form six well-supported monophyletic clus-ters (Fig. 1). Group A (BP 5 92) contains the largest number ofstomatopod opsin sequences (n 5 28), followed by group B (BP 5
99) with 13 sequences. Group C (BP 5 100) is composed of onlyfour sequences from three species (Coronis scolopendra,N. oerstedii, and Odontodactylus scyllarus). Group D (BP 5 99)is the smallest group, composed of only two sequences fromN. oerstedii, corresponding to two of the transcripts originallyisolated by Brown (1996). Sequence groups A–D form a largemonophyletic clade of only stomatopod opsins (BP 5 64). Group E(n 5 3, BP 5 76), composed of sequences from two species(O. scyllarus and S. empusa), is clustered with opsins representingtwo additional orders of crustaceans (Euphausiacea and Mysida).Finally, group F is a well-supported cluster (BP 5 97) containingfour sequences from two stomatopod species (Gonodactylus smithiiand N. oerstedii) as well as an opsin from a decapod shrimp(Penaeus monodon). Group F, together with additional decapodopsins, forms the basal lineage in the main clade of crustaceanopsins. Our sequencing efforts did not recover representatives of allsix opsin groups in any of the stomatopod species. Both groupsA and B, however, contained transcripts from all five speciesinvestigated, while groups C–F consisted of sequences from threeor fewer species. The largest number of expressed transcripts wasobserved in groups A and B, where many of the sequences formclusters of closely related sequences from single species.
In this study, up to 15 different opsin transcripts in the crustaceanM/LWS group were identified from a single species. Using a conser-vative estimate of gene copy number, that is, our sequence variationrepresents two alleles at each locus, the number of opsin gene copiesrecovered in our set of species ranged from four (S. empusa) to nine(N. oerstedii), with three species containing more opsin copies thanpredicted (N. oerstedii, C. scolopendra, and S. empusa; Table 2).In particular, the recovery of four gene copies (six transcripts) dis-tributed throughout three phylogenetically distinct sequence clustersfrom the retina of S. empusa is significant as based on studies ofphotoreceptor anatomy and spectral sensitivity, and S. empusa eyeswere hypothesized to contain a single M/LWS visual pigment(Cronin, 1985).
Functional constraints and divergence in stomatopod opsins
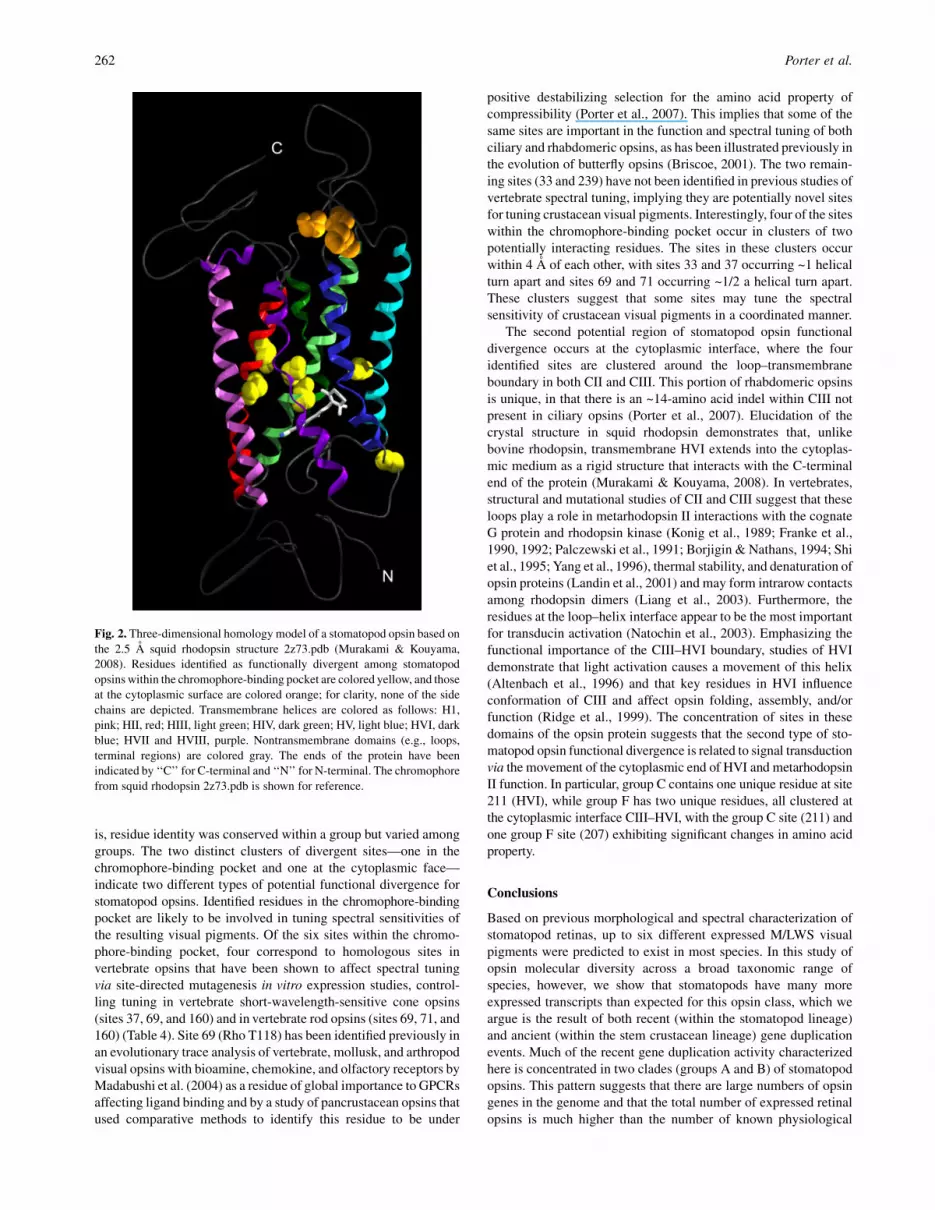
Based on evolutionary trace analysis, 29.4% of the amino acidresidues in the region spanning from HI to HVII were conservedin all the currently characterized stomatopod opsin sequences.A total of 10 sites were identified as functionally divergent instomatopod opsins (Table 3). These form two clusters, one of foursites at the cytoplasmic face of the protein and the other of six sitessurrounding the chromophore-binding pocket (Fig. 2). The func-tional sites in the chromophore-binding pocket are located in HII(two sites), HIII (two sites), HV (one site), and HVI (one site)(Table 3). The stomatopod opsin homology model indicates that allsix of these sites are on helical turns facing the binding pocket. The
four sites on the cytoplasmic face of the opsin are clustered at loop–transmembrane boundaries in CII and CIII.
Of the 10 identified sites, 4 differentiate group F from the otherstomatopod opsins (residues 37, 160, 207, and 210), with two ofthe four amino acid replacements corresponding to significantchanges in amino acid properties (C160V and K207T). Two ofthese four sites are within the chromophore-binding pocket, bothcorresponding to sites previously identified as affecting spectraltuning in vertebrates (Table 4). The remaining two sites are at thecytoplasmic interface and have been shown to affect spectral tuning(D210E, +4 nm) and transducin activation (K207C) in vertebratevisual pigments (Table 4). Two sites (L99M and C211I) differen-tiate group C from other stomatopod opsins, with both sites found atthe cytoplasmic interface of the protein. Both sites have been shownto be functionally important in bovine rhodopsin, affecting eitherphosphorylation or transducin activation (Table 4). The remainingsites differentiate groups A and B from C, E, and F (S33N) orgroups A–C from E and F (S69N, T/F71C, and L/I239M). Althoughtwo of these sites have no known function in vertebrates, sites69 and 71 both have been shown to affect spectral tuning.Additionally, in a comparative evolutionary study of pancrustaceanopsin sequences, site 69 (Rho T118) was identified as a site underdestabilizing positive selection (Porter et al., 2007).
Discussion
Patterns of gene duplication in stomatopod opsins
Stomatopods contain complex retinas hypothesized to contain upto 16 different visual pigments, with 6 of these having sensitivityto middle or long wavelengths of light. In this study, up to 15different opsin transcripts in the crustacean M/LWS opsin classwere identified from a single species. The isolated transcripts fromeach species form clusters of highly similar sequences, indicatingthat there have been many rounds of opsin gene duplicationthroughout the evolution of stomatopod visual systems, includingmany recently duplicated functionally similar copies that are stillexpressed in a single retina. Most of the recent duplication appearsto be concentrated in only two of the identified stomatopod opsinclades, groups A and B. This pattern is similar to opsin expressionin ostracods, where Oakley and Huber (2004) found eye-specificopsin expression of multiple loci in the median versus thecompound eyes. Within the isolated stomatopod opsin sequences,the most remarkable examples of multiple opsin expression withina retina are the S. empusa opsins. Relative to the most complexstomatopod eyes, S. empusa exhibits a reduced eye morphologycontaining only two midband rows. Furthermore, microspectro-photometric studies of S. empusa visual pigments implied that inthe retina, all peripheral and midband photoreceptors contain asingle visual pigment (Cronin, 1985). Our study, however, re-covered six S. empusa opsin transcripts, which are distributedthroughout three phylogenetically distinct sequence clusters. Con-servatively, these transcripts represent four opsin copies in thegenome. Because S. empusa contains at most three morphologi-cally distinct photoreceptor types, these opsins must be coex-pressed in some parts of the eye. Finding the expression of multipleopsin gene copies in a retina previously thought to contain a sin-gle visual pigment implies that the molecular components ofthe S. empusa visual system are unexpectedly complex. Similarunexpected opsin sequence diversity has been found in both thecrab Hemigrapsus sanguineus (Sakamoto et al., 1996) and thedeep-sea lophogastrid Gnathophausia ingens (Frank et al., 2009),
260 Porter et al.

where in both species, two expressed opsin copies were found inphotoreceptors without physiological evidence for the presence ofmultiple visual pigment spectral types. In contrast to insect opsins,multicopy opsin expression within a single photoreceptor, possiblyof many recently duplicated loci, may represent a common occurrencein crustacean visual systems. The functional consequence for crus-tacean vision of multiple opsin expression in single photoreceptorsis one that requires further research.
The stomatopod opsin clades also do not cluster together. Inparticular, the phylogenetic position of clade F at the base of thecrustacean opsin cluster indicates that many of the gene duplica-tion events leading to the visual pigment diversity in extant speciesare the product of ancient duplications early in crustaceanevolution before the divergence of stomatopods, mysids, decap-
ods, and euphausiids. This is in agreement with the hypothesis ofBriscoe and Chittka (2001) that the major pattern of crustaceanvisual systems containing one or two visual pigments representsa derived state, with copies of the gene having been lost.
Functional constraints and divergence
Based on evolutionary trace analysis, 29.4% of the amino acidresidues are conserved in all the stomatopod opsin sequences,indicating that roughly a quarter of amino acid sites are highlyconstrained, probably in order to maintain proper protein function.Of the variable residues, 10 sites forming two distinct clusterswithin the protein exhibited patterns of amino acid differenceconsistent with functional divergence in stomatopod opsins, that
Table 3. Evolutionary trace analysis of stomatopod opsin groups A, B, C, E, and F (Fig. 1). The first row contains the opsin amino acidsequence from Procambarus clarkii (labeled Pc; accession number: S53494) as a representative crustacean opsin for comparison. The tracefor each opsin group represents a consensus sequence for all of the transcripts within that group. If a particular site is classified asfunctionally divergent among opsin sequence groups, the residues are highlighted in grey; if an identified site also contains a replacementwith significant differences in amino acid property, the site is highlighted in black. In the consensus sequence trace for each opsin group,conserved sites are indicated by an amino acid, dashes show the sites variable with respect to residue identity, ?s specify missing data, anda * designates a sequence gap. The summary trace represents the pattern of conservaed and variable residues among the traces of allthe opsin groups. In the summary trace (SUM), functionally divergent sites are indicated by an ‘‘X’’. The major opsin domains (HI–VIII),transmembrane helices; CI–III, cytoplasmic loops; EI–III, extracellular loops are indicated. The amino acid numbers correspond to ouralignment of crustacean opsins, not to bovine rhodopsin numbers. However, the vertebrate counterion site (Y64 in this study), thehypothesized ancestral opsin counterion site (E132), and the Schiff base linkage (K258) are indicated by arrows
Visual pigment diversity in Stomatopoda 261
is, residue identity was conserved within a group but varied amonggroups. The two distinct clusters of divergent sites—one in thechromophore-binding pocket and one at the cytoplasmic face—indicate two different types of potential functional divergence forstomatopod opsins. Identified residues in the chromophore-bindingpocket are likely to be involved in tuning spectral sensitivities ofthe resulting visual pigments. Of the six sites within the chromo-phore-binding pocket, four correspond to homologous sites invertebrate opsins that have been shown to affect spectral tuningvia site-directed mutagenesis in vitro expression studies, control-ling tuning in vertebrate short-wavelength-sensitive cone opsins(sites 37, 69, and 160) and in vertebrate rod opsins (sites 69, 71, and160) (Table 4). Site 69 (Rho T118) has been identified previously inan evolutionary trace analysis of vertebrate, mollusk, and arthropodvisual opsins with bioamine, chemokine, and olfactory receptors byMadabushi et al. (2004) as a residue of global importance to GPCRsaffecting ligand binding and by a study of pancrustacean opsins thatused comparative methods to identify this residue to be under
positive destabilizing selection for the amino acid property ofcompressibility (Porter et al., 2007). This implies that some of thesame sites are important in the function and spectral tuning of bothciliary and rhabdomeric opsins, as has been illustrated previously inthe evolution of butterfly opsins (Briscoe, 2001). The two remain-ing sites (33 and 239) have not been identified in previous studies ofvertebrate spectral tuning, implying they are potentially novel sitesfor tuning crustacean visual pigments. Interestingly, four of the siteswithin the chromophore-binding pocket occur in clusters of twopotentially interacting residues. The sites in these clusters occurwithin 4 A of each other, with sites 33 and 37 occurring ~1 helicalturn apart and sites 69 and 71 occurring ~1/2 a helical turn apart.These clusters suggest that some sites may tune the spectralsensitivity of crustacean visual pigments in a coordinated manner.
The second potential region of stomatopod opsin functionaldivergence occurs at the cytoplasmic interface, where the fouridentified sites are clustered around the loop–transmembraneboundary in both CII and CIII. This portion of rhabdomeric opsinsis unique, in that there is an ~14-amino acid indel within CIII notpresent in ciliary opsins (Porter et al., 2007). Elucidation of thecrystal structure in squid rhodopsin demonstrates that, unlikebovine rhodopsin, transmembrane HVI extends into the cytoplas-mic medium as a rigid structure that interacts with the C-terminalend of the protein (Murakami & Kouyama, 2008). In vertebrates,structural and mutational studies of CII and CIII suggest that theseloops play a role in metarhodopsin II interactions with the cognateG protein and rhodopsin kinase (Konig et al., 1989; Franke et al.,1990, 1992; Palczewski et al., 1991; Borjigin & Nathans, 1994; Shiet al., 1995; Yang et al., 1996), thermal stability, and denaturation ofopsin proteins (Landin et al., 2001) and may form intrarow contactsamong rhodopsin dimers (Liang et al., 2003). Furthermore, theresidues at the loop–helix interface appear to be the most importantfor transducin activation (Natochin et al., 2003). Emphasizing thefunctional importance of the CIII–HVI boundary, studies of HVIdemonstrate that light activation causes a movement of this helix(Altenbach et al., 1996) and that key residues in HVI influenceconformation of CIII and affect opsin folding, assembly, and/orfunction (Ridge et al., 1999). The concentration of sites in thesedomains of the opsin protein suggests that the second type of sto-matopod opsin functional divergence is related to signal transductionvia the movement of the cytoplasmic end of HVI and metarhodopsinII function. In particular, group C contains one unique residue at site211 (HVI), while group F has two unique residues, all clustered atthe cytoplasmic interface CIII–HVI, with the group C site (211) andone group F site (207) exhibiting significant changes in amino acidproperty.
Conclusions
Based on previous morphological and spectral characterization ofstomatopod retinas, up to six different expressed M/LWS visualpigments were predicted to exist in most species. In this study ofopsin molecular diversity across a broad taxonomic range ofspecies, however, we show that stomatopods have many moreexpressed transcripts than expected for this opsin class, which weargue is the result of both recent (within the stomatopod lineage)and ancient (within the stem crustacean lineage) gene duplicationevents. Much of the recent gene duplication activity characterizedhere is concentrated in two clades (groups A and B) of stomatopodopsins. This pattern suggests that there are large numbers of opsingenes in the genome and that the total number of expressed retinalopsins is much higher than the number of known physiological
Fig. 2. Three-dimensional homology model of a stomatopod opsin based on
the 2.5 A squid rhodopsin structure 2z73.pdb (Murakami & Kouyama,
2008). Residues identified as functionally divergent among stomatopod
opsins within the chromophore-binding pocket are colored yellow, and those
at the cytoplasmic surface are colored orange; for clarity, none of the side
chains are depicted. Transmembrane helices are colored as follows: H1,
pink; HII, red; HIII, light green; HIV, dark green; HV, light blue; HVI, dark
blue; HVII and HVIII, purple. Nontransmembrane domains (e.g., loops,
terminal regions) are colored gray. The ends of the protein have been
indicated by ‘‘C’’ for C-terminal and ‘‘N’’ for N-terminal. The chromophore
from squid rhodopsin 2z73.pdb is shown for reference.
262 Porter et al.

photoreceptor classes. Furthermore, the characterized M/LWSstomatopod opsins form six main clades, distributed throughoutthe known crustacean opsins, indicating that some of thecharacterized molecular diversity is the result of ancient crusta-cean gene duplications. The currently diagnosed clades exhibittwo possible types of functional divergence: sites diverging withrespect to spectral tuning and sites diverging with respect to signaltransduction interactions. It is highly likely that as the character-ization of stomatopod opsin molecular diversity continues, thenumber of expressed transcripts will continue to increase. Futurestudies will focus on mapping the expression of these clusters ofopsin copies to particular photoreceptor classes, to link sequencediversity with spectral sensitivity, and to determine if particularphotoreceptors exhibit the expression of more than one opsincopy. This study of stomatopod opsin molecular diversity pro-vides the first characterization of the gene duplication events andprotein specializations required to construct a visual systemcontaining high photoreceptor diversity, including many differentspectral sensitivity classes.
Acknowledgments
We would like to thank R. Caldwell for help in acquiring specimensand K. Arikawa, K. Carleton, K. Dittmar de la Cruz, C. Hofmann, andM. Perez-Losada for insightful comments on how to improve this man-uscript. This study was supported by grants from the National ScienceFoundation (IOS 0721608) and by the Air Force Office of ScientificResearch (02NL253).
References
Abascal, F., Zardoya, R. & Posada, D. (2005). ProtTest: Selection ofbest-fit models of protein evolution. Bioinformatics 21, 2104–2105.
Ahyong, S.T. & Harling, C. (2000). The phylogeny of the stomatopodCrustacea. Australian Journal of Zoology 48, 607–642.
Altenbach, C., Yang, K., Farrens, D.L., Farahbakhsh, Z.T., Khorana,H.G. & Hubbell, W.L. (1996). Structural features and light-dependentchanges in the cytoplasmic interhelical EF loop region of rhodopsin: Asite-directed spin-labeling study. Biochemistry 35, 12470–12478.
Bates, P.A., Kelley, L.A., MacCallum, R.M. & Sternberg, M.J.E.(2001). Enhancement of protein modeling by human intervention inapplying the automatic programs 3D-Jigsaw and 3D-Pssm. Proteins:Structure, Function and Genetics 45(Suppl. 5), 39–46.
Bates, P.A. & Sternberg, M.J.E. (1999). Model building by comparison atCasp3: Using expert knowledge and computer automation. Proteins:Structure, Function and Genetics 37(Suppl. 3), 47–54.
Borjigin, J. & Nathans, J. (1994). Insertional mutagenesis as a probe ofrhodopsin’s topography, stability, and activity. The Journal of BiologicalChemistry 269, 14715–14722.
Bowmaker, J.K. & Hunt, D.M. (2006). Evolution of vertebrate visualpigments. Current Biology 16, R484–R489.
Bradley, R.D. & Hillis, D.M. (1997). Recombinant DNA sequencesgenerated by PCR amplification. Molecular Biology and Evolution14, 592–593.
Briscoe, A.D. (2001). Functional diversification of lepidopteran opsins follow-ing gene duplication. Molecular Biology and Evolution 18, 2270–2279.
Briscoe, A.D. & Chittka, L. (2001). The evolution of color vision ininsects. Annual Review of Entomology 46, 471–510.
Brown, A.J.H. (1996). Isolation and Characterisation of Visual PigmentGenes From the Stomatopod Crustacean Gonodactylus oerstedii.University of Sussex: Susson, UK.
Table 4. The stomatopod opsin sites exhibiting functional divergence as identified by evolutionary trace analysis. The position and residuesof each site, significant property differences (AA Prop), the homologous site number in bovine rhodopsin (Rho #), and previous mutationalstudies in vertebrates including the site mutated (Vert Mut), the spectral class affected (Vert Class), and the physiological effect (eitherspectral or related to signal transduction) are listed. Spectral effects are given as shifts in nanometer of the position of the kmax relative to thecorresponding wild-type pigment. Amino acid properties are indicated as follows: P, polar; H, hydrophobic; C+, positively charged.N/E, mutation has no spectral effect
Stomatopod residues AA Prop Rho # Vert Mut Vert Class Physiological effect (nm) References
S33Na — 82 — — —L37M — 86 F86L SWS1 N/E Shi et al. (2001);
Cowing et al. (2002)F86M SWS1 +38 Cowing et al. (2002)F86Y SWS1 +60�66 Cowing et al. (2002);
Fasick et al. (2002)Y86F SWS1 �71 to �75 Cowing et al. (2002);
Fasick et al. (2002)S69N — 118 A118T SWS1 +3 Wilkie et al. (2000)
S118T SWS1 N/E Shi et al. (2001)T118A RH1 �16 Janz and Farrens (2001)T118A RH1 �17 Nagata et al. (2002)T118S RH1 �12 Nagata et al. (2002)T118C RH1 �15 Nagata et al. (2002)T118G RH1 �25 Nagata et al. (2002)T118V RH1 �14 Nagata et al. (2002)T118I RH1 �11 Nagata et al. (2002)
T71F P/H 120 G120P RH1 �9 Nagata et al. (2002)L99M — 148 F148A RH1 Altered phosphorylation Shi et al. (1995)C160V P/H 211 H211C RH1 �6 Nathans (1990)
S211C SWS2 �2 Takahashi and Ebrey (2003)K207T C+/P 244 Q244C RH1 Reduced transducin activation Yang et al. (1996)D210E — 247 E247Q RH1 +4 Nathans (1990)C211I P/H 248 248 RH1 Reduced transducin activation Franke et al. (1992)L239Ma — 276 — — —
aNo mutagenesis studies at homologous sites in vertebrates could be found for these sites.
Visual pigment diversity in Stomatopoda 263

Carleton, K.L., Spady, T.C. & Cote, R.H. (2005). Rod and cone opsinfamilies differ in spectral tuning domains but not signal transducingdomains as judged by saturated evolutionary trace analysis. Journal ofMolecular Evolution 61, 75–89.
Chiao, C.C., Cronin, T.W. & Marshall, N.J. (2000). Eye Design andColor Signaling in a Stomatopod Crustacean Gonodactylus smithii.Brain, Behavior and Evolution 56, 107–122.
Contreras-Moreira, B. & Bates, P.A. (2002). Domain fishing: A firststep in protein comparative modelling. Bioinformatics 18, 1141–1142.
Cowing, J.A., Poopalasundaram, S., Wilkie, S.E., Robinson, P.R.,Bowmaker, J.K. & Hunt, D.M. (2002). The molecular mechanism forthe spectral shifts between vertebrate ultraviolet-and violet-sensitivecone visual pigments. Biochemical Journal 367, 129–135.
Cronin, T.W. (1985). The visual pigment of a stomatopod crustacean,Squilla empusa. Journal of Comparative Physiology A 156, 679–687.
Cronin, T.W. & Marshall, N.J. (1989a). A retina with at least ten spectraltypes of photoreceptors in a mantis shrimp. Nature 339, 137–140.
Cronin, T.W. & Marshall, N.J. (1989b). Multiple spectral classes ofphotoreceptors in the retinas of gonodactyloid stomatopod crustaceans.Journal of Comparative Physiology A: Sensory, Neural, and BehavioralPhysiology 166, 261–275.
Cronin, T.W., Marshall, N.J. & Caldwell, R.L. (1993). Photoreceptorspectral diversity in the retinas of squilloid and lysiosquilloid stomato-pod crustaceans. Journal of Comparative Physiology A: Sensory,Neural, and Behavioral Physiology 172, 339–350.
Cronin, T.W., Marshall, N.J. & Caldwell, R.L. (1994). The retinas ofmantis shrimps from low-light environments (Crustacea; Stomatopoda;Gonodactylidae). Journal of Comparative Physiology A: Sensory,Neural, and Behavioral Physiology 174, 607–619.
Cronin, T.W., Marshall, N.J. & Caldwell, R.L. (1996). Visual pigmentdiversity in two genera of mantis shrimps implies rapied evolution(Crustacea: Stomatopoda). Journal of Comparative Physiology A 179,371–384.
Cronin, T.W. & Jinks, R.N. (2001). Ontogeny of Vision in MarineCrustaceans. American Zoologist 41, 1098–1107.
Cronin, T.W. & Marshall, N.J. (2004). The unique visual world of mantisshrimp. In Complex Worlds From Simple Nervous Systems, ed. Prete, F.,pp. 239–268. Cambridge, MA: MIT Press.
Cronin, T.W., Marshall, N.J. & Caldwell, R.L. (2000). Spectral tuningand the visual ecology of mantis shrimps. Philosophical Transactions ofthe Royal Society Series B 355, 1263–1267.
Do, C.B., Mahabhashyam, M.S.P, Brudno, M. & Batzoglou, S. (2005).Probcons: Probabilistic consistency-based multiple sequence alignment.Genome Research 15, 330–340.
Fasick, J.I., Applebury, M.L. & Oprian, D.D. (2002). Spectral tuning inthe mammalian shortwavelength sensitive cone pigments. Biochemistry41, 6860–6865.
Frank, T.M., Porter, M.L. & Cronin, T.W. (2009). Spectral sensitivity,visual pigments and screening pigments in two life history stages ofthe ontogenetic migrator Gnathophausia ingens. Journal of theMarine Biological Association of the United Kingdom, 89, 119–129doi: 10.1017/Soo25315408002440.
Franke, R.R., Konig, B., Sakmar, T.P., Khorana, H.G. & Hofmann, K.P.(1990). Rhodopsin mutants that bind but fail to activate transducin.Science 250, 123.
Franke, R.R., Sakmar, T.P., Graham, R.M. & Khorana, H.G. (1992).Structure and function in rhodopsin. Studies of the interaction betweenthe rhodopsin cytoplasmic domain and transducin. The Journal ofBiological Chemistry 267, 14767–14774.
Frentiu, F.D., Bernard, G.D., Cuevas, C.I., Sison-Mangus, M.P., Prudic,K.L. & Briscoe, A.D. (2007a). Adaptive evolution of color vision as seenthrough the eyes of butterflies. Proceedings of the National Academy ofSciences of the United States of America 104, 8634–8640.
Frentiu, F.D., Bernard, G.D., Sison-Mangus, M.P., Brower, A.V. &Briscoe, A.D. (2007b). Gene duplication is an evolutionary mechanismfor expanding spectral diversity in the long-wavelength photopigmentsof butterflies. Molecular Biology and Evolution 24, 2016–2028.
Guex, N. & Peitsch, M.C. (1997). Swiss-model and the Swiss-Pdb Viewer:An environment for comparative protein modeling. Electrophoresis 18,2714–2723.
Guindon, S. & Gascuel, O. (2003). A simple, fast, and accurate algorithmto estimate large phylogenies by maximum likelihood. SystematicBiology 52, 696–704.
Guindon, S., Lethiec, F., Duroux, P. & Gascuel, O. (2005). Phymlonline—A web server for fast maximum likelihood-based phylogeneticinference. Nucleic Acids Research 33, W557–W559.
Hill, C.A., Fox, A.N., Pitts, R.J., Kent, L.B., Tan, P.L., Chrystal, M.A.,Cravchik, A., Collins, F.H., Robertson, H.M. & Zwiebel, L.J.(2002). G protein-coupled receptors in Anopheles gambiae. Science298, 176–178.
Hillis, D.M. & Bull, J.J. (1993). An empirical test of bootstrapping asa method for assessing confidence in phylogenetic analysis. SystematicBiology 42, 182–192.
Huber, T., Faulkner, G. & Hugenholtz, P. (2004). Bellerophon: Aprogram to detect chimeric sequences in multiple sequence alignments.Bioinformatics 20, 2317–2319.
Janz, J.M. & Farrens, D.L. (2001). Engineering a functional blue-wavelength-shifted rhodopsin mutant. Biochemistry 40, 7219–7227.
Konig, B., Arendt, A., McDowell, J.H., Kahlert, M., Hargrave, P.A.& Hofmann, K.P. (1989). Three cytoplasmic loops of rhodopsininteract with transducin. Proceedings of the National Academy ofSciences of the United States of America 86, 6878–6882.
Koyanagi, M., Takano, K., Tsukamoto, H., Ohtsu, K., Tokunaga, F. &Terakita, A. (2008). Jellyfish vision starts with cAMP signalingmediated by opsin-G(s) cascade. Proceedings of the National Academyof Sciences of the United States of America 105, 15576–15580.
Landin, J.S., Katragadda, M. & Albert, A.D. (2001). Thermal de-stabilization of rhodopsin and opsin by proteolytic cleavage in bovinerod outer segment disk membranes. Biochemistry 40, 11176–11183.
Liang, Y., Fotiadis, D., Filipek, S., Saperstein, D.A., Palczewski, K. &Engel, A. (2003). Organization of the G protein-coupled receptorsrhodopsin and opsin in native membranes. The Journal of BiologicalChemistry 278, 21655–21662.
Lichtarge, O., Bourne, H.R. & Cohen, F.E. (1996). An evolutionarytrace method defines binding surfaces common to protein families.Journal of Molecular Biology 257, 342–358.
Madabushi, S., Gross, A.K., Philippi, A., Meng, E.C., Wensel, T.G. &Lichtarge, O. (2004). Evolutionary trace of G protein-coupledreceptors reveals clusters of residues that determine global and class-specific functions. The Journal of Biological Chemistry 279, 8126–8132.
Morris, A., Bowmaker, J.K. & Hunt, D.M. (1993). The molecular basis ofa spectral shift in the rhodopsins of two species of squid from differentphotic environments. Proceedings of the Royal Society B: BiologicalSciences 254, 233–240.
Murakami, M. & Kouyama, T. (2008). Crystal structure of squidrhodopsin. Nature 453, 363–367.
Nagata, T., Oura, T., Terakita, A., Kandori, H. & Shichida, Y. (2002).Isomer-Specific Interaction of the Retinal Chromophore with Threonine-118 in Rhodopsin. Journal of Physical Chemistry A 106, 1969–1975.
Nathans, J. (1990). Determinants of visual pigment absorbance: identifi-cation of the retinyidene Schiff’s base counterion in bovine rhodopsin.Biochemistry 29, 9746–9752.
Natochin, M., Gasimov, K.G., Moussaif, M. & Artemyev, N.O. (2003).Rhodopsin determinants for transducin activation: A gain-of-functionapproach. The Journal of Biological Chemistry 278, 37574–37581.
Oakley, T.H. & Huber, D.R. (2004). Differential expression of duplicatedopsin genes in two eye types of ostracod crustaceans. Journal ofMolecular Evolution 59, 239–249.
Palczewski, K., Buczylko, J., Kaplan, M.W., Polans, A.S. & Crabb,J.W. (1991). Mechanism of rhodopsin kinase activation. The Journal ofBiological Chemistry 266, 12949–12955.
Porter, M.L., Cronin, T.W., McClellan, D.A. & Crandall, K.A.(2007). Molecular characterization of crustacean visual pigments andthe evolution of pancrustacean opsins. Molecular Biology and Evolution24, 253–268.
Qiu, X., Wu, L., Huang, H., McDonel, P.E., Palumbo, A.V., Tiedje, J.M.& Zhou, J. (2001). Evaluation of PCR-generated chimeras, mutations,and heteroduplexes with 16S rRNA gene-based cloning. Applied andEnvironmental Microbiology 67, 880–887.
Ridge, K.D., Ngo, T., Lee, S.S.J. & Abdulaev, N.G. (1999). Folding andassembly in rhodopsin: Effect of mutations in the sixth transmembranehelix on the conformation of the third cytoplasmic loop. The Journal ofBiological Chemistry 274, 21437–21442.
Sakamoto, K., Hisatomi, O., Tokunaga, F. & Eguchi, E. (1996). Twoopsins from the compound eye of the crab Hemigrapsus sanguineus.Journal of Experimental Biology 199, 441–450.
264 Porter et al.

Schloss, P.D. & Handelsman, J. (2005). Introducing Dotur, a com-puter program for defining operational taxonomic units and estimat-ing species richness. Applied and Environmental Microbiology 71,1501–1506.
Shi, W., Osawa, S., Dickerson, C.D. & Weiss, E.R. (1995). Rhodopsinmutants discriminate sites important for the activation of rhodopsinkinase and G (t). The Journal of Biological Chemistry 270, 2112.
Shi, J., Radlwimmer, F.B. & Yokoyama, S. (2001). Molecular genetics andthe evoloution of ultraviolet vision in vertebrates. Proceedings of theNational Academy of Science USA 98, 11731–11736.
Takahashi, Y. & Ebrey, T.G. (2003). Molecular basis of spectral tuning inthe newt short wavelength sensitive visual pigment. Biochemistry 42,6025–6034.
Terakita, A., Koyanagi, M., Tsukamoto, H., Yamashita, T., Miyata, T. &Shichida, Y. (2004). Counterion displacement in the molecular evolutionof the rhodopsin family. Nature Structural and Molecular Biology 11,284–289.
Terakita, A., Tsukamoto, H., Koyanagi, M., Sugahara, M., Yama-
shita, T. & Shichida, Y. (2008). Expression and comparative charac-terization of Gq-coupled invertebrate visual pigments and melanopsin.Journal of Neurochemistry 105, 883–890.
Wilkie, S.E., Robinson, P.R., Cronin, T.W., Poopalasundaram, S.,Bowmaker, J.K. & Hunt, D.M. (2000). Spectral tuning of avian violet-and ultraviolet-sensitive visual pigments. Biochemistry 39, 7895–7901.
Yang, K., Farrens, D.L., Hubbell, W.L. & Khorana, H.G. (1996).Structure and function in rhodopsin: Single cysteine substitutionmutants in the cytoplasmic interhelical E-F loop region show position-specific effects in transducin activation. Biochemistry 35, 12464–12469.
Yokoyama, S. (2000). Molecular evolution of vertebrate visual pigments.Progress in Retinal and Eye Research 19, 385–419.
Zylstra, P., Rothenfluh, H.S., Weiller, G.F., Blanden, R.V. &Steele, E.J. (1998). PCR amplification of murine immunoglobulingermline V genes: Strategies for minimization of recombinationartifacts. Immunology and Cell Biology 76, 395–405.
Visual pigment diversity in Stomatopoda 265


![Catalogue of crustacea (Arthropoda: Crustacea) of Kharkiv region, Ukraine]](https://img.pdfslide.net/doc/110x75/6323ca05078ed8e56c0b0724/catalogue-of-crustacea-arthropoda-crustacea-of-kharkiv-region-ukraine.jpg)