Embed Size (px)
Citation preview
Available online at www.sciencedirect.com
Journal of International Money and Finance 27 (2008) 455e479www.elsevier.com/locate/jimf
Monetary integration and the cost of borrowing
Marta Gomez-Puig*
Universitat de Barcelona, Spain
Abstract
With European Monetary Union (EMU), there was an increase in the adjusted spreads of euro-areasovereign securities over Germany (corrected from the foreign exchange risk), causing a lower thanexpected fall in borrowing costs. The objective of this paper is to study the reasons for this increase,and in particular, whether the change in the price assigned by markets was due to domestic factors (creditrisk and/or market liquidity) or to international risk factors. The empirical evidence suggests that it mayhave been a change in the market assessment of domestic (both liquidity and default risk) rather thaninternational factors that caused the observed increase in adjusted spreads with Monetary Integration,even though, since market size scale economies have increased since EMU, their effect differs accordingto the size of the market.� 2008 Elsevier Ltd. All rights reserved.
JEL classification: E44; F36; G15
Keywords: Monetary integration; Sovereign securities markets; International and domestic credit risk; Market liquidity
1. Introduction
European Monetary Union (EMU) caused large-scale changes in euro-area sovereignsecurities markets (see Danthine et al., 2001; BIS Study group on fixed income markets,2001). Before the introduction of the euro, yield differentials between European sovereign bor-rowers were mostly determined by four factors: expectations of exchange rate fluctuations,
* Departament de Teoria Economica, Universitat de Barcelona, Diagonal 690, Barcelona 08034, Spain. Tel.: þ34 934
020 113; fax: þ34 934 039 082.
E-mail address: [email protected]
0261-5606/$ - see front matter � 2008 Elsevier Ltd. All rights reserved.
doi:10.1016/j.jimonfin.2008.01.008
456 M. Gomez-Puig / Journal of International Money and Finance 27 (2008) 455e479
differences in domestic tax-regimes, differences in credit risk, and differences in marketliquidity. The removal of foreign exchange risk in January 1999 and the elimination (or reduc-tion to insignificant levels) of differences in tax treatment during the 1990s eliminated two ofthese factors, and paved the way for a much more integrated and competitive public debtmarket.
As a result, euro-area government bond markets began to be considered as a single market,comparable in terms of size to the US or Japanese markets. Nevertheless, segmentation did notdisappear completely. In 2006, public debt management is still decentralised under the respon-sibility of 12 sovereign issuers with differences in rating and a variety of issuing techniques (seeFavero et al., 1999). These are features that distinguish the euro-area debt market from its USand Japanese counterparts. One example of this segmentation is the persistence of yielddifferentials.
This paper sets out to examine this persistence and to explore what happened to euro-areacountries’ yield spreads on government bonds after the introduction of the euro. The pre-EMU literature speculated that with the elimination of currency risk, yield spreads wouldnarrow and would primarily reflect default risk. Conversely, market participants and memberstate debt managers appeared to believe that EMU yield differentials would be due mostlyto liquidity factors. Therefore, in order to reduce borrowing costs, debt managers introducedsubstantial innovations that were expected to enhance the liquidity of their bonds.
Actually, the main effects of the introduction of the euro in government bond markets wereon the one hand, an increase in the degree of substitutability among securities issued by differ-ent treasuries and higher levels of competition between issuers to attract investors, which led toa certain reorganisation of the market structure, and on the other, a gain in the importance ofcredit risk and market liquidity in yield differentials. Before Monetary Union differences inthese factors were perhaps not completely priced due to market segmentation.1
Therefore, a first point that will be assessed in this paper is whether EMU has increasedcredit risk by denying governments the emergency exit of money creation and by forbiddingboth the ECB and the EU to bail-out troubled governments; or whether, conversely, themaximum threshold that countries have for both their budget deficit and their level of publicindebtedness (resulting in broad improvements in budgetary balances) and the possibilitythat markets do not regard the ‘‘no-bail-out’’ clause as credible, especially in the case of largemarkets (i.e. that the theory ‘‘too big to fail’’ holds), have actually resulted in a decrease inperceived credit risk.
Secondly, the introduction of the euro reduced segmentation among euro-area governmentbond markets. The removal of the exchange rate risk brought down an important barrier thathad fostered captive domestic markets and had gone some way to explaining the home biasthat existed in cross-border investments in the European Union. Adjaoute et al. (2000) tracedthe extent of the home bias, in both the bond and equities markets, for the major Europeancountries e the UK, France, Germany, Spain, the Netherlands, and Italy e during the period
1 Blanco (2001) reports that on the side of the issuers, some significant changes were observed such as the harmo-
nisation of market conventions in the computation of yields, the introduction of a single trading calendar and pre-
announced auction calendars, or the increase in issue sizes. In some countries, the creation of large issues was facilitated
by the introduction of programmes of exchange of old illiquid bonds for new bonds and by the concentration of issuance
activity in a smaller number of benchmark securities. With the aim of attracting more investors, some of the smaller
issuers such as Austria, Belgium, the Netherlands and Portugal resorted to syndication procedures. Others such as
the French Treasury introduced new instruments such as constant maturity and inflation-indexed bonds.
457M. Gomez-Puig / Journal of International Money and Finance 27 (2008) 455e479
1980e1999.2 The increased substitutability of sovereign securities after EMU intensified therivalry between sovereign issuers to attract investors, since they were competing directly forthe same pool of funding. In this new scenario, market liquidity differences may have becomea more significant component of yield spreads. This is the second point that will be assessed inthis study.
Nevertheless, as the literature on this topic is limited, the analysis will also build on findingsin the empirical literature regarding sovereign bond yield spreads on emerging markets, whichhave suggested that spreads are also sensitive to international risk factors, mainly US riskfactors and interest rates (see Codogno et al., 2003).3
The analysis in this paper will then be threefold: first, we break down the European yieldspreads into their two main domestic components (market liquidity and credit risk differences)which remained after the removal of currency risk. Second, we examine whether there wasa change in the price assigned to them by markets after the introduction of the euro which mightexplain the yield spread behaviour observed. Third, we will examine the effects of internationalrisk factors on yield differentials. The main goal of the analysis will be to identify the possiblefactors behind the observed average increase of 11.98 basis points in yield spreads during thefirst three years of Monetary Union, once they are corrected from the exchange rate factor (fol-lowing Favero et al., 1997 we will correct pre-EMU spreads by estimating the foreign exchangefactor as the differential between the 10-year swap rate in the currency of denomination of thebond and the 10-year swap rate in Deutsche marks).
The sample is composed of daily data from January 1996 to December 2001 (therefore, thesame time interval e three years e will be considered for both pre-EMU and EMU periods) andincludes all EMU countries except Luxembourg (whose public debt market is negligible), andGreece (which did not join Monetary Union until January 2001).
We will present the results of four different specifications: (I) a static panel regression, (II)a dynamic panel regression, (III) a static regression for each individual country, and (IV)a dynamic regression for every individual country, with the same explanatory variables in allfour.4 The relative debt-to-GDP ratio will be used to identify differences in default risk, whiletwo different variables will be used to capture market liquidity: the bid/ask spread (a proxy ofmarket tightness) and on-the-run/off-the-run differentials (a complementary measure of market
2 They report that the United Kingdom held the highest share of foreign assets as a function of total financial wealth
(24%); Spain had the smallest (5%), and the Netherlands, Germany and Italy had shares around 17%. Moreover, as
expected, for bills and bonds, the level of diversification was substantial only for banks in the UK, France and the Neth-
erlands, i.e. the countries where intermediaries played an important role as market makers in the eurobond markets.
These results are consistent with Tesar and Werner (1995), who present evidence on long-term international investment
patterns in Canada, Germany, Japan, the UK, and the US during the 1970e1990 period. At the beginning of the 1990s,
the UK led this sample in international portfolio diversification, with foreign security holdings of 32% (compared with
10% in Germany).3 Our specification will be based on Codogno et al. (2003), but with some important differences. First, the models do
not control for the same variables. Second, their sample period for the daily estimation spans only 2002 (which is not
included in the analysis presented in this paper). Third, their liquidity variables have been drawn from MTS, so they
only correspond to the trading activity that takes place in that economic platform rather than in the whole of the euro-
securities market. Consequently, the results are not really comparable.4 The results are consistent with those presented in Gomez-Puig (2006), even though different variables are used to
capture domestic risk factors. In particular, in this new set of specifications, we will use the debt-to-GDP ratio instead of
the rating differential as a proxy of credit risk. This change will not allow us to use the relative level of indebtedness as
a proxy of market liquidity; otherwise, multicollinearity would pose a significant problem. This is the reason why both
the bid/ask and the on-the-run/off-the-run spreads are the variables used to capture market liquidity.
458 M. Gomez-Puig / Journal of International Money and Finance 27 (2008) 455e479
liquidity). Finally, the spread between 10-year fixed interest rates on US swaps and the yield on10-year Moody’s Seasoned AAA US corporate bonds is introduced in the model as a proxy ofinternational risk factors. To the best of our knowledge, no empirical analysis to date has useda daily dataset for two of the most important measures of liquidity, the bid/ask spreads and on-the run/off-the run yield differentials, corresponding to the trading activity in the whole of theeuro-securities market.
The results of all the specifications are highly consistent, providing evidence that market sizescale economies increased with Currency Union and that the rise was higher in smaller debtmarkets. A change in the market assessment of domestic (both liquidity and default risk) ratherthan international factors (which would play a smaller role) might be behind the observedincrease in adjusted spreads with Monetary Integration, even though their effect varies accord-ing to market size. Hence, the empirical evidence suggests that the removal of the exchange ratebarrier has penalised small markets, not only because they are potentially more illiquid, but alsobecause after EMU the ‘‘too big to fail’’ theory seems to hold: that is, the smaller the market,the higher the credibility of the ‘‘no-bail-out’’ rule. So, in the current context of increasedcompetition between euro-area government securities markets, their relative success mightbe dependent on their size.
The rest of the paper is organised as follows: Section 2 explains the foreign exchangecorrection applied in the pre-EMU period. Section 3 outlines evidence concerning MonetaryIntegration in Europe and the evolution of the relative cost of borrowing. Section 4 focuseson the various domestic and international factors to which adjusted spreads might be sensitive,and describes the data. Section 5 explains the models and estimation methodology. Section 6reports the results. Lastly, Section 7 draws conclusions.
2. Foreign exchange risk correction in the pre-EMU period
As discussed by Favero et al. (1997) a direct measure of the component of yield differentialsnot related to exchange rate factors can be obtained by comparing the yields of assets issued bytwo different states in two different currencies (say, one in Spanish pesetas, the other inD-marks) and the yield spreads in the same currencies and with the same life to maturity issuedby the same (non-government) subject, or by two otherwise comparable issuers (in the secondcase, apart from the exchange rate risk, other factors influencing yield spreads can then beignored when differences are taken). Candidates for this measure are (1) long-term bondsissued by the same supra-national organisation (such as the World Bank or the European Invest-ment Bank), (2) long-term bonds issued by the private sector, and (3) the fixed interest rates onswap contracts.
Giovannini and Piga (1994) study the differential between the interest rate on an Italiangovernment bond issued in the Eurodollar market and a comparable World Bank bond issuedin the global market. Alesina et al. (1992) compare interest rates on public and private financialinstruments denominated in the same currencies in 12 OECD countries. And Favero et al.(1997), Arnold and Lemmen (2001), Blanco (2001) and Codogno et al. (2003) compare gov-ernment bond yield differentials and interest rate swap (IRS) differentials.
Supra-national issues are by definition free of any specific default risk. However, the marketfor bonds issued by supra-national organisations is far less liquid and deep than that forgovernment bonds. More importantly, supra-national issues in some currencies are intermittent.On the other hand, corporate bond yields display a relatively volatile cyclical behaviour and arenot default risk-free. Interest rate swaps may also present problems, as they may be affected by
459M. Gomez-Puig / Journal of International Money and Finance 27 (2008) 455e479
the emergence of financial difficulties in the banking sector in a particular country (see Faveroet al., 1997).
However, on balance, the drawbacks of the interest differential on supra-national issues orcorporate issues seem to be greater. So even though it is not a perfect measure, the spreadon fixed interest rate swap contracts can therefore be used as an indicator of the exchangerate determinant of the yield spread on government bonds, as it seems to be the best indicatorof this yield spread component.
Since the early 1980s, interest rate swaps have become a popular vehicle used by manycompanies and financial institutions to hedge against interest rate risk. An interest rate swapis an agreement between two parties to exchange a series of interest payments withoutexchanging the underlying debt (which is denominated in the same currency), meaning thatthe default risk of the underlying asset is not translated into the level of the fixed interestrate on the swap contract. In a typical fixed/floating interest rate swap, the first party promisesto pay the second at designated intervals a stipulated amount of interest calculated at a fixedrate on ‘‘the notional principal’’. The second party promises to pay the first at the same intervalsa floating amount of interest on the notional principal calculated according to a floating-rateindex.5 IRS are liquidated by differences, ‘‘cash-flow netting’’. Essentially, then, an interestrate swap is a series of forward contracts on some reference interest rate, such as the Libor(see Bicksler and Chen, 1986).
The fixed rate is the one that is used to price the interest rate swaps IRS usually presenta spread over the on-the run government bond yield at the same maturity, and their pricebasically accounts for the counterparty credit risk, the liquidity, the market risk of the swapcontract, and the exchange-rate risk of the currency of denomination of the swap.6 Neverthe-less, it can be assumed that the first three components cancel out when the differential betweenthe 10-year swap rate of one European country i over, for example, Germany, is taken.7 Hence,the swap rate differential is an appropriate measure for capturing the exchange-rate changecomponent of yield spreads.
5 In this paper, the 6-month money Libor rate (in the respective currency) before the EMU and the Euribor after its
implementation.6 i.e. If a 10-year Spanish Peseta IRS is 11.50e11.60, this means that one should pay a fixed interest rate of 11.60% in
exchange for the six-month Spanish Peseta Libor in the euro-market, or the six-month Libor in order to receive a fixed
rate of 11.50%.7 With regard to the counterparty credit risk, not only are most of the participants present in the different currency
segments of the underlying swap market (the euro-deposit market) the same, but also the counterparty credit risk asso-
ciated with swap rates is currently very low given the set of collateralisation and documentation standards recently de-
veloped by dealers and customers (see Liu et al., 2002; Duffie and Singleton, 1997; He, 2000). Secondly, market risk
derives from the uncertainty associated with the floating leg of the swap contract (the six-month Libor rate). However,
because market risk is usually highly correlated within euro-currency IRS contracts, it can also be ignored when dif-
ferentials are taken. Finally, with respect to the liquidity of swaps contracts, it is reasonable to assume that, although
they are currently very liquid (see BIS statistics), their liquidity will be highly correlated with that of the underlying
government bonds. Therefore, it may vary within currencies. In this case, the estimated foreign exchange component
(the swap rate differential) of total yield differentials would be biased upward and, consequently, the credit and liquidity
component of government bonds would be biased downward. However, the data (see Tables 1a and 1b) show an increase
in the yield spread in the EMU period for countries in which the swap differential was not significant in the pre-EMU
period. This is the case of Austria, Belgium, France and the Netherlands. This finding indicates that the aforementioned
biases do not fully explain the rise in the price of liquidity and credit risk, when yield spreads are corrected for the
foreign exchange factor and support the use of the swap rate differential as an appropriate measure for capturing the
exchange-rate change component of yield spreads.
460 M. Gomez-Puig / Journal of International Money and Finance 27 (2008) 455e479
So we denominate: Ii,10¼ 10-year yield on sovereign bonds of country i, IRSi,10¼ 10-yearInterest Rate Swap rate of currency i.
Where, considering that differences in tax-regimes have been reduced to insignificant levelsduring the course of the 1990s:
8 We
Ii;10 ¼ f ðDRi;10;Li;10;ERi;10Þ: ð1Þ
DRi,10, default risk of country i 10-year sovereign bonds. Li,10, liquidity of country i 10-yearsovereign bonds. ERi,10, exchange rate risk of currency i over a 10-year horizon.
Therefore the 10-year yield differential of country i over Germany will be:
YIELD SPREADit ¼ ½Ii;10 � IGE;10�t¼ f�½DRi;10 �DRGE;10�t; ½Li;10 � LGE;10�t; ½ERi;10�ERGE;10�t
�: ð2Þ
Then, approximating:
½IRSi;10� IRSGE;10�t¼ ½ERi;10�ERGE;10�; ð3Þ
and building up the variable ‘‘ADJUSTED SPREADit’’, as the difference between the totalyield differential and the swap rate differential,
ADJUSTED SPREADit ¼ ASPREADit ¼ ½Ii;10 � IGE;10�t�½IRSi;10� IRSGE;10�t¼ f�½DRi;10�DRGE;10�t; ½Li;10� LGE;10�t; ½ERi;10 �ERGE;10�t
�
� ½ERi;10 �ERGE;10�t: ð4Þ
It can be inferred that the variable ASPREADit, which will be used as the dependent variable,will mainly account for credit risk and market liquidity differences of country i sovereignsecurities over Germany. So, this variable could be considered an appropriate indicator of yielddifferential components not related to exchange rate factors.8
3. Monetary integration and the relative cost of borrowing: some evidence
The aforementioned elimination of two of the main components of yield differentialsprompted a substantial convergence in total yield differentials over 10-year German bond yieldsduring the period January 1999eDecember 2001.
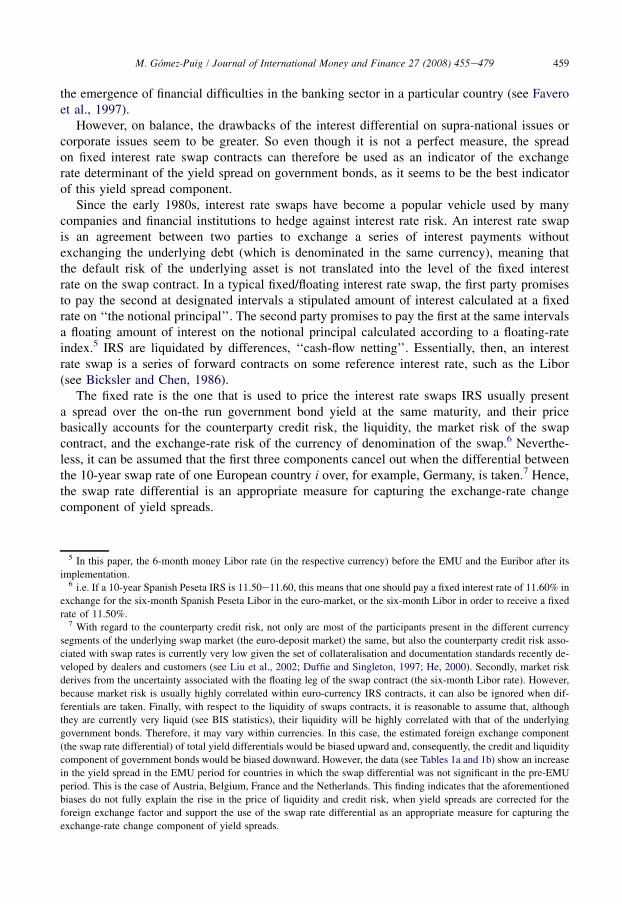
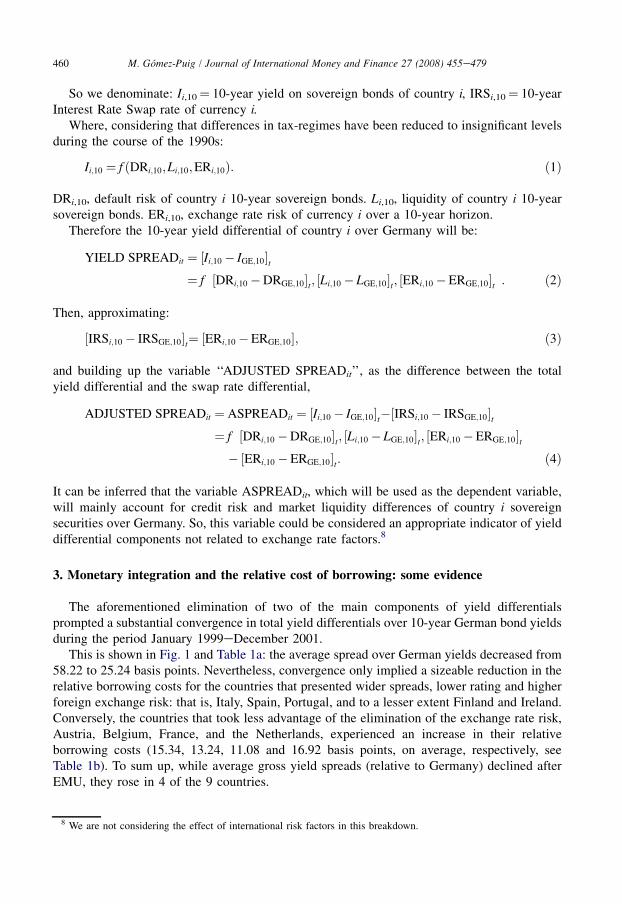
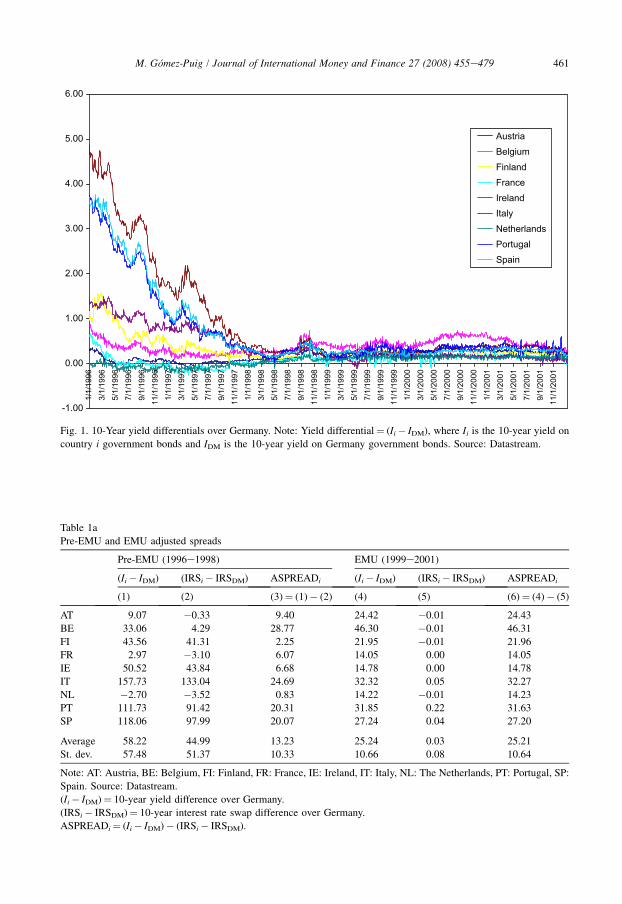
This is shown in Fig. 1 and Table 1a: the average spread over German yields decreased from58.22 to 25.24 basis points. Nevertheless, convergence only implied a sizeable reduction in therelative borrowing costs for the countries that presented wider spreads, lower rating and higherforeign exchange risk: that is, Italy, Spain, Portugal, and to a lesser extent Finland and Ireland.Conversely, the countries that took less advantage of the elimination of the exchange rate risk,Austria, Belgium, France, and the Netherlands, experienced an increase in their relativeborrowing costs (15.34, 13.24, 11.08 and 16.92 basis points, on average, respectively, seeTable 1b). To sum up, while average gross yield spreads (relative to Germany) declined afterEMU, they rose in 4 of the 9 countries.
are not considering the effect of international risk factors in this breakdown.
-1.00
0.00
1.00
2.00
3.00
4.00
5.00
6.001/
1/19
963/
1/19
965/
1/19
967/
1/19
969/
1/19
9611
/1/1
996
1/1/
1997
3/1/
1997
5/1/
1997
7/1/
1997
9/1/
1997
11/1
/199
71/
1/19
983/
1/19
985/
1/19
987/
1/19
989/
1/19
9811
/1/1
998
1/1/
1999
3/1/
1999
5/1/
1999
7/1/
1999
9/1/
1999
11/1
/199
91/
1/20
003/
1/20
005/
1/20
007/
1/20
009/
1/20
0011
/1/2
000
1/1/
2001
3/1/
2001
5/1/
2001
7/1/
2001
9/1/
2001
11/1
/200
1
AustriaBelgiumFinlandFranceIrelandItalyNetherlandsPortugalSpain
Fig. 1. 10-Year yield differentials over Germany. Note: Yield differential¼ (Ii� IDM), where Ii is the 10-year yield on
country i government bonds and IDM is the 10-year yield on Germany government bonds. Source: Datastream.
Table 1a
Pre-EMU and EMU adjusted spreads
Pre-EMU (1996e1998) EMU (1999e2001)
(Ii� IDM) (IRSi� IRSDM) ASPREADi (Ii� IDM) (IRSi� IRSDM) ASPREADi
(1) (2) (3)¼ (1)� (2) (4) (5) (6)¼ (4)� (5)
AT 9.07 �0.33 9.40 24.42 �0.01 24.43
BE 33.06 4.29 28.77 46.30 �0.01 46.31
FI 43.56 41.31 2.25 21.95 �0.01 21.96
FR 2.97 �3.10 6.07 14.05 0.00 14.05
IE 50.52 43.84 6.68 14.78 0.00 14.78
IT 157.73 133.04 24.69 32.32 0.05 32.27
NL �2.70 �3.52 0.83 14.22 �0.01 14.23
PT 111.73 91.42 20.31 31.85 0.22 31.63
SP 118.06 97.99 20.07 27.24 0.04 27.20
Average 58.22 44.99 13.23 25.24 0.03 25.21
St. dev. 57.48 51.37 10.33 10.66 0.08 10.64
Note: AT: Austria, BE: Belgium, FI: Finland, FR: France, IE: Ireland, IT: Italy, NL: The Netherlands, PT: Portugal, SP:
Spain. Source: Datastream.
(Ii� IDM)¼ 10-year yield difference over Germany.
(IRSi� IRSDM)¼ 10-year interest rate swap difference over Germany.
ASPREADi¼ (Ii� IDM)� (IRSi� IRSDM).
461M. Gomez-Puig / Journal of International Money and Finance 27 (2008) 455e479
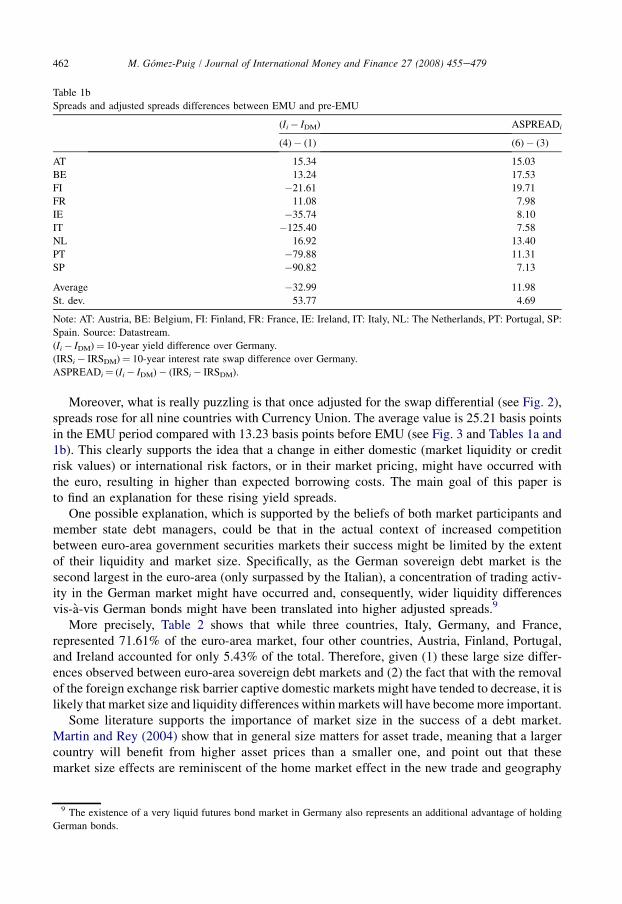
Table 1b
Spreads and adjusted spreads differences between EMU and pre-EMU
(Ii� IDM) ASPREADi
(4)� (1) (6)� (3)
AT 15.34 15.03
BE 13.24 17.53
FI �21.61 19.71
FR 11.08 7.98
IE �35.74 8.10
IT �125.40 7.58
NL 16.92 13.40
PT �79.88 11.31
SP �90.82 7.13
Average �32.99 11.98
St. dev. 53.77 4.69
Note: AT: Austria, BE: Belgium, FI: Finland, FR: France, IE: Ireland, IT: Italy, NL: The Netherlands, PT: Portugal, SP:
Spain. Source: Datastream.
(Ii� IDM)¼ 10-year yield difference over Germany.
(IRSi� IRSDM)¼ 10-year interest rate swap difference over Germany.
ASPREADi¼ (Ii� IDM)� (IRSi� IRSDM).
462 M. Gomez-Puig / Journal of International Money and Finance 27 (2008) 455e479
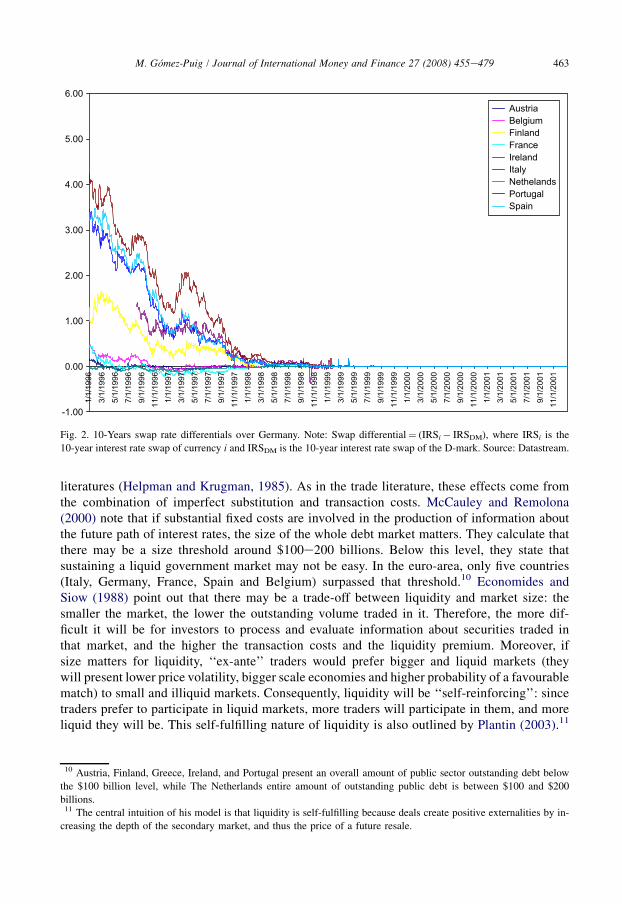
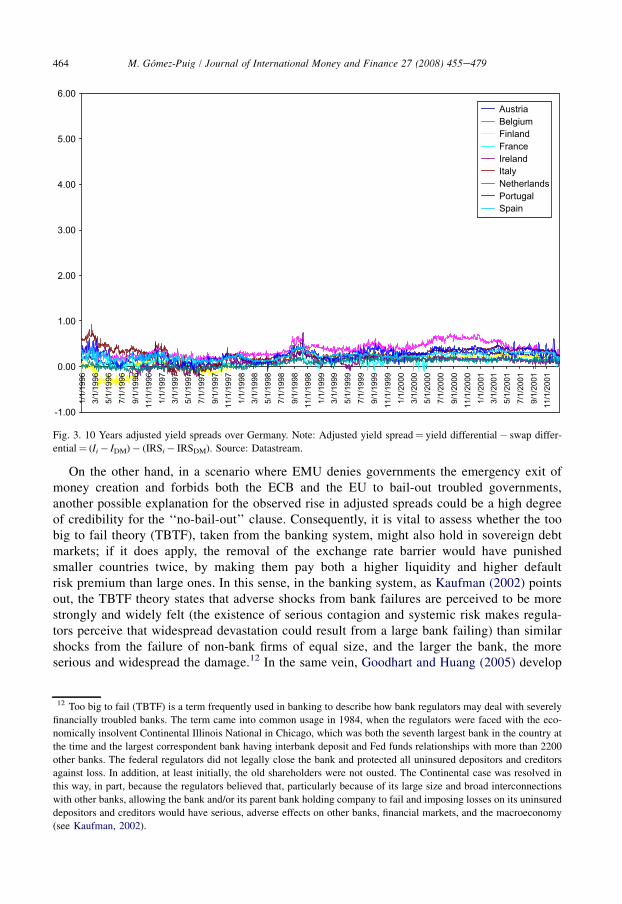
Moreover, what is really puzzling is that once adjusted for the swap differential (see Fig. 2),spreads rose for all nine countries with Currency Union. The average value is 25.21 basis pointsin the EMU period compared with 13.23 basis points before EMU (see Fig. 3 and Tables 1a and1b). This clearly supports the idea that a change in either domestic (market liquidity or creditrisk values) or international risk factors, or in their market pricing, might have occurred withthe euro, resulting in higher than expected borrowing costs. The main goal of this paper isto find an explanation for these rising yield spreads.
One possible explanation, which is supported by the beliefs of both market participants andmember state debt managers, could be that in the actual context of increased competitionbetween euro-area government securities markets their success might be limited by the extentof their liquidity and market size. Specifically, as the German sovereign debt market is thesecond largest in the euro-area (only surpassed by the Italian), a concentration of trading activ-ity in the German market might have occurred and, consequently, wider liquidity differencesvis-a-vis German bonds might have been translated into higher adjusted spreads.9
More precisely, Table 2 shows that while three countries, Italy, Germany, and France,represented 71.61% of the euro-area market, four other countries, Austria, Finland, Portugal,and Ireland accounted for only 5.43% of the total. Therefore, given (1) these large size differ-ences observed between euro-area sovereign debt markets and (2) the fact that with the removalof the foreign exchange risk barrier captive domestic markets might have tended to decrease, it islikely that market size and liquidity differences within markets will have become more important.
Some literature supports the importance of market size in the success of a debt market.Martin and Rey (2004) show that in general size matters for asset trade, meaning that a largercountry will benefit from higher asset prices than a smaller one, and point out that thesemarket size effects are reminiscent of the home market effect in the new trade and geography
9 The existence of a very liquid futures bond market in Germany also represents an additional advantage of holding
German bonds.
-1.00
0.00
1.00
2.00
3.00
4.00
5.00
6.001/
1/19
963/
1/19
965/
1/19
967/
1/19
969/
1/19
9611
/1/1
996
1/1/
1997
3/1/
1997
5/1/
1997
7/1/
1997
9/1/
1997
11/1
/199
71/
1/19
983/
1/19
985/
1/19
987/
1/19
989/
1/19
9811
/1/1
998
1/1/
1999
3/1/
1999
5/1/
1999
7/1/
1999
9/1/
1999
11/1
/199
91/
1/20
003/
1/20
005/
1/20
007/
1/20
009/
1/20
0011
/1/2
000
1/1/
2001
3/1/
2001
5/1/
2001
7/1/
2001
9/1/
2001
11/1
/200
1
AustriaBelgiumFinlandFranceIrelandItalyNethelandsPortugalSpain
Fig. 2. 10-Years swap rate differentials over Germany. Note: Swap differential¼ (IRSi� IRSDM), where IRSi is the
10-year interest rate swap of currency i and IRSDM is the 10-year interest rate swap of the D-mark. Source: Datastream.
463M. Gomez-Puig / Journal of International Money and Finance 27 (2008) 455e479
literatures (Helpman and Krugman, 1985). As in the trade literature, these effects come fromthe combination of imperfect substitution and transaction costs. McCauley and Remolona(2000) note that if substantial fixed costs are involved in the production of information aboutthe future path of interest rates, the size of the whole debt market matters. They calculate thatthere may be a size threshold around $100e200 billions. Below this level, they state thatsustaining a liquid government market may not be easy. In the euro-area, only five countries(Italy, Germany, France, Spain and Belgium) surpassed that threshold.10 Economides andSiow (1988) point out that there may be a trade-off between liquidity and market size: thesmaller the market, the lower the outstanding volume traded in it. Therefore, the more dif-ficult it will be for investors to process and evaluate information about securities traded inthat market, and the higher the transaction costs and the liquidity premium. Moreover, ifsize matters for liquidity, ‘‘ex-ante’’ traders would prefer bigger and liquid markets (theywill present lower price volatility, bigger scale economies and higher probability of a favourablematch) to small and illiquid markets. Consequently, liquidity will be ‘‘self-reinforcing’’: sincetraders prefer to participate in liquid markets, more traders will participate in them, and moreliquid they will be. This self-fulfilling nature of liquidity is also outlined by Plantin (2003).11
10 Austria, Finland, Greece, Ireland, and Portugal present an overall amount of public sector outstanding debt below
the $100 billion level, while The Netherlands entire amount of outstanding public debt is between $100 and $200
billions.11 The central intuition of his model is that liquidity is self-fulfilling because deals create positive externalities by in-
creasing the depth of the secondary market, and thus the price of a future resale.
-1.00
0.00
1.00
2.00
3.00
4.00
5.00
6.001/
1/19
963/
1/19
965/
1/19
967/
1/19
96
9/1/
1996
11/1
/199
61/
1/19
973/
1/19
975/
1/19
977/
1/19
97
9/1/
1997
11/1
/199
71/
1/19
983/
1/19
985/
1/19
987/
1/19
989/
1/19
9811
/1/1
998
1/1/
1999
3/1/
1999
5/1/
1999
7/1/
1999
9/1/
1999
11/1
/199
91/
1/20
003/
1/20
005/
1/20
007/
1/20
00
9/1/
2000
11/1
/200
01/
1/20
013/
1/20
015/
1/20
017/
1/20
019/
1/20
0111
/1/2
001
AustriaBelgiumFinlandFranceIrelandItalyNetherlandsPortugalSpain
Fig. 3. 10 Years adjusted yield spreads over Germany. Note: Adjusted yield spread¼ yield differential� swap differ-
ential¼ (Ii� IDM)� (IRSi� IRSDM). Source: Datastream.
464 M. Gomez-Puig / Journal of International Money and Finance 27 (2008) 455e479
On the other hand, in a scenario where EMU denies governments the emergency exit ofmoney creation and forbids both the ECB and the EU to bail-out troubled governments,another possible explanation for the observed rise in adjusted spreads could be a high degreeof credibility for the ‘‘no-bail-out’’ clause. Consequently, it is vital to assess whether the toobig to fail theory (TBTF), taken from the banking system, might also hold in sovereign debtmarkets; if it does apply, the removal of the exchange rate barrier would have punishedsmaller countries twice, by making them pay both a higher liquidity and higher defaultrisk premium than large ones. In this sense, in the banking system, as Kaufman (2002) pointsout, the TBTF theory states that adverse shocks from bank failures are perceived to be morestrongly and widely felt (the existence of serious contagion and systemic risk makes regula-tors perceive that widespread devastation could result from a large bank failing) than similarshocks from the failure of non-bank firms of equal size, and the larger the bank, the moreserious and widespread the damage.12 In the same vein, Goodhart and Huang (2005) develop
12 Too big to fail (TBTF) is a term frequently used in banking to describe how bank regulators may deal with severely
financially troubled banks. The term came into common usage in 1984, when the regulators were faced with the eco-
nomically insolvent Continental Illinois National in Chicago, which was both the seventh largest bank in the country at
the time and the largest correspondent bank having interbank deposit and Fed funds relationships with more than 2200
other banks. The federal regulators did not legally close the bank and protected all uninsured depositors and creditors
against loss. In addition, at least initially, the old shareholders were not ousted. The Continental case was resolved in
this way, in part, because the regulators believed that, particularly because of its large size and broad interconnections
with other banks, allowing the bank and/or its parent bank holding company to fail and imposing losses on its uninsured
depositors and creditors would have serious, adverse effects on other banks, financial markets, and the macroeconomy
(see Kaufman, 2002).
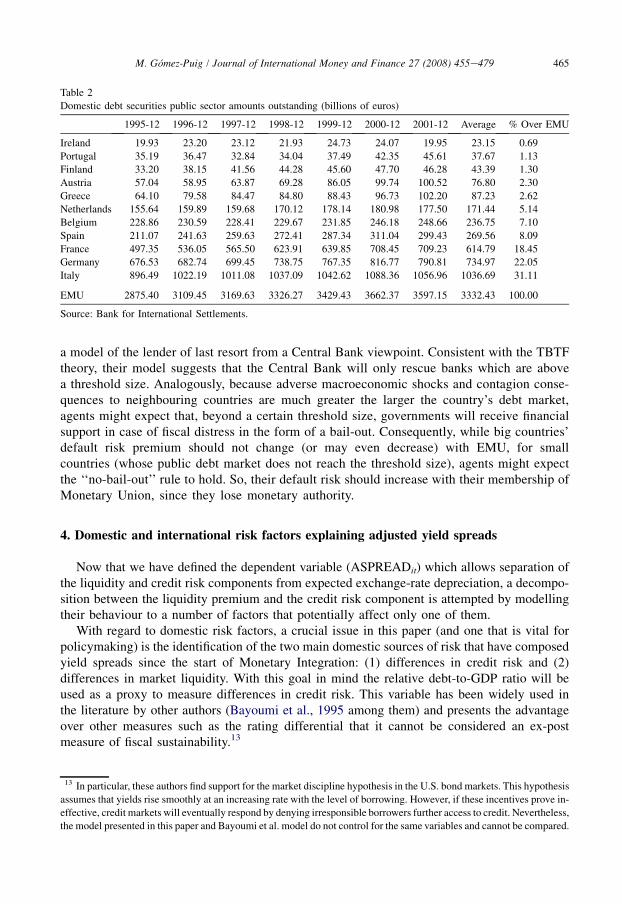
Table 2
Domestic debt securities public sector amounts outstanding (billions of euros)
1995-12 1996-12 1997-12 1998-12 1999-12 2000-12 2001-12 Average % Over EMU
Ireland 19.93 23.20 23.12 21.93 24.73 24.07 19.95 23.15 0.69
Portugal 35.19 36.47 32.84 34.04 37.49 42.35 45.61 37.67 1.13
Finland 33.20 38.15 41.56 44.28 45.60 47.70 46.28 43.39 1.30
Austria 57.04 58.95 63.87 69.28 86.05 99.74 100.52 76.80 2.30
Greece 64.10 79.58 84.47 84.80 88.43 96.73 102.20 87.23 2.62
Netherlands 155.64 159.89 159.68 170.12 178.14 180.98 177.50 171.44 5.14
Belgium 228.86 230.59 228.41 229.67 231.85 246.18 248.66 236.75 7.10
Spain 211.07 241.63 259.63 272.41 287.34 311.04 299.43 269.56 8.09
France 497.35 536.05 565.50 623.91 639.85 708.45 709.23 614.79 18.45
Germany 676.53 682.74 699.45 738.75 767.35 816.77 790.81 734.97 22.05
Italy 896.49 1022.19 1011.08 1037.09 1042.62 1088.36 1056.96 1036.69 31.11
EMU 2875.40 3109.45 3169.63 3326.27 3429.43 3662.37 3597.15 3332.43 100.00
Source: Bank for International Settlements.
465M. Gomez-Puig / Journal of International Money and Finance 27 (2008) 455e479
a model of the lender of last resort from a Central Bank viewpoint. Consistent with the TBTFtheory, their model suggests that the Central Bank will only rescue banks which are abovea threshold size. Analogously, because adverse macroeconomic shocks and contagion conse-quences to neighbouring countries are much greater the larger the country’s debt market,agents might expect that, beyond a certain threshold size, governments will receive financialsupport in case of fiscal distress in the form of a bail-out. Consequently, while big countries’default risk premium should not change (or may even decrease) with EMU, for smallcountries (whose public debt market does not reach the threshold size), agents might expectthe ‘‘no-bail-out’’ rule to hold. So, their default risk should increase with their membership ofMonetary Union, since they lose monetary authority.
4. Domestic and international risk factors explaining adjusted yield spreads
Now that we have defined the dependent variable (ASPREADit) which allows separation ofthe liquidity and credit risk components from expected exchange-rate depreciation, a decompo-sition between the liquidity premium and the credit risk component is attempted by modellingtheir behaviour to a number of factors that potentially affect only one of them.
With regard to domestic risk factors, a crucial issue in this paper (and one that is vital forpolicymaking) is the identification of the two main domestic sources of risk that have composedyield spreads since the start of Monetary Integration: (1) differences in credit risk and (2)differences in market liquidity. With this goal in mind the relative debt-to-GDP ratio will beused as a proxy to measure differences in credit risk. This variable has been widely used inthe literature by other authors (Bayoumi et al., 1995 among them) and presents the advantageover other measures such as the rating differential that it cannot be considered an ex-postmeasure of fiscal sustainability.13
13 In particular, these authors find support for the market discipline hypothesis in the U.S. bond markets. This hypothesis
assumes that yields rise smoothly at an increasing rate with the level of borrowing. However, if these incentives prove in-
effective, credit markets will eventually respond by denying irresponsible borrowers further access to credit. Nevertheless,
the model presented in this paper and Bayoumi et al. model do not control for the same variables and cannot be compared.
466 M. Gomez-Puig / Journal of International Money and Finance 27 (2008) 455e479
Because market liquidity is an elusive concept, we use the definition provided by the Bankfor International Settlements (1999): ‘‘a liquid market as a market where participants canrapidly execute a large volume of transactions with a small impact on prices.’’14 In this paper,two different proxy variables will be used to measure this effect: (i) the bid/ask spread, and (ii)the on-the run/off-the run spread.
(i) The bid/ask spread
This variable is often used as a measure of liquidity because it reflects the cost incurred bya typical investor in unwinding an asset position and measures one of the most importantdimensions of liquidity: tightness, i.e. how far transaction prices differ from mid-market prices.Additionally, the liquidity of an asset is generally understood as the ease of its conversion intomoney. Therefore, because the conversion of an asset into money involves certain costs (search-ing costs, delays, broker’s commissions, etc.), the higher these costs, the lower the degree ofliquidity. Note that as market dealers reduce their liquidity risk, the bid/ask spread shouldnarrow with trading activity.
(ii) The on-the run/off-the run spread
The yield spread between more and less liquid securities is also a liquidity measure used inthe Treasury market (see Fleming, 2003). Since liquidity has value, more liquid securities tendto have higher prices (lower yields) than less liquid securities. The yield spread is often calcu-lated as the difference between the yield of an off-the-run (older securities of a given maturity)and that of an on-the-run (benchmark) security with similar cash-flow characteristics. Positivespreads indicate that on-the-run securities are trading at a yield discount (or price premium) tooff-the-run securities. This spread provides an insight into the value of liquidity not provided byother measures like the bid/ask spread. The fact that both measures of liquidity are so differentis the reason why their correlation coefficient is not significant.15 On the other hand, thecorrelation coefficient between these liquidity variables and the credit risk proxy (the relativedebt-to-GDP ratio) is not significant either. Therefore, we can assume that the estimation resultswill not suffer from multicollinearity problems.16
14 Likewise, they point out that the usual approach is to consider market liquidity according to at least one of three
possible dimensions: tightness, depth and resiliency. Tightness is how far transaction prices diverge from mid-market
prices, and can generally be measured by the bid/ask spread. Depth denotes either the volume of trades possible without
affecting prevailing market prices, or the amount of orders on the order books of market makers at a given time. Re-
siliency refers to the speed with which price fluctuations resulting from trades are dissipated, or the speed with which
imbalances in order flows are adjusted. However, other measures, though they do not directly coincide with these three
dimensions, are often regarded as readily observable proxies of market liquidity: the number and volume of trades, trade
frequency, turnover ratio, price volatility, the number of market participants, the yield spread between the ‘‘on the run’’
and the ‘‘off the run’’ issues, the outstanding volume of a specific security, or the overall outstanding volume of secu-
rities traded in one market, among others.15 Bid/ask spreads series used in this paper are only related to the ‘‘on-the-run’’ issues and show the differential be-
tween the bid and ask quotations for the ‘‘benchmark’’ or ‘‘on-the-run’’ issue at every moment of time.16 Conversely, multicollinearity would appear if we estimated a model with the proxy of market liquidity used in
Gomez-Puig (2006) the relative level of indebtedness together with the relative debt-to-GDP ratio because these two
variables present a high correlation coefficient indeed.
467M. Gomez-Puig / Journal of International Money and Finance 27 (2008) 455e479
To sum up, the two variables described will be used in our models to control for marketliquidity. However, for the sake of fairness, it has to be noted that measuring the liquidity pre-mium remains a difficult issue because market liquidity and credit risk interact with each other.The lack of liquidity increases the effect of risk. This is because liquidity variables, such as thebid/ask spread, reflect the risk borne by market makers in managing unbalanced positions. Ascredit risk increases, so does the risk they face. A (credit-related) flight-to-quality argumentmight also be used to interpret the significance of the on-the-run/off-the-run differentials.17
In these circumstances, the results presented in this paper turn out to be highly consistent;they indicate that, since EMU, the market assessment of both liquidity and credit risk factorshas been closely related inside countries, as it depends on the size of their debt market.
Lastly, a third point that will be assessed in this paper is the relevance of international riskfactors on yield spreads. Hence, the analysis will also build on the findings of some recent workaccording to which yields spreads on eurozone government securities are sensitive to interna-tional risk factors.18
As defined in Section 2, the dependent variable is ASPREADit, i.e. the difference betweenthe total yield differential of 10-year government bonds and the 10-year interest rate swapdifferential. The sample comprises daily data spanning the period January 1, 1996eDecember31, 2001. Yields and swap rates are obtained from Datastream and correspond to the ‘‘on therun’’ (benchmark) 10-year issue for each market at every moment of time. They are quotedrates at market close.
Datastream creates continuous yield series by taking the yield from the current benchmark ineach market and using it to update a separate time series. As a benchmark changes, data aretaken from a new stock on the first day of the month. Table 3 presents the starting benchmarkdates used by Datastream as well as the characteristics of the different benchmarks thatcompose the yield and swap series.
With regard to the bid/ask spreads series, daily time series have been created by calculatingthe spread between the bid and ask quotations provided by Bloomberg for the ‘‘on the run’’(benchmark) 10-year issue for each market at every moment of time, using the same bench-marks and starting dates that Datastream uses to create the 10-year yields and swap rates series(see Table 3). For all the different issues Bloomberg provides daily quoted prices calculated asthe average bid and ask quotations at the close.
A similar methodology was used to build the on-the-run/off-the-run spread daily time-series. These series were created by calculating the differences between the ‘‘on the run’’(benchmark) 10-year issue and the ‘‘off the run’’ (immediately older security) 10-year issueyields provided by Bloomberg for each market at every moment of time, also using thesame benchmarks and starting dates that Datastream uses to create the 10-year yields andswap rates series (see Table 3).
The overall outstanding amounts of public debt data have been drawn from the Bank forInternational Settlements (BIS; see Table 2) and the GDP from Eurostat (in the case of Ireland,the Central Statistics Office). However, as these series are only provided with quarterlyfrequency, for the construction of the relative debt-to-GDP ratio daily time-series, the rest ofthe data have been extrapolated assuming a daily constant rate of increase of those volumes,which in fact present very slight differences within countries over the studied period. For
17 See Vayanos (2004) among others.18 See Codogno et al. (2003) or Bernoth et al. (2004) among others.
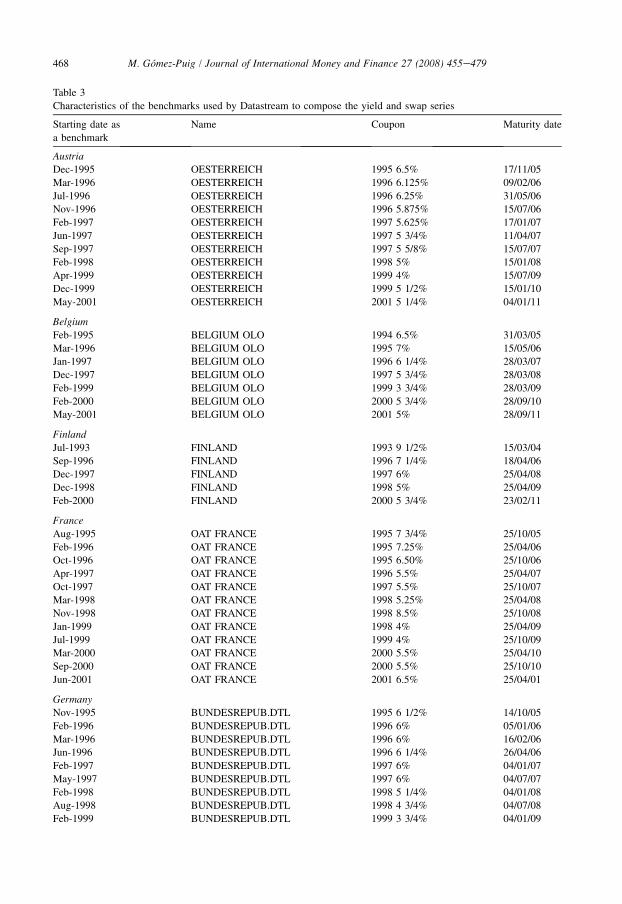
Table 3
Characteristics of the benchmarks used by Datastream to compose the yield and swap series
Starting date as
a benchmark
Name Coupon Maturity date
AustriaDec-1995 OESTERREICH 1995 6.5% 17/11/05
Mar-1996 OESTERREICH 1996 6.125% 09/02/06
Jul-1996 OESTERREICH 1996 6.25% 31/05/06
Nov-1996 OESTERREICH 1996 5.875% 15/07/06
Feb-1997 OESTERREICH 1997 5.625% 17/01/07
Jun-1997 OESTERREICH 1997 5 3/4% 11/04/07
Sep-1997 OESTERREICH 1997 5 5/8% 15/07/07
Feb-1998 OESTERREICH 1998 5% 15/01/08
Apr-1999 OESTERREICH 1999 4% 15/07/09
Dec-1999 OESTERREICH 1999 5 1/2% 15/01/10
May-2001 OESTERREICH 2001 5 1/4% 04/01/11
Belgium
Feb-1995 BELGIUM OLO 1994 6.5% 31/03/05
Mar-1996 BELGIUM OLO 1995 7% 15/05/06
Jan-1997 BELGIUM OLO 1996 6 1/4% 28/03/07
Dec-1997 BELGIUM OLO 1997 5 3/4% 28/03/08
Feb-1999 BELGIUM OLO 1999 3 3/4% 28/03/09
Feb-2000 BELGIUM OLO 2000 5 3/4% 28/09/10
May-2001 BELGIUM OLO 2001 5% 28/09/11
Finland
Jul-1993 FINLAND 1993 9 1/2% 15/03/04
Sep-1996 FINLAND 1996 7 1/4% 18/04/06
Dec-1997 FINLAND 1997 6% 25/04/08
Dec-1998 FINLAND 1998 5% 25/04/09
Feb-2000 FINLAND 2000 5 3/4% 23/02/11
France
Aug-1995 OAT FRANCE 1995 7 3/4% 25/10/05
Feb-1996 OAT FRANCE 1995 7.25% 25/04/06
Oct-1996 OAT FRANCE 1995 6.50% 25/10/06
Apr-1997 OAT FRANCE 1996 5.5% 25/04/07
Oct-1997 OAT FRANCE 1997 5.5% 25/10/07
Mar-1998 OAT FRANCE 1998 5.25% 25/04/08
Nov-1998 OAT FRANCE 1998 8.5% 25/10/08
Jan-1999 OAT FRANCE 1998 4% 25/04/09
Jul-1999 OAT FRANCE 1999 4% 25/10/09
Mar-2000 OAT FRANCE 2000 5.5% 25/04/10
Sep-2000 OAT FRANCE 2000 5.5% 25/10/10
Jun-2001 OAT FRANCE 2001 6.5% 25/04/01
Germany
Nov-1995 BUNDESREPUB.DTL 1995 6 1/2% 14/10/05
Feb-1996 BUNDESREPUB.DTL 1996 6% 05/01/06
Mar-1996 BUNDESREPUB.DTL 1996 6% 16/02/06
Jun-1996 BUNDESREPUB.DTL 1996 6 1/4% 26/04/06
Feb-1997 BUNDESREPUB.DTL 1997 6% 04/01/07
May-1997 BUNDESREPUB.DTL 1997 6% 04/07/07
Feb-1998 BUNDESREPUB.DTL 1998 5 1/4% 04/01/08
Aug-1998 BUNDESREPUB.DTL 1998 4 3/4% 04/07/08
Feb-1999 BUNDESREPUB.DTL 1999 3 3/4% 04/01/09
468 M. Gomez-Puig / Journal of International Money and Finance 27 (2008) 455e479
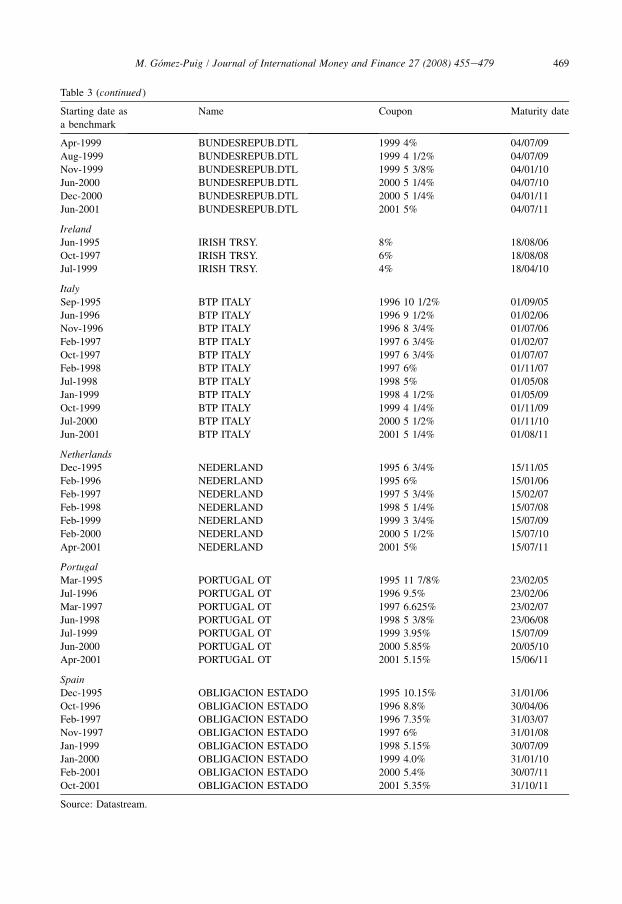
Table 3 (continued )
Starting date as
a benchmark
Name Coupon Maturity date
Apr-1999 BUNDESREPUB.DTL 1999 4% 04/07/09
Aug-1999 BUNDESREPUB.DTL 1999 4 1/2% 04/07/09
Nov-1999 BUNDESREPUB.DTL 1999 5 3/8% 04/01/10
Jun-2000 BUNDESREPUB.DTL 2000 5 1/4% 04/07/10
Dec-2000 BUNDESREPUB.DTL 2000 5 1/4% 04/01/11
Jun-2001 BUNDESREPUB.DTL 2001 5% 04/07/11
Ireland
Jun-1995 IRISH TRSY. 8% 18/08/06
Oct-1997 IRISH TRSY. 6% 18/08/08
Jul-1999 IRISH TRSY. 4% 18/04/10
Italy
Sep-1995 BTP ITALY 1996 10 1/2% 01/09/05
Jun-1996 BTP ITALY 1996 9 1/2% 01/02/06
Nov-1996 BTP ITALY 1996 8 3/4% 01/07/06
Feb-1997 BTP ITALY 1997 6 3/4% 01/02/07
Oct-1997 BTP ITALY 1997 6 3/4% 01/07/07
Feb-1998 BTP ITALY 1997 6% 01/11/07
Jul-1998 BTP ITALY 1998 5% 01/05/08
Jan-1999 BTP ITALY 1998 4 1/2% 01/05/09
Oct-1999 BTP ITALY 1999 4 1/4% 01/11/09
Jul-2000 BTP ITALY 2000 5 1/2% 01/11/10
Jun-2001 BTP ITALY 2001 5 1/4% 01/08/11
NetherlandsDec-1995 NEDERLAND 1995 6 3/4% 15/11/05
Feb-1996 NEDERLAND 1995 6% 15/01/06
Feb-1997 NEDERLAND 1997 5 3/4% 15/02/07
Feb-1998 NEDERLAND 1998 5 1/4% 15/07/08
Feb-1999 NEDERLAND 1999 3 3/4% 15/07/09
Feb-2000 NEDERLAND 2000 5 1/2% 15/07/10
Apr-2001 NEDERLAND 2001 5% 15/07/11
Portugal
Mar-1995 PORTUGAL OT 1995 11 7/8% 23/02/05
Jul-1996 PORTUGAL OT 1996 9.5% 23/02/06
Mar-1997 PORTUGAL OT 1997 6.625% 23/02/07
Jun-1998 PORTUGAL OT 1998 5 3/8% 23/06/08
Jul-1999 PORTUGAL OT 1999 3.95% 15/07/09
Jun-2000 PORTUGAL OT 2000 5.85% 20/05/10
Apr-2001 PORTUGAL OT 2001 5.15% 15/06/11
Spain
Dec-1995 OBLIGACION ESTADO 1995 10.15% 31/01/06
Oct-1996 OBLIGACION ESTADO 1996 8.8% 30/04/06
Feb-1997 OBLIGACION ESTADO 1996 7.35% 31/03/07
Nov-1997 OBLIGACION ESTADO 1997 6% 31/01/08
Jan-1999 OBLIGACION ESTADO 1998 5.15% 30/07/09
Jan-2000 OBLIGACION ESTADO 1999 4.0% 31/01/10
Feb-2001 OBLIGACION ESTADO 2000 5.4% 30/07/11
Oct-2001 OBLIGACION ESTADO 2001 5.35% 31/10/11
Source: Datastream.
469M. Gomez-Puig / Journal of International Money and Finance 27 (2008) 455e479
470 M. Gomez-Puig / Journal of International Money and Finance 27 (2008) 455e479
this reason, it can be assumed that the extrapolation will not produce important biases in thedata and can be applied in this case.
And finally, the spread between 10-year fixed interest rates on US swaps and the yield on10-year Moody’s Seasoned AAA US corporate bonds (USSPREADit), has been calculatedfrom daily data obtained from Datastream.
All the variables included in the estimation that capture domestic risk factors are in relativeterms to the German ones, as our dependent variable (ASPREADit) is the difference betweenthe total yield differential and the swap differential of country i over Germany. Therefore,BIDASKDIFit is the difference between the bid/ask spread in country i and the bid/ask spreadin Germany, ONOFFDIFit is the difference between the on-the run/off-the run spread in countryi and that in Germany, and LNDEBTGDPit is the (log) deviation of country i debt-to-GDP ratiofrom Germany’s debt-to-GDP ratio.
5. Modelling adjusted yield spread behaviour
5.1. Panel models with both domestic and international factors
The first and second specifications will be panel regressions that include nine groups orcountries. In these specifications, in addition to the variables already mentioned in Section(LNDEBTGDPit, BIDASKDIFit, ONOFFDIFit, and USSPREADit), country dummy variablesand monthly dummy variables will be introduced, in order to capture the potential existenceof both specific features via country and temporal effects. Besides, as the goal is to analyseif the marginal effect of the different variables changed with EMU, a dummy (DPRE), thattakes the value 1 in the pre-EMU period (and 0, otherwise), will also be introduced and thecoefficients of the interactions between this dummy and the rest of variables will be calculated.Finally, in order to assess if there exists a varying relationship between liquidity variables andthe yield, ASPREADSit (if liquidity is self-fulfilling, the proxies of market liquidity mightpresent a non-linear relationship, i.e. a liquid/illiquid market might lead to an increasinglylower/higher liquidity premium) a quadratic specification for the variables BIDASKDIFit,and ONOFFDIFit will be formulated. So, with the following defined previously:
BIDASKDIF2it ¼ ðBIDASKDIFÞ2it:
ONOFFDIF2it ¼ ðONOFFDIFÞ2it:
The domestic risk variables (DRVit) will be:
DRVit ¼ ðLNDEBTGDPit;BIDASKDIFit;BIDASKDIF2it;ONOFFDIFit;ONOFFDIF2itÞ:ð5Þ
While the international risk variables (IRVit) will be:
IRVit ¼ USSPREADit: ð6Þ
The international risk variable that allows adjusted spreads to be explained in terms ofexogenous risk premiums (specifically, banking risk premiums in the United States) will appearin the regression both linearly, and interacting with the domestic risk variables. This capturesthe idea that international risk affects adjusted yield differentials because Eurozone government
471M. Gomez-Puig / Journal of International Money and Finance 27 (2008) 455e479
bonds are imperfect substitutes due to differences in either market liquidity or default risk.Therefore, the interaction term identifies changes in adjusted spreads that can be entirely attrib-uted to domestic risk differentials. However, the linear term is also necessary, as internationalfactors might affect the adjusted yield spread either because of ‘‘structural’’ differences inmarket liquidity or differences in non-varying unobservable fundamentals, such as the reputa-tion of the issuing governments. Hence, the independent effect of domestic risk variables onadjusted spreads is also controlled by entering these variables linearly in the regressions.
I. Static panel model
Therefore, the first panel model with both domestic and international risk variables will be:
yit ¼ aiþ bXit þ gDPREit þ dMONTHLYDUMMIESt þ lCOUNTRYDUMMIESiþ 3it
where, with the international (IRVit) and domestic risk variables (DRVit) previously defined, thevector of independent variables will be:
Xit ¼ ðIRVit;DRVit;DRVitIRVitÞ: ð7Þ
II. Dynamic panel model
In the second estimated model, taking into account that some aspects of both credit risk andmarket liquidity do not change over the considered period, the objective will be to identify therelative importance of liquidity and default premiums in explaining fluctuations, rather thanlevels of yield differentials. With this aim a lag of the dependent variable will be introducedin the model, which will allow for a slow dynamic adjustment to a long-term equilibrium valueof the variable ASPREADit.
So, we will estimate the same model as in specification I:
yit ¼ aiþ bXit þ gDPREit þ dMONTHLYDUMMIESt þ lCOUNTRYDUMMIESiþ 3it
including a lag of the dependent variable in the vector of independent variables:
Xit ¼ ðyit�1; IRVit;DRVit;DRVitIRVitÞ: ð8Þ
In addition,
b¼ b1þ b2DPREit: ð9Þ
We honestly think that a formal coefficient test H0: b1¼ b1þ b2, in order to assess whetherthe impact of independent variables on the adjusted interest differential changed significantlywith the start of EMU, is not necessary as long as b2 turns out to be significant. Therefore,for both models I and II; the marginal effect of a variable will be:
b¼ b1ðin the EMU periodÞ; and
b¼ b1þ b2ðpre-EMUÞ:
472 M. Gomez-Puig / Journal of International Money and Finance 27 (2008) 455e479
5.2. Regressions for every individual country
In the two panel regressions above, all country dummies (with the exception of those ofIreland and Finland) turn out to be significant at the 5% confidence level, meaning that specificfactors in each different country are relevant and suggesting that a separate estimation for eachof them will provide wider information. We will do this in the third and fourth sets of regres-sions where, using the same independent variables as in the panel regressions I and II, bothstatic and dynamic estimations will be implemented separately for each nine euro countriesthat are included in the sample.
Therefore, the following empirical model on daily data will be implemented separately foreach individual country:
yit ¼ aiþ bXit þ gDPREit þ 3it: ð10Þ
Hence, two sets of regressions (III and IV) will be calculated using the same estimation equa-tions as in Section 5.1.
6. Results
The estimation methods used in all specifications, Feasible Generalized Least Squares(FGLS) in panel estimations and a regression with NeweyeWest standard errors in theestimations for each euro-country, are robust to the possible existence of autocorrelation andheteroscedasticity in the error terms.
The results of all four specifications are highly consistent and provide evidence that marketsize scale economies have increased with Currency Union and that this increase is higher thesmaller the debt market. A change in the market assessment of domestic risk factors (bothliquidity and credit risk) rather than international factors might be behind the observed increasein adjusted spreads with Monetary Integration, even though the effect differs according to thesize of the market.
Tables 4e7 present, respectively, the values and standard errors of the estimated coefficientscorresponding to the first, second, third, and fourth specifications. For each exogenous variable,these tables allow calculation of the corresponding marginal effects for the EMU period (b1)and the pre-EMU (b1þ b2), from the estimated coefficient values.
Tables 4 and 5 present the results from the panel regressions (static and dynamic) thatcorrespond to models I and II. Apart from the fact that in the dynamic model the lag of thedependent variable is significant (even though its marginal effect over aspreads decreaseswith EMU) the results from both specifications present only slight differences. They showan increase in the marginal impact of market liquidity’s variables since Monetary Union.Both linear terms of the on-the-run/off-the-run and the bid/ask spread increase with the euro.On the other hand, when it is interacted with the international risk variable (which, thoughsignificant in both specifications, only experiences an increase in its marginal effect with theeuro in the static model), the behaviour of the on-the-run/off-the-run variable is non-linear,suggesting that liquidity is self-fulfilling. Moreover, its marginal impact also rises withEMU. With regard to the default risk variable behaviour, Tables 4 and 5 show that its signifi-cance has increased since the beginning of the EMU (which would support a high degree ofcredibility for the ‘‘no-bail-out’’ rule).
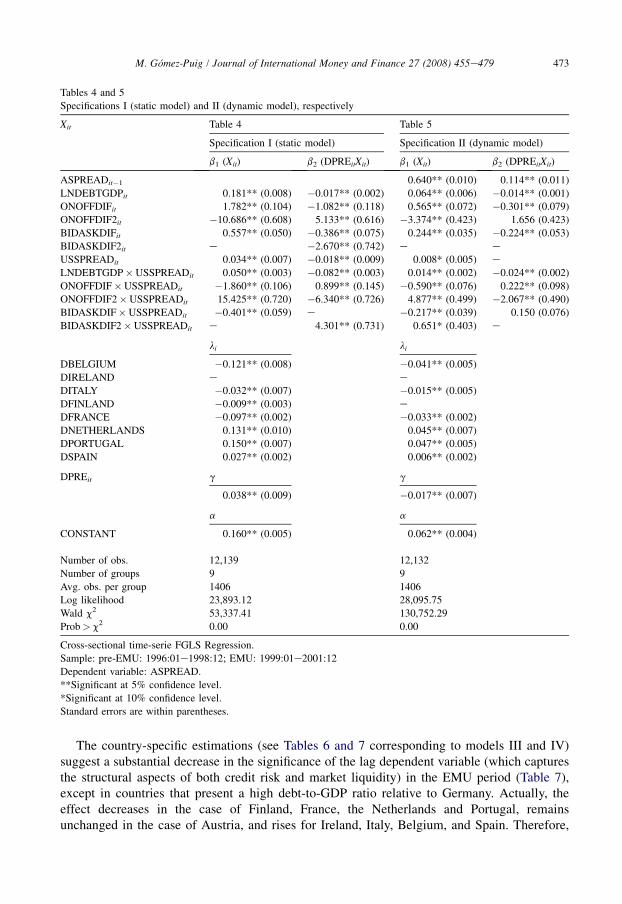
Tables 4 and 5
Specifications I (static model) and II (dynamic model), respectively
Xit Table 4 Table 5
Specification I (static model) Specification II (dynamic model)
b1 (Xit) b2 (DPREitXit) b1 (Xit) b2 (DPREitXit)
ASPREADit�1 0.640** (0.010) 0.114** (0.011)
LNDEBTGDPit 0.181** (0.008) �0.017** (0.002) 0.064** (0.006) �0.014** (0.001)
ONOFFDIFit 1.782** (0.104) �1.082** (0.118) 0.565** (0.072) �0.301** (0.079)
ONOFFDIF2it �10.686** (0.608) 5.133** (0.616) �3.374** (0.423) 1.656 (0.423)
BIDASKDIFit 0.557** (0.050) �0.386** (0.075) 0.244** (0.035) �0.224** (0.053)
BIDASKDIF2it e �2.670** (0.742) e e
USSPREADit 0.034** (0.007) �0.018** (0.009) 0.008* (0.005) e
LNDEBTGDP�USSPREADit 0.050** (0.003) �0.082** (0.003) 0.014** (0.002) �0.024** (0.002)
ONOFFDIF�USSPREADit �1.860** (0.106) 0.899** (0.145) �0.590** (0.076) 0.222** (0.098)
ONOFFDIF2�USSPREADit 15.425** (0.720) �6.340** (0.726) 4.877** (0.499) �2.067** (0.490)
BIDASKDIF�USSPREADit �0.401** (0.059) e �0.217** (0.039) 0.150 (0.076)
BIDASKDIF2�USSPREADit e 4.301** (0.731) 0.651* (0.403) e
li li
DBELGIUM �0.121** (0.008) �0.041** (0.005)
DIRELAND e e
DITALY �0.032** (0.007) �0.015** (0.005)
DFINLAND �0.009** (0.003) eDFRANCE �0.097** (0.002) �0.033** (0.002)
DNETHERLANDS 0.131** (0.010) 0.045** (0.007)
DPORTUGAL 0.150** (0.007) 0.047** (0.005)
DSPAIN 0.027** (0.002) 0.006** (0.002)
DPREit g g
0.038** (0.009) �0.017** (0.007)
a a
CONSTANT 0.160** (0.005) 0.062** (0.004)
Number of obs. 12,139 12,132
Number of groups 9 9
Avg. obs. per group 1406 1406
Log likelihood 23,893.12 28,095.75
Wald c2 53,337.41 130,752.29
Prob> c2 0.00 0.00
Cross-sectional time-serie FGLS Regression.
Sample: pre-EMU: 1996:01e1998:12; EMU: 1999:01e2001:12
Dependent variable: ASPREAD.
**Significant at 5% confidence level.
*Significant at 10% confidence level.
Standard errors are within parentheses.
473M. Gomez-Puig / Journal of International Money and Finance 27 (2008) 455e479
The country-specific estimations (see Tables 6 and 7 corresponding to models III and IV)suggest a substantial decrease in the significance of the lag dependent variable (which capturesthe structural aspects of both credit risk and market liquidity) in the EMU period (Table 7),except in countries that present a high debt-to-GDP ratio relative to Germany. Actually, theeffect decreases in the case of Finland, France, the Netherlands and Portugal, remainsunchanged in the case of Austria, and rises for Ireland, Italy, Belgium, and Spain. Therefore,
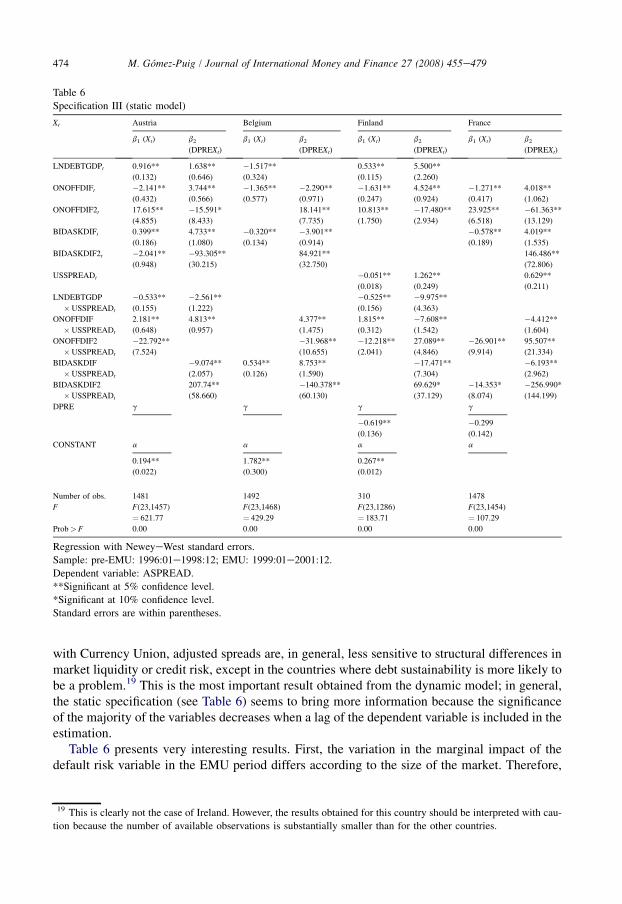
Table 6
Specification III (static model)
Xt Austria Belgium Finland France
b1 (Xt) b2
(DPREXt)
b1 (Xt) b2
(DPREXt)
b1 (Xt) b2
(DPREXt)
b1 (Xt) b2
(DPREXt)
LNDEBTGDPt 0.916**
(0.132)
1.638**
(0.646)
�1.517**
(0.324)
0.533**
(0.115)
5.500**
(2.260)
ONOFFDIFt �2.141**
(0.432)
3.744**
(0.566)
�1.365**
(0.577)
�2.290**
(0.971)
�1.631**
(0.247)
4.524**
(0.924)
�1.271**
(0.417)
4.018**
(1.062)
ONOFFDIF2t 17.615**
(4.855)
�15.591*
(8.433)
18.141**
(7.735)
10.813**
(1.750)
�17.480**
(2.934)
23.925**
(6.518)
�61.363**
(13.129)
BIDASKDIFt 0.399**
(0.186)
4.733**
(1.080)
�0.320**
(0.134)
�3.901**
(0.914)
�0.578**
(0.189)
4.019**
(1.535)
BIDASKDIF2t �2.041**
(0.948)
�93.305**
(30.215)
84.921**
(32.750)
146.486**
(72.806)
USSPREADt �0.051**
(0.018)
1.262**
(0.249)
0.629**
(0.211)
LNDEBTGDP
�USSPREADt
�0.533**
(0.155)
�2.561**
(1.222)
�0.525**
(0.156)
�9.975**
(4.363)
ONOFFDIF
�USSPREADt
2.181**
(0.648)
4.813**
(0.957)
4.377**
(1.475)
1.815**
(0.312)
�7.608**
(1.542)
�4.412**
(1.604)
ONOFFDIF2
�USSPREADt
�22.792**
(7.524)
�31.968**
(10.655)
�12.218**
(2.041)
27.089**
(4.846)
�26.901**
(9.914)
95.507**
(21.334)
BIDASKDIF
�USSPREADt
�9.074**
(2.057)
0.534**
(0.126)
8.753**
(1.590)
�17.471**
(7.304)
�6.193**
(2.962)
BIDASKDIF2
�USSPREADt
207.74**
(58.660)
�140.378**
(60.130)
69.629*
(37.129)
�14.353*
(8.074)
�256.990*
(144.199)
DPRE g g g g
�0.619**
(0.136)
�0.299
(0.142)
CONSTANT a a a a
0.194**
(0.022)
1.782**
(0.300)
0.267**
(0.012)
Number of obs. 1481 1492 310 1478
F F(23,1457)
¼ 621.77
F(23,1468)
¼ 429.29
F(23,1286)
¼ 183.71
F(23,1454)
¼ 107.29
Prob> F 0.00 0.00 0.00 0.00
Regression with NeweyeWest standard errors.
Sample: pre-EMU: 1996:01e1998:12; EMU: 1999:01e2001:12.
Dependent variable: ASPREAD.
**Significant at 5% confidence level.
*Significant at 10% confidence level.
Standard errors are within parentheses.
474 M. Gomez-Puig / Journal of International Money and Finance 27 (2008) 455e479
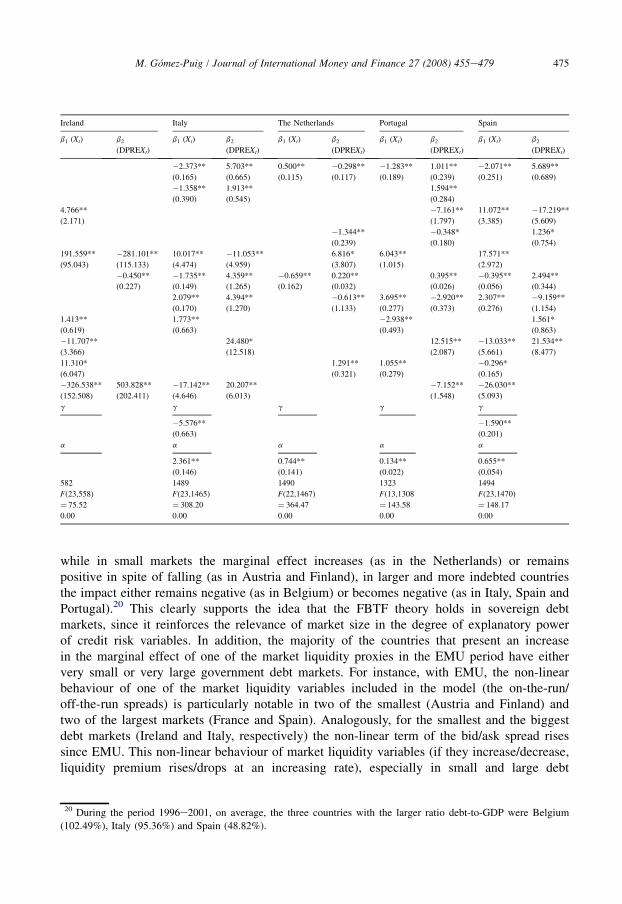
with Currency Union, adjusted spreads are, in general, less sensitive to structural differences inmarket liquidity or credit risk, except in the countries where debt sustainability is more likely tobe a problem.19 This is the most important result obtained from the dynamic model; in general,the static specification (see Table 6) seems to bring more information because the significanceof the majority of the variables decreases when a lag of the dependent variable is included in theestimation.
Table 6 presents very interesting results. First, the variation in the marginal impact of thedefault risk variable in the EMU period differs according to the size of the market. Therefore,
19 This is clearly not the case of Ireland. However, the results obtained for this country should be interpreted with cau-
tion because the number of available observations is substantially smaller than for the other countries.
Ireland Italy The Netherlands Portugal Spain
b1 (Xt) b2
(DPREXt)
b1 (Xt) b2
(DPREXt)
b1 (Xt) b2
(DPREXt)
b1 (Xt) b2
(DPREXt)
b1 (Xt) b2
(DPREXt)
�2.373**
(0.165)
5.703**
(0.665)
0.500**
(0.115)
�0.298**
(0.117)
�1.283**
(0.189)
1.011**
(0.239)
�2.071**
(0.251)
5.689**
(0.689)
�1.358**
(0.390)
1.913**
(0.545)
1.594**
(0.284)
4.766**
(2.171)
�7.161**
(1.797)
11.072**
(3.385)
�17.219**
(5.609)
�1.344**
(0.239)
�0.348*
(0.180)
1.236*
(0.754)
191.559**
(95.043)
�281.101**
(115.133)
10.017**
(4.474)
�11.053**
(4.959)
6.816*
(3.807)
6.043**
(1.015)
17.571**
(2.972)
�0.450**
(0.227)
�1.735**
(0.149)
4.359**
(1.265)
�0.659**
(0.162)
0.220**
(0.032)
0.395**
(0.026)
�0.395**
(0.056)
2.494**
(0.344)
2.079**
(0.170)
4.394**
(1.270)
�0.613**
(1.133)
3.695**
(0.277)
�2.920**
(0.373)
2.307**
(0.276)
�9.159**
(1.154)
1.413**
(0.619)
1.773**
(0.663)
�2.938**
(0.493)
1.561*
(0.863)
�11.707**
(3.366)
24.480*
(12.518)
12.515**
(2.087)
�13.033**
(5.661)
21.534**
(8.477)
11.310*
(6.047)
1.291**
(0.321)
1.055**
(0.279)
�0.296*
(0.165)
�326.538**
(152.508)
503.828**
(202.411)
�17.142**
(4.646)
20.207**
(6.013)
�7.152**
(1.548)
�26.030**
(5.093)
g g g g g
�5.576**
(0.663)
�1.590**
(0.201)
a a a a a
2.361**
(0.146)
0.744**
(0.141)
0.134**
(0.022)
0.655**
(0.054)
582 1489 1490 1323 1494
F(23,558)
¼ 75.52
F(23,1465)
¼ 308.20
F(22,1467)
¼ 364.47
F(13,1308
¼ 143.58
F(23,1470)
¼ 148.17
0.00 0.00 0.00 0.00 0.00
475M. Gomez-Puig / Journal of International Money and Finance 27 (2008) 455e479
while in small markets the marginal effect increases (as in the Netherlands) or remainspositive in spite of falling (as in Austria and Finland), in larger and more indebted countriesthe impact either remains negative (as in Belgium) or becomes negative (as in Italy, Spain andPortugal).20 This clearly supports the idea that the FBTF theory holds in sovereign debtmarkets, since it reinforces the relevance of market size in the degree of explanatory powerof credit risk variables. In addition, the majority of the countries that present an increasein the marginal effect of one of the market liquidity proxies in the EMU period have eithervery small or very large government debt markets. For instance, with EMU, the non-linearbehaviour of one of the market liquidity variables included in the model (the on-the-run/off-the-run spreads) is particularly notable in two of the smallest (Austria and Finland) andtwo of the largest markets (France and Spain). Analogously, for the smallest and the biggestdebt markets (Ireland and Italy, respectively) the non-linear term of the bid/ask spread risessince EMU. This non-linear behaviour of market liquidity variables (if they increase/decrease,liquidity premium rises/drops at an increasing rate), especially in small and large debt
20 During the period 1996e2001, on average, the three countries with the larger ratio debt-to-GDP were Belgium
(102.49%), Italy (95.36%) and Spain (48.82%).
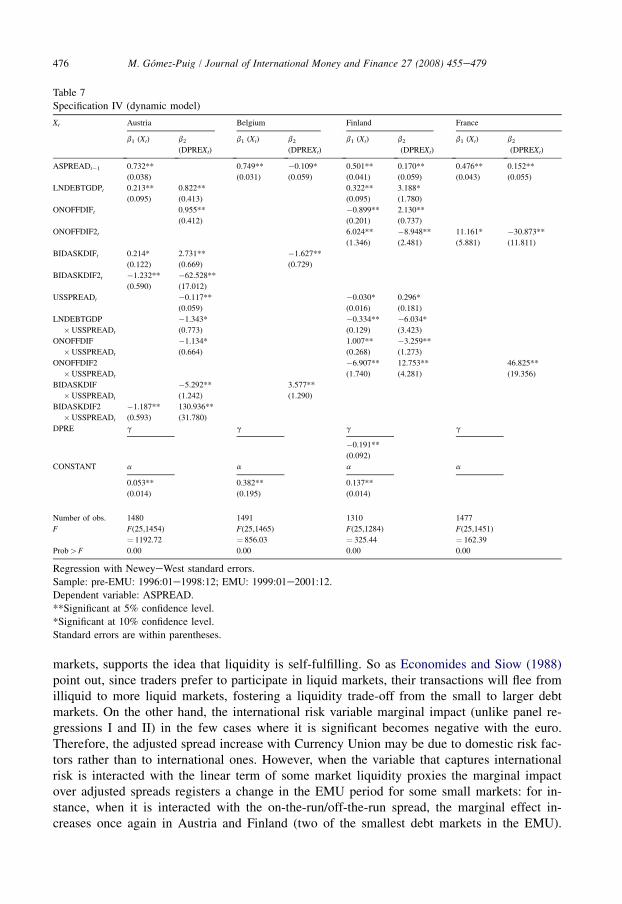
Table 7
Specification IV (dynamic model)
Xt Austria Belgium Finland France
b1 (Xt) b2
(DPREXt)
b1 (Xt) b2
(DPREXt)
b1 (Xt) b2
(DPREXt)
b1 (Xt) b2
(DPREXt)
ASPREADt�1 0.732**
(0.038)
0.749**
(0.031)
�0.109*
(0.059)
0.501**
(0.041)
0.170**
(0.059)
0.476**
(0.043)
0.152**
(0.055)
LNDEBTGDPt 0.213**
(0.095)
0.822**
(0.413)
0.322**
(0.095)
3.188*
(1.780)
ONOFFDIFt 0.955**
(0.412)
�0.899**
(0.201)
2.130**
(0.737)
ONOFFDIF2t 6.024**
(1.346)
�8.948**
(2.481)
11.161*
(5.881)
�30.873**
(11.811)
BIDASKDIFt 0.214*
(0.122)
2.731**
(0.669)
�1.627**
(0.729)
BIDASKDIF2t �1.232**
(0.590)
�62.528**
(17.012)
USSPREADt �0.117**
(0.059)
�0.030*
(0.016)
0.296*
(0.181)
LNDEBTGDP
�USSPREADt
�1.343*
(0.773)
�0.334**
(0.129)
�6.034*
(3.423)
ONOFFDIF
�USSPREADt
�1.134*
(0.664)
1.007**
(0.268)
�3.259**
(1.273)
ONOFFDIF2
�USSPREADt
�6.907**
(1.740)
12.753**
(4.281)
46.825**
(19.356)
BIDASKDIF
�USSPREADt
�5.292**
(1.242)
3.577**
(1.290)
BIDASKDIF2
�USSPREADt
�1.187**
(0.593)
130.936**
(31.780)
DPRE g g g g
�0.191**
(0.092)
CONSTANT a a a a
0.053**
(0.014)
0.382**
(0.195)
0.137**
(0.014)
Number of obs. 1480 1491 1310 1477
F F(25,1454)
¼ 1192.72
F(25,1465)
¼ 856.03
F(25,1284)
¼ 325.44
F(25,1451)
¼ 162.39
Prob> F 0.00 0.00 0.00 0.00
Regression with NeweyeWest standard errors.
Sample: pre-EMU: 1996:01e1998:12; EMU: 1999:01e2001:12.
Dependent variable: ASPREAD.
**Significant at 5% confidence level.
*Significant at 10% confidence level.
Standard errors are within parentheses.
476 M. Gomez-Puig / Journal of International Money and Finance 27 (2008) 455e479
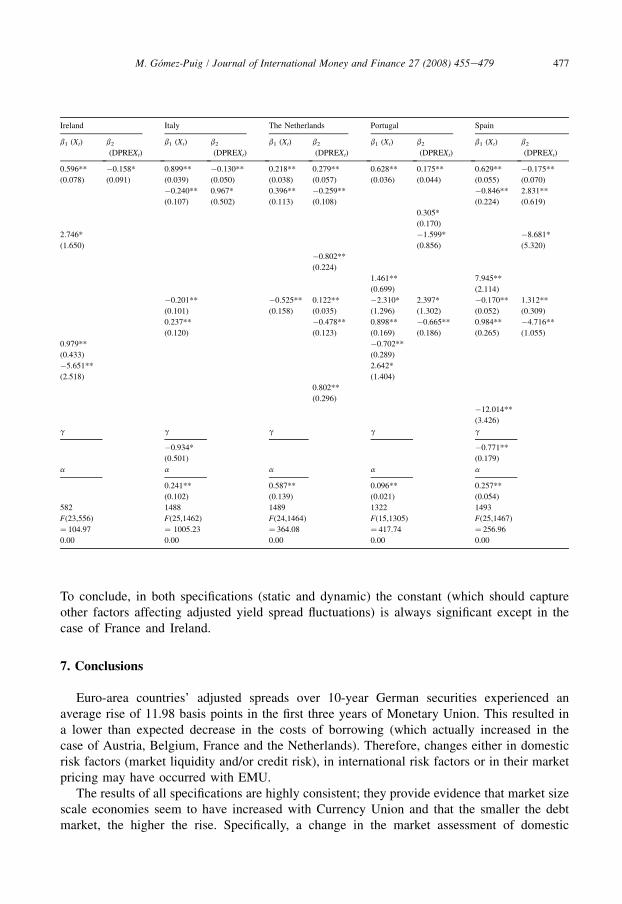
markets, supports the idea that liquidity is self-fulfilling. So as Economides and Siow (1988)point out, since traders prefer to participate in liquid markets, their transactions will flee fromilliquid to more liquid markets, fostering a liquidity trade-off from the small to larger debtmarkets. On the other hand, the international risk variable marginal impact (unlike panel re-gressions I and II) in the few cases where it is significant becomes negative with the euro.Therefore, the adjusted spread increase with Currency Union may be due to domestic risk fac-tors rather than to international ones. However, when the variable that captures internationalrisk is interacted with the linear term of some market liquidity proxies the marginal impactover adjusted spreads registers a change in the EMU period for some small markets: for in-stance, when it is interacted with the on-the-run/off-the-run spread, the marginal effect in-creases once again in Austria and Finland (two of the smallest debt markets in the EMU).
Ireland Italy The Netherlands Portugal Spain
b1 (Xt) b2
(DPREXt)
b1 (Xt) b2
(DPREXt)
b1 (Xt) b2
(DPREXt)
b1 (Xt) b2
(DPREXt)
b1 (Xt) b2
(DPREXt)
0.596**
(0.078)
�0.158*
(0.091)
0.899**
(0.039)
�0.130**
(0.050)
0.218**
(0.038)
0.279**
(0.057)
0.628**
(0.036)
0.175**
(0.044)
0.629**
(0.055)
�0.175**
(0.070)
�0.240**
(0.107)
0.967*
(0.502)
0.396**
(0.113)
�0.259**
(0.108)
�0.846**
(0.224)
2.831**
(0.619)
0.305*
(0.170)
2.746*
(1.650)
�1.599*
(0.856)
�8.681*
(5.320)
�0.802**
(0.224)
1.461**
(0.699)
7.945**
(2.114)
�0.201**
(0.101)
�0.525**
(0.158)
0.122**
(0.035)
�2.310*
(1.296)
2.397*
(1.302)
�0.170**
(0.052)
1.312**
(0.309)
0.237**
(0.120)
�0.478**
(0.123)
0.898**
(0.169)
�0.665**
(0.186)
0.984**
(0.265)
�4.716**
(1.055)
0.979**
(0.433)
�0.702**
(0.289)
�5.651**
(2.518)
2.642*
(1.404)
0.802**
(0.296)
�12.014**
(3.426)
g g g g g
�0.934*
(0.501)
�0.771**
(0.179)
a a a a a
0.241**
(0.102)
0.587**
(0.139)
0.096**
(0.021)
0.257**
(0.054)
582 1488 1489 1322 1493
F(23,556)
¼ 104.97
F(25,1462)
¼ 1005.23
F(24,1464)
¼ 364.08
F(15,1305)
¼ 417.74
F(25,1467)
¼ 256.96
0.00 0.00 0.00 0.00 0.00
477M. Gomez-Puig / Journal of International Money and Finance 27 (2008) 455e479
To conclude, in both specifications (static and dynamic) the constant (which should captureother factors affecting adjusted yield spread fluctuations) is always significant except in thecase of France and Ireland.
7. Conclusions
Euro-area countries’ adjusted spreads over 10-year German securities experienced anaverage rise of 11.98 basis points in the first three years of Monetary Union. This resulted ina lower than expected decrease in the costs of borrowing (which actually increased in thecase of Austria, Belgium, France and the Netherlands). Therefore, changes either in domesticrisk factors (market liquidity and/or credit risk), in international risk factors or in their marketpricing may have occurred with EMU.
The results of all specifications are highly consistent; they provide evidence that market sizescale economies seem to have increased with Currency Union and that the smaller the debtmarket, the higher the rise. Specifically, a change in the market assessment of domestic
478 M. Gomez-Puig / Journal of International Money and Finance 27 (2008) 455e479
(both liquidity and default risk) rather than international factors (which would only playa smaller role) might be behind the increase observed in adjusted spreads with Monetary Inte-gration, even though the effect differs according to the size of the market.21 Therefore, theremoval of the exchange rate barrier seems to have punished smaller countries twice (theyare forced to compete in terms of liquidity with larger countries for the same pool of funding,only being able to offer smaller bond issues), by making them pay both higher liquidity anda higher default risk premium than larger ones. This empirical evidence is also in concordancewith the fact that the three countries that account for around 59% of the euro-area governmentsecurities markets (Italy, France and Spain) are precisely the ones with lowest adjusted spreadrise since Monetary Integration (see Tables 1a and 1b).
As mentioned, international risk factors appear less significant than local ones in explainingadjusted spread changes. In addition, default risk only seems to be relevant when it is accom-panied by a small market size. These results then show that the theory ‘‘too big to fail’’ holds: itis expected that large countries will receive financial support in case of fiscal distress (bail-out).This explains why the default risk premium has decreased for some big countries since EMU.In small countries, on the other hand, markets expect that the ‘‘no-bail-out’’ clause will hold,and membership of the monetary union has increased the default risk since these countries havelost monetary authority. In Italy, for instance, in spite of its very high debt-to-GDP ratio, theassociated default risk might be compensated by both the increased liquidity characteristicof a big market and the lack of credibility of the no-bail-out clause.
Finally, these results reinforce the self-fulfilling nature of market liquidity. Both in the caseof the smallest or the largest debt markets, illiquidity or liquidity presents a non-linear behav-iour that supports the idea that traders’ transactions flee from illiquid to liquid debt markets. So,the more liquid (illiquid) a market is, the more traders want (do not want) to participate in it,resulting in an increase (decrease) in the liquidity of the market. In particular, as the Germansovereign debt market is the second-biggest in the euro-area (only surpassed by the Italian),both a concentration of trading activity and a drop in the credibility of the ‘‘no-bail-out’’rule might have occurred in the German market. Consequently, wider liquidity and perceiveddefault risk differences vis-a-vis German bonds might have been transformed into higheradjusted spreads.
To conclude, with the introduction of a common currency and in the current context ofhigher competition between euro-area government securities markets, the success of euro-area sovereign securities debt markets may be highly dependent on their market size.
Acknowledgments
The backbone of this paper was written while I was a Visiting Scholar at the EconomicsDepartment of the Massachusetts Institute of Technology (September 2000eAugust 2002).I would like to thank MIT Economics Department for their hospitality, the Spanish Ministryof Education for their financial support, and both Campe Goodman and Analistas FinancierosInternacionales S.A. who kindly provided part of the data used in the empirical analysis. I amgrateful to Rudi Dornbusch, Roberto Rigobon and all the participants at the International
21 These results seem consistent; they point out that, since EMU, market assessment of both liquidity and default risk
(whose measurement, see p.12 in Section 4, is difficult because the two variables interact with each other) is closely
related within countries as it depends on the size of their debt market.
479M. Gomez-Puig / Journal of International Money and Finance 27 (2008) 455e479
Breakfast Workshop at MIT for their useful comments on a very preliminary draft . Specialthanks to Lorenzo Codogno, Jordi Galı, Alessandro Missale, Juergen von Hagen, JaumeVentura, and the participants at various conferences where it has been presented, for theirinsightful comments on previous versions of the paper. Finally, I would like to give specialthanks to an anonymous referee for his/her wise comments. I alone responsible for any errorsremaining in the final version.
References
Adjaoute, K., Bottazi, L., Danthine, J.P., Fischer, A., Hamaui, R., Portes, R., Wickens, M., 2000. EMU and portfolio
adjustment. CEPR Policy Paper N�5.
Alesina, A., De Broeck, M., Prati, A., Tabellini, G., 1992. Default risk on government debt in OECD countries.
Economic Policy, 428e463.
Arnold, I., Lemmen, J., 2001. The vulnerability of banks to government default risk in the EMU. International Finance
11 (4), 101e125.
Bicksler, J., Chen, A., 1986. An economic analysis of interest rate swaps. The Journal of Finance XLI (3), 645e655.
Bank for International Settlements, 1999. Market liquidity: research findings and selected policy implications.
Committee on the Global Financial System Publications n.11.
Bank for International Settlements Study group on fixed income markets, 2001. The changing shape of fixed income
markets. BIS Working Papers 104.
Bernoth, K., Von Hagen, J., Schuknecht, L., 2004. Sovereign risk premia in the European Government Bond Market.
European Central Bank working paper n. 369.
Blanco, R., 2001. The euro-area government securities market: recent developments and implications for market
functioning. Documento de trabajo del Banco de Espana n. 0120.
Bayoumi, T., Goldstein, M., Woglom, G., 1995. Do credit markets discipline sovereign borrowers? Evidence from the
US States. Journal of Money Credit and Banking 27 (4), 1046e1059.
Codogno, L., Favero, C., Missale, A., 2003. EMU and Government Bond Spreads. Economic Policy 18, 503e532.
Danthine, J.P., Giavazzi, F., von Thadden, E.L., 2001. European financial markets after EMU: a first assessment. In:
Wyplosz, C. (Ed.), The Impact of EMU on Europe and the Developing Countries. University Press, Oxford.
Duffie, D., Singleton, K., 1997. An econometric model of the term structure of interest swap spreads. The Journal of
Finance 52, 1287e1321.
Economides, N., Siow, A., 1988. The division of markets is limited by the extent of liquidity (spatial competition with
externalities). American Economic Review 78 (1), 1719e1734.
Favero, C., Giavazzi, F., Spaventa, L., 1997. High yields: the spread on German interest rate. The Economic Journal 107 (443).
Favero, Missale, Piga, 1999. EMU and public debt management: one money, one debt? CEPR Policy Paper n.3.
Fleming, M.J., 2003. Measuring treasury market liquidity. Federal Reserve Bank of New Economic Policy Review 9,
83e108.
Goodhart, C.A.E., Huang, H., 2005. The lender of last resort. Journal of Banking & Finance 29, 1059e1082.
Gomez-Puig, M., 2006. Size matters for liquidity: evidence from EMU sovereign yield spreads. Economics Letters 9
(2), 156e162.
Giovannini, A., Piga, G., 1994. Understanding the High Interest Rates on Italian Government Securities; Bond Markets,
Treasury and Debt Management: The Italian Case. Chapman and Hall in collaboration with the European
Economics and Financial Centre, London, New York and Melbourne. pp.13e29.
He, H., 2000. Modeling term structures of swap spreads. Working Paper, Yale University.
Helpman, E., Krugman, P., 1985. Market Structure and Foreign Trade. MIT Press, Cambridge, MA.
Kaufman, G.G., 2002. Too big to fail in banking: what remains? The Quarterly Journal of Finance 42, 423e436.
Liu, J., Longstaff, F.A., Mandell, R.E., 2002. The market price of credit risk: an empirical analysis of interest rate swap
spreads. National Bureau of Economic Research Working Paper n. 8990.
Martin, P., Rey, H., 2004. Financial super-markets: size matters for asset trade. Journal of International Economics 64,
335e361.
McCauley, R., Remolona, E., 2000. Size and liquidity of government bond markets. BIS Quarterly Review.
Plantin, G., 2003. Self-fulfilling liquidity and the coordination premium. Financial Markets Group Discussion Paper n. 450.
Tesar, L., Werner, I., 1995. Home bias and high turnover. Journal of International Money and Finance 14 (4), 467e492.
Vayanos, L., 2004. Flight to quality, flight to liquidity and the pricing of risk. NBER working paper n.10327.


