Embed Size (px)
Citation preview

1
Hong Kong Exchanges and Clearing Limited and The Stock Exchange of Hong Kong Limited take no responsibility for the contents of this announcement, make no representation as to its accuracy or completeness and expressly disclaim any liability whatsoever for any loss howsoever arising from or in reliance upon the whole or any part of the contents of this announcement.
MONGOLIAN MINING CORPORATION(Incorporated in the Cayman Islands with Limited Liability)
(Stock Code: 975)
ANNUAL RESULTS ANNOUNCEMENT FOR THE YEAR ENDED 31 DECEMBER 2012
HIGHLIGHTS
For the year ended 31 December 2012, the Group’s production of ROM coal reached 9.4 million tonnes, representing a year-on-year increase of 32.4% (2011: 7.1 million tonnes). The Group sold 5.6 million tonnes of coal products in 2012, representing an increase of around 16.7% over the 4.8 million tonnes of coal products sold in 2011.
The Group’s revenue amounted to USD474.5 million for the year ended 31 December 2012, representing a change of USD68.1 million, or 12.6% as compared to USD542.6 million for the year ended 31 December 2011.
The loss attributable to the equity shareholders of the Company for the year ended 31 December 2012 was USD2.5 million compared to a profit of USD119.1 million for the year ended 31 December 2011.
The major contributing factors of the Group’s net loss position are (i) a decrease in the ASP of coking coal products, (ii) costs related to coal transportation and stockpile losses totaling USD19.5 million, which was one-off recording at the end of the year, and (iii) an increase in the Group’s finance costs due to the issue of guaranteed senior notes and other facilities, bringing total net finance cost to USD11.4 million.
The basic loss per share attributable to the equity shareholders of the Company amounted to USD0.07 cents for the year ended 31 December 2012, as compared to basic earnings per share of USD3.21 cents for the year ended 31 December 2011.
The diluted loss per share attributable to the equity shareholders of the Company amounted to USD0.07 cents for the year ended 31 December 2012, as compared to diluted earnings per share of USD3.07 cents for the year ended 31 December 2011.
The Board does not recommend the payment of dividend for the year ended 31 December 2012 (dividend in 2011: nil).
Note: All numbers in this announcement are approximate rounded values for particular item.

2
The board (the “Board”) of directors (the “Directors”) of Mongolian Mining Corporation (“MMC” or the “Company”) is pleased to announce the annual results of the Company and its subsidiaries (the “Group”) for the year ended 31 December 2012 together with the comparative figures for the corresponding period in 2011 as follows:
CONSOLIDATED STATEMENT OF COMPREHENSIVE INCOMEFor the year ended 31 December 2012
2012 2011Note USD’000 USD’000
Revenue 4 474,480 542,568Cost of revenue 5 (420,400) (336,368)
Gross profit 54,080 206,200
Other revenue 1,121 435Other net income 5,418 76Administrative expenses (48,183) (60,303)
Profit from operations 12,436 146,308
Finance income 39,561 22,236Finance costs (50,994) (13,785)
Net finance (costs)/income (11,433) 8,451
Share of losses of associates (362) (119)
Profit before taxation 6 641 154,740
Income tax 7 (3,183) (35,650)
(Loss)/profit for the year (2,542) 119,090
Other comprehensive income for the yearExchange differences on re-translation (20,929) (79,153)
Total comprehensive income for the year (23,471) 39,937
(Loss)/profit attributable to the equity shareholders of the Company (2,542) 119,090
Total comprehensive income attributable to the equity shareholders of the Company (23,471) 39,937
Basic (loss)/earnings per share 8(a) (0.07cents) 3.21cents
Diluted (loss)/earnings per share 8(b) (0.07cents) 3.07cents

3
CONSOLIDATED BALANCE SHEETAs at 31 December 2012
2012 2011Note USD’000 USD’000
Non-current assetsProperty, plant and equipment, net 527,358 347,109Construction in process 10 242,838 183,229Lease prepayments 103 105Intangible assets 11 774,773 681,352Interest in associates 3,808 4,278Other non-current assets 26,727 7,423Deferred tax assets 19,144 9,698
Total non-current assets 1,594,751 1,233,194
Current assetsInventories 90,290 57,734Trade and other receivables 12 207,914 109,322Cash at bank and in hand 284,322 227,765
Total current assets 582,526 394,821
Current liabilitiesShort-term borrowings and current portion of long-term borrowings 81,818 333,568Trade and other payables 13 247,057 118,680Current taxation 3,950 17,508Convertible bond 85,000 83,508Obligations under finance leases 210 247
Total current liabilities 418,035 553,511
Net current assets/(liabilities) 164,491 (158,690)
Total assets less current liabilities 1,759,242 1,074,504
Non-current liabilitiesInterest-bearing borrowings, less current portion 249,113 144,661Senior notes 14 592,891 –Provisions 15,538 11,110Deferred tax liabilities 149,574 149,656Obligations under finance leases 113 213
Total non-current liabilities 1,007,229 305,640
NET ASSETS 752,013 768,864
CAPITAL AND RESERVESShare capital 37,050 37,050Reserves 714,963 731,814
TOTAL EQUITY 752,013 768,864

4
NOTES
1. CORPORATE INFORMATION
The Company was incorporated in the Cayman Islands on 18 May 2010 as an exempted company with limited liability under the Companies Law, Cap 22 (Law 3 of 1961, as consolidated and revised) of the Cayman Islands. The Company and its subsidiaries are principally engaged in the mining, processing, transportation and sale of coal products.
Pursuant to a group reorganisation completed on 17 September 2010 (the “Reorganisation”) to rationalise the group structure for the public listing of the Company’s shares on the Main Board of The Stock Exchange of Hong Kong Limited (the “Stock Exchange”), the Company’s shares were listed on the Stock Exchange on 13 October 2010. Details of the Reorganisation are set out in the prospectus of the Company dated 28 September 2010.
The Group entered into a share purchase agreement with Quincunx (BVI) Ltd. and its parent, Kerry Mining (Mongolia) Limited (collectively the “Seller”) on 31 May 2011 (“Share Purchase Agreement”) in relation to the acquisition of the entire issued share capital of Baruun Naran Limited (the “Acquisition”). Baruun Naran Limited ultimately owns the Baruun Naran Coking Coal Mine (“BN Mine”), which is located in southern Mongolia, Umnugobi Aimag (South Gobi province). The Acquisition was completed on 1 June 2011. In order to change the Seller’s structure which was not cost effective for the Group, Mongolian Coal Corporation Limited owned by the Company (in its capacity as sole shareholder) made a decision to wind up Baruun Naran Limited voluntarily on 21 June 2012. Accordingly, Baruun Naran Limited (Gibraltar registered company) has been liquidated and its all assets were transferred to Mongolian Coal Corporation Limited on 16 July 2012.
2. SIGNIFICANT ACCOUNTING POLICIES
The consolidated financial statements of the Company and of the Group have been prepared in accordance with International Financial Reporting Standards (“IFRSs”), promulgated by the International Accounting Standards Board (“IASB”). IFRSs include all applicable individual International Financial Reporting Standards, International Accounting Standards (“IASs”) and related interpretations. The financial statements also comply with the disclosure requirements of the Hong Kong Companies Ordinance and the applicable disclosure provisions of the Rules Governing the Listing of Securities on the Stock Exchange.
The IASB has issued several amendments to IFRSs that are first effective for the current accounting period of the Group and the Company. Of these, the amendments to IFRS 7, Financial instruments: Disclosures – Transfers of financial assets, is relevant to the Group’s financial statements. The amendments to IFRS 7 require certain disclosures to be included in the financial statements in respect of all transferred financial assets that are not derecognised in their entirety and for any continuing involvement in transferred financial assets that are derecognised in their entirety, irrespective of when the related transfer transaction occurred. However, an entity needs not provide the disclosures for the comparative period in the first year of adoption. The Group did not have any significant transfers of financial assets in previous periods or the current period which require disclosure in the current accounting period under the amendments.

5
Up to the date of issue of the consolidated financial statements, the IASB has issued a number of amendments and new standards which are not yet effective for the year ended 31 December 2012 and which have not been adopted in the financial statements. These included the following which may be relevant to the Group’s operations and financial statements.
Effective for accounting periods
beginning on or after
IFRS 10, Consolidated financial statements 1 January 2013IFRS 11, Joint arrangements 1 January 2013IFRS 12, Disclosure of interests in other entities 1 January 2013IFRS 13, Fair value measurement 1 January 2013IAS 27, Separate financial statements (2011) 1 January 2013IAS 28, Investments in associates and joint ventures (2011) 1 January 2013Revised IAS 19, Employee benefits 1 January 2013IFRIC 20, Stripping costs in the production phase of a surface mine 1 January 2013Amendments to IFRS 7, Financial instruments: Disclosures – Offsetting financial assets and financial liabilities 1 January 2013Amendments to IFRS 1, First-time adoption of International Financial Reporting Standards – Government loans 1 January 2013Annual Improvements to IFRSs 2009-2011 Cycle 1 January 2013Amendments to IFRS 10, Consolidated financial statements, IFRS 11, Joint arrangements and IFRS 12, Disclosure of interests in other entities – Transition guidance 1 January 2013Amendments to IFRS 10, IFRS 12 and IAS 27, Investment entities 1 January 2014Amendments to IAS 32, Financial instruments: Presentation – Offsetting financial assets and financial liabilities 1 January 2014IFRS 9, Financial instruments 1 January 2015Amendments to IFRS 9, Financial instruments and IFRS 7 Financial instruments: Disclosures – Mandatory effective date and transition disclosures 1 January 2015
IFRIC 20 applies to all types of natural resources that are extracted using the surfacing mining activity process. It considers when and how to account separately for the two benefits arising from the stripping activity, which are 1) the usable ore that can be used to produce inventory; and 2) improved access to further quantities of material that will be mined in future periods, as well as how to measure these benefits both initially and subsequently.
The Group is in the process of making an assessment of what the impact of these amendments, new standards and new interpretations is expected to be in the period of initial application. So far it has concluded that the adoption of them is unlikely to have a significant impact on the Group’s results of operations and financial position except for IFRIC 20. The Group has not completed its assessment of the full impact of adopting IFRIC 20 and therefore its possible impact on the Group’s results and financial position has not been quantified.
The consolidated financial statements for the year ended 31 December 2012 comprise the Company and its subsidiaries and its interest in associates.
The measurement basis used in the preparation of the financial statements is the historical cost basis except that derivative financial instruments are stated at their fair value.

6
The preparation of financial statements in conformity with IFRSs requires management to make judgements, estimates and assumptions that affect the application of policies and reported amounts of assets, liabilities, income and expenses. The estimates and associated assumptions are based on historical experience and various other factors that are believed to be reasonable under the circumstances, the results of which form the basis of making the judgements about carrying values of assets and liabilities that are not readily apparent from other sources. Actual results may differ from these estimates.
The estimates and underlying assumptions are reviewed on an ongoing basis. Revisions to accounting estimates are recognised in the period in which the estimate is revised if the revision affects only that period, or in the period of the revision and future periods if the revision affects both current and future periods.
Judgements made by management in the application of IFRSs that have significant effect on the financial statements and major sources of estimation uncertainty are discussed in Note 3.
The consolidated financial statements are presented in United States Dollar (“USD”), which is the presentation currency of the Group. The functional currency of the Group’s Mongolian entities is Mongolian Togrog (“MNT”) and of the Group’s overseas entities is USD.
3. SIGNIFICANT ACCOUNTING ESTIMATES AND JUDGEMENTS
In determining the carrying amounts of certain assets and liabilities, the Group makes assumptions of the effects of uncertain future events on those assets and liabilities at the balance sheet date. These estimates involve assumptions about such items as risk adjustment to cash flows or discount rates used, future changes in salaries and future changes in prices affecting other costs. The Group’s estimates and assumptions are based on the expectations of future events and are reviewed periodically. In addition to assumptions and estimations of future events, judgements are also made during the process of applying the Group’s accounting policies.
(a) Reserves
Engineering estimates of the Group’s coal reserves are inherently imprecise and represent only approximate amounts because of the subjective judgements involved in developing such information. Reserve estimates are updated at regular basis and have taken into account recent production and technical information about the relevant coal deposit. In addition, as prices and cost levels change from year to year, the estimate of coal reserves also changes. This change is considered a change in estimate for accounting purposes and is reflected on a prospective basis in related depreciation and amortisation rates.
Despite the inherent imprecision in these engineering estimates, these estimates are used in determining depreciation and amortisation expenses and impairment loss. Depreciation and amortisation rates are determined based on estimated coal reserve quantity (the denominator) and capitalised costs of mining structures and mining rights (the numerator). The capitalised cost of mining structures and mining rights are depreciated and amortised based on the units produced.
(b) Useful lives of property, plant and equipment
Management determines the estimated useful lives of and related depreciation charges for its property, plant and equipment. This estimate is based on the actual useful lives of assets of similar nature and functions. It could change significantly as a result of significant technical innovations and competitor actions in response to industry cycles. Management will increase the depreciation charges where useful lives are less than previously estimated lives, or will write-off or write-down technically obsolete or non-strategic assets that have been abandoned or sold.

7
(c) Impairment of assets
The Group reviews the carrying amounts of the assets at each balance sheet date to determine whether there is objective evidence of impairment. When indication of impairment is identified, management prepares discounted future cashflow to assess the differences between the carrying amount and value in use and provided for impairment loss. Any change in the assumptions adopted in the cash flow forecasts would increase or decreased in the provision of the impairment loss and affect the Group’s net asset value.
In relation to trade and other receivables (including value-added tax (“VAT”) receivables), a provision for impairment is made and an impairment loss is recognised in profit and loss when there is objective evidence (such as the probability of insolvency or significant financial difficulties of the debtor) that the Group will not be able to collect all of the amounts due under the original terms of the invoice. Management uses judgement in determining the probability of insolvency or significant financial difficulties of the debtor.
An increase or decrease in the above impairment loss would affect the net profit in future years.
(d) Obligation for reclamation
The estimation of the liabilities for final reclamation and mine closure involves the estimates of the amount and timing for the future cash spending as well as the discount rate used for reflecting current market assessments of the time value of money and the risks specific to the liability. The Group considers the factors including future production volume and development plan, the geological structure of the mining regions and reserve volume to determine the scope, amount and timing of reclamation and mine closure works to be performed. Determination of the effect of these factors involves judgements from the Group and the estimated liabilities may turn out to be different from the actual expenditure to be incurred. The discount rate used by the Group may also be altered to reflect the changes in the market assessments of the time value of money and the risks specific to the liability, such as change of the borrowing rate and inflation rate in the market. As changes in estimates occur (such as mine plan revisions, changes in estimated costs, or changes in timing of the performance of reclamation activities), the revisions to the obligation will be recognised at the appropriate discount rate.
(e) Recognition of deferred tax assets
Deferred tax assets in respect of unused tax losses and tax credit carried forward and deductible temporary differences are recognised and measured based on the expected manner of realisation or settlement of the carrying amount of the assets, using tax rates enacted or substantively enacted at the balance sheet date. In determining the carrying amounts of deferred assets, expected taxable profits are estimated which involves a number of assumptions relating to the operating environment of the Group and require a significant level of judgement exercised by the directors. Any change in such assumptions and judgement would affect the carrying amounts of deferred tax assets to be recognised and hence the next profit in the future years.
(f) Derivative financial instruments
In determining the fair value of the derivative financial instruments, considerable judgment is required to interpret market data used in the valuation techniques. The use of different market assumptions and/or estimation methodologies may have a material effect on the estimated fair value amounts.
(g) Exploration and evaluation expenditure
The application of the Group’s accounting policy for exploration and evaluation expenditure requires judgement in determining whether it is likely that future economic benefits will flow to the Group. It requires management to make certain estimates and assumptions about future events or circumstances, in particular, whether an economically viable extraction operation can be established. Estimates and assumptions made may change if new information becomes available. If, after expenditure is capitalised, information becomes available suggesting that the recovery of expenditure is unlikely, the amount capitalised is written off in profit or loss in the period when the new information becomes available.
8
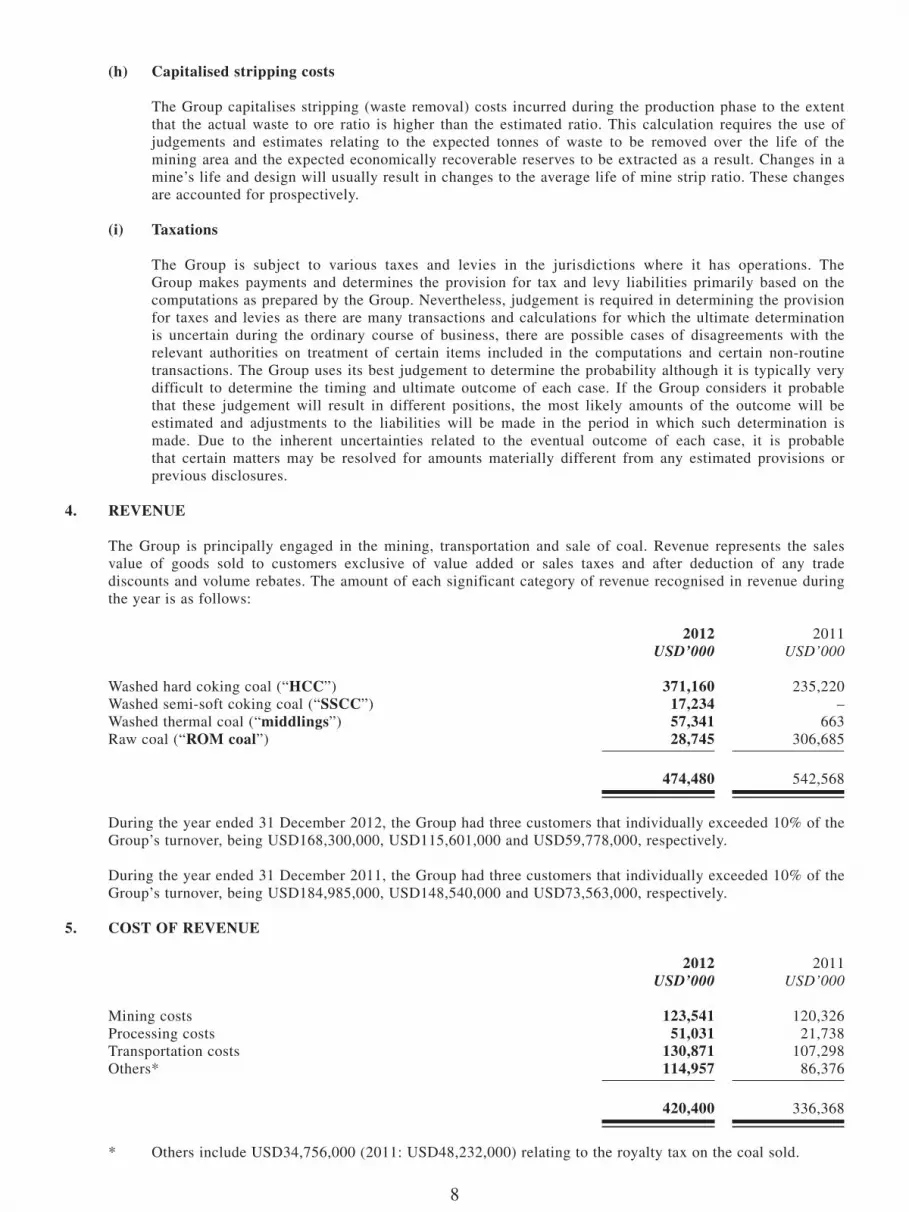
(h) Capitalised stripping costs
The Group capitalises stripping (waste removal) costs incurred during the production phase to the extent that the actual waste to ore ratio is higher than the estimated ratio. This calculation requires the use of judgements and estimates relating to the expected tonnes of waste to be removed over the life of the mining area and the expected economically recoverable reserves to be extracted as a result. Changes in a mine’s life and design will usually result in changes to the average life of mine strip ratio. These changes are accounted for prospectively.
(i) Taxations
The Group is subject to various taxes and levies in the jurisdictions where it has operations. The Group makes payments and determines the provision for tax and levy liabilities primarily based on the computations as prepared by the Group. Nevertheless, judgement is required in determining the provision for taxes and levies as there are many transactions and calculations for which the ultimate determination is uncertain during the ordinary course of business, there are possible cases of disagreements with the relevant authorities on treatment of certain items included in the computations and certain non-routine transactions. The Group uses its best judgement to determine the probability although it is typically very difficult to determine the timing and ultimate outcome of each case. If the Group considers it probable that these judgement will result in different positions, the most likely amounts of the outcome will be estimated and adjustments to the liabilities will be made in the period in which such determination is made. Due to the inherent uncertainties related to the eventual outcome of each case, it is probable that certain matters may be resolved for amounts materially different from any estimated provisions or previous disclosures.
4. REVENUE
The Group is principally engaged in the mining, transportation and sale of coal. Revenue represents the sales value of goods sold to customers exclusive of value added or sales taxes and after deduction of any trade discounts and volume rebates. The amount of each significant category of revenue recognised in revenue during the year is as follows:
2012 2011USD’000 USD’000
Washed hard coking coal (“HCC”) 371,160 235,220Washed semi-soft coking coal (“SSCC”) 17,234 –Washed thermal coal (“middlings”) 57,341 663Raw coal (“ROM coal”) 28,745 306,685
474,480 542,568
During the year ended 31 December 2012, the Group had three customers that individually exceeded 10% of the Group’s turnover, being USD168,300,000, USD115,601,000 and USD59,778,000, respectively.
During the year ended 31 December 2011, the Group had three customers that individually exceeded 10% of the Group’s turnover, being USD184,985,000, USD148,540,000 and USD73,563,000, respectively.
5. COST OF REVENUE
2012 2011USD’000 USD’000
Mining costs 123,541 120,326Processing costs 51,031 21,738Transportation costs 130,871 107,298Others* 114,957 86,376
420,400 336,368
* Others include USD34,756,000 (2011: USD48,232,000) relating to the royalty tax on the coal sold.

9
6. PROFIT BEFORE TAXATION
Profit before taxation is arrived at after charging/(crediting):
(a) Net finance income:
2012 2011USD’000 USD’000
Interest income (20,345) (22,236)Net change in fair value of derivative component of senior notes (7,500) –Foreign exchange gain, net (11,716) –
Finance income (39,561) (22,236)
Interest on bank and other borrowings 20,300 18,403Net change in fair value of derivative component of convertible bond (2,429) (7,863)Interest on liability component of convertible bond 6,766 3,371Interest on liability component of senior notes 41,417 –Transaction costs 3,822 6,495Unwinding interest on – Obligations under finance lease 94 168 – Accrued reclamation obligations 1,070 567Less: Interest expense capitalised (20,046) (9,229)
Net interest expense 50,994 11,912Foreign exchange loss, net – 1,873
Finance costs 50,994 13,785
Net finance costs/(income) 11,433 (8,451)
* Borrowing costs have been capitalised at a rate of 8.5% and 5.2% per annum for the years ended 31 December 2012 and 2011, respectively.
(b) Staff costs:
2012 2011USD’000 USD’000
Salaries, wages, bonuses and benefits 34,718 17,584Retirement scheme contributions 2,602 2,201Equity-settled share-based payment expenses 6,620 1,646
43,940 21,431
Pursuant to the relevant labour rules and regulations in Mongolia, the Group participates in defined contribution retirement benefit schemes (the “Schemes”) organised by the Government of Mongolia (“GoM”) whereby the Group is required to make contributions to the Schemes at a rate of 7% of the eligible employees’ salaries.
The Group has no other material obligation for the payment of pension benefits beyond the annual contributions described above.

10
(c) Other items:
2012 2011USD’000 USD’000
Depreciation and amortisation 47,619 19,370
Provision for impairment losses on trade and other receivables (Note 12) 5,929 4,145
Operating lease charges:Minimum lease payments – hire of plant and machinery 6,046 1,049 – hire of other assets (including property rentals) 1,317 1,107
7,363 2,156
Net losses on disposal of property, plant and equipment 900 438
Auditor’s remuneration – audit services 595 780 – tax and other services 464 154
1,059 934
Cost of inventories# 420,400 336,368
# Cost of inventories includes USD76,208,000 (2011: USD29,961,000), relating to personnel expenses, depreciation and amortisation and operating lease charges which are also included in the respective amounts disclosed separately above for each of these types of expenses.
7. INCOME TAX
(a) Income tax in the consolidated statement of comprehensive income represents:
2012 2011USD’000 USD’000
Current taxProvision for the year – Mongolian Enterprise Income Tax 12,870 49,367
Deferred taxOrigination and reversal of temporary difference (9,687) (13,717)
3,183 35,650
(b) Reconciliation between tax expense and accounting profit at applicable tax rates:
2012 2011USD’000 USD’000
Profit before income tax 641 154,740
Notional tax on profit before taxation (5,170) 35,725Tax effect of non-deductible items (Note (iii)) 2,207 1,508Tax effect of non-taxable items (Note (iv)) (1,035) (2,588)Tax losses not recognised 7,181 1,005
Actual tax expenses 3,183 35,650

11
Notes:
(i) Pursuant to the prevailing income tax rules and regulations of Mongolia, the Group is liable to Mongolian Enterprise Income Tax at a rate of 10% of first MNT3 billion taxable income and 25% of the remaining taxable income for the years ended 31 December 2012 and 2011.
(ii) Pursuant to the rules and regulations of the Cayman Islands, the Group is not subject to any income tax in the Cayman Islands. The Group is not subject to Hong Kong and Luxembourg profits tax as it has no assessable income arising in or derived from Hong Kong and Luxembourg during the years ended 31 December 2012 and 2011.
(iii) Non-deductible items mainly represent the non-deductible expenses and the unrealised exchange losses which are non-deductible pursuant to the income tax rules and regulations of Mongolia during the years ended 31 December 2012 and 2011.
(iv) Non-taxable items mainly represent the unrealised exchange gains which are non-taxable pursuant to the income tax rules and regulations of Mongolia during the years ended 31 December 2012 and 2011.
8. (LOSS)/EARNINGS PER SHARE
(a) Basic (loss)/earnings per share
For the year ended 31 December 2012, the calculation of basic loss per share is based on the loss attributable to equity shareholders of the Company of USD2,542,000 (2011: profit attributable to equity shareholders of the Company of USD119,090,000) and the weighted average of 3,705,036,500 ordinary shares (2011: 3,705,036,500 ordinary shares).
(b) Diluted (loss)/earnings per share
For the year ended 31 December 2012, basic and diluted loss per share are the same as the effect of the potential ordinary shares outstanding is anti-dilutive. For the year ended 31 December 2011, the diluted earnings per share was based on the profit attributable to equity shareholders of the Company of USD114,716,000 and the weighted average of 3,740,633,369 shares in issue during the year ended 31 December 2011.
The convertible bond and equity-settled share-based payment transactions are anti-dilutive and therefore not included in calculating diluted loss per share for the year ended 31 December 2012. The equity-settled share-based payment transactions is anti-dilutive and therefore not included in calculating diluted earnings per share for the year ended 31 December 2011.

12
9. SEGMENT REPORTING
The Group has one business segment, the mining, processing, transportation and sale of coal. The majority of its customers are located in China. Based on information reported to the chief operating decision maker for the purpose of resource allocation and performance assessment, the Group’s only operating segment is the mining, processing, transportation and sale of coal. Accordingly, no additional business and geographical segment information are presented.
10. CONSTRUCTION IN PROCESS
As at 31 December 2012, the carrying amount of railway included in construction in progress amounted to USD60.0 million (2011: USD14.4 million).
On 31 May 2012, the Group entered into a Build-Operate-Transfer Concession Agreement (the “Agreement”) with the Government of Mongolia to build and operate the railway base infrastructure between Ukhaa Khudag coking coal mine and Gashuun Sukhait border check point of Mongolia (the “UHG-GS Railway”). Under the terms of the Agreement, the Group has been granted a right to construct and then operate the UHG-GS Railway for a period up to 19 years from the date of the commissioning of the railway base infrastructure.
On 3 November 2012, the Government of Mongolia discussed at its cabinet meeting the measures to accelerate the implementation of railway network development. The Government resolved to consolidate various railway projects into a unified railway project (the “Project”) to be managed and implemented under government authority and financing with the participation of domestic and foreign investors through jointly established project companies. It also resolved to instruct the Minister of the Road and Transportation to take measure to terminate the Agreement with the Group, to negotiate and agree with the Group regarding the implementation structure of the Project, amount of the investment and its term and, to negotiate regarding the granting of shares by considering the investment costs incurred for the UHG-GS Railway by the Group as an investment to the project company or as the reimbursement.
As at the date of the approval of these financial statements, the negotiation between the Government of Mongolia and the Group regarding the arrangement for the implementation of the above resolutions is still on going and therefore the Agreement has not been terminated yet. Pursuant to the Agreement, if the Agreement is early terminated by the government initiatives, in the event of default of the Government of Mongolia or expropriation by the Government, the Government of Mongolia shall reimburse the Group by the sum of value of the railway base infrastructure, costs incurred, damages caused and potentially lost profits. In this connection, the Group has estimated the reimbursable amount according to the Agreement and according to management judgment that the carrying amount of UHG-GS Railway as at 31 December 2012 amounting to USD60.0 million is recoverable if the Agreement is terminated, no impairment loss has been provided in relation to the railway project.

13
11. INTANGIBLE ASSETS
Acquired mining right
(Note (i))
Operating right paved road
(Note (ii)) TotalUSD’000 USD’000 USD’000
Cost:At 1 January 2011 – – –Addition in relation to the Acquisition 596,557 – 596,557Transfer from construction in progress – 95,817 95,817Exchange adjustments – (8,978) (8,978)
At 31 December 2011 596,557 86,839 683,396
At 1 January 2012 596,557 86,839 683,396
Addition (Note (iii)) 105,000 – 105,000Exchange adjustments – 266 266
At 31 December 2012 701,557 87,105 788,662
Accumulated amortisation:At 1 January 2011 – – –Charge for the year – 2,256 2,256Exchange adjustments – (212) (212)
At 31 December 2011 – 2,044 2,044
At 1 January 2012 – 2,044 2,044Charge for the year 3,110 8,942 12,052Exchange adjustments – (207) (207)
At 31 December 2012 3,110 10,779 13,889
Carrying amount:At 31 December 2012 698,447 76,326 774,773
At 31 December 2011 596,557 84,795 681,352
(i) Acquired mining right represents the mining right acquired during the Acquisition. The amortisation of acquired mining right and operating right of paved road charge for the year is included in “cost of revenue” and “other net income” in the consolidated statement of comprehensive income, respectively. As BN mine has not commenced the commercial production until February 2012, accordingly there was no amortisation related to the acquired mining right during the year ended 31 December 2011.
(ii) According to the Resolution of the GoM dated 31 March 2010 and the Build-Operate-Transfer Agreement signed between the GoM and the Group dated 9 June 2010 (“BOT Agreement”), the GoM granted the Group the land use rights, and to build and operate the paved road running from the mine site to the Mongolia-China border at Gashuun Sukhait (“GS”). Under the terms of the BOT Agreement, the Group will use its own funds to construct the paved road. In return, the Group enjoys an unrestricted use right to possess, use, operate the paved road for 10 years period after commission of the road. The Group will use the road primarily for the purpose of transporting coals from its mine site to the Mongolia-China border at GS, which is the gate to the designated delivery port of the majority of its customers. In addition, the paved road may be opened to public use subject to certain weight restrictions whereupon the Group may direct users. The Group has completed and commissioned the paved road on 6 October 2011.

14
(iii) Pursuant to the Share Purchase Agreement, the Group agreed with the Seller that, 18 months to 21 months from the date of the Share Purchase Agreement, an additional payment would be payable to the Seller or a clawback might be payable by the Seller in the amount of USD3.00 per tonne to the extent that total proved and probable reserves (as defined under the Australian Code for Reporting of Mineral Resources and Ore Reserves) contained in the BN Mine (the “Total Reserves”) exceeded 150,000,000 tonnes or were less than 150,000,000 tonnes, respectively (the “Reserve Adjustment”). Under the Reserve Adjustment, the maximum amount payable to the Seller would be US$105,000,000, consistent with the Seller’s own estimation of Total Reserves being approximately 185,000,000 tonnes based on a report by SRK Consulting (Australasia) Pty Ltd in March 2011.
The Group has, according to the relevant clauses in the Share Purchase Agreement, conducted the additional geological and technical work to verify the estimation of the Total Reserves. In November 2012, it was confirmed that the final Total Reserves as defined in the Share Purchase Agreement was 188,900,000 tonnes and pursuant to the Share Purchase Agreement, the Group shall pay to the Seller an aggregate amount of USD105,000,000 (the “Reserves Adjustment Payment”).
The Reserve Adjustment Payment is highly linked to the results of the independent quantifications of the physical coal reserves by both the Seller and the Group. Given the nature of coal reserves, whose existence is unaffected by the passage of recent time, management views the Reserve Adjustment Payment as consideration for the purchase of additional coal reserves and therefore that the payment is recognised in the consolidated balance sheet on a basis consistent with the right to mine the 150,000,000 tonnes covered by the initial consideration under the Share Purchase Agreement. The amount of USD105,000,000 is therefore recognised as an addition to the acquired mining right.
12. TRADE AND OTHER RECEIVABLES
2012 2011USD’000 USD’000
Trade receivables (Note (a)) 35,819 41,445Other receivables (Note (c)) 178,024 72,022
213,843 113,467
Less: allowance for doubtful debts (Note (b)) (5,929) (4,145)
207,914 109,322
Notes:
(a) Ageing analysis
Trade receivables (net of allowance for doubtful debts) are invoiced amounts due from the Group’s customers which are due from the date of billing. As at 31 December 2012 and 2011, all of the trade receivables are aged within one year.

15
(b) Impairment of trade receivables
Impairment losses in respect of trade receivables are recorded using an allowance account unless the Group is satisfied that recovery of the amount is remote, in which case the impairment loss is written off against trade receivables directly.
The movement in the allowance for doubtful debts during the year is as follows:
2012 2011USD’000 USD’000
At 1 January 4,145 –Provision for impairment losses 5,929 4,145Amounts written off (4,145) –
At 31 December 5,929 4,145
As at 31 December 2012, an allowance for doubtful debts amounting to USD5,929,000 (2011: USD4,145,000) was made on a collective basis in respect of the Group’s trade receivable balances outstanding at the balance sheet date, which have been included in “administrative expenses” in the consolidated statement of comprehensive income.
(c) Other receivables
2012 2011USD’000 USD’000
Amounts due from related parties (Note (i)) 94 455Prepayments and deposits (Note (ii)) 64,598 17,695VAT and other tax receivables (Note (iii)) 83,071 43,697Derivative financial instruments (Note (iv)) 12,420 –Others (Note (v)) 17,841 10,175
178,024 72,022
Notes:
(i) Amount due from related parties are unsecured, interest-free and have no fixed repayment terms.
(ii) At 31 December 2012 and 2011, prepayments and deposits mainly represent the prepayments made to the Group’s mining contractor and fuel supplier.
(iii) VAT and other tax receivables include amounts that have been accumulated to date in certain subsidiaries and were due from the GoM Taxation Authority. Based on current available information, the Group anticipates full recoverability of such amounts.
(iv) It represents the embedded derivative in the senior notes (see Note 14).
(v) At 31 December 2012, this item mainly represents the reimbursement receivables due from Erdenes MGL LLC of USD3.5 million (2011: USD4.5 million) and GoM of USD4.5 million (2011: USD4.5 million) for the construction costs in relation to the expansion project of the border crossing in Mongolian side at GS, which are interest-free. Based on current available information, the Group anticipates full recoverability of such amounts. The remaining other receivables mainly represent the interest income receivable of USD3.1 million for the bank deposits.
All other receivables were aged within one year and expected to be recovered or expensed off within one year.

16
13. TRADE AND OTHER PAYABLES
2012 2011USD’000 USD’000
Trade payables (Note (i)) 45,718 18,523Receipts in advance (Note (ii)) 1,745 9,160Amounts due to related parties (Note (iii)) 14,109 9,560Payables for purchase of equipment 38,706 36,018Security deposit on construction work 2,223 9,259Interest payables 15,271 2,544Other taxes payables 4,152 21,354Promissory notes (Note (iv)) 105,000 –Others (Note (v)) 20,133 12,262
247,057 118,680
Notes:
(i) All trade payables are due and payable on presentation or within one month.
(ii) Receipts in advance represent payments in advance made by third party customers in accordance to the terms set out in respective sales agreements.
(iii) Amounts due to related parties represent management service fee payable and payables for equipment and construction work, which are unsecured, interest-free and have no fixed terms of repayments.
(iv) On 27 November 2012, the Group entered into an agreement (the “Settlement Agreement”) with the Seller setting out the settlement arrangement of the Reserves Adjustment Payment (see Note 11(iii)). Pursuant to the Settlement Agreement, the Reserves Adjustment Payment will be settled by the issuance of two promissory notes by the Company to QGX Holdings Ltd., each in the amount of US$52,500,000 (each, an “Adjustment Promissory Note”), and each Adjustment Promissory Note shall bear interest at a rate per annum equal to 3.0% commencing on the issue date to the maturity date. The Company shall pay the amount under each Adjustment Promissory Note to QGX Holdings Ltd. on a maturity date which is 360 calendar days from the issue date. Both Adjustment Promissory Notes were issued on 27 November 2012.
(v) Others represent accrued expenses, payables for staff related costs and other deposits.
All of the other payables and receipts in advance are expected to be settled or recognised in profit or loss within one year or are repayable on demand.
17
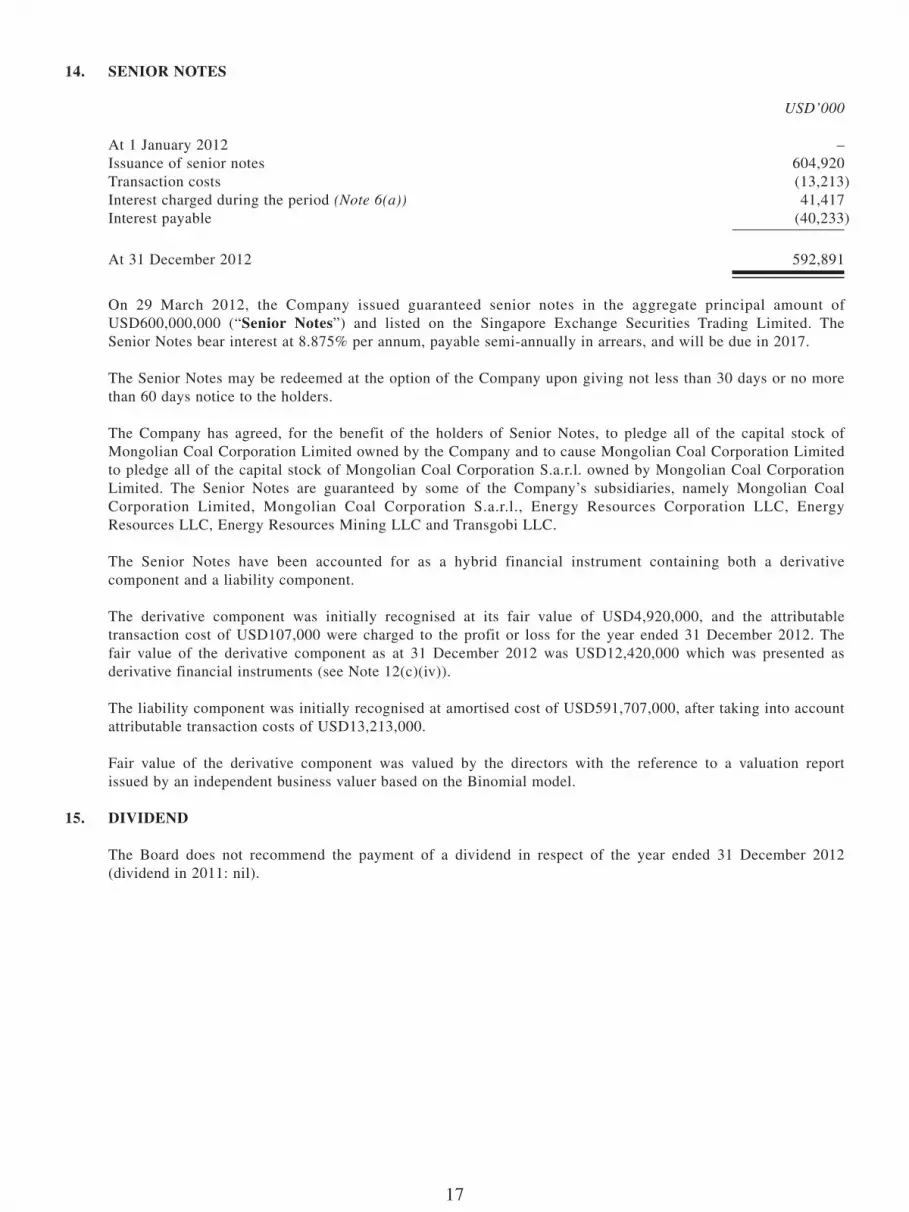
14. SENIOR NOTES
USD’000
At 1 January 2012 –Issuance of senior notes 604,920Transaction costs (13,213)Interest charged during the period (Note 6(a)) 41,417Interest payable (40,233)
At 31 December 2012 592,891
On 29 March 2012, the Company issued guaranteed senior notes in the aggregate principal amount of USD600,000,000 (“Senior Notes”) and listed on the Singapore Exchange Securities Trading Limited. The Senior Notes bear interest at 8.875% per annum, payable semi-annually in arrears, and will be due in 2017.
The Senior Notes may be redeemed at the option of the Company upon giving not less than 30 days or no more than 60 days notice to the holders.
The Company has agreed, for the benefit of the holders of Senior Notes, to pledge all of the capital stock of Mongolian Coal Corporation Limited owned by the Company and to cause Mongolian Coal Corporation Limited to pledge all of the capital stock of Mongolian Coal Corporation S.a.r.l. owned by Mongolian Coal Corporation Limited. The Senior Notes are guaranteed by some of the Company’s subsidiaries, namely Mongolian Coal Corporation Limited, Mongolian Coal Corporation S.a.r.l., Energy Resources Corporation LLC, Energy Resources LLC, Energy Resources Mining LLC and Transgobi LLC.
The Senior Notes have been accounted for as a hybrid financial instrument containing both a derivative component and a liability component.
The derivative component was initially recognised at its fair value of USD4,920,000, and the attributable transaction cost of USD107,000 were charged to the profit or loss for the year ended 31 December 2012. The fair value of the derivative component as at 31 December 2012 was USD12,420,000 which was presented as derivative financial instruments (see Note 12(c)(iv)).
The liability component was initially recognised at amortised cost of USD591,707,000, after taking into account attributable transaction costs of USD13,213,000.
Fair value of the derivative component was valued by the directors with the reference to a valuation report issued by an independent business valuer based on the Binomial model.
15. DIVIDEND
The Board does not recommend the payment of a dividend in respect of the year ended 31 December 2012 (dividend in 2011: nil).

18
MANAGEMENT DISCUSSION AND ANALYSIS
In 2012, the Group continued to implement its strategy of creating a fully integrated coking coal mining, processing, transportation and marketing platform. As a result, the Group solidified its position as the largest coal producer and exporter of washed coking coal in Mongolia. According to data issued by the National Statistical Office (“NSO”) of Mongolia, the Group exported approximately 5.6 million tonnes of coal products in 2012, representing around 26.9% volume share in the Mongolian total coal exports (2011: 4.8 million tonnes and 22.7%, respectively).
This strategy has enabled the Group to produce and sell washed coal products under its own brand name, further strengthening its position as a reliable supplier of high quality coking coal products, expanding its end-user customer base, and boosting its competitiveness in the international market.
The Chinese market remains the Group’s primary destination for its coal products, and the Group has continued to strengthen relations with its Chinese end-user customers. In addition, the Group began to explore diversification opportunities and has successfully delivered initial bulk shipments of its HCC to customers at seaborne market such as Japan, India and Taiwan.
In line with the Group’s long-term vision to diversify its business portfolio by transforming from a single asset company to a multiple asset based operations, BN mine launched its commercial mining operations in February 2012. The Group believes that the close proximity of the Ukhaa Khudag (“UHG”) and the BN mines provides a unique opportunity for synergic development. The sharing of coal handling and processing facilities, increased utilisation of coal transportation and logistics infrastructure, joint functional and operational management and marketing platform are expected to reduce the requirements for operating costs and the capital expenditure for development.
The Group’s current coal handling and processing annual capacity has reached 10.0 million tonnes and is scheduled to reach 15.0 million tonnes with the expected commissioning of the third module in the first half of 2013.
In March 2012, the Group successfully issued the Senior Notes. This enabled the Group to maintain its cash position under challenging market conditions and support the major production and infrastructure developments it had planned.
INDUSTRY OVERVIEW
Chinese steel sector performance
The global economy in 2012 went through a challenging period amid a slower than expected recovery in the USA and the uncertainty linked to the European sovereign debt crisis. Affected by declines in the export sector, and also by the Chinese government’s continuation to tighten policies designed to curb inflation in the property sector, the Chinese domestic economic growth rate slowed down to 7.4% in the third quarter of last year and stood at 7.9% as at the end of 2012 compared to 8.9% reported in the fourth quarter of 2011.

19
According to a report from the Ministry of Industry and Information Technology (“MIIT”) and the National Bureau of Statistics of China (“NBSC”), China produced 716.5 million tonnes of crude steel in 2012, up by 3.1% over the previous year; 657.9 million tonnes of iron, up by 3.7%; and 951.9 million tonnes of steel, up by 7.7%. Compared with the previous year, the growth rates of these three products fell by 4.2%, 4.7% and 2.2% points, respectively.
As a reflection of the overall economic situation and market conditions in the Group’s principal market, China’s major steel companies reported a sharp drop in profits in 2012, impacted by weak demand amid an economic slowdown. China Iron and Steel Association (“CISA”) reported that 80 medium-to-large steel makers realised a combined total profit of RMB1.6 billion in 2012, reflecting a decline of 98.2% year-on-year. Moreover, 23 out of these 80 major steel makers still suffered a combined total loss of RMB28.9 billion, representing a loss of 7 times greater than the one incurred by 8 steel makers in 2011.
Besides weaker demand, the long-existing overcapacity is one of the main factors hampering the Chinese steel industry’s profitability according to the CISA. The overcapacity capped steel prices in the environment characterised by weaker demand and growth, thus limiting steel mills’ ability to accept higher prices for steel making material, including coking coal, in 2012.
Chinese coking coal imports and Mongolian coking coal exports dynamics
The global coking coal trade dynamics in 2012 was largely impacted by the falling demand in North America and Europe and also stagnating consumption from Asian countries like Japan, China, India and South Korea. However, at the same time, Australian mining companies began returning to full production capacity after recovering from damage caused by flooding in Queensland in 2011. This oversupply subsequently led to a decline in seaborne coking coal prices, particularly in the second half of 2012.
Due to this situation, Chinese coking coal consumers increased import volumes, particularly the steel mills located in the coastal area which took advantage of weak seaborne prices for coking coal, as well as better and cheaper logistics. According to Chinese customs clearance statistics, China imported around 53.6 million tonnes of coking coal in 2012 compared to 44.7 million tonnes imported in 2011, representing 19.9% increase year-on-year.
In terms of demand, the apparent consumption of coking coal in China has fallen in line with the slower growth of steel production and the de-stocking and reduction of inventory levels by coke and steel producers. The discounts for lower grade coking coal have increased and as such, the market for inferior grades of coking coal has become very challenging, even forcing some lower grade coking coal into the thermal coal market as an alternative consumption.
However, following the market correction, Chinese coking coal reported inventories reaching normalised levels from the fourth quarter of 2012, and re-stocking activities are expected to positively influence coking coal prices in the short-term (Figure 1). In the mid to long-term, coking coal prices will be driven by improving global economic conditions and the successful implementation of the Chinese government’s policies which should maintain a sustainable growth rate.

20
Figure 1. Chinese coking coal stockpile levels and HCC pricing
-200 400 600 800 1,000 1,200 1,400 1,600
5.25
5.75
6.25
6.75
7.25
7.75
Apr
-11
May
-11
Jun-
11
Jul-1
1
Aug
-11
Sep-
11
Oct
-11
Nov
-11
Dec
-11
Jan-
12
Feb-
12
Mar
-12
Apr
-12
May
-12
Jun-
12
Jul-1
2
Aug
-12
Sep-
12
Oct
-12
Nov
-12
Dec
-12
China coking coal inventory (million tonnes)
HCC price at Tangshan (VAT inclusive, RMB/tonne)
Source: China Coal Resource
According to MIIT, Chinese crude steel production is expected to rise by 4.6% in 2013 to a record of 750.0 million tonnes. China is the world’s largest steel producer, and Chinese crude steel output reached 716.5 million tonnes in 2012, representing a 3.1% increase year-on-year. This is the second-slowest growth rate recorded after a 1.8% decline in 2008 following the global financial crisis. Crude steel production is likely to be boosted by the expected approvals of many mega-infrastructure projects in sectors such as hydro and nuclear power, dams, railways and rural city construction. These projects are also expected to increase the demand for coking coal, one of the main components in steel production.
In addition, the Japanese economy is also expected to forge ahead after the newly elected government announced its USD265 billion economic stimulus measures. As this package is primarily aimed at supporting investments in infrastructure and export oriented industries, including ship-building and car-making, it is expected to have a positive impact on the Japanese steel consumption and as such, influence the demand for coking coal at the seaborne market.
China has more than 12,000 coal mines and domestic production in the country, which reached 3.7 billion tonnes in 2012, up by 4.0% compared to the previous year. The clampdown on the country’s notoriously unsafe and polluting coal industry has been one of the main drivers for increased coal imports. In 2012, China imported 234.3 million tonnes of coal which constituted a significant increase of 28.7% over the previous year. China’s State Administration of Work Safety is planning to close roughly 5,000 small mines in 2013 in its continuing efforts to improve safety in the mines. Moreover, it will no longer approve new coal mines that do not meet production capacity requirements in 2013 in order to ensure work safety. High-gas coal mines with an annual production of less than 300,000 tonnes, as well as coal and gas outburst mines with an annual production of less than 450,000 tonnes, will not be approved. In 2012, China shut down 628 medium sized coal mines, improved technological processes of 622 mines, merged 388 mines and phased out 97.8 million tonnes of outdated production facilities.

21
Effective from 1 January 2013, China is annulling a 40% export tax on metallurgical coke exports. Traditionally, China has been a major exporter of metallurgical coke, but the exports plunged after they imposed the tax in 2008 and it was about 1.0 million tonnes in 2012 amid the curbs, from an annual average of 15 million tonnes between 2000 and 2007. However, the abolishment of the 40% export tax under World Trade Organisation regulations is expected to rekindle demand for coking coal as a feed material. Under the changed tax regime it is expected that an additional demand of 20.0 million tonnes will be generated by China.
As reported by the NSO and the Mongolian Customs General Administration (“Mongolian Customs”), Mongolian coal exports (including lignite) reached approximately 20.9 million tonnes in 2012 compared to 21.1 million tonnes in 2011. Moreover, the number of mines producing and exporting more than 100 thousand tonnes of coal in the year increased from 6 to 9, including the Group’s UHG and BN mines.
In the first half of 2012, Mongolian coal exports still have shown a relatively robust year-on-year increase of around 33.8% but the majority of coal exporters temporarily halted and/or limited their coal export shipments in the third quarter amid weak demand and low pricing. Since prices bottomed in September, as shown in the graph below, coal export shipments then began picking up accordingly in the last quarter of 2012 (Figure 2).
Figure 2. Mongolian monthly coal export volumes in 2012
649
984
1,687 1,915
2,443 2,466
887 1,030
1,947
2,250 2,322
1,948
-
500
1,000
1,500
2,000
2,500
3,000
Jan Feb Mar Apr May Jun Jul Aug Sep Oct Nov Dec
Mongolian Coal Exports in 2012 (’000 tonnes)
Source: NSO and Mongolian Customs
Moreover, as detailed in Table 1, with its exports accounting for approximately 35.7% volume share in the total Chinese coking coal imports, Mongolia still preserved its position as the largest supplier of coking coal to China, albeit a decline compared to the 44.7% volume share reported in 2011.

22
Table 1. China’s coking coal import volumes by country of origin (in million tonnes)
For the year ending 31 December2012 2011 Change
%
Total 53.5 44.7 19.7%Mongolia 19.1 20.0 (4.5%)Australia 14.0 10.3 35.9%Canada 7.2 3.2 125.0%Russia 4.8 3.7 29.7%United States 4.5 4.3 4.7%
Source: China Coal Resource
OPERATING ENVIRONMENT
Legal framework
Major regulatory changes passed and implemented by the Mongolian Parliament in 2012 included the approval of the Law on Regulation of Foreign Investment in Business Entities which Operate in Sectors of Strategic Importance (“Foreign Investment Regulation Law”) and amendments made in the Environmental Laws.
On 17 May 2012, the Parliament of Mongolia passed the Foreign Investment Regulation Law and this came into effect on the same date. Pursuant to the Foreign Investment Regulation Law, the sectors of strategic importance include the mineral, banking and finance, media and communication sectors.
Pursuant to Article 6.1, transactions involving privately-owned foreign investors will require the approval of the GoM, if as a result of such transactions a foreign entity will acquire 33% or more of the shares in a business entity operating in a sector of strategic importance. Also, the GoM approval will be required regardless of the percentage of equity interest, if as a result of a proposed transaction and acquisition of an interest in a business entity operating in the sector of strategic importance, a foreign investor has the right to the following:
– Solely appoint the executive management or a majority of the board and veto decisions of the executive management or board of directors;
– Determine or implement management decisions and/or operations;
– May potentially give rise to a monopoly (to either the seller or buyer) over mineral products on international or domestic commodity markets; or
– May directly or indirectly influence the market conditions or the pricing for mineral products exported from Mongolia.
Any acquisition or operations by a state-owned foreign investor or by an international organisation will require an approval of the GoM.

23
Moreover, as defined by Article 3.7, if foreign investments in such business entities exceed 49% and the transaction value exceeds the threshold of MNT100 billion (equivalent to USD75 million at current exchange rate), Parliament approval for such investment by any foreign entity is required.
The exact details of the approval procedure will be determined by the GoM. However, the Foreign Investment Regulation Law defines that a foreign investor wishing to enter into a transaction to which this law applies, must first make a request for approval to the relevant government agency. The agency must submit its proposal to the GoM on whether to grant approval within 45 days of receipt, and in turn the GoM has 45 days to make a final decision on whether to approve the transaction. Within 5 days after the GoM decision is made, the agency must inform the applicant about the final outcome.
As a majority Mongolian owned company, the Group understands that the Foreign Investment Regulation Law which has become effective from 17 May 2012 does not retrospectively apply and as such does not impact the Group’s operations.
On 17 May 2012, the Parliament of Mongolia also amended a number of environmental laws, such as the Law on Environmental Resource Utilisation Fee and the Law on Environmental Impact Assessment, whose amendments came into effect on 22 June 2012.
In accordance with the changes, the water utilisation cost is expected to increase in the future. Pursuant to the amendment, the water utilisation fee will be calculated based on the eco-economic value of the water. For underground water utilised by mining and mineral resource processing entities, the exact fee percentage will range from 20% to 60% of the eco-economic value of the water. However, any such water reused for industrial operations will be made exempt from the water utilisation fee.
On 2 November 2012, the Parliament approved the Law on Termination of the Laws on Ratification of Intergovernmental Conventions for Avoidance for Double Taxation and the Prevention of Fiscal Evasion with Respect to Taxes on Income and Capital made with Luxembourg, the Netherlands, the United Arab Emirates and Kuwait. These laws will trigger termination clauses of these Conventions which could have a potential impact on taxation applied for dividends paid by Mongolian registered entities to their respective holding companies in the above mentioned jurisdictions commencing in the second half of 2013 or the beginning of 2014.
In December 2012, the President’s Office of Mongolia developed draft amendments to the Mining Law and released it to the public for discussion. The main focus of this draft law is to encourage and enhance the involvement of local communities to participate more effectively in investment decisions and benefits arising from mine development. It also includes measures to tighten environmental protections and minimise challenges associated with the environmental impact of exploration and mining activities. To date the draft Mining Law is still under stakeholder consultations initiated by the President’s Office of Mongolia and no information has been released to the public on the timing of its submission to the Parliament for review and approval.
Political landscape
Since the country’s transition to democracy and a free market economy in the early 90’s and its first multi-party parliamentary elections held in 1990, Mongolians voted in their seventh parliamentary election on 28 June 2012 which was the main political event which has occurred in the country in the reporting period.

24
More than 550 candidates and 15 political parties and coalitions competed in this nationwide election for 76 seats of the State Great Khural, the Parliament of Mongolia. According to the Election Law, 48 mandates in 26 election districts were filled according to the most popular votes for individual candidates as a party/coalition nominees or independents. The remaining 28 seats, meanwhile, were filled based on the party/coalition preference voting totals nationwide, and with a 5% threshold implied to enter the Parliament.
As declared by the Election General Committee, the Democratic Party won 31 seats, the Mongolian People’s Party won 25 and the Justice Coalition won 11, and the Civil Will-Green Party won two. Three independent candidates also succeeded in getting elected. Of the four remaining seats, re-elections are expected for two mandates due to the failure of the candidates to achieve the more than 28% popular-vote threshold as stipulated by the law, and the final two seats were under dispute and were sent to the court for review.
Currently, out of the total 76 seats, 74 Parliament members have taken their oaths of office and have officially begun their terms in the newly elected Parliament. Re-elections are expected for one of the remaining mandates, and the final mandate is still under dispute and awaiting the final outcome of judicial review.
The majority in the Parliament was formed by the Democratic Party, Justice Coalition and Civil Will-Green Party representatives.
Mr. Enkhbold Zandaakhuu from the Democratic Party was elected as a Chairman of the State Great Khural (Speaker of the Parliament), and Mr. Altankhuyag Norov, Chairman of Democratic Party, was appointed as the Prime Minister of Mongolia by securing majority support in the Parliament.
BUSINESS OVERVIEW
Coal resources, reserves and exploration activities
Ukhaa Khudag (UHG) deposit
The Group’s UHG licensed area covers an area of approximately 2,960 hectares. Over the last four years (2009-2012), the Group’s geological team has conducted extensive exploration activities at the UHG deposit with the following objectives in mind:
– To define oxidation limits for mine-planning purposes by determining the locations of any oxidised coal to be mined as thermal coal;
– To undertake close-spaced (50m x 50m) open-hole drilling and geophysical logging prior to mining so as to determine localised geological structures for future short and mid-term mine planning purpose;
– To undertake close-spaced (100m x 100m) core drilling to produce coal samples for testing and analysis for key quality parameters such as but not limited to moisture, ash, volatile matter, sulphur and phosphorous content, calorific value, caking index (G), crucible swelling number (CSN), and Sapozhnikov plastometer indexes (X and Y);
– To prove the general initial observation that the coal has actual lower in-situ ash content than was predicted by the original geological model;

25
– To produce a bulk sample of the Seam 0 plies and a number of additional seams in the western section of the deposit so as to enable coking coal sections to be identified and to explore blending possibilities that may produce HCC products; and
– To complete a 2D seismic program to identify the continuity of coal seams and potential fault areas impacting the mining methodology and development schedules.
Approximately 166,385 meters of drilling was carried out during this period of exploration with 1,435 boreholes completed and geophysical logged. The laboratory test work was also carried out on a total 32,556 analytical coal samples collected.
The Group collaborated with Velseis Processing Pty Ltd (“Velseis Processing”) to interpret data collected from 71 kilometers (“km”) of a high resolution 2D seismic in-field measurement program, which was carried out by Polaris Seismic International Ltd and used to identify coal seams continuity and structure, as well as to obtain new, valuable information on the potential of the deposit’s underground resources.
Finally, a large-diameter, bulk-sample drilling program has been completed on the Seam 0 plies and a number of additional seams in the western section of the deposit, and the samples gathered have been analysed by ALS Laboratories in Mongolia for washability and metallurgical testing. All this exploration data was used to update the geological and coal quality model, and hence the JORC-compliant resource estimates as at 30 June 2012.
An independent peer audit was conducted by Mr. Todd Sercombe from GasCoal Pty Ltd which confirmed the compliance of the Group’s work carried out to update the UHG geological model, thus JORC-compliant estimates for coal resources, estimated on an air-dry basis (Table 2).
Table 2. The updated UHG coal resources by depth and category (in million tonnes) as at 30 June 2012
Total Coal Resources Resources Category (air-dry basis)Depth Limits Measured Indicated Inferred Total
(M+I)Total
(M+I+I)
From -100m to subcrop 114.3 55.3 26.2 169.6 195.8From -200m to -100m 93.5 55.2 25.8 148.7 174.5From -300m to -200m 80.1 51.0 16.8 131.1 147.9From -400m to -300m 49.7 33.2 11.4 82.9 94.3Below -400m 41.8 34.3 12.2 76.1 88.3
Sub-Total above -300m 287.9 161.5 68.8 449.4 518.2Sub-Total below -300m 91.5 67.5 23.6 159.0 182.6
Total 379.4 229.0 92.4 608.4 700.8

26
Based on air-dry raw coal qualities, seam groups were defined as a coal with moderate-high coking potential or coal with low coking potential. For above 300m to base of weathering 373.3 million tonnes of coal with moderate-high coking potential was estimated; 196.2 million tonnes in measured category, 130.6 million tonnes in indicated category, and 46.5 million tonnes in inferred category respectively. In addition, 145.1 million tonnes of coal resources were determined as a coal with low coking potential; 91.8 million tonnes in measured category, 31.0 million tonnes in indicated category, and 22.3 million tonnes in inferred category respectively.
For coal resources located below 300m depth limit, 105.3 million tonnes of coal with moderate-high coking potential was estimated; 56.8 million tonnes in measured category, 38.4 million tonnes in indicated category, and 10.1 million tonnes in inferred category respectively. In addition, 77.1 million tonnes of coal resources were determined as a coal with low coking potential; 34.6 million tonnes in measured category, 29.0 million tonnes in indicated category, and 13.5 million tonnes in inferred category respectively.
According to a previous JORC-compliant reserve report prepared by Norwest, the UHG deposit had 275.0 million tonnes of proven and probable coal reserves estimated as at 31 December 2011. The updated geological model will serve as a base to update the Group’s long-term mining schedule at UHG mine and hence the preparation of the updated JORC-compliant reserve estimation for UHG mine, with expected completion in the first half of 2013 (Note).
Note: Technical information in UHG coal resources estimation report has been compiled by Mr. Gary Ballantine, Executive General Manager for Exploration and Geology, Mongolian Mining Corporation. Mr. Ballantine is a member of the Australasian Institute of Mining and Metallurgy (Member #109105) and has over 22 years of experience relevant to the style and type of coal deposit under consideration and to the activity which is being undertaken to qualify as a Competent Person as defined by the Australasian Code for Reporting of Minerals Resources and Reserves (JORC) 2004. Mr. Ballantine consents to the inclusion in the release of the matters based on this information in the form and context in which it appears. The estimates of the Coal Resources presented in this report are considered to be a true reflection of the UHG coal resources as at 30 June 2012 and have been carried out in accordance with the principles and guidelines of the Australian Code for Reporting of Coal Resources and Coal Reserves published in September 2004 (JORC Code).
Baruun Naran (BN) deposit
In June 2011, the Group acquired the entire issued capital of Baruun Naran Limited (formerly QGX Coal Limited), which ultimately owns the BN mine (see Note 1). The Group’s mining license for the BN mine covers an area of approximately 4,482 hectares. McElroy Bryan Geological Services Pty Ltd prepared the geological model for the BN mine in February 2010 in accordance with JORC standards.
As part of the due diligence completed for the purchase of the BN mine, in 2011, 73.5 km of a 2D seismic program was completed to confirm known structures and to identify unknown structures, if they were present, and to confirm continuity of the seam. Polaris Seismic International Ltd completed the survey and Velseis Processing interpreted the seismic. With this new information and the start of mining activities during 2012, McElroy Bryan Geological Services Pty Ltd was commissioned to update the BN JORC-compliant resources as at 30 June 2012. This was determined to be 281.7 million tonnes of JORC compliant measured, indicated and inferred coal resources, based on an in-situ density calculated for a 6% moisture content (Table 3).

27
Table 3. BN coal resources by depth and category (in million tonnes) as at 30 June 2012
Total Coal Resources Resources Category (as at 6% moisture)Depth Limits Measured Indicated Inferred Total
(M+I)Total
(M+I+I)
From -100m to subcrop 45.0 9.0 – 54.0 54.0From -200m to -100m 65.5 15.1 – 80.6 80.6From -300m to -200m 57.9 19.0 – 76.9 76.9From -400m to -300m 40.2 29.5 0.5 69.7 70.2Below -400m – – – – –
Sub-Total above -300m 168.4 43.1 – 211.5 211.5Sub-Total below -300m 40.2 29.5 0.5 69.7 70.2
Total 208.6 72.6 0.5 281.2 281.7
Based on the coal seams determined by SRK Consulting to be either coking or thermal coal in the reserve estimate, the split between coking and thermal coal resources is 152.4 million tonnes as coking coal and 129.3 million tonnes as thermal coal.
In March 2011, SRK Consulting completed a reserve estimation report for the BN mine, identifying 185.3 million tonnes of open-pit mineable, JORC-compliant proven and probable coal reserves. In November 2012, the independent technical study outcomes confirmed the final total reserve quantities as defined in the Share Purchase Agreement.
The Company anticipates this reserve estimate may change as it has begun to conduct its own studies and analyses for the future development of the BN mine in synergy and conjugation with the UHG mining schedule and development, with the aim of preparing a combined life-of-mine mining study and hence the preparation of updated JORC-compliant reserve estimation for BN mine with expected completion in the first half of 2013 (Note).
Note: Technical information in BN coal resources estimation report has been compiled by Mr. Paul Harrison, Senior Geologist, McElroy Bryan Geological Services Pty. Ltd. Mr. Harrison is a member of the Australasian Institute of Mining and Metallurgy (Member #110251) and has over 25 years of experience relevant to the style and type of coal deposit under consideration and to the activity which is being undertaken to qualify as a Competent Person as defined by the Australasian Code for Reporting of Minerals Resources and Reserves (JORC) 2004. Mr. Harrison consents to the inclusion in the release of the matters based on this information in the form and context in which it appears. The estimates of the Coal Resources presented in this report are considered to be a true reflection of the BN coal resources as at 30 June 2012 and have been carried out in accordance with the principles and guidelines of the Australian Code for Reporting of Coal Resources and Coal Reserves published in September 2004 (JORC Code).

28
Production and transportation
Coal mining and processing
The Group continued with ramping up its coal mining operations at UHG mine and started its coal mining operations at BN mine in February 2012 after being given official mining permission from the relevant Mongolian government authorities on 30 January 2012.
In 2012, the Group’s combined ROM coal production at the UHG and BN mines reached approximately 9.4 million tonnes, representing an approximate 32.4% increase year-on-year. The ROM coal output was adjusted to match the Coal Handling and Preparation Plant (“CHPP”) ROM coal in-feed rates, whilst maintaining appropriate in-pit and ROM stockpile inventories to allow sustainable CHPP operation progressing with overburden removal as scheduled (Figure 3).
Figure 3. Historical annual ROM coal production volume (in thousand tonnes) and stripping ratio (bcm/tonne)
1,841 3,934
7,077 8,598
822
3.42
5.06 5.16 5.63
-
1.00
2.00
3.00
4.00
5.00
6.00
-
2,000
4,000
6,000
8,000
10,000
12,000
2009 2010 2011 2012
UHG mine BN mine Stripping ratio (bcm/tonne)
Combined ROM production targets for 2012 were strategically reduced in response to the slowed demand and reduced sales prices experienced in the second half of 2012. Mining capacity was directed to continue with overburden removal, allowing exposure of inventory in situ once ROM stockpiles had reached suitable levels, avoiding undue costs of re-handling and positioning inventories to enable response to market improvements.
In line with the Group’s development objectives, the total annual processing capacity was increased to 10.0 million tonnes by the successful commissioning of the CHPP second module and as such, significantly increased the processed coal output in 2012. Under its synergic development strategy, the Group’s CHPP based at UHG site with all necessary utility infrastructure facilities will be processing ROM coal from both operating mines.
In 2012, the Group’s total processed ROM coal volume reached approximately 7.4 million tonnes, representing an increase of around 196.0% year-on-year, and produced 5.5 million tonnes of marketable product, representing a total of 74.5% combined processing yield (Figure 4).

29
CHPP washed around 7.0 million tonnes of UHG ROM coal to produce around 3.7 million tonnes of HCC with 51.9% primary product yield and 1.6 million tonnes of middlings with 22.9% secondary product yield; washed around 0.4 million tonnes of BN ROM coal to produce around 0.2 million tonnes of SSCC with 62.5% primary product yield.
Figure 4. Historical semi-annual total and primary processed coal production volumes (in thousand tonnes)
132
1,852 2,104
3,435
-
500
1,000
1,500
2,000
2,500
3,000
3,500
4,000
1H 2011 2H 2011 1H 2012 2H 2012
Primary Product (’000 tonnes) Total Product (’000 tonnes)
90
1,530 1,545 2,354
The Group continued with the planned expansion of its coal processing capacity with construction of the third CHPP module. The construction of the third module was virtually completed by the end of 2012 and the commissioning is expected to take place in the first half of 2013. Once complete, this will expand the Group’s total coal processing annual capacity to 15.0 million tonnes starting from the second half of 2013.
Transportation and logistics
After continuous improvements to the Group’s transportation infrastructure over the last couple of years, the Group was able to conduct full year-round operations of its 245-km paved road and 300 units of double-trailer trucks in 2012, which resulted in the increased availability and utilisation of the Group’s own truck fleet as well as the improved safety and efficiency of the transport operations of the Group.
In 2012, the Group built and maintained a full capacity to handle and transport about 12 million tonnes per annum of coal which was sufficient to handle and move products from the UHG and BN mines to the Ganqimaodu (“GM”) border port in China via its coal handling, custom bonded stockpile facility at Tsagaan Khad (“TKH”) on the Mongolian side of the border.

30
In 2012, with the aim of maximising asset utilisation under its own direct control, the Group put a primary focus on maximising the utilisation of its own 300 double-trailer heavy haul trucking fleet for coal transportation from the UHG mine to TKH. As a result, the Group’s own fleet has transported a total of 4.1 million tonnes of coal or 70.7% of total cargo on its main long-haul section between UHG and TKH, representing a more than threefold increase compared to 1.2 million tonnes of coal or 22.6% in 2011. With this achievement, the Group has significantly reduced its dependency on third party contractors, greatly improved the operational efficiency of its own fleet and effectively maintained cost control on its main long-haul operations between UHG-TKH. At the same time, the Group maintained a third party contracted fleet of trucks to deliver the remaining amount of coal, which accounted for a minor portion and had less impact on capacity and the reliability of transport operations.
However, for cross-border transportation from TKH to GM in 2012, the Group continued to utilise a third party contractors fleet, and as such the Group’s own fleet has transported approximately 0.4 million tonnes of coal or 7.3% of total cargo on the short-haul section between TKH and GM in 2012, maintaining a comparable level compared to 0.4 million tonnes or 8.3% in 2011. Furthermore, to strengthen its trucking operations, in October 2012, the Group successfully completed a 4,300 square meters new truck maintenance and repair workshop with the capacity to service 5 trucks per day which is dedicated to supporting its own double-trailer truck fleet.
In 2012, the 245-km paved road between UHG and GS border checkpoint in Mongolia served as the primary infrastructure for the Group relating to the transport and delivery of its products. The road supported the Group in achieving significant improvement in transportation reliability and efficiency, and the Group also let a number of third party coal and other freight movements on the road via a toll fee arrangement, set under the BOT Agreement for 10 years. The operations, maintenance and amortisation costs of the paved road are partially offset by toll fee revenue generated from third party cargo on commercial terms in accordance with conditions stipulated in the BOT Agreement entered into between the GoM and the Group in May 2010. Moreover, the Group completed construction of a 32-km paved road between BN and UHG mines (“BN-UHG Road”) in October 2012 which has full capacity to support the interconnected operations of its two mines. The BN-UHG Road will serve as a reliable connection for transporting coal from the BN mine to the coal processing facilities at the UHG mine.
The Group jointly co-funded and executed the expansion of the GS border checkpoints with Erdenes MGL LLC, commissioned in January 2012. This investment has increased the annual border-crossing capacity at GS to an estimated 25-30 million tonnes. This provides sufficient capacity to eliminate bottlenecks on the Mongolian side of the border and support the Group’s growth objectives.
Coal inventories
The Group maintains coal inventories in connection with its coal mining, processing, and transportation operations.
The raw coal extracted from the UHG mine is either directly fed to the CHPP for processing, or stockpiled for appropriate CHPP feed blend scheduling at a later date or loaded out for raw coal sale pending coal quality. The raw coal extracted from the BN mine is stockpiled at ROM stockpile at the BN site, and later loaded-out for raw coal sales or transported from the BN mine to UHG site and stockpiled as CHPP feed ahead of processing (Table 4).

31
Table 4. Opening and closing surveyed ROM coal inventories at UHG and BN
As at December 312012 2011 Change
’000 tonnes ’000 tonnes %
ROM coal inventory at UHG site 2,142 1,246 71.9%ROM coal inventory at BN site 321 – NA
ROM coal inventory total 2,463 1,246 97.7%
The coal products produced by CHPP are stockpiled at product stockpile at UHG site and simultaneously loaded-out for transportation. Therefore, the coal product inventory levels at the UHG site are kept at very low level and as of 31 December 2012 it had only accumulated around 43 thousand tonnes of HCC.
The vast majority of the Group’s coal products are transported to and stockpiled at the coal handling facility in the TKH until they are loaded-out and cleared through customs control in Mongolia for the export shipments directly to the delivery point at GM, China (Table 5).
Table 5. Opening and closing surveyed coal product inventories at TKH
As at December 312012 2011 Change
’000 tonnes ’000 tonnes %
ROM coal 104 334 -68.9%Washed hard coking coal (HCC) 116 45 157.8%Washed semi-soft coking coal (SSCC) – – NAWashed thermal coal (middlings) 293 87 236.8%
TKH coal inventory total 513 466 10.1%
Survey of coal quantity is a measurement of volume, and as for every bulk commodity the conversion to tonnage requires the application of density assumption, which involves natural variance. Subsequently, the measurement of stockpile quantities is an estimation in which errors are inherent. Therefore, the variations within 5% are tolerated, and any tonnages above/below this limit are recorded as stockpile gain/loss. The management expects that by maintaining lower levels of inventory and improving overall inventory management, the Company will be in a position to reduce potential inventory losses in the future.
For coal products being transported from one stockpile to another destination, the transportation gain/loss is recorded as a positive/negative discrepancy between tonnages shipped-out as recorded by the weigh-bridge at the departure point and tonnages shipped-in as recorded by the weigh-bridge at the delivery point. The transportation losses are a result of natural loss during transportation, and also to some extent, to variations in moisture content.
32
Occupational health and safety
In 2012, the Group continued to recognise and implement the most stringent of safety policies for the protection of its personnel and equipment. The Group has conducted a total of 97,259 man hours of safety training involving the Group’s personnel, contractors and visitors in 2012.
As a result, the Lost Time Injury Frequency Rate (“LTIFR”), an injury frequency rate expressed as the number of injuries per million hours worked was 0.71 for 8,380,412 man hours recorded within the Group’s coal mining, processing and transportation operations for the whole year of 2012. In comparison, the Queensland Government publicly reported that the average LTIFR at surface coal mining operations in Queensland, Australia was 2.7 for the period from 1 July 2010 to 30 June 2011.
Regretfully, an unfortunate fatal traffic accident occurred in October 2012. It was related to the Group’s transportation operations and was caused by a collision with a third party transportation vehicle. The Group’s emergency response unit responded/acted immediately, and the case was further investigated by traffic police authorities. The Company representatives have fully collaborated with relevant authorities during the investigation. Currently, the case is under review by the provincial prosecutor’s office. Based on the outcomes of the investigation, no charges or payment claims were raised against the Company in connection with the case. The Company provided financial assistance equal to 36 months average wage to the victim’s family. The Group’s occupational health and safety department, jointly with the traffic police, are committed to and make every effort to prevent accidents and minimise risks associated with increased traffic by providing safety training, conducting preventive safety checks and monitoring activities not only for the Group’s own transportation operations and its contractors, but also for third party vehicles utilising its paved road on a toll fee basis.
Marketing and sales
As part of the Group’s strategic objective to supply quality products to end-users, the Group continued to strengthen its existing relations with its customers in China as well as outreaching to new customers in order to further diversify its revenue sources.
The Group sold approximately 5.6 million tonnes of coal products in 2012, representing an increase of around 16.7% over the 4.8 million tonnes of coal products sold in 2011.
As the Group drastically shifted towards washed coal products, it strengthened already built relationship with its end-user customers. In 2012, the Group exported in total 3.6 million tonnes of washed coking coal, 1.6 million tonnes of middlings and 0.4 million tonnes of raw coal (2011: 1.5 million tonnes; 0.0 million tonnes and 3.3 million tonnes, respectively).
In 2012, the Group sold 99.0% of total export sales volume to its China-based customers primarily under delivery at place (“DAP”) GM terms and 1.0% to seaborne market customers under free-on-board (“FOB”) Nakhodka terms.
The Group entered into a long-term cooperation agreement with Jinan Iron and Steel Group Co., Ltd. (“Jigang Group”), a subsidiary of Shandong Iron and Steel Group, in November 2012 to supply HCC to the Jigang Group each year for a period of five years. Also, the Group entered into a long-term cooperation agreement for its middlings with China Datang Overseas Investment Co. Ltd., one of China’s largest energy producers, and a sales and purchase agreement with China Panjin Oil Field Taicheng Industrial LLC.

33
Figure 5. Seaborne sales route
In 2012, the Group has also successfully launched pilot shipments of HCC to seaborne market customers via Far-East Russian port (Figure 5). The Group exported under FOB Nakhodka terms approximately 19.1 thousand tonnes of washed HCC to the Japanese market in partnership with Sumitomo Corporation in February 2012. Subsequently, in March 2012, the Group delivered under the same terms around 16.4 thousand tonnes of washed HCC to Mesco Steel Limited. In May 2012, a third shipment from Nakhodka delivered 17.8 thousand tonnes of washed HCC to China Steel Corporation, one of the Taiwanese steel mills. Furthermore, the Group has continued to investigate the possibility of delivering its coking coal products to its end-user customers in the seaborne market via Chinese ports located at Bohai rim.
UHG-GS Railway
On 31 May 2012, the Group entered into a Build-Operate-Transfer Concession Agreement with the GoM. This allowed the Group to initiate the construction of the railway infrastructure between UHG mine and GS.
The GoM recognising the socio-economic importance of the first and second stage railway base infrastructure construction projects, and as a measure to accelerate the implementation of the railway network development, as defined by the State Policy on Railway Transportation approved by Resolution 32 of the Parliament in June 2010, on 3 November 2012 resolved to consolidate them into a unified railway project to be funded, managed and implemented under the government authority with the participation of domestic and foreign investors.
Moreover, in order to keep uninterrupted continuation of current construction works, the GoM decided that the previous concessionaires (including the Group) will have options to participate further in the implementation of the Project, with all costs incurred to date to be considered as a part of their investment in the unified railway project.
The consolidated railway project is expected to enhance the competitiveness of the Mongolian mining industry by creating multiple access points to the target markets.

34
OUTLOOK AND BUSINESS STRATEGIES IN 2013
In 2013, the Group will continue to strengthen its position as a reliable supplier of consistently high quality coking coal products to its end-user customer base. Coking coal prices fell sharply in the third quarter of 2012. However, after reaching its lowest point in September, prices have gradually recovered in subsequent months. As the Group enters 2013, the Company’s management believes that this gradual recovery in coking coal prices will continue. With the vast majority of development projects related capital expenditures completed, and by virtue of its robust production profile, the Company is well positioned to grow by pursuing its strategic objectives in 2013.
The Company intends to pursue the following key strategies in order to maintain and enhance its position as a leading Asian washed coking coal producer: (i) increasing its mined coal production; (ii) expanding its coal handling and processing capacity; (iii) improving its transportation infrastructure and capability; (iv) continuing to develop and diversify its long-term customer base combined with the promotion of its own brand; (v) exploring opportunities for expanding and diversifying its business operations through potential acquisitions, strategic investments and joint ventures; and (vi) continuing its strong commitment to safety, the environment and socially responsible operations.
In 2013, the Group will continue to ramp up coal production, and is targeting an output of 12.0 million tonnes of ROM coal. The third module of the CHPP is expected to be commissioned in the first half of 2013, and as such the Group’s total coal processing capacity is targeted to reach 15.0 million tonnes per annum starting from the second half of 2013. Therefore, the Group is targeting to process 12 million tonnes of ROM coal, drawing additional feed from the current site stocks, to produce 6.0-6.5 million tonnes of washed HCC.
Further improvements to operational safety, efficiency and productivity are expected by (i) adjusting workforce rosters and supporting employee resettlement to South Gobi, (ii) refining the alignment of mining contractor performance incentives with overall Company performance, (iii) identifying specific mining targets including cheaper explosive products, reduced coal re-handling, and regularly scheduled in-pit inventory for optimal and efficient blending of ROM feed to CHPP. The completion of the belt filter press facility installation for treating CHPP tailings is expected to improve water recycling rates, further reducing water extraction and environmental footprint, with cost benefit. Connection to the Mongolian Central Energy System is expected to allow the UHG Power Plant to run at full coal-fired capacity by enabling energy supply to third party customers, providing an opportunity to reduce unit costs related to power generation.
Regarding transportation and logistics, the Company’s operations management will target further increases to the proportion of coal transported by own truck fleet between UHG and TKH in 2013. There is potential for further reductions in the cost of cross-border transportation between TKH and GM, with continued dialogue in progress between Mongolian and Chinese authorities to smoothen the process, allowing cost saving through improved efficiency.
Also, the Company’s management will focus on reducing operational expenditures and boosting productivity by amalgamating site-based support functions, sharing available resources, increasing efficiency and minimising indirect costs.
The Company will continue to strengthen existing and create new long-term relations with its end-user customers. Additionally, the Company will actively look at strategic long-term partnerships to expand its relations and presence in China.

35
The specific social infrastructure development initiatives will not only benefit communities the Group operates in, but also its employees and their families. It will further strengthen the Group’s competitive position as a reliable and responsible employer, allowing for the continuous build up of internal capabilities by attracting and maintaining a talented and skilled workforce.
FINANCIAL REVIEW
Revenue
The Group’s sales volume of coal products reached approximately 5.6 million tonnes in 2012, representing an increase of around 0.8 million tonnes, or 16.7%, compared to 4.8 million tonnes of coal products sold in 2011.
The most significant sales volume growth at around 140.0% was achieved for washed coking coal products. In 2012, the Group exported 3.4 million tonnes of HCC and 0.2 million tonnes of SSCC (2011: 1.5 million tonnes and nil, respectively). In contrast to the increase in sales of HCC, the sales volume of raw coal declined by about 87.9%. As such, the Group exported 0.4 million tonnes of raw coal in 2012 (2011: 3.3 million tonnes), the majority of which was sold in the first half of the year.
In addition, the Group initiated export sales of its high calorific value thermal coal, a by-product in the process of washing raw coal, selling 1.6 million tonnes of middlings to its customers in China in 2012 (2011: nil).
The breakdown of sales volume and revenue by individual coal product type and average selling prices (“ASP”) for individual coal product types for the periods are indicated in Table 6.
Table 6. Sales volume, revenue and ASP
Year ended December 312012 2011 Change
Sales volume (million tonnes) 5.6 4.8 16.7%Washed hard coking coal (HCC) 3.4 1.5 126.7%Washed semi-soft coking coal (SSCC) 0.2 – NAWashed thermal coal (middlings) 1.6 0.0 NARaw coal (ROM coal) 0.4 3.3 -87.9%
Revenue (’000 USD) 474,480 542,568 -12.5%Washed hard coking coal (HCC) 371,160 235,220 57.8%Washed semi-soft coking coal (SSCC) 17,234 – NAWashed thermal coal (middlings) 57,341 663 8,548.7%Raw coal (ROM coal) 28,745 306,685 -90.6%
Average selling price (USD/tonne) 84.8 113.9 -25.5%Washed hard coking coal (HCC) 108.4 155.6 -30.3%Washed semi-soft coking coal (SSCC) 78.1 – NAWashed thermal coal (middlings) 36.9 34.0 8.5%Raw coal (ROM coal) 72.9 95.0 -23.3%

36
As disclosed above, the Group recorded total revenue of USD474.5 million for the year ended 31 December 2012, representing a change of 12.5% as compared with USD542.6 million in 2011. Notably, revenue of USD371.2 million was generated from HCC sales, representing more than 78.2% of total revenue in 2012 (2011: USD235.2 million and 43.4%, respectively). The Group derived 97.3% and 2.7% of total coal export sales revenue in 2012 from its Chinese customers and seaborne market customers, respectively.
In 2012, the Group’s pricing for its washed coking coal products followed the negative trend in the global market prices of coking coal products. As a result, the ASP of the Group’s HCC was approximately USD108.4 per tonne in 2012, which is around 30.3% lower compared to USD155.6 per tonne in 2011.
The pricing of HCC decreased moderately in the first half of the year. ASP of HCC in the first half of 2012 was USD138.7 per tonne. In the second half of the year, pricing faced greater pressure and reached the lowest point in the third quarter, but gradually recovered in the fourth quarter of 2012. In comparison, the pricing of middlings supplied by the Group remained relatively stable during the course of the whole year. ASP of middlings was USD37.6 per tonne in the first half of 2012, and USD36.1 per tonne in the second half of 2012.
For the year ended 31 December 2012, the Group derived more than 10.0% of its annual revenue from three customers, with purchase amounts of USD168.3 million, USD115.6 million and USD59.8 million, respectively. In 2011, the Group had also derived more than 10.0% of its annual revenue from three customers, with purchase amounts of USD185.0 million, USD148.6 million and USD73.6 million, respectively.
Cost of Revenue
The Group’s cost of revenue primarily consists of mining costs, processing and handling costs, transportation and logistics costs, and costs related to site administration, stockpiles and transportation losses, and governmental royalties and fees.
The increase in the Group’s mining, processing, transportation and sales volumes resulted in increased cost of revenue from USD336.4 million in 2011 to approximately USD420.4 million in 2012.
Mining costs consist of costs associated with overburden and topsoil removal and ROM coal extraction, including the costs related to mining staff and equipment together with base and performance fees paid to the mining contractor, drill and blasting contractor fees, and costs paid to fuel suppliers. In 2012, the Group’s total mining costs were USD123.5 million (2011: USD120.5 million). UHG mine unit mining cost was USD16.3 per ROM tonne in 2012, compared to USD19.8 in 2011, representing a 17.7% decrease. BN mine unit mining cost was USD23.9 per ROM tonne in 2012 (2011: nil).
The reduction in unit mining cost is attributable to the economy of scales, and also the shift to sales of washed coal products. According to the relevant regulatory provisions, only exporters of washed coal are entitled to VAT rebates, and as such the Group’s mining cost related to the sales of washed coal products are excluding the 10% VAT component (Table 7).

37
Table 7. Total mining cost and unit mining cost per ROM tonne
Year ended December 312012 2011 2012 2011
USD’000 USD’000 USD/ROM tonne
USD/ROM tonne
Total mining costs 123,541 120,468 16.8 21.6VAT component 1,056 9,785 0.1 1.8
UHG mining cost 114,057 110,683 16.3 19.8
BN mining cost 8,428 – 23.9 –
Besides, the mining costs in the income statement, capitalised costs of pre-stripped overburden are reflected in the balance sheet. Pre-stripped overburden is associated with the coal to be mined, processed, transported and sold in the future.
Processing costs primarily included the costs associated with the operations of the CHPP, including power and water costs. In 2012, the Group’s processing costs were USD51.0 million (2011: USD21.4 million), of which USD16.8 million was related to the depreciation and amortisation. Also, processing costs included the power generation and distribution costs of USD8.4 million incurred in the UHG Power Plant and the water extraction and distribution costs of USD2.9 million incurred in the UHG Water Supply Facility related to the washed coal sold in 2012.
Unit processing cost calculated per ROM coal in-feed tonne decreased by USD1.8 or 19.8% from USD9.1 per ROM tonne in 2011 to USD7.3 per ROM tonne in 2012 (Table 8).
Table 8. Total processing cost and unit processing cost per ROM tonne
Year ended December 312012 2011 2012 2011
USD’000 USD’000 USD/ROM tonne
USD/ROM tonne
Total processing costs 51,031 21,433 7.3 9.1Consumables 2,993 777 0.4 0.3Maintenance and spares 4,810 1,468 0.7 0.6Power 8,368 6,050 1.2 2.6Water 2,903 1,223 0.4 0.5Staff 3,446 1,340 0.5 0.6Contractor fee 8,251 2,583 1.2 1.1Ancillary and support 3,477 1,165 0.5 0.5Depreciation and amortisation 16,783 6,827 2.4 2.9

38
Handling costs are related to feeding ROM coal from ROM coal stockpiles to the CHPP and also the removals of course reject (primarily rock and sediment separated from coal) after coal processing. In 2012, the Group’s handling cost was USD13.2 million (2011: USD5.2 million). The management intends to increase the proportion of in-feed ROM coal being directly dumped to the CHPP feed, which will continue to lower the handling costs related to feeding ROM coal from ROM coal stockpiles to the CHPP going forward.
Transportation costs are derived primarily from costs related to the transportation of ROM coal from the BN mine to the CHPP located at the UHG mine, the transportation of coal products from UHG to TKH, and the transportation of coal products to the selling point destinations as stipulated under sales contracts, including fees paid to third party transportation contractors.
In 2012, the Group’s transportation costs were USD130.9 million (2011: USD107.3 million), of which USD1.0 million is related to the transportation of ROM coal from BN mine to CHPP, USD66.0 million was related to long-haul (UHG-TKH) transportation; USD55.0 million to short-haul (TKH-GM) cross-border transportation for coal products sold to China-based customers under DAP GM terms, which includes costs of transportation and logistics associated with the direct delivery of products from UHG to GM; and USD8.9 million for coal products sold to seaborne market customers under FOB Nakhodka terms, which includes transportation and logistics costs incurred to deliver coal products from UHG to Nakhodka and to load the products on the customers’ designated sea transportation vessels.
In 2012, the management focused on maximising the utilisation of the Company’s own transportation assets and improving efficiency in its main long-haul transport (UHG-TKH) section. As a result, the transportation cost using its own fleet in the long-haul (UHG-TKH) section has been reduced from USD19.1 per tonne in 2011 to USD9.4 per tonne in 2012, which represents USD9.7 or 50.8% decrease per tonne year-on-year. Meantime, the transportation cost by third party contractors in the long-haul (UHG-TKH) section has been increased from USD16.6 per tonne in 2011 to USD18.1 per tonne in 2012, which represents USD1.5 or 9.0% increase per tonne year-on-year. In 2012, the Group’s own transport fleet carried the majority (70.7%) of its total coal products while the rest (29.3%) was transported by third party contractors, bringing the combined cost of transport to USD11.9 per tonne in 2012, down by USD5.3 per tonne compared to USD17.2 per tonne in 2011. For the short-haul (TKH-GM) section, where the Group utilised a contracted fleet for the majority of its transportation, the Group’s transportation costs were USD10.0 per tonne in 2012, compared to USD6.2 per tonne recorded in 2011, primarily due to competitive pressure from new entrants in this particular section. The Group maintained its overall transportation costs in the UHG-GM section at USD21.9 per tonne in 2012, which is around USD1.5 per tonne lower compared to USD23.4 per tonne recorded in the previous year.

39
For the years indicated, the Group’s total and individual costs of revenue in terms of amount as well as unit costs of revenue were calculated on a per total product sold basis in Table 9.
Table 9. Total and individual costs of revenue and unit costs of revenue
Year ended December 312012 2011 2012 2011
USD’000 USD’000 USD/tonne USD/tonne
Cost of revenue 420,400 336,368 75.1 70.6
Mining costs 123,541 120,467 22.1 25.3Variable costs 70,398 70,273 12.6 14.7Fixed costs 49,921 49,443 8.9 10.4Depreciation and amortisation 3,222 751 0.6 0.2
Processing costs 51,031 21,433 9.1 4.5Variable costs 19,074 9,518 3.4 2.0Fixed costs 15,174 5,088 2.7 1.1Depreciation and amortisation 16,783 6,827 3.0 1.4
Handling costs 13,164 5,195 2.4 1.1
Transportation costs 130,871 107,263 23.3 22.5
Logistics costs 23,252 13,537 4.2 2.9Variable costs 6,700 2,777 1.2 0.6Fixed costs 9,802 7,490 1.8 1.6Depreciation and amortisation 6,750 3,270 1.2 0.7
Site administration costs 10,938 8,605 2.0 1.8
Transportation and stockpile losses 19,478 1,002 3.4 0.2
Royalties and fees 48,125 58,866 8.6 12.3Royalties 34,756 48,232 6.2 10.1Air pollution fees 6,033 4,362 1.1 0.9Custom fees 7,336 6,272 1.3 1.3
Logistics costs are mainly related to costs for paved road operations, maintenance and amortisation costs and also costs associated with operating product stockpiles at UHG and TKH. In 2012, the Group’s logistics costs were USD23.3 million (2011: USD13.5 million), of which USD6.3 million was related to the amortisation of the UHG-GS paved road.
Site administration costs are primarily related to site support facilities such as airstrip operations, as well as the overall supervision and joint management of the Group’s mining, processing, transportation and logistics operations at the UHG and BN mines, both located in South Gobi province. In 2012, the Group’s site administration costs were USD10.9 million (2011: USD8.6 million).

40
For 2012, the Group recorded transportation and stockpile net loss of USD19.5 million compared to net loss of USD1.0 million recorded for 2011, which were included in the mining, processing, transportation and other costs in the amount of USD0.1 million gain, USD0.3 million loss, USD0.6 million loss and USD0.2 million loss respectively (Table 10).
Table 10. Transportation and stockpile losses by amounts and volumes
Year ended December 312012 2011 2012 2011
USD’000 USD’000 tonne’000 tonne’000
Transportation and stockpile losses 19,478 1,002 754.5 41.2
Transportation loss UHG-TKH 1,389 850 38.4 21.1 Washed coal 1,373 733 37.4 15.3 Raw coal 16 117 1.0 5.8
Transportation loss TKH-GM 2,393 774 42.3 13.3 Washed coal 2,345 619 40.8 9.2 Raw coal 48 155 1.5 4.1
Stockpile loss/(gain) at UHG 9,030 (2,032) 558.8 (22.2)Washed coal (168) (814) (10.4) 39.1 Raw coal 9,198 (1,218) 569.2 (61.3)
Stockpile loss at TKH 6,666 1,410 115.0 29.0 Washed coal 6,851 957 120.9 18.1 Raw coal (185) 453 (5.9) 10.9
In 2012, total transportation loss was around USD3.8 million, of which USD1.4 million incurred for transportation of coal products at UHG-TKH section and USD 2.4 million for TKH-GM section. In comparison, for 2011 the Group recorded total transportation loss of USD1.7 million, with USD0.9 million for UHG-TKH section and USD0.8 million for TKH-GM section, respectively. The increase observed for transportation loss in 2012 is primarily related to increased transportation and sales volume and due to the increased transportation and sales volume of higher value washed coal products. Also, to some extent, the increase is related to moisture loss due to the increase in the proportion of washed coal product sales and also moisture losses.
The inventory losses are assessed based on periodic survey measurements of the Group’s ROM coal inventories of ROM coal stockpiles at the UHG and BN mines, and also coal products inventories of product stockpiles at UHG and TKH. For 2012, the Group recorded unrealised inventory loss of USD9.0 million for ROM coal stockpile at UHG compared to unrealised gain of USD2.0 million recorded for the previous year. The stockpile loss at TKH was USD6.7 million in 2012, compared to USD1.4 million in 2011.
Governmental royalties and fees are related to royalties, air pollution fees and custom fees paid according to the applicable laws and regulations in Mongolia. The progressive royalty rate, in the range of 5-8% for processed coal products and 5-10% for raw coal, was based on the monthly reference price determined by the Ministry of Mineral Resources and Energy of Mongolia at the time. However, on 6 October 2012, the GoM issued Resolution No.74, temporarily suspending the use of the monthly reference price system and setting contracted prices used for calculating the royalty rates for the period from 1 October 2012 through 1 April 2013. In the meantime, it will find a fair market based system to determine the reference prices used to calculate royalty rates in consultation with industry representatives. The Group’s effective royalty rate for 2012 was around 7.3% (2011: 8.9%).

41
Gross Profit and Gross Profit Margin
The Group’s gross profit for the year ended 31 December 2012 was approximately USD54.1 million, representing a decrease of USD152.1 million, or 73.8 %, from gross profit of USD206.2 million recorded for the year ended 31 December 2011. In 2012, gross profit margin was 11.4%, compared with 38.0% in 2011.
The decrease in gross profit and gross profit margin was mainly driven by (i) a decrease in the ASP of coking coal products supplied by the Group due to challenging market conditions in China as demand from steel mills and coke plants was affected by global economic conditions and (ii) costs related to coal transportation and stockpile loss totaling USD19.5 million, which was one-off recording at the end of the year.
General and Administrative Expenses
The Group’s general and administrative expenses relate primarily to staff costs, share option expenses, consultancy and professional fees, depreciation and amortisation of office equipment and other expenses.
In 2012, the Group’s administrative expenses decreased by approximately USD12.1 million, or 20.1%, from USD60.3 million in 2011 to USD48.2 million in 2012 (Table 11). The percentage of general and administrative expenses to total revenue decreased from 11.1% in 2011 to 10.2% in 2012.
The decrease in administrative expenses was mainly due to (i) no management fees charged under provisions of the management agreement with MCS Holding LLC as this agreement expired on 1 January 2012; (ii) no acquisition-related one-off expenses incurred; and (iii) less expenses related to geological exploration works and consultancy services.
Allowance for doubtful debts is related to the accounting treatment of the Group’s trade receivables proportion according to the internal credit policy guidelines and management will continue to pursue full or partial recovery.
Table 11. General and administrative expenses
Year ended 31 December2012 2011
USD’000 % USD’000 %
Management fee – – 10,406 17.2Staff costs 10,451 21.7 8,980 14.9Consultancy and professional fees 5,585 11.6 17,413 28.9Depreciation and amortisation 4,327 9.0 3,427 5.7Allowance for doubtful debts 5,928 12.3 4,145 6.9Share option 6,620 13.7 1,646 2.7Others (Note) 15,272 31.7 14,286 23.7
Total 48,183 100.0 60,303 100.0
Note:
Others include costs incurred in relation to the social responsibility and community support expenses, insurance cost, travelling expenses, rental fees and other expenses.

42
Net Finance Cost/(Income)
Net finance cost for the year ended 31 December 2012 was approximately USD11.4 million (2011: net finance income of USD8.5 million). Net finance cost for the year ended 31 December 2012 was primarily due to interest expenses related to the Senior Notes and other credit facilities.
Income Tax Expenses
The Group’s income tax expenses decreased from approximately USD35.7 million in 2011 to USD3.2 million in 2012. The income tax expenses were incurred on taxable income generated at individual operating subsidiaries of the Group and interest income on time deposits subject to special tax rate of 10% on gross interest income.
Loss/Profit for the Year
As a result of the costs listed above, losses attributable to equity shareholders of the Company for the year ended 31 December 2012 amounted to approximately USD2.5 million. As at 31 December 2011, the Company recorded USD119.1 million profit for the year. The major contributing factors of the Group’s net loss position are (i) a decrease in the ASP of coking coal products, (ii) costs related to coal transportation and stockpile losses totaling USD19.5 million, which was one-off recording at the end of the year, and (iii) an increase in the Group’s finance costs due to the issue of the Senior Notes and other facilities, bringing total net finance cost to USD11.4 million.
Liquidity and Capital Resources
For the year ended 31 December 2012, the Company’s cash needs were primarily related to costs associated with mining and infrastructure development, which includes construction of modules 2 and 3 of the CHPP, additional water facilities, construction of the paved road between the BN and UHG mines and railway construction.
The Company’s cash resources were funded by (i) the successful issuance of the Senior Notes, (ii) a facility agreement with Standard Bank Plc (the “Standard Bank Facility”) for up to USD300 million, and (iii) cash generated from operating activities.
The gearing ratio (calculated as total bank and other borrowings divided by total assets) of the Company as at 31 December 2012 was 46.3% (2011: 34.5%). All borrowings are denominated in USD. Cash and cash equivalents are held in MNT, USD, RMB, Euros and Hong Kong Dollars. It is Company policy to regularly monitor current and expected liquidity requirements and compliance with debt covenants to ensure that the Company maintains sufficient reserves of cash to meet its liquidity requirements in the short and long term.
Indebtedness
As of 31 December 2012, the Company had USD1,008.8 million in outstanding short-term and long-term borrowings, including indebtedness incurred under (i) the Senior Notes, (ii) a Standard Bank Facility of up to USD300 million, (iii) USD180 million facility agreements with the European Bank for Reconstruction and Development, FMO – Nederlandse Financierings-Maatschappij Voor Ontwikkelingslanden N.V. and DEG – Deutsche Investitions-und Entwicklungsgesellschaft mbH (the “EBRD, FMO and DEG Loan Agreements”), and (iv) USD85 million convertible bonds.

43
The Senior Notes, rated B1 by Moody’s Investors Service, Inc. and B+ by Standard and Poor’s Ratings Services, bear a fixed interest rate of 8.875% per annum payable semi-annually. The Senior Notes will mature in March 2017, unless earlier redeemed. As of 31 December 2012, the outstanding principal amount was USD600 million. Upon the sale, transfer, conveyance or other disposition (other than by way of merger or consolidation) in one or a series of related transactions of all or substantially all of the properties or assets of the Company to any person other than one or more of the beneficial owners of less than 30% of the total voting power of the Company, the Company must make an offer to repurchase all outstanding Senior Notes at a purchase price equal to 101% of their principal amount plus accrued and unpaid interest, if any, to (but not including) the date of repurchase.
A Standard Bank Facility was drawn down in the amount of USD200 million in March 2012, and the remaining available facility of USD100 million was cancelled by the Company. The loan bears an interest rate of LIBOR plus 5.25% per annum, and is repayable in 10 quarterly installments starting from December 2012 and ending in March 2015. As of 31 December 2012, the outstanding principal amount was USD190 million. Under the Standard Bank Facility, the Company shall not issue any shares if such issue results (i) in the creation of a new class of shares for the issued share capital of the Company and (ii) in a change of control by the controlling shareholder of the Company ceasing to beneficially hold (directly or indirectly) at least 30% of the total issued share capital of the Company.
The EBRD, FMO and DEG Loan Agreements bear interest on a semi-annual basis at the rate of six-month LIBOR plus 3.25%-3.75% per annum. Pursuant to the Amendment and Consent Agreement dated 5 March 2012, the margin per annum was reduced from 4.75%-6.85% to 3.25%-3.75% and UHG mining license and share pledges were released from the security package. The USD120 million principal amount of the loan is repayable in 11 semi-annual installments ending on 15 May 2016, and the USD60 million principal amount of the loan is repayable in two equal installments on 15 May 2015 and 15 May 2016, respectively.
As at 31 December 2012, the outstanding principal amount was USD147.3 million. Under the EBRD, FMO and DEG Loan Agreements, the controlling shareholder of the Company may not cease at any time to own directly or indirectly more shares of the Company than any other shareholder, or at least 30% plus one share of the issued and outstanding shares of the Company, or the Company may not cease to be directly majority owned by entities domiciled in Mongolia.
The original maturity date of the USD85 million convertible bonds, subject to certain conditions, was on 1 December 2012. The maturity date was extended to 1 March 2013 on 27 November 2012, and further extended to 22 April 2013 on 19 February 2013. The convertible bonds can be converted into shares at the bondholder’s request in the four days prior to the maturity date at a conversion rate of HKD10.92 per share.
Credit Risk
The Group closely monitors its credit exposure. Credit risk is primarily attributable to trade and other receivables.
For the year ended 31 December 2012, the Group had approximately USD35.8 million in trade receivables, USD178.0 million in other receivables and USD5.9 million for allowance of doubtful debts. For the year ended 31 December 2011, the Group had USD41.4 million in trade receivables and USD72.0 million in other receivables, as well as USD4.1 million for allowance of doubtful debts. The Company holds monthly Credit Committee meetings to review, assess and evaluate

44
Company’s overall credit quality and the recoverable amount of each individual trade credit. As of 31 December 2012, in accordance with the Credit Policy, all bad debts aged over one year were written off against the provision which was made in the previous year. Based on the Company’s continuous efforts and the implementation of the credit policy, credit risk has been significantly reduced. Nevertheless, the management continues to monitor, on an ongoing basis, the exposure, including but not limited to the current ability to pay, and takes into account information specific to the customer and pertaining to the economic environment in which the customer operates.
With regard to other receivables of USD178.0 million, this amount is mainly related to VAT and other tax receivables, deposits and prepayments. The VAT and other tax receivables amounted to USD83.1 million and other receivables amounted to USD94.9 million. For the VAT receivables, the tax authorities audited and approved the Group’s VAT tax refund, and the Group has started to offset the VAT refund with its other tax payments. The remaining amounts are deposits, advances, prepayments and other receivables in the ordinary course of business. The management believes that there is no issue in the collectability of such receivables.
Foreign Exchange Risk
During the two years ended 31 December 2012, 100% of the Company’s revenue and 27.0% and 35.5% of the purchases in each respective year were denominated in currencies other than MNT, the functional currency of the Group’s Mongolian entities.
Cash and cash equivalents denominated in the currency other than the functional currency of the entity to which they relate as at 31 December 2011 and 2012 amounted to USD119.9 million and USD282.4 million, respectively. Total borrowings denominated in the currency other than the functional currency of the entity to which they relate as at 31 December 2011 and 2012 amounted to USD179.5 million and USD147.3 million, respectively.
For the two years ended 31 December 2012, 66.6% and 75.6% of the respective revenues were denominated in USD, with the remaining revenue denominated in RMB.
For the year ended 31 December 2011, 85.4%, 26.5% and 23.4% of the finance cost, operating expenditures and capital expenditures, respectively, were denominated in USD, with the remainder denominated in MNT. For the year ended 31 December 2012, 91.3%, 31.7% and 14.0% of the finance cost, operating expenditures and capital expenditures, respectively, were denominated in USD; while 0.7%, 13.5% and 1.2% of the finance cost, operating expenditures and capital expenditures, respectively, were denominated in RMB; 0.5% and 1.1% of the operating expenditures and capital expenditures, respectively were denominated in other currencies than the USD, RMB and MNT; and the remainder was denominated in MNT.
Although the majority of the Group’s assets and operating expenses are denominated in MNT, a large portion of expenses, including fuel and capital expenditures, are import costs and are thus linked to USD and RMB prices. Also, the majority of the Group’s finance costs are denominated in USD. Therefore, the Group believes that there is a natural hedge that partially offsets foreign exchange risk.
The Group has not entered into any derivative instruments to manage foreign exchange fluctuations. However, the management monitors foreign exchange exposure and will consider hedging significant foreign currency exposure should the need arise.

45
Pledge of Assets of the Group
As at 31 December 2012, the Company pledged Energy Resources LLC’s current accounts held with Trade and Development Bank of Mongolia, Khan Bank of Mongolia, Golomt Bank of Mongolia, its Debt Reserve Account with Standard Bank Plc for loan repayment, coal sales contract with Inner Mongolia Qinghua Group of China, coal mining agreement with Leighton LLC; engineering, procurement, construction and management (“EPCM”) contract for the CHPP constructed at the UHG site with Sedgman LLC; CHPP modules 1 and 2; UHG Power Plant; water facilities for the EBRD, FMO and DEG Loan Agreements.
The Company pledged its Collection and Cash Collateral accounts with Standard Bank Plc, coal sales contracts with Inner Mongolia Fuji Energy Co., Ltd, Winsway Resources Holdings Private Limited and Shenhua Bayannaoer Energy Co., Ltd, coal stockpile of Energy Resources LLC for a Standard Bank Facility.
Share pledges of Mongolian Coal Corporation Limited and Mongolian Coal Corporation S.a.r.l. are shared among a Standard Bank Facility and the Senior Notes.
The total amount of indebtedness covered with the above pledges is USD923.8 million.
Contingent Liabilities
a) As at 31 December 2012, the Company has contingent liability in respect of the consideration adjustments for the Acquisition pursuant to the Share Purchase Agreement, which may arise from the royalty provision. Under the royalty provision, an additional life of mine payment of USD6 per tonne may be payable in the event that the actual amount of coal extracted from the BN mine exceeds a specified semi-annual production target fixed on the date of the determination of the total reserves in each semi-annual period after 1 June 2011 commencing on 1 January and ending on 30 June and commencing on 1 July and ending on 31 December.
Under the royalty provisions for excessive coal production at the BN mine pursuant to the Share Purchase Agreement and the Settlement Agreement, the specified semi-annual ROM coal production must exceed 5.0 million tonnes. Therefore, the probability of royalty provision is considered to be very low.
b) On 14 February 2013, Enrestechnology LLC (“ERT”), wholly-owned subsidiary of the Company, has brought a claim to the Capital Administrative Court of Mongolia against two decisions No.101/12 and 102/12 both dated 26 December 2012, of the custom officers of General Customs Office of Mongolia.

46
These disputing decisions were made as a result of custom post-clearance audit, of which scope of inspection was ‘importing activities due course of CHPP module I and II Construction Project’ of the Company. Specifically, these decisions were made in relation to costs incurred in accordance with four interconnected contracts within a scope of EPCM services contracts signed with EPCM contractor.
In particular, in terms of cost type, these disputing decisions were made upon custom officers’ assumption that “procurement management service payments” stated in EPCM contracts where “brokerage service fees” as well as “design and engineering management service payments” where addable costs to the declared values of the particular imported goods in the CHPP construction period, pursuant to Article 10.3 of the Law on Custom Tariff and Tax of Mongolia.
The total amount of these decisions were MNT7,984,088,870, which includes custom and value added taxes with relevant penalty. The amount claimed against ERT under the custom officer’s first disputing decision is MNT4,630,328,449 and the amount claimed under the second disputing decision is MNT3,353,760,421.
As of the date of this disclosure, since the Company and its subsidiary ERT disagree with the custom officer’s decisions and this matter did not reach the final decision, no payment was made by the Company or ERT in accordance with these disputing two decisions.
On 26 February 2013, the Capital Administrative Court has instituted the administrative legal proceeding on this case, which started litigation process of the first instance court hearing. The first instance court decision is expected to be made within 60 days thereafter. If, the Company or ERT disagree with the first instance court decision, the Company or the defendant may appeal via the Court of Appeal up to the Supreme Court. The Company is determined to work until final decisions is made on this matter.
The court’s decisions are anticipated to be available in mid-2013 and it is premature to conclude the likely outcome at this stage. In the opinion of the Directors, based on legal advices, although the Company would provide all reasonable arguments in order to have issued rulings of the court in favor of the Group, it is difficult to estimate probability of the court decision at this early stage of the litigation. If ERT was found to be liable to the claim, the under-paid customs duties and VAT would result in an increase in the cost of the Group’s property, plant and equipment and the penalty would be charged to the Group’s profit or loss.
Reserve adjustment
Pursuant to the Share Purchase Agreement, the Group agreed with the Seller that, 18 months to 21 months from the date of the Share Purchase Agreement, an additional payment would be payable to the Seller or a clawback might be payable by the Seller in the amount of USD3.00 per tonne to the extent that the Total Reserves exceeded 150,000,000 tonnes or were less than the Reserve Adjustment. The maximum amount payable to the Seller will be USD105 million, and the maximum amount payable by the Seller will be USD90 million. According to the Share Purchase Agreement, the Company conducted geological and technical work to verify the estimations of the total reserves. In November 2012, independent technical review work confirmed that the final total reserve as defined in the Share Purchase Agreement amounts to 188,900,000 tonnes.
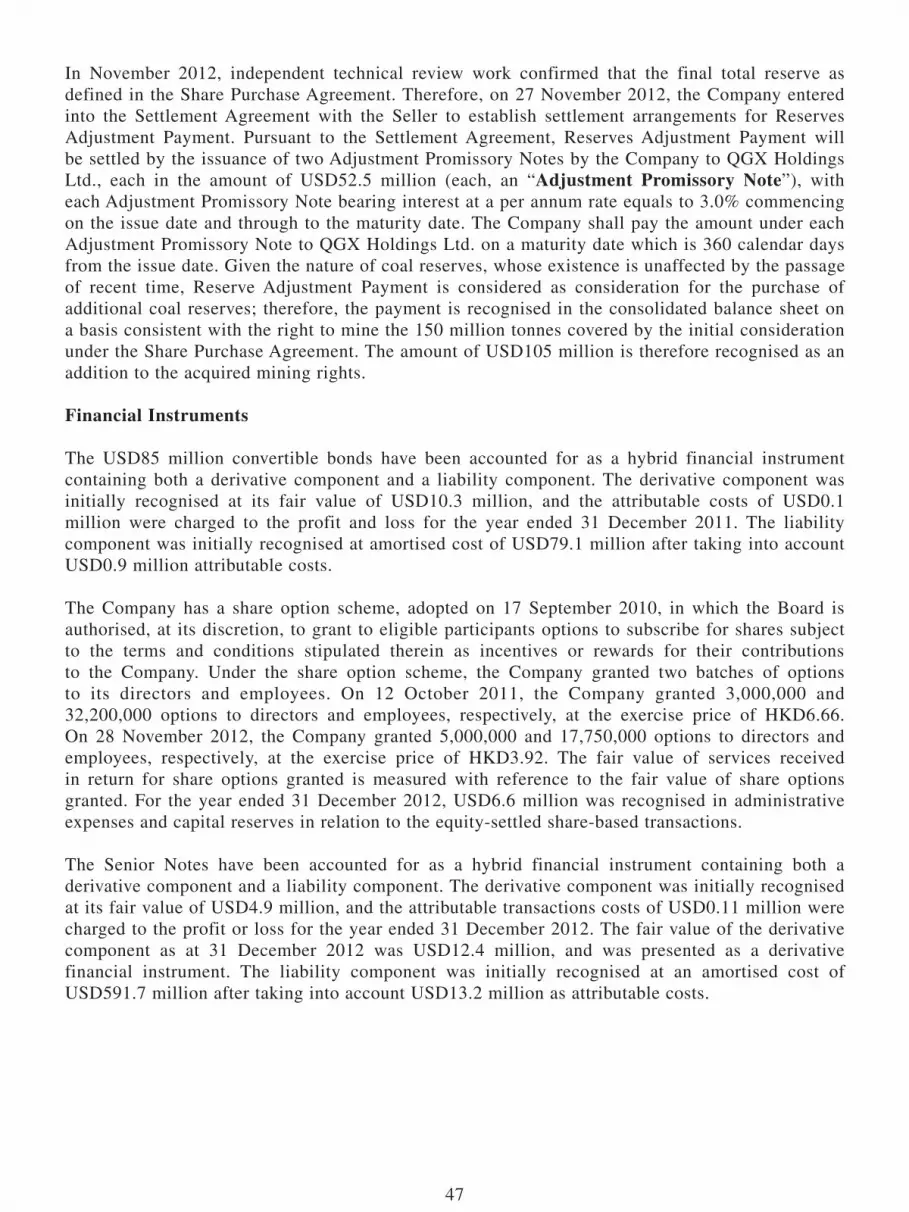
47
In November 2012, independent technical review work confirmed that the final total reserve as defined in the Share Purchase Agreement. Therefore, on 27 November 2012, the Company entered into the Settlement Agreement with the Seller to establish settlement arrangements for Reserves Adjustment Payment. Pursuant to the Settlement Agreement, Reserves Adjustment Payment will be settled by the issuance of two Adjustment Promissory Notes by the Company to QGX Holdings Ltd., each in the amount of USD52.5 million (each, an “Adjustment Promissory Note”), with each Adjustment Promissory Note bearing interest at a per annum rate equals to 3.0% commencing on the issue date and through to the maturity date. The Company shall pay the amount under each Adjustment Promissory Note to QGX Holdings Ltd. on a maturity date which is 360 calendar days from the issue date. Given the nature of coal reserves, whose existence is unaffected by the passage of recent time, Reserve Adjustment Payment is considered as consideration for the purchase of additional coal reserves; therefore, the payment is recognised in the consolidated balance sheet on a basis consistent with the right to mine the 150 million tonnes covered by the initial consideration under the Share Purchase Agreement. The amount of USD105 million is therefore recognised as an addition to the acquired mining rights.
Financial Instruments
The USD85 million convertible bonds have been accounted for as a hybrid financial instrument containing both a derivative component and a liability component. The derivative component was initially recognised at its fair value of USD10.3 million, and the attributable costs of USD0.1 million were charged to the profit and loss for the year ended 31 December 2011. The liability component was initially recognised at amortised cost of USD79.1 million after taking into account USD0.9 million attributable costs.
The Company has a share option scheme, adopted on 17 September 2010, in which the Board is authorised, at its discretion, to grant to eligible participants options to subscribe for shares subject to the terms and conditions stipulated therein as incentives or rewards for their contributions to the Company. Under the share option scheme, the Company granted two batches of options to its directors and employees. On 12 October 2011, the Company granted 3,000,000 and 32,200,000 options to directors and employees, respectively, at the exercise price of HKD6.66. On 28 November 2012, the Company granted 5,000,000 and 17,750,000 options to directors and employees, respectively, at the exercise price of HKD3.92. The fair value of services received in return for share options granted is measured with reference to the fair value of share options granted. For the year ended 31 December 2012, USD6.6 million was recognised in administrative expenses and capital reserves in relation to the equity-settled share-based transactions.
The Senior Notes have been accounted for as a hybrid financial instrument containing both a derivative component and a liability component. The derivative component was initially recognised at its fair value of USD4.9 million, and the attributable transactions costs of USD0.11 million were charged to the profit or loss for the year ended 31 December 2012. The fair value of the derivative component as at 31 December 2012 was USD12.4 million, and was presented as a derivative financial instrument. The liability component was initially recognised at an amortised cost of USD591.7 million after taking into account USD13.2 million as attributable costs.

48
Capital Commitments and Capital Expenditures
As at 31 December 2012, the capital commitments outstanding on the respective dates on the balance sheet were as follows:
As at 31 December2012 2011
USD’000 USD’000
Contracted for 35,409 14,827Authorised but not contracted for 69,427 80,075
Total 104,836 94,902
Operating Lease Commitments
As at 31 December 2012, the Company had contracted obligations consisting of operating leases which totaled approximately USD4.4 million with USD2.8 million due within one year and USD1.6 million due between two and five years. Lease terms range from 1 to 5 years, with fixed rents.
Significant investments held
As at 31 December 2012, the Company did not hold any significant investments.
Material acquisitions and disposals of subsidiaries and associated companies
For the year ended 31 December 2012, the Company did not have any material acquisitions and disposals of subsidiaries and associated companies.
Dividend
The Board does not recommend the payment of a dividend for the year ended 31 December 2012 (dividend for the year ended 31 December 2011: nil).
Employees
As at 31 December 2012, the number of the Group’s employees reached 2,568 compared to 2,177 employees as at 31 December 2011.
The Group’s employees are remunerated with reference to their individual performance, experience, qualifications and the prevailing salary trends in the local market, which is subject to periodic review. With reference to the Group’s financial and operational performance, employees may also be rewarded other benefits such as discretionary bonuses and share options pursuant to the Company’s share option scheme.

49
Closure of the Register of Members
The register of members of the Company will be closed from Friday, 10 May 2013 to Monday, 13 May 2013, both days inclusive. During such period, no transfer of shares of the Company will be registered. For the purpose of ascertaining the members’ entitlement to the attendance of the forthcoming annual general meeting (“AGM”) of the Company to be held on 13 May 2013, all completed transfer forms accompanied by the relevant share certificates must be lodged with the Company’s branch share registrar in Hong Kong, Computershare Hong Kong Investor Services Limited, at Shops 1712-1716, 17th Floor, Hopewell Centre, 183 Queen’s Road East, Wanchai, Hong Kong, for registration not later than 4:30 p.m. on Thursday, 9 May 2013.
Purchase, Sale or Redemption of the Company’s Listed Securities
For the year ended 31 December 2012, neither the Company nor any of its subsidiaries had purchased, sold or redeemed any of the Company’s listed securities.
Corporate Governance Practices
The Company has adopted the code provisions set out in the Corporate Governance Code (the “CG Code”) contained in Appendix 14 to the Rules Governing the Listing of Securities on the Stock Exchange as its code of corporate governance. CG Code provision E.1.2 stipulates that the chairman of the board should attend the AGM of the Company. Mr. Odjargal Jambaljamts, Chairman of the Board, appointed Mr. Chan Tze Ching, Ignatius, independent non-executive Director to attend and answer questions on his behalf at the 2012 AGM due to important business engagement. The Company has complied with all other applicable code provisions as set out in the CG Code.
Review by Audit Committee
Our Audit Committee currently comprises one non-executive Director, namely Ms. Enkhtuvshin Gombo, and three independent non-executive Directors, namely Mr. Chan Tze Ching, Ignatius, Mr. Unenbat Jigjid, and Mr. Ochirbat Punsalmaa. Mr. Chan Tze Ching, Ignatius is the chairman of the Audit Committee.
The Audit Committee has reviewed the annual results of the Company for the year ended 31 December 2012.
Subsequent Events
On 1 January 2013, the Company merged its two subsidiaries, Energy Resources Mining LLC and Energy Resources Road LLC, with Energy Resources LLC with the purpose of streamlining the Group’s accounting, operations and overhead and eliminating extraneous subsidiary companies. As a result of the merger, Energy Resources Mining LLC and Energy Resources Road LLC are being liquidated upon the finalisation of the relevant legal and registration procedures.

50
Publication of Information on the Stock Exchange’s Website and the Company’s Website
This annual results announcement is published on the websites of the Stock Exchange (www.hkexnews.hk) and the Company (www.mmc.mn), and the annual report of the Company for the year ended 31 December 2012 will be despatched to shareholders of the Company and published on the respective websites of the Stock Exchange and the Company in due course.
By Order of the BoardMongolian Mining Corporation
Odjargal JambaljamtsChairman
Hong Kong, 11 March 2013
As at the date of this announcement, the Board consists of Mr. Odjargal Jambaljamts and Dr. Battsengel Gotov, being the executive Directors, Dr. Oyungerel Janchiv, Mr. Batsaikhan Purev, Mr. Od Jambaljamts and Ms. Enkhtuvshin Gombo, being the non-executive Directors, and Mr. Ochirbat Punsalmaa, Mr. Unenbat Jigjid and Mr. Chan Tze Ching, Ignatius, being the independent non-executive Directors.


