Embed Size (px)
Citation preview

page proof
1
Mapping Student VictimizationAstor, Benbenishty, and Meyer
International data suggests that the most success-ful violence prevention programs are adapted tofit a specific school site and involve all of the con-stituents in a school setting. In contrast to many ofthe popular skills-based programs that are com-monly implemented in schools across the UnitedStates, the authors explore the utility of combiningmonitoring and mapping techniques to prevent spe-cific forms of school violence and aggression inspecific spaces and times in school. Examples ofthe successful implementation of monitoring andmapping techniques in schools are provided.
EDUCATORS CAN PLAY A critical role in shaping and implementing policy, interventions, andprocedures that make U.S. schools safer. This arti-cle discusses the use of two processes, monitoringand mapping, to help school professionals creategrass roots programs, empower students and teach-ers, and use school site data to adapt programs,evaluate interventions, and debate school safetyissues.
Using Monitoring and Mappingto Develop and Implement
School Safety ProgramsGiven the vast array of behaviors considered
to be school “violence,” how does a school knowwhat kind of violence problem it has? When doesa specific school cross the threshold from havingan average level of school violence to having ahigh level? Conversely, how do we know when aschool is considered a model safe school? Whatkind of violence prevention program should aschool select? If a violence prevention program isimplemented, how do we know it is effective?These are not abstract, moral, or academic issuesalone. Several state and national politicians, orga-nizations, and task forces have declared publiclythat punitive measures should be taken againstschools that are unsafe (shut them down, hire newstaff, etc.). Despite these developments, no one yethas put forth a clear set of criteria on what wouldconstitute an unsafe school district or school. Edu-cators’ participation in these philosophical discus-sions could add to the national dialogue becauseas a society, as practitioners, and as researcherswe must have agreed upon ways to understand whatis a safe or unsafe school. Without this shared un-derstanding it will be difficult to assess the suc-cess or failure of prevention/intervention programs.
A review of the school safety literature strong-ly suggests that programs should be developed and
Ron Avi Astor is an associate professor of social workand education at the University of Southern Califor-nia; Rami Benbenishty is a professor of social work atthe Hebrew University of Jerusalem; Heather Ann Mey-er is a lecturer and researcher at Wells College andCornell University.
Ron Avi AstorRami BenbenishtyHeather Ann Meyer
Monitoring and Mapping StudentVictimization in Schools
THEORY INTO PRACTICE, Volume 43, Number 1, Winter 2004Copyright © 2004 College of Education, The Ohio State University
page proof
2
THEORY INTO PRACTICE / Winter 2004Conflict Resolution and Peer Mediation
implemented in a process that would ensure theirrelevance and applicability to each specific site. Inour assessment, one reason for the promising re-sults of anti-bullying programs in Europe and Aus-tralia has to do with the implementation processand underlying philosophical approaches of theprograms (e.g., Sharp & Smith, 1994; Smith et al.,1999). Important assumptions of the bullying pro-grams center on the belief that (a) the efforts to“fit” a program to a school involves grassrootsparticipation, (b) students and teachers in the schoolneed to be empowered to deal with the problem,(c) democracy is the core of a good school safetyprogram, and (d) schools should demonstrate a pro-active vision surrounding the violence problem intheir buildings. The implementation of interven-tions or components of the program are slightlydifferent for each school site. These beliefs enableeach school to adapt the program or general prin-ciples to their unique demographic, philosophical,and organizational needs. This is a very differentprocess from many skills-oriented curricular ap-proaches used in the United States (Alexander &Curtis, 1995; Astor, Benbenishty, & Marachi, inpress; Larson, 1998).
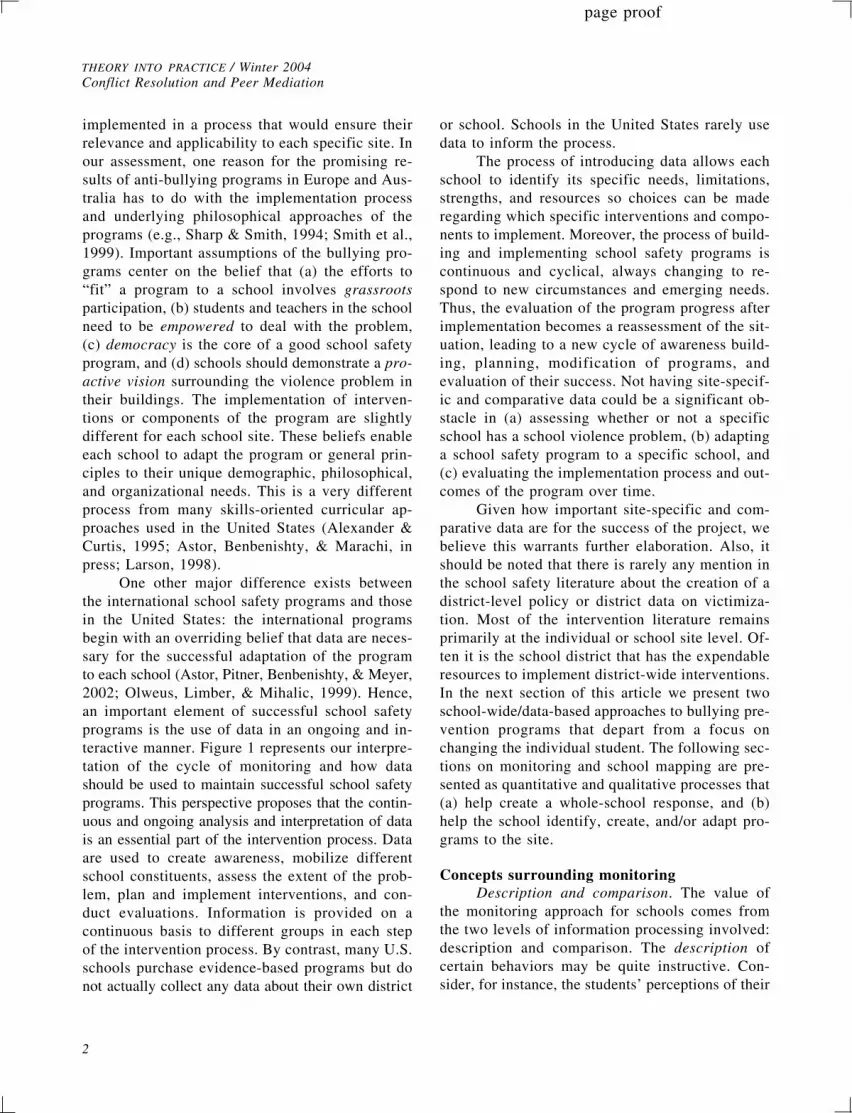
One other major difference exists betweenthe international school safety programs and thosein the United States: the international programsbegin with an overriding belief that data are neces-sary for the successful adaptation of the programto each school (Astor, Pitner, Benbenishty, & Meyer,2002; Olweus, Limber, & Mihalic, 1999). Hence,an important element of successful school safetyprograms is the use of data in an ongoing and in-teractive manner. Figure 1 represents our interpre-tation of the cycle of monitoring and how datashould be used to maintain successful school safetyprograms. This perspective proposes that the contin-uous and ongoing analysis and interpretation of datais an essential part of the intervention process. Dataare used to create awareness, mobilize differentschool constituents, assess the extent of the prob-lem, plan and implement interventions, and con-duct evaluations. Information is provided on acontinuous basis to different groups in each stepof the intervention process. By contrast, many U.S.schools purchase evidence-based programs but donot actually collect any data about their own district
or school. Schools in the United States rarely usedata to inform the process.
The process of introducing data allows eachschool to identify its specific needs, limitations,strengths, and resources so choices can be maderegarding which specific interventions and compo-nents to implement. Moreover, the process of build-ing and implementing school safety programs iscontinuous and cyclical, always changing to re-spond to new circumstances and emerging needs.Thus, the evaluation of the program progress afterimplementation becomes a reassessment of the sit-uation, leading to a new cycle of awareness build-ing, planning, modification of programs, andevaluation of their success. Not having site-specif-ic and comparative data could be a significant ob-stacle in (a) assessing whether or not a specificschool has a school violence problem, (b) adaptinga school safety program to a specific school, and(c) evaluating the implementation process and out-comes of the program over time.
Given how important site-specific and com-parative data are for the success of the project, webelieve this warrants further elaboration. Also, itshould be noted that there is rarely any mention inthe school safety literature about the creation of adistrict-level policy or district data on victimiza-tion. Most of the intervention literature remainsprimarily at the individual or school site level. Of-ten it is the school district that has the expendableresources to implement district-wide interventions.In the next section of this article we present twoschool-wide/data-based approaches to bullying pre-vention programs that depart from a focus onchanging the individual student. The following sec-tions on monitoring and school mapping are pre-sented as quantitative and qualitative processes that(a) help create a whole-school response, and (b)help the school identify, create, and/or adapt pro-grams to the site.
Concepts surrounding monitoringDescription and comparison. The value of
the monitoring approach for schools comes fromthe two levels of information processing involved:description and comparison. The description ofcertain behaviors may be quite instructive. Con-sider, for instance, the students’ perceptions of their

page proof
3
Mapping Student VictimizationAstor, Benbenishty, and Meyer
Figure 1: The Role of Data in the Development and Implementation of Interventions
Awareness
Evaluation
Implementation
Mobilization
Assessment
Planning
Data GatheringAnalysis
Dissemination
Figure 1. The Role of Data in the Development and Implementation of Interventions

page proof
4
THEORY INTO PRACTICE / Winter 2004Conflict Resolution and Peer Mediation
teachers’ responses when a student complains aboutbullying. The description of these responses mayreveal that one fourth of the students describe theresponse as ignoring the complaint, one third por-tray the response as blaming the victim, and therest describe a variety of caring and effective re-sponses. This distribution is informative and hasdirect implications for training school staff.
In general, comparisons enhance the valueof information by putting it in context. In order todesign an intervention plan and prioritize resourceallocation, it is imperative to ascertain which vio-lent acts are more prevalent than others, whichgrade levels are victimized more, how violence lev-els in a specific school compare with other schoolsin the district, and how a particular district com-pares with the state and nation in terms of the se-verity of its school violence. Furthermore, afterresources are allocated, it is important to examinehow current levels of violence compare with thosereported a year ago. In our model, we make com-parisons across several dimensions (i.e., withinschools, across groups, within a district, etc.).
Monitoring at the school district level:Practical examples
The two lead authors of this article (Benben-ishty and Astor) conducted a multi-year project ex-amining the uses of data for the Hertzelia SchoolDistrict in Israel. The district annually surveyedall of their students. Therefore, each school hadcomparative data for specific types of perpetrationand victimization involved with bullying. Theschool violence and bullying data were then pro-vided to each of 29 schools in the district to in-form assessment, planning, and evaluation ofgrassroots projects developed by the teachers andstudents in each school. Schools in this project wereable to compare themselves by grades, gendergroups, and between other schools in their district.We will highlight the advantages of such an ap-proach for school safety interventions.
Comparing a school site to district student vic-timization norms. One school wanted to know how itcompared with other schools in its district on specif-ic kinds of bullying/victim behaviors. The local me-dia was suggesting that this specific school hadproblems with sexual harassment bullying behaviors.
Prior to monitoring, the school staff was not sureif their school had similar or higher rates than thedistrict norms. Consequently, the information fromFigure 2 was helpful because it showed that theschool was lower than the district average on ev-ery sexual harassment item. This informationhelped teachers, parents, and the media situate theextent of the school problem within their districtand counter harmful media stereotypes about thisschool with regard to sexual harassment. The dataalso raised awareness about which types of behav-iors were most prevalent in their school (e.g., un-wanted sexual touching, unwanted removal of partsof clothing). The issues presented in the data werebrought to the teachers, students, and principal inforums where they could discuss what could andshould be done to address the issue. The schoolthen focused on developing interventions aroundthese data. After several months of interventions,these behaviors were measured again to see if thenew policies and grassroots interventions reducedthe prevalence of sexual harassment behaviors intheir school.
Assessment: Identifying target groups. Iden-tifying specific target groups for interventions isanother way data can and should be used. Districtadministrators were particularly interested in know-ing if students in their district who were victim-ized were also perpetrators. Students who were bothbullies and victims could require different types ofinterventions. Some of this concern came from thenumerous U.S. school shootings that received me-dia attention in the late 1990s (Gegax, Adler, &Pedersen, 1998; Sack, 1999; Verhovek, 1999).
Figure 3 shows the percent of students in thisdistrict that reported being both victims and perpe-trators of violence by grade and gender. It demon-strates two distinct patterns for boys and girls whofit the criteria of “high” victimization and perpe-tration in their district. The data suggests that farmore boys than girls fit the dual criteria. Girls whowere both victims and perpetrators had relativelystable rates over time. Boys who fit the criteriahad greater variability from a high of 30% in 7thgrade to a low of 15% in 12th grade. This suggeststhat there may be a need to have gender-specificstrategies when targeting students who were bothvictims and perpetrators, and that prevention programs

page proof
5
Mapping Student VictimizationAstor, Benbenishty, and Meyer
Fig
ure
2:
Se
xu
al
Ha
ras
sm
en
t: A
Co
mp
ari
so
n B
etw
ee
n t
he
Sc
ho
ol
an
d D
istr
ict
0%
2%
4%
6%
8%
10%
12%
14%
Sh
ow
po
rno
gra
ph
y o
r se
nt
ob
sce
ne
lett
ers
Sp
rea
d s
exu
al
rum
ors
ab
ou
t yo
u
Stu
de
nts
pe
ep
ed
in
th
e l
ock
er
or
bath
room
Stu
de
nts
ma
de
un
wa
nte
d s
exu
al
com
me
nts
A s
tud
en
t tr
ied
to
kis
s yo
u w
itho
ut
you
r co
nse
nt
A s
tud
en
t tr
ied
to
to
uch
yo
u w
itho
ut
you
r co
nse
nt
A s
tud
en
t tr
ied
to
re
mo
ve p
art
of
you
r cl
oth
s w
itho
ut
you
r co
nse
nt
Thr
eate
ned
to s
prea
d ru
mor
s ab
out
you
if
you
do
no
t co
nse
nt
Th
rea
ten
ed
to
hu
rt y
ou
ph
ysic
ally
if
you
do
no
t co
nse
nt
At
lea
st
on
ce
la
st
mo
nth
Sch
oo
l D
istr
ict
.
Fig
ure
2.
Sex
ual
Har
assm
ent:
A C
ompa
riso
n B
etw
een
the
Sch
ool
and
Dis
tric
t
At
lea s
t on
c e a
mon
th

page proof
6
THEORY INTO PRACTICE / Winter 2004Conflict Resolution and Peer Mediation
Fig
ure
3:
Per
cen
t o
f S
tud
ents
in D
istr
ict
Wh
o R
epo
rt H
igh
Vic
tim
izat
ion
by
Gra
de
and
Gen
der
02468
10
12
14
16
18
20
22
24
26
28
30
32
45
67
89
10
11
Gra
de
Percent
Mal
e
Fem
ale
.
Gra
de
Fig
ure
3.
Per
cent
of
Stu
dent
s in
Dis
tric
t W
ho R
epor
t H
igh
Vic
tim
izat
ion
by G
rade
and
Gen
der
Percent

page proof
7
Mapping Student VictimizationAstor, Benbenishty, and Meyer
should begin at least by the 4th grade. This infor-mation was extremely helpful for the district inaddressing their particular concerns surroundingstudents who were both bullies and victims. As aresult, teachers and parents decided to develop pol-icies and procedures focused on the process ofprovocation and retribution. They also had forumswhere teachers and students could address ways tohelp students who were both bullies and victims.
Evaluation: Assessing change following in-terventions. A school could use this monitoringsystem to identify particular problem areas in theirschool. They could then track progress in reducingbullying in this location over time. For example,one junior high school wanted to know where vio-lence occurred most frequently. This school used thedata to develop specific interventions generated byteachers and students around certain locations (e.g.,increased monitoring, school beautification projects,alterations to the schedule so there were less studentsin the hallways at the same time). Then the progressin terms of reducing violence in specific areas intheir school over time was monitored. Figure 4 rep-resents a comparison between the 1999-2000 and2000-2001 academic years in a school that imple-mented intervention programs during 2000-2001. Fig-ure 4 suggests that the students’ perceptions of dangerdecreased in all the targeted areas when comparedto the prior year, before the intervention was initi-ated. This was not readily evident by data collect-ed from focus groups. Figure 4 represented theviews of the entire student body.
Concepts Surrounding MappingViolence-Prone Locations
Undefined public spaces. There are manyspaces in schools, such as auditoriums, play-grounds, and lunchrooms, where both staff and stu-dents congregate. However, because of the socialhierarchy, mission, and professional roles and struc-ture of schools, these spaces may not foster infor-mal interactions among students or betweenstudents and staff. Furthermore, school profession-als may not believe it is their role to interact withstudents in these spaces unless administrators haveassigned them to monitor those times and spaces.
Consequently, we believe an important con-cept in understanding school violence is undefined
public space (Newman, 1973, 1995; Newman &Franck, 1982). This concept asserts that within anycommunity there are physical areas that may notbe seen as anyone’s responsibility to monitor ormaintain. In his early studies of housing projects,for example, Newman (1973, 1995) found that mostcriminal activity occurred in semipublic, undefinedareas of buildings (e.g., lobbies, stairwells, halls,and elevators).
Previous studies on school violence have sug-gested that violent events occur repeatedly in spe-cific places in and around school buildings (Arnette& Walsleben, 1998; Astor, Meyer, & Behre, 1999;Lockwood, 1997). Some studies in the UnitedStates and abroad have suggested that students whoattend urban schools report the highest rates of avoid-ing particular areas in and around their school due tofear (e.g., Astor, Benbenishty, Zeira, & Vinokur,2002; Benbenishty, Astor, Zeira, & Vinokur, 2002;Chandler, Chapman, Rand, & Taylor, 1998). Astor,Meyer, and Behre (1999) found that violence-proneareas in high schools were also “undefined” and“unowned” by members of the school community(i.e., students, teachers, staff, and parents).
The concepts of territoriality and undefinedspace could have theoretical and practical implica-tions for school-related spaces such as hallways,cafeterias, playgrounds, or routes to and fromschool. One obvious and important strategy im-plied by this approach is to identify these loca-tions and work with members of the community toreclaim them. Are certain school spaces violence-prone due to a lack of perceived student or adultresponsibility for keeping these areas safe? If so,can these spaces be reclaimed by students andteachers simply by identifying them and develop-ing strategies around the behaviors that occur inthose spaces?
Applications of MappingThis procedure is designed to involve school
constituents in revealing how bullying/victimiza-tion issues and other forms of violence within aschool building interact with locations, patterns ofthe school day, and social organizational variables(e.g., teacher and student relationships, teachers’professional roles, and the school’s organizationalresponse to violence. An important goal of this

page proof
8
THEORY INTO PRACTICE / Winter 2004Conflict Resolution and Peer Mediation
Fig
ure
4: S
peci
fic P
lace
s P
erce
ived
by
Stu
dent
s to
be
Dan
gero
us in
a S
choo
l by
Sch
ool Y
ear
05
1015
2025
Re
gu
lar
cla
ss
Cla
ss w
ith a
su
bst
itute
te
ach
er
Sch
oo
l ya
rd
Ga
te i
n t
he
be
gin
nin
g o
f th
e d
ay
Ga
te a
t th
e e
nd
of
the
da
y
Sch
oo
l co
rrid
ors
Wa
y to
an
d f
rom
sch
oo
l
Re
stro
om
s
Ca
fete
ria
Pe
rce
nt
of
Stu
de
nts
Ra
ting
'Qu
ite D
an
ge
rou
s' &
'Da
ng
ero
us'
1999
/200
0
2000
/200
1
.Fig
ure
4.
Spe
cifi
c P
lace
s pe
rcei
ved
by S
tude
nts
to b
e D
ange
rous
in
a S
choo
l by
Sch
ool
Yea
r

page proof
9
Mapping Student VictimizationAstor, Benbenishty, and Meyer
procedure is to allow students and teachers to con-vey their personal theories about why specific lo-cations and times in their schools are moredangerous. This approach assumes that students,teachers, school staff, and administrators have im-portant information that should be the foundationfor setting specific interventions. Most successfulbullying prevention programs involve a spatial andtemporal analysis because many of the interven-tions are centered around specific bullying/victim-ization prone locations.
Mapping, interviews, and interventions. Thefirst step in this assessment procedure is obtaining amap of the school. Ideally, the map should containall internal school territory and the areas surroundingthe school and playground facilities. In some com-munities where the routes to and from school aredangerous, a simple map of the surrounding neigh-borhood may be added to the assessment process (seeMeyer & Astor, in press, for a description of thisprocess). The school maps are an essential part of theinterviewing process in order to anchor discussionsto places and times in ways that interviews aboutissues alone cannot. The focus groups should beginwith the facilitator distributing two sets of identicalschool maps to each individual.
Map A and B. Two photocopied maps of theschool are needed for each student and teacher.The first map should be used to determine wherestudents and teachers believe the most bullyingevents in or around the school building occur. Par-ticipants should be asked to identify on the mapsthe locations of up to three of the most violentevents that have occurred within the past academicyear. Next to each event marked on the map, par-ticipants should be asked to write the followinginformation:
1. the general time frame of the event (e.g., beforeschool, after school, morning period, afternoonperiod, between classes, etc.)
2. the grade and gender of those involved in theviolence
3. their knowledge of any organizational responseto the event (e.g., sent to principal’s office, sus-pended, sent to peer counselor, nothing, etc.)
On the second map, members should be asked tocircle areas or territories they perceive to be unsafe
or potentially dangerous. This second map providesinformation about areas within the school that par-ticipants avoid or fear even though they may notpossess knowledge of a particular event.
Discussion of violent events and areas. Thefirst part of the group discussion should center onthe specific bullying events and the areas markedas unsafe or dangerous on their personal maps. Wehave asked questions such as, “Are there timeswhen those places you’ve marked on the maps areless safe?” “Is there a particular group of studentsthat is more likely to get hurt there?” “Why doyou think that area has so many incidents involv-ing bullies and victims?” The overall purpose ofthe group interviews is to explore why bullying orvictimization occurs at those specific times and inthose specific spaces. Consequently, the interviewquestions should also focus on gathering informa-tion regarding the organizational response to theevent (e.g., “What happened to the students afterthe event?” or “Did the hall monitors intervenewhen they saw what happened?”), procedures (e.g.,“What happens when the students are sent to theoffice after a fight?”; “Did anyone call the parentsof the bully or victim?”), follow-up (e.g., “Do theteachers, hall monitors, and/or administrators fol-low up on any consequences given to the students?”or “Did anyone check on the welfare of the vic-tim?”), and clarity of procedures (e.g., “Does itmatter who stops the bullying—a volunteer, secu-rity guard, teacher, or principal?”).
Interviewers should also explore participants’ideas for solutions to the specific bullying prob-lems (e.g., “Can you think of ways to avoid bully-ing or victimization in that place?” or “If you werethe principal what would you do to make that placesafer?”). In addition, the interviewer should ex-plore any obstacles participants foresee with im-plementation (e.g., “Do you think that type of planis realistic?” “Has that been tried before? Whathappened?” or “Do you think that plan wouldwork?”). Such obstacles could range from issuesrelated to roles (e.g., “It’s not my job to monitorstudents during lunch.”), to discipline policy andissues of personal safety (e.g., “I don’t want tointervene because I may get hurt.”).
In schools that already have programs designedto address school violence, specific questions should

page proof
10
THEORY INTO PRACTICE / Winter 2004Conflict Resolution and Peer Mediation
be asked about the effectiveness of those interven-tions, why they work or do not work, and whatcould be done to make the current measures moreeffective. We recommend that the interviewer askboth subjective questions (e.g., “Do you think theanti-bullying program is working? Why do youthink it works or why does it not work?”) as well asspecific questions related to the reduction of bully-ing/victimization (e.g., “Do you believe the anti-bullyprogram has reduced the number of bullying eventson the playground? Why or why not?”).
Transferring all of the reported events ontoone large map of the school enables students andstaff to locate specific hot spots for violence anddangerous time periods within each individualschool. The combined data are presented to allschool constituents, and they are asked to onceagain discuss and interpret the maps. Teachers andstudents use the maps and interviews to suggestways to improve the settings.
Compiling all the interview suggestions intothemes is an important second step in creating con-text-relevant interventions. Students, teachers, andadministrators may have differing viewpoints re-garding the organizational response of the schoolwhen victimization happened. Relaying the diver-sity of responses to students, teachers, and admin-istrators can provide an opportunity for reflectionand may generate ways to remedy the bullying/victimization problem in certain situations. Whenthe data is presented, students, teachers, and ad-ministrators can center their discussions on whythose areas are dangerous and what kinds of inter-ventions could make the location safer. The dataare collected and used in different stages of theprocess outlined in Figure 1. Both the monitoringand mapping methods provide data-based approach-es to gathering information about bullying/victimiza-tion in schools. Moreover, they provide site-specificinformation, which makes it easier for schools toaddress these problems.
ConclusionOne major difference between international
bullying/victimization programs and ones in theUnited States are that the international programsare based on school site data. Therefore, all inter-ventions are (a) created and adapted to fit the school
site and (b) involve the entire school setting. Thisrequires a high degree of commitment and aware-ness of school staff to change the organizationalresponse of the school to bullying. Many of thecurrently popular U.S. anti-school violence pro-grams are curricular-based and geared at improv-ing students’ social skills. Few U.S. violenceprevention programs are focused on altering thewhole school climate, policy, and procedures.Moreover, few U.S. programs involve the princi-pal and the entire teaching staff during the adapta-tion and implementation phase. Programs that focuson the entire school community have a greater like-lihood of being sustained over time and showingsignificant reductions in victimization.
ReferencesAlexander, R., & Curtis, C.M. (1995). A critical re-
view of strategies to reduce school violence. So-cial Work in Education, 17, 73-82.
Arnette, J., & Walsleben, M. (1998). Combating fearand restoring safety in schools. (NCJ-167888).Washington, DC: Office of Juvenile Justice andDelinquency Prevention.
Astor, Benbenishty, & Marachi (in press). Add com-plete reference.
Astor, R.A., Benbenishty, R., Zeira, A., & Vinokur, A.(2002). School climate, observed risky behaviors,and victimization as predictors of high school stu-dents’ fear and judgments of school violence as aproblem. Health Education and Behavior, 29(6),716-736.
Astor, R.A., Meyer, H.A., & Behre, W.J. (1999). Un-owned places and times: Maps and interviewsabout violence in high schools. American Educa-tional Research Journal, 36, 3-42.
Astor, Pitner, Benbenishty, & Meyer. (2002). Add com-plete reference.
Benbenishty, R., & Astor, R.A. (in press). Cultural spe-cific and cross-cultural bully/ victim patterns. InP.K. Smith (Ed.), Violence in schools: The re-sponse in Europe. London: Routledge.
Benbenishty, R., Astor, R.A., Zeira, A., & Vinokur, A.(2002). Perceptions of violence and fear of schoolattendance among junior high school students inIsrael. Social Work Research, 26(2), 71-88.
Chandler, K., Chapman, C., Rand, M., & Taylor, B.(1998). Students’ reports of school crime: 1989and 1995 (National Center for Education Statis-tics 98-241). Washington, DC: U.S. Departmentsof Education and Justice.
Gegax, T., Adler, J., & Pedersen, D. (1998, April 6).The boys behind the ambush. Newsweek, 131, 21-24.

page proof
11
Mapping Student VictimizationAstor, Benbenishty, and Meyer
Larson, J. (1998). Managing student aggression in highschools: Implications for practice. Psychology inthe Schools, 35, 283-295.
Lockwood, D. (1997). Violence among middle schooland high school students: An analysis of implica-tions for prevention. Washington DC: U.S. De-partment of Justice, Office of Justice Programs,National Institute for Justice.
Meyer, H.A., & Astor, R.A. (in press). Child and par-ent perspectives on routes to and from school inhigh crime neighborhoods. Journal of School Vio-lence.
Newman, O. (1973). Architectural design for crime pre-vention. Washington, DC: U.S. Department of Jus-tice.
Newman, O. (1995). Defensible space: A new physicalplanning tool for urban revitalization. Journal ofthe American Planning Association, 61, 149-155.
Newman, O., & Franck, K.A. (1982). The effect ofbuilding size on personal crime and fear of crime.Population and Environment, 5, 203-220.
Olweus, D., Limber, S., & Mihalic, S.F. (1999). Blue-prints for violence prevention, book nine: Bully-ing prevention program. Boulder, CO: Center forthe Study and Prevention of Violence.
Sack, K. (1999, May 21). Youth with 2 guns shoots 6at Georgia school. The New York Times, p. 1.
Sharp, S., & Smith, P. (1994). Tackling bullying inyour school: A practical handbook for teachers.London: Routledge.
Smith, P., Morita, Y., Junger-Tas, J., Olweus, D., Cat-alano, R., & Slee, P. (1999). The nature of schoolbullying: A cross-national perspective. New York:Routledge.
Verhovek, S. (1999, April 23). Terror in Littleton: TheOverview. The New York Times, p. A1.


