Embed Size (px)
Citation preview

Morningstar® Document Research℠
FORM 10-KGENERAL MILLS INC - GIS
Filed: June 29, 2017 (period: May 28, 2017)
Annual report with a comprehensive overview of the company
The information contained herein may not be copied, adapted or distributed and is not warranted to be accurate, complete or timely. The userassumes all risks for any damages or losses arising from any use of this information, except to the extent such damages or losses cannot belimited or excluded by applicable law. Past financial performance is no guarantee of future results.

Table of Contents
UNITED STATES
SECURITIES AND EXCHANGE COMMISSIONWashington, D.C. 20549
FORM 10-K ☒ ANNUAL REPORT PURSUANT TO SECTION 13 OR 15(d) OF THE SECURITIES EXCHANGE ACT OF 1934 FOR THE FISCAL YEAR ENDED
May 28, 2017
☐ TRANSITION REPORT PURSUANT TO SECTION 13 OR 15(d) OF THE SECURITIES EXCHANGE ACT OF 1934 FOR THE TRANSITION PERIODFROM TO
Commission file number: 001-01185
GENERAL MILLS, INC.(Exact name of registrant as specified in its charter)
Delaware 41-0274440
(State or other jurisdiction of (I.R.S. Employerincorporation or organization) Identification No.)
Number One General Mills Boulevard Minneapolis, Minnesota 55426
(Address of principal executive offices) (Zip Code)
(763) 764-7600(Registrant’s telephone number, including area code)
Securities registered pursuant to Section 12(b) of the Act:
Title of each class Name of each exchange
on which registeredCommon Stock, $.10 par value New York Stock ExchangeFloating Rate Notes due 2020 New York Stock Exchange
2.100% Notes due 2020 New York Stock Exchange1.000% Notes due 2023 New York Stock Exchange1.500% Notes due 2027 New York Stock Exchange
Securities registered pursuant to Section 12(g) of the Act: None
Indicate by check mark if the registrant is a well-known seasoned issuer, as defined in Rule 405 of the Securities Act. Yes ☒ No ☐
Indicate by check mark if the registrant is not required to file reports pursuant to Section 13 or Section 15(d) of the Act. Yes ☐ No ☒
Indicate by check mark whether the registrant (1) has filed all reports required to be filed by Section 13 or 15(d) of the Securities Exchange Act of 1934during the preceding 12 months (or for such shorter period that the registrant was required to file such reports), and (2) has been subject to such filingrequirements for the past 90 days. Yes ☒ No ☐
Indicate by check mark whether the registrant has submitted electronically and posted on its corporate website, if any, every Interactive Data File required tobe submitted and posted pursuant to Rule 405 of Regulation S-T during the preceding 12 months (or for such shorter period that the registrant was required tosubmit and post such files). Yes ☒ No ☐
Indicate by check mark if disclosure of delinquent filers pursuant to Item 405 of Regulation S-K is not contained herein, and will not be contained, to the bestof registrant’s knowledge, in definitive proxy or information statements incorporated by reference in Part III of this Form 10-K or any amendment to this Form10-K. ☐
Indicate by check mark whether the registrant is a large accelerated filer, an accelerated filer, a non-accelerated filer, or a smaller reporting company. See thedefinitions of “large accelerated filer,” “accelerated filer” and “smaller reporting company” in Rule 12b-2 of the Exchange Act. (Check one): Large accelerated filer ☒ Accelerated filer ☐Non-accelerated filer ☐ (Do not check if a smaller reporting company) Smaller reporting company ☐Emerging growth company ☐
If an emerging growth company, indicate by check mark if the registrant has elected not to use the extended transition period for complying with any new orrevised financial accounting standards provided pursuant to Section 13(a) of the Exchange Act. ☐
Indicate by check mark whether the registrant is a shell company (as defined in Rule 12b-2 of the Act). Yes ☐ No ☒
Aggregate market value of Common Stock held by non-affiliates of the registrant, based on the closing price of $62.30 per share as reported on the New YorkStock Exchange on November 28, 2016 (the last business day of the registrant’s most recently completed second fiscal quarter): $36,148.9 million.
Number of shares of Common Stock outstanding as of June 9, 2017: 577,099,679 (excluding 177,513,649 shares held in the treasury).
DOCUMENTS INCORPORATED BY REFERENCE
Portions of the registrant’s Proxy Statement for its 2017 Annual Meeting of Shareholders are incorporated by reference into Part III.
Source: GENERAL MILLS INC, 10-K, June 29, 2017 Powered by Morningstar® Document Research℠The information contained herein may not be copied, adapted or distributed and is not warranted to be accurate, complete or timely. The user assumes all risks for any damages or losses arising from any use of this information,except to the extent such damages or losses cannot be limited or excluded by applicable law. Past financial performance is no guarantee of future results.

Table of Contents
Table of Contents Page Part I
Item 1 Business 3
Item 1A Risk Factors 7
Item 1B Unresolved Staff Comments 11
Item 2 Properties 12
Item 3 Legal Proceedings 12
Item 4 Mine Safety Disclosures 12
Part II
Item 5 Market for Registrant’s Common Equity, Related Stockholder Matters and Issuer Purchases of Equity Securities 13
Item 6 Selected Financial Data 14
Item 7 Management’s Discussion and Analysis of Financial Condition and Results of Operations 15
Item 7A Quantitative and Qualitative Disclosures About Market Risk 46
Item 8 Financial Statements and Supplementary Data 48
Item 9 Changes in and Disagreements With Accountants on Accounting and Financial Disclosure 99
Item 9A Controls and Procedures 99
Item 9B Other Information 100
Part III
Item 10 Directors, Executive Officers and Corporate Governance 100
Item 11 Executive Compensation 100
Item 12 Security Ownership of Certain Beneficial Owners and Management and Related Stockholder Matters 100
Item 13 Certain Relationships and Related Transactions, and Director Independence 101
Item 14 Principal Accounting Fees and Services 101
Part IV
Item 15 Exhibits, Financial Statement Schedules 101
Item 16 Form 10-K Summary 104
Signatures 105
2
Source: GENERAL MILLS INC, 10-K, June 29, 2017 Powered by Morningstar® Document Research℠The information contained herein may not be copied, adapted or distributed and is not warranted to be accurate, complete or timely. The user assumes all risks for any damages or losses arising from any use of this information,except to the extent such damages or losses cannot be limited or excluded by applicable law. Past financial performance is no guarantee of future results.

Table of Contents
PART I ITEM 1 Business
General Mills, Inc. was incorporated in Delaware in 1928. The terms “General Mills,” “Company,” “registrant,” “we,” “us,” and “our” mean General Mills,Inc. and all subsidiaries included in the Consolidated Financial Statements in Item 8 of this report unless the context indicates otherwise.
Certain terms used throughout this report are defined in a glossary in Item 8 of this report.
COMPANY OVERVIEW
We are a leading global manufacturer and marketer of branded consumer foods sold through retail stores. We also are a leading supplier of branded andunbranded food products to the North American foodservice and commercial baking industries. We manufacture our products in 13 countries and marketthem in more than 100 countries. In addition to our consolidated operations, we have 50 percent interests in two strategic joint ventures that manufacture andmarket food products sold in more than 130 countries worldwide.
We manage and review the financial results of our business under four operating segments: North America Retail; Convenience Stores & Foodservice;Europe & Australia; and Asia & Latin America. See Management’s Discussion and Analysis of Financial Condition and Results of Operations (MD&A) inItem 7 of this report for a description of our segments and certain changes made to our segments in fiscal 2017. For financial information by segment andgeographic area, see Note 16 to the Consolidated Financial Statements in Item 8 of this report.
We offer a variety of food products that provide great taste, nutrition, convenience and value for consumers around the world, with a focus on five largeglobal categories: • ready-to-eat cereal; • convenient meals, including meal kits, ethnic meals, pizza, soup, side dish mixes, frozen breakfast, and frozen entrees; • snacks, including grain, fruit and savory snacks, nutrition bars, and frozen hot snacks; • yogurt; and • super-premium ice cream.
Other significant product categories include: • baking mixes and ingredients; and • refrigerated and frozen dough.
Our Cereal Partners Worldwide (CPW) joint venture with Nestlé S.A. (Nestlé) competes in the ready-to-eat cereal category in markets outside North America,and our Häagen-Dazs Japan, Inc. (HDJ) joint venture competes in the super-premium ice cream category in Japan. For net sales contributed by each class ofsimilar products, see Note 16 to the Consolidated Financial Statements in Item 8 of this report.
Customers. Our primary customers are grocery stores, mass merchandisers, membership stores, natural food chains, drug, dollar and discount chains, e-commerce grocery providers, commercial and noncommercial foodservice distributors and operators, restaurants, and convenience stores. We generally sell tothese customers through our direct sales force. We use broker and distribution arrangements for certain products and to serve certain types of customers. Forfurther information on our customer credit and product return practices, please refer to Note 2 to the Consolidated Financial Statements in Item 8 of thisreport. During fiscal 2017, Wal-Mart Stores, Inc. and its affiliates (Wal-Mart) accounted for 20 percent of our consolidated net sales and 29 percent of netsales of our North America Retail segment. No other customer accounted for 10 percent or more of our consolidated net sales. For further information onsignificant customers, please refer to Note 7 to the Consolidated Financial Statements in Item 8 of this report.
Competition. The consumer foods industry is highly competitive, with numerous manufacturers of varying sizes in the United States and throughout theworld. The food categories in which we participate also are very competitive. Our principal competitors in these categories all have substantial financial,marketing, and other resources. Competition in our product categories is based on product
3
Source: GENERAL MILLS INC, 10-K, June 29, 2017 Powered by Morningstar® Document Research℠The information contained herein may not be copied, adapted or distributed and is not warranted to be accurate, complete or timely. The user assumes all risks for any damages or losses arising from any use of this information,except to the extent such damages or losses cannot be limited or excluded by applicable law. Past financial performance is no guarantee of future results.

Table of Contents
innovation, product quality, price, brand recognition and loyalty, effectiveness of marketing, promotional activity, and the ability to identify and satisfyconsumer preferences. Our principal strategies for competing in each of our segments include unique consumer insights, effective customer relationships,superior product quality, innovative advertising, product promotion, product innovation aligned with consumers’ needs, an efficient supply chain, and price.In most product categories, we compete not only with other widely advertised, branded products, but also with regional brands and with generic and privatelabel products that are generally sold at lower prices. Internationally, we compete with both multi-national and local manufacturers, and each countryincludes a unique group of competitors.
Raw materials, ingredients, and packaging. The principal raw materials that we use are grains (wheat, oats, and corn), sugar, dairy products, vegetables,fruits, meats, nuts, vegetable oils, and other agricultural products. We also use substantial quantities of carton board, corrugated, plastic and metal packagingmaterials, operating supplies, and energy. Most of these inputs for our domestic and Canadian operations are purchased from suppliers in the United States. Inour international operations, inputs that are not locally available in adequate supply may be imported from other countries. The cost of these inputs mayfluctuate widely due to external conditions such as weather, product scarcity, limited sources of supply, commodity market fluctuations, currencyfluctuations, and changes in governmental agricultural and energy policies and regulations. We have some long-term fixed price contracts, but the majorityof our inputs are purchased on the open market. We believe that we will be able to obtain an adequate supply of needed inputs. Occasionally and wherepossible, we make advance purchases of items significant to our business in order to ensure continuity of operations. Our objective is to procure materialsmeeting both our quality standards and our production needs at price levels that allow a targeted profit margin. Since these inputs generally represent thelargest variable cost in manufacturing our products, to the extent possible, we often manage the risk associated with adverse price movements for some inputsusing a variety of risk management strategies. We also have a grain merchandising operation that provides us efficient access to, and more informedknowledge of, various commodity markets, principally wheat and oats. This operation holds physical inventories that are carried at net realizable value anduses derivatives to manage its net inventory position and minimize its market exposures.
RESEARCH AND DEVELOPMENT
Our research and development resources are focused on new product development, product improvement, process design and improvement, packaging, andexploratory research in new business and technology areas. Research and development expenditures were $218 million in fiscal 2017, $222 million in fiscal2016, and $229 million in fiscal 2015.
TRADEMARKS AND PATENTS
Our products are marketed under a variety of valuable trademarks. Some of the more important trademarks used in our global operations (set forth in italics inthis report) include Annie’s, Betty Crocker, Bisquick, Bugles, Cascadian Farm, Cheerios, Chex, Cinnamon Toast Crunch, Cocoa Puffs, Cookie Crisp, FiberOne, Food Should Taste Good, Fruit by the Foot, Fruit Gushers, Fruit Roll-Ups, Gardetto’s, Go-Gurt, Gold Medal, Golden Grahams, Häagen-Dazs, Helpers,Jeno’s, Jus-Rol, Kitano, Kix, La Salteña, Lärabar, Latina, Liberté, Lucky Charms, Muir Glen, Nature Valley, Oatmeal Crisp, Old El Paso, Pillsbury,Progresso, Raisin Nut Bran, Total, Totino’s, Trix, Wanchai Ferry, Wheaties, Yoki, and Yoplait. We protect these marks as appropriate through registrations inthe United States and other jurisdictions. Depending on the jurisdiction, trademarks are generally valid as long as they are in use or their registrations areproperly maintained and they have not been found to have become generic. Registrations of trademarks can also generally be renewed indefinitely as long asthe trademarks are in use.
Some of our products are marketed under or in combination with trademarks that have been licensed from others, including Reese’s Puffs for cereal, Hershey’sfor a variety of products, Green Giant for vegetables in certain countries, and Cinnabon for refrigerated dough, frozen pastries, and baking products. Our fruitsnacks business uses a variety of licensed trademarks, including Mott’s, Minions, Sunkist, Scooby Doo, Batman, Tom and Jerry, Hello Kitty, Thomas the TankEngine, and various Warner Bros. and Nickelodeon characters. Our yogurt business uses a variety of licensed trademarks, including various Disney, Marvel,Warner Bros., and Nickelodeon characters.
Our cereal trademarks are licensed to CPW and may be used in association with the Nestlé trademark. Nestlé licenses certain of its trademarks to CPW,including the Nestlé and Uncle Toby’s trademarks. The Häagen-Dazs trademark is licensed royalty-free and exclusively to Nestlé for ice cream and otherfrozen dessert products in the United States and Canada. The Häagen-Dazs trademark is also licensed to HDJ. The J. M. Smucker Company holds anexclusive royalty-free license to use the Pillsbury brand and the Pillsbury Doughboy character in the dessert mix and baking mix categories in the UnitedStates and under limited circumstances in Canada and Mexico.
The Yoplait trademark and other related trademarks are owned by Yoplait Marques SNC, an entity in which we own a 50 percent interest. These marks arelicensed exclusively to Yoplait SAS, an entity in which we own a 51 percent interest. Yoplait SAS licenses these trademarks to its franchisees. The Libertétrademark and other related trademarks are owned by Liberté Marques Sàrl, an entity in which we own a 50 percent interest.
4
Source: GENERAL MILLS INC, 10-K, June 29, 2017 Powered by Morningstar® Document Research℠The information contained herein may not be copied, adapted or distributed and is not warranted to be accurate, complete or timely. The user assumes all risks for any damages or losses arising from any use of this information,except to the extent such damages or losses cannot be limited or excluded by applicable law. Past financial performance is no guarantee of future results.

Table of Contents
We continue our focus on developing and marketing innovative, proprietary products. We consider the collective rights under our various patents, whichexpire from time to time, a valuable asset, but we do not believe that our businesses are materially dependent upon any single patent or group of relatedpatents.
SEASONALITY
In general, demand for our products is evenly balanced throughout the year. However, within our North America Retail segment demand for refrigerateddough, frozen baked goods, and baking products is stronger in the fourth calendar quarter. Demand for Progresso soup is higher during the fall and wintermonths. Internationally, within our Europe & Australia and Asia & Latin America segments, demand for Häagen-Dazs ice cream is higher during the summermonths and demand for baking mix and dough products increases during winter months. Due to the offsetting impact of these demand trends, as well as thedifferent seasons in the northern and southern hemispheres, our international segments’ net sales are generally evenly balanced throughout the year.
BACKLOG
Orders are generally filled within a few days of receipt and are subject to cancellation at any time prior to shipment. The backlog of any unfilled orders as ofMay 28, 2017, was not material.
WORKING CAPITAL
A description of our working capital is included in the Liquidity section of MD&A in Item 7 of this report. Our product return practices are described in Note2 to the Consolidated Financial Statements in Item 8 of this report.
EMPLOYEES
As of May 28, 2017, we had approximately 38,000 full- and part-time employees.
FOOD QUALITY AND SAFETY REGULATION
The manufacture and sale of consumer food products is highly regulated. In the United States, our activities are subject to regulation by various federalgovernment agencies, including the Food and Drug Administration, Department of Agriculture, Federal Trade Commission, Department of Commerce, andEnvironmental Protection Agency, as well as various state and local agencies. Our business is also regulated by similar agencies outside of the United States.
ENVIRONMENTAL MATTERS
As of May 28, 2017, we were involved with two active cleanup sites associated with the alleged or threatened release of hazardous substances or wasteslocated in Minneapolis, Minnesota and Moonachie, New Jersey.
Our operations are subject to the Clean Air Act, Clean Water Act, Resource Conservation and Recovery Act, Comprehensive Environmental Response,Compensation, and Liability Act, and the Federal Insecticide, Fungicide, and Rodenticide Act, and all similar state, local, and foreign environmental lawsand regulations applicable to the jurisdictions in which we operate.
Based on current facts and circumstances, we believe that neither the results of our environmental proceedings nor our compliance in general withenvironmental laws or regulations will have a material adverse effect upon our capital expenditures, earnings, or competitive position.
EXECUTIVE OFFICERS
The section below provides information regarding our executive officers as of June 29, 2017:
Richard C. Allendorf, age 56, is Senior Vice President, General Counsel, and Secretary. Mr. Allendorf joined General Mills in 2001 from The PillsburyCompany. He was promoted to Vice President, Deputy General Counsel in 2010, first overseeing the legal affairs of the U.S. Retail segment and ConsumerFood Sales and then, in August 2012, overseeing the legal affairs of the International segment and Global Ethics and Compliance. He was named to hispresent position in February 2015. Prior to joining General Mills, he practiced law with the Shearman and Sterling and Mackall, Crounse and Moore lawfirms. He was in finance with General Electric prior to his legal career.
5
Source: GENERAL MILLS INC, 10-K, June 29, 2017 Powered by Morningstar® Document Research℠The information contained herein may not be copied, adapted or distributed and is not warranted to be accurate, complete or timely. The user assumes all risks for any damages or losses arising from any use of this information,except to the extent such damages or losses cannot be limited or excluded by applicable law. Past financial performance is no guarantee of future results.

Table of Contents
John R. Church, age 51, is Executive Vice President, Supply Chain and Global Business Solutions; Chief Supply Chain Officer. Mr. Church joined GeneralMills in 1988 as a Product Developer in the Big G cereals division and held various positions before becoming Vice President, Engineering in 2003. In 2005,his role was expanded to include development of the Company’s strategy for the global sourcing of raw materials and manufacturing capabilities. He wasnamed Vice President, Supply Chain Operations in 2007, Senior Vice President, Supply Chain in 2008, Executive Vice President, Supply Chain in July 2013,and to his present position in June 2017.
Peter C. Erickson, age 56, is Executive Vice President, Innovation, Technology and Quality. Mr. Erickson joined General Mills in 1994 as part of theColombo yogurt acquisition. He has held various positions in Research & Development and became Vice President, Innovation, Technology and Quality in2003 and Senior Vice President, Innovation, Technology and Quality in 2006. He was named to his present position in July 2013.
Olivier Faujour, age 52, is Vice President; President, Dairy Strategic Brand Unit. Mr. Faujour joined General Mills in 2010 as a Vice President and ManagingDirector of France, Benelux and Southern Europe. Prior to joining General Mills, Mr. Faujour held global and national leadership positions at Danone andheld various marketing roles in the European and Latin America regions at Procter & Gamble. He was named to his present position in January 2017.
Jeffrey L. Harmening, age 50, is Chief Executive Officer. Mr. Harmening joined General Mills in 1994 and served in various marketing roles in the BettyCrocker, Yoplait, and Big G cereal divisions. He was named Vice President, Marketing for CPW in 2003 and a Vice President of the Big G cereal division in2007. In 2011, he was promoted to Senior Vice President for the Big G cereal division. Mr. Harmening was appointed Senior Vice President, Chief ExecutiveOfficer of CPW in 2012. Mr. Harmening returned from CPW in May 2014 and was named Executive Vice President, Chief Operating Officer, U.S. Retail. Hebecame President, Chief Operating Officer in July 2016, and was named to his present position in June 2017.
Christina Law, age 50, is Senior Vice President; Group President, Asia & Latin America. Ms. Law joined General Mills in November 2012 as Vice President;President, Asia, Middle East and Africa. Prior to joining General Mills, Ms. Law held various marketing and general management roles around the globe withJohnson & Johnson and Procter & Gamble. She was named to her current position in January 2017.
Donal L. Mulligan, age 56, is Executive Vice President, Chief Financial Officer. Mr. Mulligan joined General Mills in 2001 from The Pillsbury Company. Heserved as Vice President, Financial Operations for our International division until 2004, when he was named Vice President, Financial Operations forOperations and Technology. Mr. Mulligan was appointed Treasurer in 2006 and Senior Vice President, Financial Operations in 2007. He was elected to hispresent position in 2007. From 1987 to 1998, he held several international positions at PepsiCo, Inc. and YUM! Brands, Inc. Mr. Mulligan is a director ofTennant Company.
Kimberly A. Nelson, age 54, is Senior Vice President, External Relations, and President of the General Mills Foundation. Ms. Nelson joined General Mills in1988 and has held marketing leadership roles in the Big G cereal, Snacks, and Meals divisions. She was elected Vice President; President, Snacks in 2004,Senior Vice President; President, Snacks in 2008, and Senior Vice President, External Relations in 2010. She was named President of the General MillsFoundation in 2011.
Jon J. Nudi, age 47, is Group President, North America Retail. Mr. Nudi joined General Mills in 1993 as a Sales Representative and held a variety of roles inConsumer Foods Sales. In 2005, he moved into marketing roles in the Meals division and was elected Vice President in 2007. Mr. Nudi was named VicePresident; President, Snacks, in 2010, Senior Vice President, President, Europe/Australasia in June 2014 and Senior Vice President; President, U.S. Retail inSeptember 2016. He was named to his present position in January 2017.
Shawn P. O’Grady, age 53, is Group President, Convenience Stores & Foodservice; Senior Vice President, Global Revenue Development. Mr. O’Grady joinedGeneral Mills in 1990 and held several marketing roles in the Snacks, Meals and Big G cereal divisions. He was promoted to Vice President in 1998 and heldmarketing positions in the Betty Crocker and Pillsbury USA divisions. In 2004, he moved into Consumer Foods Sales, becoming Vice President, President,U.S. Retail Sales in 2007, Senior Vice President, President, Consumer Foods Sales Division in 2010 and Senior Vice President, President, Sales & ChannelDevelopment in 2012. He was named to his current position in January 2017.
Source: GENERAL MILLS INC, 10-K, June 29, 2017 Powered by Morningstar® Document Research℠The information contained herein may not be copied, adapted or distributed and is not warranted to be accurate, complete or timely. The user assumes all risks for any damages or losses arising from any use of this information,except to the extent such damages or losses cannot be limited or excluded by applicable law. Past financial performance is no guarantee of future results.

Kendall J. Powell, age 63, is Chairman of the Board. Mr. Powell joined General Mills in 1979 and served in a variety of positions before becoming a VicePresident in 1990. He became President of the Yoplait division in 1996, President of the Big G cereal division in 1997, and Senior Vice President of GeneralMills in 1998. From 1999 to 2004, he served as Chief Executive Officer of CPW. He returned from CPW in 2004 and was elected Executive Vice President.Mr. Powell was elected President and Chief Operating Officer in 2006, Chief Executive Officer in 2007, and Chairman of the Board in 2008. Mr. Powellretired from his position as Chief Executive Officer in June 2017. He is a director of Medtronic plc.
6
Source: GENERAL MILLS INC, 10-K, June 29, 2017 Powered by Morningstar® Document Research℠The information contained herein may not be copied, adapted or distributed and is not warranted to be accurate, complete or timely. The user assumes all risks for any damages or losses arising from any use of this information,except to the extent such damages or losses cannot be limited or excluded by applicable law. Past financial performance is no guarantee of future results.

Table of Contents
Bethany Quam, age 46, is Group President, Europe & Australia. Ms. Quam joined General Mills in 1993 and held a variety of positions before becoming VicePresident, Strategic Planning in 2007. She was promoted to Vice President, Field Sales, Channels in 2012, Vice President; President, Convenience Stores &Foodservice in May 2014 and Senior Vice President; President, Europe & Australia in August 2016. She was named to her current position in January 2017.
Jacqueline Williams-Roll, age 48, is Senior Vice President, Chief Human Resources Officer. Ms. Williams-Roll joined General Mills in 1995. She heldhuman resources leadership roles in Supply Chain, Finance, Marketing and Organization Effectiveness, and she also worked a large part of her career onbusinesses outside of the United States. She was named Vice President, Human Resources, International in 2010, and then promoted to Senior Vice President,Human Resources Operations in September 2013. She was named to her present position in September 2014. Prior to joining General Mills, she held sales andmanagement roles with Jenny Craig International.
Jerald A. Young, age 60, is Vice President, Controller. Mr. Young joined General Mills in 2001 from The Pillsbury Company. He was appointed VicePresident of Finance for the Bakeries and Foodservice Division while at Pillsbury in 2000. Mr. Young was appointed Vice President Internal Audit in 2005and Vice President, Supply Chain in 2008. He was named to his present position in August 2011. Mr. Young is retiring in August 2017.
WEBSITE ACCESS
Our website is www.GeneralMills.com. We make available, free of charge in the “Investors” portion of this website, annual reports on Form 10-K, quarterlyreports on Form 10-Q, current reports on Form 8-K, and amendments to those reports filed or furnished pursuant to Section 13(a) or 15(d) of the SecuritiesExchange Act of 1934 (1934 Act) as soon as reasonably practicable after we electronically file such material with, or furnish it to, the Securities andExchange Commission (SEC). Reports of beneficial ownership filed pursuant to Section 16(a) of the 1934 Act are also available on our website. ITEM 1A Risk Factors
Our business is subject to various risks and uncertainties. Any of the risks described below could materially, adversely affect our business, financialcondition, and results of operations.
The food categories in which we participate are very competitive, and if we are not able to compete effectively, our results of operations could beadversely affected.
The food categories in which we participate are very competitive. Our principal competitors in these categories all have substantial financial, marketing, andother resources. In most product categories, we compete not only with other widely advertised branded products, but also with regional brands and withgeneric and private label products that are generally sold at lower prices. Competition in our product categories is based on product innovation, productquality, price, brand recognition and loyalty, effectiveness of marketing, promotional activity, and the ability to identify and satisfy consumer preferences. Ifour large competitors were to seek an advantage through pricing or promotional changes, we could choose to do the same, which could adversely affect ourmargins and profitability. If we did not do the same, our revenues and market share could be adversely affected. Our market share and revenue growth couldalso be adversely impacted if we are not successful in introducing innovative products in response to changing consumer demands or by new productintroductions of our competitors. If we are unable to build and sustain brand equity by offering recognizably superior product quality, we may be unable tomaintain premium pricing over generic and private label products.
We may be unable to maintain our profit margins in the face of a consolidating retail environment.
There has been significant consolidation in the grocery industry, resulting in customers with increased purchasing power. In addition, large retail customersmay seek to use their position to improve their profitability through improved efficiency, lower pricing, increased reliance on their own brand name products,increased emphasis on generic and other economy brands, and increased promotional programs. If we are unable to use our scale, marketing expertise,product innovation, knowledge of consumers’ needs, and category leadership positions to respond to these demands, our profitability and volume growthcould be negatively impacted. In addition, the loss of any large customer for an extended length of time could adversely affect our sales and profits. In fiscal2017, Wal-Mart accounted for 20 percent of our consolidated net sales and 29 percent of net sales of our North America Retail segment. For more informationon significant customers, please see Note 7 to the Consolidated Financial Statements in Item 8 of this report.
7
Source: GENERAL MILLS INC, 10-K, June 29, 2017 Powered by Morningstar® Document Research℠The information contained herein may not be copied, adapted or distributed and is not warranted to be accurate, complete or timely. The user assumes all risks for any damages or losses arising from any use of this information,except to the extent such damages or losses cannot be limited or excluded by applicable law. Past financial performance is no guarantee of future results.

Table of Contents
Price changes for the commodities we depend on for raw materials, packaging, and energy may adversely affect our profitability.
The principal raw materials that we use are commodities that experience price volatility caused by external conditions such as weather, product scarcity,limited sources of supply, commodity market fluctuations, currency fluctuations, and changes in governmental agricultural and energy policies andregulations. Commodity price changes may result in unexpected increases in raw material, packaging, and energy costs. If we are unable to increaseproductivity to offset these increased costs or increase our prices, we may experience reduced margins and profitability. We do not fully hedge againstchanges in commodity prices, and the risk management procedures that we do use may not always work as we intend.
Volatility in the market value of derivatives we use to manage exposures to fluctuations in commodity prices will cause volatility in our gross marginsand net earnings.
We utilize derivatives to manage price risk for some of our principal ingredient and energy costs, including grains (oats, wheat, and corn), oils (principallysoybean), dairy products, natural gas, and diesel fuel. Changes in the values of these derivatives are recorded in earnings currently, resulting in volatility inboth gross margin and net earnings. These gains and losses are reported in cost of sales in our Consolidated Statements of Earnings and in unallocatedcorporate items outside our segment operating results until we utilize the underlying input in our manufacturing process, at which time the gains and lossesare reclassified to segment operating profit. We also record our grain inventories at net realizable value. We may experience volatile earnings as a result ofthese accounting treatments.
If we are not efficient in our production, our profitability could suffer as a result of the highly competitive environment in which we operate.
Our future success and earnings growth depend in part on our ability to be efficient in the production and manufacture of our products in highly competitivemarkets. Gaining additional efficiencies may become more difficult over time. Our failure to reduce costs through productivity gains or by eliminatingredundant costs resulting from acquisitions or divestitures could adversely affect our profitability and weaken our competitive position. Many productivityinitiatives involve complex reorganization of manufacturing facilities and production lines. Such manufacturing realignment may result in the interruptionof production, which may negatively impact product volume and margins. We are currently pursuing several multi-year restructuring and cost savingsinitiatives designed to increase our efficiency and reduce expenses. If we are unable to execute those initiatives as planned, we may not realize all or any ofthe anticipated benefits, which could adversely affect our business and results of operations.
Disruption of our supply chain could adversely affect our business.
Our ability to make, move, and sell products is critical to our success. Damage or disruption to raw material supplies or our manufacturing or distributioncapabilities due to weather, including any potential effects of climate change, natural disaster, fire, terrorism, cyber-attack, pandemic, strikes, import/exportrestrictions, or other factors could impair our ability to manufacture or sell our products. Many of our product lines are manufactured at a single location. Oursuppliers’ policies and practices can damage our reputation and the quality and safety of our products. Failure to take adequate steps to mitigate thelikelihood or potential impact of such events, or to effectively manage such events if they occur, particularly when a product is sourced from a single supplieror location, could adversely affect our business and results of operations, as well as require additional resources to restore our supply chain.
Concerns with the safety and quality of food products could cause consumers to avoid certain food products or ingredients.
We could be adversely affected if consumers in our principal markets lose confidence in the safety and quality of certain food products or ingredients.Adverse publicity about these types of concerns, whether or not valid, may discourage consumers from buying our products or cause production and deliverydisruptions.
If our food products become adulterated, misbranded, or mislabeled, we might need to recall those items and may experience product liability claims ifconsumers are injured.
We may need to recall some of our products if they become adulterated, misbranded, or mislabeled. A widespread product recall could result in significantlosses due to the costs of a recall, the destruction of product inventory, and lost sales due to the unavailability of product for a period of time. We could alsosuffer losses from a significant product liability judgment against us. A significant product recall or product liability case could also result in adversepublicity, damage to our reputation, and a loss of consumer confidence in our food products, which could have an adverse effect on our business results andthe value of our brands.
8
Source: GENERAL MILLS INC, 10-K, June 29, 2017 Powered by Morningstar® Document Research℠The information contained herein may not be copied, adapted or distributed and is not warranted to be accurate, complete or timely. The user assumes all risks for any damages or losses arising from any use of this information,except to the extent such damages or losses cannot be limited or excluded by applicable law. Past financial performance is no guarantee of future results.

Table of Contents
We may be unable to anticipate changes in consumer preferences and trends, which may result in decreased demand for our products.
Our success depends in part on our ability to anticipate the tastes, eating habits and purchasing behaviors of consumers and to offer products that appeal totheir preferences in channels where they shop. Consumer preferences and category-level consumption may change from time to time and can be affected by anumber of different trends and other factors. If we fail to anticipate, identify or react to these changes and trends, such as adapting to emerging e-commercechannels, or to introduce new and improved products on a timely basis, we may experience reduced demand for our products, which would in turn cause ourrevenues and profitability to suffer. Similarly, demand for our products could be affected by consumer concerns regarding the health effects of ingredientssuch as sodium, trans fats, genetically modified organisms, sugar, processed wheat, or other product ingredients or attributes.
We may be unable to grow our market share or add products that are in faster growing and more profitable categories.
The food industry’s growth potential is constrained by population growth. Our success depends in part on our ability to grow our business faster thanpopulations are growing in the markets that we serve. One way to achieve that growth is to enhance our portfolio by adding innovative new products in fastergrowing and more profitable categories. Our future results will also depend on our ability to increase market share in our existing product categories. If we donot succeed in developing innovative products for new and existing categories, our growth may slow, which could adversely affect our profitability.
Economic downturns could limit consumer demand for our products.
The willingness of consumers to purchase our products depends in part on local economic conditions. In periods of economic uncertainty, consumers maypurchase more generic, private label, and other economy brands and may forego certain purchases altogether. In those circumstances, we could experience areduction in sales of higher margin products or a shift in our product mix to lower margin offerings. In addition, as a result of economic conditions orcompetitive actions, we may be unable to raise our prices sufficiently to protect margins. Consumers may also reduce the amount of food that they consumeaway from home at customers that purchase products from our Convenience Stores & Foodservice segment. Any of these events could have an adverse effecton our results of operations.
Our results may be negatively impacted if consumers do not maintain their favorable perception of our brands.
Maintaining and continually enhancing the value of our many iconic brands is critical to the success of our business. The value of our brands is based inlarge part on the degree to which consumers react and respond positively to these brands. Brand value could diminish significantly due to a number offactors, including consumer perception that we have acted in an irresponsible manner, adverse publicity about our products, our failure to maintain thequality of our products, the failure of our products to deliver consistently positive consumer experiences, concerns about food safety, or our productsbecoming unavailable to consumers. Consumer demand for our products may also be impacted by changes in the level of advertising or promotional support.The growing use of social and digital media by consumers, us, and third parties increases the speed and extent that information or misinformation andopinions can be shared. Negative posts or comments about us, our brands, or our products on social or digital media could seriously damage our brands andreputation. If we do not maintain the favorable perception of our brands, our business results could be negatively impacted.
Our international operations are subject to political and economic risks.
In fiscal 2017, 29 percent of our consolidated net sales were generated outside of the United States. We are accordingly subject to a number of risks relatingto doing business internationally, any of which could significantly harm our business. These risks include:
• political and economic instability;• exchange controls and currency exchange rates;• nationalization of operations;• compliance with anti-corruption regulations;• foreign tax treaties and policies; and• restriction on the transfer of funds to and from foreign countries, including potentially negative tax consequences.
Our financial performance on a U.S. dollar denominated basis is subject to fluctuations in currency exchange rates. These fluctuations could cause materialvariations in our results of operations. Our principal exposures are to the Australian dollar, Brazilian real, British pound sterling, Canadian dollar, Chineserenminbi, euro, Japanese yen, Mexican peso, and Swiss franc. From time to time, we enter into agreements that are intended to reduce the effects of ourexposure to currency fluctuations, but these agreements may not be effective in significantly reducing our exposure.
9
Source: GENERAL MILLS INC, 10-K, June 29, 2017 Powered by Morningstar® Document Research℠The information contained herein may not be copied, adapted or distributed and is not warranted to be accurate, complete or timely. The user assumes all risks for any damages or losses arising from any use of this information,except to the extent such damages or losses cannot be limited or excluded by applicable law. Past financial performance is no guarantee of future results.

Table of Contents
New regulations or regulatory-based claims could adversely affect our business.
Our facilities and products are subject to many laws and regulations administered by the United States Department of Agriculture, the Federal Food and DrugAdministration, the Occupational Safety and Health Administration, and other federal, state, local, and foreign governmental agencies relating to theproduction, packaging, labelling, storage, distribution, quality, and safety of food products and the health and safety of our employees. Our failure to complywith such laws and regulations could subject us to lawsuits, administrative penalties, and civil remedies, including fines, injunctions, and recalls of ourproducts. We advertise our products and could be the target of claims relating to alleged false or deceptive advertising under federal, state, and foreign lawsand regulations. We may also be subject to new laws or regulations restricting our right to advertise our products, including proposals to limit advertising tochildren. Changes in laws or regulations that impose additional regulatory requirements on us could increase our cost of doing business or restrict ouractions, causing our results of operations to be adversely affected.
We are subject to various federal, state, local, and foreign environmental laws and regulations. Our failure to comply with environmental laws and regulationscould subject us to lawsuits, administrative penalties, and civil remedies. We are currently party to a variety of environmental remediation obligations. Dueto regulatory complexities, uncertainties inherent in litigation, and the risk of unidentified contaminants on current and former properties of ours, thepotential exists for remediation, liability, indemnification, and compliance costs to differ from our estimates. We cannot guarantee that our costs in relation tothese matters, or compliance with environmental laws in general, will not exceed our established liabilities or otherwise have an adverse effect on ourbusiness and results of operations.
We have a substantial amount of indebtedness, which could limit financing and other options and in some cases adversely affect our ability to paydividends.
As of May 28, 2017, we had total debt, redeemable interests, and noncontrolling interests of $10.8 billion. The agreements under which we have issuedindebtedness do not prevent us from incurring additional unsecured indebtedness in the future. Our level of indebtedness may limit our:
• ability to obtain additional financing for working capital, capital expenditures, or general corporate purposes, particularly if the ratings assigned to ourdebt securities by rating organizations were revised downward; and
• flexibility to adjust to changing business and market conditions and may make us more vulnerable to a downturn in general economic conditions.
There are various financial covenants and other restrictions in our debt instruments and noncontrolling interests. If we fail to comply with any of theserequirements, the related indebtedness (and other unrelated indebtedness) could become due and payable prior to its stated maturity and our ability to obtainadditional or alternative financing may also be adversely affected.
Our ability to make scheduled payments on or to refinance our debt and other obligations will depend on our operating and financial performance, which inturn is subject to prevailing economic conditions and to financial, business, and other factors beyond our control.
Global capital and credit market issues could negatively affect our liquidity, increase our costs of borrowing, and disrupt the operations of oursuppliers and customers.
We depend on stable, liquid, and well-functioning capital and credit markets to fund our operations. Although we believe that our operating cash flows,financial assets, access to capital and credit markets, and revolving credit agreements will permit us to meet our financing needs for the foreseeable future,there can be no assurance that future volatility or disruption in the capital and credit markets will not impair our liquidity or increase our costs of borrowing.We also utilize interest rate derivatives to reduce the volatility of our financing costs. If we are not effective in hedging this volatility, we may experience anincrease in our costs of borrowing. Our business could also be negatively impacted if our suppliers or customers experience disruptions resulting from tightercapital and credit markets or a slowdown in the general economy.
Volatility in the securities markets, interest rates, and other factors could substantially increase our defined benefit pension, other postretirementbenefit, and postemployment benefit costs.
Source: GENERAL MILLS INC, 10-K, June 29, 2017 Powered by Morningstar® Document Research℠The information contained herein may not be copied, adapted or distributed and is not warranted to be accurate, complete or timely. The user assumes all risks for any damages or losses arising from any use of this information,except to the extent such damages or losses cannot be limited or excluded by applicable law. Past financial performance is no guarantee of future results.

We sponsor a number of defined benefit plans for employees in the United States, Canada, and various foreign locations, including defined benefit pension,retiree health and welfare, severance, and other postemployment plans. Our major defined benefit pension plans are funded with trust assets invested in aglobally diversified portfolio of securities and other investments. Changes in interest rates, mortality rates, health care costs, early retirement rates, investmentreturns, and the market value of plan assets can affect the funded status of our defined benefit plans and cause volatility in the net periodic benefit cost andfuture funding requirements of the plans. A significant increase in our obligations or future funding requirements could have a negative impact on our resultsof operations and cash flows from operations.
10
Source: GENERAL MILLS INC, 10-K, June 29, 2017 Powered by Morningstar® Document Research℠The information contained herein may not be copied, adapted or distributed and is not warranted to be accurate, complete or timely. The user assumes all risks for any damages or losses arising from any use of this information,except to the extent such damages or losses cannot be limited or excluded by applicable law. Past financial performance is no guarantee of future results.

Table of Contents
Our business operations could be disrupted if our information technology systems fail to perform adequately or are breached.
Information technology serves an important role in the efficient and effective operation of our business. We rely on information technology networks andsystems, including the internet, to process, transmit, and store electronic information to manage a variety of business processes and to comply withregulatory, legal, and tax requirements. Our information technology systems and infrastructure are critical to effectively manage our key business processesincluding digital marketing, order entry and fulfillment, supply chain management, finance, administration, and other business processes. These technologiesenable internal and external communication among our locations, employees, suppliers, customers, and others and include the receipt and storage of personalinformation about our employees, consumers, and proprietary business information. Our information technology systems, some of which are dependent onservices provided by third parties, may be vulnerable to damage, interruption, or shutdown due to any number of causes such as catastrophic events, naturaldisasters, fires, power outages, systems failures, telecommunications failures, security breaches, computer viruses, hackers, employee error or malfeasance, andother causes. Increased cyber-security threats pose a potential risk to the security and viability of our information technology systems, as well as theconfidentiality, integrity, and availability of the data stored on those systems. The failure of our information technology systems to perform as we anticipatecould disrupt our business and result in transaction errors, processing inefficiencies, data loss, legal claims or proceedings, regulatory penalties, and the lossof sales and customers. Any interruption of our information technology systems could have operational, reputational, legal, and financial impacts that mayhave a material adverse effect on our business.
A change in the assumptions regarding the future performance of our businesses or a different weighted-average cost of capital used to value ourreporting units or our indefinite-lived intangible assets could negatively affect our consolidated results of operations and net worth.
As of May 28, 2017, we had $12.9 billion of goodwill and indefinite-lived intangible assets. Goodwill for each of our reporting units is tested for impairmentannually and whenever events or changes in circumstances indicate that impairment may have occurred. We compare the carrying value of the net assets of areporting unit, including goodwill, to the fair value of the unit. If the fair value of the net assets of the reporting unit is less than the net assets includinggoodwill, impairment has occurred. Our estimates of fair value are determined based on a discounted cash flow model. Growth rates for sales and profits aredetermined using inputs from our long-range planning process. We also make estimates of discount rates, perpetuity growth assumptions, marketcomparables, and other factors. Our Latin America and U.S. Yogurt reporting units have experienced declining business performance and we continue tomonitor these businesses. While we currently believe that our goodwill is not impaired, different assumptions regarding the future performance of ourbusinesses could result in significant impairment losses.
We evaluate the useful lives of our intangible assets, primarily intangible assets associated with the Pillsbury, Totino’s, Progresso, Yoplait, Old El Paso, Yoki,Häagen-Dazs, and Annie’s brands, to determine if they are finite or indefinite-lived. Reaching a determination on useful life requires significant judgmentsand assumptions regarding the future effects of obsolescence, demand, competition, other economic factors (such as the stability of the industry, knowntechnological advances, legislative action that results in an uncertain or changing regulatory environment, and expected changes in distribution channels),the level of required maintenance expenditures, and the expected lives of other related groups of assets.
Our indefinite-lived intangible assets are also tested for impairment annually and whenever events or changes in circumstances indicate that their carryingvalue may not be recoverable. Our estimate of the fair value of the brands is based on a discounted cash flow model using inputs including projectedrevenues from our long-range plan, assumed royalty rates which could be payable if we did not own the brands, and a discount rate. While not impaired as ofMay 28, 2017, the Immaculate Baking, Progresso, Green Giant, and Food Should Taste Good brands had risk of decreasing coverage. We will continue tomonitor these businesses. For further information on goodwill and intangible assets, please refer to Note 6 to the Consolidated Financial Statements in Item 8of this report.
Our failure to successfully integrate acquisitions into our existing operations could adversely affect our financial results.
From time to time, we evaluate potential acquisitions or joint ventures that would further our strategic objectives. Our success depends, in part, upon ourability to integrate acquired and existing operations. If we are unable to successfully integrate acquisitions, our financial results could suffer. Additionalpotential risks associated with acquisitions include additional debt leverage, the loss of key employees and customers of the acquired business, theassumption of unknown liabilities, the inherent risk associated with entering a geographic area or line of business in which we have no or limited priorexperience, failure to achieve anticipated synergies, and the impairment of goodwill or other acquisition-related intangible assets.
Source: GENERAL MILLS INC, 10-K, June 29, 2017 Powered by Morningstar® Document Research℠The information contained herein may not be copied, adapted or distributed and is not warranted to be accurate, complete or timely. The user assumes all risks for any damages or losses arising from any use of this information,except to the extent such damages or losses cannot be limited or excluded by applicable law. Past financial performance is no guarantee of future results.

ITEM 1B Unresolved Staff Comments
None.
11
Source: GENERAL MILLS INC, 10-K, June 29, 2017 Powered by Morningstar® Document Research℠The information contained herein may not be copied, adapted or distributed and is not warranted to be accurate, complete or timely. The user assumes all risks for any damages or losses arising from any use of this information,except to the extent such damages or losses cannot be limited or excluded by applicable law. Past financial performance is no guarantee of future results.

Table of Contents
ITEM 2 Properties
We own our principal executive offices and main research facilities, which are located in the Minneapolis, Minnesota metropolitan area. We operatenumerous manufacturing facilities and maintain many sales and administrative offices, warehouses, and distribution centers around the world.
As of May 28, 2017, we operated 52 facilities for the production of a wide variety of food products. Of these facilities, 27 are located in the United States (1 ofwhich is leased), 4 in the Greater China region, 2 in the Asia/Middle East/Africa Region (1 of which is leased), 3 in Canada (2 of which are leased), 9 inEurope/Australia, and 7 in Latin America and Mexico. The following is a list of the locations of our principal production facilities, which primarily supportthe segment noted: North America Retail
• Carson, California • Irapuato, Mexico • Buffalo, New York• St. Hyacinthe, Canada • Reed City, Michigan • Cincinnati, Ohio• Covington, Georgia • Fridley, Minnesota • Wellston, Ohio• Belvidere, Illinois • Hannibal, Missouri • Murfreesboro, Tennessee• Geneva, Illinois • Vineland, New Jersey • Milwaukee, Wisconsin• Cedar Rapids, Iowa • Albuquerque, New Mexico
Convenience Stores & Foodservice
• Chanhassen, Minnesota • Joplin, Missouri
Europe & Australia
• Mt. Waverly, Australia • Labatut, France • Vienne, France• Rooty Hill, Australia • Le Mans, France • Inofita, Greece• Arras, France • Moneteau, France • San Adrian, Spain
Asia & Latin America
• Cambara, Brazil • Paranavai, Brazil • Kunshan, China• Campo Nova do Pareceis, Brazil • Pouso Alegre, Brazil • Nashik, India• Nova Prata, Brazil • Sanhe, China • Anseong-si, Korea• Recife, Brazil • Shanghai, China • Ribeirao Claro, Brazil • Guangzhou, China
We operate numerous grain elevators and mills in the United States in support of our domestic manufacturing activities. We also utilize approximately12 million square feet of warehouse and distribution space, nearly all of which is leased, that primarily supports our North America Retail segment. We ownand lease a number of dedicated sales and administrative offices around the world, totaling approximately 3 million square feet. We have additionalwarehouse, distribution, and office space in our plant locations.
As part of our Häagen-Dazs business in our Europe & Australia and Asia & Latin America segments, we operate 433 (all leased) and franchise 356 branded icecream parlors in various countries around the world, all outside of the United States and Canada. ITEM 3 Legal Proceedings
We are the subject of various pending or threatened legal actions in the ordinary course of our business. All such matters are subject to many uncertaintiesand outcomes that are not predictable with assurance. In our opinion, there were no claims or litigation pending as of May 28, 2017, that were reasonablylikely to have a material adverse effect on our consolidated financial position or results of operations. See the information contained under the sectionentitled “Environmental Matters” in Item 1 of this report for a discussion of environmental matters in which we are involved. ITEM 4 Mine Safety Disclosures
None.
12
Source: GENERAL MILLS INC, 10-K, June 29, 2017 Powered by Morningstar® Document Research℠The information contained herein may not be copied, adapted or distributed and is not warranted to be accurate, complete or timely. The user assumes all risks for any damages or losses arising from any use of this information,except to the extent such damages or losses cannot be limited or excluded by applicable law. Past financial performance is no guarantee of future results.

Table of Contents
PART II ITEM 5 Market for Registrant’s Common Equity, Related Stockholder Matters and Issuer Purchases of Equity Securities
Our common stock is listed on the New York Stock Exchange under the symbol “GIS.” On June 9, 2017, there were approximately 31,000 record holders ofour common stock. Information regarding the market prices for our common stock and dividend payments for the two most recent fiscal years is set forth inNote 18 to the Consolidated Financial Statements in Item 8 of this report.
The following table sets forth information with respect to shares of our common stock that we purchased during the fiscal quarter ended May 28, 2017:
Period
Total Numberof Shares
Purchased (a)
AveragePrice PaidPer Share
Total Number ofShares Purchased as
Part of a PubliclyAnnounced Program (b)
Maximum Number ofShares that may yet be
Purchased Under theProgram (b)
February 27, 2017-April 2, 2017 1,930 $ 60.55 1,930 50,425,561 April 3, 2017-April 30, 2017 8,885 59.01 8,885 50,416,676 May 1, 2017-May 28, 2017 144 56.60 144 50,416,532 Total 10,959 $ 59.25 10,959 50,416,532 (a) The total number of shares purchased includes shares of common stock withheld for the payment of withholding taxes upon the distribution of deferred
option units.(b) On May 6, 2014, our Board of Directors approved an authorization for the repurchase of up to 100,000,000 shares of our common stock. Purchases can
be made in the open market or in privately negotiated transactions, including the use of call options and other derivative instruments, Rule 10b5-1trading plans, and accelerated repurchase programs. The Board did not specify an expiration date for the authorization.
13
Source: GENERAL MILLS INC, 10-K, June 29, 2017 Powered by Morningstar® Document Research℠The information contained herein may not be copied, adapted or distributed and is not warranted to be accurate, complete or timely. The user assumes all risks for any damages or losses arising from any use of this information,except to the extent such damages or losses cannot be limited or excluded by applicable law. Past financial performance is no guarantee of future results.

Table of Contents
ITEM 6 Selected Financial Data
The following table sets forth selected financial data for each of the fiscal years in the five-year period ended May 28, 2017: Fiscal Year In Millions, Except Per Share Data, Percentages and Ratios 2017 2016 2015 (a) 2014 2013 Operating data: Net sales $15,619.8 $16,563.1 $17,630.3 $17,909.6 $17,774.1 Gross margin (b) 5,563.8 5,829.5 5,949.2 6,369.8 6,423.9 Selling, general, and administrative expenses 2,801.3 3,118.9 3,328.0 3,474.3 3,552.3 Operating profit 2,566.4 2,707.4 2,077.3 2,957.4 2,851.8 Total segment operating profit (c) 2,952.6 2,999.5 3,035.0 3,153.9 3,222.9 Net earnings attributable to General Mills 1,657.5 1,697.4 1,221.3 1,824.4 1,855.2 Advertising and media expense 623.8 754.4 823.1 869.5 895.0 Research and development expense 218.2 222.1 229.4 243.6 237.9 Average shares outstanding:
Diluted 598.0 611.9 618.8 645.7 665.6 Earnings per share:
Diluted $ 2.77 $ 2.77 $ 1.97 $ 2.83 $ 2.79 Diluted, excluding certain items affecting comparability (c) $ 3.08 $ 2.92 $ 2.86 $ 2.82 $ 2.72
Operating ratios: Gross margin as a percentage of net sales 35.6% 35.2% 33.7% 35.6% 36.1% Selling, general, and administrative expenses as apercentage of net sales 17.9% 18.8% 18.9% 19.4% 20.0% Operating profit as a percentage of net sales 16.4% 16.3% 11.8% 16.5% 16.0% Adjusted operating profit as a percentage of net sales (b) (c) 18.1% 16.8% 15.9% 16.2% 16.3% Total segment operating profit as a percentage of net sales (c) 18.9% 18.1% 17.2% 17.6% 18.1% Effective income tax rate 28.8% 31.4% 33.3% 33.3% 29.2% Return on average total capital (b) 12.7% 12.9% 9.1% 12.5% 13.4% Adjusted return on average total capital (b) (c) 11.6% 11.3% 11.2% 11.6% 12.0% Balance sheet data: Land, buildings, and equipment $ 3,687.7 $ 3,743.6 $ 3,783.3 $ 3,941.9 $ 3,878.1 Total assets 21,812.6 21,712.3 21,832.0 23,044.7 22,505.7 Long-term debt, excluding current portion 7,642.9 7,057.7 7,575.3 6,396.6 5,901.8 Total debt (b) 9,481.7 8,430.9 9,191.5 8,758.9 7,944.8 Cash flow data: Net cash provided by operating activities $ 2,313.3 $ 2,629.8 $ 2,542.8 $ 2,541.0 $ 2,926.0 Capital expenditures 684.4 729.3 712.4 663.5 613.9 Free cash flow (b) (c) 1,628.9 1,900.5 1,830.4 1,877.5 2,312.1 Fixed charge coverage ratio (b) 7.26 7.40 5.54 8.04 7.62 Operating cash flow to debt ratio (b) 24.4% 31.2% 27.7% 29.0% 36.8% Share data: Low stock price $ 55.91 $ 54.12 $ 48.86 $ 46.86 $ 37.55 High stock price 72.64 65.36 57.14 54.40 50.93 Closing stock price 57.32 62.87 56.15 53.81 48.98 Cash dividends per common share 1.92 1.78 1.67 1.55 1.32 (a) Fiscal 2015 was a 53-week year; all other fiscal years were 52 weeks.(b) See “Glossary” in Item 8 of this report for definition.(c) See “Non-GAAP Measures” in Item 7 of this report for our discussion of this measure not defined by generally accepted accounting principles.
14
Source: GENERAL MILLS INC, 10-K, June 29, 2017 Powered by Morningstar® Document Research℠The information contained herein may not be copied, adapted or distributed and is not warranted to be accurate, complete or timely. The user assumes all risks for any damages or losses arising from any use of this information,except to the extent such damages or losses cannot be limited or excluded by applicable law. Past financial performance is no guarantee of future results.

Table of Contents
ITEM 7 Management’s Discussion and Analysis of Financial Condition and Results of Operations
EXECUTIVE OVERVIEW
We are a global consumer foods company. We develop distinctive value-added food products and market them under unique brand names. We workcontinuously to improve our core products and to create new products that meet consumers’ evolving needs and preferences. In addition, we build the equityof our brands over time with strong consumer-directed marketing, innovative new products, and effective merchandising. We believe our brand-buildingstrategy is the key to winning and sustaining leading share positions in markets around the globe.
Our fundamental financial goal is to generate superior returns for our shareholders over the long term. We believe that increases in net sales, segmentoperating profit, earnings per share (EPS), free cash flow, cash return to shareholders, and return on average total capital are key drivers of financialperformance for our business.
Our long-term growth objectives are to consistently deliver: • low single-digit annual growth in organic net sales; • mid single-digit annual growth in total segment operating profit on a constant-currency basis; • high single-digit annual growth in diluted EPS excluding certain items affecting comparability on a constant-currency basis; • improvement in adjusted return on average total capital; • free cash flow conversion averaging above 95 percent of adjusted net earnings after tax; and • cash return to shareholders averaging above 90 percent of free cash flow, including an attractive dividend yield.
We believe that this financial performance should result in long-term value creation for shareholders.
Fiscal 2017 was a year of significant change for General Mills. We implemented a new global organizational structure to enhance our agility in a rapidlychanging consumer environment. We expanded our global supply chain restructuring initiative to further increase our efficiency. We also implemented abusiness plan that aggressively shifted resources to our best growth opportunities and eliminated low-return investments and volume. While these actionswere the right thing to do for our company, we did not execute up to our standards in certain areas and our results did not meet ourexpectations. Consolidated net sales and total segment operating profit growth fell short of our plans, largely because of competitive price gaps in our NorthAmerican Retail segment. We underestimated the impact that our aggressive reductions in promotional spending, implemented early in the fiscal year, wouldhave on our net pricing relative to competitors. The gaps were most pronounced in the U.S. Meals & Baking operating unit, and competitive activity alsosignificantly impacted U.S. Yogurt. We took corrective actions to improve our performance in the second half of fiscal 2017, but it was not sufficient to stemthe early declines. Yogurt in the Europe & Australia segment also did not meet expectations as competitive pressure from smaller branded players increasedsignificantly. Excluding yogurt, the segment’s net sales and share increased driven by ice cream and snack bars innovation and improved merchandisingperformance. In the Convenience Stores & Foodservice segment, segment operating profit grew driven by lower input costs and benefits from cost savingsinitiatives. Net sales for the Focus 6 platforms grew modestly, but were more than offset by market index pricing on flour. In the Asia & Latin Americasegment, macroeconomic weakness in Latin America and the Middle East created a challenging environment while greater China returned to net salesgrowth, including contributions from the new Yoplait business. We continued to realize planned benefits from our numerous restructuring initiatives and costreduction efforts in our supply chain and administrative areas which helped us to increase our adjusted operating profit margin and adjusted diluted earningsper share (EPS) in fiscal 2017.
Our consolidated net sales for fiscal 2017 declined 6 percent to $15.6 billion, primarily driven by declining contributions from volume, including the impactof the divestiture of the North American Green Giant product lines (Green Giant). On an organic basis, net sales decreased 4 percent. Operating profit of $2.6billion decreased 5 percent. Total segment operating profit of $3.0 billion declined 2 percent and declined 1 percent on a constant-currency basis. DilutedEPS of $2.77 was flat compared to fiscal 2016. Adjusted diluted EPS, which excludes certain items affecting comparability of results, rose 5 percent to $3.08per share and increased 6 percent on a constant-currency basis. Our return on average total capital was 12.7 percent, and adjusted return on average totalcapital increased 30 basis points to 11.6 percent and increased 40 basis points on a constant-currency basis (See the “Non-GAAP Measures” section below fordiscussion of total segment operating profit, adjusted diluted EPS, organic net sales growth rate, constant-currency total segment operating profit growth rate,constant-currency adjusted diluted EPS growth rate, and adjusted return on average total capital, which are not defined by generally accepted accountingprinciples (GAAP)).
Net cash provided by operations totaled $2.3 billion in fiscal 2017 at a conversion rate of 136 percent of net earnings, including earnings attributable toredeemable and noncontrolling interests. This cash generation supported capital investments totaling $684 million, and our resulting free cash flow was $1.6billion at a conversion rate of 86 percent of adjusted net earnings, including earnings attributable to redeemable and noncontrolling interests. We alsoreturned significant cash to shareholders through a 6 percent dividend increase and share repurchases totaling $1,652 million. Total cash returned toshareholders represented 164 percent of our free cash flow (see the “Non-GAAP Measures” section below for a description of our use of measures not definedby GAAP).
15
Source: GENERAL MILLS INC, 10-K, June 29, 2017 Powered by Morningstar® Document Research℠The information contained herein may not be copied, adapted or distributed and is not warranted to be accurate, complete or timely. The user assumes all risks for any damages or losses arising from any use of this information,except to the extent such damages or losses cannot be limited or excluded by applicable law. Past financial performance is no guarantee of future results.
Table of Contents
A detailed review of our fiscal 2017 performance appears below in the section titled “Fiscal 2017 Consolidated Results of Operations.”
We remain committed to our Consumer First strategy and our focus on driving growth and returns for our shareholders. Our top priority in fiscal 2018 is tomake significant strides toward returning our business to sustainable topline growth. Our fiscal 2018 plans call for investment in product news andinnovation to accelerate growth for businesses where we have positive momentum, and to improve those that are underperforming. We will also increaseinvestment in capabilities like e-commerce and Strategic Revenue Management, which are critical to future growth. We will continue to prioritize resourcesagainst our Growth platforms, where we see the strongest profitable growth potential. And we will make selective investments in our Foundation brands whilefocusing on profitability and cash generation.
We plan to continue to drive efficiency in fiscal 2018, including delivering approximately $390 million in supply chain productivity savings through ourongoing Holistic Margin Management (HMM) efforts. We also expect to deliver approximately $160 million in incremental savings from our otherrestructuring and cost-reduction initiatives, which equates to approximately $700 million in savings versus fiscal 2015 levels. These savings should morethan offset our estimate of 3 percent input cost inflation.
This cost management discipline has helped us significantly expand our adjusted operating profit margin over the past two years. We continue to seeopportunities for further margin expansion, including an increase in adjusted operating profit margin in fiscal 2018, but we will moderate the pace ofexpansion as we invest to restore topline growth. Looking forward, we are focused on delivering a balance of sales growth and margin expansion, along withstrong cash conversion and cash returns, to create top-tier returns for our shareholders.
With these assumptions in mind: • We expect fiscal 2018 organic net sales to decline between 1 and 2 percent from fiscal 2017 levels. • We expect fiscal 2018 total segment operating profit will be in a range between flat and up 1 percent on a constant-currency basis. • We expect fiscal 2018 adjusted diluted EPS to increase 1 to 2 percent in constant currency from the base of $3.08 earned in fiscal 2017.
• Our plans call for continued strong cash returns to shareholders. The current annualized dividend rate of $1.96 per share is up 2 percent from the
annual dividend paid in fiscal 2017. Share repurchases in fiscal 2018 are expected to result in a net reduction in average diluted sharesoutstanding of approximately 1 to 2 percent.
See the “Non-GAAP Measures” section below for a description of our use of measures not defined by GAAP.
Certain terms used throughout this report are defined in a glossary in Item 8 of this report.
FISCAL 2017 CONSOLIDATED RESULTS OF OPERATIONS
Fiscal 2017 includes an additional month of results from General Mills Brasil Alimentos Ltda (Yoki) (please refer to Note 1 to the Consolidated FinancialStatements in Item 8 of this report).
In fiscal 2017, operating results reflected challenging net sales performance. However, we continued to make progress against our cost savings and marginexpansion initiatives. The net sales decline of 6 percent was driven by declining contributions from volume in the North America Retail and Europe &Australia segments including the impact of the divestiture of Green Giant in fiscal 2016, which were partially offset by favorable net price realization andmix. Operating profit margin of 16.4 percent was up 10 basis points from year-ago levels primarily driven by benefits from cost savings and spendingoptimization initiatives, and favorable net price realization, partially offset by the gain from the Green Giant divestiture. Adjusted operating profit marginincreased 130 basis points to 18.1 percent, driven by benefits from cost savings and spending optimization initiatives and favorable net pricerealization. Diluted earnings per share of $2.77 was flat to fiscal 2016 and adjusted diluted EPS, which excludes certain items affecting comparability, on aconstant-currency basis increased 6 percent compared to fiscal 2016 (see the “Non-GAAP Measures” section below for a description of our use of measuresnot defined by GAAP).
16
Source: GENERAL MILLS INC, 10-K, June 29, 2017 Powered by Morningstar® Document Research℠The information contained herein may not be copied, adapted or distributed and is not warranted to be accurate, complete or timely. The user assumes all risks for any damages or losses arising from any use of this information,except to the extent such damages or losses cannot be limited or excluded by applicable law. Past financial performance is no guarantee of future results.

Table of Contents
A summary of our consolidated financial results for fiscal 2017 follows:
Fiscal 2017 In millions, except
per share Fiscal 2017 vs.
Fiscal 2016 Percent of Net
Sales
Constant-Currency
Growth (a) Net sales $ 15,619.8 (6)% Operating profit 2,566.4 (5)% 16.4% Net earnings attributable to General Mills 1,657.5 (2)% Diluted EPS $ 2.77 Flat
Organic net sales growth rate (a) (4)% Total segment operating profit (a) 2,952.6 (2)% (1)% Adjusted operating profit margin (a) 18.1% Diluted EPS, excluding certain items affecting
comparability (a) $ 3.08 5% 6% (a) See the “Non-GAAP Measures” section below for our use of measures not defined by GAAP.
Consolidated net sales were as follows:
Fiscal 2017 Fiscal 2017 vs.
Fiscal 2016 Fiscal 2016 Net sales (in millions) $ 15,619.8 (6) % $ 16,563.1 Contributions from volume growth (a) (8) pts Net price realization and mix 3 pts Foreign currency exchange (1) pt (a) Measured in tons based on the stated weight of our product shipments.
The 6 percent decline in net sales primarily reflected lower organic net sales, unfavorable foreign currency exchange, and the Green Giant divestiture in fiscal2016 (please refer to Note 3 to the Consolidated Financial Statements in Item 8 of this report).
Organic net sales declined 4 percent driven by volume declines in the North America Retail and Europe & Australia segments which were partially offset bypositive net price realization and mix. To improve comparability of results from period to period, organic net sales exclude the impacts of foreign currencyexchange rate fluctuations, as well as acquisitions, divestitures, and a 53rd week of results, when applicable.
Components of organic net sales growth are shown in the following table: Fiscal 2017 vs. Fiscal 2016 Contributions from organic volume growth (a) (7) pts Organic net price realization and mix 3 pts Organic net sales growth (4) pts Foreign currency exchange (1) pt Acquisitions and divestitures (b) (1) pt Net sales growth (6) pts (a) Measured in tons based on the stated weight of our product shipments.(b) Primarily the Green Giant divestiture in fiscal 2016 (please refer to Note 3 to the Consolidated Financial Statements in Item 8 of this report).
Cost of sales decreased $678 million in fiscal 2017 to $10,056 million. The decrease included an $814 million decrease attributable to lower volume and a$137 million increase attributable to product rate and mix. We recorded a $14 million net decrease in cost of sales related to mark-to-market valuation ofcertain commodity positions and grain inventories as described in Note 7 to the Consolidated Financial Statements in Item 8 of this report, compared to a netdecrease of $63 million in fiscal 2016. In fiscal 2017, we recorded $42 million of restructuring charges in cost of sales compared to $78 million in fiscal2016. We also recorded $44 million of restructuring initiative project-related costs in cost of sales in fiscal 2017 compared to $58 million in fiscal 2016(please refer to Note 4 to the Consolidated Financial Statements in Item 8 of this report).
Gross margin declined 5 percent in fiscal 2017 versus fiscal 2016. Gross margin as a percent of net sales of 36 percent increased 40 basis points compared tofiscal 2016.
17
Source: GENERAL MILLS INC, 10-K, June 29, 2017 Powered by Morningstar® Document Research℠The information contained herein may not be copied, adapted or distributed and is not warranted to be accurate, complete or timely. The user assumes all risks for any damages or losses arising from any use of this information,except to the extent such damages or losses cannot be limited or excluded by applicable law. Past financial performance is no guarantee of future results.

Table of Contents
Selling, general and administrative (SG&A) expenses decreased $318 million to $2,801 million in fiscal 2017 versus fiscal 2016 primarily due to a 17percentage point decrease in media and advertising expense and cost savings initiatives. SG&A expenses as a percent of net sales decreased 90 basis pointscompared to fiscal 2016.
During fiscal 2017, we recorded a $14 million divestiture loss from the sale of our Martel, Ohio manufacturing facility. Divestiture net gain totaled $148million in fiscal 2016 primarily from the sale of Green Giant (please refer to Note 3 of the Consolidated Financial Statements in Item 8 of this report).
Restructuring, impairment, and other exit costs totaled $183 million in fiscal 2017, compared to $151 million in fiscal 2016, and $284 million in fiscal2015.
Total charges associated with our restructuring initiatives recognized in fiscal 2017, 2016 and 2015 consisted of the following: As Reported Estimated In Millions Fiscal 2017 Fiscal 2016 Fiscal 2015 Future Total
Savings (b) Charge Cash Charge Cash Charge Cash Charge Cash Charge Cash Global reorganization $ 72.1 $ 20.0 $ — $ — $ — $ — $ 3 $ 55 $ 75 $ 75 Closure of Melbourne, Australia plant 21.9 1.6 — — — — 12 1 34 3 Restructuring of certain international product lines 45.1 10.3 — — — — (3) (10) 42 — Closure of Vineland, New Jersey plant 41.4 7.3 — — — — 17 12 58 19 Project Compass (0.4) 12.8 54.7 36.1 — — — 5 54 54 Project Century 44.0 49.4 182.6 34.1 181.8 12.0 6 48 414 143 Project Catalyst — 1.3 (7.5) 47.8 148.4 45.0 — — 141 94 Combination of certain operational facilities — 5.1 — 4.5 13.9 6.5 1 (2) 15 14 Other — — — 0.1 (0.6) 0.1 — — — — Total restructuring charges (a) 224.1 107.8 229.8 122.6 343.5 63.6 36 109 833 402 Project-related costs classified in cost of sales 43.9 46.9 57.5 54.5 13.2 9.7 15 19 130 130 Restructuring charges and project-related costs $ 268.0 $154.7 $ 287.3 $177.1 $ 356.7 $73.3 $ 51 $128 $ 963 $532 Future cumulative annual savings $ 700 (a) Includes restructuring charges recorded in cost of sales of $41.5 million in fiscal 2017, $78.4 million in fiscal 2016 and $59.6 million in fiscal 2015.(b) Cumulative annual savings estimated by fiscal 2018. Includes savings from SG&A cost reduction projects.
Please refer to Note 4 to the Consolidated Financial Statements in Item 8 of this report for more information regarding our restructuring activities.
Interest, net for fiscal 2017 totaled $295 million, $9 million lower than fiscal 2016, primarily driven by lower rates and changes in the mix of debt, partiallyoffset by higher average debt balances.
Our consolidated effective tax rate for fiscal 2017 was 28.8 percent compared to 31.4 percent in fiscal 2016. The 2.6 percentage point decrease was primarilydue to non-deductible expenses related to the Green Giant divestiture in fiscal 2016. Our effective tax rate excluding certain items affecting comparabilitywas 29.2 percent in fiscal 2017 compared to 29.8 percent in fiscal 2016 (see the “Non-GAAP Measures” section below for a description of our use of measuresnot defined by GAAP).
18
Source: GENERAL MILLS INC, 10-K, June 29, 2017 Powered by Morningstar® Document Research℠The information contained herein may not be copied, adapted or distributed and is not warranted to be accurate, complete or timely. The user assumes all risks for any damages or losses arising from any use of this information,except to the extent such damages or losses cannot be limited or excluded by applicable law. Past financial performance is no guarantee of future results.
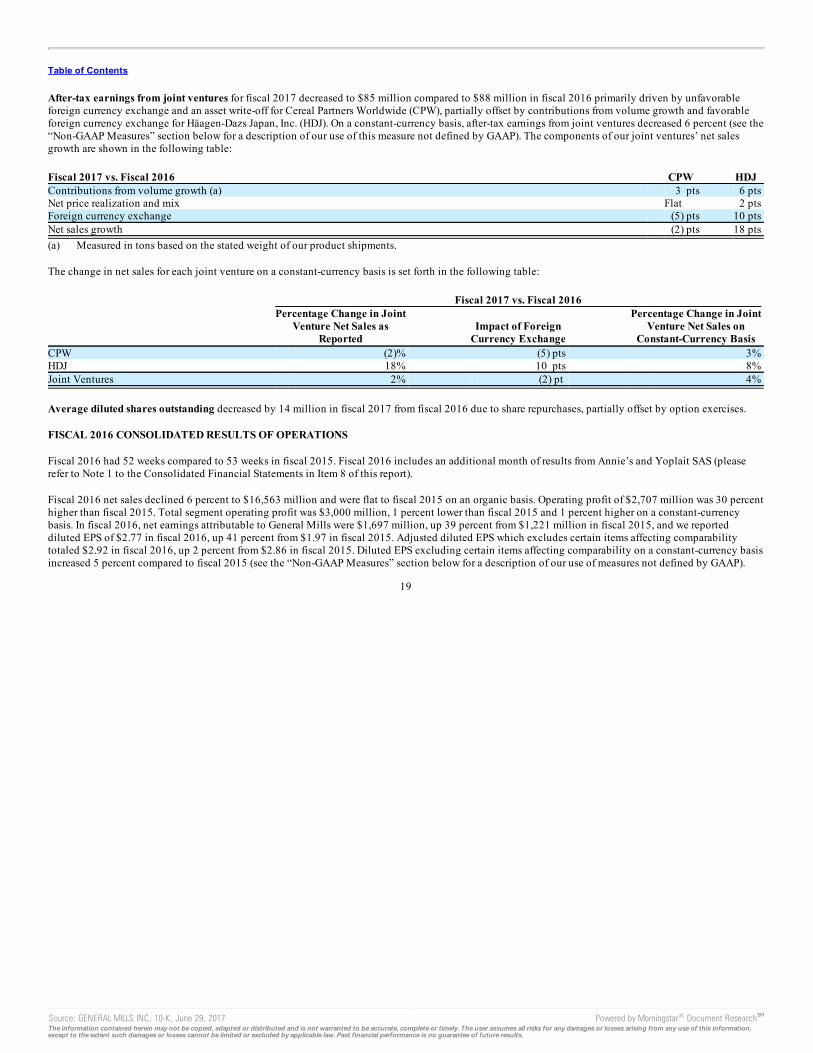
Table of Contents
After-tax earnings from joint ventures for fiscal 2017 decreased to $85 million compared to $88 million in fiscal 2016 primarily driven by unfavorableforeign currency exchange and an asset write-off for Cereal Partners Worldwide (CPW), partially offset by contributions from volume growth and favorableforeign currency exchange for Häagen-Dazs Japan, Inc. (HDJ). On a constant-currency basis, after-tax earnings from joint ventures decreased 6 percent (see the“Non-GAAP Measures” section below for a description of our use of this measure not defined by GAAP). The components of our joint ventures’ net salesgrowth are shown in the following table: Fiscal 2017 vs. Fiscal 2016 CPW HDJ Contributions from volume growth (a) 3 pts 6 pts Net price realization and mix Flat 2 pts Foreign currency exchange (5) pts 10 pts Net sales growth (2) pts 18 pts (a) Measured in tons based on the stated weight of our product shipments.
The change in net sales for each joint venture on a constant-currency basis is set forth in the following table: Fiscal 2017 vs. Fiscal 2016
Percentage Change in JointVenture Net Sales as
Reported Impact of Foreign
Currency Exchange
Percentage Change in JointVenture Net Sales on
Constant-Currency Basis CPW (2)% (5) pts 3% HDJ 18% 10 pts 8% Joint Ventures 2% (2) pt 4%
Average diluted shares outstanding decreased by 14 million in fiscal 2017 from fiscal 2016 due to share repurchases, partially offset by option exercises.
FISCAL 2016 CONSOLIDATED RESULTS OF OPERATIONS
Fiscal 2016 had 52 weeks compared to 53 weeks in fiscal 2015. Fiscal 2016 includes an additional month of results from Annie’s and Yoplait SAS (pleaserefer to Note 1 to the Consolidated Financial Statements in Item 8 of this report).
Fiscal 2016 net sales declined 6 percent to $16,563 million and were flat to fiscal 2015 on an organic basis. Operating profit of $2,707 million was 30 percenthigher than fiscal 2015. Total segment operating profit was $3,000 million, 1 percent lower than fiscal 2015 and 1 percent higher on a constant-currencybasis. In fiscal 2016, net earnings attributable to General Mills were $1,697 million, up 39 percent from $1,221 million in fiscal 2015, and we reporteddiluted EPS of $2.77 in fiscal 2016, up 41 percent from $1.97 in fiscal 2015. Adjusted diluted EPS which excludes certain items affecting comparabilitytotaled $2.92 in fiscal 2016, up 2 percent from $2.86 in fiscal 2015. Diluted EPS excluding certain items affecting comparability on a constant-currency basisincreased 5 percent compared to fiscal 2015 (see the “Non-GAAP Measures” section below for a description of our use of measures not defined by GAAP).
19
Source: GENERAL MILLS INC, 10-K, June 29, 2017 Powered by Morningstar® Document Research℠The information contained herein may not be copied, adapted or distributed and is not warranted to be accurate, complete or timely. The user assumes all risks for any damages or losses arising from any use of this information,except to the extent such damages or losses cannot be limited or excluded by applicable law. Past financial performance is no guarantee of future results.
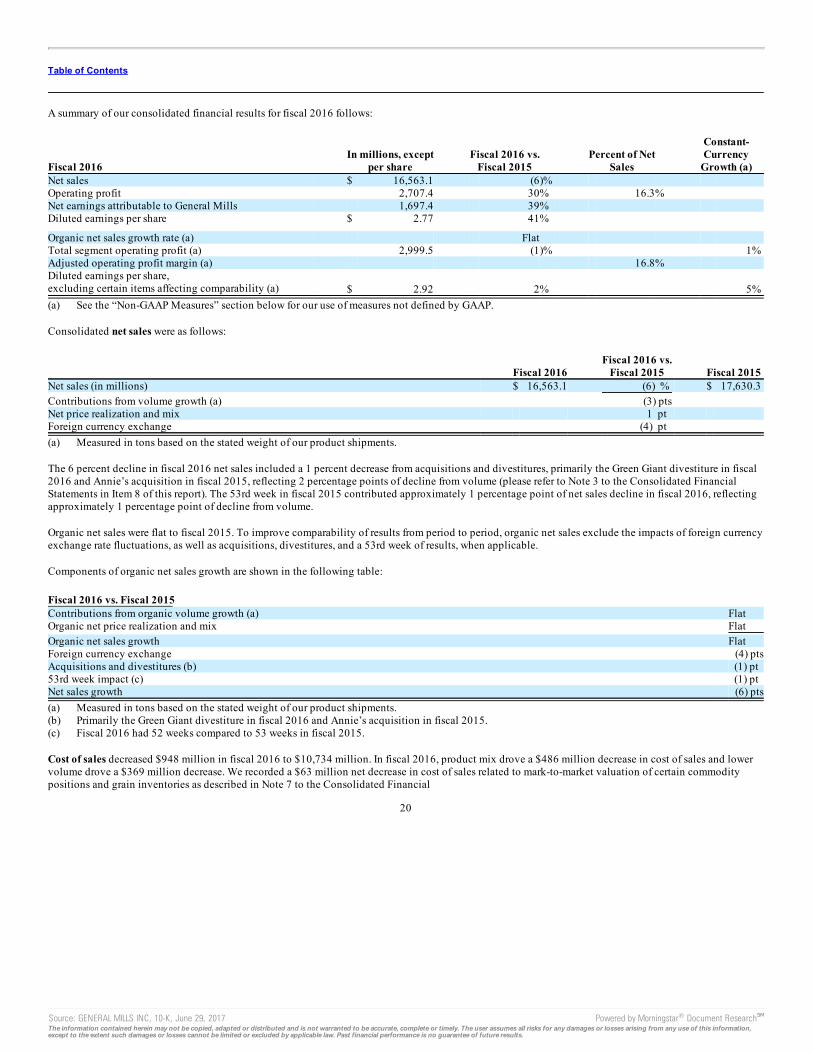
Table of Contents
A summary of our consolidated financial results for fiscal 2016 follows:
Fiscal 2016 In millions, except
per share Fiscal 2016 vs.
Fiscal 2015 Percent of Net
Sales
Constant-Currency
Growth (a) Net sales $ 16,563.1 (6)% Operating profit 2,707.4 30% 16.3% Net earnings attributable to General Mills 1,697.4 39% Diluted earnings per share $ 2.77 41%
Organic net sales growth rate (a) Flat Total segment operating profit (a) 2,999.5 (1)% 1% Adjusted operating profit margin (a) 16.8% Diluted earnings per share,excluding certain items affecting comparability (a) $ 2.92 2% 5% (a) See the “Non-GAAP Measures” section below for our use of measures not defined by GAAP.
Consolidated net sales were as follows:
Fiscal 2016 Fiscal 2016 vs.
Fiscal 2015 Fiscal 2015 Net sales (in millions) $ 16,563.1 (6) % $ 17,630.3 Contributions from volume growth (a) (3) pts Net price realization and mix 1 pt Foreign currency exchange (4) pt (a) Measured in tons based on the stated weight of our product shipments.
The 6 percent decline in fiscal 2016 net sales included a 1 percent decrease from acquisitions and divestitures, primarily the Green Giant divestiture in fiscal2016 and Annie’s acquisition in fiscal 2015, reflecting 2 percentage points of decline from volume (please refer to Note 3 to the Consolidated FinancialStatements in Item 8 of this report). The 53rd week in fiscal 2015 contributed approximately 1 percentage point of net sales decline in fiscal 2016, reflectingapproximately 1 percentage point of decline from volume.
Organic net sales were flat to fiscal 2015. To improve comparability of results from period to period, organic net sales exclude the impacts of foreign currencyexchange rate fluctuations, as well as acquisitions, divestitures, and a 53rd week of results, when applicable.
Components of organic net sales growth are shown in the following table: Fiscal 2016 vs. Fiscal 2015 Contributions from organic volume growth (a) Flat Organic net price realization and mix Flat Organic net sales growth Flat Foreign currency exchange (4) ptsAcquisitions and divestitures (b) (1) pt 53rd week impact (c) (1) pt Net sales growth (6) pts(a) Measured in tons based on the stated weight of our product shipments.(b) Primarily the Green Giant divestiture in fiscal 2016 and Annie’s acquisition in fiscal 2015.(c) Fiscal 2016 had 52 weeks compared to 53 weeks in fiscal 2015.
Cost of sales decreased $948 million in fiscal 2016 to $10,734 million. In fiscal 2016, product mix drove a $486 million decrease in cost of sales and lowervolume drove a $369 million decrease. We recorded a $63 million net decrease in cost of sales related to mark-to-market valuation of certain commoditypositions and grain inventories as described in Note 7 to the Consolidated Financial
20
Source: GENERAL MILLS INC, 10-K, June 29, 2017 Powered by Morningstar® Document Research℠The information contained herein may not be copied, adapted or distributed and is not warranted to be accurate, complete or timely. The user assumes all risks for any damages or losses arising from any use of this information,except to the extent such damages or losses cannot be limited or excluded by applicable law. Past financial performance is no guarantee of future results.

Table of Contents
Statements in Item 8 of this report, compared to a net increase of $90 million in fiscal 2015. In fiscal 2016, we recorded $78 million of restructuring chargesin cost of sales compared to $60 million in fiscal 2015. We recorded $58 million of restructuring initiative project-related costs in cost of sales in fiscal 2016compared to $13 million in fiscal 2015 (please refer to Note 4 to the Consolidated Financial Statements in Item 8 of this report). We also recorded a $3million foreign exchange loss in cost of sales in fiscal 2015 related to Venezuela currency devaluation.
Gross margin declined 2 percent in fiscal 2016 versus fiscal 2015. Gross margin as a percent of net sales of 35 percent increased 150 basis points comparedto fiscal 2015.
SG&A expenses decreased $209 million in fiscal 2016 versus fiscal 2015 primarily due to an 8 percent decrease in advertising and media expense, andsavings from Project Catalyst, Project Compass, and our other cost-management initiatives. In fiscal 2015, we recorded a $5 million charge in SG&Aexpenses related to Venezuela currency devaluation and $16 million of integration costs related to our acquisition of Annie’s. SG&A expenses as a percent ofnet sales decreased 10 basis points compared to fiscal 2015.
During fiscal 2016, we recorded a $148 million divestitures gain (net) from the sale of Green Giant, our subsidiary in Venezuela, and our foodservicebusiness in Argentina (please refer to Note 3 of the Consolidated Financial Statements in Item 8 of this report).
Restructuring, impairment, and other exit costs totaled $151 million in fiscal 2016 compared to $544 million in fiscal 2015.
In fiscal 2015, we made a strategic decision to redirect certain resources supporting our Green Giant business in our North America Retail segment to otherbusinesses within the segment. As a result, we recorded a $260 million impairment charge in fiscal 2015 related to the Green Giant brand intangible asset.
Restructuring charges recorded in restructuring, impairment, and other exit costs were $151 million in fiscal 2016 compared to $284 million in fiscal 2015.Total charges associated with our restructuring initiatives recognized in fiscal 2016 and 2015 consisted of the following: As Reported In Millions Fiscal 2016 Fiscal 2015 Charge Cash Charge Cash Project Compass $ 54.7 $ 36.1 $ — $ — Total Century (a) 182.6 34.1 181.8 12.0 Project Catalyst (7.5) 47.8 148.4 45.0 Combination of certain operational facilities — 4.5 13.9 6.5 Other — 0.1 (0.6) 0.1 Total restructuring charges (a) 229.8 122.6 343.5 63.6 Project-related costs recorded in costs of sales 57.5 54.5 13.2 9.7 Restructuring charges and project-related costs $ 287.3 $177.1 $ 356.7 $73.3 (a) Includes $78.4 million of restructuring charges recorded in cost of sales in fiscal 2016 and $59.6 million in fiscal 2015.
Please refer to Note 4 to the Consolidated Financial Statements in Item 8 of this report for more information regarding our restructuring activities.
Interest, net for fiscal 2016 totaled $304 million, $12 million lower than fiscal 2015, primarily driven by lower average debt balances, partially offset bychanges in the mix of debt.
Our consolidated effective tax rate for fiscal 2016 was 31.4 percent compared to 33.3 percent in fiscal 2015. The 1.9 percentage point decrease was primarilydue to the unfavorable impact of our repatriation of historical foreign earnings in fiscal 2015, partially offset by non-deductible expenses related to the GreenGiant divestiture in fiscal 2016. Our effective tax rate excluding certain items affecting comparability was 29.8 percent in fiscal 2016 compared to 30.5percent in fiscal 2015 (see the “Non-GAAP Measures” section below for a description of our use of measures not defined by GAAP).
21
Source: GENERAL MILLS INC, 10-K, June 29, 2017 Powered by Morningstar® Document Research℠The information contained herein may not be copied, adapted or distributed and is not warranted to be accurate, complete or timely. The user assumes all risks for any damages or losses arising from any use of this information,except to the extent such damages or losses cannot be limited or excluded by applicable law. Past financial performance is no guarantee of future results.

Table of Contents
After-tax earnings from joint ventures for fiscal 2016 increased to $88 million compared to $84 million in fiscal 2015 primarily driven by favorable inputcosts in fiscal 2016, favorable product mix for HDJ, and lapping an impairment charge of $3 million at CPW in South Africa in fiscal 2015, partially offset byunfavorable foreign currency exchange. On a constant-currency basis, after-tax earnings from joint ventures increased 12 percent (see the “Non-GAAPMeasures” section below for a description of our use of these measures not defined by GAAP). The components of our joint ventures’ net sales growth areshown in the following table: Fiscal 2016 vs. Fiscal 2015 CPW HDJ Contributions from volume growth (a) Flat 11 pts Net price realization and mix Flat (6) pts Foreign currency exchange (12) pts (5) pts Net sales growth (12) pts Flat (a) Measuredin tons based on the stated weight of our product shipments.
The change in net sales for each joint venture on a constant-currency basis is set forth in the following table: Fiscal 2016 vs. Fiscal 2015
Percentage Change in JointVenture Net Sales as
Reported Impact of Foreign
Currency Exchange
Percentage Change in JointVenture Net Sales on
Constant-Currency Basis CPW (12)% (12) pts Flat HDJ Flat (5) pts 5% Joint Ventures (10)% (11) pts 1%
Average diluted shares outstanding decreased by 7 million in fiscal 2016 from fiscal 2015 due to share repurchases, partially offset by option exercises.
RESULTS OF SEGMENT OPERATIONS
In the third quarter of fiscal 2017, we announced a new global organization structure to streamline our leadership, enhance global scale, and drive improvedoperational agility to maximize our growth capabilities. As a result of this global reorganization, beginning in the third quarter of fiscal 2017, we reportedresults for our four operating segments as follows: North America Retail; Convenience Stores & Foodservice; Europe & Australia; and Asia & Latin America.We have restated our net sales by segment and segment operating profit amounts to reflect our new operating segments. These segment changes had no effecton previously reported consolidated net sales, operating profit, net earnings attributable to General Mills, or earnings per share.
Our North America Retail operating segment consists of our former U.S. Retail operating units and our Canada region. Within our North America Retailoperating segment, our former U.S. Meals operating unit and U.S. Baking operating unit have been combined into one operating unit: U.S. Meals & Baking.Our Convenience Stores & Foodservice operating segment was unchanged. Our Europe & Australia operating segment consists of our former Europe region.Our Asia & Latin America operating segment consists of our former Asia/Pacific and Latin America regions.
22
Source: GENERAL MILLS INC, 10-K, June 29, 2017 Powered by Morningstar® Document Research℠The information contained herein may not be copied, adapted or distributed and is not warranted to be accurate, complete or timely. The user assumes all risks for any damages or losses arising from any use of this information,except to the extent such damages or losses cannot be limited or excluded by applicable law. Past financial performance is no guarantee of future results.

Table of Contents
The following tables provide the dollar amount and percentage of net sales and operating profit from each segment for fiscal 2017, 2016, and 2015: Fiscal Year 2017 2016 2015
In Millions Dollars Percent of
Total Dollars Percent of
Total Dollars Percent of
Total Net Sales North America Retail $10,196.9 65% $10,936.6 66% $11,612.1 66% Convenience Stores & Foodservice 1,870.0 12 1,923.8 12 1,995.1 11 Europe & Australia 1,824.5 12 1,998.0 12 2,126.5 12 Asia & Latin America 1,728.4 11 1,704.7 10 1,896.6 11 Total $15,619.8 100% $16,563.1 100% $17,630.3 100%
Segment Operating Profit North America Retail $ 2,303.6 78% $ 2,351.2 78% $ 2,382.7 78% Convenience Stores & Foodservice 401.2 14 378.9 13 353.1 12 Europe & Australia 164.2 5 200.3 7 179.4 6 Asia & Latin America 83.6 3 69.1 2 119.8 4 Total $ 2,952.6 100% $ 2,999.5 100% $ 3,035.0 100%
Segment operating profit excludes unallocated corporate items, net gain/loss on divestitures, and restructuring, impairment, and other exit costs becausethese items affecting operating profit are centrally managed at the corporate level and are excluded from the measure of segment profitability reviewed by ourexecutive management.
NORTH AMERICA RETAIL SEGMENT
Our North America Retail operating segment reflects business with a wide variety of grocery stores, mass merchandisers, membership stores, natural foodchains, drug, dollar and discount chains, and e-commerce grocery providers. Our product categories in this business segment are ready-to-eat cereals,refrigerated yogurt, soup, meal kits, refrigerated and frozen dough products, dessert and baking mixes, frozen pizza and pizza snacks, grain, fruit and savorysnacks, and a wide variety of organic products including refrigerated yogurt, nutrition bars, meal kits, salty snacks, ready-to-eat cereal, and grain snacks.
North America Retail net sales were as follows:
Fiscal2017
Fiscal2017 vs. 2016
Percentage Change Fiscal2016
Fiscal2016 vs. 2015
Percentage Change Fiscal2015
Net sales (in millions) $10,196.9 (7) % $10,936.6 (6) % $11,612.1 Contributions from volume growth (a) (11) pts (7) pts Net price realization and mix 4 pts 2 pts Foreign currency exchange Flat (1) pt (a) Measured in tons based on the stated weight of our product shipments.
The 7 percent decrease in North America Retail net sales for fiscal 2017 was driven by declines in the U.S. Meals & Baking, U.S. Yogurt, U.S. Cereal, andCanada operating units. The decline in net sales also includes the impact of the Green Giant divestiture from the U.S. Meals & Baking and Canada operatingunits in fiscal 2016.
The 6 percent decrease in North America Retail net sales for fiscal 2016 was driven by declines in all operating units. These results include 3 percentagepoints of net sales decline from the net impact of acquisitions and divestitures, primarily Green Giant and Annie’s, reflecting approximately 3 percentagepoints of decline from volume. The 53rd week in fiscal 2015 contributed 1 percentage point of net sales decline in fiscal 2016, reflecting approximately 2percentage points of decline from volume.
23
Source: GENERAL MILLS INC, 10-K, June 29, 2017 Powered by Morningstar® Document Research℠The information contained herein may not be copied, adapted or distributed and is not warranted to be accurate, complete or timely. The user assumes all risks for any damages or losses arising from any use of this information,except to the extent such damages or losses cannot be limited or excluded by applicable law. Past financial performance is no guarantee of future results.

Table of Contents
The components of North America Retail organic net sales growth are shown in the following table:
Fiscal2017 vs. 2016
Percentage Change
Fiscal2016 vs. 2015
Percentage Change Contributions from organic volume growth (a) (9) pts (2) pts Organic net price realization and mix 4 pts 1 pt Organic net sales growth (5) pts (1) pt Foreign currency exchange Flat (1) pt Acquisitions and divestitures (b) (2) pts (3) pts 53rd week impact (c) — (1) pt Net sales growth (7) pts (6) pts (a) Measured in tons based on the stated weight of our product shipments.(b) Primarily the Green Giant divestiture in fiscal 2016 and Annie’s acquisition in fiscal 2015.(c) Fiscal 2016 had 52 weeks compared to 53 weeks in fiscal 2015.
North America Retail organic net sales decreased 5 percentage points in fiscal 2017 which reflects the impact of reduced marketing and higher pricing as aresult of lower promotional spending. North America Retail organic net sales decreased 1 percent in fiscal 2016 which reflects the impact of reducedmarketing support.
Net sales for our North America Retail operating units are shown in the following table: Fiscal Year In Millions 2017 2016 2015 U.S. Meals & Baking (a) $ 3,876.6 $ 4,297.3 $ 4,644.1 U.S. Cereal 2,251.8 2,312.8 2,330.1 U.S. Snacks (a) 2,098.2 2,094.3 2,134.4 U.S. Yogurt and Other 1,064.3 1,302.7 1,398.4 Canada 906.0 929.5 1,105.1 Total (a) $10,196.9 $10,936.6 $11,612.1 (a) The impact of an additional month of results from Annie’s in fiscal 2016 was not material to U.S. Meals & Baking, U.S. Snacks, or the North America
Retail segment.
North America Retail net sales percentage change by operating unit are shown in the following table:
Fiscal 2017
vs. 2016 Fiscal 2016
vs. 2015 U.S. Meals & Baking (a) (10)% (7)% U.S. Yogurt (18) (7) U.S. Cereal (3) (1) Canada (b) (2) (16) U.S. Snacks (a) Flat (2) Total (a) (7)% (6)% (a) Fiscal 2016 net sales for the U.S. Meals & Baking and U.S. Snacks operating units include an additional month of results from Annie’s.(b) On a constant currency basis, Canada net sales decreased 2 percent in fiscal 2017 and decreased 4 percent in fiscal 2016. See the “Non-GAAP Measures”
section below for our use of this measure not defined by GAAP.
Segment operating profit of $2,304 million in fiscal 2017 decreased $48 million, or 2 percent, from fiscal 2016. The decrease was primarily driven bydeclining contributions from volume growth, currency-driven inflation on products imported into Canada, and the impact of the Green Giant divestiture,partially offset by benefits from cost savings initiatives, favorable net price realization, and a decrease in SG&A expenses, including a 16 percentage pointdecline in media and advertising expense. Segment operating profit decreased 2 percent on a constant-currency basis in fiscal 2017 compared to fiscal 2016(see the “Non-GAAP Measures” section below for our use of this measure).
Segment operating profit of $2,351 million in fiscal 2016 decreased $32 million, or 1 percent, from fiscal 2015. The decrease was primarily driven bycurrency-driven inflation on products imported into Canada and the impact of the Green Giant divestiture,
24
Source: GENERAL MILLS INC, 10-K, June 29, 2017 Powered by Morningstar® Document Research℠The information contained herein may not be copied, adapted or distributed and is not warranted to be accurate, complete or timely. The user assumes all risks for any damages or losses arising from any use of this information,except to the extent such damages or losses cannot be limited or excluded by applicable law. Past financial performance is no guarantee of future results.

Table of Contents
partially offset by a decrease in SG&A expenses, including a decline in media and advertising expense and benefits from cost savings initiatives. Segmentoperating profit was flat on a constant-currency basis in fiscal 2016 compared to fiscal 2015 (see the “Non-GAAP Measures” section below for our use of thismeasure).
CONVENIENCE STORES & FOODSERVICE SEGMENT
In our Convenience Stores & Foodservice segment our major product categories are ready-to-eat cereals, snacks, refrigerated yogurt, frozen meals, unbakedand fully baked frozen dough products, and baking mixes. Many products we sell are branded to the consumer and nearly all are branded to our customers.We sell to distributors and operators in many customer channels including foodservice, convenience stores, vending, and supermarket bakeries in the UnitedStates.
Convenience Stores & Foodservice net sales were as follows:
Fiscal2017
Fiscal 2017vs. 2016
Percentage Change Fiscal2016
Fiscal 2016vs. 2015
Percentage Change Fiscal2015
Net sales (in millions) $1,870.0 (3) % $1,923.8 (4) % $1,995.1 Contributions from volume growth (a) Flat (3) pts Net price realization and mix (3) pts (1) pt (a) Measured in tons based on the stated weight of our product shipments.
The 3 percent decline in fiscal 2017 Convenience Stores & Foodservice net sales was driven primarily by market index pricing on bakery flour and volumedeclines in non-Focus 6 platforms, partially offset by an increase in the Focus 6 platforms.
The 4 percentage point decline in fiscal 2016 net sales was primarily driven by the impact of the 53rd week in fiscal 2015 which contributed approximately 2percentage points of net sales decline in fiscal 2016, reflecting approximately 2 percentage points of decline from volume.
The components of Convenience Stores & Foodservice organic net sales growth are shown in the following table:
Fiscal 2017vs. 2016
Percentage Change
Fiscal 2016vs. 2015
Percentage Change Contributions from organic volume growth (a) Flat (1) pt Organic net price realization and mix (3) pts (1) pt Organic net sales growth (3) pts (2) pts 53rd week impact (b) — (2) pts Net sales growth (3) pts (4) pts (a) Measured in tons based on the stated weight of our product shipments.(b) Fiscal 2016 had 52 weeks compared to 53 weeks in fiscal 2015.
In fiscal 2017, segment operating profit was $401 million, an increase of 6 percent from $379 million in fiscal 2016 primarily driven by lower input costs andbenefits from cost savings initiatives. In fiscal 2016, segment operating profit was up 7 percent from $353 million in fiscal 2015 primarily driven byfavorable product mix and cost savings from Project Catalyst and other cost management initiatives.
EUROPE & AUSTRALIA SEGMENT
Our Europe & Australia operating segment consists of our former Europe region. The segment includes retail and foodservice businesses in the greater Europeand Australia regions. Our product categories include refrigerated yogurt, meal kits, super-premium ice cream, refrigerated and frozen dough products, shelfstable vegetables, grain snacks, and dessert and baking mixes. We also sell super-premium ice cream directly to consumers through company-owned retailshops. Revenues from franchise fees are reported in the region or country where the franchisee is located.
25
Source: GENERAL MILLS INC, 10-K, June 29, 2017 Powered by Morningstar® Document Research℠The information contained herein may not be copied, adapted or distributed and is not warranted to be accurate, complete or timely. The user assumes all risks for any damages or losses arising from any use of this information,except to the extent such damages or losses cannot be limited or excluded by applicable law. Past financial performance is no guarantee of future results.

Table of Contents
Europe & Australia net sales were as follows:
Fiscal2017
Fiscal 2017vs. 2016
Percentage Change Fiscal2016
Fiscal 2016vs. 2015
Percentage Change Fiscal2015
Net sales (in millions) (a) $1,824.5 (9) % $1,998.0 (6) % $2,126.5 Contributions from volume growth (b) (7) pts 5 pts Net price realization and mix 3 pts (2) pts Foreign currency exchange (5) pts (9) pts (a) The 9 percent decline in fiscal 2017 net sales for the Europe & Australia segment includes approximately 3 percentage points of decline due to an
additional month of results from Yoplait SAS in fiscal 2016. The 6 percent decline in fiscal 2016 net sales for the Europe & Australia segment includes3 percentage points of growth due to an additional month of results from Yoplait SAS in fiscal 2016.
(b) Measured in tons based on the stated weight of our product shipments.
The 9 percent decline in Europe & Australia fiscal 2017 net sales was driven by lower contributions from volume growth, including the impact of anadditional month of results from Yoplait SAS in fiscal 2016, and unfavorable foreign currency exchange, partially offset by favorable net price realizationand mix.
The 6 percent decline in Europe & Australia fiscal 2016 net sales was driven by unfavorable foreign currency exchange, unfavorable net price realization andmix, and the impact of the 53rd week in fiscal 2015, partially offset by higher contributions from volume growth, including the impact of an additionalmonth of results from Yoplait SAS in fiscal 2016.
The components of Europe & Australia organic net sales growth are shown in the following table:
Fiscal 2017vs. 2016
Percentage Change
Fiscal 2016vs. 2015
Percentage Change Contributions from organic volume growth (a) (7) pts 6 pts Organic net price realization and mix 3 pts (2) pts Organic net sales growth (4) pts 4 pts Foreign currency exchange (5) pts (9) pts 53rd week impact (b) — (1) pt Net sales growth (9) pts (6) pts (a) Measured in tons based on the stated weight of our product shipments.(b) Fiscal 2016 had 52 weeks compared to 53 weeks in fiscal 2015.
The 4 percent decrease in Europe & Australia organic net sales growth in fiscal 2017 was primarily driven by a 7 percentage point decline from contributionsfrom organic volume growth, which primarily reflects increased competition in key categories and the impact of an additional month of results from YoplaitSAS in fiscal 2016.
The 4 percent increase in Europe & Australia organic net sales growth in fiscal 2016 was primarily driven by a 6 percentage point increase from contributionsfrom organic volume growth, which primarily reflects the impact of an additional month of results from Yoplait SAS, and contributions from volume growthin our Häagen-Dazs and Old El Paso businesses.
Segment operating profit for fiscal 2017 decreased 18 percent to $164 million from $200 million in fiscal 2016, primarily driven by unfavorable foreigncurrency exchange, including currency-driven inflation on imported products in certain markets, and the impact of the additional month of results fromYoplait SAS in fiscal 2016, partially offset by a decrease in SG&A expenses, including a 24 percentage point decline in media and advertising expense.Europe & Australia segment operating profit decreased 9 percent on a constant-currency basis in fiscal 2017 compared to fiscal 2016 (see the “Non-GAAPMeasures” section below for our use of this measure).
Segment operating profit for fiscal 2016 increased 12 percent to $200 million from $179 million in fiscal 2015, primarily driven by lower input costs,favorable mix, and an additional month of results from Yoplait SAS, partially offset by unfavorable foreign currency exchange. Europe & Australia segmentoperating profit increased 28 percent on a constant-currency basis in fiscal 2016 compared to fiscal 2015 (see the “Non-GAAP Measures” section below forour use of this measure).
26
Source: GENERAL MILLS INC, 10-K, June 29, 2017 Powered by Morningstar® Document Research℠The information contained herein may not be copied, adapted or distributed and is not warranted to be accurate, complete or timely. The user assumes all risks for any damages or losses arising from any use of this information,except to the extent such damages or losses cannot be limited or excluded by applicable law. Past financial performance is no guarantee of future results.

Table of Contents
ASIA & LATIN AMERICA SEGMENT
Our Asia & Latin America operating segment consists of our former Asia/Pacific and Latin America regions. The segment includes retail and foodservicebusinesses in the greater Asia and South America regions. Our product categories include super-premium ice cream and frozen desserts, refrigerated andfrozen dough products, dessert and baking mixes, meal kits, salty and grain snacks, wellness beverages, and refrigerated yogurt. We also sell super-premiumice cream and frozen desserts directly to consumers through company-owned retail shops. Our Asia & Latin America segment also includes productsmanufactured in the United States for export, mainly to Caribbean and Latin American markets, as well as products we manufacture for sale to ourinternational joint ventures. Revenues from export activities and franchise fees are reported in the region or country where the end customer or franchisee, islocated.
Asia & Latin America net sales were as follows:
Fiscal2017
Fiscal2017 vs. 2016
Percentage Change Fiscal2016
Fiscal2016 vs. 2015
Percentage Change Fiscal2015
Net sales (in millions) (a) $1,728.4 1 % $1,704.7 (10) % $1,896.6 Contributions from volume growth (b) Flat 5 pts Net price realization and mix 1 pt 1 pt Foreign currency exchange Flat (16) pts (a) The 1 percent increase in fiscal 2017 net sales for the Asia & Latin America segment includes approximately 3 percentage points of growth due to an
additional month of results from Yoki in fiscal 2017.(b) Measured in tons based on the stated weight of our product shipments.
Asia & Latin America net sales increased 1 percent in fiscal 2017 primarily driven by favorable net price realization in Latin America and China.Contributions from volume growth in fiscal 2017 were flat, including the impact of an additional month of results for Yoki in fiscal 2017.
Asia & Latin America net sales declined 10 percentage points in fiscal 2016 primarily driven by 16 percentage points of net sales decline from unfavorableforeign currency exchange and the impact of the 53rd week in fiscal 2015, partially offset by favorable contributions from volume growth and favorable netprice realization and mix.
The components of Asia & Latin America organic net sales growth are shown in the following table:
Fiscal2017 vs. 2016
Percentage Change
Fiscal2016 vs. 2015
Percentage Change Contributions from organic volume growth (a) (2) pts 3 pts Organic net price realization and mix 5 pts 4 pts Organic net sales growth 3 pts 7 pts Foreign currency exchange Flat (16) pts Acquisitions and divestitures (b) (2) pts Flat 53rd week impact (c) — (1) pt Net sales growth 1 pt (10) pts (a) Measured in tons based on the stated weight of our product shipments.(b) Primarily our Venezuela subsidiary divestiture, Argentina foodservice divestiture, and Laticinios Carolina Ltda acquisition in fiscal 2016.(c) Fiscal 2016 had 52 weeks compared to 53 weeks in fiscal 2015.
The 3 percent increase in Asia & Latin America organic net sales in fiscal 2017 was primarily driven by a 5 percentage point increase from organic net pricerealization and mix resulting from pricing actions in the Latin America and China markets, partially offset by a 2 percentage point decline in contributionsfrom organic volume which reflects the impact of macroeconomic challenges in Latin America and the restructuring of our snacks business in China. The 2percentage point decline in contributions from organic volume included the impact of an additional month of results from Yoki in fiscal 2017.
Source: GENERAL MILLS INC, 10-K, June 29, 2017 Powered by Morningstar® Document Research℠The information contained herein may not be copied, adapted or distributed and is not warranted to be accurate, complete or timely. The user assumes all risks for any damages or losses arising from any use of this information,except to the extent such damages or losses cannot be limited or excluded by applicable law. Past financial performance is no guarantee of future results.

The 7 percent increase in Asia & Latin America organic net sales growth in fiscal 2016 was primarily driven by a 4 percentage point increase from organic netprice realization and mix primarily driven by pricing actions in the Latin America region and a 3 percentage point increase in contributions from organicvolume which reflects increased contributions from the Asia region.
27
Source: GENERAL MILLS INC, 10-K, June 29, 2017 Powered by Morningstar® Document Research℠The information contained herein may not be copied, adapted or distributed and is not warranted to be accurate, complete or timely. The user assumes all risks for any damages or losses arising from any use of this information,except to the extent such damages or losses cannot be limited or excluded by applicable law. Past financial performance is no guarantee of future results.

Table of Contents
Segment operating profit for fiscal 2017 increased 21 percent to $84 million from $69 million in fiscal 2016, primarily driven by growth in the Häagen-Dazsbusiness in China and the impact of an additional month of results from Yoki in fiscal 2017. Asia & Latin America segment operating profit increased 20percent on a constant-currency basis in fiscal 2017 compared to fiscal 2016 (see the “Non-GAAP Measures” section below for our use of this measure).
Segment operating profit for fiscal 2016 declined 42 percent to $69 million from $120 million in fiscal 2015, primarily driven by increased SG&A expenses,unfavorable foreign currency exchange, and input cost inflation, including currency-driven inflation on imported products in certain markets. Asia & LatinAmerica segment operating profit declined 33 percent on a constant-currency basis in fiscal 2016 compared to fiscal 2015 (see the “Non-GAAP Measures”section below for our use of this measure).
UNALLOCATED CORPORATE ITEMS
Unallocated corporate items include corporate overhead expenses, variances to planned domestic employee benefits and incentives, contributions to theGeneral Mills Foundation, asset and liability remeasurement impact of hyperinflationary economies, restructuring initiative project-related costs, and otheritems that are not part of our measurement of segment operating performance. This includes gains and losses from the mark-to-market valuation of certaincommodity positions until passed back to our operating segments in accordance with our policy as discussed in Note 7 to the Consolidated FinancialStatements in Item 8 of this report.
For fiscal 2017, unallocated corporate expense totaled $190 million compared to $289 million last year. In fiscal 2017, we recorded a $14 million netdecrease in expense related to mark-to-market valuation of certain commodity positions and grain inventories compared to a $63 million net decrease inexpense in the prior year. In addition, we recorded $42 million of restructuring charges, and $44 million of restructuring initiative project-related costs in costof sales in fiscal 2017, compared to $78 million of restructuring charges and $58 million of restructuring initiative project-related costs in cost of sales infiscal 2016. The decrease in unallocated corporate expense also reflects lower incentive expense in fiscal 2017 compared to fiscal 2016.
For fiscal 2016, unallocated corporate expense totaled $289 million compared to $414 million in fiscal 2015. In fiscal 2016, we recorded a $63 million netdecrease in expense related to mark-to-market valuation of certain commodity positions and grain inventories compared to a $90 million net increase inexpense in the prior year. In addition, we recorded $78 million of restructuring charges, and $58 million of restructuring initiative project-related costs in costof sales in fiscal 2016, compared to $60 million of restructuring charges and $13 million of restructuring initiative project-related costs in cost of sales infiscal 2015. We recorded an $8 million foreign exchange loss related to the remeasurement of assets and liabilities of our Venezuelan subsidiary in fiscal2015. We also recorded $16 million of integration costs resulting from the acquisition of Annie’s in fiscal 2015. The decrease in unallocated corporateexpense also reflects cost savings from Project Catalyst and other cost management initiatives.
IMPACT OF INFLATION
Our gross margin performance reflects the impact of 1 percent input cost inflation in fiscal 2017, 2 percent in fiscal 2016, and 2 percent in fiscal 2015,primarily on commodity inputs. We expect input cost inflation of 3 percent in fiscal 2018. We attempt to minimize the effects of inflation through HMM,planning, and operating practices. Our risk management practices are discussed in Item 7A of this report.
LIQUIDITY
The primary source of our liquidity is cash flow from operations. Over the most recent three-year period, our operations have generated $7.5 billion in cash. Asubstantial portion of this operating cash flow has been returned to shareholders through share repurchases and dividends. We also use cash from operationsto fund our capital expenditures and acquisitions. We typically use a combination of cash, notes payable, and long-term debt to finance significantacquisitions and major capital expansions.
As of May 28, 2017, we had $703 million of cash and cash equivalents held in foreign jurisdictions, which will be used to fund foreign operations andacquisitions. There is currently no need to repatriate these funds in order to meet domestic funding obligations or scheduled cash distributions. If we chooseto repatriate historical earnings held in foreign jurisdictions, we intend to do so only in a tax-neutral manner.
28
Source: GENERAL MILLS INC, 10-K, June 29, 2017 Powered by Morningstar® Document Research℠The information contained herein may not be copied, adapted or distributed and is not warranted to be accurate, complete or timely. The user assumes all risks for any damages or losses arising from any use of this information,except to the extent such damages or losses cannot be limited or excluded by applicable law. Past financial performance is no guarantee of future results.
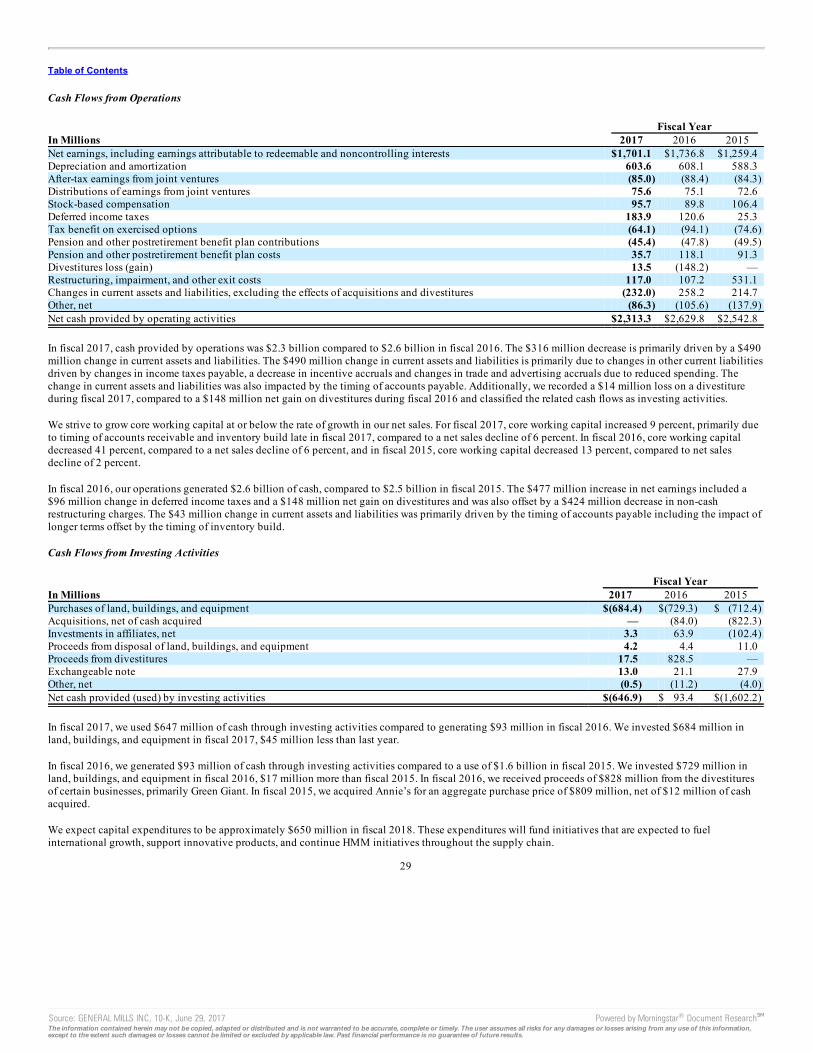
Table of Contents
Cash Flows from Operations Fiscal Year In Millions 2017 2016 2015 Net earnings, including earnings attributable to redeemable and noncontrolling interests $1,701.1 $1,736.8 $1,259.4 Depreciation and amortization 603.6 608.1 588.3 After-tax earnings from joint ventures (85.0) (88.4) (84.3) Distributions of earnings from joint ventures 75.6 75.1 72.6 Stock-based compensation 95.7 89.8 106.4 Deferred income taxes 183.9 120.6 25.3 Tax benefit on exercised options (64.1) (94.1) (74.6) Pension and other postretirement benefit plan contributions (45.4) (47.8) (49.5) Pension and other postretirement benefit plan costs 35.7 118.1 91.3 Divestitures loss (gain) 13.5 (148.2) — Restructuring, impairment, and other exit costs 117.0 107.2 531.1 Changes in current assets and liabilities, excluding the effects of acquisitions and divestitures (232.0) 258.2 214.7 Other, net (86.3) (105.6) (137.9) Net cash provided by operating activities $2,313.3 $2,629.8 $2,542.8
In fiscal 2017, cash provided by operations was $2.3 billion compared to $2.6 billion in fiscal 2016. The $316 million decrease is primarily driven by a $490million change in current assets and liabilities. The $490 million change in current assets and liabilities is primarily due to changes in other current liabilitiesdriven by changes in income taxes payable, a decrease in incentive accruals and changes in trade and advertising accruals due to reduced spending. Thechange in current assets and liabilities was also impacted by the timing of accounts payable. Additionally, we recorded a $14 million loss on a divestitureduring fiscal 2017, compared to a $148 million net gain on divestitures during fiscal 2016 and classified the related cash flows as investing activities.
We strive to grow core working capital at or below the rate of growth in our net sales. For fiscal 2017, core working capital increased 9 percent, primarily dueto timing of accounts receivable and inventory build late in fiscal 2017, compared to a net sales decline of 6 percent. In fiscal 2016, core working capitaldecreased 41 percent, compared to a net sales decline of 6 percent, and in fiscal 2015, core working capital decreased 13 percent, compared to net salesdecline of 2 percent.
In fiscal 2016, our operations generated $2.6 billion of cash, compared to $2.5 billion in fiscal 2015. The $477 million increase in net earnings included a$96 million change in deferred income taxes and a $148 million net gain on divestitures and was also offset by a $424 million decrease in non-cashrestructuring charges. The $43 million change in current assets and liabilities was primarily driven by the timing of accounts payable including the impact oflonger terms offset by the timing of inventory build.
Cash Flows from Investing Activities Fiscal Year In Millions 2017 2016 2015 Purchases of land, buildings, and equipment $(684.4) $(729.3) $ (712.4) Acquisitions, net of cash acquired — (84.0) (822.3) Investments in affiliates, net 3.3 63.9 (102.4) Proceeds from disposal of land, buildings, and equipment 4.2 4.4 11.0 Proceeds from divestitures 17.5 828.5 — Exchangeable note 13.0 21.1 27.9 Other, net (0.5) (11.2) (4.0) Net cash provided (used) by investing activities $(646.9) $ 93.4 $(1,602.2)
In fiscal 2017, we used $647 million of cash through investing activities compared to generating $93 million in fiscal 2016. We invested $684 million inland, buildings, and equipment in fiscal 2017, $45 million less than last year.
In fiscal 2016, we generated $93 million of cash through investing activities compared to a use of $1.6 billion in fiscal 2015. We invested $729 million inland, buildings, and equipment in fiscal 2016, $17 million more than fiscal 2015. In fiscal 2016, we received proceeds of $828 million from the divestituresof certain businesses, primarily Green Giant. In fiscal 2015, we acquired Annie’s for an aggregate purchase price of $809 million, net of $12 million of cashacquired.
We expect capital expenditures to be approximately $650 million in fiscal 2018. These expenditures will fund initiatives that are expected to fuelinternational growth, support innovative products, and continue HMM initiatives throughout the supply chain.
29
Source: GENERAL MILLS INC, 10-K, June 29, 2017 Powered by Morningstar® Document Research℠The information contained herein may not be copied, adapted or distributed and is not warranted to be accurate, complete or timely. The user assumes all risks for any damages or losses arising from any use of this information,except to the extent such damages or losses cannot be limited or excluded by applicable law. Past financial performance is no guarantee of future results.

Table of Contents
Cash Flows from Financing Activities Fiscal Year In Millions 2017 2016 2015 Change in notes payable $ 962.4 $ (323.8) $ (509.8) Issuance of long-term debt 1,072.1 542.5 2,253.2 Payment of long-term debt (1,000.0) (1,000.4) (1,145.8) Proceeds from common stock issued on exercised options 112.6 171.9 163.7 Tax benefit on exercised options 64.1 94.1 74.6 Purchases of common stock for treasury (1,651.5) (606.7) (1,161.9) Dividends paid (1,135.1) (1,071.7) (1,017.7) Distributions to noncontrolling and redeemable interest holders (61.0) (84.3) (25.0) Other, net (9.1) (7.2) (16.1) Net cash used by financing activities $(1,645.5) $(2,285.6) $(1,384.8)
Net cash used by financing activities decreased by $640 million in fiscal 2017. We had $1.8 billion more net debt issuances in fiscal 2017 than the prior year.For more information on our debt issuances and payments, please refer to Note 8 to the Consolidated Financial Statements in Item 8 of this report.
During fiscal 2017, we received $113 million in proceeds from common stock issued on exercised options compared to $172 million in fiscal 2016, adecrease of $59 million. During fiscal 2015, we received $164 million in proceeds from common stock issued on exercised options.
During fiscal 2017, we repurchased 25 million shares of our common stock for $1,652 million. During fiscal 2016, we repurchased 11 million shares of ourcommon stock for $607 million. During fiscal 2015, we repurchased 22 million shares of our common stock for $1,162 million.
Dividends paid in fiscal 2017 totaled $1,135 million, or $1.92 per share, an 8 percent per share increase from fiscal 2016. Dividends paid in fiscal 2016totaled $1,072 million, or $1.78 per share, a 7 percent per share increase from fiscal 2015 dividends of $1.67 per share.
Selected Cash Flows from Joint Ventures
Selected cash flows from our joint ventures are set forth in the following table: Fiscal Year Inflow (Outflow), in Millions 2017 2016 2015 Investments in affiliates, net $ 3.3 $63.9 $(102.4) Dividends received 75.6 75.1 72.6
CAPITAL RESOURCES
Total capital consisted of the following:
In Millions May 28,
2017 May 29,
2016 Notes payable $ 1,234.1 $ 269.8 Current portion of long-term debt 604.7 1,103.4 Long-term debt 7,642.9 7,057.7 Total debt 9,481.7 8,430.9 Redeemable interest 910.9 845.6 Noncontrolling interests 357.6 376.9 Stockholders’ equity 4,327.9 4,930.2 Total capital $15,078.1 $14,583.6
30
Source: GENERAL MILLS INC, 10-K, June 29, 2017 Powered by Morningstar® Document Research℠The information contained herein may not be copied, adapted or distributed and is not warranted to be accurate, complete or timely. The user assumes all risks for any damages or losses arising from any use of this information,except to the extent such damages or losses cannot be limited or excluded by applicable law. Past financial performance is no guarantee of future results.

Table of Contents
The following table details the fee-paid committed and uncommitted credit lines we had available as of May 28, 2017:
In Billions FacilityAmount
BorrowedAmount
Credit facility expiring: May 2022 $ 2.7 $ — June 2019 0.2 0.1
Total committed credit facilities 2.9 0.1 Uncommitted credit facilities 0.5 0.1 Total committed and uncommitted credit facilities $ 3.4 $ 0.2
In fiscal 2016, we entered into a $2.7 billion fee-paid committed credit facility that was originally scheduled to expire in May 2021. During the fourth quarterof fiscal 2017 we amended the credit facility’s expiration date by one year to May 2022.
To ensure availability of funds, we maintain bank credit lines sufficient to cover our outstanding notes payable. Commercial paper is a continuing source ofshort-term financing. We have commercial paper programs available to us in the United States and Europe. We also have uncommitted and asset-backedcredit lines that support our foreign operations. The credit facilities contain several covenants, including a requirement to maintain a fixed charge coverageratio of at least 2.5 times.
Certain of our long-term debt agreements, our credit facilities, and our noncontrolling interests contain restrictive covenants. As of May 28, 2017, we were incompliance with all of these covenants.
We have $605 million of long-term debt maturing in the next 12 months that is classified as current, including $500 million of 1.4 percent notes due October2017 and $100 million of 6.39 percent fixed rate medium term notes due for remarketing in February 2018. We believe that cash flows from operations,together with available short- and long-term debt financing, will be adequate to meet our liquidity and capital needs for at least the next 12 months.
As of May 28, 2017, our total debt, including the impact of derivative instruments designated as hedges, was 67 percent in fixed-rate and 33 percent infloating-rate instruments, compared to 78 percent in fixed-rate and 22 percent in floating-rate instruments on May 29, 2016.
Return on average total capital was 12.7 percent in fiscal 2017 compared to 12.9 percent in fiscal 2016. Improvement in adjusted return on average totalcapital is one of our key performance measures (see the “Non-GAAP Measures” section below for our discussion of this measure, which is not defined byGAAP). Adjusted return on average total capital increased 30 basis points from 11.3 percent in fiscal 2016 to 11.6 percent in fiscal 2017 as fiscal 2017adjusted earnings increased. On a constant-currency basis, adjusted return on average total capital increased 40 basis points.
We also believe that our fixed charge coverage ratio and the ratio of operating cash flow to debt are important measures of our financial strength. Our fixedcharge coverage ratio in fiscal 2017 was 7.26 compared to 7.40 in fiscal 2016. The measure decreased from fiscal 2016 as earnings before income taxes andafter-tax earnings from joint ventures decreased by $132 million in fiscal 2017. Our operating cash flow to debt ratio decreased 6.8 percentage points to 24.4percent in fiscal 2017, driven by a decrease in cash provided by operations and an increase in notes payable.
We have a 51 percent controlling interest in Yoplait SAS and a 50 percent interest in Yoplait Marques SNC and Liberté Marques Sàrl. Sodiaal holds theremaining interests in each of these entities. We consolidate these entities into our consolidated financial statements. We record Sodiaal’s 50 percent interestin Yoplait Marques SNC and Liberté Marques Sàrl as noncontrolling interests, and its 49 percent interest in Yoplait SAS as a redeemable interest on ourConsolidated Balance Sheets. These euro- and Canadian dollar-denominated interests are reported in U.S. dollars on our Consolidated Balance Sheets.Sodiaal has the ability to put all or a portion of its redeemable interest to us at fair value once per year, up to three times before December 2024. As ofMay 28, 2017, the redemption value of the redeemable interest was $911 million which approximates its fair value.
The third-party holder of the General Mills Cereals, LLC (GMC) Class A Interests receives quarterly preferred distributions from available net income basedon the application of a floating preferred return rate to the holder’s capital account balance established in the most recent mark-to-market valuation (currently$252 million). On June 1, 2015, the floating preferred return rate on GMC’s Class A Interests was reset to the sum of three-month LIBOR plus 125 basispoints. The preferred return rate is adjusted every three years through a negotiated agreement with the Class A Interest holder or through a remarketingauction.
We have an option to purchase the Class A Interests for consideration equal to the then current capital account value, plus any unpaid preferred return and theprescribed make-whole amount. If we purchase these interests, any change in the third-party holder’s capital account from its original value will be chargeddirectly to retained earnings and will increase or decrease the net earnings used to calculate EPS in that period.
31
Source: GENERAL MILLS INC, 10-K, June 29, 2017 Powered by Morningstar® Document Research℠The information contained herein may not be copied, adapted or distributed and is not warranted to be accurate, complete or timely. The user assumes all risks for any damages or losses arising from any use of this information,except to the extent such damages or losses cannot be limited or excluded by applicable law. Past financial performance is no guarantee of future results.

Table of Contents
OFF-BALANCE SHEET ARRANGEMENTS AND CONTRACTUAL OBLIGATIONS
As of May 28, 2017, we have issued guarantees and comfort letters of $505 million for the debt and other obligations of consolidated subsidiaries, andguarantees and comfort letters of $165 million for the debt and other obligations of non-consolidated affiliates, mainly CPW. In addition, off-balance sheetarrangements are generally limited to the future payments under non-cancelable operating leases, which totaled $501 million as of May 28, 2017.
As of May 28, 2017, we had invested in five variable interest entities (VIEs). None of our VIEs are material to our results of operations, financial condition, orliquidity as of and for the fiscal year ended May 28, 2017.
Our defined benefit plans in the United States are subject to the requirements of the Pension Protection Act (PPA). In the future, the PPA may require us tomake additional contributions to our domestic plans. We do not expect to be required to make any contributions in fiscal 2017.
The following table summarizes our future estimated cash payments under existing contractual obligations, including payments due by period: Payments Due by Fiscal Year
In Millions Total 2018 2019 -20 2021 -22 2023 andThereafter
Long-term debt (a) $ 8,290.6 604.2 2,647.7 1,559.3 3,479.4 Accrued interest 83.8 83.8 — — — Operating leases (b) 500.7 118.8 182.4 110.4 89.1 Capital leases 1.2 0.4 0.6 0.1 0.1 Purchase obligations (c) 3,191.0 2,304.8 606.8 264.3 15.1 Total contractual obligations 12,067.3 3,112.0 3,437.5 1,934.1 3,583.7 Other long-term obligations (d) 1,372.7 — — — — Total long-term obligations $13,440.0 $3,112.0 $3,437.5 $1,934.1 $ 3,583.7 (a) Amounts represent the expected cash payments of our long-term debt and do not include $1.2 million for capital leases or $44.4 million for net
unamortized debt issuance costs, premiums and discounts, and fair value adjustments.(b) Operating leases represents the minimum rental commitments under non-cancelable operating leases.(c) The majority of the purchase obligations represent commitments for raw material and packaging to be utilized in the normal course of business and for
consumer marketing spending commitments that support our brands. For purposes of this table, arrangements are considered purchase obligations if acontract specifies all significant terms, including fixed or minimum quantities to be purchased, a pricing structure, and approximate timing of thetransaction. Most arrangements are cancelable without a significant penalty and with short notice (usually 30 days). Any amounts reflected on theConsolidated Balance Sheets as accounts payable and accrued liabilities are excluded from the table above.
(d) The fair value of our foreign exchange, equity, commodity, and grain derivative contracts with a payable position to the counterparty was $24 millionas of May 28, 2017, based on fair market values as of that date. Future changes in market values will impact the amount of cash ultimately paid orreceived to settle those instruments in the future. Other long-term obligations mainly consist of liabilities for accrued compensation and benefits,including the underfunded status of certain of our defined benefit pension, other postretirement benefit, and postemployment benefit plans, andmiscellaneous liabilities. We expect to pay $21 million of benefits from our unfunded postemployment benefit plans and $14.6 million of deferredcompensation in fiscal 2018. We are unable to reliably estimate the amount of these payments beyond fiscal 2018. As of May 28, 2017, our totalliability for uncertain tax positions and accrued interest and penalties was $158.6 million.
32
Source: GENERAL MILLS INC, 10-K, June 29, 2017 Powered by Morningstar® Document Research℠The information contained herein may not be copied, adapted or distributed and is not warranted to be accurate, complete or timely. The user assumes all risks for any damages or losses arising from any use of this information,except to the extent such damages or losses cannot be limited or excluded by applicable law. Past financial performance is no guarantee of future results.

Table of Contents
SIGNIFICANT ACCOUNTING ESTIMATES
For a complete description of our significant accounting policies, see Note 2 to the Consolidated Financial Statements in Item 8 of this report. Our significantaccounting estimates are those that have a meaningful impact on the reporting of our financial condition and results of operations. These estimates includeour accounting for promotional expenditures, valuation of long-lived assets, intangible assets, redeemable interest, stock-based compensation, income taxes,and defined benefit pension, other postretirement benefit, and postemployment benefit plans.
Promotional Expenditures
Our promotional activities are conducted through our customers and directly or indirectly with end consumers. These activities include: payments tocustomers to perform merchandising activities on our behalf, such as advertising or in-store displays; discounts to our list prices to lower retail shelf prices;payments to gain distribution of new products; coupons, contests, and other incentives; and media and advertising expenditures. The recognition of thesecosts requires estimation of customer participation and performance levels. These estimates are based on the forecasted customer sales, the timing andforecasted costs of promotional activities, and other factors. Differences between estimated expenses and actual costs are recognized as a change inmanagement estimate in a subsequent period. Our accrued trade, coupon, and consumer marketing liabilities were $483 million as of May 28, 2017, and $564million as of May 29, 2016. Because our total promotional expenditures (including amounts classified as a reduction of revenues) are significant, if ourestimates are inaccurate we would have to make adjustments in subsequent periods that could have a significant effect on our results of operations.
Valuation of Long-Lived Assets
We estimate the useful lives of long-lived assets and make estimates concerning undiscounted cash flows to review for impairment whenever events orchanges in circumstances indicate that the carrying amount of an asset (or asset group) may not be recoverable. Fair value is measured using discounted cashflows or independent appraisals, as appropriate.
Intangible Assets
Goodwill and other indefinite-lived intangible assets are not subject to amortization and are tested for impairment annually and whenever events or changesin circumstances indicate that impairment may have occurred. Our estimates of fair value for goodwill impairment testing are determined based on adiscounted cash flow model. We use inputs from our long-range planning process to determine growth rates for sales and profits. We also make estimates ofdiscount rates, perpetuity growth assumptions, market comparables, and other factors.
We evaluate the useful lives of our other intangible assets, mainly brands, to determine if they are finite or indefinite-lived. Reaching a determination onuseful life requires significant judgments and assumptions regarding the future effects of obsolescence, demand, competition, other economic factors (such asthe stability of the industry, known technological advances, legislative action that results in an uncertain or changing regulatory environment, and expectedchanges in distribution channels), the level of required maintenance expenditures, and the expected lives of other related groups of assets. Intangible assetsthat are deemed to have definite lives are amortized on a straight-line basis, over their useful lives, generally ranging from 4 to 30 years. Our estimate of thefair value of our brand assets is based on a discounted cash flow model using inputs which include projected revenues from our long-range plan, assumedroyalty rates that could be payable if we did not own the brands, and a discount rate.
As of May 28, 2017, we had $12.9 billion of goodwill and indefinite-lived intangible assets. While we currently believe that the fair value of each intangibleexceeds its carrying value and that those intangibles so classified will contribute indefinitely to our cash flows, materially different assumptions regardingfuture performance of our businesses or a different weighted-average cost of capital could result in material impairment losses and amortization expense. Weperformed our fiscal 2017 assessment of our intangible assets as of August 29, 2016. As of our annual assessment date, there was no impairment of any of ourintangible assets as their related fair values were substantially in excess of the carrying values except for the Latin America reporting unit and the ImmaculateBaking brand intangible asset. The excess fair value above the carrying value of the Latin America reporting unit and the Immaculate Baking brandintangible asset is as follows:
Source: GENERAL MILLS INC, 10-K, June 29, 2017 Powered by Morningstar® Document Research℠The information contained herein may not be copied, adapted or distributed and is not warranted to be accurate, complete or timely. The user assumes all risks for any damages or losses arising from any use of this information,except to the extent such damages or losses cannot be limited or excluded by applicable law. Past financial performance is no guarantee of future results.

In Millions Carrying
Value
ExcessFair
ValueAbove
CarryingValue
Latin America $ 523.0 15% Immaculate Baking $ 12.0 17%
Our Latin America reporting unit and Immaculate Baking brand have experienced declining business performance. In addition, while not impaired as ofMay 28, 2017, the Progresso, Green Giant, and Food Should Taste Good brand intangible assets and U.S. Yogurt reporting unit had risk of decreasingcoverage. We will continue to monitor these businesses for potential impairment.
33
Source: GENERAL MILLS INC, 10-K, June 29, 2017 Powered by Morningstar® Document Research℠The information contained herein may not be copied, adapted or distributed and is not warranted to be accurate, complete or timely. The user assumes all risks for any damages or losses arising from any use of this information,except to the extent such damages or losses cannot be limited or excluded by applicable law. Past financial performance is no guarantee of future results.

Table of Contents
Redeemable Interest
In fiscal 2017, we adjusted the redemption value of Sodiaal’s redeemable interest in Yoplait SAS based on a discounted cash flow model. The significantassumptions used to estimate the redemption value include projected revenue growth and profitability from our long-range plan, capital spending,depreciation and taxes, foreign currency exchange rates, and a discount rate. As of May 28, 2017, the redemption value of the redeemable interest was $911million.
Stock-based Compensation
The valuation of stock options is a significant accounting estimate that requires us to use judgments and assumptions that are likely to have a material impacton our financial statements. Annually, we make predictive assumptions regarding future stock price volatility, employee exercise behavior, dividend yield,and the forfeiture rate. For more information on these assumptions, please refer to Note 11 to the Consolidated Financial Statements in Item 8 of this report.
The estimated fair values of stock options granted and the assumptions used for the Black-Scholes option-pricing model were as follows: Fiscal Year 2017 2016 2015 Estimated fair values of stock options granted $8.80 $7.24 $7.22 Assumptions:
Risk-free interest rate 1.7% 2.4% 2.6% Expected term 8.5 years 8.5 years 8.5 years Expected volatility 17.8% 17.6% 17.5% Dividend yield 2.9% 3.2% 3.1%
The risk-free interest rate for periods during the expected term of the options is based on the U.S. Treasury zero-coupon yield curve in effect at the time ofgrant. An increase in the expected term by 1 year, leaving all other assumptions constant, would increase the grant date fair value by 1 percent. If all otherassumptions are held constant, a one percentage point increase in our fiscal 2017 volatility assumption would increase the grant date fair value of our fiscal2017 option awards by 7 percent.
To the extent that actual outcomes differ from our assumptions, we are not required to true up grant-date fair value-based expense to final intrinsic values.However, these differences can impact the classification of cash tax benefits realized upon exercise of stock options, as explained in the following twoparagraphs. Furthermore, historical data has a significant bearing on our forward-looking assumptions. Significant variances between actual and predictedexperience could lead to prospective revisions in our assumptions, which could then significantly impact the year-over-year comparability of stock-basedcompensation expense.
Any corporate income tax benefit realized upon exercise or vesting of an award in excess of that previously recognized in earnings (referred to as a windfalltax benefit) is presented in the Consolidated Statements of Cash Flows as a financing cash flow. The actual impact on future years’ cash flows will depend, inpart, on the volume of employee stock option exercises during a particular year and the relationship between the exercise-date market value of the underlyingstock and the original grant-date fair value previously determined for financial reporting purposes.
Realized windfall tax benefits are credited to additional paid-in capital within the Consolidated Balance Sheets. Realized shortfall tax benefits (amountswhich are less than that previously recognized in earnings) are first offset against the cumulative balance of windfall tax benefits, if any, and then chargeddirectly to income tax expense, potentially resulting in volatility in our consolidated effective income tax rate. Because employee stock option exercisebehavior is not within our control, it is possible that significantly different reported results could occur if different assumptions or conditions were to prevail.
See the new accounting requirements for the accounting and presentation of stock-based payments in the Recently Issued Accounting Pronouncementssection below for forthcoming changes to stock-based compensation.
Source: GENERAL MILLS INC, 10-K, June 29, 2017 Powered by Morningstar® Document Research℠The information contained herein may not be copied, adapted or distributed and is not warranted to be accurate, complete or timely. The user assumes all risks for any damages or losses arising from any use of this information,except to the extent such damages or losses cannot be limited or excluded by applicable law. Past financial performance is no guarantee of future results.

Income Taxes
We apply a more-likely-than-not threshold to the recognition and derecognition of uncertain tax positions. Accordingly, we recognize the amount of taxbenefit that has a greater than 50 percent likelihood of being ultimately realized upon settlement. Future changes in judgment related to the expectedultimate resolution of uncertain tax positions will affect earnings in the quarter of such change. For more information on income taxes, please refer to Note 14to the Consolidated Financial Statements in Item 8 of this report.
34
Source: GENERAL MILLS INC, 10-K, June 29, 2017 Powered by Morningstar® Document Research℠The information contained herein may not be copied, adapted or distributed and is not warranted to be accurate, complete or timely. The user assumes all risks for any damages or losses arising from any use of this information,except to the extent such damages or losses cannot be limited or excluded by applicable law. Past financial performance is no guarantee of future results.

Table of Contents
Defined Benefit Pension, Other Postretirement Benefit, and Postemployment Benefit Plans
We have defined benefit pension plans covering many employees in the United States, Canada, France, and the United Kingdom. We also sponsor plans thatprovide health care benefits to many of our retirees in the United States, Canada, and Brazil. Under certain circumstances, we also provide accruable benefits,primarily severance, to former and inactive employees in the United States, Canada, and Mexico. Please refer to Note 13 to the Consolidated FinancialStatements in Item 8 of this report for a description of our defined benefit pension, other postretirement benefit, and postemployment benefit plans.
We recognize benefits provided during retirement or following employment over the plan participants’ active working lives. Accordingly, we make variousassumptions to predict and measure costs and obligations many years prior to the settlement of our obligations. Assumptions that require significantmanagement judgment and have a material impact on the measurement of our net periodic benefit expense or income and accumulated benefit obligationsinclude the long-term rates of return on plan assets, the interest rates used to discount the obligations for our benefit plans, and health care cost trend rates.
Expected Rate of Return on Plan Assets
Our expected rate of return on plan assets is determined by our asset allocation, our historical long-term investment performance, our estimate of future long-term returns by asset class (using input from our actuaries, investment services, and investment managers), and long-term inflation assumptions. We reviewthis assumption annually for each plan; however, our annual investment performance for one particular year does not, by itself, significantly influence ourevaluation.
Our historical investment returns (compound annual growth rates) for our United States defined benefit pension and other postretirement benefit plan assetswere 11.8 percent, 10.0 percent, 6.0 percent, 8.4 percent, and 8.4 percent for the 1, 5, 10, 15, and 20 year periods ended May 31, 2017.
On a weighted-average basis, the expected rate of return for all defined benefit plans was 8.17 percent for fiscal 2017, 8.53 percent for fiscal 2016, and 8.53percent for fiscal 2015. For fiscal 2018, we lowered our weighted-average expected rate of return on plan assets for our principal defined benefit pension andother postretirement plans in the United States to 7.95 percent due to asset changes that decreased investment risk in the portfolio.
Lowering the expected long-term rate of return on assets by 100 basis points would increase our net pension and postretirement expense by $66 million forfiscal 2018. A market-related valuation basis is used to reduce year-to-year expense volatility. The market-related valuation recognizes certain investmentgains or losses over a five-year period from the year in which they occur. Investment gains or losses for this purpose are the difference between the expectedreturn calculated using the market-related value of assets and the actual return based on the market-related value of assets. Our outside actuaries perform thesecalculations as part of our determination of annual expense or income.
Discount Rates
Beginning in fiscal 2017, we changed the method used to estimate the service and interest cost components of the net periodic benefit expense for our UnitedStates and most of our international defined benefit pension, other postretirement benefit, and postemployment benefit plans. We adopted a full yield curveapproach to estimate service cost and interest cost by applying the specific spot rates along the yield curve used to determine the benefit obligation to therelevant projected cash flows. This method provides a more precise measurement of service and interest costs by correlating the timing of the plans’ liabilitycash flows to the corresponding rate on the yield curve. Previously, we estimated service cost and interest cost using a single weighted-average discount ratederived from the yield curve used to measure the benefit obligation at the beginning of the period. This change does not affect the measurement of ourbenefit obligations related to these plans. We have accounted for this change prospectively as a change in accounting estimate beginning in the first quarterof fiscal 2017. The change in methodology resulted in a decrease in service and interest cost of approximately $68 million in fiscal 2017 compared to whatour costs would have been under the previous method. The fiscal 2017 reduction in our net periodic benefit expense as a result of this change inmethodology was partially offset by a reduction in our weighted-average expected rate of return on plan assets for our principal defined benefit pension andother postretirement plans in the United States to 8.25 percent as a result of changes that decreased investment risk in the portfolio.
Source: GENERAL MILLS INC, 10-K, June 29, 2017 Powered by Morningstar® Document Research℠The information contained herein may not be copied, adapted or distributed and is not warranted to be accurate, complete or timely. The user assumes all risks for any damages or losses arising from any use of this information,except to the extent such damages or losses cannot be limited or excluded by applicable law. Past financial performance is no guarantee of future results.

Our discount rate assumptions are determined annually as of May 31 for our defined benefit pension, other postretirement benefit, and postemploymentbenefit plan obligations. We work with our outside actuaries to determine the timing and amount of expected future cash outflows to plan participants and,using the Aa Above Median corporate bond yield, to develop a forward interest rate curve, including a margin to that index based on our credit risk. Thisforward interest rate curve is applied to our expected future cash outflows to determine our discount rate assumptions.
35
Source: GENERAL MILLS INC, 10-K, June 29, 2017 Powered by Morningstar® Document Research℠The information contained herein may not be copied, adapted or distributed and is not warranted to be accurate, complete or timely. The user assumes all risks for any damages or losses arising from any use of this information,except to the extent such damages or losses cannot be limited or excluded by applicable law. Past financial performance is no guarantee of future results.

Table of Contents
Our weighted-average discount rates were as follows:
Defined BenefitPension Plans
OtherPostretirementBenefit Plans
PostemploymentBenefit Plans
Effective rate for fiscal 2018 service costs 4.37% 4.27% 3.54% Effective rate for fiscal 2018 interest costs 3.45% 3.24% 2.67% Obligations as of May 31, 2017 4.08% 3.92% 2.87% Effective rate for fiscal 2017 service costs 4.57% 4.42% 3.55% Effective rate for fiscal 2017 interest costs 3.44% 3.17% 2.67% Obligations as of May 29, 2016 4.19% 3.97% 2.94% Obligations as of May 31, 2015 and fiscal 2016 expense 4.38% 4.20% 3.55%
Lowering the discount rates by 100 basis points would increase our net defined benefit pension, other postretirement benefit, and postemployment benefitplan expense for fiscal 2018 by approximately $85 million. All obligation-related experience gains and losses are amortized using a straight-line methodover the average remaining service period of active plan participants.
Health Care Cost Trend Rates
We review our health care cost trend rates annually. Our review is based on data we collect about our health care claims experience and information providedby our actuaries. This information includes recent plan experience, plan design, overall industry experience and projections, and assumptions used by othersimilar organizations. Our initial health care cost trend rate is adjusted as necessary to remain consistent with this review, recent experiences, and short-termexpectations. Our initial health care cost trend rate assumption is 7.3 percent for retirees age 65 and over and 7.0 percent for retirees under age 65 at the end offiscal 2017. Rates are graded down annually until the ultimate trend rate of 5.0 percent is reached in 2024 for all retirees. The trend rates are applicable forcalculations only if the retirees’ benefits increase as a result of health care inflation. The ultimate trend rate is adjusted annually, as necessary, to approximatethe current economic view on the rate of long-term inflation plus an appropriate health care cost premium. Assumed trend rates for health care costs have animportant effect on the amounts reported for the other postretirement benefit plans.
A one percentage point change in the health care cost trend rate would have the following effects:
In Millions
OnePercentage
PointIncrease
OnePercentage
PointDecrease
Effect on the aggregate of the service and interest cost components in fiscal 2018 $ 2.2 $ (1.9) Effect on the other post retirement accumulated benefit obligation as of May 28, 2017 59.5 (53.8)
Any arising health care claims cost-related experience gain or loss is recognized in the calculation of expected future claims. Once recognized, experiencegains and losses are amortized using a straight-line method over 10 years, resulting in at least the minimum amortization required being recorded.
Financial Statement Impact
In fiscal 2017, we recorded net defined benefit pension, other postretirement benefit, and postemployment benefit plan expense of $56 million compared to$163 million of expense in fiscal 2016 and $153 million of expense in fiscal 2015. As of May 28, 2017, we had cumulative unrecognized actuarial net lossesof $1.6 billion on our defined benefit pension plans and $24 million on our postretirement and postemployment benefit plans, mainly as the result of liabilityincreases from lower interest rates, partially offset by recent increases in the values of plan assets. These unrecognized actuarial net losses will result inincreases in our future pension and postretirement benefit expenses because they currently exceed the corridors defined by GAAP.
Actual future net defined benefit pension, other postretirement benefit, and postemployment benefit plan income or expense will depend on investmentperformance, changes in future discount rates, changes in health care cost trend rates, and other factors related to the populations participating in these plans.
36
Source: GENERAL MILLS INC, 10-K, June 29, 2017 Powered by Morningstar® Document Research℠The information contained herein may not be copied, adapted or distributed and is not warranted to be accurate, complete or timely. The user assumes all risks for any damages or losses arising from any use of this information,except to the extent such damages or losses cannot be limited or excluded by applicable law. Past financial performance is no guarantee of future results.

Table of Contents
RECENTLY ISSUED ACCOUNTING PRONOUNCEMENTS
In March 2017, the Financial Accounting Standards Board (FASB) issued new accounting requirements related to the presentation of net periodic definedbenefit pension expense, net periodic postretirement benefit expense, and net periodic postemployment benefit expense. The new standard requires theservice cost component of net periodic benefit expense to be recorded in the same line items as other employee compensation costs within our ConsolidatedStatements of Earnings. Other components of net periodic benefit expense must be presented separately outside of operating profit in our ConsolidatedStatements of Earnings. In addition, the new standard requires that only the service cost component of net periodic benefit expense is eligible forcapitalization. We recognized net periodic benefit expense of $56 million in fiscal 2017, $163 million in fiscal 2016, and $153 million in fiscal 2015 ofwhich $141 million, $161 million, and $167 million, respectively, related to service cost. These amounts may not necessarily be indicative of future amountsthat may be recognized subsequent to the adoption of this new standard. The requirements of the new standard are effective for annual reporting periodsbeginning after December 15, 2017, and interim periods within those annual periods, which for us is the first quarter of fiscal 2019. Early adoption ispermitted.
In January 2017, the FASB issued new accounting requirements related to goodwill impairment testing. The new standard eliminates the requirement tomeasure a goodwill impairment loss by determining the implied fair value of goodwill. Instead, goodwill impairment losses will be measured by the amountby which a reporting unit’s carrying value exceeds the reporting unit’s fair value, limited to the amount of goodwill allocated to the reporting unit. Therequirements of the new standard are effective for annual or any interim goodwill impairment tests in fiscal years beginning after December 15, 2019, whichfor us is fiscal 2021. Early adoption is permitted. We intend to adopt this standard in fiscal 2018 and do not expect this guidance to have a material impact onour results of operations or financial position.
In October 2016, the FASB issued new accounting requirements related to the recognition of income taxes resulting from intra-entity transfers of assets otherthan inventory. This will result in the recognition of the income tax consequences resulting from the intra-entity transfer of assets in our ConsolidatedStatements of Earnings in the period of the transfer. The requirements of the new standard are effective for annual reporting periods beginning afterDecember 15, 2017, and interim periods within those annual periods, which for us is the first quarter of fiscal 2019. Early adoption is permitted. We are in theprocess of analyzing the impact of this standard on our results of operations and financial position.
In March 2016, the FASB issued new accounting requirements for the accounting and presentation of stock-based payments. This will result in realizedwindfall and shortfall tax benefits upon exercise or vesting of stock-based awards being recorded in our Consolidated Statements of Earnings instead ofadditional paid-in capital within our Consolidated Balance Sheets. In addition, realized windfall and shortfall tax benefits will be reclassified from financingactivities to operating activities in our Consolidated Statements of Cash Flows. We recognized windfall tax benefits of $64 million in fiscal 2017, $94million in fiscal 2016, and $75 million in fiscal 2015. These amounts may not necessarily be indicative of future amounts that may be recognized subsequentto the adoption of this new standard as windfall and shortfall tax benefits are dependent upon future stock prices, employee exercise behavior, and applicabletax rates. The requirements of the new standard are effective for annual reporting periods beginning after December 15, 2016, and interim periods withinthose annual periods, which for us is the first quarter of fiscal 2018.
In February 2016, the FASB issued new accounting requirements for accounting, presentation and classification of leases. This will result in most leasesbeing capitalized as a right of use asset with a related liability on our Consolidated Balance Sheets. The requirements of the new standard are effective forannual reporting periods beginning after December 15, 2018, and interim periods within those annual periods, which for us is the first quarter of fiscal 2020.We are in the process of evaluating lease accounting software and analyzing the impact of this standard on our results of operations and financial position.Based on our assessment to date, we expect this guidance will have a material impact on our Consolidated Balance Sheets due to the amount of our leasecommitments but we are unable to quantify the impact at this time.
In May 2014, the FASB issued new accounting requirements for the recognition of revenue from contracts with customers. The requirements of the newstandard and its subsequent amendments are effective for annual reporting periods beginning after December 15, 2017, and interim periods within thoseannual periods, which for us is the first quarter of fiscal 2019. We are in the process of documenting the impact of the guidance on our current accountingpolicies and practices in order to identify material differences, if any, that would result from applying the new requirements to our revenue contracts. Wecontinue to make progress on our revenue recognition review and are also in the process of evaluating the impact, if any, on changes to our businessprocesses, systems, and controls to support recognition and disclosure requirements under the new guidance. In addition, we continue to assess our adoptionapproach. Based on our assessment to date, we do not expect this guidance to have a material impact on our results of operations or financial position.
37
Source: GENERAL MILLS INC, 10-K, June 29, 2017 Powered by Morningstar® Document Research℠The information contained herein may not be copied, adapted or distributed and is not warranted to be accurate, complete or timely. The user assumes all risks for any damages or losses arising from any use of this information,except to the extent such damages or losses cannot be limited or excluded by applicable law. Past financial performance is no guarantee of future results.

Table of Contents
NON-GAAP MEASURES
We have included in this report measures of financial performance that are not defined by GAAP. We believe that these measures provide useful informationto investors, and include these measures in other communications to investors.
For each of these non-GAAP financial measures, we are providing below a reconciliation of the differences between the non-GAAP measure and the mostdirectly comparable GAAP measure, an explanation of why we believe the non-GAAP measure provides useful information to investors and any additionalpurposes for which our management or Board of Directors uses the non-GAAP measure. These non-GAAP measures should be viewed in addition to, and notin lieu of, the comparable GAAP measure.
Organic Net Sales Growth Rates
This measure is used in reporting to our executive management and as a component of the Board of Directors’ measurement of our performance for incentivecompensation purposes. We provide organic net sales growth rates for our consolidated net sales and segment net sales. We believe that organic net salesgrowth rates provide useful information to investors because they provide transparency to underlying performance in our net sales by excluding the effectthat foreign currency exchange rate fluctuations, as well as acquisitions, divestitures, and a 53rd week, when applicable, have on year-to-year comparability.A reconciliation of these measures to reported net sales growth rates, the relevant GAAP measures, are included in our Consolidated Results of Operations andResults of Segment Operations discussions above.
Total Segment Operating Profit and Total Segment Operating Profit as a Percent of Net Sales
Total segment operating profit is used in reporting to our executive management and as a component of the Board of Director’s measurement of ourperformance for incentive compensation purposes. We believe that this measure provides useful information to investors because it is the profitabilitymeasure we use to evaluate segment performance. Fiscal Year Percent of Net Sales 2017 2016 2015 2014 2013 Operating profit as reported $2,566.4 16.4% $2,707.4 16.3% $2,077.3 11.8% $2,957.4 16.5% $2,851.8 16.0%
Unallocated Corporate Items 190.1 1.2% 288.9 1.8% 413.8 2.3% 258.4 1.5% 351.3 2.0% Divestitures loss (gain) 13.5 0.1% (148.2) (0.9)% — —% (65.5) (0.4)% — —% Restructuring, impairment, and other exit costs 182.6 1.2% 151.4 0.9% 543.9 3.1% 3.6 —% 19.8 0.1%
Total Segment operating profit $2,952.6 18.9% $2,999.5 18.1% $3,035.0 17.2% $3,153.9 17.6% $3,222.9 18.1%
38
Source: GENERAL MILLS INC, 10-K, June 29, 2017 Powered by Morningstar® Document Research℠The information contained herein may not be copied, adapted or distributed and is not warranted to be accurate, complete or timely. The user assumes all risks for any damages or losses arising from any use of this information,except to the extent such damages or losses cannot be limited or excluded by applicable law. Past financial performance is no guarantee of future results.

Table of Contents
Diluted EPS Excluding Certain Items Affecting Comparability and Related Constant-currency Growth Rate (Adjusted Diluted EPS)
This measure is used in reporting to our executive management and as a component of the Board of Directors’ measurement of our performance for incentivecompensation purposes. We believe that this measure provides useful information to investors because it is the profitability measure we use to evaluateearnings performance on a comparable year-over-year basis. The adjustments are either items resulting from infrequently occurring events or items that, inmanagement’s judgment, significantly affect the year-over-year assessment of operating results.
The reconciliation of our GAAP measure, diluted EPS, to diluted EPS excluding certain items affecting comparability and the related constant-currencygrowth rate follows: Fiscal Year
Per Share Data 2017 2016
2017 vs.2016
Change 2015
2016 vs.2015
Change 2014 2013 Diluted earnings per share, as reported $ 2.77 $ 2.77 Flat $1.97 41% $ 2.83 $ 2.79
Mark-to-market effects (a) (0.01) (0.07) 0.09 (0.05) — Divestitures loss (gain), net (b) 0.01 (0.10) — (0.06) — Tax items (c) — — 0.13 — (0.13) Acquisition integration costs (d) — — 0.02 — 0.01 Venezuela currency devaluation (a) — — 0.01 0.09 0.03 Restructuring costs (e) 0.26 0.26 0.35 0.01 0.02 Project-related costs (e) 0.05 0.06 0.01 — — Indefinite-lived intangible asset impairment (f) — — 0.28 — —
Diluted earnings per share, excluding certain items affecting comparability $ 3.08 $ 2.92 5% $2.86 2% $ 2.82 $ 2.72 Foreign currency exchange impact (1) (3) Diluted earnings per share growth, excluding certain items affecting
comparability, on a constant-currency basis 6% 5% (a) See Note 7 to the Consolidated Financial Statements in Item 8 of this report.(b) See Note 3 to the Consolidated Financial Statements in Item 8 of this report.(c) The fiscal 2015 tax item is related to the one-time repatriation of historical foreign earnings in fiscal 2015. The fiscal 2013 tax items consist of a
reduction to income taxes related to the restructuring of our GMC subsidiary and an increase to income taxes related to the liquidation of a corporateinvestment. Additionally, fiscal 2013 includes changes in deferred taxes associated with the Medicare Part D subsidies related to the Patient Protectionand Affordable Care Act, as amended by the Health Care and Education Reconciliation Act of 2010.
(d) Integration costs resulting from the acquisitions of Annie’s in fiscal 2015 and Yoki in fiscal 2013.(e) See Note 4 to the Consolidated Financial Statements in Item 8 of this report.(f) See Note 6 to the Consolidated Financial Statements in Item 8 of this report.
See our reconciliation below of the effective income tax rate as reported to the effective income tax rate excluding certain items affecting comparability forthe tax impact of each item affecting comparability.
39
Source: GENERAL MILLS INC, 10-K, June 29, 2017 Powered by Morningstar® Document Research℠The information contained herein may not be copied, adapted or distributed and is not warranted to be accurate, complete or timely. The user assumes all risks for any damages or losses arising from any use of this information,except to the extent such damages or losses cannot be limited or excluded by applicable law. Past financial performance is no guarantee of future results.

Table of Contents
Adjusted Return on Average Total Capital
Change in adjusted return on average total capital is a measure used in reporting to our executive management and as a component of the Board of Director’smeasurement of our performance for incentive compensation purposes. We believe that this measure provides useful information to investors because it isimportant for assessing the utilization of capital and it eliminates certain items that affect year-to-year comparability. The calculation of adjusted return onaverage total capital and return on average total capital, its GAAP equivalent follows: Fiscal Year In Millions 2017 2016 2015 2014 2013 2012 Net earnings, including earnings attributable to redeemable
and noncontrolling interests $ 1,701.1 $ 1,736.8 $ 1,259.4 $ 1,861.3 $ 1,892.5 Interest, net, after-tax 187.9 193.1 199.8 190.9 201.2 Earnings before interest, after-tax 1,889.0 1,929.9 1,459.2 2,052.2 2,093.7
Adjustments, after-tax (a): Mark-to-market effects (8.8) (39.6) 56.5 (30.5) (2.8) Divestitures loss (gain), net 9.2 (66.0) — (36.0) — Tax items — — 78.6 — (85.4) Acquisition integration costs — — 10.4 — 8.8 Venezuela currency devaluation — — 8.0 57.8 20.8 Restructuring costs 153.9 160.8 217.7 3.6 15.9 Project-related costs 28.2 36.8 8.3 — — Indefinite-lived intangible asset impairment — — 176.9 — —
Adjusted earnings before interest, after-tax for adjusted returnon capital calculation $ 2,071.5 $ 2,021.9 $ 2,015.6 $ 2,047.1 $ 2,051.0
Current portion of long-term debt $ 604.7 $ 1,103.4 $ 1,000.4 $ 1,250.6 $ 1,443.3 $ 741.2 Notes payable 1,234.1 269.8 615.8 1,111.7 599.7 526.5 Long-term debt 7,642.9 7,057.7 7,575.3 6,396.6 5,901.8 6,139.5
Total debt 9,481.7 8,430.9 9,191.5 8,758.9 7,944.8 7,407.2 Redeemable interest 910.9 845.6 778.9 984.1 967.5 847.8 Noncontrolling interests 357.6 376.9 396.0 470.6 456.3 461.0 Stockholders’ equity 4,327.9 4,930.2 4,996.7 6,534.8 6,672.2 6,421.7 Total capital 15,078.1 14,583.6 15,363.1 16,748.4 16,040.8 15,137.7
Accumulated other comprehensive loss 2,244.5 2,612.2 2,310.7 1,340.3 1,585.3 1,743.7 After-tax earnings adjustments (b) 621.6 439.1 347.1 (209.3) (204.2) (161.5)
Adjusted total capital $17,944.2 $17,634.9 $18,020.9 $17,879.4 $17,421.9 $16,719.9
Average total capital (c) $14,830.9 $14,973.4 $16,055.8 $16,394.6 $15,589.2 Return on average total capital (c) 12.7% 12.9% 9.1% 12.5% 13.4%
Adjusted average total capital (c) $17,789.6 $17,827.9 $17,950.1 $17,650.6 $17,070.8 Adjusted return on average total capital (c) 11.6% 11.3% 11.2% 11.6% 12.0% Change in adjusted return on average total capital 30 bps Foreign currency exchange impact (10)bps Change in adjusted return on average total capital on a
constant-currency basis 40 bps (a) See our reconciliation below of the effective income tax rate as reported to the effective income tax rate excluding certain items affecting
comparability for the tax impact of each item affecting comparability.(b) Sum of current year and previous year after-tax adjustments.(c) See “Glossary” in Item 8 of this report for definition.
40
Source: GENERAL MILLS INC, 10-K, June 29, 2017 Powered by Morningstar® Document Research℠The information contained herein may not be copied, adapted or distributed and is not warranted to be accurate, complete or timely. The user assumes all risks for any damages or losses arising from any use of this information,except to the extent such damages or losses cannot be limited or excluded by applicable law. Past financial performance is no guarantee of future results.

Table of Contents
Free Cash Flow Conversion Rate and Total Cash Returned to Shareholders as a Percentage of Free Cash Flow
We believe these measures provide useful information to investors because they are important for assessing our efficiency in converting earnings to cash andreturning cash to shareholders. The calculation of free cash flow conversion rate and net cash provided by operating activities conversion rate, its equivalentGAAP measure follows:
In Millions Fiscal2017
Net earnings, including earnings attributable to redeemable and noncontrolling interests, as reported $1,701.1 Mark-to-market effects, net of tax (a) (8.8) Divestitures loss, net of tax (b) 9.2 Restructuring costs, net of tax (c) 153.9 Project-related costs, net of tax (c) 28.2
Adjusted net earnings, including earnings attributable to redeemable and noncontrolling interests 1,883.6 Net cash provided by operating activities 2,313.3 Purchases of land, buildings, and equipment (684.4) Free cash flow $1,628.9 Net cash provided by operating activities conversion rate 136% Free cash flow conversion rate 86%
The calculation of total cash returned to shareholders as a percentage of free cash flow follows: Dividends paid $1,135.1 Purchases of common stock for treasury 1,651.5 Proceeds from common stock issued on exercised options (112.6) Total cash returned to shareholders $2,674.0 Total cash returned to shareholders as a percentage of free cash flow 164% (a) See Note 7 to the Consolidated Financial Statements in Item 8 of this report.(b) See Note 3 to the Consolidated Financial Statements in Item 8 of this report.(c) See Note 4 to the Consolidated Financial Statements in Item 8 of this report.
See our reconciliation below of the effective income tax rate as reported to the effective income tax rate excluding certain items affecting comparability forthe tax impact of each item affecting comparability.
41
Source: GENERAL MILLS INC, 10-K, June 29, 2017 Powered by Morningstar® Document Research℠The information contained herein may not be copied, adapted or distributed and is not warranted to be accurate, complete or timely. The user assumes all risks for any damages or losses arising from any use of this information,except to the extent such damages or losses cannot be limited or excluded by applicable law. Past financial performance is no guarantee of future results.

Table of Contents
Total Segment Operating Profit Constant-currency Growth Rates
We believe that this measure provides useful information to investors because it provides transparency to underlying performance of our segments byexcluding the effect that foreign currency exchange rate fluctuations have on year-to-year comparability given volatility in foreign currency exchangemarkets.
Total segment operating profit growth rates on a constant-currency basis are calculated as follows: Fiscal 2017 2016 Percentage change in total segment operating profit as reported (2) % (1) % Impact of foreign currency exchange (1) pt (2) pts Percentage change in total segment operating profit on a constant-currency basis (1) % 1 %
See our reconciliation of total segment operating profit to operating profit, its GAAP-equivalent, above.
Constant-currency After-Tax Earnings from Joint Ventures Growth Rates
We believe that this measure provides useful information to investors because it provides transparency to underlying performance of our joint ventures byexcluding the effect that foreign currency exchange rate fluctuations have on year-to-year comparability given volatility in foreign currency exchangemarkets.
After-tax earnings from joint ventures growth rates on a constant-currency basis are calculated as follows: Fiscal 2017 2016 Percentage change in after-tax earnings from joint ventures as reported (4) % 5 % Impact of foreign currency exchange 2 pts (7) pts Percentage change in after-tax earnings from joint ventures on a constant-currency basis (6) % 12 %
Net Sales Growth Rates for Canada Operating Unit on a Constant-currency Basis
We believe this measure of our Canada operating unit net sales provides useful information to investors because it provides transparency to the underlyingperformance for the Canada operating unit within our North America Retail segment by excluding the effect that foreign currency exchange rate fluctuationshave on year-to-year comparability given volatility in foreign currency exchange markets.
Net sales growth rates for our Canada operating unit on a constant-currency basis are calculated as follows: Fiscal 2017 2016 Percentage change in net sales as reported (2) % (16) % Impact of foreign currency exchange Flat (12) pts Percentage change in net sales on a constant-currency basis (2) % (4) %
42
Source: GENERAL MILLS INC, 10-K, June 29, 2017 Powered by Morningstar® Document Research℠The information contained herein may not be copied, adapted or distributed and is not warranted to be accurate, complete or timely. The user assumes all risks for any damages or losses arising from any use of this information,except to the extent such damages or losses cannot be limited or excluded by applicable law. Past financial performance is no guarantee of future results.

Table of Contents
Constant-currency Segment Operating Profit Growth Rates
We believe that this measure provides useful information to investors because it provides transparency to underlying performance of our segments byexcluding the effect that foreign currency exchange rate fluctuations have on year-to-year comparability given volatility in foreign currency exchangemarkets.
Our segments’ operating profit growth rates on a constant-currency basis are calculated as follows: Fiscal 2017
Percentage Changein Operating Profit
as Reported Impact of Foreign
Currency Exchange
Percentage Change inOperating Profit on Constant-
Currency Basis North America Retail (2)% Flat (2)% Europe & Australia (18) (9)pts (9) Asia & Latin America 21 1pt 20
Fiscal 2016
Percentage Changein Operating Profit
as Reported Impact of Foreign
Currency Exchange
Percentage Change inOperating Profit on Constant-
Currency Basis North America Retail (1)% (1)pt Flat Europe & Australia 12 (16)pts 28% Asia & Latin America (42) (9)pts (33)
43
Source: GENERAL MILLS INC, 10-K, June 29, 2017 Powered by Morningstar® Document Research℠The information contained herein may not be copied, adapted or distributed and is not warranted to be accurate, complete or timely. The user assumes all risks for any damages or losses arising from any use of this information,except to the extent such damages or losses cannot be limited or excluded by applicable law. Past financial performance is no guarantee of future results.

Table of Contents
Effective Income Tax Rate Excluding Certain Items Affecting Comparability
We believe this measure provides useful information to investors because it is important for assessing the effective tax rate excluding certain items affectingyear-to-year comparability and presents the income tax effects of certain items affecting comparability.
Effective income tax rates excluding certain items affecting comparability are calculated as follows: Fiscal Year Ended May 28, 2017 May 29, 2016 May 31, 2015 May 25, 2014 May 26, 2013
In Millions
PretaxEarnings
(a) IncomeTaxes
PretaxEarnings
(a) IncomeTaxes
PretaxEarnings
(a) IncomeTaxes
PretaxEarnings
(a) IncomeTaxes
PretaxEarnings
(a) IncomeTaxes
As reported $ 2,271.3 $ 655.2 $ 2,403.6 $ 755.2 $ 1,761.9 $ 586.8 $ 2,655.0 $ 883.3 $ 2,534.9 $ 741.2 Mark-to-market effects (b) (13.9) (5.1) (62.8) (23.2) 89.7 33.2 (48.5) (18.0) (4.4) (1.6) Divestitures loss (gain) (c) 13.5 4.3 (148.2) (82.2) — — (65.5) (29.5) — — Tax items (d) — — — — — (78.6) — — — 85.4 Acquisition integration costs (e) — — — — 16.0 5.6 — — 12.3 3.5 Venezuela currency devaluation (b) — — — — 8.0 — 62.2 4.4 25.2 4.4 Restructuring costs (f) 224.1 70.2 229.8 69.0 343.5 125.8 3.6 — 18.6 2.7 Project-related costs (f) 43.9 15.7 57.5 20.7 13.2 4.9 — — — — Intangible asset impairment (g) — — — — 260.0 83.1 — — — —
As adjusted $ 2,538.9 $ 740.3 $ 2,479.9 $ 739.5 $ 2,492.3 $ 760.8 $ 2,606.8 $ 840.2 $ 2,586.6 $ 835.6 Effective tax rate:
As reported 28.8% 31.4% 33.3% 33.3% 29.2% As adjusted 29.2% 29.8% 30.5% 32.2% 32.3%
Sum of adjustments to income taxes $ 85.1 $ (15.7) $ 174.0 $ (43.1) $ 94.4 Average number of common shares -
diluted EPS 598.0 611.9 618.8 645.7 665.6 Impact of income tax adjustments on
diluted EPS excluding certain itemsaffecting comparability $ (0.14) $ 0.03 $ (0.28) $ 0.07 $ (0.14)
(a) Earnings before income taxes and after-tax earnings from joint ventures.(b) See Note 7 to the Consolidated Financial Statements in Item 8 of this report.(c) See Note 3 to the Consolidated Financial Statements in Item 8 of this report.(d) The fiscal 2015 tax item is related to the one-time repatriation of historical foreign earnings in fiscal 2015. The fiscal 2013 tax items consist of a
reduction to income taxes related to the restructuring of our GMC subsidiary and an increase to income taxes related to the liquidation of a corporateinvestment. Additionally, fiscal 2013 includes changes in deferred taxes associated with the Medicare Part D subsidies related to the Patient Protectionand Affordable Care Act, as amended by the Health Care and Education Reconciliation Act of 2010.
(e) Integration costs resulting from the acquisitions of Annie’s in fiscal 2015 and Yoki in fiscal 2013.(f) See Note 4 to the Consolidated Financial Statements in Item 8 of this report.
Source: GENERAL MILLS INC, 10-K, June 29, 2017 Powered by Morningstar® Document Research℠The information contained herein may not be copied, adapted or distributed and is not warranted to be accurate, complete or timely. The user assumes all risks for any damages or losses arising from any use of this information,except to the extent such damages or losses cannot be limited or excluded by applicable law. Past financial performance is no guarantee of future results.

(g) See Note 6 to the Consolidated Financial Statements in Item 8 of this report.
44
Source: GENERAL MILLS INC, 10-K, June 29, 2017 Powered by Morningstar® Document Research℠The information contained herein may not be copied, adapted or distributed and is not warranted to be accurate, complete or timely. The user assumes all risks for any damages or losses arising from any use of this information,except to the extent such damages or losses cannot be limited or excluded by applicable law. Past financial performance is no guarantee of future results.

Table of Contents
Adjusted Operating Profit as a Percent of Net Sales Excluding Certain Items Affecting Comparability
We believe this measure provides useful information to investors because it is important for assessing our operating profit margin on a comparable basis.Adjusted operating profit excludes certain items affecting comparability. Fiscal Year Percent of Net Sales 2017 2016 2015 2014 2013 Operating profit as reported $2,566.4 16.4% $2,707.4 16.3% $2,077.3 11.8% $2,957.4 16.5% $2,851.8 16.0%
Mark-to-market effects (a) (13.9) (0.1)% (62.8) (0.4)% 89.7 0.5% (48.5) (0.3)% (4.4) — % Divestitures loss (gain), (b) 13.5 0.1% (148.2) (0.9)% — — % (65.5) (0.4)% — — % Acquisition integration costs (c) — — % — — % 16.0 0.1% — — % 12.3 0.1% Venezuela currency devaluation (a) — — % — — % 8.0 — % 62.2 0.4% 25.2 0.1% Restructuring costs (d) 224.1 1.4% 229.8 1.4% 343.5 1.9% 3.6 — % 18.6 0.1% Project-related costs (d) 43.9 0.3% 57.5 0.4% 13.2 0.1% — — % — — % Intangible asset impairment (e) — — % — — % 260.0 1.5% — — % — — %
Adjusted operating profit $2,834.0 18.1% $2,783.7 16.8% $2,807.7 15.9% $2,909.2 16.2% $2,903.5 16.3% (a) See Note 7 to the Consolidated Financial Statements in Item 8 of this report.(b) See Note 3 to the Consolidated Financial Statements in Item 8 of this report.(c) Integration costs resulting from the acquisitions of Annie’s in fiscal 2015 and Yoki in fiscal 2013.(d) See Note 4 to the Consolidated Financial Statements in Item 8 of this report.(e) See Note 6 to the Consolidated Financial Statements in Item 8 of this report.
Forward-Looking Financial Measures
Our fiscal 2018 outlook for organic net sales growth, constant-currency total segment operating profit and adjusted diluted EPS, and adjusted operating profitmargin are non-GAAP financial measures that exclude, or have otherwise been adjusted for, items impacting comparability, including the effect of foreigncurrency exchange rate fluctuations, restructuring charges and project-related costs, and commodity mark-to-market effects. Our fiscal 2018 outlook fororganic net sales growth also excludes the effect of acquisitions and divestitures. We are not able to reconcile these forward-looking non-GAAP financialmeasures to their most directly comparable forward-looking GAAP financial measures without unreasonable efforts because we are unable to predict with areasonable degree of certainty the actual impact of changes in foreign currency exchange rates and commodity prices or the timing of acquisitions,divestitures and restructuring actions throughout fiscal 2018. The unavailable information could have a significant impact on our fiscal 2018 GAAP financialresults.
For fiscal 2018, we currently expect: foreign currency exchange rates (based on blend of forward and forecasted rates and hedge positions), acquisitions, anddivestitures to have an immaterial impact on net sales growth; foreign currency exchange rates to have an immaterial impact on total segment operating profitand adjusted diluted EPS growth; and total restructuring charges and project-related costs related to actions previously announced to total approximately$45 million.
45
Source: GENERAL MILLS INC, 10-K, June 29, 2017 Powered by Morningstar® Document Research℠The information contained herein may not be copied, adapted or distributed and is not warranted to be accurate, complete or timely. The user assumes all risks for any damages or losses arising from any use of this information,except to the extent such damages or losses cannot be limited or excluded by applicable law. Past financial performance is no guarantee of future results.
Table of Contents
CAUTIONARY STATEMENT RELEVANT TO FORWARD-LOOKING INFORMATION FOR THE PURPOSE OF “SAFE HARBOR” PROVISIONSOF THE PRIVATE SECURITIES LITIGATION REFORM ACT OF 1995
This report contains or incorporates by reference forward-looking statements within the meaning of the Private Securities Litigation Reform Act of 1995 thatare based on our current expectations and assumptions. We also may make written or oral forward-looking statements, including statements contained in ourfilings with the SEC and in our reports to shareholders.
The words or phrases “will likely result,” “are expected to,” “will continue,” “is anticipated,” “estimate,” “plan,” “project,” or similar expressions identify“forward-looking statements” within the meaning of the Private Securities Litigation Reform Act of 1995. Such statements are subject to certain risks anduncertainties that could cause actual results to differ materially from historical results and those currently anticipated or projected. We wish to caution younot to place undue reliance on any such forward-looking statements.
In connection with the “safe harbor” provisions of the Private Securities Litigation Reform Act of 1995, we are identifying important factors that could affectour financial performance and could cause our actual results in future periods to differ materially from any current opinions or statements.
Our future results could be affected by a variety of factors, such as: competitive dynamics in the consumer foods industry and the markets for our products,including new product introductions, advertising activities, pricing actions, and promotional activities of our competitors; economic conditions, includingchanges in inflation rates, interest rates, tax rates, or the availability of capital; product development and innovation; consumer acceptance of new productsand product improvements; consumer reaction to pricing actions and changes in promotion levels; acquisitions or dispositions of businesses or assets;changes in capital structure; changes in the legal and regulatory environment, including labeling and advertising regulations and litigation; impairments inthe carrying value of goodwill, other intangible assets, or other long-lived assets, or changes in the useful lives of other intangible assets; changes inaccounting standards and the impact of significant accounting estimates; product quality and safety issues, including recalls and product liability; changesin consumer demand for our products; effectiveness of advertising, marketing, and promotional programs; changes in consumer behavior, trends, andpreferences, including weight loss trends; consumer perception of health-related issues, including obesity; consolidation in the retail environment; changesin purchasing and inventory levels of significant customers; fluctuations in the cost and availability of supply chain resources, including raw materials,packaging, and energy; disruptions or inefficiencies in the supply chain; effectiveness of restructuring and cost savings initiatives; volatility in the marketvalue of derivatives used to manage price risk for certain commodities; benefit plan expenses due to changes in plan asset values and discount rates used todetermine plan liabilities; failure or breach of our information technology systems; foreign economic conditions, including currency rate fluctuations; andpolitical unrest in foreign markets and economic uncertainty due to terrorism or war.
You should also consider the risk factors that we identify in Item 1A of this report, which could also affect our future results.
We undertake no obligation to publicly revise any forward-looking statements to reflect events or circumstances after the date of those statements or to reflectthe occurrence of anticipated or unanticipated events.
Item 7A Quantitative and Qualitative Disclosures About Market Risk
We are exposed to market risk stemming from changes in interest and foreign exchange rates and commodity and equity prices. Changes in these factorscould cause fluctuations in our earnings and cash flows. In the normal course of business, we actively manage our exposure to these market risks by enteringinto various hedging transactions, authorized under established policies that place clear controls on these activities. The counterparties in these transactionsare generally highly rated institutions. We establish credit limits for each counterparty. Our hedging transactions include but are not limited to a variety ofderivative financial instruments. For information on interest rate, foreign exchange, commodity price, and equity instrument risk, please see Note 7 to theConsolidated Financial Statements in Item 8 of this report.
VALUE AT RISK
The estimates in the table below are intended to measure the maximum potential fair value we could lose in one day from adverse changes in market interestrates, foreign exchange rates, commodity prices, and equity prices under normal market conditions. A Monte Carlo value-at-risk (VAR) methodology wasused to quantify the market risk for our exposures. The models assumed normal market conditions and used a 95 percent confidence level.
The VAR calculation used historical interest and foreign exchange rates, and commodity and equity prices from the past year to estimate the potentialvolatility and correlation of these rates in the future. The market data were drawn from the RiskMetrics™ data set. The calculations are not intended torepresent actual losses in fair value that we expect to incur. Further, since the hedging instrument (the derivative) inversely correlates with the underlyingexposure, we would expect that any loss or gain in the fair value of our derivatives would be generally offset by an increase or decrease in the fair value of theunderlying exposure. The positions included in the calculations were: debt; investments; interest rate swaps; foreign exchange forwards; commodity swaps,futures and options; and equity instruments. The calculations do not include the underlying foreign exchange and commodities or equity-related positionsthat are offset by these market-risk-sensitive instruments.
46
Source: GENERAL MILLS INC, 10-K, June 29, 2017 Powered by Morningstar® Document Research℠The information contained herein may not be copied, adapted or distributed and is not warranted to be accurate, complete or timely. The user assumes all risks for any damages or losses arising from any use of this information,except to the extent such damages or losses cannot be limited or excluded by applicable law. Past financial performance is no guarantee of future results.

Table of Contents
The table below presents the estimated maximum potential VAR arising from a one-day loss in fair value for our interest rate, foreign currency, commodity,and equity market-risk-sensitive instruments outstanding as of May 28, 2017, and May 29, 2016, and the average fair value impact during the year endedMay 28, 2017. Fair Value Impact
In Millions May 28,
2017
Averageduring
fiscal 2017 May 29,
2016 Interest rate instruments $ 25.1 $ 26.5 $ 33.3 Foreign currency instruments 24.6 22.9 27.6 Commodity instruments 3.2 2.5 3.3 Equity instruments 1.3 1.4 1.7
47
Source: GENERAL MILLS INC, 10-K, June 29, 2017 Powered by Morningstar® Document Research℠The information contained herein may not be copied, adapted or distributed and is not warranted to be accurate, complete or timely. The user assumes all risks for any damages or losses arising from any use of this information,except to the extent such damages or losses cannot be limited or excluded by applicable law. Past financial performance is no guarantee of future results.

Table of Contents
ITEM 8 Financial Statements and Supplementary Data
REPORT OF MANAGEMENT RESPONSIBILITIES
The management of General Mills, Inc. is responsible for the fairness and accuracy of the consolidated financial statements. The statements have beenprepared in accordance with accounting principles that are generally accepted in the United States, using management’s best estimates and judgments whereappropriate. The financial information throughout this Annual Report on Form 10-K is consistent with our consolidated financial statements.
Management has established a system of internal controls that provides reasonable assurance that assets are adequately safeguarded and transactions arerecorded accurately in all material respects, in accordance with management’s authorization. We maintain a strong audit program that independentlyevaluates the adequacy and effectiveness of internal controls. Our internal controls provide for appropriate separation of duties and responsibilities, and thereare documented policies regarding use of our assets and proper financial reporting. These formally stated and regularly communicated policies demandhighly ethical conduct from all employees.
The Audit Committee of the Board of Directors meets regularly with management, internal auditors, and our independent registered public accounting firm toreview internal control, auditing, and financial reporting matters. The independent registered public accounting firm, internal auditors, and employees havefull and free access to the Audit Committee at any time.
The Audit Committee reviewed and approved the Company’s annual financial statements. The Audit Committee recommended, and the Board of Directorsapproved, that the consolidated financial statements be included in the Annual Report. The Audit Committee also appointed KPMG LLP to serve as theCompany’s independent registered public accounting firm for fiscal 2018.
/s/ J. L. Harmening /s/ D. L. Mulligan
J. L. Harmening D. L. MulliganChief Executive Officer Executive Vice President
and Chief Financial Officer
June 29, 2017
48
Source: GENERAL MILLS INC, 10-K, June 29, 2017 Powered by Morningstar® Document Research℠The information contained herein may not be copied, adapted or distributed and is not warranted to be accurate, complete or timely. The user assumes all risks for any damages or losses arising from any use of this information,except to the extent such damages or losses cannot be limited or excluded by applicable law. Past financial performance is no guarantee of future results.

Table of Contents
Report of Independent Registered Public Accounting Firm
The Board of Directors and StockholdersGeneral Mills, Inc.:
We have audited the accompanying consolidated balance sheets of General Mills, Inc. and subsidiaries as of May 28, 2017 and May 29, 2016, and the relatedconsolidated statements of earnings, comprehensive income, total equity and redeemable interest, and cash flows for each of the fiscal years in the three-yearperiod ended May 28, 2017. In connection with our audits of the consolidated financial statements, we have audited the accompanying financial statementschedule. We also have audited General Mills, Inc.’s internal control over financial reporting as of May 28, 2017, based on criteria established in InternalControl – Integrated Framework (2013) issued by the Committee of Sponsoring Organizations of the Treadway Commission (COSO). General Mills, Inc.’smanagement is responsible for these consolidated financial statements and financial statement schedule, for maintaining effective internal control overfinancial reporting, and for its assessment of the effectiveness of internal control over financial reporting, included in the accompanying Item 9aManagement’s Report on Internal Control over Financial Reporting. Our responsibility is to express an opinion on these consolidated financial statementsand financial statement schedule and an opinion on the Company’s internal control over financial reporting based on our audits.
We conducted our audits in accordance with the standards of the Public Company Accounting Oversight Board (United States). Those standards require thatwe plan and perform the audits to obtain reasonable assurance about whether the financial statements are free of material misstatement and whether effectiveinternal control over financial reporting was maintained in all material respects. Our audits of the consolidated financial statements included examining, on atest basis, evidence supporting the amounts and disclosures in the financial statements, assessing the accounting principles used and significant estimatesmade by management, and evaluating the overall financial statement presentation. Our audit of internal control over financial reporting included obtainingan understanding of internal control over financial reporting, assessing the risk that a material weakness exists, and testing and evaluating the design andoperating effectiveness of internal control based on the assessed risk. Our audits also included performing such other procedures as we considered necessaryin the circumstances. We believe that our audits provide a reasonable basis for our opinions.
A company’s internal control over financial reporting is a process designed to provide reasonable assurance regarding the reliability of financial reportingand the preparation of financial statements for external purposes in accordance with generally accepted accounting principles. A company’s internal controlover financial reporting includes those policies and procedures that (1) pertain to the maintenance of records that, in reasonable detail, accurately and fairlyreflect the transactions and dispositions of the assets of the Company; (2) provide reasonable assurance that transactions are recorded as necessary to permitpreparation of financial statements in accordance with generally accepted accounting principles, and that receipts and expenditures of the Company arebeing made only in accordance with authorizations of management and directors of the Company; and (3) provide reasonable assurance regarding preventionor timely detection of unauthorized acquisition, use, or disposition of the Company’s assets that could have a material effect on the financial statements.
Because of its inherent limitations, internal control over financial reporting may not prevent or detect misstatements. Also, projections of any evaluation ofeffectiveness to future periods are subject to the risk that controls may become inadequate because of changes in conditions, or that the degree of compliancewith the policies or procedures may deteriorate.
In our opinion, the consolidated financial statements referred to above present fairly, in all material respects, the financial position of General Mills, Inc. andsubsidiaries as of May 28, 2017 and May 29, 2016, and the results of their operations and their cash flows for each of the fiscal years in the three-year periodended May 28, 2017, in conformity with U.S. generally accepted accounting principles. Also in our opinion, the accompanying financial statement schedule,when considered in relation to the basic consolidated financial statements taken as a whole, presents fairly, in all material respects, the information set forththerein. Also in our opinion, General Mills, Inc. maintained, in all material respects, effective internal control over financial reporting as of May 28, 2017,based on criteria established in Internal Control – Integrated Framework (2013) issued by the Committee of Sponsoring Organizations of the TreadwayCommission.
/s/ KPMG LLP
Minneapolis, MinnesotaJune 29, 2017
49
Source: GENERAL MILLS INC, 10-K, June 29, 2017 Powered by Morningstar® Document Research℠The information contained herein may not be copied, adapted or distributed and is not warranted to be accurate, complete or timely. The user assumes all risks for any damages or losses arising from any use of this information,except to the extent such damages or losses cannot be limited or excluded by applicable law. Past financial performance is no guarantee of future results.

Table of Contents
Consolidated Statements of EarningsGENERAL MILLS, INC. AND SUBSIDIARIES
(In Millions, Except per Share Data) Fiscal Year 2017 2016 2015
Net sales $15,619.8 $16,563.1 $17,630.3
Cost of sales 10,056.0 10,733.6 11,681.1
Selling, general, and administrative expenses 2,801.3 3,118.9 3,328.0
Divestitures loss (gain) 13.5 (148.2) —
Restructuring, impairment, and other exit costs 182.6 151.4 543.9
Operating profit 2,566.4 2,707.4 2,077.3
Interest, net 295.1 303.8 315.4
Earnings before income taxes and after-tax earnings from joint ventures 2,271.3 2,403.6 1,761.9
Income taxes 655.2 755.2 586.8
After-tax earnings from joint ventures 85.0 88.4 84.3
Net earnings, including earnings attributable to redeemable and noncontrolling interests 1,701.1 1,736.8 1,259.4
Net earnings attributable to redeemable and noncontrolling interests 43.6 39.4 38.1
Net earnings attributable to General Mills $ 1,657.5 $ 1,697.4 $ 1,221.3
Earnings per share - basic $ 2.82 $ 2.83 $ 2.02
Earnings per share - diluted $ 2.77 $ 2.77 $ 1.97
Dividends per share $ 1.92 $ 1.78 $ 1.67
See accompanying notes to consolidated financial statements.
50
Source: GENERAL MILLS INC, 10-K, June 29, 2017 Powered by Morningstar® Document Research℠The information contained herein may not be copied, adapted or distributed and is not warranted to be accurate, complete or timely. The user assumes all risks for any damages or losses arising from any use of this information,except to the extent such damages or losses cannot be limited or excluded by applicable law. Past financial performance is no guarantee of future results.

Table of Contents
Consolidated Statements of Comprehensive IncomeGENERAL MILLS, INC. AND SUBSIDIARIES
(In Millions) Fiscal Year 2017 2016 2015
Net earnings, including earnings attributable to redeemable and noncontrolling interests $1,701.1 $1,736.8 $ 1,259.4
Other comprehensive income (loss), net of tax:
Foreign currency translation 6.3 (108.7) (957.9)
Net actuarial income (loss) 197.9 (325.9) (358.4)
Other fair value changes:
Securities 0.8 0.1 0.8
Hedge derivatives 53.3 16.0 4.1
Reclassification to earnings:
Hedge derivatives (25.7) (9.5) 4.9
Amortization of losses and prior service costs 122.5 128.6 105.1
Other comprehensive income (loss), net of tax 355.1 (299.4) (1,201.4)
Total comprehensive income 2,056.2 1,437.4 58.0
Comprehensive income (loss) attributable to redeemable and noncontrolling interests 31.0 41.5 (192.9)
Comprehensive income attributable to General Mills $2,025.2 $1,395.9 $ 250.9
See accompanying notes to consolidated financial statements.
51
Source: GENERAL MILLS INC, 10-K, June 29, 2017 Powered by Morningstar® Document Research℠The information contained herein may not be copied, adapted or distributed and is not warranted to be accurate, complete or timely. The user assumes all risks for any damages or losses arising from any use of this information,except to the extent such damages or losses cannot be limited or excluded by applicable law. Past financial performance is no guarantee of future results.

Table of Contents
Consolidated Balance SheetsGENERAL MILLS, INC. AND SUBSIDIARIES
(In Millions, Except Par Value)
May 28,
2017 May 29,
2016 ASSETS Current assets:
Cash and cash equivalents $ 766.1 $ 763.7 Receivables 1,430.1 1,360.8 Inventories 1,483.6 1,413.7 Prepaid expenses and other current assets 381.6 399.0
Total current assets 4,061.4 3,937.2
Land, buildings, and equipment 3,687.7 3,743.6 Goodwill 8,747.2 8,741.2 Other intangible assets 4,530.4 4,538.6 Other assets 785.9 751.7
Total assets $21,812.6 $21,712.3
LIABILITIES AND EQUITY Current liabilities:
Accounts payable $ 2,119.8 $ 2,046.5 Current portion of long-term debt 604.7 1,103.4 Notes payable 1,234.1 269.8 Other current liabilities 1,372.2 1,595.0
Total current liabilities 5,330.8 5,014.7
Long-term debt 7,642.9 7,057.7 Deferred income taxes 1,719.4 1,399.6 Other liabilities 1,523.1 2,087.6
Total liabilities 16,216.2 15,559.6
Redeemable interest 910.9 845.6
Stockholders’ equity: Common stock, 754.6 shares issued, $0.10 par value 75.5 75.5 Additional paid-in capital 1,120.9 1,177.0 Retained earnings 13,138.9 12,616.5 Common stock in treasury, at cost, shares of 177.7 and 157.8 (7,762.9) (6,326.6) Accumulated other comprehensive loss (2,244.5) (2,612.2)
Total stockholders’ equity 4,327.9 4,930.2
Noncontrolling interests 357.6 376.9
Total equity 4,685.5 5,307.1
Total liabilities and equity $21,812.6 $21,712.3
See accompanying notes to consolidated financial statements.
52
Source: GENERAL MILLS INC, 10-K, June 29, 2017 Powered by Morningstar® Document Research℠The information contained herein may not be copied, adapted or distributed and is not warranted to be accurate, complete or timely. The user assumes all risks for any damages or losses arising from any use of this information,except to the extent such damages or losses cannot be limited or excluded by applicable law. Past financial performance is no guarantee of future results.

Table of Contents
Consolidated Statements of Total Equity, and Redeemable InterestGENERAL MILLS, INC. AND SUBSIDIARIES
(In Millions, Except per Share Data)
$.10 Par Value Common Stock(One Billion Shares Authorized)
Issued Treasury
Shares Par
Amount
AdditionalPaid-InCapital Shares Amount
RetainedEarnings
AccumulatedOther
ComprehensiveLoss
Non-controlling
Interests Total
Equity Redeemable
Interest Balance as of May 25, 2014 754.6 $ 75.5 $ 1,231.8 (142.3) $(5,219.4) $11,787.2 $ (1,340.3) $ 470.6 $ 7,005.4 $ 984.1 Total comprehensive income (loss) 1,221.3 (970.4) (70.0) 180.9 (122.9) Cash dividends declared ($1.67 per share) (1,017.7) (1,017.7) Shares purchased (22.3) (1,161.9) (1,161.9) Stock compensation plans (includes income tax
benefits of $74.6) (38.1) 8.7 325.7 287.6 Unearned compensation related to stock unit awards (80.8) (80.8) Earned compensation 111.1 111.1 Decrease in redemption value of redeemable interest 83.2 83.2 (83.2) Addition of noncontrolling interest 20.7 20.7 Acquisition of interest in subsidiary (10.5) 0.6 (9.9) Distributions to redeemable and noncontrolling
interest holders (25.9) (25.9) 0.9 Balance as of May 31, 2015 754.6 75.5 1,296.7 (155.9) (6,055.6) 11,990.8 (2,310.7) 396.0 5,392.7 778.9 Total comprehensive income (loss) 1,697.4 (301.5) 11.2 1,407.1 30.3 Cash dividends declared ($1.78 per share) (1,071.7) (1,071.7) Shares purchased (10.7) (606.7) (606.7) Stock compensation plans (includes income tax
benefits of $94.1) (46.3) 8.8 335.7 289.4 Unearned compensation related to stock unit awards (63.3) (63.3) Earned compensation 84.8 84.8 Increase in redemption value of redeemable interest (91.5) (91.5) 91.5 Acquisition of interest in subsidiary (3.4) (1.1) (4.5) Distributions to redeemable and noncontrolling
interest holders (29.2) (29.2) (55.1) Balance as of May 29, 2016 754.6 75.5 1,177.0 (157.8) (6,326.6) 12,616.5 (2,612.2) 376.9 5,307.1 845.6 Total comprehensive income 1,657.5 367.7 13.8 2,039.0 17.2 Cash dividends declared (1.92 per share) (1,135.1) (1,135.1) Shares purchased (25.4) (1,651.5) (1,651.5) Stock compensation plans (includes income tax
benefits of $64.1) 3.6 5.5 215.2 218.8 Unearned compensation related to stock unit awards (78.5) (78.5) Earned compensation 94.9 94.9 Increase in redemption value of redeemable interest (75.9) (75.9) 75.9 Acquisition of interest in subsidiary (0.2) 0.1 (0.1) Distributions to redeemable and noncontrolling
interest holders (33.2) (33.2) (27.8) Balance as of May 28, 2017 754.6 $ 75.5 $ 1,120.9 (177.7) $(7,762.9) $13,138.9 $ (2,244.5) $ 357.6 $ 4,685.5 $ 910.9
See accompanying notes to consolidated financial statements.
53
Source: GENERAL MILLS INC, 10-K, June 29, 2017 Powered by Morningstar® Document Research℠The information contained herein may not be copied, adapted or distributed and is not warranted to be accurate, complete or timely. The user assumes all risks for any damages or losses arising from any use of this information,except to the extent such damages or losses cannot be limited or excluded by applicable law. Past financial performance is no guarantee of future results.

Table of Contents
Consolidated Statements of Cash FlowsGENERAL MILLS, INC. AND SUBSIDIARIES
(In Millions) Fiscal Year 2017 2016 2015 Cash Flows - Operating Activities
Net earnings, including earnings attributable to redeemable and noncontrolling interests $ 1,701.1 $ 1,736.8 $ 1,259.4 Adjustments to reconcile net earnings to net cash provided by operating activities:
Depreciation and amortization 603.6 608.1 588.3 After-tax earnings from joint ventures (85.0) (88.4) (84.3) Distributions of earnings from joint ventures 75.6 75.1 72.6 Stock-based compensation 95.7 89.8 106.4 Deferred income taxes 183.9 120.6 25.3 Tax benefit on exercised options (64.1) (94.1) (74.6) Pension and other postretirement benefit plan contributions (45.4) (47.8) (49.5) Pension and other postretirement benefit plan costs 35.7 118.1 91.3 Divestitures loss (gain) 13.5 (148.2) — Restructuring, impairment, and other exit costs 117.0 107.2 531.1 Changes in current assets and liabilities, excluding the effects of acquisitions and divestitures (232.0) 258.2 214.7 Other, net (86.3) (105.6) (137.9)
Net cash provided by operating activities 2,313.3 2,629.8 2,542.8
Cash Flows - Investing Activities Purchases of land, buildings, and equipment (684.4) (729.3) (712.4) Acquisitions, net of cash acquired — (84.0) (822.3) Investments in affiliates, net 3.3 63.9 (102.4) Proceeds from disposal of land, buildings, and equipment 4.2 4.4 11.0 Proceeds from divestitures 17.5 828.5 — Exchangeable note 13.0 21.1 27.9 Other, net (0.5) (11.2) (4.0)
Net cash provided (used) by investing activities (646.9) 93.4 (1,602.2)
Cash Flows - Financing Activities Change in notes payable 962.4 (323.8) (509.8) Issuance of long-term debt 1,072.1 542.5 2,253.2 Payment of long-term debt (1,000.0) (1,000.4) (1,145.8) Proceeds from common stock issued on exercised options 112.6 171.9 163.7 Tax benefit on exercised options 64.1 94.1 74.6 Purchases of common stock for treasury (1,651.5) (606.7) (1,161.9) Dividends paid (1,135.1) (1,071.7) (1,017.7) Distributions to noncontrolling and redeemable interest holders (61.0) (84.3) (25.0) Other, net (9.1) (7.2) (16.1)
Net cash used by financing activities (1,645.5) (2,285.6) (1,384.8)
Effect of exchange rate changes on cash and cash equivalents (18.5) (8.1) (88.9) Increase (decrease) in cash and cash equivalents 2.4 429.5 (533.1) Cash and cash equivalents - beginning of year 763.7 334.2 867.3
Cash and cash equivalents - end of year $ 766.1 $ 763.7 $ 334.2
Cash Flow from Changes in Current Assets and Liabilities, excluding the effects of acquisitions and divestitures: Receivables $ (69.2) $ (6.9) $ 6.8 Inventories (61.5) (146.1) (24.2) Prepaid expenses and other current assets 16.6 (0.1) (50.5) Accounts payable 99.5 318.7 145.8 Other current liabilities (217.4) 92.6 136.8
Changes in current assets and liabilities $ (232.0) $ 258.2 $ 214.7
See accompanying notes to consolidated financial statements.
54
Source: GENERAL MILLS INC, 10-K, June 29, 2017 Powered by Morningstar® Document Research℠The information contained herein may not be copied, adapted or distributed and is not warranted to be accurate, complete or timely. The user assumes all risks for any damages or losses arising from any use of this information,except to the extent such damages or losses cannot be limited or excluded by applicable law. Past financial performance is no guarantee of future results.

Table of Contents
Notes to Consolidated Financial StatementsGENERAL MILLS, INC. AND SUBSIDIARIES
NOTE 1. BASIS OF PRESENTATION AND RECLASSIFICATIONS
Basis of PresentationOur Consolidated Financial Statements include the accounts of General Mills, Inc. and all subsidiaries in which we have a controlling financial interest.Intercompany transactions and accounts, including any noncontrolling and redeemable interests’ share of those transactions, are eliminated in consolidation.
Our fiscal year ends on the last Sunday in May. Fiscal years 2017 and 2016 consisted of 52 weeks, while fiscal year 2015 consisted of 53 weeks.
Change in Reporting PeriodAs part of a long-term plan to conform the fiscal year ends of all our operations, in fiscal 2017 we changed the reporting period of General Mills BrasilAlimentos Ltda (Yoki) within our Asia & Latin America segment from an April fiscal year-end to a May fiscal year-end to match our fiscal calendar.Accordingly, in fiscal 2017, our results included 13 months of results from the affected operations. The impact of these changes was not material to ourconsolidated results of operations. Our General Mills India business remains on an April fiscal year end.
In fiscal 2016 we changed the reporting period of Yoplait SAS and Yoplait Marques SNC within our Europe & Australia segment and Annie’s, Inc. (Annie’s)within our North America Retail segment from an April fiscal year-end to a May fiscal year-end to match our fiscal calendar. Accordingly, in fiscal 2016, ourresults included 13 months of results from the affected operations. The impact of these changes was not material to our consolidated results of operations.
Certain reclassifications to our previously reported financial information have been made to conform to the current period presentation.
NOTE 2. SUMMARY OF SIGNIFICANT ACCOUNTING POLICIES
Cash and Cash EquivalentsWe consider all investments purchased with an original maturity of three months or less to be cash equivalents.
InventoriesAll inventories in the United States other than grain are valued at the lower of cost, using the last-in, first-out (LIFO) method, or market. Grain inventories arevalued at net realizable value, and all related cash contracts and derivatives are valued at fair value, with all net changes in value recorded in earningscurrently.
Inventories outside of the United States are generally valued at the lower of cost, using the first-in, first-out (FIFO) method, or net realizable value.
Shipping costs associated with the distribution of finished product to our customers are recorded as cost of sales, and are recognized when the related finishedproduct is shipped to and accepted by the customer.
Land, Buildings, Equipment, and DepreciationLand is recorded at historical cost. Buildings and equipment, including capitalized interest and internal engineering costs, are recorded at cost anddepreciated over estimated useful lives, primarily using the straight-line method. Ordinary maintenance and repairs are charged to cost of sales. Buildings areusually depreciated over 40 years, and equipment, furniture, and software are usually depreciated over 3 to 10 years. Fully depreciated assets are retained inbuildings and equipment until disposal. When an item is sold or retired, the accounts are relieved of its cost and related accumulated depreciation and theresulting gains and losses, if any, are recognized in earnings. As of May 28, 2017, assets held for sale were insignificant.
Long-lived assets are reviewed for impairment whenever events or changes in circumstances indicate that the carrying amount of an asset (or asset group) maynot be recoverable. An impairment loss would be recognized when estimated undiscounted future cash flows from the operation and disposition of the assetgroup are less than the carrying amount of the asset group. Asset groups have identifiable cash flows and are largely independent of other asset groups.Measurement of an impairment loss would be based on the excess of the carrying amount of the asset group over its fair value. Fair value is measured using adiscounted cash flow model or independent appraisals, as appropriate.
55
Source: GENERAL MILLS INC, 10-K, June 29, 2017 Powered by Morningstar® Document Research℠The information contained herein may not be copied, adapted or distributed and is not warranted to be accurate, complete or timely. The user assumes all risks for any damages or losses arising from any use of this information,except to the extent such damages or losses cannot be limited or excluded by applicable law. Past financial performance is no guarantee of future results.

Table of Contents
Goodwill and Other Intangible AssetsGoodwill is not subject to amortization and is tested for impairment annually and whenever events or changes in circumstances indicate that impairment mayhave occurred. In fiscal 2016, we changed the date of our annual goodwill and indefinite-lived intangible asset impairment assessment from the first day ofthe third quarter to the first day of the second quarter to more closely align with the timing of our annual long-range planning process. Impairment testing isperformed for each of our reporting units. We compare the carrying value of a reporting unit, including goodwill, to the fair value of the unit. Carrying valueis based on the assets and liabilities associated with the operations of that reporting unit, which often requires allocation of shared or corporate items amongreporting units. If the carrying amount of a reporting unit exceeds its fair value, we revalue all assets and liabilities of the reporting unit, excluding goodwill,to determine if the fair value of the net assets is greater than the net assets including goodwill. If the fair value of the net assets is less than the carryingamount of net assets including goodwill, impairment has occurred. Our estimates of fair value are determined based on a discounted cash flow model. Growthrates for sales and profits are determined using inputs from our long-range planning process. We also make estimates of discount rates, perpetuity growthassumptions, market comparables, and other factors.
We evaluate the useful lives of our other intangible assets, mainly brands, to determine if they are finite or indefinite-lived. Reaching a determination onuseful life requires significant judgments and assumptions regarding the future effects of obsolescence, demand, competition, other economic factors (such asthe stability of the industry, known technological advances, legislative action that results in an uncertain or changing regulatory environment, and expectedchanges in distribution channels), the level of required maintenance expenditures, and the expected lives of other related groups of assets. Intangible assetsthat are deemed to have definite lives are amortized on a straight-line basis, over their useful lives, generally ranging from 4 to 30 years.
Our indefinite-lived intangible assets, mainly intangible assets primarily associated with the Pillsbury, Totino’s, Progresso, Yoplait, Old El Paso, Yoki,Häagen-Dazs, and Annie’s brands, are also tested for impairment annually and whenever events or changes in circumstances indicate that their carrying valuemay not be recoverable. Our estimate of the fair value of the brands is based on a discounted cash flow model using inputs which included projected revenuesfrom our long-range plan, assumed royalty rates that could be payable if we did not own the brands, and a discount rate.
Our finite-lived intangible assets, primarily acquired franchise agreements and customer relationships, are reviewed for impairment whenever events orchanges in circumstances indicate that the carrying amount of an asset may not be recoverable. An impairment loss would be recognized when estimatedundiscounted future cash flows from the operation and disposition of the asset are less than the carrying amount of the asset. Assets generally haveidentifiable cash flows and are largely independent of other assets. Measurement of an impairment loss would be based on the excess of the carrying amountof the asset over its fair value. Fair value is measured using a discounted cash flow model or other similar valuation model, as appropriate.
Investments in Unconsolidated Joint VenturesOur investments in companies over which we have the ability to exercise significant influence are stated at cost plus our share of undistributed earnings orlosses. We receive royalty income from certain joint ventures, incur various expenses (primarily research and development), and record the tax impact ofcertain joint venture operations that are structured as partnerships. In addition, we make advances to our joint ventures in the form of loans or capitalinvestments. We also sell certain raw materials, semi-finished goods, and finished goods to the joint ventures, generally at market prices.
In addition, we assess our investments in our joint ventures if we have reason to believe an impairment may have occurred including, but not limited to, as aresult of ongoing operating losses, projected decreases in earnings, increases in the weighted average cost of capital, or significant business disruptions. Thesignificant assumptions used to estimate fair value include revenue growth and profitability, royalty rates, capital spending, depreciation and taxes, foreigncurrency exchange rates, and a discount rate. By their nature, these projections and assumptions are uncertain. If we were to determine the current fair value ofour investment was less than the carrying value of the investment, then we would assess if the shortfall was of a temporary or permanent nature and writedown the investment to its fair value if we concluded the impairment is other than temporary.
Source: GENERAL MILLS INC, 10-K, June 29, 2017 Powered by Morningstar® Document Research℠The information contained herein may not be copied, adapted or distributed and is not warranted to be accurate, complete or timely. The user assumes all risks for any damages or losses arising from any use of this information,except to the extent such damages or losses cannot be limited or excluded by applicable law. Past financial performance is no guarantee of future results.

Redeemable InterestWe have a 51 percent controlling interest in Yoplait SAS, a consolidated entity. Sodiaal International (Sodiaal) holds the remaining 49 percent interest inYoplait SAS. Sodiaal has the ability to put all or a portion of its redeemable interest to us at fair value once per year, up to three times before December 2024.This put option requires us to classify Sodiaal’s interest as a redeemable interest outside of equity on our Consolidated Balance Sheets for as long as the putis exercisable by Sodiaal. When the put is no longer exercisable, the redeemable interest will be reclassified to noncontrolling interests on our ConsolidatedBalance Sheets. We adjust the value of the redeemable interest through additional paid-in capital on our Consolidated Balance Sheets quarterly to theredeemable interest’s redemption value, which approximates its fair value. During the second and third quarters of fiscal 2017, we adjusted the redeemableinterest’s redemption value based on a discounted cash flow model. The significant assumptions used to estimate the redemption value include projectedrevenue growth and profitability from our long-range plan, capital spending, depreciation, taxes, foreign currency exchange rates, and a discount rate.
56
Source: GENERAL MILLS INC, 10-K, June 29, 2017 Powered by Morningstar® Document Research℠The information contained herein may not be copied, adapted or distributed and is not warranted to be accurate, complete or timely. The user assumes all risks for any damages or losses arising from any use of this information,except to the extent such damages or losses cannot be limited or excluded by applicable law. Past financial performance is no guarantee of future results.

Table of Contents
Revenue RecognitionWe recognize sales revenue when the shipment is accepted by our customer. Sales include shipping and handling charges billed to the customer and arereported net of consumer coupon redemption, trade promotion and other costs, including estimated allowances for returns, unsalable product, and prompt paydiscounts. Sales, use, value-added, and other excise taxes are not recognized in revenue. Coupons are recorded when distributed, based on estimatedredemption rates. Trade promotions are recorded based on estimated participation and performance levels for offered programs at the time of sale. Wegenerally do not allow a right of return. However, on a limited case-by-case basis with prior approval, we may allow customers to return product. In limitedcircumstances, product returned in saleable condition is resold to other customers or outlets. Receivables from customers generally do not bear interest. Termsand collection patterns vary around the world and by channel. The allowance for doubtful accounts represents our estimate of probable non-payments andcredit losses in our existing receivables, as determined based on a review of past due balances and other specific account data. Account balances are writtenoff against the allowance when we deem the amount is uncollectible.
EnvironmentalEnvironmental costs relating to existing conditions caused by past operations that do not contribute to current or future revenues are expensed. Liabilities foranticipated remediation costs are recorded on an undiscounted basis when they are probable and reasonably estimable, generally no later than the completionof feasibility studies or our commitment to a plan of action.
Advertising Production CostsWe expense the production costs of advertising the first time that the advertising takes place.
Research and DevelopmentAll expenditures for research and development (R&D) are charged against earnings in the period incurred. R&D includes expenditures for new product andmanufacturing process innovation, and the annual expenditures are comprised primarily of internal salaries, wages, consulting, and supplies attributable toR&D activities. Other costs include depreciation and maintenance of research facilities, including assets at facilities that are engaged in pilot plant activities.
Foreign Currency TranslationFor all significant foreign operations, the functional currency is the local currency. Assets and liabilities of these operations are translated at the period-endexchange rates. Income statement accounts are translated using the average exchange rates prevailing during the period. Translation adjustments are reflectedwithin accumulated other comprehensive loss (AOCI) in stockholders’ equity. Gains and losses from foreign currency transactions are included in netearnings for the period, except for gains and losses on investments in subsidiaries for which settlement is not planned for the foreseeable future and foreignexchange gains and losses on instruments designated as net investment hedges. These gains and losses are recorded in AOCI.
Derivative InstrumentsAll derivatives are recognized on our Consolidated Balance Sheets at fair value based on quoted market prices or our estimate of their fair value, and arerecorded in either current or noncurrent assets or liabilities based on their maturity. Changes in the fair values of derivatives are recorded in net earnings orother comprehensive income, based on whether the instrument is designated and effective as a hedge transaction and, if so, the type of hedge transaction.Gains or losses on derivative instruments reported in AOCI are reclassified to earnings in the period the hedged item affects earnings. If the underlyinghedged transaction ceases to exist, any associated amounts reported in AOCI are reclassified to earnings at that time. Any ineffectiveness is recognized inearnings in the current period.
Stock-based CompensationWe generally measure compensation expense for grants of restricted stock units using the value of a share of our stock on the date of grant. We estimate thevalue of stock option grants using a Black-Scholes valuation model. Stock-based compensation is recognized straight line over the vesting period. Our stock-based compensation expense is recorded in selling, general and administrative (SG&A) expenses and cost of sales in our Consolidated Statements of Earningsand allocated to each reportable segment in our segment results.
Certain equity-based compensation plans contain provisions that accelerate vesting of awards upon retirement, termination, or death of eligible employeesand directors. We consider a stock-based award to be vested when the employee’s retention of the award is no longer contingent on providing subsequentservice. Accordingly, the related compensation cost is generally recognized immediately for awards granted to retirement-eligible individuals or over theperiod from the grant date to the date retirement eligibility is achieved, if less than the stated vesting period.
We report the benefits of tax deductions in excess of recognized compensation cost as a financing cash flow, thereby reducing net operating cash flows andincreasing net financing cash flows.
Source: GENERAL MILLS INC, 10-K, June 29, 2017 Powered by Morningstar® Document Research℠The information contained herein may not be copied, adapted or distributed and is not warranted to be accurate, complete or timely. The user assumes all risks for any damages or losses arising from any use of this information,except to the extent such damages or losses cannot be limited or excluded by applicable law. Past financial performance is no guarantee of future results.

Defined Benefit Pension, Other Postretirement Benefit, and Postemployment Benefit PlansWe sponsor several domestic and foreign defined benefit plans to provide pension, health care, and other welfare benefits to retired employees. Under certaincircumstances, we also provide accruable benefits, primarily severance, to former or inactive employees in
57
Source: GENERAL MILLS INC, 10-K, June 29, 2017 Powered by Morningstar® Document Research℠The information contained herein may not be copied, adapted or distributed and is not warranted to be accurate, complete or timely. The user assumes all risks for any damages or losses arising from any use of this information,except to the extent such damages or losses cannot be limited or excluded by applicable law. Past financial performance is no guarantee of future results.

Table of Contents
the United States, Canada, and Mexico. We recognize an obligation for any of these benefits that vest or accumulate with service. Postemployment benefitsthat do not vest or accumulate with service (such as severance based solely on annual pay rather than years of service) are charged to expense when incurred.Our postemployment benefit plans are unfunded.
We recognize the underfunded or overfunded status of a defined benefit pension plan as an asset or liability and recognize changes in the funded status in theyear in which the changes occur through AOCI.
Use of EstimatesPreparing our Consolidated Financial Statements in conformity with accounting principles generally accepted in the United States requires us to makeestimates and assumptions that affect reported amounts of assets and liabilities, disclosures of contingent assets and liabilities at the date of the financialstatements, and the reported amounts of revenues and expenses during the reporting period. These estimates include our accounting for promotionalexpenditures, valuation of long-lived assets, intangible assets, redeemable interest, stock-based compensation, income taxes, and defined benefit pension,other postretirement benefit and postemployment benefit plans. Actual results could differ from our estimates.
Other New Accounting StandardsIn the first quarter of fiscal 2017, we adopted new accounting requirements for the presentation of certain investments using the net asset value, providing apractical expedient to exclude such investments from categorization within the fair value hierarchy and separate disclosure. We adopted the guidanceretrospectively and restated the fiscal 2016 fair value of plan asset tables in Note 13. The adoption of this guidance did not impact our results of operations orfinancial position.
In the first quarter of fiscal 2017, we adopted new accounting requirements which permit reporting entities with a fiscal year-end that does not coincide with amonth-end to apply a practical expedient that permits the entity to measure defined benefit plan assets and obligations using the month-end that is closest tothe entity’s fiscal year-end and apply such practical expedient consistently to all plans. The adoption of this guidance did not have a material impact on ourresults of operations or financial position.
In the fourth quarter of fiscal 2016, we adopted new accounting requirements for the presentation of deferred tax assets and liabilities, requiring noncurrentclassification for all deferred tax assets and liabilities on the statement of financial position. This presentation change has been implemented retroactively.The adoption of this guidance did not have a material impact on our financial position.
In the first quarter of fiscal 2016, we adopted new accounting requirements for the classification of debt issuance costs presented in the balance sheet as adirect reduction from the carrying amount of the debt liability. This presentation change has been implemented retroactively. The adoption of this guidancedid not have a material impact on our financial position.
In the second quarter of fiscal 2015, we adopted new accounting requirements for share-based payment awards issued based upon specific performancetargets. The adoption of this guidance did not have a material impact on our results of operations or financial position.
In the first quarter of fiscal 2015, we adopted new accounting requirements on the financial statement presentation of unrecognized tax benefits when a netoperating loss, a similar tax loss, or a tax credit carryforward exists. The adoption of this guidance did not have an impact on our results of operations orfinancial position.
NOTE 3. ACQUISITION AND DIVESTITURES
During the second quarter of fiscal 2017, we sold our Martel, Ohio manufacturing facility in our Convenience Stores & Foodservice segment andsimultaneously entered into a co-packing agreement with the purchaser. We received $17.5 million in cash, and recorded a pre-tax loss of $13.5 million.
During the fourth quarter of fiscal 2016, we sold our General Mills de Venezuela CA subsidiary to a third party and exited our business in Venezuela. As aresult of this transaction, we recorded a pre-tax loss of $37.6 million. In addition, we sold our General Mills Argentina S.A. foodservice business in Argentinato a third party and recorded a pre-tax loss of $14.8 million.
During the second quarter of fiscal 2016, we sold our North American Green Giant product lines for $822.7 million in cash, and we recorded a pre-tax gain of$199.1 million. We received net cash proceeds of $788.0 million after transaction related costs. After the divestiture, we retained a brand intangible asset onour Consolidated Balance Sheets of $30.1 million related to our continued use of the Green Giant brand in certain markets outside of North America.
During the second quarter of fiscal 2015, we acquired Annie’s, a publicly traded food company headquartered in Berkeley, California, for an aggregatepurchase price of $821.2 million, which we funded by issuing debt. We consolidated Annie’s into our Consolidated Balance Sheets and recorded goodwill of$589.8 million, an indefinite lived intangible asset for the Annie’s brand of $244.5 million, and a finite lived customer relationship asset of $23.9 million.The pro forma effects of this acquisition were not material.
58
Source: GENERAL MILLS INC, 10-K, June 29, 2017 Powered by Morningstar® Document Research℠The information contained herein may not be copied, adapted or distributed and is not warranted to be accurate, complete or timely. The user assumes all risks for any damages or losses arising from any use of this information,except to the extent such damages or losses cannot be limited or excluded by applicable law. Past financial performance is no guarantee of future results.
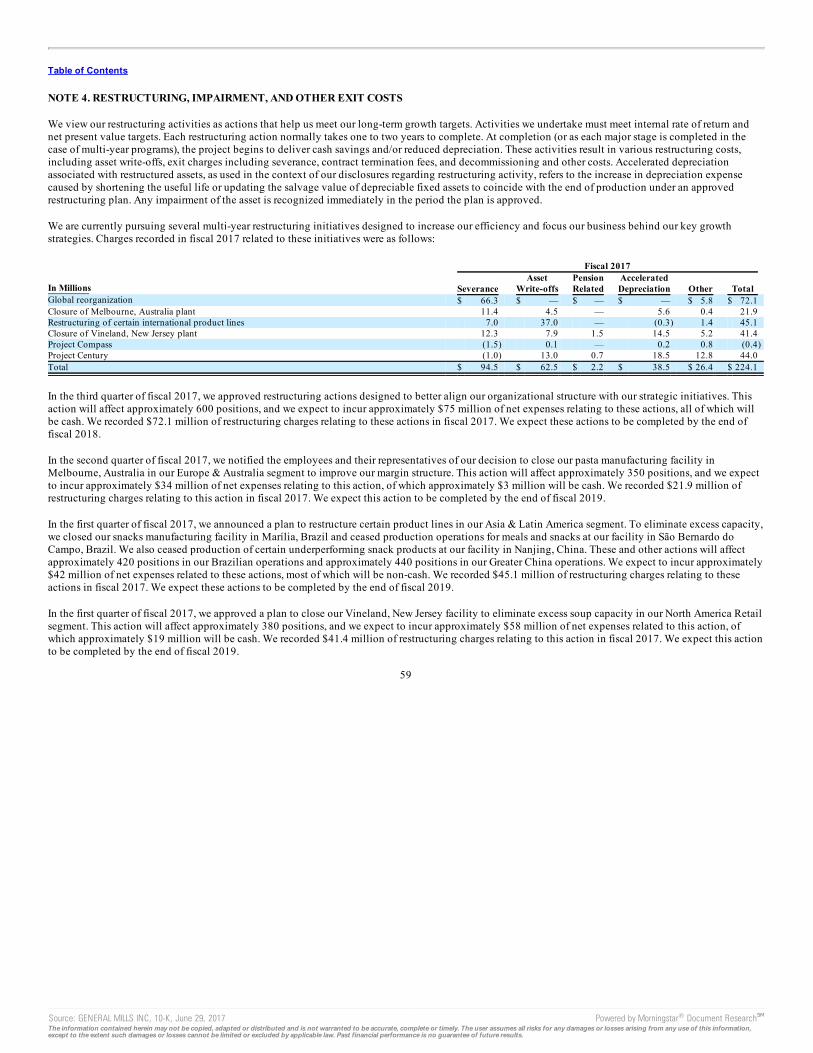
Table of Contents
NOTE 4. RESTRUCTURING, IMPAIRMENT, AND OTHER EXIT COSTS
We view our restructuring activities as actions that help us meet our long-term growth targets. Activities we undertake must meet internal rate of return andnet present value targets. Each restructuring action normally takes one to two years to complete. At completion (or as each major stage is completed in thecase of multi-year programs), the project begins to deliver cash savings and/or reduced depreciation. These activities result in various restructuring costs,including asset write-offs, exit charges including severance, contract termination fees, and decommissioning and other costs. Accelerated depreciationassociated with restructured assets, as used in the context of our disclosures regarding restructuring activity, refers to the increase in depreciation expensecaused by shortening the useful life or updating the salvage value of depreciable fixed assets to coincide with the end of production under an approvedrestructuring plan. Any impairment of the asset is recognized immediately in the period the plan is approved.
We are currently pursuing several multi-year restructuring initiatives designed to increase our efficiency and focus our business behind our key growthstrategies. Charges recorded in fiscal 2017 related to these initiatives were as follows: Fiscal 2017
In Millions Severance Asset
Write-offs PensionRelated
AcceleratedDepreciation Other Total
Global reorganization $ 66.3 $ — $ — $ — $ 5.8 $ 72.1 Closure of Melbourne, Australia plant 11.4 4.5 — 5.6 0.4 21.9 Restructuring of certain international product lines 7.0 37.0 — (0.3) 1.4 45.1 Closure of Vineland, New Jersey plant 12.3 7.9 1.5 14.5 5.2 41.4 Project Compass (1.5) 0.1 — 0.2 0.8 (0.4) Project Century (1.0) 13.0 0.7 18.5 12.8 44.0 Total $ 94.5 $ 62.5 $ 2.2 $ 38.5 $ 26.4 $ 224.1
In the third quarter of fiscal 2017, we approved restructuring actions designed to better align our organizational structure with our strategic initiatives. Thisaction will affect approximately 600 positions, and we expect to incur approximately $75 million of net expenses relating to these actions, all of which willbe cash. We recorded $72.1 million of restructuring charges relating to these actions in fiscal 2017. We expect these actions to be completed by the end offiscal 2018.
In the second quarter of fiscal 2017, we notified the employees and their representatives of our decision to close our pasta manufacturing facility inMelbourne, Australia in our Europe & Australia segment to improve our margin structure. This action will affect approximately 350 positions, and we expectto incur approximately $34 million of net expenses relating to this action, of which approximately $3 million will be cash. We recorded $21.9 million ofrestructuring charges relating to this action in fiscal 2017. We expect this action to be completed by the end of fiscal 2019.
In the first quarter of fiscal 2017, we announced a plan to restructure certain product lines in our Asia & Latin America segment. To eliminate excess capacity,we closed our snacks manufacturing facility in Marília, Brazil and ceased production operations for meals and snacks at our facility in São Bernardo doCampo, Brazil. We also ceased production of certain underperforming snack products at our facility in Nanjing, China. These and other actions will affectapproximately 420 positions in our Brazilian operations and approximately 440 positions in our Greater China operations. We expect to incur approximately$42 million of net expenses related to these actions, most of which will be non-cash. We recorded $45.1 million of restructuring charges relating to theseactions in fiscal 2017. We expect these actions to be completed by the end of fiscal 2019.
In the first quarter of fiscal 2017, we approved a plan to close our Vineland, New Jersey facility to eliminate excess soup capacity in our North America Retailsegment. This action will affect approximately 380 positions, and we expect to incur approximately $58 million of net expenses related to this action, ofwhich approximately $19 million will be cash. We recorded $41.4 million of restructuring charges relating to this action in fiscal 2017. We expect this actionto be completed by the end of fiscal 2019.
59
Source: GENERAL MILLS INC, 10-K, June 29, 2017 Powered by Morningstar® Document Research℠The information contained herein may not be copied, adapted or distributed and is not warranted to be accurate, complete or timely. The user assumes all risks for any damages or losses arising from any use of this information,except to the extent such damages or losses cannot be limited or excluded by applicable law. Past financial performance is no guarantee of future results.

Table of Contents
Charges recorded in fiscal 2016 were as follows: Fiscal 2016
In Millions Severance Asset
Write-offs PensionRelated
AcceleratedDepreciation Other Total
Project Compass $ 45.4 $ — $ 1.4 $ — $ 7.9 $ 54.7 Project Catalyst (8.7) 1.2 — — — (7.5) Project Century 30.9 30.7 19.1 76.5 25.4 182.6 Total $ 67.6 $ 31.9 $ 20.5 $ 76.5 $ 33.3 $229.8
In the first quarter of fiscal 2016, we approved Project Compass, a restructuring plan designed to enable our international operations to accelerate long-termgrowth through increased organizational effectiveness and reduced administrative expense. In connection with this project, we eliminated 749 positions. Weincurred $54.3 million of net expenses, all of which was cash. In fiscal 2017, we reduced the estimate of charges related to this action by $0.4 million. Werecorded $54.7 million of restructuring charges relating to this action in fiscal 2016. This action was completed in fiscal 2017.
In fiscal 2015, we announced Project Century (Century) which initially involved a review of our North American manufacturing and distribution network tostreamline operations and identify potential capacity reductions. In fiscal 2016, we broadened the scope of Century to identify opportunities to streamlineour supply chain outside of North America.
As part of Century, in the second quarter of fiscal 2016, we approved a restructuring plan to close manufacturing facilities in our Europe & Australia segmentsupply chain located in Berwick, United Kingdom and East Tamaki, New Zealand. These actions affected 287 positions and we incurred $31.8 million of netexpenses related to these actions, of which $12 million was cash. We recorded $1.8 million of restructuring charges relating to these actions in fiscal 2017and $30.0 million in fiscal 2016. These actions were completed in fiscal 2017.
As part of Century, in the first quarter of fiscal 2016, we approved a restructuring plan to close our West Chicago, Illinois cereal and dry dinner manufacturingplant in our North America Retail segment supply chain. This action affected 484 positions, and we expect to incur approximately $104 million of netexpenses relating to this action, of which approximately $41 million will be cash. We recorded $23.2 million of restructuring charges relating to this actionin fiscal 2017 and $79.2 million in fiscal 2016. We expect this action to be completed by the end of fiscal 2018.
As part of Century, in the first quarter of fiscal 2016, we approved a restructuring plan to close our Joplin, Missouri snacks plant in our North America Retailsegment’s supply chain. This action affected 125 positions, and we incurred $6.6 million of net expenses relating to this action, of which less than $1 millionwas cash. We recorded $6.3 million of restructuring charges relating to this action in fiscal 2016. This action was completed in fiscal 2016.
Charges recorded in fiscal 2015 were as follows: Fiscal 2015
In Millions Severance Asset
Write-offs PensionRelated
AcceleratedDepreciation Other Total
Project Catalyst $ 121.5 $ 12.3 $ 6.6 $ — $ 8.0 $148.4 Project Century 44.3 42.3 31.2 53.1 10.9 181.8 Combination of certain operational facilities 13.0 0.7 — — 0.2 13.9 Charges associated with restructuring actions previously announced (0.6) — — — — (0.6) Total $ 178.2 $ 55.3 $ 37.8 $ 53.1 $ 19.1 $343.5
In the second quarter of fiscal 2015, we approved Project Catalyst, a restructuring plan to increase organizational effectiveness and reduce overhead expense.In connection with this project, 759 positions were impacted, primarily in the United States. We incurred $140.9 million of net expenses relating to thisaction of which approximately $94 million was cash. We recorded $148.4 million of restructuring charges relating to this action in fiscal 2015. This actionwas substantially completed in fiscal 2015.
As part of Century, in the third quarter of fiscal 2015, we approved a restructuring plan to reduce our refrigerated dough capacity and exit our Midland,Ontario, Canada and New Albany, Indiana facilities, which support our North America Retail and Convenience Stores & Foodservice segments’ supplychains. The Midland action affected 94 positions and we expect to incur approximately $13 million of net expenses relating to this action, of whichapproximately $7 million will be cash. We recorded $1.8 million of restructuring charges relating to this action in fiscal 2017, $2.7 million in fiscal 2016 and$6.5 million in fiscal 2015. The New Albany action will affect 412 positions, and we expect to incur approximately $83 million of net expenses relating tothis action of which approximately $40 million will be cash. We recorded $14.6 million of restructuring charges relating to this action in fiscal 2017, $17.1million in fiscal 2016 and $51.3 million in fiscal 2015. We anticipate these actions will be completed by the end of fiscal 2018.
60
Source: GENERAL MILLS INC, 10-K, June 29, 2017 Powered by Morningstar® Document Research℠The information contained herein may not be copied, adapted or distributed and is not warranted to be accurate, complete or timely. The user assumes all risks for any damages or losses arising from any use of this information,except to the extent such damages or losses cannot be limited or excluded by applicable law. Past financial performance is no guarantee of future results.

Table of Contents
As part of Century, in the second quarter of fiscal 2015, we approved a restructuring plan to consolidate yogurt manufacturing capacity and exit ourMethuen, Massachusetts facility in our North America Retail and Convenience Stores & Foodservice segments’ supply chains. This action affected 170positions. We incurred $59.7 million of net expenses relating to this action of which $13 million was cash. We recorded $15.6 million of restructuringcharges relating to this action in fiscal 2016 and $43.6 million in fiscal 2015. This action was substantially completed in fiscal 2017.
As part of Century, in the second quarter of fiscal 2015, we approved a restructuring plan to eliminate excess cereal and dry mix capacity and exit our Lodi,California facility in our North America Retail segment supply chain. This action affected 409 positions. We incurred $95.3 million of net expenses related tothis action of which $22 million was cash. We recorded $1.5 million of restructuring charges relating to this action in fiscal 2017, $30.6 million in fiscal2016 and $63.2 million in fiscal 2015. This action was substantially completed in fiscal 2016.
In addition to the actions taken at certain facilities described above, we incurred restructuring charges related to Century of $1.1 million in fiscal 2017, noneof which was cash, $1.1 million in fiscal 2016 and $17.2 million in fiscal 2015.
During the first quarter of fiscal 2015, we approved a plan to combine certain Yoplait and General Mills operational facilities within our North AmericaRetail and Europe & Australia segments to increase efficiencies and reduce costs. This action affected approximately 240 positions. We expect to incur $15million of net expenses relating to this action of which $14 million will be cash. We recorded $13.9 million of restructuring charges in fiscal 2015. Weanticipate these actions will be completed by the end of fiscal 2018.
We paid cash related to restructuring initiatives of $107.8 million in fiscal 2017, $122.6 million in fiscal 2016 and $63.6 million in fiscal 2015.
In addition to restructuring charges, we expect to incur approximately $130 million of additional project-related costs, which will be recorded in cost of sales,all of which will be cash. We recorded project-related costs in cost of sales of $43.9 million in fiscal 2017, $57.5 million in fiscal 2016 and $13.2 million infiscal 2015. We paid cash for project-related costs of $46.9 million in fiscal 2017, $54.5 million in fiscal 2016 and $9.7 million in fiscal 2015.
Restructuring charges and project-related costs are classified in our Consolidated Statements of Earnings as follows: Fiscal In Millions 2017 2016 2015 Cost of sales $ 41.5 $ 78.4 $ 59.6 Restructuring, impairment, and other exit costs 182.6 151.4 283.9 Total restructuring charges 224.1 229.8 343.5 Project-related costs classified in cost of sales $ 43.9 $ 57.5 $ 13.2
61
Source: GENERAL MILLS INC, 10-K, June 29, 2017 Powered by Morningstar® Document Research℠The information contained herein may not be copied, adapted or distributed and is not warranted to be accurate, complete or timely. The user assumes all risks for any damages or losses arising from any use of this information,except to the extent such damages or losses cannot be limited or excluded by applicable law. Past financial performance is no guarantee of future results.

Table of Contents
The roll forward of our restructuring and other exit cost reserves, included in other current liabilities, is as follows:
In Millions Severance Contract
Termination Other
Exit Costs Total Reserve balance as of May 25, 2014 $ 3.5 $ — $ — $ 3.5
Fiscal 2015 charges, including foreigncurrency translation 176.4 0.6 8.1 185.1
Utilized in fiscal 2015 (61.3) — (6.5) (67.8) Reserve balance as of May 31, 2015 118.6 0.6 1.6 120.8
Fiscal 2016 charges, including foreigncurrency translation 64.3 1.6 4.3 70.2
Utilized in fiscal 2016 (109.3) (0.7) (4.4) (114.4) Reserve balance as of May 29, 2016 73.6 1.5 1.5 76.6
Fiscal 2017 charges, including foreigncurrency translation 95.0 0.9 8.1 104.0
Utilized in fiscal 2017 (86.8) (1.7) (7.1) (95.6) Reserve balance as of May 28, 2017 $ 81.8 $ 0.7 $ 2.5 $ 85.0
The charges recognized in the roll forward of our reserves for restructuring and other exit costs do not include items charged directly to expense (e.g., assetimpairment charges, the gain or loss on the sale of restructured assets, and the write-off of spare parts) and other periodic exit costs recognized as incurred, asthose items are not reflected in our restructuring and other exit cost reserves on our Consolidated Balance Sheets.
NOTE 5. INVESTMENTS IN UNCONSOLIDATED JOINT VENTURES
We have a 50 percent equity interest in Cereal Partners Worldwide (CPW), which manufactures and markets ready-to-eat cereal products in more than 130countries outside the United States and Canada. CPW also markets cereal bars in several European countries and manufactures private label cereals forcustomers in the United Kingdom. We have guaranteed a portion of CPW’s debt and its pension obligation in the United Kingdom.
We also have a 50 percent equity interest in Häagen-Dazs Japan, Inc. (HDJ). This joint venture manufactures and markets Häagen-Dazs ice cream productsand frozen novelties.
Results from our CPW and HDJ joint ventures are reported for the 12 months ended March 31.
Joint venture related balance sheet activity follows:
In Millions May 28,
2017 May 29,
2016 Cumulative investments $ 505.3 $ 518.9 Goodwill and other intangibles 472.0 469.2 Aggregate advances included in cumulative investments 284.7 300.3
Joint venture earnings and cash flow activity follows: Fiscal Year In Millions 2017 2016 2015 Sales to joint ventures $ 7.0 $ 10.5 $ 11.6 Net advances (repayments) (3.3) (63.9) 102.4 Dividends received 75.6 75.1 72.6
62
Source: GENERAL MILLS INC, 10-K, June 29, 2017 Powered by Morningstar® Document Research℠The information contained herein may not be copied, adapted or distributed and is not warranted to be accurate, complete or timely. The user assumes all risks for any damages or losses arising from any use of this information,except to the extent such damages or losses cannot be limited or excluded by applicable law. Past financial performance is no guarantee of future results.

Table of Contents
Summary combined financial information for the joint ventures on a 100 percent basis follows: Fiscal Year In Millions 2017 2016 2015 Net sales:
CPW $1,648.4 $1,674.8 $1,894.5 HDJ 435.1 369.4 370.2
Total net sales 2,083.5 2,044.2 2,264.7 Gross margin 865.9 867.6 925.4 Earnings before income taxes 243.3 234.8 220.9 Earnings after income taxes 190.3 186.7 170.7
In Millions May 28,
2017 May 29,
2016 Current assets $ 849.7 $ 814.1 Noncurrent assets 858.9 959.9 Current liabilities 1,469.6 1,457.3 Noncurrent liabilities 55.2 81.7
NOTE 6. GOODWILL AND OTHER INTANGIBLE ASSETS
The components of goodwill and other intangible assets are as follows:
In Millions May 28,
2017 May 29,
2016 Goodwill $ 8,747.2 $ 8,741.2 Other intangible assets:
Intangible assets not subject to amortization: Brands and other indefinite-lived intangibles 4,161.1 4,147.5
Intangible assets subject to amortization: Franchise agreements, customer relationships, and other finite-lived intangibles 524.8 536.9 Less accumulated amortization (155.5) (145.8)
Intangible assets subject to amortization 369.3 391.1 Other intangible assets 4,530.4 4,538.6 Total $13,277.6 $13,279.8
Based on the carrying value of finite-lived intangible assets as of May 28, 2017, amortization expense for each of the next five fiscal years is estimated to beapproximately $28 million.
During the third quarter of fiscal 2017, we announced a new global organization structure to streamline our leadership, enhance global scale, and driveimproved operational agility to maximize our growth capabilities. As a result of this global reorganization, we reassessed our operating segments and ourreporting units. Under our new organization structure, our chief operating decision maker assesses performance and makes decisions about resources to beallocated to our segments at the North America Retail, Convenience Stores & Foodservice, Europe & Australia, and Asia & Latin America operating segmentlevel. See Note 16 for additional information on our operating segments. Our reporting units were unchanged with the exception of combining our formerU.S. Meals and U.S. Baking reporting units into a single reporting unit.
63
Source: GENERAL MILLS INC, 10-K, June 29, 2017 Powered by Morningstar® Document Research℠The information contained herein may not be copied, adapted or distributed and is not warranted to be accurate, complete or timely. The user assumes all risks for any damages or losses arising from any use of this information,except to the extent such damages or losses cannot be limited or excluded by applicable law. Past financial performance is no guarantee of future results.

Table of Contents
The changes in the carrying amount of goodwill for fiscal 2015, 2016, and 2017 are as follows:
In Millions
NorthAmerica
Retail
ConvenienceStores &
Foodservice Europe &Australia
Asia & LatinAmerica
JointVentures Total
Balance as of May 25, 2014 $5,975.1 $ 921.1 $ 866.1 $ 390.0 $ 498.2 $8,650.5 Acquisition 589.8 — — — — 589.8 Other activity, primarily foreign currency
translation (18.7) — (147.0) (103.0) (96.7) (365.4) Balance as of May 31, 2015 6,546.2 921.1 719.1 287.0 401.5 8,874.9 Acquisitions 54.1 — — 29.4 — 83.5 Divestitures (184.5) — — (1.9) — (186.4) Other activity, primarily foreign currency
translation (5.5) — (2.6) (27.4) 4.7 (30.8) Balance as of May 29, 2016 6,410.3 921.1 716.5 287.1 406.2 8,741.2 Divestiture — (2.3) — — — (2.3) Other activity, primarily foreign currency
translation (3.8) — (15.7) 25.3 2.5 8.3 Balance as of May 28, 2017 $6,406.5 $ 918.8 $ 700.8 $ 312.4 $ 408.7 $8,747.2
The changes in the carrying amount of other intangible assets for fiscal 2015, 2016, and 2017 are as follows: In Millions Total Balance as of May 25, 2014 $5,014.3 Acquisition 268.4 Impairment charge (260.0) Other activity, primarily amortization and foreign currency translation (345.7) Balance as of May 31, 2015 4,677.0 Acquisitions 30.1 Divestiture (119.6) Other activity, primarily amortization and foreign currency translation (48.9) Balance as of May 29, 2016 4,538.6 Other activity, primarily amortization and foreign currency translation (8.2) Balance as of May 28, 2017 $4,530.4
Our annual goodwill intangible asset test was performed on the first day of the second quarter of fiscal 2017. As of the assessment date, we determined therewas no impairment of our goodwill intangible assets as their related fair values were substantially in excess of the carrying values, except for the LatinAmerica reporting unit. We did not consider the new organization structure to be a triggering event requiring a subsequent goodwill impairment test as ourreporting units remain unchanged, with the exception of combining the former U.S. Meals and U.S. Baking reporting units.
Our indefinite-lived intangible asset test was performed on the first day of the second quarter of fiscal 2017. As of the assessment date, there was noimpairment of any of our indefinite-lived intangible assets as their related fair values were substantially in excess of the carrying values, except for theImmaculate Baking brand intangible asset.
64
Source: GENERAL MILLS INC, 10-K, June 29, 2017 Powered by Morningstar® Document Research℠The information contained herein may not be copied, adapted or distributed and is not warranted to be accurate, complete or timely. The user assumes all risks for any damages or losses arising from any use of this information,except to the extent such damages or losses cannot be limited or excluded by applicable law. Past financial performance is no guarantee of future results.

Table of Contents
The excess fair value above the carrying value of the Latin America reporting unit and the Immaculate Baking brand intangible asset is as follows:
In Millions Carrying
Value
Excess FairValueAbove
CarryingValue
Latin America $ 523.0 15% Immaculate Baking $ 12.0 17%
While having significant coverage as of our fiscal 2017 assessment date, the Progresso, Green Giant, and Food Should Taste Good brand intangible assetsand U.S. Yogurt reporting unit had risk of decreasing coverage. We will continue to monitor these businesses for potential impairment.
In fiscal 2015, we made a strategic decision to redirect certain resources supporting our Green Giant business in our North America Retail segment to otherbusinesses within the segment. Therefore, future sales and profitability projections in our long-range plan for this business declined. As a result of thistriggering event, we performed an interim impairment assessment of the Green Giant brand intangible asset as of May 31, 2015, and determined that the fairvalue of the brand asset no longer exceeded the carrying value of the asset. Significant assumptions used in that assessment included our updated long-rangecash flow projections for the Green Giant business, an updated royalty rate, a weighted-average cost of capital, and a tax rate. We recorded a $260.0 millionimpairment charge in restructuring, impairment, and other exit costs in fiscal 2015 related to this asset.
NOTE 7. FINANCIAL INSTRUMENTS, RISK MANAGEMENT ACTIVITIES, AND FAIR VALUES
FINANCIAL INSTRUMENTS
The carrying values of cash and cash equivalents, receivables, accounts payable, other current liabilities, and notes payable approximate fair value.Marketable securities are carried at fair value. As of May 28, 2017 and May 29, 2016, a comparison of cost and market values of our marketable debt andequity securities is as follows:
Cost Fair Value GrossGains
GrossLosses
Fiscal Year Fiscal Year Fiscal Year Fiscal Year In Millions 2017 2016 2017 2016 2017 2016 2017 2016 Available for sale:
Debt securities $265.4 $165.7 $265.5 $165.8 $ 0.1 $ 0.1 $ — $ — Equity securities 1.8 1.8 9.9 8.4 8.1 6.6 — —
Total $267.2 $167.5 $275.4 $174.2 $ 8.2 $ 6.7 $ — $ —
There were no realized gains or losses from sales of available-for-sale marketable securities. Gains and losses are determined by specific identification.Classification of marketable securities as current or noncurrent is dependent upon our intended holding period and the security’s maturity date. Theaggregate unrealized gains and losses on available-for-sale securities, net of tax effects, are classified in AOCI within stockholders’ equity.
Scheduled maturities of our marketable securities are as follows: Available for Sale
In Millions Cost Fair
Value Under 1 year (current) $ 265.4 $ 265.5 Equity securities 1.8 9.9 Total $ 267.2 $ 275.4
As of May 28, 2017, we did not any have cash and cash equivalents pledged as collateral for derivative contracts. As of May 28, 2017, $19.6 million ofcertain accounts receivable were pledged as collateral against a foreign uncommitted line of credit.
The fair value and carrying amounts of long-term debt, including the current portion, were $8,547.0 million and $8,247.6 million, respectively, as of May 28,2017. The fair value of long-term debt was estimated using market quotations and discounted cash flows based on our current incremental borrowing rates forsimilar types of instruments. Long-term debt is a Level 2 liability in the fair value hierarchy.
65
Source: GENERAL MILLS INC, 10-K, June 29, 2017 Powered by Morningstar® Document Research℠The information contained herein may not be copied, adapted or distributed and is not warranted to be accurate, complete or timely. The user assumes all risks for any damages or losses arising from any use of this information,except to the extent such damages or losses cannot be limited or excluded by applicable law. Past financial performance is no guarantee of future results.

Table of Contents
RISK MANAGEMENT ACTIVITIES
As a part of our ongoing operations, we are exposed to market risks such as changes in interest and foreign currency exchange rates and commodity andequity prices. To manage these risks, we may enter into various derivative transactions (e.g., futures, options, and swaps) pursuant to our established policies.
COMMODITY PRICE RISK
Many commodities we use in the production and distribution of our products are exposed to market price risks. We utilize derivatives to manage price risk forour principal ingredients and energy costs, including grains (oats, wheat, and corn), oils (principally soybean), dairy products, natural gas, and diesel fuel.Our primary objective when entering into these derivative contracts is to achieve certainty with regard to the future price of commodities purchased for use inour supply chain. We manage our exposures through a combination of purchase orders, long-term contracts with suppliers, exchange-traded futures andoptions, and over-the-counter options and swaps. We offset our exposures based on current and projected market conditions and generally seek to acquire theinputs at as close to our planned cost as possible.
We use derivatives to manage our exposure to changes in commodity prices. We do not perform the assessments required to achieve hedge accounting forcommodity derivative positions. Accordingly, the changes in the values of these derivatives are recorded currently in cost of sales in our ConsolidatedStatements of Earnings.
Although we do not meet the criteria for cash flow hedge accounting, we believe that these instruments are effective in achieving our objective of providingcertainty in the future price of commodities purchased for use in our supply chain. Accordingly, for purposes of measuring segment operating performancethese gains and losses are reported in unallocated corporate items outside of segment operating results until such time that the exposure we are managingaffects earnings. At that time we reclassify the gain or loss from unallocated corporate items to segment operating profit, allowing our operating segments torealize the economic effects of the derivative without experiencing any resulting mark-to-market volatility, which remains in unallocated corporate items.
Unallocated corporate items for fiscal 2017, 2016 and 2015 included: Fiscal Year In Millions 2017 2016 2015 Net loss on mark-to-market valuation of commodity positions $(22.0) $ (69.1) $(163.7) Net loss on commodity positions reclassified from unallocated corporate items to segment operating profit 32.0 127.9 84.4 Net mark-to-market revaluation of certain grain inventories 3.9 4.0 (10.4) Net mark-to-market valuation of certain commodity positions recognized in unallocated corporate items $ 13.9 $ 62.8 $ (89.7)
As of May 28, 2017, the net notional value of commodity derivatives was $410.3 million, of which $289.6 million related to agricultural inputs and $120.7million related to energy inputs. These contracts relate to inputs that generally will be utilized within the next 12 months.
INTEREST RATE RISK
We are exposed to interest rate volatility with regard to future issuances of fixed-rate debt, and existing and future issuances of floating-rate debt. Primaryexposures include U.S. Treasury rates, LIBOR, Euribor, and commercial paper rates in the United States and Europe. We use interest rate swaps, forward-starting interest rate swaps, and treasury locks to hedge our exposure to interest rate changes, to reduce the volatility of our financing costs, and to achieve adesired proportion of fixed rate versus floating-rate debt, based on current and projected market conditions. Generally under these swaps, we agree with acounterparty to exchange the difference between fixed-rate and floating-rate interest amounts based on an agreed upon notional principal amount.
Floating Interest Rate Exposures — Floating-to-fixed interest rate swaps are accounted for as cash flow hedges, as are all hedges of forecasted issuances ofdebt. Effectiveness is assessed based on either the perfectly effective hypothetical derivative method or changes in the present value of interest payments onthe underlying debt. Effective gains and losses deferred to AOCI are reclassified into earnings over the life of the associated debt. Ineffective gains and lossesare recorded as net interest. The amount of hedge ineffectiveness was less than $1 million in each of fiscal 2017, 2016, and 2015.
66
Source: GENERAL MILLS INC, 10-K, June 29, 2017 Powered by Morningstar® Document Research℠The information contained herein may not be copied, adapted or distributed and is not warranted to be accurate, complete or timely. The user assumes all risks for any damages or losses arising from any use of this information,except to the extent such damages or losses cannot be limited or excluded by applicable law. Past financial performance is no guarantee of future results.

Table of Contents
Fixed Interest Rate Exposures — Fixed-to-floating interest rate swaps are accounted for as fair value hedges with effectiveness assessed based on changes inthe fair value of the underlying debt and derivatives, using incremental borrowing rates currently available on loans with similar terms and maturities.Ineffective gains and losses on these derivatives and the underlying hedged items are recorded as net interest. The amount of hedge ineffectiveness was a $4.3million gain in fiscal 2017, less than $1 million in fiscal 2016, and a $1.6 million gain in fiscal 2015.
In advance of planned debt financing, in the first quarter of fiscal 2017 and the third quarter of fiscal 2016, we entered into $100 million and $400 million,respectively, of treasury locks due February 15, 2017 with an average fixed rate of 2.0 percent. All of these treasury locks were cash settled for $17.2 millionduring the third quarter of fiscal 2017, concurrent with the issuance of our $750.0 million 10-year fixed-rate notes.
In fiscal 2015, we entered into swaps to convert $500.0 million of 1.4 percent fixed-rate notes due October 20, 2017, and $500.0 million of 2.2 percent fixed-rate notes due October 21, 2019, to floating rates.
As of May 28, 2017, the pre-tax amount of cash-settled interest rate hedge gain or loss remaining in AOCI, which will be reclassified to earnings over theremaining term of the related underlying debt, follows: In Millions Gain/(Loss) 5.65% notes due February 15, 2019 0.8 3.15% notes due December 15, 2021 (45.0) 1.0% notes due April 27, 2023 (1.4) 3.65% notes due February 15, 2024 12.0 3.2% notes due February 10, 2027 16.6 1.5% notes due April 27, 2027 (3.2) 5.4% notes due June 15, 2040 (12.9) 4.15% notes due February 15, 2043 10.1 Net pre-tax hedge loss in AOCI $ (23.0)
The following table summarizes the notional amounts and weighted-average interest rates of our interest rate derivatives. Average floating rates are based onrates as of the end of the reporting period.
In Millions May 28,
2017 May 29,
2016 Pay-floating swaps - notional amount $1,000.0 $1,000.0
Average receive rate 1.8% 1.8% Average pay rate 1.6% 1.1%
The swap contracts mature as follows: In Millions Pay Floating 2018 $ 500.0 2020 $ 500.0 Total $ 1,000.0
67
Source: GENERAL MILLS INC, 10-K, June 29, 2017 Powered by Morningstar® Document Research℠The information contained herein may not be copied, adapted or distributed and is not warranted to be accurate, complete or timely. The user assumes all risks for any damages or losses arising from any use of this information,except to the extent such damages or losses cannot be limited or excluded by applicable law. Past financial performance is no guarantee of future results.

Table of Contents
The following tables reconcile the net fair values of assets and liabilities subject to offsetting arrangements that are recorded in our Consolidated BalanceSheets to the net fair values that could be reported in our Consolidated Balance Sheets: May 28, 2017 Assets Liabilities
Gross Amounts NotOffset in the
Balance Sheet (e)
Gross Amounts NotOffset in the
Balance Sheet (e)
In Millions
GrossAmounts
ofRecognized
Assets
GrossLiabilitiesOffset in
theBalanceSheet (a)
NetAmountsof Assets
(b) Financial
Instruments
CashCollateralReceived
NetAmount
(c)
GrossAmounts
ofRecognizedLiabilities
GrossAssets
Offset inthe Balance
Sheet (a)
NetAmounts ofLiabilities
(b) Financial
Instruments
CashCollateralPledged
NetAmount
(d) Commodity contracts $11.5 $ — $ 11.5 $ (7.2) $ — $ 4.3 $(8.2) $ — $(8.2) $7.2 $ — $(1.0) Interest rate contracts 0.9 — 0.9 (0.5) — 0.4 (0.5) — (0.5) 0.5 — — Foreign exchange contracts 16.5 — 16.5 (7.2) — 9.3 (10.2) — (10.2) 7.2 — (3.0) Equity contracts 1.9 — 1.9 — — 1.9 — — — — — — Total $30.8 $ — $30.8 $(14.9) $ — $15.9 $(18.9) $ — $(18.9) $14.9 $— $(4.0)
(a) Includes related collateral offset in our Consolidated Balance Sheets.(b) Net fair value as recorded in our Consolidated Balance Sheets.(c) Fair value of assets that could be reported net in our Consolidated Balance Sheets.(d) Fair value of liabilities that could be reported net in our Consolidated Balance Sheets.(e) Fair value of assets and liabilities reported on a gross basis in our Consolidated Balance Sheets.
68
Source: GENERAL MILLS INC, 10-K, June 29, 2017 Powered by Morningstar® Document Research℠The information contained herein may not be copied, adapted or distributed and is not warranted to be accurate, complete or timely. The user assumes all risks for any damages or losses arising from any use of this information,except to the extent such damages or losses cannot be limited or excluded by applicable law. Past financial performance is no guarantee of future results.

Table of Contents
May 29, 2016 Assets Liabilities
Gross Amounts NotOffset in the
Balance Sheet (e)
Gross Amounts NotOffset in the
Balance Sheet (e)
In Millions
GrossAmounts
ofRecognized
Assets
GrossLiabilitiesOffset in
theBalanceSheet (a)
NetAmountsof Assets
(b) Financial
Instruments
CashCollateralReceived
NetAmount
(c)
GrossAmounts
ofRecognizedLiabilities
GrossAssets
Offset inthe
BalanceSheet (a)
NetAmounts
ofLiabilities
(b) Financial
Instruments
CashCollateral
Pledged
NetAmount
(d) Commodity contracts $ 4.4 $ — $ 4.4 $ (3.9) $ — $ 0.5 $ (22.2) $ — $ (22.2) $ 3.9 $ 7.5 $ (10.8) Interest rate contracts 8.5 — 8.5 — — 8.5 (3.0) — (3.0) — — (3.0) Foreign exchange contracts 25.4 — 25.4 (8.7) — 16.7 (13.7) — (13.7) 8.7 — (5.0) Equity contracts 2.4 — 2.4 — — 2.4 — — — — — — Total $ 40.7 $ — $ 40.7 $ (12.6) $ — $ 28.1 $ (38.9) $ — $ (38.9) $ 12.6 $ 7.5 $ (18.8)
(a) Includes related collateral offset in our Consolidated Balance Sheets.(b) Net fair value as recorded in our Consolidated Balance Sheets.(c) Fair value of assets that could be reported net in our Consolidated Balance Sheets.(d) Fair value of liabilities that could be reported net in our Consolidated Balance Sheets.(e) Fair value of assets and liabilities reported on a gross basis in our Consolidated Balance Sheets.
FOREIGN EXCHANGE RISK
Foreign currency fluctuations affect our net investments in foreign subsidiaries and foreign currency cash flows related to third party purchases, intercompanyloans, product shipments, and foreign-denominated debt. We are also exposed to the translation of foreign currency earnings to the U.S. dollar. Our principalexposures are to the Australian dollar, Brazilian real, British pound sterling, Canadian dollar, Chinese renminbi, euro, Japanese yen, Mexican peso, and Swissfranc. We primarily use foreign currency forward contracts to selectively hedge our foreign currency cash flow exposures. We also generally swap our foreign-denominated commercial paper borrowings and nonfunctional currency intercompany loans back to U.S. dollars or the functional currency of the entity withforeign exchange exposure. The gains or losses on these derivatives offset the foreign currency revaluation gains or losses recorded in earnings on theassociated borrowings. We generally do not hedge more than 18 months in advance.
As of May 28, 2017, the net notional value of foreign exchange derivatives was $850.2 million. The amount of hedge ineffectiveness was less than $1million in each of fiscal 2017, 2016, and 2015.
We also have many net investments in foreign subsidiaries that are denominated in euros. We previously hedged a portion of these net investments byissuing euro-denominated commercial paper and foreign exchange forward contracts. As of May 28, 2017, we hedged a portion of these net investments with€2,200 million of euro denominated bonds. As of May 28, 2017, we had deferred net foreign currency transaction losses of $39.1 million in AOCI associatedwith net investment hedging activity.
Venezuela is a highly inflationary economy and as such, we remeasured the value of the assets and liabilities of our former Venezuelan subsidiary based onthe exchange rate at which we expected to remit dividends in U.S. dollars from the SIMADI market. In fiscal 2015, we recorded an $8 million foreignexchange loss. In the fourth quarter of fiscal 2016, we sold our General Mills de Venezuela CA subsidiary to a third party and exited our business inVenezuela.
EQUITY INSTRUMENTS
Equity price movements affect our compensation expense as certain investments made by our employees in our deferred compensation plan are revalued. Weuse equity swaps to manage this risk. As of May 28, 2017, the net notional amount of our equity swaps was $138.9 million. These swap contracts mature infiscal 2018.
69
Source: GENERAL MILLS INC, 10-K, June 29, 2017 Powered by Morningstar® Document Research℠The information contained herein may not be copied, adapted or distributed and is not warranted to be accurate, complete or timely. The user assumes all risks for any damages or losses arising from any use of this information,except to the extent such damages or losses cannot be limited or excluded by applicable law. Past financial performance is no guarantee of future results.

Table of Contents
FAIR VALUE MEASUREMENTS AND FINANCIAL STATEMENT PRESENTATION
The fair values of our assets, liabilities, and derivative positions recorded at fair value and their respective levels in the fair value hierarchy as of May 28,2017 and May 29, 2016, were as follows: May 28, 2017 May 28, 2017 Fair Values of Assets Fair Values of Liabilities In Millions Level 1 Level 2 Level 3 Total Level 1 Level 2 Level 3 Total Derivatives designated as hedging instruments:
Interest rate contracts (a) (b) $ — $ 0.7 $ — $ 0.7 $ — $ (0.4) $ — $ (0.4) Foreign exchange contracts (c) (d) — 16.3 — 16.3 — (3.6) — (3.6)
Total — 17.0 — 17.0 — (4.0) — (4.0) Derivatives not designated as hedging instruments:
Foreign exchange contracts (c) (d) — 0.2 — 0.2 — (6.6) — (6.6) Commodity contracts (c) (e) 4.1 7.4 — 11.5 (3.4) (4.8) — (8.2) Grain contracts (c) (e) — 2.7 — 2.7 — (5.6) — (5.6)
Total 4.1 10.3 — 14.4 (3.4) (17.0) — (20.4) Other assets and liabilities reported at fair value:
Marketable investments (a) (f) 9.9 265.5 — 275.4 — — — — Long-lived assets (g) — 43.7 — 43.7 — — — —
Total 9.9 309.2 — 319.1 — — — — Total assets, liabilities, and derivative positions recorded at fair
value $ 14.0 $ 336.5 $ — $350.5 $ (3.4) $ (21.0) $ — $(24.4) (a) These contracts and investments are recorded as prepaid expenses and other current assets, other assets, other current liabilities or other liabilities, as
appropriate, based on whether in a gain or loss position. Certain marketable investments are recorded as cash and cash equivalents.(b) Based on LIBOR and swap rates.(c) These contracts are recorded as prepaid expenses and other current assets, other assets, other current liabilities, or other liabilities, as appropriate, based
on whether in a gain or loss position.(d) Based on observable market transactions of spot currency rates and forward currency prices.(e) Based on prices of futures exchanges and recently reported transactions in the marketplace.(f) Based on prices of common stock and bond matrix pricing.(g) We recorded $47.4 million in non-cash impairment charges in fiscal 2017 to write down certain long-lived assets to their fair value. Fair value was
based on recently reported transactions for similar assets in the marketplace. These assets had a carrying value of $91.1 million and were associatedwith the restructuring actions described in Note 4.
70
Source: GENERAL MILLS INC, 10-K, June 29, 2017 Powered by Morningstar® Document Research℠The information contained herein may not be copied, adapted or distributed and is not warranted to be accurate, complete or timely. The user assumes all risks for any damages or losses arising from any use of this information,except to the extent such damages or losses cannot be limited or excluded by applicable law. Past financial performance is no guarantee of future results.

Table of Contents
May 29, 2016 May 29, 2016 Fair Values of Assets Fair Values of Liabilities In Millions Level 1 Level 2 Level 3 Total Level 1 Level 2 Level 3 Total Derivatives designated as hedging instruments:
Interest rate contracts (a) (b) $ — $ 7.7 $ — $ 7.7 $ — $ (3.0) $ — $ (3.0) Foreign exchange contracts (c) (d) — 12.2 — 12.2 — (12.2) — (12.2)
Total — 19.9 — 19.9 — (15.2) — (15.2) Derivatives not designated as hedging instruments:
Foreign exchange contracts (c) (d) — 13.2 — 13.2 — (1.5) — (1.5) Commodity contracts (c) (e) 2.6 1.7 — 4.3 (0.6) (21.6) — (22.2) Grain contracts (c) (e) — 1.8 — 1.8 — (5.5) — (5.5)
Total 2.6 16.7 — 19.3 (0.6) (28.6) — (29.2) Other assets and liabilities reported at fair value:
Marketable investments (a) (f) 8.4 165.8 — 174.2 — — — — Long-lived assets (g) — 26.0 — 26.0 — — — —
Total 8.4 191.8 — 200.2 — — — — Total assets, liabilities, and derivative positions recorded at fair
value $ 11.0 $ 228.4 $ — $239.4 $ (0.6) $ (43.8) $ — $(44.4) (a) These contracts and investments are recorded as prepaid expenses and other current assets, other assets, other current liabilities or other liabilities, as
appropriate, based on whether in a gain or loss position. Certain marketable investments are recorded as cash and cash equivalents.(b) Based on LIBOR and swap rates.(c) These contracts are recorded as prepaid expenses and other current assets or as other current liabilities, as appropriate, based on whether in a gain or
loss position.(d) Based on observable market transactions of spot currency rates and forward currency prices.(e) Based on prices of futures exchanges and recently reported transactions in the marketplace.(f) Based on prices of common stock and bond matrix pricing.(g) We recorded $11.4 million in non-cash impairment charges in fiscal 2016 to write down certain long-lived assets to their fair value. Fair value was
based on recently reported transactions for similar assets in the marketplace. These assets had a carrying value of $28.2 million and were associatedwith the restructuring actions described in Note 4.
We did not significantly change our valuation techniques from prior periods.
71
Source: GENERAL MILLS INC, 10-K, June 29, 2017 Powered by Morningstar® Document Research℠The information contained herein may not be copied, adapted or distributed and is not warranted to be accurate, complete or timely. The user assumes all risks for any damages or losses arising from any use of this information,except to the extent such damages or losses cannot be limited or excluded by applicable law. Past financial performance is no guarantee of future results.

Table of Contents
Information related to our cash flow hedges, fair value hedges, and other derivatives not designated as hedging instruments for the fiscal years ended May 28,2017 and May 29, 2016, follows:
Interest Rate
Contracts Foreign Exchange
Contracts Equity
Contracts CommodityContracts Total
Fiscal Year Fiscal Year Fiscal Year Fiscal Year Fiscal Year In Millions 2017 2016 2017 2016 2017 2016 2017 2016 2017 2016 Derivatives in Cash Flow Hedging Relationships:
Amount of gain (loss) recognized in other comprehensive income (OCI)(a) $24.0 $ (2.6) $ 46.3 $ 21.2 $ — $ — $ — $ — $70.3 $ 18.6
Amount of net gain (loss) reclassified from AOCI into earnings (a) (b) (5.0) (10.6) 33.8 22.1 — — — — 28.8 11.5 Amount of net gain (loss) recognized in earnings (c) 0.1 (0.1) 0.6 (0.7) — — — — 0.7 (0.8)
Derivatives in Fair Value Hedging Relationships: Amount of net gain recognized in earnings (d) 4.3 0.1 — — — — — — 4.3 0.1
Derivatives in Net Investment Hedging Relationships: Amount of loss recognized in OCI (a) — — — (0.2) — — — — — (0.2)
Derivatives Not Designated as Hedging Instruments: Amount of net gain (loss) recognized in earnings (d) — — 7.6 1.1 17.8 (4.5) (16.2) (56.1) 9.2 (59.5)
(a) Effective portion.(b) Gain (loss) reclassified from AOCI into earnings is reported in interest, net for interest rate swaps and in cost of sales and SG&A expenses for foreign
exchange contracts.(c) Gain (loss) recognized in earnings is related to the ineffective portion of the hedging relationship, including SG&A expenses for foreign exchange
contracts and interest, net for interest rate contracts. No amounts were reported as a result of being excluded from the assessment of hedge effectiveness.(d) Gain (loss) recognized in earnings is reported in interest, net for interest rate contracts, in cost of sales for commodity contracts, and in SG&A expenses
for equity contracts and foreign exchange contracts.
AMOUNTS RECORDED IN ACCUMULATED OTHER COMPREHENSIVE LOSS
As of May 28, 2017, the after-tax amounts of unrealized gains and losses in AOCI related to hedge derivatives follows: In Millions After-Tax Gain/(Loss) Unrealized losses from interest rate cash flow hedges $(12.9) Unrealized gains from foreign currency cash flow hedges 14.4 After-tax gain in AOCI related to hedge derivatives $1.5
The net amount of pre-tax gains and losses in AOCI as of May 28, 2017 that we expect to be reclassified into net earnings within the next 12 months is $11.7million of gain.
CREDIT-RISK-RELATED CONTINGENT FEATURES
Certain of our derivative instruments contain provisions that require us to maintain an investment grade credit rating on our debt from each of the majorcredit rating agencies. If our debt were to fall below investment grade, the counterparties to the derivative instruments could request full collateralization onderivative instruments in net liability positions. The aggregate fair value of all derivative instruments with credit-risk-related contingent features that were ina liability position on May 28, 2017, was $1.0 million. We have posted no collateral under these contracts. If the credit-risk-related contingent featuresunderlying these agreements had been triggered on May 28, 2017, we would have been required to post $1.0 million of collateral to counterparties.
72
Source: GENERAL MILLS INC, 10-K, June 29, 2017 Powered by Morningstar® Document Research℠The information contained herein may not be copied, adapted or distributed and is not warranted to be accurate, complete or timely. The user assumes all risks for any damages or losses arising from any use of this information,except to the extent such damages or losses cannot be limited or excluded by applicable law. Past financial performance is no guarantee of future results.
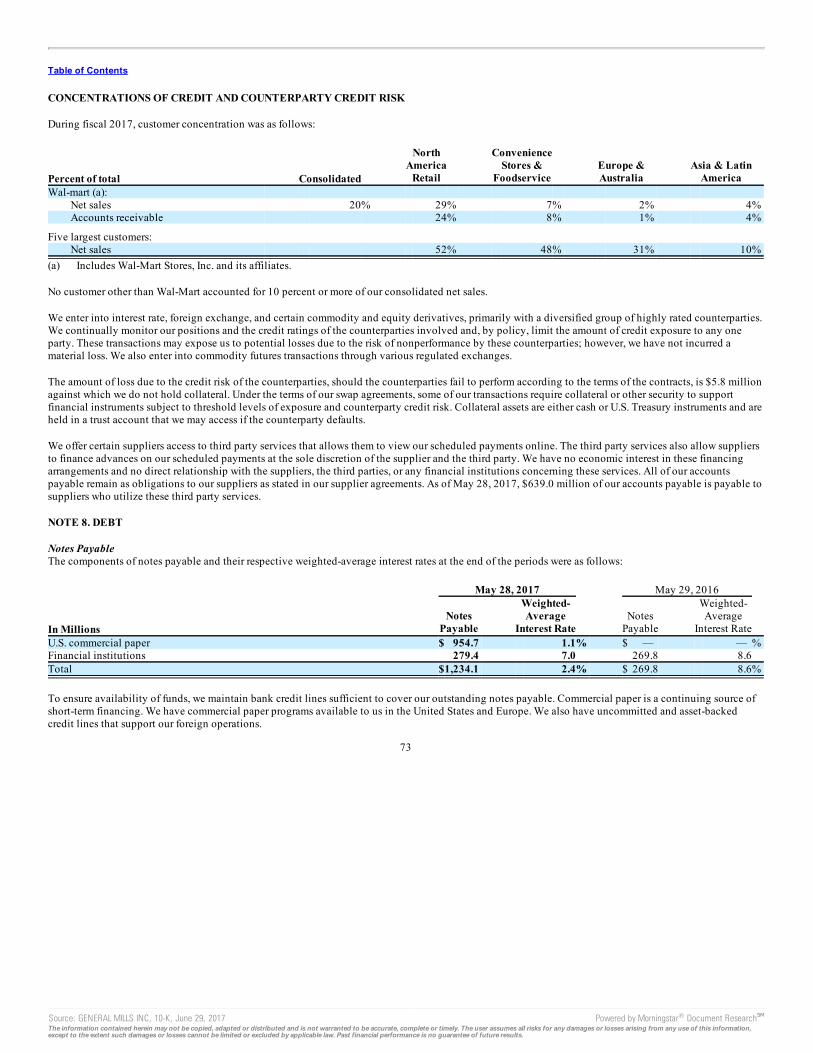
Table of Contents
CONCENTRATIONS OF CREDIT AND COUNTERPARTY CREDIT RISK
During fiscal 2017, customer concentration was as follows:
Percent of total Consolidated
NorthAmerica
Retail
ConvenienceStores &
Foodservice Europe &Australia
Asia & LatinAmerica
Wal-mart (a): Net sales 20% 29% 7% 2% 4% Accounts receivable 24% 8% 1% 4%
Five largest customers: Net sales 52% 48% 31% 10%
(a) Includes Wal-Mart Stores, Inc. and its affiliates.
No customer other than Wal-Mart accounted for 10 percent or more of our consolidated net sales.
We enter into interest rate, foreign exchange, and certain commodity and equity derivatives, primarily with a diversified group of highly rated counterparties.We continually monitor our positions and the credit ratings of the counterparties involved and, by policy, limit the amount of credit exposure to any oneparty. These transactions may expose us to potential losses due to the risk of nonperformance by these counterparties; however, we have not incurred amaterial loss. We also enter into commodity futures transactions through various regulated exchanges.
The amount of loss due to the credit risk of the counterparties, should the counterparties fail to perform according to the terms of the contracts, is $5.8 millionagainst which we do not hold collateral. Under the terms of our swap agreements, some of our transactions require collateral or other security to supportfinancial instruments subject to threshold levels of exposure and counterparty credit risk. Collateral assets are either cash or U.S. Treasury instruments and areheld in a trust account that we may access if the counterparty defaults.
We offer certain suppliers access to third party services that allows them to view our scheduled payments online. The third party services also allow suppliersto finance advances on our scheduled payments at the sole discretion of the supplier and the third party. We have no economic interest in these financingarrangements and no direct relationship with the suppliers, the third parties, or any financial institutions concerning these services. All of our accountspayable remain as obligations to our suppliers as stated in our supplier agreements. As of May 28, 2017, $639.0 million of our accounts payable is payable tosuppliers who utilize these third party services.
NOTE 8. DEBT
Notes PayableThe components of notes payable and their respective weighted-average interest rates at the end of the periods were as follows: May 28, 2017 May 29, 2016
In Millions Notes
Payable
Weighted-Average
Interest Rate Notes
Payable
Weighted-Average
Interest Rate U.S. commercial paper $ 954.7 1.1% $ — — % Financial institutions 279.4 7.0 269.8 8.6 Total $1,234.1 2.4% $ 269.8 8.6%
To ensure availability of funds, we maintain bank credit lines sufficient to cover our outstanding notes payable. Commercial paper is a continuing source ofshort-term financing. We have commercial paper programs available to us in the United States and Europe. We also have uncommitted and asset-backedcredit lines that support our foreign operations.
73
Source: GENERAL MILLS INC, 10-K, June 29, 2017 Powered by Morningstar® Document Research℠The information contained herein may not be copied, adapted or distributed and is not warranted to be accurate, complete or timely. The user assumes all risks for any damages or losses arising from any use of this information,except to the extent such damages or losses cannot be limited or excluded by applicable law. Past financial performance is no guarantee of future results.

Table of Contents
The following table details the fee-paid committed and uncommitted credit lines we had available as of May 28, 2017:
In Billions FacilityAmount
BorrowedAmount
Credit facility expiring: May 2022 $ 2.7 $ — June 2019 0.2 0.1
Total committed credit facilities 2.9 0.1 Uncommitted credit facilities 0.5 0.1 Total committed and uncommitted credit facilities $ 3.4 $ 0.2
In fiscal 2016, we entered into a $2.7 billion fee-paid committed credit facility that was originally scheduled to expire in May 2021. In fiscal 2017, weamended the credit facility’s expiration date by one year to May 2022.
The credit facilities contain covenants, including a requirement to maintain a fixed charge coverage ratio of at least 2.5 times. We were in compliance with allcredit facility covenants as of May 28, 2017.
Long-Term DebtIn March 2017, we issued €300.0 million principal amount of floating-rate notes due March 20, 2019. Interest on the notes is payable quarterly in arrears. Thenotes are not generally redeemable prior to maturity. These notes are senior unsecured obligations that include a change of control repurchase provision. Thenet proceeds were used to repay a portion of our outstanding commercial paper.
In February 2017, we repaid $1.0 billion of 5.7 percent fixed-rate notes.
In January 2017, we issued $750.0 million principal amount of 3.2 percent fixed-rate notes due February 10, 2027. Interest on the notes is payable semi-annually in arrears. We may redeem the notes in whole or in part at any time at the applicable redemption price. The notes are senior unsecured obligationsthat include a change of control repurchase provision. The net proceeds were used to repay a portion of our maturing long-term debt.
In January 2016, we issued €500.0 million principal amount of floating-rate notes due January 15, 2020. Interest on the notes are payable quarterly in arrears.The notes are not generally redeemable prior to maturity. These notes are senior unsecured obligations that include a change of control repurchase provision.The net proceeds were used to repay a portion of our maturing long-term debt.
In January 2016, we repaid $250 million of 0.875 percent fixed-rate notes and $750 million of floating-rate notes.
In April 2015, we issued €500.0 million principal amount of 1.0 percent fixed-rate notes due April 27, 2023 and €400.0 million principal amount of 1.5percent fixed-rate notes due April 27, 2027. Interest on the notes is payable annually in arrears. The notes may be redeemed in whole or in part at our optionat any time at the applicable redemption price. These notes are senior unsecured obligations that include a change of control repurchase provision. The netproceeds were used for general corporate purposes and to reduce our commercial paper borrowings.
In March 2015, we repaid $750.0 million of 5.2 percent fixed-rate notes.
74
Source: GENERAL MILLS INC, 10-K, June 29, 2017 Powered by Morningstar® Document Research℠The information contained herein may not be copied, adapted or distributed and is not warranted to be accurate, complete or timely. The user assumes all risks for any damages or losses arising from any use of this information,except to the extent such damages or losses cannot be limited or excluded by applicable law. Past financial performance is no guarantee of future results.

Table of Contents
A summary of our long-term debt is as follows:
In Millions May 28,
2017 May 29,
2016 5.65% notes due February 15, 2019 $1,150.0 $ 1,150.0 5.7% notes due February 15, 2017 — 1,000.0 3.15% notes due December 15, 2021 1,000.0 1,000.0 3.2% notes due February 10, 2027 750.0 — Euro-denominated 2.1% notes due November 16, 2020 559.2 555.8 Euro-denominated 1.0% notes due April 27, 2023 559.2 555.8 Euro-denominated floating-rate notes due January 15, 2020 559.2 555.8 1.4% notes due October 20, 2017 500.0 500.0 5.4% notes due June 15, 2040 500.0 500.0 4.15% notes due February 15, 2043 500.0 500.0 3.65% notes due February 15, 2024 500.0 500.0 2.2% notes due October 21, 2019 500.0 500.0 Euro-denominated 1.5% notes due April 27, 2027 447.3 444.6 Euro-denominated floating-rate notes due March 20, 2019 335.5 — Euro-denominated 2.2% notes due June 24, 2021 222.8 221.0 Medium-term notes, 0.02% to 6.59%, due fiscal 2018 or later 204.2 204.2 Other, including debt issuance costs and capital leases (39.8) (26.1)
8,247.6 8,161.1 Less amount due within one year (604.7) (1,103.4) Total long-term debt $7,642.9 $ 7,057.7
Principal payments due on long-term debt in the next five years based on stated contractual maturities, our intent to redeem, or put rights of certain noteholders are $604.7 million in fiscal 2018, $1,585.9 million in fiscal 2019, $1,062.5 million in fiscal 2020, $559.4 million in fiscal 2021, and $1,001.1million in fiscal 2022.
Certain of our long-term debt agreements contain restrictive covenants. As of May 28, 2017, we were in compliance with all of these covenants.
As of May 28, 2017, the $23.0 million pre-tax loss recorded in AOCI associated with our previously designated interest rate swaps will be reclassified to netinterest over the remaining lives of the hedged transactions. The amount expected to be reclassified from AOCI to net interest in fiscal 2018 is a $6.7 millionpre-tax loss.
NOTE 9. REDEEMABLE AND NONCONTROLLING INTERESTS
Our principal redeemable and noncontrolling interests relate to our Yoplait SAS, Yoplait Marques SNC, Liberté Marques Sàrl, and General Mills Cereals,LLC (GMC) subsidiaries. In addition, we have four foreign subsidiaries that have noncontrolling interests totaling $8.5 million as of May 28, 2017.
We have a 51 percent controlling interest in Yoplait SAS and a 50 percent interest in Yoplait Marques SNC and Liberté Marques Sàrl. Sodiaal holds theremaining interests in each of the entities. On the acquisition date, we recorded the $904.4 million fair value of Sodiaal’s 49 percent euro-denominatedinterest in Yoplait SAS as a redeemable interest on our Consolidated Balance Sheets. Sodiaal has the ability to put all or a portion of its redeemable interestto us at fair value once per year, up to three times before December 2024. We adjust the value of the redeemable interest through additional paid-in capital onour Consolidated Balance Sheets quarterly to the redeemable interest’s redemption value, which approximates its fair value. Yoplait SAS pays dividendsannually if it meets certain financial metrics set forth in its shareholders agreement. As of May 28, 2017, the redemption value of the euro-denominatedredeemable interest was $910.9 million.
On the acquisition dates, we recorded the $281.4 million fair value of Sodiaal’s 50 percent euro-denominated interest in Yoplait Marques SNC and 50percent Canadian dollar-denominated interest in Liberté Marques Sàrl as noncontrolling interests on our Consolidated Balance Sheets. Yoplait Marques SNCearns a royalty stream through a licensing agreement with Yoplait SAS for the rights to Yoplait and related trademarks. Liberté Marques Sàrl earns a royaltystream through licensing agreements with certain Yoplait group companies for the rights to Liberté and related trademarks. These entities pay dividendsannually based on their available cash as of their fiscal year end.
75
Source: GENERAL MILLS INC, 10-K, June 29, 2017 Powered by Morningstar® Document Research℠The information contained herein may not be copied, adapted or distributed and is not warranted to be accurate, complete or timely. The user assumes all risks for any damages or losses arising from any use of this information,except to the extent such damages or losses cannot be limited or excluded by applicable law. Past financial performance is no guarantee of future results.

Table of Contents
We paid dividends of $48.6 million in fiscal 2017, and $74.5 million in fiscal 2016, to Sodiaal under the terms of the Yoplait SAS and Yoplait Marques SNCshareholder agreements.
A subsidiary of Yoplait SAS has entered into an exclusive milk supply agreement for its European operations with Sodiaal at market-determined pricesthrough July 1, 2021. Net purchases totaled $186.4 million for fiscal 2017 and $321.0 million for fiscal 2016.
The holder of the GMC Class A Interests receives quarterly preferred distributions from available net income based on the application of a floating preferredreturn rate to the holder’s capital account balance established in the most recent mark-to-market valuation (currently $251.5 million). On June 1, 2015, thefloating preferred return rate on GMC’s Class A interests was reset to the sum of three-month LIBOR plus 125 basis points. The preferred return rate isadjusted every three years through a negotiated agreement with the Class A Interest holder or through a remarketing auction.
For financial reporting purposes, the assets, liabilities, results of operations, and cash flows of our non-wholly owned subsidiaries are included in ourConsolidated Financial Statements. The third-party investor’s share of the net earnings of these subsidiaries is reflected in net earnings attributable toredeemable and noncontrolling interests in our Consolidated Statements of Earnings.
Our noncontrolling interests contain restrictive covenants. As of May 28, 2017, we were in compliance with all of these covenants.
NOTE 10. STOCKHOLDERS’ EQUITY
Cumulative preference stock of 5.0 million shares, without par value, is authorized but unissued.
On May 6, 2014, our Board of Directors authorized the repurchase of up to 100 million shares of our common stock. Purchases under the authorization can bemade in the open market or in privately negotiated transactions, including the use of call options and other derivative instruments, Rule 10b5-1 tradingplans, and accelerated repurchase programs. The authorization has no specified termination date.
Share repurchases were as follows: Fiscal Year In Millions 2017 2016 2015 Shares of common stock 25.4 10.7 22.3 Aggregate purchase price $1,651.5 $606.7 $1,161.9
76
Source: GENERAL MILLS INC, 10-K, June 29, 2017 Powered by Morningstar® Document Research℠The information contained herein may not be copied, adapted or distributed and is not warranted to be accurate, complete or timely. The user assumes all risks for any damages or losses arising from any use of this information,except to the extent such damages or losses cannot be limited or excluded by applicable law. Past financial performance is no guarantee of future results.

Table of Contents
The following table provides details of total comprehensive income (loss): Fiscal 2017
General Mills Noncontrolling
Interests Redeemable
Interest In Millions Pretax Tax Net Net Net Net earnings, including earnings attributable to redeemable and
noncontrolling interests $ 1,657.5 $ 11.3 $ 32.3 Other comprehensive income (loss):
Foreign currency translation $ 19.5 $ — 19.5 2.5 (15.7) Net actuarial income 307.3 (109.4) 197.9 — —
Other fair value changes: Securities 1.3 (0.5) 0.8 — — Hedge derivatives 65.9 (16.1) 49.8 — 3.5
Reclassification to earnings: Hedge derivatives (a) (25.2) 2.4 (22.8) — (2.9) Amortization of losses and prior service costs (b) 197.2 (74.7) 122.5 — —
Other comprehensive income (loss) 566.0 (198.3) 367.7 2.5 (15.1) Total comprehensive income $ 2,025.2 $13.8 $17.2 (a) Gain reclassified from AOCI into earnings is reported in interest, net for interest rate swaps and in cost of sales and SG&A expenses for foreign
exchange contracts.(b) Loss reclassified from AOCI into earnings is reported in SG&A expenses. Fiscal 2016
General Mills Noncontrolling
Interests Redeemable
Interest In Millions Pretax Tax Net Net Net Net earnings, including earnings attributable to redeemable and
noncontrolling interests $1,697.4 $ 8.4 $31.0 Other comprehensive Income (loss):
Foreign currency translation $(107.6) $ — (107.6) 2.8 (3.9) Net actuarial loss (514.2) 188.3 (325.9) — —
Other fair value changes: Securities 0.2 (0.1) 0.1 — — Hedge derivatives 16.5 (2.2) 14.3 — 1.7
Reclassification to earnings: Hedge derivatives (a) (13.5) 2.5 (11.0) — 1.5 Amortization of losses and prior service costs (b) 206.8 (78.2) 128.6 — —
Other comprehensive income (loss) (411.8) 110.3 (301.5) 2.8 (0.7) Total comprehensive income $1,395.9 $11.2 $30.3 (a) Gain reclassified from AOCI into earnings is reported in interest, net for interest rate swaps and in cost of sales and SG&A expenses for foreign
exchange contracts.(b) Loss reclassified from AOCI into earnings is reported in SG&A expenses.
77
Source: GENERAL MILLS INC, 10-K, June 29, 2017 Powered by Morningstar® Document Research℠The information contained herein may not be copied, adapted or distributed and is not warranted to be accurate, complete or timely. The user assumes all risks for any damages or losses arising from any use of this information,except to the extent such damages or losses cannot be limited or excluded by applicable law. Past financial performance is no guarantee of future results.

Table of Contents
Fiscal 2015
General Mills Noncontrolling
Interests Redeemable
Interest In Millions Pretax Tax Net Net Net Net earnings, including earnings attributable to redeemable and
noncontrolling interests $1,221.3 $ 8.2 $29.9 Other comprehensive income (loss):
Foreign currency translation $(727.9) $ — (727.9) (78.2) (151.8) Net actuarial loss (561.1) 202.7 (358.4) — —
Other fair value changes: Securities 1.3 (0.5) 0.8 — — Hedge derivatives 13.6 (4.8) 8.8 — (4.7)
Reclassification to earnings: Hedge derivatives (a) 0.7 0.5 1.2 — 3.7 Amortization of losses and prior service costs (b) 170.2 (65.1) 105.1 — —
Other comprehensive loss (1,103.2) 132.8 (970.4) (78.2) (152.8) Total comprehensive income (loss) $250.9 $(70.0) $(122.9) (a) Loss reclassified from AOCI into earnings is reported in interest, net for interest rate swaps and in cost of sales and SG&A expenses for foreign
exchange contracts.(b) Loss reclassified from AOCI into earnings is reported in SG&A expenses.
In fiscal 2017, 2016, and 2015, except for reclassifications to earnings, changes in other comprehensive income (loss) were primarily non-cash items.
Accumulated other comprehensive loss balances, net of tax effects, were as follows: In Millions 2017 2016 Foreign currency translation adjustments $ (624.7) $ (644.2) Unrealized gain (loss) from:
Securities 4.6 3.8 Hedge derivatives 1.5 (25.5)
Pension, other postretirement, and postemployment benefits: Net actuarial loss (1,645.4) (1,958.2) Prior service credits 19.5 11.9
Accumulated other comprehensive loss $(2,244.5) $(2,612.2)
NOTE 11. STOCK PLANS
We use broad-based stock plans to help ensure that management’s interests are aligned with those of our shareholders. As of May 28, 2017, a total of20.3 million shares were available for grant in the form of stock options, restricted stock, restricted stock units, and shares of unrestricted stock under the2011 Stock Compensation Plan (2011 Plan) and the 2016 Compensation Plan for Non-Employee Directors. The 2011 Plan also provides for the issuance ofcash-settled share-based units, stock appreciation rights, and performance-based stock awards. Stock-based awards now outstanding include some grantedunder the 2005, 2006, 2007 and 2009 stock plans and the 2011 compensation plan for non-employee directors, under which no further awards may begranted. The stock plans provide for potential accelerated vesting of awards upon retirement, termination, or death of eligible employees and directors.
78
Source: GENERAL MILLS INC, 10-K, June 29, 2017 Powered by Morningstar® Document Research℠The information contained herein may not be copied, adapted or distributed and is not warranted to be accurate, complete or timely. The user assumes all risks for any damages or losses arising from any use of this information,except to the extent such damages or losses cannot be limited or excluded by applicable law. Past financial performance is no guarantee of future results.

Table of Contents
Stock OptionsThe estimated fair values of stock options granted and the assumptions used for the Black-Scholes option-pricing model were as follows: Fiscal Year 2017 2016 2015 Estimated fair values of stock options granted $ 8.80 $ 7.24 $ 7.22 Assumptions:
Risk-free interest rate 1.7% 2.4% 2.6% Expected term 8.5 years 8.5 years 8.5 years Expected volatility 17.8% 17.6% 17.5% Dividend yield 2.9% 3.2% 3.1%
We estimate the fair value of each option on the grant date using a Black-Scholes option-pricing model, which requires us to make predictive assumptionsregarding future stock price volatility, employee exercise behavior, dividend yield, and the forfeiture rate. We estimate our future stock price volatility usingthe historical volatility over the expected term of the option, excluding time periods of volatility we believe a marketplace participant would exclude inestimating our stock price volatility. We also have considered, but did not use, implied volatility in our estimate, because trading activity in options on ourstock, especially those with tenors of greater than 6 months, is insufficient to provide a reliable measure of expected volatility.
Our expected term represents the period of time that options granted are expected to be outstanding based on historical data to estimate option exercises andemployee terminations within the valuation model. Separate groups of employees have similar historical exercise behavior and therefore were aggregatedinto a single pool for valuation purposes. The weighted-average expected term for all employee groups is presented in the table above. The risk-free interestrate for periods during the expected term of the options is based on the U.S. Treasury zero-coupon yield curve in effect at the time of grant.
Any corporate income tax benefit realized upon exercise or vesting of an award in excess of that previously recognized in earnings (referred to as a windfalltax benefit) is presented in our Consolidated Statements of Cash Flows as a financing cash flow.
Realized windfall tax benefits are credited to additional paid-in capital within our Consolidated Balance Sheets. Realized shortfall tax benefits (amountswhich are less than that previously recognized in earnings) are first offset against the cumulative balance of windfall tax benefits, if any, and then chargeddirectly to income tax expense, potentially resulting in volatility in our consolidated effective income tax rate. We calculated a cumulative memo balance ofwindfall tax benefits for the purpose of accounting for future shortfall tax benefits.
Options may be priced at 100 percent or more of the fair market value on the date of grant, and generally vest four years after the date of grant. Optionsgenerally expire within 10 years and one month after the date of grant.
79
Source: GENERAL MILLS INC, 10-K, June 29, 2017 Powered by Morningstar® Document Research℠The information contained herein may not be copied, adapted or distributed and is not warranted to be accurate, complete or timely. The user assumes all risks for any damages or losses arising from any use of this information,except to the extent such damages or losses cannot be limited or excluded by applicable law. Past financial performance is no guarantee of future results.

Table of Contents
Information on stock option activity follows:
OptionsExercisable(Thousands)
Weighted-AverageExercisePrice Per
Share
OptionsOutstanding(Thousands)
Weighted-AverageExercisePrice Per
Share Balance as of May 25, 2014 29,452.8 $ 28.37 44,169.0 $ 32.10
Granted 2,253.1 53.70 Exercised (7,297.2) 26.68 Forfeited or expired (47.7) 43.73
Balance as of May 31, 2015 26,991.5 $ 30.44 39,077.2 $ 34.35 Granted 1,930.2 55.72 Exercised (8,471.0) 28.49 Forfeited or expired (134.8) 48.16
Balance as of May 29, 2016 22,385.1 $ 32.38 32,401.6 $ 37.09 Granted 2,446.0 66.52 Exercised (4,904.9) 30.76 Forfeited or expired (108.3) 57.52
Balance as of May 28, 2017 20,899.2 $ 33.83 29,834.4 $ 40.47
Stock-based compensation expense related to stock option awards was $18.0 million in fiscal 2017, $14.8 million in fiscal 2016, and $18.1 million in fiscal2015. Compensation expense related to stock-based payments recognized in our Consolidated Statements of Earnings includes amounts recognized inrestructuring, impairment, and other exit costs for fiscal 2017, 2016 and 2015.
Net cash proceeds from the exercise of stock options less shares used for minimum withholding taxes and the intrinsic value of options exercised were asfollows: Fiscal Year In Millions 2017 2016 2015 Net cash proceeds $112.6 $171.9 $163.7 Intrinsic value of options exercised $176.5 $268.4 $201.9
Restricted Stock, Restricted Stock Units, and Performance Share UnitsStock and units settled in stock subject to a restricted period and a purchase price, if any (as determined by the Compensation Committee of the Board ofDirectors), may be granted to key employees under the 2011 Plan. Restricted stock and restricted stock units generally vest and become unrestricted fouryears after the date of grant. Performance share units are earned based on our future achievement of three-year goals for average organic net sales growth andcumulative free cash flow. Performance share units are settled in common stock and are generally subject to a three year performance and vesting period. Thesale or transfer of these awards is restricted during the vesting period. Participants holding restricted stock, but not restricted stock units or performance shareunits, are entitled to vote on matters submitted to holders of common stock for a vote. These awards accumulate dividends from the date of grant, butparticipants only receive payment if the awards vest.
80
Source: GENERAL MILLS INC, 10-K, June 29, 2017 Powered by Morningstar® Document Research℠The information contained herein may not be copied, adapted or distributed and is not warranted to be accurate, complete or timely. The user assumes all risks for any damages or losses arising from any use of this information,except to the extent such damages or losses cannot be limited or excluded by applicable law. Past financial performance is no guarantee of future results.

Table of Contents
Information on restricted stock unit and performance share units activity follows: Equity Classified Liability Classified
Share-SettledUnits
(Thousands)
Weighted-Average
Grant-DateFair Value
Share-SettledUnits
(Thousands)
Weighted-Average
Grant-DateFair Value
Non-vested as of May 29, 2016 5,100.4 $ 48.60 211.4 $ 48.37 Granted 1,418.7 67.02 43.6 66.75 Vested (1,710.3) 42.50 (119.8) 41.21 Forfeited, expired, or reclassified (317.6) 57.96 (11.9) 57.76
Non-vested as of May 28, 2017 4,491.2 $ 56.08 123.3 $ 56.93
Fiscal Year 2017 2016 2015 Number of units granted (thousands) 1,462.3 1,351.5 1,708.2 Weighted average price per unit $ 67.01 $ 56.00 $ 53.45
The total grant-date fair value of restricted stock unit awards that vested was $78.1 million in fiscal 2017 and $101.8 million in fiscal 2016.
As of May 28, 2017, unrecognized compensation expense related to non-vested stock options, restricted stock units, and performance share units was $98.1million. This expense will be recognized over 18 months, on average.
Stock-based compensation expense related to restricted stock units and performance share units was $77.9 million for fiscal 2017, $76.8 million for fiscal2016, and $96.6 million for fiscal 2015. Compensation expense related to stock-based payments recognized in our Consolidated Statements of Earningsincludes amounts recognized in restructuring, impairment, and other exit costs for fiscal 2017, 2016 and 2015.
NOTE 12. EARNINGS PER SHARE
Basic and diluted EPS were calculated using the following: Fiscal Year In Millions, Except per Share Data 2017 2016 2015 Net earnings attributable to General Mills $1,657.5 $1,697.4 $1,221.3 Average number of common shares—basic EPS 587.1 598.9 603.3 Incremental share effect from: (a)
Stock options 8.1 9.8 11.3 Restricted stock units, performance share units, and other 2.8 3.2 4.2
Average number of common shares—diluted EPS 598.0 611.9 618.8 Earnings per share—basic $ 2.82 $ 2.83 $ 2.02 Earnings per share—diluted $ 2.77 $ 2.77 $ 1.97 (a) Incremental shares from stock options, restricted stock units, and performance share units are computed by the treasury stock method. Stock options,
restricted stock units, and performance share units excluded from our computation of diluted EPS because they were not dilutive were as follows: Fiscal Year In Millions 2017 2016 2015 Anti-dilutive stock options, restricted stock units, and performance share units 2.3 1.1 2.1
81
Source: GENERAL MILLS INC, 10-K, June 29, 2017 Powered by Morningstar® Document Research℠The information contained herein may not be copied, adapted or distributed and is not warranted to be accurate, complete or timely. The user assumes all risks for any damages or losses arising from any use of this information,except to the extent such damages or losses cannot be limited or excluded by applicable law. Past financial performance is no guarantee of future results.

Table of Contents
NOTE 13. RETIREMENT BENEFITS AND POSTEMPLOYMENT BENEFITS
Defined Benefit Pension PlansWe have defined benefit pension plans covering many employees in the United States, Canada, France, and the United Kingdom. Benefits for salariedemployees are based on length of service and final average compensation. Benefits for hourly employees include various monthly amounts for each year ofcredited service. Our funding policy is consistent with the requirements of applicable laws. We made no voluntary contributions to our principal U.S. plans infiscal 2017, 2016, and 2015. We do not expect to be required to make any contributions in fiscal 2018. Our principal domestic retirement plan coveringsalaried employees has a provision that any excess pension assets would be allocated to active participants if the plan is terminated within five years of achange in control. All salaried employees hired on or after June 1, 2013 are eligible for a retirement program that does not include a defined benefit pensionplan.
In May 2017, we announced changes to the United States pension plans. The Company will freeze the pay and service amounts used to calculate pensionbenefits for active employees who participate in the United States pension plans as of December 31, 2027. Beginning January 1, 2028, active employees inthe United States will not accrue additional benefits for future service and eligible compensation received under these plans. These changes resulted in a$130.9 million decline in the projected benefit obligation as of May 28, 2017, due to the decrease in expected future pensionable compensation.
Other Postretirement Benefit PlansWe also sponsor plans that provide health care benefits to many of our retirees in the United States, Canada, and Brazil. The United States salaried health carebenefit plan is contributory, with retiree contributions based on years of service. We make decisions to fund related trusts for certain employees and retireeson an annual basis. We made voluntary contributions to these plans of $20.0 million in in fiscal 2017 and $24.0 million in fiscal 2016.
Health Care Cost Trend RatesAssumed health care cost trends are as follows: Fiscal Year 2017 2016 Health care cost trend rate for next year 7.0% and 7.3% 7.3% and 7.5% Rate to which the cost trend rate is assumed to decline (ultimate rate) 5.0% 5.0% Year that the rate reaches the ultimate trend rate 2024 2024
We review our health care cost trend rates annually. Our review is based on data we collect about our health care claims experience and information providedby our actuaries. This information includes recent plan experience, plan design, overall industry experience and projections, and assumptions used by othersimilar organizations. Our initial health care cost trend rate is adjusted as necessary to remain consistent with this review, recent experiences, and short-termexpectations. Our initial health care cost trend rate assumption is 7.3 percent for retirees age 65 and over and 7.0 percent for retirees under age 65 at the end offiscal 2017. Rates are graded down annually until the ultimate trend rate of 5.0 percent is reached in 2024 for all retirees. The trend rates are applicable forcalculations only if the retirees’ benefits increase as a result of health care inflation. The ultimate trend rate is adjusted annually, as necessary, to approximatethe current economic view on the rate of long-term inflation plus an appropriate health care cost premium. Assumed trend rates for health care costs have animportant effect on the amounts reported for the other postretirement benefit plans.
A one percentage point change in the health care cost trend rate would have the following effects:
In Millions
OnePercentage
PointIncrease
OnePercentage
PointDecrease
Effect on the aggregate of the service and interest cost components in fiscal 2018 $ 2.2 $ (1.9) Effect on the other postretirement accumulated benefit obligation as of May 28, 2017 59.5 (53.8)
The Patient Protection and Affordable Care Act, as amended by the Health Care and Education Reconciliation Act of 2010 (collectively, the Act) was signedinto law in March 2010. The Act codifies health care reforms with staggered effective dates from 2010 to 2018. Estimates of the future impacts of several ofthe Act’s provisions are incorporated into our postretirement benefit liability.
82
Source: GENERAL MILLS INC, 10-K, June 29, 2017 Powered by Morningstar® Document Research℠The information contained herein may not be copied, adapted or distributed and is not warranted to be accurate, complete or timely. The user assumes all risks for any damages or losses arising from any use of this information,except to the extent such damages or losses cannot be limited or excluded by applicable law. Past financial performance is no guarantee of future results.

Table of Contents
Postemployment Benefit PlansUnder certain circumstances, we also provide accruable benefits, primarily severance, to former or inactive employees in the United States, Canada, andMexico. We recognize an obligation for any of these benefits that vest or accumulate with service. Postemployment benefits that do not vest or accumulatewith service (such as severance based solely on annual pay rather than years of service) are charged to expense when incurred. Our postemployment benefitplans are unfunded.
In the first quarter of fiscal 2017, we adopted new accounting requirements which permit reporting entities with a fiscal year-end that does not coincide with amonth-end to apply a practical expedient to measure defined benefit plan assets and obligations using the month-end that is closest to the entity’s fiscal year-end and apply such practical expedient consistently to all plans. We measured the plan assets and obligations for our defined benefit pension, otherpostretirement benefit, and postemployment benefit plans as of May 31, 2017.
Summarized financial information about defined benefit pension, other postretirement benefit, and postemployment benefit plans is presented below:
Defined BenefitPension Plans
OtherPostretirementBenefit Plans
PostemploymentBenefit Plans
Fiscal Year Fiscal Year Fiscal Year In Millions 2017 2016 2017 2016 2017 2016 Change in Plan Assets:
Fair value at beginning of year $5,539.9 $5,758.5 $ 602.4 $ 582.8 Actual return on assets 645.6 36.3 75.2 (0.1) Employer contributions 25.4 23.7 20.1 24.1 Plan participant contributions 8.8 5.7 15.2 14.1 Benefits payments (282.2) (277.5) (18.1) (18.5) Foreign currency (12.3) (6.8) — —
Fair value at end of year $5,925.2 $5,539.9 $ 694.8 $ 602.4 Change in Projected Benefit Obligation:
Benefit obligation at beginning of year $6,448.5 $6,252.1 $1,028.9 $1,079.6 $ 164.1 $ 146.6 Service cost 119.7 134.6 12.5 19.0 8.8 7.6 Interest cost 216.5 267.8 32.2 44.1 2.6 3.9 Plan amendment (130.9) 0.9 — — — 1.1 Curtailment/other 1.9 7.1 (0.3) 0.5 1.3 10.7 Plan participant contributions 8.8 5.7 15.2 14.1 — — Medicare Part D reimbursements — — 3.4 3.5 — — Actuarial loss (gain) 88.5 65.2 (77.6) (64.5) (7.4) 11.2 Benefits payments (282.6) (278.0) (63.3) (66.4) (34.7) (16.9) Foreign currency (11.8) (6.9) 0.4 (1.0) (0.2) (0.1)
Projected benefit obligation at end of year $6,458.6 $6,448.5 $ 951.4 $1,028.9 $ 134.5 $ 164.1 Plan assets less than benefit obligation as of fiscal year end $ (533.4) $ (908.6) $ (256.6) $ (426.5) $(134.5) $(164.1)
The accumulated benefit obligation for all defined benefit pension plans was $6,104.5 million as of May 28, 2017, and $5,950.7 million as of May 29, 2016.
83
Source: GENERAL MILLS INC, 10-K, June 29, 2017 Powered by Morningstar® Document Research℠The information contained herein may not be copied, adapted or distributed and is not warranted to be accurate, complete or timely. The user assumes all risks for any damages or losses arising from any use of this information,except to the extent such damages or losses cannot be limited or excluded by applicable law. Past financial performance is no guarantee of future results.

Table of Contents
Amounts recognized in AOCI as of May 28, 2017 and May 29, 2016, are as follows:
Defined BenefitPension Plans
OtherPostretirementBenefit Plans
PostemploymentBenefit Plans Total
Fiscal Year Fiscal Year Fiscal Year Fiscal Year In Millions 2017 2016 2017 2016 2017 2016 2017 2016 Net actuarial loss $(1,621.4) $(1,886.0) $(14.5) $ (57.6) $ (9.5) $ (14.6) $(1,645.4) $(1,958.2) Prior service (costs) credits (3.9) (6.8) 22.8 19.9 0.6 (1.2) 19.5 11.9 Amounts recorded in accumulated other comprehensive
loss $(1,625.3) $(1,892.8) $ 8.3 $ (37.7) $ (8.9) $ (15.8) $(1,625.9) $(1,946.3)
Plans with accumulated benefit obligations in excess of plan assets are as follows:
DefinedBenefit
Pension Plans
OtherPostretirementBenefit Plans
PostemploymentBenefit Plans
Fiscal Year Fiscal Year Fiscal Year In Millions 2017 2016 2017 2016 2017 2016 Projected benefit obligation $610.1 $5,490.3 $ 5.5 $ — $ 4.4 $ 4.8 Accumulated benefit obligation 542.3 4,998.3 947.9 1,024.7 130.1 159.3 Plan assets at fair value 51.9 4,498.5 694.8 602.4 — —
Components of net periodic benefit expense are as follows:
Defined BenefitPension Plans
Other PostretirementBenefit Plans
PostemploymentBenefit Plans
Fiscal Year Fiscal Year Fiscal Year In Millions 2017 2016 2015 2017 2016 2015 2017 2016 2015 Service cost $ 119.7 $ 134.6 $ 137.0 $ 12.5 $ 19.0 $ 22.4 $ 8.8 $ 7.6 $ 7.5 Interest cost 216.5 267.8 249.2 32.2 44.1 46.9 2.6 3.9 4.3 Expected return on plan assets (486.7) (496.9) (476.4) (48.5) (46.2) (40.2) — — — Amortization of losses 190.2 189.8 141.7 2.5 6.6 4.9 1.7 0.7 0.7 Amortization of prior service costs (credits) 2.5 4.7 7.4 (5.4) (5.4) (1.6) 0.6 2.5 2.4 Other adjustments 3.1 5.0 15.1 1.3 2.3 3.3 1.3 10.7 9.5 Settlement or curtailment losses 3.8 13.1 18.0 (0.9) (1.0) 1.3 (1.4) — — Net expense $ 49.1 $ 118.1 $ 92.0 $ (6.3) $ 19.4 $ 37.0 $13.6 $25.4 $24.4
We expect to recognize the following amounts in net periodic benefit expense in fiscal 2018:
In Millions Defined BenefitPension Plans
OtherPostretirementBenefit Plans
PostemploymentBenefit Plans
Amortization of losses $ 176.9 $ 0.8 $ 0.6 Amortization of prior service costs (credits) 1.9 (5.4) 0.8
84
Source: GENERAL MILLS INC, 10-K, June 29, 2017 Powered by Morningstar® Document Research℠The information contained herein may not be copied, adapted or distributed and is not warranted to be accurate, complete or timely. The user assumes all risks for any damages or losses arising from any use of this information,except to the extent such damages or losses cannot be limited or excluded by applicable law. Past financial performance is no guarantee of future results.

Table of Contents
Assumptions
Weighted-average assumptions used to determine fiscal year-end benefit obligations are as follows:
Defined BenefitPension Plans
OtherPostretirementBenefit Plans
PostemploymentBenefit Plans
Fiscal Year Fiscal Year Fiscal Year 2017 2016 2017 2016 2017 2016 Discount rate 4.08% 4.19% 3.92% 3.97% 2.87% 2.94% Rate of salary increases 4.25 4.28 — — 4.46 4.35
Weighted-average assumptions used to determine fiscal year net periodic benefit expense are as follows:
Defined BenefitPension Plans
Other PostretirementBenefit Plans
PostemploymentBenefit Plans
Fiscal Year Fiscal Year Fiscal Year 2017 (a) 2016 2015 2017 (a) 2016 2015 2017 (a) 2016 2015 Discount rate 4.19% 4.38% 4.54% 3.97% 4.20% 4.51% 2.94% 3.55% 3.82% Service cost effective rate 4.57 — — 4.42 — — 3.55 — — Interest cost effective rate 3.44 — — 3.17 — — 2.67 — — Rate of salary increases 4.28 4.31 4.44 — — — 4.35 4.36 4.44 Expected long-term rate of return on plan assets 8.17 8.53 8.53 7.85 8.14 8.13 — — — (a) Beginning in fiscal 2017, we adopted the full yield curve method.
Discount RatesBeginning in fiscal 2017, we changed the method used to estimate the service and interest cost components of the net periodic benefit expense for our UnitedStates and most of our international defined benefit pension, other postretirement benefit, and postemployment benefit plans. We adopted a full yield curveapproach to estimate service cost and interest cost by applying the specific spot rates along the yield curve used to determine the benefit obligation to therelevant projected cash flows. This method provides a more precise measurement of service and interest costs by correlating the timing of the plans’ liabilitycash flows to the corresponding rate on the yield curve. Previously, we estimated service cost and interest cost using a single weighted-average discount ratederived from the yield curve used to measure the benefit obligation at the beginning of the period. This change does not affect the measurement of ourbenefit obligations related to these plans. We have accounted for this change prospectively as a change in accounting estimate beginning in the first quarterof fiscal 2017. The change in methodology resulted in a decrease in service and interest cost of approximately $68 million for fiscal 2017 compared to ourprevious methodology. The fiscal 2017 reduction in our net periodic benefit expense as a result of this change in methodology was partially offset by areduction in our weighted-average expected rate of return on plan assets for our principal defined benefit pension and other postretirement plans in theUnited States to 8.25 percent as a result of changes that decreased investment risk in the portfolio.
Beginning in fiscal 2017, our discount rate assumptions are determined annually as of May 31 for our defined benefit pension, other postretirement benefit,and postemployment benefit plan obligations. We also use discount rates as of May 31 to determine defined benefit pension, other postretirement benefit,and postemployment benefit plan income and expense for the following fiscal year. We work with our outside actuaries to determine the timing and amountof expected future cash outflows to plan participants and, using the Aa Above Median corporate bond yield, to develop a forward interest rate curve,including a margin to that index based on our credit risk. This forward interest rate curve is applied to our expected future cash outflows to determine ourdiscount rate assumptions.
85
Source: GENERAL MILLS INC, 10-K, June 29, 2017 Powered by Morningstar® Document Research℠The information contained herein may not be copied, adapted or distributed and is not warranted to be accurate, complete or timely. The user assumes all risks for any damages or losses arising from any use of this information,except to the extent such damages or losses cannot be limited or excluded by applicable law. Past financial performance is no guarantee of future results.

Table of Contents
Fair Value of Plan Assets
The fair values of our pension and postretirement benefit plans’ assets and their respective levels in the fair value hierarchy at May 28, 2017, and May 29,2016, by asset category were as follows: May 28, 2017 May 29, 2016
In Millions Level 1 Level 2 Level 3 TotalAssets Level 1 Level 2 Level 3
TotalAssets
Fair value measurement of pension plan assets: Equity (a) $1,773.0 $ 781.2 $ — $2,554.2 $1,543.7 $ 741.9 $ — $2,285.6 Fixed income (b) 951.9 742.2 — 1,694.1 903.8 745.8 — 1,649.6 Real asset investments (c) 253.1 95.8 — 348.9 193.6 95.2 — 288.8 Other investments (d) — — 0.3 0.3 — — 0.4 0.4 Cash and accruals 174.2 — — 174.2 195.1 — — 195.1
Fair value measurement of pension plan assets in the fairvalue hierarchy $3,152.2 $1,619.2 $ 0.3 $4,771.7 $2,836.2 $1,582.9 $ 0.4 $4,419.5 Investments measured at net asset value (e) 1,153.5 1,120.4 Total pension plan investments $5,925.2 $5,539.9 Fair value measurement of postretirement benefit planassets:
Equity (a) $ 122.3 $ 67.5 $ — $ 189.8 $ 128.9 $ 87.6 $ — $ 216.5 Fixed income (b) 34.1 160.0 — 194.1 18.0 83.4 — 101.4 Real asset investments (c) 18.0 14.5 — 32.5 — 14.3 — 14.3 Other investments (d) — — — — — — — — Cash and accruals 11.3 — — 11.3 8.9 — — 8.9
Fair value measurement of postretirement benefit plan assetsin the fair value hierarchy $ 185.7 $ 242.0 $ — $ 427.7 $ 155.8 $ 185.3 $ — $ 341.1 Investments measured at net asset value (e) 267.1 261.3 Total postretirement benefit plan investments $ 694.8 $ 602.4 (a) Primarily publicly traded common stock for purposes of total return and to maintain equity exposure consistent with policy allocations. Investments
include: United States and international equity securities, mutual funds, and equity futures valued at closing prices from national exchanges; andcommingled funds valued at unit values provided by the investment managers, which are based on the fair value of the underlying investments.
(b) Primarily government and corporate debt securities and futures for purposes of total return, managing fixed income exposure to policy allocations, andmanaging duration targets. Investments include: fixed income securities and bond futures generally valued at closing prices from national exchanges,fixed income pricing models, and independent financial analysts; and fixed income commingled funds valued at unit values provided by theinvestment managers, which are based on the fair value of the underlying investments.
(c) Publicly traded common stock and limited partnerships in the energy and real estate sectors for purposes of total return. Investments include: energyand real estate securities generally valued at closing prices from national exchanges; and commingled funds valued at unit values provided by theinvestment managers, which are based on the fair value of the underlying investments.
(d) Global balanced fund of equity, fixed income, and real estate securities for purposes of meeting Canadian pension plan asset allocation policies, andinsurance and annuity contracts to provide a stable stream of income for retirees and to fund postretirement medical benefits. Fair values are derivedfrom unit values provided by the investment managers, which are generally based on the fair value of the underlying investments and contract fairvalues from the providers.
(e) Primarily private investments and common collective trusts that are measured at fair value using the net asset value per share (or its equivalent)practical expedient and have not been classified in the fair value hierarchy.
There were no material changes in our level 3 investments in fiscal 2017 and fiscal 2016.
86
Source: GENERAL MILLS INC, 10-K, June 29, 2017 Powered by Morningstar® Document Research℠The information contained herein may not be copied, adapted or distributed and is not warranted to be accurate, complete or timely. The user assumes all risks for any damages or losses arising from any use of this information,except to the extent such damages or losses cannot be limited or excluded by applicable law. Past financial performance is no guarantee of future results.

Table of Contents
Expected Rate of Return on Plan Assets
Our expected rate of return on plan assets is determined by our asset allocation, our historical long-term investment performance, our estimate of future long-term returns by asset class (using input from our actuaries, investment services, and investment managers), and long-term inflation assumptions. We reviewthis assumption annually for each plan; however, our annual investment performance for one particular year does not, by itself, significantly influence ourevaluation.
Weighted-average asset allocations for the past two fiscal years for our defined benefit pension and other postretirement benefit plans are as follows:
Defined BenefitPension Plans
Other PostretirementBenefit Plans
Fiscal Year Fiscal Year 2017 2016 2017 2016 Asset category:
United States equities 28.5% 30.5% 31.9% 37.2% International equities 17.9 19.0 17.8 23.4 Private equities 7.8 8.3 3.6 3.9 Fixed income 31.7 28.6 40.0 29.4 Real assets 14.1 13.6 6.7 6.1
Total 100.0% 100.0% 100.0% 100.0%
The investment objective for our defined benefit pension and other postretirement benefit plans is to secure the benefit obligations to participants at areasonable cost to us. Our goal is to optimize the long-term return on plan assets at a moderate level of risk. The defined benefit pension plan and otherpostretirement benefit plan portfolios are broadly diversified across asset classes. Within asset classes, the portfolios are further diversified across investmentstyles and investment organizations. For the defined benefit pension plans, the long-term investment policy allocation is: 20 percent to equities in the UnitedStates; 15 percent to international equities; 10 percent to private equities; 40 percent to fixed income; and 15 percent to real assets (real estate, energy, andtimber). For other postretirement benefit plans, the long-term investment policy allocations are: 30 percent to equities in the United States; 15 percent tointernational equities; 10 percent to private equities; 40 percent to fixed income; and 5 percent to real assets (real estate, energy, and timber). The actualallocations to these asset classes may vary tactically around the long-term policy allocations based on relative market valuations.
Contributions and Future Benefit Payments
We do not expect to be required to make contributions to our defined benefit pension, other postretirement benefit, and postemployment benefit plans infiscal 2018. Actual fiscal 2018 contributions could exceed our current projections, as influenced by our decision to undertake discretionary funding of ourbenefit trusts and future changes in regulatory requirements. Estimated benefit payments, which reflect expected future service, as appropriate, are expectedto be paid from fiscal 2018 to 2027 as follows:
In Millions
DefinedBenefitPension
Plans
OtherPostretirementBenefit Plans
Gross Payments
MedicareSubsidyReceipts
PostemploymentBenefitPlans
2018 $ 290.2 $ 59.5 $ 4.3 $21.2 2019 298.6 61.6 4.6 19.0 2020 307.7 63.0 4.2 17.4 2021 316.4 64.1 3.5 16.1 2022 325.7 64.8 3.6 15.0 2023-2027 1,767.8 328.8 18.8 61.5
Source: GENERAL MILLS INC, 10-K, June 29, 2017 Powered by Morningstar® Document Research℠The information contained herein may not be copied, adapted or distributed and is not warranted to be accurate, complete or timely. The user assumes all risks for any damages or losses arising from any use of this information,except to the extent such damages or losses cannot be limited or excluded by applicable law. Past financial performance is no guarantee of future results.

Defined Contribution PlansThe General Mills Savings Plan is a defined contribution plan that covers domestic salaried, hourly, nonunion, and certain union employees. This plan is a401(k) savings plan that includes a number of investment funds, including a Company stock fund and an Employee Stock Ownership Plan (ESOP). Wesponsor another money purchase plan for certain domestic hourly employees with net assets of $23.0 million as of May 28, 2017, and $21.0 million as ofMay 29, 2016. We also sponsor defined contribution plans in many of our foreign locations. Our total recognized expense related to defined contributionplans was $54.1 million in fiscal 2017, $61.2 million in fiscal 2016, and $44.0 million in fiscal 2015.
87
Source: GENERAL MILLS INC, 10-K, June 29, 2017 Powered by Morningstar® Document Research℠The information contained herein may not be copied, adapted or distributed and is not warranted to be accurate, complete or timely. The user assumes all risks for any damages or losses arising from any use of this information,except to the extent such damages or losses cannot be limited or excluded by applicable law. Past financial performance is no guarantee of future results.
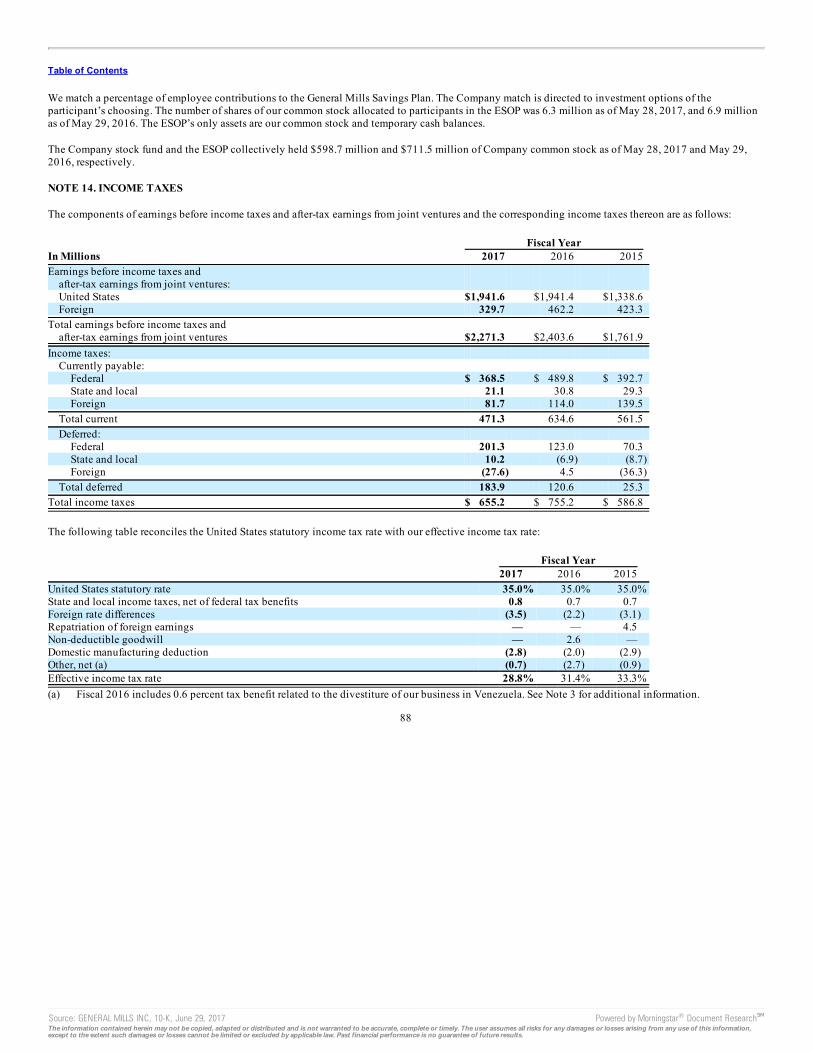
Table of Contents
We match a percentage of employee contributions to the General Mills Savings Plan. The Company match is directed to investment options of theparticipant’s choosing. The number of shares of our common stock allocated to participants in the ESOP was 6.3 million as of May 28, 2017, and 6.9 millionas of May 29, 2016. The ESOP’s only assets are our common stock and temporary cash balances.
The Company stock fund and the ESOP collectively held $598.7 million and $711.5 million of Company common stock as of May 28, 2017 and May 29,2016, respectively.
NOTE 14. INCOME TAXES
The components of earnings before income taxes and after-tax earnings from joint ventures and the corresponding income taxes thereon are as follows: Fiscal Year In Millions 2017 2016 2015 Earnings before income taxes and
after-tax earnings from joint ventures: United States $1,941.6 $1,941.4 $1,338.6 Foreign 329.7 462.2 423.3
Total earnings before income taxes andafter-tax earnings from joint ventures $2,271.3 $2,403.6 $1,761.9
Income taxes: Currently payable:
Federal $ 368.5 $ 489.8 $ 392.7 State and local 21.1 30.8 29.3 Foreign 81.7 114.0 139.5
Total current 471.3 634.6 561.5 Deferred:
Federal 201.3 123.0 70.3 State and local 10.2 (6.9) (8.7) Foreign (27.6) 4.5 (36.3)
Total deferred 183.9 120.6 25.3 Total income taxes $ 655.2 $ 755.2 $ 586.8
The following table reconciles the United States statutory income tax rate with our effective income tax rate: Fiscal Year 2017 2016 2015 United States statutory rate 35.0% 35.0% 35.0% State and local income taxes, net of federal tax benefits 0.8 0.7 0.7 Foreign rate differences (3.5) (2.2) (3.1) Repatriation of foreign earnings — — 4.5 Non-deductible goodwill — 2.6 — Domestic manufacturing deduction (2.8) (2.0) (2.9) Other, net (a) (0.7) (2.7) (0.9) Effective income tax rate 28.8% 31.4% 33.3% (a) Fiscal 2016 includes 0.6 percent tax benefit related to the divestiture of our business in Venezuela. See Note 3 for additional information.
88
Source: GENERAL MILLS INC, 10-K, June 29, 2017 Powered by Morningstar® Document Research℠The information contained herein may not be copied, adapted or distributed and is not warranted to be accurate, complete or timely. The user assumes all risks for any damages or losses arising from any use of this information,except to the extent such damages or losses cannot be limited or excluded by applicable law. Past financial performance is no guarantee of future results.

Table of Contents
The tax effects of temporary differences that give rise to deferred tax assets and liabilities are as follows:
In Millions May 28,
2017 May 29,
2016 Accrued liabilities $ 70.0 $ 89.9 Compensation and employee benefits 419.2 491.5 Pension 196.3 322.0 Tax credit carryforwards 18.4 4.5 Stock, partnership, and miscellaneous investments 276.4 353.6 Capital losses 29.8 14.5 Net operating losses 109.5 97.9 Other 85.6 84.1 Gross deferred tax assets 1,205.2 1,458.0 Valuation allowance 231.8 227.0 Net deferred tax assets 973.4 1,231.0 Brands 1,310.1 1,311.7 Fixed assets 484.5 476.3 Intangible assets 238.6 221.8 Tax lease transactions 45.8 48.0 Inventories 60.0 53.0 Stock, partnership, and miscellaneous investments 479.4 476.0 Unrealized hedges 45.4 22.6 Other 29.0 21.2 Gross deferred tax liabilities 2,692.8 2,630.6 Net deferred tax liability $1,719.4 $1,399.6
We have established a valuation allowance against certain of the categories of deferred tax assets described above as current evidence does not suggest wewill realize sufficient taxable income of the appropriate character (e.g., ordinary income versus capital gain income) within the carryforward period to allowus to realize these deferred tax benefits.
Of the total valuation allowance of $231.8 million, the majority relates to a deferred tax asset for losses recorded as part of the Pillsbury acquisition in theamount of $167.2 million, $53.3 million relates to various state and foreign loss carryforwards, and $11.1 million relates to various foreign capital losscarryforwards. As of May 28, 2017, we believe it is more-likely-than-not that the remainder of our deferred tax assets are realizable.
We have $142.1 million of tax loss carryforwards. Of this amount, $125.3 million is foreign loss carryforwards. The carryforward periods are as follows: $93.2million do not expire; $3.7 million expire in fiscal 2018 and 2019; and $28.4 million expire in fiscal 2020 and beyond. The remaining $16.8 million arestate operating loss carryforwards, the majority of which expire after fiscal 2023.
We have not recognized a deferred tax liability for unremitted earnings of approximately $2.3 billion from our foreign operations because our subsidiarieshave invested or will invest the undistributed earnings indefinitely, or the earnings will be remitted in a tax-neutral transaction. It is not practicable for us todetermine the amount of unrecognized deferred tax liabilities on these indefinitely reinvested earnings. Deferred taxes are recorded for earnings of our foreignoperations when we determine that such earnings are no longer indefinitely reinvested. In fiscal 2015, we approved a one-time repatriation of $606.1 millionof historical foreign earnings to reduce the economic cost of funding restructuring initiatives and the acquisition of Annie’s. We recorded a discrete taxcharge of $78.6 million in fiscal 2015 related to this action. We have previously asserted that our historical foreign earnings are permanently reinvested andwill only be repatriated in a tax-neutral manner, and this one-time repatriation does not change this on-going assertion.
We are subject to federal income taxes in the United States as well as various state, local, and foreign jurisdictions. A number of years may elapse before anuncertain tax position is audited and finally resolved. While it is often difficult to predict the final outcome or the timing of resolution of any particularuncertain tax position, we believe that our liabilities for income taxes reflect the most likely outcome. We adjust these liabilities, as well as the relatedinterest, in light of changing facts and circumstances. Settlement of any particular position would usually require the use of cash.
Source: GENERAL MILLS INC, 10-K, June 29, 2017 Powered by Morningstar® Document Research℠The information contained herein may not be copied, adapted or distributed and is not warranted to be accurate, complete or timely. The user assumes all risks for any damages or losses arising from any use of this information,except to the extent such damages or losses cannot be limited or excluded by applicable law. Past financial performance is no guarantee of future results.

The number of years with open tax audits varies depending on the tax jurisdiction. Our major taxing jurisdictions include the United States (federal and state)and Canada. Various tax examinations by United States state taxing authorities could be conducted for any open tax year, which vary by jurisdiction, but aregenerally from 3 to 5 years.
89
Source: GENERAL MILLS INC, 10-K, June 29, 2017 Powered by Morningstar® Document Research℠The information contained herein may not be copied, adapted or distributed and is not warranted to be accurate, complete or timely. The user assumes all risks for any damages or losses arising from any use of this information,except to the extent such damages or losses cannot be limited or excluded by applicable law. Past financial performance is no guarantee of future results.

Table of Contents
Several state and foreign examinations are currently in progress. We do not expect these examinations to result in a material impact on our results ofoperations or financial position.
During fiscal 2017, the Internal Revenue Service (IRS) concluded its field examination of our federal tax returns for fiscal 2013 and 2014. The audit closureand related adjustments did not have a material impact on our results of operations or financial position. As of May 28, 2017, we have effectively settled allissues with the IRS for fiscal years 2014 and prior.
During fiscal 2017, the Brazilian tax authority, Secretaria da Receita Federal do Brasil (RFB), concluded audits of our 2012 and 2013 tax return years. Theseaudits included a review of our determinations of amortization of certain goodwill arising from the acquisition of Yoki Alimentos S.A. (Yoki). The RFB hasproposed adjustments that effectively eliminate the goodwill amortization benefits related to this transaction. We believe we have meritorious defenses andintend to contest the disallowance.
We apply a more-likely-than-not threshold to the recognition and derecognition of uncertain tax positions. Accordingly, we recognize the amount of taxbenefit that has a greater than 50 percent likelihood of being ultimately realized upon settlement. Future changes in judgment related to the expectedultimate resolution of uncertain tax positions will affect earnings in the period of such change.
The following table sets forth changes in our total gross unrecognized tax benefit liabilities, excluding accrued interest, for fiscal 2017 and fiscal 2016.Approximately $62 million of this total in fiscal 2017 represents the amount that, if recognized, would affect our effective income tax rate in future periods.This amount differs from the gross unrecognized tax benefits presented in the table because certain of the liabilities below would impact deferred taxes ifrecognized. We also would record a decrease in U.S. federal income taxes upon recognition of the state tax benefits included therein. Fiscal Year In Millions 2017 2016 Balance, beginning of year $176.5 $161.1 Tax positions related to current year:
Additions 27.2 31.6 Tax positions related to prior years:
Additions 0.9 23.9 Reductions (47.9) (25.7) Settlements (9.6) (4.0)
Lapses in statutes of limitations (11.6) (10.4) Balance, end of year $135.5 $176.5
As of May 28, 2017, we expect to pay approximately $1.8 million of unrecognized tax benefit liabilities and accrued interest within the next 12 months. Weare not able to reasonably estimate the timing of future cash flows beyond 12 months due to uncertainties in the timing of tax audit outcomes. The remainingamount of our unrecognized tax liability was classified in other liabilities.
We report accrued interest and penalties related to unrecognized tax benefit liabilities in income tax expense. For fiscal 2017, we recognized a net benefit of$5.6 million of tax-related net interest and penalties, and had $23.1 million of accrued interest and penalties as of May 28, 2017. For fiscal 2016, werecognized a net benefit of $2.7 million of tax-related net interest and penalties, and had $32.1 million of accrued interest and penalties as of May 29, 2016.
NOTE 15. LEASES, OTHER COMMITMENTS, AND CONTINGENCIES
The Company’s leases are generally for warehouse space and equipment. Rent expense under all operating leases from continuing operations was $188.1million in fiscal 2017, $189.1 million in fiscal 2016, and $193.5 million in fiscal 2015.
Some operating leases require payment of property taxes, insurance, and maintenance costs in addition to the rent payments. Contingent and escalation rentin excess of minimum rent payments and sublease income netted in rent expense were insignificant.
90
Source: GENERAL MILLS INC, 10-K, June 29, 2017 Powered by Morningstar® Document Research℠The information contained herein may not be copied, adapted or distributed and is not warranted to be accurate, complete or timely. The user assumes all risks for any damages or losses arising from any use of this information,except to the extent such damages or losses cannot be limited or excluded by applicable law. Past financial performance is no guarantee of future results.

Table of Contents
Noncancelable future lease commitments are:
In Millions Operating
Leases
CapitalLeases
Fiscal 2018 $118.8 $0.4 Fiscal 2019 101.7 0.4 Fiscal 2020 80.7 0.2 Fiscal 2021 60.7 0.1 Fiscal 2022 49.7 — After fiscal 2022 89.1 0.1 Total noncancelable future lease commitments $500.7 $1.2 Less: interest (0.1) Present value of obligations under capital leases $1.1
Depreciation on capital leases is recorded as depreciation expense in our results of operations.
As of May 28, 2017, we have issued guarantees and comfort letters of $504.7 million for the debt and other obligations of consolidated subsidiaries, andguarantees and comfort letters of $165.3 million for the debt and other obligations of non-consolidated affiliates, mainly CPW. In addition, off-balance sheetarrangements are generally limited to the future payments under non-cancelable operating leases, which totaled $500.7 million as of May 28, 2017.
NOTE 16. BUSINESS SEGMENT AND GEOGRAPHIC INFORMATION
We operate in the consumer foods industry. In the third quarter of fiscal 2017, we announced a new global organization structure to streamline our leadership,enhance global scale, and drive improved operational agility to maximize our growth capabilities. As a result of this global reorganization, beginning in thethird quarter of fiscal 2017, we reported results for our four operating segments as follows: North America Retail, 65.3 percent of our fiscal 2017 consolidatednet sales; Convenience Stores & Foodservice, 12.0 percent of our fiscal 2017 consolidated net sales; Europe & Australia, 11.7 percent of our fiscal 2017consolidated net sales; and Asia & Latin America, 11.0 percent of our fiscal 2017 consolidated net sales. We have restated our net sales by segment andsegment operating profit amounts to reflect our new operating segments. These segment changes had no effect on previously reported consolidated net sales,operating profit, net earnings attributable to General Mills, or earnings per share.
Our North America Retail operating segment consists of our former U.S. Retail operating units and our Canada region. Within our North America Retailoperating segment, our former U.S. Meals operating unit and U.S. Baking operating unit have been combined into one operating unit: U.S. Meals & Baking.Our Convenience Stores & Foodservice operating segment is unchanged. Our Europe & Australia operating segment consists of our former Europe region.Our Asia & Latin America operating segment consists of our former Asia/Pacific and Latin America regions.
Under our new organization structure, our chief operating decision maker assesses performance and makes decisions about resources to be allocated to oursegments at the North America Retail, Convenience Stores & Foodservice, Europe & Australia, and Asia & Latin America operating segment level.
Our North America Retail operating segment reflects business with a wide variety of grocery stores, mass merchandisers, membership stores, natural foodchains, drug, dollar and discount chains, and e-commerce grocery providers. Our product categories in this business segment are ready-to-eat cereals,refrigerated yogurt, soup, meal kits, refrigerated and frozen dough products, dessert and baking mixes, frozen pizza and pizza snacks, grain, fruit and savorysnacks, and a wide variety of organic products including refrigerated yogurt, nutrition bars, meal kits, salty snacks, ready-to-eat cereal, and grain snacks.
In our Convenience Stores & Foodservice segment our major product categories are ready-to-eat cereals, snacks, refrigerated yogurt, frozen meals, unbakedand fully baked frozen dough products, and baking mixes. Many products we sell are branded to the consumer and nearly all are branded to our customers.We sell to distributors and operators in many customer channels including foodservice, convenience stores, vending, and supermarket bakeries in the UnitedStates.
Source: GENERAL MILLS INC, 10-K, June 29, 2017 Powered by Morningstar® Document Research℠The information contained herein may not be copied, adapted or distributed and is not warranted to be accurate, complete or timely. The user assumes all risks for any damages or losses arising from any use of this information,except to the extent such damages or losses cannot be limited or excluded by applicable law. Past financial performance is no guarantee of future results.

Our Europe & Australia operating segment consists of our former Europe region. The segment includes retail and foodservice businesses in the greater Europeand Australia regions. Our product categories include refrigerated yogurt, meal kits, super-premium ice cream, refrigerated and frozen dough products, shelfstable vegetables, grain snacks, and dessert and baking mixes. We also sell super-premium ice cream directly to consumers through company-owned retailshops. Revenues from franchise fees are reported in the region or country where the franchisee is located.
91
Source: GENERAL MILLS INC, 10-K, June 29, 2017 Powered by Morningstar® Document Research℠The information contained herein may not be copied, adapted or distributed and is not warranted to be accurate, complete or timely. The user assumes all risks for any damages or losses arising from any use of this information,except to the extent such damages or losses cannot be limited or excluded by applicable law. Past financial performance is no guarantee of future results.

Table of Contents
Our Asia & Latin America operating segment consists of our former Asia/Pacific and Latin America regions. The segment includes retail and foodservicebusinesses in the greater Asia and South America regions. Our product categories include super-premium ice cream and frozen desserts, refrigerated andfrozen dough products, dessert and baking mixes, meal kits, salty and grain snacks, wellness beverages, and refrigerated yogurt. We also sell super-premiumice cream and frozen desserts directly to consumers through company-owned retail shops. Our Asia & Latin America segment also includes productsmanufactured in the United States for export, mainly to Caribbean and Latin American markets, as well as products we manufacture for sale to ourinternational joint ventures. Revenues from export activities and franchise fees are reported in the region or country where the end customer or franchisee islocated.
Operating profit for these segments excludes unallocated corporate items, gain on divestitures, and restructuring, impairment, and other exit costs.Unallocated corporate items include corporate overhead expenses, variances to planned domestic employee benefits and incentives, contributions to theGeneral Mills Foundation, asset and liability remeasurement impact of hyperinflationary economies, restructuring initiative project-related costs, and otheritems that are not part of our measurement of segment operating performance. These include gains and losses arising from the revaluation of certain graininventories and gains and losses from mark-to-market valuation of certain commodity positions until passed back to our operating segments. These itemsaffecting operating profit are centrally managed at the corporate level and are excluded from the measure of segment profitability reviewed by executivemanagement. Under our supply chain organization, our manufacturing, warehouse, and distribution activities are substantially integrated across ouroperations in order to maximize efficiency and productivity. As a result, fixed assets and depreciation and amortization expenses are neither maintained noravailable by operating segment.
Our operating segment results were as follows: Fiscal Year In Millions 2017 2016 2015 Net sales:
North America Retail $10,196.9 $10,936.6 $11,612.1 Convenience Stores & Foodservice 1,870.0 1,923.8 1,995.1 Europe & Australia 1,824.5 1,998.0 2,126.5 Asia & Latin America 1,728.4 1,704.7 1,896.6
Total $15,619.8 $16,563.1 $17,630.3 Operating profit:
North America Retail $ 2,303.6 $ 2,351.2 $ 2,382.7 Convenience Stores & Foodservice 401.2 378.9 353.1 Europe & Australia 164.2 200.3 179.4 Asia & Latin America 83.6 69.1 119.8
Total segment operating profit 2,952.6 2,999.5 3,035.0 Unallocated corporate items 190.1 288.9 413.8 Divestitures loss (gain) 13.5 (148.2) — Restructuring, impairment, and other exit costs 182.6 151.4 543.9 Operating profit $ 2,566.4 $ 2,707.4 $ 2,077.3
92
Source: GENERAL MILLS INC, 10-K, June 29, 2017 Powered by Morningstar® Document Research℠The information contained herein may not be copied, adapted or distributed and is not warranted to be accurate, complete or timely. The user assumes all risks for any damages or losses arising from any use of this information,except to the extent such damages or losses cannot be limited or excluded by applicable law. Past financial performance is no guarantee of future results.

Table of Contents
Net sales by class of similar products were as follows: Fiscal Year In Millions 2017 2016 2015
Snacks $ 3,302.2 $ 3,297.2 $ 3,392.0 Cereal 2,673.2 2,731.5 2,771.3 Convenient meals 2,653.6 2,779.0 2,810.3 Yogurt 2,403.5 2,760.9 2,938.3 Dough 1,690.6 1,820.0 1,877.0 Baking mixes and ingredients 1,654.1 1,704.3 1,867.7 Super-premium ice cream 738.4 731.2 769.5 Vegetables 310.5 532.3 937.3 Other 193.7 206.7 266.9
Total $15,619.8 $16,563.1 $17,630.3
The following table provides financial information by geographic area: Fiscal Year In Millions 2017 2016 2015 Net sales:
United States $11,160.9 $11,930.9 $12,501.8 Non-United States 4,458.9 4,632.2 5,128.5
Total $15,619.8 $16,563.1 $17,630.3
In Millions May 28,
2017 May 29,
2016 Cash and cash equivalents:
United States $ 62.9 $ 118.5 Non-United States 703.2 645.2
Total $ 766.1 $ 763.7
In Millions May 28,
2017 May 29,
2016 Land, buildings, and equipment:
United States $2,704.0 $2,755.1 Non-United States 983.7 988.5
Total $3,687.7 $3,743.6
NOTE 17. SUPPLEMENTAL INFORMATION
The components of certain Consolidated Balance Sheet accounts are as follows:
In Millions May 28,
2017 May 29,
2016 Receivables:
Customers $1,454.4 $1,390.4 Less allowance for doubtful accounts (24.3) (29.6)
Total $1,430.1 $1,360.8
93
Source: GENERAL MILLS INC, 10-K, June 29, 2017 Powered by Morningstar® Document Research℠The information contained herein may not be copied, adapted or distributed and is not warranted to be accurate, complete or timely. The user assumes all risks for any damages or losses arising from any use of this information,except to the extent such damages or losses cannot be limited or excluded by applicable law. Past financial performance is no guarantee of future results.

Table of Contents
In Millions May 28,
2017 May 29,
2016 Inventories:
Raw materials and packaging $ 395.4 $ 397.3 Finished goods 1,224.3 1,163.1 Grain 73.0 72.6 Excess of FIFO over LIFO cost (a) (209.1) (219.3)
Total $1,483.6 $1,413.7 (a) Inventories of $893.8 million as of May 28, 2017, and $841.0 million as of May 29, 2016, were valued at LIFO. The difference between replacement
cost and the stated LIFO inventory value is not materially different from the reserve for the LIFO valuation method.
In Millions May 28,
2017 May 29,
2016 Prepaid expenses and other current assets:
Other receivables $ 163.7 $ 159.3 Prepaid expenses 168.9 177.9 Derivative receivables, primarily commodity-related 35.0 44.6 Grain contracts 2.7 1.8 Miscellaneous 11.3 15.4
Total $ 381.6 $ 399.0
In Millions May 28,
2017 May 29,
2016 Land, buildings, and equipment:
Land $ 79.8 $ 92.9 Buildings 2,249.2 2,236.0 Buildings under capital lease 0.3 0.3 Equipment 6,095.9 5,945.6 Equipment under capital lease 3.0 3.0 Capitalized software 545.4 523.0 Construction in progress 553.0 702.7
Total land, buildings, and equipment 9,526.6 9,503.5 Less accumulated depreciation (5,838.9) (5,759.9) Total $ 3,687.7 $ 3,743.6
In Millions May 28,
2017 May 29,
2016 Other assets:
Investments in and advances to joint ventures $ 505.3 $ 518.9 Pension assets 144.9 90.9 Exchangeable note with related party — 12.7 Life insurance 25.6 26.3 Miscellaneous 110.1 102.9
Total $ 785.9 $ 751.7
94
Source: GENERAL MILLS INC, 10-K, June 29, 2017 Powered by Morningstar® Document Research℠The information contained herein may not be copied, adapted or distributed and is not warranted to be accurate, complete or timely. The user assumes all risks for any damages or losses arising from any use of this information,except to the extent such damages or losses cannot be limited or excluded by applicable law. Past financial performance is no guarantee of future results.

Table of Contents
In Millions May 28,
2017 May 29,
2016 Other current liabilities:
Accrued trade and consumer promotions $ 482.6 $ 563.7 Accrued payroll 326.6 386.4 Dividends payable 21.5 23.8 Accrued taxes 58.0 110.5 Accrued interest, including interest rate swaps 83.8 90.4 Grain contracts 5.6 5.5 Restructuring and other exit costs reserve 85.0 76.6 Derivative payable 18.1 35.6 Miscellaneous 291.0 302.5
Total $1,372.2 $1,595.0
In Millions May 28,
2017 May 29,
2016 Other noncurrent liabilities:
Accrued compensation and benefits, including obligations for underfundedother postretirement benefit and postemployment benefit plans $1,249.7 $1,755.0
Accrued taxes 162.3 204.0 Miscellaneous 111.1 128.6
Total $1,523.1 $2,087.6
Certain Consolidated Statements of Earnings amounts are as follows: Fiscal Year In Millions 2017 2016 2015 Depreciation and amortization $603.6 $608.1 $588.3 Research and development expense 218.2 222.1 229.4 Advertising and media expense (including production and communication costs) 623.8 754.4 823.1
The components of interest, net are as follows: Fiscal Year Expense (Income), in Millions 2017 2016 2015 Interest expense $306.7 $319.6 $335.5 Capitalized interest (4.6) (7.7) (6.9) Interest income (7.0) (8.1) (13.2) Interest, net $295.1 $303.8 $315.4
Certain Consolidated Statements of Cash Flows amounts are as follows: Fiscal Year In Millions 2017 2016 2015 Cash interest payments $285.8 $292.0 $305.3 Cash paid for income taxes 551.1 533.8 562.6
95
Source: GENERAL MILLS INC, 10-K, June 29, 2017 Powered by Morningstar® Document Research℠The information contained herein may not be copied, adapted or distributed and is not warranted to be accurate, complete or timely. The user assumes all risks for any damages or losses arising from any use of this information,except to the extent such damages or losses cannot be limited or excluded by applicable law. Past financial performance is no guarantee of future results.

Table of Contents
NOTE 18. QUARTERLY DATA (UNAUDITED)
Summarized quarterly data for fiscal 2017 and fiscal 2016 follows:
In Millions, Except Per Share Amounts
First Quarter Second Quarter Third Quarter Fourth Quarter Fiscal Year Fiscal Year Fiscal Year Fiscal Year 2017 2016 2017 2016 2017 2016 2017 2016
Net sales $3,907.9 $4,207.9 $4,112.1 $4,424.9 $3,793.2 $4,002.4 $3,806.6 $3,927.9
Gross margin 1,416.9 1,554.6 1,519.5 1,540.6 1,307.7 1,357.5 1,319.7 1,376.8 Net earnings attributableto General Mills 409.0 426.6 481.8 529.5 357.8 361.7 408.9 379.6 EPS:
Basic $ 0.68 $ 0.71 $ 0.82 $ 0.88 $ 0.62 $ 0.61 $ 0.70 $ 0.63 Diluted $ 0.67 $ 0.69 $ 0.80 $ 0.87 $ 0.61 $ 0.59 $ 0.69 $ 0.62
Dividends per share $ 0.48 $ 0.44 $ 0.48 $ 0.44 $ 0.48 $ 0.44 $ 0.48 $ 0.46 Market price of common stock:
High $ 72.64 $ 59.55 $ 71.42 $ 59.23 $ 63.87 $ 60.14 $ 61.16 $ 65.36 Low $ 62.78 $ 54.36 $ 60.65 $ 55.41 $ 59.23 $ 54.12 $ 55.91 $ 58.85
The effective tax rate for the fourth quarter of fiscal 2016 was 19.2 percent, primarily driven by tax credits and the impact of the divestiture of our business inVenezuela.
During the fourth quarter of fiscal 2016, we sold our General Mills de Venezuela CA subsidiary to a third party and exited our business in Venezuela. As aresult of this transaction, we recorded a pre-tax loss of $37.6 million. In addition, we sold our General Mills Argentina S.A. foodservice business in Argentinato a third party and recorded a pre-tax loss of $14.8 million.
96
Source: GENERAL MILLS INC, 10-K, June 29, 2017 Powered by Morningstar® Document Research℠The information contained herein may not be copied, adapted or distributed and is not warranted to be accurate, complete or timely. The user assumes all risks for any damages or losses arising from any use of this information,except to the extent such damages or losses cannot be limited or excluded by applicable law. Past financial performance is no guarantee of future results.
Table of Contents
Glossary
Accelerated depreciation associated with restructured assets. The increase in depreciation expense caused by updating the salvage value and shorteningthe useful life of depreciable fixed assets to coincide with the end of production under an approved restructuring plan, but only if impairment is not present.
AOCI. Accumulated other comprehensive income (loss).
Adjusted average total capital. Notes payable, long-term debt including current portion, redeemable interest, noncontrolling interests, and stockholders’equity excluding AOCI, and certain after-tax earnings adjustments are used to calculate adjusted return on average total capital. The average is calculatedusing the average of the beginning of fiscal year and end of fiscal year Consolidated Balance Sheet amounts for these line items.
Adjusted operating profit margin. Operating profit adjusted for certain items affecting year-over-year comparability, divided by net sales.
Adjusted return on average total capital. Net earnings including earnings attributable to redeemable and noncontrolling interests, excluding after-tax netinterest, and adjusted for certain items affecting year-over-year comparability, divided by adjusted average total capital.
Average total capital. Notes payable, long-term debt including current portion, redeemable interest, noncontrolling interests, and stockholders’ equity areused to calculate return on average total capital. The average is calculated using the average of the beginning of fiscal year and end of fiscal yearConsolidated Balance Sheet amounts for these line items.
Constant currency. Financial results translated to United States dollars using constant foreign currency exchange rates based on the rates in effect for thecomparable prior-year period. To present this information, current period results for entities reporting in currencies other than United States dollars aretranslated into United States dollars at the average exchange rates in effect during the corresponding period of the prior fiscal year, rather than the actualaverage exchange rates in effect during the current fiscal year. Therefore, the foreign currency impact is equal to current year results in local currenciesmultiplied by the change in the average foreign currency exchange rate between the current fiscal period and the corresponding period of the prior fiscal year.
Core working capital. Accounts receivable plus inventories less accounts payable, all as of the last day of our fiscal year.
Derivatives. Financial instruments such as futures, swaps, options, and forward contracts that we use to manage our risk arising from changes in commodityprices, interest rates, foreign exchange rates, and equity prices.
Euribor. European Interbank Offered Rate.
Fair value hierarchy. For purposes of fair value measurement, we categorize assets and liabilities into one of three levels based on the assumptions (inputs)used in valuing the asset or liability. Level 1 provides the most reliable measure of fair value, while Level 3 generally requires significant managementjudgment. The three levels are defined as follows: Level 1: Unadjusted quoted prices in active markets for identical assets or liabilities. Level 2: Observable inputs other than quoted prices included in Level 1, such as quoted prices for similar assets or liabilities in active markets or
quoted prices for identical assets or liabilities in inactive markets. Level 3: Unobservable inputs reflecting management’s assumptions about the inputs used in pricing the asset or liability.
Fixed charge coverage ratio. The sum of earnings before income taxes and fixed charges (before tax), divided by the sum of the fixed charges (before tax)and interest.
Focus 6 platforms. The Focus 6 platforms for the Convenience Stores & Foodservice segment consist of cereal, yogurt, snacks, frozen meals, biscuits, andbaking mixes.
Foundation businesses. Foundation businesses consist primarily of refrigerated dough, desserts, and soup in our North America Retail segment and bakeryflour and frozen dough products in our Convenience Stores & Foodservice segment, as well as other product lines not included in Growth businesses.
Free cash flow. Net cash provided by operating activities less purchases of land, buildings, and equipment.
97
Source: GENERAL MILLS INC, 10-K, June 29, 2017 Powered by Morningstar® Document Research℠The information contained herein may not be copied, adapted or distributed and is not warranted to be accurate, complete or timely. The user assumes all risks for any damages or losses arising from any use of this information,except to the extent such damages or losses cannot be limited or excluded by applicable law. Past financial performance is no guarantee of future results.

Table of Contents
Free cash flow conversion rate. Free cash flow divided by our net earnings, including earnings attributable to redeemable and noncontrolling interestsadjusted for certain items affecting year-over-year comparability.
Generally accepted accounting principles (GAAP). Guidelines, procedures, and practices that we are required to use in recording and reporting accountinginformation in our financial statements.
Goodwill. The difference between the purchase price of acquired companies plus the fair value of any noncontrolling and redeemable interests and therelated fair values of net assets acquired.
Growth businesses. Growth businesses include cereal, snack bars, the natural and organic portfolio, hot snacks, Mexican products, and yogurt in our NorthAmerica Retail segment; our Europe & Australia segment; our Asia & Latin America segment; and our Focus 6 platforms in our Convenience Stores &Foodservice segment.
Gross margin. Net sales less cost of sales.
Hedge accounting. Accounting for qualifying hedges that allows changes in a hedging instrument’s fair value to offset corresponding changes in the hedgeditem in the same reporting period. Hedge accounting is permitted for certain hedging instruments and hedged items only if the hedging relationship is highlyeffective, and only prospectively from the date a hedging relationship is formally documented.
Holistic Margin Management (HMM). Company-wide initiative to use productivity savings, mix management and price realization to offset input costinflation, protect margins and generate funds to reinvest in sales-generating activities.
Interest bearing instruments. Notes payable, long-term debt, including current portion, cash and cash equivalents, and certain interest bearing investmentsclassified within prepaid expenses and other current assets and other assets.
LIBOR. London Interbank Offered Rate.
Mark-to-market. The act of determining a value for financial instruments, commodity contracts, and related assets or liabilities based on the current marketprice for that item.
Net mark-to-market valuation of certain commodity positions. Realized and unrealized gains and losses on derivative contracts that will be allocated tosegment operating profit when the exposure we are hedging affects earnings.
Net price realization. The impact of list and promoted price changes, net of trade and other price promotion costs.
Net realizable value. The estimated selling price in the ordinary course of business, less reasonably predictable costs of completion, disposal, andtransportation.
Noncontrolling interests. Interests of consolidated subsidiaries held by third parties.
Notional principal amount. The principal amount on which fixed-rate or floating-rate interest payments are calculated.
OCI. Other comprehensive income (loss).
Operating cash flow conversion rate. Net cash provided by operating activities, divided by net earnings, including earnings attributable to redeemable andnoncontrolling interests.
Operating cash flow to debt ratio. Net cash provided by operating activities, divided by the sum of notes payable and long-term debt, including the currentportion.
Organic net sales growth. Net sales growth adjusted for foreign currency translation, as well as acquisitions, divestitures, and a 53rd week impact, whenapplicable.
Project-related costs. Costs incurred related to our restructuring initiatives not included in restructuring charges.
Redeemable interest. Interest of consolidated subsidiaries held by a third party that can be redeemed outside of our control and therefore cannot be classifiedas a noncontrolling interest in equity.
Reporting unit. An operating segment or a business one level below an operating segment.
98
Source: GENERAL MILLS INC, 10-K, June 29, 2017 Powered by Morningstar® Document Research℠The information contained herein may not be copied, adapted or distributed and is not warranted to be accurate, complete or timely. The user assumes all risks for any damages or losses arising from any use of this information,except to the extent such damages or losses cannot be limited or excluded by applicable law. Past financial performance is no guarantee of future results.

Table of Contents
Return on average total capital. Net earnings including earnings attributable to redeemable and noncontrolling interests, excluding after-tax net interest,divided by average total capital.
Segment operating profit margin. Segment operating profit divided by net sales for the segment.
Strategic Revenue Management (SRM). A company-wide capability focused on generating sustainable benefits from net price realization and mix byidentifying and executing against specific opportunities to apply tools including pricing, sizing, mix management, and promotion optimization across eachof our businesses.
Supply chain input costs. Costs incurred to produce and deliver product, including costs for ingredients and conversion, inventory management, logistics,and warehousing.
Total debt. Notes payable and long-term debt, including current portion.
Translation adjustments. The impact of the conversion of our foreign affiliates’ financial statements to United States dollars for the purpose of consolidatingour financial statements.
Variable interest entities (VIEs). A legal structure that is used for business purposes that either (1) does not have equity investors that have voting rights andshare in all the entity’s profits and losses or (2) has equity investors that do not provide sufficient financial resources to support the entity’s activities.
Working capital. Current assets and current liabilities, all as of the last day of our fiscal year.
ITEM 9 Changes in and Disagreements With Accountants on Accounting and Financial Disclosure
None.
ITEM 9A Controls and Procedures
We, under the supervision and with the participation of our management, including our Chief Executive Officer and Chief Financial Officer, have evaluatedthe effectiveness of the design and operation of our disclosure controls and procedures (as defined in Rule 13a-15(e) under the 1934 Act). Based on thatevaluation, our Chief Executive Officer and Chief Financial Officer have concluded that, as of May 28, 2017, our disclosure controls and procedures wereeffective to ensure that information required to be disclosed by us in reports that we file or submit under the 1934 Act is (1) recorded, processed, summarized,and reported within the time periods specified in applicable rules and forms, and (2) accumulated and communicated to our management, including our ChiefExecutive Officer and Chief Financial Officer, in a manner that allows timely decisions regarding required disclosure.
There were no changes in our internal control over financial reporting (as defined in Rule 13a-15(f) under the 1934 Act) during our fiscal quarter endedMay 28, 2017, that have materially affected, or are reasonably likely to materially affect, our internal control over financial reporting.
99
Source: GENERAL MILLS INC, 10-K, June 29, 2017 Powered by Morningstar® Document Research℠The information contained herein may not be copied, adapted or distributed and is not warranted to be accurate, complete or timely. The user assumes all risks for any damages or losses arising from any use of this information,except to the extent such damages or losses cannot be limited or excluded by applicable law. Past financial performance is no guarantee of future results.
Table of Contents
MANAGEMENT’S REPORT ON INTERNAL CONTROL OVER FINANCIAL REPORTING
The management of General Mills, Inc. is responsible for establishing and maintaining adequate internal control over financial reporting, as such term isdefined in Rule 13a-15(f) under the 1934 Act. The Company’s internal control system was designed to provide reasonable assurance to our management andthe Board of Directors regarding the preparation and fair presentation of published financial statements. Under the supervision and with the participation ofmanagement, including our Chief Executive Officer and Chief Financial Officer, we conducted an assessment of the effectiveness of our internal control overfinancial reporting as of May 28, 2017. In making this assessment, management used the criteria set forth by the Committee of Sponsoring Organizations ofthe Treadway Commission (COSO) in Internal Control – Integrated Framework (2013).
Based on our assessment using the criteria set forth by COSO in Internal Control – Integrated Framework (2013), management concluded that our internalcontrol over financial reporting was effective as of May 28, 2017.
KPMG LLP, our independent registered public accounting firm, has issued a report on the effectiveness of the Company’s internal control over financialreporting. /s/ J. L. Harmening /s/ D. L. Mulligan
J. L. Harmening D. L. MulliganChief Executive Officer Executive Vice President and Chief
Financial Officer
June 29, 2017
Our independent registered public accounting firm’s attestation report on our internal control over financial reporting is included in the “Report ofIndependent Registered Public Accounting Firm” in Item8 of this report.
ITEM 9B Other Information
None.
PART III ITEM 10 Directors, Executive Officers and Corporate Governance
The information contained in the sections entitled “Proposal Number 1 — Election of Directors,” “Shareholder Director Nominations,” and “Section 16(a)Beneficial Ownership Reporting Compliance” contained in our definitive Proxy Statement for our 2017 Annual Meeting of Shareholders is incorporatedherein by reference.
Information regarding our executive officers is set forth in Item 1 of this report.
The information regarding our Audit Committee, including the members of the Audit Committee and audit committee financial experts, set forth in thesection entitled “Board Committees and Their Functions” contained in our definitive Proxy Statement for our 2017 Annual Meeting of Shareholders isincorporated herein by reference.
We have adopted a Code of Conduct applicable to all employees, including our principal executive officer, principal financial officer, and principalaccounting officer. A copy of the Code of Conduct is available on our website at www.generalmills.com. We intend to post on our website any amendmentsto our Code of Conduct and any waivers from our Code of Conduct for principal officers.
ITEM 11 Executive Compensation
The information contained in the sections entitled “Executive Compensation,” “Director Compensation,” and “Overseeing Risk Management” in ourdefinitive Proxy Statement for our 2017 Annual Meeting of Shareholders is incorporated herein by reference.
ITEM 12 Security Ownership of Certain Beneficial Owners and Management and Related Stockholder Matters
The information contained in the section entitled “Ownership of General Mills Common Stock by Directors, Officers and Certain Beneficial Owners” and“Equity Compensation Plan Information” in our definitive Proxy Statement for our 2017 Annual Meeting of Stockholders is incorporated herein byreference.
100
Source: GENERAL MILLS INC, 10-K, June 29, 2017 Powered by Morningstar® Document Research℠The information contained herein may not be copied, adapted or distributed and is not warranted to be accurate, complete or timely. The user assumes all risks for any damages or losses arising from any use of this information,except to the extent such damages or losses cannot be limited or excluded by applicable law. Past financial performance is no guarantee of future results.

Table of Contents
ITEM 13 Certain Relationships and Related Transactions, and Director Independence
The information set forth in the sections entitled “Board Independence and Accountability” and “Related Person Transactions” contained in our definitiveProxy Statement for our 2017 Annual Meeting of Shareholders is incorporated herein by reference.
ITEM 14 Principal Accounting Fees and Services
The information contained in the section entitled “Independent Registered Public Accounting Firm Fees” in our definitive Proxy Statement for our 2017Annual Meeting of Shareholders is incorporated herein by reference.
PART IV ITEM 15 Exhibits, Financial Statement Schedules 1. Financial Statements:
The following financial statements are included in Item 8 of this report:
Consolidated Statements of Earnings for the fiscal years ended May 28, 2017, May 29, 2016, and May 31, 2015.
Consolidated Statements of Comprehensive Income for the fiscal years ended May 28, 2017, May 29, 2016, and May 31, 2015.
Consolidated Balance Sheets as of May 28, 2017 and May 29, 2016.
Consolidated Statements of Cash Flows for the fiscal years ended May 28, 2017, May 29, 2016, and May 31, 2015.
Consolidated Statements of Total Equity and Redeemable Interest for the fiscal years ended May 28, 2017, May 29, 2016, and May 31, 2015.
Notes to Consolidated Financial Statements.
Report of Management Responsibilities.
Report of Independent Registered Public Accounting Firm. 2. Financial Statement Schedule:
For the fiscal years ended May 28, 2017, May 29, 2016, and May 31, 2015:
II – Valuation and Qualifying Accounts 3. Exhibits: Exhibit No. Description
3.1
Restated Certificate of Incorporation of the Registrant (incorporated herein by reference to Exhibit 3.1 to Registrant’s Annual Report onForm 10-K for the fiscal year ended May 31, 2009).
3.2
By-laws of the Registrant (incorporated herein by reference to Exhibit 3.2 to the Registrant’s Current Report on Form 8-K filed March 8,2016).
4.1
Indenture, dated as of February 1, 1996, between the Registrant and U.S. Bank National Association (f/k/a First Trust of Illinois, NationalAssociation) (incorporated herein by reference to Exhibit 4.1 to Registrant’s Registration Statement on Form S-3 filed February 6, 1996(File no. 333-00745)).
4.2
First Supplemental Indenture, dated as of May 18, 2009, between the Registrant and U.S. Bank National Association (incorporated hereinby reference to Exhibit 4.2 to Registrant’s Annual Report on Form 10-K for the fiscal year ended May 31, 2009).
10.1*
2001 Compensation Plan for Non-Employee Directors (incorporated herein by reference to Exhibit 10.2 to Registrant’s Quarterly Reporton Form 10-Q for the fiscal quarter ended August 29, 2010).
101
Source: GENERAL MILLS INC, 10-K, June 29, 2017 Powered by Morningstar® Document Research℠The information contained herein may not be copied, adapted or distributed and is not warranted to be accurate, complete or timely. The user assumes all risks for any damages or losses arising from any use of this information,except to the extent such damages or losses cannot be limited or excluded by applicable law. Past financial performance is no guarantee of future results.
Table of Contents
10.2*
2005 Stock Compensation Plan (incorporated herein by reference to Exhibit 10.4 to Registrant’s Quarterly Report on Form 10-Q for the fiscalquarter ended August 29, 2010).
10.3*
2006 Compensation Plan for Non-Employee Directors (incorporated herein by reference to Exhibit 10.5 to Registrant’s Quarterly Report onForm 10-Q for the fiscal quarter ended August 29, 2010).
10.4*
2007 Stock Compensation Plan (incorporated herein by reference to Exhibit 10.6 to Registrant’s Quarterly Report on Form 10-Q for the fiscalquarter ended August 29, 2010).
10.5*
2009 Stock Compensation Plan (incorporated herein by reference to Exhibit 10.7 to Registrant’s Quarterly Report on Form 10-Q for the fiscalquarter ended August 29, 2010).
10.6*
2011 Stock Compensation Plan (incorporated herein by reference to Exhibit 10.6 to Registrant’s Annual Report on Form 10-K for the fiscalyear ended May 31, 2015).
10.7*
2011 Compensation Plan for Non-Employee Directors (incorporated herein by reference to Exhibit 10.2 to Registrant’s Quarterly Report onForm 10-Q for the fiscal quarter ended November 27, 2011).
10.8*
2016 Compensation Plan for Non-Employee Directors (incorporated herein by reference to Exhibit 10.1 to Registrant’s Quarterly Report onForm 10-Q for the fiscal quarter ended November 27, 2016).
10.9*
Executive Incentive Plan (incorporated herein by reference to Exhibit 10.1 to Registrant’s Quarterly Report on Form 10-Q for the fiscalquarter ended November 28, 2010).
10.10*
Separation Pay and Benefits Program for Officers (incorporated herein by reference to Exhibit 10.11 to Registrant’s Annual Report on Form10-K for the fiscal year ended May 25, 2014).
10.11*
Supplemental Savings Plan (incorporated herein by reference to Exhibit 10.11 to Registrant’s Quarterly Report on Form 10-Q for the fiscalquarter ended February 22, 2009).
10.12*
Supplemental Retirement Plan (Grandfathered) (incorporated herein by reference to Exhibit 10.12 to Registrant’s Quarterly Report on Form10-Q for the fiscal quarter ended February 22, 2009).
10.13*
2005 Supplemental Retirement Plan (incorporated herein by reference to Exhibit 10.13 to Registrant’s Quarterly Report on Form 10-Q for thefiscal quarter ended February 22, 2009).
10.14*
Deferred Compensation Plan (Grandfathered) (incorporated herein by reference to Exhibit 10.14 to Registrant’s Quarterly Report on Form 10-Q for the fiscal quarter ended February 22, 2009).
10.15*
2005 Deferred Compensation Plan (incorporated herein by reference to Exhibit 10.15 to Registrant’s Quarterly Report on Form 10-Q for thefiscal quarter ended February 22, 2009).
10.16*
Executive Survivor Income Plan (incorporated herein by reference to Exhibit 10.6 to Registrant’s Annual Report on Form 10-K for the fiscalyear ended May 29, 2005).
10.17*
Supplemental Benefits Trust Agreement (incorporated herein by reference to Exhibit 10.3 to Registrant’s Quarterly Report on Form 10-Q forthe fiscal quarter ended November 27, 2011).
10.18*
Supplemental Benefits Trust Agreement (incorporated herein by reference to Exhibit 10.4 to Registrant’s Quarterly Report on Form 10-Q forthe fiscal quarter ended November 27, 2011).
10.19*
Form of Performance Share Unit Award Agreement (incorporated herein by reference to Exhibit 10.1 to Registrant’s Quarterly Report on Form10-Q for the fiscal quarter ended August 24, 2014)
10.20
Agreements, dated November 29, 1989, by and between the Registrant and Nestle S.A. (incorporated herein by reference to Exhibit 10.15 toRegistrant’s Annual Report on Form 10-K for the fiscal year ended May 28, 2000).
10.21
Protocol and Addendum No. 1 to Protocol of Cereal Partners Worldwide, dated November 21, 1989, between the Registrant and Nestle S.A.(incorporated herein by reference to Exhibit 10.16 to Registrant’s Annual Report on Form 10-K for the fiscal year ended May 27, 2001).
102
Source: GENERAL MILLS INC, 10-K, June 29, 2017 Powered by Morningstar® Document Research℠The information contained herein may not be copied, adapted or distributed and is not warranted to be accurate, complete or timely. The user assumes all risks for any damages or losses arising from any use of this information,except to the extent such damages or losses cannot be limited or excluded by applicable law. Past financial performance is no guarantee of future results.

Table of Contents
10.22
Addendum No. 2 to the Protocol of Cereal Partners Worldwide, dated March 16, 1993, between the Registrant and Nestle S.A. (incorporatedherein by reference to Exhibit 10.18 to Registrant’s Annual Report on Form 10-K for the fiscal year ended May 30, 2004).
10.23
Addendum No. 3 to the Protocol of Cereal Partners Worldwide, effective as of March 15, 1993, between the Registrant and Nestle S.A.(incorporated herein by reference to Exhibit 10.2 to Registrant’s Annual Report on Form 10-K for the fiscal year ended May 28, 2000).
10.24+
Addenda Nos. 4 and 5 to the Protocol of Cereal Partners Worldwide between the Registrant and Nestle S.A. (incorporated herein by referenceto Exhibit 10.26 to Registrant’s Annual Report on Form 10-K for the fiscal year ended May 31, 2009).
10.25
Addendum No. 10 to the Protocol of Cereal Partners Worldwide, dated January 1, 2010, among the Registrant, Nestle S.A. and CPW S.A.(incorporated herein by reference to Exhibit 10.1 to Registrant’s Quarterly Report on Form 10-Q for the fiscal quarter ended February 28,2010).
10.26+
Addendum No. 11 to the Protocol of Cereal Partners Worldwide, dated July 17, 2012, among the Registrant, Nestle S.A., and CPW S.A.(incorporated herein by reference to Exhibit 10.1 to Registrant’s Quarterly Report on Form 10-Q for the fiscal quarter ended August 26, 2012).
10.27
Five-Year Credit Agreement, dated as of May 18, 2016, among General Mills, Inc., the several financial institutions from time to time party tothe agreement and Bank of America, N.A., as Administrative Agent (incorporated herein by reference to Exhibit 10.1 to Registrant’s CurrentReport on Form 8-K filed May 18, 2016).
10.28
Extension Agreement, dated April 26, 2017, among General Mills Inc., the several financial institutions from time to time party to theagreement and Bank of America, N.A., as Administrative Agent (incorporated herein by reference to Exhibit 10.1 registrant’s Current Reporton Form 8-K filed May 1, 2017).
12.1 Computation of Ratio of Earnings to Fixed Charges.
21.1 Subsidiaries of the Registrant.
23.1 Consent of Independent Registered Public Accounting Firm.
31.1 Certification of Chief Executive Officer pursuant to Section 302 of the Sarbanes-Oxley Act of 2002.
31.2 Certification of Chief Financial Officer pursuant to Section 302 of the Sarbanes-Oxley Act of 2002.
32.1 Certification of Chief Executive Officer pursuant to Section 906 of the Sarbanes-Oxley Act of 2002.
32.2 Certification of Chief Financial Officer pursuant to Section 906 of the Sarbanes-Oxley Act of 2002.
101
The following materials from the Registrant’s Annual Report on Form 10-K for the fiscal year ended May 28, 2017 formatted in eXtensibleBusiness Reporting Language: (i) the Consolidated Balance Sheets; (ii) the Consolidated Statements of Earnings; (iii) the ConsolidatedStatements of Comprehensive Income; (iv) the Consolidated Statements of Total Equity and Redeemable Interest; (v) the ConsolidatedStatements of Cash Flows; (vi) the Notes to Consolidated Financial Statements; and (vii) Schedule II – Valuation of Qualifying Accounts.
* Management contract or compensatory plan or arrangement required to be filed as an exhibit pursuant to Item 15 of Form 10-K.+ Confidential information has been omitted from the exhibit and filed separately with the SEC pursuant to Rule 24b-2 of the Securities Exchange Act of
1934.
Pursuant to Item 601(b)(4)(iii) of Regulation S-K, copies of certain instruments defining the rights of holders of our long-term debt are not filed and, inlieu thereof, we agree to furnish copies to the SEC upon request.
103
Source: GENERAL MILLS INC, 10-K, June 29, 2017 Powered by Morningstar® Document Research℠The information contained herein may not be copied, adapted or distributed and is not warranted to be accurate, complete or timely. The user assumes all risks for any damages or losses arising from any use of this information,except to the extent such damages or losses cannot be limited or excluded by applicable law. Past financial performance is no guarantee of future results.

Table of Contents
ITEM 16 Form 10-K Summary
None.
104
Source: GENERAL MILLS INC, 10-K, June 29, 2017 Powered by Morningstar® Document Research℠The information contained herein may not be copied, adapted or distributed and is not warranted to be accurate, complete or timely. The user assumes all risks for any damages or losses arising from any use of this information,except to the extent such damages or losses cannot be limited or excluded by applicable law. Past financial performance is no guarantee of future results.

Table of Contents
Signatures
Pursuant to the requirements of Section 13 or 15(d) of the Securities Exchange Act of 1934, the registrant has duly caused this report to be signed on itsbehalf by the undersigned, thereunto duly authorized.
GENERAL MILLS, INC.
Dated: June 29, 2017 By: /s/ Jerald A. Young Name: Jerald A. Young Title: Vice President, Controller
105
Source: GENERAL MILLS INC, 10-K, June 29, 2017 Powered by Morningstar® Document Research℠The information contained herein may not be copied, adapted or distributed and is not warranted to be accurate, complete or timely. The user assumes all risks for any damages or losses arising from any use of this information,except to the extent such damages or losses cannot be limited or excluded by applicable law. Past financial performance is no guarantee of future results.
Table of Contents
Pursuant to the requirements of the Securities Exchange Act of 1934, this report has been signed below by the following persons on behalf of the registrantand in the capacities and on the dates indicated.
Signature Title Date
/s/ Jeffrey L HarmeningJeffrey L. Harmening
Chief Executive Officerand Director (Principal Executive Officer)
June 29, 2017
/s/ Donal L. MulliganDonal L. Mulligan
Executive Vice President and Chief FinancialOfficer (Principal Financial Officer)
June 29, 2017
/s/ Jerald A. YoungJerald A. Young
Vice President, Controller(Principal Accounting Officer)
June 29, 2017
/s/ Bradbury H. AndersonBradbury H. Anderson
Director
June 29, 2017
/s/ Alicia S. Boler DavisAlicia S. Boler Davis
Director
June 29, 2017
/s/ R. Kerry ClarkR. Kerry Clark
Director
June 29, 2017
/s/ David M. CordaniDavid M. Cordani
Director
June 29, 2017
/s/ Roger W. Ferguson Jr.Roger W. Ferguson Jr.
Director
June 29, 2017
/s/ Henrietta H. ForeHenrietta H. Fore
Director
June 29, 2017
/s/ Maria G. HenryMaria G. Henry
Director
June 29, 2017
/s/ Heidi G. MillerHeidi G. Miller
Director
June 29, 2017
/s/ Steve OdlandSteve Odland
Director
June 29, 2017
/s/ Kendall J. PowellKendall J. Powell
Chairman of the Board and Director
June 29, 2017
/s/ Robert L. RyanRobert L. Ryan
Director
June 29, 2017
/s/ Eric D. SprunkEric D. Sprunk
Director
June 29, 2017
/s/ Dorothy A. TerrellDorothy A. Terrell
Director
June 29, 2017
/s/ Jorge A. UribeJorge A. Uribe
Director
June 29, 2017
106
Source: GENERAL MILLS INC, 10-K, June 29, 2017 Powered by Morningstar® Document Research℠The information contained herein may not be copied, adapted or distributed and is not warranted to be accurate, complete or timely. The user assumes all risks for any damages or losses arising from any use of this information,except to the extent such damages or losses cannot be limited or excluded by applicable law. Past financial performance is no guarantee of future results.

Table of Contents
General Mills, Inc. and SubsidiariesSchedule II—Valuation of Qualifying Accounts Fiscal Year In Millions 2017 2016 2015 Allowance for doubtful accounts: Balance at beginning of year $ 29.6 $ 25.3 $ 21.0 Additions charged to expense 16.6 21.4 19.8 Bad debt write-offs (23.2) (17.5) (12.5) Other adjustments and reclassifications 1.3 0.4 (3.0) Balance at end of year $ 24.3 $ 29.6 $ 25.3 Valuation allowance for deferred tax assets: Balance at beginning of year $ 227.0 $215.4 $221.6 Additions charged to expense 5.2 (1.5) 2.9 Adjustments due to acquisitions, translation of amounts, and other (0.4) 13.1 (9.1) Balance at end of year $ 231.8 $227.0 $215.4 Reserve for restructuring and other exit charges: Balance at beginning of year $ 76.6 $120.8 $ 3.5 Additions charged to expense, including translation amounts 104.0 70.2 185.1 Net amounts utilized for restructuring activities (95.6) (114.4) (67.8) Balance at end of year $ 85.0 $76.6 $120.8 Reserve for LIFO valuation: Balance at beginning of year $ 219.3 $214.2 $216.9 Increase (decrease) (10.2) 5.1 (2.7) Balance at end of year $ 209.1 $219.3 $214.2
107
Source: GENERAL MILLS INC, 10-K, June 29, 2017 Powered by Morningstar® Document Research℠The information contained herein may not be copied, adapted or distributed and is not warranted to be accurate, complete or timely. The user assumes all risks for any damages or losses arising from any use of this information,except to the extent such damages or losses cannot be limited or excluded by applicable law. Past financial performance is no guarantee of future results.

Table of Contents
Exhibit Index Exhibit No. Description
12.1 Computation of Ratio of Earnings to Fixed Charges.
21.1 Subsidiaries of the Registrant.
23.1 Consent of Independent Registered Public Accounting Firm.
31.1 Certification of Chief Executive Officer pursuant to Section 302 of the Sarbanes-Oxley Act of 2002.
31.2 Certification of Chief Financial Officer pursuant to Section 302 of the Sarbanes-Oxley Act of 2002.
32.1 Certification of Chief Executive Officer pursuant to Section 906 of the Sarbanes-Oxley Act of 2002.
32.2 Certification of Chief Financial Officer pursuant to Section 906 of the Sarbanes-Oxley Act of 2002.
101
The following materials from the Registrant’s Annual Report on Form 10-K for the fiscal year ended May 28, 2017 formatted ineXtensible Business Reporting Language: (i) the Consolidated Balance Sheets; (ii) the Consolidated Statements of Earnings; (iii) theConsolidated Statements of Comprehensive Earnings; (iv) the Consolidated Statements of Total Equity and Redeemable Interest; (v)the Consolidated Statements of Cash Flows; (vi) the Notes to Consolidated Financial Statements; and (vii) Schedule II – Valuation ofQualifying Accounts.
108
Source: GENERAL MILLS INC, 10-K, June 29, 2017 Powered by Morningstar® Document Research℠The information contained herein may not be copied, adapted or distributed and is not warranted to be accurate, complete or timely. The user assumes all risks for any damages or losses arising from any use of this information,except to the extent such damages or losses cannot be limited or excluded by applicable law. Past financial performance is no guarantee of future results.

EXHIBIT 12.1
COMPUTATION OF RATIO OF EARNINGS TO FIXED CHARGES Fiscal Year Ended
In Millions, Except Ratios May 28,
2017 May 29,
2016 May 31,
2015 May 25,
2014 May 26,
2013 Earnings before income taxes and after-tax earnings from joint ventures $2,271.3 $2,403.6 $1,761.9 $2,655.0 $2,534.9 Distributed income of equity investees 75.6 75.1 72.6 90.5 115.7 Plus: Fixed charges (1) 374.8 386.8 403.5 389.8 400.1 Plus: Amortization of capitalized interest, net of interest capitalized (0.9) (3.4) (3.0) (0.8) (0.4) Earnings available to cover fixed charges $2,720.8 $2,862.1 $2,235.0 $3,134.5 $3,050.3 Ratio of earnings to fixed charges 7.26 7.40 5.54 8.04 7.62 (1) Fixed charges:
Interest expense $ 306.7 $ 319.6 $ 335.5 $ 323.4 $ 333.8 Preferred distributions to noncontrolling interests 5.4 4.2 3.5 3.4 3.7 Rentals (1/3) 62.7 63.0 64.5 63.0 62.6
Total fixed charges $ 374.8 $ 386.8 $ 403.5 $ 389.8 $ 400.1
For purposes of computing the ratio of earnings to fixed charges, earnings represent earnings before income taxes and after-tax earnings of joint ventures,distributed income of equity investees, fixed charges, and amortization of capitalized interest, net of interest capitalized. Fixed charges represent grossinterest expense (excluding interest on taxes) and subsidiary preferred distributions to noncontrolling interest holders, plus one-third (the proportion deemedrepresentative of the interest factor) of rent expense.
Source: GENERAL MILLS INC, 10-K, June 29, 2017 Powered by Morningstar® Document Research℠The information contained herein may not be copied, adapted or distributed and is not warranted to be accurate, complete or timely. The user assumes all risks for any damages or losses arising from any use of this information,except to the extent such damages or losses cannot be limited or excluded by applicable law. Past financial performance is no guarantee of future results.

Exhibit 21.1
Subsidiaries of the Registrant Company Name CountryAB F C.V. NetherlandsAESR, LLC DelawareANNIE’S BAKING, LLC DelawareANNIE’S ENTERPRISES, INC. VermontANNIE’S HOMEGROWN, INC. DelawareANNIE’S, INC. DelawareC.P.A. CEREAL PARTNERS HANDELSGESELLSCHAFT m.b.H & Co. OHG AustriaC.P.D. CEREAL PARTNERS DEUTSCHLAND GmbH & Co. oHG GermanyC.P.W. HELLAS BREAKFAST CEREALS SOCIETE ANONYME GreeceC.P.W. MEXICO S. de R.L. de C.V. MexicoCEREAL ASSOCIADOS PORTUGAL, A.E.I.E. PortugalCEREAL PARTNERS (MALAYSIA) SDN. BHD. MalaysiaCEREAL PARTNERS AUSTRALIA PTY LIMITED AustraliaCEREAL PARTNERS CZECH REPUBLIC, s.r.o. Czech RepublicCEREAL PARTNERS ESPANA, A.E.I.E. SpainCEREAL PARTNERS FRANCE, SNC FranceCEREAL PARTNERS GIDA TICARET LIMITED SIRKETI TurkeyCEREAL PARTNERS HUNGARIA KFT. HungaryCEREAL PARTNERS MEXICO, S.A. DE C.V. MexicoCEREAL PARTNERS NIGERIA LIMITED NigeriaCEREAL PARTNERS POLAND TORUN-PACIFIC Sp. z.o.o. PolandCEREAL PARTNERS RUS LLC Russian FederationCEREAL PARTNERS SLOVAK REPUBLIC, s.r.o. SlovakiaCEREAL PARTNERS U.K. United KingdomCEREALES C.P.W. CHILE LIMITADA (SRL) ChileCEREALES CPW PERU LIMITADA PeruCEREALES PARTNERS LATIN AMERICA LLC, SUCURSAL COLOMBIA ColombiaCEREALES PARTNERS LATIN AMERICA LLC DelawareCOLOMBO, INC. DelawareCP COLOMBIA ACP ColombiaCP MIDDLE EAST FZCO United Arab EmiratesCP SUISSE SwitzerlandCPW AMA DWC—LLC United Arab EmiratesCPW BRASIL LTDA. BrazilCPW CEREAL PARTNERS WORLDWIDE—Breakfast Cereals Joint Venture SwitzerlandCPW DOMINICAN REPUBLIC Dominican RepublicCPW HONG KONG LIMITED Hong KongCPW NEW ZEALAND New ZealandCPW OPERATIONS S.A.R.L. SwitzerlandCPW PHILIPPINES, INC. PhilippinesCPW ROMANIA Romania
Source: GENERAL MILLS INC, 10-K, June 29, 2017 Powered by Morningstar® Document Research℠The information contained herein may not be copied, adapted or distributed and is not warranted to be accurate, complete or timely. The user assumes all risks for any damages or losses arising from any use of this information,except to the extent such damages or losses cannot be limited or excluded by applicable law. Past financial performance is no guarantee of future results.

CPW S.A. SwitzerlandCPW SINGAPORE (PTE.) LTD. SingaporeCPW TIANJIN LIMITED ChinaEPIC PROVISIONS, LLC DelawareFOODSHOULDTASTEGOOD, INC. DelawareGARDETTO’S BAKERY, INC. WisconsinGCOM ENTERPRISES, INC. DelawareGENERAL MILLS (CHINA) HOLDING CO., LTD. ChinaGENERAL MILLS (THAILAND) COMPANY LIMITED ThailandGENERAL MILLS ARGENTINA L.S., LLC DelawareGENERAL MILLS ASIA PTE. LTD. SingaporeGENERAL MILLS AUSTRALIA PTY LTD AustraliaGENERAL MILLS BELGIUM, VOF BelgiumGENERAL MILLS BELGIUM, VOF, PORTUGAL BRANCH PortugalGENERAL MILLS BERWICK LIMITED United KingdomGENERAL MILLS BRASIL ALIMENTOS LTDA BrazilGENERAL MILLS CANADA B.V. NetherlandsGENERAL MILLS CANADA CORPORATION CanadaGENERAL MILLS CANADA HOLDING FIVE LIMITED PARTNERSHIP CanadaGENERAL MILLS CANADA HOLDING FOUR CORPORATION CanadaGENERAL MILLS CANADA HOLDING ONE CORPORATION CanadaGENERAL MILLS CANADA HOLDING SIX CORPORATION CanadaGENERAL MILLS CANADA HOLDING THREE CORPORATION CanadaGENERAL MILLS CANADA HOLDING TWO CORPORATION CanadaGENERAL MILLS CAPITAL, INC. NevadaGENERAL MILLS CEREALS, LLC DelawareGENERAL MILLS CHINA HOLDINGS LIMITED MauritiusGENERAL MILLS CONTINENTAL INC. S.A. ChileGENERAL MILLS DE MEXICO, S. DE R.L. DE C.V. MexicoGENERAL MILLS DIRECT MARKETING, INC. DelawareGENERAL MILLS DL GP DelawareGENERAL MILLS EASTERN EUROPE s.r.o. Czech RepublicGENERAL MILLS ESPANA B.V. NetherlandsGENERAL MILLS ESPANA B.V.—SPANISH BRANCH SpainGENERAL MILLS FINANCE, INC. DelawareGENERAL MILLS FOOD PRODUCTS INDIA PRIVATE LIMITED IndiaGENERAL MILLS FOODS (NANJING) CO. LTD. ChinaGENERAL MILLS FOODS (SANHE) CO., LTD. ChinaGENERAL MILLS FOODS ASIA LIMITED Hong KongGENERAL MILLS FOUNDATION MinnesotaGENERAL MILLS FRANCE SAS FranceGENERAL MILLS FROZEN FOODS (GUANGZHOU) LIMITED Hong KongGENERAL MILLS FROZEN FOODS (SHANGHAI) LIMITED Hong KongGENERAL MILLS GLOBAL FINANCE LTD. BermudaGENERAL MILLS GLOBAL HOLDINGS EIGHT GP Bermuda
Source: GENERAL MILLS INC, 10-K, June 29, 2017 Powered by Morningstar® Document Research℠The information contained herein may not be copied, adapted or distributed and is not warranted to be accurate, complete or timely. The user assumes all risks for any damages or losses arising from any use of this information,except to the extent such damages or losses cannot be limited or excluded by applicable law. Past financial performance is no guarantee of future results.

GENERAL MILLS GLOBAL HOLDINGS ELEVEN GP BermudaGENERAL MILLS GLOBAL HOLDINGS FIVE GP BermudaGENERAL MILLS GLOBAL HOLDINGS NINE GP BermudaGENERAL MILLS GLOBAL HOLDINGS SIX LTD. BermudaGENERAL MILLS GLOBAL HOLDINGS TEN GP BermudaGENERAL MILLS GLOBAL HOLDINGS TWELVE GP BermudaGENERAL MILLS GLOBAL HOLDINGS TWO GP BermudaGENERAL MILLS GMBH GermanyGENERAL MILLS HELLAS S.A. GreeceGENERAL MILLS HOLDING (AUSTRALIA) PTY LIMITED AustraliaGENERAL MILLS HOLDING (FRANCE) SAS FranceGENERAL MILLS HOLDING (U.K.) LIMITED United KingdomGENERAL MILLS HOLDING A (NETHERLANDS) B.V. NetherlandsGENERAL MILLS HOLDING B.V. NetherlandsGENERAL MILLS HOLDING C (NETHERLANDS) B.V. NetherlandsGENERAL MILLS HOLDING D (NETHERLANDS) B.V. NetherlandsGENERAL MILLS HOLDING F (NETHERLANDS) B.V. NetherlandsGENERAL MILLS HOLDING G (NETHERLANDS) B.V. NetherlandsGENERAL MILLS HOLDING H (NETHERLANDS) B.V. NetherlandsGENERAL MILLS HOLDING J (NETHERLANDS) B.V. NetherlandsGENERAL MILLS HOLDING ONE (GERMANY) GmbH GermanyGENERAL MILLS HONG KONG LIMITED Hong KongGENERAL MILLS IBERICA, S.A. UNIPERSONAL SpainGENERAL MILLS INDIA PRIVATE LIMITED IndiaGENERAL MILLS INTERNATIONAL BUSINESSES TWO, INC. DelawareGENERAL MILLS INTERNATIONAL BUSINESSES, INC. DelawareGENERAL MILLS INTERNATIONAL FINANCE, LLC DelawareGENERAL MILLS INTERNATIONAL FRANCE SAS FranceGENERAL MILLS INTERNATIONAL HOLDINGS, LLC (Dutch Tax Resident) DelawareGENERAL MILLS INTERNATIONAL LIMITED DelawareGENERAL MILLS INTERNATIONAL LIMITED, JAPANESE BRANCH JapanGENERAL MILLS INTERNATIONAL SÀRL SwitzerlandGENERAL MILLS IP HOLDINGS I, LLC DelawareGENERAL MILLS IP HOLDINGS II, LLC DelawareGENERAL MILLS ISRAEL LTD IsraelGENERAL MILLS ITALIA SRL ItalyGENERAL MILLS KOREA CO., LTD. Korea, Republic ofGENERAL MILLS LANDES (SAS) FranceGENERAL MILLS LUXEMBOURG FINANCE S.A R.L. LuxembourgGENERAL MILLS LUXEMBOURG FINANCE S.A.R.L, NYON BRANCH SwitzerlandGENERAL MILLS LUXEMBOURG ONE S.A. R.L. LuxembourgGENERAL MILLS LUXEMBOURG ONE, U.S. BRANCH MinnesotaGENERAL MILLS LUXEMBOURG S.A.R.L. LuxembourgGENERAL MILLS MAARSSEN HOLDING, INC. DelawareGENERAL MILLS MALAYSIA SDN. BHD. Malaysia
Source: GENERAL MILLS INC, 10-K, June 29, 2017 Powered by Morningstar® Document Research℠The information contained herein may not be copied, adapted or distributed and is not warranted to be accurate, complete or timely. The user assumes all risks for any damages or losses arising from any use of this information,except to the extent such damages or losses cannot be limited or excluded by applicable law. Past financial performance is no guarantee of future results.

GENERAL MILLS MANUFACTURING AUSTRALIA PTY LIMITED AustraliaGENERAL MILLS MARKETING, INC. DelawareGENERAL MILLS MAURITIUS, INC. MauritiusGENERAL MILLS MENAT DMCC United Arab EmiratesGENERAL MILLS MIDDLE EAST & NORTH AFRICA FZE United Arab EmiratesGENERAL MILLS MIDDLE EAST SAL LebanonGENERAL MILLS MISSOURI, INC. MinnesotaGENERAL MILLS NEW ZEALAND LIMITED New ZealandGENERAL MILLS NORWAY AS NorwayGENERAL MILLS OPERATIONS, LLC DelawareGENERAL MILLS PENSION TRUSTEE LIMITED United KingdomGENERAL MILLS PROPERTIES, INC. New YorkGENERAL MILLS RH, INC. DelawareGENERAL MILLS RIGHTS HOLDINGS, LLC DelawareGENERAL MILLS SALES, INC. DelawareGENERAL MILLS SALES, INC., PUERTO RICO BRANCH Puerto RicoGENERAL MILLS SAN ADRIAN, S.L. UNIPERSONAL SpainGENERAL MILLS SCANDINAVIA AB SwedenGENERAL MILLS SERVICES (UK) LTD. United KingdomGENERAL MILLS SERVICES, INC. DelawareGENERAL MILLS SINGAPORE PTE. LTD. SingaporeGENERAL MILLS SOUTH AFRICA (PROPRIETARY) LIMITED South AfricaGENERAL MILLS SPECIALTY PRODUCTS, LLC DelawareGENERAL MILLS SWISS FOUR GMBH SwitzerlandGENERAL MILLS SWISS THREE GMBH SwitzerlandGENERAL MILLS TAIWAN LIMITED TaiwanGENERAL MILLS TRADING (SHANGHAI) CO. LIMITED ChinaGENERAL MILLS UK LIMITED United KingdomGENERAL MILLS VENTAS DE MEXICO, S. DE R.L. DE C.V. MexicoGENERAL MILLS, INC. DelawareGIGANTE VERDE S. de R.L. de C.V. MexicoGIGANTE VERDE, LLC DelawareGLOBAL HOLDINGS ONE MANAGEMENT LLC DelawareGM CEREALS HOLDINGS, INC. DelawareGM CEREALS MANAGER, INC. DelawareGM CEREALS PROPERTIES, INC. DelawareGREEN GIANT INTERNATIONAL, LLC MinnesotaGUANGZHOU PILLSBURY V. PEARL FOODS CO., LTD. ChinaHAAGEN-DAZS ARRAS SNC FranceHAAGEN-DAZS BELGIUM (BV BA) BelgiumHAAGEN-DAZS INTERNATIONAL SHOPPE COMPANY, INC. MinnesotaHAAGEN-DAZS JAPAN, INC. JapanHAAGEN-DAZS KOREA CO., LTD. Korea, Republic ofHAAGEN-DAZS NEDERLAND N.V. NetherlandsHD DISTRIBUTORS (THAILAND) CO., LTD. Thailand
Source: GENERAL MILLS INC, 10-K, June 29, 2017 Powered by Morningstar® Document Research℠The information contained herein may not be copied, adapted or distributed and is not warranted to be accurate, complete or timely. The user assumes all risks for any damages or losses arising from any use of this information,except to the extent such damages or losses cannot be limited or excluded by applicable law. Past financial performance is no guarantee of future results.

HD MARKETING & DISTRIBUTION SDN. BHD. MalaysiaHDIP, INC. DelawareIMMACULATE BAKING COMPANY DelawareINO FITA GMBH GermanyKAMPOS ESTIASI S.A. GreeceKCLM RESEARCH IN NUTRITION INC. CanadaLA SALTENA S.A. ArgentinaLATICINIOS CAROLINA LTDA BrazilLIBERTE MARQUES SARL LuxembourgLIBERTÉ USA, LLC DelawareMILL CITY, LLC DelawareMOUNTAIN HIGH LLC DelawareNAPA VALLEY KITCHENS, INC. CaliforniaNOBLEVAL SARL FranceNORTHGATE PARTNERS LLC North DakotaPET INCORPORATED DelawarePINEDALE HOLDINGS PTE LIMITED SingaporeRODOVERY TRANSPORTES LTDA BrazilSERETRAM (SAS) FranceSHANGHAI HAAGEN-DAZS FOOD TRADING CO., LTD. ChinaSHANGHAI PILLSBURY FROZEN FOODS, LIMITED ChinaSMALL PLANET FOODS, INC. WashingtonSODIMA SAS FranceTHE PASTA MASTER PTY. LTD. AustraliaTHE PILLSBURY COMPANY, LLC DelawareTRANSYOKI—TRANSPORTES YOKI LTDA. BrazilWASHBURN INVESTMENT OFFICE LLC DelawareY.O. C.V. NetherlandsYOKI DISTRIBUIDORA DE ALIMENTOS LTDA. BrazilYOPLAIT BENELUX NV BelgiumYOPLAIT BRANDCO HOLDING A (FRANCE) SAS FranceYOPLAIT CANADA HOLDING CO./YOPLAIT CANADA HOLDING CIE CanadaYOPLAIT DAIRY CO., LTD. ChinaYOPLAIT FRANCE SAS FranceYOPLAIT INTERNATIONAL SARL SwitzerlandYOPLAIT IRELAND LIMITED IrelandYOPLAIT LIBERTE CANADA CO./YOPLAIT LIBERTE CANADA CIE CanadaYOPLAIT MARQUES SNC FranceYOPLAIT SAS FranceYOPLAIT SVERIGE AB SwedenYOPLAIT UK LTD United KingdomYOPLAIT USA, INC. Delaware
Source: GENERAL MILLS INC, 10-K, June 29, 2017 Powered by Morningstar® Document Research℠The information contained herein may not be copied, adapted or distributed and is not warranted to be accurate, complete or timely. The user assumes all risks for any damages or losses arising from any use of this information,except to the extent such damages or losses cannot be limited or excluded by applicable law. Past financial performance is no guarantee of future results.

Exhibit 23.1
Consent of Independent Registered Public Accounting Firm
The Board of Directors and StockholdersGeneral Mills, Inc.:
We consent to the incorporation by reference in the registration statements (Nos. 333-198079 and 333-202215) on Form S-3 and registration statements(Nos. 2-50327, 2-53523, 2-95574, 33-27628, 33-32059, 333-32509, 333-90012, 333-131195, 333-139997, 333-148820, 333-163849, 333-179622, and333-215259) on Form S-8 of General Mills, Inc. of our report dated June 29, 2017, with respect to the consolidated balance sheets of General Mills, Inc. as ofMay 28, 2017 and May 29, 2016, and the related consolidated statements of earnings, comprehensive income, total equity and redeemable interest, and cashflows for each of the fiscal years in the three-year period ended May 28, 2017, and the related financial statement schedule, and the effectiveness of internalcontrol over financial reporting as of May 28, 2017, which report appears in the May 28, 2017 annual report on Form 10-K of General Mills, Inc.
/s/ KPMG LLPMinneapolis, MinnesotaJune 29, 2017
Source: GENERAL MILLS INC, 10-K, June 29, 2017 Powered by Morningstar® Document Research℠The information contained herein may not be copied, adapted or distributed and is not warranted to be accurate, complete or timely. The user assumes all risks for any damages or losses arising from any use of this information,except to the extent such damages or losses cannot be limited or excluded by applicable law. Past financial performance is no guarantee of future results.

EXHIBIT 31.1
CERTIFICATION PURSUANT TO SECTION 302 OF THE SARBANES-OXLEY ACT OF 2002
I, Jeffrey L. Harmening, certify that:
1. I have reviewed this annual report on Form 10-K of General Mills, Inc.;
2. Based on my knowledge, this report does not contain any untrue statement of a material fact or omit to state a material fact necessary to make thestatements made, in light of the circumstances under which such statements were made, not misleading with respect to the period covered by this report;
3. Based on my knowledge, the financial statements, and other financial information included in this report, fairly present in all material respects thefinancial condition, results of operations and cash flows of the registrant as of, and for, the periods presented in this report;
4. The registrant’s other certifying officer and I are responsible for establishing and maintaining disclosure controls and procedures (as defined inExchange Act Rules 13a-15(e) and 15d-15(e)) and internal control over financial reporting (as defined in Exchange Act Rules 13a-15(f) and 15d-15(f)) for theregistrant and have:
(a) designed such disclosure controls and procedures, or caused such disclosure controls and procedures to be designed under our supervision, toensure that material information relating to the registrant, including its consolidated subsidiaries, is made known to us by others within those entities,particularly during the period in which this report is being prepared;
(b) designed such internal control over financial reporting, or caused such internal control over financial reporting to be designed under oursupervision, to provide reasonable assurance regarding the reliability of financial reporting and the preparation of financial statements for external purposesin accordance with generally accepted accounting principles;
(c) evaluated the effectiveness of the registrant’s disclosure controls and procedures and presented in this report our conclusions about the effectivenessof the disclosure controls and procedures, as of the end of the period covered by this report based on such evaluation; and
(d) disclosed in this report any change in the registrant’s internal control over financial reporting that occurred during the registrant’s most recent fiscalquarter (the registrant’s fourth fiscal quarter in the case of an annual report) that has materially affected, or is reasonably likely to materially affect, theregistrant’s internal control over financial reporting; and
5. The registrant’s other certifying officer and I have disclosed, based on our most recent evaluation of internal control over financial reporting, to theregistrant’s auditors and the audit committee of the registrant’s board of directors (or persons performing the equivalent functions):
(a) all significant deficiencies and material weaknesses in the design or operation of internal control over financial reporting which are reasonablylikely to adversely affect the registrant’s ability to record, process, summarize and report financial information; and
(b) any fraud, whether or not material, that involves management or other employees who have a significant role in the registrant’s internal control overfinancial reporting.
Date: June 29, 2017
/s/ Jeffrey L. Harmening
Jeffrey L. HarmeningChief Executive Officer
Source: GENERAL MILLS INC, 10-K, June 29, 2017 Powered by Morningstar® Document Research℠The information contained herein may not be copied, adapted or distributed and is not warranted to be accurate, complete or timely. The user assumes all risks for any damages or losses arising from any use of this information,except to the extent such damages or losses cannot be limited or excluded by applicable law. Past financial performance is no guarantee of future results.

EXHIBIT 31.2
CERTIFICATION PURSUANT TO SECTION 302 OF THE SARBANES-OXLEY ACT OF 2002
I, Donal L. Mulligan, certify that:
1. I have reviewed this annual report on Form 10-K of General Mills, Inc.;
2. Based on my knowledge, this report does not contain any untrue statement of a material fact or omit to state a material fact necessary to make thestatements made, in light of the circumstances under which such statements were made, not misleading with respect to the period covered by this report;
3. Based on my knowledge, the financial statements, and other financial information included in this report, fairly present in all material respects thefinancial condition, results of operations and cash flows of the registrant as of, and for, the periods presented in this report;
4. The registrant’s other certifying officer and I are responsible for establishing and maintaining disclosure controls and procedures (as defined inExchange Act Rules 13a-15(e) and 15d-15(e)) and internal control over financial reporting (as defined in Exchange Act Rules 13a-15(f) and 15d-15(f)) for theregistrant and have:
(a) designed such disclosure controls and procedures, or caused such disclosure controls and procedures to be designed under our supervision, toensure that material information relating to the registrant, including its consolidated subsidiaries, is made known to us by others within those entities,particularly during the period in which this report is being prepared;
(b) designed such internal control over financial reporting, or caused such internal control over financial reporting to be designed under oursupervision, to provide reasonable assurance regarding the reliability of financial reporting and the preparation of financial statements for external purposesin accordance with generally accepted accounting principles;
(c) evaluated the effectiveness of the registrant’s disclosure controls and procedures and presented in this report our conclusions about the effectivenessof the disclosure controls and procedures, as of the end of the period covered by this report based on such evaluation; and
(d) disclosed in this report any change in the registrant’s internal control over financial reporting that occurred during the registrant’s most recent fiscalquarter (the registrant’s fourth fiscal quarter in the case of an annual report) that has materially affected, or is reasonably likely to materially affect, theregistrant’s internal control over financial reporting; and
5. The registrant’s other certifying officer and I have disclosed, based on our most recent evaluation of internal control over financial reporting, to theregistrant’s auditors and the audit committee of the registrant’s board of directors (or persons performing the equivalent functions):
(a) all significant deficiencies and material weaknesses in the design or operation of internal control over financial reporting which are reasonablylikely to adversely affect the registrant’s ability to record, process, summarize and report financial information; and
(b) any fraud, whether or not material, that involves management or other employees who have a significant role in the registrant’s internal control overfinancial reporting.
Date: June 29, 2017
/s/ Donal L. Mulligan
Donal L. MulliganExecutive Vice President andChief Financial Officer
Source: GENERAL MILLS INC, 10-K, June 29, 2017 Powered by Morningstar® Document Research℠The information contained herein may not be copied, adapted or distributed and is not warranted to be accurate, complete or timely. The user assumes all risks for any damages or losses arising from any use of this information,except to the extent such damages or losses cannot be limited or excluded by applicable law. Past financial performance is no guarantee of future results.

EXHIBIT 32.1
CERTIFICATION PURSUANT TO SECTION 906 OF THE SARBANES-OXLEY ACT OF 2002
I, Jeffrey L. Harmening , Chief Executive Officer of General Mills, Inc. (the “Company”), certify, pursuant to Section 906 of the Sarbanes-Oxley Act of 2002,18 U.S.C. Section 1350, that:
(1) the Annual Report on Form 10-K of the Company for the fiscal year ended May 28, 2017 (the “Report”), fully complies with the requirements ofSection 13(a) or 15(d) of the Securities Exchange Act of 1934 (15 U.S.C. 78m or 78o(d)); and
(2) the information contained in the Report fairly presents, in all material respects, the financial condition and results of operations of the Company.
Date: June 29, 2017
/s/ Jeffrey L. Harmening
Jeffrey L. HarmeningChief Executive Officer
Source: GENERAL MILLS INC, 10-K, June 29, 2017 Powered by Morningstar® Document Research℠The information contained herein may not be copied, adapted or distributed and is not warranted to be accurate, complete or timely. The user assumes all risks for any damages or losses arising from any use of this information,except to the extent such damages or losses cannot be limited or excluded by applicable law. Past financial performance is no guarantee of future results.

EXHIBIT 32.2
CERTIFICATION PURSUANT TO SECTION 906 OF THE SARBANES-OXLEY ACT OF 2002
I, Donal L. Mulligan, Executive Vice President and Chief Financial Officer of General Mills, Inc. (the “Company”), certify, pursuant to Section 906 of theSarbanes-Oxley Act of 2002, 18 U.S.C. Section 1350, that:
(1) the Annual Report on Form 10-K of the Company for the fiscal year ended May 28, 2017 (the “Report”), fully complies with the requirements ofSection 13(a) or 15(d) of the Securities Exchange Act of 1934 (15 U.S.C. 78m or 78o(d)); and
(2) the information contained in the Report fairly presents, in all material respects, the financial condition and results of operations of the Company.
Date: June 29, 2017
/s/ Donal L. Mulligan
Donal L. MulliganExecutive Vice President andChief Financial Officer
Source: GENERAL MILLS INC, 10-K, June 29, 2017 Powered by Morningstar® Document Research℠The information contained herein may not be copied, adapted or distributed and is not warranted to be accurate, complete or timely. The user assumes all risks for any damages or losses arising from any use of this information,except to the extent such damages or losses cannot be limited or excluded by applicable law. Past financial performance is no guarantee of future results.

Source: GENERAL MILLS INC, 10-K, June 29, 2017 Powered by Morningstar® Document Research℠The information contained herein may not be copied, adapted or distributed and is not warranted to be accurate, complete or timely. The user assumes all risks for any damages or losses arising from any use of this information,except to the extent such damages or losses cannot be limited or excluded by applicable law. Past financial performance is no guarantee of future results.


