Embed Size (px)
Citation preview

Morphological Behaviour of Thermoplastic
Polyurethanes During Repeated Deformation
Peter R. Laity,*1 Jennifer E. Taylor,1 Steven S. Wong,2 Peck Khunkamchoo,2 Martin Cable,3
Geoffrey T. Andrews,3 Anthony F. Johnson,2 Ruth E. Cameron1
1 Department of Materials Science and Metallurgy, University of Cambridge, New Museums Site,Pembroke St. Cambridge, CB2 3QZ, UKE-mail: [email protected]
2 IRC in Polymer Science and Technology, School of Chemistry, University of Leeds, LS2 9JT, UK3 Ranier Technology Ltd. Greenhouse Park Innovation Centre, Newmarket Rd. Cambridge, CB1 5AS, UK
Received: October 6, 2005; Revised: January 12, 2006; Accepted: January 19, 2006; DOI: 10.1002/mame.200500339
Keywords: mechanical properties; morphology; polyurethanes; small-angle x-ray scattering (SAXS)
Introduction
It is generally accepted that the mechanical properties of
thermoplastic polyurethanes (TPUs) depend on their micro-
phase-separated morphologies, which develop due to immi-
scibility between ‘hard’ urethane-containing segments
(HS) and more flexible ‘soft’ segments (SS).[1–12] The HS
microdomains act as physical crosslinks and reinforcing
filler particles, while the SS microdomains impart elastic
properties.
To a first approximation, the mechanical properties
of TPUs appear ‘rubberlike’. The stress-strain curves of
softer TPUs can be fitted well using hyperelasticity
models,[11] such as that described recently by Kluppel and
Schramm:[13]
s ¼ Gcðl� l�2Þ
�(
1 � z
½1 � zðl2 þ 2l�1 � 3Þ�2� z
1 � zðl2 þ 2l�1 � 3Þ
þ Geðl�1=2 � l�2Þ)
ð1Þ
where s is the engineering stress (force divided by initial
cross-section area) and l is the extension ratio, which is
Summary: SAXS was used to investigate the morphologicalresponses of two commercial thermoplastic poly(ether-co-urethane) elastomers during repeated uniaxial extension andstress-relaxation at constant strain. Experimental data wasanalysed using a ‘globular’ morphological model, which haspreviously been shown to provide a good interpretation of theSAXS from these polymers. The results indicated thatmicrodomain rotation and fragmentation coincided withand may have contributed to the strain-softening observedduring the initial deformation cycles and stress relaxation.However, these morphological changes appeared to belargely reversed, when the material was allowed to retract;consequently, they appeared insufficient to account for thedramatic changes in mechanical properties and permanent setobserved between the first and second extension cycles. Onepossible explanation is that the mechanical properties mayhave been dominated by a few, larger microdomains that weretoo large to be observed by SAXS. Alternatively, theconsiderable changes in scattering intensity suggested a
mechanism based on the slippage of entanglements as a resultof strain-induced segmental mixing.
2D-SAXS patterns of poly(ether-co-urethane)s duringsecond uniaxial extension.
Macromol. Mater. Eng. 2006, 291, 301–324 � 2006 WILEY-VCH Verlag GmbH & Co. KGaA, Weinheim
Full Paper DOI: 10.1002/mame.200500339 301
related to engineering strain (l¼ 1þ e). This model relates
the mechanical properties to the effects of permanent
crosslinks and topological constraints imposed on the
polymer chain within the tube model, which are described
by Gc and Ge respectively. The contribution from topo-
logical constraints may be significant at low strain, but
decreases as the chains become progressively less con-
voluted at higher strain. By contrast, the contributions from
permanent cross-links increase progressively with strain.
The degree of trapped entanglement (z) is expressed in
terms of the Langley trapping factor (Te)[14] divided by the
number of statistical chain segments between successive
entanglements (ne). This produces a singularity at:
ðlþ 2l�1 � 3Þ ¼ z�1 ð1aÞThe increase in s as this singularity is approached repro-
duces the observed strain hardening, which may be ascribed
to the finite extensibility of chain segments between trapped
entanglements.
The stress-strain curves of harder TPUs tend to exhibit
more pronounced ‘yielding’ or ‘strain-softening’ behav-
iour.[11] This is not described well by existing theoret-
ically-derived models, although it can be fitted using semi-
empirical models, such as those described by Meissner
and Spırkova.[8] Moreover, pre-straining causes a consid-
erable amount of residual strain or ‘permanent set’ (i.e.
the unloaded sample is elongated, compared with its
original unstrained length), while repeated straining
cycles produce significant changes in mechanical proper-
ties, similar to the work-softening of filled rubbers (the
Mullins effect). These phenomena have long been
attributed to HS microdomain fragmentation,[15] largely
by analogy with the mechanical behaviour of filled
rubbers.[8]
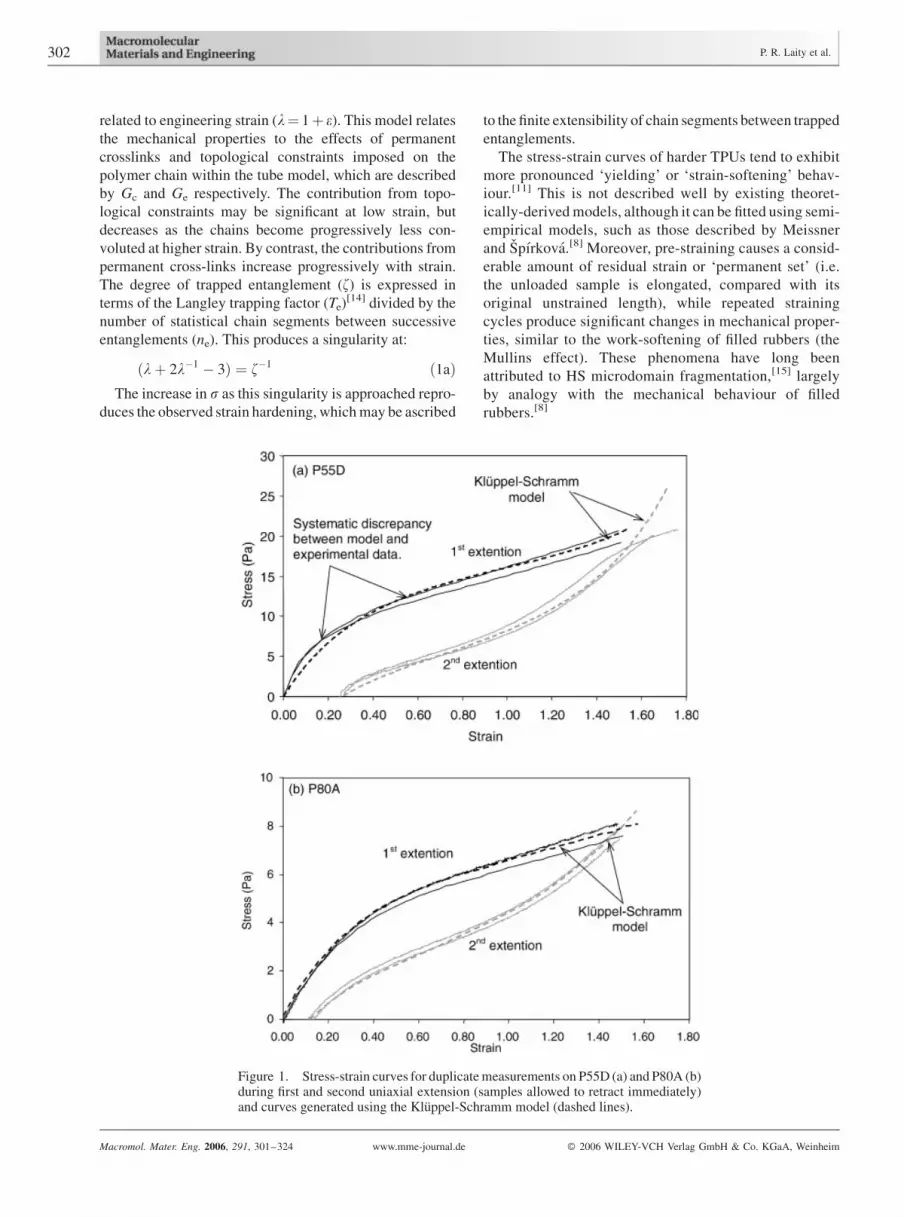
Figure 1. Stress-strain curves for duplicate measurements on P55D (a) and P80A (b)during first and second uniaxial extension (samples allowed to retract immediately)and curves generated using the Kluppel-Schramm model (dashed lines).
302 P. R. Laity et al.
Macromol. Mater. Eng. 2006, 291, 301–324 www.mme-journal.de � 2006 WILEY-VCH Verlag GmbH & Co. KGaA, Weinheim

The present work investigated the morphological res-
ponses of TPUs during deformation and whether this might
provide an explanation for the observed mechanical
behaviour. Changes in morphology were observed in ‘real
time’, by small-angle X-ray scattering (SAXS) using a
synchrotron source. A common limitation of SAXS studies
is that interpretation of the observed scattering patterns is
seldom unequivocal and relies on a prior knowledge of the
morphology under investigation. In the present work, the
scattering patterns were analysed using a ‘globular’ model
consisting of dispersed HS microdomains within a mixed
HSþ SS matrix. Previous investigations have demon-
strated that this model is capable of reproducing the
scattering patterns observed from TPUs of the type studied
here and provides plausible interpretations of the morpho-
logical responses to uniaxial extension.[9–11,16,17]
Initial investigations[9] suggested that the main features
of the SAXS patterns could be explained by assuming that
the size and shape of dispersed HS microdomains remained
constant, while their centres of mass of moved according
to affine deformation of a statistical lattice. Subsequent
work[17] showed that the effective size and shape of the
dispersed microdomains were also affected when the TPUs
were deformed. Small strains caused the microdomains to
become elongated in the stretching direction and shorter in
the transverse direction. An explanation involving rotation
of anisometric microdomains was proposed, since the
modulus of the dispersed HS phase is expected to be
considerably higher than the continuous HSþ SS matrix;
however, deformation of the HS microdomains cannot be
completely ruled out. Microdomain fragmentation was also
indicated at higher strains, which implied significant stress-
transfer and suggested a tentative link to the mechanical
softening behaviour.
The present work extended this work by analysing
the morphological behaviour in four sequential stages: (i)
uniaxial extension from the virgin state to e¼ 1.5; (ii) stress
relaxation at constant strain; (iii) retraction to zero residual
stress; (iv) a second uniaxial extension. Further evidence
of microdomain fragmentation is given, while the implica-
tions of strain-induced local density variations and segmental
mixing are examined. A morphological interpretation of the
diagonal four-spot SAXS patterns exhibited by these TPUs on
retraction after the first strain cycle is also presented.
Experimental Part
Materials and Sample Preparation
Experiments were performed using Pellethane1 2363-55Dand 2363-80A poly(ether-co-urethane)s (Dow Chemical Co,Midland MI, USA), with 55% and 44% HS respectively, which
Table 1. Mechanical and morphological results for TPU samples in unstrained or relaxed states.
P55DInitial unstrained Relaxed, after holding at e¼ 1.5 for
0 min 20 min 60 min
Young’s modulus/MPa 58� 12 38 25 20Residual strain 0.23 0.32 0.38Kluppel-Schramm Gc/MPa 1.2� 0.1 5.1 4.2 4.2model Ge/MPa 27.2� 0.1 3.3 4.2 3.9
z 0.10� 0.01 0.09 0.10 0.11Strain direction d/nm (expected)a) 9.3� 0.2 9.8 (11.4) 10.3 (12.3) 10.5 (12.9)
R/nm 3.3� 0.1 3.3 3.2 3.2Transverse direction d/nm (expected)a) 9.3� 0.2 8.5 (8.4) 8.4 (8.1) 8.2 (7.9)
R/nm 3.3� 0.1 3.1 3.0 3.0I0 normalised 1.00 0.71 0.69 0.63
(expected)a) 1.00 0.90 0.87 0.85
P80A Initial unstrained Relaxed, after holding at e¼ 1.5 for
0 min 20 min 60 min
Young’s modulus/MPa 16� 1 11 12 10Residual strain 0.06 0.14 0.20Kluppel-Schramm Gc/MPa 0.6� 0.1 1.1 1.0 1.4model Ge/MPa 11.7� 0.1 5.4 4.2 3.2
z 0.08� 0.01 0.12 0.10 0.09Strain direction d/nm (expected)a) 11.7� 0.2 12.1 (12.4) 12.5 (13.3) 12.3 (14.1)
R/nm 3.7� 0.1 3.7 3.6 3.6Transverse direction d/nm (expected)a) 11.7� 0.2 11.4 (9.0) 11.1 (8.7) 10.7 (8.5)
R/nm 3.7� 0.1 3.6 3.5 3.6I0 normalised 1.00 0.91 0.77 0.76
(expected)a) 1.00 0.97 0.94 0.91
a) Expected values calculated from residual strain, assuming affine deformation of statistical lattice and no microdomain fragmentation.
Morphological Behaviour of Thermoplastic Polyurethanes During Repeated Deformation 303
Macromol. Mater. Eng. 2006, 291, 301–324 www.mme-journal.de � 2006 WILEY-VCH Verlag GmbH & Co. KGaA, Weinheim

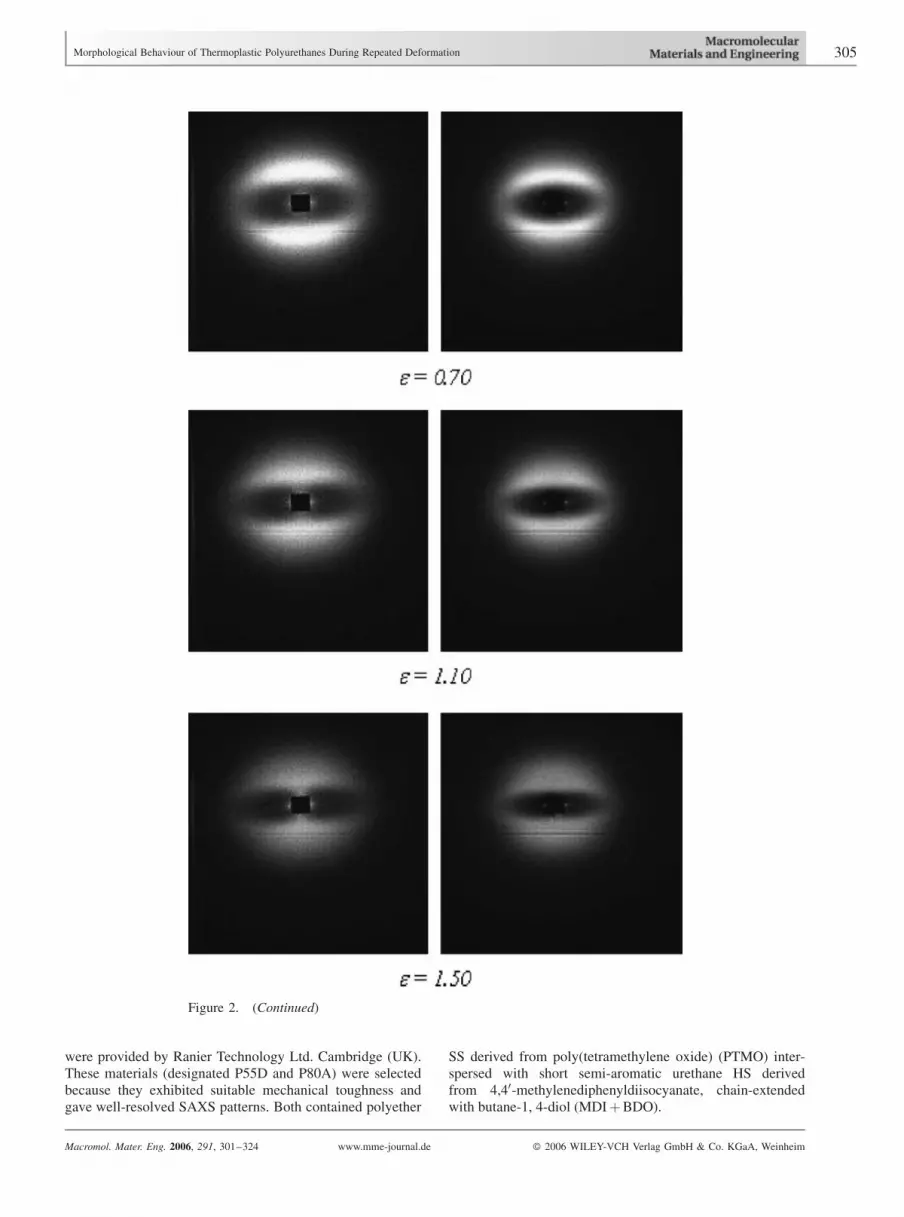
Figure 2. 2D-SAXS patterns at selected strains collected during initial uniaxial extension(strain direction vertical).
304 P. R. Laity et al.
Macromol. Mater. Eng. 2006, 291, 301–324 www.mme-journal.de � 2006 WILEY-VCH Verlag GmbH & Co. KGaA, Weinheim
were provided by Ranier Technology Ltd. Cambridge (UK).These materials (designated P55D and P80A) were selectedbecause they exhibited suitable mechanical toughness andgave well-resolved SAXS patterns. Both contained polyether
SS derived from poly(tetramethylene oxide) (PTMO) inter-spersed with short semi-aromatic urethane HS derivedfrom 4,40-methylenediphenyldiisocyanate, chain-extendedwith butane-1, 4-diol (MDIþBDO).
Figure 2. (Continued)
Morphological Behaviour of Thermoplastic Polyurethanes During Repeated Deformation 305
Macromol. Mater. Eng. 2006, 291, 301–324 www.mme-journal.de � 2006 WILEY-VCH Verlag GmbH & Co. KGaA, Weinheim

Sample preparation was as described previously.[17] Thinfilms (approximately 0.35 to 0.4 mm thickness) were obtainedby hot-pressing at 220 8C and quenching in iced water.Rectangular specimens (approximately 10� 40 mm) werecut using a scalpel and steel rule, then annealed at 135 8C for 4 hto develop the microphase-separated morphologies.
Mechanical Deformation Experiments
Stress-strain measurements were performed using a ‘Minimat’miniature materials testing apparatus (Polymer Labs. Shrop-shire, UK). Specimen thickness (s), width (w) and gauge lengthbetween the Minimat jaws (L0) were measured using caliperswith a vernier scale. Engineering stress (s) and strain (e) were
calculated from the measured force (F) and jaw displacement(x) from the starting position, according to:
s ¼ F
s � w ð2aÞ
e ¼ x
L0
ð2bÞ
The specimens were initially deformed in uniaxial extensionunder ambient condition, to e¼ 1.5, at a strain rate of de/dt¼0.15 min�1. In some cases, the specimens were allowed toretract immediately, by releasing one of the jaws. In othercases, stress relaxation measurements were made while thespecimens were maintianed at e¼ 1.5, for 20 or 60 min before
Figure 3. Meridional (a and c) and equatorial (b and d) 1D-scans through 2D-SAXSdata collected during first uniaxial extension.
306 P. R. Laity et al.
Macromol. Mater. Eng. 2006, 291, 301–324 www.mme-journal.de � 2006 WILEY-VCH Verlag GmbH & Co. KGaA, Weinheim

being allowed to retract. The gauge lengths of the retractedspecimens (LR) were measured, in order to calculate theresidual strain due to permanent set:
eR ¼ LR � L0
L0
ð3Þ
Then, the sample was subjected to a second uniaxialextension to e¼ 1.5.
SAXS Measurements and Interpretation
Two-dimensional scattering measurements (2D-SAXS) wereperformed during deformation experiments at station 16.1 ofthe synchrotron radiation source (SRS), Daresbury. Methods ofdata acquisition and correction for background scattering wereas described previously.[16,17]
The SAXS data was analysed using a ‘globular’ scatteringmodel, which is described in more detail elsewhere.[9–11,16,17]
This model treated the scattering as the product of a particlefunction and a structure factor:
IðqÞ ¼ I0 � PðqÞ � SðqÞ ð4Þ
where q is the modulus of the scattering vector:
q ¼ 4po
sin y ð4aÞ
where 2y is the scattering angle ando is the X-ray wavelength.I0 was regarded as a scaling factor, which depended on theintensity of the X-ray illumination, acquisition time andilluminated sample volume, as well as the volume fraction (f)and electron density contrast (Dr) between scatterers. It should
Figure 3. (Continued)
Morphological Behaviour of Thermoplastic Polyurethanes During Repeated Deformation 307
Macromol. Mater. Eng. 2006, 291, 301–324 www.mme-journal.de � 2006 WILEY-VCH Verlag GmbH & Co. KGaA, Weinheim

be noted that this model refers to the effective distributionsof size, shape, orientation and spacings for populations ofscatterers and not individual microdomains.
To a first approximation, the population of HS micro-domains in isotropic samples may be treated as a collection ofmonodispersed spheres with effective radius, R:
PðqÞ ¼ 9 � sinðqRÞ � qR cosðqRÞðqRÞ3
( )2
ð5Þ
In mechanically deformed samples, however, the popu-lation of scatterers became oriented with their longer axespredominantly towards the stretching direction. This wasincorporated into the model by allowing R(j) to depend on theangle j between the scattering vector and direction of appliedstrain.
The structure factor may be described equally well assuminga distorted one-dimensional statistical lattice (Zernike-Prins,ZP model) or using a more sophisticated description of liquid-like structure (Percus-Yevick, PY model).[16,17] The deriva-
tions of these models are somewhat different: the former isbased on simple geometric assumptions, while the latterattempts to incorporate thermodynamic interactions. Never-theless, the essential difference between them lies in theunderlying distributions of interdomain spacings. For thepurposes of the work presented here, the description providedby the ZP model in terms of an average projected distance (d)was considered to be more useful, although it is not certainwhether the resulting lengths are absolutely correct. For aGaussian distribution of interdomain spacings, with standarddeviation (d), Hosemann[18,19] showed that:
SðqÞ ¼ 1 � A2
1 � 2A � cosðqdÞ þ A2ð6Þ
where:
A ¼ exp � q2d2
2
� �ð6aÞ
Figure 4. Morphological responses during first uniaxial extension; continuous linesindicate the expected values based on pure affine deformation, the different shadings ofthe symbols represent measurements from duplicate experiments.
308 P. R. Laity et al.
Macromol. Mater. Eng. 2006, 291, 301–324 www.mme-journal.de � 2006 WILEY-VCH Verlag GmbH & Co. KGaA, Weinheim

Results
Stress-strain curves for P55D and P80A during a first uniaxial
extension from the virgin state and a second deformation
cycle (after immediate retraction) are compared in Figure 1,
along with curves generated using the Kluppel-Schramm
model [Equation (1)]. For ease of comparison, the strain in
both deformation cycles is calculated with respect to the
initial unstrained sample length.
During the initial measurements, the stress increased
relatively steeply at low strain, followed by a broad strain-
softening zone and an almost linear region of lower slope at
intermediate strain. Differences in composition between the
two materials used were reflected in Young’s moduli
(obtained from the approximately linear region below
e¼ 0.03, which are given in Table 1) and the relative heights
of the stress-strain curves.
Attempts to fit the stress-strain data using the Kluppel-
Schramm model were partially successful. It was found that
the model could be fitted to the P80A data very well
(Figure 1b), although this may not be particularly
significant due to the limited strain range used. However,
close examination of the P55D data showed that the model
was unable to exactly reproduce the more pronounced
strain-softening behaviour of the harder formulation (as
indicated in Figure 1a). Similar discrepancies at low strain
have been reported previously for comparable TPUs.[11]
Furthermore, it was shown that fitting the Kluppel-
Schramm model to experimental data above the strain
softening zone resulted in a discrepancy at low strain, which
increased with the HS content and was attributed to an
additional work of deformation component that was not
included in the model. The values of the parameters
obtained by curve-fitting the model to the initial deforma-
tion cycle data are given in Table 1, indicating that tube-
constraint effects dominated the mechanical behaviour of
the virgin samples.
Repeated experiments showed reasonably good reprodu-
cibility. Consequently the changes observed in the mechanical
behaviour from the first to the second extension cycles were
Figure 4. (Continued)
Morphological Behaviour of Thermoplastic Polyurethanes During Repeated Deformation 309
Macromol. Mater. Eng. 2006, 291, 301–324 www.mme-journal.de � 2006 WILEY-VCH Verlag GmbH & Co. KGaA, Weinheim
highly significant. Both TPUs exhibited considerable perma-
nent set, causing the origins of the second stress-strain curves
to be displaced along the strain axis. The pre-strained samples
exhibited considerably smaller Young’s moduli, compared
with the virgin materials, and appeared to undergo stress-
softening almost immediately, during the second extension
cycles. These effects appeared greater with the harder TPU
formulation and increased with stress-relaxation times, as
shown in Table 1.
However, after the relatively slow initial stress increase
and subsequent softening observed in the second exten-
sions, the samples exhibited considerable strain-hardening
above e¼ 0.8, such that the second extension curves inter-
cepted the initial curves around e¼ 1.5. These results
appeared consistent with recent work by Meissner and
Spırkova,[8] who showed that the stress-strain curves
for first and second deformation cycles converged
beyond the ‘pre-strain’. The Kluppel-Schramm model
was able to fit the stress-strain data from second
deformation cycles fairly well, up to the point where they
intercepted the initial curves, although any attempts to
model the convergence beyond the pre-strain were
unsuccessful.
The parameters obtained during the second extension
cycles are also shown in Table 1. The degree of trapped
entanglements appeared largely similar during the first and
second extension cycles; however, Ge decreased signifi-
cantly while Gc increased for the pre-strained, relaxed
samples. This was more pronounced for the P55D material,
where the effects of Gc appeared to dominate the second
deformation. These results suggested that the tube-
constraints were decreased by the first deformation cycle,
while the effects of cross-links became more important. In
the theory presented by Kluppel and Schramm,[13] Gc
and Ge are inversely proportional to the chain length
between cross-links and the tube radius respectively. An
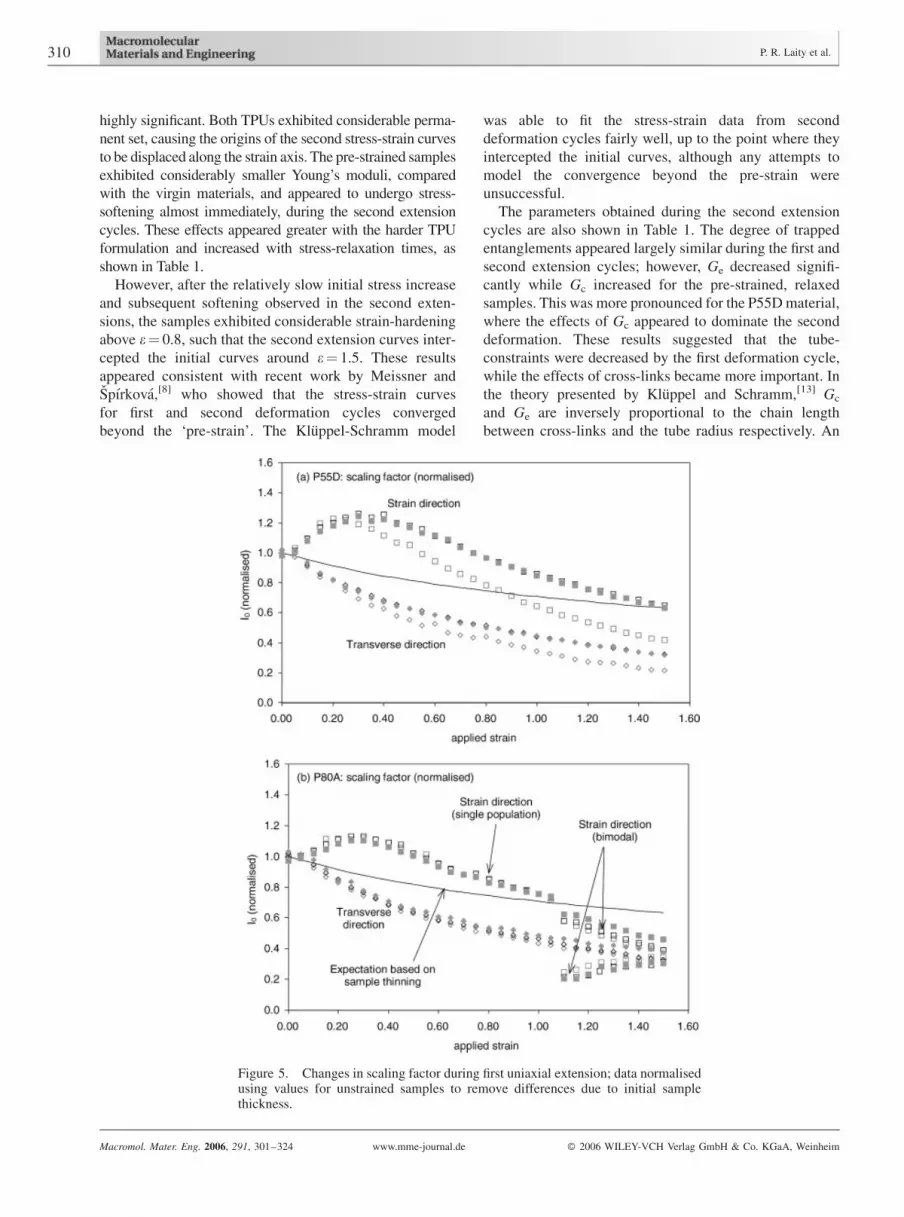
Figure 5. Changes in scaling factor during first uniaxial extension; data normalisedusing values for unstrained samples to remove differences due to initial samplethickness.
310 P. R. Laity et al.
Macromol. Mater. Eng. 2006, 291, 301–324 www.mme-journal.de � 2006 WILEY-VCH Verlag GmbH & Co. KGaA, Weinheim

interpretation of the present observations within this
framework is not clear, however.
Morphological Changes DuringInitial Deformation
Selected frames of 2D-SAXS data collected during the
initial deformation cycles for P55D and P80A are compared
in Figure 2. (The narrow horizontal lines observable across
the lower part of some frames were artefacts caused by an
electronic fault on the detector, which did not affect the rest
of the data and were omitted from subsequent analyses.)
The circular rings of highest intensity exhibited by un-
deformed samples indicated isotropic morphologies. The
only significant difference between P55D and P80A was
that the intensity maximum appeared at lowerq in the latter,
indicating larger average microdomain spacing in the softer
formulation.
Similar changes were observed for P55D and P80A at
low strain: the meridional intensity (i.e. in the stretching
direction) increased and the peak moved towards lower q,
while the equatorial scattering (i.e. transverse direction)
decreased and the peak moved to higher q. Hence, the locus
of highest intensity changed from a circle to an ellipse, then
separated into two crescents. These observations were
consistent with previous reports.[9–12,15,17,20]
At higher strain, the SAXS intensities from both mate-
rials decreased. However, while the meridional scattering
from the P55D specimens remained in the form of a single
peak, careful examination of the P80A data revealed
bimodal peaks for e> 1.1. Although bimodal peaks have
been observed for some TPUs under static conditions,[21]
Figure 6. Stress-relaxation after uniaxial extension to e¼ 1.5.
Morphological Behaviour of Thermoplastic Polyurethanes During Repeated Deformation 311
Macromol. Mater. Eng. 2006, 291, 301–324 www.mme-journal.de � 2006 WILEY-VCH Verlag GmbH & Co. KGaA, Weinheim

we are not aware of any previous reports describing similar
behaviour during deformation.
Meridional and equatorial 1D-scans corresponding to
selected frames of 2D-SAXS data are presented in Figure 3,
which demonstrate the changes in peak intensity and
position during deformation. The development of bimodal
peaks is clearly evident in the meridional 1D-scans for
P80A (Figure 3c).
The morphological responses to uniaxial extension were
analysed by curve fitting the ZP model [Equation (4)–(6)]
to meridional and equatorial scans, as described previ-
ously.[16,17] Results from samples prior to deformation are
presented in Table 1; subsequent changes in d and R during
the first deformation cycle are presented in Figure 4.
The dispersed HS microdomains appeared to be somewhat
larger and more widely separated in the softer P80A
formulation, compared with P55D. Nevertheless, the two
TPUs exhibited qualitatively similar behaviour during
deformation. At small extentions, the HS microdomains
appeared to become elongated in the strain direction
(Figure 4a and 4c) and to be displaced following approx-
imately affine deformation of the statistical lattice (Figure 4b
and 4d). R and d continued to decrease progressively in the
transverse direction, up to e¼ 1.5. By contrast, significant
changes were observed in the strain direction behaviour for
e> 0.4: the effective radius appeared to peak, then decline
slightly, while d exhibited significant deviations from
expectations based on affine deformation. Similar behaviour
in the strain direction results has been reported previ-
ously,[11,17] which was attributed to microdomain fragmen-
tation, with the fragments bisecting the expected distances
between the original scatterers.
It was assumed that the bimodal meridional scans
exhibited by P80A beyond e¼ 1.1 were due to some kind
Figure 7. Changes in meridional scattering during stress relaxation at e¼ 1.5.
312 P. R. Laity et al.
Macromol. Mater. Eng. 2006, 291, 301–324 www.mme-journal.de � 2006 WILEY-VCH Verlag GmbH & Co. KGaA, Weinheim
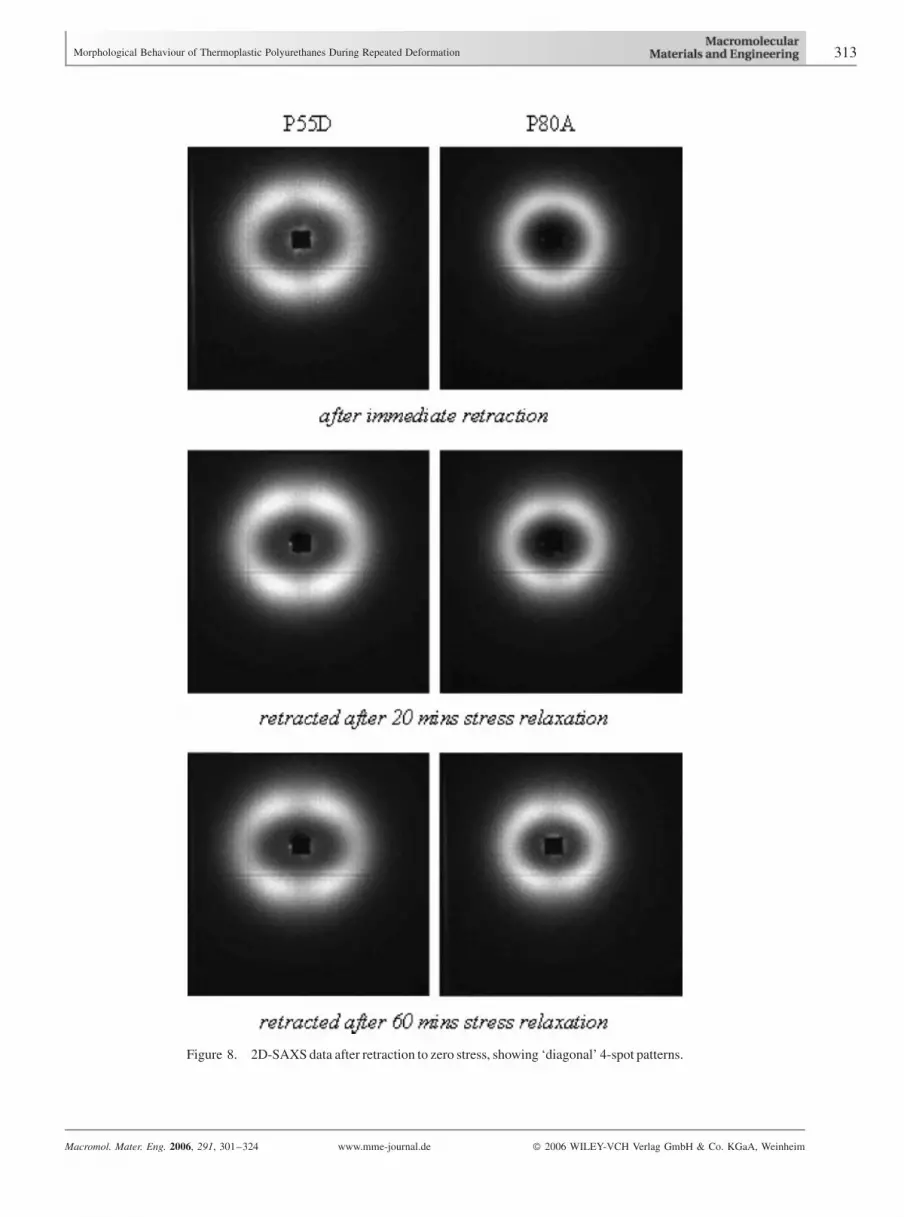
Figure 8. 2D-SAXS data after retraction to zero stress, showing ‘diagonal’ 4-spot patterns.
Morphological Behaviour of Thermoplastic Polyurethanes During Repeated Deformation 313
Macromol. Mater. Eng. 2006, 291, 301–324 www.mme-journal.de � 2006 WILEY-VCH Verlag GmbH & Co. KGaA, Weinheim

of mixed binary morphology. This was analysed using an
extended scattering model:
IðqÞ¼ I0A � PðqRAÞ � Sðq; dA; dAÞþ I0B � PðqRBÞ � Sðq; dB; dBÞ
ð7Þ
where the functions are as described in Equation (4) to
(6) and the subscripts refer to individual populations of
scatterers. Values of I0, R and d were permitted to change
independently for each population In order to facilitate
curve fitting, however, the same level of lattice distortion
was assumed for both populations. This improved the
reliability of convergence of the model to the data, although
the assumption may not have been strictly valid. The results
for P80A using the extended model are shown in Figure 4c
and 4d beyond, e¼ 1.1. It appeared that the effective radius
of the larger scatterers was slightly less than twice the value
of the smaller scatterers, while the larger d-spacings
(assumed to correspond to the larger scatterers) were
roughly 1.5 times the smaller d-spacings.
It may be significant that extrapolation from the initial
strain direction behaviour fell close to the larger values of d
and R given by this analysis; moreover, extrapolating the
curve describing low-strain results appeared to bisect the
high-strain bimodal data. This behaviour appeared to be
consistent with some HS microdomains fragmenting early
in the deformation experiments, even though bimodal meri-
dional scattering peaks were not evident below e¼ 1.1.
It should be noted that the original ZP scattering model
Figure 9. Morphological data for relaxed P55D (&) and P80A (&) samples (afteruniaxial extension, stress relaxation at e¼ 1.5 over 20 min and subsequent retractionto s¼ 0).
314 P. R. Laity et al.
Macromol. Mater. Eng. 2006, 291, 301–324 www.mme-journal.de � 2006 WILEY-VCH Verlag GmbH & Co. KGaA, Weinheim

(as well as each component of the binary model)
yield average morphological values; whereas, polydis-
persed HS microdomain sizes and interdomain spacings
are expected in the TPU samples. Consequently, a picture
emerges of some elongated microdomains remaining
intact and being oriented in the stretching direction,
giving the larger values of R and d, while others
broke into fragments that subdivided the original inter-
domain spacing and gave the smaller values of R and d.
Although the particle function used [Equation (5)] can
only give effective average values of R, the results during
uniaxial extension suggest that the HS microdomains were
significantly elongated. Hence, the clear indication of
bimodal scattering peaks during the first uniaxial extension
of P80A may be attributable to longer HS microdomains in
this material compared with P55D. Moreover, the differ-
ence in behaviour between the materials studied appeared
to be only one of degree; evidence of bimodal scattering in
P55D also emerged at later stages of the deformation
experiments, as described below.
The geometric changes in R and d presented in Figure 4
appeared to explain the main features of the observed 2D-
SAXS patterns. However, an examination of the changes in
I0 presented in Figure 5 revealed an additional level of
complexity in the morphological response to strain. Pure
affine deformation was expected to reduce sample thick-
ness, causing a reduction in I0 inversely proportional to
(1þ e)1/2, which should act equally in the meridional and
equatorial scattering. This is represented by the continuous
lines in Figure 5a and 5b. However, the experimental results
from both materials showed considerable deviations from
these expectations. The strain direction scaling factor
initially increased substantially, with a maximum around
e¼ 0.4, before decreasing at higher strain. The break in the
Figure 9. (Continued)
Morphological Behaviour of Thermoplastic Polyurethanes During Repeated Deformation 315
Macromol. Mater. Eng. 2006, 291, 301–324 www.mme-journal.de � 2006 WILEY-VCH Verlag GmbH & Co. KGaA, Weinheim

Figure 10. 2D-SAXS patterns, at selected strains collected during second uniaxialextension (after stress-relaxation at e¼ 1.5 for 60 min and retraction to s¼ 0; values ofstrain given with respect to the retracted length).
316 P. R. Laity et al.
Macromol. Mater. Eng. 2006, 291, 301–324 www.mme-journal.de � 2006 WILEY-VCH Verlag GmbH & Co. KGaA, Weinheim

strain direction data at e¼ 1.1 for P80A (Figure 5b)
corresponded to the onset of the bimodal meridional
scattering, with the smaller scattering bodies giving the
lower values of I0. The apparent conjunction of the peak in
the strain direction scaling factor with strain softening
and the point at which the behaviour of R and d indicated
the onset of microdomain fragmentation suggested that
these effects might be connected. By contrast, I0 was signi-
Figure 10. (Continued)
Morphological Behaviour of Thermoplastic Polyurethanes During Repeated Deformation 317
Macromol. Mater. Eng. 2006, 291, 301–324 www.mme-journal.de � 2006 WILEY-VCH Verlag GmbH & Co. KGaA, Weinheim

ficantly smaller for the transverse direction scattering
and decreased progressively with strain, well below the
expected values.
Stress Relaxation
The stress relaxation behaviour of P55D and P80A at
e¼ 1.5 is compared in Figure 6. Although the starting
values of s reflected the different compositions, P55D and
P80A exhibited qualitatively similar behaviour. The rapid
initial decrease in stress became progressively slower with
time, although significant changes could still be observed at
1 h. This decrease in s appeared approximately logarithmic
with time, as demonstrated in Figure 6b.
Stress relaxation was accompanied by significant
changes in the meridional scattering, as demonstrated in
Figure 7. The single peak exhibited by P55D at the end of
the deformation stage decreased in height and became
distinctly bimodal, with a shoulder at higher q growing in
prominence during stress relaxation. The scattering peak
exhibited by P80A was already distinctly bimodal by the
end of the deformation stage, but the higher q component
became dominant during stress relaxation. In both materi-
als, these changes occurred through a pronounced decrease
in the intensity of the lower q component in the 1D-scans,
while the scattering at higher q increased slightly. Analysis
of the meridional scattering data using Equation (7) found
no significant changes in R or d within the individual
populations. However, the relative decrease in the propor-
tion of larger, more widely spaced scatterers was consistent
with microdomain fragmentation.
By contrast, relatively little change in the equatorial
scattering or the corresponding morphological data was
observable during stress relaxation. Overall, the samples
retained a significant level of anisometry, with significantly
smaller values of R and d in the transverse direction.
Morphology After Retraction
2D-SAXS patterns from retracted samples are presented in
Figure 8. Both materials exhibited diagonal four-spot
Figure 11. Changes in R and d for P55D (a and b) and P80A (c and d) during second uniaxialextension, (after stress-relaxation for 60 min at e¼ 1.5 and retraction; continuous lines representtrends during initial deformation).
318 P. R. Laity et al.
Macromol. Mater. Eng. 2006, 291, 301–324 www.mme-journal.de � 2006 WILEY-VCH Verlag GmbH & Co. KGaA, Weinheim

patterns, which were most pronounced for those samples
allowed to relax at e¼ 1.5 for 20 min before retraction.
These appeared similar to the patterns observed previously
from strained TPUs by Blundell et al.[9] 1D-scans were
obtained from the 2D-SAXS data at 108 intervals from the
strain to transverse directions, and analysed by curve-fitting
the ZP model; the results are presented in Figure 9.
Morphological data in the strain and transverse directions
for virgin and strained, retracted samples is also compared
in Table 1.
The anisometry in microdomain size that developed
during the initial straining and persisted during stress
relaxation was lost on retraction. No significant angular
dependence of R was observable in the retracted sam-
ples. This probably occurred by elongated HS micro-
domains rotating back into random orientations, effectively
reversing the process by which anisometry developed
during uniaxial extension, although some shape-changing
cannot be ruled out. Moreover, no significant differences in
the values of R could be observed between virgin and
retracted samples, suggesting that HS microdomain frag-
ments may have re-united, when the stress was released.
Some angular dependence persisted in the interdomain
spacings of retracted samples; values of d within 208 from
the strain direction were about 10% longer than in the
transverse direction. However, these observed differences
were significantly less than expected on the basis of the
residual strain after retraction causing a corresponding
displacement of microdomains on the ‘statistical lattice’.
This suggested that a certain amount of microdomain
redistribution may have occurred during uniaxial extension
and retraction.
The residual anisotropy in d would account for the slight
ellipticity in the 2D-SAXS patterns of the retracted samples
and favour stronger scattering close to the strain direction.
But it does not explain the ‘off-axis’ maxima of the four-spot
patterns. In this respect, variations in I0 and d/d appeared to
be more important. The scaling factors exhibited peaks
around 108 to 308 and minima around 608 to 708 from the
strain direction, for P80A and P55D respectively
Figure 11. (Continued)
Morphological Behaviour of Thermoplastic Polyurethanes During Repeated Deformation 319
Macromol. Mater. Eng. 2006, 291, 301–324 www.mme-journal.de � 2006 WILEY-VCH Verlag GmbH & Co. KGaA, Weinheim

(Figure 9c). This suggested angular variations in scattering
contrast, possibly as a result of localised segmental mixing
or density variations around the HS microdomains. The
shallow minimum in the lattice distortion around 408 to 608would also favour sharper scattering curves, with slightly
greater intensity close to the diagonals of the 2D-SAXS
patterns.
Morphological Changes DuringSecond Deformation
Typical 2D-SAXS patterns collected during the second
extension cycles for P55D and P80A are compared in
Figure 10. The four-spot patterns exhibited by either TPU
initially appeared to intensify at low strain, generally
becoming clearest around e¼ 0.3 (with respect to the
retracted sample length). At higher strain, the spots moved
slightly towards the meridian and became weaker, although
feint traces were still discernible at e¼ 0.7. Above about
e¼ 1.3, the 2D-SAXS patterns from the first and second
deformation cycles appeared similar, although the former
were generally more intense.
Changes in R and d obtained by curve-fitting meridional
and equatorial scans during the second deformation cycle
are presented in Figure 11. For comparison, the trends from
the first deformations are also shown. P55D and P80A
exhibited similar results, becoming distinctly anisotropic
Figure 12. Changes in scaling factor for P55D (a) and P80A (b) during second uniaxialextension, after stress-relaxation for 60 min at e¼ 1.5 and retraction (continuous linesrepresent trends during initial deformation).
320 P. R. Laity et al.
Macromol. Mater. Eng. 2006, 291, 301–324 www.mme-journal.de � 2006 WILEY-VCH Verlag GmbH & Co. KGaA, Weinheim

at low strains, with both materials developing bimodal
meridional scattering populations above e¼ 1.1 and 0.9
respectively. Although this represented further evidence
of microdomain fragmentation, comparison with the data
from the first deformation cycles suggested that the
changes in R and d from the virgin state were relatively
minor. Consequently, although microdomain re-orientation
and fragmentation clearly occurred during the deformation
experiments, these processes seem unable to provide a
complete explanation for the considerable changes observed
in mechanical properties.
Both materials exhibited considerable decreases in
scaling factor between the first and second deformation
cycles, as demonstrated in Figure 12. This may be attributed
to strain-induced segmental mixing during the initial
deformation cycle that was not recovered on retraction.
Possible connections between the underlying molecular
changes responsible for the decrease in scattering intensity
and the stress-strain behaviour are discussed below.
Discussion
It has been demonstrated previously[9–11,16,17] that the
SAXS patterns from TPUs such as those studied here could
be interpreted using a two-phase model comprising
elongated, globular HS microdomains dispersed within a
mixed HSþ SS matrix. Studies using DSC and wide-angle
X-ray scattering (WAXS), to be reported elsewhere,
have effectively excluded any significant scattering from
SS crystallites in the TPUs used here. Although it is
acknowledged that PTMO is prone to crystallisation,
previous work by Van Bogart et al.[22] showed that this
required SS molecular weights above 1 000 Da. Since the
P55D and P80A samples used here are believed to have SS
molecular weights of approximately 600 to 650 and 1 000
Da respectively,[16,23] this explains the absence of SS
crystallites. Moreover, since WAXS did not reveal any
significant peaks associated with HS crystallites in these
TPUs, this suggests that the HS microdomains were essen-
tially glassy. Again, this is consistent with the short HS and
HS lengths in P55D and P80A,[16] which is also likely to
produce significant HSþ SS mixing.
A common problem in the interpretation of SAXS is that
similar patterns may be given by different morphologies.
Ideally, the morphology present should be confirmed by
independent methods, such as transmission electron micro-
scopy (TEM) or atomic force microscopy (AFM). A
number of published studies of TPUs and related poly-
mers[23–33] have indicated morphologies composed of
elongated HS microdomains within a SS matrix, roughly
consistent with the ‘globular’ scattering model used here.
The publications by McLean and Sauer[32] and Christenson
et al.[33] appears particularly relevant, since they included
polymers very similar to those used in the present work.
Nevertheless, these techniques are not without their
own problems; our attempts to study P55D and P80A
using TEM[34] appeared to indicate mixtures of weakly-
contrasting globular or lamellar HS microdomains, but also
demonstrated a considerable risk of artefacts due to in-
appropriate sample cutting, staining methods and viewing
conditions. It is possible that the weak TEM contrast (even
using heavy metal stains) may have been linked to consi-
derable SS and HS mixing in these materials, which is a key
element of the SAXS interpretation presented here.
There are likely to be some subtle morphological details,
such as local composition or density fluctuations within
microphases, the nature of the interfaces and the exact
shapes of dispersed HS microdomains that are not
encompassed by the two-phase globular model. It is also
expected that some combinations of TPU formulations and
processing conditions could give morphologies beyond the
scope of this simple scattering model. In particular, formu-
lations with longer or less miscible SS and HS will be more
strongly microphase-separated, which could lead to larger
microdomains, bi-continuous morphologies, the possibility
of semicrystalline microphases and spherulites. Never-
theless, we believe that these features are absent in the TPUs
studied here and there are no substantial arguements against
interpreting the SAXS from copolymers of this type using
the two-phase globular model.
The ZP model generally appeared well able to fit the
changes in scattering intensities observed during uniaxial
extension experiments, in line with previous work.[9–
11,16,17] Moreover, the experiments reported here extended
this analysis to stress relaxation at constant strain (e¼ 1.5),
retraction to zero stress and a second uniaxial extension.
It has been noted that the volume fractions of dispersed
microdomains indicated by the PY model were generally
lower than corresponding estimates from the ZP model.[16,17]
These discrepancies are thought to be caused by the
underlying distributions of interdomain distances inherent
in each model. Since the distribution exhibited by the TPUs is
not known at present, the values of d obtained by curve-fitting
the ZP model may not be absolutely correct and should
be treated with some caution. Further uncertainty in the
SAXS interpretation was introduced by the extended model
used to model the bimodal intensity curves exhibited
by strained materials under some conditions in the present
work.
Although analyses of SAXS data using the ZP model may
not be relied on to give a quantitatively accurate interpre-
tation, it indicated a combination of strain-induced dis-
placement, rotation and fragmentation of the dispersed HS
microdomains during uniaxial extension. This was broadly
in agreement with previous studies of mechanically
deformed TPUs, using SAXS[2,9–12,16,17,20,22] and other
techniques.[2,3,5,33,35–37] It should be noted that the ob-
served changes in R during uniaxial extension are assumed
to be attributable to microdomain rotation. Deformation
Morphological Behaviour of Thermoplastic Polyurethanes During Repeated Deformation 321
Macromol. Mater. Eng. 2006, 291, 301–324 www.mme-journal.de � 2006 WILEY-VCH Verlag GmbH & Co. KGaA, Weinheim

is thought to be less likely, due to the considerably
higher modulus expected for HS microdomains compared
with the HSþ SS matrix; this possibility cannot be
totally excluded, however, since the expected difference
in modulus may be reduced by incomplete segmental
demixing.
It appeared that microdomain rotation, the onset of
fragmentation and stress softening occurred roughly
concurrently in the first deformation cycles, which implied
that these effects may be connected. The strain-softening
observed with some TPUs has often been attributed to
fragmentation and a decrease in interconnectivity amongst
HS microdomains.[8,15,23,33,35] This hypothesis may be well
justified for copolymers with a large volume fraction of
considerably elongated or interconnected HS microdo-
mains; morphologies such as these have been reported
recently by Klinedinst et al.[38] for poly(alkylurethane-co-
urea), where the SS and HS compositions are expected to
cause stronger and more extensive microphase separation.
However, the materials used in the present study are
expected to be less strongly microphase-separated, with
smaller volume fractions of relatively short HS micro-
domains. Moreover, the morphological changes during the
first deformation cycle appeared to be largely reversed on
retraction to zero stress. Hence, while fragmentation and re-
orientation of dispersed HS microdomains during uniaxial
extension may be contributory factors, they appear unable
to fully explain the dramatic reduction in mechanical
properties from the first to second deformation cycles for
the materials studied here.
One possible explanation may be that the mechanical
properties of P55D and P80A were dominated by the
behaviour of a few much larger (probably elongated) HS
microdomains. These microdomains would scatter at very
low q, outside the range of the present SAXS measure-
ments, although their fragmentation might contribute to the
observed increase in meridional intensity at low strain.
Fragmentation of these microdomains could account for
strain softening and the considerable modulus decrease
from the virgin to pre-strained state. However, this hypo-
thesis does not easily explain the significant strain harden-
ing observed above e¼ 0.8 during the second extension
cycles or the convergence with the initial deformation
stress-strain curves above the ‘pre-strain’, which was report-
ed by Meissner and Spırkova.[8]
Any explanation based purely on microdomain rotation
and fragmentation also overlooks the considerable strain-
induced changes and angular dependence observed in the
scaling factor. No adequate explanation for these observa-
tions can be envisaged at present based on purely ‘geo-
metric’ changes in microdomain orientation or distribution;
whereas, several possible mechanisms providing explan-
ations based on variations in scattering contrast due to
localised composition or density changes appear possible.
Dilatational effects during polymer deformation have been
discussed by Naqui and Robinson.[39] Although it is gen-
erally expected that rubbery polymers deform at approx-
imately constant volume, this may not preclude local
density fluctuations on a nanometre scale, due to the mod-
ulus difference between dispersed HS microdomains and
the softer, mixed HSþ SS continuous phase. This may be
regarded as an extension to the nanometre scale of local
stress variations in composites, which have been discussed
extensively by Hull and Clyne.[40] Based on the analysis
Figure 13. Suggested mechanisms producing local variations inscattering contrast.
322 P. R. Laity et al.
Macromol. Mater. Eng. 2006, 291, 301–324 www.mme-journal.de � 2006 WILEY-VCH Verlag GmbH & Co. KGaA, Weinheim

method developed by Eshelby,[41,42] uniaxial extension of
the TPU is initially expected to produce dilation in the
continuous phase adjacent to HS microdomains in the strain
direction and compression in the transverse direction. Since
the mixed HSþ SS phase is expected to have a lower
electron density than the dispersed HS microdomains, this
would explain the angular dependence in I0 at low strain.
The subsequent general decrease in scattering intensity at
higher strain may be attributed to strain-induced segmental
mixing, with HS being pulled from microdomains in the
strain direction. These mechanisms are represented di-
agrammatically in Figure 13.
HS pull-out and strain-induced segmental mixing sug-
gests an alternative explanation for the observed mechan-
ical behaviour. The HS microdomains are usually assumed
to act as physical crosslinks; however, the chain movement
implied by segmental mixing could provide a mechanism
for relieving the stresses associated with strained macro-
molecular entanglements. Entanglements play a key part in
models of rubber-like elasticity, such as those described by
Kluppel and Schramm,[13] Edwards and Vilgis[43,44] and
others.[45] A distinction is made between ‘slip links’ that
can move relatively freely at low strain and ‘trapped
entanglements’ that contribute to load-bearing. According
to the present hypothesis, HS pull-out and chain diffusion
through HS microdomains may permit the release of
entanglements and stress-relief, giving rise to the observed
strain softening. Strain hardening during subsequent
extension cycles can then be attributed to chain segments
that had slackened through HS pull-out becoming taught
again, as the previous maximum strain is approached and
exceeded.
It was suggested previously[11] that the slower segmental
motion within HS micodomains might impede but not
completely stop the movement of entanglements. In support
of this hypothesis, NMR studies by Schmidt-Rohr and
Spiess,[46] Robertson et al.[47] and Miyoshi et al.[48] pre-
sented evidence of chain diffusion through polymer
crystals. Moreover, van der Schuur and Gaymans[49]
recently reported considerable differences in the mechan-
ical behaviour of segmented block copolymers with similar
compositions but containing different amounts of covalent
crosslinks. The suggested dependence of mechanical
properties on a combination of freely moving and trapped
entanglements in the TPUs studied is expected to cause a
strong dependence on temperature and strain rate; this is
under investigation and will be reported subsequently.
It may be possible to observe strain-induced segmental
mixing by changes in thermal behaviour, by DSC
or dynamic mechanical thermal analysis. Segmental
mixing and chain movement may also be investigated
by neutron scattering with deuterium labelled materials,
along the lines previously used by Naylor et al.[50] to
study the thermal behaviour and microphase mixing in
TPUs.
Conclusion
The SAXS patterns from two commercial TPUs undergoing
repeated uniaxial extension and stress relaxation were
analysed in terms of ‘globular’ morphologies. The results
indicated some strain-induced microdomain displacement,
reorientation and fragmentation, but the net changes
appeared incommensurate with the observed decrease in
mechanical properties from the first to second deformation
cycles.
Considerably more pronounced variations in the SAXS
scaling factor were observed, which were attributed to local
density changes and strain-induced segmental mixing. It is
suggested that the associated chain movement could
provide a mechanism for relieving the stress associated
with strained macromolecular entanglements, which has a
greater effect on the mechanical properties.
Acknowledgements: This work was funded by RanierTechnology Ltd, DTI and EPSRC. The help of A. Gleeson forsetting up station 16.1, at the SRS is gratefully acknowledged. Theauthors would especially like to thank A. Renouf, A. Kamvari, S.Freeburn, A. Lynn, J. Sandler, S. Pegler and P.Werner, who helpedto perform the experiments on which this paper is based.
[1] C. Prisacariu, C. P. Buckley, A. A. Caraculacu, Polymer2005, 46, 3884.
[2] H. S. Lee, S. R. Yoo, S. W. Seo, J. Polym. Sci., Part B: Polym.Phys. 1999, 37, 3233.
[3] H. S. Lee, J. H. Ko, K. S. Song, K. H. Choi, J. Polym. Sci.,Part B: Polym. Phys. 1997, 35, 1821.
[4] J. W. Rosthauser, K. W. Haider, C. Steinlein, C. D.Eisenbach, J. Appl. Polym. Sci. 1997, 64, 957.
[5] N. Reynolds, H. W. Spiess, H. Hayen, H. Nefzger, C. D.Eisenbach, Macromol. Chem. Phys. 1994, 195, 2855.
[6] A. J. Ryan, J. L. Stanford, R. H. Still, Polymer 1991, 32,1426.
[7] B. Bengtson, C. Feger, W. J. MacKnight, N. S. Schneider,Polymer 1985, 26, 895.
[8] B. Meissner, M. Spırkova,Macromol. Symp. 2002, 181, 289.[9] D. J. Blundell, G. Eekhaut, W. Fuller, A. Mahendrasingam,
C. J. Martin, J. Macromol. Sci. B, Phys. 2004, 43, 125.[10] D. J. Blundell, G. Eekhaut, W. Fuller, A. Mahendrasingam,
C. J. Martin, Polymer 2002, 43, 5197.[11] P. R. Laity, J. E. Taylor, S. S. Wong, P. Khunkamchoo, M.
Cable, G. T. Andrews, A. F. Johnson, R. E. Cameron, J.Macromol. Sci., Phys. 2005, 44, 261.
[12] P. R. Laity, J. E. Taylor, S. S. Wong, P. Khunkamchoo,K. Norris, M. Cable, V. Chohan, G. T. Andrews, A. F.Johnson, R. E. Cameron, J. Macromol. Sci., Phys. 2004, 43,95.
[13] M. Kluppel, J. Schramm, Macromol. Theory Simul. 2000, 9,742.
[14] N. R. Langley, Macromolecules 1968, 1, 348.[15] R. Bonart, L. Morbitzer, G. Hentze, J. Macromol. Sci., Phys.
1969, 3, 337.
Morphological Behaviour of Thermoplastic Polyurethanes During Repeated Deformation 323
Macromol. Mater. Eng. 2006, 291, 301–324 www.mme-journal.de � 2006 WILEY-VCH Verlag GmbH & Co. KGaA, Weinheim

[16] P. R. Laity, J. E. Taylor, S. S. Wong, P. Khunkamchoo, K.Norris, M. Cable, G. T. Andrews, A. F. Johnson, R. E.Cameron, Polymer 2004, 45, 7273.
[17] P. R. Laity, J. E. Taylor, S. S. Wong, P. Khunkamchoo, K.Norris, M. Cable, V. Chohan, G. T. Andrews, A. F. Johnson,R. E. Cameron, Polymer 2004, 45, 5215.
[18] R. Hosemann, Z. Phys. 1949, 127, 16.[19] R. Hosemann, S. N. Bagchi, ‘‘Direct Analysis of Diffraction
by Matter’’, North-Holland, Amsterdam 1962.[20] C. R. Desper, N. S. Schneider, J. P. Jasinski, J. S. Lin,
Macromolecules 1985, 18, 2755.[21] C. Tonelli, G. Ajroldi, A. Marigo, C. Marega, A. Turturro,
Polymer 2001, 42, 9705.[22] J. W. C. van Bogart, D. A. Bluemke, S. L. Cooper, Polymer
1981, 22, 1428.[23] D. J. Martin, G. F. Meijs, P. A. Gunatillake, S. P.
Yozghatillian, G. M. Renwick, J. Appl. Polym. Sci. 1999,71, 937.
[24] B. D. Kaushiva, G. L. Wilkes, Polymer 2000, 41, 6987.[25] C. D. Eisenbach, E. Stadler, Macromol. Chem. Phys. 1995,
196, 1981.[26] C. D. Eisenbach, A. Ribbe, C. Gunter, Macromol. Rapid
Commun. 1994, 15, 395.[27] C. D. Eisenbach, T. Heinemann, A. Ribbe, E. Stadler,Angew.
Makromol. Chem. 1992, 202, 221.[28] C. Li, S. L. Goodman, R. M. Albrecht, S. L. Cooper,
Macromolecules 1988, 21, 2367.[29] M. Serrano, W. J. MacKnight, E. L. Thomas, J. M. Ottino,
Polymer 1987, 28, 1667.[30] J. T. Garrett, C. A. Siedlecki, J. Runt,Macromolecules 2001,
34, 7066.[31] J. T. Garrett, J. Runt, J. S. Lin, Macromolecules 2000, 33,
6353.
[32] R. S. McLean, B. B. Sauer, Macromolecules 1997, 30, 8314.[33] E. M. Christenson, J. M. Anderson, A. Hiltner, E. Baer,
Polymer 2005, 46, 11744.[34] J. E. Taylor, P. R. Laity, S. S. Wong, K. Norris, P.
Khunkamchoo, M. Cable, G. T. Andrews, A. F. Johnson,R. E. Cameron, submitted to Microsc. Microanal. Micro-struct.
[35] S. B. Lin, K. S. Hwang, S. Y. Tsay, S. L. Cooper, ColloidPolym. Sci. 1985, 263, 128.
[36] H. S. Lee, S. L. Hsu, J. Polym. Sci., Part B: Polym. Phys.1994, 32, 2085.
[37] R. Bonart, K. Hoffmann,Colloid Polym. Sci. 1982, 260, 268.[38] D. B. Klinedinst, E. Yilgor, I. Yilgor, F. L. Beyer, G. L.
Wilkes, Polymer 2005, 46, 10191.[39] S. I. Naqui, I. M. Robinson, J. Mater. Sci. 1993, 28, 1421.[40] D. Hull, T. W. Clyne, ‘‘An introduction to Composite
Materials’’, 2nd edition, Cambridge University Press,Cambridge 1996.
[41] J. D. Eshelby, Proc. R. Soc. London A 1959, 252, 561.[42] J. D. Eshelby, Proc. R. Soc. London A 1957, 241, 379.[43] S. F. Edwards, T. Vilgis, Polymer 1986, 27, 483.[44] S. F. Edwards, T. Vilgis, Rep. Prog. Phys. 1988, 51, 243.[45] G. Heinrich, E. Straube, G. Helmis, Adv. Polym. Sci. 1988,
85, 33.[46] K. Schmidt-Rohr, H. W. Spiess, Macromolecules 1991, 24,
5288.[47] M. B. Robertson, I. M. Ward, P. G. Klein, K. J. Packer,
Macromolecules 1997, 30, 6893.[48] T. Miyoshi, O. Pascui, D. Reichert, Macromolecules 2004,
37, 6460.[49] M. van der Schuur, R. J. Gaymans, Polymer 2005, 46, 6862.[50] S. Naylor, N. J. Terrill, G.-E. Yu, S. Tanodekaew, W. Bras,
S. M. King, C. Booth, A. J. Ryan, Polym. Int. 1997, 44, 371.
324 P. R. Laity et al.
Macromol. Mater. Eng. 2006, 291, 301–324 www.mme-journal.de � 2006 WILEY-VCH Verlag GmbH & Co. KGaA, Weinheim


