Embed Size (px)
Citation preview

M O U L D GROWTH ON BUILDING M A T E R I A L S A N D THE EFFECTS OF BORATE-BASED PRESERVATIVES
By
Raymond L i
B .Sc , B.Sc.(Pharm.), University of British Columbia, 2005
A THESIS SUBMITTED IN PARTIAL F U L F I L L M E N T OF THE REQUIREMENTS FOR THE D E G R E E OF
M A S T E R OF SCIENCE
in
THE F A C U L T Y OF G R A D U A T E STUDIES
Occupational and Environmental Hygiene
THE UNIVERSITY OF BRITISH C O L U M B I A
April 2005
© Raymond L i , 2005

1
Abstract
One o f the diff icul t ies i n establishing causal roles for indoor m o u l d g rowth and adverse health effects is that the growth, metabol ism, and b io log ica l act ivi ty o f moulds depend on the interaction o f the moulds w i t h their g rowth substrates and environment. Further, one o f the approaches to preventing indoor m o u l d growth is to treat b u i l d i n g materials w i t h preservatives. Borates are a class o f preservatives w i t h l o w tox ic i ty that can be used to protect a variety o f different materials.
Objectives: The growth and metabo l i sm o f three moulds associated w i t h indoor environment problems were investigated on untreated and borate-treated versions o f six b u i l d i n g materials.
Methods: Untreated and treated specimens o f Southern Y e l l o w pine, lodgepole pine, p ine oriented strandboard, aspen oriented strandboard, cel lulose insulat ion, and gypsum board were inoculated w i t h spores o f S. chartarum ( A T C C 201212), A. versicolor ( A T C C 26939), or P . brevicompactum ( A T C C 9056), and incubated at 2 0 - 2 3 ° C and - 1 0 0 % relative humid i ty for 4 weeks. The v i sua l appearance o f m o u l d growth and changes i n the vola t i le organic compound profile were measured each week. Ca rbon d iox ide product ion and ergosterol were measured at the end o f the incubat ion per iod.
Results: The bu i ld ing materials tested differed i n their abi l i ty to support m o u l d growth. S. chartarum d i d not grow on untreated or treated w o o d or w o o d composites. The pattern o f vola t i le organic compounds produced b y each m o u l d depended o n the growth substrate. Borates were effective at preventing or reducing m o u l d growth, although O S B may require higher levels o f treatment than currently used. A dose-response trend was observed w i t h gypsum board. Sub- inh ib i tory levels o f borates d i d not stimulate the product ion o f different vola t i le metabolites, suggesting the lack o f stress metabol i sm. The use o f different methods for evaluat ing g rowth revealed that there cou ld be m o u l d g rowth on materials that d id not appear to be contaminated.
Conclusions: M o u l d growth and metabo l i sm is inf luenced by the specific mould-substrate interactions. Borate-based preservatives inhibi t m o u l d growth and do not appear to induce stress metabol i sm at sub-inhibi tory concentrations. Further studies on other aspects o f m o u l d growth, such as myco tox in product ion and the b io log ica l act ivi ty o f spores, on treated and untreated b u i l d i n g materials are needed.

Table of Contents
Abstract ii
Table of Contents - iii
List of Tables ix
List of Figures x
Abbreviations and Definitions x i i
Acknowledgments xiii
1. INTRODUCTION 1
1.1 The indoor environment and indoor air quality 1
1.2 Introduction to fungi and moulds 1 1.2.1. Structure and metabolism 2
1.3 Mould growth indoors 4 1.3.1 Moulds in indoor spaces and adverse health effects 5
1.3.1.1 Allergens 5 1.3.1.2 Glucans 6 1.3.1.3 VOCs 6 1.3.1.4 Mycotoxins 7 1.3.1.5 Epidemiological evidence 7
1.4 Prevention of mould growth 9 1.4.1 Boron and borates 10 1.4.2 Toxicity of borates , 11 1.4.3 Borates as preservatives 12
1.4.3.1 Solid wood 12 1.4.3.2 Oriented strandboard (OSB) 12 1.4.3.3 Cellulose insulation 13 1.4.3.4 Gypsum board 13
1.5 Moulds and building materials 13 1.5.1 Literature review 14
1.5.1.1 Studies of interactions between moulds and building materials 14 1.5.1.2 Studies on the effectiveness of borate-based preservatives 17
1.6 Objectives of the study 18
in

2. METHODS. . . 19
2.1 Overall Study Design 19
2.2 Test Materials... 20 2.2.1 Preparation of test materials 21
2.2.1.1 Solid wood (Southern Yellow pine and lodgepole pine) 21 2.2.1.2 Oriented strandboard 21 2.2.1.3 Cellulose insulation 21 2.2.1.4 Gypsum board., 21 2.2.2 Sterilisation of test materials 21
2.2.3 Conditioning of test materials 22
2.3 Inoculation 22 2.3.1 Organisms 22 2.3.2 Culturing organisms 23 2.3.3 Preparation of the spore suspension 23 2.3.4 Inoculation 24
2.4 Incubation 25 2.4.1 Incubation chambers 25 2.4.2 Incubation conditions 26
2.5 Assessment of growth 26 2.5.1 Visual assessment 27
2.5.1.1 Growth visible to the unaided eye 27 2.5.1.2 Microscopic examination 27 2.5.1.3 Volunteer rating of visible growth 27
2.5.2 Volatile organic compound extraction and analysis 28 2.5.2.1 Extraction 28 2.5.2.2 Gas chromatography analysis 29 2.5.2.3 Identification of compounds 30
2.5.3 Carbon dioxide measurement 30 2.5.4 Ergosterol measurement : 31
2.5.4.1 Ergosterol sampling 31 2.5.4.2 Ergosterol Analysis 31
2.6 Comparison of methods to assess growth 32
2.7 Data handling and analysis 33 2.7.1 Visual assessment 33 2.7.2 Volatile Organic Compound Profiles 33 2.7.3 Carbon dioxide 33 2.7.4 Ergosterol 33
2.8 Heartwood determination and borate treatment status 34
iv

2.8.1 Heartwood determination 34 2.8.2 Borate treatment status 34
3. RESULTS 35
3.1 Mould growth on building materials • • 35
3.1.1 Solid wood 35 3.1.1.1 Visible growth 35
3.1.1.1.1 Visible growth - Southern Yellow pine 35 3.1.1.1.1.1 S. chartarum 35 3.1.1.1.1.2 A. versicolor 35 3.1.1.1.1.3 P. brevicompactum 35
3.1.1.1.2 Visible growth - Lodgepole pine 35 3.1.1.1.2.1 S. chartarum 35 3.1.1.1.2.2 A. versicolor 35 3.1.1.1.2.3 P. brevicompactum 36
3.1.1.2 Volatile Organic Compound Profile. 37 3.1.1.2.1 VOCs - Southern Yellow pine 37
3.1.1.2.1.1 S. chartarum : 37 3.1.1.2.1.2/1. versicolor 37 3 A A.2 A.3 P. brevicompactum 39
3.1.1.2.2 VOCs-Lodgepole pine 40 3.1.1.2.2.1 S. chartarum 40 3-1.1.2.2.2 A versicolor 40 3.1.1.2.2.3 P. brevicompactum 41
3.1.1.3 Carbon dioxide 42 3.1.1.4 Ergosterol 43
3.1.2 Wood composites 44 3.1.2.1 Visual growth 44
3.1.2.1.1 Visual growth - Pine oriented strandboard 44 3.1.2.1.1.1 S. chartarum 44 3.1.2.1.1.2 A versicolor 44 3.1.2.1.1.3 P. brevicompactum ; 44
3.1.2.1.2 Visual growth - Aspen oriented strandboard 45 3.1.2.1.2.1 S. chartarum 45 3A2A.22 A. versicolor 46 3A.2A.2.3 P. brevicompactum ••• 46
3.1.2.2 Volatile organic compounds 46 • 3.1.2.2.1 VOCs - Pine oriented strandboard 47
3.1.2.2.1.1 S. chartarum 47 3.1.2.2.1.2 A versicolor 47 3A.2.2A.3 P. brevicompactum 48

3.1.2.2.2 VOCs - Aspen Oriented Strandboard (Aspen OSB) 49 3.1.2.2.2.1 S. chartarum 49 3.1.2.2.2.2 A. versicolor 49 3.1.2.2.2.3 P. brevicompactum 50
3.1.2.3 Carbon dioxide 51 3.1.2.4 Ergosterol 52
3.1.3 Cellulose insulation 53 3.1.3.1 Visual growth - cellulose insulation 53
3.1.3.1.1 S. chartarum 53 3.1.3.1.2 A. versicolor 53 3.1.3.1.3 P. brevicompactum 53
3.1.3.2 VOCs - Cellulose Insulation 53 3.1.3.1.1 S. chartarum 54 3.1.3.1.2 A. versicolor 55 3.1.3.1.3 P. brevicompactum 55
3.1.3.3 Carbon dioxide - cellulose insulation 56 3.1.3.4 Ergosterol 56
3.1.4 Gypsum board 57 3.1.4.1 Visual growth - Gypsum boards 57
3.1.4.1.1 S. chartarum 57 3.1.4.1.2 A. versicolor 58 3.1.4.1.3 P. brevicompactum 58 3.1.4.1.4 Independent rating of visual growth 59
3.1.4.2 VOCs - Gypsum board 59 3.1.4.2.1 S. chartarum on gypsum board 60
3.1.4.2.1.1 Sesquiterpene production by S. chartarum on gypsum board 63 3.1.4.2.2 A. versicolor on gypsum board 64 3.1.4.2.3 P. brevicompactum on gypsum board 65
3.1.4.3 Carbon dioxide - Gypsum board 66 3.1.4.4 Ergosterol - Gypsum board 68
3.1.5 Summary of results of mould growth on building materials 69
3.2 Comparisons between measures of growth - gypsum board experiments 71 3.2.1 Carbon dioxide versus Week 4 Visual Score 71 3.2.2 Ergosterol versus Week 4 Visual Score 72 3.2.3 Carbon Dioxide versus Ergosterol 73
4. DISCUSSION 74"
4.1 Overview 74
4.2 Organism-substrate interactions 75
VI

4.2.1 Differing abilities of materials to support mould growth 75 4.2.2 VOC profiles produced by each organism on different substrates 76
4.2.2.1 Solid wood 76 4.2.2.2 Wood composites 76 4.2.2.3 Cellulose insulation 77 4.2.2.4 Gypsum board 77
4.2.3 Variability of volatile metabolites 78 4.2.4 Comparison with other studies 78 4.2.5 Potential use of VOCs as identifiers of mould contamination 78
4.3 Effects of borate preservatives 79 4.3.1 Solid wood 79 4.3.2 Wood composites. 80 4.3.3 Cellulose insulation 81 4.3.4 Gypsum board 81 4.3.5 Comparison with other studies 81
4.4. Use of different measures to assess fungal growth 82 4.4.1 Visual assessment 82 4.4.2 Changes in the V O C profile. 83 4.4.3 Carbon dioxide... -. 84 4.4.4 Ergosterol 86
4.5 Strengths and limitations of the study 89 4.5.1 Strengths ..: 89 4.5.2 Limitations 90
4.5.2.1 Methodology -• 90 4.5.2.1.1 Duration of experiments 90 4.5.2.1.2 Visual assessment 90 4.5.2.1.3 Measuring the volatile organic compound profile 91 4.5.2.1.4 Carbon dioxide 91 4.5.2.1.5 Ergosterol 91 4.5.2.2 Generalisability of the results 91
4.5.2.2.1 Interactions between organisms and substrates ,. 91 4.5.2.2.2 Effectiveness of borate preservatives 92
4.6 Future directions 92 4.6.1 Mycotoxin analysis and biological activity of spores and fungal fragments 92 4.6.2 Long-term performance of borates 93 4.6.3 Different environmental conditions 93 4.6.4 Effects of accumulation of carbon dioxide and VOCs 93 4.6.5 Tests of materials under in-use conditions 94 4.6.6 Toxicity of V O C metabolites 94 4.6.7 Mechanism of resistance to borates 94
vu

5. CONCLUSIONS 95
REFERENCES 97
Appendices 108 Appendix A - Conditioning materials 109 Appendix B - Preparation of the spore suspension 112 Appendix C - Inoculation procedure 113 Appendix D - SPME desorption and sample carry-over 115 Appendix E - Comparison of SPME fibers 116 Appendix F - Effects of extraction time 118 Appendix G - Gas chromatography conditions 119 Appendix H - Development of CO2 measurement method 121 Appendix I - Ergosterol method 122 Appendix J - Photographs of specimens after 4 weeks. 134 Appendix K - Sample V O C chromatograms 145
V l l l

List of Tables
Table 1.1: Environmental factors influencing fungal growth 3 Table 1.2: Levels of evidence for adverse health effects associated with damp indoor spaces and mould growth 8 Table 1.3: Toxic effects of borates 11 Table 1.4: Boron compounds used commercially in material preservation 12
Table 2.1: Test materials used in the study 20 Table 2.2: Organisms used in the study 23 Table 2.3: Rating scale used for the intensity of fungal growth : 27
Table 3.1: Volatile organic compounds from fungal growth on Southern Yellow pine and lodgepole pine 38 Table 3.2: Average carbon dioxide concentration - solid wood 42 Table 3.3: Average ergosterol content (u,g/cm2) - solid wood , 43 Table 3.4: Volatile organic compounds from fungal growth on pine oriented strandboard and aspen oriented strandboard 47 Table 3.5: Average carbon dioxide concentration (ppm) - OSB 51 Table 3.6: Average ergosterol content (u.g/cm2) - OSB 52 Table 3.7: Volatile organic compounds from fungal growth on cellulose insulation... 54 Table 3.8: Average carbon dioxide concentration (ppm) - cellulose insulation 56 Table 3.9: Average ergosterol content (mean ± SD) (pg/g) - cellulose insulation 56 Table 3.10: Volatile organic compounds from fungal growth on gypsum boards 60 Table 3.11: Overall results - growth or no growth (all materials except gypsum board). 70 Table 3.12: Overall results - growth or no growth (gypsum board) 70
Table 4.1: Comparison of the V O C s produced by similar organisms on similar building materials in reports in the literature and in this study. 78 Table 4.2: Advantages and disadvantages of the different measured of fungal growth used in this study 88
ix

List of Figures
Figure 1.1: The three critical factors for mould growth indoors 5
Figure 2.1: Experimental design for solid wood, oriented strandboard, and cellulose insulation experiments 19 Figure 2.2: Experimental design for gypsum board experiments 19 Figure 2.3: Stainless steel lid for incubation chamber 25 Figure 2.4: Taking a V O C sample 29 Figure 2.5: Measuring carbon dioxide levels 31
Figure 3.1: Individual visual growth scores for A. versicolor on untreated Southern Yellow pine 36 Figure 3.2: Individual visual growth scores for P. brevicompactum on untreated Southern Yellow pine 36 Figure 3.3: Individual visual growth scores for A. versicolor on untreated lodgepole pine 37 Figure 3.4: 2-Pentanone production by A. versicolor on untreated Southern Yellow pine 38 Figure 3.5: Acetone production by P. brevicompactum on untreated Southern Yellow pine 39 Figure 3.6: 2-Pentanone production by P. brevicompactum on untreated Southern Yellow pine 39 Figure 3.7: 2-Butanone production by P. brevicompactum on untreated Southern Yellow pine 40 Figure 3.8: 2-Pentanone production by A. versicolor on untreated lodgepole pine 41 Figure 3.9: Hexanal concentrations for untreated lodgepole pine inoculated with P. brevicompactum (experiment 1) 42 Figure 3.10: Hexanal concentrations for untreated lodgepole pine inoculated with P. brevicompactum (experiment 2) 42 Figure 3.11: Individual visual growth scores for A. versicolor on untreated pine OSB 45 Figure 3.12: Individual visual growth scores for P. brevicompactum on treated pine OSB .. 45 Figure 3.13: Individual visual growth scores for P. brevicompactum on untreated pine OSB 45 Figure 3.14: Individual visual growth scores for A. versicolor on untreated aspen OSB ' 46 Figure 3.15: Individual visual growth scores for P. brevicompactum on untreated aspen OSB 46 Figure 3.16: Hexanal concentrations for A. versicolor on untreated pine OSB 48 Figure 3.17: Styrene production by A versicolor on untreated aspen OSB 50 Figure 3.18: 2-pentanone production by P. brevicompactum on untreated aspen OSB 51 Figure 3.19: Styrene production by P. brevicompactum on untreated aspen OSB 51 Figure 3.20: Anisole production by S. chartarum on untreated cellulose insulation... 55 Figure 3.21: 2-Pentanone production by A. versicolor on untreated cellulose insulation 55
x

Figure 3.22: Average visual growth scores for S. chartarum on gypsum board 57 Figure 3.23: Average visual growth scores for A. versicolor on gypsum board 58 Figure 3.24: Average visual growth scores for P. brevicompactum on gypsum board 59 Figure 3.25: Average hexanal concentration for S. chartarum on gypsum boards 61 Figure 3.26: Average anisole production by S. chartarum on gypsum board 61 Figure 3.27: Average trichodiene concentration for S. chartarum on gypsum boards 61 Figure 3.28: Anisole production by S. chartarum on gypsum board for experiments 1,2, and 3.... 62 Figure 3.29: Chromatograms showing terpene production by S. chartarum on gypsum board 63 Figure 3.30: Mass spectra of trichodiene from S. chartarum on gypsum 64 Figure 3.31: Average hexanal concentration for A. versicolor on gypsum board 65 Figure 3.32: Acetone production by A. versicolor on gypsum board 65 Figure 3.33: Average hexanal concentration for P. brevicompactum on gypsum board 66 Figure 3.34: Average acetone production for P. brevicompactum on gypsum board... 66 Figure 3.35: Average carbon dioxide levels for S. chartarum on gypsum board 67 Figure 3.36: Average carbon dioxide levels for A. versicolor on gypsum board 67 Figure 3.37: Average carbon dioxide levels for P. brevicompactum on gypsum board 67 Figure 3.38: Average ergosterol content for S. chartarum on gypsum boards 68 Figure 3.39: Average ergosterol content for A. versicolor on gypsum board 69 Figure 3.40: Average ergosterol content for P. brevicompactum on gypsum boards... 69 Figure 3.41: Carbon dioxide versus Week 4 visual score, S. chartarum on gypsum board 71 Figure 3.42: Carbon dioxide versus Week 4 visual score, A. versicolor on gypsum board 71 Figure 3.43: Carbon dioxide versus Week 4 visual score, P. brevicompactum on gypsum board 71 Figure 3.44: Ergosterol versus Week 4 visual score, S. chartarum on gypsum board.. 72 Figure 3.45: Ergosterol versus Week 4 visual score, A. versicolor on gypsum board.. 72 Figure 3.46: Ergosterol versus Week 4 visual score, P. brevicompactum on gypsum board 72 Figure 3.47: Carbon dioxide versus ergosterol, S. chartarum on gypsum board 73 Figure 3.48: Carbon dioxide versus ergosterol, A. versicolor on gypsum board 73 Figure 3.49: Carbon dioxide versus ergosterol, P. brevicompactum on gypsum board 73
Figure 4.1: Ergosterol measurements (average ± SD) for materials with a visual rating of "3" at week 4 88

Abbreviations, symbols and definitions
A S T M American Society for Testing and Materials A T C C American Type Culture Collection a w Water activity B A E Boric acid equivalent BSI British Standards Institute BSTFA B is(trimethylsilyl)trifluoroacetamide cm 2 Square centimeter
co 2 Carbon dioxide
Composi-Bor® Registered tradename for preservative containing zinc borate CW Carbowax® D L Detection limit DOT Disodium octaborate tetrahydrate D V B Divinyl benzene E M C Equilibrium moisture content Ergosterol-TMS Trimethylsilyl ester of ergosterol FID Flame ionization detector/detection g gram GC Gas chromatography H 2
Hydrogen He Helium L/min Litres per minute M C Moisture content mm H 2 0 Millimeters of water L/min Liters per minute MS Mass spectrometer/spectrometry MSF Thousand square feet MS/MS Tandem mass spectrometry M V O C Microbial volatile organic compound m/z Mass to charge ratio NIST National Institute of Standards and Technology OSB Oriented strand board pcf Pounds per cubic foot PDMS Polydimethylsiloxane ppb Parts per billion ppm Parts per million psi Pounds per square inch R H Relative humidity RSD Relative standard deviation (standard deviation/average x 100%) SD Standard deviation S E M Standard error of the mean SIS Selected ion storage SPME Solid phase microextraction Tim-Bor® Registered tradename for preservative containing disodium octaborate tetrahydrate Tween 80® Registered tradename for a surfactant containing polysorbate 80
Microgram U M V O C Unique microbial volatile organic compound V O C Volatile organic compound % w/v Percent weight in volume (1% w/v = 1 gram substance per 100 mL total volume)

Acknowledgments
There are many people who I wish to thank for their contributions to this project and for seeing me through it.
Firstly, I would like to thank my committee members, Dr. Chris van Netten, Dr. Michael Brauer, and Dr. Karen Bartlett, for their support and guidance through this project. I would especially like to thank my supervisor, Dr. Bartlett for introducing me to the fascinating world of mycology, keeping me on track, and for always taking the time to discuss, coach, and offer encouragement.
Many thanks to Timothy Ma for his assistance with the gas chromatography and ergosterol analysis, and for his friendship. Thank you also to Dr. Winnie Chu and Tracy Kirkham for allowing me to grab equipment with short notice and for keeping the gas from running out, and to Victor Leung for helping me get started with the gas chromatography.
I would also like to acknowledge the generous people at Forintek Canada Corporation (Vancouver) for their advice and expertise, use of their library, and use of their equipment and facilities: Dave Minchin, Dr. Adnan Uzunovic, Dr. Paul Morris, Jean Clark, and A l Matsala.
Thank you to Rashmi Patwardhan of U.S. Borax Inc. for supplying the building materials and providing technical details. Thanks also to Dr. Bob Bruce of Bob Bruce and Associates, Inc. for information regarding gypsum board manufacturing.
Thanks to my office "roomie" Melissa Friesen for the statistics pointers, as well as for the distractions. I would also like to extend my appreciation to other investigators who took the time to answer e-mails and offered information or advice, especially when I first started: Dr. Anna-Lisa Pasanen, Dr. Hannu Viitanen, Dr. Kristian Fog Nielsen, Dr. Jessie Micales-Glaeser, and Dr. Ken Wilkins.
To my family and friends, the guys from the M G , friends from U-Chapel and St. John's, thank you for your moral support and for your prayers.
Lastly, to Dorothy - danke fur Ihre Liebe und Geduld. You are truly a blessing to me!
This work was funded in part by grants from the Michael Smith Foundation for Health Research and from U.S. Borax, Inc.

1. Introduction
1.1 The indoor environment and indoor air quality
Canadians, on average, spend close to 90% of their time indoors, with about 65% of their time
inside homes (Leech et al. 2002). Over the past few decades there has been increasing concern
over the healthiness of our indoor spaces, with the development of entities such as "sick
building syndrome" and "building-related illness". In a recent survey, over 75% of Canadians
felt that indoor air pollution posed as great a risk, or greater, than outdoor air pollution
(Environics 2001).
Traditionally, the main indoor air pollutants of concern have been mostly chemical in nature,
derived from both outdoor sources and indoor sources (Health Canada 1995). Combustion
products including cigarette smoke, releases from building products and furnishings, cleaners,
personal care products, etc., all contribute to indoor air pollution. However, more recent
attention has been focused on biological contaminants, and moulds in particular (Samson 1985;
Strom et al. 1994; Straus 2003).
1.2 Introduction to fungi and moulds
Fungi are a group of eukaryotic organisms that are neither animal nor plant, and thus form their
own kingdom. Fungi are among the most plentiful organisms on the planet, accounting for an
estimated 25% of the earth's biomass. There are hundreds of thousands of species of fungi,
whose diverse members range from the useful yeasts and edible mushrooms, to wood-
destroying organisms and agents of disease, like Cryptococcus. They range in size from
microscopic unicellular yeasts to "mushrooms" with contiguous subterranean networks
estimated to be hundreds or thousands of acres in size.
"Mould" is not a scientific word, but it is often used to refer to fungi that grow as filamentous
networks, visible to the eye as smudges of colour or patches of fluffy or powdery growth. In this
thesis, we are solely Concerned with such mould fungi.
1

1.2.1. Structure and metabolism
Microscopically, moulds consist of individual filaments called hyphae, which are the basic
cellular unit of most fungi. A visible mass of hyphae is called a mycelium. Moulds resemble
plants in that their cells consist of a plasma membrane surrounded by a rigid carbohydrate
polymer cell wall, though there are differences in their respective chemical compositions.
Firstly, fungal plasma membranes contain the sterol ergosterol, as opposed to stigmasterol in
plants (or cholesterol in animals). Secondly, fungal cell walls are composed of aminosugar
polymers (chitin) and glucose polymers joined in a l->3 configuration (P(l->3)-D-glucans) as
opposed to the l->4 configuration found in cellulose. Since ergosterol is unique to fungi, and
since the cell wall polymers account for 80-90% of the fungal mass, chemical analysis of
ergosterol and |3(1 -^3)-D-glucans has been used to quantify fungal biomass. Fungi also contain
small amounts of proteins, including enzymes and glycoproteins that maybe important as
allergens (Zabel & Morell 1992; Rose 1999; Kurup & Banerjee 2000).
Mould reproduce by producing spores that are typically borne externally on specialized hyphal
structures and give moulds their characteristic coloured, powdery appearance.
Fungi are heterotrophs, meaning they must have an external source of nutrients such as carbon
sources, nitrogen, and trace elements. Fungi in general are able to use a wide variety of carbon
sources, ranging from simple sugars to complex polymers such as cellulose. Other carbon
sources that can serve as food for various fungi include lignin from wood (a complex phenolic
polymer); oils and waxes; resins and glues; low-molecular weight organic additives in paints,
plastics, and rubbers; and amino acids from proteins (Zabel & Morrell 1992; Plastic Pipe
Institute 2000). Fungi are capable of colonizing even inorganic materials, provided with just a
thin film of organic debris such as dead skin cells or oil mists from cooking. (Zabel & Morrell
1992; Becker 1994). Building structures and the indoor environment provide many of these
carbon sources in abundance.
Fungi, as with all living things, also require moisture. Water serves 4 main purposes for fungal
growth: it is a solvent for cellular processes; it is a reactant in hydrolysis (e.g., for exocellular
digestion of complex carbohydrates like cellulose); it provides a diffusion medium for secreted
enzymes and digested/solubilized substrate; and it acts as a swelling agent for the substrate to
facilitate penetration of digestive enzymes (Zabel & Morrell 1992).

There are several different ways in which moisture can be described that are relevant to mould
growth in buildings and on building material: relative humidity, moisture content, and water
activity. Of these, water activity is the most useful. Water activity (aw) is related to both the
moisture content of a substrate and the relative humidity of the surrounding atmosphere, when
conditions have reached equilibrium. When a material is placed in a closed container and
allowed to come to moisture equilibrium with the atmosphere inside the container, the water
activity of the material is calculated as the equilibrium relative humidity (ERH) inside the
container expressed as a fraction (i.e. 100% ERH = a w of 1.00). It represents water that is not
bound to the material that is available for chemical reactions and for use by microorganisms.
Most fungi require a water activity of at least 0.80 for growth (Burge & Otten 1999), although
factors such as temperature and the nutrient content of the growth substrate can affect water
requirements. Table 1.1 lists some environmental factors affecting mould growth.
Table 1.1: Environmental factors influencing fungal growth (Zabel & Morrell 1992; Burge & Otten 1999). Environmental factor Category Conditions Examples Moisture requirements aw = water activity, a measure of biologically available water.
Xerophilic Minimum aw <0.80 Aspergillus resthctus Moisture requirements aw = water activity, a measure of biologically available water.
Xerotolerant Minimum aw<0.80, Optimum a w >0.80
Some Aspergillus and Penicillium spp. Moisture requirements aw = water activity, a measure of biologically available water. Mesophilic Minimum aw > 0.80 but
<0.90 Optimum aw > 0.90
Most mycelial fungi. Xerotolerant species will also grow under these conditions.
Moisture requirements aw = water activity, a measure of biologically available water.
Hydrophilic Minimum aw>0.90 Stachybotrys spp., Fusarium spp., Rhizopus spp.
Temperature requirements
Psychrophilic Tmin <0, Tmax <20°C TOpt0-17°C
Some Cladosporium spp, Sporotrichum spp., Fusarium spp.
Temperature requirements
Psychrotolerant T0pt<15-17°C Cladosporium spp. (C. herbarum)
Temperature requirements
Mesophilic Tmin >0°C ToPt15-40°C
Most fungi. Room temperature falls into the Topt for these fungi.
Temperature requirements
Thermophilic Tmin >20, Tmax >50°C Some wood decaying species (Penicillium duponti, Chaetomium thermophile)
Oxygen requirements Most fungi are obligate aerobes, requiring at least some oxygen for growth, with optimal growth seen with oxygen levels greater than 4% (compared to normal atmospheric oxygen concentration of 21%). However, most fungi are able to tolerate low levels of oxygen (to about 1% oxygen, or <10 mm Hg partial pressure) before growth stops. Some fungi (e.g. yeasts) are capable of anaerobic metabolism.
Light requirements Fungi do not require light for growth, although light is felt to stimulate sporulation. Some species, such as Stachybotrys chartarum, will still sporulate in the absence of light (e.g. in enclosed spaces and behind walls) (Heinsohn et al., 2001). Ultraviolet radiation can inhibit mycelial growth; dark fungi are more resistant to ultraviolet radiation.
pH Most fungi can grow over a wide range of pH, with optimal conditions favouring slightly acidic pH. Spore formation and germination have more restrictive pH tolerances. pH can also affect substrate and nutrient availability, as well as exoenzyme reactions and stability.

During growth, moulds also produce various metabolites. Among them are a wide variety of
volatile organic compounds (VOCs), some of which are responsible for the typical musty,
mouldy smell associated with their presence indoors. Hundreds of VOCs have been reported to
be produced by mould fungi (Ammann 1999; Fiedler et al. 2001). Some fungal VOCs can have
non-fungal origins as well, e.g., plants, furnishings, cleaners, plastics, and combustion sources,
but there are VOCs that are felt to be unique to microbial production and these are termed
microbial volatile organic compounds (MVOCs) or unique microbial volatile organic
compounds (UMVOCs) (Wessen & Schoeps 1996; Gao et al. 2002).
The production of VOCs by fungi is highly dependent on the growth substrate. Much of the
literature on fungal VOCs comes from studies of mould growth on foodstuff or laboratory
media that are markedly different from building material in nutritional composition, so
compounds listed in the literature may not necessarily be representative of what might be found
with mould growth on building material. Production of certain compounds may be characteristic
of certain species, leading to interest in using VOCs as chemical taxonomic markers. However,
production of some VOCs may only occur at certain stages of the fungal life cycle and may also
be dependent on other environmental interactions (Ammann 1999).
Moulds can also produce various toxins as they grow. A single fungal species may produce
more than one toxin, and conversely, a toxin may be produced by more than one species. (Burge
& Ammann 1999) These fungal toxins or mycotoxins are regarded as products of secondary
metabolism - compounds not normally produced, but formed in response to some internal or
external factors. Theories on why secondary metabolism occurs include: internal necessity (e.g.
need for a pathway to eliminate other by-products); ecological adaptation (e.g. the production of
toxins to gain a survival advantage); manifestation of morphological differentiation (e.g.
production of volatile compounds or toxins during a particular stage of growth); and response to
stress, a broad view that can include aspects of internal necessity and ecologic adaptation (Frank
1998). The implications are that a toxin-producing mould might not always produce
mycotoxins, depending on the conditions.
1.3 Mould growth indoors
Mould spores are ubiquitous outdoors, and are carried indoors on air currents, on people, pets,
and objects. Under favorable conditions, these spores will germinate and grow. The indoor
4

environment provides most of the essential conditions for mould growth - nutrients, oxygen,
and favorable temperatures. The limiting factor is the availability of adequate moisture (Figure
1.1). However, various factors in building design, construction, and use have led to an increase
in the number of buildings with moisture problems that could encourage mould growth (Hutton
2003). Estimates from surveys in North America and various European countries indicate that
up to 40 to 50% of buildings may have moisture problems that could lead to mould growth
(Nielsen 2003; Gorny et al. 2002; NAS 2004). Locally, it was reported in the Barrett
Commission report of the inquiry into condominium construction in British Columbia that 50%
or more of condominiums in the lower mainland have exterior walls with leak problems (Barrett
1998).
1
\
Moistuic i
/MOULD \ s /
Mould Spoil's i fou.itl I
fitfyv.lu-rb '
Nutrients P q , A n u d l l l |< I
•mil d l l .1
\
V
Figure 1.1: The three critical factors for mould growth indoors. (From Moisture control: system performance. Canadian Gypsum Company, 2003.)
1.3.1 Moulds in indoor spaces and adverse health effects
Various mould components and metabolites can potentially have health effects. The main ones
can be classified as structural components of moulds (cell wall components found in spores and
hyphae), and metabolites such as VOCs and mycotoxins.
1.3.1.1 Allergens
Fungi cell walls contain various proteins and glycoproteins, including some soluble enzymes
such as proteases intended for excretion into the environment that can act as allergens or
antigens. Some fungal antigens have been studied in detail (the antigens of certain Aspergillus
5

and Cladosporium species, for example). Exposure to antigens can result in a variety of
symptoms, ranging from acute asthma attacks and hay-fever symptoms, to chronic inflammation
of the airways as in hypersensitivity pneumonitis. However, the difficulties in measuring fungal
allergens, the multitude of potential organisms and antigens, the non-specificity of allergy
testing, and the variability in individual sensitivity make detailed assessment of the relationships
between fungal allergens and health effects difficult (Money 2004; Rose 1999).
1.3.1.2 Glucans
Glucans comprise a significant proportion of fungal biomass. p-(l->3)-D-glucans are known to
have immunomodulating effects, and it is hypothesized that inhalation of P-(l->3)-D-glucan
may induce some sort of control defect in macrophages and other cells involved in
inflammatory processes (Rylander 2001). While studies have demonstrated associations
between respiratory symptoms (nose and throat irritation, cough, hoarseness), headache, and
fatigue and higher levels of measured P-(l->3)-D-glucan, the levels of p-(l->3)-D-glucan
measured ranged widely and there was overlap between levels in problem buildings and non-
problem buildings between studies (Rylander 1999).
1.3.1.3 VOCs
Experience with V O C exposure in other settings (industrial exposures, sick building syndrome)
has laid the foundation for investigating microbial VOCs as potential causes of health effects,
particularly irritation symptoms, but modeling experiments and animal experiments suggest that
M V O C levels that can be expected from mould growth would not be high enough to cause
irritation (Wilkins 1998; Pasanen et al. 1998; Korpi et al. 1999; Menetrez & Foarde 2002). Field
studies have shown associations between elevated levels of certain M V O C s and allergy and
respiratory symptoms, but the associations were not statistically significant (Elke et al. 1999).
However, these limited studies do not rule out the possibility of low-levels of MVOCs having
negative effects on occupants. The mechanisms by which low levels of VOCs and odours may
elicit physiologic responses (such as sensory irritation, innate aversion, annoyance and stress
reactions) are not well understood, and more study is needed (Shusterman 1992).
"Many problems (are) connected with odours produced by mould growth (headaches, eye, nose,
and throat irritation, fatigue, nausea)... Unfortunately, the significance of the compounds known
to be produced with the symptoms described in patients is still unknown. " (Samson 1985).
6

1.3.1.4 Mycotoxins.
"A new paradigm for the significance of exposure to microfungi in the indoor climate has been
developed since mycotoxins of the trichothecene type have been detected from airborne spores,
dust, and infected buildings. " (Gravesen et al. 1999).
Mycotoxins tend to be non-volatile, and are usually associated with spores, mycelial fragments,
and the surrounding growth substrate. While ingestion of mycotoxin-contaminated food
provides clear examples of the dangers of some mycotoxins, the importance of toxin exposure
from airborne mould spores or fragments and contaminated building materials remains unclear.
Extrapolations from animal data on toxic doses have led to estimates that toxic effects would
only be seen under conditions that resemble industrial or agricultural exposures. Many
authorities have taken the position that while toxicity is possible, toxicity from mycotoxin
exposures typically encountered in buildings with mould growth is unlikely (Robbins et al.
2000; Hardin et al. 2002; Miller et al. 2003; NAS 2004).
1.3.1.5 Epidemiological evidence
A number of studies from different countries have shown associations between respiratory
symptoms and indicators of moisture problems or mould growth in buildings. The most
consistent associations have been found between self-reported symptoms and self-reported or
investigator-reported presence of mould or indicators of moisture.
More recently, case series and anecdotal reports both in the scientific literature and the lay
media of more serious adverse effects ranging from pulmonary hemorrhages in infants, to
neurologic and immune system dysfunction and cancer in occupants of mould-infested building;
have also raised concerns about indoor mould (CDC 1997; Gray et al. 2003; Campbell et al.
2003). One mould in particular — Stachybotrys chartarum (a black mould capable of producing
trichothecene toxins) — has received a lot of attention following initial reports that it was
associated with lung hemorrhages in children living in homes where the organism was
recovered (CDC 1997).
However, the recent evaluation of the evidence by the National Academies of Science found
that while there was sufficient evidence for an association between dampness and/or the

presence of mould indoors and respiratory symptoms (upper respiratory irritation, cough,
wheeze, asthma in sensitized persons, hypersensitivity pneumonitis), there was limited or
insufficient evidence for many of the other purported effects (Table 1.2).
Table 1.2: Levels of evidence for adverse health effects associated with damp indoor spaces and mould growth
(NAS 2004).
Symptom/effect Sufficient evidence Limited or suggestive evidence
Inadequate or insufficient evidence
Symptom/effect
Dampness Mould Dampness Mould Dampness Mould Upper respiratory (nose and throat) symptoms
X X
Cough X X Wheeze X X Asthma symptoms in sensitized persons X X Hypersensitivity pneumonitis in susceptible individuals
X
Dyspnea X X Asthma development X X Lower respiratory tract illness in children X X Airflow obstruction in otherwise healthy persons
X X
Mucous membrane irritation syndrome X X Chronic obstructive pulmonary disease X X Inhalation fevers in non-occupational settings
X X
Lower respiratory tract illness in otherwise healthy adults
X X
Acute idiopathic hemorrhage in infants X X Skin symptoms X X Gastrointestinal tract problems X X Fatigue X X Neuropsychiatric symptoms X X Cancer X X Reproductive effects X X Rheumatological and immune disorders X X
We still do not know exactly how moulds can affect health and negatively affect the indoor
environment. Relationships or associations by themselves are not proof of causality, and such
proof may be difficult to obtain. Some of the challenges faced in establishing causal
relationships between mould exposure and health effects include the facts that some symptoms
may be caused by multiple agents, and moulds exist in complicated ecological relationships
(Rylander 2001). Other challenges relate to the fact that mould growth, mould metabolites, and
the biological activity of mould spores and fragments can be influenced by environmental
conditions, such as the growth substrate. Hence, understanding the interactions between moulds
and building materials as their growth substrate is of critical importance to clarifying the
relationships between indoor moulds and health effect.
1.4 Prevention of mould growth
Despite uncertainties and gaps in knowledge about the health effects of moulds in the indoor
environment, it is agreed that mould growth indoors is unacceptable and needs to be addressed
(Burge & Otten 1999; Robbins et al. 2000).
It is clear that controlling excessive moisture is the key to preventing mould growth. (Small
2003) However, due to the complexities of moisture management, building design, current
construction practices, and the fact that accidents happen, moisture control in buildings has
proved to be a challenge. The high prevalence of moisture problems in buildings indicates that a
"back-up plan" is still needed.
One approach would be to use materials that are inherently resistant to mould growth.
Alternatives to wood that are more resistant to fungal attack such as steel, aluminum, plastic
composites, and concrete are being promoted (Warsco & Lindsey 2003, Masonry Canada 2004).
However, wood is still valued as a construction material for its material properties (good
strength/weight ratio, easy machinability), aesthetic qualities, and because it is renewable and
energy efficient in terms of production and use compared to other materials (Scharai-Rad &
Welling 2002; Canada Wood Council 2005). Likewise, inorganic alternatives to cellulose-
containing products such as ceiling tiles (Karunesena et al. 2001) and the paper facings on
gypsum boards (e.g. DensArmour® panels by Georgia-Pacific) have been shown to resist mould
growth, but these come with increased costs.
Another approach would be to use preservatives to increase the resistance of materials to fungal
attack. The leaky building problem in has encouraged increased use of preservative-treated
wood by builders (Baker et al. 2000), and in some countries, the use of preservative-treated
wood is specified in building codes (NZ-DBH 2005). Wood preservatives have been used for
over a century to guard against damage from insects and fungi. However, there has been recent
public and regulatory pressure on the wood preservation industry to use preservatives with
lower human and ecological toxicity, and some traditional agents, such as copper chromated

arsenic (which had accounted for the vast majority of preserved wood used in building
construction) are being phased out. Additionally, wood is being used in different ways (e.g.
wood composites), and other susceptible building materials need protection against mould
growth. Borate compounds meet the requirements of low toxicity, and versatility in protecting
various kinds of materials.
1.4.1 Boron and borates
Boron is a semimetallic element comprising only 0.001% of the" earth's crust, though it is
widespread in soil and water at low levels (-10-20 ppm average in soil, <2 ppm in freshwater,
and <10 ppm in saltwater). Boron does not exist in its elemental form in nature, but rather is
found as various oxides such as boron oxide (B2O3), boric acid (B(OH)3), and borax
(NaB 2O 7-10H 2O) (Lloyd 1997; ATSDR 1992; Wood 1994). In this thesis, "borates" will be used
to refer to boron compounds in general.
Boron is an essential nutrient for plants, and possibly animals, though the physiologic roles of
boron are unclear. Boron deficient soils produce lower plant yields. Lack of boron reduces the
viability of fish embryos, and there is evidence that boron is beneficial for the development and
maintenance of healthy bones in mammals. Yet boron compounds are also biostatic at higher
concentrations.
In biological systems, the most important boron species is boric acid, or more precisely the
tetrahydroxyborate anion that boric acid forms in aqueous solution (Eq.l). Most inorganic boron
compounds also form the tetrahydroxyborate anion in water.
B(OH) 3 + H 2 0 <-> B(OH) 4" + H + (Eq. 1)
It is suggested that the biological activity of borates relates to the ability of the
tetrahydroxyborate anion to form complexes with hydroxyl groups found in various cellular
components such as enzymes and cofactors like NAD+. At higher concentrations, similar
interactions result in biostatic activity (Lloyd 1997; Manning, Lloyd, & Schoeman 1997).
10

1.4.2 Toxicity of borates
Humans are exposed to boron mainly through food (fruits, vegetables, nuts). Drinking water is
another source of boron exposure, although this can vary depending on the geographic location
and the presence of industrial sources. The average intake of boron is estimated to be 1-2 mg of
boron per day for adults (range 1-7 mg B/day); vegetarian diets may have more B. A tolerable
daily intake of 18 mg B/day has been proposed. Borate exposure may also occur from consumer
products such as detergents and toiletries (Richold 1998; ATSDR 1992).
At high doses (5-20 grams orally of boric acid for a human), borates can cause toxicity (Table
1.3). Exposure to occupants of buildings with borates as preservatives in building materials is
likely to be minimal since borates are essentially non-volatile, and such materials are likely to
be enclosed, preventing direct skin contact.
Table 1.3: Toxic effects of borates (Kent et al. 1997).
Acute Chronic CNS Agitation, excitation, seizures -Gl Nausea, vomiting.and diarrhea -Skin Local irritation from topical exposure. Rash,
bullous lesions, exfoliation from ingestion of large doses.
Kidney Kidney toxicity following massive doses -Reproductive Animal studies have shown reduced fertility
(male), but human studies of exposed workers have not shown similar effect. It was recently proposed to place borates on list as reproductive toxicants by the European Commission - action postponed for now.
Borates possess low acute mammalian toxicity, with oral LD 5o's ranging from 2550 mg/kg for
disodium octaborate tetrahydrate to 6000 mg/kg for borax. Reviews of the aquatic and terrestrial
eco-toxicity have been published, and the risk to aquatic ecosystems from borates appears to be
low. Toxicity from excess boron in soils is much less common than boron deficiency (Hubbard
1998; Howe.1998). Life cycle analysis has estimated that the increased environmental boron
burden from end use as a preservative is considered to be minor compared to natural and other
anthropogenic releases to the environment. Anthropogenic releases of borates, such as releases
from burning of fossil fuels, mining processes, stack emissions from glass and ceramic
manufacturing, agricultural use (soil application of boron-containing fertilizers, sewage sludge
and waste waters), use of borate cleaning products, and leaching from discarded items in
11

landfills are estimated to represent less than 1% of the total movement of borates in the
environment. (ATSDR 1992; Rainer 1993; Argust 1998)
1.4.3 Borates as preservatives
Borates are used to protect wood and wood composites from wood destroying fungi and insects.
They are also used in other products such as cellulose insulation and gypsum board for other
reasons, although they may also provide protection against fungal growth in these materials. The
main commercially used borates are listed in Table 1.4.
Table 1.4: Boron compounds used commercially in material preservation (ATSDR; Laks & Manning 1997).
Chemical formula Mol. Wt.
Water solubility Boron content (%wt)
Boric acid B(OH) 3
61.8 g 63.5 g/L @ 30°C 17.5% B
Borax NaB 2 O 7 -10H 2 O 336.6 g
20.1 g/L @ 0°C 6.4% B
Disodium octaborate tetrahydrate (DOT)
Na 2B 8 0i3 4H20* 412.5 g
95 g/L @ 20°C >300 g/L @ 50°C
21% B
Zinc borate 2Zn0 3B 2 0 3 -3 .5H 2 0 434.7 g
2.8 g/L at room temp. 14.9% B _
*DOT is a mixture of boric acid and borax roughly corresponding to the above chemical formula.
1.4.3.1 Solid wood
Dimensional lumber such as 2-by-4's are commercially treated with water-soluble disodium
octaborate tetrahydrate by pressure treatment, similar to other water-borne wood preservatives.
The standard recommended by the American Wood Preservers Association (AWPA) is to treat
to a borate retention of-0.9% DOT (-0.25 pounds per cubic foot - pcf) for protection against
wood-destroying fungi, beetles, and native termites. For protection against the subterranean
Formosan termite (in export markets), higher borate retentions are used (-1.5% DOT or -0.42
pcf) (Fogel & Lloyd 2002).
1.4.3.2 Oriented strandboard (OSB)
Oriented strandboard is made of layers of strands of wood glued and pressed together into a
sheet. In the manufacture of OSB, wood strands are mixed with waxes and adhesive resins
(usually phenol-formaldehyde, but about 35% of OSB manufacturers use polymeric
diphenylmethane diisocyante or pMDI) (Structural Board Association 1996). Preservatives are
added during the mixing step. The mixed wood strands are spread out in layers with specific
12

orientation to maximize the dimensional stability of the resulting sheet. Zinc borate, which is
relatively water insoluble, currently is the only commercially used borate preservative for OSB.
The A W P A recommends treating wood composites to a borate retention of 0.75% zinc borate
for protection against fungal decay and termites (Fogel and Lloyd 2002).
1.4.3.3 Cellulose insulation
Cellulose insulation is essentially ground and shredded newsprint. Due to the flarnmability
hazard, all cellulose insulation must be treated with fire retardants. Borates such as boric acid
and borax are commonly used as the fire retardant, often at concentrations -15% or higher
(CIMA 2005).
1.4.3.4 Gypsum board
Gypsum board (also known as plasterboard) is typically composed of a core of gypsum (calcium
sulphate dihydrate) sandwiched between two facings of paper. In the manufacture of gypsum
board, gypsum is made into a slurry with water, and additives such as waxes, foaming agents,
and starch are added. The wet slurry is poured between the paper facings and rolled to the
desired thickness and then dried. Boric acid can be added to the gypsum slurry in
concentrations ranging from 0.1 to 0.3% to increase the stiffness of the gypsum, core, reduce
delamination of the paper facings, and accelerate curing. As the gypsum board dries, some of
the boric acid will migrate through the paper to the paper surface, which may provide some
measure of protection against fungal growth (Fogel & Lloyd 2002).
1.5 Moulds and building materials
Over the past 20 years there has been a progression in knowledge of mould interactions with
building materials, from understanding what materials and conditions encourage mould growth,
to gaining insights into the complex biology of moulds and the production of their metabolites.
There has also been some recent work done on the effectiveness of borates against mould
growth on building materials.
However, further work is needed as there are challenges in applying existing data as well as
gaps in the data, since:
13

most of the literature comes from Europe where different building materials may be
used; more data on mould-substrate interactions with building materials used locally is
needed;
borate-treated products are commercially available. Few studies have been done on these
materials and more data are needed;
published data on the mould-resistance of borate-treated cellulose insulation is lacking;
data on the effects of borate preservatives on the metabolism of mould fungi growing on
building materials is lacking.
1.5.1 Literature review
1.5.1.1 Studies of interactions between moulds and building materials
The literature dealing with mould growth on building materials goes back to the 1930's. This
early literature primarily dealt with relative humidity requirements for mould growth and the
relative susceptibility of materials (Coppock & Cookson 1951; Block 1953). Such studies
generally involved inoculating test specimens , incubating them under various controlled
temperature and relative humidity conditions in sealed chambers such as bell jars or mason jars,
and following mould growth over time.
With the growing concern over mould growth in buildings, more literature has appeared in the
past 2 decades, broadening our knowledge of fungal interactions with more current materials.
Following similar methods as above, the earlier of these "chamber studies" primarily dealt with
determining the moisture requirements for mould growth and the susceptibility of various
building materials (Grant et al. 1989; Viitanen & Ritschkoff 1991; Pasanen et al. 1992;
Kalliokoski et al. 1993; Wang 1993; Pasanen et al. 1994; Ezeonu et al. 1994; Viitanen &
Bjurman 1995; Chang et al. 1995; Chang et al. 1996; Pasanen et al. 2000; Nielsen & Madsen
2000). Materials studied included various woods, plywood, particle board, wallpaper, ceiling
tile, gypsum board, cardboard, fiberglass and mineral wool insulation. In some studies, mould-
contaminated materials taken from water-damaged buildings were used. In other studies,
samples of new materials were used. The moulds studied could be mixtures of natural flora,
mixtures of specific organisms, or sometimes single organisms, usually belonging to genera
often found in indoor air investigations such as Penicillium or Aspergillus. Toxin-producing
moulds such as S. chartarum were included in a few of these studies, but in often in mixtures
with other organisms. Growth was usually assessed by dilution plating or visual and
14

microscopic inspection using a variety of rating scales, although carbon dioxide measurements
and ergosterol measurements were used in some studies (Pasanen et al. 1992; Korpi et al. 1998;
Nielsen and Madsen 2000).' These studies confirmed that mould growth usually requires water
activities greater than 0.80, although the minimum a w requirements varies depending on the
materials and temperature.
Later studies began looking at the production of VOCs from mould growth on building
materials. In addition to characterizing what compounds might be produced (Ezeonu et al. 1994;
Sunesson et al. 1996; Wilkins 2000; Fiedler et al. 2001; Miranda 2001; Gao et al. 2002; Gao &
Martin 2002; Claeson et al. 2002), investigators also hoped to see i f VOCs could be used as
indicators of fungal contamination (Korpi et al. 1998; Miranda 2001; Wessen et al. 2002; Gao et
al. 2002; Schleibinger et al. 2002) or even specific markers of various species (Pasanen et al.
1996; Wilkins et al. 2003). In these VOC studies, materials tested included fiberglass insulation,
different types of woods, particle board, gypsum boards, wallpaper, chipboard, ceramic tile, and
cardboard. Mixtures of organisms were often used, although some studies were performed with
single species or different isolates of a species such as A. versicolor (Schleibinger et al. 2002) or
S. chartarum (Korpi et al. 1999; Wilkins 2000; Gao & Martin 2002; Wilkins et al. 2003). VOC
emissions from naturally contaminated materials taken from water-damaged buildings have also
been evaluated.
The VOC studies revealed that fungi produce hundred of different compounds when growing on
building materials, and that the growth substrate has an effect on the types of compounds
produced (Pasanen et al. 1996; Wilkins et al. 2000; Fiedler et al. 2001; Gao & Martin 2002; Gao
et al. 2002). V O C production could vary within a species, depending on the strain (Pasanen et
al. 1996; Schleibinger et al. 2002), and V O C production could also vary with time (Sunesson et
al. 1996; Korpi et al. 1998; Gao & Martin 2002; Gao et al. 2002). Attempts to show VOCs as
useful indicators of microbial contamination were unsuccessful due to variability in VOC
production and the finding of the same compounds in sterile materials, although some did find
that VOC emissions were much higher in buildings with moisture problems (-200 pg/m3)
compared to reference buildings (<10 ug/m3) (Wessen et al. 2002). As far as using VOCs as
specific markers of specific species, differences in the patterns of VOCs produced by toxigenic
versus non-toxigenic strains of Penicillium verruscosum (Pasanen et al. 1996) and S. chartarum
(Wilkins et al. 2003) were found, and the production of certain VOCs such as terpenes and
'» 15

ketones correlated with the production of toxins, but further characterization of VOCs would
need to be done before such results could be used to predict the presence of toxins in the field
(Pasanen et al. 1996).
Although mycotoxins are generally regarded as non-volatile, trichodiene (a precursor to the
trichothecene toxins) was found as a VOC from certain strains of S. chartarum growing on
cardboard (Wilkins 2000; Wilkins et al. 2003).
Finally, studies have also looked at.the production of mycotoxins during mould growth on
various materials and the biological activity (cytotoxicity or ability to stimulate production of
inflammatory markers in macrophages) of the mould spores (Nikulin et al. 1994; Nielsen,
Thrane, Larsen et al. 1998; Nielsen et al. 1999; Nielsen et al. 2000; Murtoniemi et al. 2002;
Murtoniemi et al. 2003; Wilkins et al. 2003; Murtoniemi, Nevalainen & Hirvonen 2003). Toxin
production by S. chartarum has been the most frequently studied, although toxin production by
A. versicolor, P. brevicompactum, Fusarium spp, Trichoderma spp., and others (alone or in
mixtures) has also been investigated. Materials studied have included gypsum boards of varying
composition (Nielsen et al. 1999; Murtoniemi et al. 2002; Murtoniemi, Nevalainen & Hirvonen
2003; Murtoniemi et al. 2003), cardboard (Wilkins et al. 2003), wallpapers, woods, plywood,
cellulose insulation, mineral wool and ceiling tile (Nielsen, Thrane, Larsen et al. 1998; Nielsen
et al. 2004). The presence of toxins in naturally contaminated materials has also been studied
(Nielsen et al. 1999; Tuomi et al. 2000).
The studies showed that the growth substrate influences the production of toxins. In some
instances, nutrient poor substrates such as gypsum boards and chipboards gave lower production
of toxins compared to artificial media (Nielsen et al. 1999), and the addition of a nutrient (1-
glutamine) increased toxin production (Wilkins et al. 2003). Toxin production was also
decreased by unfavorable conditions such as reduced water activity (Nielsen et al. 2004).
However, the addition of a biocide (Parmetol® DF 17) to gypsum boards caused spores of S.
chartarum to be highly cytotoxic compared to S. chartarum spores from gypsum boards without
the biocide, although toxins were not directly measured (Murtoniemi, Nevalainen & Hirvonen
2003). In this experiment, the biocide decreased the growth of S. chartarum, but increased the
cytotoxicity of the spores. The appearance of growth did not always correlate well with the
16

biological activity of spores. Murtoniemi et al. found that in general, gypsum boards that
, produced good growth of different moulds yielded spores with lower ability to induce
production of inflammatory markers in a macrophage cell test system (Murtoniemi et al. 2003).
Additionally, Nielsen et al. found that poorly sporulating isolates of A. versicolor produced
higher levels of sterigmatocystin (Nielsen et al. 1999). These results suggest that the biological
activity of moulds cannot be judged by their appearance, and that the effects of preservatives
need to be carefully assessed i f they are not completely effective at preventing mould growth.
1.5.1.2 Studies on the effectiveness ofborate-based preservatives
A few studies on the effectiveness of borates against mould growth on building materials such
as solid wood, oriented strandboard, and gypsum board have been published. (Byrne 1991,
Fogel and Lloyd 2002, Micales-Glaeser 2004) These studies have shown borates to be effective
at reducing but not completely preventing mould growth. While it is anticipated that fungal
control will be achieved with the high concentrations of borates used as fire retardants in
cellulose insulation (Fogel & Lloyd 2002), published data on the mould resistance of borate
treated cellulose insulation is limited (Viitanen 1991; Nikulin et al. 1994).
The studies looking at borate preservatives have only used visual methods for assessing mould
growth, and none have examined the effects of borates on other aspects of mould growth such as
metabolites.
17

1.6 Objectives of our study:
The work presented i n this thesis is part o f a larger study examin ing interactions between
organisms, growth substrates, environmental factors, and the effect o f borate preservatives o n
different aspects o f m o u l d growth. In this thesis, the objectives were:
1. T o investigate the interaction o f three moulds o f importance to indoor air qual i ty (S.
chartarum, A. versicolor, and P. brevicompactum) w i t h b u i l d i n g materials c o m m o n l y used i n
bu i ld ing construct ion (so l id lumber, oriented strandboard, ce l lu lose insulat ion, and gypsum
boards) b y examin ing their g rowth and metabolites. Different measures were used to assess
m o u l d growth: v i s ib le growth , p roduct ion o f volat i le organic compounds , product ion o f carbon
d ioxide , and ergosterol. Questions to be answered inc luded: Is there a difference between
b u i l d i n g materials i n their ab i l i ty to support m o u l d growth? H o w are m o u l d metabolites affected
by the substrate?
2. T o examine the effectiveness o f commerc i a l l y available borate-treated b u i l d i n g materials
against m o u l d growth, us ing the same organisms and measures o f growth. Questions to be
answered inc luded: A r e borate preservatives effective at inh ib i t ing or preventing m o u l d growth,
and at what concentrations? C o u l d sub- inhibi tory concentrations o f borates stimulate the
product ion o f different metabolites?
3. T o compare var ious measures o f m o u l d growth. Questions to be answered inc luded: H o w
w e l l do different measures correlate w i t h one another? A r e any measures better than the others?
18
2. Methods
2.1 Overall Study Design
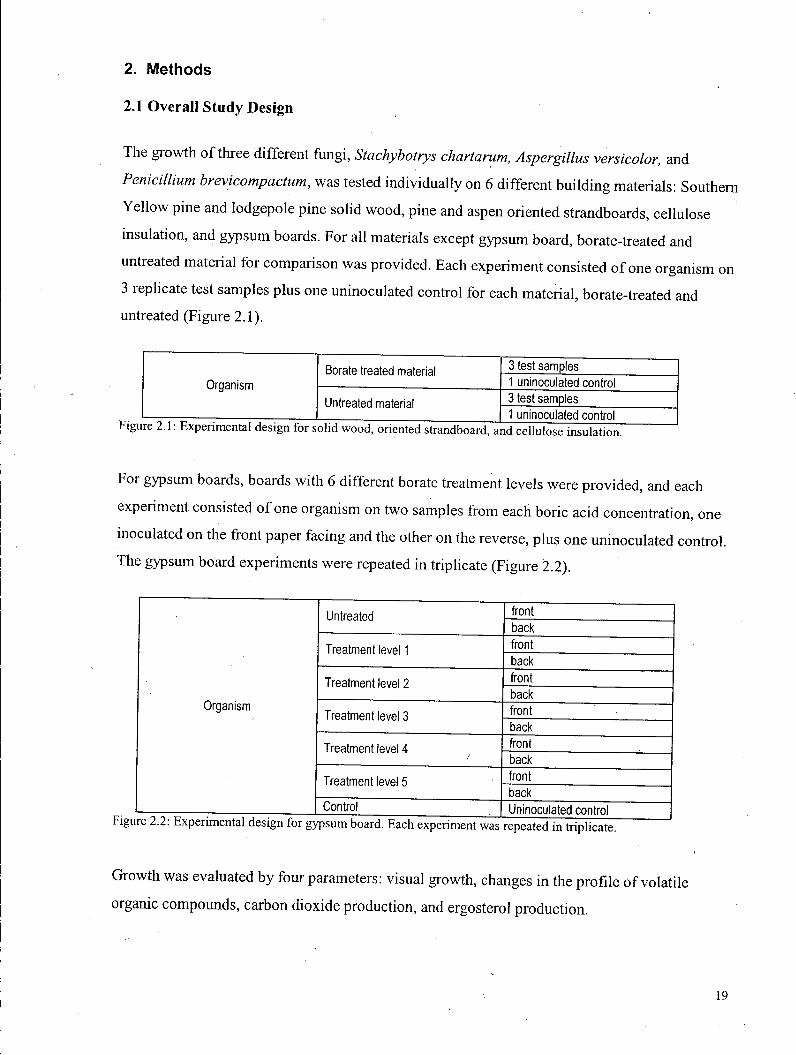
The growth o f three different fungi, Stachybotrys chartarum, Aspergillus versicolor, and
Penicillium brevicompactum, was tested ind iv idua l ly on 6 different b u i l d i n g materials: Southern
Y e l l o w pine and lodgepole pine so l id wood , pine and aspen oriented strandboards, cel lulose
insulat ion, and gypsum boards. F o r a l l materials except gypsum board, borate-treated and
untreated material for compar i son was provided. E a c h experiment consis ted o f one organism on
3 replicate test samples plus one uninoculated control for each material , borate-treated and
untreated (Figure 2.1).
Borate treated material 3 test samples
Organism Borate treated material
1 uninoculated control Organism
Untreated material 3 test samples Untreated material 1 uninoculated control
F o r gypsum boards, boards w i t h 6 different borate treatment levels were p rov ided , and each
experiment consisted o f one organism on two samples from each bor ic ac id concentration, one
inoculated o n the front paper facing and the other on the reverse, p lus one uninoculated control .
The gypsum board experiments were repeated i n triplicate (Figure 2.2).
Untreated front Untreated back
Treatment level 1 front Treatment level 1 back
Treatment level 2 front
Organism
Treatment level 2 back
Organism Treatment level 3 front Treatment level 3
back
Treatment level 4 front back
Treatment level 5 front Treatment level 5 back
Control Uninoculated control
i repeated in triplicate.
G r o w t h was evaluated by four parameters: v i sua l growth, changes i n the prof i le o f volat i le
organic compounds , carbon d iox ide product ion, and ergosterol product ion.
19

2.2 Test Materials
A l l test materials were supplied by US Borax Inc. and included: solid wood (Southern Yellow
pine and lodgepole pine two-by-fours); I/2" thick oriented strandboards made from either
Southern Yellow pine or aspen; cellulose insulation; and V" thick gypsum boards (Table 2.1).
Untreated and treated materials were supplied. For treated materials, the two-by-four lumber
was pressure-treated with disodium octaborate tetrahydrate. Oriented strandboards were treated
with zinc borate. Details on the composition of the oriented strandboard (e.g. the types of resins
and waxes) were unavailable. Cellulose insulation was treated with boric acid. Gypsum boards
were made at a commercial gypsum board plant and different levels of boric acid were
incorporated into the gypsum slurry. Borate retentions were determined by US Borax Inc.
Samples of each material were digested in hydrochloric acid for one hour, and the supernatant
analysed by inductively coupled plasma with atomic emission spectroscopy detection. (Personal
communication, R. Patwardhan, US Borax, Inc.)
Table 2.1: Test materials used in the study
?;TfeatnilpIEyi||l 11
Solid lumber Borate retentions in pounds per cubic foot (pcf)
Southern Yellow pine
Untreated
Solid lumber Borate retentions in pounds per cubic foot (pcf)
Southern Yellow pine Disodium octaborate tetrahydrate (Tim-Bor®) 0.42 pcf
Solid lumber Borate retentions in pounds per cubic foot (pcf)
Lodgepole pine
Untreated
Solid lumber Borate retentions in pounds per cubic foot (pcf)
Lodgepole pine Disodium octaborate tetrahydrate (Tim-Bor®) 0.36 - 0.42 pcf
Wood composites Borate retentions in % boric acid equivalents (BAE)
Pine oriented strandboard
Untreated
Wood composites Borate retentions in % boric acid equivalents (BAE)
Pine oriented strandboard Zinc borate (Composi-Bor®) 0.726-0.781% (0.618-0.655 % BAE)
Wood composites Borate retentions in % boric acid equivalents (BAE)
Aspen oriented strandboard
Untreated
Wood composites Borate retentions in % boric acid equivalents (BAE)
Aspen oriented strandboard Zinc borate (Composi-Bor®) 1.159% -1.137% (0.968-0.986% BAE)
Cellulose insulation Untreated Cellulose insulation Boric acid 13%
Gypsum board Specified boric acid retentions in pounds per thousand square feet (Ib/MSF)
Boric acid 0 Ib/MSF
Gypsum board Specified boric acid retentions in pounds per thousand square feet (Ib/MSF)
Boric acid 1 Ib/MSF Gypsum board Specified boric acid retentions in pounds per thousand square feet (Ib/MSF)
Boric acid 2 Ib/MSF Gypsum board Specified boric acid retentions in pounds per thousand square feet (Ib/MSF) Boric acid 2.57 Ib/MSF
Boric acid 4 Ib/MSF Boric acid 5 Ib/MSF
20

2.2.1 Preparation of test materials
2.2.1.1 Solid wood (Southern Yellow pine and lodgepole pine)
Southern Yellow pine and lodgepole pine two-by-fours were trimmed to 7 cm width, then sawn
into half-thickness planks. 3 mm were planed from both of the main faces, leaving a plank 7 cm
wide and 1.2 cm thick, which was then cut into 7 cm squares and labeled. Each square was then
individually wrapped in kraft paper and labeled. Untreated Southern Yellow pine specimens
arrived without identifiers and were left unlabelled.
2.2.1.2 Oriented strandboard
Oriented strandboard was cut into 9 cm squares and labeled. The 9 cm size was chosen initially
to maximize the surface area for mould growth, before realizing that the maximum size of
square samples obtainable from the two-by-fours was 7 cm square. Each piece was wrapped in
kraft paper and labeled.
2.2.1.3 Cellulose insulation
The cellulose insulation was supplied in bags of approximately 2 pounds. No specific
preparation was needed for cellulose insulation and the insulation was not subdivided into
aliquots and pre-packaged like the other materials. Prior to autoclaving and inoculation, 2 to 3
grams of insulation were placed in glass Petri plates and gently tamped down.
2.2.1.4 Gypsum board
Commercially made 4 ' x 8 ' gypsum boards were cut into 4 ' x 4 ' boards for ease of handling and
storing. Before cutting the boards into smaller specimens, six inches were removed from each
edge of the boards to avoid areas where the boric acid may have concentrated during drying,
The paper facings on front and back surfaces were scored in 7 cm squares with a utility knife,
each square was labeled, and the board was broken into squares by hand. Each piece was
wrapped in kraft paper and labeled.
2.2.2 Sterilisation of test materials
Solid wood, OSB, and gypsum board samples were packaged 4 layers thick into cardboard
boxes and sterilized with 25 kGy beta radiation at a commercial electron beam facility (Iotron
Technologies Corporation, Port Coquitlam, B.C.).
21
The bulk container of cellulose insulation was sterilized by beta radiation in April 2003 along
with the gypsum boards. However, since the cellulose insulation could not be pre-packaged into
glass Petri dishes, and it was difficult to handle the insulation in a completely aseptic manner
while loading the Petri dishes, once in the dishes the cellulose insulation was sterilized again by
autoclaving at 120°C for 20 minutes, prior holnoculation.
2.2.3 Conditioning of test materials
Conditioning of the materials was necessary to give them sufficient initial moisture to support
mould growth. Wood, wood composite, and gypsum board specimens were conditioned over a
layer of sterile distilled water in sterile, covered polypropylene boxes for a minimum of 14 days
(See Appendix A).
Cellulose insulation was not conditioned, although some moisture would be gained during
autoclaving prior to inoculation.
2.3 Inoculation
A l l work with organisms and sterile materials was done in a Class II Type A biosafety cabinet to
prevent contamination of the materials and to prevent exposure to the organisms.
2.3.1 Organisms
Organisms were obtained from American Type Culture Collection (ATCC), Manassas, V A .
Three organisms of importance to indoor air quality and the indoor environment were studied
(Table 2.2). The following organisms were used: Stachybotrys chartarum (ATCC 201212),
Aspergillus versicolor (ATCC 26939), and Penicillium brevicompactum (ATCC 9056).
Freeze-dried organisms were reconstituted with 0.85% saline with Tween® 80 and stored frozen
at -80°C in tryptic soy broth (TSB) with 15% glycerol until needed.
22

Table 2.2: Organisms used in the study Organism Comments" S. chartarum ATCC 201212
Commonly referred to in the media as the "toxic black mould", Stachybotrys chartarum has been isolated from up to 30% of wallboard samples from water-damaged buildings (Hyvarinen 2002), but it is infrequently isolated from the air of homes with moisture problems. It was implicated in outbreaks of idiopathic pulmonary hemorrhage in the US (CDC 1997), and while the causative role of S. chartarum in these cases remains controversial (CDC 2000), publicity surrounding these outbreaks generated a lot of interest in (and fear of) Stachybotrys and moulds in general. S. chartarum requires a very high level of moisture (aw>0.90) and produces large, dark, oval spores (4-6 um x 7-12 urn) (Samson & Hoekstra 1994) that are borne in a wet mass when the fungus is growing. S. chartarum species produce toxins including potent trichothecene toxins but there are different strains of S. chartarum and only about 60% of them produce the more toxic macrocyclic trichothecenes (Andersen et al. 2002). The strain used in our experiments, ATCC 201212, is a macrocyclic trichothecene producer.
A versicolor ATCC 26939
Aspergillus versicolor is commonly found indoors. A versicolor is mesophilic in terms of moisture requirements, but will tolerate some degree of dryness. It produces small spores (2-3.5 um) (Samson & Hoekstra 1994), and A. versicolors capable of producing mycotoxins, including sterigmatocystin which is potentially carcinogenic. Some Aspergillus species are also capable of causing infection, although A versicolor's only rarely associated with infection.
P. brevicompactum ATCC 9056
Penicillium brevicompactum is another commonly isolated indoor mould. P. brevicompactum is mesophilic in terms of moisture requirements. P. brevicompactum spores small (3-4.5 um) (Samson & Hoekstra 1994). P. brevicompactum is another toxin producer, capable of producing toxins including the immunosuppressant mycophenolic acid, and tremor-inducing compounds such as roquefortine C and penitrem A. |
2.3.2 Culturing organisms
S. chartarum spores were removed from frozen storage and suspended in a small amount of
sterile water, then added to a flask of autoclaved Uncle Ben's converted rice (Jarvis et al. 1998).
A. versicolor and P. brevicompactum spores were plated directly on malt extract agar (MEA)
from frozen storage. Cultures were kept at room temperature under normal ambient light
conditions. Spores were harvested after 5 to 7 days.
2.3.3 Preparation of the spore suspension
A detailed procedure is attached in Appendix B. Spores were harvested into a sterile solution
containing 0.01% Tween® 80 in distilled water. For Stachybotrys, the Tween® solution was
added to the flask of rice and the flask was gently shaken to liberate spores. For Aspergillus and
Penicillium, the Tween solution was added to the agar plates and a sterile inoculating loop was
used to gently scrape the agar surface to liberate spores.
The spore suspension was filtered through a sterilized cosmetic puff to remove large pieces of
debris (rice, agar, mycelia and hyphae) and collected in sterile 15 mL centrifuge tubes.
23

The filtered suspension was then washed b y pel le t ing the spores i n a centrifuge at a relative
centrifugal force o f 1500 x g for 5 minutes, decanting the supernatant, and resuspending the
spores i n fresh sterile T w e e n ® solut ion. T h e pellet ing-resuspending steps were repeated three
times for a total o f three washes.
The spore concentrat ion o f the washed suspension was determined b y count ing spores in a
hemacytometer, and the concentrat ion was adjusted to approximate ly 1 x 10 7 spores /mL by
either adding more T w e e n ® solut ion, or pel le t ing the spores and r e m o v i n g excess supernatant as
necessary.
Serial di lut ions o f the f inal spore suspension were made (10 5 , 10 3 , and 10 2 spores /mL), and 0.5
m L o f the 10 spores /mL suspension were plated o n M E A as a check for v i a b i l i t y and
contamination.
2.3.4 Inoculat ion
The biosafety cabinet f loor was steri l ised by br ief ly f laming w i t h a propane burner pr ior to
inoculat ion and each t ime a new set o f materials was m o v e d into the biosafety cabinet for
inoculat ion. Stainless steel w i r e supports were attached to test specimens to h o l d them i n an
upright posi t ion. Ce l l u lo se insula t ion was packed into glass Pet r i plates.
A n artist's airbrush ( A z t e k M o d e l A 4 3 0 , Testors Inc, R o c k f i e l d , IL) was used to inoculate the
bu i ld ing materials. The airbrush settings were pre-adjusted to de l iver ~0.1 m L over 8 to 10
seconds, determined b y spraying water into a beaker and immedia te ly w e i g h i n g it. A detailed
procedure is g iven i n A p p e n d i x C .
Sterile T w e e n ® solut ion was added to the airbrush reservoir for " sham" inocula t ing the controls.
The controls were sprayed w i t h ~0.1 m L o f the sterile T w e e n ® solut ion and then placed i n
incubat ion chambers (see be low) . T h e airbrush was emptied o f the r emain ing T w e e n ® solut ion
and the spore suspension was added to the airbrush reservoir and the airbrush was pr imed.
Test specimens were l i ned up i n groups o f three or four and inoculated w i t h ~0.1 m L o f spore
suspension. F o r so l id w o o d , w o o d composites , and gypsum board, o n l y one face o f the
24

specimens was inoculated, although the sides and the reverse of each specimen received some
overspray. For Southern Yellow pine and lodgepole pine, the convex side of the growth rings
was inoculated so that if there were specimens with heartwood and sapwood, the sapwood
would be inoculated. Inoculated test specimens were placed in incubation chambers as
described below.
Sections of an M E A plate were sprayed before and after inoculating each group with spore
suspension to check that the airbrush was working properly and to check the viability and purity
of the inoculum. The day of inoculation was taken as day 0.
2.4 Incubation
2.4.1 Incubation chambers
Chambers and all glassware and supports used inside the chambers were sterilized by
autoclaving at 120°C for 20-25 minutes prior to each experiment.
2-litre I-CHEM® glass jars were used as incubation chambers. The lids that came with the jars
were polypropylene plastic with Teflon liners, however, the plastics emitted volatile
compounds, especially after autoclaving, that could have potentially interfered with monitoring
volatile metabolites from the moulds. Lids were designed and machined from 316 stainless steel
(Craig Machining, Vancouver, B.C.), and stainless steel Swagelok® fittings were installed
(Figure 2.3).
Figure 2.3: Stainless steel lid with channel (arrow 1) to mate with rim of the jar, 2 Swagelock® fittings, and access hole for VOC sampling (arrow 2).
25

A layer (approximately 20-30 mL) of sterile distilled water was added to each chamber to
maintain the relative humidity. An inverted glass Petri plate inside the jars was used to keep
specimens out of the water.
Inoculated specimens and the uninoculated controls were placed one-apiece in the chambers.
Chambers were purged with charcoal-filtered and HEPA-filtered air that was humidified by
bubbling through sterile distilled water for 5-10 minutes to reduce extraneous volatile
compounds (mainly alcohol vapours from wiping down the biosafety cabinet) within the
chambers.
The lids were affixed to the jars with Parafilm® wrapped around the outside of lids and threads
of the jars. Later, straps were added to further secure the lids to the jars. A thin layer of water-
soluble K - Y Jelly™ was applied to the channel of the lids to provide a better seal between the
lids and the jars. Parafilm® and aluminum foil were used to seal the Swagelock fittings, and a
small square of aluminum foil was secured over the access hole used for sampling volatile
organic compounds.
2.4.2 Incubation conditions
Chambers were kept on the bench top in the lab at room temperature (20-23°C). The
temperature was monitored with a simple digital thermohygrometer (Baxter Corp.,
DeerfieldJL). The temperature was recorded with each volatile organic compound sampling
occasion. Specimens were exposed to normal ambient lighting conditions (a combination of
daylight and fluorescent lighting, with varying light-dark cycles). Specimens were incubated
for 29 days.
2.5 Assessment of growth
Four parameters of mould growth were examined in this study: visible mould growth on the
inoculated material, changes in the volatile organic compound profile, production of carbon
dioxide, and ergosterol content. The presence of visible growth and changes in the volatile
organic compound profile were assessed at weekly intervals starting on day 1. Carbon dioxide
production and ergosterol content were assessed at the end of the 4-week study period.
26

2.5.1 Visual assessment
2.5.1.1 Growth visible to the unaided eye
The appearance of growth on the inoculated surface was assessed by one investigator
throughout the experiments. Visible growth was assessed on day 1 and every week thereafter for
4 weeks. Side lighting was used to enhance surface detail for better visualization of fine growth.
Visible growth was rated according to surface area covered and the intensity of growth (Table
2.3). For example, a specimen might be 25% covered with level 1 growth (hyphae only), and
50% covered with level 2 growth (sporulation just visible). The score assigned was a composite
of the intensity and percent surface area, so for the example given, the rating score would be
((0.25 x 1) +(0.50x2))= 1.25.
Table 2.3: Rating scale used for the intensity of fungal growth Intensity rating Description
0 No growth 1 Hyphae only 2 Sporulation is just visible 3 Moderate sporulation (obvious discolouration or disfigurement) 4 Heavy sporulation (underlying material is not visible)
Photographs were taken of specimens each week for illustration and to facilitate the visual
assessment.
2.5.1.2 Microscopic examination
At the end of the 4-week incubation period and after monitoring the volatile organic compound
profile and measuring carbon dioxide, specimens were removed from the incubation chambers
and examined under 3 Ox magnification using a binocular dissection microscope.
2.5.1.3 Volunteer rating of visible growth
During the experiments, changes in the VOC profile gave an indication of whether fungal
growth was present, knowledge of which could bias the rating of visible growth. Knowledge of
the borate treatment status could also affect the rating.
To investigate whether the results of VOC monitoring or borate treatment status might have
affected the assignment of scores for visible growth by the investigator, volunteers were asked
to rate the visual appearance of mould growth on gypsum board during the third experiments
with S. chartarum and A. versicolor, and the volunteers' scores were compared to the
27

investigator's scores. The incubation chambers were relabeled with a randomly chosen code so
that the raters would be blinded to the organism and the boric acid treatment level. The
volunteers were given a brief training session with visual aids and actual samples of growth for
comparison. Volunteers rated the growth on samples once weekly in the same way as the
investigator except no special side lighting was used, and volunteers did not do a microscopic
examination at the end of the 4th week.
2.5.2 Volatile organic compound extraction and analysis
Introduction to solid-phase microextraction (SPME)
Solid-phase microextraction (SPME) is a sample preparation technique where analytes are
extracted from liquid or gaseous samples by a fiber coated with a sorbent coating or phase, and
are then introduced directly into the analytical instrument such as a gas chromatograph or high-
performance liquid chromatograph. In our experiments, gaseous volatile organic compounds
were extracted from the headspace of the incubation chambers and introduced directly into gas
chromatographs.
Analyte extraction by SPME is an equilibrium or partitioning process where analytes partition
between the sample and the SPME fiber, rather than an exhaustive process where all of the
analyte in the sample is transferred to the extraction medium as in charcoal tube and other
adsorbent tube sampling. As the name implies, the amount of analyte extracted is very small so
that the sample usually is not significantly altered by the extraction process per se, a feature that
is attractive for experiments involving serial samples such as this.
There are many factors that can influence analyte extraction by SPME, but the main ones
important to our experiments are the selection of the fiber coating, the extraction time, and
extraction temperature.
2.5.2.1 Extraction
Volatile organic compounds (VOCs) in the headspace of the incubation chambers were
monitored on day 1 and every week thereafter for 4 weeks. VOCs were extracted from the
headspace using SPME samplers with polydimethylsiloxane/Carboxen® fibers (Supelco,
Bellefonte, PA). The SPME fiber was inserted through an access hole in the chamber lids and
28

extended into the headspace. (Figure 2.4) The headspace was extracted for 30 minutes at room
temperature (20-23°C). The temperature in the room was recorded at the beginning of each
extraction.
The SPME fibers were conditioned in the injection port of the gas chromatograph for 10
minutes at the beginning of each sampling day. Fibers were not re-conditioned between samples
as the 4-minute sample desorption time was sufficient to minimize sample carry-over.
(Appendix D).
2.5.2.2 Gas chromatography analysis
After extraction, the SPME fiber was desorbed for 4 minutes in the injection port of a gas
chromatograph equipped with a Merlin Microseal® septum (Merlin Instrument Company, Half
Moon Bay, CA). Desorption of volatiles from wood and OSB specimens was done with the
injection port in split mode to avoid sample overloading. Desorption of volatiles from cellulose
insulation and gypsum board specimens was done using a timed-split program. Details on the
gas chromatography parameters are given in Appendix G.
VOC monitoring for several early experiments (S. chartarum on Southern Yellow pine, S.
chartarum on aspen OSB, and S. chartarum on cellulose insulation) was done using a Varian
3400 gas chromatograph with a Saturn 2000 ion trap mass spectrometer detector (GC-MS).
Figure 2.4: Taking a VOC sample from gypsum board with the solid-phase microextractor (arrow). The coated fiber is inserted into the headspace of the chamber through a small access hole in the lid.
29
Subsequent weekly analysis was performed on a Varian 3400 gas chromatograph with flame
ionization detector (GC-FID).
2.5.2.3 Identification of compounds
After an initial review of the literature, 8 of the most frequently mentioned compounds were
chosen as our initial standards, although other compounds could easily have been chosen as
well. The eight compounds chosen were: 1-pentanol, 2-pentanone, 1-hexanol, 2-methyl
propanol, 3-methyl butanol, 3-octanol, l-octen-3-ol, and 3-octanone. Later, as compounds were
tentatively identified using GC-MS, other standards were obtained (eg. 2-hexanone, 2-
heptanone, anisole). Chemical standards were purchased from Sigma-Aldrich.
Compounds of interest were identified by comparison of the retention times and mass spectra
with known standards if available. Other compounds were tentatively identified by manually
comparing their mass spectra with those in the NIST'98 mass spectra library, using Varian
Saturn GC/MS Workstation v. 5.51 Saturn Search software.
2.5.3 Carbon dioxide measurement
Carbon dioxide production was assessed at the end of the 4-week incubation period. After the
VOC sampling was finished, the Swagelock® fittings were opened and an S K C sampling pump
running at 1 L/minute was connected to one of the Swagelock® fittings. The atmosphere was
withdrawn from the chamber and fed to the carbon dioxide sensor of Q-Trak® or Q-Trak® Plus
indoor air quality monitors (TSI Incorporated, Shoreview, MN), via the carbon dioxide
calibration collar (Figure 2.5).
30

Figure 2.5: Measuring carbon dioxide levels. A sampling pump withdraws the atmosphere from the incubation chamber and feeds it to the C02
calibration collar of a TSI Q-Trak% Plus indoor air quality monitor. The peak carbon dioxide level is recorded.
The peak carbon dioxide level was recorded for each sample. The tubing was disconnected from
the chambers in between samples and the Q-Trak® carbon dioxide reading was allowed to come
back down to ambient levels. The ambient carbon dioxide level preceding each sample reading
was also recorded. Details on the development of this method are given in Appendix H.
2.5.4 Ergosterol measurement
2.5.4.1 Ergosterol sampling
For all materials except cellulose insulation, a sample of 5 square centimeters was taken from
each specimen at the end of the 4-week incubation period. One square centimeter was taken
from each corner and one from the center of the inoculated face of each specimen. For solid
wood material, the samples for ergosterol analysis were cut to a depth of about 1 mm; for
oriented strandboard, the top layer of strands was taken; and for gypsum boards, the top few
layers of paper were taken, sometimes down to the gypsum core. Ergosterol results were
expressed as pg/cm2.
Samples were stored in 15 mL screw-top test tubes at - 8 0 ° C until analysis. Some samples were
stored at - 2 0 ° C for a few months, until it was realized that there may be some concerns about
the stability of ergosterol at - 2 0 ° C .
31

For cellulose insulation, the entire contents of each glass Petri plate were transferred to sterile
disposable Petri plates and stored at -20°C or -80°C until analysis. Prior to ergosterol analysis,
the cellulose insulation was dried at room temperature for 48-72 hours in a dessicator over
anhydrous calcium sulfate granules (Drierite®, W A Hammond Dierite Co, Ltd., Xenia, OH). An
aliquot of cellulose insulation was transferred to pre-weighed 30 mL screw-top test tubes and
the weight of insulation recorded. Ergosterol results were expressed as pg/g of insulation.
2.5.4.2 Ergosterol Analysis
Ergosterol analysis was performed according to a modified method by Saraf et al. (1997).
Detailed procedures are provide in Appendix I. In brief, ergosterol was extracted from samples
using 10% potassium hydroxide in methanol. The ergosterol was then extracted from the
methanolic potassium hydroxide into pentane, dried, and derivatized to a trimethylsilyl
derivative using bis(trimethylsilyl)trifluoroacetate. The derivatized ergosterol product was
analysed by gas chromatography with mass spectrometry detection (Varian 3400 GC with
Saturn 2000 ion trap mass spectrometer), initially in tandem mass spectrometry (MS/MS) mode
focusing on the m/z 157 product ion, and later in selected ion storage (SIS) mode focusing on
the m/z 363 ion.
2.6 Comparison of methods to assess growth
Using data from the gypsum board experiments, three parameters (Week 4 visual score, carbon
dioxide, and ergosterol) were compared to one another to see how well they correlated with
each other. Since Visual assessment has been the most common method of evaluating mould
growth on building materials, and is used by industry, scatter plots and simple linear regression
models were made for carbon dioxide versus Week 4 visual score, ergosterol versus Week 4
visual score. Scatter plots of carbon dioxide versus ergosterol were also made to compare a
measure of metabolism to a measure of biomass. Since we expected the data to be distributed
non-normally given the unequal steps in boric acid concentration, and since the Week 4 visual
score was considered to be ordinal level data, correlations were tested using Spearman's rank
correlation. Stata® statistical software, version 8.2 (StataCorp, College Station, TX) was used.
32

2.7 Data handling and analysis
2.7.1 V i s u a l assessment
Scores for each spec imen were reported ind iv idua l ly , except for the gypsum board scores where
the scores for front and back paper facings at each bor ic ac id treatment l eve l were combined and
averaged across the three experiments.
2.7.2 V o l a t i l e Organic C o m p o u n d Profi les
Changes i n the V O C prof i le for each specimen were tracked by compar i son to the uninoculated
control , as w e l l as by compar i son to the previous weeks ' chromatograms. Peaks f rom
chromatograms obtained b y G C - F I D were integrated automatical ly us ing the V a r i a n Star
Chromatography Works ta t ion Interactive Graphics v. 5.52 (Va r i an Inc., W a l n u t Creek, C A ) and
results were reported as area counts. Graphs o f the area counts for peaks o f interest were
produced w i t h M i c r o s o f t E x c e l . Peak areas were not corrected for cont ro l values; instead, the
control results were presented along w i t h the test specimen results for compar ison . Results for
each specimen were presented ind iv idua l ly , except for the gypsum board experiments where
results for front and back paper facings at each boric ac id treatment l eve l were combined and
averaged across the three experiments
2.7.3 Carbon d iox ide
Results for each test group were averaged. Results for the front and back paper facings o f the
gypsum boards at each bor ic ac id treatment level were combined and averaged across the three
experiments.
2.7.4 Ergosterol
Results for each test group were averaged. A s w i t h the carbon d iox ide results, results for the
front and back paper facings o f the gypsum boards at each bor ic ac id treatment leve l were
combined and averaged across the three experiments.
33

2.8 Heartwood determination and Borate treatment status
In cases where unexpected results were obtained (eg. growth on "treated" material or the lack of
growth on'untreated material), specimens were tested to determine whether they were
heartwood or sapwood (in the case of solid wood), and for the presence of borates in case
treated and untreated material had been inadvertently mislabeled.
2.8.1 Heartwood determination
The presence of heartwood was determined using the heartwood indicator for pine species,
according to the American Wood Preservation Association method "M2 - Standard for
Inspection of Wood Products Treated with Preservatives 1996". The indicator solution, an
acidic mixture of o-anisidine hydrochloride and sodium nitrate, reacts with pinosilvins in
heartwood of pine species, turning red or reddish-orange. Sapwood remains a uniform pale
yellow-orange colour. Heartwood indicator solution was provided by Forintek Canada
Corporation, Vancouver.
2.8.2 Borate treatment status
The presence of borates was determined using the indicator solutions specified in the Borax
Consolidated Ltd. spot test procedure. The first solution, a 10% alcoholic extract of turmeric,
was sprayed on specimens and allowed to dry. The second solution, a saturated alcoholic
solution of salicylic acid with 20% hydrochloric acid, was then sprayed on. The solution turns
red in the presence of borates. Colour development was noted after 20 minutes. Borate indicator
solutions were provided by Forintek Canada Corporation, Vancouver.
34

3. Results
3 . 1 Mould growth on building materials
Results of the experiments are presented according material groups: solid wood, wood
composites, cellulose insulation, and gypsum boards for each fungal species.
3.1.1 Solid wood
3.1.1.1 Visible growth
3.1.1.1.1 Southern Yellow pine
3.1.1.1.1.1 S. chartarum
No growth was observed on the treated or the untreated material.
3.1.1.1.1.2 A. versicolor
No growth was observed on the treated material. Growth of A versicolor on untreated
Southern Yellow pine was strong (Appendix J, Photo 1) with obvious growth of A.
versicolor appearing at week 2. The weekly visual growth scores for untreated Southern
Yellow pine are shown in Figure 3.1.
3.1.1.1.1.3 P. brevicompactum
No growth was observed on the treated material. Growth of P. brevicompactum on untreated
Southern Yellow pine was strong (Appendix J, Photo 2), with obvious growth of P.
brevicompactum after 1 week. The weekly visual growth scores for untreated Southern
Yellow pine are shown in Figure 3.2.
3.1.1.1.2 Lodgepole pine
3.1.1.1.2.1 S. chartarum No growth occurred on the treated or untreated lodgepole pine during the 4 weeks.
3.1.1.1.2.2 A. versicolor
No growth occurred on the treated material. Growth of A. versicolor was observed on only 2
of 3 specimens of untreated lodgepole pine (Appendix J, Photo 3), and the growth was not
35
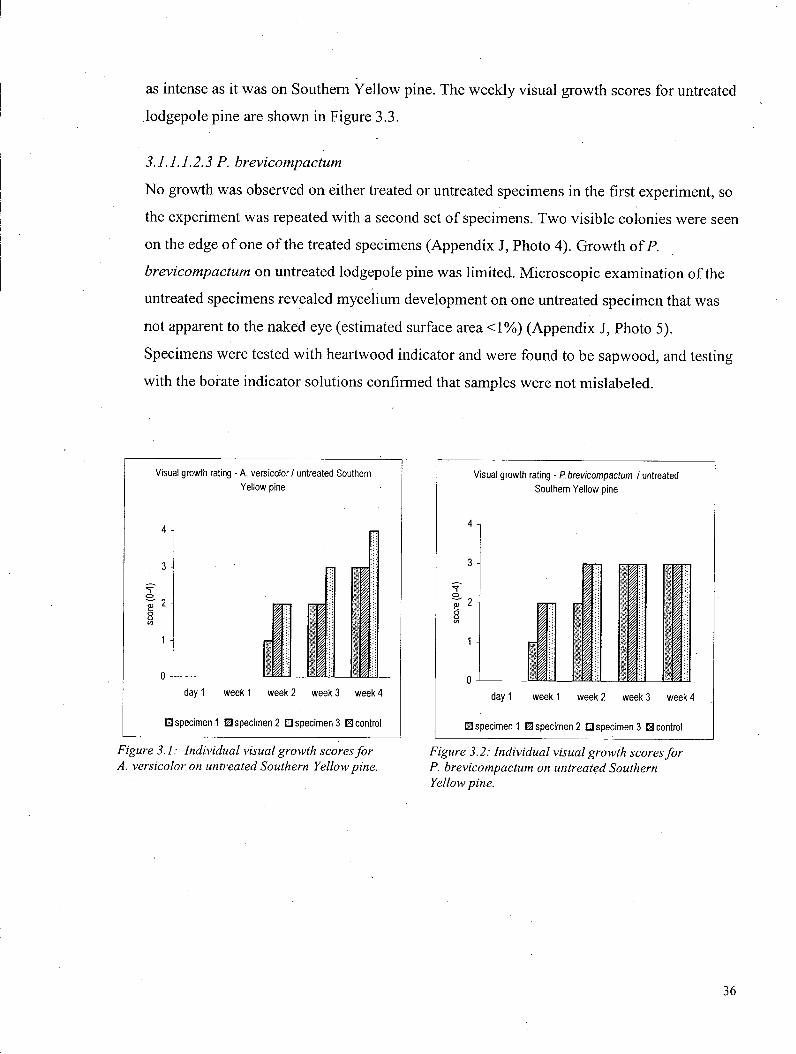
as intense as it was o n Southern Y e l l o w pine. The w e e k l y v i sua l g rowth scores for untreated
lodgepole p ine are s h o w n i n F igure 3.3.
3.1.1.1.2.3 P. brevicompactum
N o growth was observed o n either treated or untreated specimens i n the first experiment, so
the experiment was repeated w i t h a second set o f specimens. T w o v i s i b l e colonies were seen
on the edge o f one o f the treated specimens ( A p p e n d i x J , Photo 4). G r o w t h o f P .
brevicompactum o n untreated lodgepole pine was l imi ted . M i c r o s c o p i c examina t ion o f the
untreated specimens revealed m y c e l i u m development o n one untreated specimen that was
not apparent to the naked eye (estimated surface area <1%) ( A p p e n d i x J , Photo 5).
Specimens were tested w i t h hear twood indicator and were found to be sapwood, and testing
w i t h the borate indicator solutions conf i rmed that samples were not mis labe led .
Visual growth rating - A. versicolor / untreated Southern Yellow pine
0
day 1 week 1 week 2 week 3 week 4
El specimen 1 0 specimen 2 • specimen 3 H control
Figure 3.1: Individual visual growth scores for A. versicolor on untreated Southern Yellow pine.
Visual growth rating - P.brevicompactum I untreated Southern Yellow pine
0 j III
i l •i 1 i
day 1 week 1 week 2 week 3 week'
U specimen 1 0 specimen 2 Q specimen 3 E control
Figure 3.2: Individual visual growth scores for P. brevicompactum on untreated Southern Yellow pine.
36

Visual growth rating - A.versicolorI untreated Lodgepole pine (SPF)
4 -|
3 -
I 1 I
day 1 week 1 week 2 week 3 week 4
H specimen 1 0 specimen 2 El specimen 3 E3 control
Figure 3.3: Individual visual growth scores for A. versicolor on untreated lodgepole pine. Visible growth was seen on specimens 2 and 3 only.
P. brevicompactum did not grow on treated or untreated lodgepole pine, so the experiments were repeated. In the second experiment, fine microscopic growth was seen on one specimen of untreated lodgepole pine, and a couple of small colonies of growth were seen on a specimen of treated lodgepole pine (weekly scores not shown.
3.LI.2 Volatile Organic Compound Profile
In chambers where there was growth, there was both the production of new compounds,
as well as a decrease in aldehydes. Table 3.1 lists volatile organic compounds detected in
the headspace of chambers with growth that were not detected in the controls, or were
present in higher concentrations compared to the controls (e.g. acetone).
3.1.1.2.1 VOCs - Southern Yellow pine
3.1.1.2.1.1 S. chartarum
Weekly monitoring of the V O C profile was done using GC-MS. However, there were
problems with monitoring the V O C profile during this experiment and the results
were not usable.
3.1.1.2.1.2 A. versicolor
For the borate-treated southern yellow pine, the emissions of wood terpenes from the
test specimens were considerably higher than from the control. However, no other
changes consistent with growth were noted.
For the untreated specimens, production of 2-ketones (C4-C9) in test specimens 1 and
2 was strong and levels of these compounds remained high throughout the incubation
37

period. In test specimen 3, however, production of 2-ketones was limited and
transient. The V O C profile at week 4 is shown in Appendix K, Figure K - l . The time
trend of 2-pentanone production by A. versicolor on Southern Yellow pine is shown
in Figure 3.4.
2-pentanone - A. versicolor I untreated Southern yellow pine
day 1
-specimen 1
-specimen 3
week 1 week 2 week 3 week 4
time
—•— specimen 2
—X—control
Figure 3.4: 2-Pentanone production by A.
versicolor on untreated Southern Yellow
pine over time. Production of 2-pentanone
by test specimen 3 was diminished and
transient compared to specimens I and 2.
Table 3.1: Volatile organic compounds from fungal growth on Southern Yellow pine and lodgepole pine
Compound GC-FID Retentioi Southern yellow pine Lodgepole pine
Compound time (minutes) S. chartarum A. versicolor P. brevicom. S. chartarum A. versicolor P brevicom.
Rt 2.4* 2.4 X Furan 2.9 x Acetone 3.7 X x 2-butanone 6.5 X x x Dimethyl furan 8.2 x x 2-pentanone 9.3 x X J— x Rt 10.9 10.9 -t—> x Rt 11.3 11.3 X 2-hexanone 12.4 o x x x Rt 12.9 12.9 x — — Rt 13.2 13.2 x 1-hexanol 14.2 —<a mm r x 2-heptanone 15.1 L/ x x © x 2-octanone 17.6 x x x 2-nonanone 20.1 x x X C9 cyclic ketone 23 X Rt 23.3 23.3 x Rt 25 25 x
, IVIMUIUU n ine uuiy a n u 1101 l u e n i l l
eluting with a retention time of 2.4 minutes, but not identified further.
: compound
38

3.1.1.2.1.3 P. brevicompactum
No major differences in the V O C profiles between the test specimens and the control
noted for the borate-treated specimens.
Production of 2-ketones was strong in all test specimens (Appendix K , Figure K-2),
although in specimens 2 and 3, some of the ketones (C5-C9) began to disappear while in
specimen 1 they remained fairly constant (Appendix K, Figure K-3). Specimens 2 and 3 also
differed from specimen 1 by producing more acetone, while the differences in production of
2-butanone were less dramatic. The time trends for acetone, 2-pentanone, and 2-butanone
are shown in Figures 3.5 to 3.7.
Acetone - P. brevicompactum I untreated Southern Yellow pine
dayl weekl week 2 week 3 week 4
time
-specimen 1
-specimen 3 - specimen 2
- control
Figure 3.5: Acetone production by P. brevicompactum on untreated Southern Yellow pine. The concentration of acetone in specimen 1 was much lower than in specimens 2 and 3, and similar to the control.
2-pentanone - P. brevicompactum I untreated Southern Yellow pine
700000 600000 -|
_ 500000 § 400000 g 300000 -I ™ 200000
100000 0
day 1 week 1 week 2 week 3 week 4
time
- specimen 1
-specimen 3
- specimen 2
- control
Figure 3.6: 2-Pentanone production by P. brevicompactum on untreated Southern Yellow pine. Production in specimens 2 and 3 was transient, but levels remained elevated in specimen 1.
39

2-butanone - P. brevicompactum I untreated Southern Yellow pine
50000 -i
-•— specimen 1 — • — specimen 2
-A— specimen 3 —X— control
Figure 3.7: 2-Butanone production by P.
brevicompactum on untreated Southern Yellow
pine. Production in specimen I is slightly lower
than in specimens 2 and 3.
3.1.1.2.2 VOCs - Lodgepole pine
3.1.1.2.2.1 S. chartarum
No visible growth of S. chartarum was detected on untreated or treated lodgepole pine.
Accordingly, no major differences in the V O C pattern were noted between inoculated test
specimens and the control (Appendix K, Figure K-4).
3.1.1.2.2.2 A. versicolor
No major differences in the V O C profiles between the test specimens and the control were
noted for the borate-treated specimens.
On untreated lodgepole pine, A. versicolor produced 2-ketones (mostly 2-pentanone and 2-
heptanone, with smaller amounts of 2-butanone, 2-hexanone, 2-octanone and 2-nonanone),
but only in the specimens 2 and 3 that exhibited visible growth. The V O C profile of
specimen 3 is shown in Appendix K , Figure K-5. Changes in the V O C profile were evident
by week 1. Figure 3.8 shows the time trend for 2-pentanone. (Pentanal elutes at a similar
retention time, and area counts for the pentanal peak are shown for specimen 1 and the
control). A very small amount of hexanol was detected by GC-MS in specimen 2.
40
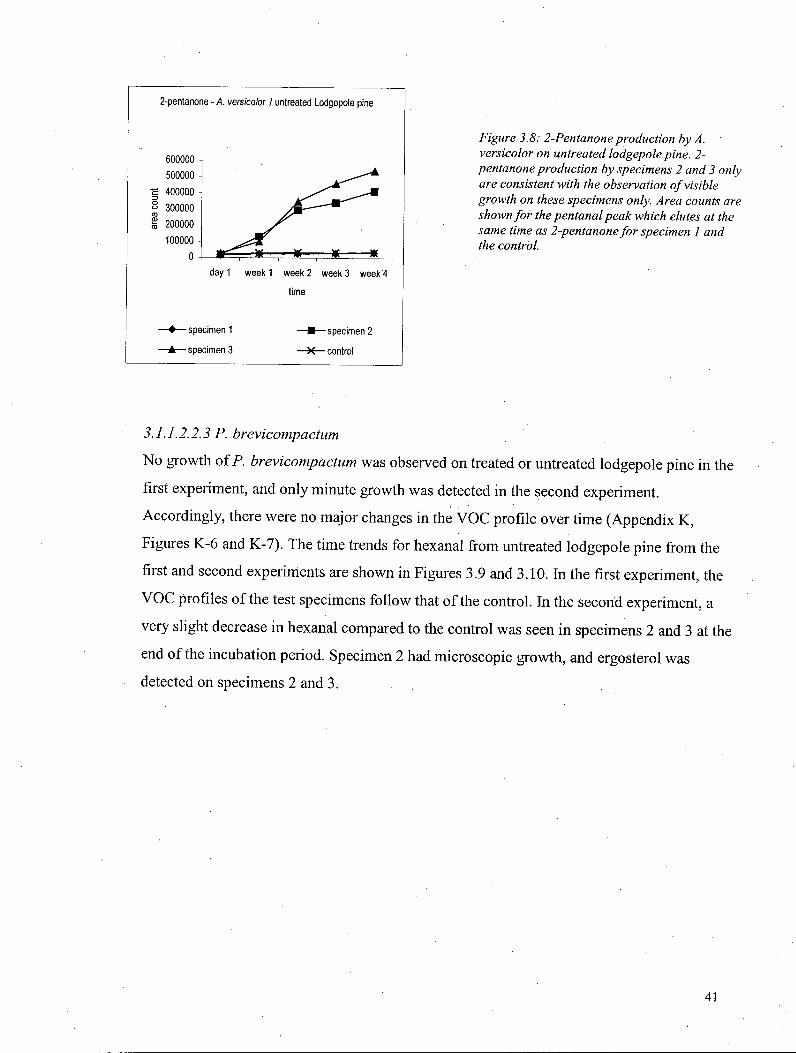
2-pentanone - A. versicolor / untreated Lodgepole pine
-600000 -
500000 -
Z3 400000 -
o o CD
300000 -<D CO 200000 -
100000 • n — * — £ $ * U -
day 1 week 1 week 2 week 3 week 4
time
— • — s p e c i m e n 1 — • — s p e c i m e n 2
— A — specimen 3 —X— control
Figure 3.8: 2-Pentanone production by A.
versicolor on untreated lodgepole pine. 2-
pentanone production by specimens 2 and 3 only
are consistent with the observation of visible
growth on these specimens only. Area counts are
shown for the pentanal peak which elutes at the
same time as 2-pentanone for specimen 1 and
the control.
3.1.1.2.2.3 P. brevicompactum
No growth of P. brevicompactum was observed on treated or untreated lodgepole pine in the
first experiment, and only minute growth was detected in the second experiment.
Accordingly, there were no major changes in the V O C profile over time (Appendix K,
Figures K-6 and K-7). The time trends for hexanal from untreated lodgepole pine from the
first and second experiments are shown in Figures 3.9 and 3.10. In the first experiment, the
VOC profiles of the test specimens follow that of the control. In the second experiment, a
very slight decrease in hexanal compared to the control was seen in specimens 2 and 3 at the
end of the incubation period. Specimen 2 had microscopic growth, and ergosterol was
detected on specimens 2 and 3.
41

Hexanal - P. brevicompactum I untreated Lodgepole
pine(exp.l)
day 1 week 1 week 2 week 3 week 4
time
- specimen 1 — • — specimen 2
- specimen 3 —X— control
Figure 3.9: Hexanal concentrations for
untreated lodgepole pine inoculated with P.
brevicompactum (experiment I). Hexanal
concentrations remained stable, indicating no
growth.
Hexanal - P.brevicompactum I untreated Lodgepole pine (exp.2)
400000
300000
o 200000
100000 A
day 1 week 1 week 2 week 3 week 4
time
-specimen 1
- specimen 3
-specimen 2
- control
Figure 3. JO: Hexanal concentrations for
untreated lodgepole pine inoculated with P.
brevicompactum (experiment 2). Hexanal
concentrations in specimens 2 and 3 decreased
slightly compared to specimen 1 and the control
at week 4, possibly suggesting growth.
Microscopic growth was seen on specimen 2 and
a small amount of ergosterol was detected on
specimens 2 and 3.
3A. 1.3 Carbon dioxide
In general, the carbon dioxide measurements were in agreement with the visual observations of
growth. Results are summarized in Table 3.1.
Table 3.2: Average ±SD carbon dioxide concentration (ppm) after 4 weeks
Average ± SD carbon dioxide concentration (ppm)
S. chartarum A versicolor P. brevicompactum ambient
Untreated Treated Untreated Treated Untreated Treated. ambient
Southern Yellow
pine 547 ± 55 •
602 ±181
b >6000 492 ± 1 0 >6000 437 ± 22 461 ± 48
Lodgepole pine
experiment 1 501 ± 2 4 505 ± 32 4028 ± 3079 c 523 ± 2 9 478 ± 4 562 ± 51
460 ± 53 Lodgepole pine
experiment 2
a • t i <
B M P ' M f l H M P 732 ± 384 d 531 ± 29 *
460 ± 53
a includes 1 specimen contaminated with Penicillium spp., C 0 2 = 610 ppm b includes 1 chamber with contamination in the water, C 0 2 = 810 ppm 0 1 specimen showed no growth; actual values: 480 ppm, >6000 ppm, 5605 ppm d results from second experiment: 1 untreated specimen had microscopic growth ( C 0 2 = 1163 ppm) e results from second experiment: 1 treated specimen had a small spot of visible growth ( C 0 2 = 525 ppm)
42

3.1.1.4 Ergosterol
The average ergosterol measurements are presented in Table 3.3. The results are generally
consistent with the other parameters of growth. In the second experiment with P.
brevicompactum on lodgepole pine, ergosterol was detected on 2 of the untreated specimens,
both at very low levels, but microscopic growth was seen on only one of them. Ergosterol was
also detected on the one treated specimen that showed growth.
Table 3.3: Average ±SD ergosterol content (jug/cm2) after 4 weeks
Average ± SD ergosterol content (uq/cm2) . S. chartarum A versicolor P. brevicompactum '
Untreated Treated Untreated Treated Untreated Treated Southern Yellow pine N/A N/A N/A N/A 1.24 + 0.33 <DL Lodgepole pine experiment 1
<DL <DL 0.27 ± 0 . 0 5 3 <DL <DL <DL
Lodgepole pine experiment 2 0.02 b 0.05c
<DL = below detection limit (0.01 ug/cm2) a actual values (growth on only 2 of 3 samples) 0.306 and 0.235 ug/cm2
no growth detected in first experiment. In the second experiment, growth seen on 1/3 untreated samples and ergosterol detected in 2/3 samples (0.015 and 0.026 ug/cm2). 0 No growth detected in the first experiment. In the second experiment, growth and ergosterol detected in 1/3 of treated samples (0.054 ug/cm2).
43

3.1.2 Wood composites
3.1.2.1 Visible growth
3.1.2.1.1 Pine oriented strandboard
3.1.2.1.1.1 S. chartarum
S. chartarum did not grow on either treated or untreated pine OSB.
3.1.2.1.1.2 A. versicolor
Growth of A. versicolor on untreated pine OSB was variable, with growth on one specimen
being strong (Appendix J, Photo '6) while growth on the other two test specimens was
limited. No growth of A. versicolor was detected oh the inoculated surface of the borate
treated pine OSB, but some growth did occur on the cut edges (Appendix J, Photos 7 and 8).
The weekly trends in visual growth scores are shown in Figure 3.11.
3.1.2.1.1.3 P. brevicompactum
The first experiment with P. brevicompactum on pine OSB yielded unexpected results. In
the initial experiment, sparse growth (Appendix J, Photo 9) occurred on the three borate
treated specimens while none occurred on the untreated specimens. The experiment was
repeated with a second set of specimens, and growth was observed on the untreated but not
on the treated specimens, as expected. Growth on the untreated specimens was variable and
somewhat limited as well (Appendix J, Photo 10). The weekly trends in visual growth scores
from experiment 1 and experiment 2 are shown in Figures 3.12 and 3.13.
Testing with the borate indicator solution confirmed that the specimens were not mislabeled.
44

Visual growth rating - A.versicolor I untreated Pine OSB
0 J L ism day 1 week 1 week 2 week 3 week 4
H specimen 1 0 specimen 2 • specimen 3 0 control
Figure 3.11: Individual visual growth scores for A.
versicolor on untreated pine OSB. Growth was
variable between specimens, with limited growth on
specimens 1 and 2, but marked growth on specimen
3.
Visual growth rating - P.brevicompactum I treated Pine OSB (exp.1)
0 day 1 week 1 week 2 week 3 week 4
0 specimen 1 0 specimen 2 EI specimen 3 E3 control
Figure 3.12: Individual visual growth scores for
P. brevicompactum on treated pine OSB from the
first experiment. Growth was limited.
Visual growth rating - P. brevicompactum I untreated Pine OSB (exp. 2)
3
2
1 1
day 1 week 1 week 2 week 3 week 4
3 specimen 1 0 specimen 2 ED specimen 3 E3 control
Figure 3.13: Individual visual growth scores for
P. brevicompactum on untreated pine OSB from
the second experiment. This time growth was
seen on the untreated specimens, but growth was
again limited, and variable between specimens.
3.1.2.1.2 A s p e n oriented strandboard
3.1.2.1.2.1 S. chartarum
S. chartarum d i d not g row o n either treated or untreated aspen O S B .
45
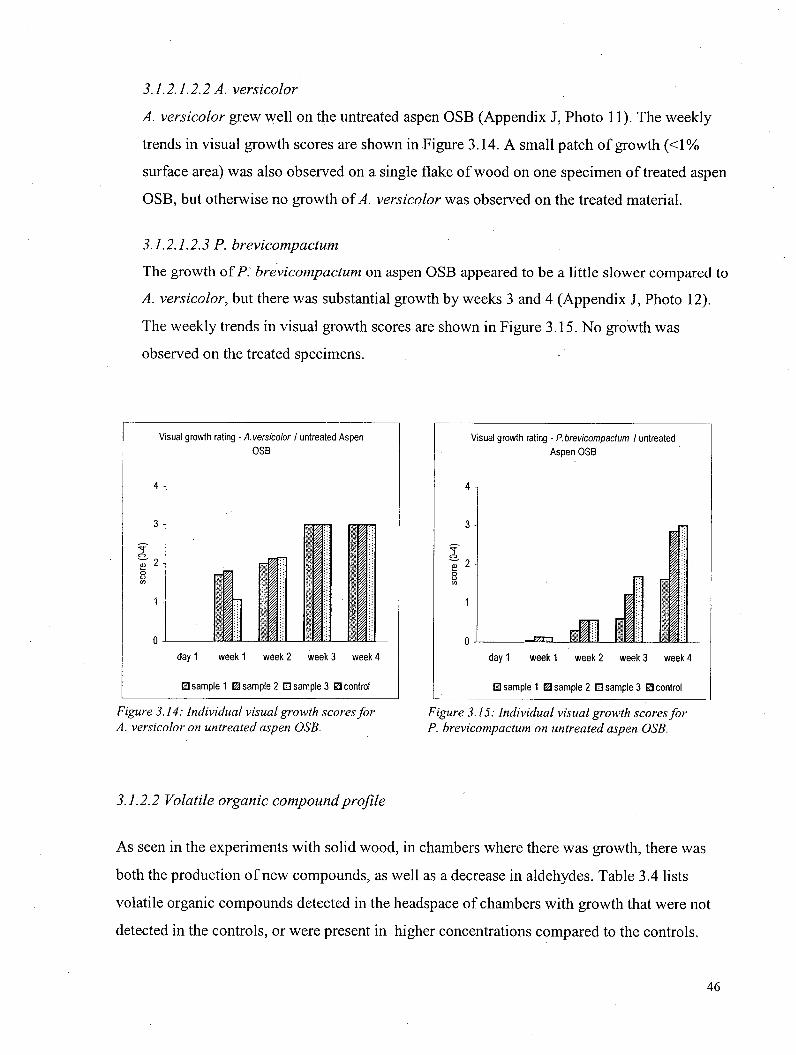
3.1.2.1.2.2 A. versicolor
A. versicolor grew well on the untreated aspen OSB (Appendix J, Photo 11). The weekly-
trends in visual growth scores are shown in Figure 3.14. A small patch of growth (<1%
surface area) was also observed on a single flake of wood on one specimen of treated aspen
OSB, but otherwise no growth of A. versicolor was observed on the treated material.
3.1.2.1.2.3 P. brevicompactum
The growth of P. brevicompactum on aspen OSB appeared to be a little slower compared to
A. versicolor, but there was substantial growth by weeks 3 and 4 (Appendix J, Photo 12).
The weekly trends in visual growth scores are shown in Figure 3.15. No growth was
observed on the treated specimens.
Visual growth rating - A.versicolor I untreated Aspen OSB
1 i L day 1 week 1 week 2 week 3 week 4
0 sample 1 0 sample 2 • sample 3 • control
Figure 3.14: Individual visual growth scores for
A. versicolor on untreated aspen OSB.
Visual growth rating - P.brevicompactum I untreated Aspen OSB
1r 2 \
1! i
day 1 week 1 week 2 week 3 week 4
B sample 1 E3 sample 2 0 sample 3 E3 control
Figure 3.15: Individual visual growth scores for
P. brevicompactum on untreated aspen OSB.
3.1.2.2 Volatile organic compound profile
As seen in the experiments with solid wood, in chambers where there was growth, there was
both the production of new compounds, as well as a decrease in aldehydes. Table 3.4 lists
volatile organic compounds detected in the headspace of chambers with growth that were not
detected in the controls, or were present in higher concentrations compared to the controls.
46

Table 3.4: Volatile organic compounds from fungal growth on pine oriented strandboard and aspen oriented
strandboard.
Compound GC-FID Retention time (minutes)
Pine OSB Aspen OSB Compound GC-FID Retention
time (minutes) Q chariarum A. versicolor P. brevicom. S chartarum A. versicolor P. brevicom
Rt 2.4* 2.4 X X Acetone 3.7 X ' r X 2-butanone 6.5 X X 2-pentanone 9.3 x X Methyl pyrrole 10.6 x X Pyrrole 12.3 X X 2-hexanone 12.4 X X •> Rt 12.9 12.9 > X X Styrene 14 u X X Methoxymethyl benzene
17.2 CJ) ....
CD X 2-octanone 17.6 o x o Ethoxy methyl benzene
19.9 c X Rt 21 21 x Rt 23 22.9 X Rt 24 24 x *
Rt 25 25 x other terpenes X
*Rt denotes compounds labelled by retention time only and not identified further. Example: Rt 2.4 = compound eluting with a retention time of 2.4 minutes, but not identified further.
3.1.2.2.1 VOCs - Pine oriented strandboard
3.1.2.2.1.1 S. chartarum
A splitless injection technique was used during this experiment, with the result that some
peaks were broad and overloaded. However, no significant differences in the V O C profiles
were noted between inoculated test specimens and the controls for either untreated or treated
pine OSB. The V O C profile for untreated pine OSB inoculated with S. chartarum after 4
weeks is shown in Appendix K, Figure K-8.
3J.2.2.1.2 A. versicolor
The VOC profile for borate-treated specimens showed noticeable decreases in aldehydes at
week 2, but production of new compounds was limited to a very small amount of 2-
hexanone.
47

The change in V O C profile for A. versicolor growing on untreated pine OSB was
characterized mainly by decreases in aldehydes. One sample (specimen 3) started to show a
loss of aldehydes at week 1, consistent with the early visual appearance of growth on this
specimen (Appendix K, Figure K-8). The VOC profile of the other test specimens showed
noticeable decreases in aldehydes compared to the control by the third and fourth weeks,
consistent with the later appearance of growth (Appendix K, Figure K-10). The time trends
of hexanal for A, versicolor on untreated pine OSB are shown in Figure 3.16. Production of
new compounds was limited (small quantities of 2-hexanone, 2-octanone, and several
unidentified compounds eluting between 20-25 minutes, possibly terpenes).
Hexanal - A. versicolor 1 untreated Pine OSB
250000 -
200000 -
I 150000 -O
/ 2.100000 -CO
50000 -
n u - \ m i - m 1 • i • — i
day 1 week 1 week 2 week 3 week 4 time
—•— specimen 1 • specimen 2
—•— specimen 3 —X— control
Figure 3.16: Hexanal concentrations for A.
versicolor on untreated pine OSB. Hexanal
decreased fastest in specimen 3, consistent with
the observation of the most intense visible
growth on specimen 3. Hexanal decreased more
slowly in specimens I and 2, but remained high
in the control.
3.1.2.2.13 P. brevicompactum
With the unexpected growth on treated pine OSB, changes in the V O C profile for the treated
material were mainly decreases in aldehydes, but small amounts of new products (mostly
ketones such as acetone, 2-butanone, 2-pentanone, 2-hexanone) were also detected. The
VOC profile remained unchanged for the untreated material on which no growth was seen.
In the second experiment, changes in the V O C profile were seen for the untreated material,
consistent with observed growth. VOC production by P. brevicompactum on the untreated
OSB consisted of ketones again, and also small amounts of compounds tentatively identified
as nitrogen-containing compounds methyl pyrrole and pyrrole (Appendix K , Figure K - l 1).
48

As expected, no major changes were seen in the V O C profile of the treated pine OSB in this
experiment.
3.1.2.2.2 VOCs - Aspen oriented strandboard
3.1.2.2.2.1 S. chartarum
VOC monitoring was begun using GC-MS from day 1 to week 2, then monitoring was done
using GC-FID for the weeks 3 and 4. The area counts are not transposable between methods,
but consistent with the absence of visible growth, there were no significant changes in the
VOC profile between inoculated test specimens and the controls for both untreated and
borate-treated material. The V O C profile for the untreated material after 4 weeks in shown
in Appendix K, Figure K-12.
3.1.2.2.2.2 A. versicolor
No major differences in the V O C profiles between the test specimens and the control were
noted for the borate-treated specimens.
On untreated material, aldehydes decreased and new compounds were formed. Styrene was
the main compound produced by A. versicolor on untreated aspen OSB. The times trends for
styrene production are shown in Figure 3.17. Small quantities of compounds tentatively
identified as methoxymethyl benzene and ethoxymethyl benzene were also detected
(Appendix K, Figure K-13). In contrast to the observations with A. versicolor on solid pine
wood and pine OSB, ketone production was not observed with A. versicolor on aspen OSB.
49

Styrene - A. versicolor I untreated Aspen OSB
250000 A
200000 A
§ 150000 Figure 3.17: Styrene production by A.
versicolor on untreated aspen OSB.
e 100000 A
50000
0 — £ — i — K — I — K — I — X ,
day 1 week 1 week 2 week 3 week 4
time
—specimen 1 specimen 2
specimen 3 control
3.1.2.2.2.3 P. brevicompactum
No major differences in the V O C profiles between the test specimens and the control were
On untreated material, aldehydes decreased and new compounds, mostly 2-pentanone and
styrene, were produced (Appendix K, Figure K-14). Other ketones (acetone, 2-butanone)
were also produced, as well as compounds tentatively identified as pyrrole and methyl
pyrrole (detected only in specimens 2 and 3). Times trends for 2-pentanone and styrene are
shown in Figures 3.18 and 3.19.
noted for the borate-treated specimens.
50

2-pentanone - P. brevicompactum I untreated Aspen OSB
350000 300000
_ 250000 | 200000 g 150000 <° 100000
50000 0
day 1 week 1 week 2 week 3 week 4
time
- specimen 1
- specimen 3
- •—specimen 2
-K— control
Figure 3.18: 2-pentanone production by P.
brevicompactum on untreated aspen OSB. 2-
pentanone production decreased after week 3 in
specimens 2 and 3. Area counts are shown for
the pentanal peak which elutes at the same time
as 2-pentanone for the control.
Styrene - P. brevicompactum I untreated Aspen OSB
150000 \
100000
50000
day 1 week 1 week 2 week 3 week 4
time
-specimen 1.
- specimen 3
- specimen 2
- control
Figure 3.19: Styrene production by P.
brevicompactum on untreated aspen OSB.
3.1.2.3 Carbon dioxide
In general, the carbon d i o x i d e measurements were i n agreement w i t h the v i sua l observations o f
growth. Resul ts are summar ized i n Table 3.5. The carbon d iox ide levels for oriented
strandboard where no g rowth was observed (borate-treated specimens and uninoculated
controls) tended to be higher compared to other materials.
Table 3.5: Average ± SD carbon dioxide concentration (ppm) after 4 weeks
Average ± SD carbon dioxide concentration (ppm) S. chartarum- A. versicolor P brevicompactum
Ambient Untreated Treated Untreated Treated Untreated Treated Ambient
Pine OSB experiment 1 664 ± 97 789 + 186 >6000 4448 ±
697^ 832 ± 87" >6000 b 478 ± 31 Pine OSB
experiment 2 '6000 r 605 ± 23 c
478 ± 31
Aspen OSB 620 ± 84 654 ±109 >6000 107. _
106 >6000
861 ± 262 476 ±53
growth occurred on the cut edges of pine OSB, but none was observed on the inoculated face anomalous results in first experiment - growth on 3/3 treated specimens and 0/3 untreated specimens results of second experiment - growth on 0/3 treated specimens and 3/3 untreated specimens
t 51

3.1.2.4 Ergosterol
The ergosterol results were consistent w i t h the observations o f growth. T h e average ergosterol
measurements are presented i n Table 3.6.
Table 3.6: Average ± SD ergosterol content (fig/cm2)
Average ± SD ergosterol content (uq/cm2) S chartarum A versicolor P. brevicompactum
Untreated Treated Untreated . Treated Untreated Treated Pine OSB experiment 1
N/A N/A 1.2 ± 1.0 a <DL <DL 0.42 ± .15"
Pine OSB experiment 2 0.80 ± 0.50 <DL
Aspen OSB N/A N/A 3.0 ± 0.46 <DL 1.39 ±0.51 <DL N / A = not assayed <DL = below detection limit (0.01 ug/cm2) a actual values for 3 samples: 0.40, 0.89, 2.34 pg/cm2
Anomalous results - growth on treated material first experiment but growth occurred on untreated material in second experiment)
52

3.1.3 Cellulose insulation
3.1.3.1 Visible growth
Growth on cellulose insulation was difficult to see with the naked eye, especially through the
glass of the chambers, so rating the visual appearance each week was often not possible.
However, microscopic examination showed that all three organisms grew on untreated cellulose
insulation.
3.1.3.1.1 S. chartarum
Black spores of 6". chartarum were visible on larger pieces of paper in untreated cellulose
insulation. Microscopic examination revealed hyphal structures and masses of spores on
untreated insulation (Appendix J, Photo 13), but no growth on the treated insulation
(Appendix J, Photo 14).
3.1.3.1.2 A. versicolor
Due to its light colour, A. versicolor was difficult to see with the unaided eye, but was
visible under microscopic examination after 4 weeks. Even under magnification it was still
somewhat difficult to distinguish among the cellulose fibers unless there were conidia
(Appendix J, Photo 15). No growth was seen on the treated material (Appendix J, Photo
16).
3.1.3.1.3 P. brevicompactum
Similarly, P. brevicompactum was difficult to see with the unaided eye but was visible under
microscopic examination after 4 weeks, though it was still somewhat difficult to distinguish
among the cellulose fibers (Appendix J, Photo 17). No growth was seen on the treated
material (Appendix J, Photo 18).
3.1.3.2 Volatile organic compound profile
Growth was associated with production of new compounds as well as a decrease in aldehydes.
Table 3.7 lists volatile organic compounds detected in the headspace of chambers with growth
that were not detected in the controls, or were present in significantly higher concentrations
compared to the controls.
53

Table 3.7: Volatile organic compounds from fungal growth on cellulose insulation
Compound GC-FID Retention time (minutes)
Cellulose insulation Compound GC-FID Retention
time (minutes) S. chartarum A. versicolor P. brevicom.
Acetone 3.6 X X
2-butanone 6.3 X 2-pentanone 9.1 X X dimethyl disulfide 9.6 X dimethyl cyclopentenone
10.3 X
2-hexanone 12.2 X 2-heptanone 14.7 X
Anisole 14.8 X
Rt 26.6* 26.6 X
Trichodiene 29.3 X other terpenes X
*Rt denotes compounds labelled by retention time only and not identified further. Example: Rt 26.6 = compound eluting with a retention time of 26.6 minutes, but not identified further.
3.1.3.1.1 S. chartarum
In the initial experiment, V O C monitoring was begun using GC-MS for the first 2 weeks
and then monitoring was done using GC-FID for the remainder of the experiment. The area
counts are not transposable between methods, and the GC-FID settings were not very
sensitive yielding poor results.
The experiment was repeated using GC-FID to monitor the V O C profile, this time with a
splitless injection method that resulted in broad, overloaded peaks. A different
chromatography column was installed between day 1 and week 1 V O C monitoring resulting
in shifted retention times for week 1. However, changes in the V O C profile consistent with
fungal growth were observed. The original column was replaced for subsequent monitoring.
On untreated cellulose insulation, growth of S. chartarum was associated with both a
decrease in aldehydes and the production of new compounds. Acetone and anisole
(methoxybenzene) were the main VOCs produced, as well as smaller amounts of 2
compounds identified as a sesquiterpene (retention time 26.6 minutes) and trichodiene
(retention time 29.3 minutes) (Wilkins 2000). The V O C profile for untreated cellulose
inoculated with S. chartarum after 4 weeks is shown in Appendix K , Figure K-15. The time
trend for anisole production is shown in Figure 3.20.
54

While no growth was found on the treated cellulose insulation, the water in one of the
chambers became contaminated and a decrease in aldehydes was observed in this specimen.
Anisole - S. chartarum I untreated cellulose insulation
800000
600000 t
Q 400000
200000
day 1 week 1 week 2 week 3 week 4
time
- • — specimen 1
-A—specimen 3
- specimen 2
- control
2-pentanone - A. versicolor I untreated cellulose insulation
dayl day 5 day 12 day 19 day 26
time
- • — specimen 1 — • — specimen 2
- A — specimen 3 —X-— control
Figure 3.20: Anisole production by S. chartarum
on untreated cellulose insulation. A splitless
injection method was used.
Figure 3.21: 2-Pentanoneproduction by A.
versicolor on untreated cellulose insulation.
Production was transient. Area counts for the
pentanalpeak which elutes at the same time as
2-pentanone are shown for the control.
3.1.3.1.2 A. versicolor
The chromatography from the initial experiment was poor due to low sensitivity from use of
a split injection method. The experiment was later repeated using only untreated cellulose
insulation to better characterize the VOC profile using the timed-split injection method.
Compounds produced by A. versicolor on untreated cellulose insulation included 2-
pentanone, 2-hexanone, and 2-heptanone. Production of these ketones was limited and
transient (Appendix K , Figures K-16 and K-17). Figure 3.21 shows the time trend for 2-
pentanone production.
3.1.3.1.3 P. brevicompactum
A splitless injection method was used resulting in overloaded peaks. For the borate-treated
material, no major differences in the VOC profiles between the test specimens and the
control were noted.
55

For the untreated material, changes in the VOC profile were characterised mainly by a
decrease in aldehydes (Appendix K, Figure K-18). Acetone and small amounts 2-butanone
and 2-pentanone were produced, but overall P. brevicompactum did not produce many
detectable V O C metabolites on untreated cellulose insulation.
3.1.3.3 Carbon dioxide
In general, the carbon dioxide measurements were in agreement with the visual observations of
growth. Results are summarized in Table 3.8. The carbon dioxide levels associated with growth
on untreated cellulose insulation were lower compared to the carbon dioxide levels seen with
other materials that supported fungal growth.
Table 3.8: Average ± SD carbon dioxide concentration (ppm) after 4 weeks
Average ± SD carbon dioxide concentration (ppm) S. chartarum A. versicolor P. brevicompactum
Ambient Untreated Treated Untreated Treated IlUhtreltell Treated Ambient
Cellulose insulation 2038 ± 332
464 ± 24 2440 ± 405
533 ± 3 1458 ± 323
530 ± 8 1
467 ± 4 2 Cellulose insulation experiment 2
3208 ± 952
671 ± 250 467 ± 4 2
3.1.3.4 Ergosterol
Ergosterol results are summarized in Table 3.9 (ergosterol content expressed as ug/g of dry
insulation). Of note is that the ergosterol levels for S. chartarum on cellulose insulation are
much higher than for both A. versicolor and P. brevicompactum, indicating that cellulose
insulation is an excellent substrate for S. chartarum.
Table 3.9: Average ± SD ergosterol content (pg/g)
Average ± SD ergosterol content (uc /g) S chartarum A. versicolor P. brevicompactum
Untreated Treated Untreated Treated;., Untreated Treated Cellulose insulation 22.65 ± 3 .0 a ND 2.51 ± 0.39 ND 1.76 ±0.31 ND Cellulose insulation experiment 2 20.16 ±1.6 ND ^ ^ ^ ^ ^ ^ ^
ND = not detected a 0.72 ug/g detected in control.
56
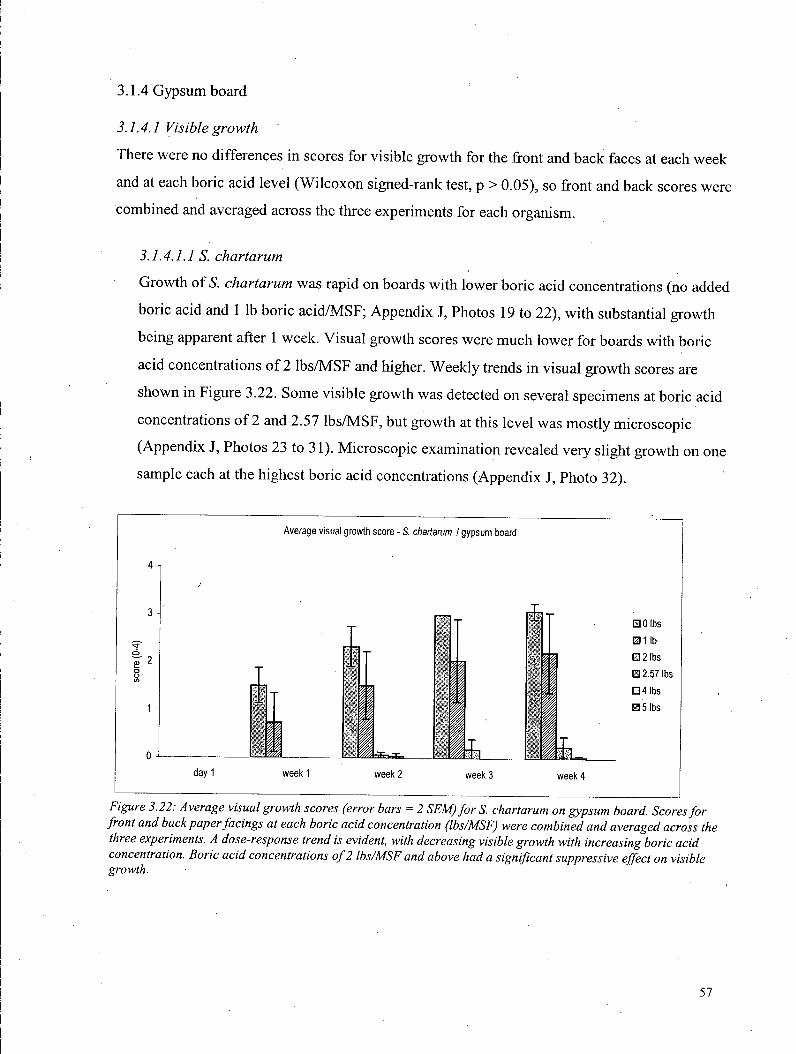
3.1.4 Gypsum board
3.1.4.1 Visible growth
There were no differences in scores for visible growth for the front and back faces at each week
and at each boric acid level (Wilcoxon signed-rank test, p > 0.05), so front and back scores were
combined and averaged across the three experiments for each organism.
3.1.4.1.1 S. chartarum
Growth of S. chartarum was rapid on boards with lower boric acid concentrations (no added
boric acid and 1 lb boric acid/MSF; Appendix J, Photos 19 to 22), with substantial growth
being apparent after 1 week. Visual growth scores were much lower for boards with boric
acid concentrations of 2 lbs/MSF and higher. Weekly trends in visual growth scores are
shown in Figure 3.22. Some visible growth was detected on several specimens at boric acid
concentrations of 2 and 2.57 lbs/MSF, but growth at this level was mostly microscopic
(Appendix J, Photos 23 to 31). Microscopic examination revealed very slight growth on one
sample each at the highest boric acid concentrations (Appendix J, Photo 32).
3
Average visual growth score - S. chartarum I gypsum board
day 1 week 1
1 week 2 week 3
f f l T
week 4
B O lbs
0 1 lb
• 2 lbs
02.57 lbs
• 4 lbs
0 5 lbs
Figure 3.22: Average visual growth scores (error bars = 2 SEM) for S. chartarum on gypsum board. Scores for
front and back paper facings at each boric acid concentration (lbs/MSF) were combined and averaged across the
three experiments. A dose-response trend is evident, with decreasing visible growth with increasing boric acid
concentration. Boric acid concentrations of 2 lbs/MSF and above had a significant suppressive effect on visible
growth.
57
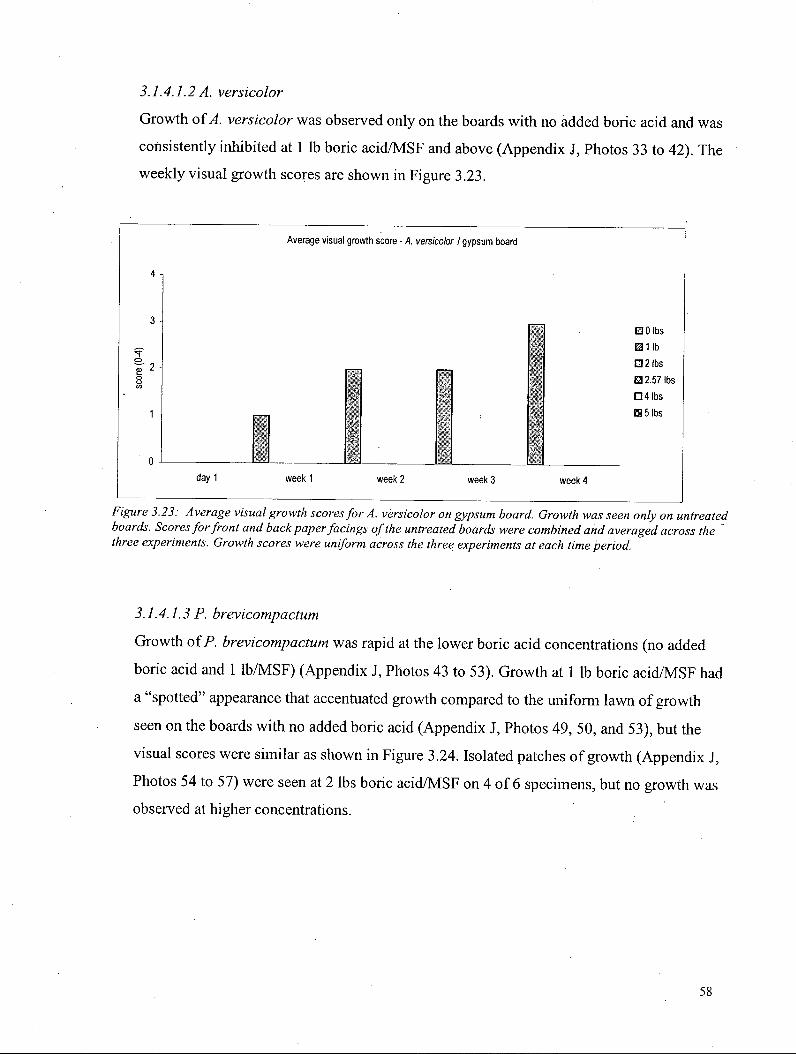
3.1.4.1.2 A. versicolor
Growth of A. versicolor was observed only on the boards with no added boric acid and was
consistently inhibited at 1 lb boric acid/MSF and above (Appendix J, Photos 33 to 42). The
weekly visual growth scores are shown in Figure 3.23.
Average visual growth score - A. versicolor I gypsum board
3
0
no ibs 0 1 lb
0 2 lbs
1111 02.57 lbs
• 4 lbs
H5 lbs
day 1 weekl week 2 week 3 week 4
Figure 3.23: Average visual growth scores for A. versicolor on gypsum board. Growth was seen only on untreated boards. Scores for front and back paper facings of the untreated boards were combined and averaged across the three experiments. Growth scores were uniform across the three experiments at each time period.
3.1.4.1.3 P. brevicompactum
Growth of P. brevicompactum was rapid at the lower boric acid concentrations (no added
boric acid and 1 lb/MSF) (Appendix J, Photos 43 to 53). Growth at 1 lb boric acid/MSF had
a "spotted" appearance that accentuated growth compared to the uniform lawn of growth
seen on the boards with no added boric acid (Appendix J, Photos 49, 50, and 53), but the
visual scores were similar as shown in Figure 3.24. Isolated patches of growth (Appendix J,
Photos 54 to 57) were seen at 2 lbs boric acid/MSF on 4 of 6 specimens, but no growth was
observed at higher concentrations.
58
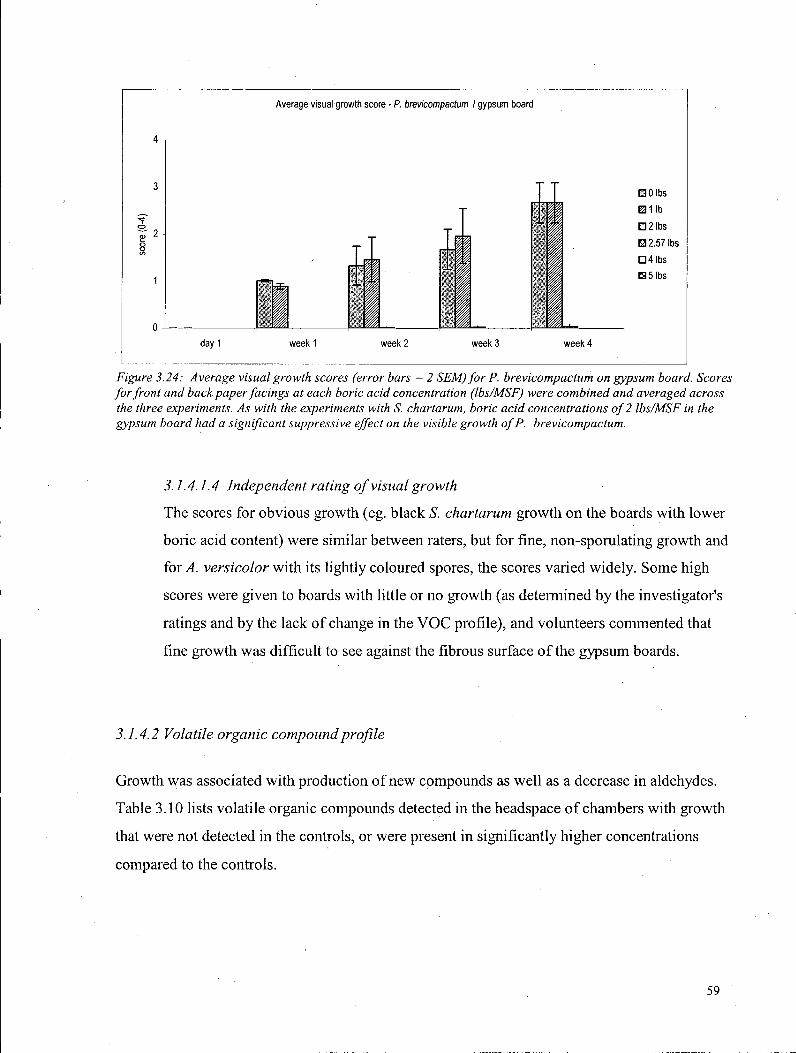
Average visual growth score - P. brevicompactum I gypsum board
4 ->
• Olbs
0 1 lb
• 2 lbs
H2.57 lbs
• 4 lbs
135 lbs
day 1 week 1 week 2 week 3 week 4
Figure 3.24: Average visual growth scores (error bars = 2 SEM) for P. brevicompactum on gypsum board. Scores for front and back paper facings at each boric acid concentration (Ibs/MSF) were combined and averaged across the three experiments. As with the experiments with S. chartarum, boric acid concentrations of 2 Ibs/MSF in the gypsum board had a significant suppressive effect on the visible growth of P. brevicompactum.
3.1.4.1.4 Independent rating of visual growth
The scores for obvious growth (eg. black S. chartarum growth on the boards with lower
boric acid content) were similar between raters, but for fine, non-sporulating growth and
for A. versicolor with its lightly coloured spores, the scores varied widely. Some high
scores were given to boards with little or no growth (as determined by the investigator's
ratings and by the lack of change in the V O C profile), and volunteers commented that
fine growth was difficult to see against the fibrous surface of the gypsum boards.
3.1.4.2 Volatile organic compound profile
Growth was associated with production of new compounds as well as a decrease in aldehydes.
Table 3.10 lists volatile organic compounds detected in the headspace of chambers with growth
that were not detected in the controls, or were present in significantly higher concentrations
compared to the controls.
59

Table 3.10: Volatile organic compounds from fungal growth on gypsum boards
Compound GC-FID Retention time (minutes)
G ypsum board Compound GC-FID Retention
time (minutes) S. chartarum A. versicolor P. brevicom.
Acetone 3.7 X x X 2-butanone 6.5 X X 2-pentanone 9.3 x X X dimethyl disulfide 10 x X dimethyl cyclopentenone
• 10.6 x
2-hexanone 12.4 X X Anisole 15.3 x Limonene 16.7 x Rt 27.2* 27.2 x Trichodiene 29.9 x other terpenes x *Rt denotes compounds labelled by retention time only and not identified further. Example: Rt 27.2 = compound eluting with a retention time of 27.2 minutes, but not identified further.
3.1.4.2.1 S. chartarum on gypsum board
A variety of compounds were produced by S. chartarum on gypsum board, including
ketones such as acetone, 2-butanone, 2-pentanone, dimethylcyclopentenone; anisole (the
main metabolite); terpenes and sesquiterpenes (limonene and other unidentified
compounds); and the tricothecene pre-cursor trichodiene.
A dose-response trend was observed (Appendix K, Figure K-19), with the rate of decrease in
hexanal and the rate of production of anisole and other volatile metabolites being inversely
related to the level of boric acid treatment. Hexanal concentrations were already decreased
on day 1 in the gypsum boards with the lower boric acid concentrations.
The time trends for hexanal, anisole, and trichodiene averaged over the three experiments
and combining results for the front and back paper facings, are shown in Figures 3.25 to
3.27. The production of VOCs varied between experiments. However, visual inspection of
plots for each experiment showed that the dose-response trends were consistent between
experiments (Figure 3.28).
60

Average hex anal - S. chartarum I gypsum board
- •— control
HB—0 lbs
- A — 1 lbs
- X — 2 lbs
2.57 lbs
- • — 4 lbs
^ # - N ^ a ? * • *
time
H — 5 lbs
Figure 3.25: Average hexanal concentration for S. chartarum on gypsum boards. A dose-response trend can be seen, with rapid decreases in hexanal at the lower boric acid concentrations, less dramatic decreases at intermediate boric acid concentrations, and concentrations similar to the control at the higher boric acid concentration.
Average anisole - S. chartarum I gypsum board
dayl week week week week 1 2 3 4
time
Figure 3.26: Average anisole production by S. chartarum on gypsum board. Again, a dose-response trends can be seen, with inhibition of anisole production increasing as the boric acid concentration increases.
Average trichodiene - S. chartarum I gypsum
board
— control
-HB—0 lbs
1 lbs
- X — 2 lbs
- * — 2.57 lbs
-r*—4 lbs
- f — 5 lbs
Figure 3.27: Average trichodiene concentration for S. chartarum on gypsum boards. Trichodiene production was strongest on the untreated boards and greatly reduced at 1 lb boric acid/MSF. Trichodiene was not detected in any significant quantities at higher boric acid concentration.
61

Anisole - S. chartarum /gypsum board exp. 1 front
200000 4
day 1 week 1 week 2 week 3 week 4
time
-2.57
Anisole - S. chartarum /gypsum board exp. 1 back
day 1 weekl week 2 week 3 week 4
time
-1 -2.57
Anisole - S. chartarum /gypsum board exp. 2 front
200000 - -
area
cou
nt
CD cn
CD C
D
CD C
D
CD C
D
CD C
D
50000 - 7 / 7 o mS I K mt wm
™ « ~ m i m i mm • day 1 weekl week 2 week 3 week 4
time
- + _ 0 ^ _ 2 . 5 7 _ ^ _ 5
Anisole - S. chartarum /gypsum board exp. 2 back
200000 -
area
cou
nt
CD cn
CD
O
CD C
D
O C
D
CD O
50000 -
0 - WoC^r-— « Mt >f -mt ™» ™ BB H
dayl weekl week 2 week 3 week 4
time
- * - 2 - * - 2 . 5 7 - * - 4 - « - 5
Anisole - S. chartarum /gypsum board exp. 3 front
day 1 week 1 week 2 week 3 week 4 time
•2.57 — * — 4
Anisole - S. chartarum /gypsum board exp. 3 back
200000
150000 n o | 100000 CO
50000
day 1 weekl week2 week3 week4 time
-1 -2.57 -5
Figure 3.28: Anisole production by S. chartarum on gypsum board for experiments 1,2, and 3, front and back sides, the dose-response trend was generally consistent in each experiment.
Production varied between experiments, but
62

3.1.4.2.1.1 Sesquiterpene production by S. chartarum on gypsum board
S. chartarum produced a number of compounds eluting after 25 minutes, most in small
quantities. Of particular interest are the 15-carbon (CI 5) compounds (peaks A through
J), including the trichothecene precursor, trichodiene (peak K). These are most abundant
with the untreated boards, and most are still present at 1 lb boric acid/MSF, but their
concentration was lower and their appearance was delayed. These compounds were not
detected in samples at 2 lbs boric acid/MSF or higher (Figures 3.27 and 3.29). The mass
spectra of trichodiene is shown in Figure 3.30.
Chromatooram P i n t s P lo 1 1 : u :\. ., U 2 f . b 0 4 1 B y p 0 _ , t . _ 1 2 f . b 0 4 .r u n A P to l 2 : u : \, .. \ 1 2 C b 0 4 \ g y p l _ . t . I 2 t . b 0 4 . r u n A P l o t 3 : » 1 2 i . b 0 4 \ B y p 2 - i t « - 1 2 i . b 0 4 . r u n A
Figure 3.29: GC-FID chromatograms from the headspace of chambers with S. chartarum growing on gypsum
board at 4 weeks, showing CI5 compounds (A-J) as determined by GC-MS, and trichodiene (K). The amounts of
these sesquiterpenes were greatest on untreated gypsum board (top). Some were also detected at I lb boric
acid/MSF (secondfrom top), but not at 2 lbs boric acid/MSF (thirdfrom top) or in the uninoculated control
(bottom).
63

S c a n 1922 fiom u:Vray*s ptojocl_gc-ms\29jan04\gyp0_sla_29)ar.04,s
Figure 3.30: Mass spectra of Peak K from S.
chartarum on gypsum board, corresponding to
trichodiene (C]5H24, molecular weight = 204).
(Wilkins 2000).
Trichodiene
3.1.4.2.2 A. versicolor on gypsum board
Consistent w i t h the observat ion o f growth on ly on the untreated boards, the changes i n the
V O C profi les over t ime were noted o n l y for the untreated gypsum board (Append ix K ,
F igure K - 2 0 ) . V O C product ion b y A. versicolor on gypsum board was l imi ted , w i t h the m a i n
metabolite detected be ing acetone. Other 2-ketones were also detected ( C 4 - C 7 ) but at very
l o w levels. T h e t ime trends for hexanal and acetone, averaged over the three experiments
and c o m b i n i n g results for the front and back paper facings, are shown i n Figures 3.31 and
3.32.
64

Average hexanal - A. versicolor / gypsum board
120000 n
100000
80000 A
60000
40000 J
20000
dayl week week week week 1 2 3 4
time
• control -HB—0 lbs - A — 1 lbs - X — 2 lbs
2.57 lbs - • — 4 lbs -H—5 lbs
Figure 3.31: Average hexanal concentration for A. versicolor on gypsum board. A decrease in hexanal was observed for only untreated boards, consistent with the observations of visible growth.
Average acetone - A. versicolor I gypsum board
140000
120000
100000
§ 80000 o o
5> 60000 to
40000
20000
0 dayl week week week week 1 2 3 4
time
-•— control - • — 0 lbs - A — 1 lbs - X — 2 lbs -*—2.57 lbs - • — 4 lbs' - 4—5 lbs
Figure 3.32: Acetone production by A. versicolor on gypsum board. Acetone was detected in all samples, but was significantly higher only in the untreated boards.
3.1.4.2.3 P. brevicompactum on gypsum board
The changes i n the V O C prof i le for the untreated gypsum boards and boards w i t h 1 lb bor ic
a c i d / M S F were very s imi la r . P roduc t ion o f new compounds b y P. brevicompactum o n
gypsum board was l imi ted , w i t h 2-ketones (acetone, 2-butanone, 2-pentanone, 2-hexanone)
being the m a i n compounds produced, and d imethyl disulf ide be ing detected.
Consistent w i t h the observations o f on ly l imi ted , patchy growth o n 4 o f 6 test specimens at
21bs bor ic a c i d / M S F , product ion o f new compounds was negl ig ib le or ve ry l im i t ed at this
concentration ( A p p e n d i x K , F igure K - 2 1 ) . In addit ion, the decrease i n aldehydes was
delayed and less marked at 2 lbs bor ic a c i d / M S F . N o significant changes i n the V O C profi le
were noted at higher bor ic ac id concentrations. The t ime trends for hexanal and acetone,
averaged over the three experiments and combin ing results for the front and back paper
facings, are s h o w n i n Figures 3.33 and 3.34.
65
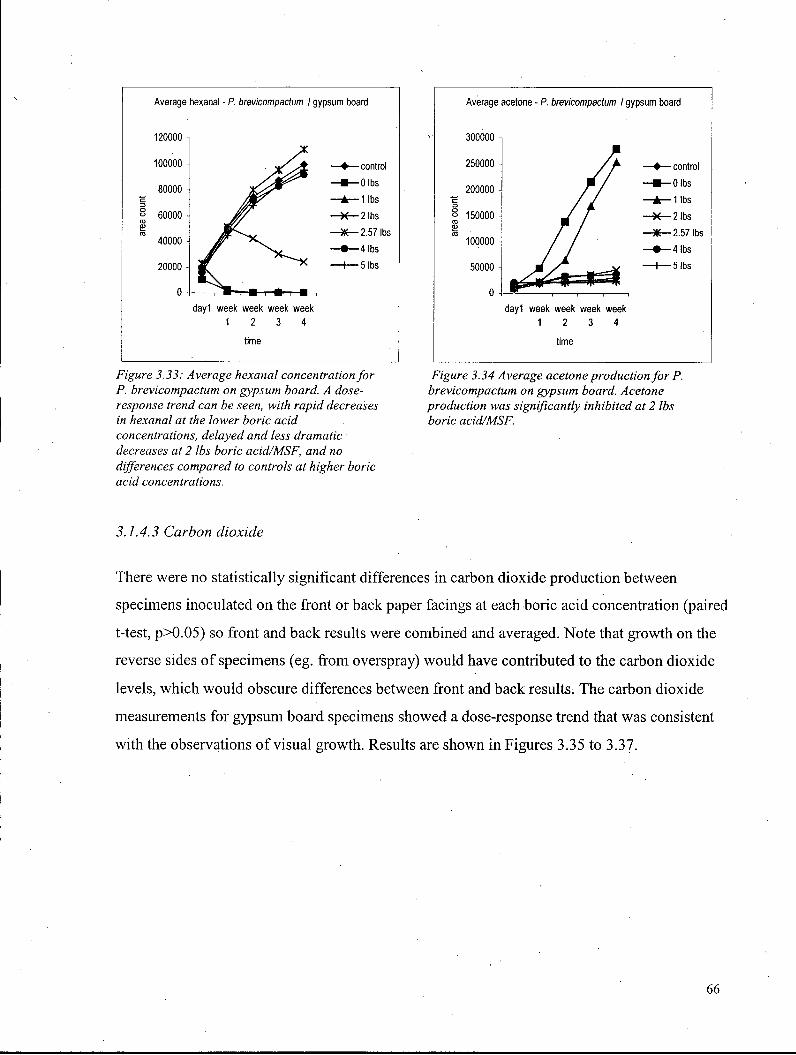
Average hexanal - P. brevicompactum I gypsum board
120000
100000
80000
60000
40000
20000
• control -m— Olbs - ± — 1 lbs - K — 2 lbs
—2.57 lbs - • — 4 lbs -+—5 lbs
dayl week week week week 1 2 3 4
time
Figure 3.33: Average hexanal concentration for
P. brevicompactum on gypsum board. A dose-
response trend can be seen, with rapid decreases
in hexanal at the lower boric acid
concentrations, delayed and less dramatic
decreases at 2 lbs boric acid/MSF, and no
differences compared to controls at higher boric
acid concentrations.
Average acetone - P. brevicompactum I gypsum board
300000
250000
200000
° 150000 CO CU
100000
50000
0
-•— control -•—Olbs - A — 1 lbs - K — 2 lbs
2.57 lbs - • — 4 lbs -H—5 lbs
dayl week week week week 1 2 3 4
time
Figure 3.34 Average acetone production for P.
brevicompactum on gypsum board. Acetone
production was significantly inhibited at 2 lbs
boric acid/MSF.
3.1.4.3 Carbon dioxide
There were no statistically significant differences in carbon dioxide production between
specimens inoculated on the front or back paper facings at each boric acid concentration (paired
t-test, p>0.05) so front and back results were combined and averaged. Note that growth on the
reverse sides of specimens (eg. from overspray) would have contributed to the carbon dioxide
levels, which would obscure differences between front and back results. The carbon dioxide
measurements for gypsum board specimens showed a dose-response trend that was consistent
with the observations of visual growth. Results are shown in Figures 3.35 to 3.37.
66

Average carbon dioxide - S. chartarum I gypsum board
6000 n
5000 • E a 4000 CU
1 3000
§ 2000 CO
° 1000
0
4<),'4 '440?
boric acid (lbs/MSF)
• Olbs 01 lbs ED2lbs 02.57 lbs 04lbs H5lbs
Figure 3.35: Average carbon dioxide levels (error bars = 2SEM) for S. chartarum on gypsum board, showing a dose-response trend consistent with visible growth.
Average carbon dioxide - A. versicolor I gypsum board
6000
_ 5000 E S 4000 CD
| 3000
| 2000 -
S 1000
0
2744
804 484 486 485 491
boric acid (lbs/MSF)
• Olbs 01 lbs Q2lbs E32.57lbs 0 4 lbs H5lbs
Figure 3.36: Average carbon dioxide levels (error bars = 2SEM) for A. versicolor on gypsum board. One specimen at 1 lb boric acid/MSF had an elevated carbon dioxide level of2302 ppm, but no growth was seen on the specimen, and no contamination was found in the chamber.
Average carbon dioxide - P. brevicompactum I gypsum board
6000
5000 -E Q . CL 4000 -CD
'x o 3000 -TZ>
o 2000 -CO
1000 -
0 -
5323 ,50sf
637 451 455 476
boric acid (lbs/MSF)
HOIbs 01 lbs Q2lbs B2.57lbs Q4lbs H5lbs
Figure 3.37: Average carbon dioxide levels (error bars = 2SEM) for P. brevicompactum on gypsum board, also showing a dose-response trend consistent with visible growth,
67

3.1.4.4 Ergosterol
No statistically significant differences in ergosterol measurements were found between
specimens inoculated on the front or back paper facings at each boric acid concentration
(Wilcoxon signed-rank test, p>0.05) so front and back results were combined and averaged. The
ergosterol results show dose-response trends that are consistent with the observations of visible
growth (Figures 3.38 to 3.40).
For S. chartarum on gypsum board, ergosterol was detected on 2 specimens at the 4 Ibs/MSF
boric acid level, although growth was seen on only 1 of them. Conversely, ergosterol was not
detected in the sample taken from the one specimen at 5 Ibs/MSF boric acid that showed
microscopic growth.
Average ergosterol - S. chartarum I gypsum board
£ 2 o Figure 3.38: Average ergosterol content (error
bars = 2SEM) for S. chartarum on gypsum boards. A dose response trend is evident, with a noticeable reduction in ergosterol being seen at a boric acid concentration of 2.57 Ibs/MSF.
0.11 <DL
boric acid (Ib/MSF)
UOIbs 01 lbs Q2lbs 02.57lbs 04lbs H5lbs
68

Average ergosterol - A. versicolor I gypsum board
3 i
T
0 79 ' <DL <DL <DL <DL <DL
boric acid (Ib/MSF)
HO lbs 01 lbs H2lbs 02.57 lbs 0 4 lbs H5lbs
Figure 3.39: Average ergosterol content (error bars = 2SEM) for A. versicolor on gypsum board . Consistent with the visible growth, ergosterol was detected only on the untreated boards.
Average ergosterol - P. brevicompactum I gypsum board
3 i
0.47 T 0.35
' J_ 0.05 <DL <DL 0.05 <DL <DL <DL
boric acid (Ib/MSF)
HOIbs 0 1 lbs 02lbs E32.57lbs D4lbs H5lbs
Figure 3.40: Average ergosterol content (error bars = 2SEM) for P. brevicompactum on gypsum boards. A dose response trend is evident, and is consistent with the visible growth.
3.1.5 S u m m a r y o f results o f m o u l d growth on bu i ld ing materials
Tables 3.11 and 3.12 prov ide a summary o f how many test specimens showed evidence o f
growth i n one or more parameters measured. Ove ra l l , the results show that there are differences
between materials i n terms o f their abil i t ies to support m o u l d growth, w i t h w o o d not be ing a
good substrate for S. chartarum growth, and lodgepole pine seeming to show some resistance to
growth o f A. versicolor and P. brevicompactum.
Other differences i n organism-substrate interactions were evident i n the different patterns o f
V O C s produced w i t h each o f the combinat ions o f organisms and b u i l d i n g materials.
The results also show that borate treatments do inhibi t m o u l d growth, al though not complete ly
at the levels tested for some materials. The results f rom the gypsum board experiments show
different dose-response trends for each organism tested, ind ica t ing that there are differences i n
the sensit ivi ty to borates between fungal species.
69

Table 3.11: Overall results - growth or no growth (all materials except gypsum board)
Overall - any growth S. chartarum A. versicolor P. brevicompactum
Untreated Treated Untreated Treated Untreated Treated Southern Yellow pine 0/3 0/3 3/3 0/3 3/3, 0/3 Lodgepole pine
exp.1 0/3 0/3 ' 2/3 0/3 0/3 0/3 Lodgepole pine exp.2 2/3 a 1/3" Pine OSB exp.1 0/3 0/3 3/3 3/3 c 0/3 d 3/3 d Pine OSB
exp.2 3/3 0/3 Aspen OSB 0/3 0/3 3/3 1/3 - 3/3 0/3 Cellulose insulation 6/6 0/6 3/3 0/3 3/3 0/3
very limited growth (several small colonies) on the side of one specimen c growth noted only on the cut edges of treated material
unexpected results: growth on 3/3 treated specimens and 0/3 untreated specimens in the first experiment. The experiment was repeated with new material, and growth occurred on 0/3 treated specimens and 3/3 untreated specimens as expected. e growth on one flake of wood (<1% surface area)
Table 3.12: Overall results - growth or no growth (gypsum board)
Overall - any growth S. chartarum ' • . A . versicolor P. brevicompactum
."2 c r
0 6/6 6/6 6/6 ."2 c r 1 6/6 0/6 6/6
Gypsum o CO ro o 2 6/6 0/6 4/6
board O CD C o O T—
2.57 6/6 . 0/6 • , 0/6 co 1B 4 2/6 0/6 0/6
5 1/6^ 0/6 0/6 a One other specimen showed V O C changes consistent with growth but no growth was seen, carbon dioxide levels were not significantly elevated, and no ergosterol was detected.
70

3,2 Comparisons between measures of growth - gypsum board experiments
3.2.1 Carbon dioxide versus Week 4 Visual Score
Scatter plots and simple linear regression relationships between carbon dioxide and the week 4
visual scores are presented in Figures 3.41 to 3.43. For S. chartarum on gypsum board, the y-
intercept (carbon dioxide) indicates that carbon dioxide levels maybe elevated, indicating
growth, even when no growth is visible.
o, o o
x o
13 CO
Carbon dioxide vs Week 4 visual scon» S.xhartafum on gypsum boad
• • S i 2 " " 3 Week 4 visual score
Figure 3.41: Carbon dioxide versus Week 4
visual score, S. chartarum on gypsum board.
Intercept: 1149 ppm; coefficient: 1297 ;
Spearman's rho = 0.87; p <0.001.
•3>-
go •on
Carbon dioxide vs Week 4 visual score A versicolor on gypsum board
Week 4 visual score
Figure 3.42: Carbon dioxide versus Week 4
visual score, A. versicolor on gypsum board.
Intercept: 543 ppm; coefficient: 733;
Spearman's rho = 0.61; p <0.001.
• 'So .xo > D O
x>r>
^Carbon dioxide vs Week 4 visual score . P brrwompactum on gypsum bo.ru ' ,
'•Week 4 visual score
Figure 3.43: Carbon dioxide versus Week 4
visual score, P. brevicompactum on gypsum
board. Intercept: 580 ppm; coefficient: 1666;
Spearman's rho = 0.87;p <0.001
71

3.2.2 Ergosterol versus Week 4 Visual Score
Scatter plots and simple linear regression relationships between ergosterol and the week 4
visual scores are presented in Figures 3.44 to 3.46. They-intercept (ergosterol) for S.
chartarum on gypsum board indicates that significant amounts of ergosterol or fungal
biomass may be present even when no growth is visible.
i . i i r
* , * ' - ^ * .Week 4 visual score
Figure 3.44: Ergosterol versus Week 4 visual
score, S. chartarum on gypsum board. Intercept
0.5292, coefficient 0.5192, Spearman's rho =
0.84; p <0.001.
Week 4 visual score * " A * "
Figure 3.45: Ergosterol versus Week 4 visual
score, A. versicolor on gypsum board. Intercept
0.005, coefficient 0.2611, Spearman's rho =
0.99; p <0.001.
"Ergosterol vs Week 4 visual score ^ P Ixevcompactum on gypsum board 1 1
Figure 3.46: Ergosterol versus Week 4 visual
score, P. brevicompactum on gypsum board.
Intercept 0.0163, coefficient 0.1383, Spearman's
rho = 0.88;p<0.001
\Week 4 visual score
72

3.2.3 Carbon Dioxide versus Ergosterol
Scatter plots and simple linear regression relationships between carbon dioxide and ergosterol
are presented in Figures 3.47 to 3.49. There was a variable relationship between carbon dioxide
production and ergosterol level between the organisms. P. brevicompactum produced a lot of
carbon dioxide, but little ergosterol, while S. chartarum produced the most ergosterol for the
amount of carbon dioxide.
Carbon dioxide vs Ergosterol S chartanjm on gypsum board
• •
Carbon dioxide vs Ergosterol A.wrsjcolorongyusymboard *:
Ergosterol (ug/cm2)-
Figure 3.47: Carbon dioxide versus ergosterol,
S. chartarum on gypsum board. Intercept 581
ppm, coefficient 1725, Spearman's rho = 0.85; p
<0.001.
Figure 3.48: Carbon dioxide versus ergosterol,
A. versicolor on gypsum board. Intercept 616
ppm, coefficient 2122, Spearman's rho = 0.61; p
<0.001.
o o
, o
o
• S o
IS "Co
o o
P i
Carbon dioxide vs Ergosterol-: P browampactiJfr. on gypsum board .
1; " --'2 Ergosterol (ug/cm2)
• 3
Figure 3.49: Carbon dioxide versus ergosterol,
P. brevicompactum on gypsum board. Intercept
650ppm, coefficient 9997, Spearman's rho =
0.82;p <0.001.
73

4. Discussion
4.1 Overview
Several questions were posed in the introduction to the study regarding the interactions of
moulds with building materials, the effectiveness of borate preservatives, and the use of
different measures for assessing mould growth.
Mould interactions with building materials
Is there a difference between building materials in their ability to support mould growth? How
are mould metabolites affected by the substrate?
Our results showed that the building materials tested differed in their abilities to support the
growth of moulds, notably that wood and wood composites were not good substrates for the
growth of S. chartarum. Our results also showed that the volatile metabolites produced by
moulds are influenced by the growth substrate.
Effectiveness of borate preservatives against mould growth
Are borate preservatives effective at inhibiting or preventing mould growth, and at what
concentrations? Could sub-inhibitory concentrations of borates stimulate the production of
different metabolites or induce "stress metabolism"?
Our results showed that borate preservatives are generally effective at inhibiting mould growth
on building materials, although wood composites may need a higher level of treatment than
what is currently recommended. We observed different dose-responses for each organism on
gypsum board, indicating that there are differences in the susceptibility of the different moulds
to borates. We also observed that sub-inhibitory concentrations of borates suppressed the
production of volatile metabolites, and did not result in production of different volatile
compounds.
Comparison of different measures of mould growth
How well do different measures correlate with one another? Are any measures better than the
others?
Our comparisons of three different measures of growth found that there was a good correlation
between the different measures, although there were differences in sensitivity, with carbon
dioxide and ergosterol potentially being more sensitive than visual evaluation. The monitoring
74

of the VOC profile revealed that changes in the VOC profile, namely decreases in aldehyde
concentration, might also be a useful means of monitoring mould growth in laboratory
experiments such as ours.
4.2 Organism-substrate interactions
4.2.1 Differing abilities of materials to support mould growth
This was most clearly demonstrated by the observations that S. chartarum did not grow on
wood (solid wood, wood composites), but grew readily on cellulose insulation and gypsum
board papers, producing strikingly high levels of ergosterol on cellulose insulation compared to
the other two organisms tested.
Another example of the different abilities of the materials to support growth was the observation
that lodgepole pine supported the growth of P. brevicompactum poorly. A. versicolor also
seemed to grow poorly on lodgepole pine compared to Southern Yellow pine, with growth on
only 2 of 3 specimens, lower visual growth scores after 4 weeks, and a lower level of ergosterol
than other materials. The reasons for this are unclear. The inoculated sides of the lodgepole pine
used in our experiments (the convex side of the growth rings) were sapwood. Compared to
Southern Yellow pine sapwood, on which we observed fairly consistent growth of Aspergillus
and Penicillium, lodgepole pine sapwood has fungal decay resistance that is roughly equivalent
or even slightly less, although there may be significant variations within a species and even
within a single tree (Viitanen 1991). Further experiments are needed to shed more light on our
lodgepole pine observations.
Organic or cellulose-containing materials such as wood have been implicated as "risk materials"
for mould growth (Gravesen et al. 1999). It has been reported that wood framing is associated
with higher levels of airborne mould spores compared to concrete construction (Meklin et al.
2003). However, our observations that wood did not support the growth of S. chartarum and
that our lodgepole pine specimens displayed some resistance to A. versicolor and P.
brevicompactum suggest that labeling wood as a risk material may be an over-generalization.
The reasons for the unexpected lack of growth of P. brevicompactum on the untreated pine OSB
in the first experiment are unclear. One possible explanation is that formaldehyde emissions
75

from phenol-formaldehyde adhesives used in OSB may have had an inhibitory effect on mould
growth. However, the type of adhesive used to manufacture the OSB used in this study was not
confirmed. Formaldehyde emissions from commercially made oriented strandboards have been
found to be very low. (Structural Board Association 2005). Additionally, the pine OSB
specimens had been stored in the lab for at least 12 months prior to the experiments. A.
versicolor grew on untreated pine OSB in experiments done prior to the first experiment with P.
brevicompactum on pine OSB, and growth of P. brevicompactum was subsequently achieved on
the pine OSB a month later. It therefore seems unlikely that formaldehyde emissions explain the
unexpected lack of growth of P. brevicompactum on the pine OSB, nevertheless, formaldehyde
emission and aging of building materials should be considered in tests of microbial growth on
building materials.
4.2.2 Unique V O C profiles were produced by each organism on different substrates.
Within our experiments, each organism produced a different pattern of volatile metabolites
depending on the substrate it was growing on, though some similarities were seen between
similar materials (e.g. pine wood and pine OSB, cellulose insulation and paper covered gypsum
board). Each material resulted in a different pattern of volatile metabolites depending on the
organism, thus confirming that each organism-substrate interaction is unique.
4.2.2.1 Solid wood
2-ketones (C3 to C9) were the most common and plentiful volatile metabolites produced by A
versicolor and P. brevicompactum on Southern yellow pine and lodgepole pine. This is in
agreement with Fiedler et al., who reported that 2-ketones were typical of all fungal species they
tested when grown on wood, and attributed this to the metabolism of free fatty acids from
woods (Fiedler et al. 2001). 2-ketones are often found in mouldy buildings and are on the VOC
"hit list" (Wilkins & Larsen 1995). Thus, the frequent occurrence of 2-ketones in our results is
consistent with the observations of others.
4.2.2.2 Wood composites
Similar volatile metabolites were produced on solid pine above and pine OSB, but a different
pattern of compounds was produced on aspen OSB. Like the pine woods above, 2-ketones were
the main volatile metabolites detected from both A. versicolor and P. brevicompactum on pine
76

OSB. Other compounds were also detected that could be the result of metabolism of the
additives used in the OSB. The V O C metabolites produced by A. versicolor and P.
brevicompactum on aspen OSB, however, were different. P. brevicompactum produced some 2-
ketones, but A. versicolor did not, and both A. versicolor and P. brevicompactum produced
styrene as a metabolite.
Commonly regarded as an industrial chemical, styrene is a naturally occurring compound, being
produced by plants (eg. Liquidambar spp.) (Budavari et al. 1996), and styrene has been reported
as a fungal metabolite (Claeson et al. 2002). It is unlikely that the source of styrene was the
OSB itself since styrene was not detected in the controls, nor is styrene typically used as an
adhesive in OSB. Styrene is a compound of potential toxicological significance as it is classified
as a possible human carcinogen (IARC 2002).
These results exemplify how the substrate can influence the production of fungal metabolites.
4.2.2.3 Cellulose insulation
A. versicolor and P. brevicompactum produced few volatile metabolites on cellulose insulation,
suggesting that cellulose insulation has poor nutrient value for these organisms. The strongly
cellulolytic organism S. chartarum, on the other hand, was able to synthesize a variety of
compounds ranging from ketones to aromatic compounds and terpenes. The detection of anisole
as a metabolite from S. chartarum on cellulose insulation is consistent with other reports. So
was the detection of trichodiene, a precursor to the production of the trichothecene mycotoxins.
4.2.2.4 Gypsum board
Just as we saw similarities between our results with pine OSB and pine wood, there were
similarities between the results with gypsum board and cellulose insulation. A. versicolor and P.
brevicompactum did not produce many volatile metabolites while growing on the paper facings
of the gypsum boards, with a small number of 2-ketones being detected. Once again, however,
S. chartarum, produced a variety of compounds, indicating that while the cellulosic materials
such as cellulose insulation and the paper facings of gypsum boards may not be ideal substrates
for A. versicolor or P. brevicompactum, they are preferred substrates for S. chartarum. The
results show the importance of the organism in determining the nature of VOCs that might be
emitted from contaminated materials.
77

4.2.2.5 Variability of volatile metabolites
In our results we observed that the production of volatile metabolites was sometimes transient
(e.g. 2-ketone production by P. brevicompactum on Southern Yellow pine and aspen OSB; 2-
pentanone production by A. versicolor on cellulose insulation). Even within an experiment there
was variability between test specimens. Time-dependent production of volatile metabolites and
variable reproducibility between experiments has been noted by others (Fiedler et al. 2001;
Schleibinger et al. 2002; Gao & Martin 2002; Gao et al. 2002).
4.2.2.6 Comparison with other studies
Several studies were located that looked at VOC production by organisms similar to ours (S.
chartarum, A. versicolor, and P. brevicompactum) on materials like wood (pine and spruce),
gypsum boards, cardboard, etc. (Ezeonu et al. 1994; Korpi et al. 1998; Korpi et al. 1999;
Wilkins 2000; Wilkins et al. 2000; Fiedler et al. 2001; Gao & Martin 2002; Gao et al. 2002;
Schleibinger et al. 2002; Wady et al. 2003; Wilkins et al. 2003). Of the VOCs reported in these
studies, few were found in our experiments (Table 4.1), reinforcing the fact that fungal
metabolites are indeed dependent on the specific organism-substrate interaction. There are
differences in metabolites produced even among strains of a particular organism.
Table 4.1: Comparison of the VOCs produced by similar organisms on similar building materials in reports in the literature and in our study. .
S. chartarum3 A. versicolor3 P. brevicompactumb
Number of VOCs reported in the literature0 27 35 9 Number of VOCs found in our experiments'1 8 18 16 Number of VOCs in common between our data and the literature
5 7 4
different strains than ours were used " no studies with P. brevicompactum alone - the only study located with P. brevicompactum used a mixture of organisms. c not including compounds such as unspecified terpenes d major peaks, not including compounds such as unspecified terpenes
4.2.2.7 Potential use of VOCs as identifiers of mould contamination
For a VOC to be useful as a marker of fungal presence, it should be reliably produced by a fungi
on different substrates but it should not have other sources. In our results, no one compound was
detected as a metabolite in all organism-substrate combinations. The 2-ketones were common,
with occurrences ranging from 4/14 of the combinations where growth and VOC production
78

occurred (2-nonanone) to 12/14 o f the combinat ions (2-pentanone). M o s t o f the other
compounds w e detected were produced by on ly one or two organism-substrate combinat ions.
Wessen and Schoeps proposed a list o f 23 V O C s o f un ique ly m i c r o b i a l o r i g i n ( J J M V O C s ) that
cou ld a id i n d iagnosing the cause o f "p rob lem bu i ld ings" (Wessen & Schoeps 1996). In our
results, o n l y 4 o f the 23 U M V O C s (2-hexanone, 2-heptanone, 2-nonanone, and d imethy l
disulf ide) were found among the compounds w e detected and identif ied. T h e occurrence o f
these four U M V O C s i n our experiments ranged f rom 3/14 o f the organism-substrate
combinat ions (d imethyl disulf ide) to 8/14 (2-hexanone). Others have also found that few o f
these U M V O C s were found i n their o w n experiments w i t h moulds o n var ious b u i l d i n g materials
(Gao & M a r t i n 2002; G a o et a l . 2002).
Thus, w i t h respect to the use o f V O C s as chemica l markers or fingerprints, the var iab i l i ty i n
volat i le metabolites w e have seen w i t h our control led condit ions and the heterogeneity o f
compounds found by others suggests that the use o f V O C profiles for fungal identif icat ion,
especial ly i n indoor air qual i ty investigations where variables m a y be mu l t i p l i ed , is s t i l l
impract ica l . It underscores the need for more data on metabolite profi les o f different organism-
substrate interactions. A s stated almost a decade ago: "...Several compounds may be useful as
indicators for mold growth undoubtedly depending on the specific substrate(s) and the
microbiological entities involved, but more detailed studies of VOC biosynthesis for indoor
molds under a variety of growth conditions, including building material substrates, are required
before indoor air analyses can be used effectively. " ( W i l k i n s & Larsen 1995)
4.3 Effects of borate preservatives
4.3.1 S o l i d w o o d
Pressure treatment o f Southern Y e l l o w and lodgepole pine sapwood w i t h d i s o d i u m octaborate
tetrahydrate to c o m m e r c i a l l y avai lable treatment levels was essential ly comple te ly effective at
preventing m o u l d g rowth over a 4 week per iod under our test condi t ions .
79

4.3.2 Wood composites
The visual scores and ergosterol results from experiments with the untreated pine and aspen
OSB suggest that aspen OSB is more susceptible to fungal attack than pine OSB, which is not
surprising since aspen is generally considered to be less resistant to fungal attack than softwoods
like pine (Laks et al. 2002).
However, treated aspen OSB performed better than treated pine OSB, with virtually no growth
occurring on the treated aspen boards while growth occurred on both the inoculated faces and
cut edges of treated pine OSB. These results are probably due to the higher zinc borate content
of the aspen OSB compared to the pine OSB (1.148% zinc borate versus 0.754% zinc borate).
The American Wood Preservers Association recommends treating OSB to a zinc borate
retention of 0.75% for protection against decay fungi and Formosan termites, and commercially
available OSB is treated to this level. Our results suggest that higher borate retentions may be
needed to improve the mould resistance of OSB.
Growth on the cut edges of the pine OSB may also indicate that the full thickness of the wood
flakes was not completely protected. Incorporation of zinc borate into the wood flakes along
with waxes and adhesives results in a surface treatment on each flake. However, zinc borate is
relatively insoluble, and even though wood flakes used in OSB are generally less than 1 mm
thick, unless the borates diffuse into the flake to provide protection throughout, the inside of the
flakes may be susceptible to mould attack. Note that oriented strandboard is usually edge-coated
at the time of manufacture to protect against edge swelling caused by moisture, which may
provide some protection against mould attack, but on construction sites, cut edges are rarely
coated or treated in any way.
Although growth of A. versicolor and P. brevicompactum was seen on the treated pine OSB, the
production of VOCs was reduced compared to the untreated pine OSB. The compounds
detected from growth on the treated pine OSB (mainly 2-ketones) were also detected in
untreated pine OSB and no new or unique compounds were detected on the treated OSB. These
results show that sub-inhibitory concentrations of borates did not stimulate the production of
new volatile metabolites, which suggests that the borates did not cause "stress metabolism" in
these two organisms.
80

4.3.3 Cellulose insulation
Boric acid treatment of cellulose insulation was completely protective against mould growth
under our test conditions. This was not surprising given the high levels of boric acid (13%) used
to impart the necessary fire resistance.
4.3.4 Gypsum board
Dose-response trends with increasing boric acid content were seen in all 4 parameters of growth
for each organism, notably for S. chartarum and P. brevicompactum since A. versicolor only
grew on the untreated gypsum boards. For S. chartarum and P. brevicompactum, visual growth
scores and carbon dioxide levels were significantly lower compared to untreated boards at a
boric acid concentration of 2 lbs/MSF. Ergosterol levels were also significantly lower at 2
Ibs/MSF for P. brevicompactum, but for S. chartarum, the difference was significant at 2.57
lbs/MSF.
The results also showed that the organisms differ in their sensitivity to borates. S. chartarum
was more resistant than P. brevicompactum, which in turn was more resistant than A. versicolor
with gypsum board as the substrate. However, S. chartarum's resistance to borates might differ
on less favorable substrates, and similarly, it is possible that P. brevicompactum and A.
versicolor might exhibit higher tolerances to borates on other substrates that they prefer,
pointing to the importance of considering organism-substrate interactions when testing
preservatives.
Boric acid also produced a dose-dependent suppression in the production of volatile metabolites.
As with the treated pine OSB, no new or unique metabolites were detected with sub-inhibitory
concentrations of boric acid compared to the untreated gypsum boards. In particular, boric acid
inhibited the production of trichodiene in a dose-dependent fashion. As trichodiene is a
precursor to trichothecene mycotoxins, from these results, it does not appear that the lower
doses of borates would result in increased trichothecene production as a result of stress
metabolism. However, actual analysis for trichothecenes would be necessary to confirm this.
4.3.5 Comparison with other studies
Our results are consistent with the work of others who have also tested the mould resistance of
borate-treated material. Fogel and Lloyd found that borates provided dose-related protection
81

against mould growth on solid wood, OSB, and gypsum boards exposed continuously to a
natural mixed inoculum (Fogel & Lloyd 2000; Fogel & Lloyd 2002). However, while we
observed almost complete inhibition of mold growth for most of our materials (Southern Yellow
pine, lodgepole pine, aspen OSB, gypsum boards with higher boric acid content), Fogel and
Lloyd found growth ranging from traces to light growth on their treated material, even at borate
retentions higher than our test material. The difference in results may be due to their use of
constant exposure to a natural inoculum, higher incubation temperatures, and for the gypsum
boards, longer incubation times.
Most recently, Micales-Glaeser et al. tested various preservatives (disodium octaborate
tetrahydrate, didecyl dimethyl ammonium chloride, and chlorthalonil, alone and in
combinations) against common indoor mould species on wood and gypsum board (Micales-
Glaeser et al. 2004). They found there were differences in the sensitivity to borates between the
species, with Cladosporium cladosporoides and P. brevicompactum being the most difficult to
control. They also found that the material had an effect, with mould growth being easier to
control on gypsum boards than on pine or aspen wood with the same borate treatments. While
the treatments and experimental conditions used in this study were quite different from ours, the
findings that mould growth and the performance of borate preservatives depend on both species
and material were consistent with our observations.
Neither study looked at metabolites, so an important aspect of our results was that as far as can
be determined from the volatile metabolites, borates inhibited mould growth and did not appear
to induce "stress metabolism". Reduced fungal growth was simply associated with reduced
VOC production.
4 . 4 . Use of different measures to assess fungal growth
4.4.1 Visual assessment and microscopy
Visual assessment allowed the determination between growth and no growth, as well as
allowing observation of time trends and dose-response trends. However, despite similar rating
scores, the materials varied in their actual appearance. Visual assessment was also somewhat
subjective as demonstrated by the different scores given by the independent volunteers during
the gypsum board experiments, and the intensity criteria used were arbitrary.
82

Various rating scales have been used in previous studies sometimes with vague criteria such as
"material only partially covered after 4 weeks" so that comparing studies can be difficult
(Nielsen et al. 1998; Nielsen et al. 1999; Viitanen & Bjurman 1995; Nikulin et al. 1994; Adan et
al. 1994; Wang 1993; Viitanen & Ritschkoff 1991). Visual assessment also forms the basis for a
number of standards that are used by industry (Adan et al. 1994; A S T M 1995; A S T M 2000;.
A S T M 2002; Canadian Gypsum Company 2003), but again, comparing between standards, and
between materials can be difficult.
Visual assessment with the unaided eye also missed some growth that was detected using
microscopy. We did a microscopic examination at the end of the incubation period, and in terms
of sensitivity, microscopy was probably as sensitive as any of the other measures we used (see
carbon dioxide and ergosterol below). Some researchers agree that macroscopic examination
alone might allow significant fungal colonization and sporulation to go undetected, especially
with light coloured organisms or i f the material itself is fibrous or difficult to see discoloration
on. Micales-Glaeser et al. found that samples that were even just slightly discoloured had large
spore loads that could potentially affect sensitive individuals (Micales-Glaeser et al. 2004).
However, as with macroscopic examination, describing microscopic growth quantitatively is
difficult. Photographs 5, 13, 15, 17, and 24 in Appendix J give examples of difficult to quantify
microscopic growth.
"Quantification of mold biomass by microscopy may be influenced by a high degree of observer
subjectivity and interference due to debris and fibers and can only be performed by trained
microbiologists. " (Reeslev et al. 2003).
4.4.2 Changes in the V O C profile
We observed two patterns of change in the VOC profile when mould growth occurred:
production of new compounds, and the disappearance of aldehydes. Both were useful as
measures of mould growth. However, while focusing on the production of specific V O C
metabolites might be used to monitor growth, given the dependency of metabolites on the
growth substrate and other environmental factors, predicting what compounds to focus on would
be difficult.
83

On the other hand, we observed a ubiquitous presence of aldehydes in all materials tested, and
consistently saw a decrease in these aldehydes when there was growth. The rate of decrease
seemed to correlate well with observed growth over time in several of our experiments (A.
versicolor on untreated pine OSB, S. chartarum and P. brevicompactum on gypsum board) and
followed the general dose-response trend seen with the varying levels of boric acid in the
gypsum board.
Aldehydes have been found in natural wood and in wood composites, although there is some
uncertainty over the source of these aldehydes (Baumann et al. 2000). The most likely source of
aldehydes is probably oxidation of fatty acids. Fatty acids make up a substantial proportion of
the extractives in wood (Leone & Breuil 1998). The source of the aldehydes in the cellulose f
insulation and the gypsum boards is also unclear, although it would be reasonable to speculate
that they are also the oxidation products of fatty acids.
The decrease in aldehydes with fungal growth on building materials, as well as on laboratory
culture media, has been observed by others. (Pasanen et al. 1998, Kiviranta et al. 1998, Claeson
et al. 2002) It has been suggested that growth of mould on building materials "restrained their
emissions" (Pasanen et al. 1998), and that, "according to some assumptions, microorganisms can
decrease airborne concentrations by presenting a diffusion barrier, providing a larger surface
area increasing vapor deposition or simply by depleting the compounds." (Korpi, Pasanen &
Viitanen 1999) However, we observed decreases in aldehydes when there was no growth on the
material itself but instead when there was contamination growing in the water of the chambers,
so it would appear that the fungi are catabolising the aldehydes.
We were able to use the decrease in aldehydes to monitor growth in our experiments, and this
may be applicable to similar laboratory experiments testing the fungal resistance of materials.
Monitoring the levels of aldehydes to diagnose mould growth in buildings, however, may be
impractical because other sources of aldehydes maybe present indoors that can confound
results.
4.4.3 Carbon dioxide
The carbon dioxide measurements agreed with the observations of visible growth, and in some
cases, were more sensitive than visual observation with the unaided eye. For example, CO2 was
elevated in the specimen of lodgepole pine that exhibited microscopic growth of P.
84

brevicompactum. Carbon dioxide was also elevated in one specimen of gypsum board
containing 5 lbs boric acid/MSF that exhibited microscopic growth of S. chartarum. The scatter
plot and regression line for CO2 versus visual score for S. chartarum on gypsum board showed
that there could be significant amounts of CO2 (and hence growth) on materials that did not
appear to be contaminated. On the other hand, carbon dioxide measurements did not capture the
microscopic growth of S. chartarum observed on a specimen of gypsum board containing 4 lbs
boric acid/MSF, so there are limits to the sensitivity of CO2 as a measure of fungal growth.
Note that C 0 2 levels measured in this study represented growth on all surfaces of the specimens,
growth that may have resulted from deposition of spores on the sides and reverse of the
specimens during inoculation or from spread of growth during the incubation.
In studies of mould growth on building material, rapid increases of carbon dioxide have been
reported beginning as early as day 2 of incubation (Pasanen et al. 1992). High levels, up to ~6-
7% (60,000-70,000 ppm) have been reported in studies with similar inoculated surface-to-
chamber volume ratios as ours (Korpi et al. 1998). Carbon dioxide measurements, especially if
they can be done serially, appear to be a useful tool to track mould growth on building materials,
yet it seems carbon dioxide has been used infrequently in published studies.
One potential drawback of using carbon dioxide as a measure of growth in studies using
building materials is that it may be subject to confounding by chemical reactions. We observed
that carbon dioxide levels from OSB were elevated, even for the borate-treated specimens where
there was no growth detected by other means and for the uninoculated controls. It could be
speculated that there may have been a chemical reaction that resulted in the generation of small
amounts of carbon dioxide, perhaps initiated by moisture. Conversely, Korpi et al. observed a
lack of elevated carbon dioxide when there was fungal growth on ceramic tile attached to
aggregate block (Korpi et al. 1998). They suggested that the carbon dioxide reacted with
calcium hydroxide in the aggregate block to form calcium carbonate and water.
A second drawback to using carbon dioxide as a measurement of mould growth is that carbon
dioxide levels did not necessarily correlate with fungal biomass. For example, P.
brevicompactum produced the highest average levels of carbon dioxide on gypsum boards at the
low end of the boric acid range, yet the ergosterol levels were the lowest of the three organisms.
This is also evident from the scatter plot of carbon dioxide versus ergosterol (Figure 3.49). A.
85

versicolor produced higher levels of CO2 on cellulose insulation than S. chartarum, but S.
chartarum produced more VOCs and about 8 times more ergosterol. It can be argued that in
terms of potential impact on health, fungal biomass is probably more important than carbon
dioxide production.
Thus, while carbon dioxide measurements can be useful for monitoring mould growth on
building materials, other measures may be needed to corroborate the results, and caution should
be applied in the interpretation of the results.
4.4.4 Ergosterol
The ergosterol results generally agreed well with other measures of growth. Ergosterol was also
fairly sensitive. Ergosterol was detected in a couple of specimens (P. brevicompactum on
lodgepole pine, S. chartarum on gypsum board at 4 lbs boric acid/MSF) where no growth was
seen with the unaided eye. Conversely, ergosterol measurements failed to detect growth of P.
brevicompactum on 4 specimens of gypsum boards that showed visible growth. The sampling
pattern we used may have had an effect on results: when growth was patchy, the arbitrary
sampling pattern we used may have missed isolated areas of growth.
Comparing ergosterol to visual assessment, the scatterplot and regression line for ergosterol
versus visual score at week 4 for S. chartarum on gypsum board showed that there could be
appreciable amounts of mould on materials that do not appear to be contaminated. Gutarowska
and Zakowska compared ergosterol measurements to propagule counts (determined by dilution
plating) for a variety of materials ("cellular concrete", plain gypsum-carton board, and painted
gypsum-carton board) (Gutarowska & Zakowska 2002). They developed a model that predicted
that ergosterol levels less than 1.92 mg/m2 (0.19 pg/cm2) corresponded to a "normal" level of
contamination without active growth on gypsum-carton board, while levels greater than 3.69 2 2
mg/m (0.37 pg/cm ) represented active growth with a high level of contamination. The y-
intercept from our regression line was 0.53 pg/cm2 for S. chartarum on gypsum board, with 4
specimens having > 1 ug/cm ergosterol given a visual score of 0.
The organism may have had an impact on our ability to detect ergosterol. In general, we found
that S. chartarum produced the highest levels of ergosterol for a given visual score or carbon
dioxide level. Ranking organisms in terms of ergosterol levels from cellulose insulation and
86

gypsum boards, the order was S. chartarum > A. versicolor > P. brevicompactum. F o r w o o d
products, ergosterol levels were higher for A. versicolor than for P. brevicompactum. Th i s
agrees w i t h the findings o f Pasanen et a l , who found that S. chartarum and A. versicolor had 10
to 30 times more ergosterol content o n a per-spore basis than P. brevicompactum. (Note that S.
chartarum has re la t ive ly large spores, but the d imensions o f A. versicolor and P.
brevicompactum spores are s imi lar . ) O n a dry-weight basis, S. chartarum and A. versicolor had
roughly twice the ergosterol content o f P . brevicompactum (Pasanen et a l . 1999). Thus , our
observation o f detectable ergosterol o n material that d i d not appear to have m o u l d growth (and
hence better sensi t ivi ty compared to v i sua l inspection) m a y o n l y be appl icable to certain
moulds , that is, those w i t h higher ergosterol content.
Is measuring ergosterol useful? N i e l s e n found that ergosterol was detectable even w h e n no
growth seemed to occur, especial ly on fibrous materials (N ie l s en & M a d s e n 2000; N i e l s e n et a l .
2004), but also stated that "no significant quantities o f biomass were o v e r l o o k e d " us ing
stereomicroscopy, and decided not to do further biomass determinations i n future experiments.
However , we do not k n o w i f the sma l l amounts o f ergosterol that w e found where there was
inv is ib le growth c o u l d become larger g iven enough t ime, so w e have to quest ion what is
"significant". Further, our results show that the ergosterol levels are not the same from one
material to another at a g i v e n v i sua l rating score (Figure 4.1). There is considerable variat ion i n
ergosterol measurements between organisms and materials g iven the same v i sua l score. A s
mentioned above, v i sua l assessments can be subjective, and there are diff icul t ies compar ing
results o f one study to another w h e n different rating systems are used. A n objective
measurement l ike ergosterol m a y help solve these problems.
87

Average +/- SD ergosterol for materials rated "3" at 4 weeks
3.5
II P. brevicompactum/southern yellow pine 0 A. versicolor/pine OSB • P.brevicompactum/aspen OSB • A.versicolor/aspen OSB • S. chartarum/gypsum board • P. brevicompactum/gypsum
Figure 4.1: Ergosterol measurements (average ±SD) for materials with a visual rating of "3 " at week 4.
Table 4.2 lists some of the advantages and disadvantages of the methods that we used. Overall,
no one measure stood out as being ultimately superior to the others for assessing mould growth.
In the end, deciding on what measures to use to assess fungal growth likely depends on the
questions to be answered. For determining fungal resistance (i.e. growth or no growth), visual
and microscopic examination will likely suffice. However, to compare one material to another
objectively, ergosterol measurements may be useful. To explore other aspects of mould growth
on building materials, other methods such as measuring and characterizing metabolites may be
necessary.
Table 4.2: Advantages and disadvantages of the different measurements offungal growth used in our study
Advantages Disadvantages Visual Simple, rapid, and inexpensive. Visual
assessment forms the basis of several testing standards. Can be done serially.
Visual assessment without microscopy may not be able to detect fine growth, such as the beginnings of growth, and may be difficult on dark or fibrous surfaces. Visual assessment may also be somewhat subjective, and is dependent on the training and experience of the examiner.
Microscopic Fairly sensitive and inexpensive. Allows better assessment of hyphal development and sporulation.
Can be time consuming. Removal of specimens from incubation vessels can upset environmental conditions, which can affect growth as well as make it difficult to collect other data (eg. VOCs) serially. If done serially, requires handling of specimens, which may lead to unwanted contamination. Might still miss some growth, although probably not significant amounts.

Changes in VOC pattern
Can be done serially. Decreases in aldehydes can be fairly sensitive.
Requires specialized equipment. Ability to indicate growth (sensitivity) can depend on the type and quantity of background VOCs, as well as VOC sampling and analysis techniques. Production of new compounds can be unpredictable. Aldehydes may not be present in all material, and decreases in aldehydes can also be caused by microbial contamination of the test chamber.
Carbon dioxide Relatively simple. Can be done serially with the right equipment.
May not be very sensitive, although our gypsum board results with S. chartarum indicated that carbon dioxide levels can be elevated even when no growth is seen.
Ergosterol Sensitive. Objective measure of fungal biomass, can be used to directly compare growth on one material to growth on another.
Requires extensive sample preparation and complicated analysis. Sensitivity can depend on how samples are obtained. Analysis is destructive, so serial sampling cannot be done.
4.5 Strengths and limitations of our study
4.5.1 Strengths
F e w other chamber studies o f m o u l d growth o n b u i l d i n g materials have looked at more than one
parameter o f g rowth or tr ied to compare them. Object ive measures o f fungal biomass such as
ergosterol have also been infrequently used i n conjunct ion w i t h other measures. W e found fair ly
good agreement w i t h the 4 different measures used, and the results revealed some advantages
and disadvantages o f each method.
Studies l ook ing at the effectiveness o f borate preservatives at prevent ing m o u l d growth on
commerc ia l ly avai lable b u i l d i n g products are few, and none o f the studies located have looked
at vola t i le metabolites or used ergosterol measurements. Thus our data p rov ide some objective
informat ion o n the effects o f borate preservatives o n more than one aspect o f fungal growth.
Las t ly , our experiments add to the experience us ing S P M E as a s imple , non-interfering method
for fungal V O C analysis, O u r results also add new data o n the V O C metabolites produced by S.
chartarum (3 new compounds) , A. versicolor (11 new compounds) , and P. brevicompactum (12
new compounds) w h e n these organisms grow o n b u i l d i n g materials.
89

4.5.2 Limitations
4.5.2.1 Methodology
4.5.2.1.1 Duration of experiments
Although 4 weeks was sufficient to demonstrate differences between treated and borate-treated
materials for A. versicolor and P. brevicompactum on all materials, and S. chartarum on
cellulose and gypsum boards, a longer incubation period may be necessary for experiments with
S. chartarum on wood. Two studies that found growth of S. chartarum on wood were located;
both were of 12 weeks duration, although neither stated how long it took before S. chartarum
growth was noticeable (Nikulin et al. 1994; Micales-Glaeser et al. 2004).
4.5.2.1.2 Visual assessment
Determining the surface area covered by growth was sometimes difficult, especially for fine
growth on fibrous materials like the paper coverings of the gypsum boards and the cellulose
insulation. The optics of the glass jars further hampered visual inspection so that the surface
area covered in mould from week to week could really only be estimated. Rating the severity of
growth was also somewhat subjective. Early sporulation of A. versicolor or P. brevicompactum,
with their light-coloured spores, may have been assigned scores of 1 (hyphal growth only)
instead of 2 (sporulation) due to inability to see spores that were actually present.
4.5.2.1.3 Measuring the volatile organic compound profile
The selection of the SPME fiber, the duration of sample extraction, and the gas chromatograph
operating parameters could have an effect on the number and types of VOCs detected. Wady et
al. reported that the Carbowax®/divinylbenzene coated SPME fiber gave the best extraction of
alcohols and ketones, and used that fiber in their studies of VOCs from mould-contaminated
materials (Wady et al. 2003). However, the Carboxen®/PDMS SPME coating we used is
recommended as a good all-purpose coating for a variety of compounds. We compared the
performance of the Carboxen®/PDMS fiber to the Carbowax®/divinylbenzene with actual test
specimens, and found the Carboxen®/PDMS to be better (Appendix E).
Exposing the SPME fiber for longer periods would have resulted in increased sorption of
compounds from the chamber headspace, especially compounds with higher boiling points
(Appendix F). The 30-minute SPME extraction time was chosen as a compromise between
convenience and sensitivity.

The high background levels of VOCs from the wood and wood composites necessitated using a
split injection method of sample introduction into the gas chromatograph to avoid some very
broad, overloaded peaks. Split injection means that only a fraction of the sample is actually
deposited onto the column, the remainder being vented away. This reduces the sensitivity of the
method, so that some volatile fungal metabolites that were produced in small quantities may
have gone undetected.
4.5.2.1.4 Carbon dioxide
Some dilution of the atmosphere within the chambers would have occurred while taking the
carbon dioxide readings, so the reported values are only approximations. The instrument was
calibrated using available calibration gas that was only -1000 ppm, and linearity of the response
through the instruments' entire range (0-6000 ppm) was assumed. Also, carbon dioxide levels in
26 of 102 of the test specimens exceeded the range of the Q-Trak® monitors used, so no
estimates of the actual carbon dioxide levels for these specimens can be made.
4.5.2.1.5 Ergosterol
Samples of the materials (taken from each corner and the center of the inoculated face) rather
than the entire specimens were used for ergosterol analysis. Since only 5 square centimeters
from the inoculated face of the woods, OSB, and gypsum boards were used (representing
roughly 6% or 10% of the inoculated surface), the sensitivity would be decreased. Such
sampling may have also introduced bias into the ergosterol results. For example, the sampling
pattern chosen missed areas of growth, as was the case for specimens of gypsum board
inoculated with P. brevicompactum, which could result in artificially low results. However,
using the entire inoculated surface would have required the use of excessive amounts of solvents
and extensive sample preparation time.
4.5.2.2 Generalisability of our results
4.5.2.2.1 Interactions between organisms and substrates
Our results show that the growth of moulds and the production of their metabolites are
dependent on the substrate. It is clear then that the main limitations to the generalisability of our
study are that we studied only a few organisms on a few materials under specific conditions.
91

A d d i t i o n a l l y , the growth and V O C patterns found m a y not be representative o f the organisms
tested on materials under different environmental condi t ions, or w h e n they grow as m i x e d flora.
F o r example, m o u l d g rowth i n a b u i l d i n g can occur on interior surfaces, but often also occurs i n
enclosed spaces wi thout exposure to light. The test specimens i n this study were exposed to
normal ambient l i gh t ing condi t ions - a combina t ion o f dayl ight w i t h seasonal var ia t ion, and
fluorescent l ight ing . It is poss ib le that exposure to l ight m a y have had an effect o n the growth o f
the moulds , and c o u l d have affected the volat i le organic compound metaboli tes formed.
A l s o , i n natural systems a variety o f organisms co-exist o n substrates and there is b io log i ca l
succession where the f lora changes w i t h t ime and changing condi t ions. T h e potential for
antagonistic or synergistic effects o f m i x e d flora on the growth o f mou lds o n b u i l d i n g materials
and the metabolites formed was not evaluated i n this study.
4.5.2.2.2 Effectiveness o f borate preservatives
O u r results showed that borates at commerc ia l ly used treatment levels have an inh ib i to ry effect
on m o u l d growth under specif ic laboratory condit ions. Howeve r , caut ion is necessary i n
extending the results to other situations, such as the condit ions that b u i l d i n g materials w o u l d be
subject to i n actual use. Other moulds m a y have different sensit ivit ies to borates, and as
mentioned above, the resistance o f borate-treated materials to m i x e d f lora m a y differ.
4.6 Future directions
4.6.1 M y c o t o x i n analysis and b io log i ca l act ivi ty o f spores and fungal fragments.
W e found that the vola t i le metabolites are influenced by the growth substrate. Whether the
product ion o f other metabolites such as toxins, and whether the b i o l o g i c a l ac t iv i ty o f spores and
fungal fragments is also inf luenced b y the growth substrate remains to be seen.
O u r results also show that borates inhibi t the product ion o f vola t i le metabolites and do not
stimulate the product ion o f different volat i le compounds. Con f i rma t ion that borates do not
stimulate product ion o f toxins or enhance the b io log ica l act ivi ty o f spores is required.
92

4.6.2 Long-term performance of borates
Since moisture problems in buildings may go undetected for some time, the long-term
performance of borates needs to be investigated. We observed some growth of S. chartarum and
P. brevicompactum on gypsum board containing 2 lbs boric acid/MSF that was delayed, both in
terms of the visual appearance as well as in the effects on the V O C profile. It would be
interesting to know the extent to which these organisms could grow at these higher borate
concentrations, given enough time.
4.6.3 Different environmental conditions
The effects of varying moisture levels on the growth of our moulds on the building materials,
and the performance of the borates at different moisture levels remains to be determined. We
might reasonably expect even less growth and volatile metabolite production at lower moisture
levels (Viitanen & Bjurman 1995; Nielsen et al. 2004). However, a report that decreased water
activity led to decreased growth (mm/day) but significantly increased toxin production by
Fusarium spp. on wheat treated with low levels of fungicides should make us cautious.
"Environmental stress factors, particularly water availability and temperature, and low
fungicide doses may stimulate mycotoxin production (in Fusarium). " (Magan et al. 2002).
Thus the combined effects of different temperatures, moisture levels, and the presence of
borates need to be examined.
4.6.4 Effects of accumulation of carbon dioxide and VOCs
Some of our specimens had carbon dioxide levels that exceeded the measurement range of the
instruments we used (6000 ppm or 0.6%), so we do not know how high carbon dioxide levels
were in these specimens. We did not explore whether CO2 accumulation may have had an effect
on mould growth and metabolism. Nilsson et al. found that the V O C profile for Penicillium
species differed when the culture was grown in a Petri dish with no air flow compared to the
same culture grown in a specially designed flow-through system (air flow 5 mL/min) (Nilsson
1996). When grown in a Petri dish, the metabolites were mainly small alcohols, ketones and
esters, while in flow-through equipment, terpenes were the main metabolites. Insufficient
information was found on whether other species are likely to be affected by oxygen and carbon
dioxide conditions. In our experiments, the carbon dioxide levels attained did not prevent the
93

formation of terpenes by S. chartarum, but whether or not A. versicolor (which has been
reported to produce terpenes on building materials in other studies) or P. brevicompactum
would have produced terpenes or other metabolites under different conditions remains
unknown.
The effect of V O C metabolite accumulation on further V O C metabolite production remains
unknown in our test system. VOCs can affect various aspects of mould growth, such as spore
germination and mycelial growth, and also production of new VOCs. (Wilkins et al. 1995).
Miranda tested the effects of various VOCs, alone and in paired combinations, on the
production of V O C metabolites in A. niger and P. viridicatum, and found variable metabolite
production depending on the VOC(s) tested (Miranda 2001). This indicates that the effects of
VOC accumulation in our system may have effects that can only be determined by actual
testing.
4.6.5 Tests of materials under in-use conditions
While we found that commercial borate treatments were generally effective in preventing or
inhibiting mould growth in the lab, the true test would be to study these materials under
conditions more similar to in-use conditions - in combination with each other as in wall
assemblies, for example, and subject to inoculation with mixtures of organisms.
4.6.6 Toxicity of V O C metabolites
While we did not quantify the VOCs produced, we did find ample production of certain
compounds, including some that may have toxicological significance such as styrene and 2-
hexanone, so further research may look at the potential for toxic effects from fungal VOCs.
Further work may also include refinement of the experimental methods, such as optimizing
VOC sampling and analysis.
4.6.7 Mechanism of resistance to borates
Different sensitivities to boric acid were observed between the organisms on gypsum board.
Further elucidation of the mechanism of borates, or the mechanisms of mould resistance to
borates, may help to optimize preservative treatments.
94

5. Conclusions
Our results support that mould-substrate interactions influence mould growth on building
materials and the types of volatile metabolites that are produced. Building materials differ in
their ability to support mould growth, and organisms produce different metabolites depending
on their growth substrate. One of the difficulties in establishing causal roles for mould growth
and certain health effects may be linked to the variability in mould biology as a result of mould
interactions with their growth substrate. Gaining an understanding of these interactions may
help answer some of the questions surrounding the potential health effects of moulds growing in
indoor spaces. However, given the numerous other variables that need to be considered, much
more work needs to be done.
In the meantime, steps need to be taken to prevent mould growth indoors. Moisture control is
the key, but we have provided evidence that borate preservatives at levels currently found in
commercially available building materials offers some protection against mould growth.
Pressure treatment of solid wood with disodium octaborate tetrahydrate to a retention of 0.42
pcf was very effective at preventing mould growth on Southern Yellow pine and lodgepole pine.
Oriented strandboard, however, may benefit from higher treatment levels with zinc borate than
the current standard of 0.75% zinc borate. The high levels of boric acid used to make cellulose
insulation fire-resistant were protective against mould growth as well, as expected. Boric acid
incorporated into the gypsum slurry of gypsum boards had a dose-dependent protective effect,
with substantial effects against S. chartarum (the most resistant species in the tests with gypsum
board) at boric acid loadings of 2 to 2.57 lbs per thousand square feet.
Our results also suggest that borates inhibit mould growth without causing shifts in metabolism
and the production of different metabolites. However, our results may not predict how borate-
treated materials will perform under actual in-use conditions, and studies are needed to
determine the effects of borates on toxin production and the biological activity of mould spores.
Finally, our simple test system and use of different measures to asses mould growth shed some
light on potentially useful methods for monitoring mould growth on building on materials in the
laboratory. Visual assessment was subjective, and if used alone may result in some mould
growth being missed. Microscopy, changes in the VOC profile, carbon dioxide measurements,
95

and ergosterol measurements each had their advantages and added useful information, but none
stood out as being superior to the others.
Further work needs to be done in the area of assessing mould growth, both in the laboratory as
well as in the field. Some of the measures used in this study have limited utility in assessing
mould growth in studies of actual buildings. Measuring carbon dioxide and the VOC profile, for
example, can be confounded in the field by non-fungal emissions of CO2 and VOCs. However,
the test system and protocols developed for this study could be adapted to study other materials
and preservatives in the laboratory. Future studies of mould growth on building materials should
attempt to use objective measures of mould growth. Standardization of measures will help
researchers collaborate and share data to advance our understanding of this complex problem.
96
References
A d a n , O . C . G . , Samson , R A . , Wi jnen , J . T h . M . 1994. ' F u n g a l resistance tests: a proposed method for testing resistance o f interior finishes', i n Health Implications of Fungi in Indoor Environments, eds R A . Samson, B . Flannigan, M . E . F lann igan , A . P . Verhoeff , O . C . G . A d a n , & E . S . Hoeks t ra , E lsevier , Amste rdam, pp. 415-437.
A m m a n n , H . A . 1999, ' M i c r o b i a l volat i le organic compounds ' , i n Bioaerosols: Assessment and Controlled J . M a c h e r , A m e r i c a n Congress o f Governmenta l Industrial Hygienis ts , C inc inna t i , O H , pp. 26.1 - 26.17.
Andersen , B . , N i e l s e n , K . F . & Jarvis B . B . 2002, 'Character iza t ion o f Stachybotrys from water-damaged bui ld ings based o n morphology, growth, and metaboli te p roduc t ion ' , Mycologia, v o l . 94, pp. 392-403.
Argus t , P . 1998, 'D i s t r i bu t ion o f boron i n the environment ' , Biological Trace Element Research, v o l . 66, pp. 131-143.
A S T M . 1994, A S T M Standard D 4933-91. Standard guide for cond i t ion ing w o o d and w o o d -based materials. A m e r i c a n Socie ty for Test ing and Mater ia l s , Wes t Conshohocken , P A .
A S T M . 1995, A S T M Standard D 3274-95. Standard test method for evaluat ing degree o f surface disf igurement o f paint films by mic rob i a l (fungal or algal) g rowth or s o i l and dirt accumulat ion. A m e r i c a n Socie ty for Test ing and Mater ia l s , Wes t Conshohocken , P A .
A S T M . 2000, A S T M Standard D 3273-00. Standard test method for resistance to growth o f m o l d on the surface o f interior coatings i n an environmental chamber. A m e r i c a n Socie ty for Test ing and Mate r ia l s , Wes t Conshohocken , P A .
A S T M . 2002, A S T M Standard G-21-96 . Standard practice for de termining resistance o f synthetic po lymer i c materials to fungi. A m e r i c a n Socie ty for Tes t ing and Mater ia l s , Wes t Conshohocken , P A .
A T S D R A g e n c y for T o x i c Substances and Disease Regis t ry . 1992, Toxicological profile for boron and compounds, U . S . P u b l i c Hea l th Service , At lan ta , G A .
Baker , C , W i l s o n , C , M c F a r l i n g , S., M o r r i s , P . 2000, 'Pressure treatment o f Canadian S P F w i t h heated borate solut ions, ' Proceedings of the 21st Annual Meeting of the Canadian Wood Preservation Association, October 2000, Mon t r ea l , Q C , pp. 69-77.
Barrett, D . 1998, The renewal of trust in residential construction. Commission of inquiry into the quality of condominium construction in British Columbia. A v a i l a b l e from URL:h t tp : / /www.qp .gov .bc .ca /condo / . Accessed 15/3/05.
Baumann , M . G . D . , Lorenz , L . F . , Batterman, S . A . , & Zhang , G - Z . 2000 , ' A l d e h y d e emissions f rom part ic leboard and m e d i u m density f iberboard products ' , Forest Products Journal, v o l . 50, pp. 75-82.
97

Becker, R. 1994, 'Fungal disfigurement of constructions - analysis of the effects of various factors, in Health Implications of Fungi in Indoor Environments, eds R. A . Samson, B. Flannigan, M.E . Flannigan, A.P. Verhoeff, O.C.G. Adan, & E.S. Hoekstra, Elsevier, Amsterdam, pp.361-378.
Block, S.S. 1953, 'Humidity requirements for mold growth', Applied Microbiology, vol. 1, pp. 287-293.
Budavari, S., O'Neil, M.J. , Smith, A. , Heckelman, P.E., & Kinneary, J.F. 1996, The Merck Index: An Encyclopedia of Chemicals, Drugs, & Biologicals - 12th Edition. Merck & Co., Inc., Whitehouse Station, NJ.
Burge, H.A., Ammann, H.A. 1999, 'Fungal toxins and |3-l->3-D-glucans', in Bioaerosols: Assessment and Control, ed J. Macher, American Congress of Governmental Industrial Hygienists, Cincinnati, OH, pp. 24.1 - 24.13.
Burge, H.A., Otten, J.A. 1999, 'Fungi', in Bioaerosols: Assessment and Control, ed J. Macher, American Congress of Governmental Industrial Hygienists, Cincinnati, OH, pp. 19.1-19.13.
Byrne, T. 1990, 'Recent research in boron treatment of Canadian wood species: stain and mold preventives', Proceedings of the First International Conference on Wood Protection with Diffusible Preservatives, November 1990, Nashville, TN. pp. 66-75.
Campbell, A.W., Thrasher , J.D., Madison , R.A., Vojdani, A. , Gray, M.R., et al. 2003, 'Neural antibodies and neurophysiological abnormalities in patients exposed to molds in water-damaged buildings', Archives of Environmental Health, vol. 58, pp. 464-474.
Canadian Gypsum Company. 2003, Moisture Control, available from U R L : http://www.cgcinc.com/pdf/MSDS/EWB W i l l MoistureCOMBO CP.pdf. Accessed 13/1/05.
Canada Wood Council. 2005, 'Green by design: Wood - the best choice for the environment', available from URL: http://www.cwc.ca/publications/brochures/green by design/wood.php. Accessed 15/03/05.
CDC. 1997, 'Update: Pulmonary hemorrhage/hemosiderosis among infants — Cleveland, Ohio, 1993-1996'', Morbidity and Mortality Weekly Report, vol. 46, pp. 33-35.
CDC. 2000, 'Update: Pulmonary hemorrhage/hemosiderosis among infants — Cleveland, Ohio, 1993-1996', Morbidity and Mortality Weekly Report, vol. 49, pp. 180-184.
Chang, J.C.S., Foarde, K . K . , & Vanosdel D.W. 1995, 'Growth evaluation of fungi (Penicillium and Aspergillus) on ceiling tiles', Atmospheric Environment, vol. 29, pp. 2331-2337.1995
Chang, J.C.S., Foarde, K . K . , & Vanosdel D.W. 1996, 'Assessment of fungal (Penicillium chrysogenum) growth on three H V A C duct materials', Environment International, vol. 22, pp. 425-431.
98

CIMA. 2005, Cellulose Insulation Manufacturers Association Website. Available from URL:http://www.cellulose.org. Accessed 15/3/05.
Claeson, A-S. , Levin, J-O., Blomquist, G., & Sunesson, A - L . 2002, 'Volatile metabolites from microorganisms grown on building materials', Proceedings: Indoor Air 2002, July 3, 2002, Monterey, C A , pp. 437-442.
Coppock, J .B.M. & Cookson, E.D. 1951, 'The effect of humidity on mould growth on construction materials', Journal of the Science of Food and Agriculture, vol. 2, pp. 534-537.
Elke, K., Begerow, J., Oppermann, H. , Kramer, U. , Jermann, E., & Duneman, L. 1999, 'Determination of selected microbial volatile organic compounds by diffusive sampling and dual-column GC-FTD - a new feasible approach for the detection of an exposure to indoor mould fungi?', Journal of Environmental Monitoring, vol. 1, pp. 445-52.
Environics Research Group. 2002, 'Ai r pollution: information needs and the knowledge, attitudes and behaviour of Canadians.' Available from URL: http://www.hc-sc.gc.ca/hecs-sesc/air qualitv/pdf/Environics_Air_Pollution_Survey_E.pdfhttp://www.hc-sc.gc.ca/hecs-sesc/airquality/pdf/Environics Air Pollution_Survev_E.pdf. Accessed August 2004.
Health Canada. 1995. Exposure Guidelines for Residential Indoor Air Quality: A Report of the Federal-Provincial Advisory Committee on Environmental and Occupational Health. Minister of Supply and Services Canada, Ottawa, ON.
Ezeonu, I. M . , Price, D. L. , Simmons, R. B., Crow, S. A . and Ahearn, D. G. 1994, 'Fungal production of volatiles during growth on fiberglass', Applied and Environmental Microbiology, vol. 60, pp. 4172-4173.
Fiedler, K. , Scutz, E., & Geh, S. 2001, 'Detection of microbial volatile organic compounds MVOCs produced by moulds on various materials', International Journal of Hygiene and Environmental Health, vol. 204, pp. 111-121.
Fogel, J.L. & Lloyd, J.D. 2002, 'Mold performance of some construction products with and without borates', Forest Products Journal, vol. 52, pp. 38-43.
Fogel, J.L. & Lloyd JD. 2000, 'Biological performance of gypsum products containing borates', International Research Group on Wood Preservation, Document No. IRG/WP 00-30237. IRG Secretariat, Stockholm, Sweden.
Frank, J .M. 1998, 'Special metabolites in relation to conditions of growth', in Chemical Fungal Taxonomy, eds. J.C. Frisvad, P.D. Bridge PD & D.K. Arora, Marcel K . Dekker, pp. 321-344.
Gao, P. & Martin, J. 2002, 'Volatile metabolites produced by three strains of Stachybotrys chartarum cultivated on rice and gypsum board', Applied Occupational and Environmental Hygiene, vol. 176, pp. 430-6.
99

Gao, P., Korley, F., Martin, J., & Chen, B.T. 2002, 'Determination of unique microbial volatile organic compounds produced by five Aspergillus species commonly found in problem buildings', American Industrial Hygiene Association Journal, vol. 63, pp. 135-40.
Gorny, R.L., Reponen T., Willeke, K. , Schmechel, D., Robine, E., Boisser, M . , & Grinshpun, S.A. 2002, 'Fungal fragments as indoor air biocontaminants', Applied and Environmental Microbiology, vol. 68, pp. 3522-3531.
Grant. C , Hunter, C.A., Flannigan, B., & Bravery, A.F. 1989, 'The moisture requirements of moulds isolated from domestic dwellings', International Biodeterioration, vol. 25, pp. 259-284.
Gravesen, S., Nielsen, P.A., Iversen, R., & Nielsen, K.F. 1999, 'Microfungal contamination of damp buildings - examples of risk constructions and risk materials', Environmental Health Perspectives, vol. 107, Suppl. 3, pp. 505-508.
Gray, M.R., Thrasher, J.D., Crago, R., Madison, R.A. , Arnold, L . , Campbell, A.W., et al. 2003, ' Mixed mold mycotoxicosis: immunological changes in humans following exposure in water-damaged buildings', Archives of Environmental Health, vol. 58, pp. 410-420.
Gutarowska, B., Zakowska, Z. 2002, 'Elaboration and application of mathematical model for estimation of mould contamination of some building materials based on ergosterol content determination', International Biodeterioration & Biodegradation, vol. 49, pp. 299-305.
Hardin, B.D., Kelman, B.J., Saxon, A. 2002, 'American College of Occupational and Environmental Medicine Evidence Based Statements: adverse human health effects associated with molds in the indoor environment'. Available from URL: http://www/acoem.org/guidelines/article.asp?ID==52. Accessed 11/02.
Heinsohn, P., Harney, S., Exuzides K . A . 2001, 'Sporulation of the hyphomycete Stachybotrys chartarum under three light conditions', in Bioaerosols, fungi and mycotoxins: health effects, assessment, prevention and control - updated and revised edition, ed E. Johanning, Fungal Research Group FRG, Inc., Albany, N Y , pp. 411-417.
Howe, P.D. 1998, A review of boron effects in the environment. Biological Trace Element Research; vol. 66, pp. 153-166.
Hubbard, S.A. 1998, 'Comparative toxicology of borates', Biological Trace Element Research, vol. 66, pp. 343-357.
Hutton, G.H. 2003, 'The way we build now', Archives of Environmental Health, vol. 58, pp. 505-511.
Hyvarinen, A. , Meklin, T., Vepsalainen, A., & Nevalainen, A. 2002, 'Fungi and actinobacteria in moisture-damaged building materials - concentrations and diversity', International Biodeterioration & Biodegradation, vol. 49, pp. 21-31.
100

IARC 2002. IARC Monographs on the Evaluation of Carcinogenic Risks to Humans: Styrene. Available from U R L : http://www-cie.iarc.fr/htdocs/monographs/vol82/82-07.html. Accessed 15/3/05.
Jarvis, B.B., Sorenson, W.G., Hintikka, E-L., Nikulin, M . , Zhou, Y . , Jiang, J., Wang, S., Hinkley, S., Etzel, R.A., & Dearborn, D. 1998, 'Study of toxin production by isolates of Stachybotrys chartarum and Memnoniella echinata isolated during a study of pulmonary hemosiderosis in infants', Applied and Environmental Microbiology, vol. 64, pp. 3620-3625.
Kalliokoski, P., Juutinen, T., Pasanen, P., & Pasanen, A - L . 1993, 'Fungal growth and activity on moist building materials', Proceedings of Indoor Air '93, vol. 4, pp. 299-303.
Karunesena, E., Markham, N , Basel, T., Cooley, J.D., & Straus, D.C. Evaluation of fungal growth on cellulose-containing and inorganic ceiling tile', Mycopathologia, vol. 150, pp. 91-95.
Kent, D.A., Willis, G.A. & Lepik K.J . (eds) 1997, Poison management manual, 4th edition, B.C. Drug and Poison Information Centre, Vancouver, BC.
Kiviranta, H. , Tuomainen, A. , Laitinen, S., Liesivuori, J., & Nevalainen, A. 1998, 'Qualitative identification of volatile metabolites from two fungi and three bacteria species cultivated on two media', Central European Public Health Journal, vol. 6, pp. 296-299.
Korpi, A. , Pasanen,A-L., & Pasanen,P. 1998, 'Volatile compounds originating from mixed microbial cultures on building materials under various humidity conditions', Applied and Environmental Microbiology, vol. 64, pp. 2914-2919.
Korpi, A. , Pasanen, A - L . , & Viitanen, H. 1999, 'Volatile metabolites of Serpula lacrymans, Coniophora puteana, Poria placenta, Stachybotrys chartarum and Chaetomium globosum\ Building and Environment, vol. 34, pp. 205-211.
Korpi, A. , Kasanen, J-P., Alarie, Y . , Kosma, V. , & Pasanen, A - L . 1999, 'Sensory irritating potency of some microbial volatile organic compounds M V O C s and a mixture of five . MVOCs ' , Archives of Environmental Health, 545:347-352.
Kurup, V . K . & Banerjee, B. 2000, 'Fungal allergens and peptide epitopes', Peptides, vol. 21, pp. 589-599.
Laks, P.E. & Manning, M.J. 1997, 'Update on the use of borates as preservatives for wood composites', in Proceedings of the Second International Conference on Wood Protection with Diffusible Preservatives and Pesticides, Forest Products Society, Madison, WI, pp.62-68.
Laks, P.E., Richter, D.L. & Larkin, G . M . 2002, 'Fungal susceptibility of interior commercial building panels', Forest Products Journal, vol. 52, pp. 41-44.
Leech, J.A., Nelson, W.C., Burnett, R.T., Aaron, S., & Raizenne, M.E. 2002, 'It's about time: A comparison of Canadian and American time-activity patterns', Journal of Exposure Analysis and Environmental Epidemiology, vol.12, pp. 427-432.
101

Leone, R., Breuil, C. 1998, 'Filamentous fungi can degrade aspen steryl esters and waxes', International Biodeterioration & Biodegradation, vol. 41, pp. 133-137.
Lloyd, J.D. 1997, 'International status of borate preservative systems', in Proceedings of the Second International Conference on Wood Protection with Diffusible Preservatives and Pesticides, Forest Products Society, Madison, WI, pp. 45-54.
Magan, N . , Hope, R., Colleate, A. , & Baxter, E.S. 2002, 'Relationship between growth and mycotoxin production by Fusarium species, biocides and environment', European Journal of Plant Pathology, vol. 108, pp. 685-90.
Manning, M.J. , Lloyd, J., Schoeman, M . 1997, 'The future of diffusible preservative and pesticide systems', in Proceedings of the Second International Conference on Wood Protection with Diffusible Preservatives and Pesticides, Forest Products Society, Madison, WI, pp. 157-168.
Masonry Canada. 2004, 'Fungal mould resistance testing (FMRT) of common building materials according to MIL-STD 810E', Available from URL: http://www.masonrycanada.ca/
Meklin, T., Hyvarinen, A. , Toivola, M . , Reponen, T., Koponen, V. , et al. 2003, 'Effect of building frame and moisture damage on microbial indoor air quality in school buildings', American Industrial Hygiene Association Journal, vol. 64, pp. 108-116.
Menetrez, M . Y . & Foarde, K . K . 2002, 'Microbial volatile organic compound emission rates and exposure model', Indoor and Built Environment, vol. 11, pp. 208-213.
Micales-Glaeser, J.A, Lloyd, J.D., & Woods, T.L. 2004. Efficacy of didecyl dimethyl ammonium chloride (DDAC), disodium octaborate tetrahydrate (DOT)) against common mold fungi. International Research Group on Wood Preservation Document Number IRG/WP 04-30338. Stockholm, Sweden, 14 pp.
Miller, J.D., Rand, T.G., Jarvis, B.B. 2003, 'Stachybotrys chartarum: cause of human disease or media darling?', Medical Mycology, vol. 41, pp. 271-91.
Miranda, V.R.D.J. 2001, The role of fungal metabolic by-products in indoor air chemistry: analytical considerations for the evaluation of poor indoor environments, PhD thesis, Georgia Institute of Technology.
Money, N.P. 2004, Carpet monsters and killer spores: a natural history of toxic mold, Oxford University Press, New York.
Mullins, E.J. & McKnight, T.S. (eds). 1981, Canadian woods: their properties and uses, third edition, Minister of Supply and Services Canada, Ottawa, ON, pp. 152-153.
Murtoniemei, T., Nevalinen, A. , Suutari, M . , & Hirvonen, M-R. 2002. 'Effect of liner and core materials of plasterboard on microbial growth, spore-induced inflammatory reponses, and cytotoxicity in macrophages', Inhalation Toxicology, vol. 14, pp. 1087-1101.
102

Murtoniemi, T., Nevalainen, A. , & Hirvonen, M-R. 2003, 'Effect of plasterboard composition on Stachybotrys chartarum growth and biological activity of spores,' Applied and Environmental Microbiology, vol. 69, pp. 3751-3757.
Murtoniemi, T., Hirvonen, M-R., Nevalainen, A. , & Suutari, M . 2003, 'The relation between growth of four microbes on six different plasterboards and biological activity of spores', Indoor Air, vol. 13, pp. 65-73.
NAS (National Academy of Sciences), Committee on Damp Indoor Spaces and Health. 2004, Damp indoor spaces and health, The National Academies Press, Washington, DC.
Nielsen, K.F. , Hansen, M.O. , Larsen, T.O., & Thrane, U . 1998, Production of trichothecene mycotoxins on water damaged gypsum boards in Danish buildings', International Biodeterioration & Biodegradation, vol. 42: pp. 1-7.
Nielsen, K.F. , Thrane, U. , Larsen, T.O., Nielsen, P.A., & Gravesen, S. 1998, 'Production of mycotoxins on artificially inoculated building materials', International Biodeterioration & Biodegradation, vol. 42, pp. 9-16.
Nielsen, K.F. , Gravesen, S., Nielsen, P.A., Andersen, B., Thrane, U . , & Frisvad, J.C. 1999, 'Production of mycotoxins on artificially and naturally infested building materials', Mycopathologia, vol. 145, pp. 43-56.
Nielsen, K.F. , Nielsen, P.A., & Holm, G. 2000, 'Growth of moulds on building materials under different humidities', Proceedings of Healthy Buildings, vol. 3, pp. 283-288.
Nielsen, K.F. , Madsen, J.O. 2000, 'Determination of ergosterol on mouldy building materials using isotope dilution and gas chromatography-tandem mass spectrometry', Journal of Chromatography A, vol. 898, pp. 227-234.
Nielsen KF . 2003, 'Mycotoxin production by indoor molds', Fungal Genetics and Biology, vol. 39,pp.l03-17.
Nielsen, K.F. , Holm, G., Uttrup, L.P., & Nielsen, P.A. 2004, 'Mould growth on building materials under low water activities. Influence of humidity and temperature on fungal growth and secondary metabolism', International Biodeterioration & Biodegradation, vol. 54, pp. 325-336.
Nikulin, M . , Pasanen, A - L . , Berg, S., Hintikka, E-L. 1994, 'Stachybotrys atra growth and toxin production in some building materials and fodder under different relative humidities', Applied and Environmental Microbiology, vol. 60, pp. 3421-3424.
Nilsson, T., Larsen, T.O., Montanarella, L., & Madsen, J.O. 1996, 'Application of head-space solid-phase microextraction for the analysis of volatile metabolites emitted by Penicillium species', Journal of Microbiological Methods, vol. 25, pp. 245-255.
NZ-DBH. 2005, New Zealand Department of Building and Housing Website. Available from: URL:http://www.building.govt.nz/. Accessed 15/3/05.
103

Pasanen, A - L . , Juutinen, T., Jantunen, M.J,, & Kalliokoski, P. 1992, 'Occurrence and moisture requirements of microbial growth in building materials', International Biodeterioration & Biodegradation, vol. 30, pp. 273-283.
Pasanen, A - L . , Kalliokoski, P., & Jantunen, M . 1994,'Recent studies on fungal growth on building materials', in Health Implications of Fungi in Indoor Environments, eds R.A. Samson, B. Flannigan, M.E . Flannigan, A.P. Verhoeff, O.C.G. Adan, & E.S. Hoekstra, Elsevier, Amsterdam, pp. 485-493.
Pasanen, A - L . , Lappalainen, S., & Pasanen, P. 1996, 'Volatile organic metabolites associated with some toxic fungi and their mycotoxins', Analyst, vol. 121, pp. 1949-1953.
Pasanen, A - L . , Korpi, A. , Kasenen, J-P., &. Pasanen, P. 1998, 'Critical aspects on the significance of microbial volatile metabolites as indoor air pollutants', Environment International, vol. 24, pp. 703-712.
Pasanen, A - L . , Yli-Pietila, K , Pasanen, P., Kalliokoski, P., & Tarhanen, J. 1999, 'Ergosterol content in various fungal species and biocontaminated building materials', Applied and Environmental Microbiology, vol. 65, pp. 138-142 .
Pasanen, A - L . , Kasanen, J-K., Rautila, S., Ikaheimo, M . , Rantamaki, J., Kaartinen, H. , & Kalliokoski, P. 2000, 'Fungal growth and survival in building materials inder fluctuating moisture and temperature conditions', International Biodeterioration and Biodegradation, vol. 46, pp. 117-127.
Plastic Pipe Institute. 2000, 'Resistance of thermoplastic piping materials to micro- and macro- biological attack', Plastic Pipe Institute. Available from U R L : http://www.plasticpipe.org/pdf/pubs/reports/TRl 1 -00.PDF. Accessed August 2004.
Rainer, J.B. 1993, 'Borates as wood preservatives - an environmental, health and safety perspective', IRG International Conference Proceedings Cannes 1993. pp. 60-76.
Reeslev, M . , Miller, J.D., & Nielsen, K.F. 2003, 'Quantifying mold biomass on gypsum board: comparison of ergosterol and beta-N-acetylhexosaminidase as mold biomass parameters', Applied and Environmental Microbiology, vol. 69, pp. 3996-3998.
Richold, M . 1998. Boron exposure from consumer products. Biological Trace Element Research 1998; 66: 121-9.
Robbins, C.A., Swenson, L.J., Neally, M.N. , Gots, R.E., & Kelman B.J. 2000, 'Health effects of mycotoxins in indoor air: a critical review', Applied Occupational and Environmental Hygiene, vol. 15, pp. 773-784.
Rose, C.S. 1999. Antigens, in Bioaerosols: Assessment and Control, ed J. Macher, American Congress of Governmental Industrial Hygienists, Cincinnati, OH, pp. 25.1-25.11.
Rylander, R. .1999, 'Indoor air-related effects and airborne l->3-B-D-glucan', Environmental Health Perspectives, vol. 107, Suppl. 3, pp. 501-503.
104

Rylander, R. 2001, 'Effects after mold exposure - which are the causative agents?', in Bioaerosols, fungi and mycotoxins: health effects, assessment, prevention and control -updated and revised edition, ed E. Johanning, Fungal Research Group FRG, Inc., Albany, N Y , pp. p. 28-31.
Samson, R.A. & Hoekstra, E.S. 1994,, "Common fungi occurring in indoor environments', in Health Implications of Fungi in Indoor Environments, eds R. A . Samson, B. Flannigan, M.E. Flannigan, A.P. Verhoeff, O.C.G. Adan, & E.S. Hoekstra, Elsevier, Amsterdam, pp. 541-587.
Samson, R.A. 1985, 'Occurrence of moulds in modern living and working environments', European Journal of Epidemiology, vol.1, pp. 54-61.
Saraf, A. , Larsson, L. , Burge, H., & Milton, D. 1997, 'Quantification of ergosterol and 3-hydroxy fatty acids in settled house dust by gas chromatography-mass spectrometry: comparison with fungal culture and determination of endotoxin by a Limulus amebocyte lysate assay', Applied and Environmental Microbiology, vol. 63, pp. 2554-2559.
Scharai-Rad, M . & Welling, J. 2002, Environmental and energy balances of wood products and substitutes, Food and Agricultural Organization of the United Nations, Rome. Available from: URL:http://www.fao.org/documents/show cdr.asp?url file=/DOCREP/004/Y3609E /v3609e00.htm
Schleibinger, H. , Brattig C , Mangier, M . , Samwer. H. , Laussmann, D., Eis, D. et al. 2002, 'Microbial volatile organic compounds M V O C as indicators for fungal damage', Proceedings Indoor Air 2002, p. 707-12 2002
Shusterman, D. 1992, 'Critical review: the health significance of environmental odor pollution', Archives of Environmental Health, vol. 47, pp. 76-87.
Small, B . M . 2003, "Creating mold-free buildings: a key to avoiding health effects of indoor molds', Archives of Environmental Health, vol., 58, pp. 523-527.
Strom, G., West, J., Wessen, B., & Palmgren, U . 1994, "Quantitative analysis of microbial volatiles in damp Swedish houses', in Health Implications of Fungi in Indoor Environments, eds R.A. Samson, B . Flannigan, M.E . Flannigan, A.P. Verhoeff, O.C.G. Adan, & E.S. Hoekstra, Elsevier, Amsterdam, pp.291-305.
Straus, D.C., Coley,J.D., Wong,W.,C, & Jumper, C.A. 2003, 'Studies on the role of fungi in sick building syndrome', Archives of Environmental Health, vol. 58, pp. 475-478.
Structural Board Association. 1996, Technical Bulletin: binders and waxes in OSB. Available from U R L : http://www.osbguide.com/pdfs/TBl 14.pdf. Accessed 15/3/05.
Structural Board Association. 2005, Technical Bulletin: negligible or non-existent formaldehyde emissions from OSB panels. Available from URL: http://www.osbguide.com/pdfs/TB102.pdf. Accessed 16/4/05.
105

Sunesson, A - L . , N i l s s o n , C - A . , Andersson , B . , & B lomqu i s t , G . 1996, ' V o l a t i l e metabolites produced by two fungal species cul t ivated on bu i ld ing materials ' , Annals of Occupational Hygiene, v o l . 40 , pp. 397-410.
T u o m i , T. , Re i ju l a , K . , Johnsson, T. , H e m m i n k i , K . , H i n t i k k a , E - L , et a l . 2000, ' M y c o t o x i n s i n crude b u i l d i n g materials f rom water-damaged bu i ld ings ' , Applied and Environmental Microbiology, v o l . 66, pp. 1899-1904.
Vi i t anen , H . 1991. Preservat ive effect o f cel lulose insula t ion material against some m o u l d fungi and b r o w n rot fungus Coniophora puteana i n pine sapwood. International Research Group o n W o o d Preservatives Document N u m b e r I R G / W P / 1 4 8 4 . S t o c k h o l m , Sweden , 9 pp.
V i i t anen , H , & B j u r m a n , J . 1995, ' M o u l d growth on w o o d under f luctuat ing humid i ty condi t ions , ' Material und Organismen, v o l . 29, pp. 27-46.
Vi i t anen , H . , & Ri t schkof f , A - C . 1991. M o u l d growth i n pine and spruce sapwood i n relation to air humid i ty and temperature. Swed i sh U n i v e r s i t y o f A g r i c u l t u r a l Sciences, Department o f Forest Products Report N o . 221. Uppsa la , Sweden , 52 pp.
W a d y , L . , Bunte , A . , Pehrson, C , & Larsson, L . 2002, ' G a s chromatography-mass spectrometry/solid phase microextract ion: a new technique for the ident i f ica t ion o f M V O C s from m o l d y b u i l d i n g materials. Proceedings: Indoor Air 2002, J u l y 3, 2002, Monterey , C A , pp. 414-419.
W a d y , L . , Bunte , A . , Pehrson, C , & Larsson, L . 2003, ' U s e o f gas chromatography-mass spectrometry/solid phase microext rac t ion for the ident if icat ion o f M V O C s from m o l d y bu i ld ing materials , ' Journal of Microbiological Methods, v o l . 52, pp. 325-332.
W a n g , Q . 1993, ' G r o w t h o f m o u l d and stain fungi i o n wood-based boards i n relat ion to temperature and relative h u m i d i t y ' , Material und Organismen, v o l . 28 , pp. 81-103.
Warsco , K . , & L indsey , P . F . 2003, 'Proact ive approaches for mold-free interior environments ' , Archives of Environmental Health, v o l . 58, pp. 512-522.
Wessen, B . & Schoeps, K - O . 1996, ' M i c r o b i a l volat i le organic compounds - what substances cane be found i n s ick bu i ld ings? ' , Analyst, v o l . 121, pp. 1203-1205.
Wessen B , H o n k a n e n J , M a l a r s t i g B . Mic roo rgan i sms , M V O C and the health complaints . Proceedings: Indoor Air 2002, J u l y 3, 2002, Monterey , C A , pp. 319-22.
W i l k i n s , K . & Larsen, K . 1995, ' V a r i a t i o n o f vola t i le organic c o m p o u n d patterns o f m o l d species f rom damp bu i ld ings ' , Chemosphere, v o l . 5, pp. 3225-3236.
W i l k i n s , C . K . , Larsen , S.T. , Hammer , M . , Poulsen, O . M . , W o l k o f f , P . , & N i e l s e n , G . D . 1998, 'Respi ra tory effects i n mice exposed to airborne emissions f rom Stachybotrys chartarum and impl ica t ions for r isk assessment', Pharmacology & Toxicology, v o l . 83, pp. 112-119.
106

Wilkins, K. , Larsen, K. , & Simkus, M . 2000, 'Volatile metabolites from mold growth on building materials and synthetic media', Chemosphere, vol. 41, pp. 437-446. 1998,
Wilkins, K. 2000, 'Volatile sesquiterpenes from Stachybotrys chartarum: indicators for trichothecene producing mold species?', Environmental Science and Pollution Research, vol. 7, pp. 77-78.
Wilkins K, Nielsen K F , & Din SU. 2003, 'Patterns of volatile metabolites and nonvolatile tricothecenes produced by isolates of Stachybotrys, Fusarium, Trichoderma, Tricothecium, and Memnonielld', Environmental Science and Pollution Research, vol. 10, pp. 162-6.
Wood WG. 1994, ' A n introduction to boron: history, sources, uses, and chemistry', Environmental Health Perspectives, vol. 102, Suppl. 7, pp. 5-11.
Zabel, R.A, & Morrell, J. J. 1992, Wood microbiology. Decay and its prevention. Academic Press, Inc., San Diego, C A .
107

Appendices
108

Appendix A - Conditioning materials
Cond i t i on ing o f the materials was necessary to give them sufficient in i t i a l moisture to support m o u l d growth. Me thods used i n other studies have included p l ac ing the material i n sealed chambers at h igh humid i ty , autoclaving, and p lac ing material i n imperv ious bags and adding an amount o f water calculated to g ive a specific moisture content. W e d i d not want to wet the material as this might result i n leaching or wash ing away o f surface borates or nutrients, so condi t ion ing at h igh humid i ty at r o o m temp was the most suitable method for our study. A n attempt was made to determine an appropriate condi t ion ing times for the b u i l d i n g materials. A standard method for cond i t ion ing w o o d and wood-based materials exists [ A S T M D 4933] . The procedures used i n our experiments were not as stringent as those out l ined i n the standard.
A . l S o l i d w o o d F u l l - s i z e d specimens were used; some specimens were oven dr ied for several days beforehand, others were condi t ioned "as i s . " Specimens were placed i n sealed chamber above a th in layer o f water and the weight was determined per iodical ly . After 14 days weight gain had begun to plateau (Figure A . l ) , and the total percentage weight gain was 22 -24% i n the oven-dried specimens, and 15-17% i n the "as i s " specimens, inc lud ing one lodgepole pine specimen. (Note: it was previous ly determined that "as i s " so l id lumber has about 6% moisture content at the storage condit ions inside the lab, so the "as i s " specimens w o u l d have gained 2 1 - 2 3 % moisture by weight had they been oven-dr ied as wel l . ) The fiber saturation point o f most woods is usual ly considered to be 2 8 % o n average, so our experimental ly determined weight gains fal l short o f this. However , some o f our specimens showed m o u l d growth dur ing this t ime, indicat ing that the w o o d surface at least was moist enough to support growth o f some m o u l d species. Note : The equ i l i b r ium moisture content [ E M C ] o f Canadian woods is l is ted as 23 .4% at 2 0 ° C and 9 6 % relative h u m i d i t y ( M u l l i n s & M c K n i g h t 1981). A S T M D 4933 lists the E M C o f so l id w o o d at 2 0 ° C to be 2 3 . 9 % at 9 5 % R H , and 26 .9% at 9 8 % R H ( A S T M 1994).
Solid lumber - hydration - percent weight gain
Figure A.l: Hydration (percent weight gain) of solid lumber over time. SYP1, SYP2, and SPF1 were conditioned
starting "as is" (estimatedstarting moisture content 6%): Oven SYP1, Oven SYP2, and Oven SYP3 were oven dried
-before conditioning, so their total weight gain from baseline (22-24%) is higher compared to the "as is" specimens
(15-17%).
109

A . 2 Or iented Strandboard ( O S B ) Oriented strandboard is a composi te material made o f flakes o f w o o d , adhesives, waxes , and other addit ives. M o i s t u r e sorpt ion curves for w o o d composites such as O S B , p l y w o o d and part icleboard are avai lable , but the t ime required to reach e q u i l i b r i u m w o u l d depend o n factors such as what type o f w o o d furnish was used, what additives were incorporated into the board, and poss ib ly o n the process ing parameters such as pressing t ime and temperature o f the board.
T o get an idea o f h o w long it might take to condi t ion our material , s m a l l test b locks (1- inch squares) cut f rom aspen O S B boards (Genics O S B ) were p laced i n a sealed beaker above a th in layer o f water. The weight gain was recorded per iod ica l ly and had s tabi l ized after about 10 days (Figure A . 2 ) .
It was later real ized that condi t ion ing times are dependent o n the d imens ions o f the specimens, so the cond i t ion ing t imes determined for the s m a l l test b locks w o u l d be m u c h shorter than what w o u l d be required for actual test specimens. However , it was felt that after 2 weeks o f condi t ion ing the surface o f the O S B , but not the deeper layers, w o u l d essential ly be at equ i l ib r ium w i t h the atmosphere [personal communica t ion , P . M o r r i s , For in tek Canada Corp . ]
OSB test blocks hydration - percent weight gain
20 n
18 4
Figure A.2: Hydration (percent weight gain) of aspen OSB test blocks over time. The test blocks used in this
experiment were 1-inch squares and would hydrate much faster than the full-sized OSB specimens (3.5 inches
square) used in our experiments.
A . 3 G y p s u m board G y p s u m board is a composi te material made o f mul t ip le layers o f paper facings sandwich ing a core o f gypsum, w h i c h contains various additives such as foaming agents, waxes , fire retardants, and re inforcing fibers. W h e n exposed to humidi ty , the paper facings w o u l d be expected to reach equ i l ib r ium q u i c k l y , but the core m a y take longer. Formulae for pred ic t ing the moisture content o f gypsum boards at certain relative humidi t ies exist, but no data o n h o w q u i c k l y gypsum board w o u l d reach e q u i l i b r i u m was located. Cond i t i on ing times for fu l l - s ized specimens (7 c m squares) were determined us ing the same procedures as above. W e i g h t ga in s tabi l ized after 9 days, and after 2 weeks some specimens were covered i n m o u l d . T h e percentage weight gain after 9 days at - 1 0 0 % relative humid i ty was about 5-6% (Figure A . 3 ) . It has been reported that a moisture content o f over 1.4% i n gypsum board is sufficient to a l l o w m o u l d growth.
110

Gypsum board hydration - percent weight gain
Figure A3: Hydration (percent weight gain) of gypsum board over time.

Appendix B - Preparation of fungal spore suspension
Materials and supplies: • filter funnel • micro-pipetters (1 mL and 100 uL) and • gauze sterile micro-pipetter tips • sterile transfer pipettes • beakers for liquid waste • sterile culture tubes ± glass beads • tube racks • sterile 15 mL centrifuge tubes • sterile inoculating loop • sterile water (+0.01% w/v Tween 80) • vortex mixer
• counting chamber
1. Sterilise filter funnel containing small plug of gauze.
2. Add several mL sterile water with 0.01% Tween 80 to media (agar plate, rice). Volume is not critical.
3. Gently agitate, stir or scrape with sterile inoculating loop to release spores.
4. Transfer suspension into culture tube containing glass beads and vortex to break up clumps.
5. Transfer suspension to sterile funnel containing sterile plug of gauze; filter into sterile centrifuge tube.
6. Centrifuge @ 3000 rpm x 5 minutes to pellet spores.
7. Remove supernatant, and resuspend spores in sterile water/Tween 80. Repeat x 2 (ie. centrifuge and resuspend 3 times, for a total of 3 washes).
8. Determine spore concentration with counting chamber. Adjust concentration to 107 spores/mL by adding appropriate amount of sterile water/Tween 80 to dilute, or i f concentration is less than 107 spores/mL, pellet spores again and resuspend in smaller volume of sterile water/Tween 80.
9. Prepare serial dilutions for plating (to check viability of spore suspension). Plate 0.5 mL of the final suspension (102) onto agar media.
spore concentration volume, spore susp volume sterile.water 103 100 uL ofTO7 9.9 mL 10J 100 uL of 10' 9.9 mL 102 lOOuLof 103 0.9 mL
If several inoculations with different organisms will be done during the week, spore suspensions may be made several days in advance and can be kept in the refrigerator (ASTM G21-96 states 4 days @ 3-10°C; A S T M C 739 states 7 days @ 2-10°C)
112

Appendix C - Air brush calibration and inoculation of samples
Materials and supplies: • Agar media plate (positive control) • timer • air compressor (Campbell Hausfeld
standard duty air compressor, model FP200400) with HEP A filter (Balston disposable filter cartridge 9933-05-BQ) attached to outlet with tubing (see picture)
airbrush (Aztek, part no. A430, with 0.40 mm general purpose nozzle) weigh scale (Sartorius BA110S) sterile forceps or tweezers for handling materials alcohol for sterilising propane burner beakers for waste
1. Calibrate airbrush to deliver ca. 100 uL over 10 seconds: a. Set compressor pressure to lowest setting (est. 5 psi). b. Allow air compressor and pressure regulator valve to warm up several
minutes (this also flushes the air line with filtered air). c. Connect airbrush. d. Fi l l airbrush reservoir with deionized water. e. Weigh and tare a small beaker. f. Spray (with airbrush at maximum flow) into beaker for 10 seconds (using a
timer), then weigh. Volume delivered is calculated using density of water (~ 1 g/mL).
g. Adjust air compressor pressure or adjust spray time so that volume delivered per spray is approximately 0.1 mL (100 uL).
h. Spray and weigh 10 times to calculate and average volume and a standard deviation. Repeat.
Eg-Weight (g) Weight (g)
1 .1018 .0984 2 .1072 .1188 3 .1187 .1265 4 .1027 .1043 5 .1157 .0945 6 .0995 .1088 7 .1035 .1168 8 .1265 .0960 9 .1172 .1085 10 .0852 .1097 Average .1078 .1077 SD .0119 .0105
Sterilize airbrush by spraying alcohol through it.
Drain reservoir and spray out excess alcohol from nozzle. Allow to dry. Rinse with sterile water.
Place incubation chambers with conditioned materials in biosafety cabinet.
113
2.
3.
4.

5. Steri l ise area i n biosafety cabinet (briefly flame surface).
6. R e m o v e test mater ial f rom jars and l ine up on steri l ised surface for inoculat ion. ( U n m a r k e d lumber shou ld be inoculated on convex side o f g rowth rings).
7. Spray control pieces w i t h sterile water /Tween 80 so lu t ion (sham inoculat ion) .
8. E m p t y reservoir and spray remain ing sterile water out o f nozz le .
9. Resuspend spore suspension and transfer some into airbrush reservoir. Spray some suspension into waste beaker to ensure airbrush is p r imed w i t h suspension.
10. Spray each test piece w i t h 100 u L spore suspension.
11. In between sets o f inoculat ions , spray agar media ( M E A or C M A ) plate w i t h spore suspension to check that the airbrush is p r imed and that the spore suspension is v iab le (posi t ive g rowth control) .
12. P lace inoculated test pieces back into incubation chambers.
13. A p p l y a smal l amount o f K Y Jelly® to the groove i n the l i d o f the chamber to help seal the chamber.

Appendix D - Sample desorption and carry-over
D . l Timed splitless mode Figure D . l shows a sample chromatograph and the SPME fiber run again after desorbing the sample (4 minutes). There is minimal sample carry-over (total peak area for the sample = 338544, total peak area for the SPME fiber post-sample = 1084).
1>A IAJUAMIJLJ
Figure D.l: GC-FID chromatograph for a gypsum board sample (top), and the SPME fiber run again after
desorption (bottom). There is minimal sample carry-over.
D.2 Split mode Figure D.2 shows a sample chromatograph and the SPME fiber run again after desorbing the sample (4 minutes). There is very little sample carry-over (total peak area for the sample = 587039, total peak area for the SPME fiber post-sample = 20317).
JU
Figure D.2: GC-FID chromatograph for a pine OSB sample (top), and the SPME fiber run again after desorption
(bottom). There is little sample carry-over (~3%).
115

Appendix E - Selection of the S P M E fiber coating
Different SPME fiber coatings will extract different types of analytes, depending on their chemical and physical properties. Some of the common coatings are summarized in Table E . l .
Table E.l: Some SPME fiber coatings. Fibers are available in a wide variety of coatings and coating thicknesses.
Consult the manufacturer's literature for more information on the range of coatings available and applications.
Fiber coating Characteristics Suitable for Polydimethylsiloxane (PDMS) Non-polar liquid phase, similar to GC
column coatings. Absorbs analytes. Volatile and semi-volatile compounds, non-polar high-molecular weight compounds
Polyacrylate Polar phase, resistant to solvents. Absorbs and desorbs analytes more slowly than other "liquid" phases.
Polar semi-volatile compounds
Carbowax® (CW) Moderately polar liquid phase, absorbs analytes.
Not available by itself - only available as a combination of Carbowax®/divinylbenzene (see below) or Carbowax® divinylbenzene templated resin.
Combining porous particles in liquid phases can alter the polarity of the coating, and broadens the range of molecular weights of analytes that can be extracted. Carbowax®/divinylbenzene (CW/DVB)
Divinylbenzene is a porous particle with primarily medium sized pores (20-500 angstroms) that adsorb analytes in the C6-C15 range and higher. Blending DVB with carbowax® increases the polarity of the coating.
Alcohols and polar compounds.
PDMS/Carboxen® Carboxen® 1006 is another porous particle that has an even distribution of pore sizes from micropores (2-20 angstroms) to macropores (>500 angstroms), suitable for a range of analytes in the C2-C12 range.
Gases, low-molecular-weight compounds
PDMS/DVB A combination coating that is less polar than Carbowax®/DVB.
Polar compounds, amines, and nitroaromatic compounds
SPME has been used for characterizing fungal volatiles in a small number of published studies. In the first study [Nilsson 1996], PDMS and polyacrylate fibers were used, with the fibers performing similarly in most respects, but with the polyacrylate fiber giving better sensitivity for polar compounds. In another study [Fiedler 2001], four different fibers were used (polydimethylsiloxane, polyacrylate, Carbowax®/divinylbenzene, and polydimethylsiloxane/Carboxen®) to capture a wide variety of volatiles. The relative merits and performance of the different fibers were not discussed.
Several studies involving SPME for microbial volatiles were presented at the 2002 Indoor Air conference in Monterey, California. A PDMS fiber was used to extract volatiles from house dust in one study [Nilsson et al 2002], but details on the type(s) of SPME fibers used in another study were not provided [Wessen 2002]. Another group of researchers reported that based on some experiments using aqueous mixtures of M V O C standards (alcohols and ketones) to determine the optimal extraction conditions for fungal volatiles from building materials, of the threee fibers tested (PDMS/Carboxen®, PDMS/DVB, or Carbowax®/DVB), the Carbowax®/DVB fiber was the best fiber [Wady et al 2002]. For extraction of MVOCs from actual building materials, they found that extraction at 70°C for 20 minutes was optimal. (These authors later published an
116

article stating that a " C a r b o w a x 5
fiber) [ W a d y e t a l 2003] . fiber was the best, probably mean ing the C a r b o w a x ® / D V B
A c c o r d i n g to technical informat ion from the manufacturer, the P D M S / C a r b o x e n ® fiber is the best al l -around fiber choice for low-molecu la r weight volat i le compounds across a range o f functional chemica l groups (alcohols, aldehydes, ketones, ca rboxy l ic acids, aromatic compounds) . T h e i r experiments found responses w i t h the P D M S / C a r b o x e n ® fiber to be more than 10 to 100 t imes that for other fibers for many o f the tested compounds w i t h molecular weights less than 90.
O u r lab already had P D M S / C a r b o x e n ® fibers available. Based o n the report b y W a d y et a l , w e compared the P D M S / C a r b o x e n ® fiber to the C a r b o w a x ® / D V B fiber for extract ing actual samples under our extract ion condit ions ( room temperature [ 2 1 - 2 2 ° C ] for 30 minutes). The results are shown i n F igu re E . 1. The P D M S / C a r b o x e n ® fiber was c lear ly better than the C a r b o w a x ® / D V B fiber under our extraction condit ions, i n agreement w i t h the manufacturer 's technical literature.
JLl
j u:\rayg projacl\aapenoifa_pen_ap(03130apr03\ttOsbl_pen_3Qapr03.run |
u'.Vays pro|acftaspenosb_pan_apr03mimay03\aosb1 jan_01rnaydvb.ru
Figure E.l: GC-FID chromatograms of the VOC profile for P. brevicompactum on aspen oriented strandboard,
comparing results from the Carboxen®/PDMS (75 urn coating thickness) fiber (top) to the Carbowax/DVB (70 urn
coating thickness) fiber (bottom) under the same extraction and analysis conditions. The Carboxen®/PDMS fiber
had much greater sensitivity for a broad range of compounds.
117

Appendix F - Extraction time An extraction time of 30 minutes was initially chosen out of convenience, since the gas chromatography analysis time was about the same including oven cycling time. It was also previously reported that 30 minutes was sufficient to establish equilibrium with fungal volatiles using a PDMS-coated fiber [Nilsson 1996]. We chose to stay with an extraction time of 30 minutes for convenience, although longer extraction times may have allowed us to detect less volatile and semi-volatile compounds with greater sensitivity.
Figure F. 1 shows the effect of varying extraction times under our experimental conditions. No significant qualitative differences were noted between 30 and 60 minutes, but increasing the extraction time to 120 minutes resulted in increased response for the less volatile compounds.
mVolts
7 5 -
50 —
25 —
0 —
mVotts
75 H
a a y* pioj nc i'g ypt ti nw< i p_ 3u;i03>2 SaugO iji ra «• tiyp-i _.
m Volts
7 5 -
mVotts
7 5 - j
jjiL
JlL.
UMrn*\|VL\j
Figure F.I: Effect of increasing extraction times. The sample was gypsum board. Extraction was with a
PDMS/Carboxen® coated SPME fiber at 21-22 <Cfor 15, 30, 60, and 120 minutes (top to bottom). Analysis was by
GC-FID with timed splitless injection. No significant qualitative differences were noted between 30, 60, and 120
minutes for the volatile compounds eluting before 15 minutes, but an increase in response for the less volatile
compounds eluting after 15 minutes is evident after extraction for 120 minutes.
118

Appendix G - Gas chromatograph parameters
G . 1 Gas chromatograph parameters
Var ious gas chromatograph parameters were tried before the methods were f inal ized, and some early data was col lec ted before the methods were op t imized . T h e biggest improvements i n chromatography performance was seen w i t h instal lat ion o f a c o l u m n designed for vola t i le compound analysis (Restek R t x - V M S ® ) and adjusting the c o l u m n temperature program.
Split versus splitless injection In gas chromatography, a sample can be del ivered i n its entirety to the c o l u m n , or part o f it can be diverted or spli t away before reaching the c o l u m n and vented out o f the gas chromatograph. The former is ca l led splitless inject ion and the latter is ca l led spli t inject ion. S P M E is intended for splitless inject ion, but because the w o o d specimens gave o f f h igh background levels o f V O C s , a split inject ion was used because otherwise some o f the peaks w o u l d be broad and overloaded w i t h poor separation. Spl i t injection resulted i n poor sensi t ivi ty w i t h the cel lulose and gypsum specimens, but splitless injection again led to broad, over loaded peaks. A t imed splitless injection program was used as a compromise between sensi t ivi ty and chromatographic separation.
Table G . 1 summarizes the gas chromatograph parameters for the various methods used for data col lec t ion. G C - F f D methods ( A ) and (C) were the final methods used to col lect most o f the data. G C - M S methods ( B ) and ( C ) were the final methods for G C - M S , a l though due to other demands for G C - M S analysis, it was always possible to analyse samples w i t h these methods, and samples were occas iona l ly analysed w i t h whatever c o l u m n and injector l iner were installed at the time.
Table G.l: Gas chromatography methods used in the study. GC-FID methods (A) and (C) were used to collect most
of the data. GC-MS (A) was used to collect the data from S. chartarum on Southern Yellow Pine.
G C - F I D GC-FID (A) GC-FID (B) GC-FID (C)
Carrier gas Hydrogen Hydrogen Hydrogen Column head 8 psi 8 psi 8 psi pressure Injector 260°C 260°C 260°C temperature Split valve Open Closed Closed x 0.2 minutes, then open Split flow rate 35 mL/min N/A 35 mL/min Column Restek Rtx-VMS Restek Rtx-VMS , Restek Rtx-VMS
30 m x 0.25 mm, 1.4 urn film 30 mx 0.25 mm, 1.4 urn film 30 m x 0.25 mm, 1.4 urn film thickness thickness thickness
Column 40°C for 4 minutes, then 40°C for 4 minutes, then 40°C for 4 minutes, then temperature increase to 140°C at 8°C/min, increase to 140°C at 8°C/min, increase to 140°C at8°C/min, program then increase to 200°C at then increase to 200°C at then increase to 200°C at
5°C/min, hold x 3.5 to 6.5 5°C/min, hold x 3.5 to 6.5 5°C/min, hold x 3.5 to 6.5 minutes (total runtime: 32 to 35 minutes (total runtime: 32 to 35 minutes (total runtime: 32 to 35 minutes) minutes) minutes)
Detector 220°C 220°C 220°C temperature
119

Detector settings Attenuation 4, detector range 12 (most sensitive)
Attenuation 4, detector range 12 (most sensitive)
Attenuation 4, detector range 12 (most sensitive)
Comments Final method for wood products (solid wood, OSB). A narrow-bore injector liner designed for SPME was used.
Broad, overloaded peaks. A narrow-bore injector liner designed for SPME was used.
Final method for cellulose insulation and gypsum board. A narrow-bore injector liner designed for SPME was used.
G C - M S GC-MS (A) GC-MS (B) GC-MS (C) '
Carrier gas Helium Helium Helium Column head 12 psi 8-10 psi 8-10 psi pressure Injector temperature 280°C 230°C 230°C Split valve Open Open Closed x 0.33 minutes, then
open Split flow rate ? 42-43 mL/min 42-43 mL/min Column Supelco PTE-5 Restek Rtx-VMS Restek Rtx-VMS
30 m x 0.25 mm, 0.25 um film 20 mx 0.18 mm, 1 umfilm 20 m x 0.18 mm, 1 um film thickness thickness thickness
Column temperature 35°C for 4 minutes, then 40°C for 4 minutes, then 40°C for 4 minutes, then program increase to 160°C at 10°C/min, increase to 140°C at 8°C/min, increase to 140°C at8°C/min,
hold x 2 minutes (total run time then increase to 200°C at then increase to 200°C at 18.5 minutes). 5°C/min, hold x 6.5 minutes
(total runtime: 35 minutes) 5°C/min, hold x 6.5 minutes (total runtime: 35 minutes)
Transfer line 280°C 285°C 285°C temperature Ion trap temperature 220°C 150°C 150°C Mass spectrometer Full scan 30-450 m/z Full scan 40-650 m/z Full scan 40-650 m/z settings Comments Poor separation with this Final method for wood Final method for cellulose
column and column products. A narrow-bore insulation and gypsum board. A temperature program. injector liner designed for
SPME was used, although sometimes analysis would have to be done with whatever injector liner and column was installed at the time.
narrow-bore injector liner designed for SPME was used, although sometimes analysis would have to be done with whatever injector liner and column was installed at the time.
120

Appendix H - Monitoring carbon dioxide production
A couple of studies have used carbon dioxide to monitor growth rate of mould [Pasanen 1992, 1994; Korpi 1998], but others have apparently used carbon dioxide levels simply as a check for sterility. [Pasanen 1996; Kalliokoski 1993]
Our initial goal was to monitor carbon dioxide levels each week. This would require that only small samples be taken from the chambers so that the concentration of volatile compounds within the chambers would not be altered significantly. The option of inserting or enclosing carbon dioxide sensors within the chambers was not feasible.
Gas chromatography was tried initially. Gas chromatography with a thermal conductivity detector (GC-TCD) is one of the standard methods used for monitoring carbon dioxide in the workplace, but our gas chromatography instruments lacked thermal conductivity detectors, so GC-MS was tried instead. Gas chromatography with mass spectrometry (GC-MS) is specified for monitoring carbon dioxide in the workplace if compound confirmation is required.
Carbon dioxide standards of 0, 249, 498, and 995 ppm were made by mixing appropriate volumes of a 995 ppm carbon dioxide calibration standard and zero air in Tedlar bags. 100 uL of each mixture were manually injected using a Gastight® syringe into the GC-MS, but poor reproducibility and non-linear calibration curves were obtained.
A MIRAN® infrared detector able to detect C02 at a wavelength of 4.3 um was also tried. The sampling cell was made into a closed loop and samples of 2 to 10 mL of calibration gas (995 ppm C02) were introduced into the closed sample loop, but this did not produce a detectable signal. Others have reported that aliquots of 50 to 100 mL are needed to produce an adequate signal [OSHA]; such volumes would have too large for our experimental set-up.
A hand-held Q-Trak® indoor air quality monitor with non-dispersive infrared detector was also tried. Introducing small samples (up to 10 mL) into the Q-Trak® sensor using the carbon dioxide calibration collar was not feasible since the sample was not large enough to fully flood the sensor chamber, and since the Q-Trak sensor is not completely enclosed some dilution was probably occurring during the sample reading.
Weekly monitoring of carbon dioxide was abandoned in favour of measuring the carbon dioxide levels once at the end of the incubation period. This involved purging the incubation chambers contents and feeding the contents to the Q-Trak® sensor, using the calibration collar.
To test the set-up, a 2-L incubation chamber was filled with carbon dioxide calibration gas (995 ppm) and evacuated with an SKC sampling pump at lL/minute, with the exhaust fed into the calibration collar of the Q-Trak®. The peak carbon dioxide reading was 94% (+2%) of the actual calibration gas concentration. The apparent reduced concentration inside the jars was due to dilution of the carbon dioxide by incoming room air. While this method would not be able to provide exact measurements of carbon dioxide inside the incubation chambers, it was felt that it would still provide useful data on carbon dioxide production and allow comparisons between samples.
121

Appendix I - Extraction and analysis of ergosterol
UBC School of Occupational and Environmental Hygiene (SOEH) Procedure for Analysis of Ergosterol in Air Filters, Fungal Biomass and Building Materials by GC/MS/MS
Creat ion Date: 02/15/03 M e t h o d V e r s i o n : S O E F £ - S O P # A . 0 0 . 0 2
1.0 Introduction
This procedure describes the sample extraction, preparation and analysis o f air sampl ing filters and bu i ld ing materials such as w o o d , insulat ion and gyproc for Ergos tero l b y Gas Chromatography/Mass Spectrometry ( G C / M S / M S ) . Th i s substance is a chemica l marker o f fungal biomass (spores and myce l ium) and can be detected i n air borne dust or b u i l d i n g materials.
A V a r i a n Saturn 2000 Ion Trap instrument operated i n the M S / M S mode is h igh ly sensitive and selective for the detection o f E r g o s t e r o l - T M S derivative (on c o l u m n 50-100 picograms) . The t r imethyls i ly l derivat ive o f Ergos tero l yie lds a unique mass spectrum and w i t h the mass spectrometer operated i n the M S / M S mode yields increased specif ici ty.
Ergosterol
C28H44O
M.W. = 396.665 (CAS # 57-87-4)
Precautionary Properties: A i r and L i g h t sensi t ivi ty (photo degradation)
Storage: Storage i n desicator i n dark cabinet.
122

7-DehydrochoIesterol (Internal Standard)
C27H44O
M.W. = 384.664 CAS # 67-97-0
Precautionary Properties: Air and Light sensitivity (photo degradation) Storage Recommendations: Storage in desicator in dark cabinet.
Stigmasterol (Surrogate)
C28H48O
M.W. = 412 CAS # 83-47-8
Precautionary Properties: Air and Light sensitivity (photo degradation) Storage Recommendations: Storage in desicator in dark cabinet.
Derivatization of Ergosterol Jnternal Standard and Surrogate
The derivatization of ergosterol, the internal standard and surrogate by BSTFA (bis(trimethylsilyl)trifluoroacetamide) forms trimethylsilyl derivatives that are amenable to chromatography/mass spectrometric analysis.

R x - OH + Pyridine + BSTFA > R x - O-Si (CH 3) 3
Where Rx-OH is underivatized Ergosterol, 7-Dehydrocholesterol or Stigmasterol (pyridine is a catalyst in the reaction)
The Electron Impact (E.I.) mass spectrum of ergosterol-TMS derivative is dominated by a m/z 363 ion (M-105, loss of the trimethylsilanol group and one methyl group). This ion is used to yield a product of m/z 157 ion for the quantification of the derivative in the MS/MS mode.
The internal standard, 7-dehydrocholesterol, yield a mass spectrum with the GC/MS operating in the full scan mode and acquiring the data in the range of m/z 315 to 375. This yields a base peak ion of m/z 351 for the internal standard that is used in the quantification of the ergosterol-TMS.
The surrogate (Stigmasterol) yields m/z 394 and is monitored with the GC/MS operating in the full scan mode.
Chemicals
Ergosterol - Sigma-Aldrich # E-6510 (lot 88H1343) - 90 % purity 7-Dehydrocholesterol - Sigma-Aldrich # D-4429 (lot 71K2510) - 93.4% purity Stigmasterol - Sigma-Aldrich # S4409 - 93 % purity BSFTA - (N)-bis(trimethylsilyl)trifluofoacetamde - Aldrich Cataloq No. 39,485-8 derivatization grade in 1.0 mL X 10 vials
Pyridine (ACS grade) - Fluka # 82702 - 99.8% purity Pentane (Pesticide grade) - Fisher Chemicals Pyrogen Free Water - prepared by BarnStead Mega Pure@System (ACS) Potassium Hydrohydroxide Pellets (ACS certified) - Fisher Chemicals # P250-1 Methanol (ACS grade) - Fisher Chemicals Toluene (ACS grade) - Fisher Chemicals
10% KOH/Methanol solution - prepared as weight percent (50 g K O H to 450 mLs of MeOH)
Glassware
8 mL pyrex cell culture tubes equipped with PTFE lined screw caps 2 mL disposable glass pipets 50 mL Amber Colored Volumetric Flask (Grade A) 25 mL Amber Colored Volumetric Flask (Grade A) 10 mL Amber Colored Volumetric Flask (Grade A) 5 mL Amber Colored Volumetric Flask (Grade A) Glass Chemical Storage Desiccator Apparatus:
Varian Saturn 2000 GC/MS/MS Varian Star 3400 GC
124

V a r i a n 8200 C X Autosample r
H e i d o l p h Roto M a x 120 M i x e r C a n L a b D r y B l o c k Heater - M o d e l H 2 0 2 5 Vor t ex M i x e r M i x II - T y p e 37600
Software
V a r i a n Saturn V i e w ™ V e r s i o n 5.51 Mic rosof t E x c e l - V e r s i o n 2000 Professional N I S T 9 8 M a s s Spectral Database
Stock Solution Preparations
Ergosterol
W e i g h and record precisely an amount o f ergosterol crystals into an a l u m i n u m boat. Th i s final amount can be i n the 0.01 to 0.02 grams range but must be recorded prec ise ly (0.0001 dec imal place). The final concentrat ion is corrected for the percent pur i ty as suppl ied b y S i g m a Chemica l s (90% yie lds a 0.90 correct ion factor). Transfer into a 50 m L amber co lored volumetr ic flask and top up to v o l u m e w i t h toluene. M i x w e l l and then transfer to storage vials (25 m L telfon capped via ls ) . T h e storage via ls are then wrapped i n a l u m i n u m f o i l to m i n i m i z e the effects o f l ight w h e n i n use. Store the stocks at - 8 0 ° C . The stocks must be labeled w i t h the date o f preparation, name o f the analyst and the
concentration calculated i n n g / u L . A w o r k i n g standard is prepared from this stock and then a set o f cal ibrat ion standards is prepared from the w o r k i n g standard.
7-Dehydrocholesterol (Internal Standard)
W e i g h and record precisely an amount o f 7-Dehydrocholesterol crystals into an a l u m i n u m boat. T h i s final amount can be i n the 0.01 to 0.02 grams range but must be recorded precisely (0.0001 dec imal place). The final concentration is corrected for the percent pur i ty as suppl ied by S i g m a Chemica l s (93.4% yie lds a 0.934 correct ion factor). Transfer into a 25 m L amber colored volumetr ic flask and top up to vo lume w i t h toluene. M i x w e l l and then transfer to a storage v i a l (25 m L telfon capped v ia l ) . The storage vials are then wrapped i n a l u m i n u m fo i l to m i n i m i z e the effects o f l ight w h e n i n use. Store the stock solu t ion i n the - 8 0 ° C freezer.
T h e stock must be labeled w i t h the date o f preparation, name o f the analyst and the concentration i n ng /uL .
Stigmasterol (Surrogate)
W e i g h and record precisely an amount o f St igmasterol crystals into an a l u m i n u m boat. Th i s final amount can be i n the 0.01 to 0.02 grams range but must be recorded prec ise ly (0.0001 dec imal place). The final concentration is corrected for the percent pur i ty as suppl ied b y S i g m a Chemica l s (93%o yie lds a 0.90 correct ion factor). Transfer into a 25 m L amber co lored volumetr ic flask and top up to v o l u m e w i t h toluene. M i x w e l l and then transfer to a storage v i a l
125

(25 mL telfon capped vial). The storage vial is then wrapped in aluminum foil to minimize the effects of light when in use. Store the stock solution in the -80° C freezer.
The stock must be labeled with the date of preparation, name of the analyst and the concentration in ng/uL.
Working Internal Standard/Surrogate Standard Preparation
Working standard (Internal Standard and Surrogate) is prepared by dilution of each stock into a single 25 mL volumetric flask.
Remove the stock solutions (internal standard and the surrogate) from the -80° C freezer and warm to room temperature. Examine the solutions for undissolved crystals and gently warm and handshake to re-dissolve.
Transfer a volume (uL) of each stock solution into a 25 mL volumetric flask to prepare the working standard in the 60.0 ng/uL range. After transfer, top up the volumetric with toluene.
Calculate the concentration of the internal standard and surrogate working standard as such:
[Working Std] = [ISTD/Surrogate Stock Soln] x Transfer Vol(ul)/25mL x 1000
(units are ng/uL)
Each sample and calibration standard is spiked with the working solution prior to the extraction procedure or standard preparation.
Ergosterol Working and Calibration Standards Preparation
Working Ergosterol standard is prepared by dilution of the stock and the calibration standards are prepared from this working standard:
1) Remove the stock solution from the -80° C freezer and warm to room temperature. Examine the solution for undissolved crystals and gently warm and handshake to re-dissolve.
2) Transfer a volume (uL) of the stock solution into a 25 mL or suitable volumetric flask to prepare the working standard (TABLE 1 example). This transfer volume can be altered
126

to a "target concentration" so that the calibration standards can be in a desired range. After transfer, top up the volumetric with toluene.
3) Calculate the concentration of the working standard as such:
[Working Std] = [Erg Stock Solution] x Transfer Vol(ul)/25mL x 1000
(units are ng/uL)
4) The calibration standards (STD-A-1 to 9) are prepared in glass 8 mL culture test tubes from a working standard as outlined in example T A B L E 1.
5) The transfer volume (uL) from the working standard can be altered to meet a "target calibration" range as desired by the analyst. The final concentrations of the calibration standards are calculated as follows:
[Std-A-1 to 9] = uL transferred to test tube x [Working Std]/Final Volume
a. units are in ng/ul
b. final vol (ul) is the total volume (uL) of derivatization reagents and re-constitution solvent (toluene) spiked into the tube (15 + 50 + 500 ul = 565 ul)
6) Each calibration standard is spiked with 50 uL of the internal standard/surrogate working standard prior to derivatization.
7) The solvent in each calibration standard is evaporated to dryness under a stream of nitrogen gas. The evaporation process can be enhanced with the tubes placed in a warm water bath.
8) Each calibration standard is spiked with derivatization agents (15 uL of neat pyridine and then 50 uL of BSTFA). Cap tightly and immediately vortex each tube. Transfer to the dry block heater and heat to 60° C for 30 minutes.
9) Cool the tubes and add 500 uL of toluene (re-constitution solvent) or an appropriate volume. Vortex and transfer the contents to GC vials and run on the GC/MS/MS.
127

T A B L E 1
Working Std Calibration Std Final Amount
Calibration Standard
Transfer Volume (ul)
Volumetric Flask Size
Working Std Cone*
Transfer Volume (uL) into
Spike Amount
with Re-constitution
Solvent of Stock Solution
(mL) (ng/uL) test tube (ng) (ng/uL)
Std-A-1 645 25 5.670 5.000 28.35 0.052 Std-A-2 645 25 5.670 10.000 56.70 0.100 Std-A-3 645 25 5.670 15.000 85.05 0.150 Std-A-4 645 25 5.670 25.000 141.76 0.251 Std-A-5 645 25 5.670 50.000 283.52 0.502 Std-A-6 645 25 5.670 75.000 425.27 0.753 Std-A-7 645 25 5.670 200.000 1134.06 2.01 Std-A-8 645 25 5.670 500.000 2835.16 5.02 Std-A-9 645 25 5.670 1000.000 5670.32 10.04
Note: *Working standard solution used for preparation of calibration standards that can be altered for a desired range.
Sample Preparation and Extraction Procedure
1. Air Filters: Remove the air sampling filters from their storage containers (50 mL centrifuge tubes) and prepare to spike each filter with the internal standard/surrogate. Place the filters slightly suspended above a clean surface (Kim Wipe tissue) so that the spike solution does not transfer to the lower surface.
2. Spike each filter with 50 uL of the working internal standard/surrogate solution directly in the center of the filter and allow 5 minutes for the solvent to evaporate.
3. Carefully fold and place each filter into separate 8 mL culture tubes and add 3-4 mL of a 10% solution of KOH/Methanol so that the filter is submerged. Tightly cap the tubes. Proceed to step 10.
4. Fungal Biomass: Obtain a record the spore counts as spores/mL and proceed to spike an appropriate volume of suspended fungal spores into the center of a Gelman Glass Fiber filter. Vortex the solution to suspended spores before spiking. Let the filter dry for 1 hour.
5. Spike each filter with 50 uL of the working internal standard/surrogate solution directly in the center of the filter and allow 5 minutes for the solvent to evaporate.
6. Carefully fold and place each filter into a separate 8 mL culture tube and add 3-4 mL of a 10% solution of KOH/Methanol so that the filter is submerged. Tightly cap the tubes. Proceed to step 10.
128

7. Building Materials (Wood, Insulation or Gyproc type materials): R e c o r d the surface area o f the mater ia l that has been sampled or precisely w e i g h and record an appropriate amount o f sample material . P lace the sample i n 8 m L culture tubes or suitable container.
8. Sp ike each sample w i t h 50 u L o f the w o r k i n g internal standard/surrogate solut ion.
9. A d d an appropriate amount o f a solut ion o f 10% K O H / M e t h a n o l so that the material is submerged. Proceed to step 10.
10. The tubes can be incubated i n a dry b l o c k heater or water bath at a temperature o f 8 0 ° C for 90 minutes or autoclaved for 20 minutes at 250 °C i n the autoclave unit. I f autoclaving is performed each sample must be capped w i t h a G C type septum cap and sealed into a plast ic 50 m L centrifuge type tube. T h e setting for the exhaust col lector should be " F o r L i q u i d s (S low)" .
THIS PRECA UTIONIS NECESSARY TO MINIMIZE THE DANGER OF THE SAMPLE TUBES EXPLODING AND RELEASING THE CA USTIC SOLUTION IN THE AUTOCLAVE.
11. R e m o v e the tubes from the heat source and a l l ow the tubes to c o o l to r o o m temperature. I f the autoclave method has been used a l l ow the unit to c o o l so there is a gradual drop i n pressure before opening the unit. Proceed w i t h the sample extract ion steps.
Sample Extraction
12. Air Filters Extraction Step:
After sponaficat ion, each sample is extracted 2 times w i t h pentane. A d d 1 m L o f pyrogen free water and gently vortex. A d d 2 m L o f pentane to each tube and cap tightly. P lace and secure the tubes o n the Rotamax m i x e r and m i x for 5 minutes w i t h an agitation speed o f 10. Proceed to step 15
13. Fungal Biomass Extraction Step:
After sponaficat ion, each sample is extracted 2 times w i t h pentane. A d d 1 m L o f pyrogen free water and gent ly vortex. A d d 2 m L o f pentane to each tube and cap tightly. P lace and secure the tubes o n the Ro tamax m i x e r and m i x for 5 minutes w i t h an agitation speed o f 10. Proceed to step 15.
14. Building Materials Extraction Step (Wood, Insulation or Gyproc type materials) Step:
Afte r sponif icat ion, each sample is extracted 2 times w i t h pentane. Decant the 10% K O H / M e t h a n o l so lu t ion into separate labeled test tubes. W a s h each tube 2 X w i t h a 2 m L v o l u m e o f 10% K O H / M e t h a n o l and decant into the appropriate tubes. A d d 1 m L o f pyrogen free water and gent ly vortex. A d d 2 m L o f pentane to each tube and cap t ightly. P lace and secure the tubes o n the Ro tamax m i x e r and m i x for 5 minutes w i t h an agitation speed o f 10. Proceed to step 15.
129

15. After mixing, remove the tubes and transfer the pentane (upper phase) to a labeled clean test tube.
16. Repeat the extraction step and transfer the remaining pentane to the appropriate test tubes.
i
' . 17V. The extracts are evaporated to dryness under a stream of nitrogen gas. The evaporation process can be enhanced with the tubes placed in a warm water bath.
Derivatization Steps:
18. Add the derivatization reagents to each tube. First 15 uL of neat Pyridine then add 50 uL of BSTFA and tightly cap the tubes. Vortex each tube for 5 seconds.
19. Place the tubes in a dry block heater and heat to 60°C for 30 minutes.
20. Remove the tubes from the dry block heater and allow the tubes to cool to room temperature.
21. Add 500 uL of toluene (re-constitution solvent) or an appropriate volume and cap the vials. Vortex well.
22. Transfer the derivatized extracts to GC vials and prepare to run the samples on the GC/MS/MS. •
Ergosterol-TMS Standard Calibration
The range of the calibration curve can be adjusted according to the expected range of the analyte found in sample matrices (air samples on gelman filters, biomass or building materials).
Ergosterol GC/MS/MS is an internal standard quantation method. The calibration curve of ergosterol-TMS is a plot the peak ratios of 157/351 m/z versus nanograms injected. The quan ion of the derivative of the ergosterol is m/z 157 and the internal standard is m/z 351. The calibration curve is a quadratic curve fit, including zero and a weighing of 1/x .
GC/MS/MS Conditions:
Gas Chromatographic Parameters
Column Type: PTE -5, HP-5 or DB-5 0.25 m.m. I.D. x 30 meters 250 microns film thickness
130

GC Oven Temperature Program
95° C (1 min hold) to 310° C @ 20° C/min hold for 10.5 minutes
Injection Port Temperature 290° C
Splitless Injection time: 0.60 minutes splitless time
Interface Temperature: 290° C
Injector (Model 8200)
Injection Amount (ul): 1.0 uL or upto 2.0 uL
Solvent Plug Size (uL): 0.4 uL
Syringe Needle Wash Time: 30 seconds
Injection Rate (uL/sec): 10 uL/sec
Mass Spectrometer: G C / M S / M S Saturn 2000
Segment 1: Filament off (start time = 0 min End time = 14 min)
Segment 2 - Full Scan Mode: Internal Standard
Emission Current: 50 microamps Mass Defect: 85 mmu/lOOu Count Threshold: 1 counts Mulitplier Offset: 0 volts Scaqn Time: 0.78 sees Segment Start time: 12mins Segment End time: 16.50 mins Segment Low Mass: 315 m/z Segment High Mass: 375 m/z Ionization Mode: EI A G C
Segment 2: EI-AutoMode
Target TIC: 20000 counts Prescan Ionization Time: 100 microseconds Background Mass: 45 m/z RF Dump Value: 650.0 m/z

Mass Range: 315 to 375 Target Counts: 40000 Prescan Ionization Time: 1500 microseconds Background Mass: 149 m/z RF Dump Value: 650:0 m/z
Segment 3 - M S M S mode: Ergosterol-TMS
Emission Current: 90 microamps Mass Defect: 85 mmu/lOOu Count Threshold: 1 counts Mulitplier Offset: 300 volts Scan Time: 0.67 sees Segment Start time: 16.50 mins Segment End time: 18.50 mins Segment Low Mass: 150 m/z Segment High Mass: 160 m/z Ionization Mode: EI A G C
Segment 3: EI-Auto Mode Target TIC: 40000 counts Prescan Ionization Time: 1500 microseconds Background Mass: 149 m/z RF Dump Value: 650.0 m/z
Segment 3: MS/MS Ion Preparation
Ionization Parameters: Ionization Storage Level: 48.0 m/z Ejection Amplitude: 20.0 volts
Isolation Parameters: Parent Ion Mass: 363.0 m/z Isolation Window: 2.0 m/z Low-Edge Offset: 6 steps
• High Edge Offset: 2 steps High-Edge Amplitude: 30.0 volts Isolation Time: 5 sees
Dissocation Parameters: Waveform Type: Resonant Excitation Storage Level: 79.9 m/z Excitation Amplitude: 0.40 volts Modulation Range: 2 steps Modulation Rate: 3000 usecs/step Number of Frequencies: 1 Excitation Time: 20 milliseconds CID Frequency Offset: 0 Hertz

Segment 4 - Full Scan (Surrogate - Stigmasterol)
Emission Current: 50 microamps Mass Defect: 85 mmu/lOOu Count Threshold: 1 counts Mulitplier Offset: 0 volts Scaqn Time: 0.78 sees Segment Start time: 12mins Segment End time: 16.50 mins Segment Low Mass: 390 m/z Segment High Mass: 398 m/z
• Ionization Mode: EI A G C
Segment 4: El-Auto Mode
Target TIC: 20000 counts Prescan Ionization Time: 100 microseconds Background Mass: 45 m/z RF Dump Value: 650.0 m/z
Segment 4: E.I. - Auto Mode Mass Range: 390 to 398 Target Counts: 40000 Prescan Ionization Time: 1500 microseconds Background Mass: 149 m/z RF Dump Value: 650.0 m/z
Segment start and end times will change depending on the column dimensions, performance, and carrier gas (He) flow rate as determined by the injection port head pressure. The start and end times must be changed in the method prior to GC/MS/MS analysis when there have been major changes with the listed parameters.
Definitions
GC/MS/MS - Gas chromatography/Mass Spec/Mass Spec Gelman Glass Filters - air sampling glass fiber type filters BSTFA - derivatization agent (N)-bis(trimethylsilyl)trifluoroacetamde) m/z - mass to charge ratio MS/MS - mass spec/mass spec mode of operation of the mass spectrometer Quan ion - the m/z peak in a mass spectrum used for quantification
Method Revisions Revision Number Author Date Description SOEH-SOP# A.00.01 Timothy Ma 02/19/03 1 s t Version SOEH-SOP# A-00.02 Timothy Ma 04/23/03 Added Surrogate
Stigmastrol
133

Appendix J : Photographs of test specimens after 4 weeks
Photo 1: A. versicolor on untreated southern yellow Photo 2: P. brevicompactum on untreated southern pine. yellow pine.
Photo 3: A. versicolor on untreated lodgepole pine. Photo 4: P. brevicompactum on treated lodgepole pine.
Photo 5: P. brevicompactum on untreated lodgepole Photo 6: A. versicolor on untreated Pine OSB pine (specimen 2, 30x magnification). (specimen 3).
134

Photo 7: A. versicolor (arrow) on treated Pine OSB (specimen I).
Photo 9: P. brevicompactum on treated Pine OSB (specimen 1).
Photo 11: A. versicolor on untreated Aspen OSB (specimen 2).
Photo 8: A. versicolor (arrow) on treated Pine OSB (specimen 3).
Photo 12: P. brevicompactum on untreated Aspen OSB (specimen 1).
135

Photo 13: S. chartarum on untreated cellulose
insulation (30x magnification).
Photo 15: A. versicolor on untreated cellulose
insulation (30x magnification).
Photo 17: P. brevicompactum on untreated cellulose
insulation (30x magnification).
Photo 14: Treated insulation inoculated with S.
chartarum (30x magnification).
Photo 16: Treated insulation inoculated with A.
versicolor (30x magnification).
Photo 18: Treated insulation inoculated with P.
brevicompactum.
136

137

Photo 25: S. chartarum - gypsum board 2 Ib/MSF Photo 26: S. chartarum hyphal strands - 2 Ib/MSF
boric acid (back). boric acid (30x).
Photo 27: S. chartarum showing sporulation - 2
Ib/MSF boric acid (30x).
Photo 28: S. chartarum - gypsum board 2.57 Photo 29: S. chartarum hyphal strands - gypsum
Ib/MSF boric acid (front). board 2.57 Ib/MSF boric acid {front - 30x).
138

Photo 30: S. chartarum - gypsum board 2.57
Ib/MSF boric acid (back).
Photo 31: S. chartarum hyphal strands - gypsum
board 2.57 Ib/MSF boric acid (back - 30x).
Photo 32: S. chartarum hyphal strands - 4 Ib/MSF boric
acid (3 Ox).
Photo 33: A. versicolor on gypsum board - no boric
acid added (front)
Photo 34: A. versicolor on gypsum board - no boric
acid added compared to control. Side lighting makes
growth easier to see.
139

HB Photo 35: A. versicolor on gypsum board - no added
boric acid (front - 30x magnification).
Photo 36: A. versicolor on gypsum board - no boric Photo 37: A. versicolor on gypsum board - no boric
acid added (back). acid added compared to control. Side lighting makes
growth easier to see.
140

Photo 39: A. versicolor - gypsum board 1 Ib/MSF
boric acid (front) - no visible growth.
Photo 41: A. versicolor- gypsum board 1 Ib/MSF
boric acid (back) - no visible growth.
Photo 43: P. brevicompactum — gypsum board no
added boric acid (front).
Photo 42: A. versicolor - gypsum board 1 Ib/MSF
boric acid (30x): clean.
Photo 44: Same specimen as previous, but side
lighting makes growth easier to see.
141

Photo 46: P. brevicompactum - gypsum board no Photo 47: Same specimen as previous, but side
added boric acid (back). lighting makes growth easier to see.
Photo 48: P. brevicompactum - gypsum board no
added boric acid (back - 30x).
142

Photo 49: P. brevicompactum - gypsum board 1 Photo 50:.. .with side lighting...
Ib/MSF boric acid (front)...
Photo 51: P. brevicompactum - gypsum board 1
Ib/MSF boric acid (front - 30x).
Photo 52: P. brevicompactum - gypsum board 1 Photo 53: ...with side lighting...
Ib/MSF boric acid (back)...
143

Photo 54: P. brevicompactum - gypsum board 2 Ib/MSF boric acid (front).
Photo 56: P. brevicompactum - isolated growth on another gypsum board @ 2 Ib/MSF boric acid (front).
Photo 57: P. brevicompactum, patchy growth -gypsum board 2 Ib/MSF boric acid (back).
144

Appendix K - Sample chromatograms
C h r o m a to g r a m P l o t s Plot 1: u: \ . . . \ 2 6 f e b 0 3 \ s y p 1_aspe r _ 2 6 f e b . r u n A P l o ( 2 : u : \ . . \ 2 6 f e b 0 3 \ s y p 2 _ a s p e r _ 2 6 f e b . r u n A P lo t 3: u:\ . . . \ 2 6 f e b 0 3 \ s y p 3 _ a s p e r _ 2 6 f e b . r u n A P lo t 4: u:\ . . . \ 2 6 f e b 0 3 \ s y p 4 _ a s p e r _ 2 6 f e b . r u n A
m V o l l s
2 0 0 -
15 0 -
10 0 -
5 0 -
o-
A
3
\
\ i 4
\
I ,1
5
\ 6
\
U J L J J W
I
A s y p1 _ a s p e r _ 2 6 f e b . r u n
;
m V o l t s
2 0 0 -
15 0 -
10 0 -
5 0 -
o-
B
3
\ 1
I 2
. I I, I
4 \
j j
5 \
. . . . 1
6
\
A s y p 2 _ a s p e r _ 2 6 f e b. r u n
m V o l l s
2 0 0 -
15 0 -
10 0 - :
5 0 -
0 -
c A s y p
I 1.1 . . A ' J t J J ,JA ,
3 _ a s p e r _ 2 6 f e b , r u n
9 J 10
m V o l t s
2 0 0 -
1 5 0 - :
10 0 -
5 0 -
0 -
D
L L.l * A i l L J A sy p 4 _ a s p e r _ 2 6 f e b. r u n
^ ]
5 lb 15 2 b 2 5 - — , m i n u te s
Figure K - l . GC-FDD chromatograms of the VOC profile for Aspergillus versicolor on untreated southern yellow pine at week 4, top to bottom: specimens 1, 2, 3, and control. Production of V O C s in specimen 3 differed from specimens 1 and 2. Labels: 1 = 2-butanone; 2 = dimethyl furan; 3 = 2-pentanone; 4 = 2-hexanone; 5 = 2-heptanone; 6 = 2-octanone; 7 = 2-nonanone; 8 = Rt. 2.4; 9 = Rt. 23.3; 10 = Rt. 25; 11 = hexanal; 12 = heptanal; 13 = nonanal. The lower-molecular weight aliphatic aldehydes (pentanal, hexanal, heptanal) elute at the same time as the corresponding 2-ketones.
145
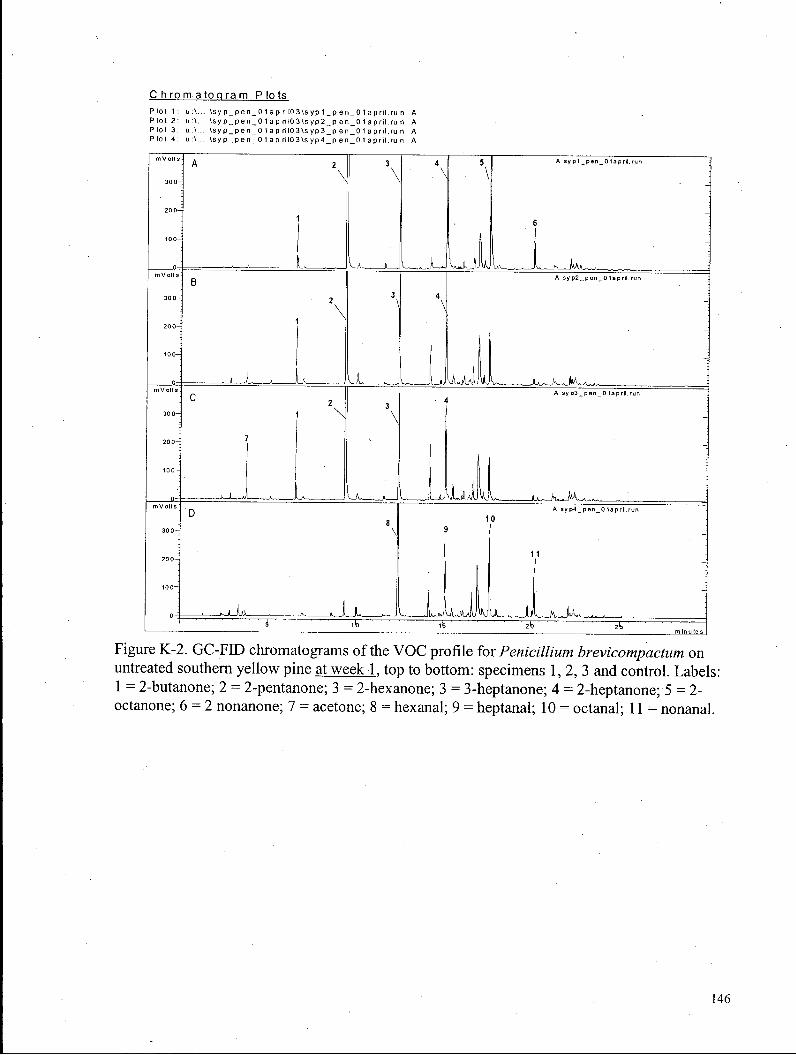
C h r o m a to g r a m P l o t s P l o l l : u A . . . \ s y p _ p e n _ O 1 ap r l l 0 3 \ s y p 1 _ p e n _ 0 1 aprll .ru n A P lo t 2: u A . . . \ s y p _ p e n _ O 1 ap ril03\s y p 2 _ p e n _ 0 1 april .ru n A Plot 3: u A . . . \ s y p _ p e n _ 0 1 ap rM03\s y p 3 _ p en_01 aprl l .ru n A Plot 4: u A . . . \sy p _ p e n _ 0 1 ap ril03\s y p 4 _ p e n _ 0 1 april .ru n A
Figure K - 2 . G C - F I D chromatograms o f the V O C profi le for Penicillium brevicompactum on untreated southern y e l l o w pine at week 1. top to bottom: specimens 1, 2, 3 and control . Labels : 1 = 2-butanone; 2 = 2-pentanone; 3 = 2-hexanone; 3 = 3-heptanone; 4 = 2-heptanone; 5 = 2-octanone; 6 = 2 nonanone; 7 = acetone; 8 = hexanal; 9 = heptanal; 10 = octanal; 11 = nonanal.
146

C h ro m a to q ra m P l o t s P l o t 1 P l o t 2 P l o t 3 P l o t 4
u : \ . . . \ s y p _ p e n _ 2 2 a p r 0 3 \ s y p 1 _ p e n _ 2 2 a p r 0 3 . r u n u : \ . . . \ s y p _ p e n _ 2 2 a p r 0 3 \ s y p 2 _ p e n _ 2 2 a p r 0 3 . r u n u : V . . . \ s y p _ p e n _ 2 2 a p rf)3\syp3 _ p e n _ 2 2 a p r . r u n A u : \ . . . \ s y p _ p e n _ 2 2 a p r 0 3 \ s y p 4 _ p e n _ 2 2 a p r 0 3 . r u n
Figure K-3. GC-FID chromatograms of the V O C profile for Penicillium brevicompactum on untreated southern yellow pine at week 4, top to bottom: specimens 1, 2, 3 and control. Some of the compounds seen in specimens 2 and 3 at week 1 have now disappeared (*), but still remain in specimen 1. The production of acetone and furan in specimens 2 and 3 is stronger than in specimen 1. Labels: 1 = 2-butanone; 2 = 2-pentanone; 3 = 2-hexanone; 3 = 3-heptanone; 4 = 2-heptanone; 5 = 2-octanone; 6 = 2 nonanone; 7 = acetone; 8 = hexanal; 9 = heptanal; 10 = octanal; 11 = nonanal; 12 = dimethyl furan; 13 = furan.
147

C h r o m a to g r a m P l o t s P l o l 1 P l o l 2 P l o t 3 P l o t 4
u : \ . . . \ 1 1 j u n 0 3 \ s p f 1 _ s t a c h y _ 1 1 j u n . r u n A u : \ . . . \ 1 1 j u n 0 3 \ s p f 2 _ s t a c h y _ 1 1 j u n . r u n A u : \ . . . \1 1 j u n 0 3 \ s p f 3 _ s t a c h y _ 1 l j u n . r u n A u : \ . . . \1 1 j u n 0 3 \ s p f 4 _ s t a c h y _ 1 1 j u n r u n A
Figure K-4. GC-FID chromatograms of the VOC profile for Stachybotrys chartarum on untreated lodgepole pine at week 4. Top to bottom: specimens 1, 2, 3 and control. No growth was observed during the experiment; correspondingly, no changes in the V O C profile compared to the control were observed, although specimen 3 emitted higher levels of wood terpenes (*). Labels: 1 = toluene.
148

C h ro m a to q ra m P l o t s P l o t 1: u : \ . . . \ 2 6 a u g 0 3 \ s p f 3 _ a s p _ 2 6 a u g . r u n A P l o t 2 : u : \ . . - \ 2 6 a u g 0 3 \ s p f 4 _ a s p _ 2 6 a u g . r u n A
T ~ — — 10 ite 20 2fe — — — . — ™ . m inu le s
Figure K-5. GC-FID chromatograms of the V O C profile for Aspergillus versicolor on untreated lodgepole pine at week 4: specimen 3 (top) vs. control (bottom). 2-ketones were the main compounds produced with fungal growth. 1 = 2-butanone; 2 = 2-pentanone; 3 = 2-hexanone; 4 = 2-heptanone; 5 = 2-octanone; 6 = 2-nonanone; 7 = C9 cyclic ketone; 8 = pentanal; 9 = toluene; 10 = hexanal.
149

C h ro m a to g ra m P l o t s P lot 1 : u:\..\spf_pen_jun03\16jul03\spf1_pen_16jul.run A Plot 2: u:\ . .M6jul0 3\spf2b_pen_16jul.run A Plot 3: u :\... \spt_pen_ju n 03\1 6jul0 3\s pf3_pen_ 1 6 ju I. run A Plot 4: u:\... \spf_pen_jun 0 3\1 6jul03\s pf4_pen_1 6 ju I. run - A
m V o l t s
30 0 -
2 0 0 -
10 0 -
o—
A
.., 11 . . Lll... j j 1 11
A s p ( 1 _ p e n _ 1 6 j u l . r u n
m V o l t s
30 0 -
2 0 0 -
10 0 -
0 —
B
, 11 .. —' L. 1 J 1 A s p f 2 b _ p e n _ 1 6 j u l . r u n
L A . ^ / I I M . . ^ l IA_J . . . . ; m V o l l s
3 0 0 -
20 0 -
1 0 0 -
0 —
c
1 { A s p f 3 _ p e n _ 1 6 j u l . r u n
m V o l t s
30 0 -
2 0 0 -
ioo-
n—
D
, I I . . I l i . , U Jl_j/Jlu J L A
A s p f 4 _ p e n _ 1 6j u l . ru n
' 4 / ib ib 2 b 2 ^ , , m in u te s
Figure K - 6 . G C - F I D chromatograms o f the V O C prof i le for Penicillium brevicompactum on untreated lodgepole pine at week 4 (experiment 1). T o p to bot tom: specimens 1, 2, 3, and Control. N o growth was observed o n any o f the test specimens; correspondingly, no changes i n the V O C prof i le were seen.
150

C h r o m a to g r a m P l o t s u:\... \20a ugO 3\spf 1 _ pen_20aug .ru n A u:\... \20a ug03\spf2_ pen_2 Oaug .ru n A u:\... \20a ug03\spf3_ pen_20aug .ru n A u:\... \20a ug03\spf4_ pen_20aug .ru n A
m V o l t s
3 0 0 -
2 0 0 -
1 0 0 -
A
1 \
_ u LL« —.—n__A>JV~jLjtj1_ J D
A s p f 1 _ p e n _ 2 0 a u g . r u n
m V o l l s
3 0 0 —
2 0 0 —
1 0 0 -
B 1 \
j /. ^ _ . . . . Iv 1 . l . ..,. I, J , i
A s p f 2 _ p e n _ 2 O a u g .ru n
m V o l t s
3 0 0 -
2 0 0 —
1 0 0 -
C
1 \
_ _ u _ _ j J L l
A s p f 3 _ p e n _ 2 0 a u g .ru n
liLuJ ^ , m V o l l s
3 0 0 —
2 0 0 —
10 0 -
D 1 \
. , 1 . . - i l l . . J ii
A s p f 4 _ p e n _ 2 0 a u g . r u n
l Ail. 11 . - JiJn^. . L n. s -
4 1̂ l fe 2̂ > 2 f e „,!„.,,„« m i n u le s
Figure K - 7 . G C - F E D chromatograms o f the V O C profi le for Penicillium brevicompactum o n untreated lodgepole pine, experiment 2. T o p to bot tom: specimens 1, 2 , 3 and control . M i c r o s c o p i c growth was observed o n specimen 2 at the end o f the experiment, but no obvious growth was seen. N o signif icant changes i n the V O C prof i le were observed dur ing the experiment, except for a very slight decrease i n hexanal i n specimens 2 and 3 at week 4. Emiss ions o f some compounds (*) were higher i n specimen 3 compared to the other test specimens and the control . Labe l s : 1 = hexanal .
P lot 2 P lol 3 P lol 4
151
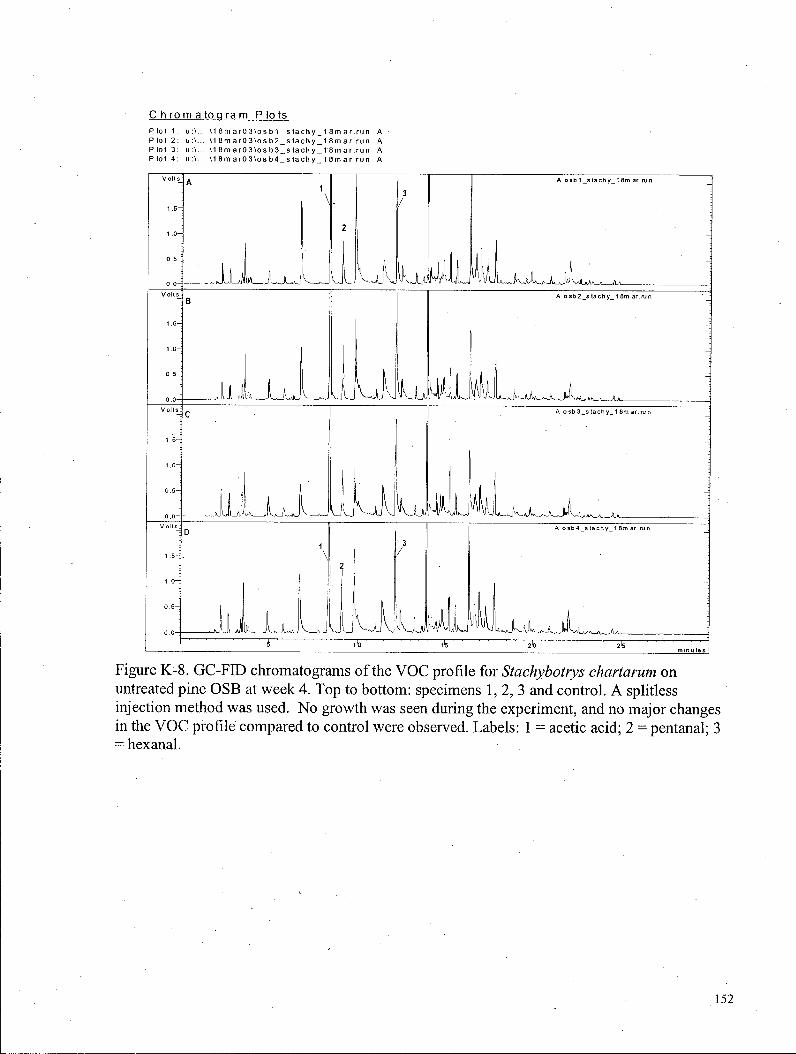
C h ro m a to q ra m P l o t s P lot 1 P lol 2 P lol 3 P lot 4
u:\... \1 8m a r03\os b 1 _s ta chy_1 8m ar.ru n A u:\... \1 8m a r03\os b2_s tachy_1 8m ar.run A u:\... \1 8m a r03\os b3_s tach y_1 8m ar.run A u:\... \1 8m ar03\os b4_s tach y_1 8m a r.run A
M _ J L X . J
A o s b 1 _s t a c h y_ 1 8 m a r . ru rt
A o s b 2 _ s t a c h y _ 1 8 m a r . r u n
A o s b 3 _ s t a c h y_ 1 8 m a r . ru n
J j J
A o s b 4 _ s t a c h y _ 1 E
Figure K-8. GC-FID chromatograms of the VOC profile for Stachybotrys chartarum on untreated pine OSB at week 4. Top to bottom: specimens 1, 2, 3 and control. A splitless injection method was used. No growth was seen during the experiment, and no major changes in the V O C profile compared to control were observed. Labels: 1 = acetic acid; 2 = pentanal; 3 = hexanal.
152

C h r o m a to gram Plots Plot 1: u:\... \1 2m a r03\pos b 1 _as per__1 2m ar.ru n A Plot 2: u :\... \1 2m a r03\pos b2_a s per_ 1 2m a r.ru n A Plot 3: u :\... \1 2m ar03\pos b3_a s per_ 1 2m a r.ru n A Plot 4: u :\... \1 2 m arO 3\pos b4_as per_ 1 2m a r.ru n A
m V o l t s
1 5 0 -
1 0 0 -
5 0 -
0 -
A
1. L . . . 1 11 Lli»jL 1
A p o s b 1 _ a s p e i _ _ 1 2 m ar. r u n
m V o l t s
1 5 0 -
10 0 -
5 0 -
0 -
B
- 1 - - J A l . i . I ± IA i JILL }
A p o s b 2 _ a s p e r _ 1 2 m a r . r u n
m V o l t s
15 0 -
10 0 -
5 0 -
o -
c A p o s b 3 _ a s p e r _ 1 2 m a r . r u n
3
hhL*...... I * , . .
m V o l t s ;
1 5 0 -
1 0 0 -
5 0 -
0 -
D
• 1 , ..1, i . JjJ 2
\
IJLLL
I
J
A p o s b 4 _ a s p e r_ 1 2 m a r . r u n
:
4
4 l b tfe 2 0 2 5 — m i n u le s
Figure K - 9 . G C - F E ) chromatograms o f the V O C profi le for Aspergillus versicolor on untreated pine O S B at week 1. T o p to bot tom: specimens 1, 2, 3, and control . V i s i b l e g rowth was seen o n specimen 3, and noticeable changes i n the V O C profi le were also evident i n spec imen 3, m a i n l y as decreases i n aldehydes (chromatogram C ) . N o v is ib le growth was seen o n specimens 1 or 2 at w e e k l ; correspondingly, the V O C profi les for specimens 1 and 2 were s imi l a r to the control . Labels : 1 = pentanal; 2 = hexanal ; 3 = benzaldehyde; 4 = nonanal .
153

C h ro m a to q ra m P l o t s Plot 1: u:\... \02apriI03\pos b 1 _as per_ 02a pr.run A Plot 2: u:\. .\02april03\posb2_asper_02apr.run A Plot 3: u:\... \0 2 a p MIO 3\pos b3_a s p e r_ 0 2 a pr.ru n A Plot 4: u :\... \02april03\pos b4_as per_ 02a pr.run A
m V o i l s
15 0 -
10 0 -
5 0 -
0 -
A L i s b 1 _ a s p e r _ 0 2 a p r . r u n
m V o l t s
15 0 -
1 0 0 -
5 0 -
0 —
B A p c
*
s b 2 _ a s p e r _ 0 2 a p r . r u n
m V o l l s
15 0 -
1 0 0 -
5 0 -
o -
c
. I i j hi IK . I V '..Lfu_J
A p o s b 3 _ a s p e r _ 0 2 a p r . r u n
, , . . . | i \ ^ : . . . . m V o l t s ;
1 5 0 -
1 0 0 -
5 0 -
o -
D
II I—jl ^jj A JLJI_
1
2
ul
A p o
4
s b 4 _ a s p e r _ 0 2 a p r . r u n
* i b i s 2 b 2 b ~ — .. — m i n u t e s
Figure K-10. GC-FID chromatograms of the VOC profile for Aspergillus versicolor on untreated pine OSB at week 4, top to bottom: specimens 1, 2, 3, and control. Decreases in some compounds (*) are now evident in specimens 1 and 2, as in specimen 3. Production of small amounts of new compounds was noted (eg. 2-hexanone eluting at the same time as hexanal; 2-octanone appearing in specimen 1). Labels: 1 = acetic acid; 2 = pentanal; 3 = hexanal; 4 = benzaldehyde; 5 = nonanal; 6 = 2-octanone; 7 = 2-hexanone.
154

C h r o m a to g r a m P l o t s Plot 1. u:\... \03jul03\posb3_pen_03jul.run' A PI012: u:\... \03jul03\posb4_pen_03jul.run A
1 ' 4 10 15 2b 25 • • , m i n u te s |
Figure K - l l . GC-FED chromatograms of the VOC profile for Penicillium brevicompactum on untreated pine OSB at week 4, specimen 3 (top) vs. control (bottom). Labels: 1 = acetone; 2 = 2-butanone; 3 = 2-pentanone; 4 = methyl pyrrole; 5 = pyrrole;. 6 = 2-hexanone; 7 = acetic acid; 8 = pentanal; 9 = hexanal; 10 = benzaldehyde= 11= nonanal.
155

C h r o m a t o o r a m P l o t s Plot 1: u:V... \0 4feb0 3\a sp_o sb 1 _s ta c h y.ru n A Plot 2: u:\..-\04feb03\asp_osb2_stachy.run A Plot 3: u :\... \04feb03\asp_o sb3_s tachy.run A Plot 4: u:\... \04feb03\asp_o sb 4_s ta c h y.ru n A
m V o l l s
1 0 0 -
7 5 -
5 0 -
2 5 -
0 -
A
1
\
A I AL t i t . L
2 3
/
A a s p _ o s b1 s t a c h y . r u n
UX^-JUJL.. ^ J L . m V o l l s
10 0 -
7 5 -
5 0 -
2 5 -
0 -
B
I
A a s p _ o s b 2 _ s t a c hy . r u n
i m V o l t s
10 0 -
7 5 -
5 0 -
2 5 H
0-.
c
. « i I J l h t » L L ,
A a s p o s b 3 _ s t a c hy . r u n
m V o l t s :
100 - i
75-i
5 0 -
2 5 J
o-;
D
1
\
.. .LI AL i R . u
2 3
/
A a s p _ o s b 4 _ s l ac hy . r u n
4 10 15 2b 2fe ~ m i n u te s
Figure K - 1 2 . G C - F I D chromatograms o f the V O C prof i le for Stachybotrys chartarum o n untreated aspen O S B at week 4. T o p to bottorn: specimens 1, 2, 3 and control . N o growth was observed dur ing the experiment; correspondingly, no changes i n the V O C profi le compared to the control were seen. Labe l s : 1 = acetic ac id; 2 = pentanal; 3 = hexanal .
156

C h ro m a to g ra m P l o t s P l o M : u:\. .\02april03\aosb1_asper_02apr.run A Plot 2: u \02a pri!03\aos b4_as per_ 02apr.run A
II
A a o s b 1 _ a s p e r _ 0 2 a p r . r u n
JL
A a o s b 4_ a s p e r _ 0 2 a p r ,
IT
Figure K-13. GC-FID chromatograms of the VOC profile for Aspergillus versicolor on untreated aspen OSB at week 4: specimen 1 (top) and control (bottom). Labels: 1 = Rt. 2.4; 2 = Rt. 12.9; 3 = styrene; 4 = methoxymethyl benzene; 5 = ethoxymethyl benzene; 6 = Rt. 23; 7 = acetic acid; 8 = pentanal; 9 = hexanal; 10 = heptanal; 11= benzaldehyde.
157

C h r o m a to g r a m P l o t s P lol 1: u:\...\07may0 3\aosb3_pen_07may03.run A Plot 2: u:\ . . \07may0 3\aosb4_pen_07may03.run A
A a o s b 3 _ p e n _ 0 7 m ay 0 3 . n j n
'b -ife 2 D ' ' 2 f e ' ' ' ' . — _ m i n u le s
Figure K - 1 4 . G C - F I D chromatograms o f the V O C profi le for Penicillium brevicompactum on untreated aspen O S B at week 4: specimen 3 (top) vs. control (bottom). Labe l s : 1 = acetone; 2 = 2-butanone; 3 = 2-pentanone; 4 = methyl pyrrole; 5 = pyrrole; 6 = Rt . 12.9; 7 = styrene; 8 = acetic ac id; 9 = pentanal; 10 = hexanal ; 11 = heptanal; 12 = benzaldehyde.
158

C h r o m a to g r a m P l o t s P l o t l : u:\... M 8m a rO 3\c ell _s ta c h y__ 1 8m ar.run A Plot 2: u:\. . \18mar03\cel4_stachy_18mar.run A
A c e M _ s l a c h y _ 1 f l m a r . r u n
ib 2b r ~ ' 2b ' ~ ~ - m i n u le s
Figure K-15. GC-FID chromatograms of the VOC profile for Stachybotrys chartarum on untreated cellulose insulation at week 4: specimen 1 (top) vs. control (bottom). A splitless injection method was used. Labels: 1 = isopropanol; 2 = acetone; 3 = dimethylcyclopentenone (tentative); 4 = anisole; 5 = Rt. 26.6; 6 = trichodiene; 7 = pentanal; 8 = hexanal; 9 = heptanal.
159

C h ro m a to q ra m P l o t s P lot 1 : u :\... \30s ep03\c eM _a s p_30s ep.run A Plot 2: u:\ . . \30sep03\cel4_asp_30sep.run A
m V o l t s
2 0 0 -
15 0 -
1 0 0 -
5 0 -
0 -
; A
1
\
L A A _ I \ 1 t • » n . *—J\
2
3
JL
A ce 11 _ a s p_ 30 se p.run
4 /
^^kJl^^ _ m Vol ts
2 0 0 -
1 5 0 -
10 0 -
5 0 -
0 -
1
B
6 /
7
/
.WJJUAJ
A ce I 4 _ as p_ 3 Ose p run
8 /
9
/
* 10 tfe 20 2fe — — — m i n u t e s
Figure K-16. GC-FID chromatograms of the VOC profile for Aspergillus versicolor on untreated cellulose insulation at week 1: specimen 1 (top) vs. control (bottom). Labels: 1 = 2-pentanone; 2 = 2-hexanone; 3 = 2-heptanone; 4 = 2-octanone; 5 = pentanal; 6 = hexanal; 7 = heptanal; 8 = benzaldehyde; 9 = octanal.
160

C h ro m a to g ra m P lo ts
A c e l l _ a s p_2 1 o c t . r u n
Plot 1: u:\... \21 oct03\cet1 _asp_2 1 oct.run A Plot 2: u:\... \2 1 oc 10 3\c el4_a s p_2 1 oc t.ru n A
200-1
5 0 -
' tb ' ' ' ' ' ' ^ ' " 2b ' ' ' ' ' ' 2b - ; m i n u le s
Figure K-17. GC-FID chromatograms of the V O C profile for Aspergillus versicolor on untreated cellulose insulation at week 4: specimen 1 (top) vs. control (bottom). The 2-ketones seen at week 1 have disappeared (*). Labels: 5 = pentanal; 6 = hexanal; 7 = heptanal; 8 = benzaldehyde; 9 = octanal.
161

C h ro m a to q ra m P l o t s Plot 1: u:\... \cell_p e n_ 2 2 a p rO 3\c e I3_pe n_22apr03.run A Plot 2: u:\. . \cell_pen_22apr03\cel4_pen_22apr03.run A
3 4
A c e I3__ pe n _ 2 2 a p r 0 3 . r u n
Ul
A c e l 4 _ p e n _ 2 2 a p r 0 3 . r u n
Figure K-18. GC-FID chromatograms of the VOC profile for Penicillium brevicompactum on untreated cellulose insulation at week 4: specimen 3 (top) vs. control (bottom). A splitless injection method was used. V O C production was limited. Labels: 1 = acetone; 2 = 2-butanone; 3 = 2-pentanone, 4 = dimethyl disulfide; 5 = pentanal; 6 = hexanal.
162

C h ro m a to g ra m P lo ts P lot 1 P lot 2 P lot 3 P lot 4
u:\... \10jun0 3\gyp0_stachy_10jun.run A u:\... \1 OjunO 3\g yp2_s ta c h y_ 1 Ojun.run A u:\... \1 Oju n 0 3\gyp4_s ta c hy_ 1 Oju n .ru n A u:\... \10jun0 3\gypOc__stachy_1Qjun.run A
n V o l l s
2 5 0 -
2 0 0 -
1 5 0 -
10 0 -
m V o l t s
2 5 0 -
2 0 0 -
1 5 0 -
m V o l t s
2 5 0 -
n V o l t s
2 5 0 -
2 0 0 -
15 0 -
' 1 0 0 -
A g y p 0 _ s ta c h y _ 1 0 j u n .ru n
A g y p 2_s t a c h y_ 1 0 j u n .r
A g y p 4 _ s t a c h y_ l O j u n
A g y p O c _ s t a c h y _ 1 Ojun .t
Figure K-19. GC-FID chromatbgrams of the VOC profile for Stachybotrys chartarum on gypsum board at week 4. Top to bottom: 0 lbs boric acid/MSF, 2 lbs boric acid/MSF, 4 lbs boric acid/MSF, control. At 2 lbs boric acid/MSF the production of new compounds is significantly reduced, and the production of trichodiene is undetectable. Labels: 1 = acetone; 2 = dimethylcyclopentenone; 3 = anisole; 4 =' limonene; 5 = Rt. 27.2; 6 = trichodiene; 7 = pentanal; 8 = hexanal; 9 = heptanal.
163

C h r o m a to g r a m P l o t s P l o t l : u :\... \27 no vO 3\gyp 0_asp_ 27 nov. ru n A Plot 2: u:\... \27nov03\gyp 1 _a sp_ 2 7 n o v. ru n A Plot 3: u:\. .\27nov03\gyp 257_asp_27nov.run A Plot 4: u :\... \gyps u m as p_oct03\2 7 n o v03\gy p_c_27 nov.run A
m V o l t s
2 0 0 -
1 5 0 -
10 0 -
5 0 -
o-
A
1
\
A g y p 0_ a s p _ 2 7 n o v . ru n
2
m V o l l s
2 0 0 -
15 0 -
1 0 0 -
5 0 -
0 -
B
4 \ 6
5
A g y p 1 _ a s p _ 2 7 n o v . f u n
8 " 7 I
m V o l t s
2 0 0 -
1 so-
io o-
5 0 -
0 -
C
3
4
\
A g yp 2 5 7 _ a s p _ 2 7 no v . ru n \
m vans:
2 0 0 -
15 0 -
10 0 -
5 0 -
oJ
D
4
I
A g y p _ c _ 2 7 n o v . r u n
5 1 0 15 2 b 2 5 1 — — — — —• . — - - . „ m i n u t e s
Figure K-20. GC-FID chromatograms of the VOC profile fox Aspergillus versicolor on gypsum board at week 4. Top to bottom: 0 lbs boric acid/MSF, 1 lb boric acid/MSF, 2.57 lbs boric acid/MSF, control. Growth of A. versicolor did not occur at boric acid concentrations of 1 lb boric acid/MSF and above; correspondingly, no changes in the V O C profile compared to the control were seen. Labels: 1 = acetone; 2 = 2-butanone; 3 = pentanal; 4 = hexanal; 5 =• heptanal; 6 = benzaldehyde; 7 = octanal; 8 = nonanal.
164

C h ro m a to q ra m P l o t s Plot 1: u:\... \23oc t03\g yp 0_pen_2 3oc t.run A Plot 2: u :\... \2 3oct0 3\g yp 2_pen_2 3oc t.run A Plot 3: u:\. . \2 3oct0 3\gyp 2 57_pen_23oct.run A Plot 4: u :\... \23oc t03\g yp control_pen_23oc .ru n A
Figure K-21. GC-FED chromatograms of the VOC profile for Penicillium brevicompactum on gypsum board at week 4. Top to bottom: 0 lbs boric acid/MSF, 2 lbs boric acid/MSF, 2.57 lbs boric acid/MSF, control. At 2 lbs boric acid/MSF, aldehydes (*) have disappeared but production of new compounds is negligible. Growth was not observed at boric acid concentrations of 2.57 lbs boric acid/MSF and above; correspondingly, there were no changes in the VOC profile compared to the control. Labels: 1= acetone; 2 = 2-butanone; 3 = 2-pentanone; 4 = dimethyl disulfide; 5 = pentanal; 6 = hexanal; 7 = heptanal; 8 = benzaldehyde; 9 = octanal; 10 = nonanal.
165


