Embed Size (px)
Citation preview

MRI-Based 3D Shape Analysisof Thigh Muscles:
Patients with Chronic Obstructive Pulmonary Disease Versus Healthy Adults
Bahareh HajGhanbari, BSc (PT), MSc, Ghassan Hamarneh, PhD, Neda Changizi, MSc,Aaron D. Ward, PhD, W. Darlene Reid, BMR (PT), PhD
Ac
FrVaLaCaOLaPh(WThthLuin
ªdo
Rationale and Objective: Because lower limb muscles differ in architecture and function, the systemic effects of chronic obstructivepulmonary disease (COPD) and related disuse may result in regional abnormalities. The purpose of this study was to investigate the differ-
ences between patients with COPD and healthy controls in three-dimensional shape and size measurements of individual thigh muscles.
Materials andMethods: Twenty patients with COPD and 20 healthy adults (aged 55–79 years) underwentmagnetic resonance imaging ofthe thighs. After manual segmentation of individual knee extensor and flexor muscles, the three-dimensional shape of each muscle was
obtained using specialized software. Eight shape descriptors were computed both globally (for the whole muscle) and regionally
(for portions of the muscle). A two-tailed t test with a modified Bonferroni correction was used to compare group differences.
Results: Compared to the thigh muscles of healthy subjects, vastus intermedius and semimembranosus showed the most shape abnor-
malities in the COPD group (P < .01). Greater regional shape anomalies in the COPD group were found in the middle to proximal regions of
all knee extensor muscles and the middle region of the semimembranosusmuscle, compared to those of the control group (P < .01). In the
COPD group, more shape abnormalities were found in the knee extensors than in the knee flexors (P < .01).
Conclusions: A non-uniformdistribution of atrophy and size changeswas found across knee extensors and flexors in patients with COPD.
Further research is required to investigate the underlying mechanisms of regional morphologic abnormalities of the thigh muscles and the
increased susceptibility of the knee extensors to atrophy-related anatomic anomalies in COPD.
Key Words: Thigh muscle; chronic obstructive pulmonary disease; magnetic resonance imaging; three-dimensional shape analysis;
computer-aided diagnosis.
ªAUR, 2011
keletal muscle weakness, particularly in the lower skeletal muscle weakness in patients with COPD ranges
S extremities, is common in patients with chronic
obstructive pulmonary disease (COPD) (1–3). In
fact, lower limb muscles are typically more adversely
affected than respiratory muscles in this patient population,
in part because of disuse (3). COPD-related muscle weakness
is also associated with other systemic comorbidities, including
abnormal arterial blood gases (hypoxia, hypercapnia),
malnutrition, systemic inflammation, oxidative stress, and
low testosterone levels (2,4). Of interest, the magnitude of
ad Radiol 2011; 18:155–166
om the Department of Physical Therapy, University of British Columbia,ncouver, BC V5Z 1M9, Canada (B.HG.); the Medical Image Analysisb, School of Computing Science, Simon Fraser University, Burnaby, BC,nada (G.H., N.C.); the Robarts Research Institute, University of Westernntario, London, ON, Canada (A.D.W.), and the Muscle Biophysicsboratory, Vancouver Coastal Health Research Institute, Department ofysical Therapy, University of British Columbia, Vancouver, BC, Canada.D.R., B.HG.). Received June 23, 2010; accepted September 1, 2010.is study was supported by the Canadian Institutes of Health Research,e British Columbia Medical Services Foundation, and the British Columbiang Association. Address correspondence to: B.HG. e-mail: [email protected]
AUR, 2011i:10.1016/j.acra.2010.09.008
widely among patients (4), likely reflecting individual differ-
ences in the contribution of factors involved in poor muscle
performance.
It has been suggested that the loss of muscle mass (size) is
associated with skeletal muscle weakness in patients with
COPD (3). However, the contribution of reduced muscle
mass relative to other factors, such as changes in the muscle
contractile apparatus and/or neuromuscular activation, is
unknown (1). Comprehensive measures of muscle size and
shape are therefore required to more precisely examine the
relative contribution of muscle mass reduction to force loss.
Magnetic resonance imaging (MRI) can be used to accurately
distinguish muscle from bone, connective tissue, nerves, and
blood vessels and can therefore provide accurate measures of
muscle cross-sectional area (CSA) (5).
Achieving an accurate estimate of muscle size and atrophy is
an important concern in strength training, aging, metabolic,
and immobilization research (6), all of which aim to design
effective preventive and therapeutic strategies. MRI can
generate multiple image slices from which muscle volume
can be estimated. Previous studies have used a single axial
CSA as a surrogate measure of muscle size (3,7–11), and
a few reports have described the measurement of several,
155

HAJGHANBARI ET AL Academic Radiology, Vol 18, No 2, February 2011
but not all, axial slices along the whole muscle (6,12).
However, the measurement of CSA throughout all axial
slices is preferable because it allows for a more accurate
measure of muscle size (6). Of further concern, previous
researchers have reported only on a single measure of thigh
muscle CSA or the CSA of groups of thigh muscles (eg,
knee extensors and flexors) rather than exploring individual
thigh muscle volumes and size measures to determinewhether
aging and/or pathology differentially affect individual muscles
(3,7–12).
Although muscle atrophy, as defined by muscle volume and
CSA, has been reported in patients with COPD, other
descriptors of surface area and shape abnormalities have not
been explored (3,7,12). Three-dimensional (3D) shape
descriptors can provide regional information about surface
area, muscle size, and shape and the distribution of atrophy.
However, whether muscle atrophy occurs uniformly or
with intermuscle or intramuscle heterogeneity in COPD is
unknown.
The objective of this study was to determine the differences
between patients with COPD and healthy controls in 3D
shape and size measurements of individual thigh muscles.
MATERIALS AND METHODS
Subjects
A convenience sample of patients with COPD was obtained
from local hospitals and COPD clinics. Healthy older adults
were recruited via advertisements in local newspapers and
community centers. The inclusion criteria for patients with
COPD were (1) moderate to severe (stage II to III) COPD
on the basis of the Global Initiative for Chronic Obstructive
Lung Disease guidelines (forced expiratory volume in 1
second < 80% of predicted value and forced expiratory
volume in 1 second/forced vital capacity < 70%) (13) and
(2) age > 50 years. The exclusion criteria for patients with
COPD were no acute exacerbations and no oral corticoste-
roids during the 6 months prior to the study and no participa-
tion in a formal exercise rehabilitation program for $1 year
prior to the study. The inclusion criteria for participants in
the control group were age > 50 years, free of lung disease,
nonsmokers, and no participation in any formal exercise
rehabilitation program for $1 year prior to the study. The
healthy group was matched for age, gender, and body mass
index to facilitate the analysis of muscle shape and size
independent of the overall size of the individual. As an addi-
tional normalization for patient size, we normalized the sizes
of the muscles using the femur length as a surrogate measure of
patient size. These individuals were screened for medical
history and spirometric outcomes to ensure that no respiratory
disease was present. The exclusion criteria for subjects in both
groups included comorbid cardiovascular disease (eg, heart
failure, previous myocardial infarction, or cardiovascular
surgery), neurologic conditions (eg, stroke or Parkinson’s
156
disease), or lower-extremity musculoskeletal problems (eg,
knee or hip injury or arthritis). All subjects provided written
informed consent prior to participation in the study. Ethics
approval was granted by the University Clinical Ethics
Research Board at the University of British Columbia.
Height and weight were measured with shoes off and in
light clothing. Spirometric measures were conducted accord-
ing to the standards described by the American Thoracic
Society (14) to measure forced expiratory volume in 1 second
and forced vital capacity for the purposes of confirming the
presence and severity of COPD. Descriptive demographic
data of the participants are summarized in Table 1. Subjects
were matched for gender and range matched for age and
body mass index (ie, with the exception of a single outlier,
no paired subjects had an age difference > 5 years or a body
mass index difference > 4 kg/m2).
MRI
A 1.5T MRI scanner (1.5T Horizon Echospeed Scanner; GE
Healthcare, Milwaukee, WI) was used to acquire
5 mm-thick, contiguous, axial slices from the anterior supe-
rior iliac spine to the tibial plateau while the subject’s lower
extremities were strapped to a foam block to minimize move-
ment. Images were T1-weighted magnetic resonance (echo
time, 8 ms; repetition time, 650 ms) with a 40 cm2 field of
view and a 512 � 384 pixel matrix (in-plane resolution,
0.78 � 1.78 mm). For each subject, two sets of images, one
for the upper and another for the lower thigh regions,
were collected in immediate succession without a change in
the subject’s position. A landmark (vitamin E capsule) at the
midthigh (half the distance between the anterior inferior iliac
spine and the superior margin of patella) was identified on the
MRI scans to register the two images into a single image of the
entire thigh. The vitamin E landmark facilitated the identifi-
cation of overlap between the two sets of images. The MRI
scan yielded a total of approximately 100 slices for each partic-
ipant, which were merged into a single 3D image using the
Merge module in the Amira 3.1 software package (Mercury
Computer Systems, Inc, Chelmsford, MA), with the coinci-
dence of the landmark verified after merging. Figure 1 shows
a selection of representative MRI slices taken from a subject’s
thigh at different levels.
Image Segmentation and Interpolation
ITK-SNAP 1.6.0.1 (15) was used for the manual slice-by-slice
(5 mm slice thickness) segmentation of individual muscles
from the merged axial magnetic resonance images (Fig 2).
Segmentation was performed by a physical therapist with
expert anatomic knowledge, which was further validated by
cross-checking of several references (16–18) and educational
inspection of human cadavers. Tendons and noncontractile
tissue, including fascia, adipose tissue, and blood vessels
outside the muscle periphery, were excluded. After the

TABLE 1. Characteristics of Patients with COPD and Healthy Older Adults
Characteristic
Healthy Older Adults
(n = 20)
Patients with COPD
(n = 20)
Age (y) 64.4 � 8.1 68.2 � 10.0
Women/men 11/9 11/9
Height (m) 1.67 � 0.13 1.66 � 0.09
Weight (kg) 69.0 � 14.4 72.1 � 14.6
BMI (kg/m2) 24.3 � 2.2 26.6 � 4.7
Lung function
FEV1 (L) (% predicted)* 2.28 � 0.72 (81 � 20) 1.34 � 0.41 (51 � 17)
FVC (L) (% predicted)* 3.05 � 1.11 (83 � 20) 2.58 � 0.47 (78 � 14)
FEV1/FVC (%)* 77 � 9 52 � 14
BMI, bodymass index; COPD, chronic obstructive pulmonary disease; FEV1, forced expiratory volume in 1 second; FVC, forced vital capacity.
*Significant difference between groups at P < .05.
Academic Radiology, Vol 18, No 2, February 2011 MRI-BASED 3D SHAPE ANALYSIS OF THIGH MUSCLES
completion of slice-by-slice muscle segmentation, the muscle
surfaces were interpolated in the out-of-plane direction using
custom software in MATLAB version 7.6 (The MathWorks,
Natick, MA) to obtain a rich description of the surface of
each muscle (Fig 3). This interpolation was performed by
establishing a correspondence between neighboring points
on adjacent contours and then adding new surface points at
equal (1 mm) distances along the line segments joining corre-
sponding points. Muscle size was normalized to femur length
as a surrogate measure of patient size by scaling the muscle
surface point coordinates to the ratio of the patient’s femur
length to a reference femur length (mean of all observed femur
lengths).
Shape Descriptor Computation
We computed seven 3D shape and size descriptors of each of
the muscles, described in the following paragraphs. All shape
descriptors were computed globally, for each muscle as
a whole. Four of the shape descriptors were computed region-
ally, whereby each muscle was divided into four quarters
(regions) along its length (Fig 4), and the measures were calcu-
lated for each region.
Mean Distance to the Centroid (MDC) and Standard Deviationof Distances to the Centroid (SDC). The centroid of a 3D shape
is a point in three dimensions that is in the center of the shape.
Intuitively, it can be thought of as a point that is not biased
toward any region or side of the shape over another. The
distances from each point on the shape surface to this centroid
can be analyzed to obtain two measures: (1) the overall size of
the object (by taking the mean) and (2) the difference between
the shape and a perfect sphere (by taking the standard devia-
tion). For a perfectly spherical shape, these distances will all
be the same, and their mean (the MDC) will be exactly equal
to the radius of the sphere. As the shape becomes less spher-
ical, these distances become more different from one another;
this is reflected in their standard deviation (the SDC). Figure 5
illustrates how the magnitude of the SDC reflects asphericity
in the form of surface roughness or irregularity. These
measures were computed regionally by averaging the MDC
and SDC values computed for each slice within each region.
Three-dimensional Moment Invariants. Three 3D moments,
J1, J2, and J3, which are invariant to translation and rotation,
were computed for the surface points of each muscle. Intui-
tively, moments capture characteristics of the spatial distribu-
tion of the voxels that make up the muscle surface (19).
Informally, these are considered to be higher order extensions
of quantities such as the mean and standard deviation. The
moment invariants were calculated using the methodology
described by Ward et al (20).
Moment invariants could not be assessed regionally,
because the division of the muscle introduces sudden flat
caps at the division boundaries, which would result in
misleading moment measurements.
Surface Area and Volume. To compute the surface area of each
muscle, the closest points on the contours of adjacent slices
were connected to form a triangular mesh (Fig 6). The sum
of the triangular areas provided an estimate of muscle surface
area (21). The volume of each muscle was computed by
counting the number of voxels inside the segmentation of
the muscle and multiplying this number by the spatial volume
occupied by each voxel. This measure was also computed
regionally.
Statistical Analysis
Comparisons of muscle shape and size measures were
performed using SPSS version 16.0 (SPSS, Inc, Chicago,
IL). Each descriptor was tested for normality using the
Shapiro-Wilk test, which showed that the data were normally
distributed (P > .05). As such, a two-tailed t test was per-
formed for each descriptor to evaluate the null hypothesis,
which stated that the means of the healthy and COPD groups
did not differ. For the regional analysis, the t test was repeated
for three regional features because of removal of extreme
outlier values (outliers were defined as�2 standard deviations
or more). The P values reported by the t tests indicated the
statistical significance of the differences in the measurements
157

Figure 1. Sample MRI slices of a subject’s thigh
from proximal (top) to distal (bottom).
HAJGHANBARI ET AL Academic Radiology, Vol 18, No 2, February 2011
in the COPD group compared to the healthy control group.
Because the outcomes (shape features) were highly correlated
(with the pairwise correlation within each of two groups for
each shape descriptor lying within the range of 0.8 to 0.9),
a Bonferroni correction seemed to be an overly conservative
approach (22). Therefore, we applied a modified Bonferroni
correction to avoid potential type I error for multiple compar-
isons (22). The preestablished level of significance of a = .01
was selected for the comparison of shape descriptors for global
and regional analyses. The null hypothesis was rejected for
158
measurements which resulted in P values < a and therefore
were considered to be statistically significant (Table 2).
Classification Accuracy
The shape measures from global analysis were compared to test
their clinical significance by evaluating the ability of a trained
automated classifier to distinguish the healthy from the
COPD groups using the computed measures. We input the
entire feature vector of each muscle into a soft-margin

Figure 2. Sample segmentation of knee
extensor and flexor muscles in ITK-SNAP: axial
(top left), sagittal (top right), coronal (bottom
right), and 3D mesh view (bottom left). Thedifferent knee extensors and flexors are repre-
sented by different fill colors.
Academic Radiology, Vol 18, No 2, February 2011 MRI-BASED 3D SHAPE ANALYSIS OF THIGH MUSCLES
nonlinear support vector machine (SVM) classifier (23). The
SVM classifier classifies subjects as normal or COPD on the
basis of a chosen feature vector. We chose to consider all of
the features together rather than each feature individually to
improve the discrimination between the twogroups (the differ-
ences between which are given in Table 1). We then measured
the classification accuracy as the percentage of correct classifi-
cations reported in a leave-one-out cross-validation.
RESULTS
Analysis of Global Muscle Shape Descriptors
The results of the analysis of the global shape descriptors of the
knee extensor and the knee flexor muscles are presented in
Table 2, which shows the six measures of the five muscles
for which statistically significant differences were found
between the normal and the COPD groups. In general, all
of the values for the seven shape descriptors were smaller in
the COPD group compared to the healthy controls. Knee
extensors showed more shape abnormalities in the COPD
group compared to healthy controls (P < .01). Of the knee
extensors, the vastus intermedius showed significant differ-
ences in seven shape descriptors in the COPD group
compared to healthy subjects. The box plots in Figure 7 depict
the sampling distribution of global shape descriptors of the
vastus intermedius. The vastus medialis and rectus femoris
showed significant differences in one (surface area) and two
(moments 1 and 2) shape descriptors, respectively, in the
COPD group compared to healthy subjects. Fewer shape
abnormalities were found in the knee flexors compared to
the knee extensors. Of the knee flexors, significant shape
abnormalities were found in the semimembranosus in
MDC, SDC, and moment 1. The short head of the biceps
femoris showed significantly lower values in moments 1 and
2 (which reflect differences in the distribution of muscle
mass) in patients with COPD. In general, among all of the
knee flexor and extensor muscles, shape abnormalities were
most apparent in the semimembranosus and vastus interme-
dius muscles of patients with COPD. The semitendinosus,
the long head of biceps femoris and vastus lateralis did not
show any differences in shape descriptors. Although muscle
volumes in patients with COPD were lower, no significant
differences in volumes of any of the knee extensor and flexors
were found between groups.
Analysis of Regional Muscle Shape Descriptors
The regional morphology of knee extensor and flexor muscles
was then investigated more closely by examining each muscle
in four regions, subdivided into four equal distances along the
total length of each muscle from origin to insertion (Fig 4).
Significant results related to the regional analysis of 3D
shape descriptors, including P values, are presented in Table
159

Figure 3. The interpolation technique for knee extensor and flexor
muscles. The parallel white contours depict the segmentation
boundaries on the acquired magnetic resonance slices with a
5-mm interslice spacing. The colored regions uniting the segmenta-tion boundaries are the product of the interpolation technique.
Figure 4. A sample muscle (rectus femoris) divided into four regions
(quarters) as defined by four equal lengths along the vertical axis of the
muscle.Region IV ismost proximal,whereas region I is themost distal.
HAJGHANBARI ET AL Academic Radiology, Vol 18, No 2, February 2011
3. In the COPD group, knee extensors showed significantly
lower measures in shape descriptors (ie, more shape abnor-
malities) in the middle to proximal regions of the muscles,
160
whereas shape abnormalities in the knee flexors were found
closer to the insertion of the muscles (ie, distal sections).

Figure 5. Description of the standard deviation of distances to
centroid (SDC) measure. Three such distances are illustrated as
d1, d2, and d3. Note how a perfect circle or sphere exhibits zero vari-
ability in the distances to the centroid (left), whereas the standarddeviation of these differences will not be zero for a rough or irregular
shape with more variability in d1, d2, and d3 (right).
Academic Radiology, Vol 18, No 2, February 2011 MRI-BASED 3D SHAPE ANALYSIS OF THIGH MUSCLES
Among the knee extensors, the vastus medialis showed the
highest number of regional abnormalities in the COPD
group, whereas the vastus lateralis, rectus femoris, and vastus
intermedius showed lower numbers of regional shape abnor-
malities. SDC, an indicator of surface roughness, was signifi-
cantly lower in the COPD group in region III of the rectus
femoris and regions II, III, and IV of the vastus medialis.
Surface area was significantly lower in the COPD group in
regions II and III of the vastus medialis and region III of the
vastus lateralis and rectus femoris. Significantly lower volumes
were found in regions II and III of the vastus lateralis in the
COPD group. Of the knee flexors, regional shape abnormal-
ities were mainly found in the distal regions of semimembra-
nosus (ie, area and volume of region II). No significant
differences between groups were found when the short and
long heads of the biceps femoris and semitendinosus were
examined for regional differences.
Classification Accuracy
TheSVMclassifier provided 95% to 100% accuracy in differen-
tiatingmuscles fromhealthy subjects from those of patientswith
COPD (Table 4). Our implementation requires two parame-
ters: one assigning a penalty C to classification errors and
another defining the width g of a radial basis function used
within the SVM. A standard logarithmic grid search was used
to determine the optimal values for the parameters C and g
for each muscle type using leave-one-out cross-validation.
Figure 6. A triangular mesh represents the muscle surface area.
The surface area of the muscle is estimated as the sum of the area
of all triangles that constitute the mesh.
DISCUSSION
Differences in MDC, Surface Area, and SDC
Higher MDC and surface area values in healthy group reflect
a bigger muscle girth. However, one intuitively expects that
measures of size, including MDC, surface area, and volume of
themuscle, should all increase as the size of themuscle increases.
In this study, we observed increases inMDC and surface area in
161

TABLE 2. Differences Between 3D Shape Descriptors for Global Analysis in Healthy Subjects Compared to Patients with COPD
Muscle MDC (mm) SDC (mm) Moment 1 (mm2) Moment 2 (mm4) Moment 3 (mm6) Area (mm2)
RF
Mean (SE) 3.08 (1.33) 1.19 (0.74) 7.68E7 (2.91E7)* 4.78E15 (1.71E15)y 4.18E22 (1.84E22) 2,549.10 (1,523.03)
95% CI 0.39–5.79 0.31–2.70 1.78E7–1.36E8 1.32E15–8.25E15 4.58E21–7.91E22 534.11–5,632.31
VI
Mean (SE) 5.31 (1.66)y 3.12 (1.00)y 1.58 E8 (5.52E7)y 1.83E16 (6.42E15)y 4.87E23 (1.81E23)* 7,492.95 (2,364.59)y
95% CI 1.95–8.67 1.08–5.15 4.57E7–2.69E8 5.31E15–3.13E16 1.22E23–8.52E23 2,706.08–12,279.82
VM
Mean (SE) 2.12 (1.06) 0.74 (0.79) 8.49E7 (4.15E7) 1.11E16 (5.33E15) 2.83E23 (1.46E23) 4,667.11 (1,770.98)*
95% CI 0.03–4.27 0.87–2.35 9.07E5–1.69E8 3.14E14–2.19E16 1.14E22–5.78E23 1,081.94–8,252.27
BF-SH
Mean (SE) 3.78 (1.55) 2.13 (0.855) 3.65E7 (1.39E7)* 7.15 E14 (2.71E14)* 2.84 E21 (1.21E21) 2,277.42 (1,171.59)
95% CI 0.63–6.92 0.40–3.87 8.39E6–6.47E7 1.68E14–1.26E15 3.96E20–5.29E21 94.35–4,649.18
SM
Mean (SE) 5.30 (1.56)y 2.47 (0.88)y 7.49E7 (2.36E7)y 3.25E15 (1.46E15) 3.87E22 (1.97E22) 4,516.24 (1,732.28)*
95% CI 2.15–8.45 0.689–4.24 2.71E7–1.23E8 2.99E14–6.21E15 1.21E21–7.86E22 1,009.41–8,023.07
Statistical measures are reported as mean difference (SE) and 95% CI of the difference. Mean difference is defined as the average absolute
difference of group means for each shape descriptor (independent values).
BF-SH, biceps femoris–short head; CI, confidence interval; COPD, chronic obstructive pulmonary disease; MDC, mean distance to the
centroid; RF, rectus femoris; SDC, standard deviation of distances to the centroid; SE, standard error; SM, semimembranosus; VI, vastus in-
termedius; VM, vastus medialis.
*Significant difference between groups at P < .01.ySignificant difference between groups at P < .005.
HAJGHANBARI ET AL Academic Radiology, Vol 18, No 2, February 2011
the normal group, without a concomitant increase in muscle
volume. To understand these results, it is important to note
that these three measures are different in the way they describe
the muscle size, and the term ‘‘muscle size’’ can imply different
meanings. For example, the ‘‘size’’ of a sphere increases as its
volume, surface area, or MDC (or radius) increases. However,
these three measures relate differently to the radius r of the
sphere; volume is proportional to r3, surface area is proportional
to r2, andMDCisproportional to r, and so theyall relate to ‘‘size’’
in different ways. Some size measures are more sensitive to
changes in the radius or thickness of the muscle than others.
For example, if the radius doubles, the volume will increase
by an approximate factor of 8, whereas the surface area only
increases by an approximate factor of 4.
The SDC measure reflects the variability in the thickness
(or radius) of the entire muscle, or portions thereof, in global
and regional analysis respectively. The closer SDC is to zero,
the more constant the thickness of the muscle and the more
closely the muscle approximates a sphere shape with a fixed
radius from the center to any point on the surface. As such,
the significant increase in SDC alone indicates that regardless
of differences in volume, the thickness differs along the muscle
or muscle section. Likewise, the lower SDC indicates fewer
indentations on the surface and smoother muscle periphery.
Physiologic Implications of Global and RegionalMeasurements
Our results indicated that the semimembranosus and vastus
intermedius had smaller or fewer indentations or folds
162
(lower SDC) at their periphery in the COPD group. Three
possible reasons might explain this lower surface irregu-
larity in patients with COPD. First, in the elderly, fascicles
within the muscle become shorter and less pennate (24,25),
mainly because of decreases in the contractile tissue packed
along the tendon aponeurosis (24). Second, this phenom-
enon becomes even more apparent in cases of disuse (26).
Because knee extensors are primarily pennate muscles
(27), it is likely that they are more susceptible to the
pennation-reducing effects of disuse in COPD, resulting
in a reduction in the indentation of the muscle surface.
Third, the selective atrophy of type II fibers in COPD
(28), which are more superficially distributed in the quad-
riceps (29), might also contribute to the reduced surface
irregularity.
Moreover, lower regional surface area and SDC were
detected, while muscle volumes were only nonsignificantly
lower in patients with COPD. This might be related to
age-related and disuse-related reductions in pennation angle
and atrophy of superficial type II fibers of knee extensors in
the COPD group, as discussed above. Other contributing
factors to the loss of regional surface irregularity could
include regional neuropathic changes with associated moto-
neuron death and/or muscle cell apoptosis, which would
lead to a marked decrease in the number as well as the
size of muscle fibers. Previous studies provide evidence in
support of polyneuropathy (30,31) and skeletal muscle
myopathy (30) due to local increases in cytokines and reac-
tive oxygen species within the muscle as well as corticoste-
roid use (32) in COPD.

Figure 7. Sampling distribution of surface area (top), mean distance
to the centroid (MDC;middle), and standard deviation of distances to
the centroid (SDC; bottom) for the vastus intermedius. COPD,chronic obstructive pulmonary disease.
Academic Radiology, Vol 18, No 2, February 2011 MRI-BASED 3D SHAPE ANALYSIS OF THIGH MUSCLES
Distribution of Shape Abnormalities and AtrophyAmong Thigh Muscles in COPD
In the regional analysis, most differences between groups were
found in the middle two regions, not regions I (distal) or IV
(proximal), of the muscles. This could be related to the fact
that thigh muscles taper closer to their origins and insertions
such that less muscle mass is present in the end regions.
Furthermore, although shape abnormalities were present
throughout the middle to proximal regions of the knee
extensor, morphologic anomalies were less evident among
knee flexors and were mainly restricted to the distal regions
closer to the insertion of the muscles (ie, region II of the semi-
membranosus). Significant atrophy of the middle two regions
of the vastus lateralis and region II of the semimembranosus
was evidenced by the reductions in volume and surface area
of these sections in the COPD group. The differential patterns
of shape abnormalities between knee extensors and flexors
require further study. One possibility is that this variability
could be related to the increased muscle fat infiltration
(12,33), neuropathy, and polyneuropathy (30,31) that are
characteristic of COPD. In line with this, selective
pathology of femoral or tibial nerves or branches, or
regional loss of motor neurons, might be involved in the
regional atrophy of these muscles.
Measurement of Muscle Volume and Comparison toPrevious Studies
We found no significant differences in muscle volumes
between the two groups in our global analysis, although values
tended to be lower in patients with COPD. Our results are
discordant with those of previous studies that described lower
muscle volumes in patients with COPD compared to healthy
controls (3,7,12). This discrepancy might be due to different
methodologies used to estimate muscle size. Previous studies
reported on muscle groups (3,12), rather than individual
thigh muscles, which may have masked and diminished
variances in regional muscle atrophy. A second issue is the
small sample sizes and locations of the thigh muscle slices
used to estimate volume in previous studies. A single CSA
(3,7) at the midthigh or the CSA of a number of slices (12)
was used to estimate thigh muscle mass in these studies. Mid-
thigh measures may represent the largest differences between
healthy subjects and those with COPD, so a single slice at the
midthigh may exaggerate differences between COPD and
healthy subjects. Even when using multiple slices (12), muscle
volumes were calculated by summing 17 selected slices plus
estimated volumes of intermediate sections on the basis of
the truncated cone formula. This technique is based on the
tenuous assumption that the muscle is conical in shape, which
may not accurately reflect thigh muscle shapes (6,34).
Automated Group Classification on the Basis of ShapeMeasures
The trained SVM-based classifier is capable of distinguishing
between the COPD and healthy groups with an accuracy of
95% to 100% across the eight thigh muscles examined.
Although it was not our objective to immediately develop
a computer-aided diagnosis system for individual thigh
muscles, the accuracy of these classifications provide
support for future work to translate this technique to the
clinic.
163
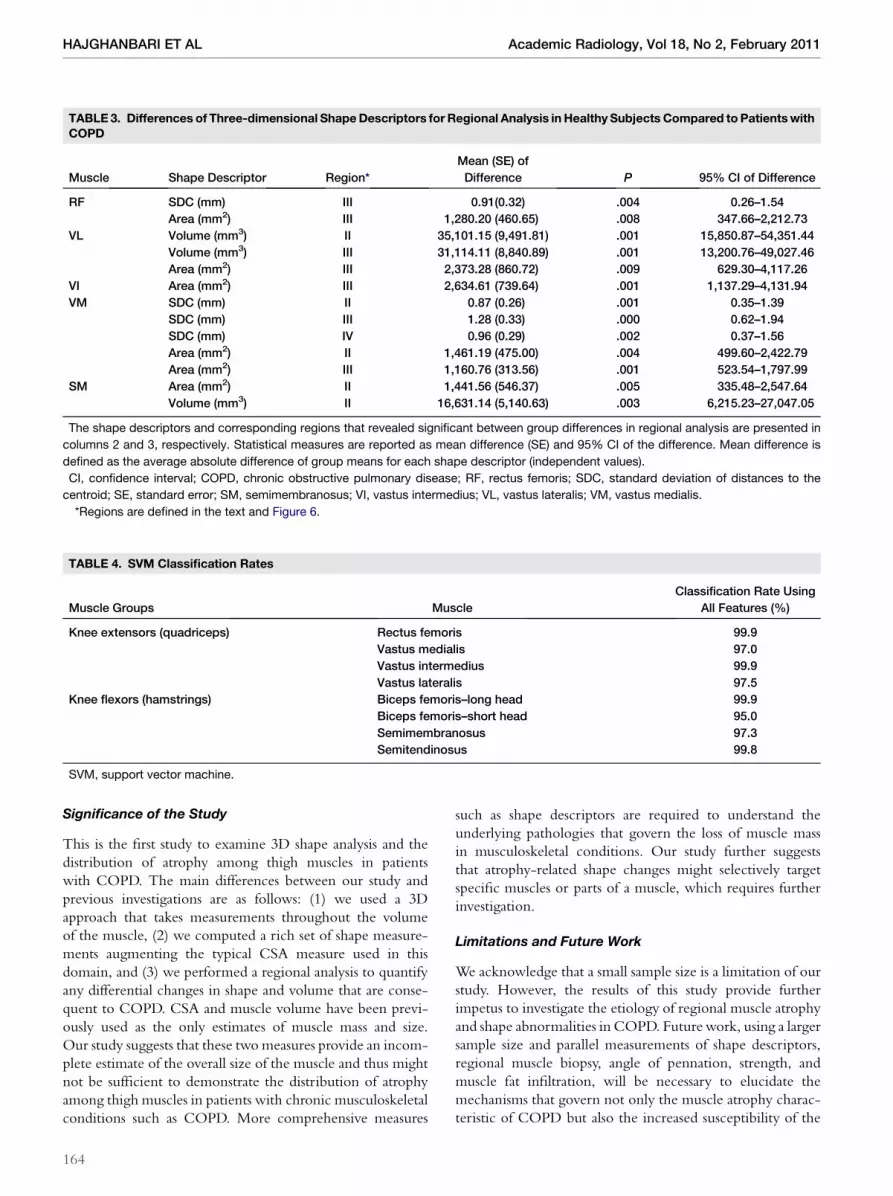
TABLE 3. Differences of Three-dimensional ShapeDescriptors for Regional Analysis in Healthy Subjects Compared to PatientswithCOPD
Muscle Shape Descriptor Region*
Mean (SE) of
Difference P 95% CI of Difference
RF SDC (mm) III 0.91(0.32) .004 0.26–1.54
Area (mm2) III 1,280.20 (460.65) .008 347.66–2,212.73
VL Volume (mm3) II 35,101.15 (9,491.81) .001 15,850.87–54,351.44
Volume (mm3) III 31,114.11 (8,840.89) .001 13,200.76–49,027.46
Area (mm2) III 2,373.28 (860.72) .009 629.30–4,117.26
VI Area (mm2) III 2,634.61 (739.64) .001 1,137.29–4,131.94
VM SDC (mm) II 0.87 (0.26) .001 0.35–1.39
SDC (mm) III 1.28 (0.33) .000 0.62–1.94
SDC (mm) IV 0.96 (0.29) .002 0.37–1.56
Area (mm2) II 1,461.19 (475.00) .004 499.60–2,422.79
Area (mm2) III 1,160.76 (313.56) .001 523.54–1,797.99
SM Area (mm2) II 1,441.56 (546.37) .005 335.48–2,547.64
Volume (mm3) II 16,631.14 (5,140.63) .003 6,215.23–27,047.05
The shape descriptors and corresponding regions that revealed significant between group differences in regional analysis are presented in
columns 2 and 3, respectively. Statistical measures are reported as mean difference (SE) and 95% CI of the difference. Mean difference is
defined as the average absolute difference of group means for each shape descriptor (independent values).
CI, confidence interval; COPD, chronic obstructive pulmonary disease; RF, rectus femoris; SDC, standard deviation of distances to the
centroid; SE, standard error; SM, semimembranosus; VI, vastus intermedius; VL, vastus lateralis; VM, vastus medialis.
*Regions are defined in the text and Figure 6.
TABLE 4. SVM Classification Rates
Muscle Groups Muscle
Classification Rate Using
All Features (%)
Knee extensors (quadriceps) Rectus femoris 99.9
Vastus medialis 97.0
Vastus intermedius 99.9
Vastus lateralis 97.5
Knee flexors (hamstrings) Biceps femoris–long head 99.9
Biceps femoris–short head 95.0
Semimembranosus 97.3
Semitendinosus 99.8
SVM, support vector machine.
HAJGHANBARI ET AL Academic Radiology, Vol 18, No 2, February 2011
Significance of the Study
This is the first study to examine 3D shape analysis and the
distribution of atrophy among thigh muscles in patients
with COPD. The main differences between our study and
previous investigations are as follows: (1) we used a 3D
approach that takes measurements throughout the volume
of the muscle, (2) we computed a rich set of shape measure-
ments augmenting the typical CSA measure used in this
domain, and (3) we performed a regional analysis to quantify
any differential changes in shape and volume that are conse-
quent to COPD. CSA and muscle volume have been previ-
ously used as the only estimates of muscle mass and size.
Our study suggests that these twomeasures provide an incom-
plete estimate of the overall size of the muscle and thus might
not be sufficient to demonstrate the distribution of atrophy
among thigh muscles in patients with chronic musculoskeletal
conditions such as COPD. More comprehensive measures
164
such as shape descriptors are required to understand the
underlying pathologies that govern the loss of muscle mass
in musculoskeletal conditions. Our study further suggests
that atrophy-related shape changes might selectively target
specific muscles or parts of a muscle, which requires further
investigation.
Limitations and Future Work
We acknowledge that a small sample size is a limitation of our
study. However, the results of this study provide further
impetus to investigate the etiology of regional muscle atrophy
and shape abnormalities in COPD. Futurework, using a larger
sample size and parallel measurements of shape descriptors,
regional muscle biopsy, angle of pennation, strength, and
muscle fat infiltration, will be necessary to elucidate the
mechanisms that govern not only the muscle atrophy charac-
teristic of COPD but also the increased susceptibility of the

Academic Radiology, Vol 18, No 2, February 2011 MRI-BASED 3D SHAPE ANALYSIS OF THIGH MUSCLES
muscles of the anterior thigh to atrophy-related anatomic
anomalies. The presence of muscle weakness in patients
with COPD is well established. However, it is unclear
whether it is secondary to loss of muscle mass or rather to defi-
cits in muscle contractile function, fiber type distribution,
neuromuscular activation, or some combination thereof. A
better understanding of the pattern and etiology of COPD-
related muscle atrophy and morphologic abnormalities would
aid in the design of rehabilitative strategies for the purpose of
improving age-related loss of muscle mass (sarcopenia) and
physical disability among this population.
Future work is also motivated by the results given by the 3D
moment invariant measures, which showed significant differ-
ences between the healthy and COPD groups. These
measures could potentially be useful to the eventual
computer-aided diagnosis of muscle abnormalities conse-
quent to COPD or other disorders that affect muscle. Their
efficacy in group differentiation also motivates future research
exploring the utility of fine-scale, intuitive, localized shape
representations, such as M-reps (35) and medial patches (36).
CONCLUSIONS
Our study reveals that among the thigh muscles, morphologic
changes appear more in knee extensor muscles than in knee
flexors in patients with COPD. Furthermore, shape differ-
ences are most apparent in the middle to proximal regions
of the knee extensors and the lower regions of the knee flexors
in patients with COPD. These findings could inform the
design of strength training programs as well as targeted
prescription of therapeutics, such as neuromuscular electrical
stimulation and biofeedback, to the more affected muscles or
muscle sections. Our study suggests a need for more attention
to the middle to proximal regions of the knee extensors
(regions showing more atrophy or shape abnormalities).
Furthermore, hypertrophied muscle is reported to have
a higher angle of pennation compared with untrained muscle
(26). Therefore, it is likely that a more appropriately localized
treatment approach could improve the pennation angle in
affected muscle regions in COPD.
REFERENCES
1. Gosselink R, Troosters T, Decramer M. Peripheral muscle weakness
contributes to exercise limitation in COPD. Am J Respir Crit Care Med
1996; 153:976–980.
2. Nici L, Donner C, Wouters E, et al. American Thoracic Society/European
Respiratory Society statement on pulmonary rehabilitation. Am J Respir
Crit Care Med 2006; 173:1390–1413.
3. Bernard S, LeBlanc P, Whittom F, et al. Peripheral muscle weakness in
patients with chronic obstructive pulmonary disease. Am J Respir Crit
Care Med 1998; 158:629–634.
4. Casaburi R. Skeletal muscle dysfunction in chronic obstructive pulmonary
disease. Med Sci Sports Exerc 2001; 33:S662–S670.
5. Engstrom CM, Loeb GE, Reid JG, et al. Morphometry of the human thigh
muscles: a comparison between anatomical sections and computer
tomographic and magnetic resonance images. J Anat 1991; 176:
139–156.
6. Tracy BL, Ivey FM, Metter JE, et al. A more efficient magnetic resonance
imaging-based strategy for measuring quadriceps muscle volume. Med
Sci Sports Exerc 2003; 35:425–433.
7. Seymour JM, Ward K, Sidhu PS, et al. Ultrasound measurement of rectus
femoris cross-sectional area and the relationship with quadriceps strength
in COPD. Thorax 2009; 64:418–423.
8. Marquis K, Debigare R, Lacasse Y, et al. Midthigh muscle cross-sectional
area is a better predictor of mortality than bodymass index in patients with
chronic obstructive pulmonary disease. Am J Respir Crit Care Med 2002;
166:809–813.
9. Akima H, Kano Y, Enomoto Y, et al. Muscle function in 164 men and
women aged 20-84 yr. Med Sci Sports Exerc 2001; 33:220–226.
10. Visser M, Goodpaster BH, Kritchevsky SB, et al. Muscle mass, muscle
strength, and muscle fat infiltration as predictors of incident mobility limi-
tations in well-functioning older persons. J Gerontol A Biol Sci Med Sci
2005; 60:324–333.
11. Overend TJ, Cunningham DA, Kramer JF, et al. Knee extensor and knee
flexor strength: cross-sectional area ratios in young and elderly men.
J Gerontol 1992; 47:M204–M210.
12. Mathur S, Takai KP, Macintyre DL, et al. Estimation of thigh muscle mass
with magnetic resonance imaging in older adults and people with chronic
obstructive pulmonary disease. Phys Ther 2008; 88:219–230.
13. Global Initiative for Obstructive Lung Disease. Global strategy for the diag-
nosis, management and prevention of chronic obstructive pulmonary
disease. Bethesda,MD: National Heart, Lung and Blood Institute, 2004. 6–8.
14. American Thoracic Society/European Respiratory Society. Skeletal
muscle dysfunction in chronic obstructive pulmonary disease: a statement
of the American Thoracic Society and the European Respiratory Society.
Am J Respir Crit Care Med 1999; 159:S1–S40.
15. Yushkevich PA, Piven J, Hazlett HC, et al. User-guided 3D active contour
segmentation of anatomical structures: significantly improved efficiency
and reliability. Neuroimage 2006; 31:1116–1128.
16. Agur AMR, Grant JCB, Dalley AF. Grant’s atlas of anatomy. 12th ed. Phil-
adelphia: Lippincott Williams & Wilkins, 2009.
17. Marinkovic S, Schellinger D, Milisavljevic M, et al. Sectional and MRI
anatomy of the human body: a photographic atlas. Stuttgart, Germany:
Thieme Verlag, 2000.
18. Willan PLT,RansomeJA,MahonM.Variability in humanquadricepsmuscles:
Quantitativestudyand reviewofclinical literature.ClinAnat2002;15:116–128.
19. Sadjadi FA, Hall EL. Three dimensional moment invariants. IEEE PAMI
1980; 2:127–136.
20. Ward AD, Hamarneh G, Ashry R, et al. 3D shape analysis of the supraspi-
natus muscle: a clinical study of the relationship between shape and
pathology. Acad Radiol 2007; 14:1229–1241.
21. Lorensen WE, Cline HE. Marching cubes: a high resolution 3D surface
construction algorithm. Comput Graph 1987; 21:163–169.
22. Pocock SJ, Geller NL, Tsiatis AA. The analysis of multiple endpoints in clin-
ical trials. Biometrics 1987; 43:487–498.
23. Fradkin D, Muchnik I. Support vector machines for classification. DIMACS
Ser Discrete Math Theoret Comput Sci 2006; 70:13–20.
24. Narici MV, Capodaglio P. Changes in muscle size and architecture in
disuse-atrophy. In: Capodaglio P, Narici MV, eds. Muscle atrophy: disuse
and disease. Pavia, Italy: PI-ME Press, 1998; 55–63.
25. Kubo K, Kanehisa H, AzumaK, et al. Muscle architectural characteristics in
young and elderly men and women. Int J Sports Med 2003; 24:125–130.
26. Kawakami Y, Abe T, Fukunaga T. Muscle-fiber pennation angles are
greater in hypertrophied than in normal muscles. J Appl Physiol 1993;
74:2740–2744.
27. Kendall FP, McCreary EK, Provance PG, et al. Muscles: testing and func-
tion with posture and pain. 5th ed. Baltimore, MD: Lippincott Williams &
Wilkins, 2005.
28. Gosker HR, Engelen MP, van Mameren H, et al. Muscle fiber type IIX
atrophy is involved in the loss of fat-free mass in chronic obstructive
pulmonary disease. Am J Clin Nutr 2002; 76:113–119.
29. Johnson MA, Polgar J, Weightman D, et al. Data on the distribution of fibre
types in thirty-six humanmuscles: an autopsy study. J Neurol Sci 1973; 18:
111–129.
30. Faden A, Mendoza E, Flynn F. Subclinical neuropathy associated with
chronic obstructive pulmonary disease: possible pathophysiologic role
of smoking. Arch Neurol 1981; 38:639–642.
31. Pozza JJ, Marti-Masso JF. Peripheral neuropathy associated with chronic
obstructive pulmonary disease. Neurologia 1997; 12:12389–12394.
32. Agusti AGN, Noguera A, Sauleda J, et al. Systemic effects of chronic
obstructive pulmonary disease. Eur Respir J 2003; 21:347–360.
165

HAJGHANBARI ET AL Academic Radiology, Vol 18, No 2, February 2011
33. Mathur S, MacIntyre DL, Forster BB, et al. Fat infiltration in the quadriceps
and hamstrings in people with COPD and lung transplant recipients. Med
Sci Sports Exerc 2005; 37:S243–S244.
34. Roberts N, Cruz-Orive LM, Reid MK, et al. Unbiased estimation of human
body composition by the cavalieri method using magnetic resonance
imaging. J Microsc 1993; 171:239–253.
166
35. Pizer SM, Fletcher PT, Joshi S, et al. Deformable M-reps for 3D medical
image segmentation. Int J Comput Vis 2003; 55:85–106.
36. Hamarneh G, Ward AD, Frank R. Quantification and visualization of local-
ized and intuitive shape variability using a novel medial-based shape
representation. Proc IEEE Conf Int Symp Biomed Imaging 2007;
1232–1235.


![[MRI of extraperitoneal rectal carcinoma]](https://img.pdfslide.net/doc/110x75/635a8910ef8fb73aab01ca90/mri-of-extraperitoneal-rectal-carcinoma.jpg)


