Embed Size (px)
Citation preview

Multi-Source Video Streaming Suite
Pablo Rodrıguez-Bocca1,2, Gerardo Rubino2, and Luis Stabile2
1 Instituto de Computacion - Facultad de IngenierıaUniversidad de la Republica,
Julio Herrera y Reissig 565, 11300,Montevideo, [email protected]
2 Inria/IrisaCampus universitaire de Beaulieu
35042 Rennes, France
Abstract. This paper presents a method for the distribution of videoflows through several paths of an IP network. We call the approach multi-source focusing on the fact that, from the receiver’s point of view, thestream is obtained from several different sources. A typical use of ourprocedure is in the design of a P2P network for streaming applications.We implemented a tool in VLC which can send video streaming frommultiple sources. In this paper, we describe the method together withthe design decisions and the operation characteristics of the tool. Finallywe consider, at the receiver side, the perceived quality, automaticallymeasured using the PSQA methodology. We illustrate the work of thetool by means of some tests.Keywords: multi-source, Internet Protocol, VLC, PSQA
1 Introduction
The main objective of our tool is the distribution of video flows through severalpaths of an IP network. We call the approach multi-source focusing on the factthat, from the receiver’s point of view, the stream is obtained from several differ-ent sources. The idea is to resist to the possible failures of the servers distributingsomehow the associated risks. Therefore, multi-source streaming techniques areused typically in P2P networks, where the peers become often disconnected.
Previous studies (see [1]) show that in 30-80% of the cases there is at leasta better end-to-end path, from the quality perspective, for a transmission. Inthe particular case of video flows, it is then easier to recover from isolated lossesthan from consecutive ones [2]. Another advantage of this approach is that ithelps to balance the load on the networks (we are not going to address this issuein this paper). The basic difference between the multi-path and multi-sourceconcepts is that in the former case we consider a single source sending data tothe destination following different paths. The main difficulty here is the routingaspects: we must specify and control which path must be followed by whichpacket in the flow. The multi-source approach implies that there are multipleand independent sources for the signal, and that some general scheme allows

2 P. Rodrıguez-Bocca et al.
the receiver to get the stream from a set of servers. Since they are different, thepath that the packets will follow would be a priori different, without any needof acting on the routing processes. Of course, in practice, the different pathscould share some nodes, which are good candidates to become bottlenecks ofthe communication system. Detecting such cases is an active research area [3].
A few studies consider the implementation needed to split and to mergestream content, especially when it is live video streaming. For instance, Nguyenand Zakhor [4] propose to stream video from multiple sources concurrently,thereby exploiting path diversity and increasing tolerance to packet loss. Ro-drigues and Biersack [5] show that parallel download of a large file from multiplereplicated servers achieves significantly shorter download times. Apostolopou-los [1,6] originally proposed using striped video and Multiple Description Coding(MDC) to exploit path diversity for increased robustness to packet loss. Theypropose building an overlay composed of relays, and having each stripe deliveredto the client using a different source. Besides the academic studies, some com-mercial networks for video distribution are available. Focusing in the P2P world(our main application here), the most successful ones are PPlive [7], SopCast [8],and TVUnetwork [9].
The paper is organized as follows. Section 2 introduces all relevant conceptsfor our project. In Section 3, a conceptual architecture of the components andthe complete solution is presented. It consists of modules added to the open codeVLC project of VideoLAN [10]. In Section 4 some first experimental results areintroduced. The main contributions of this work and conclusions are in Section 5.
2 Multi-Source Streaming
We will focus on the case of a P2P architecture where the video flow is decom-posed into pieces and sent through the network. Each node receives the flowfrom different sources and builds the original stream before it is played. At thesame time, it will, in general, send each of the substreams to a different client,acting then as a server. At the beginning, the (single) initial stream is split intoseveral substreams, according to some specific scheme.
With these goals, we need the two basic following services: (i) a flexible“splitter” where the original stream is decomposed into different substreams,and (ii) a module capable of reconstructing the original stream from the set ofsubstreams, or a degraded version of it if some of the substreams had losses, oris simply missing. Associated with these services we want to design a very flex-ible transport scheme, allowing to transport the original information plus someredundancy, with high control on which server sends which part of the flow andof the redundant information (see below). We also want to be able to measure,at the receiver side, the perceived quality, using the PSQA methodology.
Let us now briefly describe these different components of the project. Thesplitter must be able to obey a general scheme where we decide how manysubstreams are to be used, and which of the frames are to be sent throughwhich of the substreams. This generality allows us to send, for instance, most of

Multi-Source Video Streaming Suite 3
the frames through the highest performing nodes in the network, or to balancethe load among the different components, or to adopt a scheme where the typeof frame is used to take the routing decision. It must also be possible to sendan extra fraction r of the original stream, or of a specific population of theframes (for instance, the I frames) again according to any pre-specified scheme.If r = 0 there is no redundancy at all. If r = 0.2 we send 20% of supplementaryredundant data, and r = 1 means that the original stream is actually sent twiceto the receiver(s) We not consider r > 1 because, in a real system, this wouldmean too much bandwidth consumption. At the client side, we must be able toreconstruct the original stream if we receive all the frames, but also if only a partof the stream arrives; this typically happens when some of the servers fails (thatis, it disconnects from the P2P network). Last, the client must be able to identifythe lost frames and to compute statistics from them. We want also that the clientcomputes the value of the quality of the received stream, as evaluated by thePSQA tool, for instance for auditing the quality of the transmission system, orfor controlling purposes.
2.1 The PSQA Technology [11]
PSQA stands for Pseudo-Subjective Quality Assessment. It is a technique thatallow the building of a function mapping some measurable parameters chosenby the users into a numerical assessment of the perceived quality. The measuresare taken on the client side, and a good example is the end-to-end loss rate offrames. The mapping is done by showing many sequences to real human users,where these parameters took many different values, and performing subjectivetests in order to evaluate their quality values. Then, after statistically filteringthe results provided by these tests, a statistical learning tool is used that allowsto build the PSQA function. To use PSQA on the client side, we must be able tomeasure the parameters chosen at the beginning of the process, and then to callthe function. The latter is always a rational function of the parameters, whosevalue can be obtained very quickly, allowing PSQA to operate, if necessary, inreal time. The parameters are chosen at the beginning of the process. They canbe qualitative or quantitative. Their choice depend on the network and/or theapplication at hand, and of course the resulting PSQA procedure will be betterif the a priori choice is as relevant as possible.
We know from previous work on PSQA that the loss process is the mostimportant global factor for quality. In this paper, we consider the loss rates ofvideo frames, denoted by LR, and the mean size of loss bursts, MLBS , that is,the average length of a sequence of consecutive lost frames not contained in alonger such sequence. See [11] and the references therein for more details aboutPSQAs.

4 P. Rodrıguez-Bocca et al.
3 Design
This section will describe the main design decisions. There are K servers andeach server is identified by an index between 1 and K. See Figure 1 for anillustration.
Fig. 1. The multi-source scheme
3.1 Global Architecture
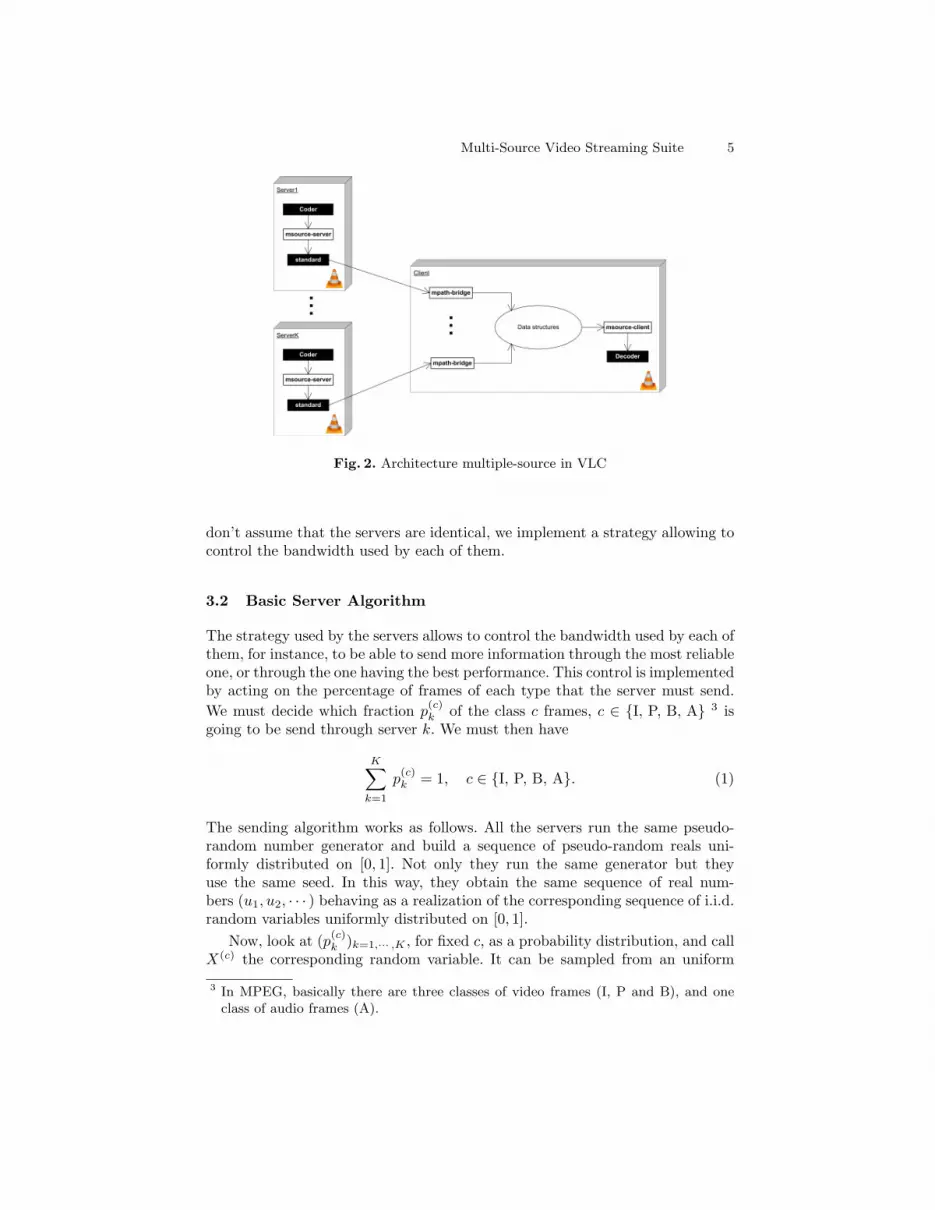
The implementation consists of three VLC modules, one at the server side andtwo at the client side. They are called msource-server, msource-bridge andmsource-client (see Figure 2).
The module msource-server, located at the server, decides which framesare to be sent to the client. It builds a substream for audio and another onefor video. The basic constraint to satisfy is, of course, that each frame in theoriginal stream must be sent at least once by one of the servers. Once the framesselected by msource-server, the module standard of VLC sends them to theclient.
At the client’s side, there are K modules msource-bridge, one per serverand each with its own buffer. The kth one receives the frames sent by server k.The last module, msource-client, receives the flows sent by the K modulesmsource-bridge and reconstructs the stream. This task consists of ordering theframes according to their decoding time (called DTS). The output of a modulemsource-client can be stored on the local disk, sent somewhere through thenetwork (both tasks are performed by the module standard, which is a part ofthe VLC package) or played by the client.
The ideal case is when all the servers start their transmissions simultaneouslyand keep synchronized, but this never happens in practice. It means that thesystem must handle the possible shift between the servers. Moreover, since we
Multi-Source Video Streaming Suite 5
Fig. 2. Architecture multiple-source in VLC
don’t assume that the servers are identical, we implement a strategy allowing tocontrol the bandwidth used by each of them.
3.2 Basic Server Algorithm
The strategy used by the servers allows to control the bandwidth used by each ofthem, for instance, to be able to send more information through the most reliableone, or through the one having the best performance. This control is implementedby acting on the percentage of frames of each type that the server must send.We must decide which fraction p
(c)k of the class c frames, c ∈ {I, P, B, A} 3 is
going to be send through server k. We must then have
K∑k=1
p(c)k = 1, c ∈ {I, P, B, A}. (1)
The sending algorithm works as follows. All the servers run the same pseudo-random number generator and build a sequence of pseudo-random reals uni-formly distributed on [0, 1]. Not only they run the same generator but theyuse the same seed. In this way, they obtain the same sequence of real num-bers (u1, u2, · · · ) behaving as a realization of the corresponding sequence of i.i.d.random variables uniformly distributed on [0, 1].
Now, look at (p(c)k )k=1,··· ,K , for fixed c, as a probability distribution, and call
X(c) the corresponding random variable. It can be sampled from an uniform
3 In MPEG, basically there are three classes of video frames (I, P and B), and oneclass of audio frames (A).

6 P. Rodrıguez-Bocca et al.
random variable U using the classical algorithm given by
X(c) = k ⇐⇒ P(c)k−1 ≤ U < P
(c)k , (2)
where P(c)j = p
(c)1 + · · ·+ p
(c)j , j = 1, · · · ,K, and P
(c)0 = 0.
Now, let fn be the nth frame of the stream, n ≥ 1, and let cn ∈ {I, P, B, A}be the class of fn. Any of the K servers will then run the same algorithm.They all sample the random variable X(c), and obtain the same value sn, with1 ≤ sn ≤ K. That is, they all look at the type of fn, and use (2). Server sn
sends fn and the remaining servers don’t. This construction guarantees that oneand only one server sends each frame, and since sn behaves as a realization ofrandom variable X(c), after sending many frames the fraction of type c framessent by server k will be close to p
(c)k . Observe that this method allows to control
the bandwidth of each server in a scalable way (there is no limit on the numberof servers nor on the distribution of the load among them).
3.3 Controlling the Redundancy Level
With our method we can send some redundancy to the client. This, togetherwith our splitting procedure, adds robustness to the system, in order to face theproblem of possible server failures (recall that we call failure any event causingthe server to stop sending, for instance, because it simply left the network). Aswe will see in next subsection, redundancy also allows us to design a simplesolution to the problem of synchronizing. We describe here the way we controlthe redundancy level in the system.
We allow the system to send redundant frames up to sending again the wholestream, and we provide a precise mechanism to control with high precision theredundancy level and the distribution of the supplementary load among the Kservers. For this purpose, we implement a system where a given frame is senteither once or twice, and in the latter case, by two different servers. Our methodallows to control the redundancy level per class, for instance, for each class offrames (I, P, B). We denote by r(c) the fraction of supplementary class-c framesthat will be sent to the client (by the set of servers). So, each server k mustdecide if it sends frame fn as the “original” frame, as a copy for redundancy,or not at all. The procedure described before allows to choose the server thatsends the frame as the original one. For the redundacy, the implementation isalso probabilistic. We proceed as follows. Together with the stream of pseudo-random numbers used to make the first assignment we described before, the setof servers build a second sequence (v1, v2, · · · ) with the same characteristics (thesame for all servers, the same seed). Suppose that frame fn is of class c and thatit is assigned to some other server j, j 6= k. Then, using the second sequence(v1, v2, · · · ), server k samples a second random variable with values in the set{1, 2, · · · ,K} to decide at the same time if a redundant copy of the frame is to besend and if it must send it. Let us call Y
(c)j this random variable. Its distribution

Multi-Source Video Streaming Suite 7
is the following: Pr(Y (c)j = j) = 1− r(c) and if m 6= j,
Pr(Y (c)j = m) =
p(c)m∑
h: h6=m p(c)h
r(c) =p(c)m
1− p(c)j
r(c).
If Y(c)j = j, no redundancy is sent. If Y
(c)j = m, m 6= j, server m is the only one
to send the frame as a redundant one.
3.4 Client Behavior
The client must reconstruct the stream using the flows received from the differentservers. It will work even if some of the servers are missing (failed). Each serversends its streams marked with a time stamp indicating its playtime with respectto a specific reference (in VLC, 1/1/1970). Assuming all the servers synchronized,the algorithm is simple: it consists of selecting as the next frame the one havingthe smallest value of playtime. The problem is the possible shift between theservers (whose locations are different in the network). This can be due to theconditions encountered by the packets in their travelling through the network,or by the processing of the frames at the servers themselves. The key idea forknowing this shift in the transmission time of the servers consists of using theredundant frames.
First, let us look at the identification of the redundant frames. Each frameis sent with a time stamp corresponding to its playtime at the client side (com-puted by VLC). When receiving it, a Message-Digest algorithm 5 (MD5) [12]is computed and a dictionary is maintained to see if an arriving frame has al-ready been received (necessarily by a different server). If the frame arrives forthe first time, we store its MD5 together with its time stamp. Assume now thatthe same frame arrived from two different servers i and j, and call τi and τj thecorresponding time stamps. The difference between these values is the (current)shift between the two servers. We denote it by ∆ij , that is, ∆ij = τi− τj . Let usdenote by ∆ the K ×K matrix (∆ij) where we define ∆ii = 0 for all server i.Observe that ∆ji = −∆ij . Following these observations, we maintain such amatrix, initialized to 0, and we modify it each time a new redundant frame isdetected (actually we do it less often, but this is a detail here). Observe that rowsi and j in the matrix, i 6= j, are obtained by adding a constant element per ele-ment (or, equivalently, see that ∆ij = ∆ik +∆kj). This constant is precisely thedelay between the corresponding servers. The same happens with the columns.All this in other words: if we receive K − 1 redundant pairs corresponding toK − 1 different pairs of servers, we can build the whole matrix.
Each time we update matrix ∆, we can compute the index d of the mostdelayed server (if any), by choosing any row4 in ∆ and by computing its smallestelement. Then, using for instance row 1, d = argmin{j : ∆1j}. When the clientnow looks for the next frame to choose, it scans the K buffers corresponding4 Actually, we can choose any row if all the entries of ∆ have been computed; otherwise,
we choose the row having the largest number of computed entries.

8 P. Rodrıguez-Bocca et al.
to the K servers. Let us denote by τk the time stamp of the first frame in thekth buffer (assume for the moment that no buffer is empty). Then, we firstmake the correcting operation τ ′
k = τk + ∆dk, that is, we synchronize withthe time of the most delayed server, and then we look for the server m wherem = argmin{k : τ ′
k}. Next frame to be played will be the one in head of buffer m.This works as long as there are frames in buffer d. If it is empty after a play,we must wait for an arrival there, because we have no information about whichserver will be sending next frame to play. Of course, we must wait until some timeout because if server d for some reason stopped sending, we block the system ifwe remain waiting for its frames. After some amount of time, we move to theframe having the smallest time to play using the previous procedure.
Observe that, at the price of an extra computation at the client’s side, weare able to synchronize efficiently the substreams without any signalling traffic,and using the same data that protects the system against failures.
4 Evaluation and first results
For testing the correctness of our prototype, we implemented a program thatcollects complete traces of the sequences of frames sent by the servers and re-ceived by the client. These traces allows us to determine, for each frame, whichserver sent it and if it was played of not by the client. The program also collectssome other data as the amount of frames sent, the used bandwidth, etc.
4.1 Testing the bandwidth used
The goal of the tests we will describe here is to measure the bandwidth usedby the servers. This can be compared with the values provided by a theoreticalanalysis of the system, to check the consistency of the implementation. We willuse two different models for distributing the load among the servers. The firstone consists of sharing it uniformly among the K servers, that is, all of themsend the same fraction 1/K (quantitatively speaking) of the global stream. Inthe second model, we use a geometric distribution: server i sends 1/2ith of thestream, for i = 1, 2, · · · ,K − 1 and server K sends the fraction 1/2K−1.
Consider the uniform case, in which we send the stream with a redundancylevel of r. If BW unif
K,i denotes the bandwidth used by server i, then clearlyBW unif
K,i = (1 + r)/K. The case of our geometric load is a little bit more in-volved. If BW geo
K,i is the bandwidth used by server i in this case, we have
BW geoK,i =
12i
+r
2i
(1− 1
2i
)if i 6= K
12K−1
+r
2K−1
(1− 1
2K−1
)if i = K
, K ≥ i ≥ 1. (3)
In our tests, we used the value r = 0.5. In Table 1 we show the Mean SquaredError between the bandwidth measured during our experiments and the theo-retical values in the two distribution models considered, uniform and geometric.

Multi-Source Video Streaming Suite 9
We evaluated the used bandwidth by extracting information automatically com-puted by the standard VLC modules. This consists of multiplying the numberof frames sent in each class (I, P, ...) by the average size of these frames, andthen by dividing by the used time. We then get an approximation of the usedbandwidth. This, plus the losses (see next subsection) explains the differencesbetween expected and observed values. Observe that we sum over all servers,which means that the effects of the randomness used are not responsible of anypart of the observed differences.
K Uniform Geometric
1 0.00000 0.000002 0.00005 0.000053 0.00013 0.003224 0.00006 0.003105 0.00008 0.002436 0.00005 0.002077 0.00006 0.001718 0.00004 0.001499 0.00009 0.0013410 0.00011 0.00125
Table 1. Mean Squared Error between theoretical and observed values of the usedbandwidth, as a function of the total number K of servers. The error is computedsumming on i, the server index, from 1 to K.
4.2 Measuring losses
In our preliminary prototype, there are some frame losses at the beginning of thetransmission, because we assume no specific effort is made to synchronize the Kservers (this extreme situation is considered for testing purposes). There is, then,a transient phase during which the system will loose information until there havebeen enough redundancies allowing to synchronize the flows using the proceduredescribed before. Then, during the transmission, in other stressing experimentalsituations, some of the servers may have very few frames to send, which can makethe synchronization process again slower to converge, until redundant frames arefinally sent.
We computed the loss rates by comparing the sent and received frame se-quences. We arbitrarily eliminated the first parts of the flows until observing50 consecutive frames correctly sent, because this implies in general that the Kservers are synchronized. Again, the goal is to check that even using this roughtesting procedure, the observed loss ratios are small enough. We used the sameloads as in Subsection 4.1. In Table 2 we show the observed loss rates, during 2K

10 P. Rodrıguez-Bocca et al.
experiments using k servers, 1 ≤ k ≤ K, and both the uniform and geometricload distributions.
K loss rate (uniform load) loss rate (geometric load)
1 0.0000 0.00002 0.0049 0.00493 0.0070 0.00804 0.0083 0.00665 0.0080 0.00706 0.0080 0.00727 0.0083 0.02208 0.0093 0.01869 0.0090 0.018210 0.0129 0.0222
Table 2. Estimated loss rates after synchronization, as a function of the number K ofservers used, for the two load models considered
Observe the fact that in the geometric model, we measure some “peak” valuesof the loss rates for high values of K. This is due to the fact that in this loadmodel there are servers that send a small number of frames. Specifically, allthe servers with index i ≥ 7 send (1/26)th of the original video. These serversnever succeed in synchronizing because of the lack of redundant frames sent.This implies that the decoding time of the frames sent by these servers will notbe correctly computed because the shifts will not been known by the system.The final consequence of this is that those frames will be discarded.
4.3 Perceived quality
In this last subsection, we consider the perceived quality of the reconstructedstream. In the experiments mentioned here, the goal is to test the consistency ofthe system, and not its performances (this will be the object of further studies).However, we underline here the way the connection is made with the quality asperceived by the user.
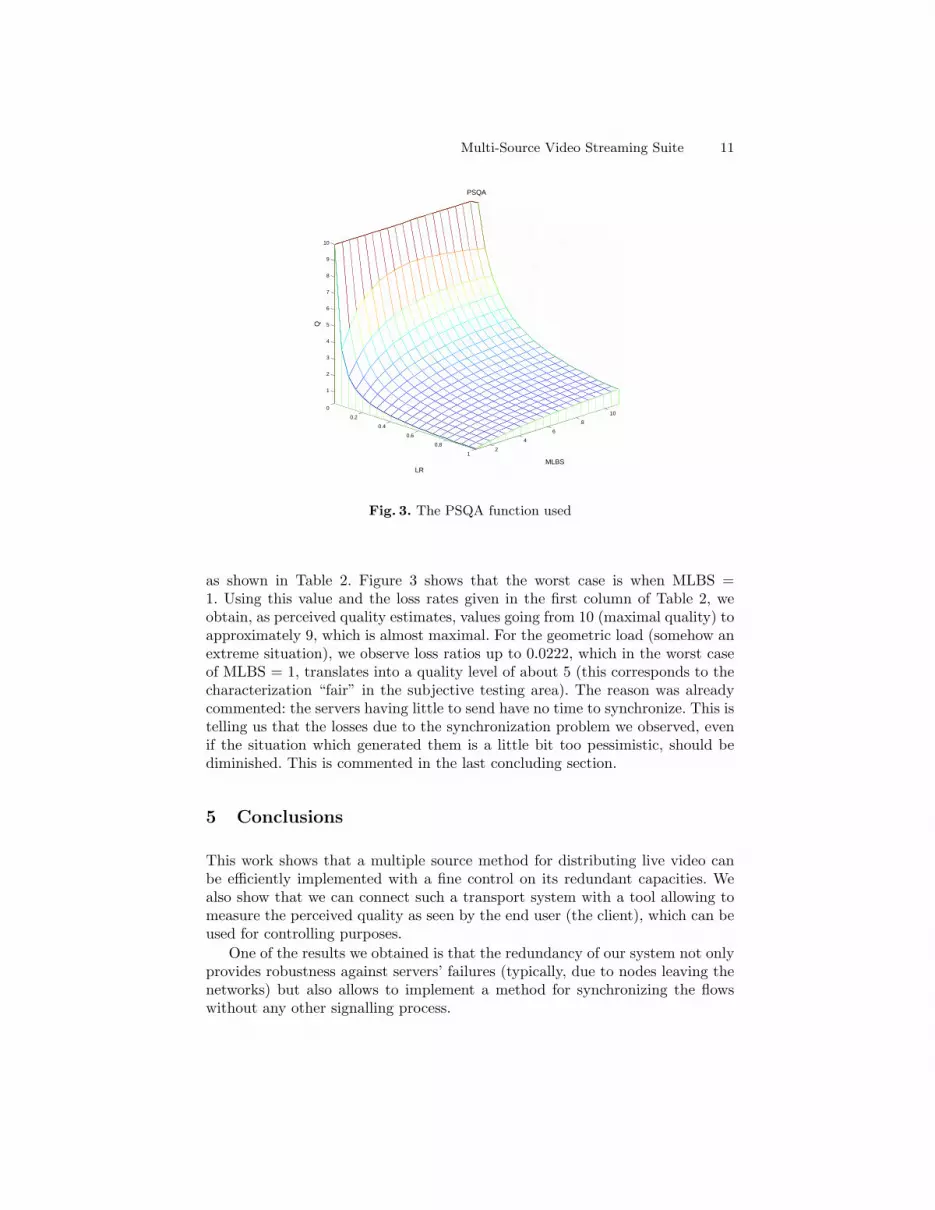
The PSQA technology provides us with a function Q = Q(LR,MLBS ). InFigure 3 we plot the curve obtained following the PSQA procedure (see [11] for ageneral presentation of the PSQA approach and metrics such as LR and MLBS;see [13] for an example of application). First, observe that the quality is muchmore sensitive to losses than to the average size of the loss bursts. If we wantto estimate the quality as perceived by the user, we must just measure the LRand MLBS and call the Q function using the measured values as input data.For instance, consider the loss rates obtained using the uniform load model,
Multi-Source Video Streaming Suite 11
0
0.2
0.4
0.6
0.8
12
4
6
8
10
1
2
3
4
5
6
7
8
9
10
MLBS
PSQA
LR
Q
Fig. 3. The PSQA function used
as shown in Table 2. Figure 3 shows that the worst case is when MLBS =1. Using this value and the loss rates given in the first column of Table 2, weobtain, as perceived quality estimates, values going from 10 (maximal quality) toapproximately 9, which is almost maximal. For the geometric load (somehow anextreme situation), we observe loss ratios up to 0.0222, which in the worst caseof MLBS = 1, translates into a quality level of about 5 (this corresponds to thecharacterization “fair” in the subjective testing area). The reason was alreadycommented: the servers having little to send have no time to synchronize. This istelling us that the losses due to the synchronization problem we observed, evenif the situation which generated them is a little bit too pessimistic, should bediminished. This is commented in the last concluding section.
5 Conclusions
This work shows that a multiple source method for distributing live video canbe efficiently implemented with a fine control on its redundant capacities. Wealso show that we can connect such a transport system with a tool allowing tomeasure the perceived quality as seen by the end user (the client), which can beused for controlling purposes.
One of the results we obtained is that the redundancy of our system not onlyprovides robustness against servers’ failures (typically, due to nodes leaving thenetworks) but also allows to implement a method for synchronizing the flowswithout any other signalling process.

12 P. Rodrıguez-Bocca et al.
The first measures we did show also that the present prototype needs someimprovements to reduce the losses due to the possible lack of synchronization(even if they are not very important in number). In order to diminish theselosses, we are currently working on adding extra redundancy for a better syn-chronization (for instance, by sending at the beginning, all the frames by all theservers, during some pre-specified time or until a pre-chosen number of frameshave been sent). Also, when a server has almost no frame to send, we also canforce it to send redundant data, again for allowing the client to estimate thedrifts with accuracy enough.
One of the tasks needed for further work is to explore the performances of ourmethods in different failure scenarios. The goal of this study will be to explorethe appropriate values of the number K of servers to use, together with the bestredundancy level r. After such a performance evaluation analysis, the search foroptimal tuning parameters can be considered.
References
1. Apostolopoulos, J., Trott, M.: Path diversity for enhanced media streaming. IEEECommunications Magazine 42(8) (2004) 80–87
2. Apostolopoulos, J.: Reliable video communication over lossy packet networks usingmultiple state encoding and path diversity. In: Proc. Visual Communication andImage Processing, VCIP ’01. (2001) 392–409
3. Rubenstein, D., Kurose, J., Towsley, D.: Detecting shared congestion of flows viaend-to-end measurement. IEEE Trans. on Networking 3 (2003)
4. Nguyen, T.P., Zakhor, A.: Distributed video streaming over Internet. In Kienzle,M.G., Shenoy, P.J., eds.: Proc. SPIE Vol. 4673, p. 186-195, Multimedia Computingand Networking 2002, Martin G. Kienzle; Prashant J. Shenoy; Eds. Volume 4673of Presented at the Society of Photo-Optical Instrumentation Engineers (SPIE)Conference. (2001) 186–195
5. Rodriguez, P., Biersack, E.W.: Dynamic parallel access to replicated content inthe internet. IEEE/ACM Trans. Netw. 10(4) (2002) 455–465
6. Apostolopoulos, J., Wee, S.: Unbalanced multiple description video communicationusing path diversity. In: In IEEE International Conference on Image Processing.(2001) 966–969
7. PPLive Home page. http://www.pplive.com (2007)8. SopCast - Free P2P internet TV. http://www.sopcast.org (2007)9. TVUnetworks home page. http://tvunetworks.com/ (2007)
10. VideoLan home page. http://www.videolan.org (2007)11. Rubino, G.: Quantifying the Quality of Audio and Video Transmissions over the
Internet: the PSQA Approach. In: Design and Operations of Communication Net-works: A Review of Wired and Wireless Modelling and Management Challenges.Edited by J. Barria. Imperial College Press (2005)
12. IETF Network Working Group: The MD5 Message-Digest Algorithm (RFC 1321)(1992)
13. Bonnin, J.M., Rubino, G., Varela, M.: Controlling Multimedia QoS in the FutureHome Network Using the PSQA Metric. The Computer Journal 2(49) (2006)


