Embed Size (px)
Citation preview
JOURNAL OF GEOPHYSICAL RESEARCH, VOL. 106, NO. B5, PAGES 8563-8580, MAY 10, 2001
Multiple scales of hydrothermal circulation in Middle Valley, northern Juan de Fuca Ridge: Physical constraints and geologic models Joshua S. Stein 1 and Andrew T. Fisher 2 Department of Earth Sciences, University of California, Santa Cruz, California
Abstract. A synthesis of data including seafloor heat flow, water column thermal anomalies, shallow pore pressures, pore water chemical profiles, paired borehole observations, and 3.5-kHz records help to characterize distinct hydrothermal circulation systems within and surrounding two active vent areas in Middle Valley, a sedimented rift on northern Juan de Fuca Ridge. We estimate the total heat and fluid budgets for a 260 km 2 area encompassing 17 km of ridge to be 274 MW (16 MW km -1 of ridge) and 0.157 m 3 s -1, respectively. About half of the seafloor heat loss is conductive, requiring efficient lateral fluid and heat transport in basement. Lateral head gradients (fluid driving forces) in basement between the primary fluid discharge site and the surrounding formation are very low. Simple mass balance and flow calculations indicate that the majority of the recharge to the primary hydrothermal reservoir cannot occur through sediments immediately around the vent area; recharge is probably focused along valley-bounding normal
10 12 2 faults. Crustal-scale lateral permeability in basement must be 10- to 10- m in order to allow rapid flow and maintain nearly isothermal temperatures over many kilometers. On a smaller scale, heat flow patterns within the main vent area are controlled by the depth to the primary hydrothermal reservoir, proximity to active vents, and local recharge of a secondary circulation system. Shallow underpressures and isolated zones of very low heat flow result from vigorous secondary circulation driven by pressure gradients associated with venting. Models of secondary circulation suggest that most of the overpressure observed in hydrothermal basement is lost when the fluid enters the vents and that cooler sediment pore fluids flow toward and into the vents as a result of shallow underpressuring. Secondary circulation results in significant heat flow reduction at the seafloor but adds minor sediment pore fluid to vent discharge.
1. Introduction
Sedimented spreading centers offer important opportunities to assess the subseafloor plumbing of ridge crest hydrothermal activity. In these settings, high sedimentation rates prevent the formation of "normal" oceanic crust. Instead of erupting at the seafloor, magma rises from depth and spreads laterally as sills within the sediments [e.g., Kastner, 1982]. Sediments help to trap heat within the subsurface, to compress thermal and chemical gradients near the seafloor, and to allow the thermal and fluid flow regimes to be characterized through coring, drilling, and heat flow measurements [e.g., Gieskes et al., 1982; Davis and Villinger, 1992]. Low-permeability sediments may also help to localize recharge and discharge relative to processes at bare rock spreading centers, making it easier to assess hydrothermal fluxes.
Middle Valley is a sedimented spreading center at the northern end of Juan de Fuca Ridge (Figure 1 a). The valley is bordered by ridge-parallel, high-angle normal faults (Figure lb) and filled with Pleistocene turbidites deposited when sea level was lower
1 Now at Colorado Rocky Mountain School, Carbondale, Colorado. 2 Also at Institute of Geophysics and Planetary Physics, University of
California, Santa Cruz, California.
and terrigeneous sediments were transported down the continental slope and into Cascadia Basin [Davis and Villinger, 1992]. The high sedimentation rate prevented formation of normal oceanic crust, and upper lithologic "basement" in this setting comprises alternating basaltic sills and indurated sediments [Langseth and Becker, 1994]. This sediment sill sequence has a bulk permeability considerably greater than that of the overlying sediments [Becker et al., 1994; Fisher et al., 1994] and hosts vigorous hydrothermal circulation that leads to essentially isothermal (280øC) conditions in uppermost hydrologic basement [Davis and Villinger, 1992; Davis et al., 1992; Davis and Fisher, 1994].
In this paper we integrate previous heat flow, permeability, and borehole observations from Middle Valley with new heat flow, pore water, thermal anomalies, and pore pressure data from two areas of active venting (AAV) in Middle Valley. We use the synthesis of these results to constrain numerical and analytical models of subseafloor hydrothermal flow. Our results help to elucidate processes associated with hydrologically distinct primary and secondary circulation systems, and we suggest how a wide variety of observations, some of which appear to be contradictory at first, can be reconciled.
Copyright 2001 by the American Geophysical Union.
Paper number 2000JB900395. 0148-0227/01/2000JB 900395 $09.00
2. Earlier Studies of AAVs in Middle Valley Hydrothermal activity in Middle Valley was recognized from
heat-flow surveys that revealed extremely high and variable
8563
8564 STEIN AND FISHER: HYDROTHERMAL CIRCULATION IN MIDDLE VALLEY
m North American
ß
/ • • Valley • •
l
130 ø W 126 ø 1280 50' W 40, 128 ø 50'W 40'
2OOO 2200 2400 2600 Meters below sea level
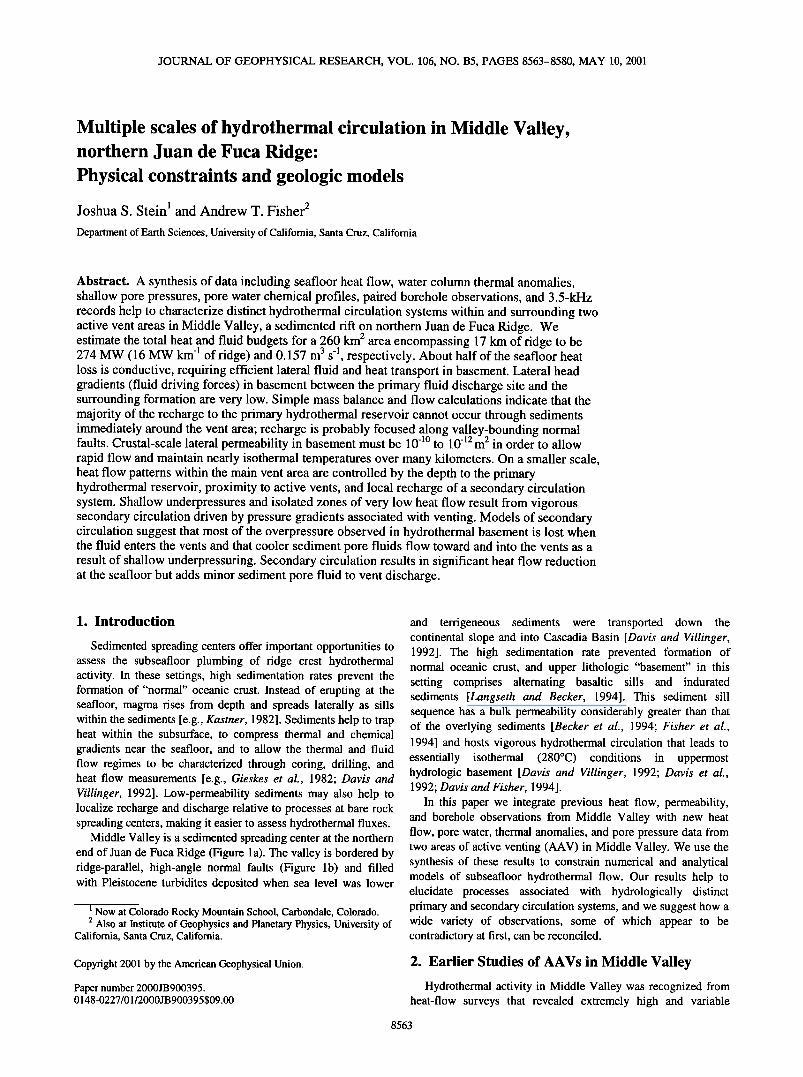
Figure 1. (a) Index map showing location of Middle Valley and boxed area of Figures lb and l c. (b) Middle Valley bathymetry, ODP Leg 139 and 169 drill sites. (c) Middle Valley heat flow contours (W/m 2) [Davis and Villinger, 1992]. Dashed line indicates extent of dense, regional heat flow coverage. Smaller area inside solid gray line (260 km 2) was used for heat budget calculations.
values near the spreading center [e.g., Davis and Lister, 1977; Davis and Villinger, 1992]. Subsequent surface, submersible, and remotely operated vehicle expeditions confirmed the presence of discrete vent sites and associated geological, geochemical, and geophysical anomalies and identified the Dead Dog and Bent Hill AAVs [e.g., Davis et al., 1987; Goodfellow and Blaise, 1988; Butterfield et al., 1994]. These studies allowed site selection for Ocean Drilling Program (ODP) Leg 139, which was intended to delineate the driving forces and consequences of hydrothermal circulation. ODP Leg 169 returned to two of the Leg 139 sites to continue drilling, sampling, and downhole experiments within the AAVs.
Davis and Villinger [1992] noted an inverse relationship between heat flow and sediment thickness from 550 heat flow measurements in Middle Valley. They calculated basement temperatures from heat flow measurements and seismically constrained sediment thickness and estimated that basement was nearly isothermal at 300øC. They suggested that high permeability was required to support vigorous circulation to maintain isothermal conditions within basement [Davis and Villinger, 1992]. Heat flow contours from their compilation are shown in Figure 1 c.
2.1. Dead Dog AAV (Sites 858 and 1036)
The Dead Dog AAV (ODP Sites 858 and 1036; Figures lb and 2) lies 6 km west of the eastern edge of the valley and 6 km east of the valley axis. Side-scan surveys across the valley show the vent field as a well-defined area of high acoustic backscatter measuring-400x800 m [Davis and Villinger, 1992]. Clustered inside the acoustic backscatter boundary are -20 vents discharging hydrothermal fluids at temperatures ranging from 180 to 276øC, most near the high end of this range [Ames et al., 1993; Butterfield et al., 1994]. Vent fluid chemistry is strongly influenced by reaction with basaltic basement and shows little or no indication of reaction with sediments [Butterfield et al., 1994]. Multichannel seismic data reveal that the vent field is
located in a subtle bathymetric depression east of a crest formed by the footwall of a prominent basement normal fault [Rohr and Schmidt, 1994] (Figure lb). Shallow 3.5-kHz profiles across the Dead Dog AAV reveal the disruption of sediment layering in the vicinity of active vents (Figure 3). The vent field appears as a cone-shaped, seismically transparent region extending meters to tens of meters below the seafloor. The AAV may be located over a fault or other subvertical feature that facilitates flow from the
underlying reaction zone (Figure 3). Seismic resolution is poor directly beneath the vent field but logging and drilling results indicate that the vent field is located just above a local basement edifice, encountered at 258 m below seafloor (mbsf) in ODP Hole 858G [Shipboard Scientific Party, 1992a]. Drilling in Hole 858G penetrated 175 m into extrusive basalt, interpreted to be the top of a seamount now buried by turbidites [Langseth and Becker, 1994]. This subseafloor volcanic edifice is thought to function as a hydrothermal "chimney," focusing discharge within the overlying vent field [Davis and Fisher, 1994]. Shallow sediment holes were drilled within and just outside the vent field to sample sediments and fluids and to measure temperatures. Several of the Leg 139 holes drilled within the vent field encountered an extremely hard layer -30 mbsf [Shipboard Scientific Party, 1992a], and Leg 169 drilling recovered hydrothermal precipitates and diagenetically altered sediments at this depth [Shipboard Scientific Party, 1998a]. After Leg 139 drilling was completed in Hole 858G, a borehole observatory was installed to allow the formation surrounding the borehole to reequilibrate to predrilling thermal and hydrologic conditions [Davis and Becker, 1994]. The borehole seal and instrumentation in Hole 858G were replaced during ODP Leg 169 [Davis and Becker, 1998]. Further evidence of intense hydrothermal activity beneath the Dead Dog AAV comes from microearthquake swarms recorded by a temporary array of eight ocean bottom seismometers [Golden et al., 1998]. The largest swarm was located between 750 and 1300 mbsf beneath the AAV and
extended south. Other microearthquakes to the northeast of the
STEIN AND FISHER: HYDROTHERMAL CIRCULATION IN MIDDLE VALLEY 8565
I I A"i I I
Heineken Hollow •1 I East Hill
Ropos Vents
Noodle Vents '•-•__•242;':•*.2,• I
Pin Vent • Needles •nt •• • Pi•us•on Venl
Clam Cl'u Chow•r Hill
' 200 m
a I I A, I ,
128 ø 42.8' W 42.6' 42.4'
HF Scale (W/m 2) o 0-2 o 2-4 0 4-10 , O >10
o 0 m c
ø ø • O!
i o oo o
o
o o
b I
128 ø 42.8' W 42.6'
I I I I
oø
))• ••, ø•ø ø o
.nJoo 0 ø øo o
7IOo
200m C
I I I I 42.4'
200m
128 ø 42.8' W 42.6' 42.4'
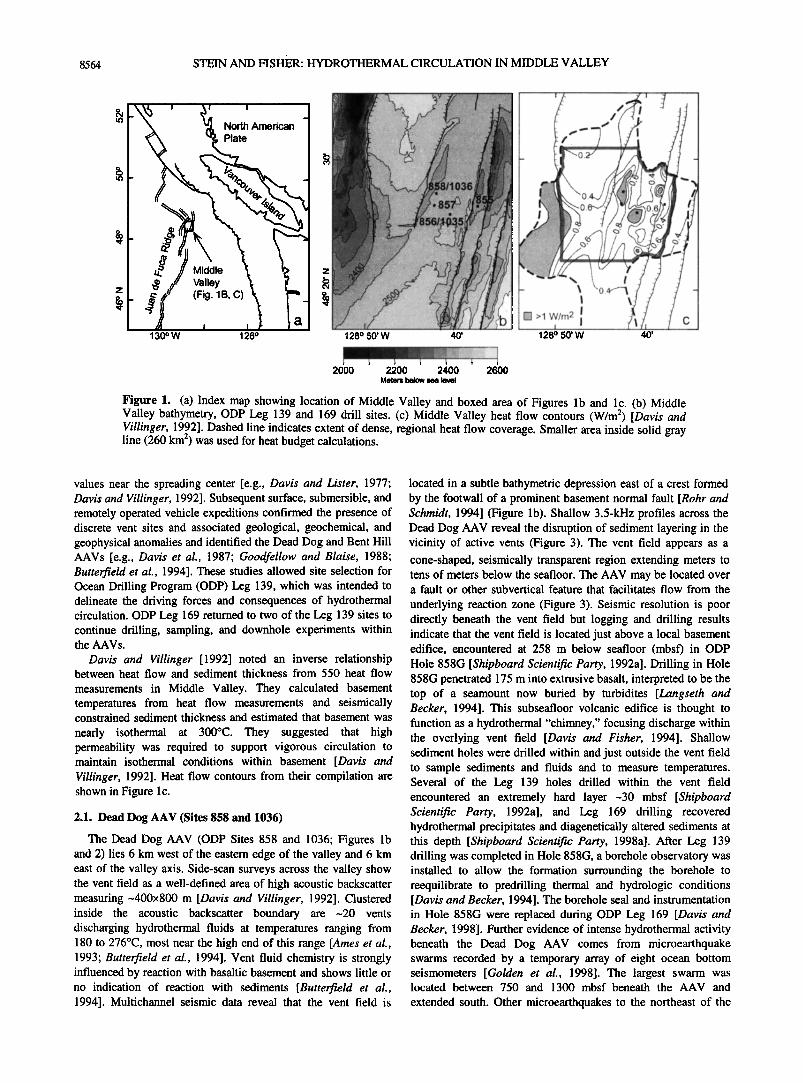
Figure 2. (a) Geologic features of the Dead Dog vent field (ODP Site 858/1036) including outline of area of high acoustic backscatter, individual vent and vent cluster names and locations (solid squares), bathymetry (meters), Hole 858G location, and shaded areas where water column thermal anomalies were detected (DDP1 to 8). The 3.5- kHz seismic lines A-A' and B-B' are shown in Figure 3. (b) Heat flow (HF) measurements separated into classes: violin bow (open circles), core barrel outriggers (open squares), and ODP (open triangles). Crosses indicate at least one thermistor exceeded maximum temperature range of instrument. Stars indicate locations where the heat flow probe fell over without penetrating. Solid squares are vent locations. (c) Estimates of vertical fluid flow direction (point in direction of flow) determined by pore water strontium profiles (open triangles) [Glenn, 1998] and shallow pore pressure gradients (solid triangles) [Langseth et al., 1996; Schultheiss, 1997]. Hexagons show where nonlinear thermal gradients indicate advective heat transport. Solid squares are vent locations.
AAV have hypocenters reaching 2500 mbsf. These events may indicate thermal contraction associated with the hydrothermal mining of heat [Golden et al., 1998].
2.2. Bent Hill AAV (Sites 856 and 1035)
The Bent Hill area (ODP Sites 856 and 1035) (Figures 1 b and 4) is named for a 400-m-diameter topographic high that rises 50 m above the surrounding seafloor, 4 km southeast of the Dead Dog vent field. Drilling 200 m south of the hill during ODP Legs 139 and 169 penetrated and cored a massive sulfide deposit. The deposit is roughly cylindrical in shape, 60 m in diameter, and -120 m thick [Shipboard Scientific Party, 1992b; 1998b]. Drilling during ODP Leg 169 penetrated through the deposit and recovered intensely mineralized sediments underlying the massive sulfide and overlying less altered turbidites and hemipelagic clay [Shipboard Scientific Party, 1998b]. A single active vent located 300 m south of the massive sulfide deposit discharges fluid that is similar in composition to fluid venting in the Dead Dog AAV, except for its lower salinity and Ca content [Butterfield et al., 1994]. The presence of the massive sulfide requires that fluid temperatures in the past were at least 400øC, although the present vent discharge is at 265øC [Peter et al., 1994; Davis and Fisher, 1994]. An interval of intense mineralization found below the Bent Hill AAV is thought to hydrologically isolate the underlying hydrothermal system [Shipboard Scientific Party, 1998b; Stein et al., 1998].
2.3. Sealed Basement Site (Site 857)
ODP Site 857, hereinafter referred to as the sealed basement site (Figure 1), is located 1.5 km east of the major normal fault that defines the western boundary of Middle Valley, 1.6 km south
of the Dead Dog AAV. Hydrologic basement in this area is covered by a thick sediment layer, and the site is located well away from known or suspected recharge and discharge sites, making it ideal for investigation of properties within the hydrothermal reservoir. Drilling penetrated 470 m of turbidites overlying at least 500 m of a sediment sill complex comprising basalt and altered turbidites in roughly equal proportions [Shipboard Scientific Party, 1992c; Langseth and Becker, 1994].
A A' (south) (north)
3.25 :•!!!•':'•'•J•'"'•:.i"'""i,,..,:..-.. ;::-. i, •. .•-.'...; ::---..--•:-:•,,.: ß ?: .; -.
': :'"'" "'"":' :;"::"• ::•'"" ' !:.':i :-:":i :":;;.: ............ ' ........... ß . ,•;..... ;.:.; ..-. ;.,:;.:., .-
::.•...:..;.! ..: :. '.';.:•, .; :: • :':;'.: ::.:".::: ,.,.• ,...f:",•;•:4.:.:..:. ,• : $::
3,30 '"*" "' ' 0 '50"0 ............ •m
B B' (west) (east)
.!.!. ' !.•-;':'•ii*/•$,:;:-,:•.'a :!:"i ..........
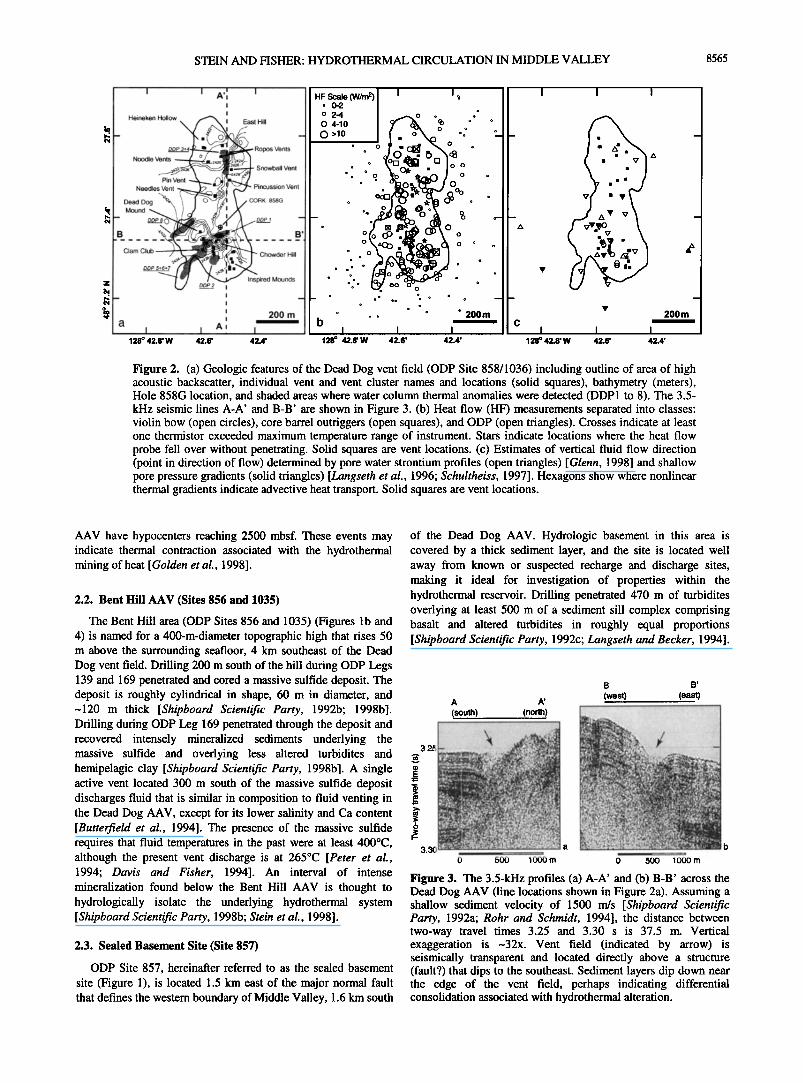
Figure 3. The 3.5-kHz profiles (a) A-A' and (b) B-B' across the Dead Dog AAV (line locations shown in Figure 2a). Assuming a shallow sediment velocity of 1500 rn/s [Shipboard Scientific Party, 1992a; Rohr and Schmidt, 1994], the distance between two-way travel times 3.25 and 3.30 s is 37.5 m. Vertical exaggeration is -32x. Vent field (indicated by arrow) is seismically transparent and located directly above a structure (fault?) that dips to the southeast. Sediment layers dip down near the edge of the vent field, perhaps indicating differential consolidation associated with hydrothermal alteration.
8566 STEIN AND FISHER: HYDROTHERMAL CIRCULATION IN MIDDLE VALLEY
z
o
,..,.,.
o • 0 o
I • I I I I ø 128 ø 41.1' W 40.9'
.m
200 m
40.7' 40.5'
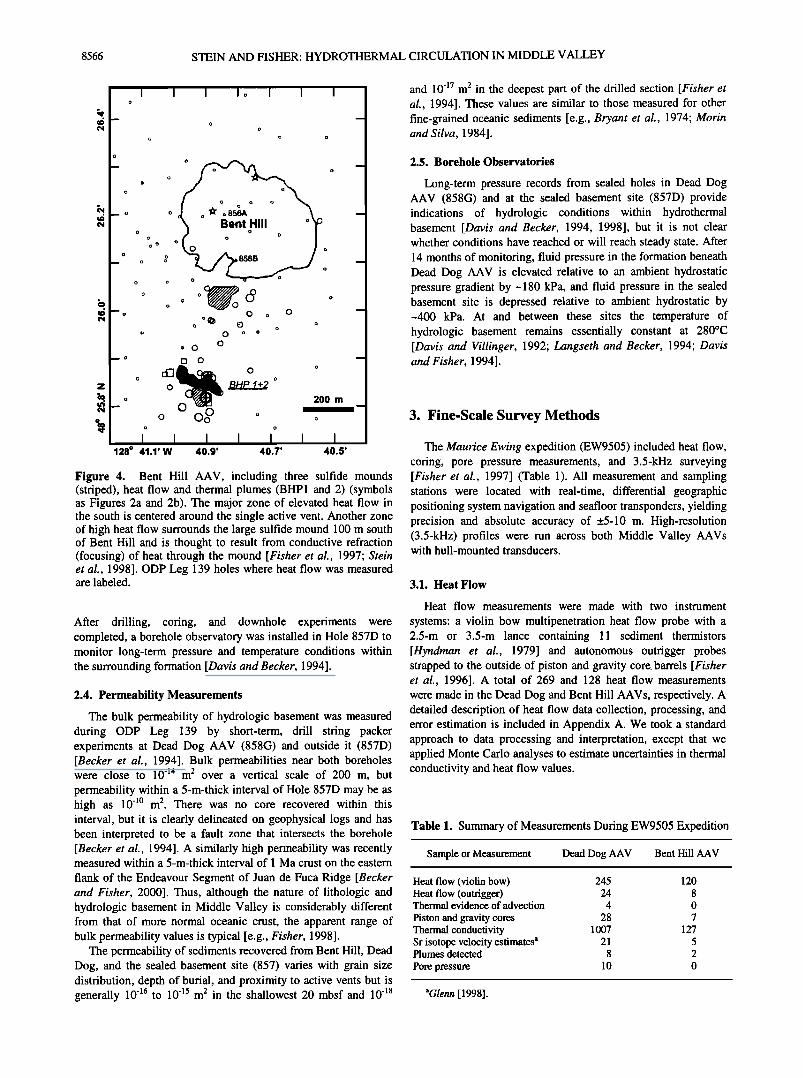
Figure 4. Bent Hill AAV, including three sulfide mounds (striped), heat flow and thermal plumes (BHP1 and 2) (symbols as Figures 2a and 2b). The major zone of elevated heat flow in the south is centered around the single active vent. Another zone of high heat flow surrounds the large sulfide mound 100 m south of Bent Hill and is thought to result from conductive refraction (focusing) of heat through the mound [Fisher et al., 1997; Stein et al., 1998]. ODP Leg 139 holes where heat flow was measured are labeled.
After drilling, coring, and downhole experiments were completed, a borehole observatory was installed in Hole 857D to monitor long-term pressure and temperature conditions within the surrounding formation [Davis and Becker, 1994].
2.4. Permeability Measurements
The bulk permeability of hydrologic basement was measured during ODP Leg 139 by short-term, drill string packer experiments at Dead Dog AAV (858G) and outside it (857D) [Becker et al., 1994]. Bulk permeabilities near both boreholes were close to 10 -14 m 2 over a vertical scale of 200 m, but permeability within a 5-m-thick interval of Hole 857D may be as high as 10 -lø m 2. There was no core recovered within this interval, but it is clearly delineated on geophysical logs and has been interpreted to be a fault zone that intersects the borehole [Becker et al., 1994]. A similarly high permeability was recently measured within a 5-m-thick interval of 1 Ma crust on the eastern
flank of the Endeavour Segment of Juan de Fuca Ridge [Becker and Fisher, 2000]. Thus, although the nature of lithologic and hydrologic basement in Middle Valley is considerably different from that of more normal oceanic crust, the apparent range of bulk permeability values is typical [e.g., Fisher, 1998].
The permeability of sediments recovered from Bent Hill, Dead Dog, and the sealed basement site (857) varies with grain size distribution, depth of burial, and proximity to active vents but is generally 10 -16 to 10 '•5 m 2 in the shallowest 20 mbsf and 10 -•8
and 10 -17 m 2 in the deepest part of the drilled section [Fisher et al., 1994]. These values are similar to those measured for other fine-grained oceanic sediments [e.g., Bryant et al., 1974; Morin and Silva, 1984].
2.5. Borehole Observatories
Long-term pressure records from sealed holes in Dead Dog AAV (858G) and at the sealed basement site (857D) provide indications of hydrologic conditions within hydrothermal basement [Davis and Becker, 1994, 1998], but it is not clear whether conditions have reached or will reach steady state. After 14 months of monitoring, fluid pressure in the formation beneath Dead Dog AAV is elevated relative to an ambient hydrostatic pressure gradient by-180 kPa, and fluid pressure in the sealed basement site is depressed relative to ambient hydrostatic by -400 kPa. At and between these sites the temperature of hydrologic basement remains essentially constant at 280øC [Davis and Villinger, 1992; Langseth and Becker, 1994; Davis and Fisher, 1994].
3. Fine-Scale Survey Methods
The Maurice Ewing expedition (EW9505) included heat flow, coring, pore pressure measurements, and 3.5-kHz surveying [Fisher et al., 1997] (Table 1). All measurement and sampling stations were located with real-time, differential geographic positioning system navigation and seafloor transponders, yielding precision and absolute accuracy of +_5-10 m. High-resolution (3.5-kHz) profiles were run across both Middle Valley AAVs with hull-mounted transducers.
3.1. Heat Flow
Heat flow measurements were made with two instrument
systems: a violin bow multipenetration heat flow probe with a 2.5-m or 3.5-m lance containing 11 sediment thermistors [Hyndman et al., 1979] and autonomous outrigger probes strapped to the outside of piston and gravity core. barrels [Fisher et al., 1996]. A total of 269 and 128 heat flow measurements were made in the Dead Dog and Bent Hill AAVs, respectively. A detailed description of heat flow data collection, processing, and error estimation is included in Appendix A. We took a standard approach to data processing and interpretation, except that we applied Monte Carlo analyses to estimate uncertainties in thermal conductivity and heat flow values.
Table 1. Summary of Measurements During EW9505 Expedition
Sample or Measurement Dead Dog AAV Bent Hill AAV
Heat flow (violin bow) 245 120 Heat flow (outrigger) 24 8 Thermal evidence of advection 4 0 Piston and gravity cores 28 7 Thermal conductivity 1007 127 Sr isotope velocity estimates a 21 5 Plumes detected 8 2 Pore pressure 10 0
aGlenn [ 1998].
STEIN AND FISHER: HYDROTHERMAL CIRCULATION IN MIDDLE VALLEY 8567
3.2. Water Column Thermal Anomalies
Water column thermal anomalies were detected by the heat flow probe while the instrument was in transit between stations. The depth of the probe was determined using a pressure transducer attached to the probe, and the distance from the probe to the seafloor was estimated by averaging the depths of the prior and subsequent heat flow stations. Ten thermal anomalies were detected and are listed in Table 2.
3.3. Pore Pressure Measurements
Eight Pop-up Pore Pressure Instruments (PUPPIs) were deployed successfully at the Dead Dog AAV during EW9505, and two additional measurements were made during ODP Leg 169. The PUPPIs measure differential fluid pore pressure between two sampling ports on a 4-m lance. The instrument is launched from the surface and free-falls to the seafloor, where it is left in place for 2-3 days. Data are recorded internally, and the pressure gauges and data logger are recovered by acoustic release. In situ measurements include a record of the pressure pulse associated with deployment, a decay of this excess pressure, and tidal signals that propagate through the shallow sediments. In situ pressures and pressure gradients were estimated by extrapolation of the in situ records to equilibrium conditions, and ambient hydrostatic pressures were subtracted to derive differential pressures accompanying fluid flow near the seafloor [Schultheiss, 1990, 1997; Fang et al., 1993].
3.4. Pore Water Strontium
Glenn [1998] separated strontium from pore water samples recovered by coring using a strontium-specific extraction resin and analyzed isotopes with a thermal ionization mass spectrometer. One-dimensional, advection-diffusion-reaction models were used to estimate effective seepage rates and directions using forward and inverse techniques for 21 cores from Dead Dog AAV and five cores from Bent Hill AAV.
4. Fine-Scale Survey Results 4.1. Heat Flow
Heat flow values and measurement locations are compiled in Table A1 (available as electronic supporting materialS). Individual values range from 0.53 to >50 W m -2 within the Dead Dog area (Figure 2a). Heat flow in the Bent Hill area ranges from 0.18 to 25.68 W m -2 (Figure 4). Ten measurements included temperatures in excess of the calibrated range of the instruments (40øC for violin bow probe, 50øC for outrigger probes). The highest heat flow values in both AAVs are found immediately adjacent to hydrothermal vents and vent clusters. A zone of locally elevated heat flow also occurs in the area immediately surrounding the massive sulfide deposit south of Bent Hill, most likely resulting from conductive refraction [e.g., Gr6schel-Becker et al., 1994; Fisher et al., 1997].
•Supporting Table A1 is available via Web browser or via Anonymous FFP from ftp://kosmos.agu.org, directory "append" (Usemame = "anonymous", Password = "guest"); subdirectories in the ftp site are arranged by paper number. Information on searching and submitting electronic supplements is found at http://www.agu.orffpubs/ esupp-abøut'html'
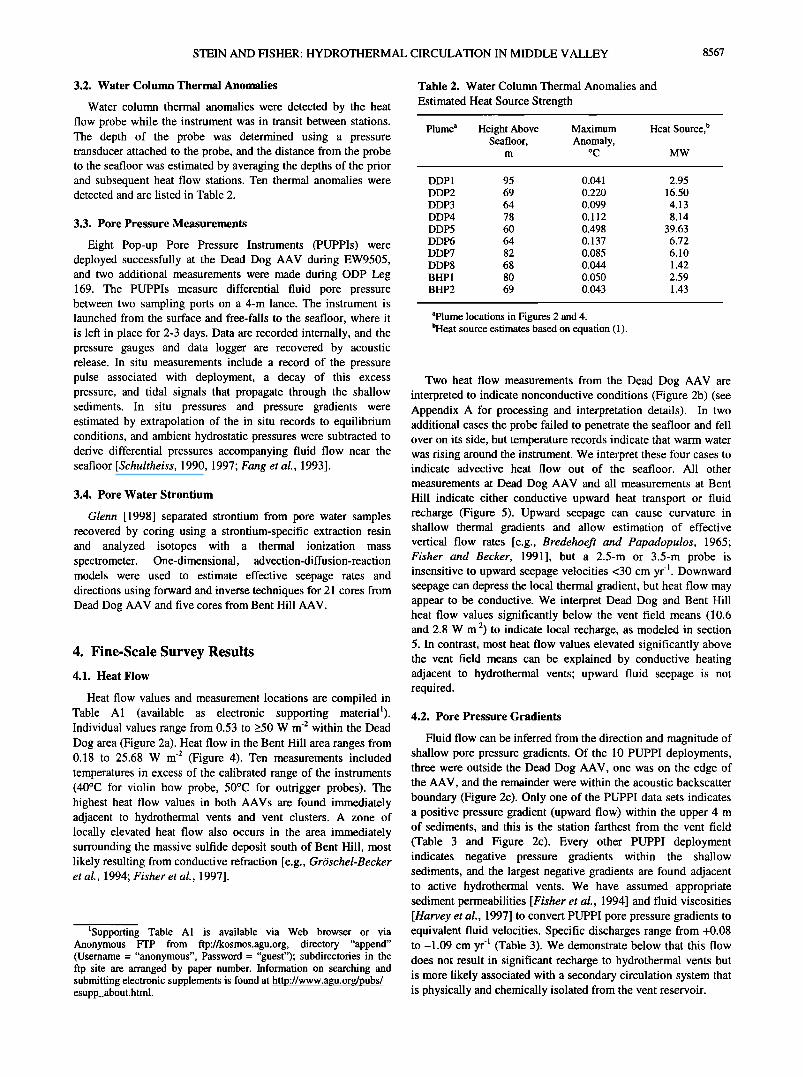
Table 2. Water Column Thermal Anomalies and
Estimated Heat Source Strength
Plume a Height Above Maximum Heat Source, b Seafloor, Anomaly,
m øC MW
DDP1 95 0.041 2.95 DDP2 69 0.220 16.50 DDP3 64 0.099 4.13 DDP4 78 0.112 8.14 DDP5 60 0.498 39.63 DDP6 64 0.137 6.72 DDP7 82 0.085 6.10 DDP8 68 0.044 1.42 BHP1 80 0.050 2.59 BHP2 69 0.043 1.43
aPlume locations in Figures 2 and 4. bHeat source estimates based on equation (1).
Two heat flow measurements from the Dead Dog AAV are interpreted to indicate nonconductive conditions (Figure 2b) (see Appendix A for processing and interpretation details). In two additional cases the probe failed to penetrate the seafloor and fell over on its side, but temperature records indicate that warm water was rising around the instrument. We interpret these four cases to indicate advective heat flow out of the seafloor. All other
measurements at Dead Dog AAV and all measurements at Bent Hill indicate either conductive upward heat transport or fluid recharge (Figure 5). Upward seepage can cause curvature in shallow thermal gradients and allow estimation of effective vertical flow rates [e.g., Bredehoeft and Papadopulos, 1965; Fisher and Becker, 1991], but a 2.5-m or 3.5-m probe is insensitive to upward seepage velocities <30 cm yr -•. Downward seepage can depress the local thermal gradient, but heat flow may appear to be conductive. We interpret Dead Dog and Bent Hill heat flow values significantly below the vent field means (10.6 and 2.8 W m -2) to indicate local recharge, as modeled in section 5. In contrast, most heat flow values elevated significantly above the vent field means can be explained by conductive heating adjacent to hydrothermal vents; upward fluid seepage is not required.
4.2. Pore Pressure Gradients
Fluid flow can be inferred from the direction and magnitude of shallow pore pressure gradients. Of the 10 PUPPI deployments, three were outside the Dead Dog AAV, one was on the edge of the AAV, and the remainder were within the acoustic backscatter boundary (Figure 2c). Only one of the PUPPI data sets indicates a positive pressure gradient (upward flow) within the upper 4 m of sediments, and this is the station farthest from the vent field (Table 3 and Figure 2c). Every other PUPPI deployment indicates negative pressure gradients within the shallow sediments, and the largest negative gradients are found adjacent to active hydrothermal vents. We have assumed appropriate sediment permeabilities [Fisher et al., 1994] and fluid viscosities [Harvey et al., 1997] to convert PUPPI pore pressure gradients to equivalent fluid velocities. Specific discharges range from +0.08 to-1.09 cm yr -1 (Table 3). We demonstrate below that this flow does not result in significant recharge to hydrothermal vents but is more likely associated with a secondary circulation system that is physically and chemically isolated from the vent reservoir.
8568 STEIN AND FISHER: HYDROTHERMAL CIRCULATION IN MIDDLE VALLEY
Temperature (øC) Temperature (øC) Temperature (øC) 0 10 20 30 40 50 0 1 2 3 4 5 0 5 10 15 20 25 • O i ! i i i I i i I i i I i i i i I i i i i i i i
•2 '• -
• ' HP06-B '•, q: 0.95 + 0.05 W/• . •b t ,,,,,,,,,, .... , .... ,,,,,,
Temperature (øC) Temperature (øC) Temperature (øC) 2 4 6 8 10 _ 0 5 10 15 20 25
• lO •-PCO2 • '• I q = 1.75 + 0.10 W/rn• ' • r•12,,,,,•,,,,,,,,,. .... r•,
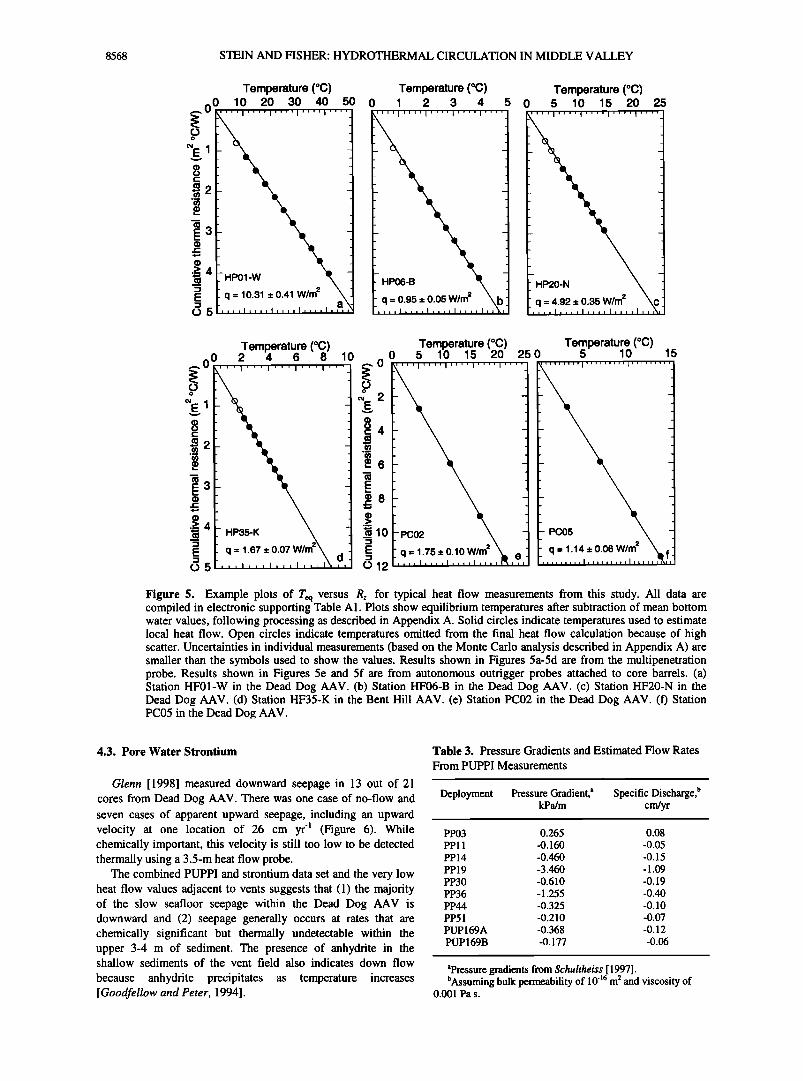
Figure 5. Example plots of Teq versus Rz for typical heat flow measurements from this study. All data are compiled in electronic supporting Table A1. Plots show equilibrium temperatures after subtraction of mean bottom water values, following processing as described in Appendix A. Solid circles indicate temperatures used to estimate local heat flow. Open circles indicate temperatures omitted from the final heat flow calculation because of high scatter. Uncertainties in individual measurements (based on the Monte Carlo analysis described in Appendix A) are smaller than the symbols used to show the values. Results shown in Figures 5a-5d are from the multipenetration probe. Results shown in Figures 5e and 5f are from autonomous outrigger probes attached to core barrels. (a) Station HF01-W in the Dead Dog AAV. (b) Station HF06-B in the Dead Dog AAV. (c) Station HF20-N in the Dead Dog AAV. (d) Station HF35-K in the Bent Hill AAV. (e) Station PC02 in the Dead Dog AAV. (f) Station PC05 in the Dead Dog AAV.
4.3. Pore Water Strontium
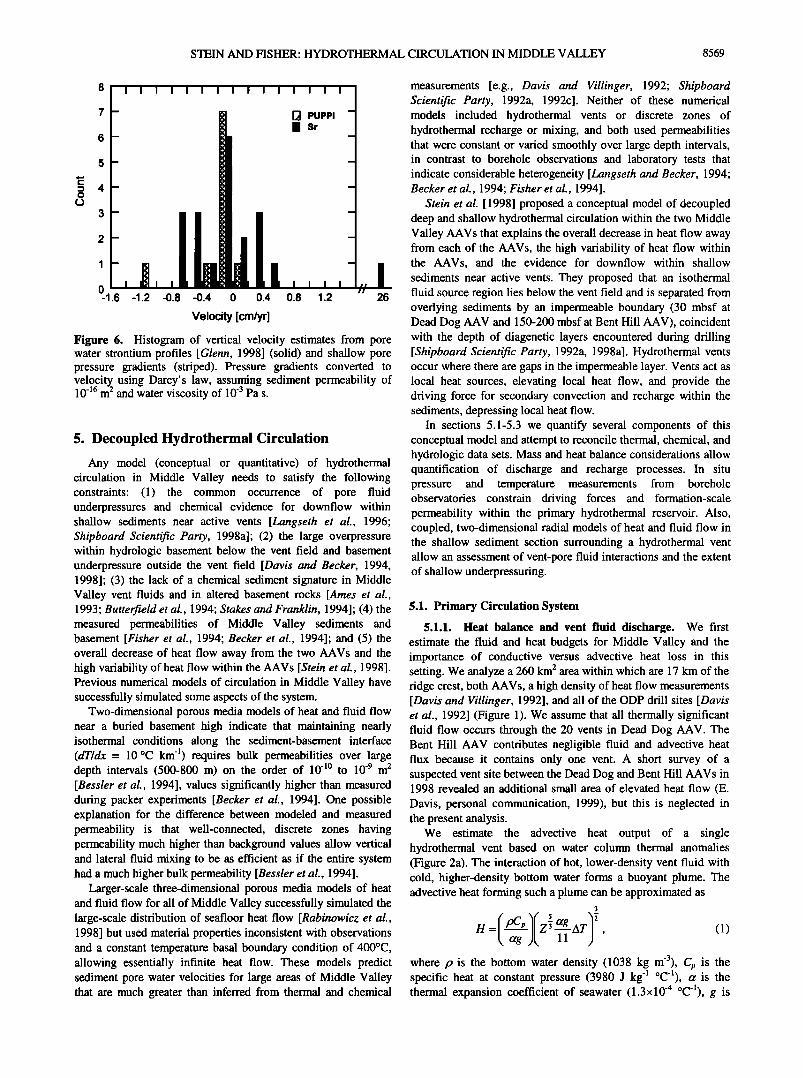
Glenn [1998] measured downward seepage in 13 out of 21 cores from Dead Dog AAV. There was one case of no-flow and seven cases of apparent upward seepage, including an upward velocity at one location of 26 cm yr -• (Figure 6). While chemically important, this velocity is still too low to be detected thermally using a 3.5-m heat flow probe.
The combined PUPPI and strontium data set and the very low heat flow values adjacent to vents suggests that (1) the majority of the slow seafloor seepage within the Dead Dog AAV is downward and (2) seepage generally occurs at rates that are chemically significant but thermally undetectable within the upper 3-4 m of sediment. The presence of anhydrite in the shallow sediments of the vent field also indicates down flow
because anhydrite precipitates as temperature increases [Goodfellow and Peter, 1994].
Table 3. Pressure Gradients and Estimated Flow Rates From PUPPI Measurements
Deployment Pressure Gradient, a Specific Discharge, b kPa/m cm/yr
PP03 0.265 0.08 PP11 -0.160 -0.05 PP14 -0.460 -0.15 PP19 -3.460 -1.09 PP30 -0.610 -0.19 PP36 -1.255 -0.40 PP44 -0.325 -0.10 PP51 -0.210 -0.07 PUP 169A -0.368 -0.12 PUP169B -0.177 -0.06
apressum gradients from Schultheiss [ 1997]. bAssuming bulk permeability of 10 '16 m 2 and viscosity of
0.001 Pa s.
STEIN AND FISHER: HYDROTHERMAL CIRCULATION IN MIDDLE VALLEY 8569
• PUPPI • $r
o -1.6 -1.2 -o.8 -o.4 o 0.4 0.8 1.2
Velocity [cm/yr]
Figure 6. Histogram of vertical velocity estimates from pore water strontium profiles [Glenn, 1998] (solid) and shallow pore pressure gradients (striped). Pressure gradients converted to velocity using Darcy's law, assuming sediment permeability of 10 '•6 m 2 and water viscosity of 10 -3 Pa s.
5. Decoupled Hydrothermal Circulation Any model (conceptual or quantitative) of hydrothermal
circulation in Middle Valley needs to satisfy the following constraints: (1) the common occurrence of pore fluid underpressures and chemical evidence for downflow within shallow sediments near active vents [Langseth et al., 1996; Shipboard Scientific Party, 1998a]; (2) the large overpressure within hydrologic basement below the vent field and basement underpressure outside the vent field [Davis and Becker, 1994, 1998]; (3) the lack of a chemical sediment signature in Middle Valley vent fluids and in altered basement rocks [Ames et al., 1993; Butterfield et al., 1994; Stakes and Franklin, 1994]; (4) the measured permeabilities of Middle Valley sediments and basement [Fisher et al., 1994; Becker et al., 1994]; and (5) the overall decrease of heat flow away from the two AAVs and the high variability of heat flow within the AAVs [Stein et al., 1998]. Previous numerical models of circulation in Middle Valley have successfully simulated some aspects of the system.
Two-dimensional porous media models of heat and fluid flow near a buffed basement high indicate that maintaining nearly isothermal conditions along the sediment-basement interface (dT/dx = 10 øC km -•) requires bulk permeabilities over large depth intervals (500-800 m) on the order of 10 -•ø to 10 -9 m 2 [Bessler et al., 1994], values significantly higher than measured during packer experiments [Becker et al., 1994]. One possible explanation for the difference between modeled and measured permeability is that well-connected, discrete zones having permeability much higher than background values allow vertical and lateral fluid mixing to be as efficient as if the entire system had a much higher bulk permeability [Bessler et al., 1994].
Larger-scale three-dimensional porous media models of heat and fluid flow for all of Middle Valley successfully simulated the large-scale distribution of seafloor heat flow [Rabinowicz et al., 1998] but used material properties inconsistent with observations and a constant temperature basal boundary condition of 400øC, allowing essentially infinite heat flow. These models predict sediment pore water velocities for large areas of Middle Valley that are much greater than inferred from thermal and chemical
measurements [e.g., Davis and Villinger, 1992; Shipboard Scientific Party, 1992a, 1992c]. Neither of these numerical models included hydrothermal vents or discrete zones of hydrothermal recharge or mixing, and both used permeabilities that were constant or varied smoothly over large depth intervals, in contrast to borehole observations and laboratory tests that indicate considerable heterogeneity [Langseth and Becker, 1994; Becker et al., 1994; Fisher et al., 1994].
Stein et al. [1998] proposed a conceptual model of decoupled deep and shallow hydrothermal circulation within the two Middle Valley AAVs that explains the overall decrease in heat flow away from each of the AAVs, the high variability of heat flow within the AAVs, and the evidence for downflow within shallow sediments near active vents. They proposed that an isothermal fluid source region lies below the vent field and is separated from overlying sediments by an impermeable boundary (30 mbsf at Dead Dog AAV and 150-200 mbsf at Bent Hill AAV), coincident with the depth of diagenetic layers encountered during drilling [Shipboard Scientific Party, 1992a, 1998a]. Hydrothermal vents occur where there are gaps in the impermeable layer. Vents act as local heat sources, elevating local heat flow, and provide the driving force for secondary convection and recharge within the sediments, depressing local heat flow.
In sections 5.1-5.3 we quantify several components of this conceptual model and attempt to reconcile thermal, chemical, and hydrologic data sets. Mass and heat balance considerations allow quantification of discharge and recharge processes. In situ pressure and temperature measurements from borehole observatories constrain driving forces and formation-scale permeability within the primary hydrothermal reservoir. Also, coupled, two-dimensional radial models of heat and fluid flow in the shallow sediment section surrounding a hydrothermal vent allow an assessment of vent-pore fluid interactions and the extent of shallow underpressuring.
5.1. Primary Circulation System
5.1.1. Heat balance and vent fluid discharge. We first estimate the fluid and heat budgets for Middle Valley and the importance of conductive versus advective heat loss in this setting. We analyze a 260 km 2 area within which are 17 km of the ridge crest, both AAVs, a high density of heat flow measurements [Davis and Villinger, 1992], and all of the ODP drill sites [Davis et al., 1992] (Figure 1). We assume that all thermally significant fluid flow occurs through the 20 vents in Dead Dog AAV. The Bent Hill AAV contributes negligible fluid and advective heat flux because it contains only one vent. A short survey of a suspected vent site between the Dead Dog and Bent Hill AAVs in 1998 revealed an additional small area of elevated heat flow (E. Davis, personal communication, 1999), but this is neglected in the present analysis.
We estimate the advective heat output of a single hydrothermal vent based on water column thermal anomalies (Figure 2a). The interaction of hot, lower-density vent fluid with cold, higher-density bottom water forms a buoyant plume. The advective heat forming such a plume can be approximated as
3
H = Z• ag AT (1) 11 '
where p is the bottom water density (1038 kg m-3), Cp is the specific heat at constant pressure (3980 J kg '• øC-l), a is the thermal expansion coefficient of seawater (1.3x10 '4 øC-l), g is
8570 STEIN AND FISHER: HYDROTHERMAL CIRCULATION IN MIDDLE VALLEY
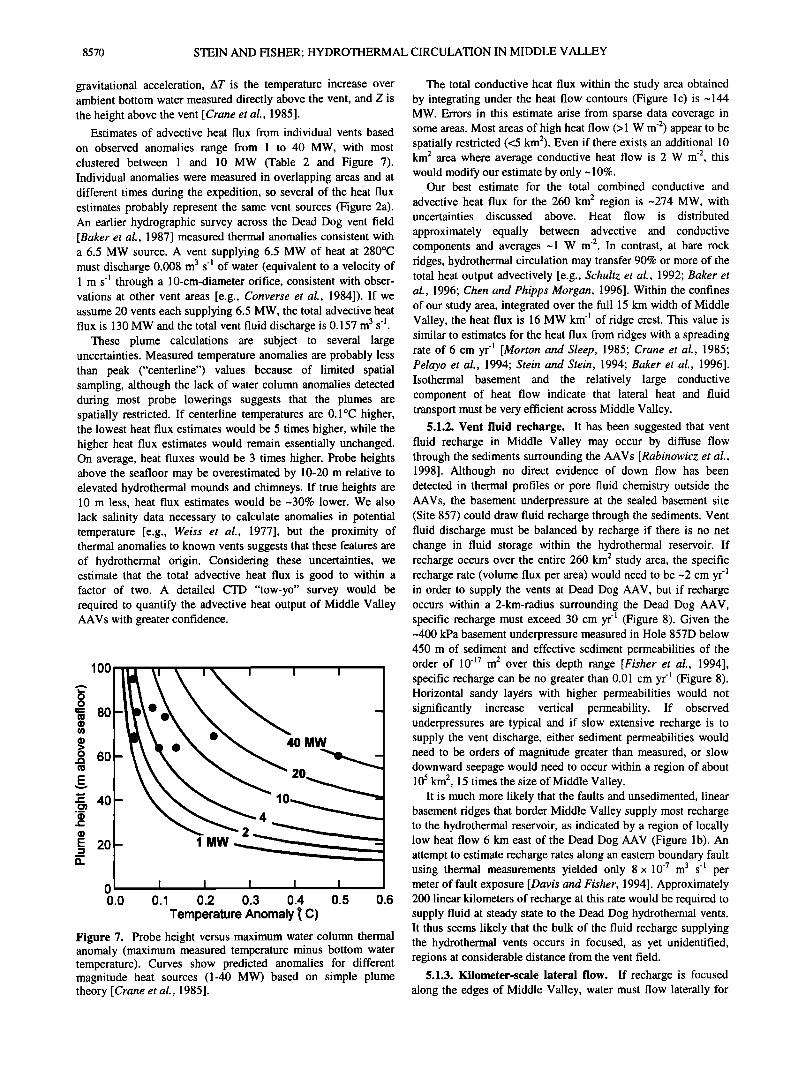
gravitational acceleration, /XT is the temperature increase over ambient bottom water measured directly above the vent, and Z is the height above the vent [Crane et at., 1985].
Estimates of advective heat flux from individual vents based on observed anomalies range from 1 to 40 MW, with most clustered between 1 and 10 MW (Table 2 and Figure 7). Individual anomalies were measured in overlapping areas and at different times during the expedition, so several of the heat flux estimates probably represent the same vent sources (Figure 2a). An earlier hydrographic survey across the Dead Dog vent field [Baker et at., 1987] measured thermal anomalies consistent with a 6.5 MW source. A vent supplying 6.5 MW of heat at 280øC must discharge 0.008 m 3 s -1 of water (equivalent to a velocity of 1 m s -• through a 10-cm-diameter orifice, consistent with obser- vations at other vent areas [e.g., Converse et at., 1984]). If we assume 20 vents each supplying 6.5 MW, the total advective heat flux is 130 MW and the total vent fluid discharge is 0.157 m 3 s -1.
These plume calculations are subject to several large uncertainties. Measured temperature anomalies are probably less than peak ("centerline") values because of limited spatial sampling, although the lack of water column anomalies detected during most probe lowerings suggests that the plumes are spatially restricted. If centerline temperatures are 0.1 øC higher, the lowest heat flux estimates would be 5 times higher, while the higher heat flux estimates would remain essentially unchanged. On average, heat fluxes would be 3 times higher. Probe heights above the seafloor may be overestimated by 10-20 m relative to elevated hydrothermal mounds and chimneys. If true heights are 10 m less, heat flux estimates would be -30% lower. We also lack salinity data necessary to calculate anomalies in potential temperature [e.g., Weiss et at., 1977], but the proximity of thermal anomalies to known vents suggests that these features are of hydrothermal origin. Considering these uncertainties, we estimate that the total advective heat flux is good to within a factor of two. A detailed CTD "tow-yo" survey would be required to quantify the advective heat output of Middle Valley AAVs with greater confidence.
lOO
o 60
E
.c 40
E 20
0 0.0
i i
40 MW
1 MW 2• I I I I I
0.1 0.2 0.3 0.4 0.5 0.6 Temperature Anomaly • C)
Figure 7. Probe height versus maximum water column thermal anomaly (maximum measured temperature minus bottom water temperature). Curves show predicted anomalies for different magnitude heat sources (1-40 MW) based on simple plume theory [Crane et al., 1985].
The total conductive heat flux within the study area obtained by integrating under the heat flow contours (Figure lc) is -144 MW. Errors in this estimate arise from sparse data coverage in some areas. Most areas of high heat flow (>1 W m '2) appear to be spatially restricted (<5 km2). Even if there exists an additional 10 km 2 area where average conductive heat flow is 2 W m -2, this would modify our estimate by only- 10%.
Our best estimate for the total combined conductive and
advective heat flux for the 260 km 2 region is -274 MW, with uncertainties discussed above. Heat flow is distributed
approximately equally between advective and conductive components and averages -1 W m -•. In contrast, at bare rock ridges, hydrothermal circulation may transfer 90% or more of the total heat output advectively [e.g., Schultz et al., 1992; Baker et al., 1996; Chen and Phipps Morgan, 1996]. Within the confines of our study area, integrated over the full 15 km width of Middle Valley, the heat flux is 16 MW km -• of ridge crest. This value is similar to estimates for the heat flux from ridges with a spreading rate of 6 cm yr -• [Morton and Sleep, 1985; Crane et al., 1985; Pelayo et al., 1994; Stein and Stein, 1994; Baker et al., 1996]. Isothermal basement and the relatively large conductive component of heat flow indicate that lateral heat and fluid transport must be very efficient across Middle Valley.
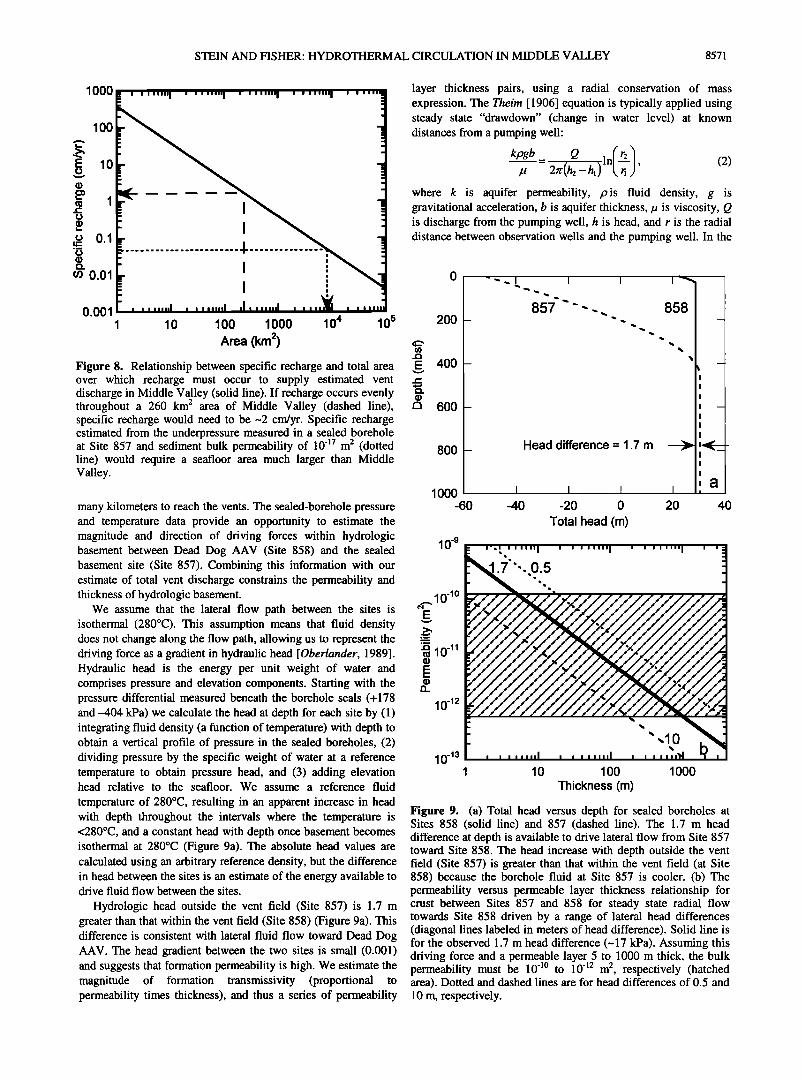
5.1.2. Vent fluid recharge. It has been suggested that vent fluid recharge in Middle Valley may occur by diffuse flow through the sediments surrounding the AAVs [Rabinowicz et al., 1998]. Although no direct evidence of down flow has been detected in thermal profiles or pore fluid chemistry outside the AAVs, the basement underpressure at the sealed basement site (Site 857) could draw fluid recharge through the sediments. Vent fluid discharge must be balanced by recharge if there is no net change in fluid storage within the hydrothermal reservoir. If recharge occurs over the entire 260 km • study area, the specific recharge rate (volume flux per area) would need to be-2 cm yr -• in order to supply the vents at Dead Dog AAV, but if recharge occurs within a 2-km-radius surrounding the Dead Dog AAV, specific recharge must exceed 30 cm yr '• (Figure 8). Given the -400 kPa basement underpressure measured in Hole 857D below 450 m of sediment and effective sediment permeabilities of the order of 10 '•7 m 2 over this depth range [Fisher et al., 1994], specific recharge can be no greater than 0.01 cm yr -• (Figure 8). Horizontal sandy layers with higher permeabilities would not significantly increase vertical permeability. If observed underpressures are typical and if slow extensive recharge is to supply the vent discharge, either sediment permeabilities would need to be orders of magnitude greater than measured, or slow downward seepage would need to occur within a region of about 105 km 2, 15 times the size of Middle Valley.
It is much more likely that the faults and unsedimented, linear basement ridges that border Middle Valley supply most recharge to the hydrothermal reservoir, as indicated by a region of locally low heat flow 6 km east of the Dead Dog AAV (Figure lb). An attempt to estimate recharge rates along an eastern boundary fault using thermal measurements yielded only 8 x 10 -7 m 3 s -] per meter of fault exposure [Davis and Fisher, 1994]. Approximately 200 linear kilometers of recharge at this rate would be required to supply fluid at steady state to the Dead Dog hydrothermal vents. It thus seems likely that the bulk of the fluid recharge supplying the hydrothermal vents occurs in focused, as yet unidentified, regions at considerable distance from the vent field.
5.1.3. Kilømeter'scale lateral flow. If recharge is focused along the edges of Middle Valley, water must flow laterally for
STEIN AND FISHER: HYDROTHERMAL CIRCULATION IN MIDDLE VALLEY 8571
lOOO
lOO
10
1
0.1
0.01
0.001 1 10 100 1000 104 10 s
Area (krn 2) Figure 8. Relationship between specific recharge and total area over which recharge must occur to supply estimated vent discharge in Middle Valley (solid line). If recharge occurs evenly throughout a 260 km 2 area of Middle Valley (dashed line), specific recharge would need to be -2 cm/yr. Specific recharge estimated from the underpressure measured in a sealed borehole at Site 857 and sediment bulk permeability of 10 -17 m 2 (dotted line) would require a seafloor area much larger than Middle Valley.
many kilometers to reach the vents. The sealed-borehole pressure and temperature data provide an opportunity to estimate the magnitude and direction of driving forces within hydrologic basement between Dead Dog AAV (Site 858) and the sealed basement site (Site 857). Combining this information with our estimate of total vent discharge constrains the permeability and thickness of hydrologic basement.
We assume that the lateral flow path between the sites is isothermal (280øC). This assumption means that fluid density does not change along the flow path, allowing us to represent the driving force as a gradient in hydraulic head [Oberlander, 1989]. Hydraulic head is the energy per unit weight of water and comprises pressure and elevation components. Starting with the pressure differential measured beneath the borehole seals (+178 and -404 kPa) we calculate the head at depth for each site by (1) integrating fluid density (a function of temperature) with depth to obtain a vertical profile of pressure in the sealed boreholes, (2) dividing pressure by the specific weight of water at a reference temperature to obtain pressure head, and (3) adding elevation head relative to the seafloor. We assume a reference fluid
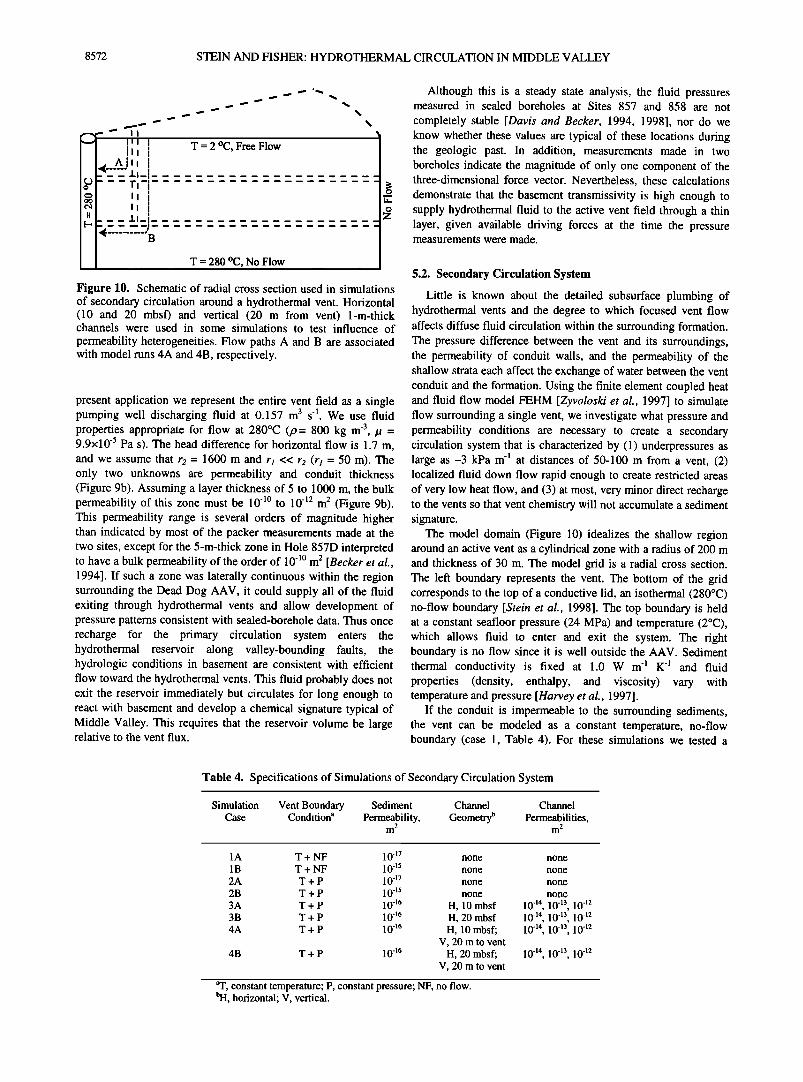
temperature of 280øC, resulting in an apparent increase in head with depth throughout the intervals where the temperature is <280øC, and a constant head with depth once basement becomes isothermal at 280øC (Figure 9a). The absolute head values are calculated using an arbitrary reference density, but the difference in head between the sites is an estimate of the energy available to drive fluid flow between the sites.
Hydrologic head outside the vent field (Site 857) is 1.7 m greater than that within the vent field (Site 858) (Figure 9a). This difference is consistent with lateral fluid flow toward Dead Dog AAV. The head gradient between the two sites is small (0.001) and suggests that formation permeability is high. We estimate the magnitude of formation transmissivity (proportional to permeability times thickness), and thus a series of permeability
layer thickness pairs, using a radial conservation of mass expression. The Theim [ 1906] equation is typically applied using steady state "drawdown" (change in water level) at known distances from a pumping well:
kpgb _ Q ln/r2) (2) At 2zc(h2-h,) •. •i ?' where k is aquifer permeability, p is fluid density, g is gravitational acceleration, b is aquifer thickness, # is viscosity, Q is discharge from the pumping well, h is head, and r is the radial distance between observation wells and the pumping well. In the
200 -
400 -
600 -
800 -
1000 -60
10 -9
857
Head difference = 1.7 rn
I I I
-40 -20 0 Total head (m)
I
20 40
• 10 -lø E
v
...
._
'• 10 -11 E
10 -12
1 10 100 1000 Thickness (m)
Figure 9. (a) Total head versus depth for sealed boreholes at Sites 858 (solid line) and 857 (dashed line). The 1.7 m head difference at depth is available to drive lateral flow from Site 857 toward Site 858. The head increase with depth outside the vent field (Site 857) is greater than that within the vent field (at Site 858) because the borehole fluid at Site 857 is cooler. (b) The permeability versus permeable layer thickness relationship for crust between Sites 857 and 858 for steady state radial flow towards Site 858 driven by a range of lateral head differences (diagonal lines labeled in meters of head difference). Solid line is for the observed 1.7 m head difference (-17 kPa). Assuming this driving force and a permeable layer 5 to 1000 m thick, the bulk
10 12 permeability must be 10- to 10- m 2, respectively (hatched area). Dotted and dashed lines are for head differences of 0.5 and 10 m, respectively.
8572 STEIN AND FISHER: HYDROTHERMAL CIRCULATION IN MIDDLE VALLEY
T = 2 øC, Free Flow
T = 280 øC, No Flow
Figure 10. Schematic of radial cross section used in simulations of secondary circulation around a hydrothermal vent. Horizontal (10 and 20 mbsf) and vertical (20 m from vent) 1-m-thick channels were used in some simulations to test influence of permeability heterogeneities. Flow paths A and B are associated with model runs 4A and 4B, respectively.
present application we represent the entire vent field as a single pumping well discharging fluid at 0.157 m 3 s -1. We use fluid properties appropriate for flow at 280øC (p= 800 kg m -3, /a = 9.9x10 -5 Pa s). The head difference for horizontal flow is 1.7 m, and we assume that r2 -- 1600 m and r• << r2 (r• -- 50 m). The only two unknowns are permeability and conduit thickness (Figure 9b). Assuming a layer thickness of 5 to 1000 m, the bulk permeability of this zone must be 10 -•ø to 10 -12 m 2 (Figure 9b). This permeability range is several orders of magnitude higher than indicated by most of the packer measurements made at the two sites, except for the 5-m-thick zone in Hole 857D interpreted to have a bulk permeability of the order of 10 -•ø m 2 [Becker et al., 1994]. If such a zone was laterally continuous within the region surrounding the Dead Dog AAV, it could supply all of the fluid exiting through hydrothermal vents and allow development of pressure patterns consistent with sealed-borehole data. Thus once recharge for the primary circulation system enters the hydrothermal reservoir along valley-bounding faults, the hydrologic conditions in basement are consistent with efficient flow toward the hydrothermal vents. This fluid probably does not exit the reservoir immediately but circulates for long enough to react with basement and develop a chemical signature typical of Middle Valley. This requires that the reservoir volume be large relative to the vent flux.
Although this is a steady state analysis, the fluid pressures measured in sealed boreholes at Sites 857 and 858 are not completely stable [Davis and Becker, 1994, 1998], nor do we know whether these values are typical of these locations during the geologic past. In addition, measurements made in two boreholes indicate the magnitude of only one component of the three-dimensional force vector. Nevertheless, these calculations demonstrate that the basement transmissivity is high enough to supply hydrothermal fluid to the active vent field through a thin layer, given available driving forces at the time the pressure measurements were made.
5.2. Secondary Circulation System
Little is known about the detailed subsurface plumbing of hydrothermal vents and the degree to which focused vent flow affects diffuse fluid circulation within the surrounding formation. The pressure difference between the vent and its surroundings, the permeability of conduit walls, and the permeability of the shallow strata each affect the exchange of water between the vent conduit and the formation. Using the finite element coupled heat and fluid flow model FEHM [Zyvoloski et al., 1997] to simulate flow surrounding a single vent, we investigate what pressure and permeability conditions are necessary to create a secondary circulation system that is characterized by (1) underpressures as large as -3 kPa m -• at distances of 50-100 m from a vent, (2) localized fluid down flow rapid enough to create restricted areas of very low heat flow, and (3) at most, very minor direct recharge to the vents so that vent chemistry will not accumulate a sediment signature.
The model domain (Figure 10) idealizes the shallow region around an active vent as a cylindrical zone with a radius of 200 m and thickness of 30 m. The model grid is a radial cross section. The left boundary represents the vent. The bottom of the grid corresponds to the top of a conductive lid, an isothermal (280øC) no-flow boundary [Stein et al., 1998]. The top boundary is held at a constant seafloor pressure (24 MPa) and temperature (2øC), which allows fluid to enter and exit the system. The right boundary is no flow since it is well outside the AAV. Sediment thermal conductivity is fixed at 1.0 W m -• K -• and fluid properties (density, enthalpy, and viscosity) vary with temperature and pressure [Harvey et al., 1997].
If the conduit is impermeable to the surrounding sediments, the vent can be modeled as a constant temperature, no-flow boundary (case 1, Table 4). For these simulations we tested a
Table 4. Specifications of Simulations of Secondary Circulation System
Simulation Vent Boundary Sediment Channel Case Condition a Permeability, Geometry b
m 2
Channel Permeabilities,
m 2
1A T + NF 1047 none 1B T + NF 10 45 none 2A T + P 10 47 none 2B T + P 1045 none 3A T + P 1046 H, 10 mbsf 3B T + P 10 46 H, 20 mbsf 4A T + P 1046 H, 10 mbsf;
V, 20 m to vent 4B T + P 1046 H, 20 mbsf;
V, 20 m to vent
none
none
none
none
1044, 1043, 1042 1044, 1043, 1042 1044, 1043, 104•
1044, 1043, 104•
aT, constant temperature; P, constant pressure; NF, no flow. bH, horizontal' V, vertical.
STEIN AND FISHER: HYDROTHERMAL CIRCULATION IN MIDDLE VALLEY 8573
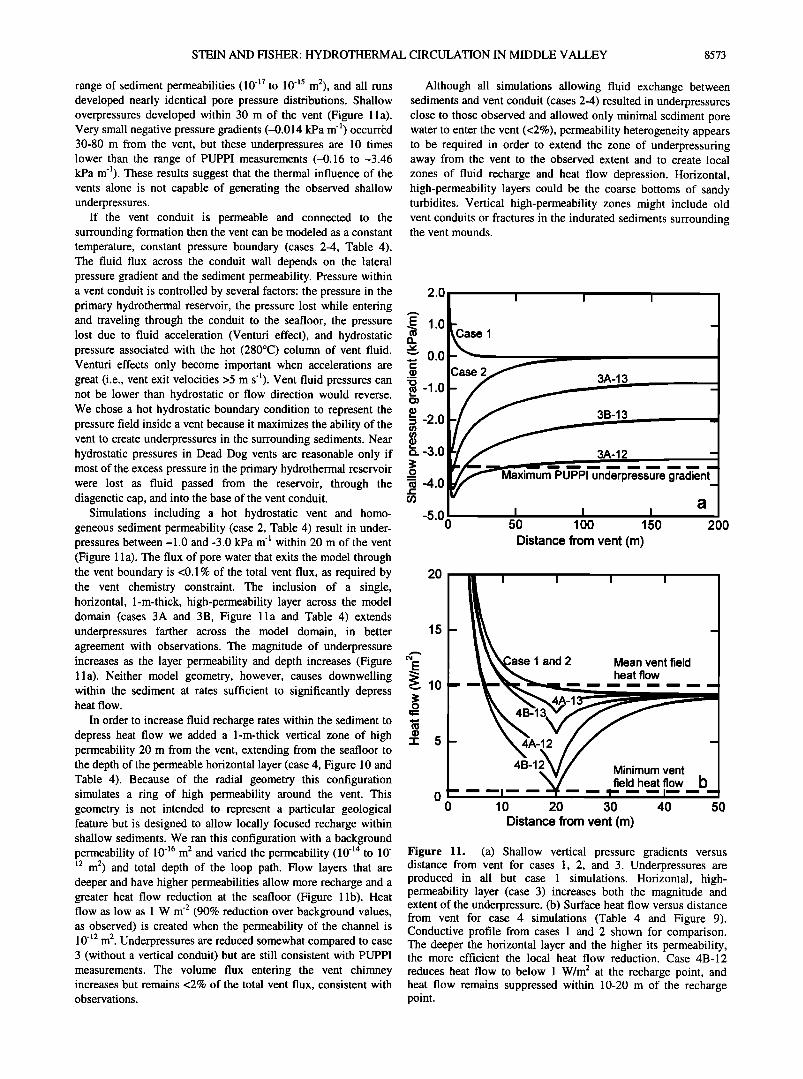
range of sediment permeabilities (10 -]7 to 10 -]5 m2), and all runs developed nearly identical pore pressure distributions. Shallow overpressures developed within 30 m of the vent (Figure 1 l a). Very small negative pressure gradients (-0.014 kPa m -1) occurred 30-80 m from the vent, but these underpressures are 10 times lower than the range of PUPPI measurements (-0.16 to -3.46 kPa m-i). These results suggest that the thermal influence of the vents alone is not capable of generating the observed shallow underpressures.
If the vent conduit is permeable and connected to the surrounding formation then the vent can be modeled as a constant temperature, constant pressure boundary (cases 2-4, Table 4). The fluid flux across the conduit wall depends on the lateral pressure gradient and the sediment permeability. Pressure within a vent conduit is controlled by several factors: the pressure in the primary hydrothermal reservoir, the pressure lost while entering and traveling through the conduit to the seafloor, the pressure lost due to fluid acceleration (Venturi effect), and hydrostatic pressure associated with the hot (280øC) column of vent fluid. Venturi effects only become important when accelerations are great (i.e., vent exit velocities >5 m s-i). Vent fluid pressures can not be lower than hydrostatic or flow direction would reverse. We chose a hot hydrostatic boundary condition to represent the pressure field inside a vent because it maximizes the ability of the vent to create underpressures in the surrounding sediments. Near hydrostatic pressures in Dead Dog vents are reasonable only if most of the excess pressure in the primary hydrothermal reservoir were lost as fluid passed from the reservoir, through the diagenetic cap, and into the base of the vent conduit.
Simulations including a hot hydrostatic vent and homo- geneous sediment permeability (case 2, Table 4) result in under- pressures between -1.0 and -3.0 kPa m -] within 20 m of the vent (Figure 1 l a). The flux of pore water that exits the model through the vent boundary is <0.1% of the total vent flux, as required by the vent chemistry constraint. The inclusion of a single, horizontal, 1-m-thick, high-permeability layer across the model domain (cases 3A and 3B, Figure 11a and Table 4) extends underpressures farther across the model domain, in better agreement with observations. The magnitude of underpressure increases as the layer permeability and depth increases (Figure 1 l a). Neither model geometry, however, causes downwelling within the sediment at rates sufficient to significantly depress heat flow.
In order to increase fluid recharge rates within the sediment to depress heat flow we added a 1-m-thick vertical zone of high permeability 20 m from the vent, extending from the seafloor to the depth of the permeable horizontal layer (case 4, Figure 10 and Table 4). Because of the radial geometry this configuration simulates a ring of high permeability around the vent. This geometry is not intended to represent a particular geological feature but is designed to allow locally focused recharge within shallow sediments. We ran this configuration with a background permeability of 10 -]6 m 2 and varied the permeability (10 -]4 to 10- ]2 m 2) and total depth of the loop path. Flow layers that are deeper and have higher permeabilities allow more recharge and a greater heat flow reduction at the seafloor (Figure 1 lb). Heat flow as low as 1 W m -2 (90% reduction over background values, as observed) is created when the permeability of the channel is 10 -]2 m 2. Underpressures are reduced somewhat compared to case 3 (without a vertical conduit) but are still consistent with PUPPI measurements. The volume flux entering the vent chimney increases but remains <2% of the total vent flux, consistent with observations.
Although all simulations allowing fluid exchange between sediments and vent conduit (cases 2-4) resulted in underpressures close to those observed and allowed only minimal sediment pore water to enter the vent (<2%), permeability heterogeneity appears to be required in order to extend the zone of underpressuring away from the vent to the observed extent and to create local zones of fluid recharge and heat flow depression. Horizontal, high-permeability layers could be the coarse bottoms of sandy turbidires. Vertical high-permeability zones might include old vent conduits or fractures in the indurated sediments surrounding the vent mounds.
2.0
1.0
v 00 ,
-1.0
-2.0
-,3.0
-4.0
-5.00
20
Case 1
3A-13
3B-13
3A-12 i i i i i i i 1
Maximum PUPPI underpressure gradient
50 100 150 Distance from vent (m)
a
200
15
• 10 o
1 and 2 Mean vent field heat flow
4B-12 Minimum vent field heat flow b
0 10 20 30 40 50 Distance from vent (m)
Figure 11. (a) Shallow vertical pressure gradients versus distance from vent for cases 1, 2, and 3. Underpressures are produced in all but case 1 simulations. Horizontal, high- permeability layer (case 3) increases both the magnitude and extent of the underpressure. (b) Surface heat flow versus distance from vent for case 4 simulations (Table 4 and Figure 9). Conductive profile from cases 1 and 2 shown for comparison. The deeper the horizontal layer and the higher its permeability, the more efficient the local heat flow reduction. Case 4B-12 reduces heat flow to below 1 W/m 2 at the recharge point, and heat flow remains suppressed within 10-20 m of the recharge point.
8574 STEIN AND FISHER: HYDROTHERMAL CIRCULATION IN MIDDLE VALLEY
Fig. 12b Recharge to primary system along faults
Not to scale Hydrologic basement
_ \ -Y•!•K. I X X. V'
Diagenetic,• k_ | I I,,/ I • •,l-."l Secondary circulation hydrologic, • "•U.n.derp.ressure, d • •_ and vent discharge conductive
fid • Overpressure• \'
A!!ered. / • • J It \ Primary circulation
Not to scale / Well-mixed, isothermal
Vent seepage(• ' Pore water seepage • ... _ Focused -•••• l• \ •._ otow r, ec.n,arge recharge
• •)• • ,, • J )•••Recharoealong u• '• .... I. !, Recharoe is / ' • ! No head loss • )•rnaJl-co•- ['ribution I,,I h ht roug /id •l I .... •'ovei4•s- t'¾1 Head loss
Not to scale • •1;•' •1•1'/• C
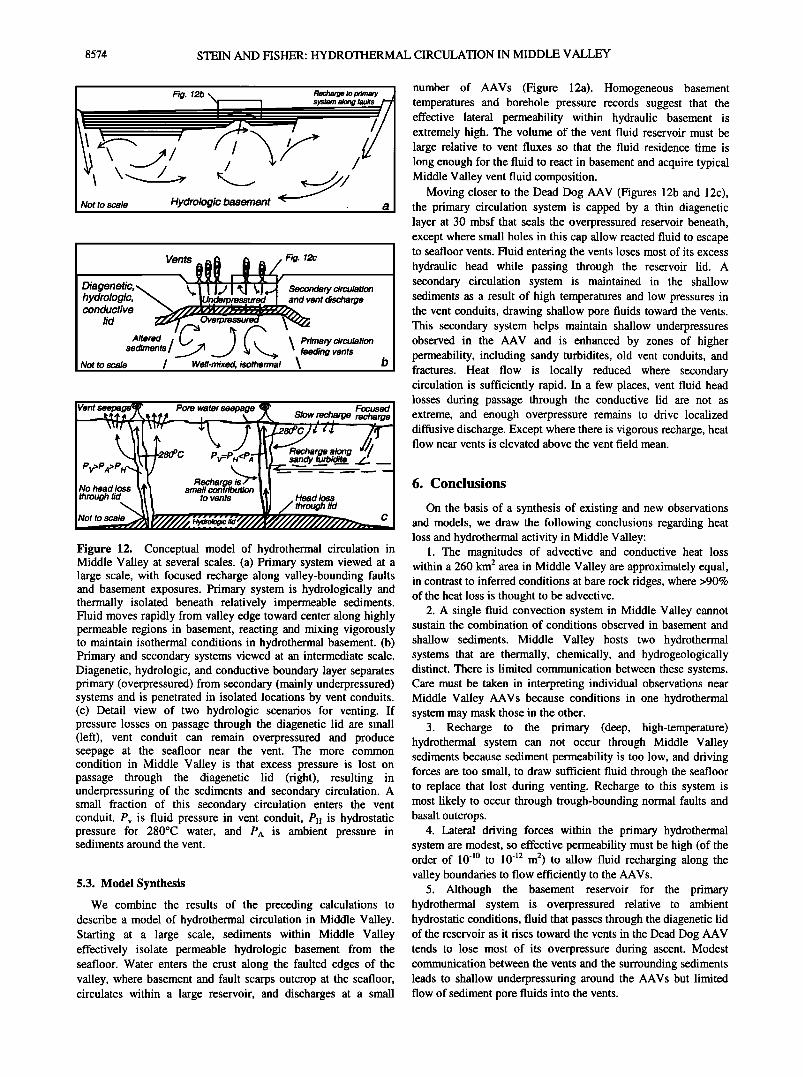
Figure 12. Conceptual model of hydrothermal circulation in Middle Valley at several scales. (a) Primary system viewed at a large scale, with focused recharge along valley-bounding faults and basement exposures. Primary system is hydrologically and thermally isolated beneath relatively impermeable sediments. Fluid moves rapidly from valley edge toward center along highly permeable regions in basement, reacting and mixing vigorously to maintain isothermal conditions in hydrothermal basement. (b) Primary and secondary systems viewed at an intermediate scale. Diagenetic, hydrologic, and conductive boundary layer separates primary (overpressured) from secondary (mainly underpressured) systems and is penetrated in isolated locations by vent conduits. (c) Detail view of two hydrologic scenarios for venting. If pressure losses on passage through the diagenetic lid are small (left), vent conduit can remain overpressured and produce seepage at the seafloor near the vent. The more common condition in Middle Valley is that excess pressure is lost on passage through the diagenetic lid (fight), resulting in underpressuring of the sediments and secondary circulation. A small fraction of this secondary circulation enters the vent conduit. Pv is fluid pressure in vent conduit, Pi• is hydrostatic pressure for 280øC water, and P^ is ambient pressure in sediments around the vent.
5.3. Model Synthesis
We combine the results of the preceding calculations to describe a model of hydrothermal circulation in Middle Valley. Starting at a large scale, sediments within Middle Valley effectively isolate permeable hydrologic basement from the seafloor. Water enters the crust along the faulted edges of the valley, where basement and fault scarps outcrop at the seafloor, circulates within a large reservoir, and discharges at a small
number of AAVs (Figure 12a). Homogeneous basement temperatures and borehole pressure records suggest that the effective lateral permeability within hydraulic basement is extremely high. The volume of the vent fluid reservoir must be large relative to vent fluxes so that the fluid residence time is long enough for the fluid to react in basement and acquire typical Middle Valley vent fluid composition.
Moving closer to the Dead Dog AAV (Figures 12b and 12c), the primary circulation system is capped by a thin diagenetic layer at 30 mbsf that seals the overpressured reservoir beneath, except where small holes in this cap allow reacted fluid to escape to seafloor vents. Fluid entering the vents loses most of its excess hydraulic head while passing through the reservoir lid. A secondary circulation system is maintained in the shallow sediments as a result of high temperatures and low pressures in the vent conduits, drawing shallow pore fluids toward the vents. This secondary system helps maintain shallow underpressures observed in the AAV and is enhanced by zones of higher permeability, including sandy turbidites, old vent conduits, and fractures. Heat flow is locally reduced where secondary circulation is sufficiently rapid. In a few places, vent fluid head losses during passage through the conductive lid are not as extreme, and enough overpressure remains to drive localized diffusive discharge. Except where there is vigorous recharge, heat flow near vents is elevated above the vent field mean.
6. Conclusions
On the basis of a synthesis of existing and new observations and models, we draw the following conclusions regarding heat loss and hydrothermal activity in Middle Valley:
1. The magnitudes of advective and conductive heat loss within a 260 km 2 area in Middle Valley are approximately equal, in contrast to inferred conditions at bare rock ridges, where )90% of the heat loss is thought to be advective.
2. A single fluid convection system in Middle Valley cannot sustain the combination of conditions observed in basement and
shallow sediments. Middle Valley hosts two hydrothermal systems that are thermally, chemically, and hydrogeologically distinct. There is limited communication between these systems. Care must be taken in interpreting individual observations near Middle Valley AAVs because conditions in one hydrothermal system may mask those in the other.
3. Recharge to the primary (deep, high-temperature) hydrothermal system can not occur through Middle Valley sediments because sediment permeability is too low, and driving forces are too small, to draw sufficient fluid through the seafloor to replace that lost during venting. Recharge to this system is most likely to occur through trough-bounding normal faults and basalt outcrops.
4. Lateral driving forces within the primary hydrothermal system are modest, so effective permeability must be high (of the order of 10 © to 10 -•2 m 2) to allow fluid recharging along the valley boundaries to flow efficiently to the AAVs.
5. Although the basement reservoir for the primary hydrothermal system is overpressured relative to ambient hydrostatic conditions, fluid that passes through the diagenetic lid of the reservoir as it rises toward the vents in the Dead Dog AAV tends to lose most of its overpressure during ascent. Modest communication between the vents and the surrounding sediments leads to shallow underpressuring around the AAVs but limited flow of sediment pore fluids into the vents.
STEIN AND FISHER: HYDROTHERMAL CIRCULATION IN MIDDLE VALLEY 8575
6. In cases where rising fluid passes through the diagenetic lid without losing all of its overpressure, zones of diffuse discharge may develop adjacent to hydrothermal vents.
7. Underpressuring associated with hydrothermal vents, in combination with the thermal boundary condition imposed by the vents, drives a secondary (shallow, low-temperature) convection system. Flow associated with this secondary system is enhanced in areas of locally elevated permeability (the bases of turbidites, old vent conduits, fractures). Recharge of the secondary system suppresses seafloor heat flow, leading to low values adjacent to hydrothermal vents.
Several critical questions remain to be resolved: What is the distribution of permeability beneath the valley that allows efficient lateral fluid, solute, and heat transport over distances of several kilometers? How does the Middle Valley hydrogeology relate to the lithostratigraphy of the crust? Is the existence of a conductive lid above the hydrothermal reaction zone limited to sedimented spreading centers, or do bare rock systems also have a diagenetic cap (perhaps at greater depth below the seafloor) that allows development of fluid overpressures .9
Seafloor hydrothermal systems are profoundly dynamic and enigmatic. As we continue to accumulate observations and develop quantitative models, we are developing a better understanding of the mechanisms by which heat, solutes, and fluid are exchanged between water and rock. Middle Valley continues to provide excellent opportunities to develop and test new ideas about how these systems work.
Appendix A: Data Processing and Uncertainty Estimates
Here we describe standard processing of multipenetration heat flow data and data collected with outrigger probes on core barrels. We also describe how uncertainties in the calculated heat flow values were estimated. A listing of the final heat flow locations, values, and estimated uncertainties is available as electronic supporting material (Table A1).
A1. Heat Flow Data Processing
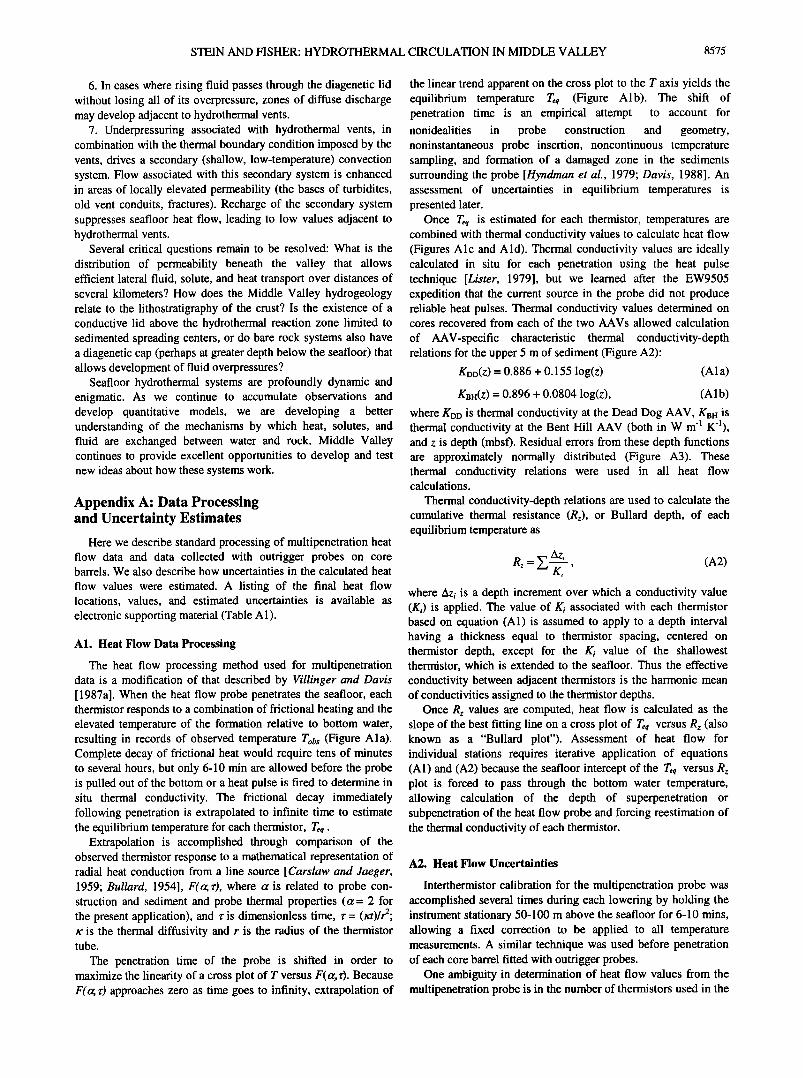
The heat flow processing method used for multipenetration data is a modification of that described by Villinger and Davis [ 1987a]. When the heat flow probe penetrates the seafloor, each thermistor responds to a combination of frictional heating and the elevated temperature of the formation relative to bottom water, resulting in records of observed temperature Tobs (Figure Ala). Complete decay of frictional heat would require tens of minutes to several hours, but only 6-10 min are allowed before the probe is pulled out of the bottom or a heat pulse is fired to determine in situ thermal conductivity. The frictional decay immediately following penetration is extrapolated to infinite time to estimate the equilibrium temperature for each thermistor, teq ß
Extrapolation is accomplished through comparison of the observed thermistor response to a mathematical representation of radial heat conduction from a line source [Carslaw and Jaeger, 1959; Bullard, 1954], F(a; r), where a is related to probe con- struction and sediment and probe thermal properties (a= 2 for the present application), and r is dimensionless time, r = (xt)/r2; •c is the thermal diffusivity and r is the radius of the thermistor tube.
The penetration time of the probe is shifted in order to maximize the linearity of a cross plot of T versus F(a, r). Because F(a; r) approaches zero as time goes to infinity, extrapolation of
the linear trend apparent on the cross plot to the T axis yields the equilibrium temperature T•q (Figure Alb). The shift of penetration time is an empirical attempt to account for nonidealities in probe construction and geometry, noninstantaneous probe insertion, noncontinuous temperature sampling, and formation of a damaged zone in the sediments surrounding the probe [Hyndman et al., 1979; Davis, 1988]. An assessment of uncertainties in equilibrium temperatures is presented later.
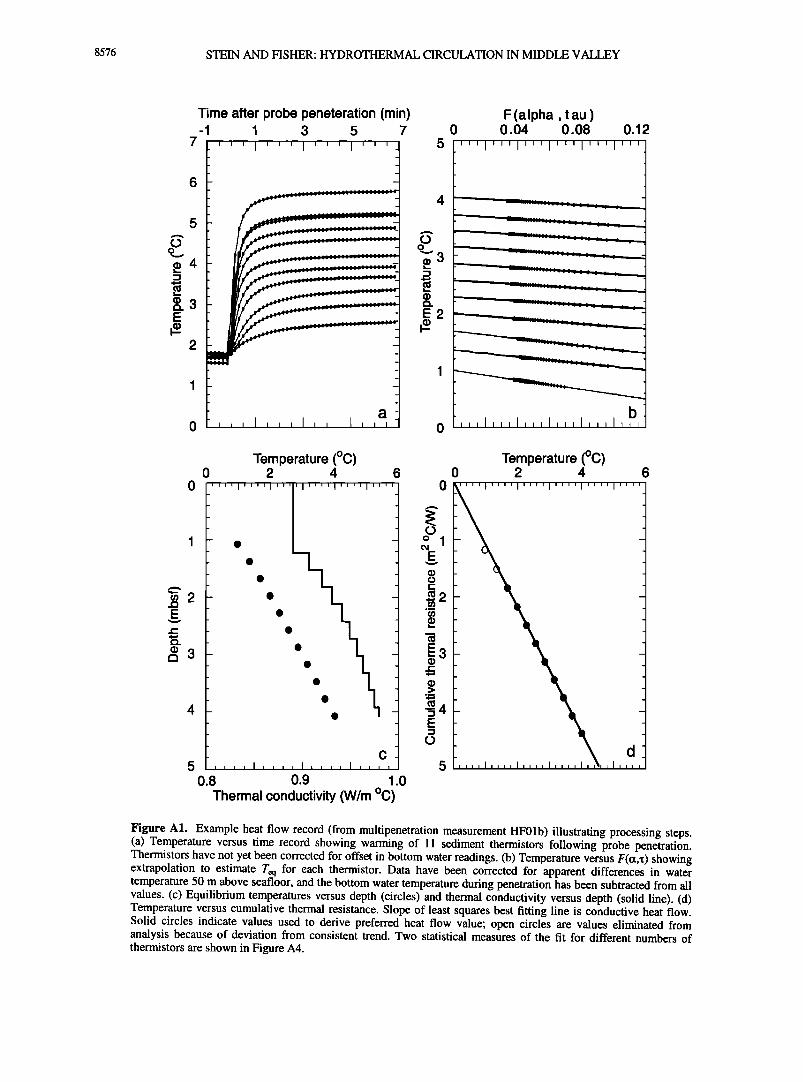
Once T•q is estimated for each thermistor, temperatures are combined with thermal conductivity values to calculate heat flow (Figures Alc and Ald). Thermal conductivity values are ideally calculated in situ for each penetration using the heat pulse technique [Lister, 1979], but we learned after the EW9505 expedition that the current source in the probe did not produce reliable heat pulses. Thermal conductivity values determined on cores recovered from each of the two AAVs allowed calculation
of AAV-specific characteristic thermal conductivity-depth relations for the upper 5 m of sediment (Figure A2):
KDD(Z) = 0.886 + 0.155 log(z) (Ala)
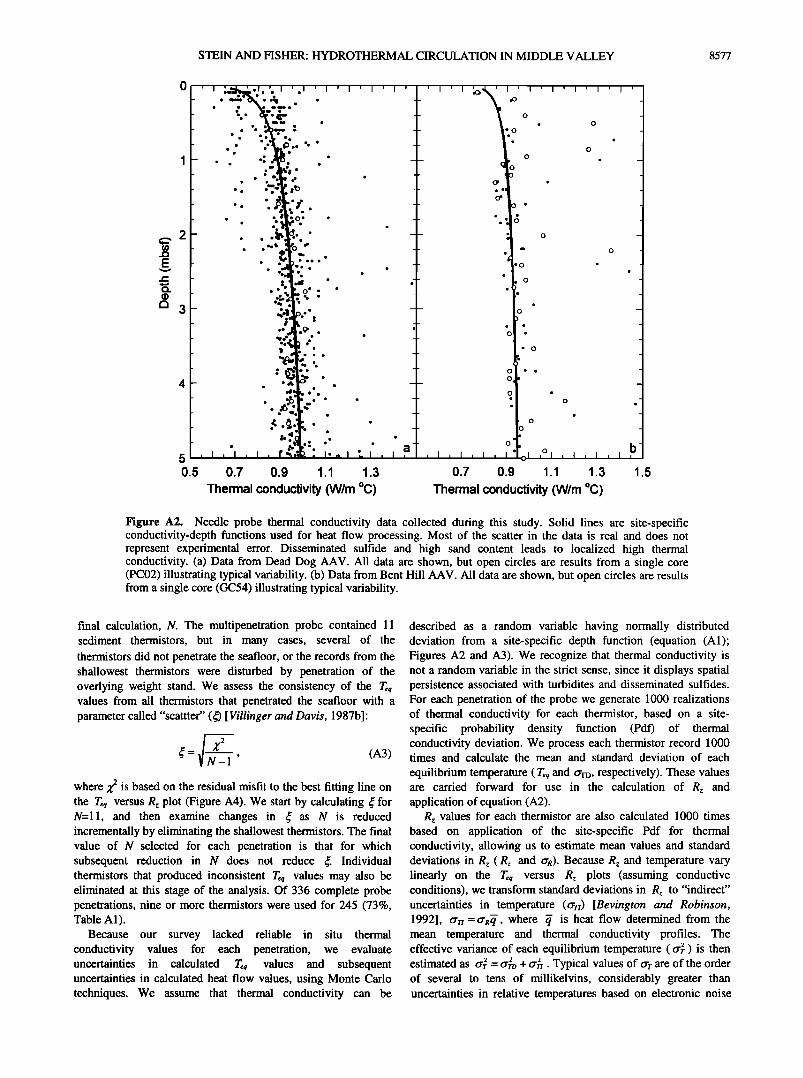
KB.(z) = 0.896 + 0.0804 log(z), (Alb) where KDD is thermal conductivity at the Dead Dog AAV, KB. is thermal conductivity at the Bent Hill AAV (both in W m -1 K-I), and z is depth (mbsf). Residual errors from these depth functions are approximately normally distributed (Figure A3). These thermal conductivity relations were used in all heat flow calculations.
Thermal conductivity-depth relations are used to calculate the cumulative thermal resistance (Rz), or Bullard depth, of each equilibrium temperature as
R• = • Az.•_, (A2) K, ' where AZi is a depth increment over which a conductivity value (Ki) is applied. The value of Ki associated with each thermistor based on equation (A1) is assumed to apply to a depth interval having a thickness equal to thermistor spacing, centered on thermistor depth, except for the Ki value of the shallowest thermistor, which is extended to the seafloor. Thus the effective conductivity between adjacent thermistors is the harmonic mean of conductivities assigned to the thermistor depths.
Once Rz values are computed, heat flow is calculated as the slope of the best fitting line on a cross plot of T•q versus Rz (also known as a "Bullard plot"). Assessment of heat flow for individual stations requires iterative application of equations (A1) and (A2) because the seafloor intercept of the T•q versus Rz plot is forced to pass through the bottom water temperature, allowing calculation of the depth of superpenetration or subpenetration of the heat flow probe and forcing reestimation of the thermal conductivity of each thermistor.
A2. Heat Flow Uncertainties
Interthermistor calibration for the multipenetration probe was accomplished several times during each lowering by holding the instrument stationary 50-100 m above the seafloor for 6-10 mins, allowing a fixed correction to be applied to all temperature measurements. A similar technique was used before penetration of each core barrel fitted with outrigger probes.
One ambiguity in determination of heat flow values from the multipenetration probe is in the number of thermistors used in the
8576 STEIN AND FISHER: HYDROTHERMAL CIRCULATION IN MIDDLE VALLEY
5
Timeafterprobepeneteration(min) ' 1 3 5 7
'''1'''1'''1'''- -
.
_
_
_
_
_
_
_
_
_
_
_
_
_
_ _
_
_
a-
E2
F (a Ipha, t au ) 0.04 0.08 0.12
'''1'''1'''1'''1'''1'''
Temperature (øC) 2 4
I'''' I''''1'''
c
O.8 O.9 1.0 Thermal conductivity (W/m øC)
0
Temperature (øC) 0 2 4 6
Figure A1. Example heat flow record (from multipenetration measurement HF01b) illustrating processing steps. (a) Temperature versus time record showing warming of 11 sediment thermistors following probe penetration. Thermistors have not yet been corrected for offset in bottom water readings. (b) Temperature versus F(tx,x) showing extrapolation to estimate req for each thermistor. Data have been corrected for apparent differences in water temperature 50 m above seafloor, and the bottom water temperature during penetration has been subtracted from all values. (c) Equilibrium temperatures versus depth (circles) and thermal conductivity versus depth (solid line). (d) Temperature versus cumulative thermal resistance. Slope of least squares best fitting line is conductive heat flow. Solid circles indicate values used to derive preferred heat flow value; open circles are values eliminated from analysis because of deviation from consistent trend. Two statistical measures of the fit for different numbers of thermistors are shown in Figure A4.
STEIN AND FISHER: HYDROTHERMAL CIRCULATION IN MIDDLE VALLEY 8577
ß ß •eee ß e• e e •
ß ß ß ee%
ß
ee
eee ee ß ß
ß .0
0 ß ß 0
ß ß
ß ß
ß
ß
ß
e•e ß ß eee
•ee ß
e e ß
0 e ß ß
ß
5 0.5
ß
ß
ß ß ß
ß
ß
0.7 0.9 1.1 1.3
Thermal conductivity (W/m øC)
e, 0
ß 0 ß ß - ß
0 -
ß _ ß
0
ß -
0
ß ß
ß
-' 0 ß ß
0
ø•I ø , I , I , I , I
0.7 0.9 1.1 1.3 1.5
Thermal conductivity (W/m øC)
Figure A2. Needle probe thermal conductivity data collected during this study. Solid lines are site-specific conductivity-depth functions used for heat flow processing. Most of the scatter in the data is real and does not represent experimental error. Disseminated sulfide and high sand content leads to localized high thermal conductivity. (a) Data from Dead Dog AAV. All data are shown, but open circles are results from a single core (PC02) illustrating typical variability. (b) Data from Bent Hill AAV. All data are shown, but open circles are results from a single core (GC54) illustrating typical variability.
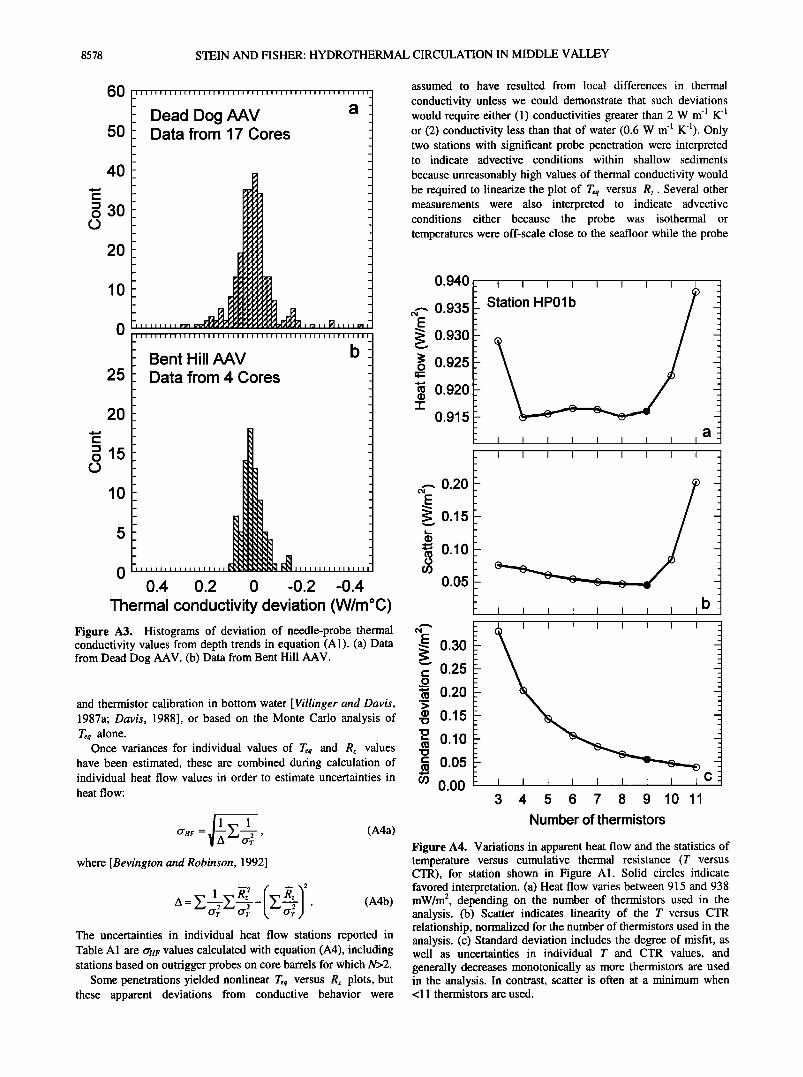
final calculation, N. The multipenetration probe contained 11 sediment thermistors, but in many cases, several of the thermistors did not penetrate the seafloor, or the records from the shallowest thermistors were disturbed by penetration of the overlying weight stand. We assess the consistency of the Teq values from all thermistors that penetrated the seafloor with a parameter called "scattter" (½) [ Villinger and Davis, 1987b]:
(A3)
where 72 is based on the residual misfit to the best fitting line on the Teq versus Rz plot (Figure A4). We start by calculating f for N=11, and then examine changes in • as N is reduced incrementally by eliminating the shallowest thermistors. The final value of N selected for each penetration is that for which subsequent reduction in N does not reduce •. Individual thermistors that produced inconsistent Teq values may also be eliminated at this stage of the analysis. Of 336 complete probe penetrations, nine or more thermistors were used for 245 (73%, Table A1).
Because our survey lacked reliable in situ thermal conductivity values for each penetration, we evaluate uncertainties in calculated Te• values and subsequent uncertainties in calculated heat flow values, using Monte Carlo techniques. We assume that thermal conductivity can be
described as a random variable having normally distributed deviation from a site-specific depth function (equation (A1); Figures A2 and A3). We recognize that thermal conductivity is not a random variable in the strict sense, since it displays spatial persistence associated with turbidites and disseminated sulfides. For each penetration of the probe we generate 1000 realizations of thermal conductivity for each thermistor, based on a site- specific probability density function (Pdf) of thermal conductivity deviation. We process each thermistor record 1000 times and calculate the mean and standard deviation of each
equilibrium temperature (Te• and OrI•, respectively). These values are carried forward for use in the calculation of Rz and application of equation (A2).
Rz values for each thermistor are also calculated 1000 times based on application of the site-specific Pdf for thermal conductivity, allowing us to estimate mean values and standard deviations in Rz (R• and OR). Because Rz and temperature vary linearly on the Te• versus R• plots (assuming conductive conditions), we transform standard deviations in R• to "indirect" uncertainties in temperature (err/) [Bevington and Robinson, 1992], o'r/=o'R•, where • is heat flow determined from the mean temperature and thermal conductivity profiles. The effective variance of each equilibrium temperature (crY-) is then estimated as crY. = cr•-z> + crY-,. Typical values of o'r are of the order of several to tens of millikelvins, considerably greater than uncertainties in relative temperatures based on electronic noise
8578 STEIN AND FISHER: HYDROTHERMAL CIRCULATION IN MIDDLE VALLEY
0 IIIIIIIIIIIIIIIIIIIIIIIIIIIIIIIIIIIIIIIIIIIIIIII
Dead Dog AAV a 50 Data from 17 Cores
4O _ -
_
o 30 - _
O - _
_
20 - _
_
_
_
10 - _
_
_
0 -II III II II F'I• .... J• ...... - IIIIIIIIIIIIIIIIIIIIIIIIIIIIllllllllllllllllllll
Bent Hill AAV b 25 Data from 4 Cores
2O _ _
=15 - O - O -
_
_
10 - _
_
_
_
5 - _
_
- -IIIIIIIIIIIll•ll• IIIIIIIIIIIIIIII- 0.4 0.2 0 -0.2 -0.4
Thermal conductivity deviation (W/møC) Figure A3. Histograms of deviation of needle-probe thermal conductivity values from depth trends in equation (A1). (a) Data from Dead Dog AAV. (b) Data from Bent Hill AAV.
and thermistor calibration in bottom water [Viilinger and Davis, 1987a; Davis, 1988], or based on the Monte Carlo analysis of Teq alone.
Once variances for individual values of Teq and R• values have been estimated, these are combined during calculation of individual heat flow values in order to estimate uncertainties in heat flow:
O"HF -- 2 ' O'r
where [Bevington and Robinson, 1992]
A = Z _l__y]]•_ Z ß (A4b) The uncertainties in individual heat flow stations reported in Table A1 are cr•r values calculated with equation (A4), including stations based on outrigger probes on core barrels for which N>2.
Some penetrations yielded nonlinear T,½ versus R• plots, but these apparent deviations from conductive behavior were
(A4a)
assumed to have resulted from local differences in thermal
conductivity unless we could demonstrate that such deviations would require either (1) conductivities greater than 2 W m -• K -• or (2) conductivity less than that of water (0.6 W m -• K-l). Only two stations with significant probe penetration were interpreted to indicate advective conditions within shallow sediments
because unreasonably high values of thermal conductivity would be required to linearize the plot of Teq versus R•. Several other measurements were also interpreted to indicate advective conditions either because the probe was isothermal or temperatures were off-scale close to the seafloor while the probe
O.94O
0.935
0.930 0.925
0.920
0.915
0.20
0.15
0.10
0.05
0.30 0.25 0.20
o.s 0.10
o.o5 0.00
I I I
I I
5 6 7 8 9 10 11
Number of thermistors
Figure A4. Variations in apparent heat flow and the statistics of temperature versus cumulative thermal resistance (T versus CTR), for station shown in Figure A1. Solid circles indicate favored interpretation. (a) Heat flow varies between 915 and 938 mW/m 2, depending on the number of thermistors used in the analysis. (b) Scatter indicates linearity of the T versus CTR relationship, normalized for the number of thermistors used in the analysis. (c) Standard deviation includes the degree of misfit, as well as uncertainties in individual T and CTR values, and generally decreases monotonically as more thermistors are used in the analysis. In contrast, scatter is often at a minimum when <11 thermistors are used.
STEIN AND FISHER: HYDROTHERMAL CIRCULATION IN MIDDLE VALLEY 8579
was in sediments or because the probe fell over but warm diffuse flow was interpreted to be passing over the thermistor tube.
Some heat flow measurements made with outrigger probes included only a single thermistor that penetrated the sediment, or one or more thermistors were heated beyond their calibrated and usable range. In these cases, the listed heat flow values are lower bounds and no uncertainty estimate is made.
Additional possible errors not included in the heat flow uncer- tainty estimates are those associated with sedimentation, instru- ment tilt, and thermal conductivity corrections. We did not apply sedimentation corrections because earlier workers in this area did
not apply corrections [e.g., Davis and Villinger, 1992] and because the sedimentation and volcanic history of Middle Valley is not well known [Davis et al., 1992; Davis and Wang, 1994]. On the basis of an assumed sedimentation rate of 0.22 mm yr -• for the last 125 kyr [Davis and Wang, 1994], standard analytical solutions [Benfield, 1949; Langseth et al., 1980] result in a sedimentation correction of <3%. The actual correction could be
somewhat higher, depending on the sedimentation rate of deeper sediments and the history of intrusions in Middle Valley.
No corrections were applied for instrument tilt because the tilt sensor was considered to be unreliable during much of the survey and because tilts during the rest of the survey result in an average correction of <1%. Tilt values are reported in Table A1 so that others can apply corrections, if desired. No corrections were applied to needle probe thermal conductivity values for in-situ pressures and temperatures. We note that the combination of corrections for sedimentation, P and T dependence of thermal conductivity and tilt will have a minimal impact on heat budget calculations and that differences in corrections between stations will be much smaller than the enormous differences in observed heat flow.
Acknowledgments. We thank the EW9505 and ODP Leg 169 Scientific Parties for collecting and providing access to data. We also thank E. Giambalvo, E. Davis, and K. Becker for helpful discussions and critical reviews of this manuscript and J. Revenaugh for statistical advice. S. Nagahara, an anonymous reviewer, and the Associate Editor made suggestions that greatly improved this manuscript. This research was supported by NSF OCE95-96253 and OCE95-28438 and CULAR (LANL/UCSC) project STB-UC98-181.
References
Ames, D.E., J.M. Franklin, and M.D. Hannington, Mineralogy and geochemistry of active and inactive chimneys and massive sulfide, Middle Valley, northern Juan de Fuca Ridge: An evolving hydrothermal system, Can. Mineral., 31,997-1024, 1993.
Baker, E.T., G.A. Feely, and G.J. Massoth, Hydrographic and chemical survey of hydrothermal plumes from the Middle Valley vent field, Juan de Fuca Ridge, Eos Trans. AGU, 68, 1325, 1987.
Baker, E.T., Y.J. Chen, and J.P. Morgan, The relationship between near- axis hydrothermal cooling and the spreading rate of mid-ocean ridges, Earth Planet. Sci. Lett., 142, 137-145, 1996.
Becker, K., and A. Fisher, Permeability of upper o•eanic basement on the eastern flank of the Endeavor Ridge determined with drill-string packer experiments, J. Geophys. Res., 105, 897-912, 2000.
Becker, K., R.H. Morin, and E.E. Davis, Permeabilities in the Middle Valley hydrothermal system measured with packer and flowmeter experiments, Proc. Ocean Drill. Program Sci. Results, 139, 613-626, 1994.
Benfield, A.E., The effect of uplift and denudation on underground temperatures, J. Appl. Phys., 20, 66-70, 1949.
Bessler, J.U., L. Smith, and E.E. Davis, Hydrologic and thermal conditions at a sediment/basalt interface: Implications for interpretation of field measurements at Middle Valley, Proc. Ocean Drill. Program Sci. Results, 139, 667-675, 1994.
Bevington, P.R., and D.K. Robinson, Data Reduction and Error Analysis for the Physical Sciences, 328 pp., McGraw-Hill, New York, 1992.
Bredehoeft, J.D., and I.S. Papadopoulos, Rates of vertical groundwater movement estimated from the Earth's thermal profile, Water Resour. Res., 1,325-328, 1965.
Bryant, W.R., A.P. Deflanche, and P.H. Trabant, Consolidation of marine clays and carbonates, in Deep-Sea Sediments, Physical and Mechanical Properties, edited by A.L. Inderbitzen, pp. 209-244, Plenum, New York, 1974.
Bullard, E.C., The flow of heat through the floor of the Atlantic Ocean, Proc. R. Soc. London, Ser. A, 222, 408-429, 1954.
Butterfield, D.A., R.E. McDuff, J. Franklin, and C.G. Wheat, Geochemistry of hydrothermal vent fluids from Middle Valley, Juan de Fuca Ridge, Proc. Ocean Drill. Program Sci. Results, 139, 395- 410, 1994.
Carslaw, H. S. and J. C. Jaeger, Conduction of Heat in Solids, 2nd ed. Oxford Univ. Press, New York, 1959.
Chen, Y.J., and J. Phipps Morgan, The effects of spreading rate, the magma budget, and the geometry of magma emplacement on the axial heat flux at mid-ocean ridges, J. Geophys. Res., 101, 11,475-11,482, 1996.
Converse, D.R., H.D. Holland, and J.M. Edmond, Flow rates in the axial hot springs of the East Pacific Rise (21 ø N): Implications for the heat budget and the formation of massive sulfide deposits, Earth Planet. Sci. Lett., 69, 159-175, 1984.
Crane, K., F.1. Aikman, R. Embley, S. Hammond, A. Malahoff, and J. Lupton, The distribution of geothermal fields on the Juan de Fuca Ridge, J. Geophys. Res., 90, 727-744, 1985.
Davis, E.E., Oceanic heat-flow density, in Handbook of Terrestrial Heat- Flow Density Determination, edited by R. Haenel, L. Rybach, and L. Stegena, pp. 223-260, Kluwer Acad., Norwell, Mass., 1988.
Davis, E.E., and K. Becker, Formation temperature and pressures in a sedimented rift hydrothermal system: 10 months of CORK observations, Holes 857D and 858G, Proc. Ocean Drill. Program Sci. Results, 139, 649-666, 1994.
Davis, E., and K. Becker, Borehole observatories record driving forces for hydrothermal circulation in young oceanic crust, Eos Trans. AGU, 79, 369-370, 1998.
Davis, E.E., and A.T. Fisher, On the nature and consequences of hydrothermal circulation in the Middle Valley sedimented rift: Inferences from geophysical and geochemical observations, Leg 139, Proc. Ocean Drill. Program Sci. Results, 139, 695-717, 1994.
Davis, E.E., and C.R.B. Lister, Heat flow measured over the Juan de Fuca Ridge: Evidence for widespread hydrothermal circulation in a highly heat transportative crust, J. Geophys. Res., 82, 4845-4860, 1977.
Davis, E.E., and H. Viilinger, Tectonic and thermal structure of the Middle Valley sedimented rift, northern Juan de Fuca Ridge, Proc. Ocean Drill. Program Initial Rep., 139, 9-41, 1992.
Davis, E.E., and K. Wang, Present and past temperatures of sediments at Site 857, Middle Valley, northern Juan de Fuca Ridge, Proc. Ocean Drill. Program Sci. Results, 139, 565-572, 1994.
Davis, E.E., W.D. Goodfellow, B.D. Bornhold, J. Adshead, B. Blaise, H. Viilinger, and G.M. Le Cheminant, Massive sulfides in a sedimented rift valley, northern Juan de Fuca Ridge, Earth Planet. Sci. Lett., 82, 49-61, 1987.
Davis, E.E., et al., Proc. Ocean Drill. Program Initial Rep., 1026 pp., Ocean Drill. Program, College Station, Tex., 1992.
Fang, W. W., M. G. Langseth, and P. J. Schultheiss, Analysis and application of in situ pore pressure measurements in marine sediments, J. Geophys. Res., 98, 7921-7938, 1993.
Fisher, A.T., Permeability within basaltic oceanic crust, Rev. Geophys., 36, 143-182, 1998.
Fisher, A.T., and K. Becker, Heat flow, hydrothermal circulation and basalt intrusions in the Guaymas Basin, Gulf of California, Earth Planet. Sci. Lett., 103, 84-99, 1991.
Fisher, A.T., K. Fischer, D. Lavoie, M. Langseth, and J. Xu, Geotechnical and hydrological properties of sediments from Middle Valley, northern, Juan de Fuca Ridge, Proc. Ocean Drill. Program Sci. Results, 139, 627-647, 1994.
Fisher, A., G. Iturrino, G. Jolly, R. Dolling, D. Daniel, J. Stein, and W. Jin, New autonomous outrigger probes used for the collection of thermal and chemical gradient data at the same location, Eos Trans. A GU, 77(17), Spring Meet. Suppl., S256, 1996.
Fisher, A., et al., The devil's in the details: Hydrogeology of active venting areas, Middle Valley, Eos Trans. AGU, 78(16), 165,170, 1997.
8580 STEIN AND FISHER: HYDROTHERMAL CIRCULATION IN MIDDLE VALLEY
Gieskes, J., M. Kastner, G. Einsele, K. Kelts, and J. Niemitz, Hydrothermal activity in the Guayman Basin, Gulf of California, a synthesis, Initial Rep. Deep Sea Drill. Proj., 64, 1159-1168, 1982.
Glenn, S., One dimensional fluid flow modeling of the area of active venting, Middle Valley, northern Juan de Fuca Ridge, M.S. thesis, Duke Univ., Durham, N. C., 1998.
Golden, C.E., S.C. Webb, and R.A. Sohn, Hydrothermal microearthquakes at Middle Valley, Juan de Fuca Ridge, Eos Trans. AGU, 79(45), Fall Meet. Suppl., F857, 1998.
Goodfellow, W.D., and B. Blaise, Sulfide formation and hydrothermal alteration of hemipelagic sediment in Middle Valley, northern Juan de Fuca Ridge, Can. Mineral., 26, 675-696, 1988.
Goodfellow, W.D., and J.M. Peter, Geochemistry of hydrothermally altered sediment, Middle Valley, northern Juan de Fuca Ridge, Proc. Ocean Drill. Program Sci. Results, 139, 207-289, 1994.
Gr6schel-Becker, H.M., E.E. Davis, and J.M. Franklin, Data report: Physical properties of massive sulfide from site 856, Middle Valley, northern Juan de Fuca Ridge, Proc. Ocean Drill. Program Sci. Results, 139, 721-724, 1994.
Harvey, A.H., A.P. Peskin, and S.A. Kline, NIST/ASME steam properties, U.S. Dep. of Commer., Gaithersburg, Md., 1997.
Hyndman, R.D., E.E. Davis, and J.A. Wright, The measurement of marine geothermal heat flow by a multipenetration probe with digital acoustic telemetry and in situ thermal conductivity, Mar. Geophys. Res., 4, 181-205, 1979.
Kastner, M., Evidence for two distinct hydrothermal systems in the Gulf of California, Initial Rep., Deep Sea Drill. Proj., 64, 529-542, 1982.
Langseth, M., and K. Becker, Structure of igneous basement at sites 857 and 858 based on leg 139 downhole logging, Proc. Ocean Drill. Program Sci. Results, 139, 573-583, 1994.
Langseth, M.G., M.A. Hobart, and K. Horai, Heat flow in the Bering Sea, J. Geophys. Res., 85, 3740-3750, 1980.
Langseth, M., P. Schultheiss, A.T. Fisher, and B.F. Ryan, Local recharge in an area of active hydrothermal venting: pore pressure gradient measurements over a sedimented ridge axis in Middle Valley, Juan de Fuca Ridge, Eos Trans. AGU, 77(17), Spring Meet. Suppl., S257, 1996.
Lister, C.R.B., The pulse-probe method of conductivity measurement, Geophys. J. R. Astron. Soc., 57, 451-461, 1979.
Morin, R., and A.J. Silva, The effects of high pressure and high temperature on some physical properties of ocean sediments, J. Geophys. Res., 89, 511-526, 1984.
Morton, J.L., and N.H. Sleep, A mid-ocean ridge thermal model: constraints on the volume of axial hydrothermal heat flux, J. Geophys. Res., 90, 11,345-11,353, 1985.
Obefiander, P.L., Fluid density and gravitational variations in deep boreholes and their effect on fluid potential, Ground Water, 27, 341- 350, 1989.
Pelayo, A.M., S. Stein, and C.A. Stein, Estimation of oceanic hydrothermal heat flux from heat flow and depths of midocean ridge seismicity and magma chambers, Geophys. Res. Lett., 21, 713-716, 1994.
Peter, J.M., W.D. Goodfellow, and M.I. Leyboume, Fluid inclusion petrography and micro thermometry of the Middle Valley hydrothermal system, northern Juan de Fuca Ridge, Proc. Ocean Drill. Program Sci. Results, 139, 411-428, 1994.
Rabinowicz, M., J. Boulegue, and P. Genthon, Two- and three- dimentional modeling of hydrothermal convection in the sedimented Middle Valley segment, Juan de Fuca Ridge, J. Geophys. Res., 103, 24,045-24,065, 1998.
Rohr, K.M.M., and U. Schmidt, Seismic structure of Middle Valley near Sites 855-858, Leg 139, Juan de Fuca Ridge, Proc. Ocean Drill. Program Sci. Results, 139, 3-17, 1994.
Schultheiss, P. J., Pore pressures in marine sediments: An overview of measurement techniques and some geological and engineering applications, Mar. Geophys. Res., 12, 153-168, 1990.
Schultheiss, P., Advances in fluid flow determinations for marine hydrogeology using pore pressure measurements, Eos Trans. A GU, 78(46), Fall Meet. Suppl., F672, 1997.
Schultz, A., J.R. Delaney, and R.E. McDuff, On the partitioning of heat flux between diffuse and point source seafloor venting, J. Geophys. Res., 97, 12,299-12,314, 1992.
Shipboard Scientific Party, Site 858, Proc. Ocean Drill. Program Initial Rep., 139, 431-569, 1992a.
Shipboard Scientific Party, Site 856, Proc. Ocean Drill. Program Initial Rep., 139, 161-281, 1992b.
Shipboard Scientific Party, Site 857, Proc. Ocean Drill. Program Initial Rep., 139, 283-429, 1992c.
Shipboard Scientific Party, Site 1036, Proc. Ocean Drill. Program Initial Rep., 169, 153-203, 1998a.
Shipboard Scientific Party, Site 1035, Proc. Ocean Drill. Program Initial Rep., 169, 35-152, 1998b.
Stakes, D.S., and J.M. Franklin, Petrology of igneous rocks at Middle Valley, Juan de Fuca Ridge, Proc. Ocean Drill. Program Sci. Results, 139, 79-102, 1994.
Stein, C.A., and S. Stein, Constraints on hydrothermal heat flux through the oceanic lithosphere from global heat flow, J. Geophys. Res., 99, 3081-3095, 1994.
Stein, J.S., A.T. Fisher, M. Langseth, W. Jin, G. Iturrino, and E. Davis, Fine-scale heat flow, shallow heat sources, and decoupled circulation systems at two sea-floor hydrothermal sites, Middle Valley, northern Juan de Fuca Ridge, Geology, 26, 1115-1118, 1998.
Theim, G., Hydrologische Methoden, 56 pp., Gebhardt, Leipzig, 1906. Viilinger, H., and E.E. Davis, A new reduction algorithm for marine
heat-flow measurements, J. Geophys. Res., 92, 12,846-12,856, 1987a. Viilinger, H., and E.E. Davis, HFRED: A program for reduction of
marine heat flow data on a microcomputer, 77 pp., Geol. Surv. Can., Open File Rep., 1627, 1987b.
Weiss, R.F., P. Lonsdale, J.E. Lupton, A.E. Bainbridge, and H. Craig, Hydrothermal plumes in the Galapagos Rift, Nature, 267, 600-603, 1977.
Zyvoloski, G.A., B.A. Robinson, Z.V. Dash, and L.L. Trease, User's manual for FEHM application-A finite-element heat- and mass- transfer code, Los Alamos Nat. Lab., Los Alamos, N.M., 1997.
A. T. Fisher, Department of Earth Sciences, University of California, Santa Cruz, CA 95064. ([email protected])
J. S. Stein, Colorado Rocky Mountain School, Carbondale, CO 81623. (jstein @ crms.org)
(Received October 11, 1999; revised October 23, 2000; accepted October 30, 2000.)


