Embed Size (px)
Citation preview

emote Sensing 62 (2007) 186–200www.elsevier.com/locate/isprsjprs
ISPRS Journal of Photogrammetry & R
Multitemporal fuzzy classification model based onclass transition possibilities
Guilherme L.A. Mota a,b, Raul Q. Feitosa a,b,⁎, Heitor L.C. Coutinho c,Claus-Eberhard Liedtke d, Sönke Müller d, Kian Pakzad e,
Margareth S.P. Meirelles b,c
a Catholic University of Rio de Janeiro, Department of Electrical Engineering, Rua Marquês de São Vicente 225,Room 401 L, Gávea, Rio de Janeiro, RJ 22453-900, PO Box 38097, Brazil
b Rio de Janeiro State University, Department of Systems and Computing Engineering, Rua São Francisco Xavier 524,Room 5028 D, Maracanã, Rio de Janeiro, RJ 20550-900, Brazil
c Embrapa, Soils Research Center, Rua Jardim Botânico 1024, Jardim Botânico, Rio de Janeiro,RJ 22460-000, Brazild University of Hannover, Institut für Informationsverarbeitung, 9a Appelstrasse,13th floor, Hannover 30167, Germany
e University of Hannover, Institute of Photogrammetry and GeoInformation, 1 Nienburger Street, Hannover D-30167, Germany
Received 8 April 2006; received in revised form 30 March 2007; accepted 3 April 2007Available online 1 June 2007
Abstract
This paper proposes a new method to model temporal knowledge and to combine it with spectral and spatial knowledge within anintegrated fuzzy automatic image classification framework for land-use land-cover map update applications. The classification modelexplores not only the object features, but also information about its class at a previous date. The method expresses temporal classdependencies by means of a transition diagram, assigning a possibility value to each class transition. A Genetic Algorithm (GA) carries outthe class transition possibilities estimation. Temporal and spectral/spatial classification results are combined bymeans of fuzzy aggregation.The improvement achieved by the use of multitemporal knowledge rather than a pure monotemporal approach was assessed in a realapplication usingLANDSATimages fromMidwestBrazil. The experiments showed that the use of temporal knowledgemarkedly improvedthe classification performance, in comparison to a conventional single-time classification. A further observation was that multitemporalknowledge may subsume the knowledge related to steady spatial attributes whose values do not significantly change over time.© 2007 International Society for Photogrammetry and Remote Sensing, Inc. (ISPRS). Published by Elsevier B.V. All rightsreserved.
Keywords: Remote sensing; Knowledge-base representation; Multitemporal interpretation; Fuzzy logic
0924-2716/$ - see front matter © 2007 International Society for PhotogramAll rights reserved.doi:10.1016/j.isprsjprs.2007.04.001
⁎ Corresponding author. Catholic University of Rio de Janeiro,Department of Electrical Engineering, Rua Marquês de São Vicente 225,Room401L,Gávea, Rio de Janeiro, RJ 22453-900, POBox38097, Brazil.
E-mail addresses: [email protected] (G.L.A. Mota),[email protected] (R.Q. Feitosa), [email protected](H.L.C. Coutinho), [email protected] (C.-E. Liedtke),[email protected] (S. Müller),[email protected] (K. Pakzad), [email protected](M.S.P. Meirelles).
1. Introduction
One of the most important applications of remotesensing technology is the regular update of land-coverland-use (LCLU) maps. In addition to the image beingclassified, a previous image of the same area and itsclassification are usually available in these applications.A photointerpreter often uses this prior information to
metry and Remote Sensing, Inc. (ISPRS). Published by Elsevier B.V.

187G.L.A. Mota et al. / ISPRS Journal of Photogrammetry & Remote Sensing 62 (2007) 186–200
aid in the visual interpretation process. Similarly, manyautomatic image interpretation approaches try to explorethe temporal correlation between images of the samegeographical area acquired at different dates.
Every image classifier incorporates some form ofknowledge representation. This work considers threeknowledge modalities: spectral, spatial and temporal.The spectral knowledge relies on the spectral appear-ance, which characterizes the object by itself opposed tocharacterizing its component parts or its relationshipswith other objects. This is the simplest and most widelyused form of knowledge. By lacking an explicit high-level knowledge representation, such classifiers areseldom labelled as knowledge-based.
The second category considered in this work is thespatial knowledge. It incorporates some higher levelknowledge representation, in addition to an object'soverall characteristics. This may include a description ofits parts, as well as its relationships with other objects.Input data for a spatial classifier can be derived fromdifferent sensors, GIS databases or the results of aspectral classifier. Spatial knowledge can be describedby different techniques such as predicate logic (Epstein,2000), frames (Minsky, 1974), production rules (Clém-ent et al., 2003) and semantic nets (Liedtke et al., 2001).
Generally, spatial knowledge is used in combinationwith spectral knowledge, usually referring to objectfeatures on the image being classified and not taking thehistory of the object into account. These two forms ofknowledge are termed non-temporal. A third knowledgemodality is temporal. It is related to the ability of aphotointerpreter to utilize an earlier data set of the samearea during the visual interpretation taking into accountthe dynamics of the objects and classes of the targetarea. The temporal knowledge usually is derived fromclassifiers combined with other knowledge forms tocreate a multitemporal classifier (Growe, 1999).
The multitemporal classification can be treated as amultisource classification problem (e.g. Lee et al., 1987)where the central issue is how to combine the temporaldata sets. Most solutions proposed thus far (see nextsection for references) rely on the simplifying assump-tion that transition probabilities are independent fromthe spectral/spatial information (e.g. Jeon and Land-grebe, 1999).
The present work proposes a new multitemporalimage interpretation framework for the LULC map up-date application. The method uses class transition dia-grams that express temporal class dependencies in afuzzy way. No intersource independence is assumed sothat the method has the potential to capture the cor-relation between spectral, spatial and temporal infor-
mation. Class transition possibilities can be estimatedby means of a Genetic Algorithm. This approach wasadopted due to its ability to find, based on examples,appropriate solutions for complex relations without theneed for an explicit model. After estimating the clas-sifier's parameters, the Genetic Algorithm is substitutedby a full deterministic procedure.
The main contributions of the present work are:
• A temporal knowledge modeling method contain-ing a novel procedure to estimate class transitionpossibilities,
• A method to integrate information from distinct timeinstants that is able to capture the temporal inter-source correlation, and
• An evaluation of the potential contribution of thetemporal knowledge in comparison to other knowl-edge forms, particularly with respect to steadyfeatures.
The present method uses fuzzy logic concepts andtechniques (Zadeh, 1978; Kuncheva, 2000; Mendel,1995) instead of a probabilistic approach. This choice ismainly due to their ability to represent vague and im-precise knowledge by means of fuzzy rules in such away that even those that are not familiar with the un-derlying theory are able to understand the generalmeaning of the knowledge being represented.
The present proposal is validated on a set ofLANDSAT-TM images from Midwest Brazil acquiredover three consecutive years during the dry season.Temporal relationships between classes were deter-mined with the help of an expert well acquainted withthe class dynamics of the test area. The experimentalresults indicated that the temporal knowledge maysubsume the spatial knowledge in order to simplify theusually troublesome process of knowledge acquisition.
The remaining parts of this paper are organized asfollows. Section 2 presents an overview of related workson multitemporal knowledge representation. Section 3describes the fuzzy classification framework with em-phasis on the proposed temporal knowledge represen-tation method. Section 4 describes the experiments anddiscusses their results. Section 5 presents some con-cluding remarks and a discussion of future researchdirections.
2. Related research
The literature discusses different approaches for themultitemporal interpretation of remote sensing data withchange detection being the most common. A recent

188 G.L.A. Mota et al. / ISPRS Journal of Photogrammetry & Remote Sensing 62 (2007) 186–200
survey that clearly summarizes the most relevant changedetection algorithms was presented by Lu et al. (2004).
Change detection plays an important role in landcover map updates. A time intensive task in this type ofapplication is the gathering of a sufficient number oftraining samples. Generally, the class labels in a prev-ious image are already available, but one still has toselect training samples from the new image to be clas-sified. These partially unsupervised techniques performthis task automatically (Bruzzone and Prieto, 2001).Such approaches use no “ground truth” informationfrom the specific image to be classified, but instead usea training set related to a previous image of the samegeographical area.
A partially unsupervised multitemporal classificationmethodology has been introduced by Bruzzone andPrieto (2001, 2002) that estimates the class conditionalprobability densities in the image by using a specificformulation of the Expectation-Maximization (EM) Al-gorithm (Dempster et al., 1977).
Another partially unsupervised proposal (Cazeset al., 2004) uses change detection as the initial step.Objects in the most recent image, set as “stable” by achange detection procedure, are selected as trainingsamples carrying the same labels they had in the prev-ious image.
Another group of techniques explores temporalrelations and approaches image interpretation as a datafusion problem. In the remote sensing arena, research ondata fusion was initially restricted to multisensor/mul-tisource image classifications. One early report proposesa contextual classifier that considers both spatial andtemporal interpixel class dependencies (Jeon and Land-grebe, 1992). This classifier uses Random Gibbs Fieldsto model class coherence among neighbouring pixels interms of prior probabilities, while the temporal aspect ismodelled by class transition probabilities.
A method for data fusion was developed that in-corporates the multisensor/multisource, as well as thetemporal aspects (Solberg et al., 1994; Jeon and Land-grebe, 1999). In this method, the a priori information onthe probabilities of class changes between imageacquisition epochs is incorporated into a single-timemodel. A methodology to estimate the class transitionprobabilities is a central issue in many proposals aboutmultitemporal classification. Most approaches as-sume class conditional independence in the time domain(Bruzzone et al., 1999; Bruzzone and Prieto, 2002).Other works present methods that do not assume in-dependence and try to capture intersource (spectral,spatial and temporal) correlations by means of neuralnetworks (Melgani et al., 2001, 2003).
A further group of related approaches comparesimages of different epochs at the semantic level withdifferent conditions for possible changes between ob-jects from one epoch to another being postulated. Theseare described by means of a class transition diagram;temporal part of the prior knowledge (Pakzad, 2002;Pakzad et al., 2003). The interpretation process takesadvantage of the knowledge on possible class changes.Some kind of estimation of class transition probabilitiescould add significant value to the method.
These diagrams can be used to identify possible classchanges and to restrict the number of classes beingconsidered for a given image segment (Bückner et al.,1999; Growe et al., 2000). Pakzad (2001) and Growe(2001) associated each class transition with a value thatexpresses the probability that it might occur within agiven time period. However, these probabilities merelyestablish the search order for a solution through a se-mantic network. In such approaches, transition pro-babilities do not take part in the computation of anydiscriminant function.
The present work proposes a fuzzy multitemporalclassification procedure that combines non-temporaland temporal knowledge. The non-temporal approachcan consider both its spectral and spatial aspects.Nonetheless, while spatial knowledge is mostly timeinvariant, spectral knowledge can vary significantlyover time due to many factors, such as differences inatmospheric conditions. This problem is avoided in thepresent proposal by using a partially unsupervised ap-proach as proposed by Cazes et al. (2004). Anothernovelty of the present methodology is the use of apossibilistic approach (Mota, 2004) instead of a pro-babilistic one. Moreover, by not assuming data sourceindependence, the method is able to exploit the cor-relation among spectral, spatial and temporal data. Thisis achieved by using a Genetic Algorithm to estimate theclass transition possibilities based on examples withoutassuming any pre-defined distribution of the data sets. Inaddition, it is worth mentioning that our method can beapplied to both pixel-wise and object-oriented classifi-cation (Blaschke and Strobl, 2001).
3. Multitemporal classification model
3.1. Problem formulation
Suppose a multitemporal data set comprising animage It acquired at time t. Let Ω={ω1, ω2, … , ωn} bethe set of distinguishable LULC classes at both t and t−Δt. Let xt (o) denote a p-dimensional vector in Rp,composed of spectral and spatial features (xt,i (o)) for

189G.L.A. Mota et al. / ISPRS Journal of Photogrammetry & Remote Sensing 62 (2007) 186–200
i=1,…,p) extracted from an object o in image It, andeventually from a GIS database. With wt−Δt (o) we de-note the crisp label vector of object o at a previous timet−Δt. Therefore, wt−Δt(o) is a vector in space W,defined as follows:
W ¼ fwa Rn : wi a½0; 1� 8 i ¼ 1; N n;Xni¼1
wi ¼ 1g
In other words, wt−Δt(o) is a n-dimensional unitaryvector of the form [0 … 1 … 0]T having “1” in its ithcomponent (wt−Δt,i (o)=1) and “0” (wt−Δt,j (o)=0, forj≠ i) otherwise, indicating that the object o belongs tothe class ωi at time t−Δt. Henceforth, we drop theexplicit indication to the object by writing its featurevector and its crisp label vector at a previous time as xtand wt−Δt., respectively.
The problem consists of identifying the crisp vectorlabel wt of each image object at time t based upon xt andwt−Δt. Thus, we are searching for a function M suchthat:
wt ¼ Mðxt;wt�DtÞ; ð1Þwhere M is a function of the form M: Rp+n→W.
3.2. General model description
Fig. 1 shows an overview of the solution proposed.The classification occurs in four main steps:
− Non-temporal classification− Temporal classification
Fig. 1. The multitemporal cl
− Decision fusion− Defuzzification.
Two types of classifiers cooperate during the re-cognition task. The first, called non-temporal, is basedexclusively on spectral/spatial object descriptions (xt) atthe image acquisition date (t). The second type of clas-sifier, temporal, classifies image objects based solely onthe previous object class (wt−Δt) at t−Δt. The non-temporal and the temporal classifiers are combinedto form a potentially more accurate classifier calledmultitemporal.
Following a fuzzy approach, the n classes in Ω aremodelled at each classifier by fuzzy sets whose mem-bership functions map points in the corresponding inputfeature space into the interval [0 1].
The non-temporal classifier produces a n-dimension-al fuzzy label vector denoted by α=[αl, α2, … , αn]
T
where αi stays for the membership of the image objectassigned by the non-temporal classifier to the class ωi,for i=1,2,…,n and for at least one i, αi≠0. It can bedescribed by a function of the form A: Rp→F, suchthat:
α ¼ ½αl; α2; N ; αn� ¼ AðxtÞ; ð2Þwhere the space F is given by:
F ¼ fαa Rn : αi a½0; 1�8 i ¼ 1; N n;
and αi N 0 for at least one ig :
In the temporal classifier, classes are analogouslyrepresented by fuzzy sets. The temporal classifier is
assification procedure.

190 G.L.A. Mota et al. / ISPRS Journal of Photogrammetry & Remote Sensing 62 (2007) 186–200
given by a function T of the form T: W→F. The valueτ=T(wt−Δt) is a fuzzy label vector τ=[τl, τ2, … , τn]
T
where τj is the membership of the image object assignedby the temporal classifier to the class ωj.
The two fuzzy classification outcomes α and τare then combined in the next step labelled in Fig. 1as fusion. As a result, a multitemporal fuzzy labelvector
μ ¼ ½μ1;μ2; N ;μn�T ¼ Hðα; τÞ ð3Þis produced by a function of the formH: [0 1]n×[0 1]n→[0 1]n.
The final step of the classification method depicted inFig. 1 is the defuzzification that transforms a fuzzyvector label into a crisp one. The defuzzification func-tion of the form D: F→W assigns the image objectbeing classified to the class ωj that has the highestmembership values. So D is given by the formula:
wt ¼ ðwt;1; N ;wt;nÞT
¼ DðμÞ;where wt;i ¼ 1; for μi ¼ maxjfμjg
wt;i ¼ 0; otherwise
:�
ð4Þ
Replacing Eqs. (2) and (3) in Eq. (1) results in themultitemporal classifier M proposed in this paper ex-pressed as:
wt ¼ Mðxt;wt�DtÞ ¼ D½H½AðxtÞ;Tðwt�DtÞ��: ð5ÞIndeed, many well known classification methods fit
in the description of the non-temporal classifier A pre-sented above and can be used in this scheme. Similarly,the defuzzification methodD portrayed thus far has beenused in many pattern recognition applications. Thedesign of the temporal classifier T and the fusion func-tion H are described in detail in the next sections.
3.3. Design of the temporal classifier
The temporal knowledge is represented by thepossibilities Pij that an image object belonging to aclass ωi at a previous time t−Δt changes to the classωj at a later time t for a given Δt and i,j=1, 2, …, n.This can be represented pictorially by a class transitiondiagram.
The class transition diagram is a graph whose nodescorrespond to the classes and links of the plausible classtransitions between t−Δt and t. Each link is labelledwith a value Pij (0≤Pij≤1) that expresses the pos-sibility that an object of class ωi changes to class ωj
within Δt. For simplicity, links with Pij=0 are notdrawn.
The temporal knowledge can be modelled equiva-lently by n discrete fuzzy sets. As proposed by Mendel(1995), discrete fuzzy sets are represented by a sequenceof pairs composed of a fuzzy membership value, a slash,and the discrete value of the linguistic variable, which inthis case is the previous classification at time t. Thedistinct pairs are separated by the symbol + that in thisnotation is a mere separator. Hence, temporal knowl-edge may be represented by a set of n expressions as inthe example below:
Pj ¼ P1j=x1 þ P2 j=x2 þ N þ Pnj=xn;
for j ¼ 1; 2 N n:
An even more compact representation can be for-mulated by writing each set as a distinct column ofa n×n matrix P={Pij} called a Transition PossibilityMatrix (TPM).
The temporal classifier can be derived from the TPMin the following way. Given the class ωi of an imageobject at time t−Δt, the temporal classifier produces amembership vector:
τ ¼ Tðwt�DtÞ ¼ ½τ1; τ2; N ; τn�T¼ ½Pi1;Pi2; N ;Pin�Twhere wt�Dt;i ¼ 1 ð6Þ
that is the i-th row of the transition matrix P.
3.3.1. Fusion of non-temporal and temporal fuzzy labelsThe temporal fuzzy label α is combined with the
result τ of the non-temporal classifier into a singlemeaningful fuzzy label vector μ that expresses theoverall membership of a given image object to each ofthe n classes. In this study, the outcome μi of the fusionstep relative to class ωi is a function h of αi and τi, of theform:
h : ½0 1�2Y½0 1�:
This function is called aggregation function or ag-gregation operation by the fuzzy set theory literature.According to Klir and Yuan (1995), an aggregationfunction must satisfy the following axioms:
Axiom 1. h(0,0)=0 and h(1,1)=1 (boundary conditions)
Axiom 2. For any pair (a1, a2) and (b1, b2) such that ai,bi,∈ [0 1] if ai≤bi, for i=1,2, then:
hða1; a2Þ V hðb1; b2Þ;that is, h is monotonic, increasing in all its arguments.
Axiom 3. h is a continuous function.

191G.L.A. Mota et al. / ISPRS Journal of Photogrammetry & Remote Sensing 62 (2007) 186–200
Aggregation functions are usually expected to meettwo additional conditions, namely:
Axiom 4. h is symmetric in its arguments; that is:
hða1; a2Þ ¼ hða2; a1Þ:
Axiom 5. h is idempotent,1 that is:
hða; aÞ ¼ a
for all a∈ [0 1].
A family of functions that meet all five axioms is thegeneralized means, which is defined by the formula:
hgða1; a2Þ ¼ ag1 þ ag22
� �1=g
ð7Þ
where γ∈R, (γ≠0) and ai≠0 for i=1,2 when γb0.It can be demonstrated (Klir and Yuan, 1995) that the
functions max, arithmetic mean, geometric mean2, har-monic mean and min are special cases of the generalizedmean, for γ→+∞, γ=1, γ→0, γ=−1 and γ→−∞,respectively.
Other functions, apart from the generalized means,could be used for aggregation with different levels ofperformance. An extensive discussion of this topic goesbeyond the scope of the present work. We limit our-selves to consider the geometric mean as an aggregationfunction. In this case, the final multitemporal fuzzyclassification will be given by:
μ ¼ Hðα; τÞ ¼ ½μ1;μ2 N ;μn�T¼ ½ðα1τ1Þ1=2; ðα1τ2Þ1=2; N ; ðαnτnÞ1=2�T :
ð8ÞThis choice is inspired by an analogy with the max-
imum probability classifier where the prior probabilityscales the probability density to build the discriminantfunction (see e.g. Shackelford and Davis, 2003).However, the product cannot be qualified as an ag-gregation function since it returns a value inferior (orequal) to both its arguments. Therefore, the use ofthe product as an aggregation function would have asa counterintuitive consequence that the more knowledgewe combine, the lower the membership values become.The geometric mean circumvents this inconvenience bycomputing the square root of the product. The exper-imental analysis reported in Section 4.4 provides further
1 Notice that Axiom 5 is implied in Axiom 1.2 To compute this limit, just take the natural logarithm of the
generalized mean, apply l'Hôpital rule and calculate the exponentialof the result.
empirical elements favoring the choice of the geometricmean as an aggregation function. An investigation ofaggregation functions other than the geometric functionis the subject of future research.
3.3.2. Estimating the model parametersClass transitions can be treated by two ways. The
first, called a crisp transition, considers the possibilitiesas either “1” or “0”, depending whether the transition ispossible or not. Such information can be easily deliveredby a photointerpreter with some experience in the testarea without any need for training data.
A more powerful alternative, called a soft transition,considers the transition possibilities as real numbers inthe interval [0 1]. A key issue in this proposal is theestimation of the soft transition possibilities Pij. Thiscan be done in three sequential steps:
1) Trainingset selectionThe necessary training data to estimate soft transitionpossibilities becomes apparent in Fig. 1. One needs arepresentative set of samples for which the features xtat a time t, and their crisp label wt and wt−Δt at time tand t−Δt are known in advance. For an accurateestimation, all possible class transitions must berepresented in the selected samples. Such trainingobjects may be chosen manually by a pho-tointerpreter according to a conventional supervisedapproach. For LULC update applications, this can bedone automatically by applying a partially unsuper-vised training set selection as mentioned in Section 2.
2) Training of the non-temporal classifierThe non-temporal classifier parameters are adjustedby using the training samples selected in the previ-ous step according to the particular classifier designelected for this task.
3) Estimation of the Transition Possibility MatrixOnce the design of the non-temporal classifiers hasbeen completed, the Transition Possibility MatrixTPM is estimated. By using the same training setselected in Step 1, one searches for the values Pij thatmaximize the performance measure computed on theknown crisp classification of the training objects. Thephotointerpreter can indicate the impossible transi-tions (whose possibilities are set to zero) and, foreach source class, the outgoing transition with thehighest possibility. This a priori knowledge mayconsiderably accelerate the search for optimum andplausible possibility values. In addition, dependingon the selected aggregation function, the number ofparameters to estimate can be reduced further. Let'sconsider again the geometric mean. Recall that, for

192 G.L.A. Mota et al. / ISPRS Journal of Photogrammetry & Remote Sensing 62 (2007) 186–200
the defuzzification function D, only the ordering ofthe final memberships μi matters. This does notchange if the vector τ in Eq. (3) is scaled by anypositive real number. Therefore, each row of thematrix P can be estimated only up to a scale factor.We can eliminate this ambiguity without affecting thefinal crisp result by setting the highest transitionpossibility at each row of the matrix P to “1”. Thisreduces the number of transition possibilities to es-timate by n, the number of classes.
Training of the non-temporal classifier (Step 2)requires samples to represent each of the n classes at agiven time t. However, training of the temporal clas-sifier (Step 3) requires samples representing all possibleclass transitions whose number can be as large as n2.Collecting samples for all possible transitions maytherefore be a troublesome task for the photointerpreter.We can overcome this hindrance by estimating theTPM upon data sets (xt′, wt′ and wt′−Δt) relative to apair of preceding dates t′ and t′−Δt (t′b t) also sep-arated by Δt. In LULC map update applications, suchdata sets of previous epochs are usually available. It isimportant to use images taken at the same time of theyear to avoid seasonal effects. Steps 1–3 are performedon the earlier data sets to estimate the matrix P. Noticethat in this case all objects in the entire image may beselected for training. The estimate of P is then stored tobe used for the classification of the image It. We are inthis way implicitly assuming that the transition pos-sibilities in images from the same season in the samegeographical area do not significantly change overtime. Certainly the closer t′ is to t the more plausiblethis assumption is.
The temporal model described so far is not bound toany particular optimization method. The most appropri-ate technique will depend on the objective function to beoptimized. In many image analysis problems, the ob-jective function that truly expresses the goodness of thesolution does not meet the properties required by mostconventional calculus-based optimization methods.Gradient descent methods, for instance, require thatthe objective function is differentiable. In this study, weuse a Genetic Algorithm for this task (Schmiedle et al.,2002). It does not impose any assumption concerningthe class probability distribution and can be applied toany performance metric used as an objective function.
It is important to emphasize that the proposed methodproduces transition possibility estimates that are specificto a particular target site, as well as to a particularclassifier design. Possibility values estimated upon onearea, and for a particular classifier, may not be appli-
cable to other geographical areas or to a distinct non-temporal classifier design.
It is worth mentioning that the ability of our methodto capture intersource correlation is a result of the op-timization procedure described above. The Genetic Al-gorithm (GA) enables one to search for possibilityvalues that optimize the performance of the entireclassifier comprising both the temporal and non-temporal data sets. It is important to stress why not touse a more intuitive maximum likelihood based tech-nique to estimate transition possibilities based on theavailable ground truth at both dates (wt′ and wt′−Δt). Inthis case, the possibility values would be adjusted tomaximize the performance of the temporal classifieralone. The disadvantage of this method is that itdisregards the temporal classifier and consequently failsto capture the temporal correlation between both datasets.
4. Experiments
A software prototype was written in order to validatethe proposed method in a real application. This sectiondescribes how the experimental evaluation was designedand its results.
4.1. Description of the data set
4.1.1. Test areaOur test area is situated in the County of Alcinópolis
in the State of Mato Grosso do Sul, Brazil. It is coveredby a single LANDSAT 7 scene (224-073). Two subsetswere used covering around 950 km2. The segmentspicked up from both subsets were treated in our ex-periments as if they belonged to a single contiguousarea.
The streams in Alcinópolis are located in the TaquariRiver sub-basin, part of the Upper Paraguai River basin,and the headwaters of the Pantanal wetlands, one of themost important ecosystems in South America. Much ofAlcinópolis County is used to raise cattle for the meatindustry. Given the region's soil, topography, geology,and climate, the excessive numbers of cattle placed onpasturelands makes it highly vulnerable to erosion pro-cesses. Therefore, environmental recovery efforts andthe monitoring of land cover changes in theses areas areurgently needed.
4.1.2. Image pre-processing and segmentationBands 5, 4 and 3 of three LANDSAT-7 images
were used in the experiments. The images were ac-quired during the dry seasons of 1999 (August 5), 2000

Fig. 2. The watershed based segmentation procedure.
193G.L.A. Mota et al. / ISPRS Journal of Photogrammetry & Remote Sensing 62 (2007) 186–200
(August 7), and 2001 (August 10), being co-registeredusing a GIS database as reference data.
The registered images were segmented producingspectrally homogeneous objects through the followingsequential steps (see Fig. 2):
a) The three bands of all three images were stackedforming an artificial nine-band image. A spatialGaussian lowpass filter with a given standard devi-ation σ was applied to each band in order to eli-minate noise effects and small details.
b) After lowpass filtering, the gradient of each band wascomputed by using the Sobel operator.
c) The maximum value of the gradient magnitudeacross all bands was then computed resulting in atwo-dimensional matrix. This guarantees that a sig-nificant discontinuity on any band will suffice tobring about a segment border on all images.
d) All local minima in the gradient matrix whose depthis lower than a given value δ were suppressed by
Table 1Land-use classes
Label Class Description
Bare soil (ω1) Bare soil A soil that has been degradedthat is being prepared for culti
Riparian (ω2) Riparian forest Dense woodland alongside rivPasture (ω3) Pasture Cultivated pasture for cattle nuWater (ω4) Water bodies Water or swamplandSavannah (ω5) Dense savannah Formation of low trees (8–12 m
significant contact between theis not complete allowing develcontaining grasses, dwarf palmBrazillian cerrado (Coutinho, 1
Regeneration (ω6) Dense savannahin regeneration
An area used previously for paand is regenerating its native v
applying the h-minima transformation (Soille, 2003).This is intended to avoid oversegmentation.
e) Finally, the Watershed Algorithm (Vincent andSoille, 1991) was applied to the result of the previousstep.
The values of the segmentation parameters σ and δwere selected empirically by a photointerpreter.
4.1.3. Validation dataTable 1 describes the land-use classes considered
in our experiments. To assess the performance of ourmethod a reference classification for all three years wascreated visually by a photointerpreter with expertise inland cover classification. This was achieved using asancillary data a videography taken in October 2001, theLANDSAT images, a drainage map, and a digital ele-vation model. Only segments covered by the flight linesof the videography were considered in this analysis.Segments set as “unclassified” by the photointerpreter in
Number of segments
1999 2000 2001
by erosion orvation.
96 84 61
ers and streams. 62 62 57trition. 496 510 538
28 28 28) densely packed, but without
ir crowns so that the shading effectopment of an understory vegetationtrees and ground woody plants -978).
134 132 132
sture that was left aside by the farmeregetation.
6 6 6

Table 2aNumber of possible class transitions that occurred in 1999–2000
2000
1999 Bare soil Riparian Pasture Water Savannah Regeneration Total
Bare soil 71 25 96Riparian 0 62 0 62Pasture 11 485 496Water 28 28Savannah 2 0 132 134Regeneration 0 0 0 6 6total 84 62 510 28 132 6 822
194 G.L.A. Mota et al. / ISPRS Journal of Photogrammetry & Remote Sensing 62 (2007) 186–200
any of the three years were also discarded from theexperiments. Table 1 also shows the number of seg-ments used in the experiments for each class.
Tables 2a,b show the class transitions observed intwo consecutive years. The blank table positions cor-respond to class transitions considered to be impossibleby the photointerpreter.
4.2. Non-temporal classification
One objective of this work is to assess the con-tribution of the multitemporal knowledge to the clas-sification performance in comparison to other forms ofknowledge. For this assessment, two non-temporalclassifiers were implemented according to the approachdescribed in Section 3 using a pure spectral classifierand a spectral/spatial classifier. In both cases, the train-ing samples were selected from the image taken in 2001using a partially unsupervised method as proposed inCazes et al. (2004) and based on the image taken in 2000and its classification.
4.2.1. Spectral classificationFeature vectors x were built for each segment by
stacking the mean spectral values of each availableband. It was assumed that all classes ωi can be appro-priately modelled by a normal distribution N( x̄,Σωi).
Table 2bNumber of possible class transitions that occurred in 2000–2001
2001
2000 Bare soil Riparian Pasture
Bare soil 49 35Riparian 5 57 0Pasture 7 503WaterSavannah 0 0Regeneration 0 0total 61 57 538
So, a Gaussian-shaped membership function SMFωi (x)was selected for all classes ωi, given by the formulabelow.
SMFxiðxÞ ¼ exp �ðx� x̄xiÞTP�1
xi ðx� x̄xiÞ2
" #: ð9Þ
For ωi∈{baresoil, riparian, pasture, water, savannah,regeneration}; x̄ωi, and Σωi correspond respectively tothe mean and to the covariance matrix of the class ωi.Estimates for these parameters were computed by stan-dard procedures based on the training samples selectedaccording to the automatic method proposed in Cazeset al. (2004). Replacing Eq. (9) into Eq. (2), the non-temporal classifier will be given by:
α ¼ AðxÞ ¼
SMFbaresoilðxÞSMFriparianðxÞSMFpastureðxÞSMFwaterðxÞ
SMFsavannahðxÞSMFregenerationðxÞ
26666664
37777775: ð10Þ
In order to compare the performance of a simplespectral approach with the proposed multitemporalmethod, the membership vector α produced by thespectral classifier shown in the equation above was
Water Savannah Regeneration Total
8462510
28 28132 1320 6 6
28 132 6 822
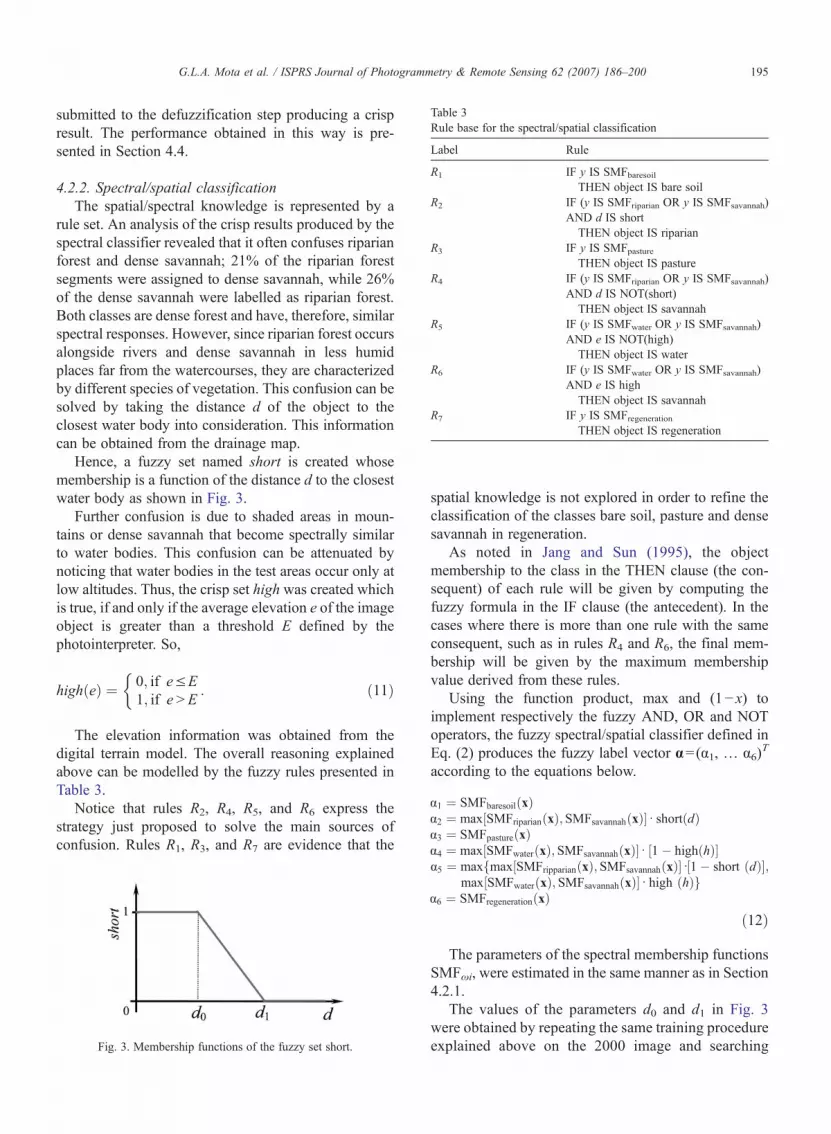
Table 3Rule base for the spectral/spatial classification
Label Rule
R1 IF y IS SMFbaresoilTHEN object IS bare soil
R2 IF (y IS SMFriparian OR y IS SMFsavannah)AND d IS short
THEN object IS riparianR3 IF y IS SMFpasture
THEN object IS pastureR4 IF (y IS SMFriparian OR y IS SMFsavannah)
AND d IS NOT(short)THEN object IS savannah
R5 IF (y IS SMFwater OR y IS SMFsavannah)AND e IS NOT(high)
THEN object IS waterR6 IF (y IS SMFwater OR y IS SMFsavannah)
AND e IS highTHEN object IS savannah
R7 IF y IS SMFregenerationTHEN object IS regeneration
195G.L.A. Mota et al. / ISPRS Journal of Photogrammetry & Remote Sensing 62 (2007) 186–200
submitted to the defuzzification step producing a crispresult. The performance obtained in this way is pre-sented in Section 4.4.
4.2.2. Spectral/spatial classificationThe spatial/spectral knowledge is represented by a
rule set. An analysis of the crisp results produced by thespectral classifier revealed that it often confuses riparianforest and dense savannah; 21% of the riparian forestsegments were assigned to dense savannah, while 26%of the dense savannah were labelled as riparian forest.Both classes are dense forest and have, therefore, similarspectral responses. However, since riparian forest occursalongside rivers and dense savannah in less humidplaces far from the watercourses, they are characterizedby different species of vegetation. This confusion can besolved by taking the distance d of the object to theclosest water body into consideration. This informationcan be obtained from the drainage map.
Hence, a fuzzy set named short is created whosemembership is a function of the distance d to the closestwater body as shown in Fig. 3.
Further confusion is due to shaded areas in moun-tains or dense savannah that become spectrally similarto water bodies. This confusion can be attenuated bynoticing that water bodies in the test areas occur only atlow altitudes. Thus, the crisp set high was created whichis true, if and only if the average elevation e of the imageobject is greater than a threshold E defined by thephotointerpreter. So,
highðeÞ ¼ 0; if e V E1; if e N E
:
�ð11Þ
The elevation information was obtained from thedigital terrain model. The overall reasoning explainedabove can be modelled by the fuzzy rules presented inTable 3.
Notice that rules R2, R4, R5, and R6 express thestrategy just proposed to solve the main sources ofconfusion. Rules R1, R3, and R7 are evidence that the
Fig. 3. Membership functions of the fuzzy set short.
spatial knowledge is not explored in order to refine theclassification of the classes bare soil, pasture and densesavannah in regeneration.
As noted in Jang and Sun (1995), the objectmembership to the class in the THEN clause (the con-sequent) of each rule will be given by computing thefuzzy formula in the IF clause (the antecedent). In thecases where there is more than one rule with the sameconsequent, such as in rules R4 and R6, the final mem-bership will be given by the maximum membershipvalue derived from these rules.
Using the function product, max and (1−x) toimplement respectively the fuzzy AND, OR and NOToperators, the fuzzy spectral/spatial classifier defined inEq. (2) produces the fuzzy label vector α=(α1, … α6)
T
according to the equations below.
α1 ¼ SMFbaresoilðxÞα2 ¼ max½SMFriparianðxÞ; SMFsavannahðxÞ�d shortðdÞα3 ¼ SMFpastureðxÞα4 ¼ max½SMFwaterðxÞ; SMFsavannahðxÞ�d ½1� highðhÞ�α5 ¼ maxfmax½SMFripparianðxÞ; SMFsavannahðxÞ�d½1� short ðdÞ�;
max½SMFwaterðxÞ; SMFsavannahðxÞ�d high ðhÞgα6 ¼ SMFregenerationðxÞ
ð12Þ
The parameters of the spectral membership functionsSMFωi, were estimated in the same manner as in Section4.2.1.
The values of the parameters d0 and d1 in Fig. 3were obtained by repeating the same training procedureexplained above on the 2000 image and searching

Table 4Possible class transitions for Δt=1 year
Class at t−Δt Class at t Process
Savannah Pasture Deforestation for introduction ofa new pasture.
Bare soil Land preparationRegeneration Pasture Deforestation for introduction of
a new pasture.Bare soil Land preparationSavannah Favorable environmental conditions
allowing the rehabilitation of theoriginal vegetal cover.
Riparian Pasture Deforestation for introduction ofa new pasture.
Bare soil Land preparation for planting anew pasture.
Pasture Bare soil Land preparation for planting orenewal of pastures orthe offset of soil degradationprocess (erosion)
Bare soil Pasture New pasture or renewal ofdegraded pasture
Fig. 4. Class transition diagram for the test area.
196 G.L.A. Mota et al. / ISPRS Journal of Photogrammetry & Remote Sensing 62 (2007) 186–200
for the values that maximize the mean class recognitionrate F for the image objects of 2000 as given in Eq.(13),
F ¼ 1n
Xni¼1
ncini
ð13Þ
where nci is the number of training objects of class ωi
correctly assigned by the spectral/spatial classifier, ni isthe total number of training objects of class ωi, andn is, as before, the number of classes in the application.A Genetic Algorithm was used to compute the valuesfor d0 and d1. The algorithm was executed througha number of generations until it was observed thatthere was no improvement in the class recognitionrate F. This was reached for d0=1 pixel and d1=21pixels.
As in the preceding section, the fuzzy classificationα given in Eq. (12) was defuzzified in order to comparethe performance of the spectral/spatial classifier with themultitemporal approach proposed in this paper. Theresults are presented in Section 4.4.
4.3. Multitemporal classification
The multitemporal model was built from interviewswith an agronomic engineer well acquainted with theclass dynamics in the test area. The possible class tran-sitions withinΔt=one year, as well as the processes thatcause such transitions are described in Table 4.
Fig. 4 presents the corresponding class transitiondiagram. The objects tend to continue in the same classas expressed in the diagram by the possibilities beingequal to “1”. Disregarding the impossible transitions, atotal of nine possible transitions still had to be estimated.The geometric mean (see Eq. (3)) was used as the ag-gregation function.
The temporal classifier was implemented in crisp andsoft versions. In both cases, this was done in com-bination with pure spectral and spectral/spatial classi-fiers. Thus, four different multitemporal classifiers wereinvestigated. To evaluate the performance of a crispclass transition diagram, as introduced in Section 3.3.2,an experiment was performed setting all unknown pos-sibility values in Fig. 4 to “1” (see experimental resultsin Columns 4 and 5 of Table 5).
To assess the soft class transition approach, addi-tional training data were required to estimate the tran-sition possibilities. We followed the scheme described inSection 3.3.2 using all image segments for 2000 andtheir reference classifications in 2000 and in 1999 fortraining. Accordingly, the non-temporal membershipdegrees relative to 2000 were computed as described inSections 4.2.1 and 4.2.2. Next, the transition possibil-ities were adjusted to maximize the agreement betweenthe classification produced by the classifier and thereference classification in the 2000 image. The possi-bility values were estimated by a Genetic Algorithm(GA) using the average class recognition rate given inEq. (13) as an objective function.
The GAwas configured in the following way. Everygene of the chromosome is represented by a double

Table 5Experimental average class recognition rate (%) in the 2001 image for different classification approaches
Class Non-temporal Classification Multitemporal Classification
Crisp transitions Soft transitions
Spectral Spectral/spatial Spectral+ temporal Spectral/spatial+ temporal
Spectral+ temporal Spectral/spatial+ temporal
Bare soil 28 28 30 30 89 89Riparian forest 75 93 98 98 100 100Pasture 75 75 77 77 93 93Water bodies 100 100 100 100 100 100Dense savannah 50 64 93 93 100 100Dense savannah
in regeneration67 83 67 83 100 100
Mean 66 74 77 80 97 97
197G.L.A. Mota et al. / ISPRS Journal of Photogrammetry & Remote Sensing 62 (2007) 186–200
precision real number, one value for each parameterbeing estimated. A population of 100 individuals isassumed. For the next generation, the 50 worse chro-mosomes will be substituted by reproduction. Repro-duction considers the genetic material of one or twoindividuals selected by a “roulette wheel”. The selectionis bounded by the individuals' fitness measurements,normalized between 1 and 100. The need for one or twoparents depends on the requirements of the selectedoperator. If crossover, the selection of two parents willbe demanded, while if mutation, only one parent will berequired. In a linear fashion, during the course of evo-lution, the probability of selecting a mutation operatorincreases, while the probabilities associated to crossoveroperators decrease. In the first generation, the probabil-ities are: 0.3 for a simple crossover, 0.3 for an arithmeticcrossover, 0.2 for a simple mutation, 0.1 for a smallcreep mutation and 0.1 for a big creep mutation. In thelast generation, these values were respectively 0.1, 0.1,0.3, 0.2, and 0.3. This favors the diversification of thesearch foci in the early generations, while at the end ofthe evolution the exploitation of the space around themore potential solutions.
Once the transition possibilities have been identified,the final evaluation was performed on the objects fromthe 2001 image. In this testing step, the same non-temporal classifier, designed in the experiments describedin Section 4.2 for the 2001 image were employed. Theresult of the temporal classifier was aggregated to thenon-temporal outcome according to Eq. (3) producing theoverall fuzzy classification, which was subsequentlydefuzzified (see Fig. 1). The performance of the testingstep was measured again by computing the average classrecognition rate defined in Eq. (13). This evaluation wasconducted starting with both of the non-temporalclassifiers presented in Sections 4.2.1 and 4.2.2.
4.4. Results and discussion
The results obtained are summarized in Table 5. Itshows the mean class recognition rate achieved in thetesting step for the 2001 image. All image objects listedin Table 2b were used in the test.
By comparing the second and third columns relativeto the two non-temporal classifiers one can observe theimprovements achieved by introducing the spatialknowledge. Typically, the performance increased from66% to 74%. The performance of the classes densesavannah, dense savannah in regeneration and, special-ly, riparian forest were the most affected. In fact, notmuch spatial knowledge can be explored at mediumresolution images. A comparatively higher improve-ment is expected by using spatial knowledge at higherresolutions.
The last four columns of Table 5 refer to the fourmultitemporal classifiers analyzed in our experiments.Columns labelled as “crisp transitions” show the per-formance of multitemporal classifiers built by aggre-gating the crisp temporal knowledge to both non-temporal classifiers. The temporal knowledge enhancedthe performance for all classes, in particular for densesavannah.
It is important to observe that there is little changebetween these two columns. The improvement achievedfor dense savannah in regeneration (from 67% to 83%) isactually not so significant because it corresponds to asingle additional segment that was correctly classifiedwith the temporal knowledge. Therefore, one could haverenounced the spatial reasoning and kept the temporalknowledge without incurring a significant loss in per-formance. As a matter of fact, the rule base built inTable 3 considers only long-lasting spatial attributeswhose values do not change in the time interval

198 G.L.A. Mota et al. / ISPRS Journal of Photogrammetry & Remote Sensing 62 (2007) 186–200
considered (Δt=1 year). In the case of rules R2 and R4,for instance, the fact that an object was assigned in thepast to the class riparian forest or dense savannah impliesthat the object stays at short and not short distances fromriver, respectively. Therefore, as far as the separation ofthese classes is concerned, the temporal and the spatialknowledge were mostly equivalent. A similar reasoningcan be formulated for the rules R5 and R6. This showsthat the crisp multitemporal knowledge can at leastpartially embody the spatial knowledge within it in thatrefers to the permanent attributes.
It is also noteworthy to analyze the last two columnsof Table 5 that present the results associated with the softmultitemporal knowledge. The mean class recognitionrate increased from 77% to 80% in the crisp multi-temporal knowledge and to around 97% in the softapproach. These remarkable improvements in perfor-mance could be credited to the scarce use of spatialknowledge in our experiments. Columns 6 and 7 againshow that there is no significant contribution from thespatial knowledge when the multitemporal knowledge isalready being used.
After having emphasized the contribution of themultitemporal approach, some comments concerningthe estimation of transition possibilities through GeneticAlgorithms must be introduced.
Genetic algorithms (GA) do not guarantee that theglobal optimum of the objective function will be found.Indeed, GAmay encounter some consistent solution thatis only locally optimal. The results shown in Table 6correspond to the best value observed through 20 runs ofthe GA, each time with a randomly selected start sol-ution. The worst, the mean, and the best class recog-nition rates found by the GA throughout the 20experiments are presented in Table 6. By comparingthis figure with the number of objects for each class inTable 2, it becomes clear that the largest discrepancybetween the worst and the best performance is 5% forthe class bare soil, which corresponds to about ±2 ob-
Table 6The worst, mean and best class recognition rate (%) obtained through20 runs of the Genetic Algorithm
Class Worst case Average Best case
Bare soil 84 84 89Riparian forest 98 99 100Pasture 94 94 94Water bodies 100 100 100Dense savannah 100 100 100Dense savannah in regeneration 100 100 100Mean class recognition rate 96 96 97Global recognition rate 95 95 95
jects. This indicates that the GA was quite stable in ourexperiments.
Table 2a shows that six possible class transitions donot occur in the training set comprising objects from1999 and 2000. The corresponding transition possibil-ities were therefore underestimated by the GA. Lookingat Table 2b, we see that five of these six transitions alsodo not occur between 2000 and 2001 and consequentlydid not affect the performance measured in our exper-iments. The exception is the transition riparian→bar-esoil that does not occur in 1999–2000, but occurs fivetimes in 2000–2001. In this case, the transition pos-sibility was estimated as being near zero. As a con-sequence, the five objects in the class riparian in 2000that changed to the class baresoil in 2001, according tothe reference classification, were maintained in the classriparian by our multitemporal classifier. This has cer-tainly contributed to the comparatively poor perfor-mance obtained for the class baresoil in 2001.
This observation stresses the need of having trainingexamples for all class transitions we want to detect in theimage. Indeed, the soft multitemporal approach pro-posed in this work demands a comparatively largetraining set in order to perform well. When such trainingdata is not available, the crisp multitemporal model is,according to our experimental results, worth trying.
5. Conclusions and future research
The present paper proposes a novel method to re-present temporal knowledge and to combine it withother knowledge forms within an integrated automaticimage interpretation framework for LULC map updateapplications. The method expresses temporal classdependencies by means of a transition diagram thatassigns to each class transition a possibility value.
The improvement brought by the temporal knowl-edge in relation to a pure non-temporal approach wasassessed in a real application using medium-resolutionLANDSAT images from Midwest Brazil. The multi-temporal model parameters were estimated by a GeneticAlgorithm based on a pair of images from 1999 and2000 and tested on a 2001 image of the same area.
The experiments showed that the use of prior knowl-edge markedly improved the classification performancein comparison to a conventional spectral classification. Afurther observation was that the temporal knowledge forthe most part subsumed the spatial knowledge. This isexplained by the fact that the spatial knowledge modelbuilt in the experiments was based on steady spatialattributes whose values do not significantly change overtime.

199G.L.A. Mota et al. / ISPRS Journal of Photogrammetry & Remote Sensing 62 (2007) 186–200
The ability of the proposed multitemporal knowledgerepresentation to capture long lasting spatial relationshipsmay considerably simplify the usually troublesome taskof spatial knowledge acquisition. In contrast, the classtransition diagrams used in our experiments were set upas a result of a single interview with a photointerpreter.
Spatial knowledge can play a more important rolewhen high resolution images are the objects of analysis.Assessing the relative contribution of multitemporalknowledge for high resolution image analysis is cer-tainly a promising topic for future research.
The experiments reported in this paper successfullyapplied a Genetic Algorithm to estimate class transitionpossibilities. This technique has the advantage of ac-cepting virtually any objective function, as well as anysolution constraint. It has the disadvantage of beingcomputationally intensive. Despite the ever increasingavailability of processing power, an investigation to-wards a computationally more efficient optimizationtechnique would be also welcome.
Acknowledgements
The authors acknowledge the World Bank for financ-ing part of the data acquisition in the Taquari River basin(AGTEC/PRODETAB 039/01-99), Conservation In-ternational and Oreades for training and execution ofvideography based georeferenced data acquisition, themunicipality of Alcinópolis for logistical support duringfieldwork, and CAPES and DAAD, for the supportwithin the PROBRAL program.
References
Blaschke, T., Strobl, J., 2001. What's wrong with pixels? Some recentdevelopments interfacing remote sensing and GIS. GIS —Zeitschrift für Geoinformationssysteme 14 (6), 12–17.
Bruzzone, L., Prieto, D.F., 2001. Unsupervised retraining of amaximum-likelihood classifier for the analysis of multitemporalremote-sensing images. IEEE Transactions on Geoscience andRemote Sensing 39 (2), 456–460.
Bruzzone, L., Prieto, D.F., 2002. A partially unsupervised approach tothe automatic classification of multitemporal remote-sensingimages. Pattern Recognition Letters 23 (9), 1063–1071.
Bruzzone, L., Prieto, D.F., Serpico, S.B., 1999. A neural-statisticalapproach to multitemporal and multisource remote-sensing imageclassification. IEEE Transactions on Geoscience and RemoteSensing 37 (3), 1350–1359.
Bückner, J., Jung, S., Pakzad, K., 1999. Image interpretationand GIS analysis as an approach for moor monitoring. Proceed-ings International Conference on Dynamic and Multi-Dimen-sional GIS (DMGIS 99), Peking, China, 4–6 October 1999,pp. 341–349.
Cazes, T.B., Feitosa, R.Q., Mota, G.L.A., 2004. Automatic selection oftraining samples for multitemporal image classification. Proceed-
ings International Conference on Image Analysis and Recognition(ICIAR 2004) - Part II, Porto, Portugal, 29 September–1 October2004, pp. 389–398.
Clément, V., Giraudon, G., Houzelle, S., Sandakly, F., 2003.Interpretation of remotely sensed images in a context of multi-sensor fusion using a multispecialist architecture. IEEE Transac-tions on Geoscience and Remote Sensing 31 (4), 779–791.
Coutinho, L.M., 1978. O conceito de Cerrado. Revista Brasileira deBotânica 1 (1), 17–23.
Dempster, A.P., Laird, N.M., Rubin, D.B., 1977. Maximum likelihoodfrom incomplete data via the EM algorithm. Journal of the RoyalStatistical Society 39 (1), 1–38.
Epstein, R.L., 2000. Predicate Logic: The Semantic Foundations ofLogic, second ed. Wadsworth Publishing Co., Belmont, CA.
Growe, S., 1999. Knowledge based interpretation of multisensor andmultitemporal remote sensing images. International Archives ofPhotogrammetry, Remote Sensing and Spatial InformationSciences 32 (Part 7-4-3W6), 130–138.
Growe, S., 2001. Wissensbasierte Interpretation MultitemporalerLuftbilder. PhD Thesis, Institut für Theoretische Nachrichtentech-nik und Informationsverarbeitung, University of Hannover, Hann-over, Germany.
Growe, S., Schröder, T., Liedtke, C.E., 2000. Use of Bayesiannetworks as judgement calculus in a knowledge based imageinterpretation system. International Archives of Photogrammetry,Remote Sensing, and Spatial Information Sciences 33 (Part B3/1),342–350.
Jang, J.S.R., Sun, C.T., 1995. Neuro-fuzzy modeling and control.Proceedings of the IEEE 83 (3), 378–406.
Jeon, B., Landgrebe, D.A., 1992. Classification with spatio-temporalinterpixel class dependency contexts. IEEE Transactions onGeoscience and Remote Sensing 30 (4), 663–672.
Jeon, B., Landgrebe, D.A., 1999. Decision fusion approach formultitemporal classification. IEEE Transactions on Geoscienceand Remote Sensing 37 (3), 1227–1233.
Klir, G.J., Yuan, B., 1995. Fuzzy Sets and Fuzzy Logic— Theory andApplications. Prentice Hall Inc., Upper Saddle River, NJ.
Kuncheva, L.I., 2000. How good are fuzzy if–then classifiers? IEEETransactions on Systems, Man and Cybernetics. Part B. Cyber-netics 30 (4), 501–509.
Lee, T., Richards, J.A., Swain, P.H., 1987. Probabilistic andevidential approaches for multisource data analysis. IEEETransactions on Geoscience and Remote Sensing GE-25 (3),283–293.
Liedtke, C.E., Büchner, J., Pahl, M., Stahlhut, O., 2001. Knowledgebased system for the interpretation of complex scenes. AutomaticExtraction of Man-Made Objects from Aerial and Space Images(III). Balkema Publishers, Ascona, Switzerland.
Lu, D., Mausel, P., Brondízio, E., Moran, E., 2004. Change detectiontechniques. International Journal of Remote Sensing 25 (12),2365–2407.
Melgani, F., Serpico, S.B., Vernazza, G., 2001. Fusion of multitem-poral contextual information by neural networks for multisensorimage classification. Proceedings Geoscience and Remote SensingSymposium (IGARSS '01), Sydney, Australia, 9–13 July 2001,pp. 2952–2954.
Melgani, F., Serpico, S.B., Vernazza, G., 2003. Fusion of multitemporalcontextual information by neural networks for multisensor remotesensing image classification. Integrated Computer-Aided Engineer-ing 10 (1), 81–90.
Mendel, J.M., 1995. Fuzzy logic systems for engineering: a tutorial.Proceedings of the IEEE 83 (3), 345–377.

200 G.L.A. Mota et al. / ISPRS Journal of Photogrammetry & Remote Sensing 62 (2007) 186–200
Minsky, M., 1974. A framework for representing knowledge. In:Winston, P. (Ed.), The Psychology of Computer Vision. McGraw-Hill, New York, pp. 211–277.
Mota, G.L.A., 2004. Interpretação Baseada em ConhecimentoAplicada a Imagens Multitemporais de Satélite de BaixaResolução. PhD Thesis, Department of Electrical Engineering,Pontifical Catholic University, Rio de Janeiro, Brazil.
Pakzad, K., 2001. Wissensbasierte Interpretation von Vegetations-flächen aus Multitemporalen Fernerkundungsdaten. PhD Thesis,Institut für Theoretische Nachrichtentechnik und Informationsver-arbeitung, University of Hannover, Hannover, Germany.
Pakzad, K., 2002. Knowledge based multitemporal interpretation.International Archives of Photogrammetry, Remote Sensing andSpatial Information Sciences 34 (Part 3A), 234–239.
Pakzad, K., Mota, G.L.A., Meirelles, M.S.P., Coutinho, H.L., Feitosa,R.Q., 2003. Automatic interpretation of vegetation areas in Brazil.Proceedings Joint ISPRS/EARSeLWorkshop — High ResolutionMapping from Space 2003, Hannover, Germany, 6–8 October2003. 7 pp. (on CDROM).
Schmiedle, F., Drechsler, N., Grosse, D., Drechsler, R., 2002. Heuristiclearning based on genetic programming. Genetic Programmingand Evolvable Machines 3 (4), 363–388.
Shackelford, A.K., Davis, C.H., 2003. A hierarchical fuzzy classifi-cation approach for high resolution multispectral data over urbanareas. IEEE Transactions on Geoscience and Remote Sensing 41(9), 1920–1932.
Soille, P., 2003. Morphological Image Analysis Principles andApplication, 2nd ed. Springer-Verlag, Berlin.
Solberg, A.H.S., Jain, A.K., Taxt, T., 1994. Multisource classificationof remotely sensed data: fusion of Landsat TM and SAR images.IEEE Transactions on Geoscience and Remote Sensing 32 (4),768–778.
Vincent, L., Soille, P., 1991. Watersheds in digital spaces: an efficientalgorithm based on immersion simulations. IEEE Transactions onPattern Analysis and Machine Intelligence 13 (6), 583–598.
Zadeh, L., 1978. Fuzzy sets as a basis for a theory of possibility. FuzzySets and Systems 1 (1), 3–28.