Embed Size (px)
Citation preview
1
Municipality of Anchorage
Community Assessment of Substance Misuse
May 2019
2
Acknowledgements
Anchorage is a place that people call home. We live here for the beautiful scenery, accessible outdoors, community connection and frontier spirit that defines Alaska. The Anchorage Health Department (AHD)’s vision is for Anchorage to become the safest and healthiest city in the United States. However, substance misuse remains one of the top concerns for our community, pointed to in both health needs assessments and community conversations. Substance misuse and related addiction is having a negative emotional and financial impact on our city. In the fall of 2018, AHD set out to better understand the data and community understanding of the substance misuse problem. The purpose of this assessment is to provide in one location a collection of the quantitative and qualitative data, literature and potential policy recommendations available to our community. The data is the most current available. Where access to local level data was available, it was included. This goal of this report is to encourage dialogue, establish strategies, and create pathways to successful regulatory changes. Ultimately, AHD seeks to encourage the community to better understand how substance misuse, specifically the eight findings below, are impacting us. This assessment would not have been possible without the partnership with the Alaska National Guard Counterdrug Support Program, State of Alaska Office of Substance Misuse and Addiction Prevention, Project HOPE, Volunteers of America-Healthy Voices Healthy Choices Coalition and Recover Alaska. The MOA Health and Human Services Commission was integral in the policy analysis and prioritization process, which will shape and advance policies to help address some of the substance use issues in our community. We would like to thank the staff at the Anchorage Health Department, many community partners, agencies, organizations, community groups, and individuals that generously contributed their time, energy, and knowledge to this assessment. Your expertise, insight, and dedication are deeply appreciated. It will take the whole community working together to change the current trends and consequences associated with substance misuse.
Contact
Anchorage Health Department 825 L Street
Anchorage, AK 99501
www.muni.org/health (907) 343-6718
3
Letter to Readers
Over the last four months we travelled all over Anchorage, talking to community members who have been directly and indirectly affected by substance misuse and addiction. In total, we spoke to 72 individuals through the interview process and dozens more through our Community Conversation on Substance Misuse. We heard incredibly powerful stories of loss, hopelessness, and fear. We spoke to people overcome with anger, with exhaustion, with frustration. We also listened to stories imbued with hope, love, and an indefatigable drive to serve others and help heal this community. These words, filled with pain and love and frustration and hope, were gifts of great courage. We hope that through this assessment they can also be vehicles of change.
Time and again we were told that Anchorage’s greatest resource is its residents. This assessment discusses numerous gaps in services, barriers to treatment, drivers of addiction, and trends in use and misuse. It does not paint a particularly rosy picture. This is not an easy issue to grapple with, and so many of us have loved ones, family, friends, neighbors, and colleagues that have been directly impacted by addiction. In too many cases, this impact comes in the form of death. Yet we urge you, as you read this assessment, to remember that you are our community’s greatest resource. However grim the reality may be, hope and resilience and passion and love are alive in the members of this community. We witnessed it over and over again. We hope that you will use this assessment as an evidence-based tool to find solutions and build hope.
Thank you for your stories, your pain, your passion, and your hope.
Sarah Richardson SSG Elijah Gutierrez
4
Contents Executive Summary ................................................................................................................................................................. 6
List of Figures .......................................................................................................................................................................... 8
Acronyms and Definitions ..................................................................................................................................................... 12
Community Description ........................................................................................................................................................ 13
Table of Psychoactive Substances......................................................................................................................................... 14
Purpose of Assessment & Methodology ............................................................................................................................... 15
Key Informant Interview Process ...................................................................................................................................... 15
Datasets ............................................................................................................................................................................ 16
Note on Language ................................................................................................................................................................. 17
Substance Use Disorder ........................................................................................................................................................ 18
Substance Use Disorder in Alaska ..................................................................................................................................... 19
Overview: Substance Misuse in Anchorage .......................................................................................................................... 21
Key Findings .......................................................................................................................................................................... 25
Effects on the Community ................................................................................................................................................ 25
Drivers and Risk Factors .................................................................................................................................................... 27
Strengths and Resiliencies ................................................................................................................................................ 29
Stigma ............................................................................................................................................................................... 32
Opioids .............................................................................................................................................................................. 36
Heroin ............................................................................................................................................................................ 39
Fentanyl ......................................................................................................................................................................... 46
Prescription Opioids ...................................................................................................................................................... 48
Neonatal Abstinence Syndrome ................................................................................................................................... 54
Methamphetamine ........................................................................................................................................................... 55
Cocaine .............................................................................................................................................................................. 61
Synthetic Cannabinoids ..................................................................................................................................................... 64
Marijuana .......................................................................................................................................................................... 66
Tobacco ............................................................................................................................................................................. 73
Electronic Cigarettes (vaping) ........................................................................................................................................... 78
Alcohol .............................................................................................................................................................................. 82
Fetal Alcohol Syndrome ................................................................................................................................................ 91
Syringe Services................................................................................................................................................................. 92
HIV ................................................................................................................................................................................. 94
Hepatitis C ..................................................................................................................................................................... 95
Prescription Medicine Disposal ......................................................................................................................................... 96
5
Homelessness.................................................................................................................................................................... 98
Community Connectedness ............................................................................................................................................ 101
Trauma ........................................................................................................................................................................ 103
Behavioral Health ........................................................................................................................................................ 108
Treatment ....................................................................................................................................................................... 111
Recovery .......................................................................................................................................................................... 117
Appendix 1: Policy Recommendations................................................................................................................................ 118
Appendix 2: Community Conversation Notes ..................................................................................................................... 119
Appendix 3: Literature Review ............................................................................................................................................ 132
Source List ........................................................................................................................................................................... 191
6
Executive Summary
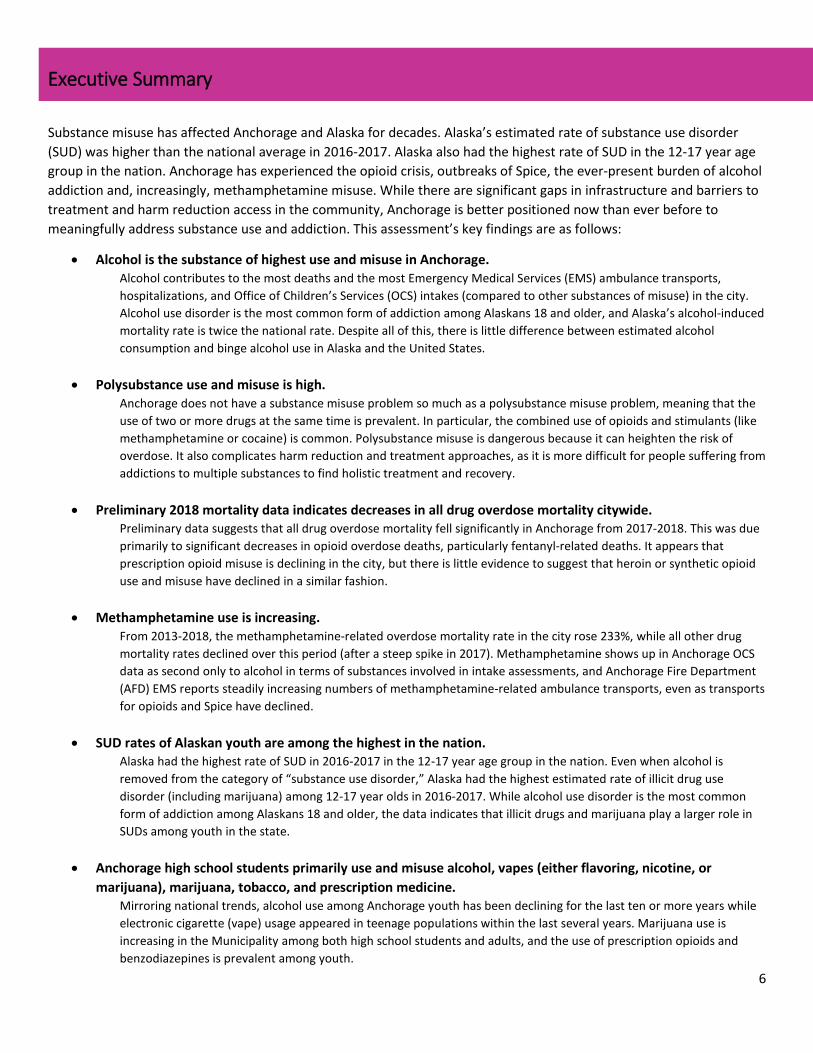
Substance misuse has affected Anchorage and Alaska for decades. Alaska’s estimated rate of substance use disorder (SUD) was higher than the national average in 2016-2017. Alaska also had the highest rate of SUD in the 12-17 year age group in the nation. Anchorage has experienced the opioid crisis, outbreaks of Spice, the ever-present burden of alcohol addiction and, increasingly, methamphetamine misuse. While there are significant gaps in infrastructure and barriers to treatment and harm reduction access in the community, Anchorage is better positioned now than ever before to meaningfully address substance use and addiction. This assessment’s key findings are as follows:
• Alcohol is the substance of highest use and misuse in Anchorage. Alcohol contributes to the most deaths and the most Emergency Medical Services (EMS) ambulance transports, hospitalizations, and Office of Children’s Services (OCS) intakes (compared to other substances of misuse) in the city. Alcohol use disorder is the most common form of addiction among Alaskans 18 and older, and Alaska’s alcohol-induced mortality rate is twice the national rate. Despite all of this, there is little difference between estimated alcohol consumption and binge alcohol use in Alaska and the United States.
• Polysubstance use and misuse is high. Anchorage does not have a substance misuse problem so much as a polysubstance misuse problem, meaning that the use of two or more drugs at the same time is prevalent. In particular, the combined use of opioids and stimulants (like methamphetamine or cocaine) is common. Polysubstance misuse is dangerous because it can heighten the risk of overdose. It also complicates harm reduction and treatment approaches, as it is more difficult for people suffering from addictions to multiple substances to find holistic treatment and recovery.
• Preliminary 2018 mortality data indicates decreases in all drug overdose mortality citywide. Preliminary data suggests that all drug overdose mortality fell significantly in Anchorage from 2017-2018. This was due primarily to significant decreases in opioid overdose deaths, particularly fentanyl-related deaths. It appears that prescription opioid misuse is declining in the city, but there is little evidence to suggest that heroin or synthetic opioid use and misuse have declined in a similar fashion.
• Methamphetamine use is increasing. From 2013-2018, the methamphetamine-related overdose mortality rate in the city rose 233%, while all other drug mortality rates declined over this period (after a steep spike in 2017). Methamphetamine shows up in Anchorage OCS data as second only to alcohol in terms of substances involved in intake assessments, and Anchorage Fire Department (AFD) EMS reports steadily increasing numbers of methamphetamine-related ambulance transports, even as transports for opioids and Spice have declined.
• SUD rates of Alaskan youth are among the highest in the nation. Alaska had the highest rate of SUD in 2016-2017 in the 12-17 year age group in the nation. Even when alcohol is removed from the category of “substance use disorder,” Alaska had the highest estimated rate of illicit drug use disorder (including marijuana) among 12-17 year olds in 2016-2017. While alcohol use disorder is the most common form of addiction among Alaskans 18 and older, the data indicates that illicit drugs and marijuana play a larger role in SUDs among youth in the state.
• Anchorage high school students primarily use and misuse alcohol, vapes (either flavoring, nicotine, or marijuana), marijuana, tobacco, and prescription medicine.
Mirroring national trends, alcohol use among Anchorage youth has been declining for the last ten or more years while electronic cigarette (vape) usage appeared in teenage populations within the last several years. Marijuana use is increasing in the Municipality among both high school students and adults, and the use of prescription opioids and benzodiazepines is prevalent among youth.
7
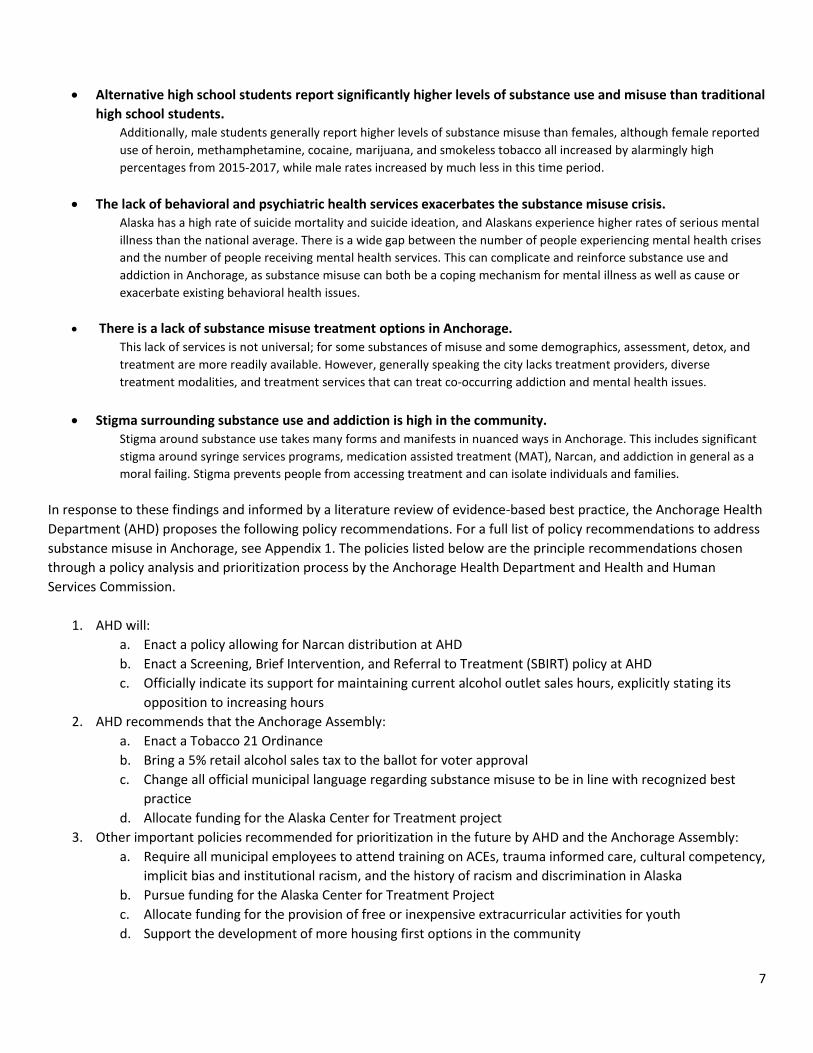
• Alternative high school students report significantly higher levels of substance use and misuse than traditional
high school students. Additionally, male students generally report higher levels of substance misuse than females, although female reported use of heroin, methamphetamine, cocaine, marijuana, and smokeless tobacco all increased by alarmingly high percentages from 2015-2017, while male rates increased by much less in this time period.
• The lack of behavioral and psychiatric health services exacerbates the substance misuse crisis. Alaska has a high rate of suicide mortality and suicide ideation, and Alaskans experience higher rates of serious mental illness than the national average. There is a wide gap between the number of people experiencing mental health crises and the number of people receiving mental health services. This can complicate and reinforce substance use and addiction in Anchorage, as substance misuse can both be a coping mechanism for mental illness as well as cause or exacerbate existing behavioral health issues.
• There is a lack of substance misuse treatment options in Anchorage. This lack of services is not universal; for some substances of misuse and some demographics, assessment, detox, and treatment are more readily available. However, generally speaking the city lacks treatment providers, diverse treatment modalities, and treatment services that can treat co-occurring addiction and mental health issues.
• Stigma surrounding substance use and addiction is high in the community.
Stigma around substance use takes many forms and manifests in nuanced ways in Anchorage. This includes significant stigma around syringe services programs, medication assisted treatment (MAT), Narcan, and addiction in general as a moral failing. Stigma prevents people from accessing treatment and can isolate individuals and families.
In response to these findings and informed by a literature review of evidence-based best practice, the Anchorage Health Department (AHD) proposes the following policy recommendations. For a full list of policy recommendations to address substance misuse in Anchorage, see Appendix 1. The policies listed below are the principle recommendations chosen through a policy analysis and prioritization process by the Anchorage Health Department and Health and Human Services Commission.
1. AHD will: a. Enact a policy allowing for Narcan distribution at AHD b. Enact a Screening, Brief Intervention, and Referral to Treatment (SBIRT) policy at AHD c. Officially indicate its support for maintaining current alcohol outlet sales hours, explicitly stating its
opposition to increasing hours 2. AHD recommends that the Anchorage Assembly:
a. Enact a Tobacco 21 Ordinance b. Bring a 5% retail alcohol sales tax to the ballot for voter approval c. Change all official municipal language regarding substance misuse to be in line with recognized best
practice d. Allocate funding for the Alaska Center for Treatment project
3. Other important policies recommended for prioritization in the future by AHD and the Anchorage Assembly: a. Require all municipal employees to attend training on ACEs, trauma informed care, cultural competency,
implicit bias and institutional racism, and the history of racism and discrimination in Alaska b. Pursue funding for the Alaska Center for Treatment Project c. Allocate funding for the provision of free or inexpensive extracurricular activities for youth d. Support the development of more housing first options in the community
8
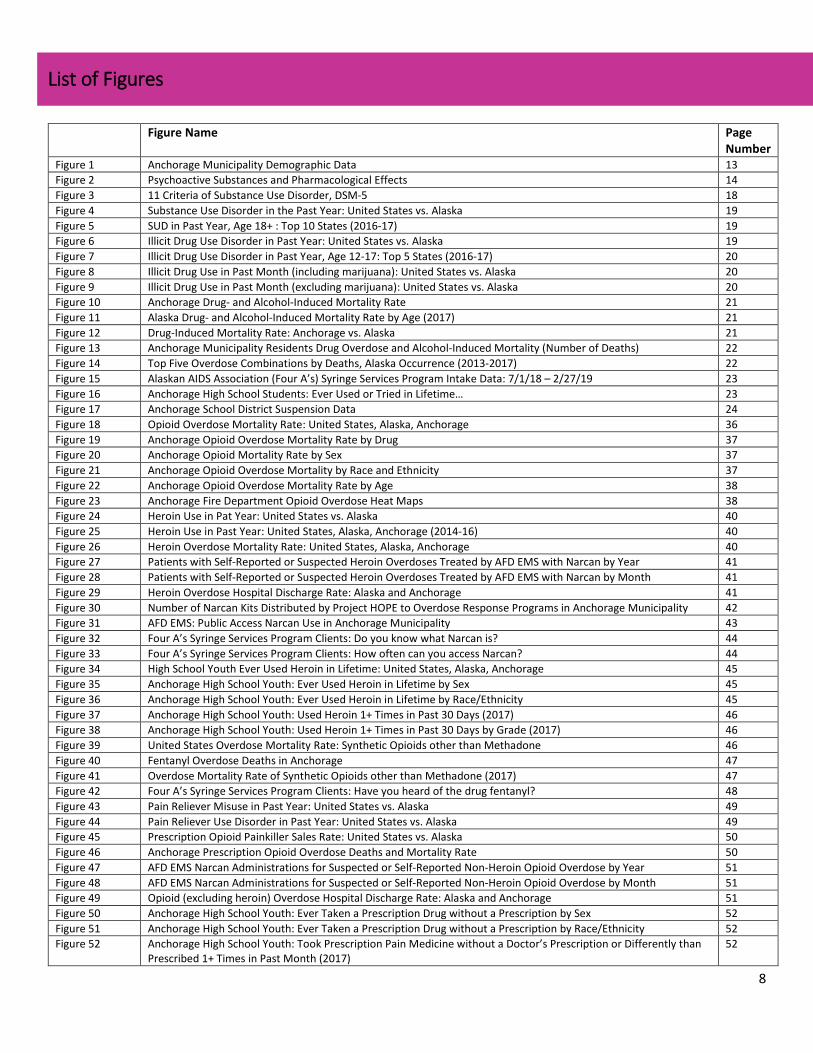
List of Figures
Figure Name Page Number
Figure 1 Anchorage Municipality Demographic Data 13 Figure 2 Psychoactive Substances and Pharmacological Effects 14 Figure 3 11 Criteria of Substance Use Disorder, DSM-5 18 Figure 4 Substance Use Disorder in the Past Year: United States vs. Alaska 19 Figure 5 SUD in Past Year, Age 18+ : Top 10 States (2016-17) 19 Figure 6 Illicit Drug Use Disorder in Past Year: United States vs. Alaska 19 Figure 7 Illicit Drug Use Disorder in Past Year, Age 12-17: Top 5 States (2016-17) 20 Figure 8 Illicit Drug Use in Past Month (including marijuana): United States vs. Alaska 20 Figure 9 Illicit Drug Use in Past Month (excluding marijuana): United States vs. Alaska 20 Figure 10 Anchorage Drug- and Alcohol-Induced Mortality Rate 21 Figure 11 Alaska Drug- and Alcohol-Induced Mortality Rate by Age (2017) 21 Figure 12 Drug-Induced Mortality Rate: Anchorage vs. Alaska 21 Figure 13 Anchorage Municipality Residents Drug Overdose and Alcohol-Induced Mortality (Number of Deaths) 22 Figure 14 Top Five Overdose Combinations by Deaths, Alaska Occurrence (2013-2017) 22 Figure 15 Alaskan AIDS Association (Four A’s) Syringe Services Program Intake Data: 7/1/18 – 2/27/19 23 Figure 16 Anchorage High School Students: Ever Used or Tried in Lifetime… 23 Figure 17 Anchorage School District Suspension Data 24 Figure 18 Opioid Overdose Mortality Rate: United States, Alaska, Anchorage 36 Figure 19 Anchorage Opioid Overdose Mortality Rate by Drug 37 Figure 20 Anchorage Opioid Mortality Rate by Sex 37 Figure 21 Anchorage Opioid Overdose Mortality by Race and Ethnicity 37 Figure 22 Anchorage Opioid Overdose Mortality Rate by Age 38 Figure 23 Anchorage Fire Department Opioid Overdose Heat Maps 38 Figure 24 Heroin Use in Pat Year: United States vs. Alaska 40 Figure 25 Heroin Use in Past Year: United States, Alaska, Anchorage (2014-16) 40 Figure 26 Heroin Overdose Mortality Rate: United States, Alaska, Anchorage 40 Figure 27 Patients with Self-Reported or Suspected Heroin Overdoses Treated by AFD EMS with Narcan by Year 41 Figure 28 Patients with Self-Reported or Suspected Heroin Overdoses Treated by AFD EMS with Narcan by Month 41 Figure 29 Heroin Overdose Hospital Discharge Rate: Alaska and Anchorage 41 Figure 30 Number of Narcan Kits Distributed by Project HOPE to Overdose Response Programs in Anchorage Municipality 42 Figure 31 AFD EMS: Public Access Narcan Use in Anchorage Municipality 43 Figure 32 Four A’s Syringe Services Program Clients: Do you know what Narcan is? 44 Figure 33 Four A’s Syringe Services Program Clients: How often can you access Narcan? 44 Figure 34 High School Youth Ever Used Heroin in Lifetime: United States, Alaska, Anchorage 45 Figure 35 Anchorage High School Youth: Ever Used Heroin in Lifetime by Sex 45 Figure 36 Anchorage High School Youth: Ever Used Heroin in Lifetime by Race/Ethnicity 45 Figure 37 Anchorage High School Youth: Used Heroin 1+ Times in Past 30 Days (2017) 46 Figure 38 Anchorage High School Youth: Used Heroin 1+ Times in Past 30 Days by Grade (2017) 46 Figure 39 United States Overdose Mortality Rate: Synthetic Opioids other than Methadone 46 Figure 40 Fentanyl Overdose Deaths in Anchorage 47 Figure 41 Overdose Mortality Rate of Synthetic Opioids other than Methadone (2017) 47 Figure 42 Four A’s Syringe Services Program Clients: Have you heard of the drug fentanyl? 48 Figure 43 Pain Reliever Misuse in Past Year: United States vs. Alaska 49 Figure 44 Pain Reliever Use Disorder in Past Year: United States vs. Alaska 49 Figure 45 Prescription Opioid Painkiller Sales Rate: United States vs. Alaska 50 Figure 46 Anchorage Prescription Opioid Overdose Deaths and Mortality Rate 50 Figure 47 AFD EMS Narcan Administrations for Suspected or Self-Reported Non-Heroin Opioid Overdose by Year 51 Figure 48 AFD EMS Narcan Administrations for Suspected or Self-Reported Non-Heroin Opioid Overdose by Month 51 Figure 49 Opioid (excluding heroin) Overdose Hospital Discharge Rate: Alaska and Anchorage 51 Figure 50 Anchorage High School Youth: Ever Taken a Prescription Drug without a Prescription by Sex 52 Figure 51 Anchorage High School Youth: Ever Taken a Prescription Drug without a Prescription by Race/Ethnicity 52 Figure 52 Anchorage High School Youth: Took Prescription Pain Medicine without a Doctor’s Prescription or Differently than
Prescribed 1+ Times in Past Month (2017) 52
9
Figure 53 Anchorage High School Youth: Parents Consider it Wrong or Very Wrong to use Prescription Pain Medicine without Prescription or Differently than Prescribed (2017)
53
Figure 54 Anchorage High School Youth: Took Prescription Pain Medicine without a Doctor’s Prescription or Differently than Prescribed 1+ Times in Past Month by School Type and Sex (2017)
53
Figure 55 Anchorage High School Youth: Took Prescription Pain Medicine without a Doctor’s Prescription or Differently than Prescribed 1+ Times in Past Month by Sex and Race/Ethnicity (2017)
53
Figure 56 Neonatal Abstinence Syndrome Rate in Alaska: 3 Month Rolling Averages 54 Figure 57 Anchorage: Hospital Discharges for Neonatal Withdrawal Symptoms 54 Figure 58 Anchorage: Hospital Discharges for Neonatal Withdrawal Symptoms by Race 54 Figure 59 Other Substances Involved in Methamphetamine Related Fatalities in Alaska: 2008-2016 55 Figure 60 Methamphetamine Use in Past Year: United States vs. Alaska 55 Figure 61 Psychostimulant Mortality Rate: United States vs. Alaska 55 Figure 62 Methamphetamine-Related Mortality by 3-Year Interval 56 Figure 63 Anchorage Methamphetamine and All Drug Overdose Mortality Rates 57 Figure 64 Anchorage Methamphetamine and Opioid Overdose Mortality Rates 57 Figure 65 AFD EMS: Methamphetamine Transports in Anchorage Municipality 58 Figure 66 AFD Transports and Narcan Administrations by Year 58 Figure 67 AFD Methamphetamine Transports by Month 58 Figure 68 Anchorage: Psychostimulant Hospital Discharges 59 Figure 69 Anchorage: Psychostimulant Hospital Discharges by Sex and Type 59 Figure 70 Anchorage: Psychostimulant Hospital Discharges by Race 59 Figure 71 Youth Ever Used Methamphetamine in Lifetime: United States, Alaska, Anchorage 60 Figure 72 Youth Ever Used Methamphetamine in Lifetime 60 Figure 73 Anchorage High School Youth: Ever Used Methamphetamine by Sex 60 Figure 74 Anchorage High School Youth: Used Methamphetamine 1+ Times in Past 30 Days 60 Figure 75 Cocaine Use in Past Year: United States vs. Alaska 61 Figure 76 Cocaine Use in Past Year, Age 12+: United States, Alaska, Anchorage 61 Figure 77 Anchorage Drug Overdose and Cocaine Overdose Mortality Rate 61 Figure 78 Anchorage High School Youth: Ever Used Any Form of Cocaine by Sex 62 Figure 79 Anchorage High School Youth: Ever Used Any Form of Cocaine by Race/Ethnicity 62 Figure 80 High School Youth Ever Used Any Form of Cocaine: Alaska vs. Anchorage 62 Figure 81 Anchorage High School Youth Ever Used Any Form of Cocaine by School Type 63 Figure 82 AFD Spice Transports by Month 64 Figure 83 AFD Spice Transports by Year 65 Figure 84 Alaska vs. Anchorage High School Youth: Ever Used Synthetic Marijuana in Lifetime 65 Figure 85 Anchorage High School Youth: Ever Used Synthetic Marijuana in Lifetime 65 Figure 86 Marijuana Use in Past Month: United States, Alaska, Anchorage 66 Figure 87 Alaska Adults: Current Marijuana Use 67 Figure 88 Low vs. High Income Anchorage Adults: Current Marijuana Use 67 Figure 89 Anchorage Adults: Current Marijuana Use by Age 67 Figure 90 Anchorage Adults: Primary Reason for Using Marijuana by Age (2017) 67 Figure 91 Anchorage: Maternal Marijuana Use and Pregnancy 68 Figure 92 High School Youth Marijuana Use: United States, Alaska, Anchorage 68 Figure 93 Anchorage Youth: Used Marijuana for First Time Before Age 13 69 Figure 94 Anchorage High School Youth: Marijuana Use and Legal Changes 69 Figure 95 Anchorage High School Youth: Marijuana Use 1+ Times in Past Month 69 Figure 96 Anchorage High School Youth: Used Marijuana 1+ Times in Past Month by Race/Ethnicity 70 Figure 97 Anchorage Students: Among Current Marijuana Users – Used by Other Than Smoking 70 Figure 98 Anchorage Students: In Past 12 Months, Personally Seen Student at School or School Event Under Influence of
Marijuana 1+ Times (2019) 70
Figure 99 Anchorage Students: In past 12 Months, Personally Seen Student at School or School Event Under Influence of Substance 1+ Times (2019)
71
Figure 100 Anchorage Students Grade 6-12: In Past 12 Months, Personally Seen Student at School or School Event Under Influence of Marijuana 1+ Times (2019)
71
Figure 101 Anchorage High School Students: Pretty Good or Very Good Chance of Being Seen as Cool if… 72 Figure 102 Anchorage High School Youth: Parents Think it’s Wrong or Very Wrong to… (2017) 72 Figure 103 Tobacco Product Use in Past Month: United States vs. Alaska 73 Figure 104 Cigarette Use in Past Month: United States vs. Alaska 73 Figure 105 Tobacco Product and Cigarette Use in Past Month, 12+ Years 73
10
Figure 106 Current Smoker or Smokeless Tobacco User: Alaska vs. Anchorage 74 Figure 107 Smoke Every Day: Anchorage Adults by Age 74 Figure 108 Smoke Every Day: Anchorage Adults by Race/Ethnicity 74 Figure 109 Anchorage Pregnant Women: Smoked… 75 Figure 110 American 12th Graders: Ever Used Cigarettes or Smokeless Tobacco in Lifetime 75 Figure 111 High School Youth: Every Tried Smoking, Even One or Two Puffs 76 Figure 112 High School Youth: Smoked Cigarettes on 20+ Days in Past Month 76 Figure 113 Anchorage High School Youth: Smoked Cigarettes on 20+ Days in Past Month 76 Figure 114 Anchorage High School Youth: Used Smokeless Tobacco in Past 30 Days 77 Figure 115 Anchorage High School Youth: Smokeless Tobacco User on School Property in Past 30 Days 77 Figure 116 Current Use of E-Cigarettes: Alaska vs. Anchorage 78 Figure 117 Current Use of E-Cigarettes: Anchorage by Age 78 Figure 118 Current Use of E-Cigarettes: Anchorage by Age and Sex 78 Figure 119 Youth Nationwide: Any Vaping in Lifetime 79 Figure 120 High School Youth Electronic Cigarette Use (2017) 79 Figure 121 Anchorage High School Youth: Used Vaping Products in Past 30 Days 79 Figure 122 Anchorage High School Youth: Used Vaping Products in Past 30 Days by Race/Ethnicity 80 Figure 123 Anchorage High School Youth: Currently Using Vaping Products by Group and Sex 80 Figure 124 Anchorage High School Vape Users: How did you obtain vaping products? 81 Figure 125 Alcohol Use in Past Month: United States vs. Alaska 82 Figure 126 Binge Alcohol Use in Past Month: United States vs. Alaska 82 Figure 127 Alcohol Use Disorder in Past Year: United States vs. Alaska 82 Figure 128 Alcohol Use Disorder in Past Year, 12+ Years: United States, Alaska, Anchorage 82 Figure 129 Adult Current Alcohol Use: Alaska vs. Anchorage 83 Figure 130 Adult Current Alcohol Use: Anchorage by Sex 83 Figure 131 Adult Current Alcohol Use: Anchorage by Race 83 Figure 132 Adult Current Alcohol Use: Anchorage by Income 83 Figure 133 Adult Current Alcohol Use: Anchorage by Age 84 Figure 134 Alcohol and Drug Induced Mortality in Alaska 84 Figure 135 Alcohol-Induced Mortality: Alaska vs. Anchorage 85 Figure 136 Alcohol-Induced Mortality in Alaska by Race 85 Figure 137 AFD EMS: Total Calls by Primary Impression 85 Figure 138 Anchorage: Alcohol Related Hospital Discharges 86 Figure 139 Anchorage: Alcohol Related Hospital Discharges by Sex 86 Figure 140 Anchorage: Alcohol Related Hospital Discharges by Age 86 Figure 141 Anchorage OCS: Characteristics in All Substantiated Intake Assessments 87 Figure 142 Anchorage High School Youth: Had 5+ Drinks of Alcohol in a Row in Past Month 88 Figure 143 Anchorage High School Youth: Had 4+ Drinks (females) or 5+ Drinks (males) of Alcohol in a Row in Past Month
(2017) 88
Figure 144 Anchorage High School Youth: Had 4+ Drinks (females) or 5+ Drinks (males) of Alcohol in a Row in Past Month by Age and Sex (2017)
89
Figure 145 Anchorage High School Youth: Pretty Good or Very Good Chance of Being Seen as Cool if Regularly Drink Alcohol 89 Figure 146 Anchorage High School Youth: First Drink of Alcohol Before Age 13 89 Figure 147 Anchorage Students: In Past 12 Months, Personally Seen Students at School or School Event Under the Influence of
Alcohol 1+ Times (2019) 89
Figure 148 Anchorage 6th-12th Graders: In Past 12 Months, Personally Seen Students at School or School Event Under the Influence of Alcohol 1+ Times (2019)
90
Figure 149 Anchorage High School Youth: In the Past 12 Months, Drove When Drinking Alcohol 90 Figure 150 Anchorage: Fetal Alcohol Syndrome Hospital Discharges 91 Figure 151 Anchorage: Fetal Alcohol Syndrome Hospital Discharges by Race 91 Figure 152 Four A’s Demographic Data: Age 92 Figure 153 Four A’s Demographic Data: Race 92 Figure 154 Four A’s Syringe Services Program: Syringes Given and Returned 93 Figure 155 Four A’s Syringe Services Program Clients: I can access needle exchange in Anchorage… 93 Figure 156 Four A’s Syringe Services Program Clients: In the past month, how often have you reused a needle? 94 Figure 157 Persons Living with HIV in Alaska by Transmission Category 94 Figure 158 Annual Newly Reported Cases of HCV in Alaska 95 Figure 159 Pounds of Medicine Received at Alaska DEA Takeback Events 96 Figure 160 Homelessness Point in Time Counts (January): Alaska vs. Anchorage 98
11
Figure 161 Anchorage Homelessness Point in Time Count (Sheltered and Unsheltered Persons) 99 Figure 162 Anchorage Homeless Population Demographics 99 Figure 163 Anchorage High School Student Connectedness 102 Figure 164 Anchorage High School Student Connectedness by School Type 102 Figure 165 Anchorage 6th-12th Graders: Spend 2+ Hours Participating in Organized After School or Weekend Activities in an
Average Week (2019) 102
Figure 166 ACEs Definitions 103 Figure 167 Adverse Childhood Experiences in Alaska and Anchorage: Persons 18 and Older (2015) 104 Figure 168 Alaska: Experienced 1+ ACEs Before Age 18, Adults 18 Years and Older (2015) 105 Figure 169 Anchorage: ACEs in Adult Population by Sex (2015) 105 Figure 170 Anchorage High School Students: Bullied on School Property in Past Year 106 Figure 171 Anchorage High School Youth: Did Not Go to School Because it was Unsafe in Past Month (2017) 106 Figure 172 Anchorage 6th-12th Graders: Agree or Strongly Agree: I Feel Safe at School (2019) 107 Figure 173 Anchorage High School Youth: Ever Physically Hurt by Someone They Dated in Past Year (2017) 107 Figure 174 Anchorage High School Youth: Forced by Anyone to do Sexual Things in Past Year (2017) 107 Figure 175 Alaska Suicide Mortality Rate by Sex 108 Figure 176 Suicide Mortality Rate: United States, Alaska, Anchorage 108 Figure 177 Highest Ranked States and Anchorage: Had Serious Thoughts of Suicide in Past Year – Persons 18 Years and Older 108 Figure 178 Had Serious Thoughts of Suicide in Past Year: United States vs. Alaska 108 Figure 179 Serious Mental Illness in Past Year: United States vs. Alaska 109 Figure 180 Alaska: Any Mental Illness vs. Received Services for Mental Illness in Past Year 109 Figure 181 Anchorage Adults: Reported Frequent Mental Distress 109 Figure 182 Anchorage Adults: Reported Frequent Mental Distress by Income and Education Level 109 Figure 183 Anchorage Youth: Suicide and Depression 110 Figure 184 Adults in Treatment for Drug or Alcohol Use Within Past Year: Alaska vs. Anchorage 111 Figure 185 Anchorage Adults: In Treatment for Drug or Alcohol Use Within Past Year 111 Figure 186 Needing but not Receiving Treatment at a Specialty Facility for Illicit Drug Use in Past Year: United States vs. Alaska 111 Figure 187 Syringe Services Program Clients: If you have been in treatment or detox, how did you find the services? 113
12
Acronyms and Definitions
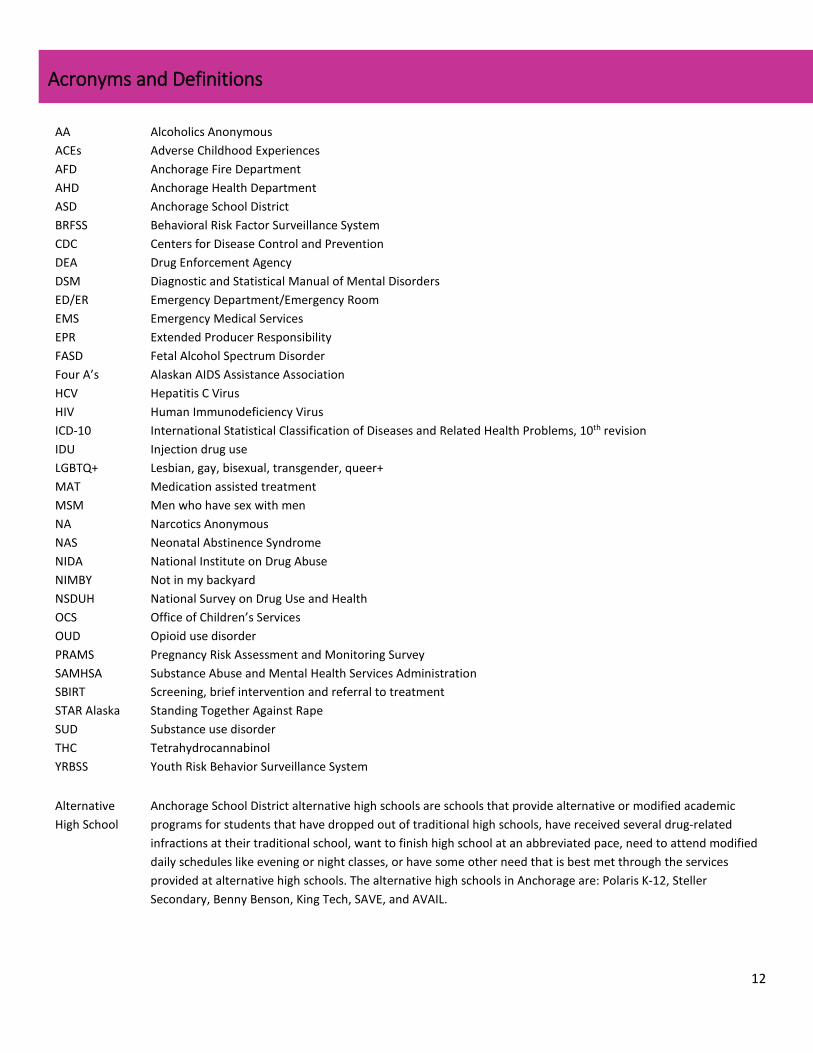
AA Alcoholics Anonymous ACEs Adverse Childhood Experiences AFD Anchorage Fire Department AHD Anchorage Health Department ASD Anchorage School District BRFSS Behavioral Risk Factor Surveillance System CDC Centers for Disease Control and Prevention DEA Drug Enforcement Agency DSM Diagnostic and Statistical Manual of Mental Disorders ED/ER Emergency Department/Emergency Room EMS Emergency Medical Services EPR Extended Producer Responsibility FASD Fetal Alcohol Spectrum Disorder Four A’s Alaskan AIDS Assistance Association HCV Hepatitis C Virus HIV Human Immunodeficiency Virus ICD-10 International Statistical Classification of Diseases and Related Health Problems, 10th revision IDU Injection drug use LGBTQ+ Lesbian, gay, bisexual, transgender, queer+ MAT Medication assisted treatment MSM Men who have sex with men NA Narcotics Anonymous NAS Neonatal Abstinence Syndrome NIDA National Institute on Drug Abuse NIMBY Not in my backyard NSDUH National Survey on Drug Use and Health OCS Office of Children’s Services OUD Opioid use disorder PRAMS Pregnancy Risk Assessment and Monitoring Survey SAMHSA Substance Abuse and Mental Health Services Administration SBIRT Screening, brief intervention and referral to treatment STAR Alaska Standing Together Against Rape SUD Substance use disorder THC Tetrahydrocannabinol YRBSS Youth Risk Behavior Surveillance System Alternative High School
Anchorage School District alternative high schools are schools that provide alternative or modified academic programs for students that have dropped out of traditional high schools, have received several drug-related infractions at their traditional school, want to finish high school at an abbreviated pace, need to attend modified daily schedules like evening or night classes, or have some other need that is best met through the services provided at alternative high schools. The alternative high schools in Anchorage are: Polaris K-12, Steller Secondary, Benny Benson, King Tech, SAVE, and AVAIL.
13
Community Description
Population
The Anchorage Municipality includes Eagle River, Chugiak, Anchorage, Girdwood, and Joint Base Elmendorf Richardson (JBER), and encompasses 1,961 square miles of land. In 2018 the State of Alaska Department of Labor and Workforce Development estimated the population of the Municipality at 295,365, meaning that residents of Anchorage make up 40.1% of Alaska’s population. The population of Anchorage has been decreasing since 2013, when over 301,000 people lived in the Municipality. From 2017-2018, the population of Anchorage decreased 0.8%.1
There are nearly 50,000 students in Anchorage School District schools. At the high school level, there are approximately 10,900 students at traditional high schools and over 1,000 students at alternative high schools.19
Demographics
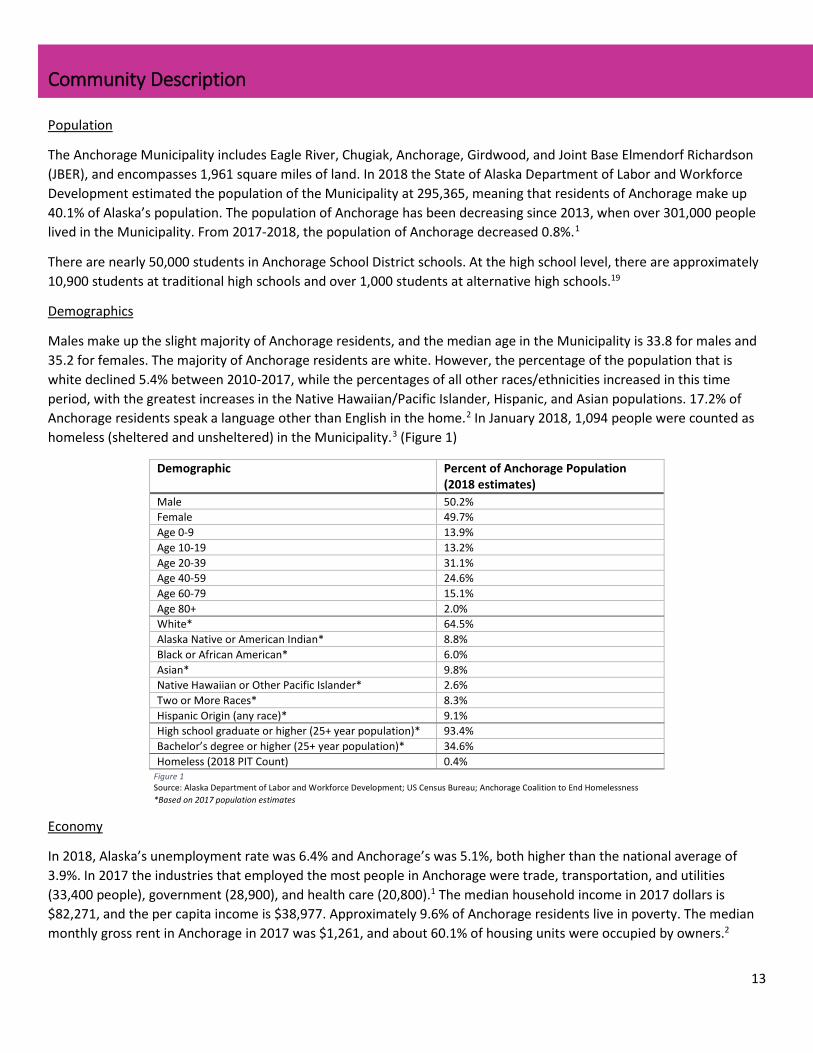
Males make up the slight majority of Anchorage residents, and the median age in the Municipality is 33.8 for males and 35.2 for females. The majority of Anchorage residents are white. However, the percentage of the population that is white declined 5.4% between 2010-2017, while the percentages of all other races/ethnicities increased in this time period, with the greatest increases in the Native Hawaiian/Pacific Islander, Hispanic, and Asian populations. 17.2% of Anchorage residents speak a language other than English in the home.2 In January 2018, 1,094 people were counted as homeless (sheltered and unsheltered) in the Municipality.3 (Figure 1)
Economy
In 2018, Alaska’s unemployment rate was 6.4% and Anchorage’s was 5.1%, both higher than the national average of 3.9%. In 2017 the industries that employed the most people in Anchorage were trade, transportation, and utilities (33,400 people), government (28,900), and health care (20,800).1 The median household income in 2017 dollars is $82,271, and the per capita income is $38,977. Approximately 9.6% of Anchorage residents live in poverty. The median monthly gross rent in Anchorage in 2017 was $1,261, and about 60.1% of housing units were occupied by owners.2
Demographic Percent of Anchorage Population (2018 estimates)
Male 50.2% Female 49.7% Age 0-9 13.9% Age 10-19 13.2% Age 20-39 31.1% Age 40-59 24.6% Age 60-79 15.1% Age 80+ 2.0% White* 64.5% Alaska Native or American Indian* 8.8% Black or African American* 6.0% Asian* 9.8% Native Hawaiian or Other Pacific Islander* 2.6% Two or More Races* 8.3% Hispanic Origin (any race)* 9.1% High school graduate or higher (25+ year population)* 93.4% Bachelor’s degree or higher (25+ year population)* 34.6% Homeless (2018 PIT Count) 0.4%
Figure 1 Source: Alaska Department of Labor and Workforce Development; US Census Bureau; Anchorage Coalition to End Homelessness *Based on 2017 population estimates
14
Table of Psychoactive Substances
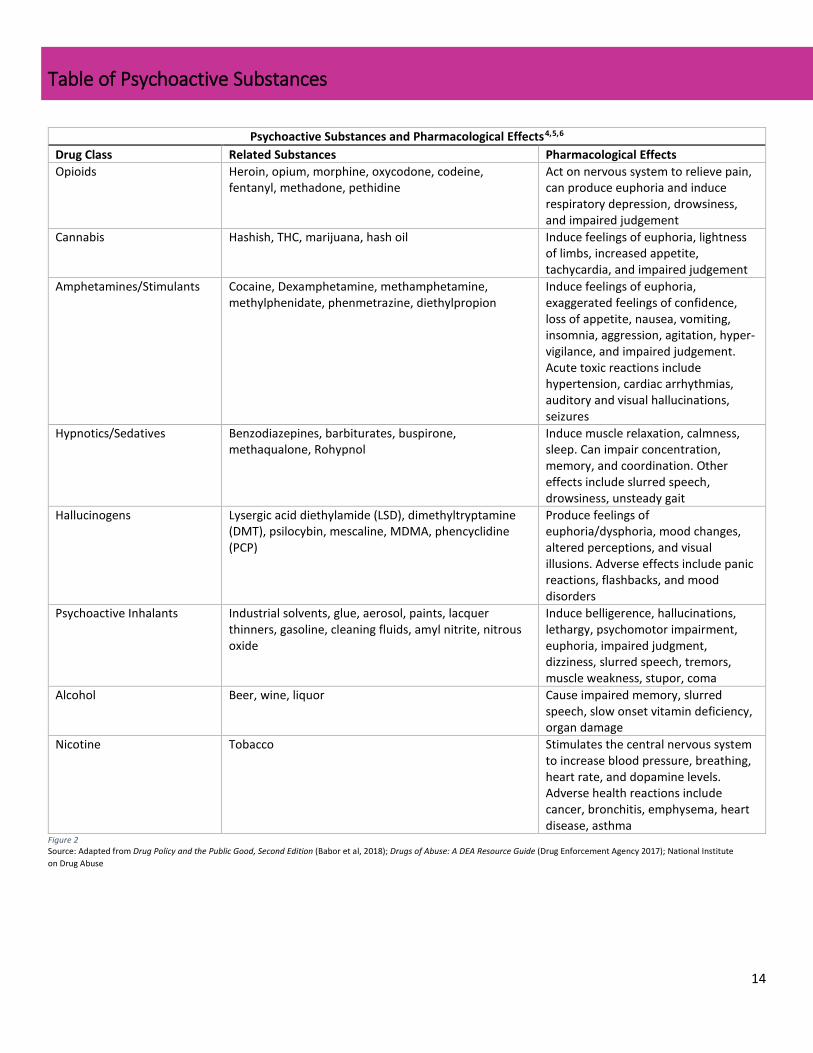
Psychoactive Substances and Pharmacological Effects4,5,6 Drug Class Related Substances Pharmacological Effects Opioids Heroin, opium, morphine, oxycodone, codeine,
fentanyl, methadone, pethidine Act on nervous system to relieve pain, can produce euphoria and induce respiratory depression, drowsiness, and impaired judgement
Cannabis Hashish, THC, marijuana, hash oil Induce feelings of euphoria, lightness of limbs, increased appetite, tachycardia, and impaired judgement
Amphetamines/Stimulants Cocaine, Dexamphetamine, methamphetamine, methylphenidate, phenmetrazine, diethylpropion
Induce feelings of euphoria, exaggerated feelings of confidence, loss of appetite, nausea, vomiting, insomnia, aggression, agitation, hyper-vigilance, and impaired judgement. Acute toxic reactions include hypertension, cardiac arrhythmias, auditory and visual hallucinations, seizures
Hypnotics/Sedatives Benzodiazepines, barbiturates, buspirone, methaqualone, Rohypnol
Induce muscle relaxation, calmness, sleep. Can impair concentration, memory, and coordination. Other effects include slurred speech, drowsiness, unsteady gait
Hallucinogens Lysergic acid diethylamide (LSD), dimethyltryptamine (DMT), psilocybin, mescaline, MDMA, phencyclidine (PCP)
Produce feelings of euphoria/dysphoria, mood changes, altered perceptions, and visual illusions. Adverse effects include panic reactions, flashbacks, and mood disorders
Psychoactive Inhalants Industrial solvents, glue, aerosol, paints, lacquer thinners, gasoline, cleaning fluids, amyl nitrite, nitrous oxide
Induce belligerence, hallucinations, lethargy, psychomotor impairment, euphoria, impaired judgment, dizziness, slurred speech, tremors, muscle weakness, stupor, coma
Alcohol Beer, wine, liquor Cause impaired memory, slurred speech, slow onset vitamin deficiency, organ damage
Nicotine Tobacco Stimulates the central nervous system to increase blood pressure, breathing, heart rate, and dopamine levels. Adverse health reactions include cancer, bronchitis, emphysema, heart disease, asthma
Figure 2 Source: Adapted from Drug Policy and the Public Good, Second Edition (Babor et al, 2018); Drugs of Abuse: A DEA Resource Guide (Drug Enforcement Agency 2017); National Institute on Drug Abuse
15
Purpose of Assessment & Methodology
The Anchorage Health Department (AHD) conducted this assessment to better understand the current state of substance misuse in the Municipality of Anchorage. As well as looking at specific substance trends and affected groups, the assessment examines access to treatment, harm reduction, and recovery services in the city, identifies drivers of substance misuse and resiliencies, and assesses the levels and types of stigma that surround substance use and misuse in the community. AHD used this assessment, in conjunction with a literature review of evidence-based best practices (Appendix 2), to set policy priorities to address substance misuse in the Municipality of Anchorage (Appendix 1).
The assessment is comprised of data collected from a qualitative interview process and quantitative datasets and sources.
Key Informant Interview Process
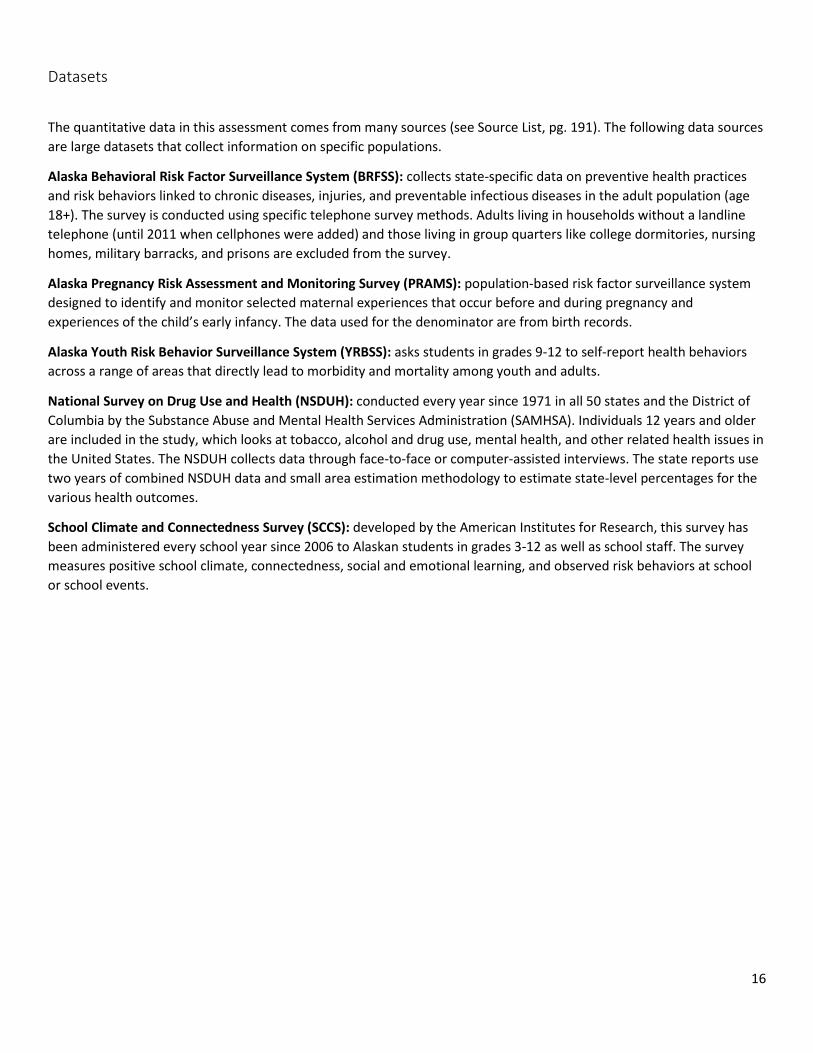
The assessment team conducted 60 key informant interviews with 72 individuals in Anchorage. The interviews were conducted in person or, if necessary, over the phone. The interviewees represent the following groups or fields:
The team endeavored to speak to as many key informants as possible, and to include representatives from every field and group affected by substance misuse in the city. That said, we do not assume that everyone whose voice should be heard, has been heard.
“Addiction is something that impacts all of our lives. It is a medical disease that is part of being human.” – Behavioral health specialist
• People in recovery from SUD • Family members of people with SUD • Local, state, and tribal government • Community councils • Social services providers • Organizations and community groups serving youth, families, homeless populations, people in
recovery, people using substances, people reentering society from incarceration • Treatment providers and medical professionals • First responders • Law enforcement • Academics • Policymakers • Businesses • School district • Youth
16
Datasets
The quantitative data in this assessment comes from many sources (see Source List, pg. 191). The following data sources are large datasets that collect information on specific populations.
Alaska Behavioral Risk Factor Surveillance System (BRFSS): collects state-specific data on preventive health practices and risk behaviors linked to chronic diseases, injuries, and preventable infectious diseases in the adult population (age 18+). The survey is conducted using specific telephone survey methods. Adults living in households without a landline telephone (until 2011 when cellphones were added) and those living in group quarters like college dormitories, nursing homes, military barracks, and prisons are excluded from the survey.
Alaska Pregnancy Risk Assessment and Monitoring Survey (PRAMS): population-based risk factor surveillance system designed to identify and monitor selected maternal experiences that occur before and during pregnancy and experiences of the child’s early infancy. The data used for the denominator are from birth records.
Alaska Youth Risk Behavior Surveillance System (YRBSS): asks students in grades 9-12 to self-report health behaviors across a range of areas that directly lead to morbidity and mortality among youth and adults.
National Survey on Drug Use and Health (NSDUH): conducted every year since 1971 in all 50 states and the District of Columbia by the Substance Abuse and Mental Health Services Administration (SAMHSA). Individuals 12 years and older are included in the study, which looks at tobacco, alcohol and drug use, mental health, and other related health issues in the United States. The NSDUH collects data through face-to-face or computer-assisted interviews. The state reports use two years of combined NSDUH data and small area estimation methodology to estimate state-level percentages for the various health outcomes.
School Climate and Connectedness Survey (SCCS): developed by the American Institutes for Research, this survey has been administered every school year since 2006 to Alaskan students in grades 3-12 as well as school staff. The survey measures positive school climate, connectedness, social and emotional learning, and observed risk behaviors at school or school events.
17
Note on Language
Throughout this assessment the words addiction and substance use disorder are used interchangeably. Substance use disorder is the medical terminology that has replaced words like addict and dependence as research on substance use indicates that substance use disorder is a medical condition rather than a moral or social choice.
In addition, the word misuse is used instead of abuse, in line with evidence-based best practice. Recent research suggests that the word abuse assigns blame and stigma to individuals with substance use disorder, which can result in worse health and treatment outcomes.7 Therefore, “substance misuse” is used rather than “substance abuse” throughout this assessment.
Finally, person-first language is used throughout the assessment. When it comes to substance use terminology, person-first language means shifting from words like addict, abuser, and user to person who uses drugs and person with a substance use disorder.
18
Substance Use Disorder
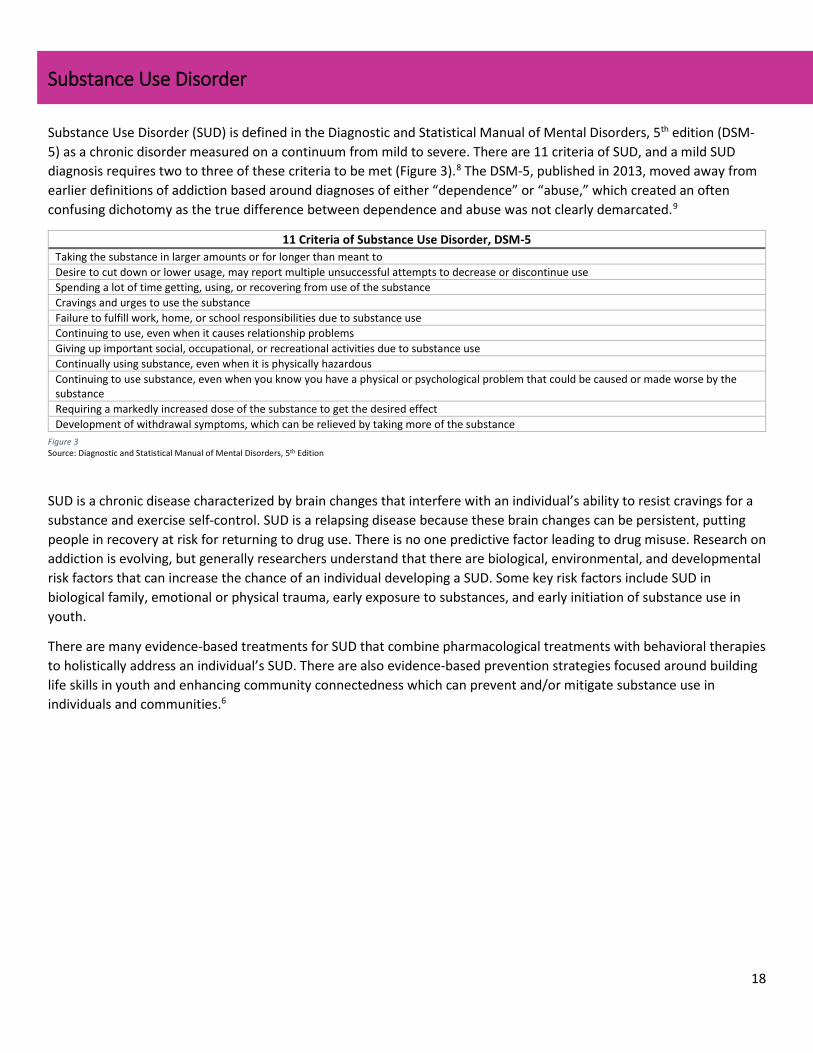
Substance Use Disorder (SUD) is defined in the Diagnostic and Statistical Manual of Mental Disorders, 5th edition (DSM-5) as a chronic disorder measured on a continuum from mild to severe. There are 11 criteria of SUD, and a mild SUD diagnosis requires two to three of these criteria to be met (Figure 3).8 The DSM-5, published in 2013, moved away from earlier definitions of addiction based around diagnoses of either “dependence” or “abuse,” which created an often confusing dichotomy as the true difference between dependence and abuse was not clearly demarcated.9
11 Criteria of Substance Use Disorder, DSM-5 Taking the substance in larger amounts or for longer than meant to Desire to cut down or lower usage, may report multiple unsuccessful attempts to decrease or discontinue use Spending a lot of time getting, using, or recovering from use of the substance Cravings and urges to use the substance Failure to fulfill work, home, or school responsibilities due to substance use Continuing to use, even when it causes relationship problems Giving up important social, occupational, or recreational activities due to substance use Continually using substance, even when it is physically hazardous Continuing to use substance, even when you know you have a physical or psychological problem that could be caused or made worse by the substance Requiring a markedly increased dose of the substance to get the desired effect Development of withdrawal symptoms, which can be relieved by taking more of the substance
SUD is a chronic disease characterized by brain changes that interfere with an individual’s ability to resist cravings for a substance and exercise self-control. SUD is a relapsing disease because these brain changes can be persistent, putting people in recovery at risk for returning to drug use. There is no one predictive factor leading to drug misuse. Research on addiction is evolving, but generally researchers understand that there are biological, environmental, and developmental risk factors that can increase the chance of an individual developing a SUD. Some key risk factors include SUD in biological family, emotional or physical trauma, early exposure to substances, and early initiation of substance use in youth.
There are many evidence-based treatments for SUD that combine pharmacological treatments with behavioral therapies to holistically address an individual’s SUD. There are also evidence-based prevention strategies focused around building life skills in youth and enhancing community connectedness which can prevent and/or mitigate substance use in individuals and communities.6
Figure 3 Source: Diagnostic and Statistical Manual of Mental Disorders, 5th Edition
19
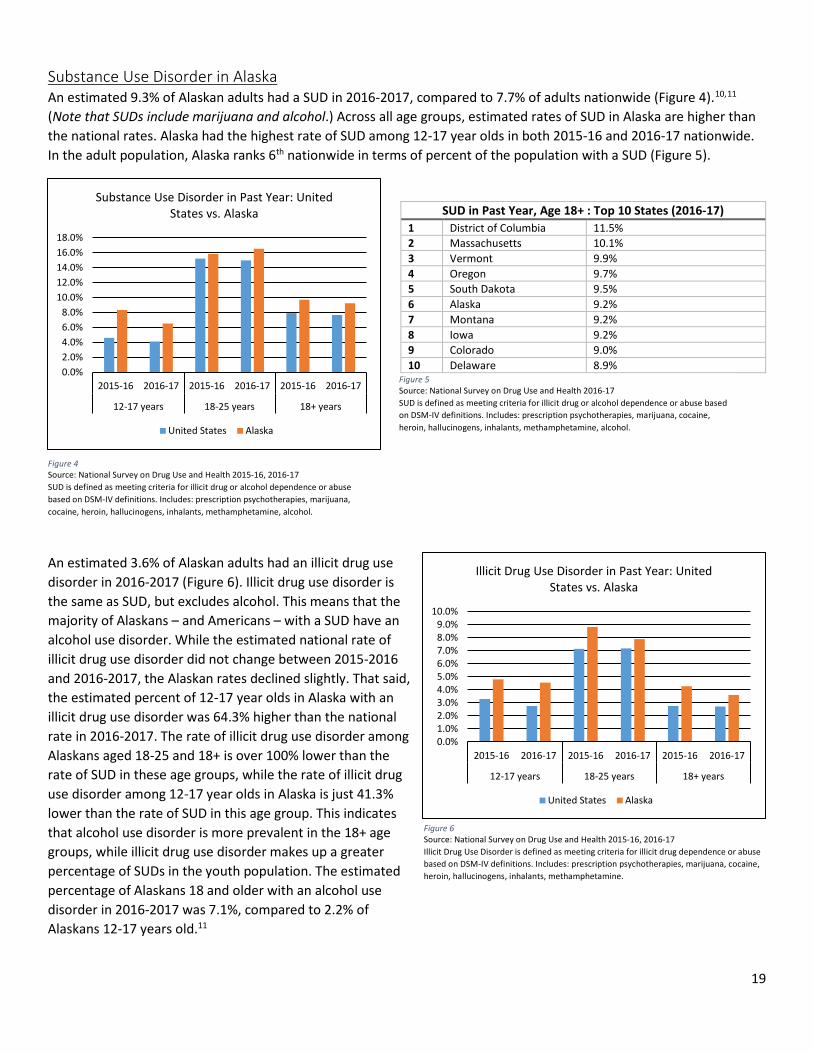
Substance Use Disorder in Alaska An estimated 9.3% of Alaskan adults had a SUD in 2016-2017, compared to 7.7% of adults nationwide (Figure 4).10,11 (Note that SUDs include marijuana and alcohol.) Across all age groups, estimated rates of SUD in Alaska are higher than the national rates. Alaska had the highest rate of SUD among 12-17 year olds in both 2015-16 and 2016-17 nationwide. In the adult population, Alaska ranks 6th nationwide in terms of percent of the population with a SUD (Figure 5).
An estimated 3.6% of Alaskan adults had an illicit drug use disorder in 2016-2017 (Figure 6). Illicit drug use disorder is the same as SUD, but excludes alcohol. This means that the majority of Alaskans – and Americans – with a SUD have an alcohol use disorder. While the estimated national rate of illicit drug use disorder did not change between 2015-2016 and 2016-2017, the Alaskan rates declined slightly. That said, the estimated percent of 12-17 year olds in Alaska with an illicit drug use disorder was 64.3% higher than the national rate in 2016-2017. The rate of illicit drug use disorder among Alaskans aged 18-25 and 18+ is over 100% lower than the rate of SUD in these age groups, while the rate of illicit drug use disorder among 12-17 year olds in Alaska is just 41.3% lower than the rate of SUD in this age group. This indicates that alcohol use disorder is more prevalent in the 18+ age groups, while illicit drug use disorder makes up a greater percentage of SUDs in the youth population. The estimated percentage of Alaskans 18 and older with an alcohol use disorder in 2016-2017 was 7.1%, compared to 2.2% of Alaskans 12-17 years old.11
SUD in Past Year, Age 18+ : Top 10 States (2016-17) 1 District of Columbia 11.5% 2 Massachusetts 10.1% 3 Vermont 9.9% 4 Oregon 9.7% 5 South Dakota 9.5% 6 Alaska 9.2% 7 Montana 9.2% 8 Iowa 9.2% 9 Colorado 9.0% 10 Delaware 8.9%
Figure 4 Source: National Survey on Drug Use and Health 2015-16, 2016-17 SUD is defined as meeting criteria for illicit drug or alcohol dependence or abuse based on DSM-IV definitions. Includes: prescription psychotherapies, marijuana, cocaine, heroin, hallucinogens, inhalants, methamphetamine, alcohol.
Figure 5 Source: National Survey on Drug Use and Health 2016-17 SUD is defined as meeting criteria for illicit drug or alcohol dependence or abuse based on DSM-IV definitions. Includes: prescription psychotherapies, marijuana, cocaine, heroin, hallucinogens, inhalants, methamphetamine, alcohol.
Figure 6 Source: National Survey on Drug Use and Health 2015-16, 2016-17 Illicit Drug Use Disorder is defined as meeting criteria for illicit drug dependence or abuse based on DSM-IV definitions. Includes: prescription psychotherapies, marijuana, cocaine, heroin, hallucinogens, inhalants, methamphetamine.
0.0%1.0%2.0%3.0%4.0%5.0%6.0%7.0%8.0%9.0%
10.0%
2015-16 2016-17 2015-16 2016-17 2015-16 2016-17
12-17 years 18-25 years 18+ years
Illicit Drug Use Disorder in Past Year: United States vs. Alaska
United States Alaska
0.0%2.0%4.0%6.0%8.0%
10.0%12.0%14.0%16.0%18.0%
2015-16 2016-17 2015-16 2016-17 2015-16 2016-17
12-17 years 18-25 years 18+ years
Substance Use Disorder in Past Year: United States vs. Alaska
United States Alaska
20
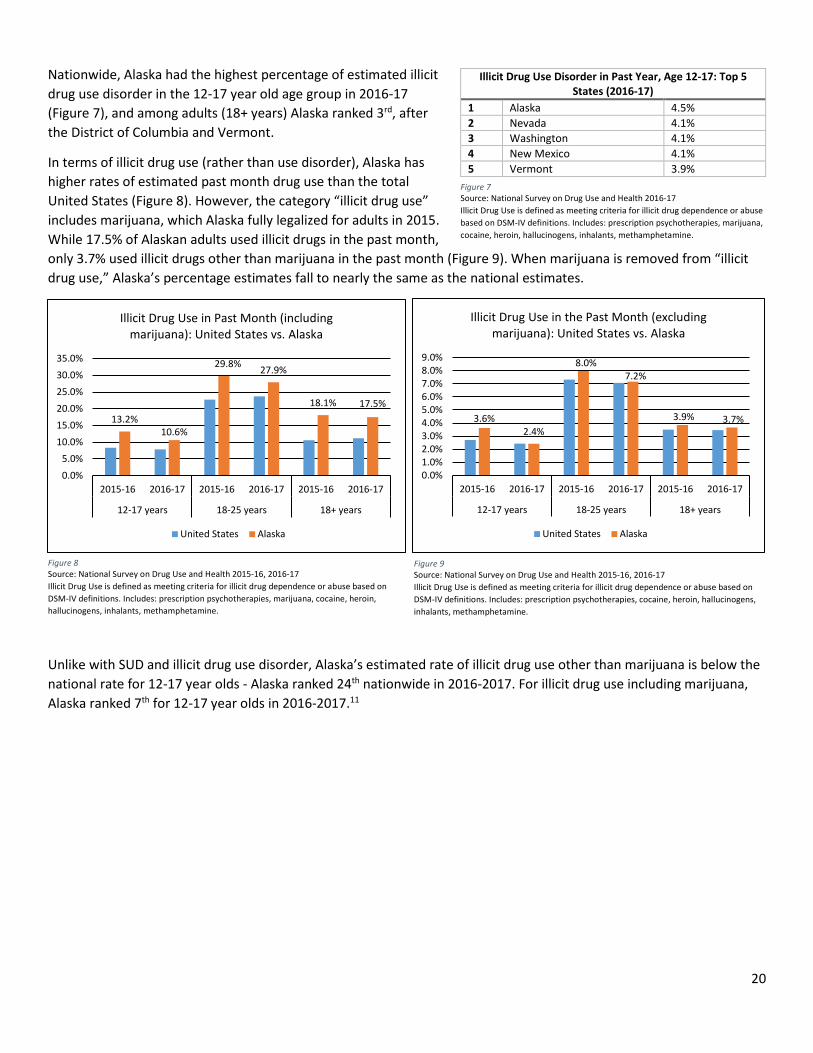
Nationwide, Alaska had the highest percentage of estimated illicit drug use disorder in the 12-17 year old age group in 2016-17 (Figure 7), and among adults (18+ years) Alaska ranked 3rd, after the District of Columbia and Vermont.
In terms of illicit drug use (rather than use disorder), Alaska has higher rates of estimated past month drug use than the total United States (Figure 8). However, the category “illicit drug use” includes marijuana, which Alaska fully legalized for adults in 2015. While 17.5% of Alaskan adults used illicit drugs in the past month, only 3.7% used illicit drugs other than marijuana in the past month (Figure 9). When marijuana is removed from “illicit drug use,” Alaska’s percentage estimates fall to nearly the same as the national estimates.
Unlike with SUD and illicit drug use disorder, Alaska’s estimated rate of illicit drug use other than marijuana is below the national rate for 12-17 year olds - Alaska ranked 24th nationwide in 2016-2017. For illicit drug use including marijuana, Alaska ranked 7th for 12-17 year olds in 2016-2017.11
Illicit Drug Use Disorder in Past Year, Age 12-17: Top 5 States (2016-17)
1 Alaska 4.5% 2 Nevada 4.1% 3 Washington 4.1% 4 New Mexico 4.1% 5 Vermont 3.9%
Figure 7 Source: National Survey on Drug Use and Health 2016-17 Illicit Drug Use is defined as meeting criteria for illicit drug dependence or abuse based on DSM-IV definitions. Includes: prescription psychotherapies, marijuana, cocaine, heroin, hallucinogens, inhalants, methamphetamine.
Figure 8 Source: National Survey on Drug Use and Health 2015-16, 2016-17 Illicit Drug Use is defined as meeting criteria for illicit drug dependence or abuse based on DSM-IV definitions. Includes: prescription psychotherapies, marijuana, cocaine, heroin, hallucinogens, inhalants, methamphetamine.
Figure 9 Source: National Survey on Drug Use and Health 2015-16, 2016-17 Illicit Drug Use is defined as meeting criteria for illicit drug dependence or abuse based on DSM-IV definitions. Includes: prescription psychotherapies, cocaine, heroin, hallucinogens, inhalants, methamphetamine.
3.6%2.4%
8.0%7.2%
3.9% 3.7%
0.0%1.0%2.0%3.0%4.0%5.0%6.0%7.0%8.0%9.0%
2015-16 2016-17 2015-16 2016-17 2015-16 2016-17
12-17 years 18-25 years 18+ years
Illicit Drug Use in the Past Month (excluding marijuana): United States vs. Alaska
United States Alaska
13.2%10.6%
29.8% 27.9%
18.1% 17.5%
0.0%5.0%
10.0%15.0%20.0%25.0%30.0%35.0%
2015-16 2016-17 2015-16 2016-17 2015-16 2016-17
12-17 years 18-25 years 18+ years
Illicit Drug Use in Past Month (including marijuana): United States vs. Alaska
United States Alaska
21
Overview: Substance Misuse in Anchorage
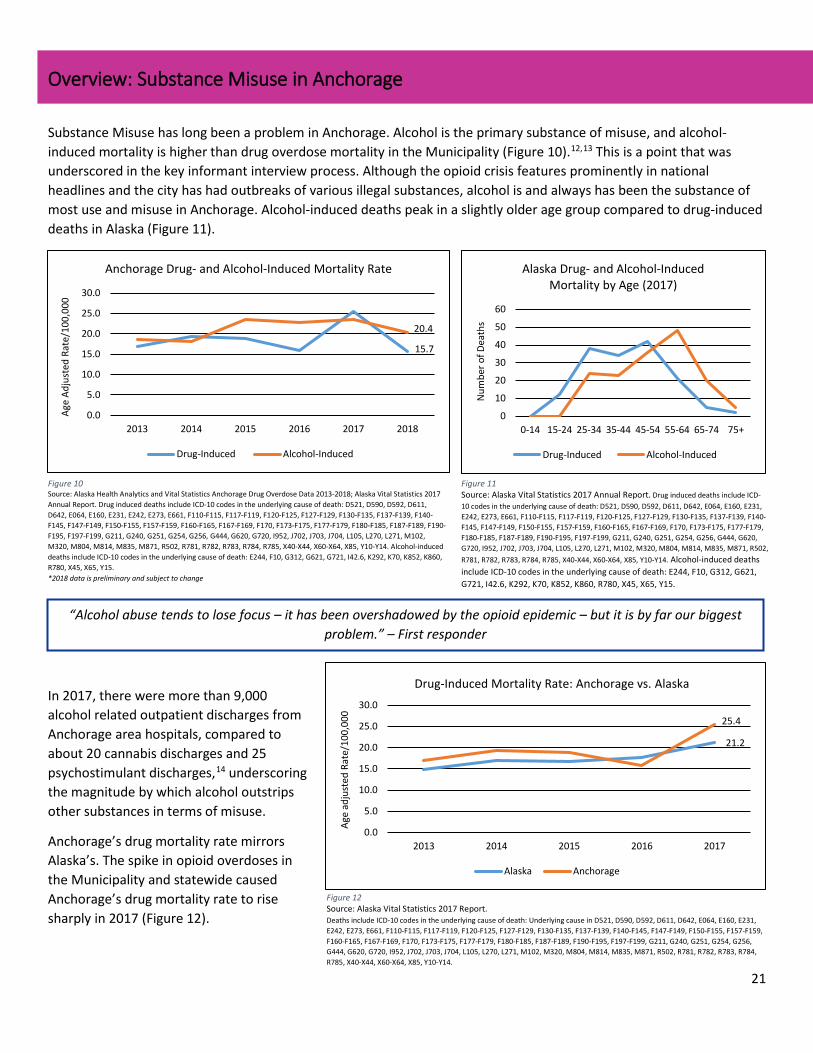
Substance Misuse has long been a problem in Anchorage. Alcohol is the primary substance of misuse, and alcohol-induced mortality is higher than drug overdose mortality in the Municipality (Figure 10).12,13 This is a point that was underscored in the key informant interview process. Although the opioid crisis features prominently in national headlines and the city has had outbreaks of various illegal substances, alcohol is and always has been the substance of most use and misuse in Anchorage. Alcohol-induced deaths peak in a slightly older age group compared to drug-induced deaths in Alaska (Figure 11).
In 2017, there were more than 9,000 alcohol related outpatient discharges from Anchorage area hospitals, compared to about 20 cannabis discharges and 25 psychostimulant discharges,14 underscoring the magnitude by which alcohol outstrips other substances in terms of misuse.
Anchorage’s drug mortality rate mirrors Alaska’s. The spike in opioid overdoses in the Municipality and statewide caused Anchorage’s drug mortality rate to rise sharply in 2017 (Figure 12).
15.7
20.4
0.0
5.0
10.0
15.0
20.0
25.0
30.0
2013 2014 2015 2016 2017 2018
Age
Adju
sted
Rat
e/10
0,00
0
Anchorage Drug- and Alcohol-Induced Mortality Rate
Drug-Induced Alcohol-Induced
Figure 10 Source: Alaska Health Analytics and Vital Statistics Anchorage Drug Overdose Data 2013-2018; Alaska Vital Statistics 2017 Annual Report. Drug induced deaths include ICD-10 codes in the underlying cause of death: D521, D590, D592, D611, D642, E064, E160, E231, E242, E273, E661, F110-F115, F117-F119, F120-F125, F127-F129, F130-F135, F137-F139, F140-F145, F147-F149, F150-F155, F157-F159, F160-F165, F167-F169, F170, F173-F175, F177-F179, F180-F185, F187-F189, F190-F195, F197-F199, G211, G240, G251, G254, G256, G444, G620, G720, I952, J702, J703, J704, L105, L270, L271, M102, M320, M804, M814, M835, M871, R502, R781, R782, R783, R784, R785, X40-X44, X60-X64, X85, Y10-Y14. Alcohol-induced deaths include ICD-10 codes in the underlying cause of death: E244, F10, G312, G621, G721, I42.6, K292, K70, K852, K860, R780, X45, X65, Y15. *2018 data is preliminary and subject to change
21.2
25.4
0.0
5.0
10.0
15.0
20.0
25.0
30.0
2013 2014 2015 2016 2017
Age
adju
sted
Rat
e/10
0,00
0
Drug-Induced Mortality Rate: Anchorage vs. Alaska
Alaska Anchorage
Figure 12 Source: Alaska Vital Statistics 2017 Report. Deaths include ICD-10 codes in the underlying cause of death: Underlying cause in D521, D590, D592, D611, D642, E064, E160, E231, E242, E273, E661, F110-F115, F117-F119, F120-F125, F127-F129, F130-F135, F137-F139, F140-F145, F147-F149, F150-F155, F157-F159, F160-F165, F167-F169, F170, F173-F175, F177-F179, F180-F185, F187-F189, F190-F195, F197-F199, G211, G240, G251, G254, G256, G444, G620, G720, I952, J702, J703, J704, L105, L270, L271, M102, M320, M804, M814, M835, M871, R502, R781, R782, R783, R784, R785, X40-X44, X60-X64, X85, Y10-Y14.
“Alcohol abuse tends to lose focus – it has been overshadowed by the opioid epidemic – but it is by far our biggest problem.” – First responder
0
10
20
30
40
50
60
0-14 15-24 25-34 35-44 45-54 55-64 65-74 75+
Num
ber o
f Dea
ths
Alaska Drug- and Alcohol-Induced Mortality by Age (2017)
Drug-Induced Alcohol-Induced
Figure 11 Source: Alaska Vital Statistics 2017 Annual Report. Drug induced deaths include ICD-10 codes in the underlying cause of death: D521, D590, D592, D611, D642, E064, E160, E231, E242, E273, E661, F110-F115, F117-F119, F120-F125, F127-F129, F130-F135, F137-F139, F140-F145, F147-F149, F150-F155, F157-F159, F160-F165, F167-F169, F170, F173-F175, F177-F179, F180-F185, F187-F189, F190-F195, F197-F199, G211, G240, G251, G254, G256, G444, G620, G720, I952, J702, J703, J704, L105, L270, L271, M102, M320, M804, M814, M835, M871, R502, R781, R782, R783, R784, R785, X40-X44, X60-X64, X85, Y10-Y14. Alcohol-induced deaths include ICD-10 codes in the underlying cause of death: E244, F10, G312, G621, G721, I42.6, K292, K70, K852, K860, R780, X45, X65, Y15.
22
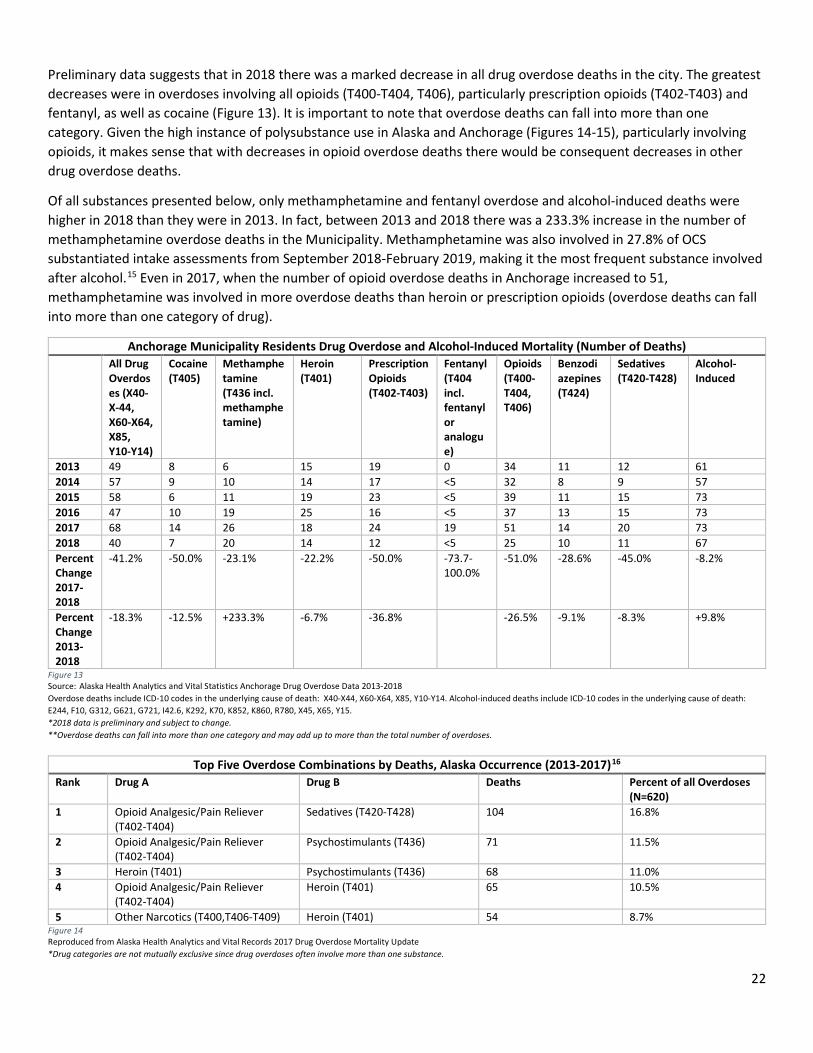
Preliminary data suggests that in 2018 there was a marked decrease in all drug overdose deaths in the city. The greatest decreases were in overdoses involving all opioids (T400-T404, T406), particularly prescription opioids (T402-T403) and fentanyl, as well as cocaine (Figure 13). It is important to note that overdose deaths can fall into more than one category. Given the high instance of polysubstance use in Alaska and Anchorage (Figures 14-15), particularly involving opioids, it makes sense that with decreases in opioid overdose deaths there would be consequent decreases in other drug overdose deaths.
Of all substances presented below, only methamphetamine and fentanyl overdose and alcohol-induced deaths were higher in 2018 than they were in 2013. In fact, between 2013 and 2018 there was a 233.3% increase in the number of methamphetamine overdose deaths in the Municipality. Methamphetamine was also involved in 27.8% of OCS substantiated intake assessments from September 2018-February 2019, making it the most frequent substance involved after alcohol.15 Even in 2017, when the number of opioid overdose deaths in Anchorage increased to 51, methamphetamine was involved in more overdose deaths than heroin or prescription opioids (overdose deaths can fall into more than one category of drug).
Anchorage Municipality Residents Drug Overdose and Alcohol-Induced Mortality (Number of Deaths) All Drug
Overdoses (X40-X-44, X60-X64, X85, Y10-Y14)
Cocaine (T405)
Methamphetamine (T436 incl. methamphetamine)
Heroin (T401)
Prescription Opioids (T402-T403)
Fentanyl (T404 incl. fentanyl or analogue)
Opioids (T400-T404, T406)
Benzodiazepines (T424)
Sedatives (T420-T428)
Alcohol-Induced
2013 49 8 6 15 19 0 34 11 12 61 2014 57 9 10 14 17 <5 32 8 9 57 2015 58 6 11 19 23 <5 39 11 15 73 2016 47 10 19 25 16 <5 37 13 15 73 2017 68 14 26 18 24 19 51 14 20 73 2018 40 7 20 14 12 <5 25 10 11 67 Percent Change 2017-2018
-41.2% -50.0% -23.1% -22.2% -50.0% -73.7-100.0%
-51.0% -28.6% -45.0% -8.2%
Percent Change 2013-2018
-18.3% -12.5% +233.3% -6.7% -36.8% -26.5% -9.1% -8.3% +9.8%
Figure 13 Source: Alaska Health Analytics and Vital Statistics Anchorage Drug Overdose Data 2013-2018 Overdose deaths include ICD-10 codes in the underlying cause of death: X40-X44, X60-X64, X85, Y10-Y14. Alcohol-induced deaths include ICD-10 codes in the underlying cause of death: E244, F10, G312, G621, G721, I42.6, K292, K70, K852, K860, R780, X45, X65, Y15. *2018 data is preliminary and subject to change. **Overdose deaths can fall into more than one category and may add up to more than the total number of overdoses.
Top Five Overdose Combinations by Deaths, Alaska Occurrence (2013-2017)16 Rank Drug A Drug B Deaths Percent of all Overdoses
(N=620) 1 Opioid Analgesic/Pain Reliever
(T402-T404) Sedatives (T420-T428) 104 16.8%
2 Opioid Analgesic/Pain Reliever (T402-T404)
Psychostimulants (T436) 71 11.5%
3 Heroin (T401) Psychostimulants (T436) 68 11.0% 4 Opioid Analgesic/Pain Reliever
(T402-T404) Heroin (T401) 65 10.5%
5 Other Narcotics (T400,T406-T409) Heroin (T401) 54 8.7% Figure 14 Reproduced from Alaska Health Analytics and Vital Records 2017 Drug Overdose Mortality Update *Drug categories are not mutually exclusive since drug overdoses often involve more than one substance.
23
Alaskan AIDS Assistance Association (Four A’s) Syringe Services Program Intake Data: 7/1/18 – 2/27/19 (n=2,680)17
Disclosed Substances Percent of Intakes Heroin Only 20.7% Methamphetamine Only 20.3% Heroin and Methamphetamine 37.7% Not Heroin or Methamphetamine 6.6% Declined 14.8%
Figure 15 Source: Alaskan AIDS Assistance Association Report, February 2019
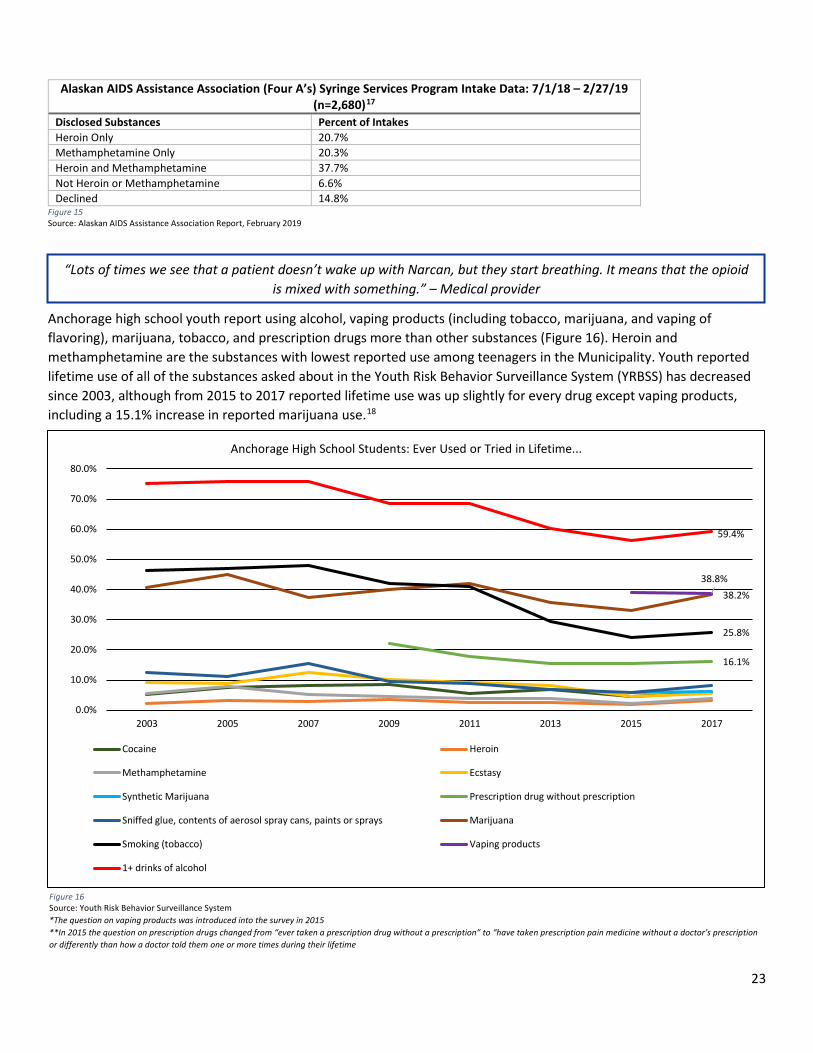
Anchorage high school youth report using alcohol, vaping products (including tobacco, marijuana, and vaping of flavoring), marijuana, tobacco, and prescription drugs more than other substances (Figure 16). Heroin and methamphetamine are the substances with lowest reported use among teenagers in the Municipality. Youth reported lifetime use of all of the substances asked about in the Youth Risk Behavior Surveillance System (YRBSS) has decreased since 2003, although from 2015 to 2017 reported lifetime use was up slightly for every drug except vaping products, including a 15.1% increase in reported marijuana use.18
16.1%
38.2%
25.8%
38.8%
59.4%
0.0%
10.0%
20.0%
30.0%
40.0%
50.0%
60.0%
70.0%
80.0%
2003 2005 2007 2009 2011 2013 2015 2017
Anchorage High School Students: Ever Used or Tried in Lifetime...
Cocaine Heroin
Methamphetamine Ecstasy
Synthetic Marijuana Prescription drug without prescription
Sniffed glue, contents of aerosol spray cans, paints or sprays Marijuana
Smoking (tobacco) Vaping products
1+ drinks of alcohol
Figure 16 Source: Youth Risk Behavior Surveillance System *The question on vaping products was introduced into the survey in 2015 **In 2015 the question on prescription drugs changed from “ever taken a prescription drug without a prescription” to “have taken prescription pain medicine without a doctor’s prescription or differently than how a doctor told them one or more times during their lifetime
“Lots of times we see that a patient doesn’t wake up with Narcan, but they start breathing. It means that the opioid is mixed with something.” – Medical provider
24
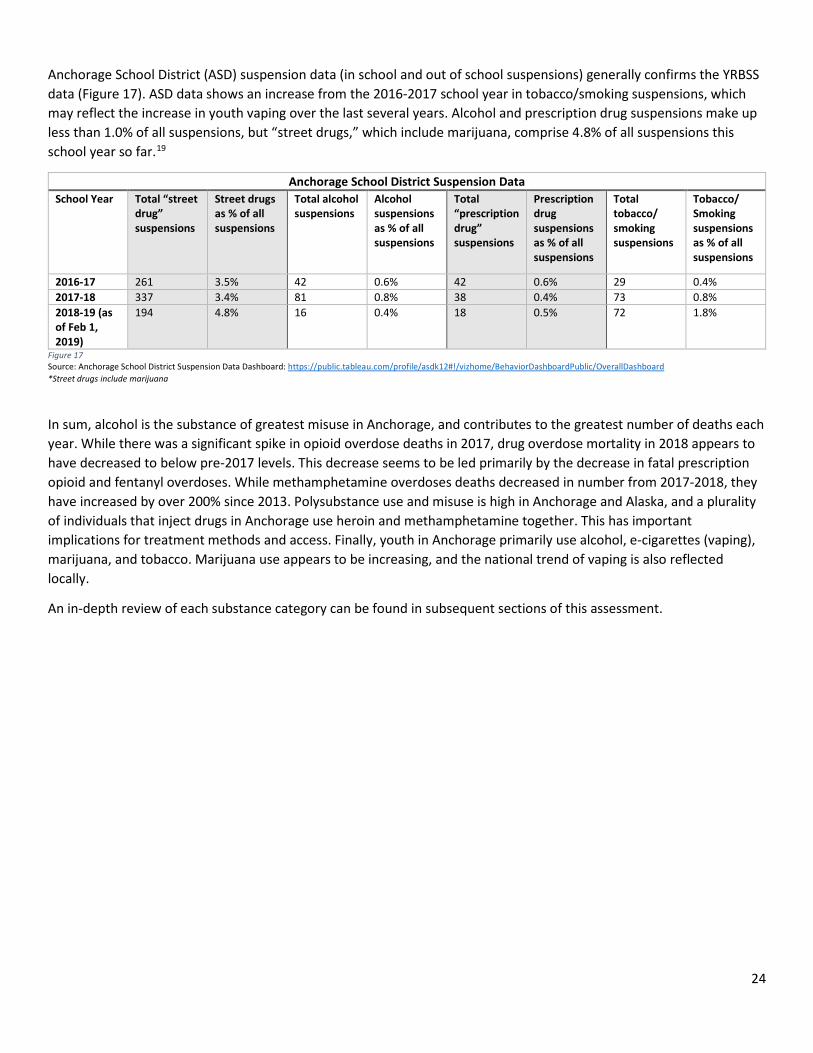
Anchorage School District (ASD) suspension data (in school and out of school suspensions) generally confirms the YRBSS data (Figure 17). ASD data shows an increase from the 2016-2017 school year in tobacco/smoking suspensions, which may reflect the increase in youth vaping over the last several years. Alcohol and prescription drug suspensions make up less than 1.0% of all suspensions, but “street drugs,” which include marijuana, comprise 4.8% of all suspensions this school year so far.19
Anchorage School District Suspension Data School Year Total “street
drug” suspensions
Street drugs as % of all suspensions
Total alcohol suspensions
Alcohol suspensions as % of all suspensions
Total “prescription drug” suspensions
Prescription drug suspensions as % of all suspensions
Total tobacco/ smoking suspensions
Tobacco/ Smoking suspensions as % of all suspensions
2016-17 261 3.5% 42 0.6% 42 0.6% 29 0.4% 2017-18 337 3.4% 81 0.8% 38 0.4% 73 0.8% 2018-19 (as of Feb 1, 2019)
194 4.8% 16 0.4% 18 0.5% 72 1.8%
Figure 17 Source: Anchorage School District Suspension Data Dashboard: https://public.tableau.com/profile/asdk12#!/vizhome/BehaviorDashboardPublic/OverallDashboard *Street drugs include marijuana
In sum, alcohol is the substance of greatest misuse in Anchorage, and contributes to the greatest number of deaths each year. While there was a significant spike in opioid overdose deaths in 2017, drug overdose mortality in 2018 appears to have decreased to below pre-2017 levels. This decrease seems to be led primarily by the decrease in fatal prescription opioid and fentanyl overdoses. While methamphetamine overdoses deaths decreased in number from 2017-2018, they have increased by over 200% since 2013. Polysubstance use and misuse is high in Anchorage and Alaska, and a plurality of individuals that inject drugs in Anchorage use heroin and methamphetamine together. This has important implications for treatment methods and access. Finally, youth in Anchorage primarily use alcohol, e-cigarettes (vaping), marijuana, and tobacco. Marijuana use appears to be increasing, and the national trend of vaping is also reflected locally.
An in-depth review of each substance category can be found in subsequent sections of this assessment.
25
Key Findings
Effects on the Community
Findings in this section come from the key informant interview process.
The impact of substance misuse on the Anchorage community is difficult to quantify in numbers or encapsulate in a paragraph. What is clear is that substance use, misuse, and addiction have long been a problem in the city, and everyone is impacted. For example, the Anchorage Department of Health and Environmental Protection 1980 Annual Report discusses at length the alcohol and behavioral health problems in the community. While the “opioid epidemic” may be the most recent drug crisis, interviewees stressed that it should not overshadow the fact that addiction has plagued Anchorage for decades. In particular, substances like alcohol and methamphetamine have been an ever-present issue in the community.
When discussing specific effects of substance misuse on the Municipality, interviewees most frequently discussed the impact of substance misuse on crime and homelessness. They expressed that the most common perception in the community at large is that substance misuse is affecting property crime and theft. There is a perception as well that substance misuse has been driving violent crime, assault, and domestic violence. The link between substance misuse and crime, and frustration around increased property crime, lead some people to push for more punitive approaches to substance use in the community. Interviewees expressed that some community members are angry and would like to see more people that misuse substances put in jail. The community also perceives that substance misuse is affecting homelessness in the city, although the relationship between substance use and homelessness is not clearly defined. The community, however, sees homelessness as a visual representation of addiction in the city.
Substance misuse also heavily impacts first responders and hospital emergency departments. Interviewees emphasized that recent spikes in Spice and heroin use have stressed the Municipality’s first responders, and that co-occurring mental health issues greatly exacerbate some substance misuse crises. A lack of mental health services means that people in the midst of overlapping behavioral and substance use crises often end up in jail, on the streets, or temporarily in emergency departments, rather than receiving the wrap-around care that they need. This lack of services can also contributes to the addiction problem, as individuals unable to receive behavioral health treatment may self-medicate with substances.
Addiction also affects families in the community. The impact on children can be immense – neglect, child abuse, intergenerational trauma, and removal from the home are all possible outcomes for children with parents or caregivers suffering through addiction. Anchorage OCS noted that the number of kids coming into OCS over the last several years has increased, which can be at least partially attributed to substance misuse and the opioid crisis. Interviewees discussed that Anchorage lacks a family-centered approach to addressing substance misuse that would prioritize building family resiliency and surrounding family units with a full set of social, emotional, and physical health supports. This lack of a family-centered approach to addressing substance misuse can exacerbate intergenerational substance use and addiction.
The economic impacts of substance misuse on the Municipality cannot be overlooked. Business leaders discussed how crime, violence, and vandalism, perceived to be linked to substance misuse, are affecting local businesses across town. Some businesses have also faced challenges finding candidates that can pass drug tests, particularly for marijuana. There may be a lack of understanding that marijuana’s new legal status does not make it impossible to fail a drug test after using the substance. On the other hand, substance misuse and the opioid crisis in particular have generated increased workforce demand for addiction professionals and social workers in the city. Meeting this demand will be crucial moving
26
forward, as the lack of addiction and behavioral health services in the community is partially due to a lack of trained professionals able to provide these services.
With regards to the opioid crisis, interviewees discussed how community education around the dangers of prescription opioids has increased in the last several years and prescribing guidelines have begun to reduce the number of prescription opioids in the community. However, in some cases it appears that the pendulum has swung too far in the opposite direction and individuals with chronic pain may experience more difficulty accessing opioid pain medication, a problem that is not unique to Alaska. For example, in early 2019 the Alaska Board of Pharmacy issued a letter to pharmacists statewide urging them to fill opioid prescriptions, in response to increased patient reports of “refusals to fill.”20 Additionally, interviewees discussed the lack of education and awareness about alternative and non-narcotic pain management strategies in Anchorage. This is an important piece of the larger picture, as several alternative pain management strategies are evidence-based and can be extremely effective in managing pain, which mitigates or neutralizes the need to use opioid painkillers.
Several interviewees discussed that there seems to be an increased number of needles on the ground in public spaces across the city. This can generate fear, frustration, and anger around drug use, and is certainly both a public safety issue and a significant dent in the standard of living for many residents. While use of the syringe services program in Anchorage has increased in recent years, it is notable that the number of syringes handed out by the program is lower than the number received back. That said, the public’s concerns around needles in public spaces are real and, left unaddressed, could lead to greater frustration and stigma towards people that use drugs in the community.
Finally, interviewees discussed the shame, guilt, and stigma that exists in the community around substance misuse. Assumptions about what it looks like to have a substance use disorder often feed conversations around crime and homelessness and are based on misperceptions rather than fact. This stigma can make people afraid to seek treatment or ask for help. However, many interviewees mentioned that the opioid crisis has helped break down some of this stigma, because it has cut across every demographic and reached every population in the city. Most residents of Anchorage know someone affected by substance misuse now, and this has helped focus attention on facts and evidence-based solutions for addressing SUD and away from moral assumptions that reinforce stigma.
“The thing about addiction is that it doesn’t care what color your skin is or how much money you make.” – Policymaker
27
Drivers and Risk Factors
Findings in this section come from the key informant interview process.
If you want a drug in Anchorage, you can find it. Over and over interviewees stressed the high social availability of every type of substance in the city. Moreover, they discussed that drug dealers often target specific populations with cheap drugs tailored to that market. Whether it is synthetic marijuana in the homeless population, small containers of cheap alcohol in low-income populations, cocaine among teenagers, or any other substance, drug dealers know how to create new customers. Add to that the ready availability of prescription medications and legal marijuana, tobacco, and alcohol, and the fact that Anchorage is a national and international transit hub and the statewide population and services center, and it becomes evident that the supply of substances – legal and illegal – in Anchorage is almost overwhelmingly high.
On the demand side, there are many factors that may lead people to use or misuse substances in Anchorage. Interviewees identified trauma as the primary factor – childhood trauma, intergenerational trauma, domestic violence, suicide, historical trauma, cultural trauma, and colonization all create pain that can be overwhelming. A lack of behavioral health services, trauma informed care, and a real effort to address some of these traumas in the community can lead some people to try to dull their pain with substances (see Community Connectedness pg. 101).
Isolation, a lack of community connection, long, dark, cold winters, and a lack of hope and economic opportunity can also lead individuals to misuse substances. The high cost of living and lack of transitional and housing first housing options in Anchorage causes some people to end up homeless and mired in addiction. A strong culture of drinking, similar to that of other circumpolar north communities, can lead to a normalization of alcohol misuse. On top of that, the “Alaskan mentality” of the individualistic, frontier, risk-taking culture can exacerbate social norms around substance misuse as well as make it more difficult for individuals with problematic substance use to feel like they can ask for help.
Another important driver of substance misuse in Anchorage is seasonal labor. Labor-related injuries can result in the prescription of opioid painkillers, which can sometimes lead to opioid use disorder. Paychecks from seasonal labor typically come all at once and in large quantities, which can lead to spending on drugs and alcohol. Moreover, the boredom and isolation that can accompany the seasons when work is not available can lead some people to use and misuse substances.
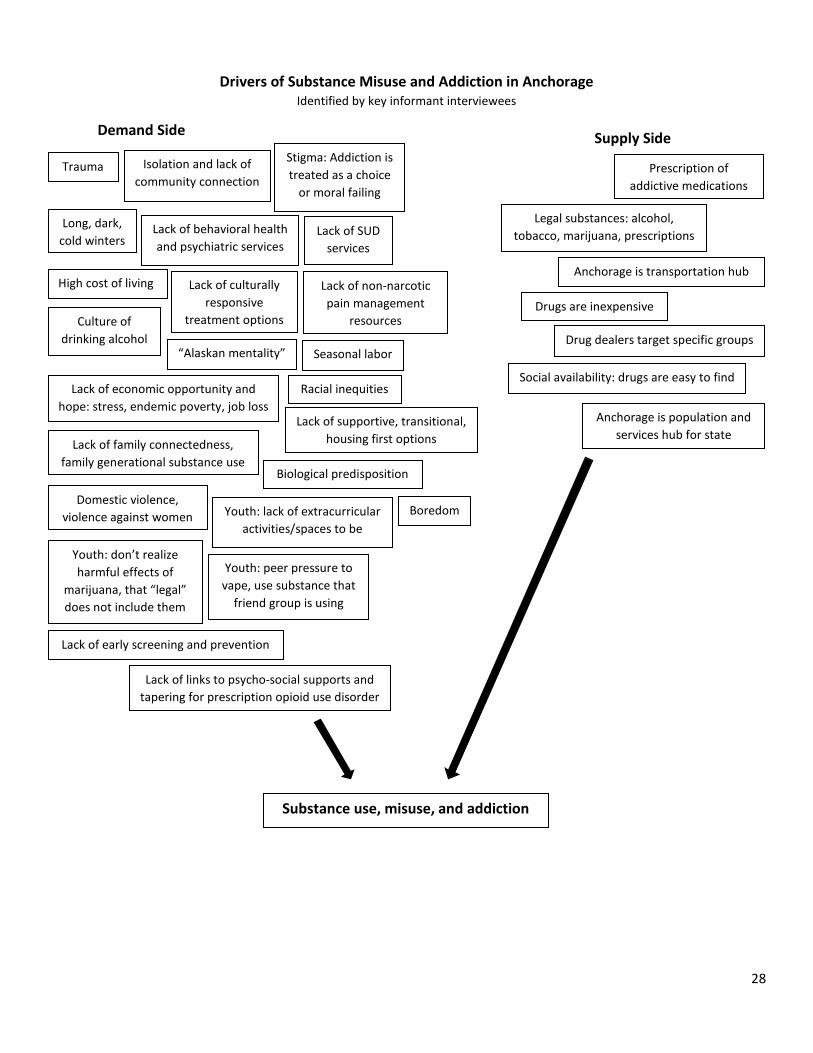
Beyond these primary drivers, interviewees named many other factors that may lead people in Anchorage to misuse substances. These factors are outlined in the diagram below.
“People acquire illegal drugs through connections. That’s why going to jail is not a deterrent.” – Person in recovery
28
Substance use, misuse, and addiction
Demand Side Supply Side
Drivers of Substance Misuse and Addiction in Anchorage Identified by key informant interviewees
Trauma Isolation and lack of community connection
Stigma: Addiction is treated as a choice
or moral failing
Long, dark, cold winters
Lack of behavioral health and psychiatric services
Lack of SUD services
High cost of living
Lack of supportive, transitional, housing first options
Culture of drinking alcohol
Domestic violence, violence against women
Lack of economic opportunity and hope: stress, endemic poverty, job loss
“Alaskan mentality” Seasonal labor
Racial inequities
Lack of family connectedness, family generational substance use
Boredom
Biological predisposition
Lack of non-narcotic pain management
resources
Youth: lack of extracurricular activities/spaces to be
Youth: don’t realize harmful effects of
marijuana, that “legal” does not include them
Youth: peer pressure to vape, use substance that
friend group is using
Lack of early screening and prevention
Lack of links to psycho-social supports and tapering for prescription opioid use disorder
Lack of culturally responsive
treatment options
Prescription of addictive medications
Legal substances: alcohol, tobacco, marijuana, prescriptions
Anchorage is transportation hub
Drugs are inexpensive
Drug dealers target specific groups
Social availability: drugs are easy to find
Anchorage is population and services hub for state
29
Strengths and Resiliencies
Findings in this section come from the key informant interview process.
The interview process examined strengths and resiliencies in the Anchorage community that help or could be leveraged to help mitigate substance misuse in the city. The prevailing narrative around addiction in Anchorage tends towards a resigned hopelessness – substance misuse is a problem, it is getting worse, and the resources do not exist to do anything meaningful about it. While there are certainly gaps in services, holes in programming, and ingrained issues of stigma, the assessment revealed real strengths in the Anchorage community that suggest that the city is better poised now than it ever has been before to meaningfully address substance misuse.
The single most-cited strength in the community was the residents of Anchorage. Interviewees expressed the sentiment that Alaskans help each other and care about their community. There is a high level of pride and involvement in the community, and some very passionate people involved in substance misuse work citywide. This, combined with the feeling that more people are starting to talk about addiction, trauma, homelessness, and stories of recovery, provide hope that a caring and engaged community with access to more information will be better able to build a more accepting, connected, resource-filled future.
Another common strength discussed by interviewees was that Anchorage is a “big little city” – it is large enough to have resources, but not so large as to be unwieldy. This means that problems are highly quantifiable and interventions can be targeted to groups with specific needs, but population-wide data can still be collected to estimate use and misuse patterns. It also means that almost everyone knows someone touched by substance misuse. These personal connections to this issue not only help to destigmatize SUD, but can drive collaboration, innovation, and creative solutions to addressing substance misuse and its many effects on the community.
Anchorage’s healthcare resources were frequently cited as strengths. With several hospitals and treatment centers, Anchorage has more substance misuse and behavioral health resources than anywhere else in the state. The city has a strong tribal health system, walk-in medication assisted treatment (MAT) for opioid use disorder, the bridge device and naltrexone (Vivitrol) are available, and providers have and receive a lot of information about substance misuse and addiction. The State’s efforts to get Screening, Brief Intervention and Referral to Treatment (SBIRT) for SUD into every emergency department in Alaska will benefit Anchorage as well.
Interviewees and community members discussed many other more specific strengths, detailed below.
Anchorage Community Strengths to Address Substance Misuse Strength Explanation Syringe services program The Four A’s syringe service program provides new, sterile
needles and other injecting drug paraphernalia and takes back used needles for disposal free of cost. As of February 2019, the program serves over 2,600 people in Anchorage.17
Libraries, parks, trails, and other public spaces These public spaces offer free, healthy, pro-social environments for positive community engagement.
Narcan distribution Since Project HOPE began in early 2017, over 5,000 free Narcan kits have been distributed in the Anchorage Municipality.21 The sharp decline in opioid overdose deaths in 2018 may be partially attributed to the wide distribution of Narcan and intense community efforts to increase access to Narcan.
Strong law enforcement Anchorage law enforcement was cited by many interviewees and community members as respectful, caring, and dedicated to addressing substance misuse in the city. The increased presence of law enforcement, the good relationship between
30
the Anchorage Police Department and the Alaska State Troopers, and the designation of Alaska as a High Intensity Drug Trafficking Area also help address substance misuse in the city.
Anchorage Fire Department Many interviewees and community members praised the Fire Department for being respectful, kind, caring first responders. Community members understand that AFD’s administration of Narcan has saved many lives in the Municipality.
Peer support services In the last year there has been increased attention paid to the evidence-based best practice of peer support. More peer support programs are starting in the Municipality and the state is working on making peer support services reimbursable by Medicaid.
Political will Interviewees cited an increased level of political will to find solutions to the problems created by substance misuse. This is best evidenced by former Governor Walker’s declaration of the opioid crisis as a public health disaster, which allowed for the creation of the State’s Office of Substance Misuse and Addiction Prevention.
Faith community Anchorage’s faith community is strong and there are many concerned and engaged members of the faith community motivated by a desire to help their fellow citizens.
Nonprofit sector Anchorage has a strong nonprofit sector, with many nonprofits working specifically in the fields of substance misuse and prevention, behavioral health, family support, trauma, homeless services, harm reduction, and healthcare delivery.
Alaska Natives leading culturally responsive treatment The Alaska Native community and tribal health systems are leading the way on culturally responsive treatment and recovery programs that connect people to their culture and deliver holistic treatment.
Medication disposal bags There has been increased access to and awareness about safe and environmentally friendly medication disposal in the city due to the distribution of free medication disposal bags.
Extracurricular activities for youth Youth discussed some good after-school programs for young people that offer spaces for positive engagement, mentorship, and learning.
Federal funding for opioids Federal funding to address the opioid crisis has allowed Narcan to become widely available in Anchorage. Additionally, it has spurred the creation of more MAT options for opioid use disorder.
Focus on behavioral health Interviewees noted a growing focus in the community on the importance of behavioral health and its role in addressing SUD.
Awareness of adverse childhood experiences (ACEs) Community members and interviewees discussed that more conversations are happening in the community around ACEs, and their effects on issues like substance misuse and homelessness.
1115 Medicaid waiver Alaska’s 1115 Medicaid waiver, approved in November 2018, will allow SUD treatment providers to bill Medicaid for more than 16 beds in residential treatment centers. This will help expand access to SUD treatment in Anchorage.
Entry level jobs There are many entry-level jobs available in Anchorage. While they often do not provide a living wage, they can be an important stepping stone, particularly for people transitioning out of incarceration or establishing a job history.
31
Non-narcotic pain management There are more discussions in the community around evidence-based non-narcotic pain management strategies.
Other organizations specifically mentioned Alaska Mental Health Trust Authority Alcoholics Anonymous and Narcotics Anonymous Anchorage Opiate Task Force Anchorage Reentry Coalition Covenant House Healthy Voices Healthy Choices Coalition Rasmuson Foundation and philanthropic donors Recover Alaska Safe Families Program Suicide Prevention Coalition The NEST Program (Neonatal Abstinence Evaluation Support & Treatment) at Alaska Regional Hospital
32
Stigma
Stigma (noun): a strong lack of respect for a person or group of people or a bad opinion of them because they have done something society does not approve of – Cambridge Dictionary
Findings in this section come from the key informant interview process.
The interview process revealed numerous, deeply ingrained stigmas in the Anchorage community around substance use and misuse. Each manifest in different yet overlapping ways, and seem to be rooted at least in part in a lack of understanding that SUD is a disease, not a choice. Interviewees expressed that the following stigmas exist and are prevalent in Anchorage.
Stigma around addiction broadly:
Moral Failing: By far the most prevalent stigma named was that the community understands addiction as a moral failing – as a choice made due to some character weakness. This stigma is tied to the assumption that a person with SUD looks a certain way; often the stereotype of an Alaska Native male experiencing chronic homelessness arises. This stigma, deeply rooted in racism, also has a flip side: that there are those who, due to race, socioeconomic class, education level, or some other trait, are immune to addiction. The perception of addiction as a moral failing rooted in a person’s inherent character traits assigns great blame and shame to individuals with SUD and fails to recognize the medical nature of addiction, the brain changes that occur when an individual has SUD, and the underlying drivers of addiction.
Criminality: The second most named stigma in the community is that of the equation of people with SUD with criminals. Interviewees expressed that there can be a feeling in the city that people who use drugs are thieves and often violent. Some interviewees discussed how this stigma may arise out of a general need for someone to blame rising crime rates on, as well as a feeling that there are no consequences for the behavior of people with SUD.
“Pull yourself up by your bootstraps:” Another key stigma in the community revolves around the idea that people who have an addiction simply lack the willpower or motivation to stop using drugs. This is encapsulated in the phrase “pull yourself up by your bootstraps,” which often serves to label people with SUD as weak or lazy for not changing their behaviors. Several interviewees discussed how this stigma in particular is often closely tied to a deeper Alaskan frontier mentality which places value on individualism, strength, and self-sufficiency. This cultural value system can reinforce the idea that a person using or misusing substances is simply not strong enough to “just stop” using. As with the stigma of moral failing, this stigma arises out of a lack of knowledge about the medical nature of addiction and its underlying drivers.
Stigma relative to substance: An interesting nuance discussed by several interviewees is that often different levels of stigma are assigned to different substances in the community. Alcohol can often have less stigma because it is not seen as a “hard drug” the way that heroin or methamphetamine are. An individual with a prescription opioid use disorder can sometimes be seen as more “worth saving” than a person with a heroin use disorder, because the former substance carries less blame, shame, and societal stigma than the latter. A large
“We have people in the ER that you would never have believed were addicted. People assume who an addict is, based on TV portrayals and stereotypes.” – Medical provider
“Addiction is a chronic relapsing brain disease. People argue that you have a choice and that it is a moral issue. Not if your brain is hijacked.” – Community health specialist
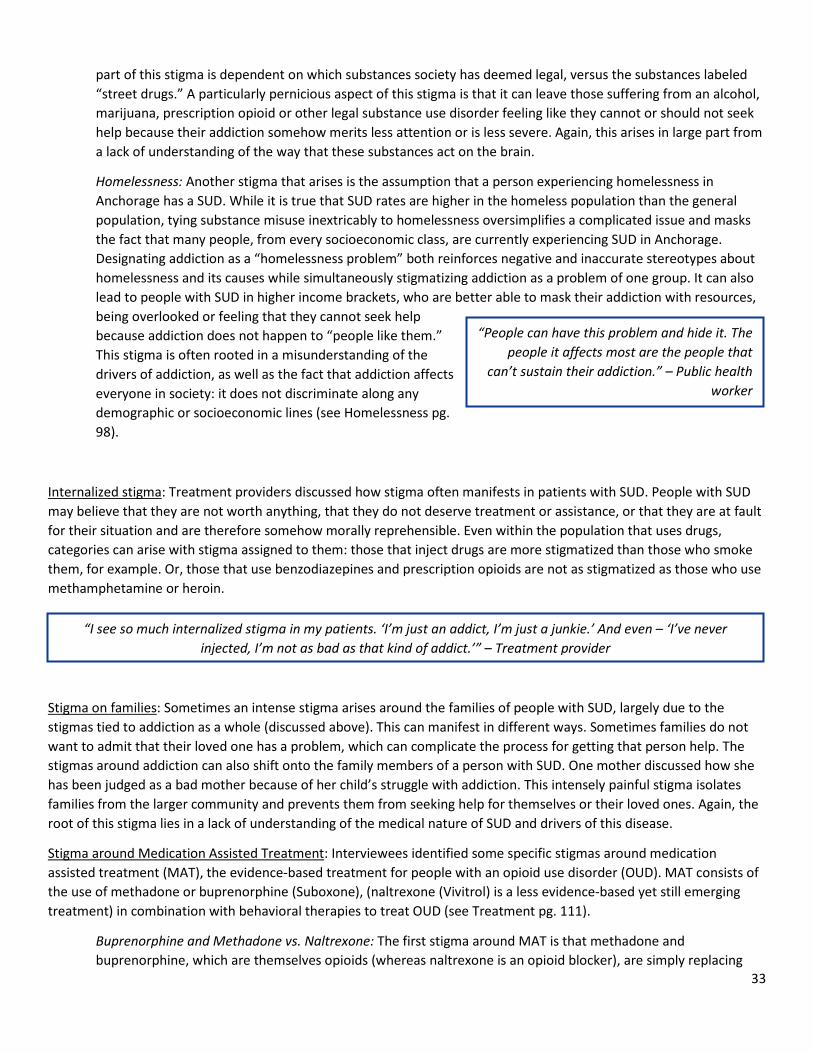
33
part of this stigma is dependent on which substances society has deemed legal, versus the substances labeled “street drugs.” A particularly pernicious aspect of this stigma is that it can leave those suffering from an alcohol, marijuana, prescription opioid or other legal substance use disorder feeling like they cannot or should not seek help because their addiction somehow merits less attention or is less severe. Again, this arises in large part from a lack of understanding of the way that these substances act on the brain.
Homelessness: Another stigma that arises is the assumption that a person experiencing homelessness in Anchorage has a SUD. While it is true that SUD rates are higher in the homeless population than the general population, tying substance misuse inextricably to homelessness oversimplifies a complicated issue and masks the fact that many people, from every socioeconomic class, are currently experiencing SUD in Anchorage. Designating addiction as a “homelessness problem” both reinforces negative and inaccurate stereotypes about homelessness and its causes while simultaneously stigmatizing addiction as a problem of one group. It can also lead to people with SUD in higher income brackets, who are better able to mask their addiction with resources, being overlooked or feeling that they cannot seek help because addiction does not happen to “people like them.” This stigma is often rooted in a misunderstanding of the drivers of addiction, as well as the fact that addiction affects everyone in society: it does not discriminate along any demographic or socioeconomic lines (see Homelessness pg. 98).
Internalized stigma: Treatment providers discussed how stigma often manifests in patients with SUD. People with SUD may believe that they are not worth anything, that they do not deserve treatment or assistance, or that they are at fault for their situation and are therefore somehow morally reprehensible. Even within the population that uses drugs, categories can arise with stigma assigned to them: those that inject drugs are more stigmatized than those who smoke them, for example. Or, those that use benzodiazepines and prescription opioids are not as stigmatized as those who use methamphetamine or heroin.
Stigma on families: Sometimes an intense stigma arises around the families of people with SUD, largely due to the stigmas tied to addiction as a whole (discussed above). This can manifest in different ways. Sometimes families do not want to admit that their loved one has a problem, which can complicate the process for getting that person help. The stigmas around addiction can also shift onto the family members of a person with SUD. One mother discussed how she has been judged as a bad mother because of her child’s struggle with addiction. This intensely painful stigma isolates families from the larger community and prevents them from seeking help for themselves or their loved ones. Again, the root of this stigma lies in a lack of understanding of the medical nature of SUD and drivers of this disease.
Stigma around Medication Assisted Treatment: Interviewees identified some specific stigmas around medication assisted treatment (MAT), the evidence-based treatment for people with an opioid use disorder (OUD). MAT consists of the use of methadone or buprenorphine (Suboxone), (naltrexone (Vivitrol) is a less evidence-based yet still emerging treatment) in combination with behavioral therapies to treat OUD (see Treatment pg. 111).
Buprenorphine and Methadone vs. Naltrexone: The first stigma around MAT is that methadone and buprenorphine, which are themselves opioids (whereas naltrexone is an opioid blocker), are simply replacing
“People can have this problem and hide it. The people it affects most are the people that
can’t sustain their addiction.” – Public health worker
“I see so much internalized stigma in my patients. ‘I’m just an addict, I’m just a junkie.’ And even – ‘I’ve never injected, I’m not as bad as that kind of addict.’” – Treatment provider
34
one addiction with another. This misperception of MAT is not unique to Anchorage: only in the last several years has the federal government come out in strong support of MAT as the gold standard for OUD treatment. Unfortunately, the stigma around methadone and buprenorphine being replacement drugs that only prolong a person’s addiction is strong in Anchorage. This also leads to the misperception that naltrexone is a better treatment choice than methadone or buprenorphine because a person on naltrexone is “clean” of all opioids. Ultimately, the bias towards abstinence-based treatment over pharmacological-based treatment is at the core of this stigma. The belief that abstinence-based treatment for OUD is superior runs deep in Anchorage and has only recently begun to change.
Methadone clinics: The second stigma that interviewees identified around MAT is the long-running, deeply-ingrained stigma that methadone clinics are dirty, ineffective treatment options that just enable people with heroin use disorders to get greater access to opioids. This stigma, in no way unique to Anchorage, can result in some damaging effects: despite the fact that outpatient methadone assisted treatment with full behavioral health wrap-around services is the standard of care for many people with OUD, the community, families, and individuals may choose to avoid methadone treatment because of the stigma around it.
Stigma around harm reduction:
Syringe Services programs: One of the most prominent stigmas identified is that regarding syringe services, or needle exchange. Many people in the community view syringe services programs as enabling addiction. The belief is that by providing free, new syringes to people who use drugs, the community feeds addiction and contributes to the number of used needles in public spaces around the city. While there is now overwhelming evidence to suggest that syringe services programs lower the instance of HIV and Hepatitis C (HCV) infection as well as serve as a contact point for individuals to receive services and learn about treatment, the stigma around this intervention is high. Interviewees discussed the frustration around the number of needles on the ground in public spaces, and how this exacerbates the stigmas that exist around syringe services programs. A strong attitude of “not in my backyard” (NIMBY) pervades discussions about syringe services programs in Anchorage. However, much of this stigma seems to stem from a lack of understanding of the medical and economic benefits of syringe services programs. Interviewees noted that when people are informed about these benefits, in particular the incredible cost savings produced by preventing HIV or HCV infection, they are more likely to support these programs. Syringe services are discussed in more detail below (pg. 92).
Narcan: Narcan (naloxone) is an opioid overdose reversal drug that is administered as a nasal spray or injection. The state, funded by a federal grant, has distributed more than 5,000 Narcan kits in Anchorage since early 2017. The interview process revealed some significant stigma towards Narcan and Narcan use in Anchorage. Three main themes arose out of discussions about stigma related to Narcan. The first is that people sometimes believe that Narcan will encourage opioid use, because it enables people to use without fear of overdose. Secondly, some community members express frustration that Narcan is distributed free of charge, while other life-saving drugs like insulin are not provided free by the state. Finally, interviewees discussed that there can be a sentiment of “just let them die,” referring to a feeling that people using drugs do not deserve to have access to an overdose reversal tool. Nevertheless, interviewees expressed that most community members seem to be in support of Narcan, if they know what it is. As one interviewee said, “I don’t know many people that actually want other people to die of overdose.”
“There’s a misconception that they will use as much heroin as possible just to go to the edge, then use Narcan to reverse the overdose. Most patients here aren’t getting high, they are using enough not to get sick.” – Treatment
provider
35
Often, the above stigmas manifest on social media. Interviewees discussed that certain social media platforms, perhaps especially Facebook and Nextdoor, can reinforce negative stereotypes about people with SUD and perpetuate the myths that underlie so much of the stigma around this issue.
Interviewees discussed several ways to lower or mitigate some of these stigmas around substance use and misuse in Anchorage. The most cited was personal stories – humanizing addiction so that the community understands that addiction is often caused by trauma, pain, and isolation rather than personal choice or weakness of character, that “just stopping” is not often possible due to the medical nature of SUD, and that treatment and recovery are possible. In particular, emphasizing success stories of people who have received treatment and are in recovery is an important way to lower stigma and begin discussions around SUD as a chronic, relapsing disease.
Interviewees also discussed that as the opioid crisis has increasingly affected the middle and upper classes, stigma in the community has begun to decline. Overall, there seems to be a growing understanding in Anchorage that addiction is a medical issue and that more needs to be done to address it community-wide. This feeling has been driven in large part by the opioid crisis, which has cut across all demographic and socioeconomic lines. Many interviewees expressed that in Anchorage, everyone knows someone affected by addiction. Slowly, this has allowed more people to share their stories of addiction and recovery.
Finally, making SUD a matter of public health rather than primarily a criminal or social issue will help to lower stigma. Providing more health-based services and education around addiction in the community will begin to shift the conversation from a moral perspective to a medical one.
“The best way to reduce stigma is to reduce the distance between the person and the thing they have
stigma towards.” – Academic
“Social media can be a place of knowledge and learning, but it can also be a source of incredibly egregious false information that can be manifested as fact… I don’t think there’s a robust enough campaign to put forth the facts
and beat back the fiction.” – Business leader
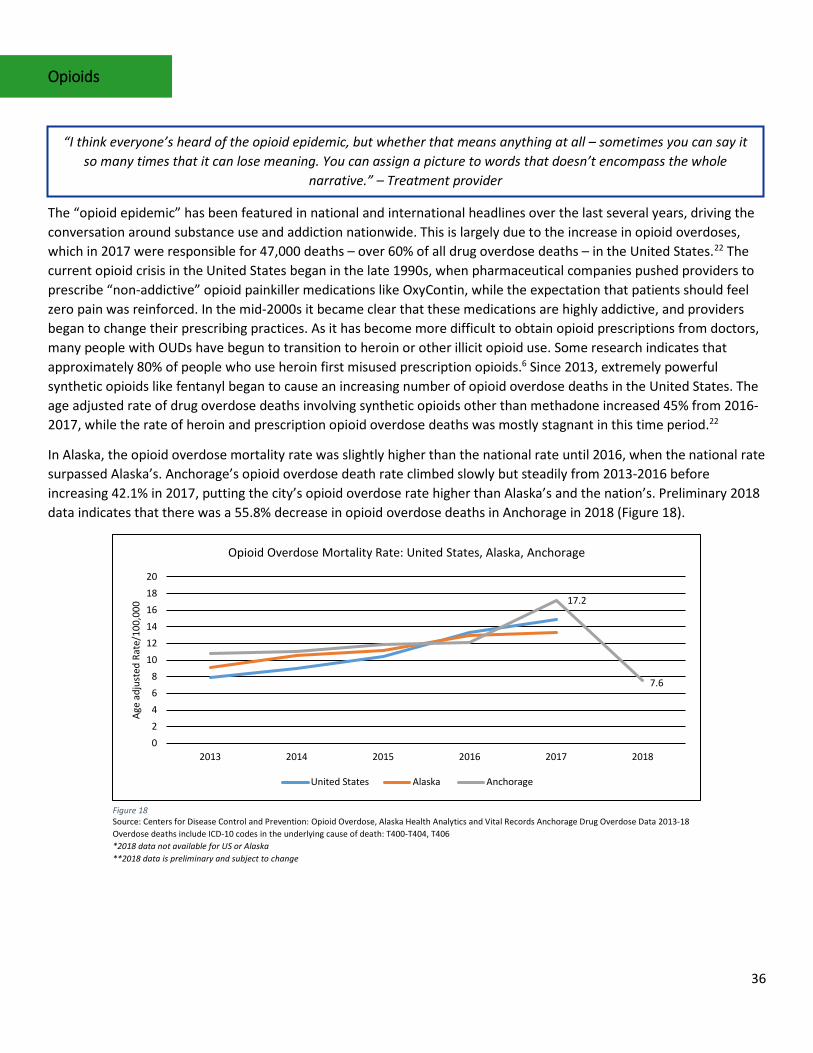
36
Opioids
The “opioid epidemic” has been featured in national and international headlines over the last several years, driving the conversation around substance use and addiction nationwide. This is largely due to the increase in opioid overdoses, which in 2017 were responsible for 47,000 deaths – over 60% of all drug overdose deaths – in the United States.22 The current opioid crisis in the United States began in the late 1990s, when pharmaceutical companies pushed providers to prescribe “non-addictive” opioid painkiller medications like OxyContin, while the expectation that patients should feel zero pain was reinforced. In the mid-2000s it became clear that these medications are highly addictive, and providers began to change their prescribing practices. As it has become more difficult to obtain opioid prescriptions from doctors, many people with OUDs have begun to transition to heroin or other illicit opioid use. Some research indicates that approximately 80% of people who use heroin first misused prescription opioids.6 Since 2013, extremely powerful synthetic opioids like fentanyl began to cause an increasing number of opioid overdose deaths in the United States. The age adjusted rate of drug overdose deaths involving synthetic opioids other than methadone increased 45% from 2016-2017, while the rate of heroin and prescription opioid overdose deaths was mostly stagnant in this time period.22
In Alaska, the opioid overdose mortality rate was slightly higher than the national rate until 2016, when the national rate surpassed Alaska’s. Anchorage’s opioid overdose death rate climbed slowly but steadily from 2013-2016 before increasing 42.1% in 2017, putting the city’s opioid overdose rate higher than Alaska’s and the nation’s. Preliminary 2018 data indicates that there was a 55.8% decrease in opioid overdose deaths in Anchorage in 2018 (Figure 18).
“I think everyone’s heard of the opioid epidemic, but whether that means anything at all – sometimes you can say it so many times that it can lose meaning. You can assign a picture to words that doesn’t encompass the whole
narrative.” – Treatment provider
Figure 18 Source: Centers for Disease Control and Prevention: Opioid Overdose, Alaska Health Analytics and Vital Records Anchorage Drug Overdose Data 2013-18 Overdose deaths include ICD-10 codes in the underlying cause of death: T400-T404, T406 *2018 data not available for US or Alaska **2018 data is preliminary and subject to change
17.2
7.6
02468
101214161820
2013 2014 2015 2016 2017 2018
Age
adju
sted
Rat
e/10
0,00
0
Opioid Overdose Mortality Rate: United States, Alaska, Anchorage
United States Alaska Anchorage
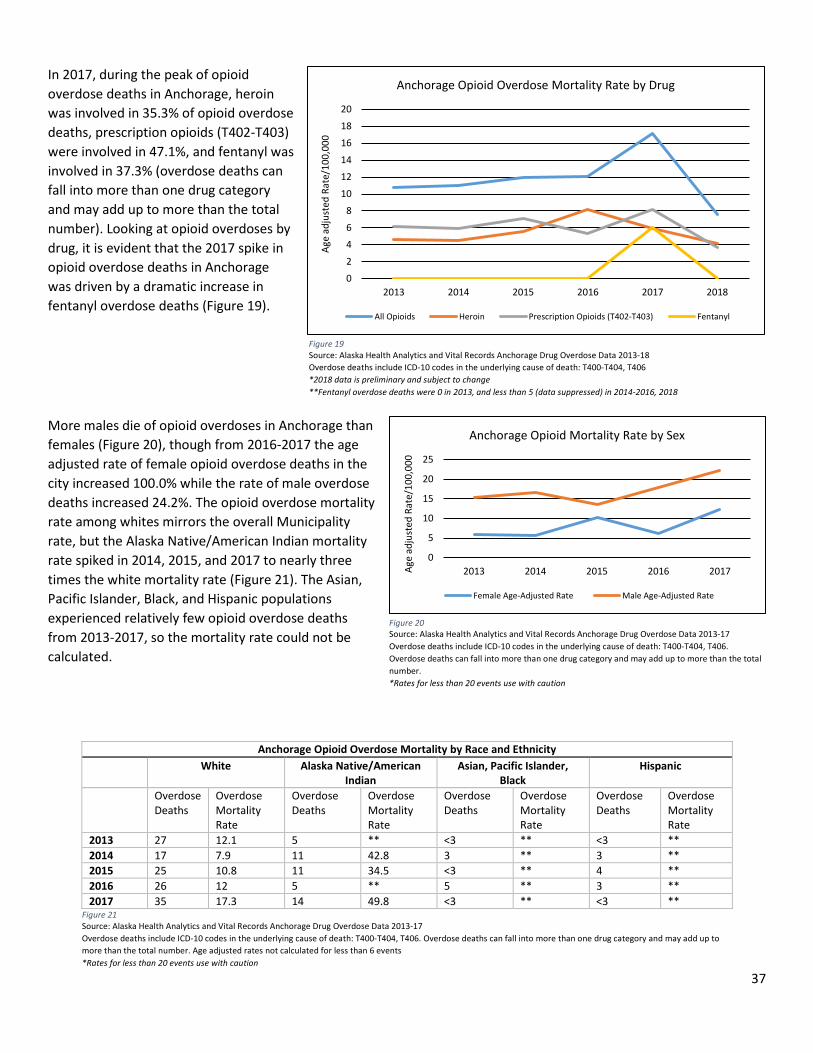
37
In 2017, during the peak of opioid overdose deaths in Anchorage, heroin was involved in 35.3% of opioid overdose deaths, prescription opioids (T402-T403) were involved in 47.1%, and fentanyl was involved in 37.3% (overdose deaths can fall into more than one drug category and may add up to more than the total number). Looking at opioid overdoses by drug, it is evident that the 2017 spike in opioid overdose deaths in Anchorage was driven by a dramatic increase in fentanyl overdose deaths (Figure 19).
More males die of opioid overdoses in Anchorage than females (Figure 20), though from 2016-2017 the age adjusted rate of female opioid overdose deaths in the city increased 100.0% while the rate of male overdose deaths increased 24.2%. The opioid overdose mortality rate among whites mirrors the overall Municipality rate, but the Alaska Native/American Indian mortality rate spiked in 2014, 2015, and 2017 to nearly three times the white mortality rate (Figure 21). The Asian, Pacific Islander, Black, and Hispanic populations experienced relatively few opioid overdose deaths from 2013-2017, so the mortality rate could not be calculated.
Anchorage Opioid Overdose Mortality by Race and Ethnicity White Alaska Native/American
Indian Asian, Pacific Islander,
Black Hispanic
Overdose Deaths
Overdose Mortality Rate
Overdose Deaths
Overdose Mortality Rate
Overdose Deaths
Overdose Mortality Rate
Overdose Deaths
Overdose Mortality Rate
2013 27 12.1 5 ** <3 ** <3 ** 2014 17 7.9 11 42.8 3 ** 3 ** 2015 25 10.8 11 34.5 <3 ** 4 ** 2016 26 12 5 ** 5 ** 3 ** 2017 35 17.3 14 49.8 <3 ** <3 **
0
5
10
15
20
25
2013 2014 2015 2016 2017Age
adju
sted
Rat
e/10
0,00
0
Anchorage Opioid Mortality Rate by Sex
Female Age-Adjusted Rate Male Age-Adjusted Rate
Figure 20 Source: Alaska Health Analytics and Vital Records Anchorage Drug Overdose Data 2013-17 Overdose deaths include ICD-10 codes in the underlying cause of death: T400-T404, T406. Overdose deaths can fall into more than one drug category and may add up to more than the total number. *Rates for less than 20 events use with caution
Figure 21 Source: Alaska Health Analytics and Vital Records Anchorage Drug Overdose Data 2013-17 Overdose deaths include ICD-10 codes in the underlying cause of death: T400-T404, T406. Overdose deaths can fall into more than one drug category and may add up to more than the total number. Age adjusted rates not calculated for less than 6 events *Rates for less than 20 events use with caution
0
2
4
6
8
10
12
14
16
18
20
2013 2014 2015 2016 2017 2018
Age
adju
sted
Rat
e/10
0,00
0
Anchorage Opioid Overdose Mortality Rate by Drug
All Opioids Heroin Prescription Opioids (T402-T403) Fentanyl
Figure 19 Source: Alaska Health Analytics and Vital Records Anchorage Drug Overdose Data 2013-18 Overdose deaths include ICD-10 codes in the underlying cause of death: T400-T404, T406 *2018 data is preliminary and subject to change **Fentanyl overdose deaths were 0 in 2013, and less than 5 (data suppressed) in 2014-2016, 2018
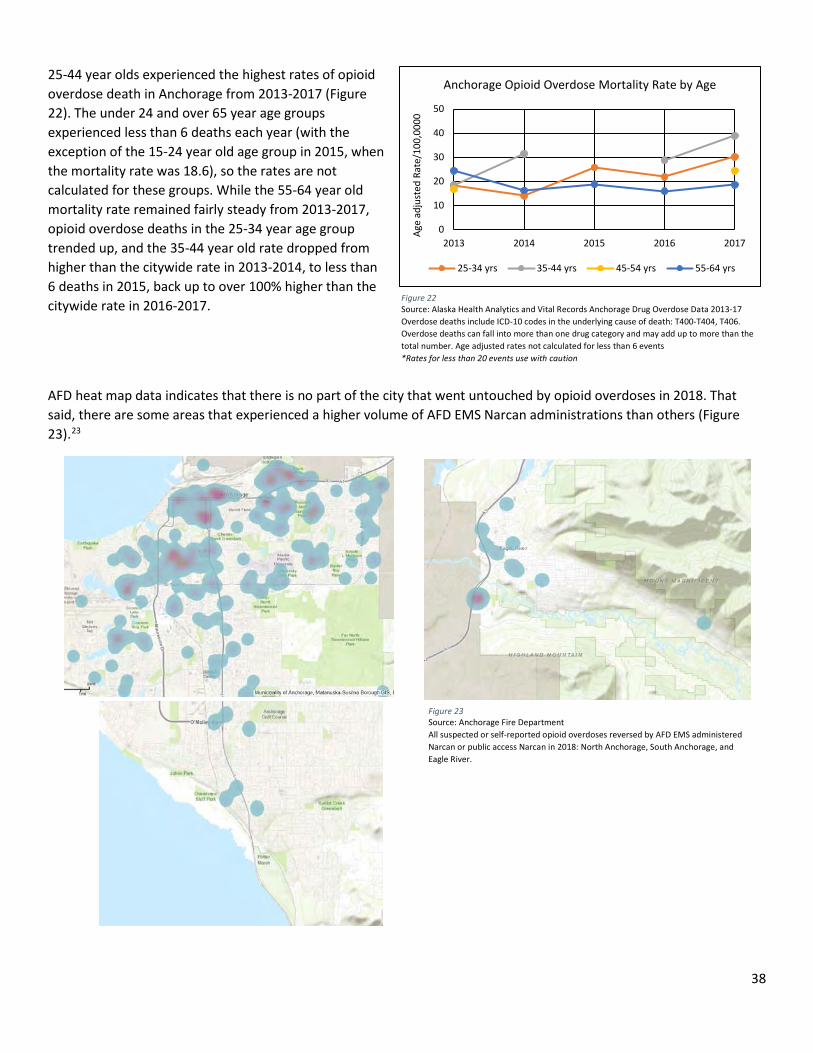
38
25-44 year olds experienced the highest rates of opioid overdose death in Anchorage from 2013-2017 (Figure 22). The under 24 and over 65 year age groups experienced less than 6 deaths each year (with the exception of the 15-24 year old age group in 2015, when the mortality rate was 18.6), so the rates are not calculated for these groups. While the 55-64 year old mortality rate remained fairly steady from 2013-2017, opioid overdose deaths in the 25-34 year age group trended up, and the 35-44 year old rate dropped from higher than the citywide rate in 2013-2014, to less than 6 deaths in 2015, back up to over 100% higher than the citywide rate in 2016-2017.
AFD heat map data indicates that there is no part of the city that went untouched by opioid overdoses in 2018. That said, there are some areas that experienced a higher volume of AFD EMS Narcan administrations than others (Figure 23).23
Figure 23 Source: Anchorage Fire Department All suspected or self-reported opioid overdoses reversed by AFD EMS administered Narcan or public access Narcan in 2018: North Anchorage, South Anchorage, and Eagle River.
0
10
20
30
40
50
2013 2014 2015 2016 2017
Age
adju
sted
Rat
e/10
0,00
00
Anchorage Opioid Overdose Mortality Rate by Age
25-34 yrs 35-44 yrs 45-54 yrs 55-64 yrs
Figure 22 Source: Alaska Health Analytics and Vital Records Anchorage Drug Overdose Data 2013-17 Overdose deaths include ICD-10 codes in the underlying cause of death: T400-T404, T406. Overdose deaths can fall into more than one drug category and may add up to more than the total number. Age adjusted rates not calculated for less than 6 events *Rates for less than 20 events use with caution
39
Importantly, these maps show only opioid overdoses where AFD EMS responded at the scene. It is not clear how many additional overdoses occur where first responders are not called, particularly given the increasing amount of publicly available Narcan in the community (see Heroin pg. 39 and Prescription Opioids pg. 48 below). Therefore, the data presented here are one piece of a much larger picture.
One key theme expressed throughout the interview process is that the opioid crisis has brought attention to larger addiction issues in Anchorage. Whether this is due to the magnitude of the opioid problem, the speed with which opioid overdose can occur (compared to other substances), the weight of national news and policy coverage, or the way in which opioids appear to have affected all socioeconomic groups nationwide is not entirely clear, although it seems to be a combination of all of these factors. In Anchorage, interviewees discussed that in the last few years more people have started to talk about addiction, there is increasing awareness not only of the opioid crisis but of drug and alcohol misuse in general, recovery events have been better attended, and more individuals are coming out with their personal stories of addiction. This has cumulated in a feeling that the Anchorage community is better positioned now than ever before to really address addiction in a meaningful way.
However, interviewees indicated that there may be populations within Anchorage that are less informed about the opioid crisis and available OUD services. In particular, lower income populations and/or those that have less access to resources like the internet or television, educational material, and healthcare services may know less than the average citizen.
Despite a feeling of increased knowledge and willingness to address addiction in the community, there still seems to be some confusion about the opioid crisis. In Anchorage in particular the popular narrative around addiction is often caught up in concerns about crime and homelessness. Many interviewees expressed that Anchorage residents know about the opioid crisis because of crime and homelessness, which are two very visual issues that sometimes get equated with substance misuse broadly, so that the picture of addiction in Anchorage becomes assigned to a stereotype rooted in frustration, fear, and exhaustion rather than reality.
Heroin Heroin is an opioid made from morphine. It can be ingested via injection, sniffing, snorting, or smoking, and can be in the form of a white powder or a black sticky substance commonly referred to as black tar heroin. Heroin use increases dopamine levels in the brain, leading to feelings of euphoria as well as dry mouth, heavy feelings in the arms and legs, nausea, itching, clouded mental functioning, and a state of switching between consciousness and unconsciousness. The long-term effects of regular heroin use include but are not limited to insomnia, abscesses, liver and kidney disease, lung complications, sexual dysfunction in men, irregular menstrual cycles in women, and mental disorders like depression and antisocial personality disorder. Sharing injection drug paraphernalia can lead to HIV and HCV infection. Heroin is highly addictive and withdrawal symptoms include severe muscle and bone pain, diarrhea and vomiting, cold flashes, uncontrollable leg movements, severe cravings, sleep problems, and restlessness. It is possible to overdose on heroin. Heroin overdose occurs when an individual’s breathing slows or stops, decreasing the amount of oxygen in the brain. Short of death, heroin overdose can result in coma and permanent brain damage.6
“Alaska has had an addiction challenge for decades, it’s just been in the dark. But the opioid crisis brought attention, and now people want to do something about it.” – Policymaker
“The opioid epidemic has become a talking point. It seems that it comes up when it’s related to crime, and they talk about SB91 – thinking that they are all intertwined.” – Nonprofit leader
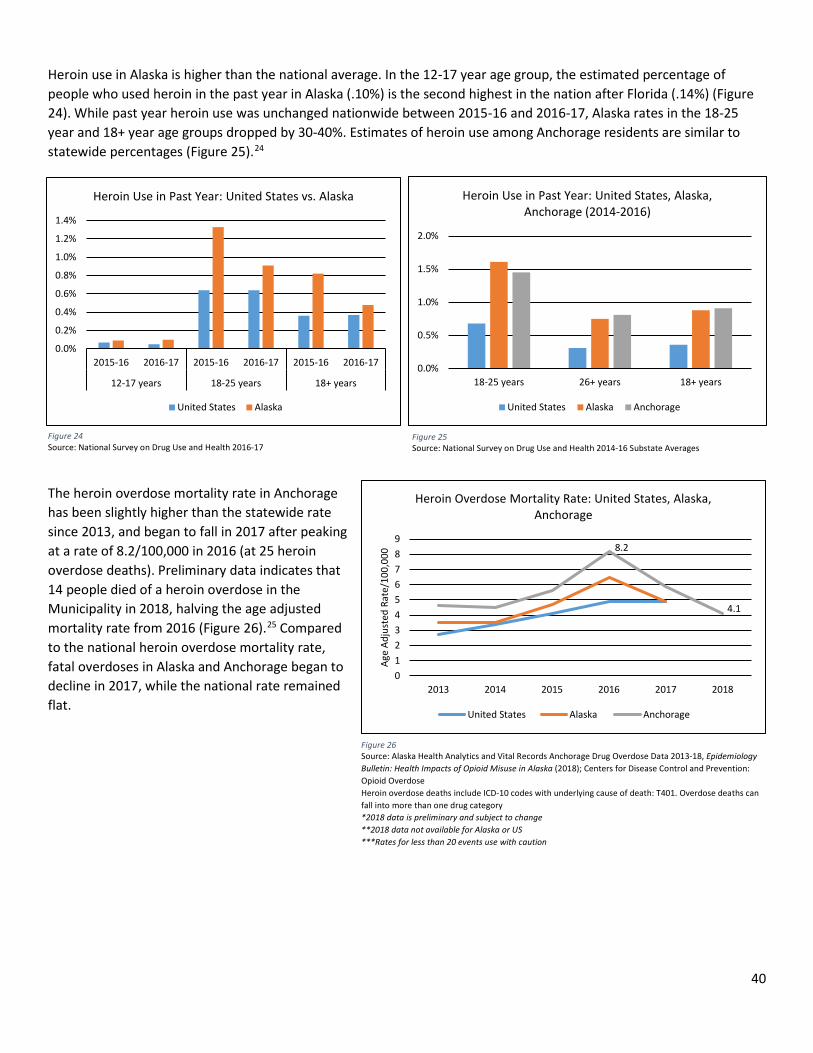
40
Heroin use in Alaska is higher than the national average. In the 12-17 year age group, the estimated percentage of people who used heroin in the past year in Alaska (.10%) is the second highest in the nation after Florida (.14%) (Figure 24). While past year heroin use was unchanged nationwide between 2015-16 and 2016-17, Alaska rates in the 18-25 year and 18+ year age groups dropped by 30-40%. Estimates of heroin use among Anchorage residents are similar to statewide percentages (Figure 25).24
The heroin overdose mortality rate in Anchorage has been slightly higher than the statewide rate since 2013, and began to fall in 2017 after peaking at a rate of 8.2/100,000 in 2016 (at 25 heroin overdose deaths). Preliminary data indicates that 14 people died of a heroin overdose in the Municipality in 2018, halving the age adjusted mortality rate from 2016 (Figure 26).25 Compared to the national heroin overdose mortality rate, fatal overdoses in Alaska and Anchorage began to decline in 2017, while the national rate remained flat.
Figure 26 Source: Alaska Health Analytics and Vital Records Anchorage Drug Overdose Data 2013-18, Epidemiology Bulletin: Health Impacts of Opioid Misuse in Alaska (2018); Centers for Disease Control and Prevention: Opioid Overdose Heroin overdose deaths include ICD-10 codes with underlying cause of death: T401. Overdose deaths can fall into more than one drug category *2018 data is preliminary and subject to change **2018 data not available for Alaska or US ***Rates for less than 20 events use with caution
Figure 24 Source: National Survey on Drug Use and Health 2016-17
Figure 25 Source: National Survey on Drug Use and Health 2014-16 Substate Averages
0.0%
0.2%
0.4%
0.6%
0.8%
1.0%
1.2%
1.4%
2015-16 2016-17 2015-16 2016-17 2015-16 2016-17
12-17 years 18-25 years 18+ years
Heroin Use in Past Year: United States vs. Alaska
United States Alaska
0.0%
0.5%
1.0%
1.5%
2.0%
18-25 years 26+ years 18+ years
Heroin Use in Past Year: United States, Alaska, Anchorage (2014-2016)
United States Alaska Anchorage
8.2
4.1
0123456789
2013 2014 2015 2016 2017 2018
Age
Adju
sted
Rat
e/10
0,00
0
Heroin Overdose Mortality Rate: United States, Alaska, Anchorage
United States Alaska Anchorage
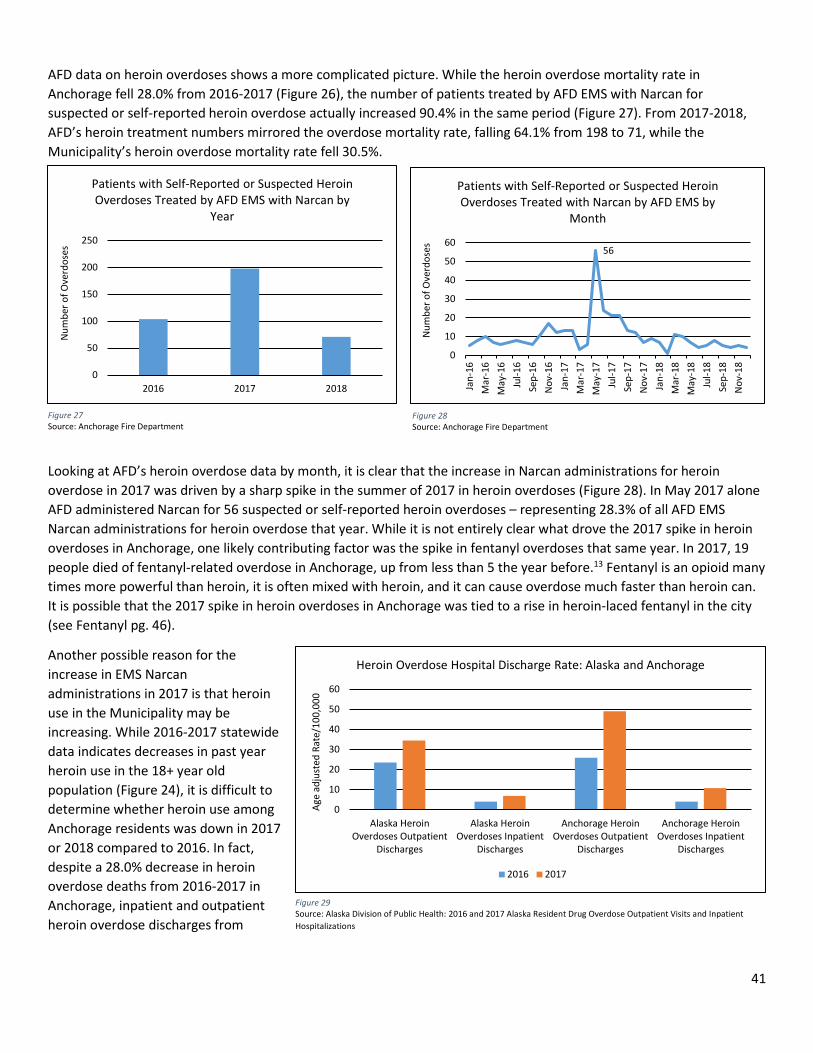
41
AFD data on heroin overdoses shows a more complicated picture. While the heroin overdose mortality rate in Anchorage fell 28.0% from 2016-2017 (Figure 26), the number of patients treated by AFD EMS with Narcan for suspected or self-reported heroin overdose actually increased 90.4% in the same period (Figure 27). From 2017-2018, AFD’s heroin treatment numbers mirrored the overdose mortality rate, falling 64.1% from 198 to 71, while the Municipality’s heroin overdose mortality rate fell 30.5%.
Looking at AFD’s heroin overdose data by month, it is clear that the increase in Narcan administrations for heroin overdose in 2017 was driven by a sharp spike in the summer of 2017 in heroin overdoses (Figure 28). In May 2017 alone AFD administered Narcan for 56 suspected or self-reported heroin overdoses – representing 28.3% of all AFD EMS Narcan administrations for heroin overdose that year. While it is not entirely clear what drove the 2017 spike in heroin overdoses in Anchorage, one likely contributing factor was the spike in fentanyl overdoses that same year. In 2017, 19 people died of fentanyl-related overdose in Anchorage, up from less than 5 the year before.13 Fentanyl is an opioid many times more powerful than heroin, it is often mixed with heroin, and it can cause overdose much faster than heroin can. It is possible that the 2017 spike in heroin overdoses in Anchorage was tied to a rise in heroin-laced fentanyl in the city (see Fentanyl pg. 46).
Another possible reason for the increase in EMS Narcan administrations in 2017 is that heroin use in the Municipality may be increasing. While 2016-2017 statewide data indicates decreases in past year heroin use in the 18+ year old population (Figure 24), it is difficult to determine whether heroin use among Anchorage residents was down in 2017 or 2018 compared to 2016. In fact, despite a 28.0% decrease in heroin overdose deaths from 2016-2017 in Anchorage, inpatient and outpatient heroin overdose discharges from
Figure 27 Source: Anchorage Fire Department
0
50
100
150
200
250
2016 2017 2018
Num
ber o
f Ove
rdos
es
Patients with Self-Reported or Suspected Heroin Overdoses Treated by AFD EMS with Narcan by
Year
56
0
10
20
30
40
50
60
Jan-
16M
ar-1
6M
ay-1
6Ju
l-16
Sep-
16N
ov-1
6Ja
n-17
Mar
-17
May
-17
Jul-1
7Se
p-17
Nov
-17
Jan-
18M
ar-1
8M
ay-1
8Ju
l-18
Sep-
18N
ov-1
8
Num
ber o
f Ove
rdos
es
Patients with Self-Reported or Suspected Heroin Overdoses Treated with Narcan by AFD EMS by
Month
Figure 28 Source: Anchorage Fire Department
0
10
20
30
40
50
60
Alaska HeroinOverdoses Outpatient
Discharges
Alaska HeroinOverdoses Inpatient
Discharges
Anchorage HeroinOverdoses Outpatient
Discharges
Anchorage HeroinOverdoses Inpatient
Discharges
Age
adju
sted
Rat
e/10
0,00
0
Heroin Overdose Hospital Discharge Rate: Alaska and Anchorage
2016 2017
Figure 29 Source: Alaska Division of Public Health: 2016 and 2017 Alaska Resident Drug Overdose Outpatient Visits and Inpatient Hospitalizations
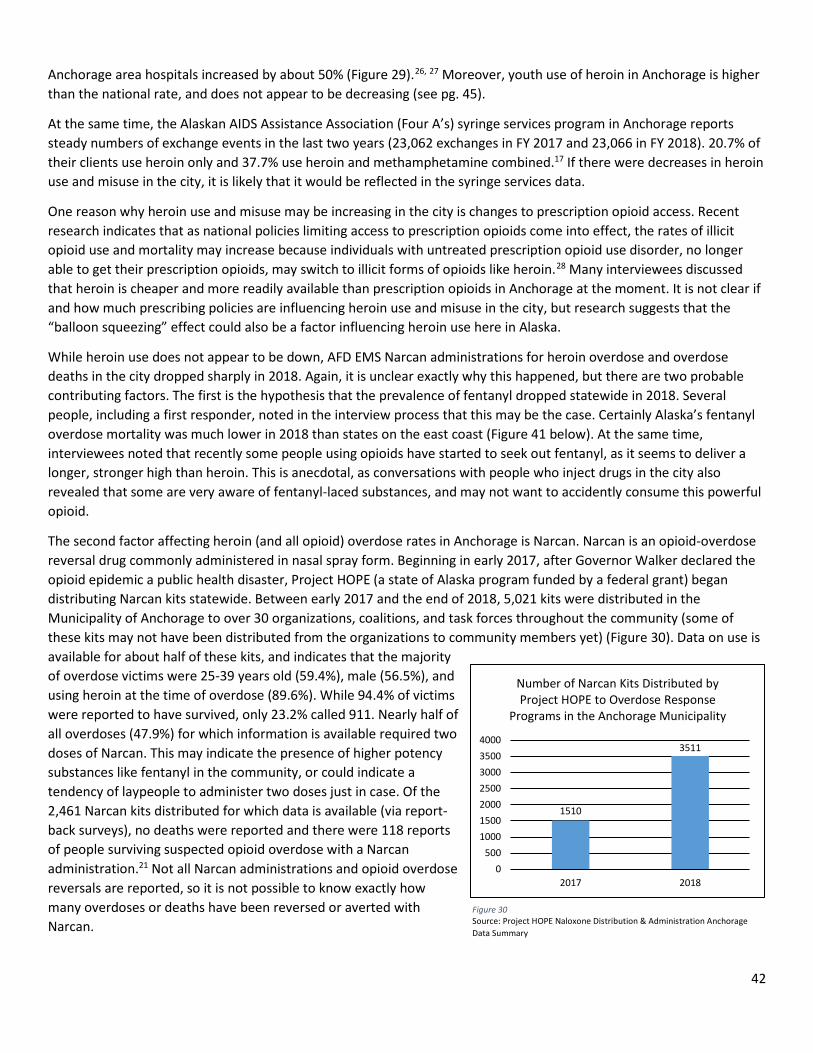
42
Anchorage area hospitals increased by about 50% (Figure 29).26, 27 Moreover, youth use of heroin in Anchorage is higher than the national rate, and does not appear to be decreasing (see pg. 45).
At the same time, the Alaskan AIDS Assistance Association (Four A’s) syringe services program in Anchorage reports steady numbers of exchange events in the last two years (23,062 exchanges in FY 2017 and 23,066 in FY 2018). 20.7% of their clients use heroin only and 37.7% use heroin and methamphetamine combined.17 If there were decreases in heroin use and misuse in the city, it is likely that it would be reflected in the syringe services data.
One reason why heroin use and misuse may be increasing in the city is changes to prescription opioid access. Recent research indicates that as national policies limiting access to prescription opioids come into effect, the rates of illicit opioid use and mortality may increase because individuals with untreated prescription opioid use disorder, no longer able to get their prescription opioids, may switch to illicit forms of opioids like heroin.28 Many interviewees discussed that heroin is cheaper and more readily available than prescription opioids in Anchorage at the moment. It is not clear if and how much prescribing policies are influencing heroin use and misuse in the city, but research suggests that the “balloon squeezing” effect could also be a factor influencing heroin use here in Alaska.
While heroin use does not appear to be down, AFD EMS Narcan administrations for heroin overdose and overdose deaths in the city dropped sharply in 2018. Again, it is unclear exactly why this happened, but there are two probable contributing factors. The first is the hypothesis that the prevalence of fentanyl dropped statewide in 2018. Several people, including a first responder, noted in the interview process that this may be the case. Certainly Alaska’s fentanyl overdose mortality was much lower in 2018 than states on the east coast (Figure 41 below). At the same time, interviewees noted that recently some people using opioids have started to seek out fentanyl, as it seems to deliver a longer, stronger high than heroin. This is anecdotal, as conversations with people who inject drugs in the city also revealed that some are very aware of fentanyl-laced substances, and may not want to accidently consume this powerful opioid.
The second factor affecting heroin (and all opioid) overdose rates in Anchorage is Narcan. Narcan is an opioid-overdose reversal drug commonly administered in nasal spray form. Beginning in early 2017, after Governor Walker declared the opioid epidemic a public health disaster, Project HOPE (a state of Alaska program funded by a federal grant) began distributing Narcan kits statewide. Between early 2017 and the end of 2018, 5,021 kits were distributed in the Municipality of Anchorage to over 30 organizations, coalitions, and task forces throughout the community (some of these kits may not have been distributed from the organizations to community members yet) (Figure 30). Data on use is available for about half of these kits, and indicates that the majority of overdose victims were 25-39 years old (59.4%), male (56.5%), and using heroin at the time of overdose (89.6%). While 94.4% of victims were reported to have survived, only 23.2% called 911. Nearly half of all overdoses (47.9%) for which information is available required two doses of Narcan. This may indicate the presence of higher potency substances like fentanyl in the community, or could indicate a tendency of laypeople to administer two doses just in case. Of the 2,461 Narcan kits distributed for which data is available (via report-back surveys), no deaths were reported and there were 118 reports of people surviving suspected opioid overdose with a Narcan administration.21 Not all Narcan administrations and opioid overdose reversals are reported, so it is not possible to know exactly how many overdoses or deaths have been reversed or averted with Narcan.
Figure 30 Source: Project HOPE Naloxone Distribution & Administration Anchorage Data Summary
1510
3511
0500
1000150020002500300035004000
2017 2018
Number of Narcan Kits Distributed by Project HOPE to Overdose Response
Programs in the Anchorage Municipality
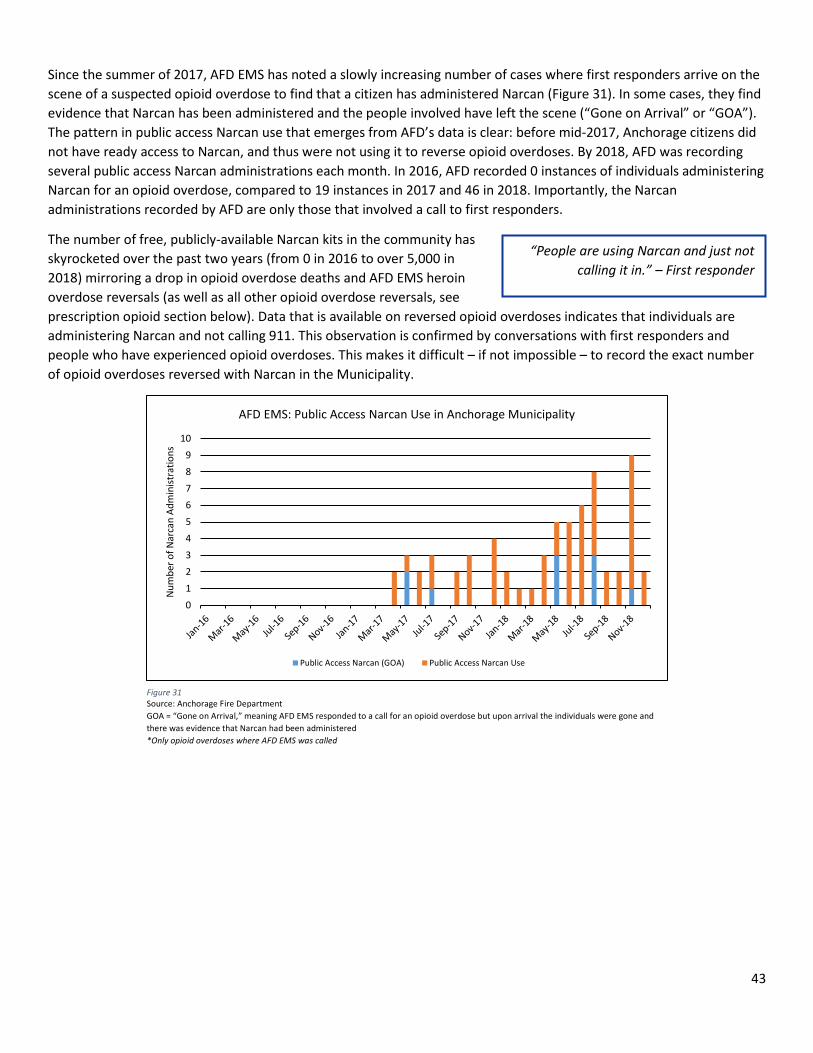
43
Since the summer of 2017, AFD EMS has noted a slowly increasing number of cases where first responders arrive on the scene of a suspected opioid overdose to find that a citizen has administered Narcan (Figure 31). In some cases, they find evidence that Narcan has been administered and the people involved have left the scene (“Gone on Arrival” or “GOA”). The pattern in public access Narcan use that emerges from AFD’s data is clear: before mid-2017, Anchorage citizens did not have ready access to Narcan, and thus were not using it to reverse opioid overdoses. By 2018, AFD was recording several public access Narcan administrations each month. In 2016, AFD recorded 0 instances of individuals administering Narcan for an opioid overdose, compared to 19 instances in 2017 and 46 in 2018. Importantly, the Narcan administrations recorded by AFD are only those that involved a call to first responders.
The number of free, publicly-available Narcan kits in the community has skyrocketed over the past two years (from 0 in 2016 to over 5,000 in 2018) mirroring a drop in opioid overdose deaths and AFD EMS heroin overdose reversals (as well as all other opioid overdose reversals, see prescription opioid section below). Data that is available on reversed opioid overdoses indicates that individuals are administering Narcan and not calling 911. This observation is confirmed by conversations with first responders and people who have experienced opioid overdoses. This makes it difficult – if not impossible – to record the exact number of opioid overdoses reversed with Narcan in the Municipality.
0123456789
10
Num
ber o
f Nar
can
Adm
inist
ratio
ns
AFD EMS: Public Access Narcan Use in Anchorage Municipality
Public Access Narcan (GOA) Public Access Narcan Use
Figure 31 Source: Anchorage Fire Department GOA = “Gone on Arrival,” meaning AFD EMS responded to a call for an opioid overdose but upon arrival the individuals were gone and there was evidence that Narcan had been administered *Only opioid overdoses where AFD EMS was called
“People are using Narcan and just not calling it in.” – First responder
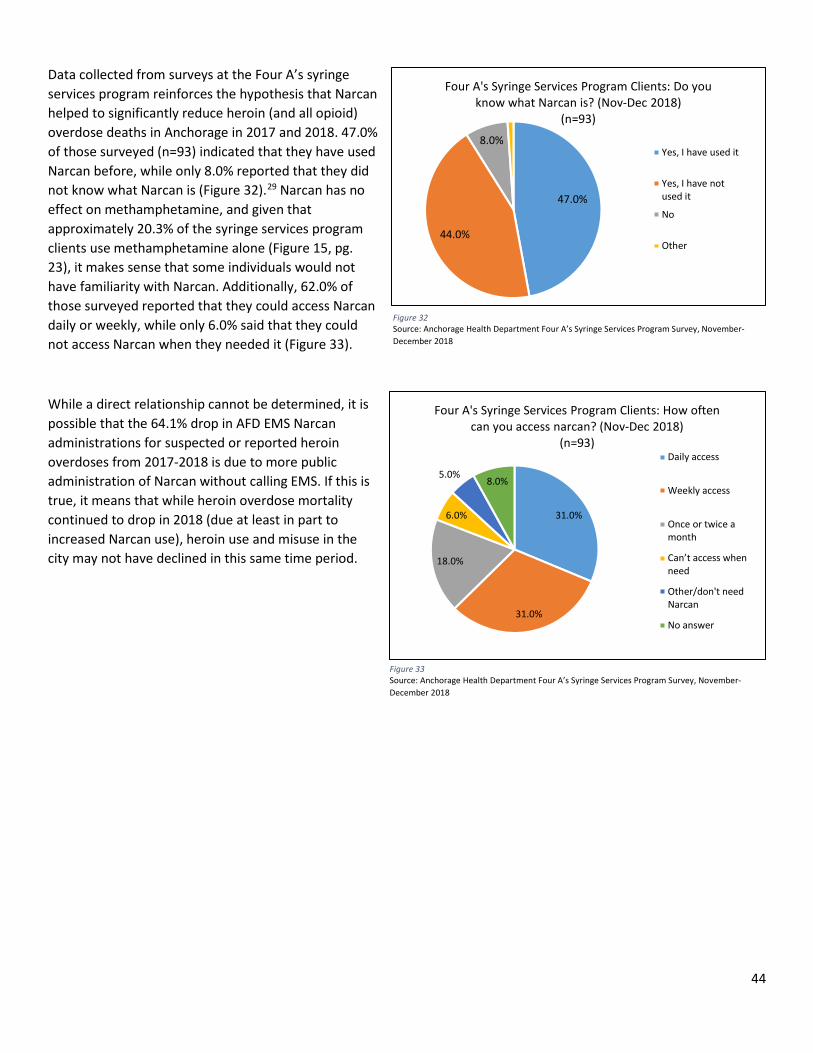
44
Data collected from surveys at the Four A’s syringe services program reinforces the hypothesis that Narcan helped to significantly reduce heroin (and all opioid) overdose deaths in Anchorage in 2017 and 2018. 47.0% of those surveyed (n=93) indicated that they have used Narcan before, while only 8.0% reported that they did not know what Narcan is (Figure 32).29 Narcan has no effect on methamphetamine, and given that approximately 20.3% of the syringe services program clients use methamphetamine alone (Figure 15, pg. 23), it makes sense that some individuals would not have familiarity with Narcan. Additionally, 62.0% of those surveyed reported that they could access Narcan daily or weekly, while only 6.0% said that they could not access Narcan when they needed it (Figure 33).
While a direct relationship cannot be determined, it is possible that the 64.1% drop in AFD EMS Narcan administrations for suspected or reported heroin overdoses from 2017-2018 is due to more public administration of Narcan without calling EMS. If this is true, it means that while heroin overdose mortality continued to drop in 2018 (due at least in part to increased Narcan use), heroin use and misuse in the city may not have declined in this same time period.
47.0%
44.0%
8.0%
Four A's Syringe Services Program Clients: Do you know what Narcan is? (Nov-Dec 2018)
(n=93)
Yes, I have used it
Yes, I have notused it
No
Other
Figure 32 Source: Anchorage Health Department Four A’s Syringe Services Program Survey, November-December 2018
Figure 33 Source: Anchorage Health Department Four A’s Syringe Services Program Survey, November-December 2018
31.0%
31.0%
18.0%
6.0%
5.0%8.0%
Four A's Syringe Services Program Clients: How often can you access narcan? (Nov-Dec 2018)
(n=93)Daily access
Weekly access
Once or twice amonth
Can’t access when need
Other/don't needNarcan
No answer
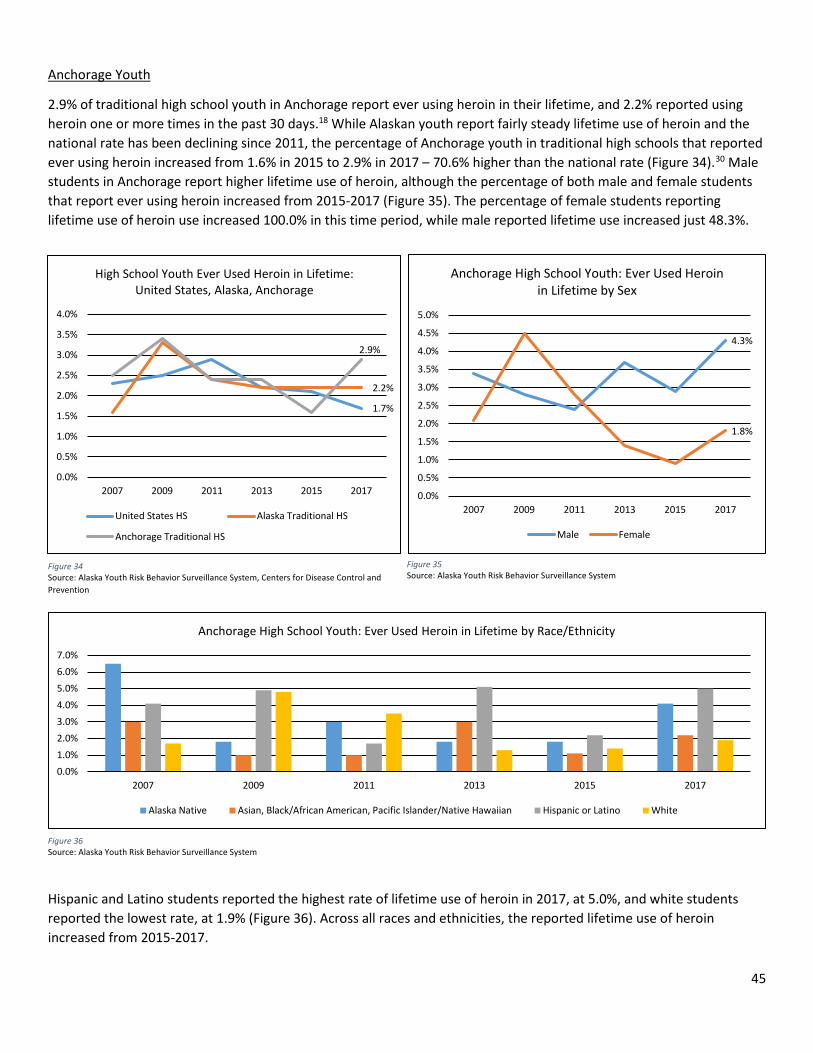
45
Anchorage Youth
2.9% of traditional high school youth in Anchorage report ever using heroin in their lifetime, and 2.2% reported using heroin one or more times in the past 30 days.18 While Alaskan youth report fairly steady lifetime use of heroin and the national rate has been declining since 2011, the percentage of Anchorage youth in traditional high schools that reported ever using heroin increased from 1.6% in 2015 to 2.9% in 2017 – 70.6% higher than the national rate (Figure 34).30 Male students in Anchorage report higher lifetime use of heroin, although the percentage of both male and female students that report ever using heroin increased from 2015-2017 (Figure 35). The percentage of female students reporting lifetime use of heroin use increased 100.0% in this time period, while male reported lifetime use increased just 48.3%.
Hispanic and Latino students reported the highest rate of lifetime use of heroin in 2017, at 5.0%, and white students reported the lowest rate, at 1.9% (Figure 36). Across all races and ethnicities, the reported lifetime use of heroin increased from 2015-2017.
Figure 35 Source: Alaska Youth Risk Behavior Surveillance System
1.7%
2.2%
2.9%
0.0%
0.5%
1.0%
1.5%
2.0%
2.5%
3.0%
3.5%
4.0%
2007 2009 2011 2013 2015 2017
High School Youth Ever Used Heroin in Lifetime: United States, Alaska, Anchorage
United States HS Alaska Traditional HS
Anchorage Traditional HS
Figure 34 Source: Alaska Youth Risk Behavior Surveillance System, Centers for Disease Control and Prevention
4.3%
1.8%
0.0%
0.5%
1.0%
1.5%
2.0%
2.5%
3.0%
3.5%
4.0%
4.5%
5.0%
2007 2009 2011 2013 2015 2017
Anchorage High School Youth: Ever Used Heroin in Lifetime by Sex
Male Female
0.0%1.0%2.0%3.0%4.0%5.0%6.0%7.0%
2007 2009 2011 2013 2015 2017
Anchorage High School Youth: Ever Used Heroin in Lifetime by Race/Ethnicity
Alaska Native Asian, Black/African American, Pacific Islander/Native Hawaiian Hispanic or Latino White
Figure 36 Source: Alaska Youth Risk Behavior Surveillance System
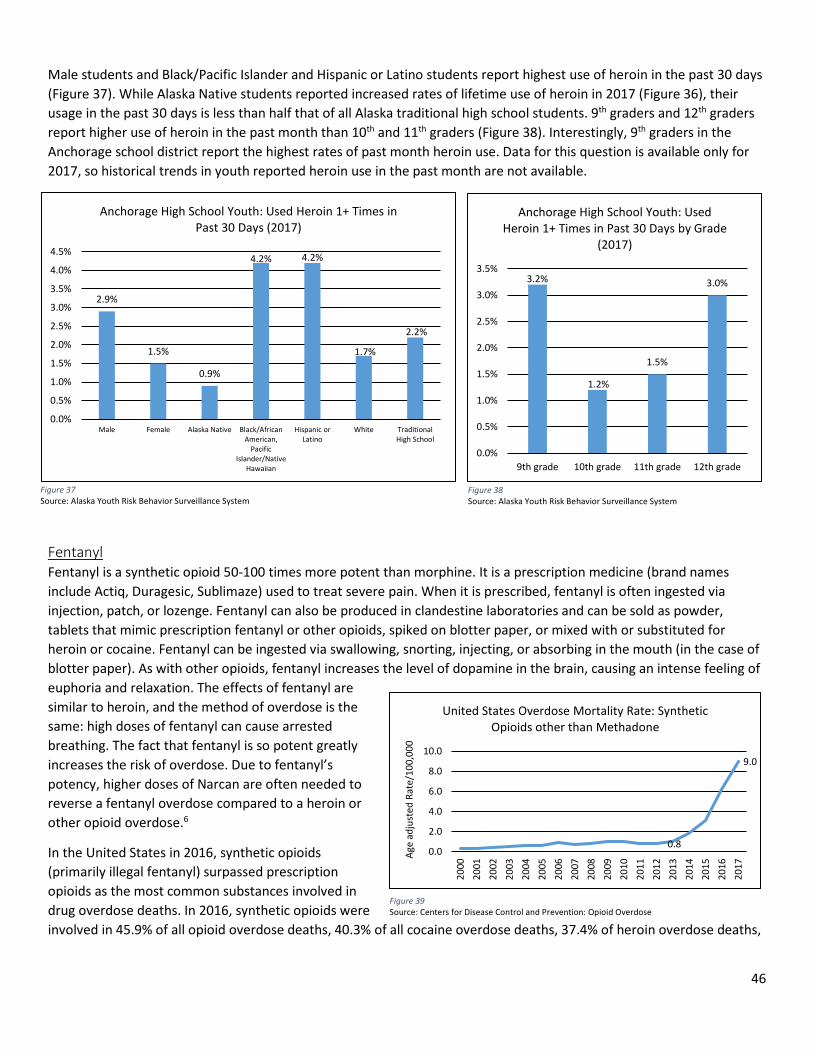
46
Male students and Black/Pacific Islander and Hispanic or Latino students report highest use of heroin in the past 30 days (Figure 37). While Alaska Native students reported increased rates of lifetime use of heroin in 2017 (Figure 36), their usage in the past 30 days is less than half that of all Alaska traditional high school students. 9th graders and 12th graders report higher use of heroin in the past month than 10th and 11th graders (Figure 38). Interestingly, 9th graders in the Anchorage school district report the highest rates of past month heroin use. Data for this question is available only for 2017, so historical trends in youth reported heroin use in the past month are not available.
Fentanyl Fentanyl is a synthetic opioid 50-100 times more potent than morphine. It is a prescription medicine (brand names include Actiq, Duragesic, Sublimaze) used to treat severe pain. When it is prescribed, fentanyl is often ingested via injection, patch, or lozenge. Fentanyl can also be produced in clandestine laboratories and can be sold as powder, tablets that mimic prescription fentanyl or other opioids, spiked on blotter paper, or mixed with or substituted for heroin or cocaine. Fentanyl can be ingested via swallowing, snorting, injecting, or absorbing in the mouth (in the case of blotter paper). As with other opioids, fentanyl increases the level of dopamine in the brain, causing an intense feeling of euphoria and relaxation. The effects of fentanyl are similar to heroin, and the method of overdose is the same: high doses of fentanyl can cause arrested breathing. The fact that fentanyl is so potent greatly increases the risk of overdose. Due to fentanyl’s potency, higher doses of Narcan are often needed to reverse a fentanyl overdose compared to a heroin or other opioid overdose.6
In the United States in 2016, synthetic opioids (primarily illegal fentanyl) surpassed prescription opioids as the most common substances involved in drug overdose deaths. In 2016, synthetic opioids were involved in 45.9% of all opioid overdose deaths, 40.3% of all cocaine overdose deaths, 37.4% of heroin overdose deaths,
0.8
9.0
0.0
2.0
4.0
6.0
8.0
10.0
2000
2001
2002
2003
2004
2005
2006
2007
2008
2009
2010
2011
2012
2013
2014
2015
2016
2017
Age
adju
sted
Rat
e/10
0,00
0
United States Overdose Mortality Rate: Synthetic Opioids other than Methadone
Figure 39 Source: Centers for Disease Control and Prevention: Opioid Overdose
Figure 37 Source: Alaska Youth Risk Behavior Surveillance System
3.2%
1.2%
1.5%
3.0%
0.0%
0.5%
1.0%
1.5%
2.0%
2.5%
3.0%
3.5%
9th grade 10th grade 11th grade 12th grade
Anchorage High School Youth: Used Heroin 1+ Times in Past 30 Days by Grade
(2017)
Figure 38 Source: Alaska Youth Risk Behavior Surveillance System
2.9%
1.5%
0.9%
4.2% 4.2%
1.7%
2.2%
0.0%
0.5%
1.0%
1.5%
2.0%
2.5%
3.0%
3.5%
4.0%
4.5%
Male Female Alaska Native Black/AfricanAmerican,
PacificIslander/Native
Hawaiian
Hispanic orLatino
White TraditionalHigh School
Anchorage High School Youth: Used Heroin 1+ Times in Past 30 Days (2017)
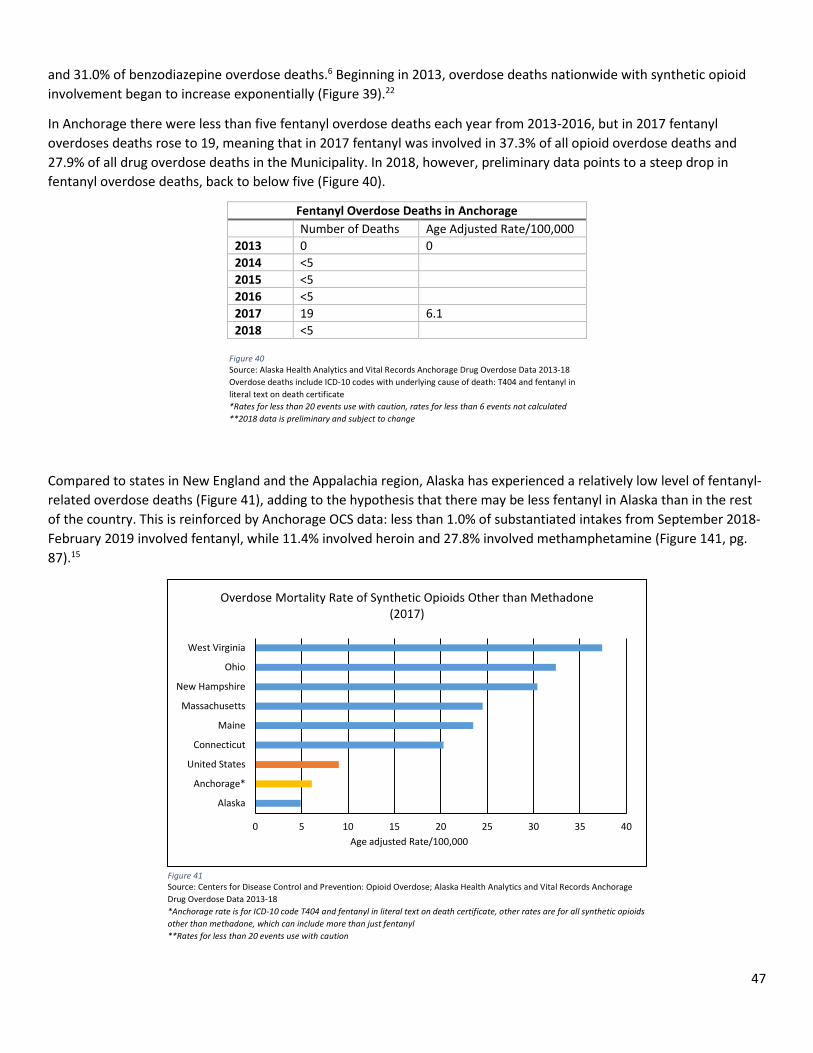
47
and 31.0% of benzodiazepine overdose deaths.6 Beginning in 2013, overdose deaths nationwide with synthetic opioid involvement began to increase exponentially (Figure 39).22
In Anchorage there were less than five fentanyl overdose deaths each year from 2013-2016, but in 2017 fentanyl overdoses deaths rose to 19, meaning that in 2017 fentanyl was involved in 37.3% of all opioid overdose deaths and 27.9% of all drug overdose deaths in the Municipality. In 2018, however, preliminary data points to a steep drop in fentanyl overdose deaths, back to below five (Figure 40).
Compared to states in New England and the Appalachia region, Alaska has experienced a relatively low level of fentanyl-related overdose deaths (Figure 41), adding to the hypothesis that there may be less fentanyl in Alaska than in the rest of the country. This is reinforced by Anchorage OCS data: less than 1.0% of substantiated intakes from September 2018-February 2019 involved fentanyl, while 11.4% involved heroin and 27.8% involved methamphetamine (Figure 141, pg. 87).15
Fentanyl Overdose Deaths in Anchorage Number of Deaths Age Adjusted Rate/100,000 2013 0 0 2014 <5 2015 <5 2016 <5 2017 19 6.1 2018 <5
Figure 40 Source: Alaska Health Analytics and Vital Records Anchorage Drug Overdose Data 2013-18 Overdose deaths include ICD-10 codes with underlying cause of death: T404 and fentanyl in literal text on death certificate *Rates for less than 20 events use with caution, rates for less than 6 events not calculated **2018 data is preliminary and subject to change
0 5 10 15 20 25 30 35 40
Alaska
Anchorage*
United States
Connecticut
Maine
Massachusetts
New Hampshire
Ohio
West Virginia
Age adjusted Rate/100,000
Overdose Mortality Rate of Synthetic Opioids Other than Methadone (2017)
Figure 41 Source: Centers for Disease Control and Prevention: Opioid Overdose; Alaska Health Analytics and Vital Records Anchorage Drug Overdose Data 2013-18 *Anchorage rate is for ICD-10 code T404 and fentanyl in literal text on death certificate, other rates are for all synthetic opioids other than methadone, which can include more than just fentanyl **Rates for less than 20 events use with caution
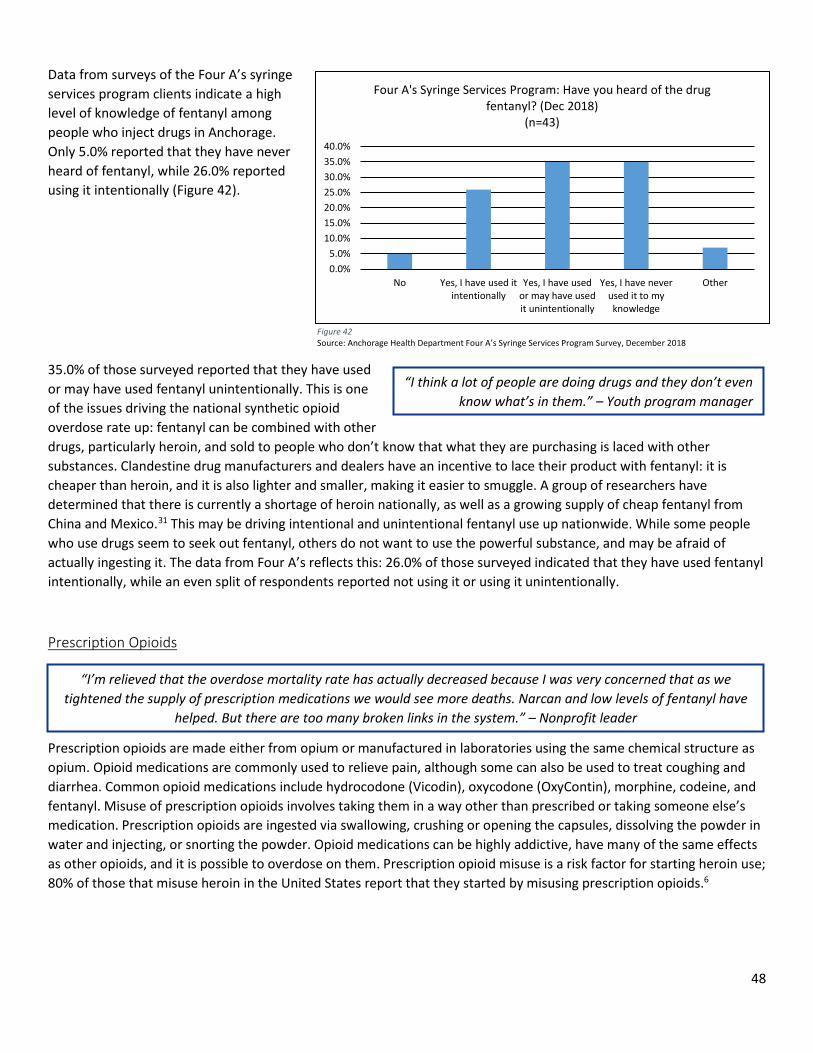
48
Data from surveys of the Four A’s syringe services program clients indicate a high level of knowledge of fentanyl among people who inject drugs in Anchorage. Only 5.0% reported that they have never heard of fentanyl, while 26.0% reported using it intentionally (Figure 42).
35.0% of those surveyed reported that they have used or may have used fentanyl unintentionally. This is one of the issues driving the national synthetic opioid overdose rate up: fentanyl can be combined with other drugs, particularly heroin, and sold to people who don’t know that what they are purchasing is laced with other substances. Clandestine drug manufacturers and dealers have an incentive to lace their product with fentanyl: it is cheaper than heroin, and it is also lighter and smaller, making it easier to smuggle. A group of researchers have determined that there is currently a shortage of heroin nationally, as well as a growing supply of cheap fentanyl from China and Mexico.31 This may be driving intentional and unintentional fentanyl use up nationwide. While some people who use drugs seem to seek out fentanyl, others do not want to use the powerful substance, and may be afraid of actually ingesting it. The data from Four A’s reflects this: 26.0% of those surveyed indicated that they have used fentanyl intentionally, while an even split of respondents reported not using it or using it unintentionally.
Prescription Opioids
Prescription opioids are made either from opium or manufactured in laboratories using the same chemical structure as opium. Opioid medications are commonly used to relieve pain, although some can also be used to treat coughing and diarrhea. Common opioid medications include hydrocodone (Vicodin), oxycodone (OxyContin), morphine, codeine, and fentanyl. Misuse of prescription opioids involves taking them in a way other than prescribed or taking someone else’s medication. Prescription opioids are ingested via swallowing, crushing or opening the capsules, dissolving the powder in water and injecting, or snorting the powder. Opioid medications can be highly addictive, have many of the same effects as other opioids, and it is possible to overdose on them. Prescription opioid misuse is a risk factor for starting heroin use; 80% of those that misuse heroin in the United States report that they started by misusing prescription opioids.6
0.0%5.0%
10.0%15.0%20.0%25.0%30.0%35.0%40.0%
No Yes, I have used itintentionally
Yes, I have usedor may have usedit unintentionally
Yes, I have neverused it to myknowledge
Other
Four A's Syringe Services Program: Have you heard of the drug fentanyl? (Dec 2018)
(n=43)
Figure 42 Source: Anchorage Health Department Four A’s Syringe Services Program Survey, December 2018
“I think a lot of people are doing drugs and they don’t even know what’s in them.” – Youth program manager
“I’m relieved that the overdose mortality rate has actually decreased because I was very concerned that as we tightened the supply of prescription medications we would see more deaths. Narcan and low levels of fentanyl have
helped. But there are too many broken links in the system.” – Nonprofit leader
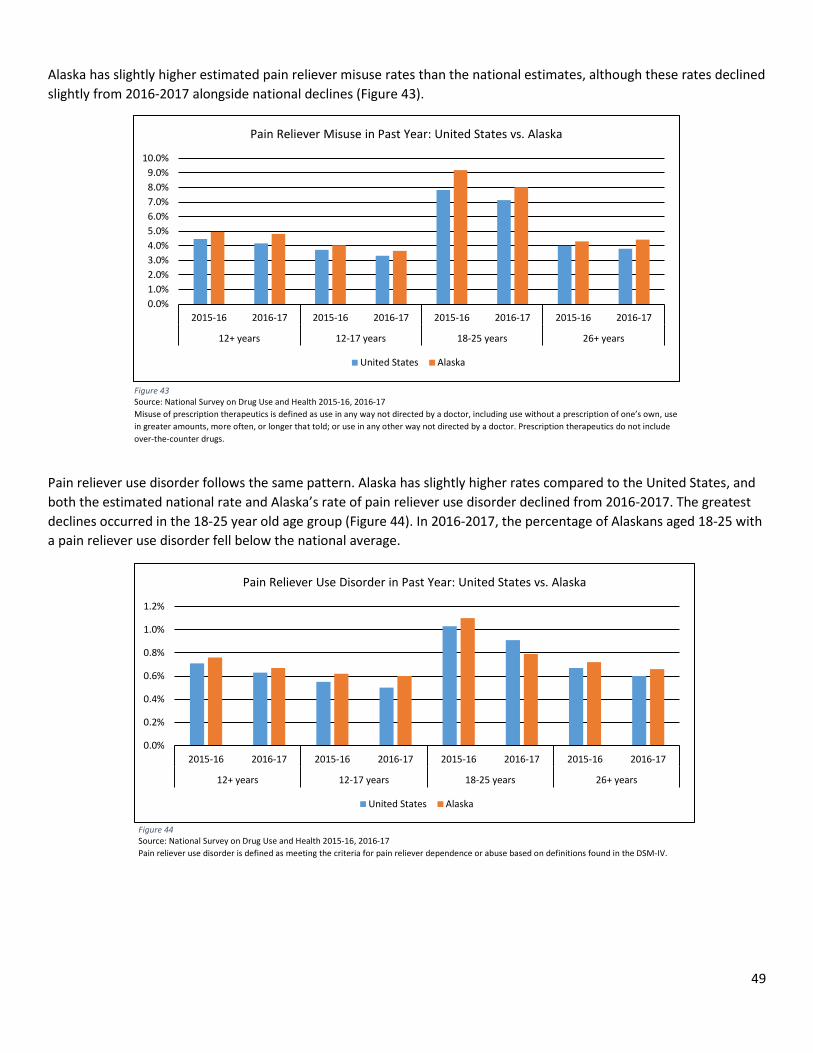
49
Alaska has slightly higher estimated pain reliever misuse rates than the national estimates, although these rates declined slightly from 2016-2017 alongside national declines (Figure 43).
Pain reliever use disorder follows the same pattern. Alaska has slightly higher rates compared to the United States, and both the estimated national rate and Alaska’s rate of pain reliever use disorder declined from 2016-2017. The greatest declines occurred in the 18-25 year old age group (Figure 44). In 2016-2017, the percentage of Alaskans aged 18-25 with a pain reliever use disorder fell below the national average.
0.0%1.0%2.0%3.0%4.0%5.0%6.0%7.0%8.0%9.0%
10.0%
2015-16 2016-17 2015-16 2016-17 2015-16 2016-17 2015-16 2016-17
12+ years 12-17 years 18-25 years 26+ years
Pain Reliever Misuse in Past Year: United States vs. Alaska
United States Alaska
Figure 43 Source: National Survey on Drug Use and Health 2015-16, 2016-17 Misuse of prescription therapeutics is defined as use in any way not directed by a doctor, including use without a prescription of one’s own, use in greater amounts, more often, or longer that told; or use in any other way not directed by a doctor. Prescription therapeutics do not include over-the-counter drugs.
0.0%
0.2%
0.4%
0.6%
0.8%
1.0%
1.2%
2015-16 2016-17 2015-16 2016-17 2015-16 2016-17 2015-16 2016-17
12+ years 12-17 years 18-25 years 26+ years
Pain Reliever Use Disorder in Past Year: United States vs. Alaska
United States Alaska
Figure 44 Source: National Survey on Drug Use and Health 2015-16, 2016-17 Pain reliever use disorder is defined as meeting the criteria for pain reliever dependence or abuse based on definitions found in the DSM-IV.
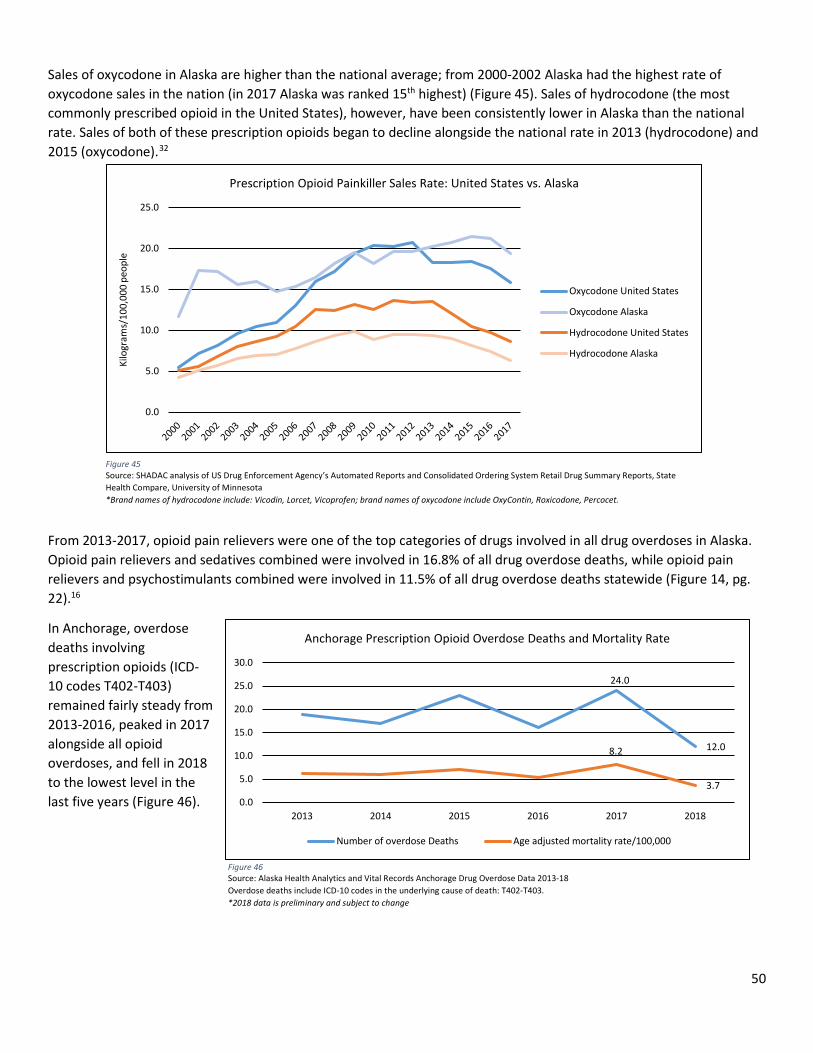
50
Sales of oxycodone in Alaska are higher than the national average; from 2000-2002 Alaska had the highest rate of oxycodone sales in the nation (in 2017 Alaska was ranked 15th highest) (Figure 45). Sales of hydrocodone (the most commonly prescribed opioid in the United States), however, have been consistently lower in Alaska than the national rate. Sales of both of these prescription opioids began to decline alongside the national rate in 2013 (hydrocodone) and 2015 (oxycodone).32
From 2013-2017, opioid pain relievers were one of the top categories of drugs involved in all drug overdoses in Alaska. Opioid pain relievers and sedatives combined were involved in 16.8% of all drug overdose deaths, while opioid pain relievers and psychostimulants combined were involved in 11.5% of all drug overdose deaths statewide (Figure 14, pg. 22).16
In Anchorage, overdose deaths involving prescription opioids (ICD-10 codes T402-T403) remained fairly steady from 2013-2016, peaked in 2017 alongside all opioid overdoses, and fell in 2018 to the lowest level in the last five years (Figure 46).
24.0
12.08.2
3.70.0
5.0
10.0
15.0
20.0
25.0
30.0
2013 2014 2015 2016 2017 2018
Anchorage Prescription Opioid Overdose Deaths and Mortality Rate
Number of overdose Deaths Age adjusted mortality rate/100,000
Figure 46 Source: Alaska Health Analytics and Vital Records Anchorage Drug Overdose Data 2013-18 Overdose deaths include ICD-10 codes in the underlying cause of death: T402-T403. *2018 data is preliminary and subject to change
0.0
5.0
10.0
15.0
20.0
25.0
Kilo
gram
s/10
0,00
0 pe
ople
Prescription Opioid Painkiller Sales Rate: United States vs. Alaska
Oxycodone United States
Oxycodone Alaska
Hydrocodone United States
Hydrocodone Alaska
Figure 45 Source: SHADAC analysis of US Drug Enforcement Agency’s Automated Reports and Consolidated Ordering System Retail Drug Summary Reports, State Health Compare, University of Minnesota *Brand names of hydrocodone include: Vicodin, Lorcet, Vicoprofen; brand names of oxycodone include OxyContin, Roxicodone, Percocet.
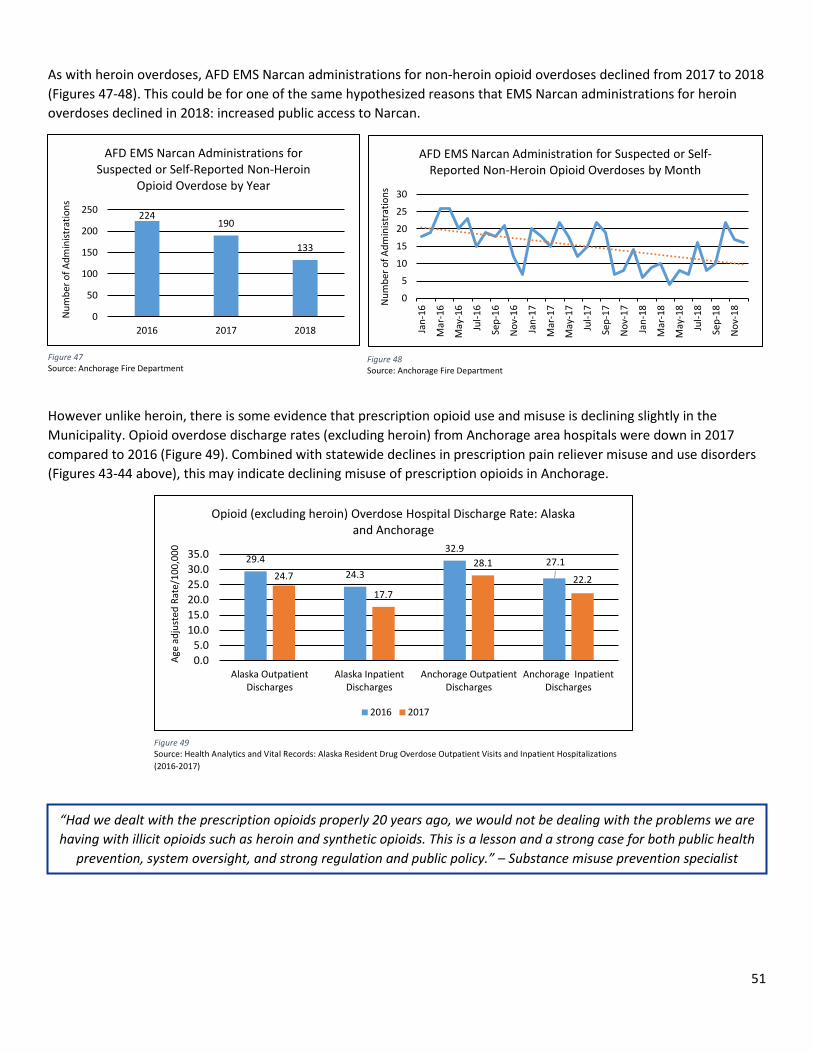
51
As with heroin overdoses, AFD EMS Narcan administrations for non-heroin opioid overdoses declined from 2017 to 2018 (Figures 47-48). This could be for one of the same hypothesized reasons that EMS Narcan administrations for heroin overdoses declined in 2018: increased public access to Narcan.
However unlike heroin, there is some evidence that prescription opioid use and misuse is declining slightly in the Municipality. Opioid overdose discharge rates (excluding heroin) from Anchorage area hospitals were down in 2017 compared to 2016 (Figure 49). Combined with statewide declines in prescription pain reliever misuse and use disorders (Figures 43-44 above), this may indicate declining misuse of prescription opioids in Anchorage.
29.424.3
32.927.1
24.7
17.7
28.122.2
0.05.0
10.015.020.025.030.035.0
Alaska OutpatientDischarges
Alaska InpatientDischarges
Anchorage OutpatientDischarges
Anchorage InpatientDischarges
Age
adju
sted
Rat
e/10
0,00
0
Opioid (excluding heroin) Overdose Hospital Discharge Rate: Alaska and Anchorage
2016 2017
Figure 49 Source: Health Analytics and Vital Records: Alaska Resident Drug Overdose Outpatient Visits and Inpatient Hospitalizations (2016-2017)
224190
133
0
50
100
150
200
250
2016 2017 2018
Num
ber o
f Adm
inist
ratio
ns
AFD EMS Narcan Administrations for Suspected or Self-Reported Non-Heroin
Opioid Overdose by Year
0
5
10
15
20
25
30
Jan-
16
Mar
-16
May
-16
Jul-1
6
Sep-
16
Nov
-16
Jan-
17
Mar
-17
May
-17
Jul-1
7
Sep-
17
Nov
-17
Jan-
18
Mar
-18
May
-18
Jul-1
8
Sep-
18
Nov
-18N
umbe
r of A
dmin
istra
tions
AFD EMS Narcan Administration for Suspected or Self-Reported Non-Heroin Opioid Overdoses by Month
Figure 47 Source: Anchorage Fire Department
Figure 48 Source: Anchorage Fire Department
“Had we dealt with the prescription opioids properly 20 years ago, we would not be dealing with the problems we are having with illicit opioids such as heroin and synthetic opioids. This is a lesson and a strong case for both public health
prevention, system oversight, and strong regulation and public policy.” – Substance misuse prevention specialist
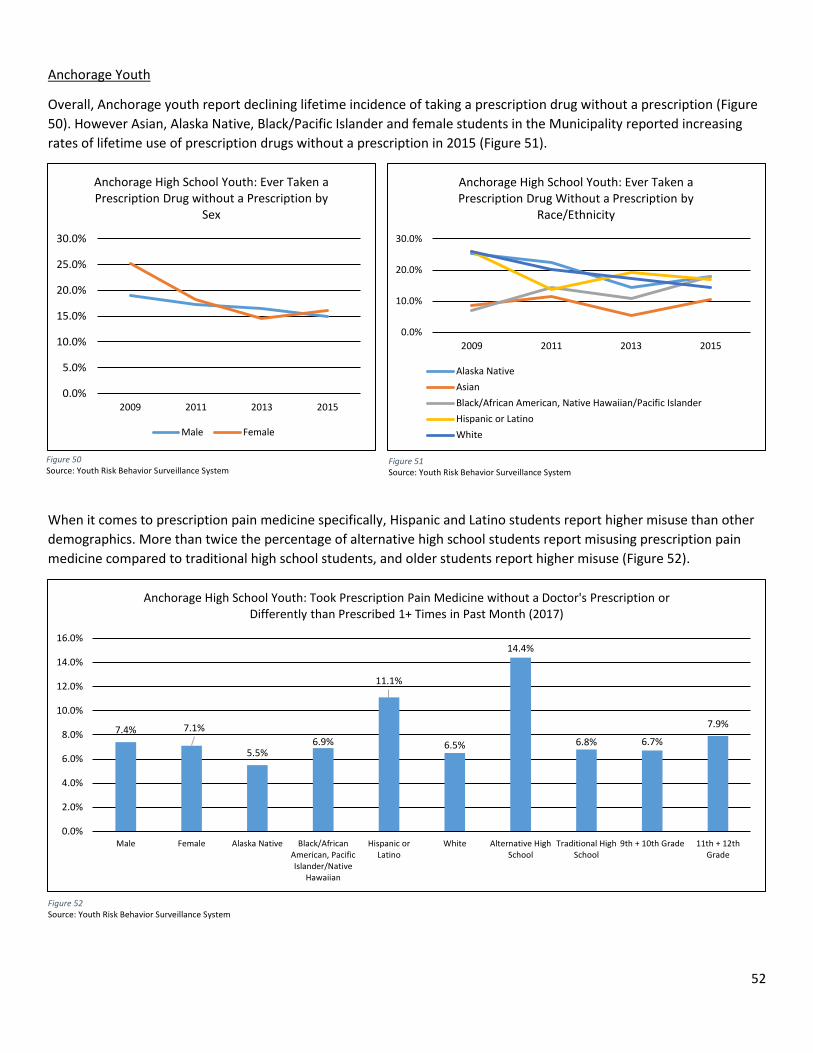
52
Anchorage Youth
Overall, Anchorage youth report declining lifetime incidence of taking a prescription drug without a prescription (Figure 50). However Asian, Alaska Native, Black/Pacific Islander and female students in the Municipality reported increasing rates of lifetime use of prescription drugs without a prescription in 2015 (Figure 51).
When it comes to prescription pain medicine specifically, Hispanic and Latino students report higher misuse than other demographics. More than twice the percentage of alternative high school students report misusing prescription pain medicine compared to traditional high school students, and older students report higher misuse (Figure 52).
0.0%
5.0%
10.0%
15.0%
20.0%
25.0%
30.0%
2009 2011 2013 2015
Anchorage High School Youth: Ever Taken a Prescription Drug without a Prescription by
Sex
Male Female
Figure 50 Source: Youth Risk Behavior Surveillance System
Figure 51 Source: Youth Risk Behavior Surveillance System
Figure 52 Source: Youth Risk Behavior Surveillance System
7.4% 7.1%
5.5%6.9%
11.1%
6.5%
14.4%
6.8% 6.7%
7.9%
0.0%
2.0%
4.0%
6.0%
8.0%
10.0%
12.0%
14.0%
16.0%
Male Female Alaska Native Black/AfricanAmerican, PacificIslander/Native
Hawaiian
Hispanic orLatino
White Alternative HighSchool
Traditional HighSchool
9th + 10th Grade 11th + 12thGrade
Anchorage High School Youth: Took Prescription Pain Medicine without a Doctor's Prescription or Differently than Prescribed 1+ Times in Past Month (2017)
0.0%
10.0%
20.0%
30.0%
2009 2011 2013 2015
Anchorage High School Youth: Ever Taken a Prescription Drug Without a Prescription by
Race/Ethnicity
Alaska NativeAsianBlack/African American, Native Hawaiian/Pacific IslanderHispanic or LatinoWhite
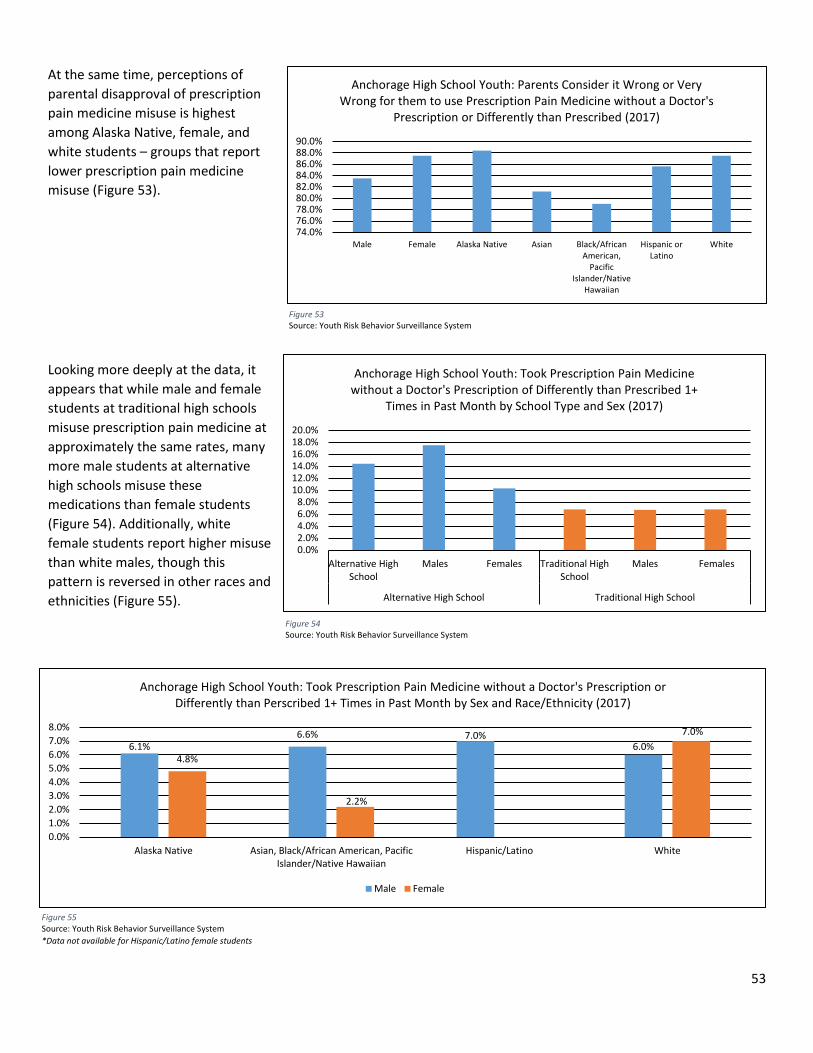
53
At the same time, perceptions of parental disapproval of prescription pain medicine misuse is highest among Alaska Native, female, and white students – groups that report lower prescription pain medicine misuse (Figure 53).
Looking more deeply at the data, it appears that while male and female students at traditional high schools misuse prescription pain medicine at approximately the same rates, many more male students at alternative high schools misuse these medications than female students (Figure 54). Additionally, white female students report higher misuse than white males, though this pattern is reversed in other races and ethnicities (Figure 55).
Figure 53 Source: Youth Risk Behavior Surveillance System
0.0%2.0%4.0%6.0%8.0%
10.0%12.0%14.0%16.0%18.0%20.0%
Alternative HighSchool
Males Females Traditional HighSchool
Males Females
Alternative High School Traditional High School
Anchorage High School Youth: Took Prescription Pain Medicine without a Doctor's Prescription of Differently than Prescribed 1+
Times in Past Month by School Type and Sex (2017)
Figure 54 Source: Youth Risk Behavior Surveillance System
Figure 55 Source: Youth Risk Behavior Surveillance System *Data not available for Hispanic/Latino female students
74.0%76.0%78.0%80.0%82.0%84.0%86.0%88.0%90.0%
Male Female Alaska Native Asian Black/AfricanAmerican,
PacificIslander/Native
Hawaiian
Hispanic orLatino
White
Anchorage High School Youth: Parents Consider it Wrong or Very Wrong for them to use Prescription Pain Medicine without a Doctor's
Prescription or Differently than Prescribed (2017)
6.1%6.6% 7.0%
6.0%4.8%
2.2%
7.0%
0.0%1.0%2.0%3.0%4.0%5.0%6.0%7.0%8.0%
Alaska Native Asian, Black/African American, PacificIslander/Native Hawaiian
Hispanic/Latino White
Anchorage High School Youth: Took Prescription Pain Medicine without a Doctor's Prescription or Differently than Perscribed 1+ Times in Past Month by Sex and Race/Ethnicity (2017)
Male Female
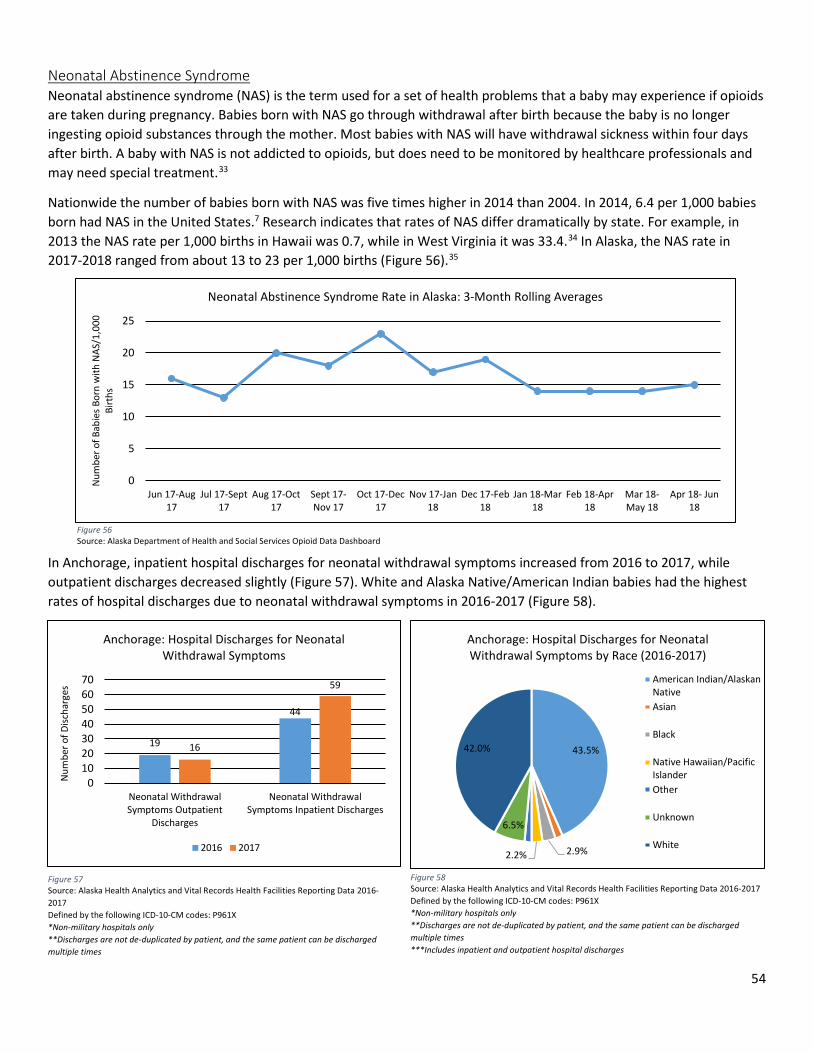
54
Neonatal Abstinence Syndrome Neonatal abstinence syndrome (NAS) is the term used for a set of health problems that a baby may experience if opioids are taken during pregnancy. Babies born with NAS go through withdrawal after birth because the baby is no longer ingesting opioid substances through the mother. Most babies with NAS will have withdrawal sickness within four days after birth. A baby with NAS is not addicted to opioids, but does need to be monitored by healthcare professionals and may need special treatment.33
Nationwide the number of babies born with NAS was five times higher in 2014 than 2004. In 2014, 6.4 per 1,000 babies born had NAS in the United States.7 Research indicates that rates of NAS differ dramatically by state. For example, in 2013 the NAS rate per 1,000 births in Hawaii was 0.7, while in West Virginia it was 33.4.34 In Alaska, the NAS rate in 2017-2018 ranged from about 13 to 23 per 1,000 births (Figure 56).35
In Anchorage, inpatient hospital discharges for neonatal withdrawal symptoms increased from 2016 to 2017, while outpatient discharges decreased slightly (Figure 57). White and Alaska Native/American Indian babies had the highest rates of hospital discharges due to neonatal withdrawal symptoms in 2016-2017 (Figure 58).
0
5
10
15
20
25
Jun 17-Aug17
Jul 17-Sept17
Aug 17-Oct17
Sept 17-Nov 17
Oct 17-Dec17
Nov 17-Jan18
Dec 17-Feb18
Jan 18-Mar18
Feb 18-Apr18
Mar 18-May 18
Apr 18- Jun18
Num
ber o
f Bab
ies B
orn
with
NAS
/1,0
00
Birt
hs
Neonatal Abstinence Syndrome Rate in Alaska: 3-Month Rolling Averages
Figure 56 Source: Alaska Department of Health and Social Services Opioid Data Dashboard
19
44
16
59
010203040506070
Neonatal WithdrawalSymptoms Outpatient
Discharges
Neonatal WithdrawalSymptoms Inpatient Discharges
Num
ber o
f Disc
harg
es
Anchorage: Hospital Discharges for Neonatal Withdrawal Symptoms
2016 2017
Figure 57 Source: Alaska Health Analytics and Vital Records Health Facilities Reporting Data 2016-2017 Defined by the following ICD-10-CM codes: P961X *Non-military hospitals only **Discharges are not de-duplicated by patient, and the same patient can be discharged multiple times
Figure 58 Source: Alaska Health Analytics and Vital Records Health Facilities Reporting Data 2016-2017 Defined by the following ICD-10-CM codes: P961X *Non-military hospitals only **Discharges are not de-duplicated by patient, and the same patient can be discharged multiple times ***Includes inpatient and outpatient hospital discharges
43.5%
2.9%2.2%
6.5%
42.0%
Anchorage: Hospital Discharges for Neonatal Withdrawal Symptoms by Race (2016-2017)
American Indian/AlaskanNativeAsian
Black
Native Hawaiian/PacificIslanderOther
Unknown
White
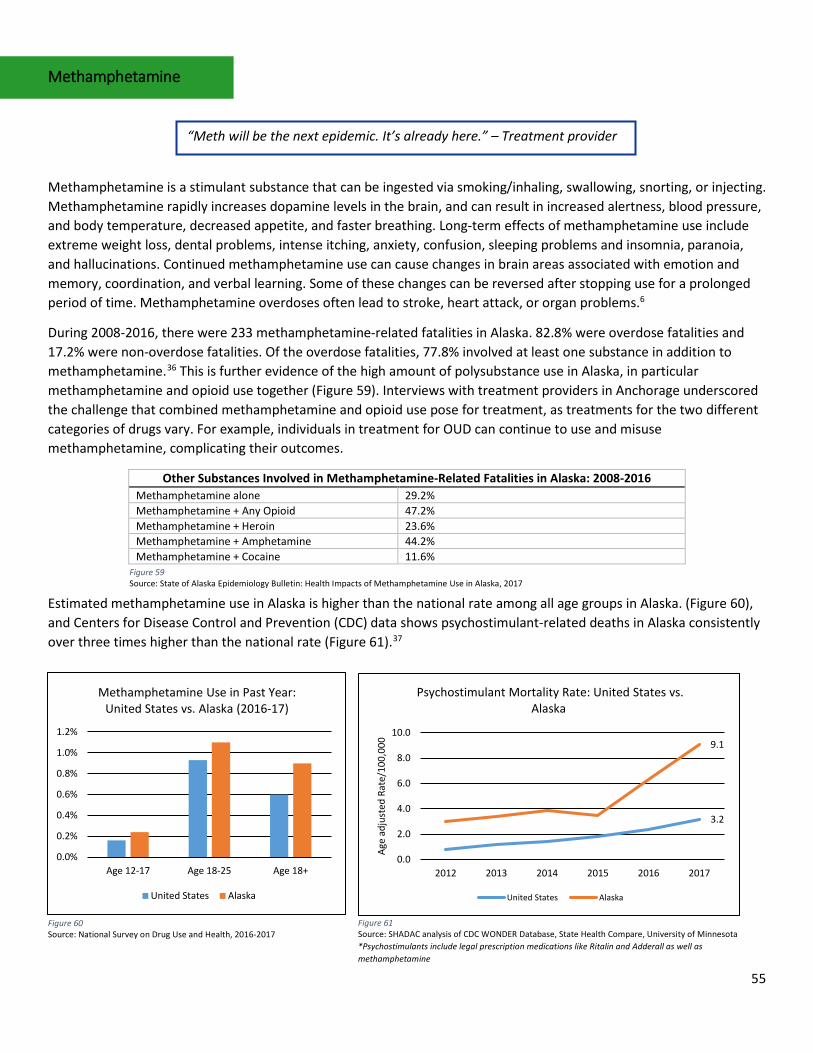
55
Methamphetamine
Methamphetamine is a stimulant substance that can be ingested via smoking/inhaling, swallowing, snorting, or injecting. Methamphetamine rapidly increases dopamine levels in the brain, and can result in increased alertness, blood pressure, and body temperature, decreased appetite, and faster breathing. Long-term effects of methamphetamine use include extreme weight loss, dental problems, intense itching, anxiety, confusion, sleeping problems and insomnia, paranoia, and hallucinations. Continued methamphetamine use can cause changes in brain areas associated with emotion and memory, coordination, and verbal learning. Some of these changes can be reversed after stopping use for a prolonged period of time. Methamphetamine overdoses often lead to stroke, heart attack, or organ problems.6
During 2008-2016, there were 233 methamphetamine-related fatalities in Alaska. 82.8% were overdose fatalities and 17.2% were non-overdose fatalities. Of the overdose fatalities, 77.8% involved at least one substance in addition to methamphetamine.36 This is further evidence of the high amount of polysubstance use in Alaska, in particular methamphetamine and opioid use together (Figure 59). Interviews with treatment providers in Anchorage underscored the challenge that combined methamphetamine and opioid use pose for treatment, as treatments for the two different categories of drugs vary. For example, individuals in treatment for OUD can continue to use and misuse methamphetamine, complicating their outcomes.
Other Substances Involved in Methamphetamine-Related Fatalities in Alaska: 2008-2016 Methamphetamine alone 29.2% Methamphetamine + Any Opioid 47.2% Methamphetamine + Heroin 23.6% Methamphetamine + Amphetamine 44.2% Methamphetamine + Cocaine 11.6%
Estimated methamphetamine use in Alaska is higher than the national rate among all age groups in Alaska. (Figure 60), and Centers for Disease Control and Prevention (CDC) data shows psychostimulant-related deaths in Alaska consistently over three times higher than the national rate (Figure 61).37
0.0%
0.2%
0.4%
0.6%
0.8%
1.0%
1.2%
Age 12-17 Age 18-25 Age 18+
Methamphetamine Use in Past Year: United States vs. Alaska (2016-17)
United States Alaska
Figure 60 Source: National Survey on Drug Use and Health, 2016-2017
Figure 59 Source: State of Alaska Epidemiology Bulletin: Health Impacts of Methamphetamine Use in Alaska, 2017
“Meth will be the next epidemic. It’s already here.” – Treatment provider
3.2
9.1
0.0
2.0
4.0
6.0
8.0
10.0
2012 2013 2014 2015 2016 2017
Age
adju
sted
Rat
e/10
0,00
0
Psychostimulant Mortality Rate: United States vs. Alaska
United States Alaska
Figure 61 Source: SHADAC analysis of CDC WONDER Database, State Health Compare, University of Minnesota *Psychostimulants include legal prescription medications like Ritalin and Adderall as well as methamphetamine
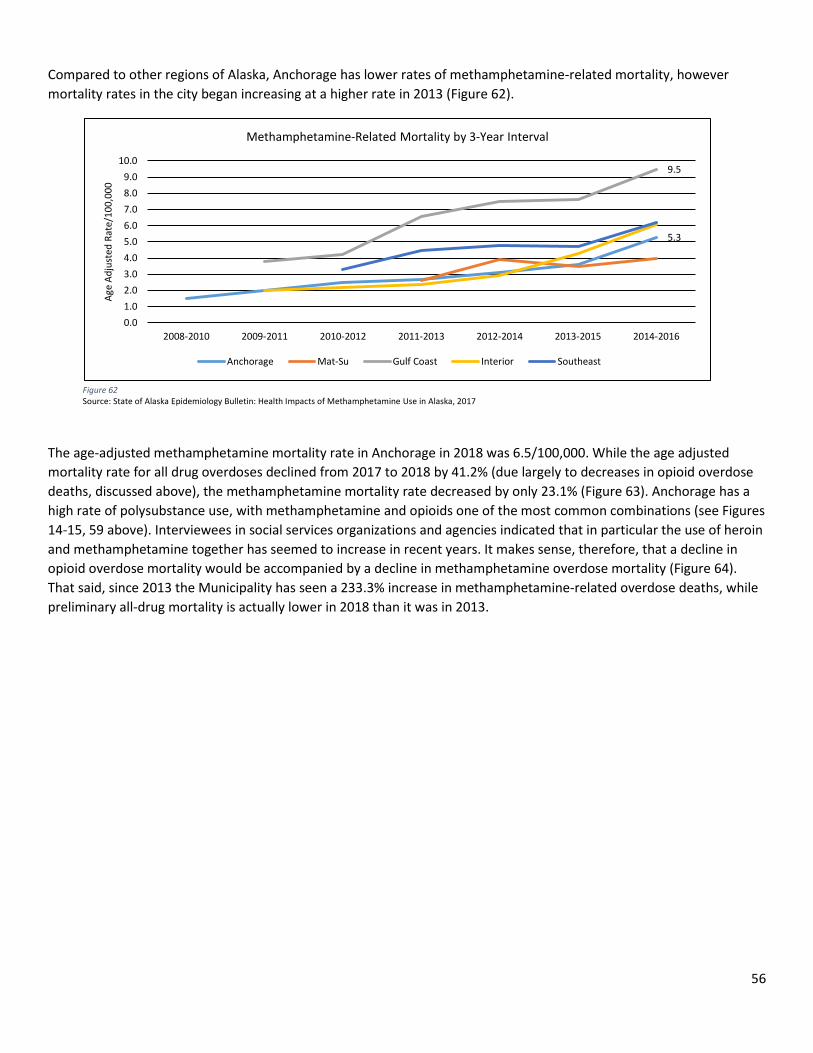
56
Compared to other regions of Alaska, Anchorage has lower rates of methamphetamine-related mortality, however mortality rates in the city began increasing at a higher rate in 2013 (Figure 62).
The age-adjusted methamphetamine mortality rate in Anchorage in 2018 was 6.5/100,000. While the age adjusted mortality rate for all drug overdoses declined from 2017 to 2018 by 41.2% (due largely to decreases in opioid overdose deaths, discussed above), the methamphetamine mortality rate decreased by only 23.1% (Figure 63). Anchorage has a high rate of polysubstance use, with methamphetamine and opioids one of the most common combinations (see Figures 14-15, 59 above). Interviewees in social services organizations and agencies indicated that in particular the use of heroin and methamphetamine together has seemed to increase in recent years. It makes sense, therefore, that a decline in opioid overdose mortality would be accompanied by a decline in methamphetamine overdose mortality (Figure 64). That said, since 2013 the Municipality has seen a 233.3% increase in methamphetamine-related overdose deaths, while preliminary all-drug mortality is actually lower in 2018 than it was in 2013.
5.3
9.5
0.01.02.03.04.05.06.07.08.09.0
10.0
2008-2010 2009-2011 2010-2012 2011-2013 2012-2014 2013-2015 2014-2016
Age
Adju
sted
Rat
e/10
0,00
0
Methamphetamine-Related Mortality by 3-Year Interval
Anchorage Mat-Su Gulf Coast Interior Southeast
Figure 62 Source: State of Alaska Epidemiology Bulletin: Health Impacts of Methamphetamine Use in Alaska, 2017
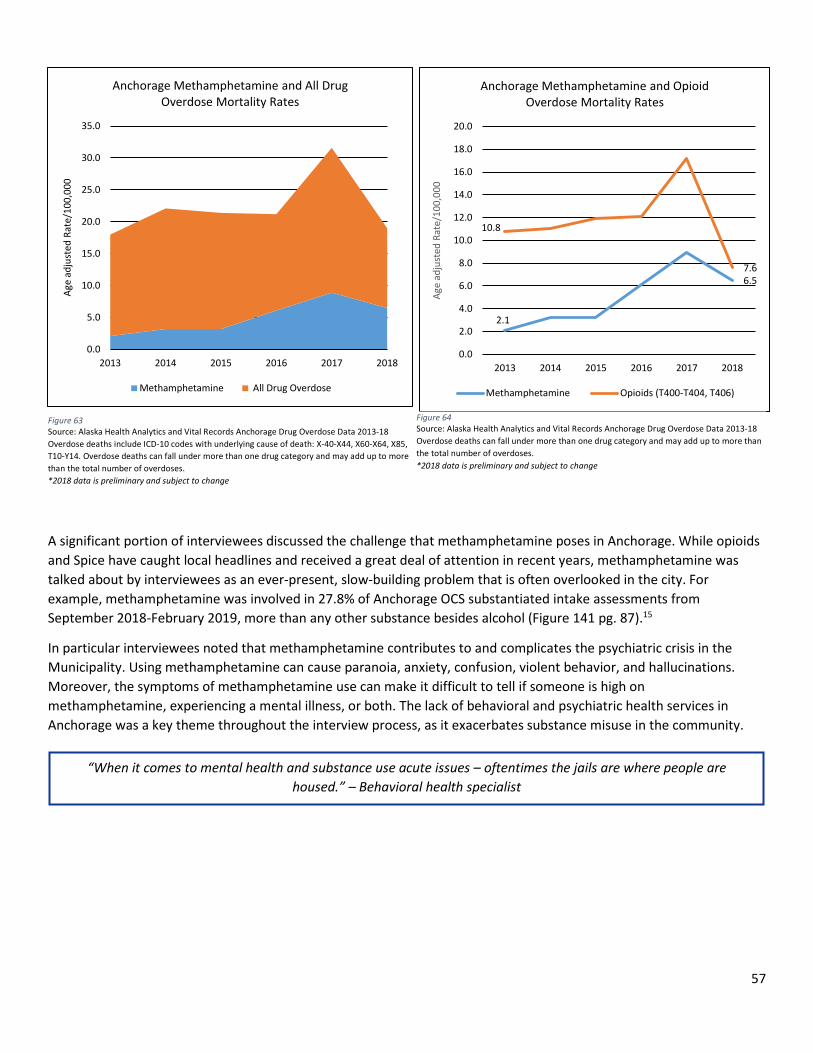
57
A significant portion of interviewees discussed the challenge that methamphetamine poses in Anchorage. While opioids and Spice have caught local headlines and received a great deal of attention in recent years, methamphetamine was talked about by interviewees as an ever-present, slow-building problem that is often overlooked in the city. For example, methamphetamine was involved in 27.8% of Anchorage OCS substantiated intake assessments from September 2018-February 2019, more than any other substance besides alcohol (Figure 141 pg. 87).15
In particular interviewees noted that methamphetamine contributes to and complicates the psychiatric crisis in the Municipality. Using methamphetamine can cause paranoia, anxiety, confusion, violent behavior, and hallucinations. Moreover, the symptoms of methamphetamine use can make it difficult to tell if someone is high on methamphetamine, experiencing a mental illness, or both. The lack of behavioral and psychiatric health services in Anchorage was a key theme throughout the interview process, as it exacerbates substance misuse in the community.
Figure 63 Source: Alaska Health Analytics and Vital Records Anchorage Drug Overdose Data 2013-18 Overdose deaths include ICD-10 codes with underlying cause of death: X-40-X44, X60-X64, X85, T10-Y14. Overdose deaths can fall under more than one drug category and may add up to more than the total number of overdoses. *2018 data is preliminary and subject to change
2.1
6.5
10.8
7.6
0.0
2.0
4.0
6.0
8.0
10.0
12.0
14.0
16.0
18.0
20.0
2013 2014 2015 2016 2017 2018
Age
adju
sted
Rat
e/10
0,00
0
Anchorage Methamphetamine and Opioid Overdose Mortality Rates
Methamphetamine Opioids (T400-T404, T406)
Figure 64 Source: Alaska Health Analytics and Vital Records Anchorage Drug Overdose Data 2013-18 Overdose deaths can fall under more than one drug category and may add up to more than the total number of overdoses. *2018 data is preliminary and subject to change
“When it comes to mental health and substance use acute issues – oftentimes the jails are where people are housed.” – Behavioral health specialist
0.0
5.0
10.0
15.0
20.0
25.0
30.0
35.0
2013 2014 2015 2016 2017 2018
Age
adju
sted
Rat
e/10
0,00
0
Anchorage Methamphetamine and All Drug Overdose Mortality Rates
Methamphetamine All Drug Overdose
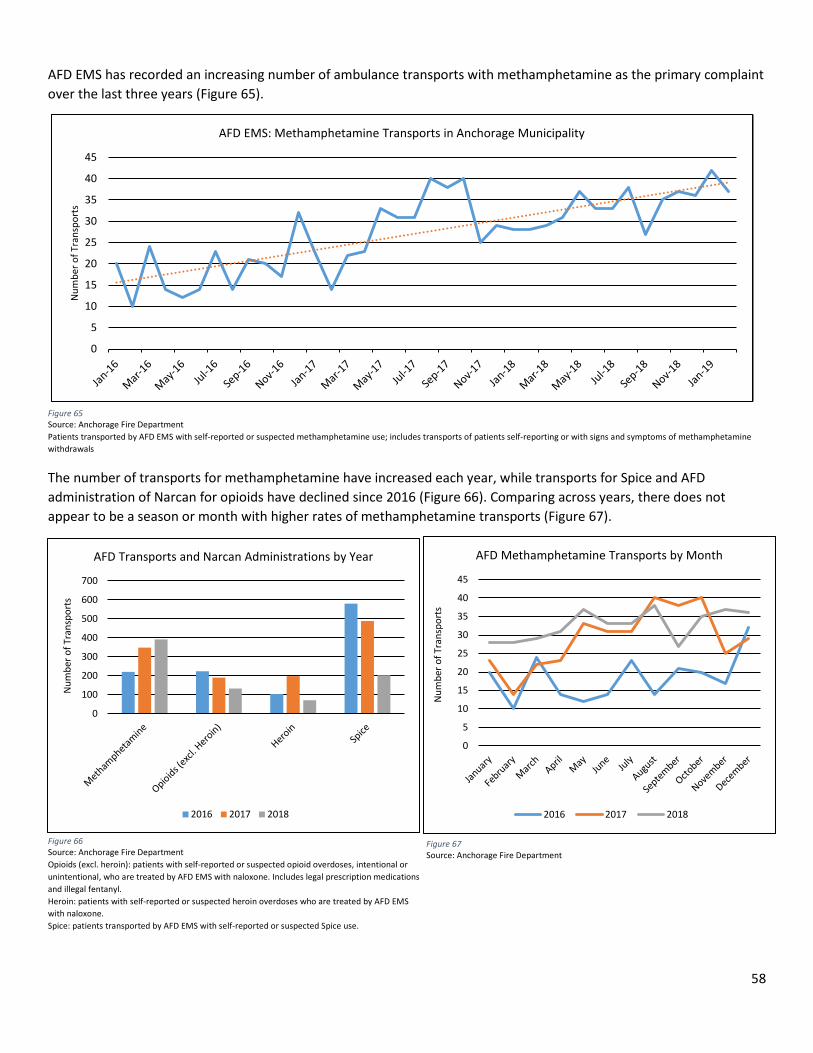
58
AFD EMS has recorded an increasing number of ambulance transports with methamphetamine as the primary complaint over the last three years (Figure 65).
The number of transports for methamphetamine have increased each year, while transports for Spice and AFD administration of Narcan for opioids have declined since 2016 (Figure 66). Comparing across years, there does not appear to be a season or month with higher rates of methamphetamine transports (Figure 67).
0
5
10
15
20
25
30
35
40
45
Num
ber o
f Tra
nspo
rts
AFD EMS: Methamphetamine Transports in Anchorage Municipality
Figure 65 Source: Anchorage Fire Department Patients transported by AFD EMS with self-reported or suspected methamphetamine use; includes transports of patients self-reporting or with signs and symptoms of methamphetamine withdrawals
0
100
200
300
400
500
600
700
Num
ber o
f Tra
nspo
rts
AFD Transports and Narcan Administrations by Year
2016 2017 2018
Figure 66 Source: Anchorage Fire Department Opioids (excl. heroin): patients with self-reported or suspected opioid overdoses, intentional or unintentional, who are treated by AFD EMS with naloxone. Includes legal prescription medications and illegal fentanyl. Heroin: patients with self-reported or suspected heroin overdoses who are treated by AFD EMS with naloxone. Spice: patients transported by AFD EMS with self-reported or suspected Spice use.
0
5
10
15
20
25
30
35
40
45
Num
ber o
f Tra
nspo
rts
AFD Methamphetamine Transports by Month
2016 2017 2018
Figure 67 Source: Anchorage Fire Department
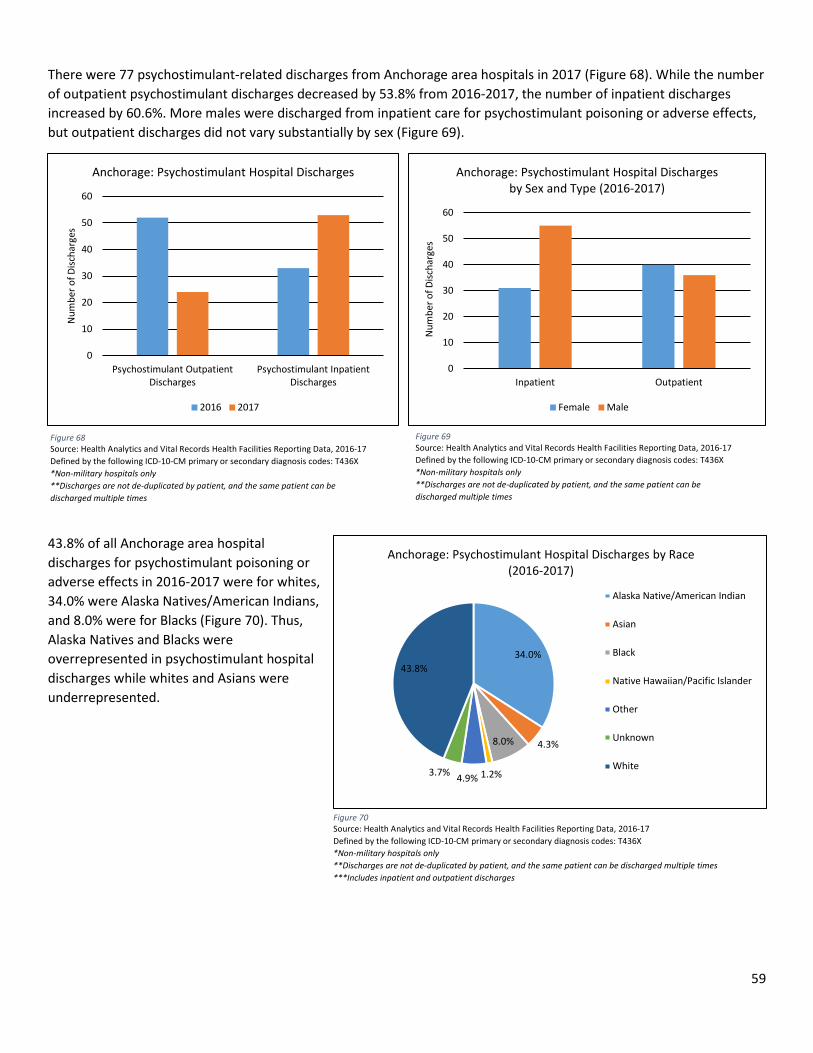
59
There were 77 psychostimulant-related discharges from Anchorage area hospitals in 2017 (Figure 68). While the number of outpatient psychostimulant discharges decreased by 53.8% from 2016-2017, the number of inpatient discharges increased by 60.6%. More males were discharged from inpatient care for psychostimulant poisoning or adverse effects, but outpatient discharges did not vary substantially by sex (Figure 69).
43.8% of all Anchorage area hospital discharges for psychostimulant poisoning or adverse effects in 2016-2017 were for whites, 34.0% were Alaska Natives/American Indians, and 8.0% were for Blacks (Figure 70). Thus, Alaska Natives and Blacks were overrepresented in psychostimulant hospital discharges while whites and Asians were underrepresented.
0
10
20
30
40
50
60
Psychostimulant OutpatientDischarges
Psychostimulant InpatientDischarges
Num
ber o
f Disc
harg
es
Anchorage: Psychostimulant Hospital Discharges
2016 2017
0
10
20
30
40
50
60
Inpatient Outpatient
Num
ber o
f Disc
harg
es
Anchorage: Psychostimulant Hospital Discharges by Sex and Type (2016-2017)
Female Male
Figure 68 Source: Health Analytics and Vital Records Health Facilities Reporting Data, 2016-17 Defined by the following ICD-10-CM primary or secondary diagnosis codes: T436X *Non-military hospitals only **Discharges are not de-duplicated by patient, and the same patient can be discharged multiple times
Figure 69 Source: Health Analytics and Vital Records Health Facilities Reporting Data, 2016-17 Defined by the following ICD-10-CM primary or secondary diagnosis codes: T436X *Non-military hospitals only **Discharges are not de-duplicated by patient, and the same patient can be discharged multiple times
Figure 70 Source: Health Analytics and Vital Records Health Facilities Reporting Data, 2016-17 Defined by the following ICD-10-CM primary or secondary diagnosis codes: T436X *Non-military hospitals only **Discharges are not de-duplicated by patient, and the same patient can be discharged multiple times ***Includes inpatient and outpatient discharges
34.0%
4.3%8.0%
1.2%4.9%3.7%
43.8%
Anchorage: Psychostimulant Hospital Discharges by Race (2016-2017)
Alaska Native/American Indian
Asian
Black
Native Hawaiian/Pacific Islander
Other
Unknown
White
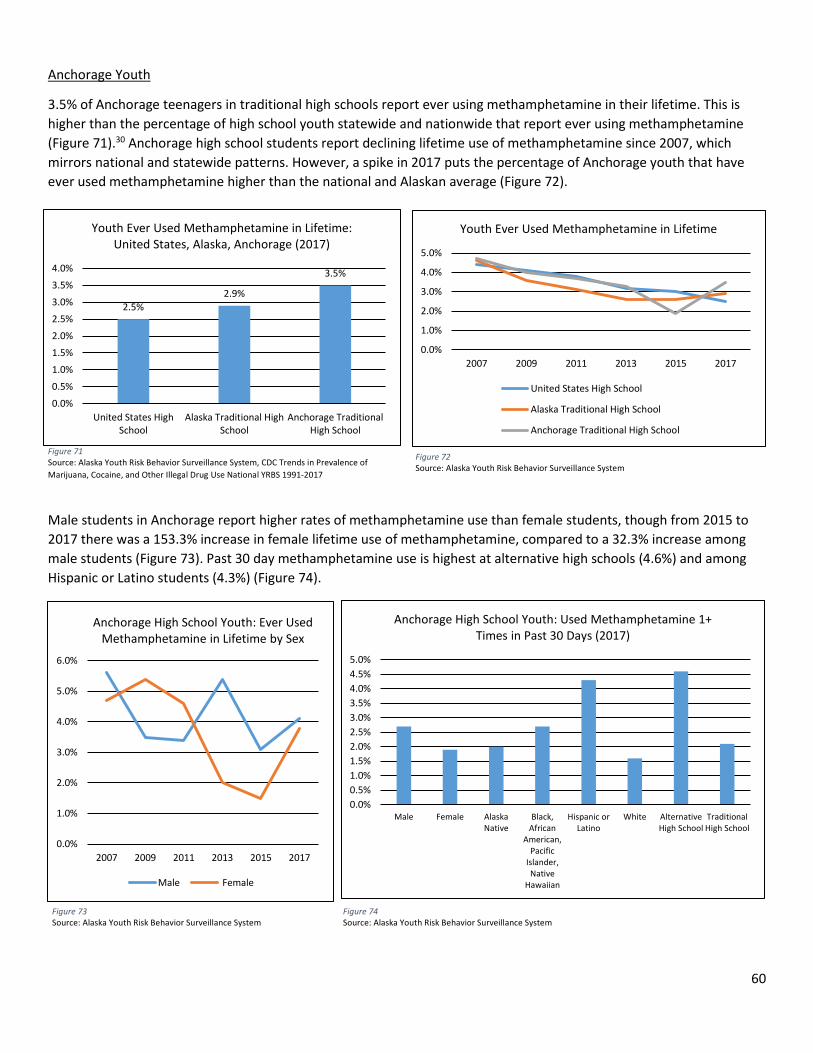
60
Anchorage Youth
3.5% of Anchorage teenagers in traditional high schools report ever using methamphetamine in their lifetime. This is higher than the percentage of high school youth statewide and nationwide that report ever using methamphetamine (Figure 71).30 Anchorage high school students report declining lifetime use of methamphetamine since 2007, which mirrors national and statewide patterns. However, a spike in 2017 puts the percentage of Anchorage youth that have ever used methamphetamine higher than the national and Alaskan average (Figure 72).
Male students in Anchorage report higher rates of methamphetamine use than female students, though from 2015 to 2017 there was a 153.3% increase in female lifetime use of methamphetamine, compared to a 32.3% increase among male students (Figure 73). Past 30 day methamphetamine use is highest at alternative high schools (4.6%) and among Hispanic or Latino students (4.3%) (Figure 74).
Figure 71 Source: Alaska Youth Risk Behavior Surveillance System, CDC Trends in Prevalence of Marijuana, Cocaine, and Other Illegal Drug Use National YRBS 1991-2017
Figure 72 Source: Alaska Youth Risk Behavior Surveillance System
0.0%
1.0%
2.0%
3.0%
4.0%
5.0%
6.0%
2007 2009 2011 2013 2015 2017
Anchorage High School Youth: Ever Used Methamphetamine in Lifetime by Sex
Male Female
Figure 73 Source: Alaska Youth Risk Behavior Surveillance System
Figure 74 Source: Alaska Youth Risk Behavior Surveillance System
2.5%2.9%
3.5%
0.0%
0.5%
1.0%
1.5%
2.0%
2.5%
3.0%
3.5%
4.0%
United States HighSchool
Alaska Traditional HighSchool
Anchorage TraditionalHigh School
Youth Ever Used Methamphetamine in Lifetime: United States, Alaska, Anchorage (2017)
0.0%
1.0%
2.0%
3.0%
4.0%
5.0%
2007 2009 2011 2013 2015 2017
Youth Ever Used Methamphetamine in Lifetime
United States High School
Alaska Traditional High School
Anchorage Traditional High School
0.0%0.5%1.0%1.5%2.0%2.5%3.0%3.5%4.0%4.5%5.0%
Male Female AlaskaNative
Black,African
American,Pacific
Islander,Native
Hawaiian
Hispanic orLatino
White AlternativeHigh School
TraditionalHigh School
Anchorage High School Youth: Used Methamphetamine 1+ Times in Past 30 Days (2017)
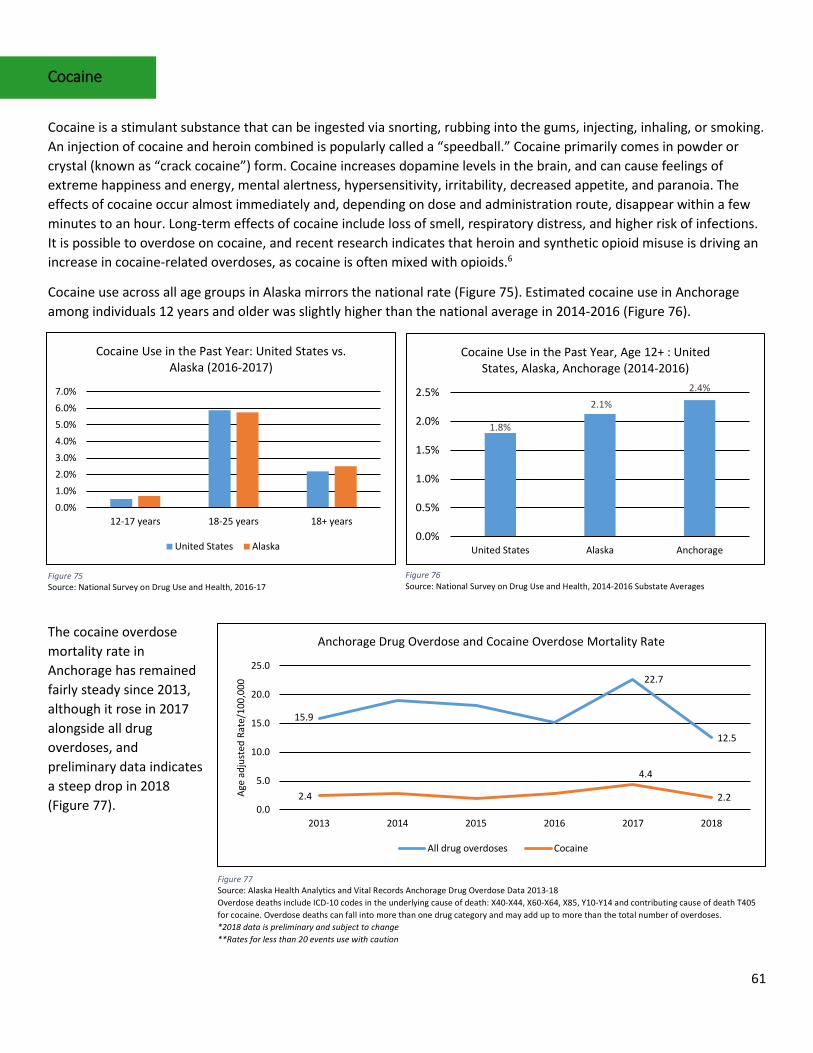
61
Cocaine
Cocaine is a stimulant substance that can be ingested via snorting, rubbing into the gums, injecting, inhaling, or smoking. An injection of cocaine and heroin combined is popularly called a “speedball.” Cocaine primarily comes in powder or crystal (known as “crack cocaine”) form. Cocaine increases dopamine levels in the brain, and can cause feelings of extreme happiness and energy, mental alertness, hypersensitivity, irritability, decreased appetite, and paranoia. The effects of cocaine occur almost immediately and, depending on dose and administration route, disappear within a few minutes to an hour. Long-term effects of cocaine include loss of smell, respiratory distress, and higher risk of infections. It is possible to overdose on cocaine, and recent research indicates that heroin and synthetic opioid misuse is driving an increase in cocaine-related overdoses, as cocaine is often mixed with opioids.6
Cocaine use across all age groups in Alaska mirrors the national rate (Figure 75). Estimated cocaine use in Anchorage among individuals 12 years and older was slightly higher than the national average in 2014-2016 (Figure 76).
The cocaine overdose mortality rate in Anchorage has remained fairly steady since 2013, although it rose in 2017 alongside all drug overdoses, and preliminary data indicates a steep drop in 2018 (Figure 77).
0.0%1.0%2.0%3.0%4.0%5.0%6.0%7.0%
12-17 years 18-25 years 18+ years
Cocaine Use in the Past Year: United States vs. Alaska (2016-2017)
United States Alaska
Figure 75 Source: National Survey on Drug Use and Health, 2016-17
1.8%
2.1%2.4%
0.0%
0.5%
1.0%
1.5%
2.0%
2.5%
United States Alaska Anchorage
Cocaine Use in the Past Year, Age 12+ : United States, Alaska, Anchorage (2014-2016)
Figure 76 Source: National Survey on Drug Use and Health, 2014-2016 Substate Averages
15.9
22.7
12.5
2.4
4.4
2.20.0
5.0
10.0
15.0
20.0
25.0
2013 2014 2015 2016 2017 2018
Age
adju
sted
Rat
e/10
0,00
0
Anchorage Drug Overdose and Cocaine Overdose Mortality Rate
All drug overdoses Cocaine
Figure 77 Source: Alaska Health Analytics and Vital Records Anchorage Drug Overdose Data 2013-18 Overdose deaths include ICD-10 codes in the underlying cause of death: X40-X44, X60-X64, X85, Y10-Y14 and contributing cause of death T405 for cocaine. Overdose deaths can fall into more than one drug category and may add up to more than the total number of overdoses. *2018 data is preliminary and subject to change **Rates for less than 20 events use with caution
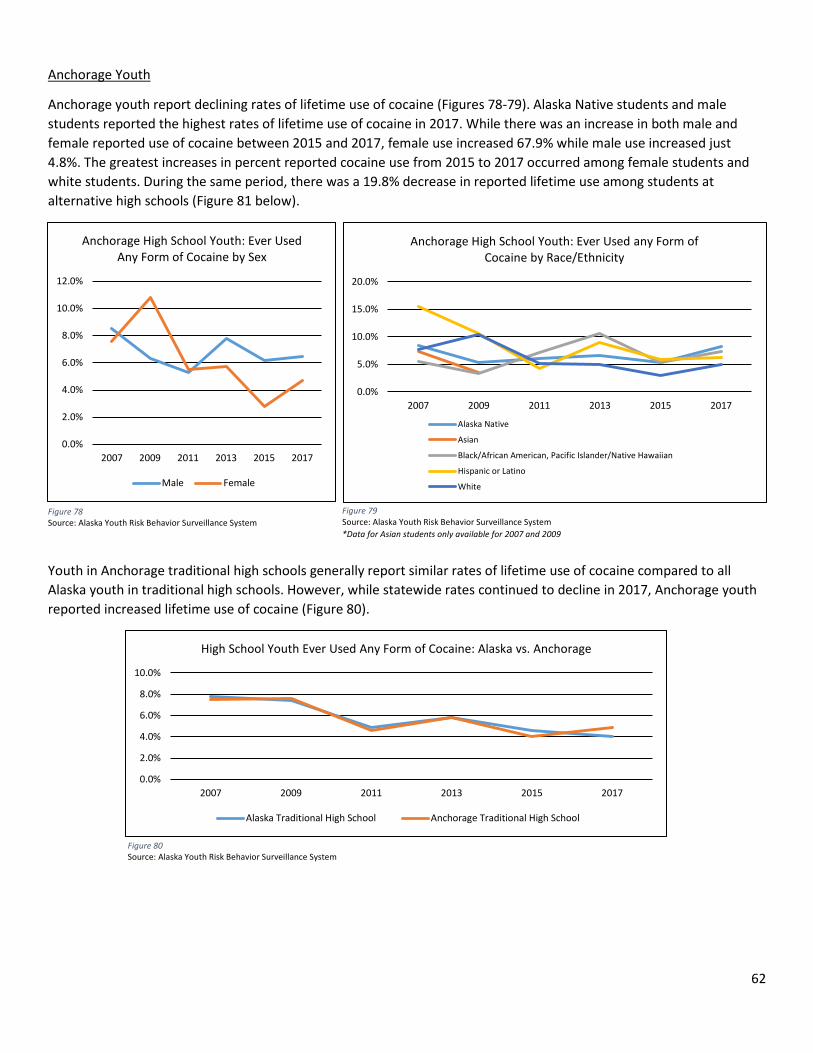
62
Anchorage Youth
Anchorage youth report declining rates of lifetime use of cocaine (Figures 78-79). Alaska Native students and male students reported the highest rates of lifetime use of cocaine in 2017. While there was an increase in both male and female reported use of cocaine between 2015 and 2017, female use increased 67.9% while male use increased just 4.8%. The greatest increases in percent reported cocaine use from 2015 to 2017 occurred among female students and white students. During the same period, there was a 19.8% decrease in reported lifetime use among students at alternative high schools (Figure 81 below).
Youth in Anchorage traditional high schools generally report similar rates of lifetime use of cocaine compared to all Alaska youth in traditional high schools. However, while statewide rates continued to decline in 2017, Anchorage youth reported increased lifetime use of cocaine (Figure 80).
Figure 78 Source: Alaska Youth Risk Behavior Surveillance System
0.0%
2.0%
4.0%
6.0%
8.0%
10.0%
2007 2009 2011 2013 2015 2017
High School Youth Ever Used Any Form of Cocaine: Alaska vs. Anchorage
Alaska Traditional High School Anchorage Traditional High School
Figure 80 Source: Alaska Youth Risk Behavior Surveillance System
0.0%
2.0%
4.0%
6.0%
8.0%
10.0%
12.0%
2007 2009 2011 2013 2015 2017
Anchorage High School Youth: Ever Used Any Form of Cocaine by Sex
Male Female
Figure 79 Source: Alaska Youth Risk Behavior Surveillance System *Data for Asian students only available for 2007 and 2009
0.0%
5.0%
10.0%
15.0%
20.0%
2007 2009 2011 2013 2015 2017
Anchorage High School Youth: Ever Used any Form of Cocaine by Race/Ethnicity
Alaska Native
Asian
Black/African American, Pacific Islander/Native Hawaiian
Hispanic or Latino
White
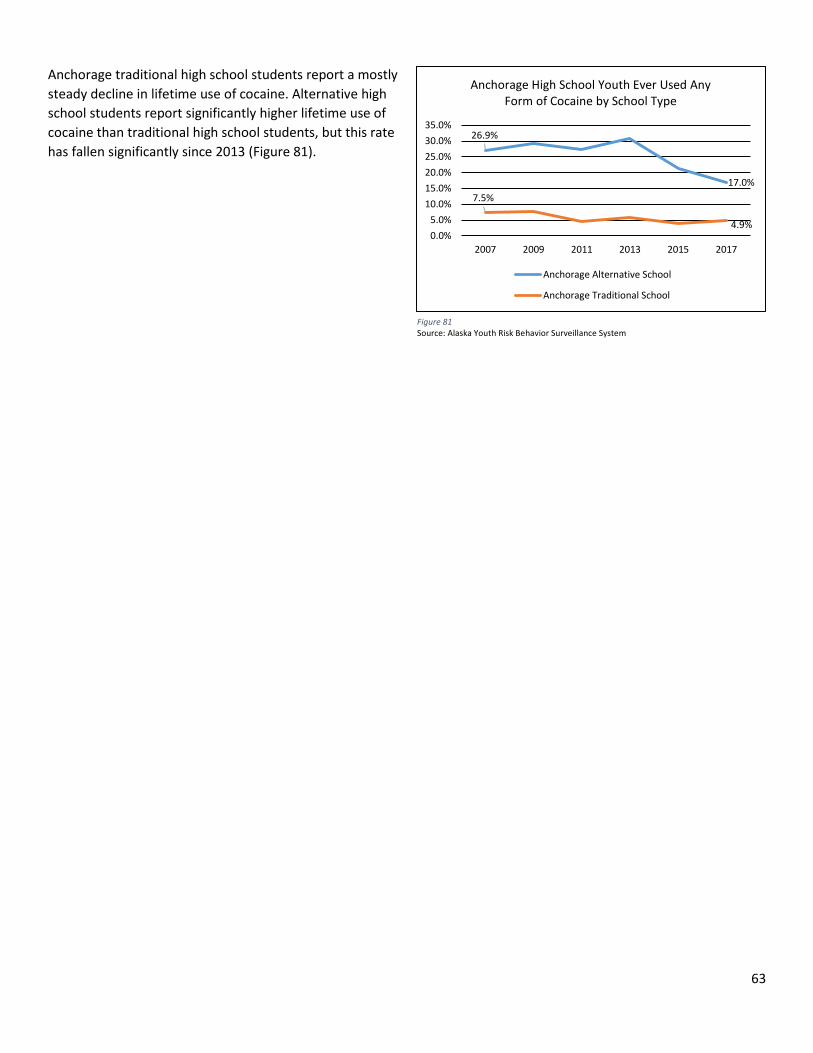
63
Anchorage traditional high school students report a mostly steady decline in lifetime use of cocaine. Alternative high school students report significantly higher lifetime use of cocaine than traditional high school students, but this rate has fallen significantly since 2013 (Figure 81).
26.9%
17.0%7.5%
4.9%0.0%5.0%
10.0%15.0%20.0%25.0%30.0%35.0%
2007 2009 2011 2013 2015 2017
Anchorage High School Youth Ever Used Any Form of Cocaine by School Type
Anchorage Alternative School
Anchorage Traditional School
Figure 81 Source: Alaska Youth Risk Behavior Surveillance System
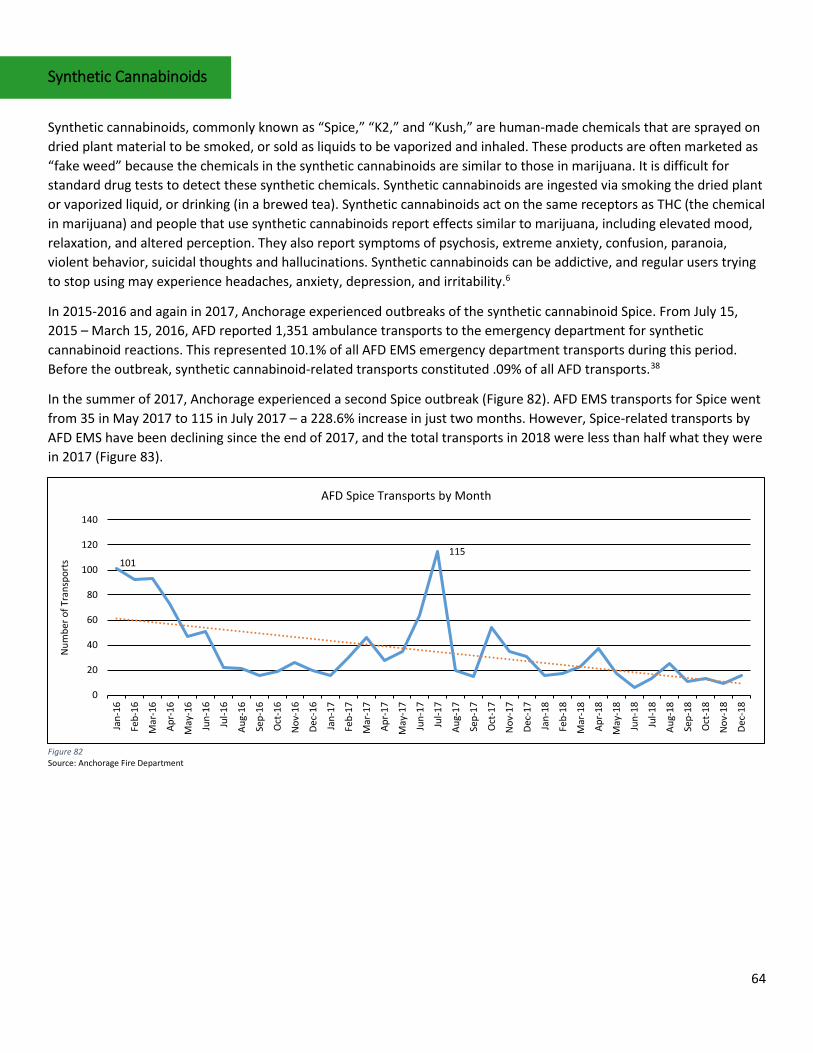
64
Synthetic Cannabinoids
Synthetic cannabinoids, commonly known as “Spice,” “K2,” and “Kush,” are human-made chemicals that are sprayed on dried plant material to be smoked, or sold as liquids to be vaporized and inhaled. These products are often marketed as “fake weed” because the chemicals in the synthetic cannabinoids are similar to those in marijuana. It is difficult for standard drug tests to detect these synthetic chemicals. Synthetic cannabinoids are ingested via smoking the dried plant or vaporized liquid, or drinking (in a brewed tea). Synthetic cannabinoids act on the same receptors as THC (the chemical in marijuana) and people that use synthetic cannabinoids report effects similar to marijuana, including elevated mood, relaxation, and altered perception. They also report symptoms of psychosis, extreme anxiety, confusion, paranoia, violent behavior, suicidal thoughts and hallucinations. Synthetic cannabinoids can be addictive, and regular users trying to stop using may experience headaches, anxiety, depression, and irritability.6
In 2015-2016 and again in 2017, Anchorage experienced outbreaks of the synthetic cannabinoid Spice. From July 15, 2015 – March 15, 2016, AFD reported 1,351 ambulance transports to the emergency department for synthetic cannabinoid reactions. This represented 10.1% of all AFD EMS emergency department transports during this period. Before the outbreak, synthetic cannabinoid-related transports constituted .09% of all AFD transports.38
In the summer of 2017, Anchorage experienced a second Spice outbreak (Figure 82). AFD EMS transports for Spice went from 35 in May 2017 to 115 in July 2017 – a 228.6% increase in just two months. However, Spice-related transports by AFD EMS have been declining since the end of 2017, and the total transports in 2018 were less than half what they were in 2017 (Figure 83).
Figure 82 Source: Anchorage Fire Department
101115
0
20
40
60
80
100
120
140
Jan-
16
Feb-
16
Mar
-16
Apr-
16
May
-16
Jun-
16
Jul-1
6
Aug-
16
Sep-
16
Oct
-16
Nov
-16
Dec-
16
Jan-
17
Feb-
17
Mar
-17
Apr-
17
May
-17
Jun-
17
Jul-1
7
Aug-
17
Sep-
17
Oct
-17
Nov
-17
Dec-
17
Jan-
18
Feb-
18
Mar
-18
Apr-
18
May
-18
Jun-
18
Jul-1
8
Aug-
18
Sep-
18
Oct
-18
Nov
-18
Dec-
18
Num
ber o
f Tra
nspo
rts
AFD Spice Transports by Month
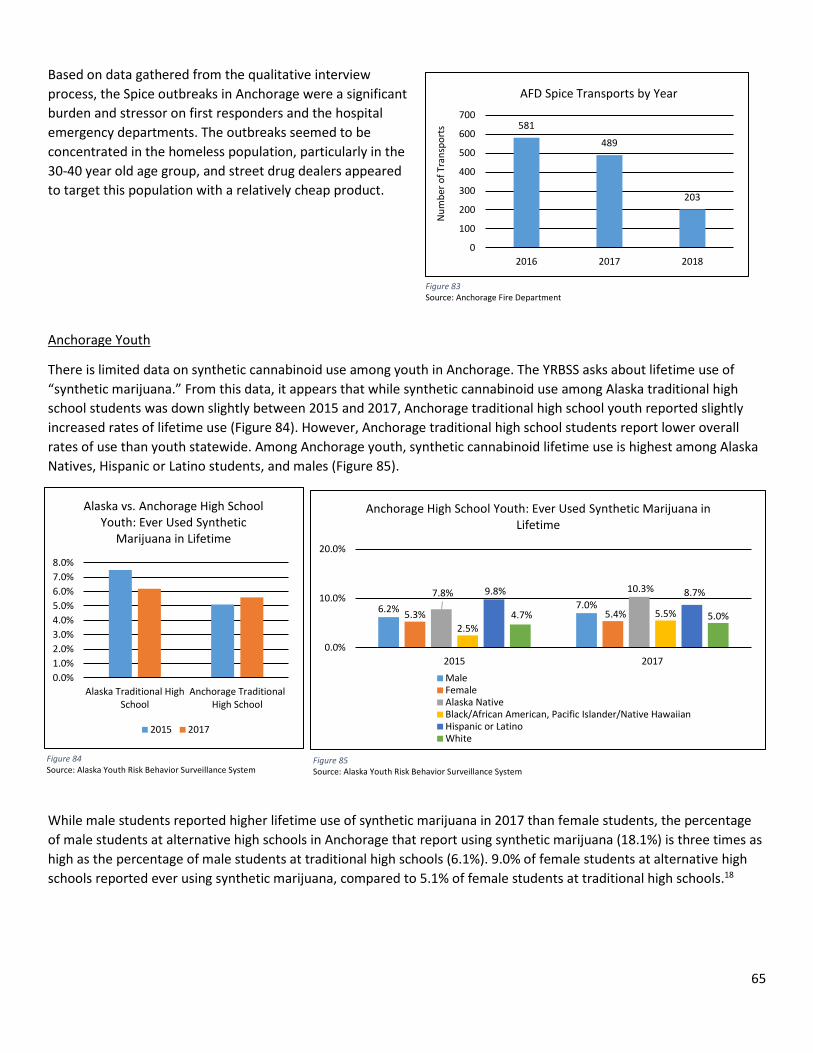
65
Based on data gathered from the qualitative interview process, the Spice outbreaks in Anchorage were a significant burden and stressor on first responders and the hospital emergency departments. The outbreaks seemed to be concentrated in the homeless population, particularly in the 30-40 year old age group, and street drug dealers appeared to target this population with a relatively cheap product.
Anchorage Youth
There is limited data on synthetic cannabinoid use among youth in Anchorage. The YRBSS asks about lifetime use of “synthetic marijuana.” From this data, it appears that while synthetic cannabinoid use among Alaska traditional high school students was down slightly between 2015 and 2017, Anchorage traditional high school youth reported slightly increased rates of lifetime use (Figure 84). However, Anchorage traditional high school students report lower overall rates of use than youth statewide. Among Anchorage youth, synthetic cannabinoid lifetime use is highest among Alaska Natives, Hispanic or Latino students, and males (Figure 85).
While male students reported higher lifetime use of synthetic marijuana in 2017 than female students, the percentage of male students at alternative high schools in Anchorage that report using synthetic marijuana (18.1%) is three times as high as the percentage of male students at traditional high schools (6.1%). 9.0% of female students at alternative high schools reported ever using synthetic marijuana, compared to 5.1% of female students at traditional high schools.18
581
489
203
0
100
200
300
400
500
600
700
2016 2017 2018
Num
ber o
f Tra
nspo
rts
AFD Spice Transports by Year
Figure 83 Source: Anchorage Fire Department
0.0%1.0%2.0%3.0%4.0%5.0%6.0%7.0%8.0%
Alaska Traditional HighSchool
Anchorage TraditionalHigh School
Alaska vs. Anchorage High School Youth: Ever Used Synthetic
Marijuana in Lifetime
2015 2017
Figure 84 Source: Alaska Youth Risk Behavior Surveillance System
Figure 85 Source: Alaska Youth Risk Behavior Surveillance System
6.2% 7.0%5.3% 5.4%
7.8% 10.3%
2.5%5.5%
9.8% 8.7%
4.7% 5.0%
0.0%
10.0%
20.0%
2015 2017
Anchorage High School Youth: Ever Used Synthetic Marijuana in Lifetime
MaleFemaleAlaska NativeBlack/African American, Pacific Islander/Native HawaiianHispanic or LatinoWhite
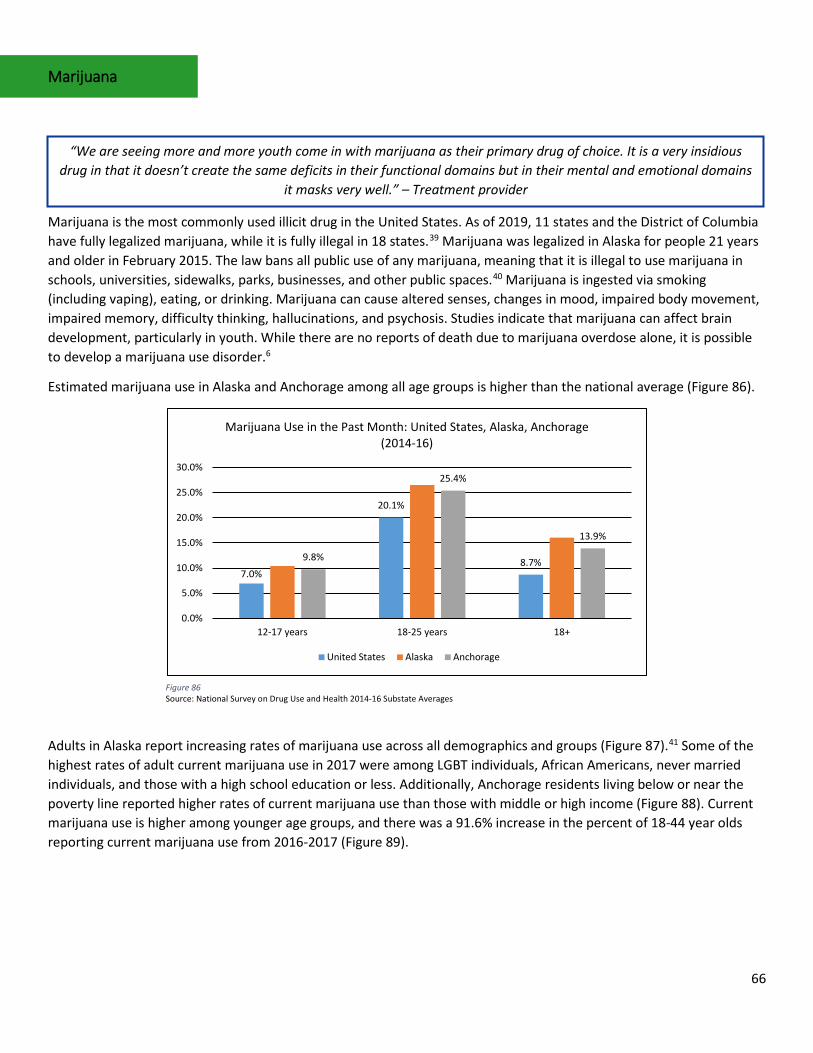
66
Marijuana
Marijuana is the most commonly used illicit drug in the United States. As of 2019, 11 states and the District of Columbia have fully legalized marijuana, while it is fully illegal in 18 states.39 Marijuana was legalized in Alaska for people 21 years and older in February 2015. The law bans all public use of any marijuana, meaning that it is illegal to use marijuana in schools, universities, sidewalks, parks, businesses, and other public spaces.40 Marijuana is ingested via smoking (including vaping), eating, or drinking. Marijuana can cause altered senses, changes in mood, impaired body movement, impaired memory, difficulty thinking, hallucinations, and psychosis. Studies indicate that marijuana can affect brain development, particularly in youth. While there are no reports of death due to marijuana overdose alone, it is possible to develop a marijuana use disorder.6
Estimated marijuana use in Alaska and Anchorage among all age groups is higher than the national average (Figure 86).
Adults in Alaska report increasing rates of marijuana use across all demographics and groups (Figure 87).41 Some of the highest rates of adult current marijuana use in 2017 were among LGBT individuals, African Americans, never married individuals, and those with a high school education or less. Additionally, Anchorage residents living below or near the poverty line reported higher rates of current marijuana use than those with middle or high income (Figure 88). Current marijuana use is higher among younger age groups, and there was a 91.6% increase in the percent of 18-44 year olds reporting current marijuana use from 2016-2017 (Figure 89).
“We are seeing more and more youth come in with marijuana as their primary drug of choice. It is a very insidious drug in that it doesn’t create the same deficits in their functional domains but in their mental and emotional domains
it masks very well.” – Treatment provider
7.0%
20.1%
8.7%9.8%
25.4%
13.9%
0.0%
5.0%
10.0%
15.0%
20.0%
25.0%
30.0%
12-17 years 18-25 years 18+
Marijuana Use in the Past Month: United States, Alaska, Anchorage (2014-16)
United States Alaska Anchorage
Figure 86 Source: National Survey on Drug Use and Health 2014-16 Substate Averages
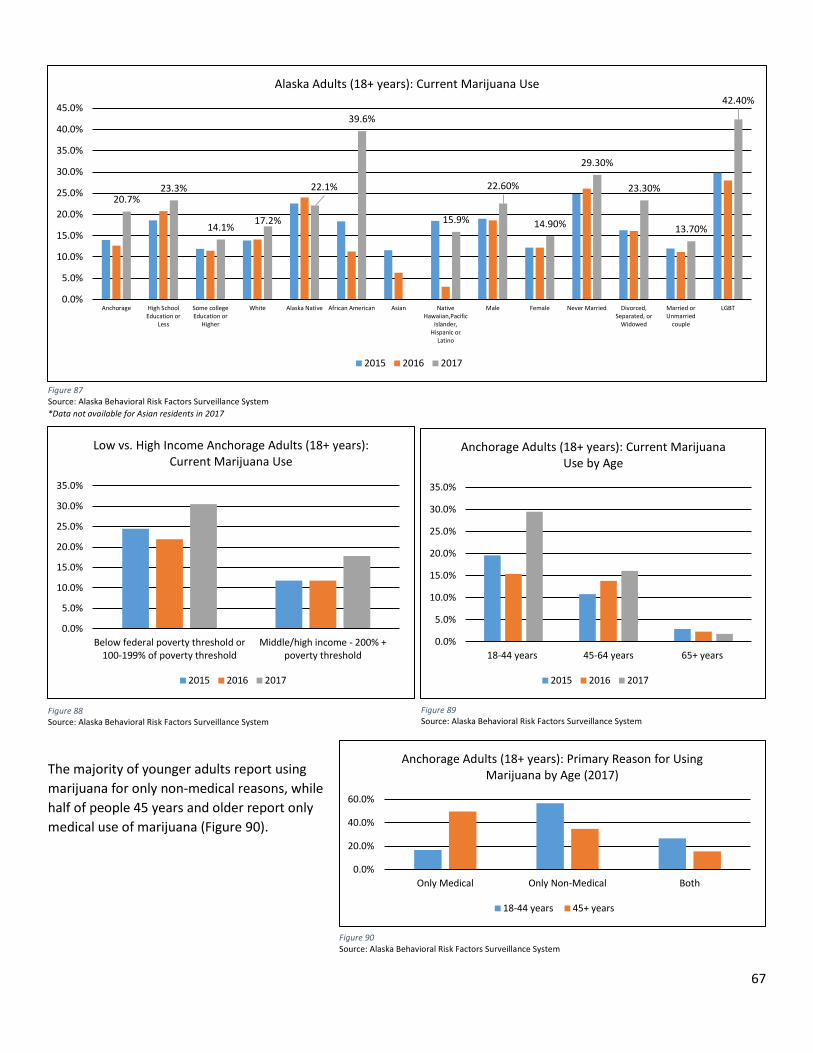
67
The majority of younger adults report using marijuana for only non-medical reasons, while half of people 45 years and older report only medical use of marijuana (Figure 90).
Figure 88 Source: Alaska Behavioral Risk Factors Surveillance System
0.0%
5.0%
10.0%
15.0%
20.0%
25.0%
30.0%
35.0%
Below federal poverty threshold or100-199% of poverty threshold
Middle/high income - 200% +poverty threshold
Low vs. High Income Anchorage Adults (18+ years): Current Marijuana Use
2015 2016 2017
Figure 87 Source: Alaska Behavioral Risk Factors Surveillance System *Data not available for Asian residents in 2017
0.0%
5.0%
10.0%
15.0%
20.0%
25.0%
30.0%
35.0%
18-44 years 45-64 years 65+ years
Anchorage Adults (18+ years): Current Marijuana Use by Age
2015 2016 2017
Figure 89 Source: Alaska Behavioral Risk Factors Surveillance System
0.0%
20.0%
40.0%
60.0%
Only Medical Only Non-Medical Both
Anchorage Adults (18+ years): Primary Reason for Using Marijuana by Age (2017)
18-44 years 45+ years
Figure 90 Source: Alaska Behavioral Risk Factors Surveillance System
20.7%23.3%
14.1%17.2%
22.1%
39.6%
15.9%
22.60%
14.90%
29.30%
23.30%
13.70%
42.40%
0.0%
5.0%
10.0%
15.0%
20.0%
25.0%
30.0%
35.0%
40.0%
45.0%
Anchorage High SchoolEducation or
Less
Some collegeEducation or
Higher
White Alaska Native African American Asian NativeHawaiian,Pacific
Islander,Hispanic or
Latino
Male Female Never Married Divorced,Separated, or
Widowed
Married orUnmarried
couple
LGBT
Alaska Adults (18+ years): Current Marijuana Use
2015 2016 2017
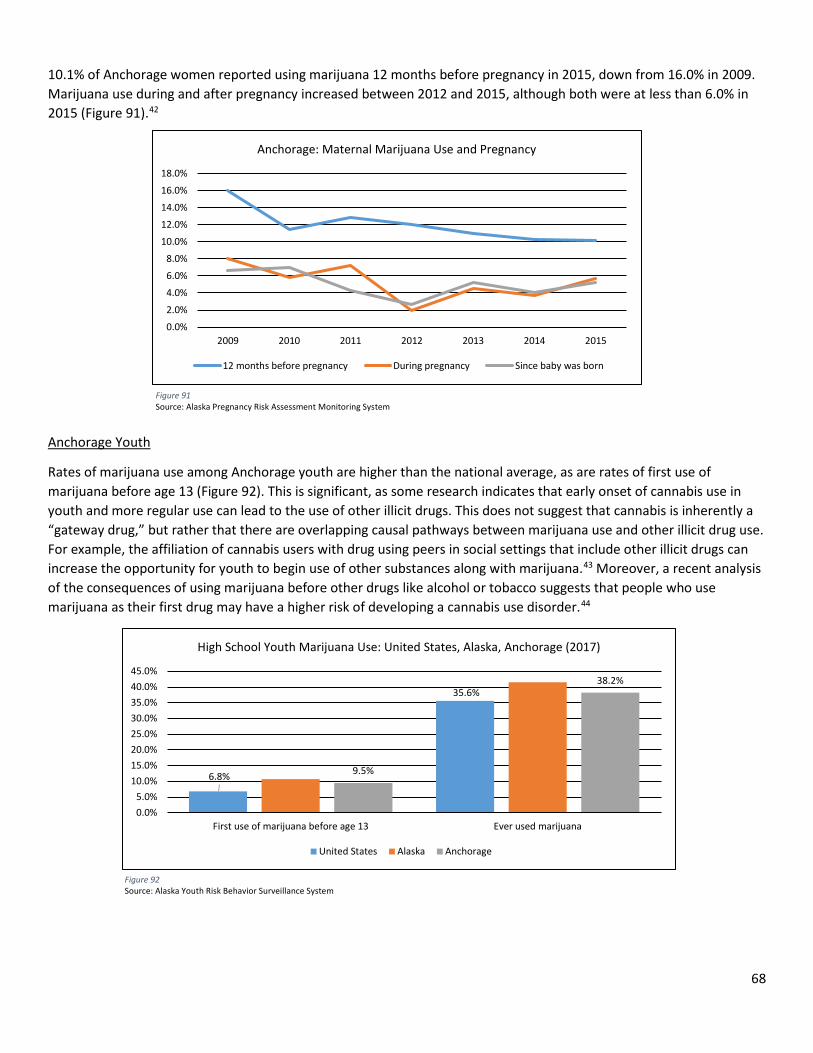
68
10.1% of Anchorage women reported using marijuana 12 months before pregnancy in 2015, down from 16.0% in 2009. Marijuana use during and after pregnancy increased between 2012 and 2015, although both were at less than 6.0% in 2015 (Figure 91).42
Anchorage Youth
Rates of marijuana use among Anchorage youth are higher than the national average, as are rates of first use of marijuana before age 13 (Figure 92). This is significant, as some research indicates that early onset of cannabis use in youth and more regular use can lead to the use of other illicit drugs. This does not suggest that cannabis is inherently a “gateway drug,” but rather that there are overlapping causal pathways between marijuana use and other illicit drug use. For example, the affiliation of cannabis users with drug using peers in social settings that include other illicit drugs can increase the opportunity for youth to begin use of other substances along with marijuana.43 Moreover, a recent analysis of the consequences of using marijuana before other drugs like alcohol or tobacco suggests that people who use marijuana as their first drug may have a higher risk of developing a cannabis use disorder.44
0.0%
2.0%
4.0%
6.0%
8.0%
10.0%
12.0%
14.0%
16.0%
18.0%
2009 2010 2011 2012 2013 2014 2015
Anchorage: Maternal Marijuana Use and Pregnancy
12 months before pregnancy During pregnancy Since baby was born
Figure 91 Source: Alaska Pregnancy Risk Assessment Monitoring System
6.8%
35.6%
9.5%
38.2%
0.0%5.0%
10.0%15.0%20.0%25.0%30.0%35.0%40.0%45.0%
First use of marijuana before age 13 Ever used marijuana
High School Youth Marijuana Use: United States, Alaska, Anchorage (2017)
United States Alaska Anchorage
Figure 92 Source: Alaska Youth Risk Behavior Surveillance System
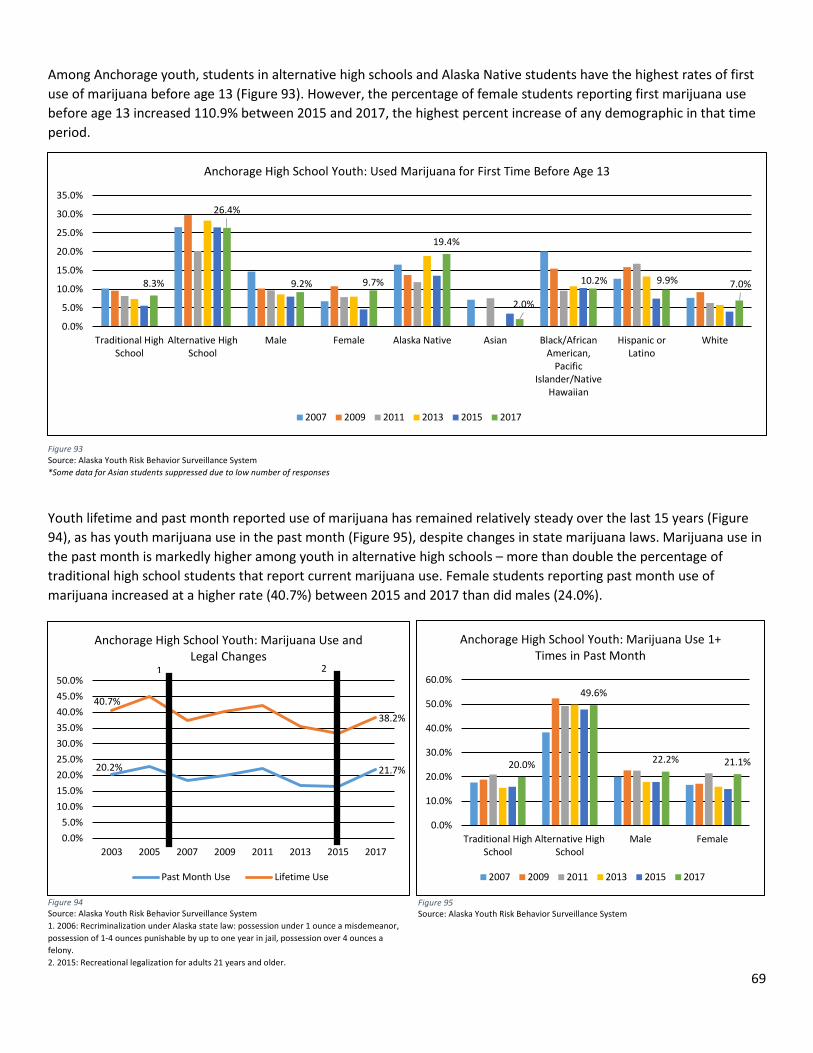
69
Among Anchorage youth, students in alternative high schools and Alaska Native students have the highest rates of first use of marijuana before age 13 (Figure 93). However, the percentage of female students reporting first marijuana use before age 13 increased 110.9% between 2015 and 2017, the highest percent increase of any demographic in that time period.
Youth lifetime and past month reported use of marijuana has remained relatively steady over the last 15 years (Figure 94), as has youth marijuana use in the past month (Figure 95), despite changes in state marijuana laws. Marijuana use in the past month is markedly higher among youth in alternative high schools – more than double the percentage of traditional high school students that report current marijuana use. Female students reporting past month use of marijuana increased at a higher rate (40.7%) between 2015 and 2017 than did males (24.0%).
20.0%
49.6%
22.2% 21.1%
0.0%
10.0%
20.0%
30.0%
40.0%
50.0%
60.0%
Traditional HighSchool
Alternative HighSchool
Male Female
Anchorage High School Youth: Marijuana Use 1+ Times in Past Month
2007 2009 2011 2013 2015 2017
Figure 94 Source: Alaska Youth Risk Behavior Surveillance System 1. 2006: Recriminalization under Alaska state law: possession under 1 ounce a misdemeanor, possession of 1-4 ounces punishable by up to one year in jail, possession over 4 ounces a felony. 2. 2015: Recreational legalization for adults 21 years and older.
Figure 95 Source: Alaska Youth Risk Behavior Surveillance System
Figure 93 Source: Alaska Youth Risk Behavior Surveillance System *Some data for Asian students suppressed due to low number of responses
8.3%
26.4%
9.2% 9.7%
19.4%
2.0%
10.2% 9.9% 7.0%
0.0%
5.0%
10.0%
15.0%
20.0%
25.0%
30.0%
35.0%
Traditional HighSchool
Alternative HighSchool
Male Female Alaska Native Asian Black/AfricanAmerican,
PacificIslander/Native
Hawaiian
Hispanic orLatino
White
Anchorage High School Youth: Used Marijuana for First Time Before Age 13
2007 2009 2011 2013 2015 2017
20.2% 21.7%
40.7%38.2%
0.0%5.0%
10.0%15.0%20.0%25.0%30.0%35.0%40.0%45.0%50.0%
2003 2005 2007 2009 2011 2013 2015 2017
Anchorage High School Youth: Marijuana Use and Legal Changes
Past Month Use Lifetime Use
21
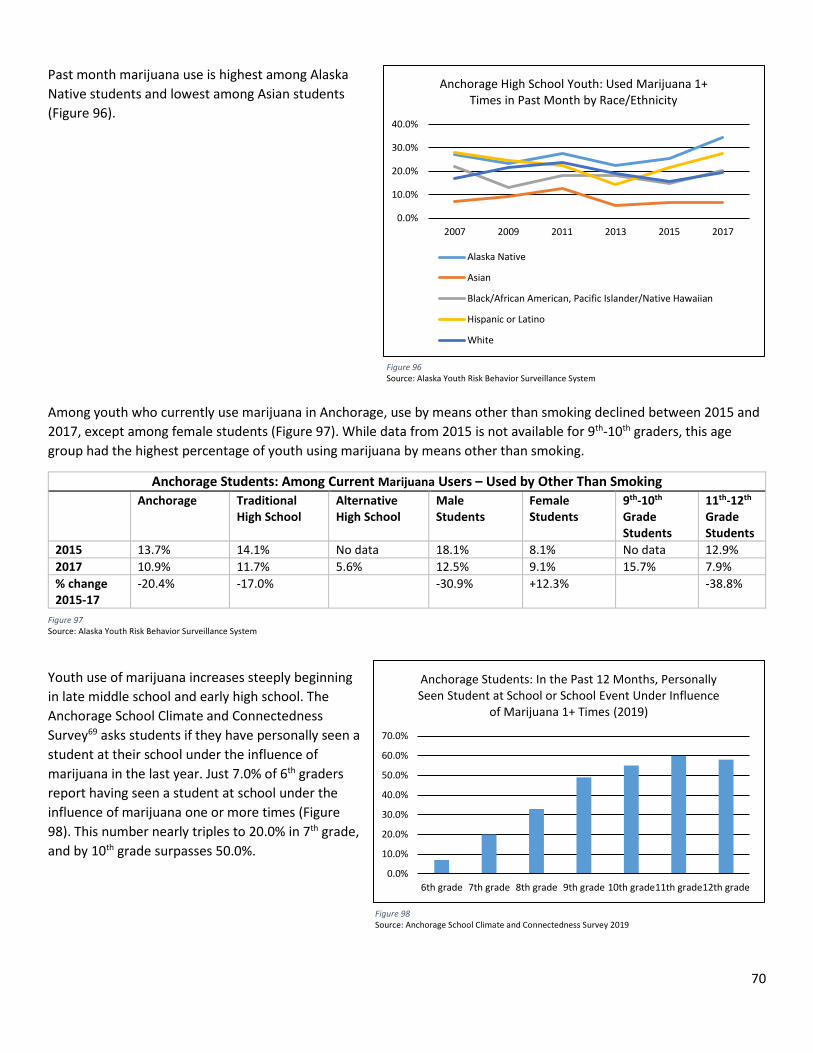
70
Past month marijuana use is highest among Alaska Native students and lowest among Asian students (Figure 96).
Among youth who currently use marijuana in Anchorage, use by means other than smoking declined between 2015 and 2017, except among female students (Figure 97). While data from 2015 is not available for 9th-10th graders, this age group had the highest percentage of youth using marijuana by means other than smoking.
Anchorage Students: Among Current Marijuana Users – Used by Other Than Smoking Anchorage Traditional
High School Alternative High School
Male Students
Female Students
9th-10th Grade Students
11th-12th Grade Students
2015 13.7% 14.1% No data 18.1% 8.1% No data 12.9% 2017 10.9% 11.7% 5.6% 12.5% 9.1% 15.7% 7.9% % change 2015-17
-20.4% -17.0% -30.9% +12.3% -38.8%
Youth use of marijuana increases steeply beginning in late middle school and early high school. The Anchorage School Climate and Connectedness Survey69 asks students if they have personally seen a student at their school under the influence of marijuana in the last year. Just 7.0% of 6th graders report having seen a student at school under the influence of marijuana one or more times (Figure 98). This number nearly triples to 20.0% in 7th grade, and by 10th grade surpasses 50.0%.
Figure 97 Source: Alaska Youth Risk Behavior Surveillance System
Figure 96 Source: Alaska Youth Risk Behavior Surveillance System
0.0%
10.0%
20.0%
30.0%
40.0%
2007 2009 2011 2013 2015 2017
Anchorage High School Youth: Used Marijuana 1+ Times in Past Month by Race/Ethnicity
Alaska Native
Asian
Black/African American, Pacific Islander/Native Hawaiian
Hispanic or Latino
White
0.0%
10.0%
20.0%
30.0%
40.0%
50.0%
60.0%
70.0%
6th grade 7th grade 8th grade 9th grade 10th grade11th grade12th grade
Anchorage Students: In the Past 12 Months, Personally Seen Student at School or School Event Under Influence
of Marijuana 1+ Times (2019)
Figure 98 Source: Anchorage School Climate and Connectedness Survey 2019
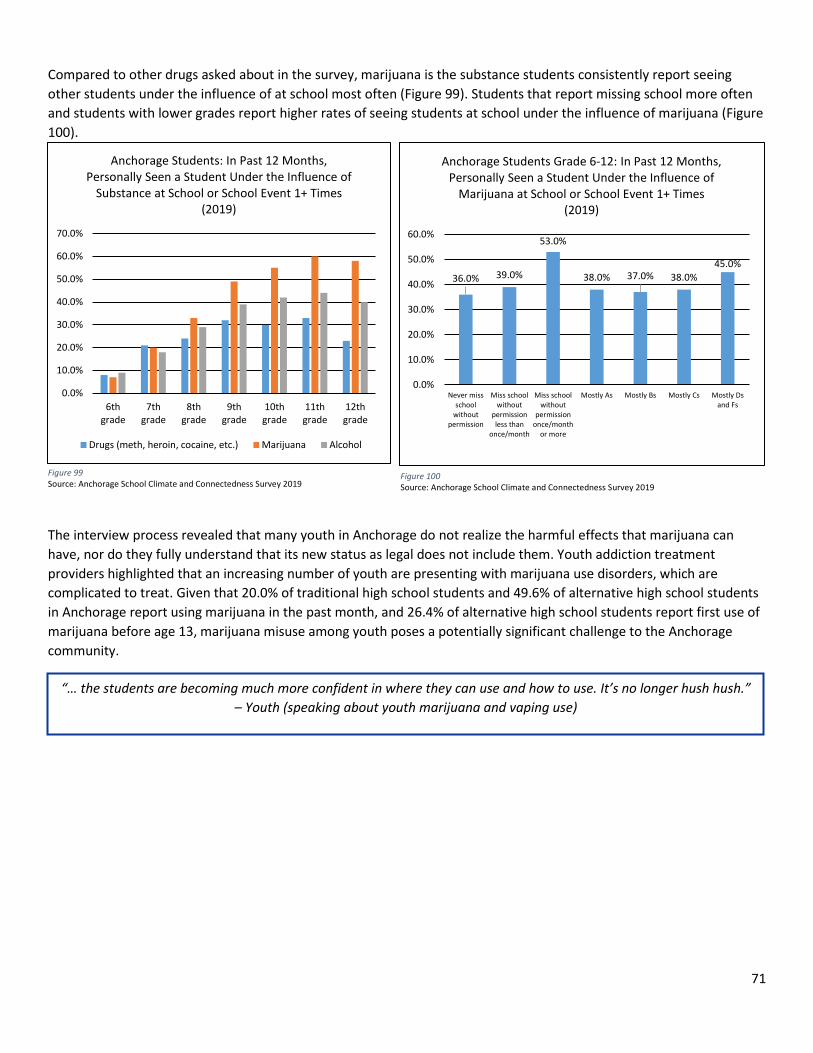
71
Compared to other drugs asked about in the survey, marijuana is the substance students consistently report seeing other students under the influence of at school most often (Figure 99). Students that report missing school more often and students with lower grades report higher rates of seeing students at school under the influence of marijuana (Figure 100).
The interview process revealed that many youth in Anchorage do not realize the harmful effects that marijuana can have, nor do they fully understand that its new status as legal does not include them. Youth addiction treatment providers highlighted that an increasing number of youth are presenting with marijuana use disorders, which are complicated to treat. Given that 20.0% of traditional high school students and 49.6% of alternative high school students in Anchorage report using marijuana in the past month, and 26.4% of alternative high school students report first use of marijuana before age 13, marijuana misuse among youth poses a potentially significant challenge to the Anchorage community.
“… the students are becoming much more confident in where they can use and how to use. It’s no longer hush hush.” – Youth (speaking about youth marijuana and vaping use)
0.0%
10.0%
20.0%
30.0%
40.0%
50.0%
60.0%
70.0%
6thgrade
7thgrade
8thgrade
9thgrade
10thgrade
11thgrade
12thgrade
Anchorage Students: In Past 12 Months, Personally Seen a Student Under the Influence of
Substance at School or School Event 1+ Times (2019)
Drugs (meth, heroin, cocaine, etc.) Marijuana Alcohol
Figure 99 Source: Anchorage School Climate and Connectedness Survey 2019
36.0% 39.0%
53.0%
38.0% 37.0% 38.0%45.0%
0.0%
10.0%
20.0%
30.0%
40.0%
50.0%
60.0%
Never missschool
withoutpermission
Miss schoolwithout
permissionless than
once/month
Miss schoolwithout
permissiononce/month
or more
Mostly As Mostly Bs Mostly Cs Mostly Dsand Fs
Anchorage Students Grade 6-12: In Past 12 Months, Personally Seen a Student Under the Influence of
Marijuana at School or School Event 1+ Times (2019)
Figure 100 Source: Anchorage School Climate and Connectedness Survey 2019
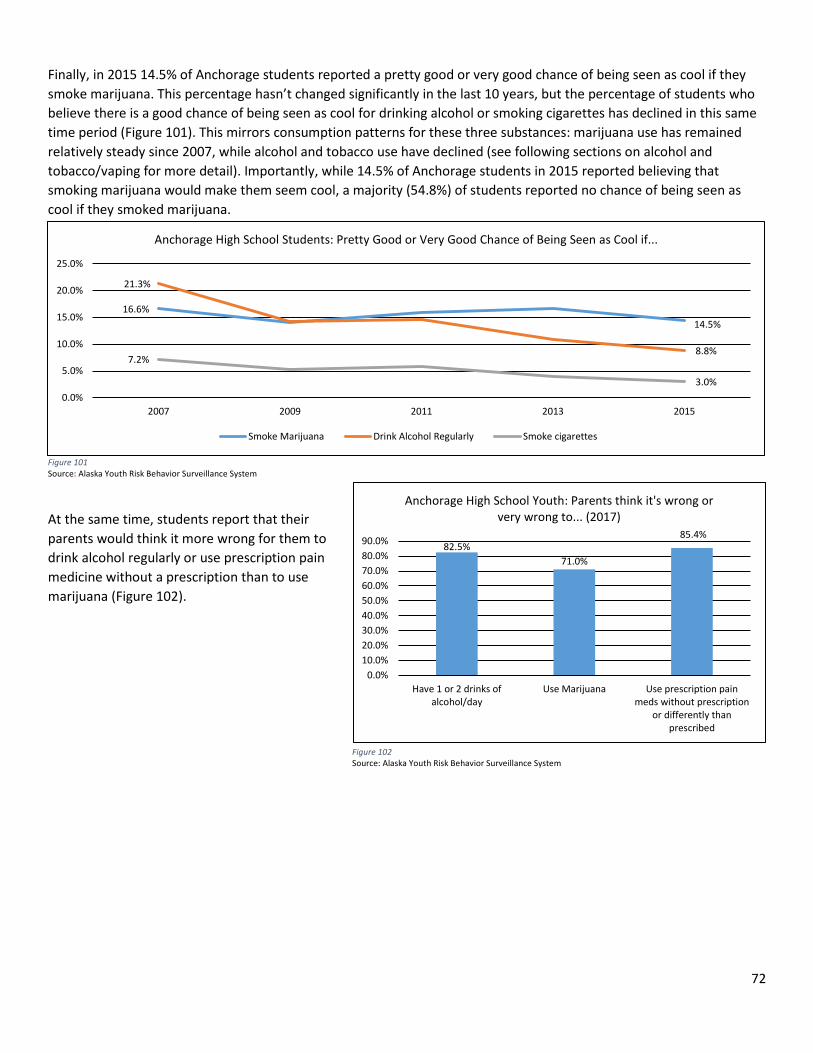
72
Finally, in 2015 14.5% of Anchorage students reported a pretty good or very good chance of being seen as cool if they smoke marijuana. This percentage hasn’t changed significantly in the last 10 years, but the percentage of students who believe there is a good chance of being seen as cool for drinking alcohol or smoking cigarettes has declined in this same time period (Figure 101). This mirrors consumption patterns for these three substances: marijuana use has remained relatively steady since 2007, while alcohol and tobacco use have declined (see following sections on alcohol and tobacco/vaping for more detail). Importantly, while 14.5% of Anchorage students in 2015 reported believing that smoking marijuana would make them seem cool, a majority (54.8%) of students reported no chance of being seen as cool if they smoked marijuana.
Figure 101 Source: Alaska Youth Risk Behavior Surveillance System
At the same time, students report that their parents would think it more wrong for them to drink alcohol regularly or use prescription pain medicine without a prescription than to use marijuana (Figure 102).
16.6%14.5%
21.3%
8.8%7.2%
3.0%0.0%
5.0%
10.0%
15.0%
20.0%
25.0%
2007 2009 2011 2013 2015
Anchorage High School Students: Pretty Good or Very Good Chance of Being Seen as Cool if...
Smoke Marijuana Drink Alcohol Regularly Smoke cigarettes
Figure 102 Source: Alaska Youth Risk Behavior Surveillance System
82.5%71.0%
85.4%
0.0%10.0%20.0%30.0%40.0%50.0%60.0%70.0%80.0%90.0%
Have 1 or 2 drinks ofalcohol/day
Use Marijuana Use prescription painmeds without prescription
or differently thanprescribed
Anchorage High School Youth: Parents think it's wrong or very wrong to... (2017)
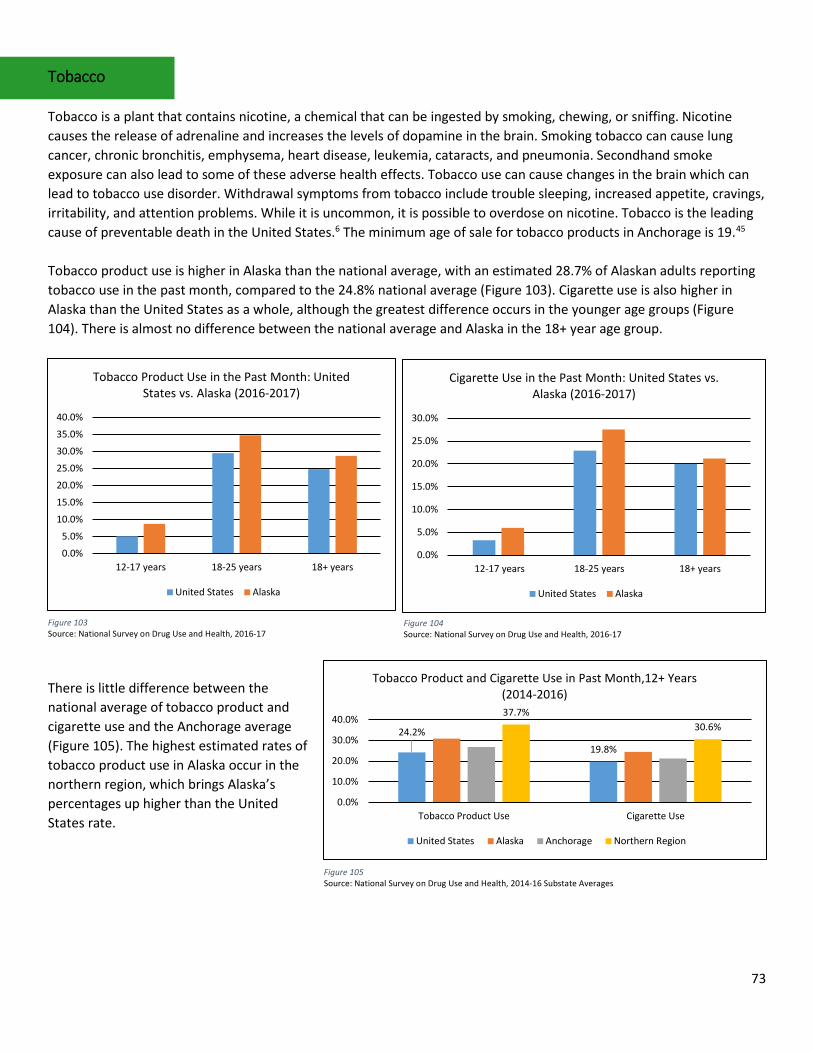
73
Tobacco Tobacco is a plant that contains nicotine, a chemical that can be ingested by smoking, chewing, or sniffing. Nicotine causes the release of adrenaline and increases the levels of dopamine in the brain. Smoking tobacco can cause lung cancer, chronic bronchitis, emphysema, heart disease, leukemia, cataracts, and pneumonia. Secondhand smoke exposure can also lead to some of these adverse health effects. Tobacco use can cause changes in the brain which can lead to tobacco use disorder. Withdrawal symptoms from tobacco include trouble sleeping, increased appetite, cravings, irritability, and attention problems. While it is uncommon, it is possible to overdose on nicotine. Tobacco is the leading cause of preventable death in the United States.6 The minimum age of sale for tobacco products in Anchorage is 19.45 Tobacco product use is higher in Alaska than the national average, with an estimated 28.7% of Alaskan adults reporting tobacco use in the past month, compared to the 24.8% national average (Figure 103). Cigarette use is also higher in Alaska than the United States as a whole, although the greatest difference occurs in the younger age groups (Figure 104). There is almost no difference between the national average and Alaska in the 18+ year age group.
There is little difference between the national average of tobacco product and cigarette use and the Anchorage average (Figure 105). The highest estimated rates of tobacco product use in Alaska occur in the northern region, which brings Alaska’s percentages up higher than the United States rate.
0.0%
5.0%
10.0%
15.0%
20.0%
25.0%
30.0%
35.0%
40.0%
12-17 years 18-25 years 18+ years
Tobacco Product Use in the Past Month: United States vs. Alaska (2016-2017)
United States Alaska
Figure 103 Source: National Survey on Drug Use and Health, 2016-17
0.0%
5.0%
10.0%
15.0%
20.0%
25.0%
30.0%
12-17 years 18-25 years 18+ years
Cigarette Use in the Past Month: United States vs. Alaska (2016-2017)
United States Alaska
Figure 104 Source: National Survey on Drug Use and Health, 2016-17
24.2%
19.8%
37.7%30.6%
0.0%
10.0%
20.0%
30.0%
40.0%
Tobacco Product Use Cigarette Use
Tobacco Product and Cigarette Use in Past Month,12+ Years (2014-2016)
United States Alaska Anchorage Northern Region
Figure 105 Source: National Survey on Drug Use and Health, 2014-16 Substate Averages
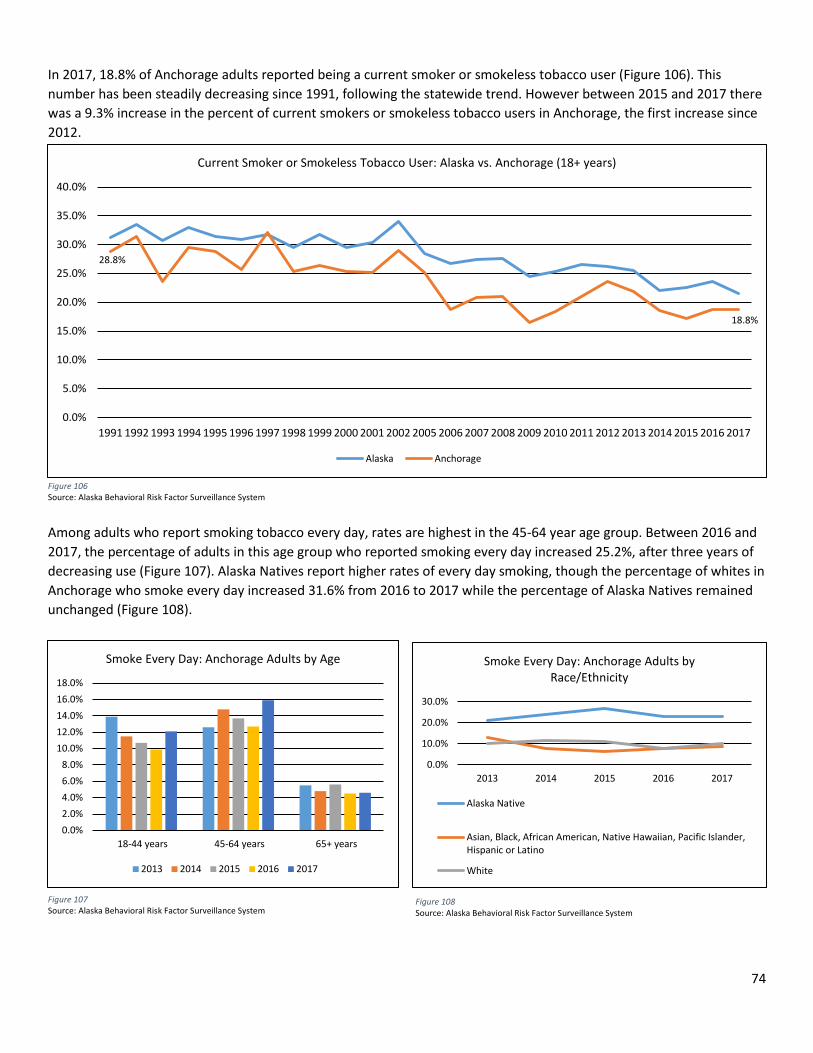
74
In 2017, 18.8% of Anchorage adults reported being a current smoker or smokeless tobacco user (Figure 106). This number has been steadily decreasing since 1991, following the statewide trend. However between 2015 and 2017 there was a 9.3% increase in the percent of current smokers or smokeless tobacco users in Anchorage, the first increase since 2012.
Among adults who report smoking tobacco every day, rates are highest in the 45-64 year age group. Between 2016 and 2017, the percentage of adults in this age group who reported smoking every day increased 25.2%, after three years of decreasing use (Figure 107). Alaska Natives report higher rates of every day smoking, though the percentage of whites in Anchorage who smoke every day increased 31.6% from 2016 to 2017 while the percentage of Alaska Natives remained unchanged (Figure 108).
28.8%
18.8%
0.0%
5.0%
10.0%
15.0%
20.0%
25.0%
30.0%
35.0%
40.0%
1991 1992 1993 1994 1995 1996 1997 1998 1999 2000 2001 2002 2005 2006 2007 2008 2009 2010 2011 2012 2013 2014 2015 2016 2017
Current Smoker or Smokeless Tobacco User: Alaska vs. Anchorage (18+ years)
Alaska Anchorage
Figure 106 Source: Alaska Behavioral Risk Factor Surveillance System
0.0%2.0%4.0%6.0%8.0%
10.0%12.0%14.0%16.0%18.0%
18-44 years 45-64 years 65+ years
Smoke Every Day: Anchorage Adults by Age
2013 2014 2015 2016 2017
Figure 107 Source: Alaska Behavioral Risk Factor Surveillance System
Figure 108 Source: Alaska Behavioral Risk Factor Surveillance System
0.0%
10.0%
20.0%
30.0%
2013 2014 2015 2016 2017
Smoke Every Day: Anchorage Adults by Race/Ethnicity
Alaska Native
Asian, Black, African American, Native Hawaiian, Pacific Islander,Hispanic or Latino
White
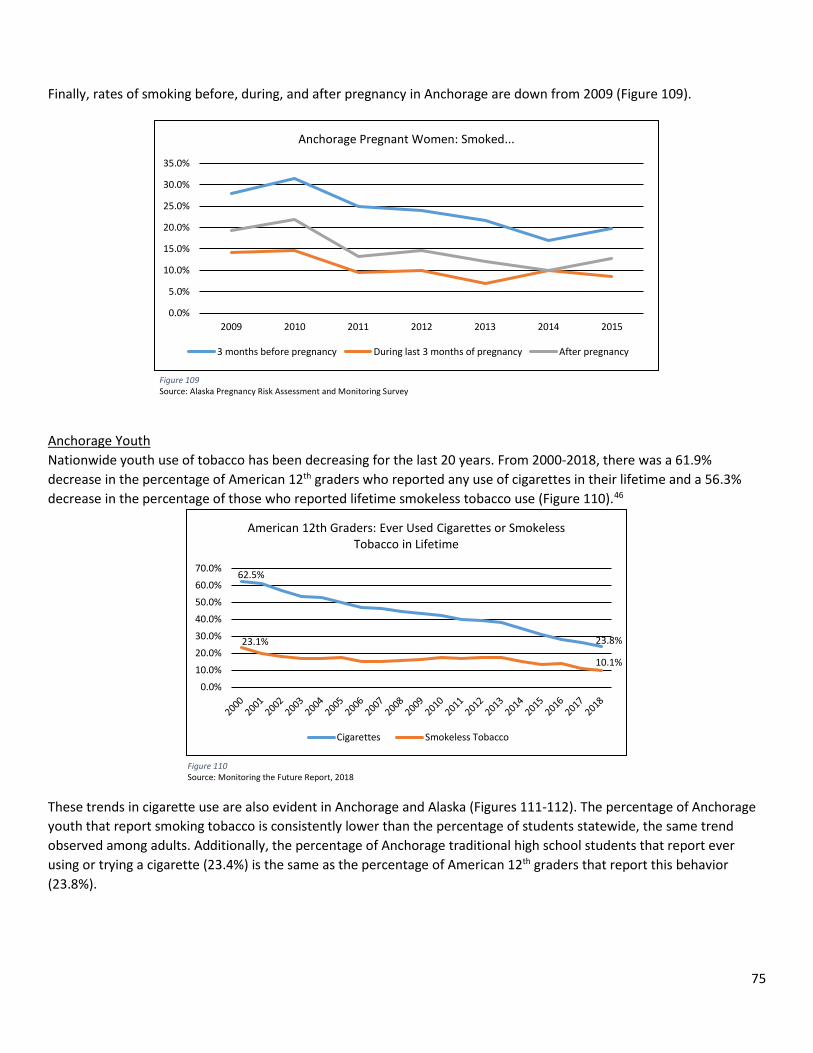
75
Finally, rates of smoking before, during, and after pregnancy in Anchorage are down from 2009 (Figure 109). Anchorage Youth Nationwide youth use of tobacco has been decreasing for the last 20 years. From 2000-2018, there was a 61.9% decrease in the percentage of American 12th graders who reported any use of cigarettes in their lifetime and a 56.3% decrease in the percentage of those who reported lifetime smokeless tobacco use (Figure 110).46 These trends in cigarette use are also evident in Anchorage and Alaska (Figures 111-112). The percentage of Anchorage youth that report smoking tobacco is consistently lower than the percentage of students statewide, the same trend observed among adults. Additionally, the percentage of Anchorage traditional high school students that report ever using or trying a cigarette (23.4%) is the same as the percentage of American 12th graders that report this behavior (23.8%).
0.0%
5.0%
10.0%
15.0%
20.0%
25.0%
30.0%
35.0%
2009 2010 2011 2012 2013 2014 2015
Anchorage Pregnant Women: Smoked...
3 months before pregnancy During last 3 months of pregnancy After pregnancy
Figure 109 Source: Alaska Pregnancy Risk Assessment and Monitoring Survey
62.5%
23.8%23.1%
10.1%
0.0%
10.0%
20.0%
30.0%
40.0%
50.0%
60.0%
70.0%
American 12th Graders: Ever Used Cigarettes or Smokeless Tobacco in Lifetime
Cigarettes Smokeless Tobacco
Figure 110 Source: Monitoring the Future Report, 2018
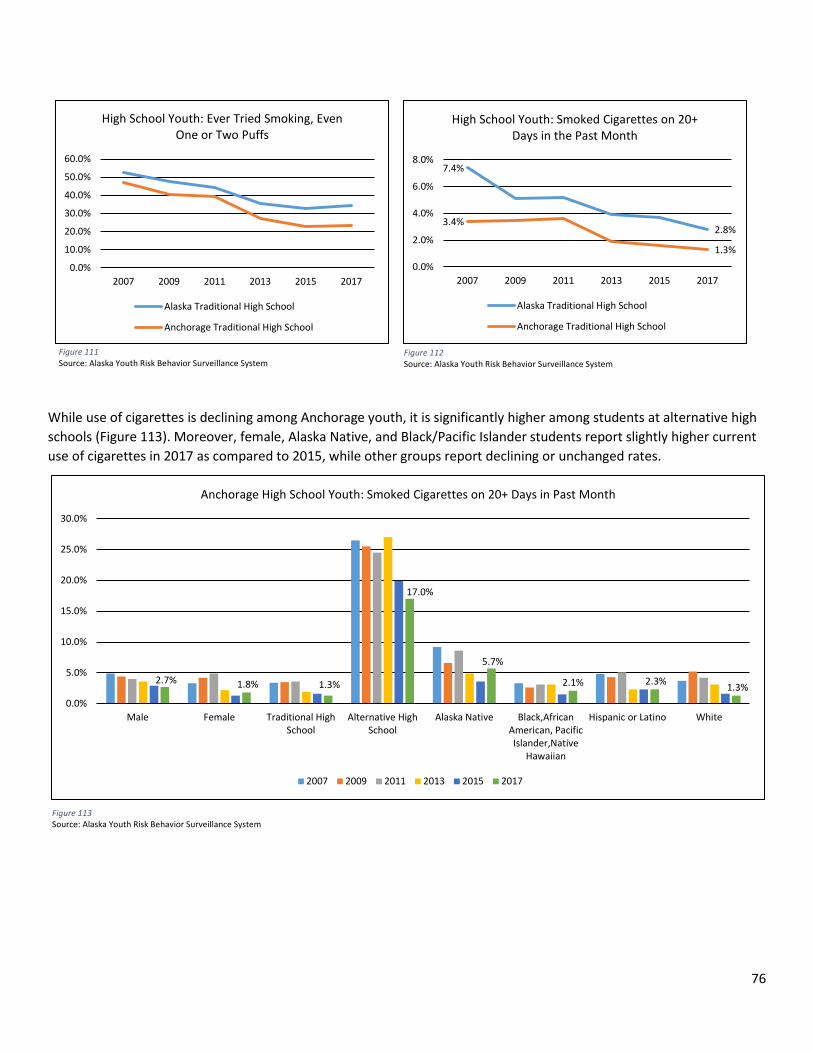
76
While use of cigarettes is declining among Anchorage youth, it is significantly higher among students at alternative high schools (Figure 113). Moreover, female, Alaska Native, and Black/Pacific Islander students report slightly higher current use of cigarettes in 2017 as compared to 2015, while other groups report declining or unchanged rates.
Figure 111 Source: Alaska Youth Risk Behavior Surveillance System
Figure 112 Source: Alaska Youth Risk Behavior Surveillance System
Figure 113 Source: Alaska Youth Risk Behavior Surveillance System
0.0%
10.0%
20.0%
30.0%
40.0%
50.0%
60.0%
2007 2009 2011 2013 2015 2017
High School Youth: Ever Tried Smoking, Even One or Two Puffs
Alaska Traditional High School
Anchorage Traditional High School
7.4%
2.8%3.4%
1.3%0.0%
2.0%
4.0%
6.0%
8.0%
2007 2009 2011 2013 2015 2017
High School Youth: Smoked Cigarettes on 20+ Days in the Past Month
Alaska Traditional High School
Anchorage Traditional High School
2.7% 1.8% 1.3%
17.0%
5.7%
2.1% 2.3% 1.3%0.0%
5.0%
10.0%
15.0%
20.0%
25.0%
30.0%
Male Female Traditional HighSchool
Alternative HighSchool
Alaska Native Black,AfricanAmerican, PacificIslander,Native
Hawaiian
Hispanic or Latino White
Anchorage High School Youth: Smoked Cigarettes on 20+ Days in Past Month
2007 2009 2011 2013 2015 2017
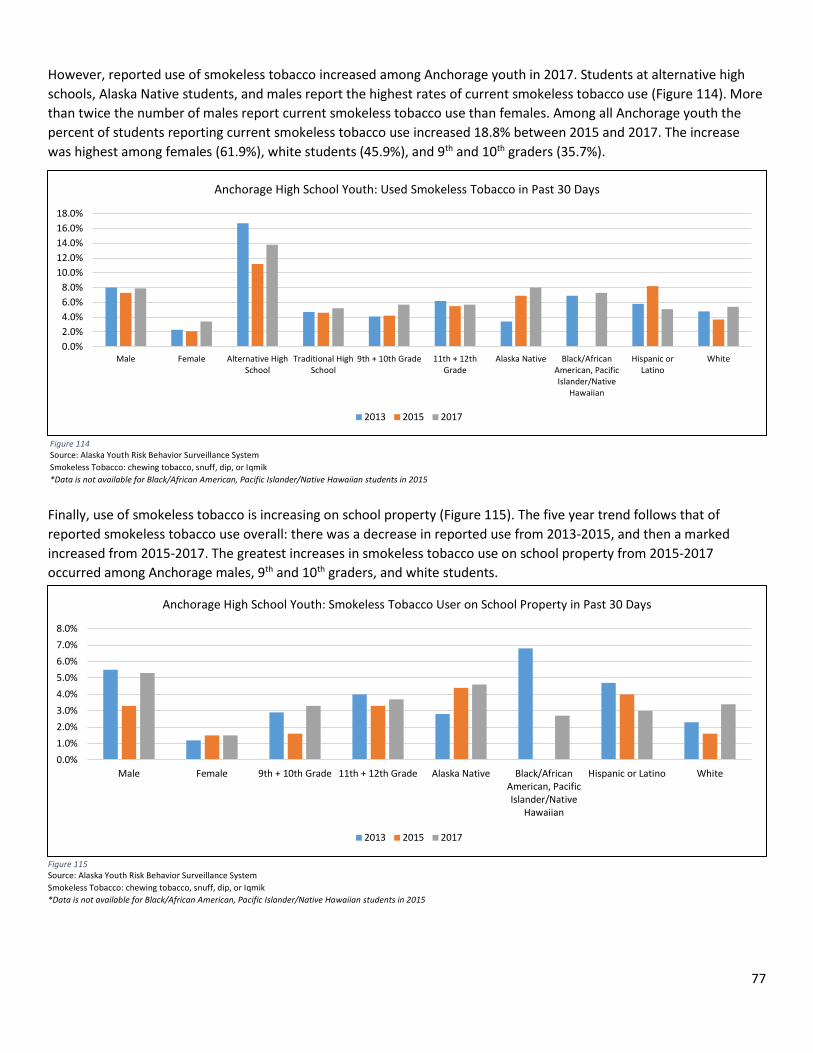
77
However, reported use of smokeless tobacco increased among Anchorage youth in 2017. Students at alternative high schools, Alaska Native students, and males report the highest rates of current smokeless tobacco use (Figure 114). More than twice the number of males report current smokeless tobacco use than females. Among all Anchorage youth the percent of students reporting current smokeless tobacco use increased 18.8% between 2015 and 2017. The increase was highest among females (61.9%), white students (45.9%), and 9th and 10th graders (35.7%).
Finally, use of smokeless tobacco is increasing on school property (Figure 115). The five year trend follows that of reported smokeless tobacco use overall: there was a decrease in reported use from 2013-2015, and then a marked increased from 2015-2017. The greatest increases in smokeless tobacco use on school property from 2015-2017 occurred among Anchorage males, 9th and 10th graders, and white students.
Figure 114 Source: Alaska Youth Risk Behavior Surveillance System Smokeless Tobacco: chewing tobacco, snuff, dip, or Iqmik *Data is not available for Black/African American, Pacific Islander/Native Hawaiian students in 2015
Figure 115 Source: Alaska Youth Risk Behavior Surveillance System Smokeless Tobacco: chewing tobacco, snuff, dip, or Iqmik *Data is not available for Black/African American, Pacific Islander/Native Hawaiian students in 2015
0.0%2.0%4.0%6.0%8.0%
10.0%12.0%14.0%16.0%18.0%
Male Female Alternative HighSchool
Traditional HighSchool
9th + 10th Grade 11th + 12thGrade
Alaska Native Black/AfricanAmerican, PacificIslander/Native
Hawaiian
Hispanic orLatino
White
Anchorage High School Youth: Used Smokeless Tobacco in Past 30 Days
2013 2015 2017
0.0%1.0%2.0%3.0%4.0%5.0%6.0%7.0%8.0%
Male Female 9th + 10th Grade 11th + 12th Grade Alaska Native Black/AfricanAmerican, PacificIslander/Native
Hawaiian
Hispanic or Latino White
Anchorage High School Youth: Smokeless Tobacco User on School Property in Past 30 Days
2013 2015 2017
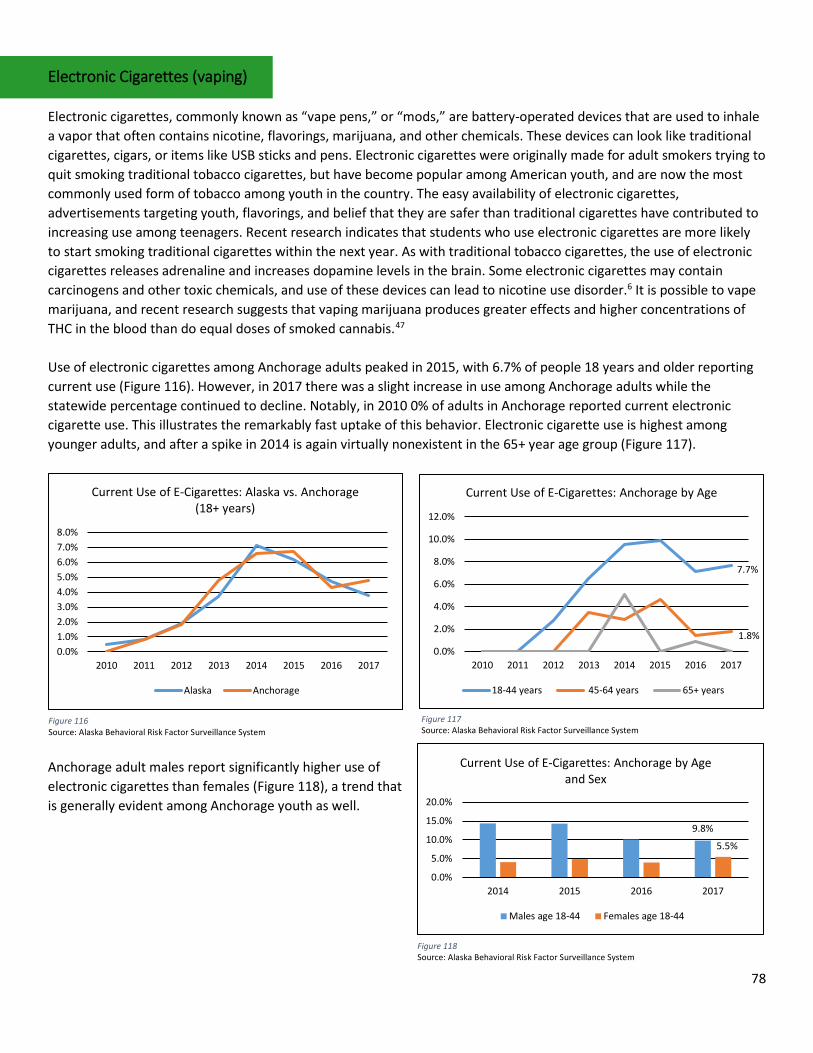
78
Electronic Cigarettes (vaping) Electronic cigarettes, commonly known as “vape pens,” or “mods,” are battery-operated devices that are used to inhale a vapor that often contains nicotine, flavorings, marijuana, and other chemicals. These devices can look like traditional cigarettes, cigars, or items like USB sticks and pens. Electronic cigarettes were originally made for adult smokers trying to quit smoking traditional tobacco cigarettes, but have become popular among American youth, and are now the most commonly used form of tobacco among youth in the country. The easy availability of electronic cigarettes, advertisements targeting youth, flavorings, and belief that they are safer than traditional cigarettes have contributed to increasing use among teenagers. Recent research indicates that students who use electronic cigarettes are more likely to start smoking traditional cigarettes within the next year. As with traditional tobacco cigarettes, the use of electronic cigarettes releases adrenaline and increases dopamine levels in the brain. Some electronic cigarettes may contain carcinogens and other toxic chemicals, and use of these devices can lead to nicotine use disorder.6 It is possible to vape marijuana, and recent research suggests that vaping marijuana produces greater effects and higher concentrations of THC in the blood than do equal doses of smoked cannabis.47 Use of electronic cigarettes among Anchorage adults peaked in 2015, with 6.7% of people 18 years and older reporting current use (Figure 116). However, in 2017 there was a slight increase in use among Anchorage adults while the statewide percentage continued to decline. Notably, in 2010 0% of adults in Anchorage reported current electronic cigarette use. This illustrates the remarkably fast uptake of this behavior. Electronic cigarette use is highest among younger adults, and after a spike in 2014 is again virtually nonexistent in the 65+ year age group (Figure 117).
Anchorage adult males report significantly higher use of electronic cigarettes than females (Figure 118), a trend that is generally evident among Anchorage youth as well.
0.0%1.0%2.0%3.0%4.0%5.0%6.0%7.0%8.0%
2010 2011 2012 2013 2014 2015 2016 2017
Current Use of E-Cigarettes: Alaska vs. Anchorage (18+ years)
Alaska Anchorage
Figure 116 Source: Alaska Behavioral Risk Factor Surveillance System
7.7%
1.8%0.0%
2.0%
4.0%
6.0%
8.0%
10.0%
12.0%
2010 2011 2012 2013 2014 2015 2016 2017
Current Use of E-Cigarettes: Anchorage by Age
18-44 years 45-64 years 65+ years
Figure 117 Source: Alaska Behavioral Risk Factor Surveillance System
Figure 118 Source: Alaska Behavioral Risk Factor Surveillance System
9.8%
5.5%
0.0%
5.0%
10.0%
15.0%
20.0%
2014 2015 2016 2017
Current Use of E-Cigarettes: Anchorage by Age and Sex
Males age 18-44 Females age 18-44
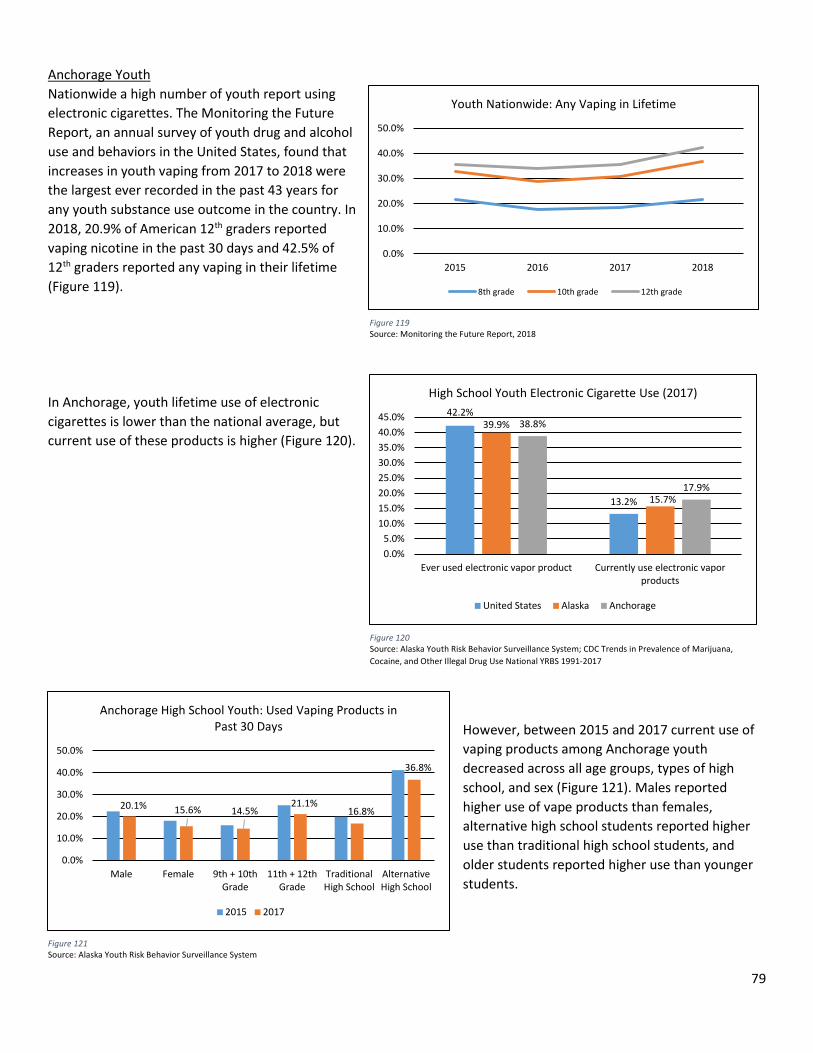
79
Anchorage Youth Nationwide a high number of youth report using electronic cigarettes. The Monitoring the Future Report, an annual survey of youth drug and alcohol use and behaviors in the United States, found that increases in youth vaping from 2017 to 2018 were the largest ever recorded in the past 43 years for any youth substance use outcome in the country. In 2018, 20.9% of American 12th graders reported vaping nicotine in the past 30 days and 42.5% of 12th graders reported any vaping in their lifetime (Figure 119). In Anchorage, youth lifetime use of electronic cigarettes is lower than the national average, but current use of these products is higher (Figure 120).
However, between 2015 and 2017 current use of vaping products among Anchorage youth decreased across all age groups, types of high school, and sex (Figure 121). Males reported higher use of vape products than females, alternative high school students reported higher use than traditional high school students, and older students reported higher use than younger students.
0.0%
10.0%
20.0%
30.0%
40.0%
50.0%
2015 2016 2017 2018
Youth Nationwide: Any Vaping in Lifetime
8th grade 10th grade 12th grade
Figure 119 Source: Monitoring the Future Report, 2018
Figure 120 Source: Alaska Youth Risk Behavior Surveillance System; CDC Trends in Prevalence of Marijuana, Cocaine, and Other Illegal Drug Use National YRBS 1991-2017
42.2%
13.2%
39.9%
15.7%
38.8%
17.9%
0.0%5.0%
10.0%15.0%20.0%25.0%30.0%35.0%40.0%45.0%
Ever used electronic vapor product Currently use electronic vaporproducts
High School Youth Electronic Cigarette Use (2017)
United States Alaska Anchorage
20.1% 15.6% 14.5%21.1%
16.8%
36.8%
0.0%
10.0%
20.0%
30.0%
40.0%
50.0%
Male Female 9th + 10thGrade
11th + 12thGrade
TraditionalHigh School
AlternativeHigh School
Anchorage High School Youth: Used Vaping Products in Past 30 Days
2015 2017
Figure 121 Source: Alaska Youth Risk Behavior Surveillance System
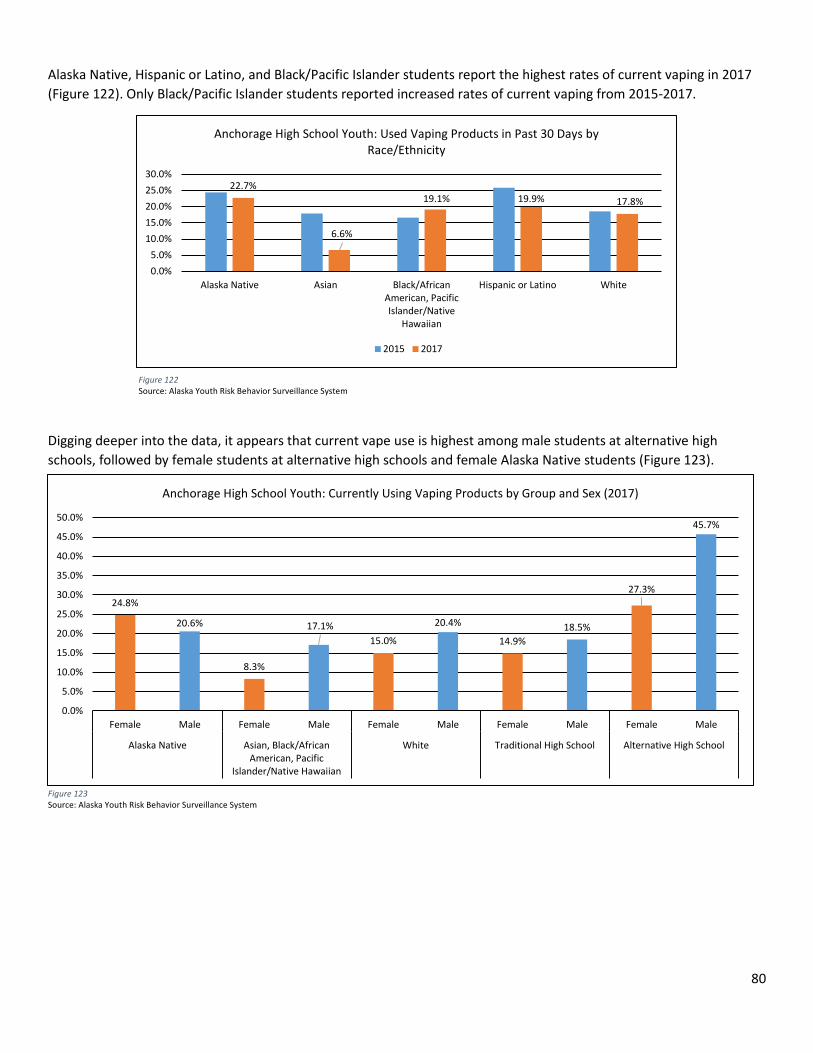
80
Alaska Native, Hispanic or Latino, and Black/Pacific Islander students report the highest rates of current vaping in 2017 (Figure 122). Only Black/Pacific Islander students reported increased rates of current vaping from 2015-2017. Digging deeper into the data, it appears that current vape use is highest among male students at alternative high schools, followed by female students at alternative high schools and female Alaska Native students (Figure 123).
Figure 116 Source: Alaska Youth Risk Behavior Surveillance System
Figure 123 Source: Alaska Youth Risk Behavior Surveillance System
22.7%
6.6%
19.1% 19.9% 17.8%
0.0%5.0%
10.0%15.0%20.0%25.0%30.0%
Alaska Native Asian Black/AfricanAmerican, PacificIslander/Native
Hawaiian
Hispanic or Latino White
Anchorage High School Youth: Used Vaping Products in Past 30 Days by Race/Ethnicity
2015 2017
Figure 122 Source: Alaska Youth Risk Behavior Surveillance System
24.8%
20.6%
8.3%
17.1%15.0%
20.4%
14.9%18.5%
27.3%
45.7%
0.0%
5.0%
10.0%
15.0%
20.0%
25.0%
30.0%
35.0%
40.0%
45.0%
50.0%
Female Male Female Male Female Male Female Male Female Male
Alaska Native Asian, Black/AfricanAmerican, Pacific
Islander/Native Hawaiian
White Traditional High School Alternative High School
Anchorage High School Youth: Currently Using Vaping Products by Group and Sex (2017)
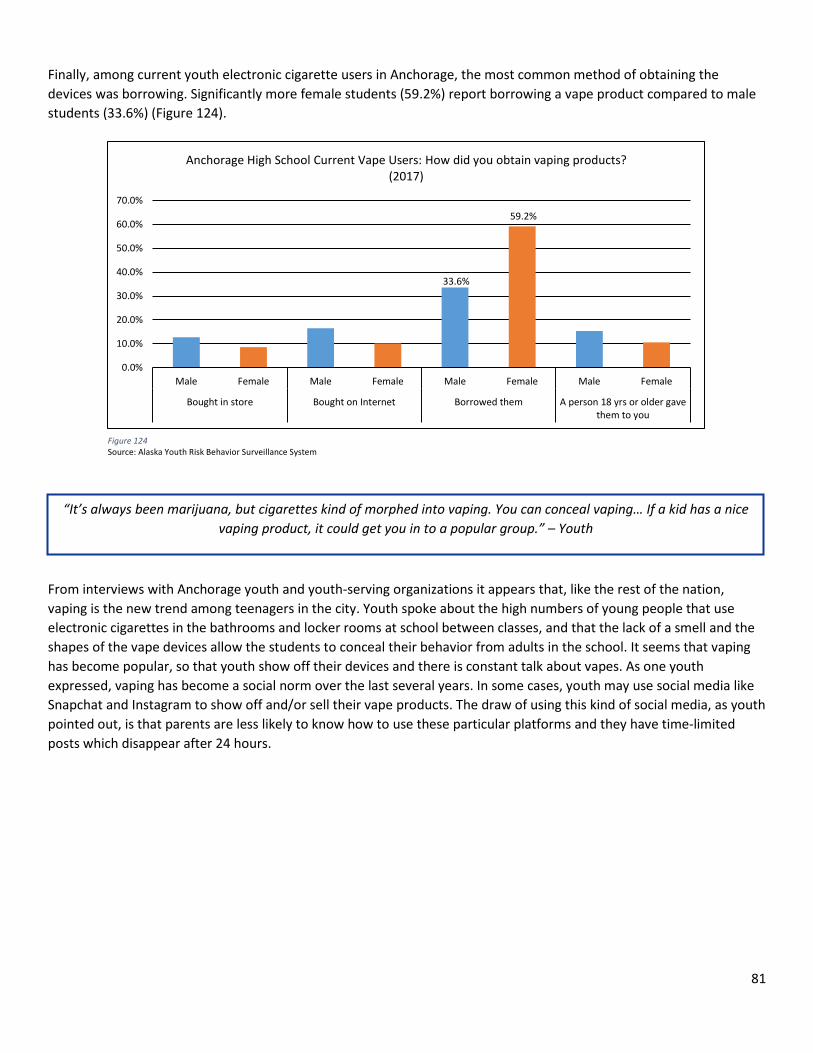
81
Finally, among current youth electronic cigarette users in Anchorage, the most common method of obtaining the devices was borrowing. Significantly more female students (59.2%) report borrowing a vape product compared to male students (33.6%) (Figure 124).
From interviews with Anchorage youth and youth-serving organizations it appears that, like the rest of the nation, vaping is the new trend among teenagers in the city. Youth spoke about the high numbers of young people that use electronic cigarettes in the bathrooms and locker rooms at school between classes, and that the lack of a smell and the shapes of the vape devices allow the students to conceal their behavior from adults in the school. It seems that vaping has become popular, so that youth show off their devices and there is constant talk about vapes. As one youth expressed, vaping has become a social norm over the last several years. In some cases, youth may use social media like Snapchat and Instagram to show off and/or sell their vape products. The draw of using this kind of social media, as youth pointed out, is that parents are less likely to know how to use these particular platforms and they have time-limited posts which disappear after 24 hours.
33.6%
59.2%
0.0%
10.0%
20.0%
30.0%
40.0%
50.0%
60.0%
70.0%
Male Female Male Female Male Female Male Female
Bought in store Bought on Internet Borrowed them A person 18 yrs or older gavethem to you
Anchorage High School Current Vape Users: How did you obtain vaping products? (2017)
Figure 124 Source: Alaska Youth Risk Behavior Surveillance System
“It’s always been marijuana, but cigarettes kind of morphed into vaping. You can conceal vaping… If a kid has a nice vaping product, it could get you in to a popular group.” – Youth
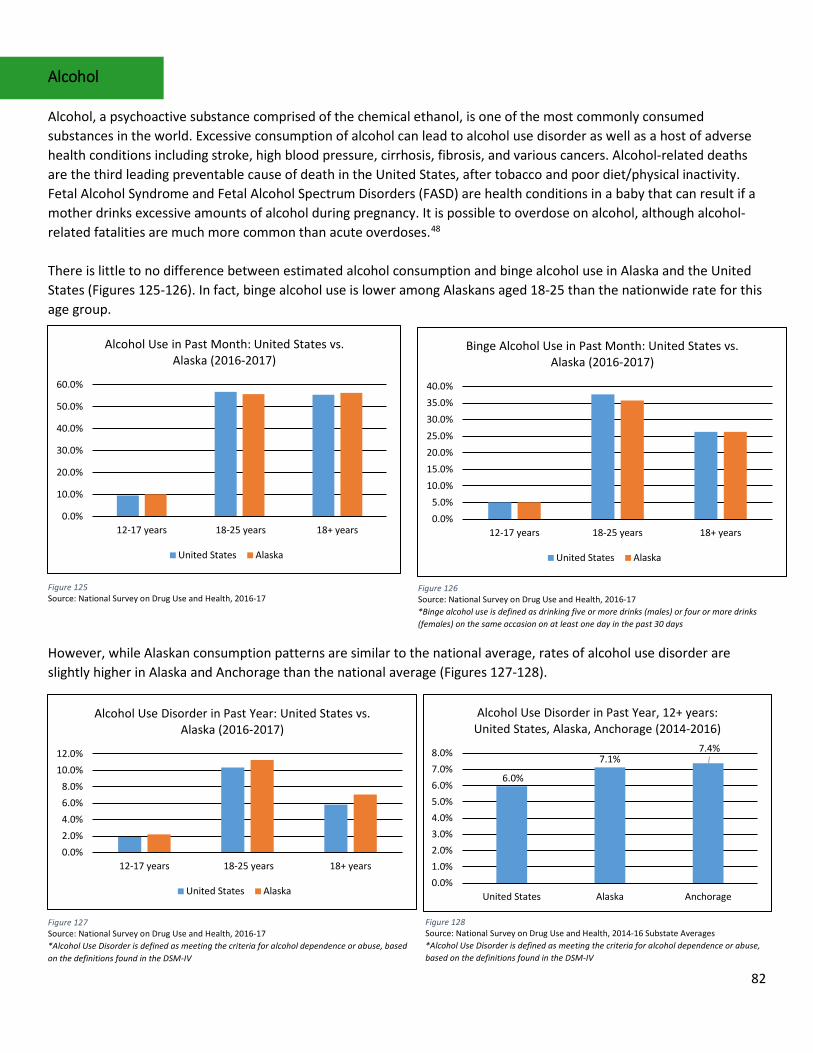
82
Alcohol Alcohol, a psychoactive substance comprised of the chemical ethanol, is one of the most commonly consumed substances in the world. Excessive consumption of alcohol can lead to alcohol use disorder as well as a host of adverse health conditions including stroke, high blood pressure, cirrhosis, fibrosis, and various cancers. Alcohol-related deaths are the third leading preventable cause of death in the United States, after tobacco and poor diet/physical inactivity. Fetal Alcohol Syndrome and Fetal Alcohol Spectrum Disorders (FASD) are health conditions in a baby that can result if a mother drinks excessive amounts of alcohol during pregnancy. It is possible to overdose on alcohol, although alcohol-related fatalities are much more common than acute overdoses.48 There is little to no difference between estimated alcohol consumption and binge alcohol use in Alaska and the United States (Figures 125-126). In fact, binge alcohol use is lower among Alaskans aged 18-25 than the nationwide rate for this age group.
However, while Alaskan consumption patterns are similar to the national average, rates of alcohol use disorder are slightly higher in Alaska and Anchorage than the national average (Figures 127-128).
0.0%
10.0%
20.0%
30.0%
40.0%
50.0%
60.0%
12-17 years 18-25 years 18+ years
Alcohol Use in Past Month: United States vs. Alaska (2016-2017)
United States Alaska
0.0%5.0%
10.0%15.0%20.0%25.0%30.0%35.0%40.0%
12-17 years 18-25 years 18+ years
Binge Alcohol Use in Past Month: United States vs. Alaska (2016-2017)
United States Alaska
Figure 125 Source: National Survey on Drug Use and Health, 2016-17
Figure 126 Source: National Survey on Drug Use and Health, 2016-17 *Binge alcohol use is defined as drinking five or more drinks (males) or four or more drinks (females) on the same occasion on at least one day in the past 30 days
0.0%2.0%4.0%6.0%8.0%
10.0%12.0%
12-17 years 18-25 years 18+ years
Alcohol Use Disorder in Past Year: United States vs. Alaska (2016-2017)
United States Alaska
6.0%
7.1%7.4%
0.0%1.0%2.0%3.0%4.0%5.0%6.0%7.0%8.0%
United States Alaska Anchorage
Alcohol Use Disorder in Past Year, 12+ years: United States, Alaska, Anchorage (2014-2016)
Figure 127 Source: National Survey on Drug Use and Health, 2016-17 *Alcohol Use Disorder is defined as meeting the criteria for alcohol dependence or abuse, based on the definitions found in the DSM-IV
Figure 128 Source: National Survey on Drug Use and Health, 2014-16 Substate Averages *Alcohol Use Disorder is defined as meeting the criteria for alcohol dependence or abuse, based on the definitions found in the DSM-IV
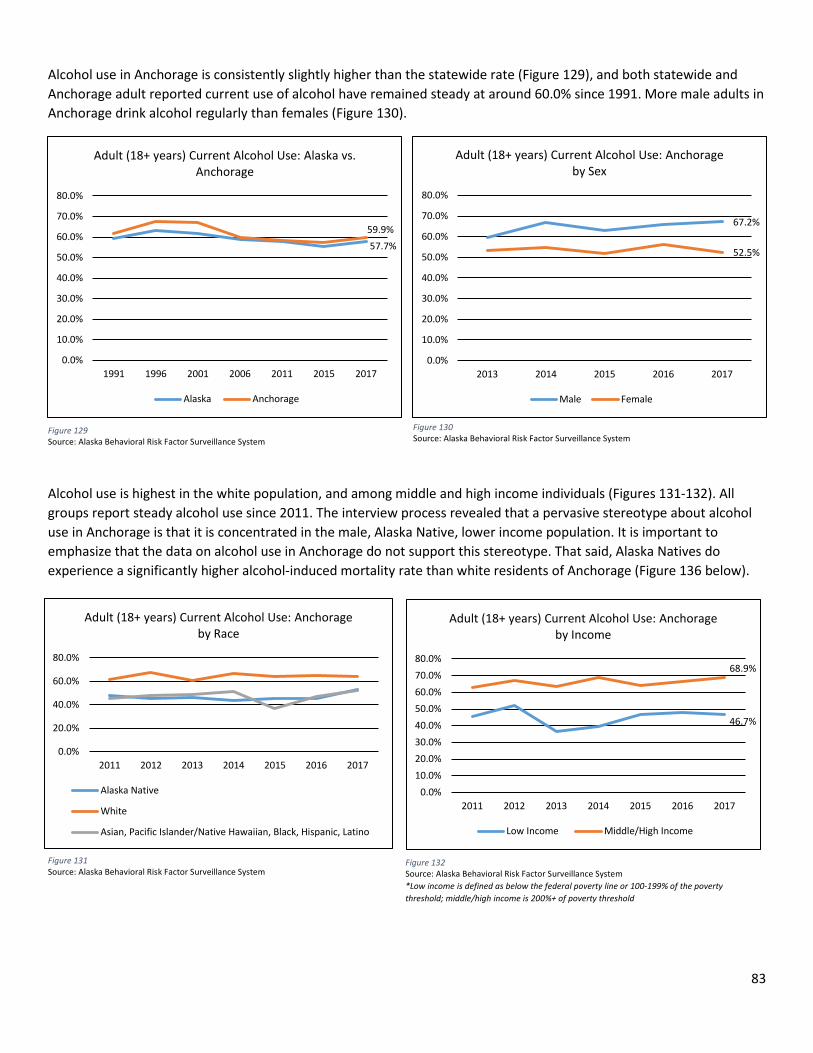
83
Alcohol use in Anchorage is consistently slightly higher than the statewide rate (Figure 129), and both statewide and Anchorage adult reported current use of alcohol have remained steady at around 60.0% since 1991. More male adults in Anchorage drink alcohol regularly than females (Figure 130).
Alcohol use is highest in the white population, and among middle and high income individuals (Figures 131-132). All groups report steady alcohol use since 2011. The interview process revealed that a pervasive stereotype about alcohol use in Anchorage is that it is concentrated in the male, Alaska Native, lower income population. It is important to emphasize that the data on alcohol use in Anchorage do not support this stereotype. That said, Alaska Natives do experience a significantly higher alcohol-induced mortality rate than white residents of Anchorage (Figure 136 below).
67.2%
52.5%
0.0%
10.0%
20.0%
30.0%
40.0%
50.0%
60.0%
70.0%
80.0%
2013 2014 2015 2016 2017
Adult (18+ years) Current Alcohol Use: Anchorage by Sex
Male Female
Figure 129 Source: Alaska Behavioral Risk Factor Surveillance System
Figure 130 Source: Alaska Behavioral Risk Factor Surveillance System
46.7%
68.9%
0.0%10.0%20.0%30.0%40.0%50.0%60.0%70.0%80.0%
2011 2012 2013 2014 2015 2016 2017
Adult (18+ years) Current Alcohol Use: Anchorage by Income
Low Income Middle/High Income
Figure 131 Source: Alaska Behavioral Risk Factor Surveillance System
Figure 132 Source: Alaska Behavioral Risk Factor Surveillance System *Low income is defined as below the federal poverty line or 100-199% of the poverty threshold; middle/high income is 200%+ of poverty threshold
57.7%59.9%
0.0%
10.0%
20.0%
30.0%
40.0%
50.0%
60.0%
70.0%
80.0%
1991 1996 2001 2006 2011 2015 2017
Adult (18+ years) Current Alcohol Use: Alaska vs. Anchorage
Alaska Anchorage
0.0%
20.0%
40.0%
60.0%
80.0%
2011 2012 2013 2014 2015 2016 2017
Adult (18+ years) Current Alcohol Use: Anchorage by Race
Alaska Native
White
Asian, Pacific Islander/Native Hawaiian, Black, Hispanic, Latino
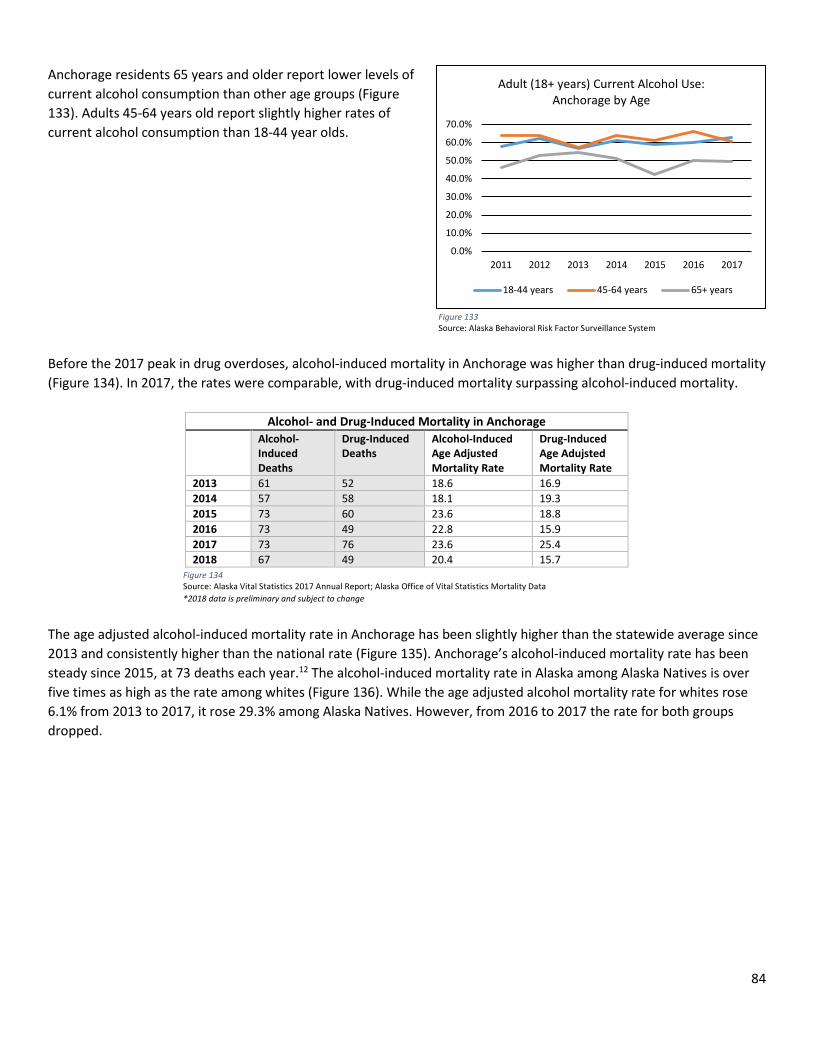
84
Anchorage residents 65 years and older report lower levels of current alcohol consumption than other age groups (Figure 133). Adults 45-64 years old report slightly higher rates of current alcohol consumption than 18-44 year olds. Before the 2017 peak in drug overdoses, alcohol-induced mortality in Anchorage was higher than drug-induced mortality (Figure 134). In 2017, the rates were comparable, with drug-induced mortality surpassing alcohol-induced mortality.
Alcohol- and Drug-Induced Mortality in Anchorage Alcohol-
Induced Deaths
Drug-Induced Deaths
Alcohol-Induced Age Adjusted Mortality Rate
Drug-Induced Age Adujsted Mortality Rate
2013 61 52 18.6 16.9 2014 57 58 18.1 19.3 2015 73 60 23.6 18.8 2016 73 49 22.8 15.9 2017 73 76 23.6 25.4 2018 67 49 20.4 15.7
The age adjusted alcohol-induced mortality rate in Anchorage has been slightly higher than the statewide average since 2013 and consistently higher than the national rate (Figure 135). Anchorage’s alcohol-induced mortality rate has been steady since 2015, at 73 deaths each year.12 The alcohol-induced mortality rate in Alaska among Alaska Natives is over five times as high as the rate among whites (Figure 136). While the age adjusted alcohol mortality rate for whites rose 6.1% from 2013 to 2017, it rose 29.3% among Alaska Natives. However, from 2016 to 2017 the rate for both groups dropped.
Figure 134 Source: Alaska Vital Statistics 2017 Annual Report; Alaska Office of Vital Statistics Mortality Data *2018 data is preliminary and subject to change
0.0%
10.0%
20.0%
30.0%
40.0%
50.0%
60.0%
70.0%
2011 2012 2013 2014 2015 2016 2017
Adult (18+ years) Current Alcohol Use: Anchorage by Age
18-44 years 45-64 years 65+ years
Figure 133 Source: Alaska Behavioral Risk Factor Surveillance System
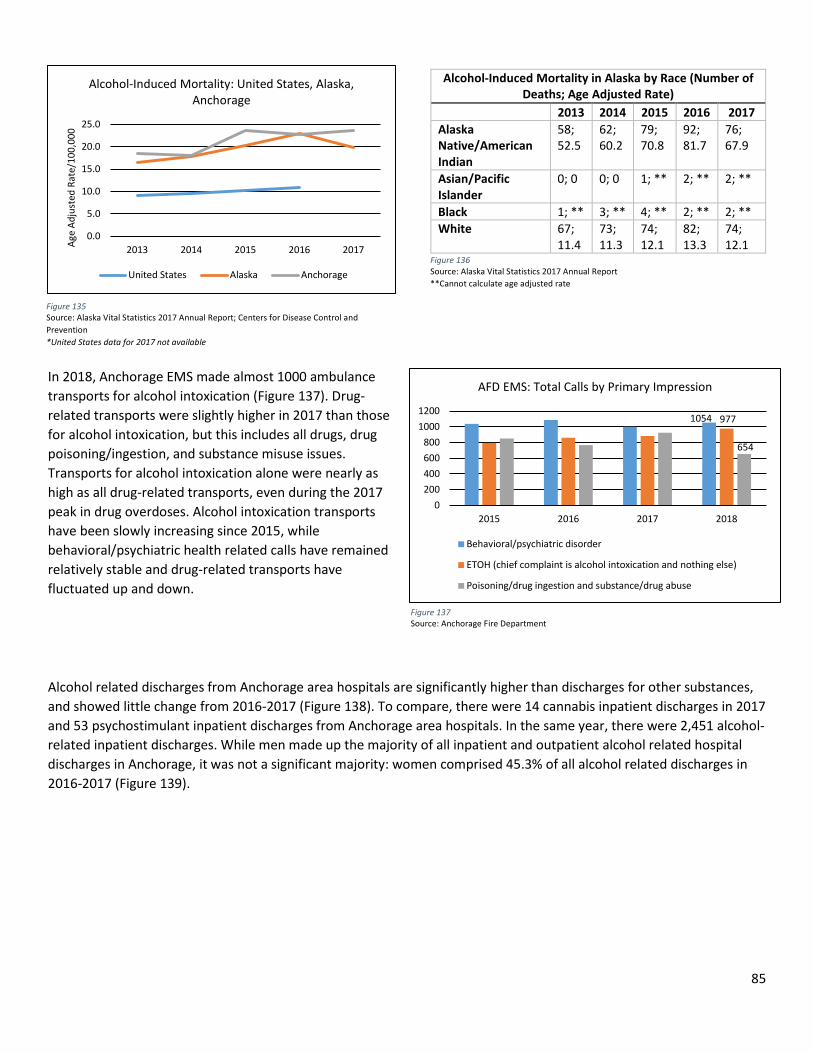
85
In 2018, Anchorage EMS made almost 1000 ambulance transports for alcohol intoxication (Figure 137). Drug-related transports were slightly higher in 2017 than those for alcohol intoxication, but this includes all drugs, drug poisoning/ingestion, and substance misuse issues. Transports for alcohol intoxication alone were nearly as high as all drug-related transports, even during the 2017 peak in drug overdoses. Alcohol intoxication transports have been slowly increasing since 2015, while behavioral/psychiatric health related calls have remained relatively stable and drug-related transports have fluctuated up and down.
Alcohol related discharges from Anchorage area hospitals are significantly higher than discharges for other substances, and showed little change from 2016-2017 (Figure 138). To compare, there were 14 cannabis inpatient discharges in 2017 and 53 psychostimulant inpatient discharges from Anchorage area hospitals. In the same year, there were 2,451 alcohol-related inpatient discharges. While men made up the majority of all inpatient and outpatient alcohol related hospital discharges in Anchorage, it was not a significant majority: women comprised 45.3% of all alcohol related discharges in 2016-2017 (Figure 139).
Alcohol-Induced Mortality in Alaska by Race (Number of Deaths; Age Adjusted Rate)
2013 2014 2015 2016 2017 Alaska Native/American Indian
58; 52.5
62; 60.2
79; 70.8
92; 81.7
76; 67.9
Asian/Pacific Islander
0; 0 0; 0 1; ** 2; ** 2; **
Black 1; ** 3; ** 4; ** 2; ** 2; ** White 67;
11.4 73; 11.3
74; 12.1
82; 13.3
74; 12.1
Figure 135 Source: Alaska Vital Statistics 2017 Annual Report; Centers for Disease Control and Prevention *United States data for 2017 not available
Figure 136 Source: Alaska Vital Statistics 2017 Annual Report **Cannot calculate age adjusted rate
Figure 137 Source: Anchorage Fire Department
1054 977
654
0200400600800
10001200
2015 2016 2017 2018
AFD EMS: Total Calls by Primary Impression
Behavioral/psychiatric disorder
ETOH (chief complaint is alcohol intoxication and nothing else)
Poisoning/drug ingestion and substance/drug abuse
0.0
5.0
10.0
15.0
20.0
25.0
2013 2014 2015 2016 2017Age
Adju
sted
Rat
e/10
0,00
0Alcohol-Induced Mortality: United States, Alaska,
Anchorage
United States Alaska Anchorage
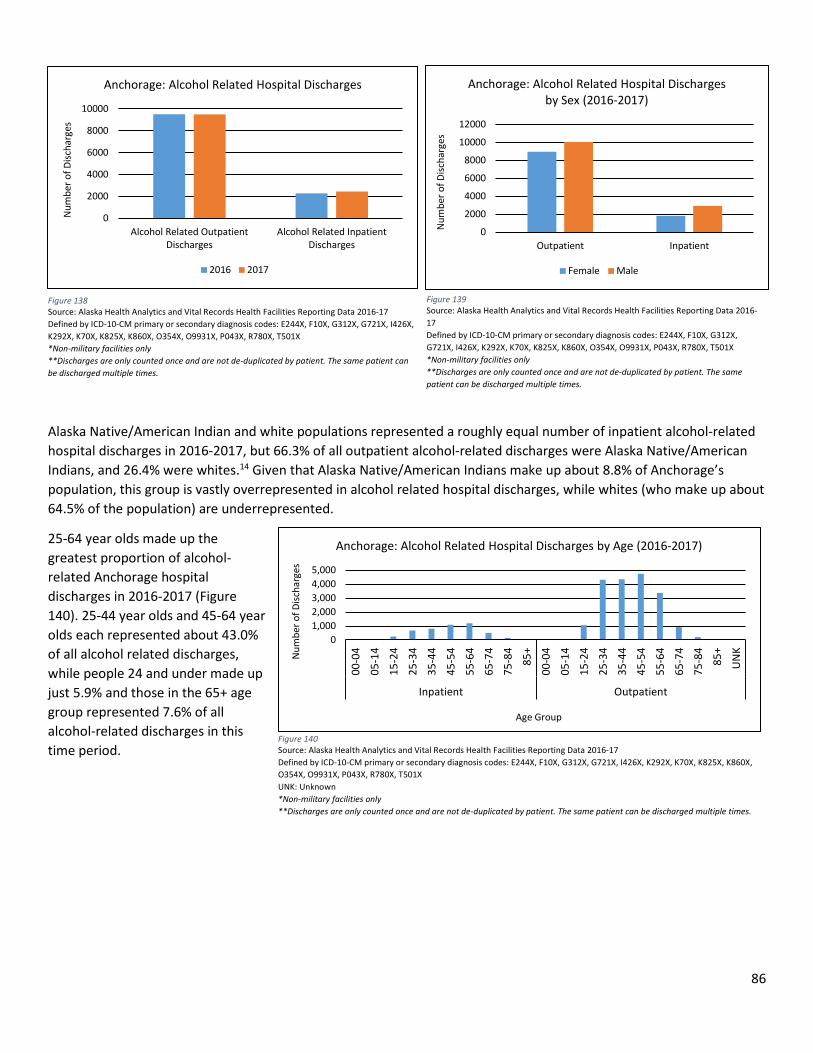
86
Alaska Native/American Indian and white populations represented a roughly equal number of inpatient alcohol-related hospital discharges in 2016-2017, but 66.3% of all outpatient alcohol-related discharges were Alaska Native/American Indians, and 26.4% were whites.14 Given that Alaska Native/American Indians make up about 8.8% of Anchorage’s population, this group is vastly overrepresented in alcohol related hospital discharges, while whites (who make up about 64.5% of the population) are underrepresented.
25-64 year olds made up the greatest proportion of alcohol-related Anchorage hospital discharges in 2016-2017 (Figure 140). 25-44 year olds and 45-64 year olds each represented about 43.0% of all alcohol related discharges, while people 24 and under made up just 5.9% and those in the 65+ age group represented 7.6% of all alcohol-related discharges in this time period.
0
2000
4000
6000
8000
10000
Alcohol Related OutpatientDischarges
Alcohol Related InpatientDischarges
Num
ber o
f Disc
harg
es
Anchorage: Alcohol Related Hospital Discharges
2016 2017
Figure 138 Source: Alaska Health Analytics and Vital Records Health Facilities Reporting Data 2016-17 Defined by ICD-10-CM primary or secondary diagnosis codes: E244X, F10X, G312X, G721X, I426X, K292X, K70X, K825X, K860X, O354X, O9931X, P043X, R780X, T501X *Non-military facilities only **Discharges are only counted once and are not de-duplicated by patient. The same patient can be discharged multiple times.
0
2000
4000
6000
8000
10000
12000
Outpatient Inpatient
Num
ber o
f Disc
harg
es
Anchorage: Alcohol Related Hospital Discharges by Sex (2016-2017)
Female Male
Figure 139 Source: Alaska Health Analytics and Vital Records Health Facilities Reporting Data 2016-17 Defined by ICD-10-CM primary or secondary diagnosis codes: E244X, F10X, G312X, G721X, I426X, K292X, K70X, K825X, K860X, O354X, O9931X, P043X, R780X, T501X *Non-military facilities only **Discharges are only counted once and are not de-duplicated by patient. The same patient can be discharged multiple times.
01,0002,0003,0004,0005,000
00-0
4
05-1
4
15-2
4
25-3
4
35-4
4
45-5
4
55-6
4
65-7
4
75-8
4
85+
00-0
4
05-1
4
15-2
4
25-3
4
35-4
4
45-5
4
55-6
4
65-7
4
75-8
4
85+
UN
K
Inpatient Outpatient
Num
ber o
f Disc
harg
es
Age Group
Anchorage: Alcohol Related Hospital Discharges by Age (2016-2017)
Figure 140 Source: Alaska Health Analytics and Vital Records Health Facilities Reporting Data 2016-17 Defined by ICD-10-CM primary or secondary diagnosis codes: E244X, F10X, G312X, G721X, I426X, K292X, K70X, K825X, K860X, O354X, O9931X, P043X, R780X, T501X UNK: Unknown *Non-military facilities only **Discharges are only counted once and are not de-duplicated by patient. The same patient can be discharged multiple times.
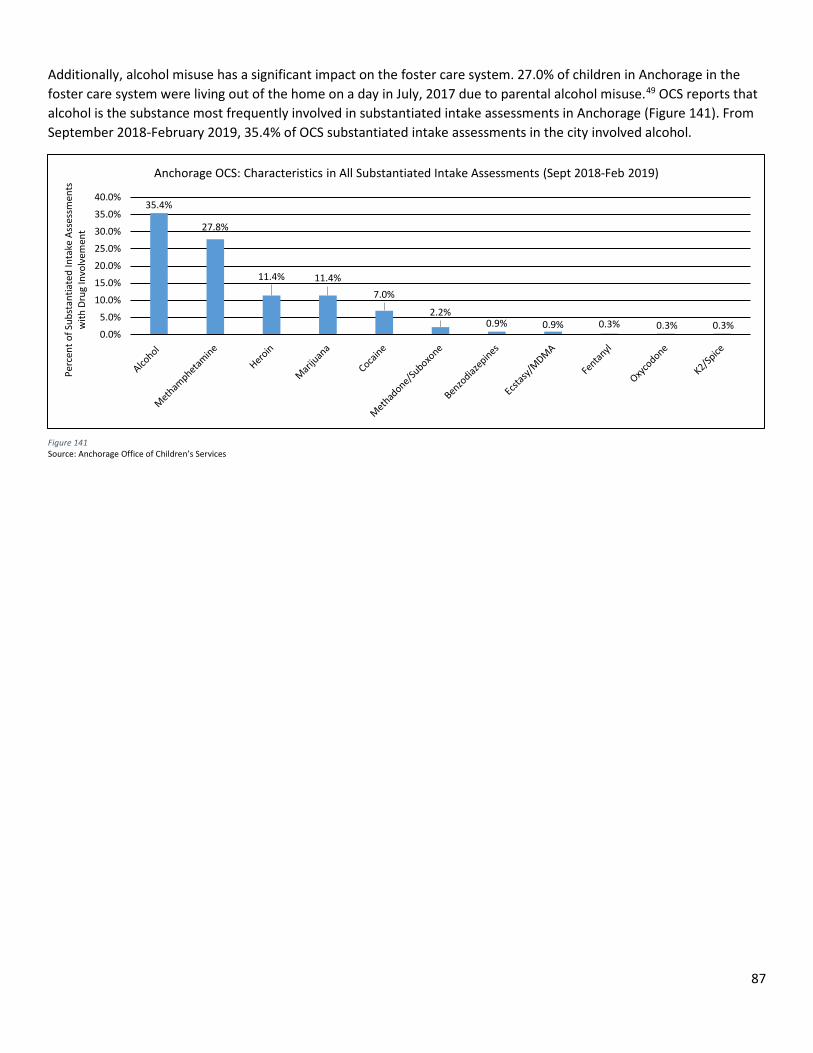
87
Additionally, alcohol misuse has a significant impact on the foster care system. 27.0% of children in Anchorage in the foster care system were living out of the home on a day in July, 2017 due to parental alcohol misuse.49 OCS reports that alcohol is the substance most frequently involved in substantiated intake assessments in Anchorage (Figure 141). From September 2018-February 2019, 35.4% of OCS substantiated intake assessments in the city involved alcohol.
35.4%
27.8%
11.4% 11.4%7.0%
2.2%0.9% 0.9% 0.3% 0.3% 0.3%
0.0%
5.0%
10.0%
15.0%
20.0%
25.0%
30.0%
35.0%
40.0%
Perc
ent o
f Sub
stan
tiate
d In
take
Ass
essm
ents
w
ith D
rug
Invo
lvem
ent
Anchorage OCS: Characteristics in All Substantiated Intake Assessments (Sept 2018-Feb 2019)
Figure 141 Source: Anchorage Office of Children’s Services
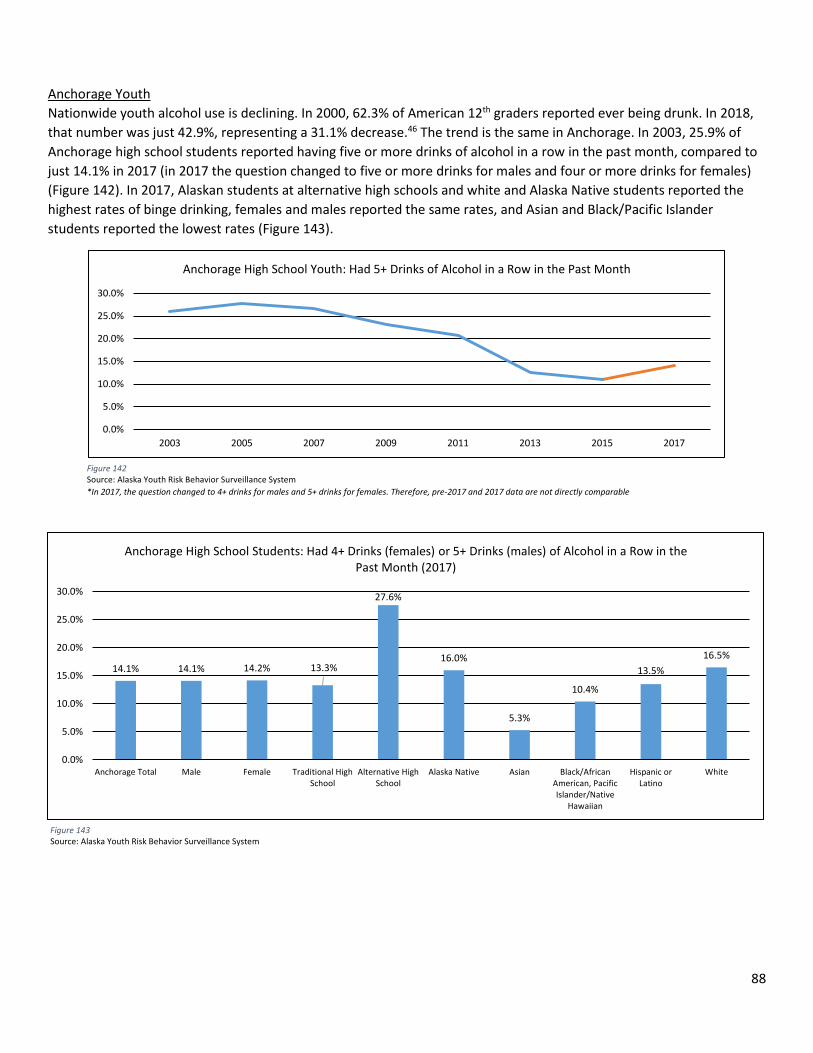
88
Anchorage Youth Nationwide youth alcohol use is declining. In 2000, 62.3% of American 12th graders reported ever being drunk. In 2018, that number was just 42.9%, representing a 31.1% decrease.46 The trend is the same in Anchorage. In 2003, 25.9% of Anchorage high school students reported having five or more drinks of alcohol in a row in the past month, compared to just 14.1% in 2017 (in 2017 the question changed to five or more drinks for males and four or more drinks for females) (Figure 142). In 2017, Alaskan students at alternative high schools and white and Alaska Native students reported the highest rates of binge drinking, females and males reported the same rates, and Asian and Black/Pacific Islander students reported the lowest rates (Figure 143).
Figure 142 Source: Alaska Youth Risk Behavior Surveillance System *In 2017, the question changed to 4+ drinks for males and 5+ drinks for females. Therefore, pre-2017 and 2017 data are not directly comparable
0.0%
5.0%
10.0%
15.0%
20.0%
25.0%
30.0%
2003 2005 2007 2009 2011 2013 2015 2017
Anchorage High School Youth: Had 5+ Drinks of Alcohol in a Row in the Past Month
Figure 143 Source: Alaska Youth Risk Behavior Surveillance System
14.1% 14.1% 14.2% 13.3%
27.6%
16.0%
5.3%
10.4%
13.5%16.5%
0.0%
5.0%
10.0%
15.0%
20.0%
25.0%
30.0%
Anchorage Total Male Female Traditional HighSchool
Alternative HighSchool
Alaska Native Asian Black/AfricanAmerican, PacificIslander/Native
Hawaiian
Hispanic orLatino
White
Anchorage High School Students: Had 4+ Drinks (females) or 5+ Drinks (males) of Alcohol in a Row in the Past Month (2017)
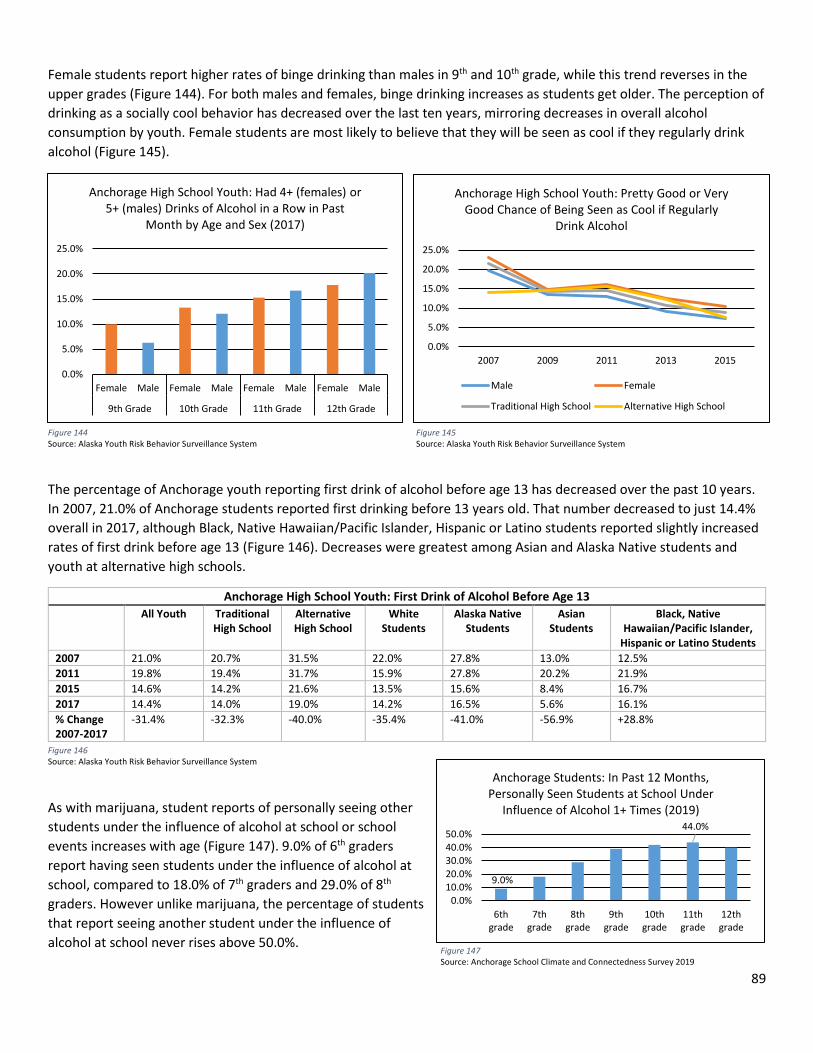
89
Female students report higher rates of binge drinking than males in 9th and 10th grade, while this trend reverses in the upper grades (Figure 144). For both males and females, binge drinking increases as students get older. The perception of drinking as a socially cool behavior has decreased over the last ten years, mirroring decreases in overall alcohol consumption by youth. Female students are most likely to believe that they will be seen as cool if they regularly drink alcohol (Figure 145).
The percentage of Anchorage youth reporting first drink of alcohol before age 13 has decreased over the past 10 years. In 2007, 21.0% of Anchorage students reported first drinking before 13 years old. That number decreased to just 14.4% overall in 2017, although Black, Native Hawaiian/Pacific Islander, Hispanic or Latino students reported slightly increased rates of first drink before age 13 (Figure 146). Decreases were greatest among Asian and Alaska Native students and youth at alternative high schools.
Anchorage High School Youth: First Drink of Alcohol Before Age 13 All Youth Traditional
High School Alternative High School
White Students
Alaska Native Students
Asian Students
Black, Native Hawaiian/Pacific Islander,
Hispanic or Latino Students 2007 21.0% 20.7% 31.5% 22.0% 27.8% 13.0% 12.5% 2011 19.8% 19.4% 31.7% 15.9% 27.8% 20.2% 21.9% 2015 14.6% 14.2% 21.6% 13.5% 15.6% 8.4% 16.7% 2017 14.4% 14.0% 19.0% 14.2% 16.5% 5.6% 16.1% % Change 2007-2017
-31.4% -32.3% -40.0% -35.4% -41.0% -56.9% +28.8%
As with marijuana, student reports of personally seeing other students under the influence of alcohol at school or school events increases with age (Figure 147). 9.0% of 6th graders report having seen students under the influence of alcohol at school, compared to 18.0% of 7th graders and 29.0% of 8th graders. However unlike marijuana, the percentage of students that report seeing another student under the influence of alcohol at school never rises above 50.0%.
0.0%
5.0%
10.0%
15.0%
20.0%
25.0%
2007 2009 2011 2013 2015
Anchorage High School Youth: Pretty Good or Very Good Chance of Being Seen as Cool if Regularly
Drink Alcohol
Male Female
Traditional High School Alternative High School
Figure 144 Source: Alaska Youth Risk Behavior Surveillance System
Figure 145 Source: Alaska Youth Risk Behavior Surveillance System
Figure 146 Source: Alaska Youth Risk Behavior Surveillance System
9.0%
44.0%
0.0%10.0%20.0%30.0%40.0%50.0%
6thgrade
7thgrade
8thgrade
9thgrade
10thgrade
11thgrade
12thgrade
Anchorage Students: In Past 12 Months, Personally Seen Students at School Under
Influence of Alcohol 1+ Times (2019)
Figure 147 Source: Anchorage School Climate and Connectedness Survey 2019
0.0%
5.0%
10.0%
15.0%
20.0%
25.0%
Female Male Female Male Female Male Female Male
9th Grade 10th Grade 11th Grade 12th Grade
Anchorage High School Youth: Had 4+ (females) or 5+ (males) Drinks of Alcohol in a Row in Past
Month by Age and Sex (2017)
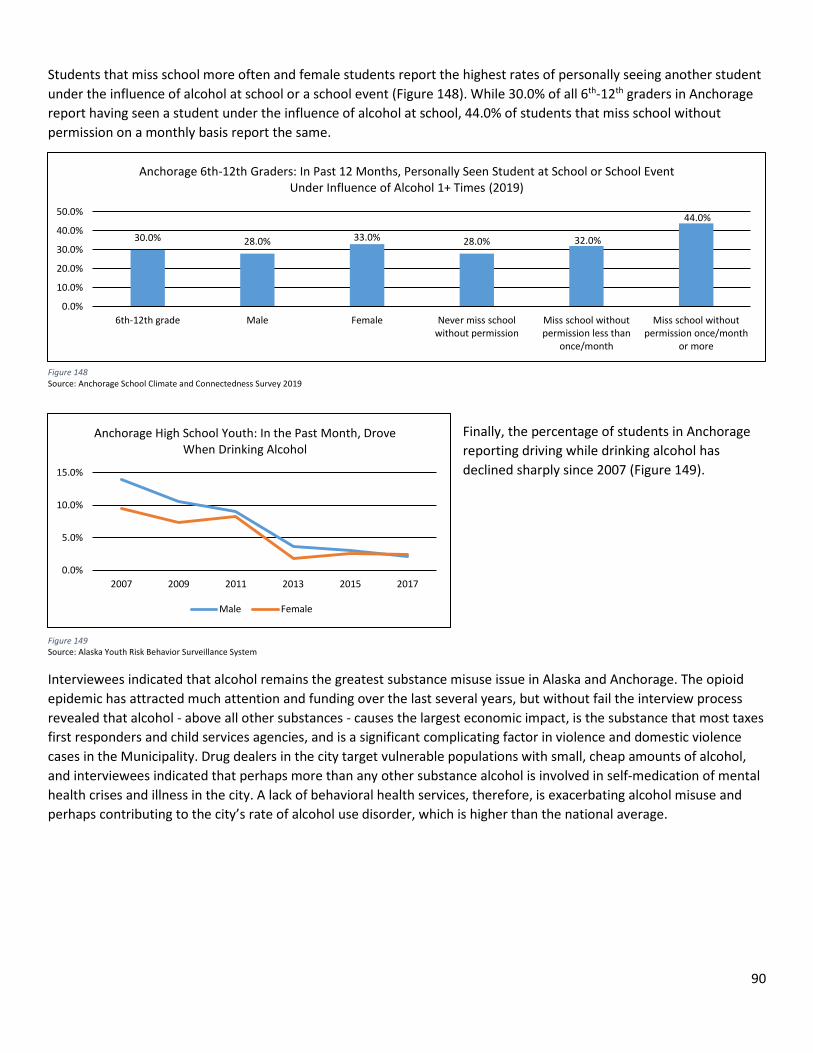
90
Students that miss school more often and female students report the highest rates of personally seeing another student under the influence of alcohol at school or a school event (Figure 148). While 30.0% of all 6th-12th graders in Anchorage report having seen a student under the influence of alcohol at school, 44.0% of students that miss school without permission on a monthly basis report the same.
Finally, the percentage of students in Anchorage reporting driving while drinking alcohol has declined sharply since 2007 (Figure 149).
Interviewees indicated that alcohol remains the greatest substance misuse issue in Alaska and Anchorage. The opioid epidemic has attracted much attention and funding over the last several years, but without fail the interview process revealed that alcohol - above all other substances - causes the largest economic impact, is the substance that most taxes first responders and child services agencies, and is a significant complicating factor in violence and domestic violence cases in the Municipality. Drug dealers in the city target vulnerable populations with small, cheap amounts of alcohol, and interviewees indicated that perhaps more than any other substance alcohol is involved in self-medication of mental health crises and illness in the city. A lack of behavioral health services, therefore, is exacerbating alcohol misuse and perhaps contributing to the city’s rate of alcohol use disorder, which is higher than the national average.
0.0%
5.0%
10.0%
15.0%
2007 2009 2011 2013 2015 2017
Anchorage High School Youth: In the Past Month, Drove When Drinking Alcohol
Male Female
Figure 149 Source: Alaska Youth Risk Behavior Surveillance System
30.0% 28.0% 33.0% 28.0% 32.0%
44.0%
0.0%
10.0%
20.0%
30.0%
40.0%
50.0%
6th-12th grade Male Female Never miss schoolwithout permission
Miss school withoutpermission less than
once/month
Miss school withoutpermission once/month
or more
Anchorage 6th-12th Graders: In Past 12 Months, Personally Seen Student at School or School Event Under Influence of Alcohol 1+ Times (2019)
Figure 148 Source: Anchorage School Climate and Connectedness Survey 2019
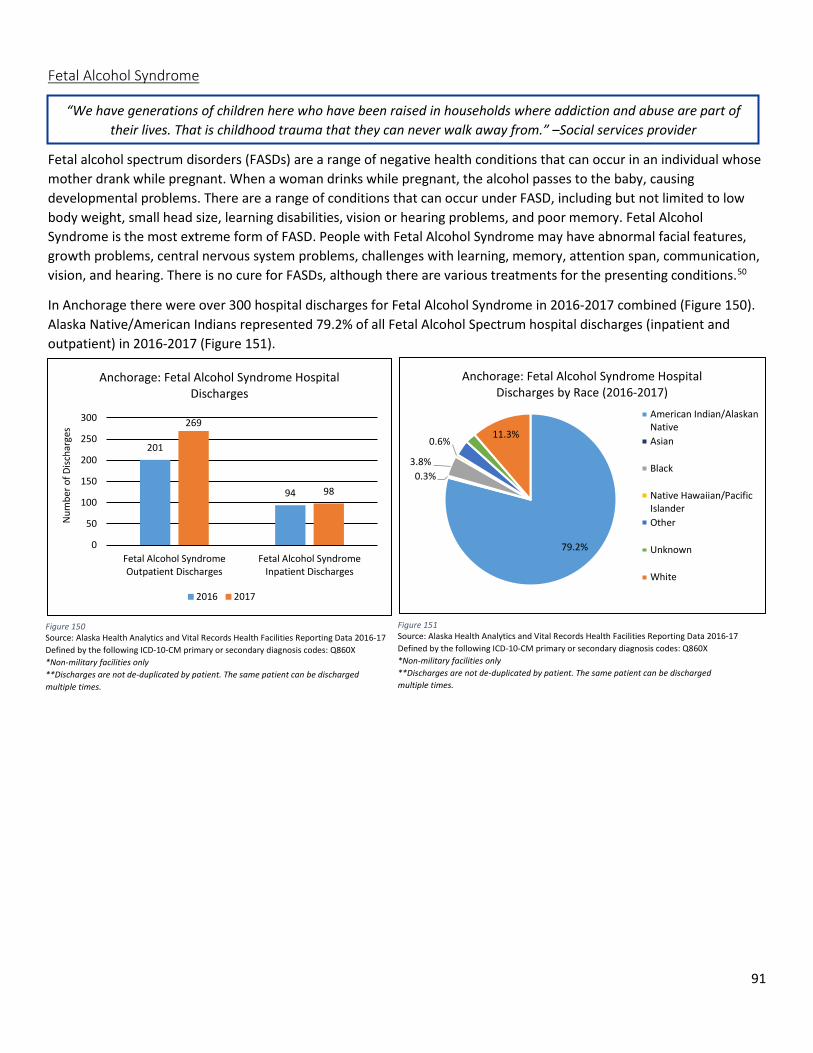
91
Fetal Alcohol Syndrome
Fetal alcohol spectrum disorders (FASDs) are a range of negative health conditions that can occur in an individual whose mother drank while pregnant. When a woman drinks while pregnant, the alcohol passes to the baby, causing developmental problems. There are a range of conditions that can occur under FASD, including but not limited to low body weight, small head size, learning disabilities, vision or hearing problems, and poor memory. Fetal Alcohol Syndrome is the most extreme form of FASD. People with Fetal Alcohol Syndrome may have abnormal facial features, growth problems, central nervous system problems, challenges with learning, memory, attention span, communication, vision, and hearing. There is no cure for FASDs, although there are various treatments for the presenting conditions.50
In Anchorage there were over 300 hospital discharges for Fetal Alcohol Syndrome in 2016-2017 combined (Figure 150). Alaska Native/American Indians represented 79.2% of all Fetal Alcohol Spectrum hospital discharges (inpatient and outpatient) in 2016-2017 (Figure 151).
“We have generations of children here who have been raised in households where addiction and abuse are part of their lives. That is childhood trauma that they can never walk away from.” –Social services provider
201
94
269
98
0
50
100
150
200
250
300
Fetal Alcohol SyndromeOutpatient Discharges
Fetal Alcohol SyndromeInpatient Discharges
Num
ber o
f Disc
harg
es
Anchorage: Fetal Alcohol Syndrome Hospital Discharges
2016 2017
Figure 150 Source: Alaska Health Analytics and Vital Records Health Facilities Reporting Data 2016-17 Defined by the following ICD-10-CM primary or secondary diagnosis codes: Q860X *Non-military facilities only **Discharges are not de-duplicated by patient. The same patient can be discharged multiple times.
Figure 151 Source: Alaska Health Analytics and Vital Records Health Facilities Reporting Data 2016-17 Defined by the following ICD-10-CM primary or secondary diagnosis codes: Q860X *Non-military facilities only **Discharges are not de-duplicated by patient. The same patient can be discharged multiple times.
79.2%
0.3%3.8%
0.6%11.3%
Anchorage: Fetal Alcohol Syndrome Hospital Discharges by Race (2016-2017)
American Indian/AlaskanNativeAsian
Black
Native Hawaiian/PacificIslanderOther
Unknown
White
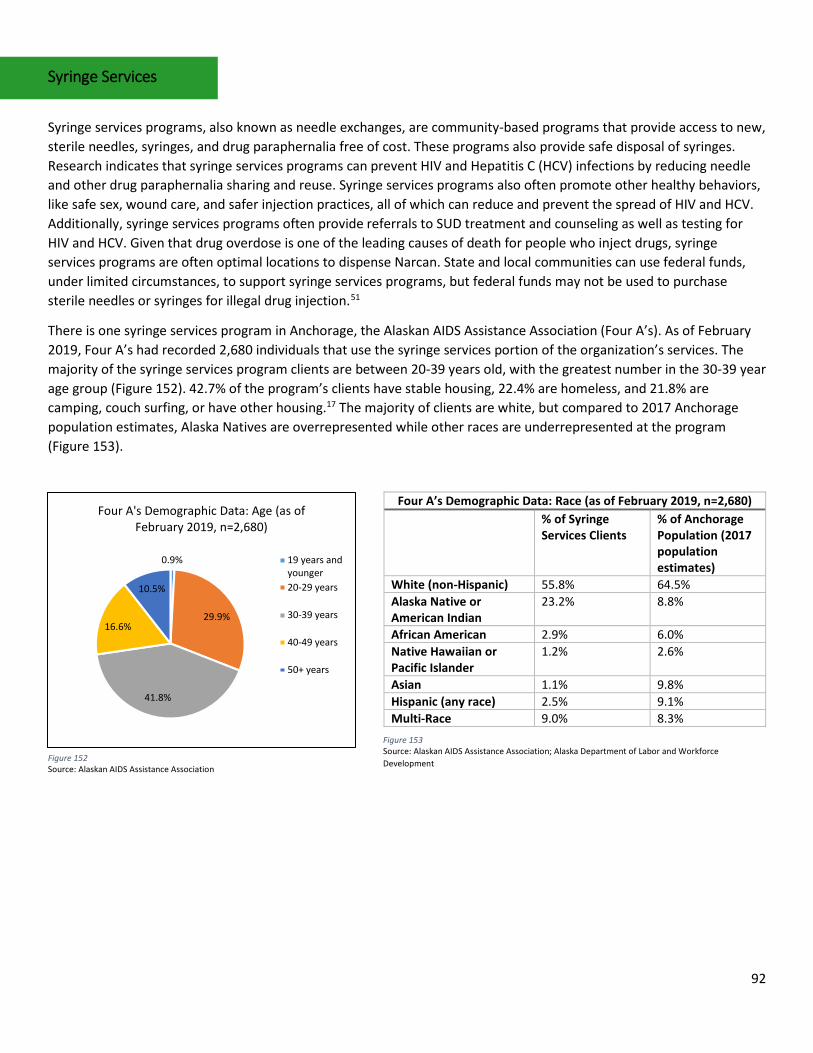
92
Syringe Services
Syringe services programs, also known as needle exchanges, are community-based programs that provide access to new, sterile needles, syringes, and drug paraphernalia free of cost. These programs also provide safe disposal of syringes. Research indicates that syringe services programs can prevent HIV and Hepatitis C (HCV) infections by reducing needle and other drug paraphernalia sharing and reuse. Syringe services programs also often promote other healthy behaviors, like safe sex, wound care, and safer injection practices, all of which can reduce and prevent the spread of HIV and HCV. Additionally, syringe services programs often provide referrals to SUD treatment and counseling as well as testing for HIV and HCV. Given that drug overdose is one of the leading causes of death for people who inject drugs, syringe services programs are often optimal locations to dispense Narcan. State and local communities can use federal funds, under limited circumstances, to support syringe services programs, but federal funds may not be used to purchase sterile needles or syringes for illegal drug injection.51
There is one syringe services program in Anchorage, the Alaskan AIDS Assistance Association (Four A’s). As of February 2019, Four A’s had recorded 2,680 individuals that use the syringe services portion of the organization’s services. The majority of the syringe services program clients are between 20-39 years old, with the greatest number in the 30-39 year age group (Figure 152). 42.7% of the program’s clients have stable housing, 22.4% are homeless, and 21.8% are camping, couch surfing, or have other housing.17 The majority of clients are white, but compared to 2017 Anchorage population estimates, Alaska Natives are overrepresented while other races are underrepresented at the program (Figure 153).
Four A’s Demographic Data: Race (as of February 2019, n=2,680) % of Syringe
Services Clients % of Anchorage Population (2017 population estimates)
White (non-Hispanic) 55.8% 64.5% Alaska Native or American Indian
23.2% 8.8%
African American 2.9% 6.0% Native Hawaiian or Pacific Islander
1.2% 2.6%
Asian 1.1% 9.8% Hispanic (any race) 2.5% 9.1% Multi-Race 9.0% 8.3%
0.9%
29.9%
41.8%
16.6%
10.5%
Four A's Demographic Data: Age (as of February 2019, n=2,680)
19 years andyounger20-29 years
30-39 years
40-49 years
50+ years
Figure 152 Source: Alaskan AIDS Assistance Association
Figure 153 Source: Alaskan AIDS Assistance Association; Alaska Department of Labor and Workforce Development
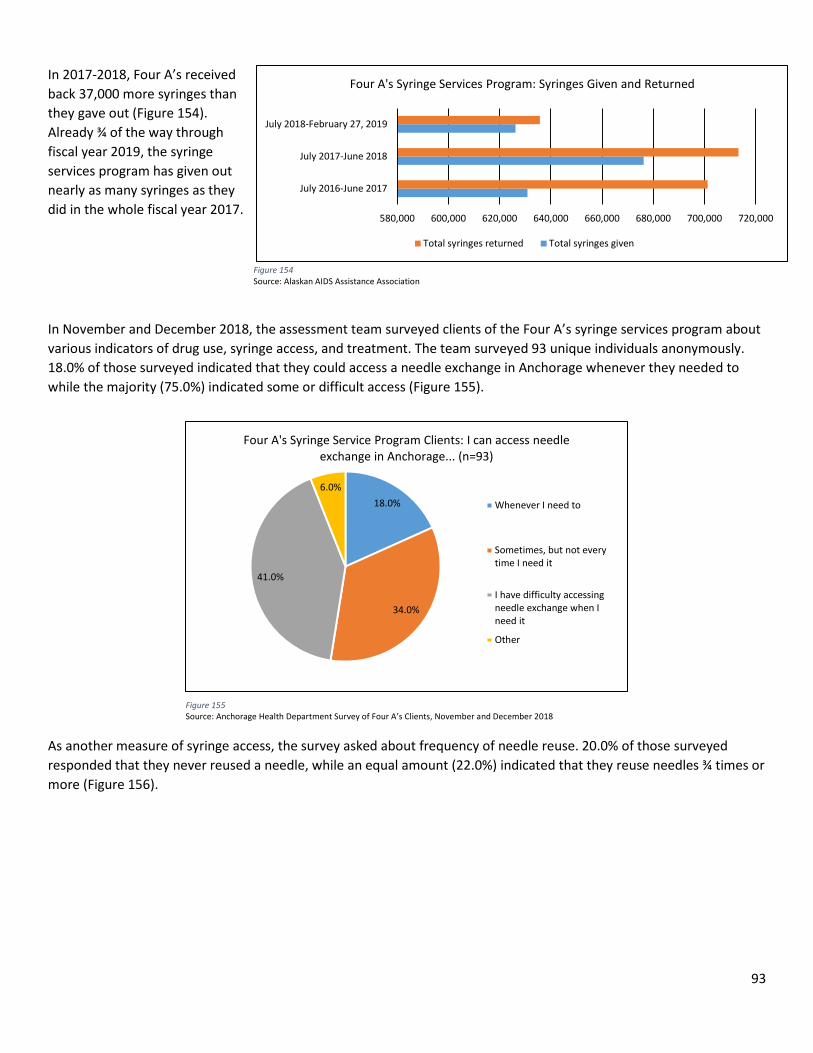
93
In 2017-2018, Four A’s received back 37,000 more syringes than they gave out (Figure 154). Already ¾ of the way through fiscal year 2019, the syringe services program has given out nearly as many syringes as they did in the whole fiscal year 2017.
In November and December 2018, the assessment team surveyed clients of the Four A’s syringe services program about various indicators of drug use, syringe access, and treatment. The team surveyed 93 unique individuals anonymously. 18.0% of those surveyed indicated that they could access a needle exchange in Anchorage whenever they needed to while the majority (75.0%) indicated some or difficult access (Figure 155).
As another measure of syringe access, the survey asked about frequency of needle reuse. 20.0% of those surveyed responded that they never reused a needle, while an equal amount (22.0%) indicated that they reuse needles ¾ times or more (Figure 156).
18.0%
34.0%
41.0%
6.0%
Four A's Syringe Service Program Clients: I can access needle exchange in Anchorage... (n=93)
Whenever I need to
Sometimes, but not everytime I need it
I have difficulty accessingneedle exchange when Ineed it
Other
Figure 155 Source: Anchorage Health Department Survey of Four A’s Clients, November and December 2018
580,000 600,000 620,000 640,000 660,000 680,000 700,000 720,000
July 2016-June 2017
July 2017-June 2018
July 2018-February 27, 2019
Four A's Syringe Services Program: Syringes Given and Returned
Total syringes returned Total syringes given
Figure 154 Source: Alaskan AIDS Assistance Association
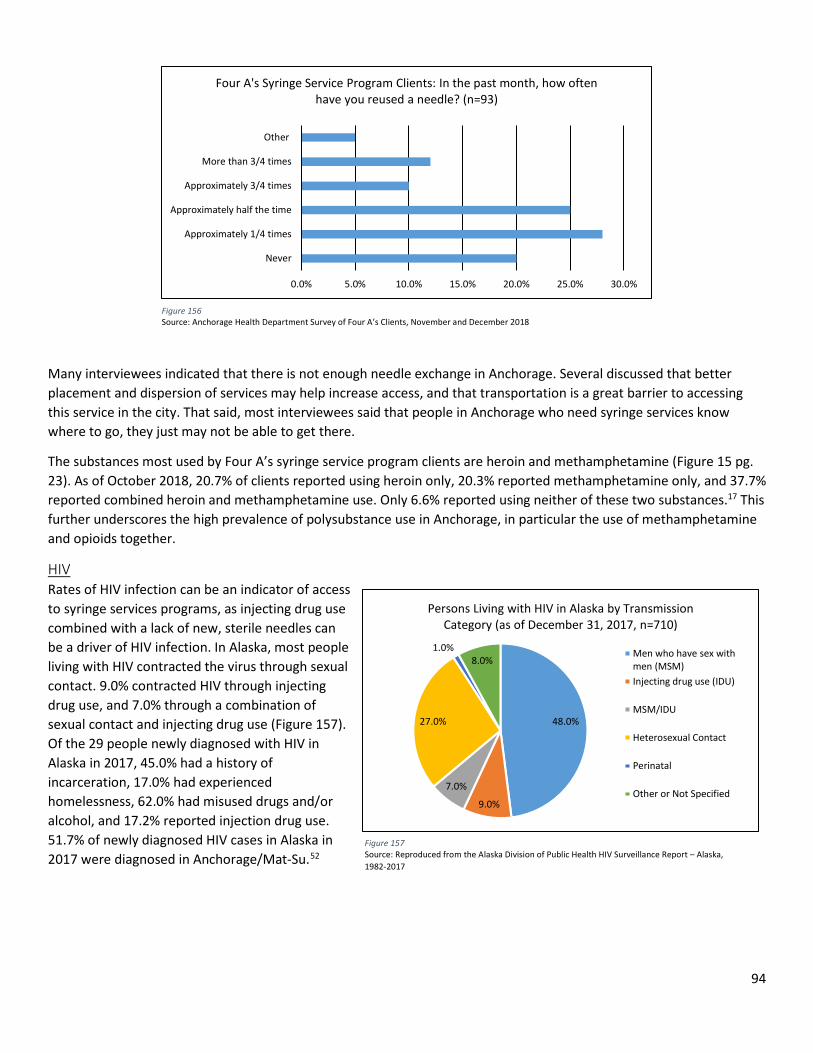
94
Many interviewees indicated that there is not enough needle exchange in Anchorage. Several discussed that better placement and dispersion of services may help increase access, and that transportation is a great barrier to accessing this service in the city. That said, most interviewees said that people in Anchorage who need syringe services know where to go, they just may not be able to get there.
The substances most used by Four A’s syringe service program clients are heroin and methamphetamine (Figure 15 pg. 23). As of October 2018, 20.7% of clients reported using heroin only, 20.3% reported methamphetamine only, and 37.7% reported combined heroin and methamphetamine use. Only 6.6% reported using neither of these two substances.17 This further underscores the high prevalence of polysubstance use in Anchorage, in particular the use of methamphetamine and opioids together.
HIV Rates of HIV infection can be an indicator of access to syringe services programs, as injecting drug use combined with a lack of new, sterile needles can be a driver of HIV infection. In Alaska, most people living with HIV contracted the virus through sexual contact. 9.0% contracted HIV through injecting drug use, and 7.0% through a combination of sexual contact and injecting drug use (Figure 157). Of the 29 people newly diagnosed with HIV in Alaska in 2017, 45.0% had a history of incarceration, 17.0% had experienced homelessness, 62.0% had misused drugs and/or alcohol, and 17.2% reported injection drug use. 51.7% of newly diagnosed HIV cases in Alaska in 2017 were diagnosed in Anchorage/Mat-Su.52
0.0% 5.0% 10.0% 15.0% 20.0% 25.0% 30.0%
Never
Approximately 1/4 times
Approximately half the time
Approximately 3/4 times
More than 3/4 times
Other
Four A's Syringe Service Program Clients: In the past month, how often have you reused a needle? (n=93)
Figure 156 Source: Anchorage Health Department Survey of Four A’s Clients, November and December 2018
48.0%
9.0%
7.0%
27.0%
1.0%8.0%
Persons Living with HIV in Alaska by Transmission Category (as of December 31, 2017, n=710)
Men who have sex withmen (MSM)Injecting drug use (IDU)
MSM/IDU
Heterosexual Contact
Perinatal
Other or Not Specified
Figure 157 Source: Reproduced from the Alaska Division of Public Health HIV Surveillance Report – Alaska, 1982-2017
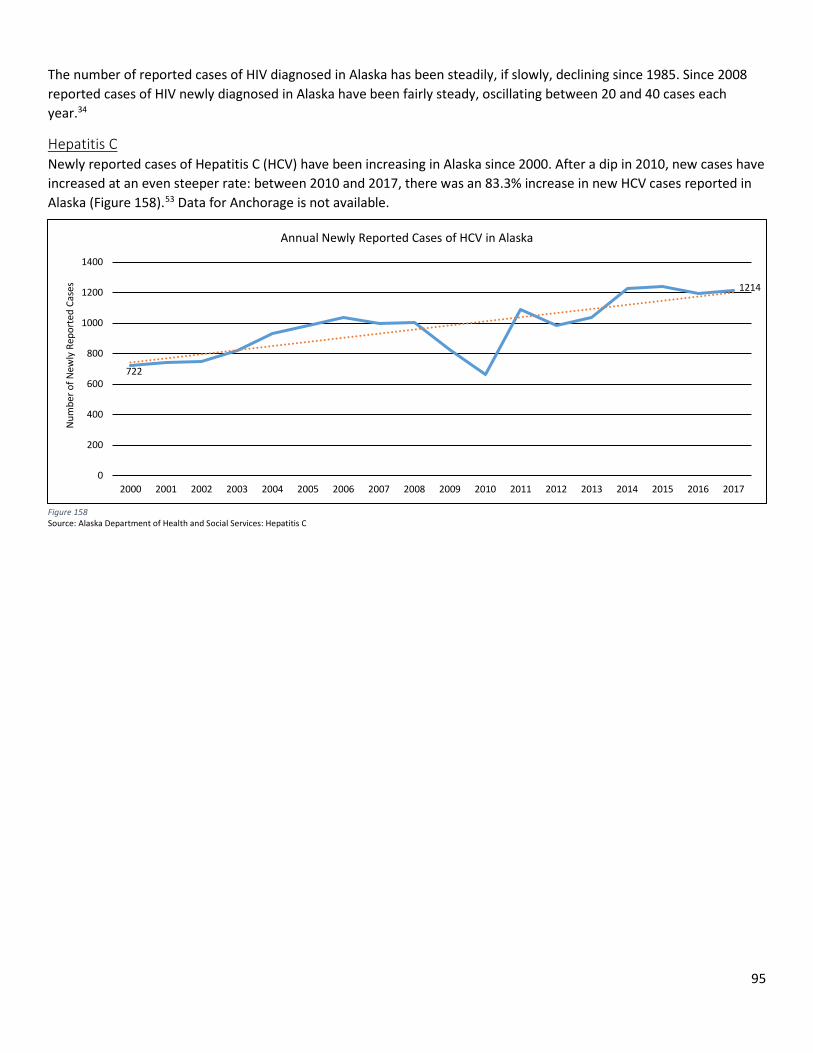
95
The number of reported cases of HIV diagnosed in Alaska has been steadily, if slowly, declining since 1985. Since 2008 reported cases of HIV newly diagnosed in Alaska have been fairly steady, oscillating between 20 and 40 cases each year.34
Hepatitis C Newly reported cases of Hepatitis C (HCV) have been increasing in Alaska since 2000. After a dip in 2010, new cases have increased at an even steeper rate: between 2010 and 2017, there was an 83.3% increase in new HCV cases reported in Alaska (Figure 158).53 Data for Anchorage is not available.
Figure 158 Source: Alaska Department of Health and Social Services: Hepatitis C
722
1214
0
200
400
600
800
1000
1200
1400
2000 2001 2002 2003 2004 2005 2006 2007 2008 2009 2010 2011 2012 2013 2014 2015 2016 2017
Num
ber o
f New
ly R
epor
ted
Case
s
Annual Newly Reported Cases of HCV in Alaska
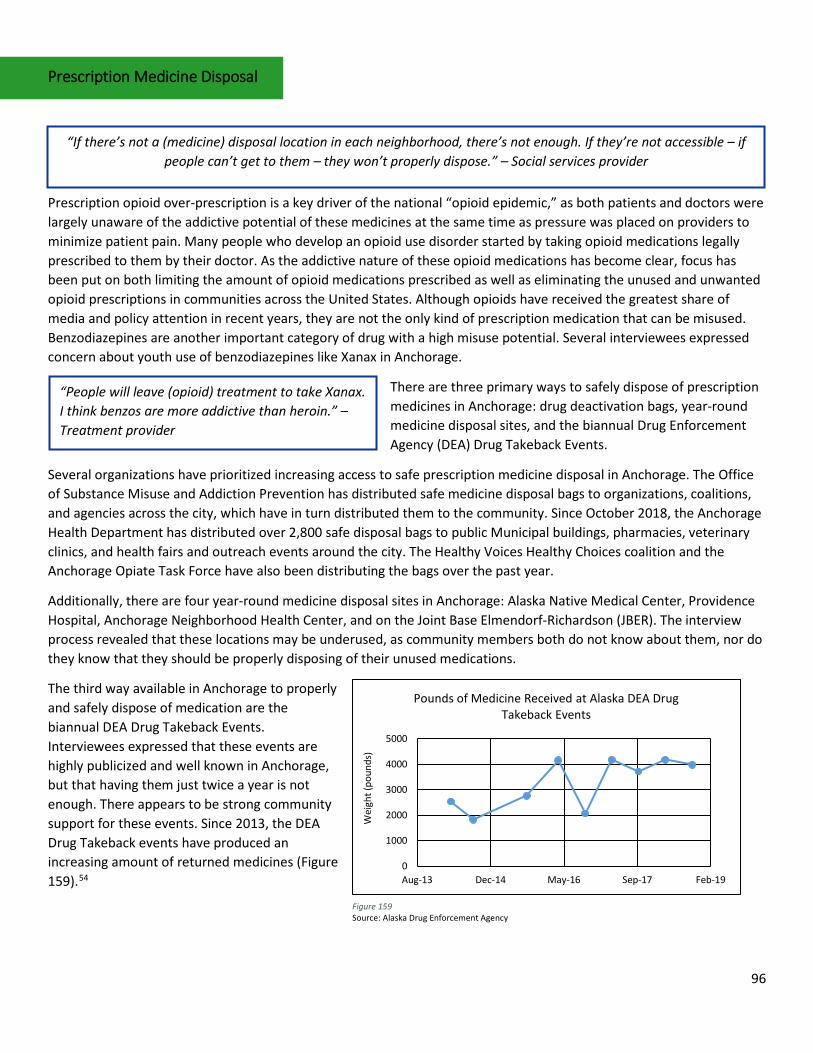
96
Prescription Medicine Disposal
Prescription opioid over-prescription is a key driver of the national “opioid epidemic,” as both patients and doctors were largely unaware of the addictive potential of these medicines at the same time as pressure was placed on providers to minimize patient pain. Many people who develop an opioid use disorder started by taking opioid medications legally prescribed to them by their doctor. As the addictive nature of these opioid medications has become clear, focus has been put on both limiting the amount of opioid medications prescribed as well as eliminating the unused and unwanted opioid prescriptions in communities across the United States. Although opioids have received the greatest share of media and policy attention in recent years, they are not the only kind of prescription medication that can be misused. Benzodiazepines are another important category of drug with a high misuse potential. Several interviewees expressed concern about youth use of benzodiazepines like Xanax in Anchorage.
There are three primary ways to safely dispose of prescription medicines in Anchorage: drug deactivation bags, year-round medicine disposal sites, and the biannual Drug Enforcement Agency (DEA) Drug Takeback Events.
Several organizations have prioritized increasing access to safe prescription medicine disposal in Anchorage. The Office of Substance Misuse and Addiction Prevention has distributed safe medicine disposal bags to organizations, coalitions, and agencies across the city, which have in turn distributed them to the community. Since October 2018, the Anchorage Health Department has distributed over 2,800 safe disposal bags to public Municipal buildings, pharmacies, veterinary clinics, and health fairs and outreach events around the city. The Healthy Voices Healthy Choices coalition and the Anchorage Opiate Task Force have also been distributing the bags over the past year.
Additionally, there are four year-round medicine disposal sites in Anchorage: Alaska Native Medical Center, Providence Hospital, Anchorage Neighborhood Health Center, and on the Joint Base Elmendorf-Richardson (JBER). The interview process revealed that these locations may be underused, as community members both do not know about them, nor do they know that they should be properly disposing of their unused medications.
The third way available in Anchorage to properly and safely dispose of medication are the biannual DEA Drug Takeback Events. Interviewees expressed that these events are highly publicized and well known in Anchorage, but that having them just twice a year is not enough. There appears to be strong community support for these events. Since 2013, the DEA Drug Takeback events have produced an increasing amount of returned medicines (Figure 159).54
“If there’s not a (medicine) disposal location in each neighborhood, there’s not enough. If they’re not accessible – if people can’t get to them – they won’t properly dispose.” – Social services provider
“People will leave (opioid) treatment to take Xanax. I think benzos are more addictive than heroin.” – Treatment provider
0
1000
2000
3000
4000
5000
Aug-13 Dec-14 May-16 Sep-17 Feb-19
Wei
ght (
poun
ds)
Pounds of Medicine Received at Alaska DEA Drug Takeback Events
Figure 159 Source: Alaska Drug Enforcement Agency
97
Generally, interviewees felt that there are not enough services within Anchorage to dispose of prescription medicines appropriately, but that these services have been improving lately, particularly with the introduction of the drug deactivation bags into the community. A lack of knowledge about the right way to dispose of medications compounds the lack of services.
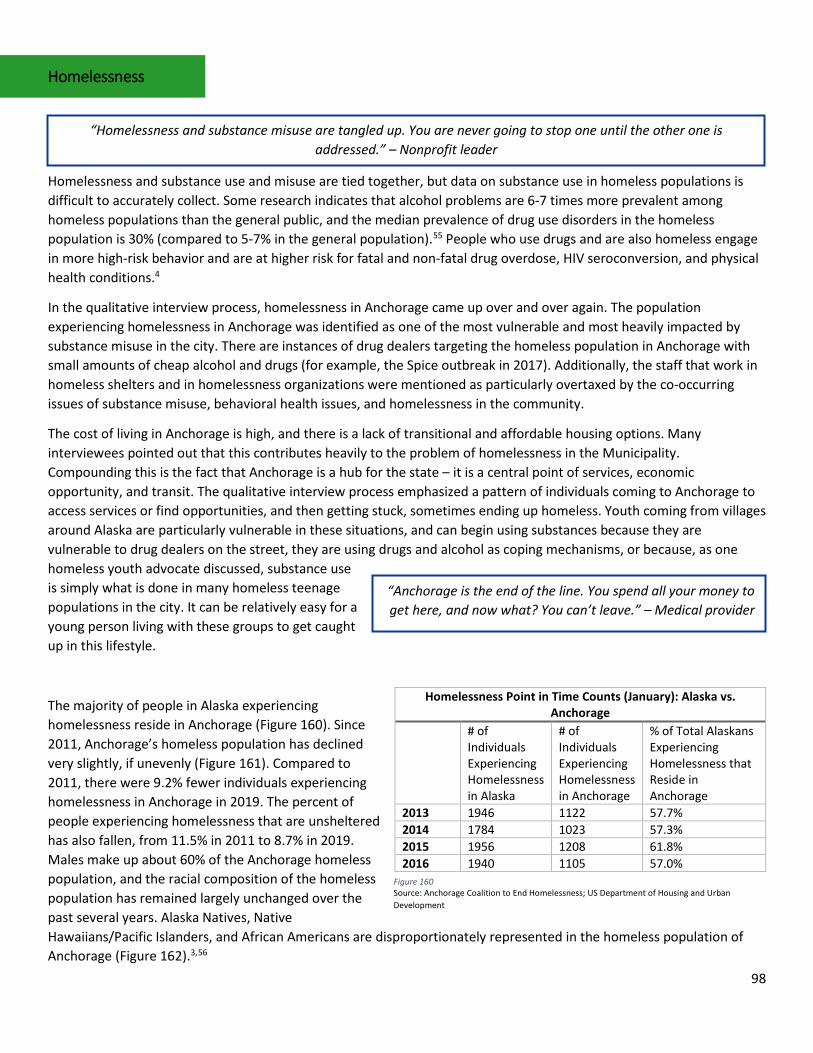
98
Homelessness
Homelessness and substance use and misuse are tied together, but data on substance use in homeless populations is difficult to accurately collect. Some research indicates that alcohol problems are 6-7 times more prevalent among homeless populations than the general public, and the median prevalence of drug use disorders in the homeless population is 30% (compared to 5-7% in the general population).55 People who use drugs and are also homeless engage in more high-risk behavior and are at higher risk for fatal and non-fatal drug overdose, HIV seroconversion, and physical health conditions.4
In the qualitative interview process, homelessness in Anchorage came up over and over again. The population experiencing homelessness in Anchorage was identified as one of the most vulnerable and most heavily impacted by substance misuse in the city. There are instances of drug dealers targeting the homeless population in Anchorage with small amounts of cheap alcohol and drugs (for example, the Spice outbreak in 2017). Additionally, the staff that work in homeless shelters and in homelessness organizations were mentioned as particularly overtaxed by the co-occurring issues of substance misuse, behavioral health issues, and homelessness in the community.
The cost of living in Anchorage is high, and there is a lack of transitional and affordable housing options. Many interviewees pointed out that this contributes heavily to the problem of homelessness in the Municipality. Compounding this is the fact that Anchorage is a hub for the state – it is a central point of services, economic opportunity, and transit. The qualitative interview process emphasized a pattern of individuals coming to Anchorage to access services or find opportunities, and then getting stuck, sometimes ending up homeless. Youth coming from villages around Alaska are particularly vulnerable in these situations, and can begin using substances because they are vulnerable to drug dealers on the street, they are using drugs and alcohol as coping mechanisms, or because, as one homeless youth advocate discussed, substance use is simply what is done in many homeless teenage populations in the city. It can be relatively easy for a young person living with these groups to get caught up in this lifestyle.
The majority of people in Alaska experiencing homelessness reside in Anchorage (Figure 160). Since 2011, Anchorage’s homeless population has declined very slightly, if unevenly (Figure 161). Compared to 2011, there were 9.2% fewer individuals experiencing homelessness in Anchorage in 2019. The percent of people experiencing homelessness that are unsheltered has also fallen, from 11.5% in 2011 to 8.7% in 2019. Males make up about 60% of the Anchorage homeless population, and the racial composition of the homeless population has remained largely unchanged over the past several years. Alaska Natives, Native Hawaiians/Pacific Islanders, and African Americans are disproportionately represented in the homeless population of Anchorage (Figure 162).3,56
Homelessness Point in Time Counts (January): Alaska vs. Anchorage
# of Individuals Experiencing Homelessness in Alaska
# of Individuals Experiencing Homelessness in Anchorage
% of Total Alaskans Experiencing Homelessness that Reside in Anchorage
2013 1946 1122 57.7% 2014 1784 1023 57.3% 2015 1956 1208 61.8% 2016 1940 1105 57.0%
“Homelessness and substance misuse are tangled up. You are never going to stop one until the other one is addressed.” – Nonprofit leader
“Anchorage is the end of the line. You spend all your money to get here, and now what? You can’t leave.” – Medical provider
Figure 160 Source: Anchorage Coalition to End Homelessness; US Department of Housing and Urban Development
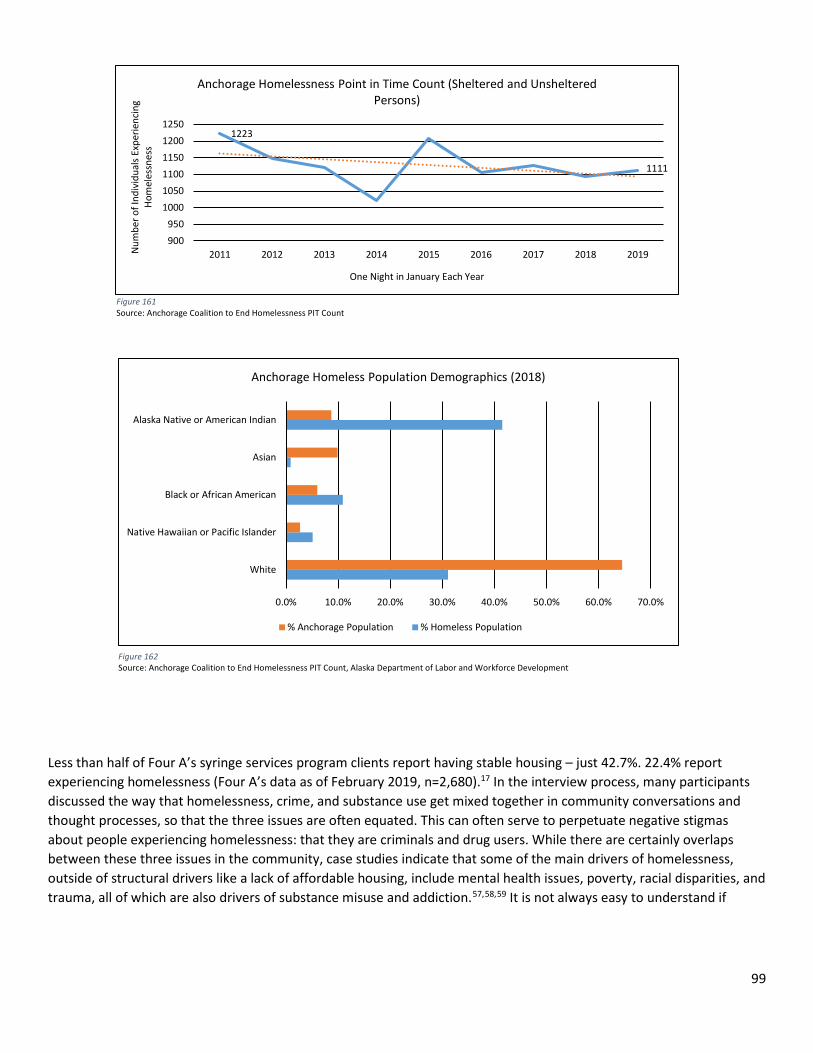
99
Less than half of Four A’s syringe services program clients report having stable housing – just 42.7%. 22.4% report experiencing homelessness (Four A’s data as of February 2019, n=2,680).17 In the interview process, many participants discussed the way that homelessness, crime, and substance use get mixed together in community conversations and thought processes, so that the three issues are often equated. This can often serve to perpetuate negative stigmas about people experiencing homelessness: that they are criminals and drug users. While there are certainly overlaps between these three issues in the community, case studies indicate that some of the main drivers of homelessness, outside of structural drivers like a lack of affordable housing, include mental health issues, poverty, racial disparities, and trauma, all of which are also drivers of substance misuse and addiction.57,58,59 It is not always easy to understand if
Figure 161 Source: Anchorage Coalition to End Homelessness PIT Count
Figure 162 Source: Anchorage Coalition to End Homelessness PIT Count, Alaska Department of Labor and Workforce Development
1223
1111
900950
100010501100115012001250
2011 2012 2013 2014 2015 2016 2017 2018 2019Num
ber o
f Ind
ivid
uals
Expe
rienc
ing
Hom
eles
snes
s
One Night in January Each Year
Anchorage Homelessness Point in Time Count (Sheltered and Unsheltered Persons)
0.0% 10.0% 20.0% 30.0% 40.0% 50.0% 60.0% 70.0%
White
Native Hawaiian or Pacific Islander
Black or African American
Asian
Alaska Native or American Indian
Anchorage Homeless Population Demographics (2018)
% Anchorage Population % Homeless Population
100
homelessness caused a person to turn to substance use or if substance use drove an individual into homelessness, but it is clear that the underlying traumas are inextricably linked.
“Most people just see ‘the crazies’ who walk around downtown or walk into the street. There is not a recognition of the fact that this is part of the addiction epidemic and the inability to provide treatment, safety, and opportunities for
people.” – Nonprofit leader
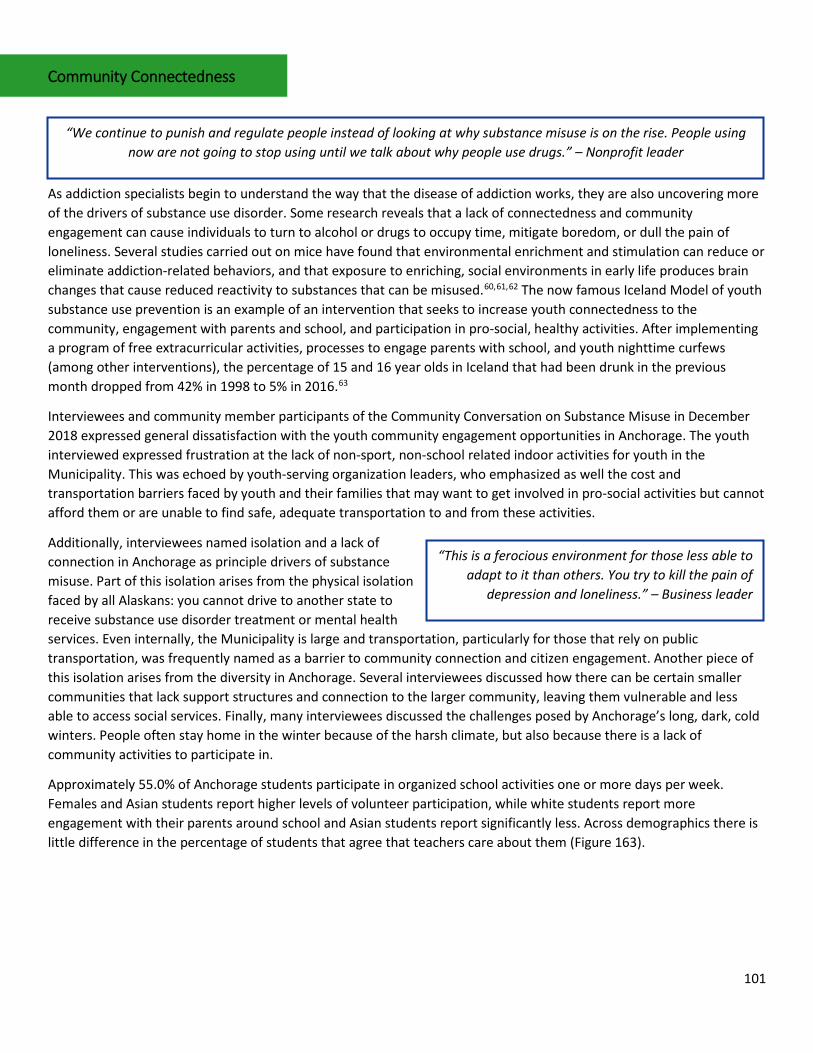
101
Community Connectedness
As addiction specialists begin to understand the way that the disease of addiction works, they are also uncovering more of the drivers of substance use disorder. Some research reveals that a lack of connectedness and community engagement can cause individuals to turn to alcohol or drugs to occupy time, mitigate boredom, or dull the pain of loneliness. Several studies carried out on mice have found that environmental enrichment and stimulation can reduce or eliminate addiction-related behaviors, and that exposure to enriching, social environments in early life produces brain changes that cause reduced reactivity to substances that can be misused.60,61,62 The now famous Iceland Model of youth substance use prevention is an example of an intervention that seeks to increase youth connectedness to the community, engagement with parents and school, and participation in pro-social, healthy activities. After implementing a program of free extracurricular activities, processes to engage parents with school, and youth nighttime curfews (among other interventions), the percentage of 15 and 16 year olds in Iceland that had been drunk in the previous month dropped from 42% in 1998 to 5% in 2016.63
Interviewees and community member participants of the Community Conversation on Substance Misuse in December 2018 expressed general dissatisfaction with the youth community engagement opportunities in Anchorage. The youth interviewed expressed frustration at the lack of non-sport, non-school related indoor activities for youth in the Municipality. This was echoed by youth-serving organization leaders, who emphasized as well the cost and transportation barriers faced by youth and their families that may want to get involved in pro-social activities but cannot afford them or are unable to find safe, adequate transportation to and from these activities.
Additionally, interviewees named isolation and a lack of connection in Anchorage as principle drivers of substance misuse. Part of this isolation arises from the physical isolation faced by all Alaskans: you cannot drive to another state to receive substance use disorder treatment or mental health services. Even internally, the Municipality is large and transportation, particularly for those that rely on public transportation, was frequently named as a barrier to community connection and citizen engagement. Another piece of this isolation arises from the diversity in Anchorage. Several interviewees discussed how there can be certain smaller communities that lack support structures and connection to the larger community, leaving them vulnerable and less able to access social services. Finally, many interviewees discussed the challenges posed by Anchorage’s long, dark, cold winters. People often stay home in the winter because of the harsh climate, but also because there is a lack of community activities to participate in.
Approximately 55.0% of Anchorage students participate in organized school activities one or more days per week. Females and Asian students report higher levels of volunteer participation, while white students report more engagement with their parents around school and Asian students report significantly less. Across demographics there is little difference in the percentage of students that agree that teachers care about them (Figure 163).
“We continue to punish and regulate people instead of looking at why substance misuse is on the rise. People using now are not going to stop using until we talk about why people use drugs.” – Nonprofit leader
“This is a ferocious environment for those less able to adapt to it than others. You try to kill the pain of
depression and loneliness.” – Business leader
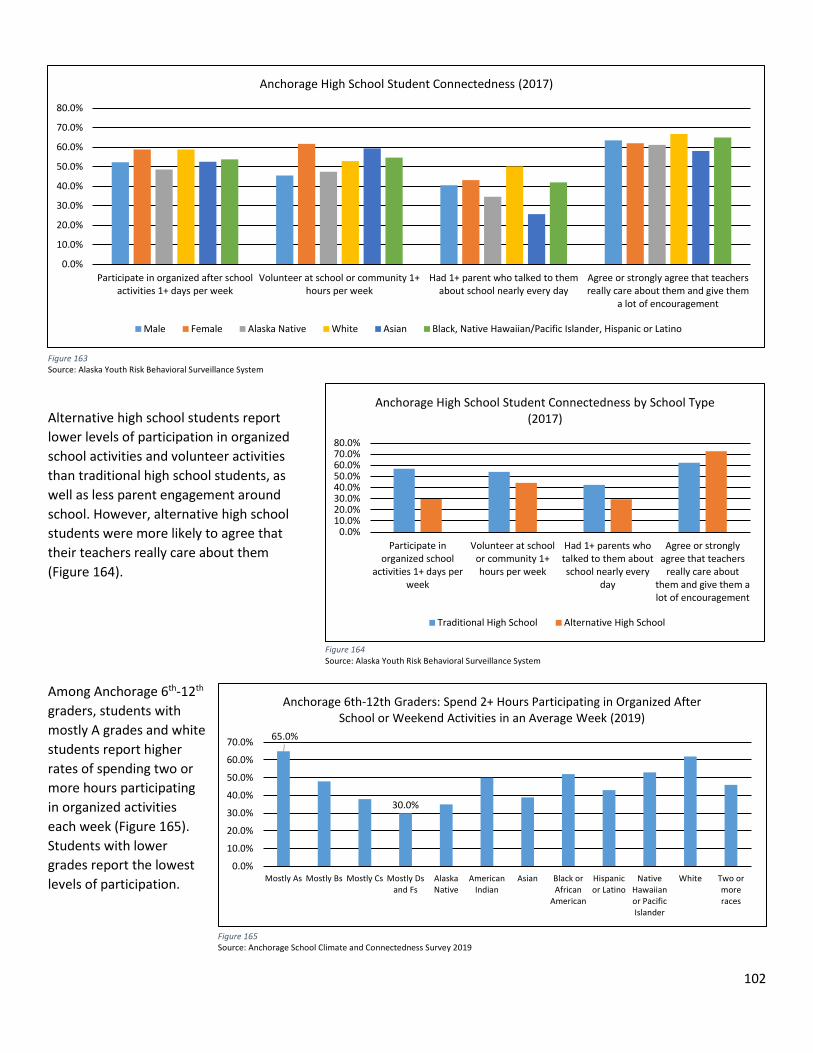
102
Alternative high school students report lower levels of participation in organized school activities and volunteer activities than traditional high school students, as well as less parent engagement around school. However, alternative high school students were more likely to agree that their teachers really care about them (Figure 164).
Among Anchorage 6th-12th graders, students with mostly A grades and white students report higher rates of spending two or more hours participating in organized activities each week (Figure 165). Students with lower grades report the lowest levels of participation.
Figure 163 Source: Alaska Youth Risk Behavioral Surveillance System
Figure 165 Source: Anchorage School Climate and Connectedness Survey 2019
0.0%10.0%20.0%30.0%40.0%50.0%60.0%70.0%80.0%
Participate inorganized school
activities 1+ days perweek
Volunteer at schoolor community 1+hours per week
Had 1+ parents whotalked to them aboutschool nearly every
day
Agree or stronglyagree that teachers
really care aboutthem and give them alot of encouragement
Anchorage High School Student Connectedness by School Type (2017)
Traditional High School Alternative High School
Figure 164 Source: Alaska Youth Risk Behavioral Surveillance System
0.0%
10.0%
20.0%
30.0%
40.0%
50.0%
60.0%
70.0%
80.0%
Participate in organized after schoolactivities 1+ days per week
Volunteer at school or community 1+hours per week
Had 1+ parent who talked to themabout school nearly every day
Agree or strongly agree that teachersreally care about them and give them
a lot of encouragement
Anchorage High School Student Connectedness (2017)
Male Female Alaska Native White Asian Black, Native Hawaiian/Pacific Islander, Hispanic or Latino
65.0%
30.0%
0.0%
10.0%
20.0%
30.0%
40.0%
50.0%
60.0%
70.0%
Mostly As Mostly Bs Mostly Cs Mostly Dsand Fs
AlaskaNative
AmericanIndian
Asian Black orAfrican
American
Hispanicor Latino
NativeHawaiianor PacificIslander
White Two ormoreraces
Anchorage 6th-12th Graders: Spend 2+ Hours Participating in Organized After School or Weekend Activities in an Average Week (2019)
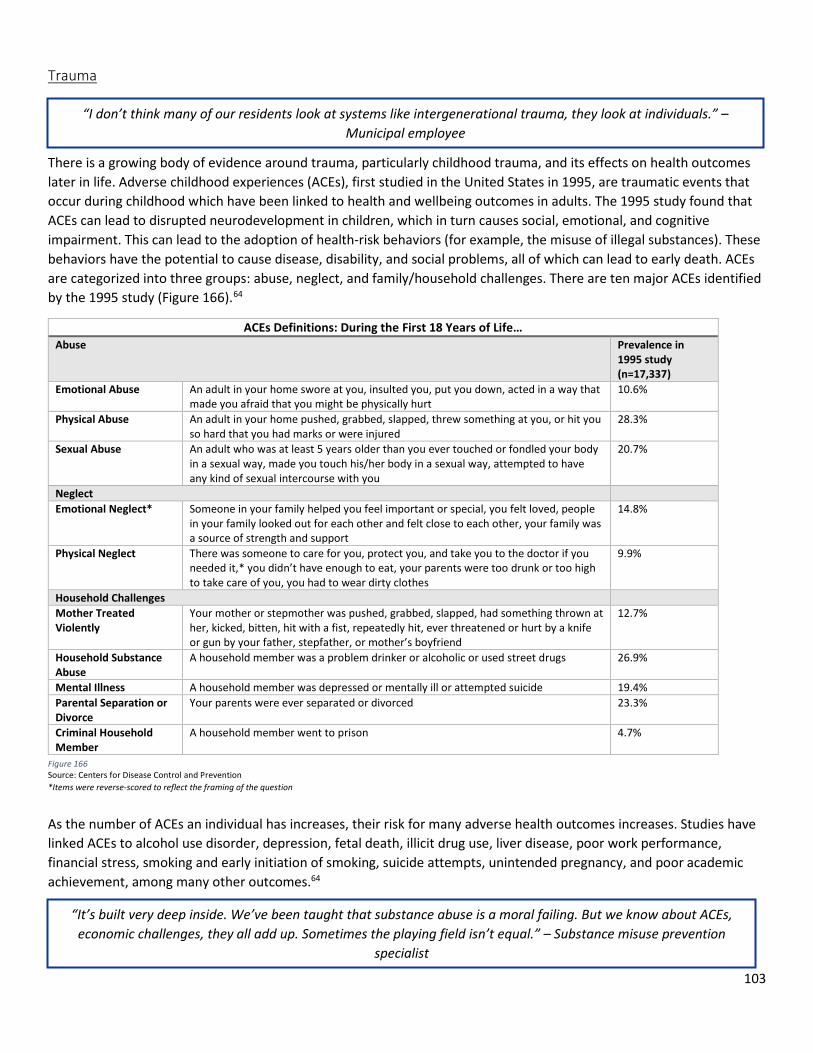
103
Trauma
There is a growing body of evidence around trauma, particularly childhood trauma, and its effects on health outcomes later in life. Adverse childhood experiences (ACEs), first studied in the United States in 1995, are traumatic events that occur during childhood which have been linked to health and wellbeing outcomes in adults. The 1995 study found that ACEs can lead to disrupted neurodevelopment in children, which in turn causes social, emotional, and cognitive impairment. This can lead to the adoption of health-risk behaviors (for example, the misuse of illegal substances). These behaviors have the potential to cause disease, disability, and social problems, all of which can lead to early death. ACEs are categorized into three groups: abuse, neglect, and family/household challenges. There are ten major ACEs identified by the 1995 study (Figure 166).64
ACEs Definitions: During the First 18 Years of Life… Abuse Prevalence in
1995 study (n=17,337)
Emotional Abuse An adult in your home swore at you, insulted you, put you down, acted in a way that made you afraid that you might be physically hurt
10.6%
Physical Abuse An adult in your home pushed, grabbed, slapped, threw something at you, or hit you so hard that you had marks or were injured
28.3%
Sexual Abuse An adult who was at least 5 years older than you ever touched or fondled your body in a sexual way, made you touch his/her body in a sexual way, attempted to have any kind of sexual intercourse with you
20.7%
Neglect Emotional Neglect* Someone in your family helped you feel important or special, you felt loved, people
in your family looked out for each other and felt close to each other, your family was a source of strength and support
14.8%
Physical Neglect There was someone to care for you, protect you, and take you to the doctor if you needed it,* you didn’t have enough to eat, your parents were too drunk or too high to take care of you, you had to wear dirty clothes
9.9%
Household Challenges Mother Treated Violently
Your mother or stepmother was pushed, grabbed, slapped, had something thrown at her, kicked, bitten, hit with a fist, repeatedly hit, ever threatened or hurt by a knife or gun by your father, stepfather, or mother’s boyfriend
12.7%
Household Substance Abuse
A household member was a problem drinker or alcoholic or used street drugs 26.9%
Mental Illness A household member was depressed or mentally ill or attempted suicide 19.4% Parental Separation or Divorce
Your parents were ever separated or divorced 23.3%
Criminal Household Member
A household member went to prison 4.7%
As the number of ACEs an individual has increases, their risk for many adverse health outcomes increases. Studies have linked ACEs to alcohol use disorder, depression, fetal death, illicit drug use, liver disease, poor work performance, financial stress, smoking and early initiation of smoking, suicide attempts, unintended pregnancy, and poor academic achievement, among many other outcomes.64
Figure 166 Source: Centers for Disease Control and Prevention *Items were reverse-scored to reflect the framing of the question
“I don’t think many of our residents look at systems like intergenerational trauma, they look at individuals.” – Municipal employee
“It’s built very deep inside. We’ve been taught that substance abuse is a moral failing. But we know about ACEs, economic challenges, they all add up. Sometimes the playing field isn’t equal.” – Substance misuse prevention
specialist
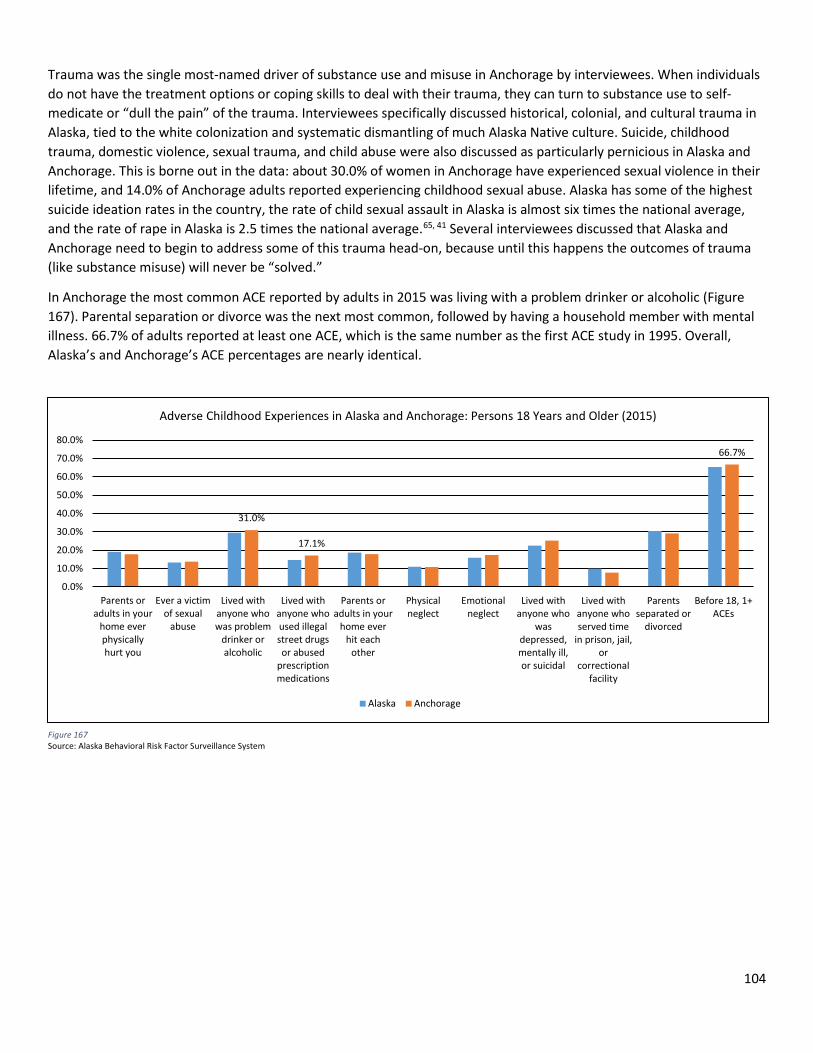
104
Trauma was the single most-named driver of substance use and misuse in Anchorage by interviewees. When individuals do not have the treatment options or coping skills to deal with their trauma, they can turn to substance use to self-medicate or “dull the pain” of the trauma. Interviewees specifically discussed historical, colonial, and cultural trauma in Alaska, tied to the white colonization and systematic dismantling of much Alaska Native culture. Suicide, childhood trauma, domestic violence, sexual trauma, and child abuse were also discussed as particularly pernicious in Alaska and Anchorage. This is borne out in the data: about 30.0% of women in Anchorage have experienced sexual violence in their lifetime, and 14.0% of Anchorage adults reported experiencing childhood sexual abuse. Alaska has some of the highest suicide ideation rates in the country, the rate of child sexual assault in Alaska is almost six times the national average, and the rate of rape in Alaska is 2.5 times the national average.65, 41 Several interviewees discussed that Alaska and Anchorage need to begin to address some of this trauma head-on, because until this happens the outcomes of trauma (like substance misuse) will never be “solved.”
In Anchorage the most common ACE reported by adults in 2015 was living with a problem drinker or alcoholic (Figure 167). Parental separation or divorce was the next most common, followed by having a household member with mental illness. 66.7% of adults reported at least one ACE, which is the same number as the first ACE study in 1995. Overall, Alaska’s and Anchorage’s ACE percentages are nearly identical.
31.0%
17.1%
66.7%
0.0%
10.0%
20.0%
30.0%
40.0%
50.0%
60.0%
70.0%
80.0%
Parents oradults in your
home everphysicallyhurt you
Ever a victimof sexual
abuse
Lived withanyone whowas problem
drinker oralcoholic
Lived withanyone whoused illegalstreet drugsor abused
prescriptionmedications
Parents oradults in your
home everhit each
other
Physicalneglect
Emotionalneglect
Lived withanyone who
wasdepressed,mentally ill,or suicidal
Lived withanyone whoserved time
in prison, jail,or
correctionalfacility
Parentsseparated or
divorced
Before 18, 1+ACEs
Adverse Childhood Experiences in Alaska and Anchorage: Persons 18 Years and Older (2015)
Alaska Anchorage
Figure 167 Source: Alaska Behavioral Risk Factor Surveillance System
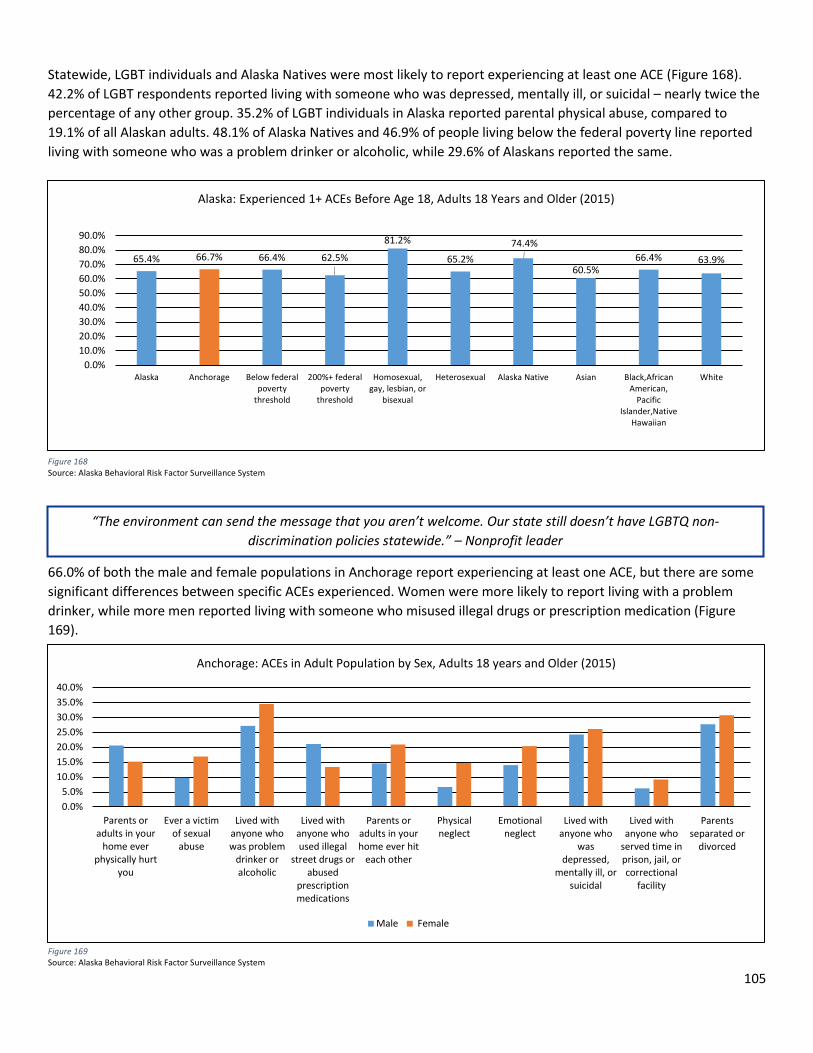
105
Statewide, LGBT individuals and Alaska Natives were most likely to report experiencing at least one ACE (Figure 168). 42.2% of LGBT respondents reported living with someone who was depressed, mentally ill, or suicidal – nearly twice the percentage of any other group. 35.2% of LGBT individuals in Alaska reported parental physical abuse, compared to 19.1% of all Alaskan adults. 48.1% of Alaska Natives and 46.9% of people living below the federal poverty line reported living with someone who was a problem drinker or alcoholic, while 29.6% of Alaskans reported the same.
66.0% of both the male and female populations in Anchorage report experiencing at least one ACE, but there are some significant differences between specific ACEs experienced. Women were more likely to report living with a problem drinker, while more men reported living with someone who misused illegal drugs or prescription medication (Figure 169).
Figure 168 Source: Alaska Behavioral Risk Factor Surveillance System
0.0%5.0%
10.0%15.0%20.0%25.0%30.0%35.0%40.0%
Parents oradults in your
home everphysically hurt
you
Ever a victimof sexual
abuse
Lived withanyone whowas problem
drinker oralcoholic
Lived withanyone whoused illegal
street drugs orabused
prescriptionmedications
Parents oradults in yourhome ever hit
each other
Physicalneglect
Emotionalneglect
Lived withanyone who
wasdepressed,
mentally ill, orsuicidal
Lived withanyone who
served time inprison, jail, orcorrectional
facility
Parentsseparated or
divorced
Anchorage: ACEs in Adult Population by Sex, Adults 18 years and Older (2015)
Male Female
Figure 169 Source: Alaska Behavioral Risk Factor Surveillance System
“The environment can send the message that you aren’t welcome. Our state still doesn’t have LGBTQ non-discrimination policies statewide.” – Nonprofit leader
65.4% 66.7% 66.4% 62.5%
81.2%
65.2%74.4%
60.5%66.4% 63.9%
0.0%10.0%20.0%30.0%40.0%50.0%60.0%70.0%80.0%90.0%
Alaska Anchorage Below federalpoverty
threshold
200%+ federalpoverty
threshold
Homosexual,gay, lesbian, or
bisexual
Heterosexual Alaska Native Asian Black,AfricanAmerican,
PacificIslander,Native
Hawaiian
White
Alaska: Experienced 1+ ACEs Before Age 18, Adults 18 Years and Older (2015)
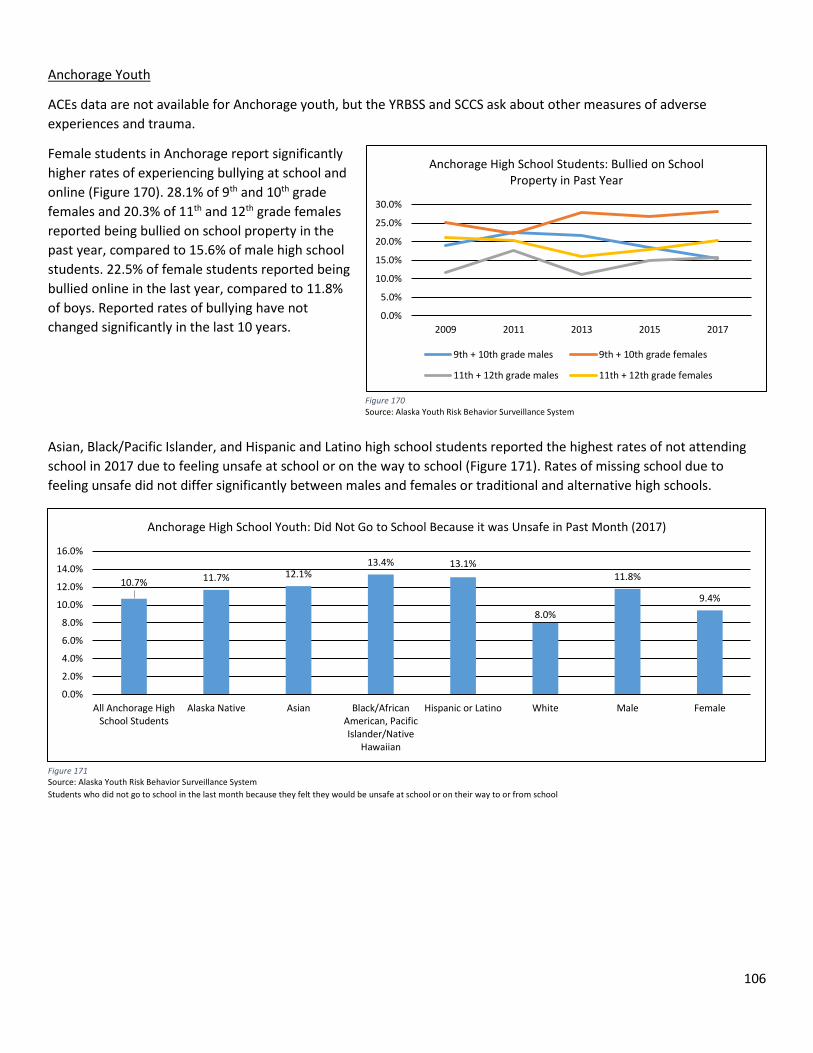
106
Anchorage Youth
ACEs data are not available for Anchorage youth, but the YRBSS and SCCS ask about other measures of adverse experiences and trauma.
Female students in Anchorage report significantly higher rates of experiencing bullying at school and online (Figure 170). 28.1% of 9th and 10th grade females and 20.3% of 11th and 12th grade females reported being bullied on school property in the past year, compared to 15.6% of male high school students. 22.5% of female students reported being bullied online in the last year, compared to 11.8% of boys. Reported rates of bullying have not changed significantly in the last 10 years.
Asian, Black/Pacific Islander, and Hispanic and Latino high school students reported the highest rates of not attending school in 2017 due to feeling unsafe at school or on the way to school (Figure 171). Rates of missing school due to feeling unsafe did not differ significantly between males and females or traditional and alternative high schools.
0.0%
5.0%
10.0%
15.0%
20.0%
25.0%
30.0%
2009 2011 2013 2015 2017
Anchorage High School Students: Bullied on School Property in Past Year
9th + 10th grade males 9th + 10th grade females
11th + 12th grade males 11th + 12th grade females
Figure 170 Source: Alaska Youth Risk Behavior Surveillance System
Figure 171 Source: Alaska Youth Risk Behavior Surveillance System Students who did not go to school in the last month because they felt they would be unsafe at school or on their way to or from school
10.7% 11.7% 12.1%13.4% 13.1%
8.0%
11.8%
9.4%
0.0%
2.0%
4.0%
6.0%
8.0%
10.0%
12.0%
14.0%
16.0%
All Anchorage HighSchool Students
Alaska Native Asian Black/AfricanAmerican, PacificIslander/Native
Hawaiian
Hispanic or Latino White Male Female
Anchorage High School Youth: Did Not Go to School Because it was Unsafe in Past Month (2017)
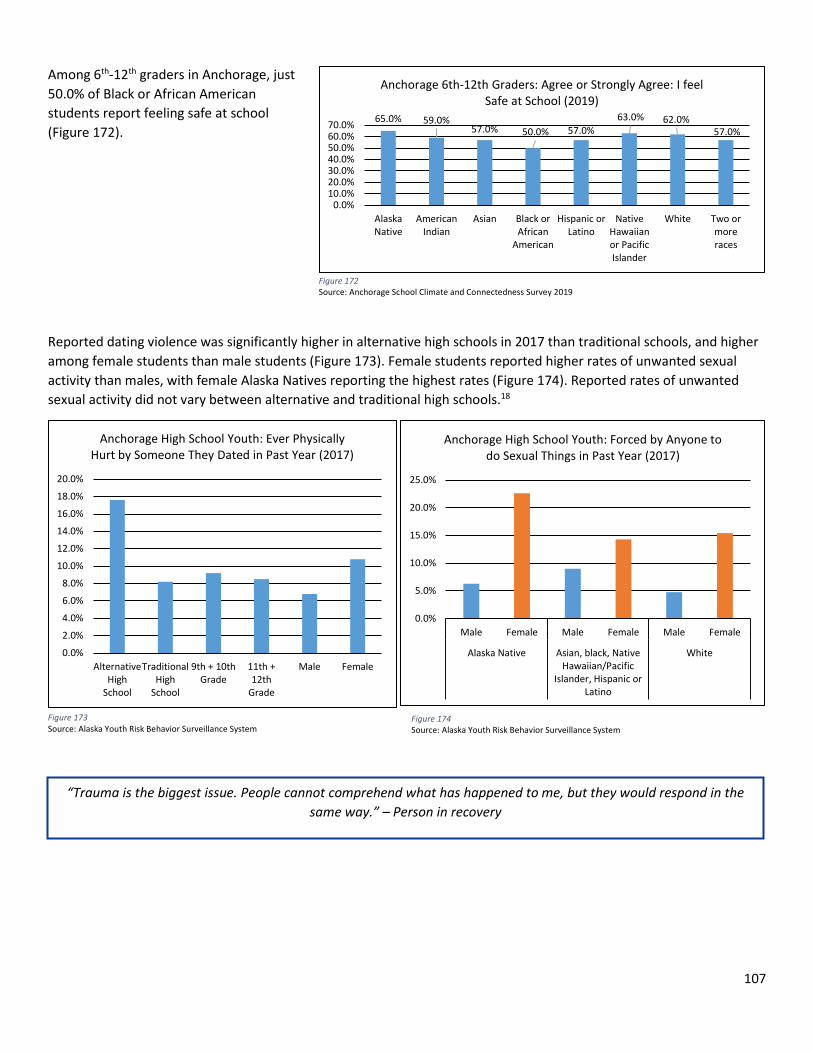
107
Among 6th-12th graders in Anchorage, just 50.0% of Black or African American students report feeling safe at school (Figure 172).
Reported dating violence was significantly higher in alternative high schools in 2017 than traditional schools, and higher among female students than male students (Figure 173). Female students reported higher rates of unwanted sexual activity than males, with female Alaska Natives reporting the highest rates (Figure 174). Reported rates of unwanted sexual activity did not vary between alternative and traditional high schools.18
“Trauma is the biggest issue. People cannot comprehend what has happened to me, but they would respond in the same way.” – Person in recovery
0.0%
2.0%
4.0%
6.0%
8.0%
10.0%
12.0%
14.0%
16.0%
18.0%
20.0%
AlternativeHigh
School
TraditionalHigh
School
9th + 10thGrade
11th +12th
Grade
Male Female
Anchorage High School Youth: Ever Physically Hurt by Someone They Dated in Past Year (2017)
Figure 173 Source: Alaska Youth Risk Behavior Surveillance System
Figure 174 Source: Alaska Youth Risk Behavior Surveillance System
65.0% 59.0%57.0% 50.0% 57.0%
63.0% 62.0%57.0%
0.0%10.0%20.0%30.0%40.0%50.0%60.0%70.0%
AlaskaNative
AmericanIndian
Asian Black orAfrican
American
Hispanic orLatino
NativeHawaiianor PacificIslander
White Two ormoreraces
Anchorage 6th-12th Graders: Agree or Strongly Agree: I feel Safe at School (2019)
Figure 172 Source: Anchorage School Climate and Connectedness Survey 2019
0.0%
5.0%
10.0%
15.0%
20.0%
25.0%
Male Female Male Female Male Female
Alaska Native Asian, black, NativeHawaiian/Pacific
Islander, Hispanic orLatino
White
Anchorage High School Youth: Forced by Anyone to do Sexual Things in Past Year (2017)
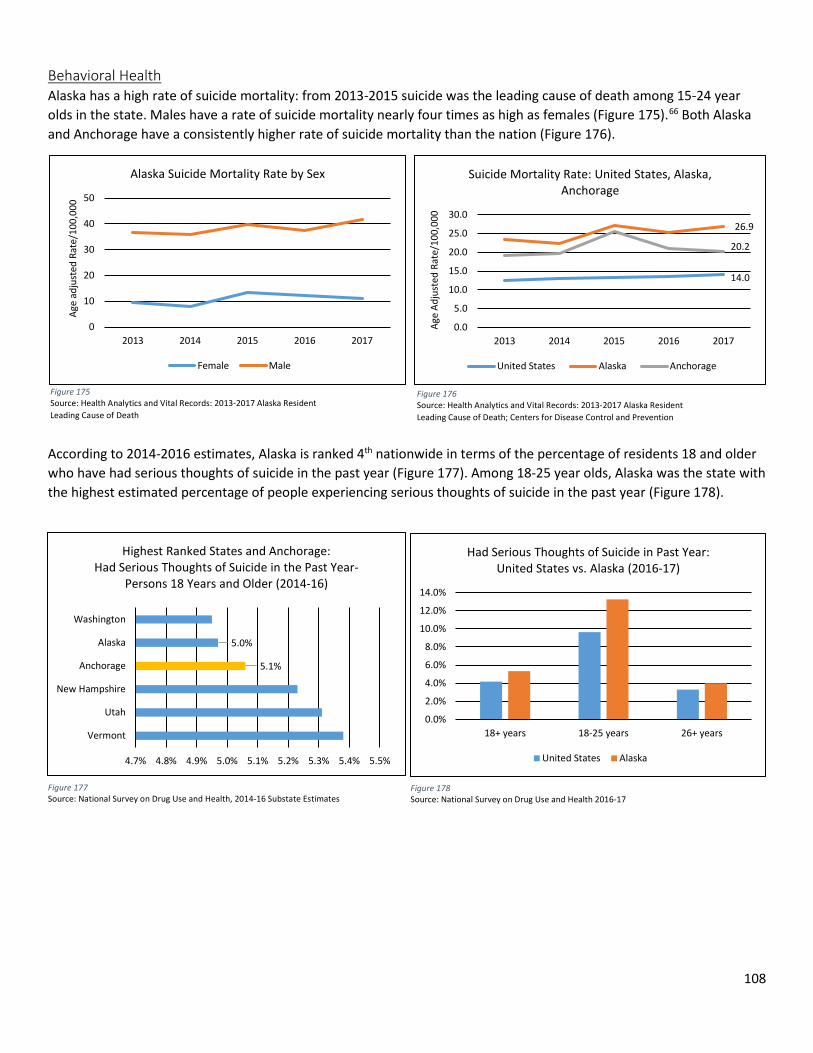
108
Behavioral Health Alaska has a high rate of suicide mortality: from 2013-2015 suicide was the leading cause of death among 15-24 year olds in the state. Males have a rate of suicide mortality nearly four times as high as females (Figure 175).66 Both Alaska and Anchorage have a consistently higher rate of suicide mortality than the nation (Figure 176).
According to 2014-2016 estimates, Alaska is ranked 4th nationwide in terms of the percentage of residents 18 and older who have had serious thoughts of suicide in the past year (Figure 177). Among 18-25 year olds, Alaska was the state with the highest estimated percentage of people experiencing serious thoughts of suicide in the past year (Figure 178).
0
10
20
30
40
50
2013 2014 2015 2016 2017
Age
adju
sted
Rat
e/10
0,00
0
Alaska Suicide Mortality Rate by Sex
Female Male
Figure 175 Source: Health Analytics and Vital Records: 2013-2017 Alaska Resident Leading Cause of Death
5.1%
5.0%
4.7% 4.8% 4.9% 5.0% 5.1% 5.2% 5.3% 5.4% 5.5%
Vermont
Utah
New Hampshire
Anchorage
Alaska
Washington
Highest Ranked States and Anchorage: Had Serious Thoughts of Suicide in the Past Year-
Persons 18 Years and Older (2014-16)
0.0%
2.0%
4.0%
6.0%
8.0%
10.0%
12.0%
14.0%
18+ years 18-25 years 26+ years
Had Serious Thoughts of Suicide in Past Year: United States vs. Alaska (2016-17)
United States Alaska
Figure 177 Source: National Survey on Drug Use and Health, 2014-16 Substate Estimates
Figure 178 Source: National Survey on Drug Use and Health 2016-17
14.0
26.9
20.2
0.0
5.0
10.0
15.0
20.0
25.0
30.0
2013 2014 2015 2016 2017
Age
Adju
sted
Rat
e/10
0,00
0
Suicide Mortality Rate: United States, Alaska, Anchorage
United States Alaska Anchorage
Figure 176 Source: Health Analytics and Vital Records: 2013-2017 Alaska Resident Leading Cause of Death; Centers for Disease Control and Prevention
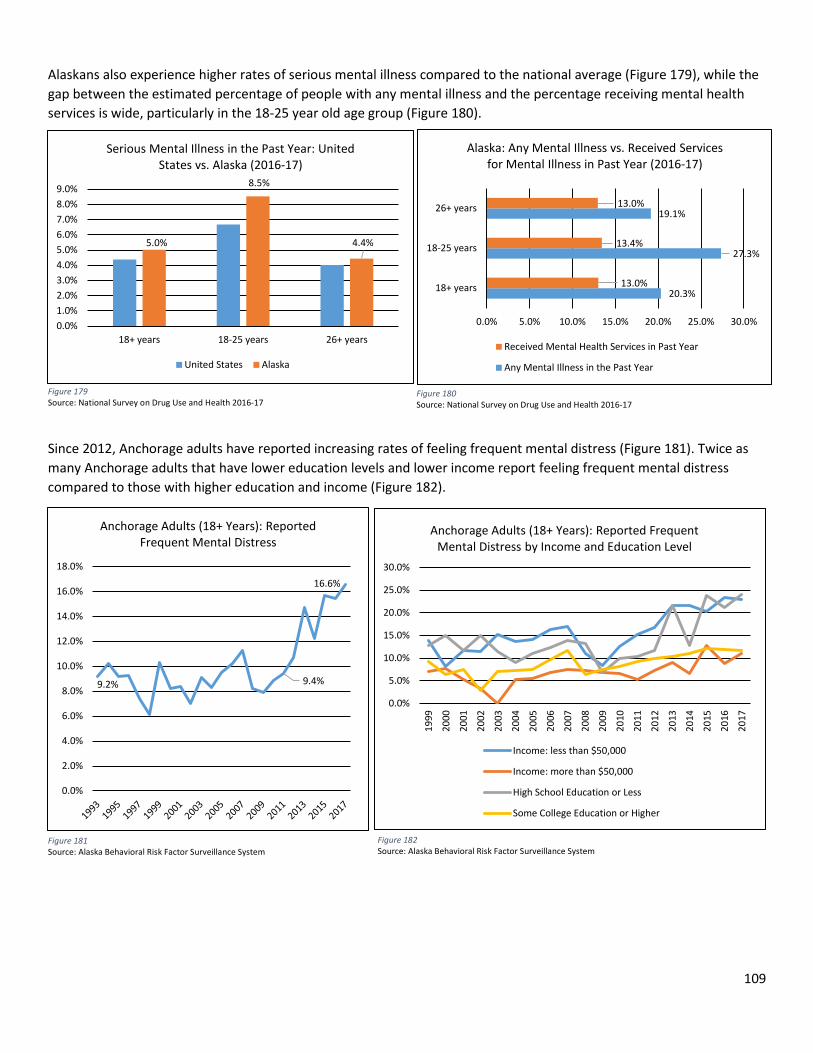
109
Alaskans also experience higher rates of serious mental illness compared to the national average (Figure 179), while the gap between the estimated percentage of people with any mental illness and the percentage receiving mental health services is wide, particularly in the 18-25 year old age group (Figure 180).
Since 2012, Anchorage adults have reported increasing rates of feeling frequent mental distress (Figure 181). Twice as many Anchorage adults that have lower education levels and lower income report feeling frequent mental distress compared to those with higher education and income (Figure 182).
5.0%
8.5%
4.4%
0.0%1.0%2.0%3.0%4.0%5.0%6.0%7.0%8.0%9.0%
18+ years 18-25 years 26+ years
Serious Mental Illness in the Past Year: United States vs. Alaska (2016-17)
United States Alaska
20.3%
27.3%
19.1%
13.0%
13.4%
13.0%
0.0% 5.0% 10.0% 15.0% 20.0% 25.0% 30.0%
18+ years
18-25 years
26+ years
Alaska: Any Mental Illness vs. Received Services for Mental Illness in Past Year (2016-17)
Received Mental Health Services in Past Year
Any Mental Illness in the Past Year
Figure 179 Source: National Survey on Drug Use and Health 2016-17
Figure 180 Source: National Survey on Drug Use and Health 2016-17
9.2% 9.4%
16.6%
0.0%
2.0%
4.0%
6.0%
8.0%
10.0%
12.0%
14.0%
16.0%
18.0%
Anchorage Adults (18+ Years): Reported Frequent Mental Distress
0.0%
5.0%
10.0%
15.0%
20.0%
25.0%
30.0%
1999
2000
2001
2002
2003
2004
2005
2006
2007
2008
2009
2010
2011
2012
2013
2014
2015
2016
2017
Anchorage Adults (18+ Years): Reported Frequent Mental Distress by Income and Education Level
Income: less than $50,000
Income: more than $50,000
High School Education or Less
Some College Education or Higher
Figure 181 Source: Alaska Behavioral Risk Factor Surveillance System
Figure 182 Source: Alaska Behavioral Risk Factor Surveillance System
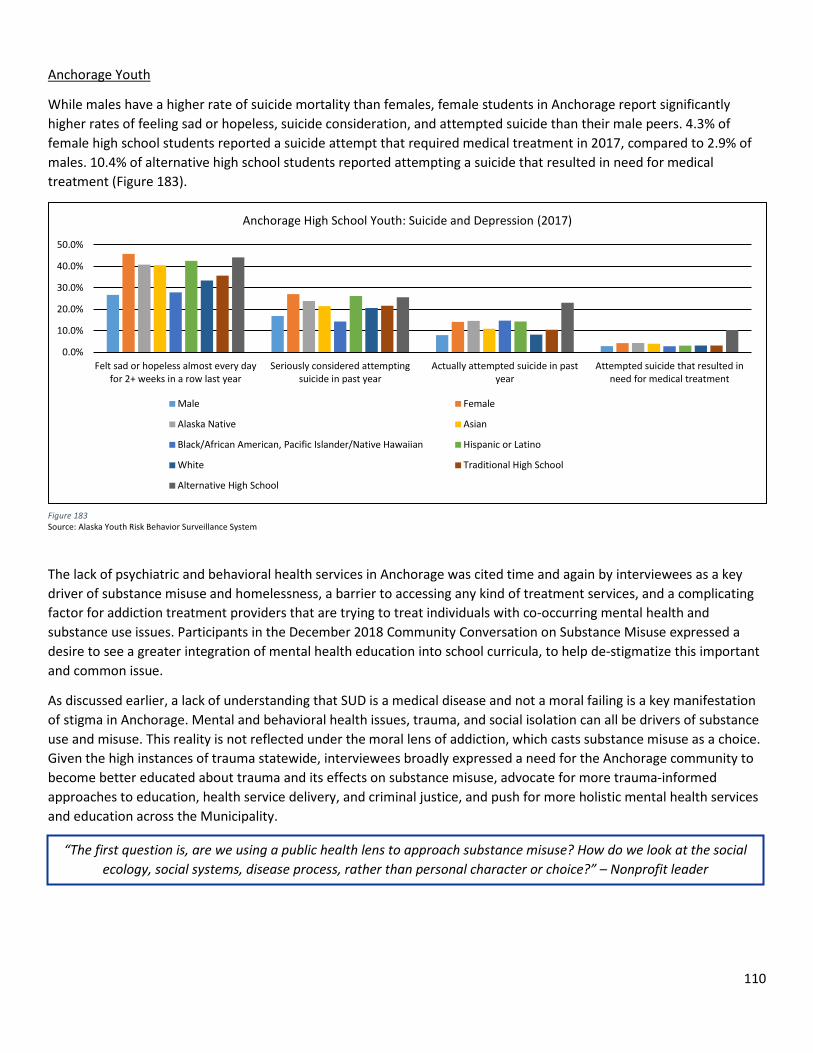
110
Anchorage Youth
While males have a higher rate of suicide mortality than females, female students in Anchorage report significantly higher rates of feeling sad or hopeless, suicide consideration, and attempted suicide than their male peers. 4.3% of female high school students reported a suicide attempt that required medical treatment in 2017, compared to 2.9% of males. 10.4% of alternative high school students reported attempting a suicide that resulted in need for medical treatment (Figure 183).
The lack of psychiatric and behavioral health services in Anchorage was cited time and again by interviewees as a key driver of substance misuse and homelessness, a barrier to accessing any kind of treatment services, and a complicating factor for addiction treatment providers that are trying to treat individuals with co-occurring mental health and substance use issues. Participants in the December 2018 Community Conversation on Substance Misuse expressed a desire to see a greater integration of mental health education into school curricula, to help de-stigmatize this important and common issue.
As discussed earlier, a lack of understanding that SUD is a medical disease and not a moral failing is a key manifestation of stigma in Anchorage. Mental and behavioral health issues, trauma, and social isolation can all be drivers of substance use and misuse. This reality is not reflected under the moral lens of addiction, which casts substance misuse as a choice. Given the high instances of trauma statewide, interviewees broadly expressed a need for the Anchorage community to become better educated about trauma and its effects on substance misuse, advocate for more trauma-informed approaches to education, health service delivery, and criminal justice, and push for more holistic mental health services and education across the Municipality.
Figure 183 Source: Alaska Youth Risk Behavior Surveillance System
“The first question is, are we using a public health lens to approach substance misuse? How do we look at the social ecology, social systems, disease process, rather than personal character or choice?” – Nonprofit leader
0.0%
10.0%
20.0%
30.0%
40.0%
50.0%
Felt sad or hopeless almost every dayfor 2+ weeks in a row last year
Seriously considered attemptingsuicide in past year
Actually attempted suicide in pastyear
Attempted suicide that resulted inneed for medical treatment
Anchorage High School Youth: Suicide and Depression (2017)
Male Female
Alaska Native Asian
Black/African American, Pacific Islander/Native Hawaiian Hispanic or Latino
White Traditional High School
Alternative High School
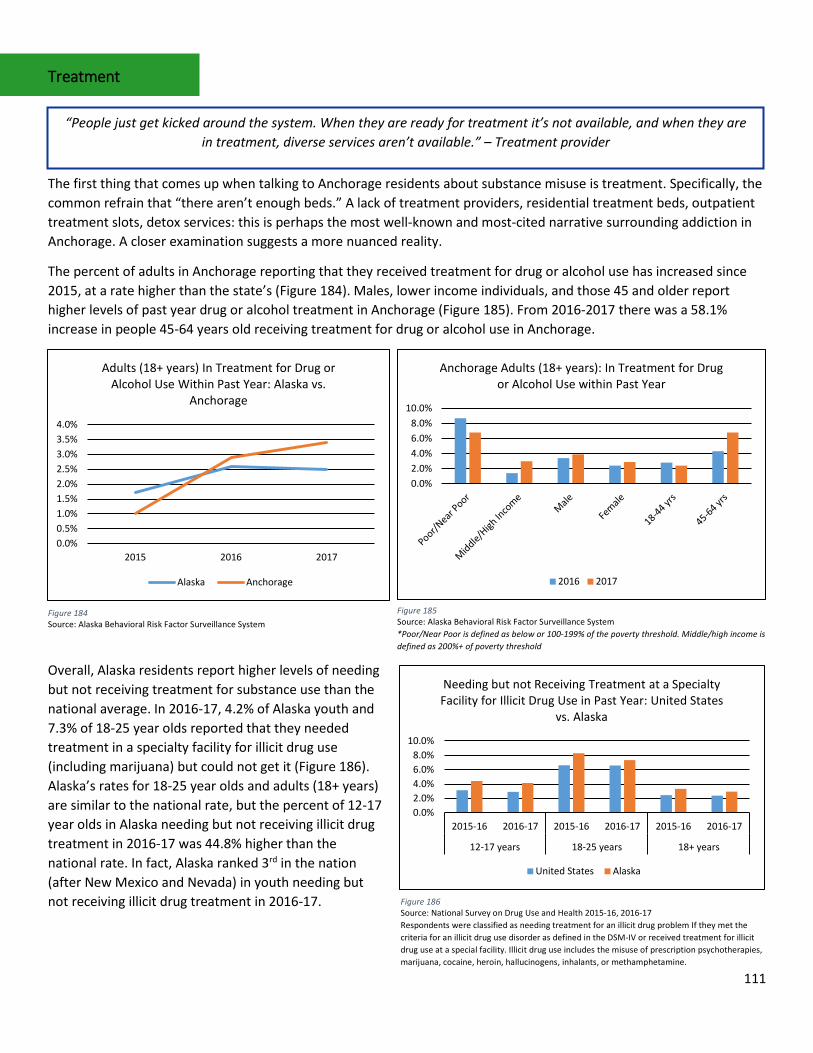
111
Treatment
The first thing that comes up when talking to Anchorage residents about substance misuse is treatment. Specifically, the common refrain that “there aren’t enough beds.” A lack of treatment providers, residential treatment beds, outpatient treatment slots, detox services: this is perhaps the most well-known and most-cited narrative surrounding addiction in Anchorage. A closer examination suggests a more nuanced reality.
The percent of adults in Anchorage reporting that they received treatment for drug or alcohol use has increased since 2015, at a rate higher than the state’s (Figure 184). Males, lower income individuals, and those 45 and older report higher levels of past year drug or alcohol treatment in Anchorage (Figure 185). From 2016-2017 there was a 58.1% increase in people 45-64 years old receiving treatment for drug or alcohol use in Anchorage.
Overall, Alaska residents report higher levels of needing but not receiving treatment for substance use than the national average. In 2016-17, 4.2% of Alaska youth and 7.3% of 18-25 year olds reported that they needed treatment in a specialty facility for illicit drug use (including marijuana) but could not get it (Figure 186). Alaska’s rates for 18-25 year olds and adults (18+ years) are similar to the national rate, but the percent of 12-17 year olds in Alaska needing but not receiving illicit drug treatment in 2016-17 was 44.8% higher than the national rate. In fact, Alaska ranked 3rd in the nation (after New Mexico and Nevada) in youth needing but not receiving illicit drug treatment in 2016-17.
“People just get kicked around the system. When they are ready for treatment it’s not available, and when they are in treatment, diverse services aren’t available.” – Treatment provider
0.0%0.5%1.0%1.5%2.0%2.5%3.0%3.5%4.0%
2015 2016 2017
Adults (18+ years) In Treatment for Drug or Alcohol Use Within Past Year: Alaska vs.
Anchorage
Alaska Anchorage
Figure 184 Source: Alaska Behavioral Risk Factor Surveillance System
0.0%2.0%4.0%6.0%8.0%
10.0%
Anchorage Adults (18+ years): In Treatment for Drug or Alcohol Use within Past Year
2016 2017
Figure 185 Source: Alaska Behavioral Risk Factor Surveillance System *Poor/Near Poor is defined as below or 100-199% of the poverty threshold. Middle/high income is defined as 200%+ of poverty threshold
0.0%2.0%4.0%6.0%8.0%
10.0%
2015-16 2016-17 2015-16 2016-17 2015-16 2016-17
12-17 years 18-25 years 18+ years
Needing but not Receiving Treatment at a Specialty Facility for Illicit Drug Use in Past Year: United States
vs. Alaska
United States Alaska
Figure 186 Source: National Survey on Drug Use and Health 2015-16, 2016-17 Respondents were classified as needing treatment for an illicit drug problem If they met the criteria for an illicit drug use disorder as defined in the DSM-IV or received treatment for illicit drug use at a special facility. Illicit drug use includes the misuse of prescription psychotherapies, marijuana, cocaine, heroin, hallucinogens, inhalants, or methamphetamine.
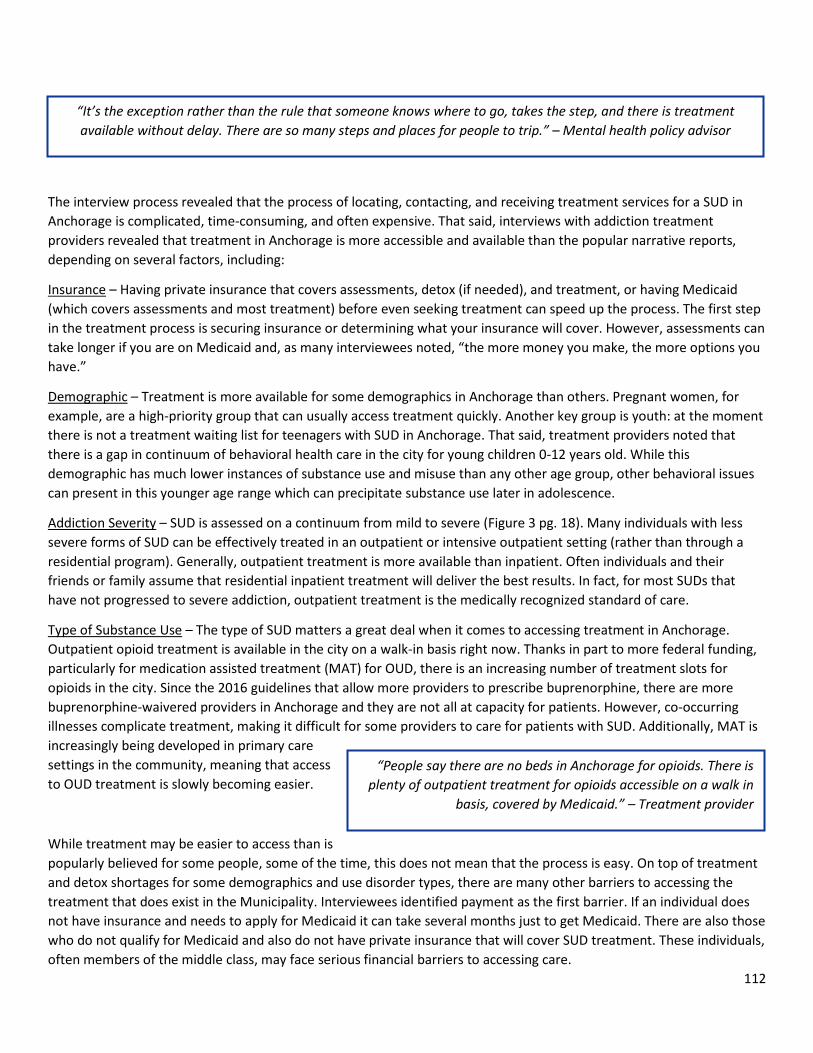
112
The interview process revealed that the process of locating, contacting, and receiving treatment services for a SUD in Anchorage is complicated, time-consuming, and often expensive. That said, interviews with addiction treatment providers revealed that treatment in Anchorage is more accessible and available than the popular narrative reports, depending on several factors, including:
Insurance – Having private insurance that covers assessments, detox (if needed), and treatment, or having Medicaid (which covers assessments and most treatment) before even seeking treatment can speed up the process. The first step in the treatment process is securing insurance or determining what your insurance will cover. However, assessments can take longer if you are on Medicaid and, as many interviewees noted, “the more money you make, the more options you have.”
Demographic – Treatment is more available for some demographics in Anchorage than others. Pregnant women, for example, are a high-priority group that can usually access treatment quickly. Another key group is youth: at the moment there is not a treatment waiting list for teenagers with SUD in Anchorage. That said, treatment providers noted that there is a gap in continuum of behavioral health care in the city for young children 0-12 years old. While this demographic has much lower instances of substance use and misuse than any other age group, other behavioral issues can present in this younger age range which can precipitate substance use later in adolescence.
Addiction Severity – SUD is assessed on a continuum from mild to severe (Figure 3 pg. 18). Many individuals with less severe forms of SUD can be effectively treated in an outpatient or intensive outpatient setting (rather than through a residential program). Generally, outpatient treatment is more available than inpatient. Often individuals and their friends or family assume that residential inpatient treatment will deliver the best results. In fact, for most SUDs that have not progressed to severe addiction, outpatient treatment is the medically recognized standard of care.
Type of Substance Use – The type of SUD matters a great deal when it comes to accessing treatment in Anchorage. Outpatient opioid treatment is available in the city on a walk-in basis right now. Thanks in part to more federal funding, particularly for medication assisted treatment (MAT) for OUD, there is an increasing number of treatment slots for opioids in the city. Since the 2016 guidelines that allow more providers to prescribe buprenorphine, there are more buprenorphine-waivered providers in Anchorage and they are not all at capacity for patients. However, co-occurring illnesses complicate treatment, making it difficult for some providers to care for patients with SUD. Additionally, MAT is increasingly being developed in primary care settings in the community, meaning that access to OUD treatment is slowly becoming easier.
While treatment may be easier to access than is popularly believed for some people, some of the time, this does not mean that the process is easy. On top of treatment and detox shortages for some demographics and use disorder types, there are many other barriers to accessing the treatment that does exist in the Municipality. Interviewees identified payment as the first barrier. If an individual does not have insurance and needs to apply for Medicaid it can take several months just to get Medicaid. There are also those who do not qualify for Medicaid and also do not have private insurance that will cover SUD treatment. These individuals, often members of the middle class, may face serious financial barriers to accessing care.
“It’s the exception rather than the rule that someone knows where to go, takes the step, and there is treatment available without delay. There are so many steps and places for people to trip.” – Mental health policy advisor
“People say there are no beds in Anchorage for opioids. There is plenty of outpatient treatment for opioids accessible on a walk in
basis, covered by Medicaid.” – Treatment provider
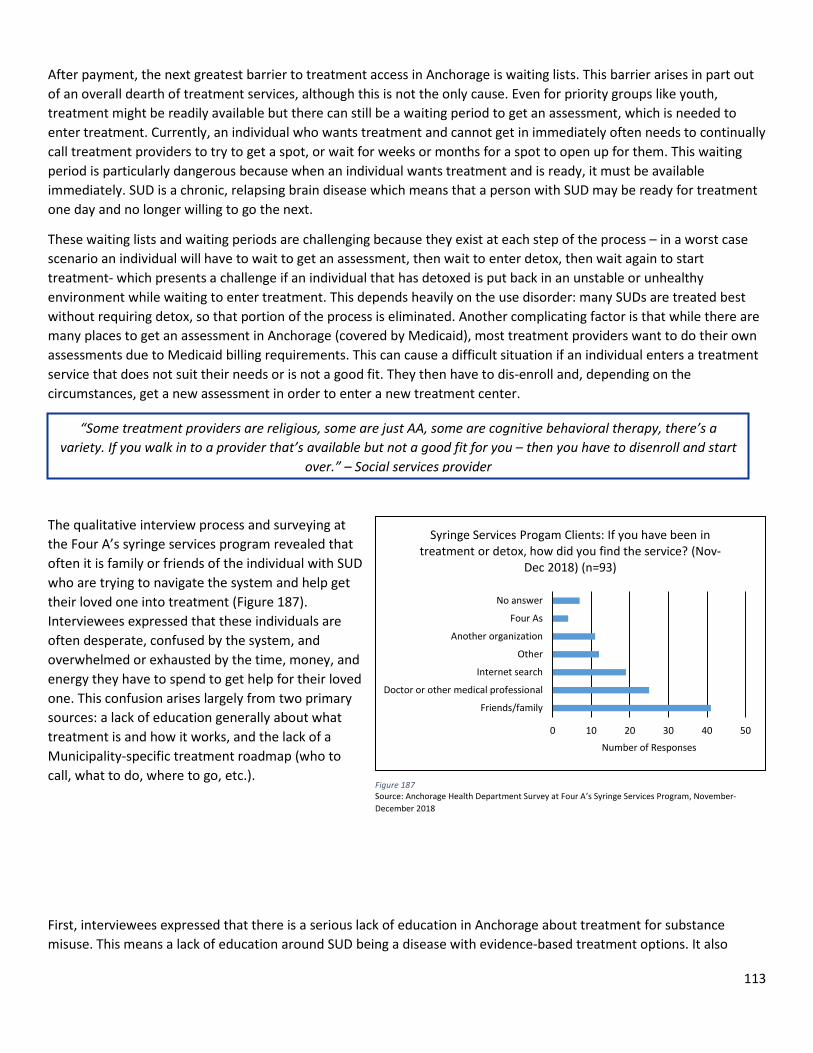
113
After payment, the next greatest barrier to treatment access in Anchorage is waiting lists. This barrier arises in part out of an overall dearth of treatment services, although this is not the only cause. Even for priority groups like youth, treatment might be readily available but there can still be a waiting period to get an assessment, which is needed to enter treatment. Currently, an individual who wants treatment and cannot get in immediately often needs to continually call treatment providers to try to get a spot, or wait for weeks or months for a spot to open up for them. This waiting period is particularly dangerous because when an individual wants treatment and is ready, it must be available immediately. SUD is a chronic, relapsing brain disease which means that a person with SUD may be ready for treatment one day and no longer willing to go the next.
These waiting lists and waiting periods are challenging because they exist at each step of the process – in a worst case scenario an individual will have to wait to get an assessment, then wait to enter detox, then wait again to start treatment- which presents a challenge if an individual that has detoxed is put back in an unstable or unhealthy environment while waiting to enter treatment. This depends heavily on the use disorder: many SUDs are treated best without requiring detox, so that portion of the process is eliminated. Another complicating factor is that while there are many places to get an assessment in Anchorage (covered by Medicaid), most treatment providers want to do their own assessments due to Medicaid billing requirements. This can cause a difficult situation if an individual enters a treatment service that does not suit their needs or is not a good fit. They then have to dis-enroll and, depending on the circumstances, get a new assessment in order to enter a new treatment center.
The qualitative interview process and surveying at the Four A’s syringe services program revealed that often it is family or friends of the individual with SUD who are trying to navigate the system and help get their loved one into treatment (Figure 187). Interviewees expressed that these individuals are often desperate, confused by the system, and overwhelmed or exhausted by the time, money, and energy they have to spend to get help for their loved one. This confusion arises largely from two primary sources: a lack of education generally about what treatment is and how it works, and the lack of a Municipality-specific treatment roadmap (who to call, what to do, where to go, etc.).
First, interviewees expressed that there is a serious lack of education in Anchorage about treatment for substance misuse. This means a lack of education around SUD being a disease with evidence-based treatment options. It also
“Some treatment providers are religious, some are just AA, some are cognitive behavioral therapy, there’s a variety. If you walk in to a provider that’s available but not a good fit for you – then you have to disenroll and start
over.” – Social services provider
0 10 20 30 40 50
Friends/family
Doctor or other medical professional
Internet search
Other
Another organization
Four As
No answer
Number of Responses
Syringe Services Progam Clients: If you have been in treatment or detox, how did you find the service? (Nov-
Dec 2018) (n=93)
Figure 187 Source: Anchorage Health Department Survey at Four A’s Syringe Services Program, November-December 2018
114
means that people without a real understanding of addiction treatment tend to make decisions and assumptions about what treatment is needed based off of popular narratives: thus, family and friends may seek out detox and residential treatment when in fact their loved one may just need outpatient treatment and can walk in that same day to receive it, no detox necessary.
Secondly, there is no treatment roadmap for Anchorage. This was discussed as a challenge not only for individual residents of the city, but for caseworkers and social services providers. Too often, access to treatment depends on knowing who to call and getting lucky. This makes the system almost impossibly difficult for an average citizen to navigate. Additionally, family members, friends, the individuals themselves, and even caseworkers and professionals in the field are often just not aware of all of the services that are available in Anchorage. Several interviewees discussed a need for better advertising within the Municipality about what services are available, and particularly strategic advertising in places like buses, shelters, and libraries. This information must be presented in multiple languages to meet the needs of Anchorage’s diverse communities. A common theme from the interview process is that family and friends, already suffering emotionally under the weight of a loved one’s disease and societal stigma around that disease, just do not know where to begin seeking help.
One of the most challenging barriers to accessing or receiving treatment for SUD is the high prevalence of co-occurring health problems that complicate treatment. This can be co-occurring SUDs, for example an OUD and methamphetamine use disorder together. The treatments for these two addictions are distinct, yet the underlying causes and any resulting or contributing behavioral health issues overlap. This creates a complicated dynamic for treatment providers. OUD treatment providers discussed how their clients can be doing well in treatment for opioids, but continue to use methamphetamine or benzodiazepines outside of treatment. Aside from co-occurring use disorders, mental illness and SUDs often present together. The Substance Abuse and Mental Health Services Administration (SAMHSA) estimated that in 2016 8.2 million American adults aged 18 and older had co-occurring SUD and mental illness.67 As discussed earlier, there is a high prevalence of mental health issues in Alaska and Anchorage and mental illness can be both a driver and effect of chronic substance use and SUDs. Therefore, treatment for SUD must also incorporate behavioral health treatments for any co-occurring morbidities. This can be challenging for both the provider and patient.
A significant and often overlooked barrier to treatment for some people is the lack of peer support services in Anchorage. Peer supports are people who have lived experience of substance misuse that navigate the treatment and recovery process alongside an individual with SUD. Peer supports are a recognized best practice for improving treatment outcomes. There are a growing number of peer support services within Anchorage, but interviewees expressed that there is still not enough given that a person in active addiction is often best served by someone who has been in that same position.
A crucial, and often insurmountable barrier, to treatment for some people is lack of access to stable housing. Stable, safe housing needs to be available while an individual is looking for treatment, in treatment, and after they have completed treatment.
Social services providers that work with Anchorage’s homeless population discussed the extreme difficulties this population faces – despite experiencing a higher rate of SUD than the general population – trying to access or stay in treatment while homeless. Being homeless is very often stressful, unsafe, and unpredictable. Making it to a weekly counseling appointment across the city can be impossible. Calling treatment providers to get a slot in the program is
“We have a lot of places that require sobriety in this town. I think we need a greyer area, and to provide resources that don’t require complete sobriety.” – Nonprofit leader
“We need to provide continuing information about the services available. If it’s not woven into the fabric of our community, the chances of success are low.” – Municipal policymaker
115
challenging if you do not own a phone. Moreover, the lack of housing first (housing that does not require sobriety) options in the city is a barrier to accessing treatment for many people that are experiencing homelessness, as they cannot find housing until they have stopped using substances, cannot stop using substances until they get treatment, and cannot find or enroll in treatment while homeless.
Beyond housing, there are other logistical barriers to accessing SUD treatment in Anchorage. Transportation can be challenging regardless of housing status, and most treatment providers are only open during regular business hours. Interviewees expressed that many times people who need SUD treatment work full time and are terrified that they will lose their job (and often their health insurance with it) if they have to miss work to attend treatment. This points to deeper issues around stigma and employment policies, but one clear barrier on top of these more intractable issues are the operating hours of many treatment providers.
Interviewees also identified a general lack of diverse treatment modalities in the city. Treatment looks different for each individual, and this reality is not reflected in the treatment options in the community. While some individuals may need cognitive behavioral therapy, others may want detox and Alcoholics Anonymous (AA) support groups and others may be best served by methadone treatment. Not only are there not enough addiction and behavioral health treatment providers in the city, but there are not enough diverse options for people to choose from. This leads to poorer treatment outcomes, which can discourage people from seeking help.
Finally, one of the largest and most difficult barriers to treatment access in Anchorage is stigma. Stigma is discussed at length above (pg. 32), but it is important to again highlight that personal, societal, and institutional stigmas toward drug use and misuse are well established barriers to accessing services of any kind.
While there has been some encouraging progress made in the area of SUD treatment in Anchorage recently, the system is still full of gaps, delays, and confusing processes. Below is a general outline of the system as it exists today. Depending on the factors elaborated above (payment method, demographic, addiction severity, substance of use) as well as the particular barriers faced by each individual (for example if they are experiencing homelessness, have family or friend support or a caseworker, have co-occurring morbidities, etc.), the time it takes to get from wanting treatment to entering treatment can vary from a few weeks to several months, if treatment is secured at all.
“Most places are only open Monday-Friday 8am-5pm. That needs to change. When you’re looking for help, it’s outside of those hours.” – Treatment provider
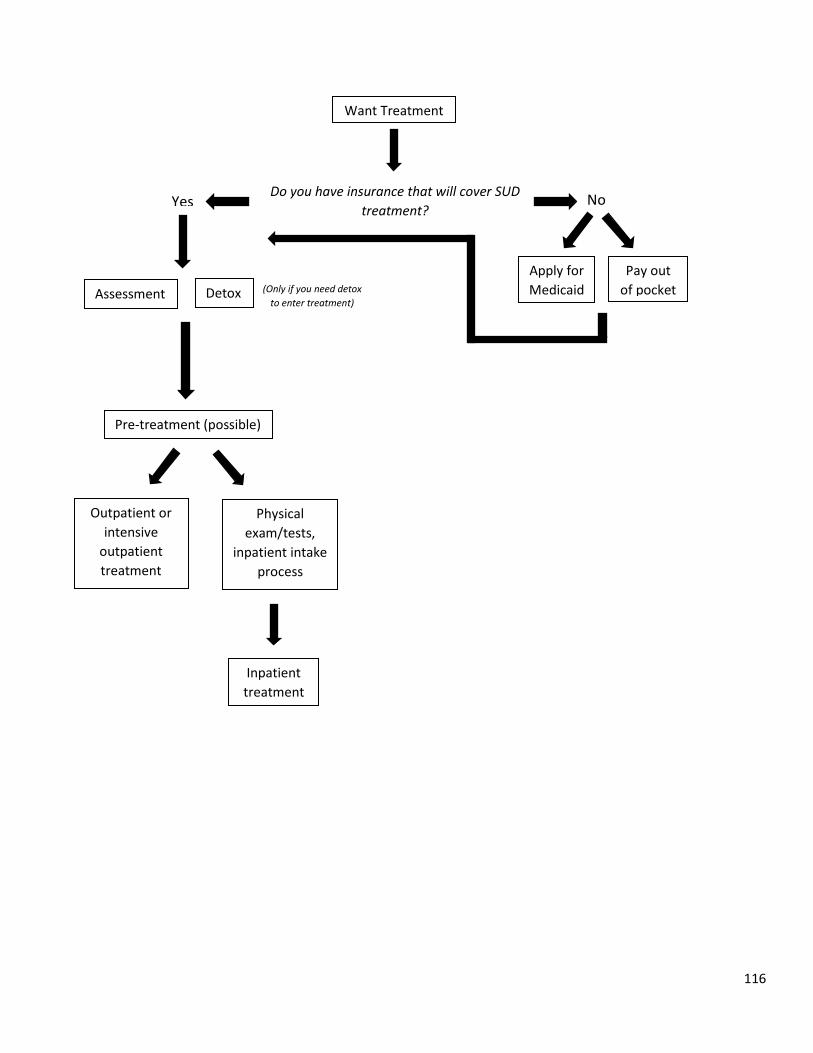
116
Want Treatment
Do you have insurance that will cover SUD treatment?
No
Apply for Medicaid
Pay out of pocket
Yes
(Only if you need detox to enter treatment)
Detox Assessment
Pre-treatment (possible)
Outpatient or intensive
outpatient treatment
Physical exam/tests,
inpatient intake process
Inpatient treatment
117
Recovery
Recovery supports and services were not a part of the initial investigation of substance misuse in Anchorage, but as the assessment progressed recovery continued to come up in the key informant interviews. The following themes emerged as central to the discussions around recovery.
Recovery services: Interviewees and community members expressed frustration with the lack of recovery supports and services in Anchorage. While AA and Narcotics Anonymous (NA) were named by some as examples of positive community assets and recovery supports, other discussed that a strong recovery community includes a diversity of supports. AA or NA work for some people, but may not be the right fit for others. In addition to a lack of recovery services, several interviewees also discussed that the entrenched culture surrounding alcohol at social events leads to few opportunities for indoor, pro-social community events that do not involve alcohol. This can be very difficult for individuals in recovery from an alcohol use disorder.
What recovery means: An important message that emerged from the Community Conversation on Substance Misuse was that recovery does not end – we say recovery, not recovered. Some interviewees and community members discussed that there can be a lack of understanding of what this really means, particularly in the context of SUD as a chronic, relapsing disease. Recovery never ends, and because SUD is a relapsing disease, relapse is very often part of recovery. As one medical provider noted, relapse is part of recovery if you have wrap around health and community supports. Without those supports, relapse is the end of recovery.
Peer supports: One asset that several interviewees highlighted as underutilized in the Anchorage community are peer supports. Peer supports are people in recovery from SUD that are able to use their unique knowledge and experience to help others find treatment and recovery. Several members of the recovery community discussed the lack of peer support services in Anchorage which, given that peer supports are an evidence-based best practice, is a disservice to those with SUD that want help.
Stigma and Recovery: There is no aspect of substance use or misuse that stigma does not touch. In the realm of recovery and recovery supports, community members and interviewees in recovery indicated that although more people have been coming out recently and publicly talking about their experiences with addiction, there is still a need to broaden and deepen the conversation around recovery in order to normalize it. Some of the stigmas discussed include stigma around relapse being failure (rather than part of recovery), stigma around talking about being in recovery (instead of keeping it a secret), stigma around what counts as recovery (whether or not an individual is in recovery from opioid use disorder if they continue to misuse alcohol), and stigma around length of recovery – sometimes the community demands years of recovery before it will accept an individual as “recovered.”
“The entire realm of recovery supports has been overlooked, especially if you consider addiction to be a chronic disease. Routine checkups, support groups: this is the recovery routine for other diseases.” – Nonprofit leader
“Dental issues are a big trigger for relapse. We won’t give them dentures, they don’t want all their teeth pulled – so, they use painkillers again. We
need to slow down and address these issues.” – Treatment provider
“Will our community choose to value recovery as a long term investment?” – Anchorage Health Department Community Conversation on Substance Misuse
“One person incorporated the library into their sobriety plan. It’s nice to have a free public space where you are always welcome, a positive outlet.” – Municipal employee
118
Appendix 1: Policy Recommendations
The following is a complete list of AHD policy recommendations to address substance use, misuse, and addiction in the Municipality of Anchorage. These recommendations were generated from the community assessment and a literature review of best practices in policy and interventions to prevent, mitigate, and treat substance misuse.
• Require all AHD staff and any municipal employees that work directly with the public to attend trainings on trauma-informed care/adverse childhood experiences, cultural competency, implicit bias and institutional racism, and the history of racism and discrimination in Alaska.
• Pursue funding for the Alaska Center for Treatment Project. • Pilot a fentanyl test strip program with community partners. • Issue a resolution in support of the development of housing first options in the Municipality and recognizing the
strong evidence base behind true housing first interventions. • Explore funding opportunities to pilot the LifeGuard overdose system in the Municipality. • Allocate funding for a long-term stigma reduction and addiction information campaign in the Municipality. • Allocate funding for a study on syringe services program access in the Municipality. • Allocate funding for the provision of free or inexpensive extracurricular activities for youth in the Municipality. • AHD will adopt a policy that allows for Narcan distribution in the clinic and at outreach events until the Project
HOPE Narcan distribution funding runs out. • Require official municipal language regarding substance use to be in line with recognized best practice.
Accompany language change with brief training on appropriate language use for all municipal employees involved in public messaging.
• Require distributors of medications to have a take back/disposal mechanism and information about safe disposal that is given with each prescription of a controlled substance. (“Extended Producer Responsibility” (EPR) Law).
• Introduce Screening, Brief Intervention, and Referral to Treatment (SBIRT) procedures into Anchorage Health Department clinic.
• Install sharps boxes in AHD and City Hall first floor bathrooms, all municipal library bathrooms. Provide sharps handling and disposal equipment and training to any municipal staff responsible for possibly handling sharps. Establish clear disposal mechanism for each site.
• Work with Parks and Recreation to pilot a monitored sharps disposal site within a public recreation center. • Issue a resolution in support of Title IV legislation. • Enact a 5% retail tax on alcohol in the Municipality. • Do not support increases in alcohol outlet sale hours. • Conduct a policy analysis related to alcohol outlet density in the Municipality and its effect on health and public
safety outcomes. • Enact a Tobacco 21 Ordinance. • Allocate funding for the Alaska Center for Treatment project.
119
Appendix 2: Community Conversation Notes
Summary: On December 11, 2018 from 6:00-9:00pm the Anchorage Health Department held a Community Conversation on Substance Misuse at the Loussac Library. The event was supported by the Healthy Voices Healthy Choices Coalition, the DHSS Office of Substance Misuse and Addiction Prevention, and the Alaska National Guard Counterdrug Support Program. The notes taken at the Conversation will supplement the community assessment of substance misuse currently being conducted by the Health Department. The assessment will be made public in early March, 2019. Mayor Berkowitz and Anchorage Health Department Director Natasha Pineda gave welcoming remarks. Anne Hillman facilitated the event, which was structured around eight discussion topics. Dinner and on-site childcare were provided. Discussion topics: Youth Prevention
Community-Based Prevention Treatment Recovery Harm Reduction Community Engagement Language, Perception & Communication Law Enforcement
Event attendees: 65 community members 9 Facilitators 8 Volunteers
Notes: Question: What are you unsure about when it comes to substance misuse and addiction? Are there any areas, ideas,
or topics that you are unsure about?
- Why does the state not have adequate treatment facilities? o RN required at every facility – there are not enough RNs
- How can we improve access to and availability of resources? o Mat Su has 30 beds: twice as many as Anchorage o Navigation of the system
- How do we approach the stigma in the community? o Need to create a culture of compassion – how to do this?
Talking about it Include the context of addiction (e.g. trauma, violence, etc.)
o How to address compassion fatigue? - Do you need to hit rock bottom to seek treatment?
o Everyone has a different level of rock bottom. High vs. low rock bottom? - Stigma - Does Narcan make users susceptible to detox? - Is public awareness an issue regarding Narcan? - What regulations are there on alcohol?
120
- What is the current opioid situation among youth? - What are the current programs for youth besides DARE? - Who is working on harm reduction/community based prevention to address this issue? - Other treatment options for chronic pain? - Youth-specific efforts? - Data collection? - Are drugs like Vivitrol and Suboxone a good solution? - Medication assisted therapy - Are pain clinics potentially worsening the problem? - Why are treatment beds so limited?
o What are potential solutions? o Are more treatment centers going to open up?
- How do bad doctors who overprescribe drugs stay in the system? - How do agencies at different levels work together? - Data related to substance misuse in Anchorage - What the state/Muni are doing, future plans for addressing the issue? - Requirements in schools?
Discussion Table: Youth Prevention
Main Points:
1. Lack of curriculum on substance use and misuse a. Need more education in schools: currently little to no education in schools/villages/communities b. Lack of ACEs/trauma informed care in the curriculum (school district has put forward effort)
2. Lack of resources for youth outside of school a. Need more alternative options and safe places for youth to go/feel connected to community/participate
in fun/substance free activities b. Specifically, need more mentoring programs and harm reduction approaches/strategies
What resources are there in the community, what are current youth prevention efforts? - Parenting vouchers - Bring programs to the schools - Kids need a mentor or a connection to a healthy adult
o Need more culturally appropriate mentors and activities - A doctor was going into schools talking about how drugs affect the brain - TV advertisements/commercials - Church youth groups - Red Ribbon Week - Lack of resources for youth: nobody really knew of any resources
What are some factors causing youth to misuse substances?
- Marijuana being legal - They don’t know it changes the brain as it grows - Get parents’ stash, follow their example - ACEs- contribute to use – create huge risk for health problems - See kids being pressured to perform well in life – they are overwhelmed - Price of privilege
121
What components are missing in youth substance misuse programs in Anchorage? - Parent: I talked to my daughter, there is no program on substance misuse - Storytelling, seeing someone who has been through this, seeing success – could be effective - Destigmatize mental health issues
o Teach kids about mental health issues, warning signs, where to get help o The problem is people are uncomfortable talking about mental health
- Teachers are overburdened- that could be hard - Student: I didn’t get any info or education in high school, there were a few clubs for mental health
o Some education in elementary school - The state has offered to give ASD curriculum, ASD says they have it covered, don’t want new curriculum - In Kenai, they are doing some innovative teaching about healthy relationships - Lack of data: need YRBS to be changed for “active consent” so more students fill it out - More resource dedicated to youth and better ways we all work together to share resources - Family breakdown: 2000 in state custody
o Do they have mentors? o Lack of awareness, no idea about addiction
- Wait list for therapeutic care - Mixed messaging on drugs from the media - Need resources available for after-school activities - ASD doesn’t have enough opportunities
o Teachers don’t have time or money to do after-school activities o At-risk kids don’t have money o “3rd place from home” – have another place besides work, can be a place or a community itself
- Make people feel welcome in places: “safe spaces” - Parachutes: moved to different location, not centrally located - Have them come to us, not require us to go to them (about safe spaces) - Have a resource in every mall
Outside of school, where could prevention activities occur for youth?
- After-school programs o How consistent is attendance at after-school programs- would they get out message?
- Boys and Girls Club - Church - Rare that attendance at these places is consistent: most effective way to educate is through schools - Should we advocate with legislatures for more prevention/mental health programming in Anchorage school
district? - There are two states where mental health programming is mandatory, NAMI is interested
o No other way that programming will be effective
Other: - Supportive family members: teach kids early, get prevention in schools and curriculum (ASD needs to make a
class) - We think peer pressure comes from strangers, but it comes from friends - The power of storytelling - High school students representing youth
122
Discussion Table: Community-Based Prevention
What is the role of social isolation in addiction? - Must look at both risk and protective factors - Cannot be bound by the “misery index” - How do we flip the script and talk about building connections - What is the role of shared protective factors in the solution? - Youth 360 – based on Youth in Iceland Model
o Elements: build connections, social; reduce barriers like money or transportation; training youth professionals – be trauma informed
- If asked, would people with substance use disorder agree that isolation leads to addiction? - People feel like they don’t matter, have no purpose - Do we assign blame to those with substance use disorder?
How do we design community-based prevention programs that are positive and comprehensive? - There are different stages of readiness in the community to address public health concerns like addiction- how
do we get community to embrace complex solutions to complex problems? How do we build the narrative, engage communities/neighborhoods in the conversations?
- Role of education, educational curricula o E.g.: Thrive Mat-Su relationship with MSB School district o Use of Be [You] in middle/high schools, Youth 360 in Houston MS
- Parent education- family-based prevention critical o Strengthening families model o Relationship-based activities that support larger questions of family and community growth
- What are the policy-driven efforts to shape the community that are prevention? - What efforts are underway to educate the community about protective factors? Shape community conversation
about what prevention is… - Social/emotional learning – role in school/ED efforts - Trauma-informed care – application in education, application in law enforcement - Prevention is part of the larger continuum of care – it is NOT linear - Protective factors need to be strengthened: school, family
o Start conversation with kids - Greenhouse for housing homeless in winter and growing in summer - Drug classes for suspended students - Peer to peer connection - Change diets - Give kids a voice in policy - Let people with substance use disorder design their recovery programs, give support - The community needs to accept those with substance use disorders
o Stigma is the hardest thing to combat - Community conferences on community-based prevention needed
Other:
- Prevention, intervention, treatment are all part of larger picture/context/conversation - Need for system-level changes
o Change social and environmental conditions o Change environment, change behavior
123
- Prevention is where we need to start, focus on more than just the symptoms/problems
Discussion Table: Treatment Why did you choose to sit at this table?
- Recovering addict/recovered - Current user and recovering - Education is power - Active citizen - Lack of discussion about treatment - Connection to mobile resources (ie clean needles, referrals, etc.) - Feeling alone regardless of knowledge of resources - Goal of how to treat or implement treatment? - I want to be in the know about resources and have the ability to implement treatment - Connection with substance abuse, mental health, and homelessness - Current treatment is not for all. How can we create an alternative treatment path that includes family or personal
support? - Cultural inclusion to treatment - Interested in treatment - Never offered treatment - It is a part of daily life and work - Treatment related activity for grants - Who and how to fund treatment - Education related (school) - Experience and observation of lack and disappearing resources - Research on treatment - Generational trauma - More accessible assessment - Looking at outside program resources
Create a roadmap for treatment in Anchorage:
- Step One: o Sleep off, CSP, Any care agency o 2-1-1 o Ads on the radio, TV, news o Law enforcement o Schools o Immediate response with warm reception o Housing system for homeless o Reverse halfway house o Safe place that is available for all and assessment o Wrap around services o Central assessment safety center o Sleep off CSP transportation to central center o Awareness of central center o Community collaboration
124
o Triage - Step Two: After warm reception, stop time limits on beds
o Assessment in safe place o Treatment center and recovery center together o Should include relapse o Medical, therapy, all agencies to provide wrap around services o Social services need to be included o Different levels of withdrawal require appropriate level of treatment o After care o Must include people that love them
What are perceptions of treatment in Anchorage?
- Medication is used for treatment successfully - Moral model of addiction vs. medical condition or illness - Use of personal stories to humanize - Is there an infrastructure for stories to be told and cause change? - Awareness of context and causes - Alcohol connection with addiction - Perception of cheating when using controlled doses of substances - Lack of awareness among certain organizations - Over prescription of medication - High turnover of providers contributes to low quality of treatment - Lack of treatment training among medical providers - Designated medical wing for detox (Mat Su example) - Communication among treatment centers - Collaboration among key organizations - Restrictions on grants or projects that limit collaboration between organizations - Lack of quality medical care - No agreement on a macro level on defining addiction and how to treat - Understand what is out there and how does it work - Systems are complicated - People have no concept of trauma informed care - Levels of ability to navigate the system already in place - A lot of providers are sending clients out of state - Lack of ability for people to get to treatment – cycles of homelessness
Other: - Ask Alaska to be a leader of promoting evidence-based medical practices - A need to have open access to information - Ensure treatment options - Every Alaskan needs to have access to treatment - Increase coordination of services - Who is providing treatment for youth?
o Increase access to SUD services for youth o Clinicians could decide the age for youth transitions of mental health treatment
- How do we share information? o When other organizations push back
125
- All primary care should provide addiction treatment - Peer support in medical facilities - Why isn’t more money being spent by the state on prevention services? Why don’t we use more tax money
from ETOH and marijuana? - What treatment resources are there really and who is paying for them? - What’s our recovery methodology – follow-up care infrastructure - How to remove barriers to actually getting to treatment: patient navigation
Discussion Table: Recovery Recovery doesn’t “end”
- E.g.: cancer remission - Recovery, NOT recovered - Less stigma/shame to support, hard to talk about
What are the challenges or gaps in recovery in Anchorage? - Transform community services, clinics, treatment, beds, support services - Need to look at recovery from social view, not just individual level - Complex recovery
o Long-term recovery, follow-up, monthly follow through o Focusing on improvements (“I’m a better dad now”)
- Need monitoring programs after treatment - Where is the most effective bang for buck in recovery?
o Prevention o Housing, coordinated reentry into society
- Balance between recovery and law enforcement - Recovery means different things to different people
o What other opportunities exist? o Redefine recovery as their own story o Different recovery from different drugs (changes over time- 1980s vs now) o Chemical addiction vs. social use aspects o If medical treatment, what is the long term management plan? o “How do we treat” and keep that continuing o Get recovery into most needed/effective places – jail/corrections o Peer support and peer to peer o Recovery is a life long struggle, always a reminder
- Ultimate goal: how can we work recovery into a harm reduction matrix? - Resources are few and far between- why are we sending people to the lower 48?
o Akeela, CITC, Ernie Turner, Eklutna, Clitheroe, Hiland/Cook Inlet, Wasilla o 30 days isn’t enough o Wait lists o “So sad how little treatment we have here”
- Hard to talk about recovery in small communities, “personal” - Suicide numbers going up from doctors having to lower number of prescription opioids
o People can’t handle chronic pain o Withdrawals worse than prior starting medications
126
o Difference between chronic pain/using opioids for long term management, and temporary access to opioids for broken arm
- Why do people look down on using Suboxone/methadone? o Some people see it as “cheating” – can’t do it on your own o Hard to access Suboxone/methadone/chronic meds- limited doctors, limited prescriptions, office
policies (pain clinics) - Old timer’s attitudes affecting younger people in recovery - Methadone clinic/needle exchange – “Not in My Neighborhood” - We don’t ever not prescribe insulin because we think they won’t adhere to treatment plan, why do we do it with
substances? Reframe it: “no one wants to grow up to be a dope fiend.” - Sick people need trauma informed care - Very concerned – councils/meetings have “caustic” language/narrative
o How do we plan recovery? - Minneapolis MN indigenous drug use camp – positive community help response
o Vs. Fairbanks camp: eviction off land via municipal vote - Punitive mindset in Alaska - Cost to pay for treatment/detox – will our community choose to value recovery as a long term investment?
Solutions to these challenges: - More local treatment centers - Drug court after a crime – so that most people end up doing treatment rather than jail time - Funding - Homelessness coalition - Harm reduction access - Support services, coordination between services - Recovery needs to be more socially acceptable/talked about - Teach life skills in schools, not “don’t do it” - Change the narrative – we are changing history by talking about it - How do we craft that narrative of a positive message, front edge work, communications, cracking through
negative narratives o Appeal to someone’s intelligence, “we see substance use increases correlated with ACEs, trauma, abuse,
vs. resilience o Education, coping skills – maladaptive coping skills
Bring education back to recovery - People don’t respond to a narrative until the message reaches them on their level. Rather than education,
change the social/cultural context o “Brain on drugs” – “friends don’t let friends drive drunk”
Discussion Table: Harm Reduction Concerns and/or questions about harm reduction approaches:
- Creates or invites more use - “Enabling” - Misunderstanding of what harm reduction is - Fear that donors won’t support it - Assuming others will provide naloxone (Narcan) - Liability of possessing, distributing
127
- Need of fentanyl test strips for users
Benefits of harm reduction approaches: - SAVES LIVES - Opens doors to resources immediately as need arises - Increased perception of misuse as a continuum - Harm reduction = driver’s education/seatbelts, framing that lens for the public as aspect of education
What harm reduction resources are available in Anchorage? What needs to be improved?
- Syringe exchanges – awareness needs to increase, advertising - Safe disposal sites – more sites, buy-in from pharmacies - Innovative efforts –
o Safe injection sites o Vending machine model of syringe exchange o Prescribing not only Suboxone, etc. but heroin itself with a monitoring provider
- Family-centered approach: parents need not be penalized and children removed if interventions are appropriate - “Social enterprise” model – address money concerns and longevity of programs - Public Health Model - Need commitment from pharmacies re: syringe disposal, medication disposal, patient education - Multi-drug use education regarding the increased risk of death for users - Services billable: no financial incentive to get clean, no financial incentive for providers to support, recovery - Employing people directly affected by addiction = social enterprise model of recovery services
Discussion Table: Community Engagement
What are communities in Anchorage, and where do they gather?
- Faith-based (churches, mosques, synagogues) - Refugees (gather at welcome events) - Youth (malls, transit center) - Hospitals - Clubs:
o “Quilters, musicians, artists, gamers, houseless” - Gathering places:
o Parks, trails, ski areas o Bear Tooth, restaurants o Libraries o Universities
- Welcoming Anchorage – for newcomers - Indigenous - Neighborhoods - Examples:
o Portland- Intersection Repair o Tradition Tuesday
When it comes to substance misuse, how do the needs of various communities differ? - “Often it’s about the ‘other’ – engaging them. We need to flip the script, think about what communities am I
involved with, what can I do to engage myself? Start with me.”
128
- How do we break down boundaries- i.e.: see homeless people as community members? - How do we “get people” to understand the diversity in our community? - When talking about substance misuse, what vulnerable populations are affected?
o Foster care system o Trauma-informed youth
- Youth prevention- community engagement - Faith leader: “How can the faith community respond?” - Social worker: “How do we come together for a slow burn crisis?” - Nurse: “How do we get community buy-in?” - Who is most vulnerable?
o Trauma – collective, historical, intergenerational, situational, individual o Marginalization/marginalized/isolation – “living on the line” o Stress, poverty, constantly on edge o Those living within dysfunctional systems
How can the Municipality make sure that the needs of all community members are being met when addressing substance misuse in the city?
- Being able to share stories, tell the truth - What am I doing vs. what are they doing? - Challenge is how to listen well and create appropriate responses
o Friends killed by suicide, dealing with trauma o People ashamed to talk about challenges, but expected to look good, be heroes, etc.
- Stories we hear and tell – Nextdoor: fear of crime - Addiction in everything: addiction to exercise, to work… - Interested in thinking about messengers- how can we share and support other communities and be good
advocates of our knowledge, etc? o Ex: getting neighborhoods to volunteer
- How do you engage more people in the community? - The opposite of addiction is connection
o Relationship building o Humanizing each other o Amplify stories, don’t represent those stories o Peer voice
- Tools for visioning community engagement solutions: o Service map o Frameworks o Navigator
Actual help Hope, empathy, immediacy
- What we can do: o Fundraising for addiction services o Humanizing the issue o Street papers
- Instead of “What are they doing?” ask: “What am I doing?” - How to leverage messengers and amplify voices? - Where are common public spaces where diverse people can interact freely?
129
Discussion Table: Language, Perception & Communication What is the community’s perception of people struggling with addiction? What are the specific words/phrases that come up?
- Words people use: o Normies (normal drinkers) o Loser, drug addict, weak, can’t handle life, how did you let it happen? o “Be tough” o “You’re not strong enough”
- Disease of the body and brain – some people don’t understand that - They should just let them die - The challenges between those connected to the issue - Denial about the issue - “Criminal” is used to describe those with internalized shame - Perception that native corporations are responsible for “drunk natives” - Stigma hasn’t changed in the last 25-30 years, still not comfortable, some people relapse because of stigma,
need time to repair - Changing language to first person use:
o “They are manipulative” to “They are good at getting their needs met” o “Thief” to “My brother” o This changes the weight of words – humanizes
- Class and ethnicity influence stigma: o “You’re an Indian,” “opioids are white collar”
- Perception change requires us to get to know people, see personally – this is hard because people with substance abuse issue are segregated by housing status, class, race, etc
- Media is a powerful tool for good/bad. Can tell positive stories of people OR reinforce stigma
How do the media, government, nonprofits, and other organizations communicate about addiction in Anchorage? Where do you hear about addiction? What are the most common narratives that arise?
- News stories are about result of addiction: crime, death, etc. NOT people or causes - People complain using negative language. People mention it without being asked - Don’t see solutions - The difference between different substance use issues: alcohol vs. drugs - There seems to be some ignorance- not knowing - “Let addicts die” - “Narcan parties” - This perception that those who are addicted don’t care about themselves - Community education about what an addict looks like - Anchorage Opiate Task Force: anyone can come and work on the issue - What’s the intersection between racism and addiction? - Negative messages - Need for treatment beds - Racism can be underlying current - Where hear about addiction: Radio, DHHS, Four A’s - If you are new to the city, how does media affect your perception?
What are some ways to address and lessen the stigma that exists around substance misuse and addiction? - People are sick and want to get better
130
- Get families involved in the issue - Hiding recovery and not being out in the open about it - Honest discussion sessions made impact on recovering abuser because treatment made them feel they don’t
care - Break the stigma by being innovators - Indigenous people should tell their own stories of recovery, addiction, etc. - Make addiction non-threatening to others - Newcomers quickly pick up on perception of Anchorage as having substance abuse issues
Discussion Table: Law Enforcement
What role does Law Enforcement (LE) play in prevention?
- Youth prevention/mentorship program/children in families with addiction - LE help people get into treatment vs. incarceration - LE facilitation to address basic needs - How do we change the role of LE? - Money directed to services/intervention
o Grant money? - APD doesn’t carry Narcan because it is not rural like troopers – education - Compassion - Hand out a card or information to those who need resources - Prevention of drugs coming into AK (e.g. drug dogs) - Red Ribbon Week/prevention campaigns/evidence based - Partnerships with peers/people in recovery - Hidden in Plain Sight trainings with LE officers - Increase visibility of problem - Understand that the person suffering from addiction is not the only “problem,” it’s also the families, neighbors,
and community - LE mentorship program/positive interactions with LE officers – kids of parents suffering from addiction, those in
recovery
What is the perception of how LE interacts with people struggling with substance misuse? - Individual relationships with LE and citizens
o Non-verbal communication o Human connections
- Training on dealing with people in crisis o Understanding the lenses people view their world with o Training on mental health
- Good interaction o Actually- really good! (compared to LAPD)
- Number of police have increased - Happy to hear that APD recruits receive crisis intervention training - Observed good/compassionate interactions at Bean’s Café - We can’t arrest our way out of this problem - It has improved - Public perception is that crime and drugs are out of control – they are visible
o Are police to blame?
131
Alaska Department of Corrections: 80% of people in DOC system have a substance misuse problem. What role should incarceration play?
- Increase the prevalence of meeting human needs - Should not be punishment - Rehabilitation
o How to succeed outside prison o Support people on road to recovery o Inmates working outside facility to learn job skills
- Inmates telling their story – increase dialogue
132
Appendix 3: Literature Review
Anchorage Substance Misuse Community Assessment and Policy Recommendations Substance Misuse Policy and Programming: Best Practices Literature Review
This literature review seeks to identify the evidence-based programming and policy best practices for combatting substance misuse. The interventions examined here have been identified by government agencies, think tanks, and/or organizations as effective measures to address substance misuse. For each intervention, the body of scientific evidence available is investigated and “scored” based on the strength of the evidence. For a summary of these scores, see page five.
The literature review is broken into the following sections based on type of program and policy area. Generally, a comprehensive approach to addressing substance misuse incorporates programming and policy in each of these areas. Finally, some innovative ongoing interventions are listed. These interventions lack an evidence base, but may prove effective at addressing some aspect of substance misuse.
Prevention
Harm Reduction
Intervention, Treatment & Recovery
Public Awareness & Stigma Reduction
Emerging Interventions: Innovative program and policy interventions without an evidence base, but which may be promising solutions to combatting the opioid epidemic and substance misuse broadly.
133
Table of Contents
Acronyms & Definitions 134
Summary of Findings 136
Evidence-Based Prevention Interventions 137
1. School-Based Youth Prevention Programs 138
2. Community-Based Prevention Programs 139
3. Adverse Childhood Experiences (ACEs) 140
4. Prescription Drug Monitoring Programs 142
5. Prescribing Guidelines and Prescriber Education 144
6. Co-prescribing naloxone with opioids 145
Evidence-Based Harm Reduction Interventions 147
1. Naloxone Access 147
2. Good Samaritan Laws 150
3. Syringe Services Programs 151
4. Safe Drug Disposal 153
5. Safe Syringe & Needle Disposal (Sharps Disposal) 155
6. Safe Injection Sites 155
7. Fentanyl Test Strips 156
Evidence-Based Intervention, Treatment & Recovery Interventions 158
1. Screening, Brief Intervention and Referral to Treatment (SBIRT) 158
2. Medication Assisted Treatment (MAT) 159
3. Drug Courts 163
4. Housing First 164
5. LGBTQ-Tailored Treatment Services 165
6. Cognitive Behavioral Therapy and the Matrix Model 166
7. Contingency Management 167
8. Peer to Peer Services 167
9. Exercise 168
Evidence-Based Public Awareness & Stigma Reduction Interventions 169
1. Changing the Language of Addiction 169
2. Public Awareness Campaigns 170
Emerging Interventions 172
Bibliography 174
134
Acronyms & Definitions ACE – Adverse Childhood Experience
Stressful or traumatic events in early childhood that are strongly related to the development and prevalence of a wide range of health problems throughout a person’s lifespan
CBT – Cognitive Behavioral Therapy A treatment method for SUD, particularly methamphetamine and cocaine CDC – Centers for Disease Control and Prevention The federal agency of national public health in the United States DEA – Drug Enforcement Administration The United States federal agency tasked with combatting drug smuggling and distribution FTS – Fentanyl Test Strip Small strips of paper that can detect fentanyl and some analogues in a substance
GSL – Good Samaritan Law Laws that offer legal protection to people who give reasonable assistance to those who are injured, in danger, or otherwise incapacitated
MAT – Medication Assisted Treatment The combination of behavioral therapy and medications to treat substance use disorders NAL – Naloxone Access Law Laws that expand access to naloxone, the prescription medicine in Narcan NIH – National Institutes of Health
The primary agency of the United States government responsible for biomedical and public health research
OEND – Overdose Education and Narcan Distribution Training on overdose indicators, proper responses and Narcan administration, accompanied by Narcan distribution to trainees
OUD – Opioid Use Disorder
A chronic brain disease that involves problematic opioid use resulting in significant impairment or harm to the individual
PDMP – Prescription Drug Monitoring Program
State-run programs that collect, monitor, and distribute data about prescription and dispensation of controlled substances
SAMHSA – Substance Abuse and Mental Health Services Administration
A branch of the United States Department of Health and Human Services in charge of improving the quality and availability of treatment and rehabilitative services for substance misuse and mental illness
SBIRT – Screening, Brief Intervention and Referral to Treatment
135
An evidence-based practice used to identify, reduce, and prevent problematic use or misuse of alcohol and illicit substances
SUD – Substance Use Disorder The recurrent use of alcohol and/or drugs which results in clinically and functionally significant impairment
WHO – World Health Organization An agency of the United Nations focused on international public health
136
Summary of Findings Prevention:
1. School-based youth prevention: there is substantial evidence that implementing skills-based, interactive prevention curriculum in schools, targeted at appropriate ages, can lower substance misuse among youth.
2. Community-based prevention programs: there is some evidence that a community development approach to prevention that is based on risk and preventive factors can help combat substance misuse, particularly among youth.
3. Adverse Childhood Experiences: there is substantial evidence that ACEs are correlated with substance misuse later in life. Therefore, interventions that seek to lower and mitigate ACEs scores in a population could have a positive impact on substance misuse behaviors. More research regarding the link between specific interventions and lowered population ACE scores is necessary.
4. Prescription Drug Monitoring Programs: there is some evidence that PDMPs improve clinical decision-making, reduce doctor shopping and diversion of controlled substances, reduce opioid prescription rates, and in some cases result in increased buprenorphine prescriptions and lowered overdose rates. There is not enough evidence to firmly establish a correlation between PDMP use and lowered substance misuse or overdose rates. Some research indicates that PDMPs could contribute to an increase in overdose deaths as individuals are forced to move from prescription drug misuse to misusing illicit substances.
5. Prescribing Guidelines & Prescriber Education: there is some evidence that prescribing guidelines and prescriber education can increase awareness of prescription opioid misuse amongst prescribers, and possibly contribute to reduced opioid prescription rates. There is not yet enough evidence to determine the effects of the 2016 CDC Opioid Prescribing Guidelines.
6. Co-Prescribing Naloxone with Opioids: there is some evidence that co-prescribing naloxone with opioids can reduce opioid-related emergency department visits. There is not enough evidence to draw strong conclusions about co-prescription of naloxone at this time.
Harm Reduction: 1. Naloxone Access: there is substantial evidence that increasing access to naloxone decreases opioid-related
overdoses and emergency department visits. Naloxone Access Laws may reduce opioid overdose deaths, particularly when accompanied by Good Samaritan Laws.
2. Good Samaritan Laws: there is some evidence that implementation of Good Samaritan Laws that provide protection from both civil and criminal prosecution can result in lowered overdose rates.
3. Syringe Services Programs: there is very substantial evidence that syringe services programs decrease HIV infection rates, decrease needle sharing, and can divert people misusing substances to treatment.
4. Safe Drug Disposal: there is some evidence that comprehensive drug disposal box programs can be an effective way to remove unused prescription drugs from a community. There is little evidence to suggest that drug take back events remove any meaningful amount of drugs from the community, although they may help increase awareness about the dangers of prescription drug misuse. There is no evidence yet on the effectiveness of drug deactivation bags.
5. Safe Syringe & Needle Disposal: there is substantial evidence that safe syringe disposal boxes or locations are very effective at reducing the number of discarded and improperly disposed of needles in a community.
6. Safe Injection Sites: while not legal in the United States, there is some evidence that these sites can reduce overdose mortality, increase access to drug treatment, reduce needle sharing and risky drug use behavior, and lower rates of public drug use.
7. Fentanyl Test Strips: there is some evidence that the use of fentanyl test strips can decrease risky drug use behaviors at the time of drug use. There is very limited evidence on fentanyl test strips.
137
Intervention, Treatment & Recovery: 1. Screening, Brief Intervention and Referral to Treatment (SBIRT): there is substantial evidence that brief,
universal, comprehensive SBIRT can reduce risky alcohol consumption, but less evidence for its role in reducing risky drug use.
2. Medically Assisted Treatment (MAT): there is very substantial evidence that MAT retains people in substance treatment, lowers illicit drug use, reduces opioid-related overdose mortality, and is associated with lower HCV infection rates. Evidence indicates that MAT is more effective at achieving these outcomes than detoxification or non-medical substance misuse treatment programs.
3. Drug Courts: there is some evidence that drug courts reduce criminal recidivism and substance misuse during and after court program participation.
4. Housing First: there is some evidence that housing first policies improve housing outcomes, reduce incarceration rates and prison time, and reduce emergency department visits and inpatient spending among people experiencing homelessness. There is limited research on the direct impacts of housing first policies on substance misuse.
5. LGBTQ Tailored Services: there is some evidence that treatment services tailored to the specific needs of LGBTQ persons result in better recovery outcomes for these individuals.
6. Cognitive Behavioral Therapy (CBT) and the Matrix Model: there is some evidence that these two treatment therapies for SUD are effective, particularly for methamphetamine and cocaine addictions, which have no pharmacological treatment options.
7. Contingency Management: there is some evidence that this treatment method can be effective for individuals with amphetamine use disorders.
8. Peer to Peer Services: there is some evidence that peer to peer services enhance treatment and recovery outcomes for SUDs. This is an emerging field of research but the evidence is overwhelmingly positive.
9. Exercise: there is substantial evidence that exercise and physical activity can prevent substance misuse, enhance treatment outcomes, and prevent relapse.
Public Awareness & Stigma Reduction: 1. Changing the language of addiction: there is substantial evidence that using people-first language and limiting
use of the word “abuse” when referring to substance use disorder can improve treatment outcomes for individuals with substance misuse disorder and lower stigma among providers and health care professionals.
2. Public Awareness Campaigns: there is some evidence that contact-based campaigns that focus on positive stories and recovery outcomes can help reduce stigma in target populations
Evidence-Based Prevention Interventions
Prevention of problematic drug use is a key aspect of addressing substance misuse at a community level. Prevention science is based on the idea that negative health outcomes can be prevented by reducing or eliminating risk factors and enhancing protective factors in individuals and their environments.1 Prevention focuses primarily on youth and young people, as evidence suggests that youth are more at risk to develop problematic drug use and that substance misuse tends to emerge in mid-to-late adolescence.2 Research indicates that youth who first use alcohol at ages 11-14 have a much higher chance of problematic substance use later in life than those who first use alcohol after age 14.3
1 J. David Hawkins et al., "Promoting Science-based Prevention in Communities." Addictive Behaviors 27, no. 6 (2002). 2 Mary Ellen O'Connell et al., "Preventing Mental, Emotional, and Behavioral Disorders Among Young People." 2009. 3 D.J. Dewit, "Age at First Alcohol Use: A Risk Factor for the Development of Alcohol Disorders." American Journal of Psychiatry 157, no. 5 (2000).
138
Furthermore, prevention is a cost-effective way to address substance misuse: one study estimated an $18 savings for every $1 spent on school-based prevention programming if such programming were implementing nationwide.4
Based on the literature, the following evidence-based prevention interventions can be effective at lowering the rate of substance misuse in target groups: (*some evidence; **substantial evidence; ***very substantial evidence)
• School-based youth prevention programs** • Community-based prevention programs* • Programs that seek to lower instances of adverse childhood experiences** • Prescription drug monitoring programs* • Prescribing guidelines* • Co-prescribing naloxone with opioids*
1. School-Based Youth Prevention Programs
Prevention programs tend to be designed as either universal (targeting everyone in a group), selective (targeting groups with higher risk of biological, psychological, or social risk factors), or indicated (targeting individuals who show signs of risk for SUD).5 Numerous school-based prevention programs have been studied and evaluated as effective, and the Surgeon General has compiled a list of over 40 such evidence-based programs.6 Importantly, the “Just Say No” approach to drug education and prevention popularized with the DARE program has proven ineffective.7 A SAMHSA cost-benefit evaluation of school based prevention approaches found that if effective prevention programs were implemented nationally, substance abuse initiation would decline for 1.5 million youth and be delayed by 2 years on average.8 Some of the factors that contribute to a successful youth prevention program include:
- Aligned to the developmental stages of the intended target group:9 o Elementary school students: most effective programs teach basic skills, problem solving, self-control,
don’t address substance use directly (drawing attention to substance use in high risk groups can even be harmful)
o Early adolescents: social norm education (norm-focused discussions, correcting misperceptions of peers’ substance use, use of role models), enhancement of basic skills like self-control and decision making. Preparing students for peer pressure was not found to be effective.
o Middle adolescents: difficult age to conduct prevention programming – few effective universal prevention programs documented. High risk groups can benefit from skills around coping with stress and anxiety.
o Late adolescents: refusal skills, health education on substance use interference in personal goals, basic skills training in self-control, problem solving and decision making. Involvement of parents can have positive outcomes. High risk groups do not benefit from refusal skills training.
4 Ted R. Miller et al., "Substance Abuse Prevention Dollars and Cents: A Cost-Benefit Analysis." National Criminal Justice Reference Service, 2008. 5 SAMHSA. "Risk and Protective Factors." August 13, 2018. 6 U.S. Department of Health and Human Services (HHS), Office of the Surgeon General, Facing Addiction in America: The Surgeon General’s Report on Alcohol, Drugs, and Health. Washington, DC: HHS, November 2016. 7 S.T. Ennett et al., "How Effective Is Drug Abuse Resistance Education? A Meta-analysis of Project DARE Outcome Evaluations." American Journal of Public Health 84, no. 9 (1994). 8 Ted R. Miller et al., "Substance Abuse Prevention Dollars and Cents: A Cost-Benefit Analysis." National Criminal Justice Reference Service, 2008. 9 Simone A. Onrust et al., Roy "School-based Programmes to Reduce and Prevent Substance Use in Different Age Groups: What Works for Whom? Systematic Review and Meta-regression Analysis." Clinical Psychology Review 44 (March 2016).
139
- Interactive delivery methods – students practice refusing drugs, roleplay situations in a multimodal approach10 - Peer led or facilitated training11 - Program is based around both preventive and risk factors of the target group12 - Life skills approach is effective13- some examples include the Life Skills Training Program,14 Unplugged
Program,15 and the Good Behavior Game16
2. Community-Based Prevention Programs
“Until we provide people with an alternative source of dopamine, in the form of family connections, meaningful work and a sense of purpose in their lives, the problem of addiction will continue to grow,” - Dr. Anna Lembke, medical director of addiction medicine at Stanford.17
A public health model of community-based prevention of disease or disorder involves assessing the risk and protective factors associated with the problem in the target group, and then designing interventions to lower risk and strengthen protective factors.18 There is growing evidence to suggest that SUD arises in large part from a lack of community connection, safety, and development (among other factors). This idea is summarized well by the concept that the opposite of addiction is not sobriety, the opposite of addiction is connection.19 To combat this, community-based prevention efforts have arisen that focus on community development, fostering connections, and giving individuals outlets to enhance overall SUD protective factors. That said, there is less evidence of effectiveness for community prevention interventions than school-based prevention programming. More controlled research is needed in this area.
The Icelandic Model: In the 1990s, Iceland identified a serious adolescent substance misuse problem countrywide. To address it, the country implemented a radical, evidence-based strategy based on the concept of addiction and problematic substance misuse as a problem of social disconnection rather than drug availability. This idea of substance use has recently gained traction and is beginning to reshape substance misuse prevention efforts worldwide. In Iceland, the holistic prevention program lowered alcohol, tobacco, and marijuana use significantly between 1997 and 2007. The Icelandic approach is based around research that indicates that peer group affiliation (having friends who use or don’t use substances), time spent with family, feeling cared about at school, and type of recreational activities available
10 Ibid. 11 W. Hollingworth et al., "Reducing Smoking in Adolescents: Cost-Effectiveness Results From the Cluster Randomized ASSIST (A Stop Smoking In Schools Trial)." Nicotine & Tobacco Research 14, no. 2 (December 16, 2011); DC Gottfredson et al., "Characteristics of Effective School-based Substance Abuse Prevention." Prevention Science 4, no. 1 (March 2003). 12 Mary Ellen O'Connell et al., "Preventing Mental, Emotional, and Behavioral Disorders Among Young People." 2009. 13 F Faggiano et al., "School-based Prevention for Illicit Drugs Use." Cochrane Database of Systematic Reviews, April 18, 2005; David R. Foxcroft et al., "Universal School-based Prevention Programs for Alcohol Misuse in Young People." Cochrane Database of Systematic Reviews 5 (May 11, 2011); Mahdi Moshki et al., "Effect of Life Skills Training on Drug Abuse Preventive Behaviors among University Students." International Journal of Preventive Medicine 5, no. 5 (May 2014). 14 R. Spoth et al., "Longitudinal Effects of Universal Preventive Intervention on Prescription Drug Misuse: Three Randomized Controlled Trials with Late Adolescents and Young Adults." American Journal of Public Health 103, no. 4 (April 2013). 15 Roman Gabrhelik et al., "“Unplugged”: A School-based Randomized Control Trial to Prevent and Reduce Adolescent Substance Use in the Czech Republic." Drug and Alcohol Dependence 124, no. 1-2 (July 2012). 16 "Good Behavior Game." American Institutes for Research. October 19, 2016. 17 Josh Katz, "How a Police Chief, a Governor and a Sociologist Would Spend $100 Billion to Solve the Opioid Crisis." The New York Times. February 14, 2018. 18 Hawkins, J. David, Richard F. Catalano, and Michael W. Arthur. "Promoting Science-based Prevention in Communities." Addictive Behaviors 27, no. 6 (2002). 19 Bruce K. Alexander et al., "Effect of Early and Later Colony Housing on Oral Ingestion of Morphine in Rats." Pharmacology Biochemistry and Behavior 15, no. 4 (October 1981); Hari, Johann. "Everything You Think You Know About Addiction Is Wrong." TedTalks. June 2015.
140
to young people are the strongest predictors of youth substance use. The country provided life-skills training and comprehensive extracurricular activities for all children, facilitated strong links between parents and teachers, gave parenting classes focused on maximizing time spent with kids, and passed laws making it illegal to buy tobacco under the age of 18, alcohol under the age of 20, banning tobacco and alcohol advertising, and prohibiting children aged 13-16 from being outside after 10:00pm in winter and 12:00am in summer.20
Key Best-Practices for Prevention Programming from the Icelandic Model:
- Minimize unsupervised adolescent time periods - Create more and more frequent structured activity - Focus on delaying the onset of “first drink” - Base efforts at the community level - Get buy-in of elected officials - Involve parents at home, school, and community levels
3. Adverse Childhood Experiences (ACEs)
ACEs21 are defined by SAMHSA as “stressful or traumatic events… related to the development and prevalence of a wide range of health problems throughout a person’s lifespan, including those associated with substance misuse.” The list of ACEs include: physical abuse, sexual abuse, emotional abuse, physical neglect, intimate partner violence, mother treated violently, substance misuse within the household, household mental illness, parental separation or divorce, and incarcerated household member.22 Prevention of substance misuse must take into account that individuals with several (typically understood as four or more) ACEs have higher risk factors for developing a SUD, and must also seek to prevent children from having adverse experiences in the first place. The presence of ACEs is associated with higher smoking rates,23 mental and substance use disorders,24 alcohol misuse,25 and nonmedical prescription drug use among youth.26 ACEs are also related to homelessness both directly and indirectly, with childhood adversity substantially overrepresented in homeless populations.27 This is significant, because homeless populations experience higher rates of SUD than the general population – problematic alcohol use can be 6-7 times more prevalent in homeless populations, and the rate of SUD in homeless populations has been estimated at 30% (compared to about 5-7% in the general adult population).28 Importantly, research has found that positive, caring student-teacher relationships are inversely associated with nonmedical prescription drug use, and recommends training
20 I.D. Sigfusdottir et al., "Substance Use Prevention for Adolescents: The Icelandic Model." Health Promotion International 24, no. 1 (December 11, 2008); Alfgeir Logi Kristjansson et al., "Adolescent Substance Use, Parental Monitoring, and Leisure-time Activities: 12-year Outcomes of Primary Prevention in Iceland." Preventive Medicine 51, no. 2 (August 2010). 21 "About the CDC-Kaiser ACE Study." Centers for Disease Control and Prevention. June 14, 2016. 22 SAMHSA. "Adverse Childhood Experiences." September 7, 2018. 23 Earl S. Ford et al., "Adverse Childhood Experiences and Smoking Status in Five States." Preventive Medicine 53, no. 3 (September 2011). 24 Namkee G. Choi et al., "Association of Adverse Childhood Experiences with Lifetime Mental and Substance Use Disorders among Men and Women Aged 50 Years." International Psychogeriatrics 29, no. 03 (2016). 25 Shanta R. Dube et al., "Adverse Childhood Experiences and Personal Alcohol Abuse as an Adult." Addictive Behaviors 27, no. 5 (September/October 2002). 26 Myriam Forster et al., "Associations between Adverse Childhood Experiences, Student-teacher Relationships, and Non-medical Use of Prescription Medications among Adolescents." Addictive Behaviors 68 (May 2017). 27 Roos, Leslie E et al. “Relationship between adverse childhood experiences and homelessness and the impact of axis I and II disorders” American journal of public health vol. 103 Suppl 2 (2013): S275-81. 28 Hwang, S W. “Homelessness and health” CMAJ : Canadian Medical Association journal = journal de l'Association medicale canadienne vol. 164,2 (2001): 229-33.
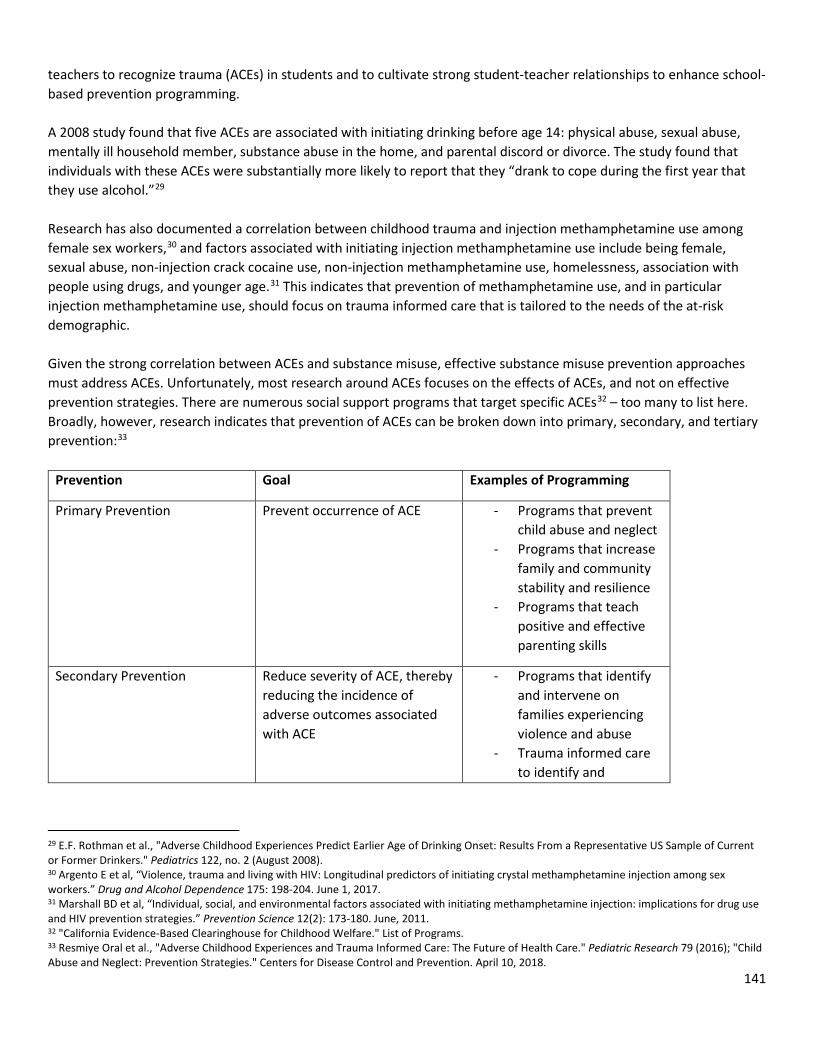
141
teachers to recognize trauma (ACEs) in students and to cultivate strong student-teacher relationships to enhance school-based prevention programming. A 2008 study found that five ACEs are associated with initiating drinking before age 14: physical abuse, sexual abuse, mentally ill household member, substance abuse in the home, and parental discord or divorce. The study found that individuals with these ACEs were substantially more likely to report that they “drank to cope during the first year that they use alcohol.”29 Research has also documented a correlation between childhood trauma and injection methamphetamine use among female sex workers,30 and factors associated with initiating injection methamphetamine use include being female, sexual abuse, non-injection crack cocaine use, non-injection methamphetamine use, homelessness, association with people using drugs, and younger age.31 This indicates that prevention of methamphetamine use, and in particular injection methamphetamine use, should focus on trauma informed care that is tailored to the needs of the at-risk demographic. Given the strong correlation between ACEs and substance misuse, effective substance misuse prevention approaches must address ACEs. Unfortunately, most research around ACEs focuses on the effects of ACEs, and not on effective prevention strategies. There are numerous social support programs that target specific ACEs32 – too many to list here. Broadly, however, research indicates that prevention of ACEs can be broken down into primary, secondary, and tertiary prevention:33
Prevention Goal Examples of Programming
Primary Prevention Prevent occurrence of ACE - Programs that prevent child abuse and neglect
- Programs that increase family and community stability and resilience
- Programs that teach positive and effective parenting skills
Secondary Prevention Reduce severity of ACE, thereby reducing the incidence of adverse outcomes associated with ACE
- Programs that identify and intervene on families experiencing violence and abuse
- Trauma informed care to identify and
29 E.F. Rothman et al., "Adverse Childhood Experiences Predict Earlier Age of Drinking Onset: Results From a Representative US Sample of Current or Former Drinkers." Pediatrics 122, no. 2 (August 2008). 30 Argento E et al, “Violence, trauma and living with HIV: Longitudinal predictors of initiating crystal methamphetamine injection among sex workers.” Drug and Alcohol Dependence 175: 198-204. June 1, 2017. 31 Marshall BD et al, “Individual, social, and environmental factors associated with initiating methamphetamine injection: implications for drug use and HIV prevention strategies.” Prevention Science 12(2): 173-180. June, 2011. 32 "California Evidence-Based Clearinghouse for Childhood Welfare." List of Programs. 33 Resmiye Oral et al., "Adverse Childhood Experiences and Trauma Informed Care: The Future of Health Care." Pediatric Research 79 (2016); "Child Abuse and Neglect: Prevention Strategies." Centers for Disease Control and Prevention. April 10, 2018.
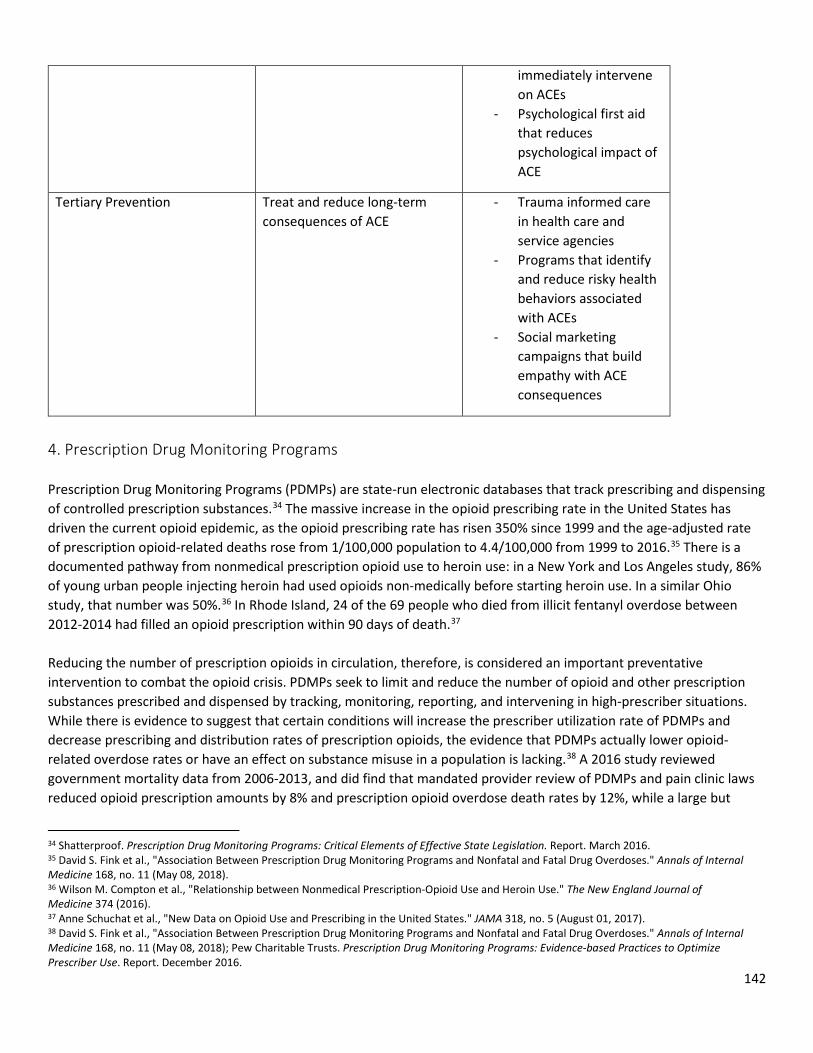
142
immediately intervene on ACEs
- Psychological first aid that reduces psychological impact of ACE
Tertiary Prevention Treat and reduce long-term consequences of ACE
- Trauma informed care in health care and service agencies
- Programs that identify and reduce risky health behaviors associated with ACEs
- Social marketing campaigns that build empathy with ACE consequences
4. Prescription Drug Monitoring Programs Prescription Drug Monitoring Programs (PDMPs) are state-run electronic databases that track prescribing and dispensing of controlled prescription substances.34 The massive increase in the opioid prescribing rate in the United States has driven the current opioid epidemic, as the opioid prescribing rate has risen 350% since 1999 and the age-adjusted rate of prescription opioid-related deaths rose from 1/100,000 population to 4.4/100,000 from 1999 to 2016.35 There is a documented pathway from nonmedical prescription opioid use to heroin use: in a New York and Los Angeles study, 86% of young urban people injecting heroin had used opioids non-medically before starting heroin use. In a similar Ohio study, that number was 50%.36 In Rhode Island, 24 of the 69 people who died from illicit fentanyl overdose between 2012-2014 had filled an opioid prescription within 90 days of death.37 Reducing the number of prescription opioids in circulation, therefore, is considered an important preventative intervention to combat the opioid crisis. PDMPs seek to limit and reduce the number of opioid and other prescription substances prescribed and dispensed by tracking, monitoring, reporting, and intervening in high-prescriber situations. While there is evidence to suggest that certain conditions will increase the prescriber utilization rate of PDMPs and decrease prescribing and distribution rates of prescription opioids, the evidence that PDMPs actually lower opioid-related overdose rates or have an effect on substance misuse in a population is lacking.38 A 2016 study reviewed government mortality data from 2006-2013, and did find that mandated provider review of PDMPs and pain clinic laws reduced opioid prescription amounts by 8% and prescription opioid overdose death rates by 12%, while a large but
34 Shatterproof. Prescription Drug Monitoring Programs: Critical Elements of Effective State Legislation. Report. March 2016. 35 David S. Fink et al., "Association Between Prescription Drug Monitoring Programs and Nonfatal and Fatal Drug Overdoses." Annals of Internal Medicine 168, no. 11 (May 08, 2018). 36 Wilson M. Compton et al., "Relationship between Nonmedical Prescription-Opioid Use and Heroin Use." The New England Journal of Medicine 374 (2016). 37 Anne Schuchat et al., "New Data on Opioid Use and Prescribing in the United States." JAMA 318, no. 5 (August 01, 2017). 38 David S. Fink et al., "Association Between Prescription Drug Monitoring Programs and Nonfatal and Fatal Drug Overdoses." Annals of Internal Medicine 168, no. 11 (May 08, 2018); Pew Charitable Trusts. Prescription Drug Monitoring Programs: Evidence-based Practices to Optimize Prescriber Use. Report. December 2016.
143
statistically insignificant reduction in heroin overdoses also occurred after implementation of these policies.39 However there is limited evidence from other studies to confirm these findings. Conversely, some research suggests that the implementation of a PDMP may have no effect on or even increase opioid-related overdoses because it may force individuals with OUD to move to heroin use (which is unregulated and increasingly laced with fentanyl), as the availability of prescription opioids declines. A study on policy interventions found that the use of PDMPs could result in 42,300 more opioid-related overdose deaths over the next 10 years for this reason.40 Perhaps in line with this analysis, Kentucky (the first state to implement mandated PDMP use), saw a decrease in opioid prescribing rates, doctor shopping, and prescription overdose hospitalizations after the PDMP mandate was enacted, but heroin treatment admissions also rose during the same period.41 Moreover, the current opioid crisis is being driven not by prescription opioids, but by illicit synthetic opioids like fentanyl. Recent research suggests that any policies that lower prescription opioid misuse will only decrease overall opioid mortality nationwide by 3-5%, because most opioid overdoses today are caused by synthetic opioids.42 That said, there is evidence that indicates that PDMPs improve clinical decision-making, reduce doctor shopping and diversion of controlled substances,43 reduce opioid prescription rates, and in some cases result in increased buprenorphine prescriptions.44 Since their creation in the 2000s, important data has also been gathered regarding prescribing trends and habits. For example, the Oregon PDMP found that 4% of prescribers issued 60% of all controlled substance prescriptions in the state.45 Similar trends have been noted in other states, providing an important data point in the analysis of the opioid epidemic. Evidence-based best practices to increase the effectiveness of PDMPs include:46
- Mandated Use: requiring a prescriber to view a patient’s PDMP data before writing a prescription for a controlled substance.
- Streamlined Enrollment: minimize the time and difficulty of applying to access the PDMP (for prescribers, delegates, and distributors). One possible way to do this is registration that occurs automatically in conjunction with license registration.
- Delegation: allowing prescribers to designate someone on staff to access the PDMP on their behalf (one of the greatest prescriber-cited barriers to use of PDMP is time: in one survey, 58% of physicians said the data from the PDMP is too time-consuming to retrieve).
o In Kentucky, the law allows PDMP reports to be included in patient charts, allowing physicians and delegates to receive data prior to scheduled visits. This may help improve workflow.
- Proactive unsolicited reports: send PDMP reports to prescribers, dispensers, law enforcement, and regulators to flag harmful drug use or prescribing activity based on the data.
39 Deborah Dowell et al., "Mandatory Provider Review And Pain Clinic Laws Reduce The Amounts Of Opioids Prescribed And Overdose Death Rates." Health Affairs 35, no. 10 (October 2016). 40 Allison L. Pitt et al., "Modeling Health Benefits and Harms of Public Policy Responses to the US Opioid Epidemic." American Journal of Public Health 108, no. 10 (October 1, 2018). 41 Johns Hopkins Bloomberg School of Public Health. The Prescription Opioid Epidemic: An Evidence-Based Approach. Report. November 2015. 42 Chen Q, Larochelle MR, Weaver DT, et al. Prevention of Prescription Opioid Misuse and Projected Overdose Deaths in the United States. JAMA Netw Open. 2019;2(2). 43 "Briefing on PDMP Effectiveness." Prescription Drug Monitoring Program Center of Excellence at Brandeis, September 2014. 44 Shatterproof. Prescription Drug Monitoring Programs: Critical Elements of Effective State Legislation. Report. March 2016. 45 Johns Hopkins Bloomberg School of Public Health. The Prescription Opioid Epidemic: An Evidence-Based Approach. Report. November 2015. 46 Shatterproof. Prescription Drug Monitoring Programs: Critical Elements of Effective State Legislation. Report. March 2016; Pew Charitable Trusts. Prescription Drug Monitoring Programs: Evidence-based Practices to Optimize Prescriber Use. Report. December 2016; Johns Hopkins Bloomberg School of Public Health. The Prescription Opioid Epidemic: An Evidence-Based Approach. Report. November 2015; "Briefing on PDMP Effectiveness." Prescription Drug Monitoring Program Center of Excellence at Brandeis, September 2014.
144
- Interstate sharing: increase PDMP data sharing between states so that prescribers can see prescriptions dispensed in other states.
- Proactive analysis and investigation of PDMP data: states should require PDMPs to regularly analyze data and send out reports regarding patients, prescribers, and dispensers. Professional licensure boards should receive reports of questionable prescribing practices and investigate immediately.
o In California, when a prescriber signs on to his/her PDMP account, the dashboard lists his/her patients who are currently being prescribed high doses of opioids, have been prescribed opioids for more than 90 days, and/or have obtained opioid prescriptions from six or more prescribers or pharmacies in the last year. This eases the burden of use for prescribers and makes relevant data easily available.
- Include Schedule IV drugs in the PDMP: Most prescription opioids are listed as Schedule II or III drugs, but benzodiazepines are Schedule IV drugs and can have very harmful effects if taken together with opioid medications.47 In the US, 31% of prescription drug-related overdose deaths in 2013 involved benzodiazepines. A 2015 study in Britain found that 50% of veterans who died of a prescription drug overdose between 2004-2009 were prescribed opioids and benzodiazepines at the same time.48
- Data Timeliness and Accessibility: require dispensers to upload information to the PDMP in a regular, timely manner (daily, weekly, or bi-weekly. Previous standard is monthly). Provide regularly available PDMP data to the general public in a user-friendly electronic format, with all confidentiality best practices in place.
- Prescriber training: train prescribers, delegates, and dispensers on how to use and access the PDMP. - Link PDMP to Treatment: require PDMPs to provide prescribers and dispensers with links to pain and substance
misuse professionals and treatment centers, including guidelines for intervening with persons with possible SUD.
5. Prescribing Guidelines and Prescriber Education Approximately 11% of American adults experience chronic pain and 3-4% are prescribed opioids on a long-term basis. Opioids are effective at relieving short-term pain (defined as 12 weeks or less) but evidence does not suggest that opioids are effective for relieving chronic pain.49 A 2011 study found that higher opioid doses were associated with increased risk of opioid overdose death, and the rate of unintentional overdose death in the US between 1999-2007 increased sharply due largely to increases in prescription opioid overdoses.50 The opioid prescription rate in the US peaked in 2010, after climbing steadily since 1999, and has been decreasing since 2010. The 2017 rate, however, is still higher than the rate in 1999, and amounts prescribed vary greatly across counties.51 In 2016 the CDC released its “CDC Guideline for Prescribing Opioids for Chronic Pain” to respond to this crisis.52 The guideline is comprised of 12 recommendations intended to improve communication about the benefits and risks of using opioids for chronic pain, improve the safety and effectiveness of pain treatment, and reduce the risks associated with long-term opioid therapy.53
47 Centers for Disease Control and Prevention. "Guideline for Prescribing Opioids for Chronic Pain." March 18, 2016. 48 Shatterproof. Prescription Drug Monitoring Programs: Critical Elements of Effective State Legislation. Report. March 2016. 49 Deborah Dowell et al., "CDC Guideline for Prescribing Opioids for Chronic Pain—United States, 2016." JAMA 315, no. 15 (April 19, 2016). 50 Amy SB Bohnert et al., "Association Between Opioid Prescribing Patterns and Opioid Overdose-Related Deaths." JAMA 305, no. 13 (April 06, 2011). 51 Gery P. Guy et al., "Vital Signs: Changes in Opioid Prescribing in the United States, 2006–2015." MMWR. Morbidity and Mortality Weekly Report 66, no. 26 (July 07, 2017); Centers for Disease Control and Prevention. “2018 Annual Surveillance Report of Drug-Related Risks and Outcomes — United States.” Surveillance Special Report. Centers for Disease Control and Prevention, U.S. Department of Health and Human Services. Published August 31, 2018. 52 Centers for Disease Control and Prevention. "Guideline for Prescribing Opioids for Chronic Pain." March 18, 2016. 53 Deborah Dowell et al., "CDC Guideline for Prescribing Opioids for Chronic Pain—United States, 2016." JAMA 315, no. 15 (April 19, 2016).
145
There is not enough evidence to determine whether the CDC’s Guideline has had an effect on prescription opioid overdoses, overdose deaths, or the opioid epidemic at large. The opioid prescribing rate declined by 19.1% between 2016-2017,54 but it is not clear how much of this can be attributed to the new prescribing guidelines (PDMP usage also increased during this time period, for example). Moreover, one study identified chronic pain prescribing restrictions as a policy intervention that could, over the next 10 years, actually increase opioid-related overdose deaths by 3,800 because it may drive people with OUD to misuse illicit, unregulated substances.55 That said, the CDC strongly recommends that its evidence-based Guideline is utilized by prescribers. Although the Guideline may not reduce opioid overdose deaths, it may help to lower the number of opioid prescriptions written and inform a more holistic approach to pain treatment. Some research suggests that a guideline like the CDC’s can affect prescriber behavior: there is evidence that explicit clinical guidelines can improve clinical practice when introduced in the context of rigorous evaluations.56 The American College of Physicians, American Academy of Family Practice, and the American Medical Association have introduced programs to help educate physicians about opioid prescribing. In 2016, the US Surgeon General sent a letter to all licensed physicians with updated resources on safe prescribing, managing pain, and linking patients to addiction treatment.57 The President’s Commission on Combating Drug Addiction and the Opioid Crisis recommended in 2017 that the Administration develop a model training program of continuing medical education on screening for substance use and mental health status, and that the DEA should require all prescribers to participate in an approved continuing medical education program on opioid prescribing before receiving relicensing.58 However, it is not clear whether increasing efforts to promote continued prescriber education on opioids has had a measurable effect on rates of OUD or overdoses.59
6. Co-prescribing naloxone with opioids Naloxone is an opioid receptor antagonist that quickly reverses the effects of an opioid. It restores normal breathing and can save someone from overdosing on an opioid substance. Naloxone, also known by its brand name Narcan, can be administered as a nasal spray or injection, and has no known adverse reactions. Naloxone has no effect on a person without opioids in their system.60 Naloxone access is a key part of harm reduction (addressed in the following section), but it can also be used on the prevention side. A survey of chronic pain patients receiving prescription opioids found that almost 20% had experienced an overdose, yet only 3% reported having a naloxone prescription or being trained to deliver naloxone.61 Co-prescribing naloxone with opioid prescriptions is being evaluated as a possible way to prevent prescription opioid overdoses. While there is not much research on co-prescribing, a 2016 study found that providing naloxone in a primary care setting may
54 Centers for Disease Control and Prevention. “2018 Annual Surveillance Report of Drug-Related Risks and Outcomes — United States.” Surveillance Special Report. Centers for Disease Control and Prevention, U.S. Department of Health and Human Services. Published August 31, 2018. 55 Allison L. Pitt et al., "Modeling Health Benefits and Harms of Public Policy Responses to the US Opioid Epidemic." American Journal of Public Health 108, no. 10 (October 1, 2018). 56 Jeremy M. Grimshaw et al., "Effect of Clinical Guidelines on Medical Practice." The Lancet 342, no. 8883 (November 27, 1993). 57 Anne Schuchat et al., "New Data on Opioid Use and Prescribing in the United States." JAMA 318, no. 5 (August 01, 2017). 58 The President's Commission on Combatting Drug Addiction and the Opioid Crisis. November 1, 2017. 59 Todd Kerensky et al., "Opioid Overdose Prevention and Naloxone Rescue Kits: What We Know and What We Don’t Know." Addiction Science & Clinical Practice 12, no. 4 (January 07, 2017). 60 National Institute on Drug Abuse. "Naloxone for Opioid Overdose: Life-Saving Science." March 2017. 61 Ibid.; Kelly E. Dunn et al., "Opioid Overdose Experience, Risk Behaviors, and Knowledge in Drug Users from a Rural Versus an Urban Setting." Journal of Substance Abuse Treatment 71 (December 2016).
146
reduce opioid-related adverse events. The study found that patients prescribed naloxone had 47% fewer opioid-related emergency department visits per month in the six months after receiving the prescription, compared with patients who did not receive a naloxone prescription.62 Despite limited evidence on co-prescribing, the American Medical Association Opioid Task Force recommends co-prescribing naloxone with opioids to reduce the risks of overdose.63 The CDC, in its “2016 Guideline for Prescribing Opioids for Chronic Pain,” recommends considering naloxone prescription and overdose education for patients and household members of patients prescribed opioids under certain conditions.64 At the same time, prescriptions for naloxone have increased: one study found a 1170% increase in naloxone dispensing from American retail pharmacies between 2013 and 2015.65 While research on co-prescribing is scarce, research on the benefits of naloxone is more robust. For example, when states pass laws that allow laypeople to administer naloxone or provide immunity from prosecution to people calling 911 for medical assistance (see Good Samaritan Laws section), opioid-related deaths decrease between 9-11%.66 There is also evidence that overdose education and naloxone distribution have resulted in reductions in community level opioid overdose death rates.67 This suggests that, while co-prescribing naloxone does not have a strong evidence base, it may still provide positive effects as it distributes more naloxone into communities, particularly into households where prescription opioids are present and related overdoses common.68
62 PO Coffin et al., "Nonrandomized Intervention Study of Naloxone Coprescription for Primary Care Patients Receiving Long-Term Opioid Therapy for Pain." Annals of Internal Medicine 165, no. 4 (August 16, 2016). 63 American Medical Association Opioid Task Force. Help save Lives: Co-prescribe Naloxone to Patients at Risk of Overdose. Report. August 2017. 64 Centers for Disease Control and Prevention. "Guideline for Prescribing Opioids for Chronic Pain." March 18, 2016. 65 CM Jones et al., "Increase in Naloxone Prescriptions Dispensed in US Retail Pharmacies Since 2013." American Journal of Public Health 106, no. 4 (April 2016): 689-90. 66 Daniel Rees et al., "With a Little Help from My Friends: The Effects of Naloxone Access and Good Samaritan Laws on Opioid-Related Deaths." National Bureau of Economic Research, February 2017. 67 Todd Kerensky et al., "Opioid Overdose Prevention and Naloxone Rescue Kits: What We Know and What We Don’t Know." Addiction Science & Clinical Practice 12, no. 4 (January 07, 2017). 68 Ibid.
147
Evidence-Based Harm Reduction Interventions Harm reduction is a set of strategies aimed at reducing the negative consequences of using drugs, keeping people who use drugs as safe as possible, and promoting the rights of people who use drugs.69 Harm reduction as a policy is growing in popularity as the evidence base to support its efficacy grows, however there are still those who believe that harm reduction enables drug use. For example, in 2016 Maine’s Governor Paul LePage vetoed a bill that would have allowed pharmacists to dispense naloxone without a prescription, and in July of 2018 he vetoed several more harm reduction bills, including one that would have funded syringe services programs.70 In his veto of the naloxone law, Governor LePage said, “Naloxone does not truly save lives; it merely extends them until the next overdose. Creating a situation where an addict has a heroin needle in one hand and a shot of naloxone in the other produces a sense of normalcy and security around heroin use that serves only to perpetuate the cycle of addiction.”71 Those who believe that harm reduction interventions enable drug use essentially believe that providing safer ways to use drugs will both encourage drug use and endanger lives. Evidence suggests that neither of these arguments are true. In fact, research indicates that harm reduction programs and policy can reduce overdose deaths and connect people to treatment services. Based on the literature, the following evidence-based harm reduction interventions can be effective at mitigating the harms of substance misuse in target groups: (*some evidence; **substantial evidence; ***very substantial evidence)
• Naloxone Access** • Good Samaritan Laws* • Syringe Services Programs*** • Safe Drug Disposal* • Safe Syringe & Needle Disposal** • Safe Injection Sites* • Fentanyl Test Strips*
1. Naloxone Access Naloxone, as stated above, is an opioid antagonist that quickly reverses the effects of an opioid-related overdose. It has no effect on individuals with no opioids in their system, and can be injected or administered via a nasal spray. Naloxone is often referred to by its brand name Narcan. A 2018 study of the effects of naloxone distribution in British Columbia during an outbreak of fentanyl-related overdoses found that for every 64 take home naloxone kits distributed, 7 deaths were averted.72 Naloxone Access Best Practices:
- Targeted distribution: Provide naloxone to people at high risk of overdose or witnessing overdose. The people who most often witness and respond to overdoses are people who use drugs. A 2010 nation-wide study found that 80% of overdose reversals with naloxone in the US were carried out by people who use drugs.73 Another target group is family members of people who use drugs or are at risk of overdose: a review of data in
69 "Principles of Harm Reduction." Harm Reduction Coalition. https://harmreduction.org/about-us/principles-of-harm-reduction/. 70 McCauley, Lauren. "Despite Rising Death Toll, LePage Vetoes Opioid Treatment Bills." Maine Beacon. July 9, 2018. 71 Miller, Kevin. "LePage Vetoes Bill Aimed at Increasing Access to Overdose Antidote." Press Herald. April 20, 2016. 72 Irvine, Michael A et al. “Distribution of take-home opioid antagonist kits during synthetic opioids epidemic in British Columbia, Canada: a modeling study.” The Lancet 3, no. 5 (May 1, 2018). 73 Jennifer J. Carroll et al., "Evidence-Based Strategies for Preventing Opioid Overdose: What’s Working in the United States." Centers for Disease Control and Prevention, 2018.
148
Massachusetts found that family members of people at risk of overdose were responsible for 20% of all recorded naloxone rescue attempts among all those in an Overdose Education and Naloxone Distribution training program.74 Getting naloxone to these targeted groups, especially in rural areas where emergency services are not readily available, is key to preventing overdose deaths.75
76
- Education, particularly in rural areas: Ensure that people who use drugs and first responders are well informed as to the potential effects and actions of naloxone. Comfort with carrying and administering naloxone is crucial. Evidence indicates that prescribers who received naloxone training reported greater comfort, more knowledge, and less fear of the consequences of dispensing naloxone.77 A 2013 Massachusetts study found that opioid overdose death rates were reduced in communities that received overdose education and naloxone distribution (OEND) compared to communities that did not receive OEND.78 Additionally, research has found that naloxone is less often administered by EMT-basics (compared to EMT-intermediates), who are more common in rural areas. The same study found that while the odds of naloxone administration are 23% higher in rural areas than urban areas, the opioid overdose rate is 45% higher in rural areas.79 Rural areas are farther from emergency services, less likely to have highly trained EMTs, and experience higher levels of opioid related overdoses. Positively, studies show that brief education (5-10 minutes) on naloxone is sufficient to improve comfort and facility in recognizing and managing overdose.80 Naloxone access and comfort of use in these areas is crucial.
- Law Enforcement Access: ensure that law enforcement is trained in naloxone administration and opioid
overdoses, and that officers carry naloxone at all times. A 2015 study in Ohio found that increases in the number
74 Sarah M. Bagley et al., "Expanding Access to Naloxone for Family Members: The Massachusetts Experience." Drug and Alcohol Review 37, no. 4 (April 20, 2017). 75 Jennifer J Carroll et al., "Evidence-Based Strategies for Preventing Opioid Overdose: What’s Working in the United States." Centers for Disease Control and Prevention, 2018. 76 Su Albert et al., "Project Lazarus: Community-Based Overdose Prevention in Rural North Carolina." Pain Medicine 12, no. 2 (June 13, 2011). 77Alyssa M. Peckham et al., "A Survey of Prescribersʼ Attitudes, Knowledge, Comfort, and Fear of Consequences Related to an Opioid Overdose Education and Naloxone Distribution Program." Journal of Public Health Management and Practice 24, no. 4 (July/August 2018). 78 A. Y. Walley et al., "Opioid Overdose Rates and Implementation of Overdose Education and Nasal Naloxone Distribution in Massachusetts: Interrupted Time Series Analysis." Bmj 346 (January 31, 2013). 79 Mark Faul et al., "Disparity in Naloxone Administration by Emergency Medical Service Providers and the Burden of Drug Overdose in US Rural Communities." American Journal of Public Health 105, no. S3 (July 2015). 80 Emily Behar et al., "Brief Overdose Education Is Sufficient for Naloxone Distribution to Opioid Users." Drug and Alcohol Dependence 148 (March 1, 2015).
Project Lazarus, a nonprofit in North Carolina, analyzed data on overdoses and community knowledge regarding overdoses and came up with the following list of “naloxone priority groups” to target in their overdose education and naloxone distribution program:
• Recent medical care for opioid poisoning/intoxication/overdose • Suspected or confirmed history of heroin or nonmedical opioid use • High-dose opioid prescription (≥100 mg/day morphine equivalence) • Any methadone prescription for opioid naive patient • Recent release from jail or prison • Recent release from mandatory abstinence program or drug detox program • Enrolled in methadone or buprenorphine detox/maintenance (for addiction or pain) • Any opioid prescription and known or suspected • Remoteness from or difficulty accessing medical care • Voluntary patient request
149
of law enforcement officers trained and carrying naloxone was associated with a reduction in opioid overdose deaths and an increased rate of survival among opioid overdose victims in the surrounding area.81
- Treatment Centers and Criminal Justice Settings: Individuals who have just left a treatment center or
incarceration are at high risk for opioid related overdose, because their tolerance for opioids are low, and the risk that they will take a large dose of an opioid is high. People are more than 25 times more likely to overdose in the first weeks following cessation of treatment than during treatment.82 There is limited research on the effect on overdose rates of take home naloxone programs for people leaving correctional facilities, and most of the research that exists has been done on male prisoners.83 That said, there are some general evidence-based recommendations to increase effectiveness of such naloxone interventions. Universal (rather than opt-in) naloxone distribution and training programs within treatment centers and criminal justice institutions are suggested to help prevent overdoses. Close friends and family of the individuals in treatment or incarceration should also be trained in naloxone administration.
o Scotland’s National Naloxone Programme started providing naloxone at release to inmates in 2011 and was associated with a 36% reduction in the proportion of opioid-related deaths occurring within the first four weeks following release from prison.84
o At New York’s Rikers Island correctional facility, a program trained individuals visiting detainees in naloxone administration and overdose prevention. Over a six month period, 1406 visitors were trained and 8 trainees reported using naloxone to reverse an overdose. Importantly, 35% of naloxone kits were distributed to neighborhoods with above average opioid overdose rates, and 22% of kits were distributed to neighborhoods with the highest rates of residents re-entering after incarceration.85 This is an important case study, as it suggests a novel way to effectively distribute naloxone to several target populations.
- Naloxone Access Laws: Naloxone access laws make it easier to obtain naloxone by expanding how the
medication can be distributed beyond traditional prescriptions. All 50 states allow medical providers to prescribe naloxone to patients, however some people at risk of opioid related overdose do not have contact with a health professional. Naloxone access laws expand who can prescribe or distribute naloxone, who can receive naloxone prescriptions, and legal protections for those that carry and/or use naloxone.86 There is limited research on the effectiveness of naloxone access laws at reducing overdoses, although one study found that adoption of naloxone access laws are associated with a 9-11% reduction in opioid related deaths, and two or more years after the adoption of such a law there is a 21% decrease in opioid-related deaths.87 Additionally, qualitative studies indicate that people who use drugs often fear that they may be arrested for possession of
81 Jessica Rando et al., "Intranasal Naloxone Administration by Police First Responders Is Associated with Decreased Opioid Overdose Deaths." The American Journal of Emergency Medicine 33, no. 9 (September 2015). 82 Marina Davoli et al., "Risk of Fatal Overdose during and after Specialist Drug Treatment: The VEdeTTE Study, a National Multi-site Prospective Cohort Study." Addiction 102, no. 12 (December 2007). 83 Meredith Horton et al., "A Mapping Review of Take-home Naloxone for People Released from Correctional Settings." International Journal of Drug Policy 46 (May 2, 2017). 84 Sheila M. Bird et al., Effectiveness of Scotland’s National Naloxone Programme for Reducing Opioid-related Deaths: A before (2006-10) versus after (2011-13) Comparison." Addiction 111, no. 5 (May 2016). 85 Meredith Horton et al., "A Mapping Review of Take-home Naloxone for People Released from Correctional Settings." International Journal of Drug Policy 46 (May 2, 2017). 86 SAMHSA's Center Center for the Application of Prevention Technologies. Preventing the Consequences of Opioid Overdose: Understanding Naloxone Access Laws. Report. January 20, 2018. 87 Daniel Rees et al., "With a Little Help from My Friends: The Effects of Naloxone Access and Good Samaritan Laws on Opioid-Related Deaths." National Bureau of Economic Research, February 2017.
150
naloxone if they call 911.88 Therefore, naloxone access laws may assuage fear of arrest and increase the rate of naloxone use and emergency services contact. There is almost no research on specific provisions of naloxone access laws which may impact effectiveness. Limited evidence exists for the following two provisions to naloxone access laws:
o Expand pharmaceutical distribution of naloxone through standing orders, protocol orders, collaborative practice agreements, or pharmacist prescriptive authority.89 In Rhode Island in 2014-2015, pharmacies dispensed 572 naloxone kits via collaborative practice agreements, which amounted to 25% of all naloxone distributed in the state. Experts believe this contributed to a much smaller increase in opioid overdose deaths (7) in this time period compared to surrounding states like Massachusetts and New Hampshire (40).90
o Civil, criminal and disciplinary immunity for medical professionals who prescribe naloxone and individuals who administer it. Removing criminal liability for possession of naloxone is associated with a 13% reduction in opioid-related deaths, and the effects of naloxone access laws that do not have protection from criminal liability have effects that are statistically indistinguishable from zero.91
- Insurance reimbursement and Medicaid: a generally recognized best practice for increasing access to naloxone is to require insurers to reimburse for naloxone prescriptions and third party naloxone prescriptions, and to include all forms of naloxone on a state’s Medicaid preferred drugs list.92 Although no research examines whether these specific interventions have a direct effect on substance misuse or overdose rates, evidence does suggest that increased access to naloxone will reduce opioid-related overdoses. Ensuring that individuals have financial access to naloxone, which is rapidly becoming more expensive,93 is an important policy intervention.
2. Good Samaritan Laws Good Samaritan Laws (GSLs) are policies that provide legal protections for people who contact emergency assistance in the event of a drug overdose. GSLs can include criminal, civil, and disciplinary immunity for various crimes related to drug possession.94 As of June 2018, 46 states and the District of Columbia had some kind of drug overdose GSL in place.95 The effects of GSLs on substance misuse and opioid-related overdoses have been measured in one study, which indicated that while the effects of GSLs on opioid-related deaths are often large and consistently negative, they are not statistically significant at conventional levels. That said, the study found that adoption of a GSL is associated with a 13%
88 Ibid.; Romina Gastonet al., "Can We Prevent Drug Related Deaths by Training Opioid Users to Recognise and Manage Overdoses?" Harm Reduction Journal 6, no. 26 (September 25, 2009). 89 Daniel Kim et al., "Expanded Access to Naloxone: Options for Critical Response to the Epidemic of Opioid Overdose Mortality." American Journal of Public Health 99, no. 3 (March 2009). 90 SAMHSA's Center Center for the Application of Prevention Technologies. Preventing the Consequences of Opioid Overdose: Understanding Naloxone Access Laws. Report. January 20, 2018. 91 Daniel Rees et al., "With a Little Help from My Friends: The Effects of Naloxone Access and Good Samaritan Laws on Opioid-Related Deaths." National Bureau of Economic Research, February 2017. 92 Naomi Seiler et al., Medicaid Reimbursement for Take-home Naloxone: A Toolkit for Advocates. Report; The National Center on Addiction and Substance Abuse. Ending the Opioid Crisis: A Practical Guide for State Policymakers. Report. October 2017. 93 Ravi Gupta et al.,. "The Rising Price of Naloxone — Risks to Efforts to Stem Overdose Deaths." New England Journal of Medicine 375 (December 08, 2016). 94 SAMHSA's Center for the Application of Prevention Technologies. Preventing the Consequences of Opioid Overdose: Understanding 911 Good Samaritan Laws. Report. November 8, 2017. 95 MonQcle. "PDAPS | Prescription Drug Abuse Policy System." MonQcle - Good Samaritan Overdose Prevention Laws. July 1, 2018.
151
decrease in opioid-related deaths not involving heroin. The study also found evidence that GSLs reduce opioid-related deaths involving alcohol.96 Awareness is important for GSLs to have an effect in overdose situations. A study in New York City found that awareness of the GSL in place statistically increased the likelihood that a bystander would call 911 in the event of an overdose. Another study of police officers found that trainings and informational tools on GSLs provided to police officers quickly increased the officers’ familiarity and comfort with overdose response and helped them to overcome their jurisdictional and liability concerns.97 Qualitative studies have documented that fear of being arrested or harassed by police often discourages people using drugs from calling 911 in the event of an overdose.98 Combined with the evidence that adoption of GSLs do not increase recreational use of prescription painkillers (no moral hazard attached to GSL as an intervention), this suggests that policies which enact and expand GSLs can be considered a best practice to reduce opioid overdoses.
3. Syringe Services Programs Syringe services programs (formerly known as syringe or needle exchanges) are community-based programs that provide free access to syringes and needles and facilitate safe disposal of used syringes and needles. Syringe services programs in the United States were banned from receiving federal funding from 1988-2009. This ban was reinstated by Congress in 2011 and lifted again in 2016, meaning that federal funding for syringe services programs has been legal for a total of four out of the last 30 years.99 There is ample evidence to indicate that syringe services programs have two important, proven harm reduction impacts: reduction in needle/syringe sharing100 which results in reduced HIV and HCV infection rates, and offering a diversion point to SUD treatment services. In addition, syringe services programs offer other health related services, like access to other drug paraphernalia, Narcan, sharps containers, testing for disease, and other medical treatment. While there is little evidence to draw any conclusions about the effectiveness of these additional services, they are a notably positive “side-effect” of syringe services programming. One important additional service provided by many syringe services programs is access to condoms and safe sex education. This is extremely important, as drug use – and in particular methamphetamine use – is associated with sexually risky behavior.101 In fact some studies indicate that methamphetamine use can increase the risk of syphilis infection and incidence of HIV infection in men who have sex with men.102
96 Daniel Rees et al., "With a Little Help from My Friends: The Effects of Naloxone Access and Good Samaritan Laws on Opioid-Related Deaths." National Bureau of Economic Research, February 2017. 97 Jennifer J. Carroll et al., "Evidence-Based Strategies for Preventing Opioid Overdose: What’s Working in the United States." Centers for Disease Control and Prevention, 2018. 98 Daniel Rees et al., "With a Little Help from My Friends: The Effects of Naloxone Access and Good Samaritan Laws on Opioid-Related Deaths." National Bureau of Economic Research, February 2017. 99 National Minority AIDS Council. Federal Funding for Syringe Exchange: An Issue Brief. Report; Audie, Cornish. "Congress Ends Ban On Federal Funding For Needle Exchange Programs." NPR All Things Considered, January 8, 2016. 100 MJ Bravo et al., "Access to Sterile Syringes among Young Drug Injectors in Madrid and Barcelona and Its Association with Risk Behaviour." Gaceta Sanitaria 22, no. 2 (March/April 2008); Lei Zhang et al., "Ability to Access Community-based Needle-syringe Programs and Injecting Behaviors among Drug Users: A Cross-sectional Study in Hunan Province, China." Harm Reduction Journal10, no. 8 (May 7, 2013). 101 Zule WA et al, “Methamphetamine use and risky sexual behaviors during heterosexual encounters.” Sexually Transmitted Diseases 34, no. 9 (September 2007). 102 Centers for Disease Control and Prevention Morbidity and Mortality Weekly Report, Methamphetamine use and HIV risk behaviors among heterosexual men – preliminary results from five northern California counties, December 2001-November 2003. CDC 55, no. 10 (March 2006).
152
HIV and HCV prevention: Multiple studies103 indicate that syringe services programs can reduce the transmission of blood-borne viruses like HIV and HCV among people who inject drugs, without increasing illicit drug use.104 Research suggests that virtually all people who inject drugs will carry a serious disease after five years of drug use.105 This underscores the importance of providing syringe services to people who inject drugs, and in particular to younger people and/or people who have recently started injecting drugs, to prevent infection. Importantly, while there is substantial evidence that syringe services programs lower HIV transmission rates, there is less evidence that these programs reduce HCV transmission.106 More research is needed in this area. A survey of HIV prevalence in 103 cities across 24 countries, 16 of which had syringe services available, found that the cities in countries with syringe services had declining rates of HIV seroprevalence (18.6% mean annual decline), while HIV seroprevalence increased in locations without syringe services (8.1% mean annual increase).107 A 2004 World Health Organization (WHO) review found that in the absence of syringe services programs, there were no documented cases of declining HIV incidence in a population with high HIV prevalence.108 A notable 1999 study looked at the closure of a needle exchange in Connecticut after it was blamed for the city’s drug problem. After the closure of the needle exchange, significant increases in syringe reuse and sharing occurred, although surveys of outdoor drug-use areas found no decrease (or increase) in the volume of discarded syringes.109 A recent Stanford study of policy interventions to reduce opioid related deaths in the US calculated that expanding syringe supply programs could result in 5,900 less deaths from opioids over the next 10 years.110 A 2015 study found that about 18% of syringe injections are covered by syringe supply programs in the United States, and concluded that this represents a “tremendous unmet need for clean syringes among people who inject drugs.”111 Additionally, evidence clearly indicates that syringe services programs are incredibly cost-effective interventions, as the cost of treating an individual with HIV or HCV is much higher than the cost of maintaining a syringe services program.112 Diversion to treatment: Individuals who participate in syringe services programs are five times more likely to enter drug treatment and 3.5 times more likely to stop injecting compared to those who don’t participate in these programs.113 A 1999 study found that “needle exchange programs” represent an important bridge to drug misuse treatment for HIV-infected and uninfected people who use injection drugs.114
103 Abu S Abdul-Quader et al., "Effectiveness of Structural-Level Needle/Syringe Programs to Reduce HCV and HIV Infection Among People Who Inject Drugs: A Systematic Review." AIDS and Behavior 17, no. 9 (November 2013); J-PAL North America U.S. Health Care Delivery Initiative Policy Brief. 2016. “Strategies to Combat the Opioid Epidemic: What We Know and Where to Go from Here.” Cambridge, MA: Abdul Latif Jameel Poverty Action Lab, North America. 104 R Heimer, "Syringe Exchange Programs: Lowering the Transmission of Syringe-borne Diseases and beyond." Public Health Rep 113 (June 1998). 105 Babor, Thomas F et al. Drug Policy and the Public Good. Vol. 2. Oxford, UK: Oxford University Press, 2018, pg. 62. 106 Norah Palmateer et al., "Evidence for the Effectiveness of Sterile Injecting Equipment Provision in Preventing Hepatitis C and Human Immunodeficiency Virus Transmission among Injecting Drug Users: A Review of Reviews." Addiction 105, no. 5 (March 2, 2010). 107 Alex Wodak et al., Effectiveness of Sterile Needle and Syringe Programming in Reducing HIV/AIDS Among Injecting Drug Users. Report. World Health Organization. 2004. 108 Ibid. 109 RS Broadhead et al., "The Impact of a Needle Exchange's Closure." Public Health Reports 114, no. 5 (September/October 1999). 110 Allison L. Pitt et al., "Modeling Health Benefits and Harms of Public Policy Responses to the US Opioid Epidemic." American Journal of Public Health 108, no. 10 (October 1, 2018). 111 Trang Quynh Nguyen et al., "Syringe Exchange in the United States: A National Level Economic Evaluation of Hypothetical Increases in Investment." AIDS and Behavior 18, no. 11 (November 15, 2014). 112 Ibid. 113 Elaine Hyshka et al.,"Needle Exchange and the HIV Epidemic in Vancouver: Lessons Learned from 15 Years of Research." International Journal of Drug Policy 23, no. 4 (July 2012); Jisoo A. Kwon et al., "Estimating the Cost-effectiveness of Needle-syringe Programs in Australia." AIDS 26, no. 17 (November 13, 2012). 114 Steffanie A. Strathdee et al., "Needle-exchange Attendance and Health Care Utilization Promote Entry into Detoxification." Journal of Urban Health 76, no. 4 (December 1999).
153
Evidence-based factors that increase effectiveness of syringe services:
- Provide an adequate supply of sterile needs (not one-for-one exchanges or limits on daily dispersal)115 - Provide syringes in as many different ways and locations as possible: pharmacy, syringe services location, syringe
services mobile location, syringe vending machine. While the research is thin, there is evidence to suggest that pharmacy and vending machine syringe services attract different populations, and that a community that offers every different kind of syringe services program will more effectively reach the entire population of people injecting drugs.116
- Keep syringe services locations open for as many hours during the day as possible. Evidence shows that “daylight operating hours” for these programs can create barriers to accessing the services for many people who inject drugs.117
- When establishing or expanding syringe services programs, the needs and concerns of the local community are addressed. Research suggests that fear of repercussions and lack of leadership are two of the greatest barriers to implementing syringe services programs. Combined efforts of activists, public officials, researchers, and community coalitions are needed to establish community-accepted syringe services programming.118
4. Safe Drug Disposal One common way that prescription drugs end up being used for non-medical purposes is through diversion. A 2016 study estimated that about 20% of adults with an opioid prescription self-reported sharing those opioids with another person, most frequently for helping to manage pain.119 Research at a four-year college in the Midwestern United States found that the leading source of prescription opioids among undergraduates (used for nonmedical reasons) were friends and parents.120 A 2009 pilot assessment of people who misuse prescription drugs in Delaware found that the primary sources of prescription drugs on the street were the elderly, patients with pain, doctor shoppers, and pill brokers who work with these groups.121 Proper disposal of prescription drugs in the United States is rare, and surveys indicate that many prescribed drugs are not used.122 This reality has led to interventions which seek to promote safe prescription drug disposal of unused medication. This is usually done through “drug take back” events123 run by a local organization, government, or police department, static drug disposal receptacles, and drug deactivation kits that can be distributed to the public.
115 Ricky N. Bluthenthal et al., "Examination of the Association between Syringe Exchange Program (SEP) Dispensation Policy and SEP Client-level Syringe Coverage among Injection Drug Users," Addiction 102, no. 4 (April 2007). 116 Alex Wodak et al., Effectiveness of Sterile Needle and Syringe Programming in Reducing HIV/AIDS Among Injecting Drug Users. Report. World Health Organization. 2004. 117 Elaine Hyshka et al., "Needle Exchange and the HIV Epidemic in Vancouver: Lessons Learned from 15 Years of Research." International Journal of Drug Policy 23, no. 4 (July 2012). 118 Moher Downing et al., "Whats Community Got to Do With It? Implementation Models of Syringe Exchange Programs," AIDS Education and Prevention 17, no. 1 (February 2005). 119 National Academies of Sciences, Engineering, and Medicine et al., Pain Management and the Opioid Epidemic, report (Washington, DC: National Academies Press, 2013). 120 Sean Esteban Mccabe et al., "Motives, Diversion and Routes of Administration Associated with Nonmedical Use of Prescription Opioids," Addictive Behaviors 32, no. 3 (March 2007). 121 James A. Inciardi et al., "Prescription Opioid Abuse and Diversion in an Urban Community: The Results of an Ultrarapid Assessment," Pain Medicine 10, no. 3 (April 1, 2009). 122 National Academies of Sciences, Engineering, and Medicine et al., Pain Management and the Opioid Epidemic, report (Washington, DC: National Academies Press, 2013). 123 Benedikt Fischer and Yoko Murphy, "Policy Measures for Prescription Opioids and Harms: Enough to Protect Public Health? A Comment on Yanovitzky (2016) and Piper Et Al. (2016)," Journal of Studies on Alcohol and Drugs 77, no. 4 (June 28, 2016).
154
Drug Take Back Events: This is a popular intervention, and while the literature suggests that this kind of event raises awareness124 about prescription drug diversion and does result in substantial amounts of substances being returned, the amounts are actually a very small proportion of the total prescription drugs dispersed,125 and there is no evidence that drug take back events effect overdose rates.126 One analysis concluded: “these programs will not solve or even make a substantial dent in the prescription opioid public health crisis.”127 However, another study found that the majority of donors to take back events in Appalachia traveled 10 miles or less to donate their substances, and concluded that perhaps implementing more frequent, more locally-based community take back events (with less travel required for community members) could increase the amount of drugs dispensed.128 Drug Disposal Boxes: Many communities have several permanent prescription drug disposal boxes located in places like police departments and pharmacies.129 Some studies indicate that these boxes can be an effective way to remove excess controlled substances from the community.130 However, a 2016 study in Kentucky found that drugs deposited in safe disposal boxes represent a “miniscule” proportion of the number of drugs dispensed.131 There is a lack of evidence to conclusively indicate whether drug disposal boxes are an effective intervention to combat the opioid crisis and substance misuse. Drug Deactivation Bags: Single use drug deactivation bags have become a popular method for promoting safe disposal of pharmaceuticals in the United States. While many states have begun handing out these bags for free, there is a lack of research on the effectiveness of this intervention. One study is underway in Ohio to evaluate use patterns and effectiveness of the bags.132 More research is needed to evaluate the impact and cost effectiveness of this intervention. International Programs with Recorded Successes:
- Australia’s Return Unwanted Medicines Project is a free, national project that collects unused medications at any pharmacy. A 2016 evaluation of the project concluded that it is effective at collecting dangerous medicines from the population.133
- France’s Cyclamed Program was started in 1993 and from 2007 has been collecting unused drugs as well as waste packaging materials. Cyclamed is funded by the pharmaceutical industry through a tax on boxes of medication distributed, and more than 22,000 pharmacies work with Cyclamed to help recover unused
124 Itzhak Yanovitzky, "The American Medicine Chest Challenge: Evaluation of a Drug Take-Back and Disposal Campaign," Journal of Studies on Alcohol and Drugs 77, no. 4 (July 2016). 125 Jeffrey A. Gray and Nicholas E. Hagemeier, "Prescription Drug Abuse and DEA-Sanctioned Drug Take-Back Events: Characteristics and Outcomes in Rural Appalachia," Archives of Internal Medicine172, no. 15 (August 13, 2012); Kathleen L. Egan et al., "From Dispensed to Disposed: Evaluating the Effectiveness of Disposal Programs through a Comparison with Prescription Drug Monitoring Program Data," The American Journal of Drug and Alcohol Abuse 43, no. 1 (January 2017). 126 National Academies of Sciences, Engineering, and Medicine et al., Pain Management and the Opioid Epidemic, report (Washington, DC: National Academies Press, 2013). 127 Benedikt Fischer and Yoko Murphy. "Policy Measures for Prescription Opioids and Harms: Enough to Protect Public Health? A Comment on Yanovitzky (2016) and Piper Et Al. (2016)." Journal of Studies on Alcohol and Drugs 77, no. 4 (June 28, 2016). 128 Jeffrey A. Gray and Nicholas E. Hagemeier. "Prescription Drug Abuse and DEA-Sanctioned Drug Take-Back Events: Characteristics and Outcomes in Rural Appalachia." Archives of Internal Medicine 172, no. 15 (August 13, 2012). 129 Kathleen L. Egan et al., "Diffusion of Medication Drop-boxes in North Carolina from 2007 to 2016," Addictive Behaviors 86 (November 2018). 130 Jeffrey Gray et al., "Prescription Disposal Practices: A 2-Year Ecological Study of Drug Drop Box Donations in Appalachia," American Journal of Public Health 105, no. 9 (September 2015). 131 Kathleen L. Egan et al., "From Dispensed to Disposed: Evaluating the Effectiveness of Disposal Programs through a Comparison with Prescription Drug Monitoring Program Data." The American Journal of Drug and Alcohol Abuse 43, no. 1 (January 2017). 132 Daniel Kelly. "Medical Students Lead Research into Opioid Disposal Bags." Wright State University. January 22, 2018. 133 Emilie Bettington et al., "Returning Unwanted Medicines to Pharmacies: Prescribing to Reduce Waste," Australian Prescriber 41, no. 3 (June 01, 2018).
155
medications. Research indicates that 75% of French people return some amount of unused medication, and 70% of people “always” return medication.134
- British Columbia’s Medications Return Program, started in 1996, is a province-wide governmental program which collects and disposes of unused and unwanted medications. More than 96% of pharmacies participate, and the program has seen increases in the number of drugs collected each year, specifically in residual pharmaceuticals. However, only 20% of residents use the program and 31% are aware that pharmacies collect unused medications.135
5. Safe Syringe & Needle Disposal (Sharps Disposal) “Sharps” is a medical term for devices with sharp points or edges that can puncture or cut skin, including hypodermic needles, syringes, and lancets. According to the Food and Drug Administration (FDA), approximately 3 billion needles are used each year in the United States.136 Safe disposal of used syringes and needles is important for reducing the instances of accidental injury (which can result in the transmission of disease, although this is rare) and general public health concerns. Evidence suggests that secure syringe drop boxes are an effective intervention to reduce discarded needles, and are economical. Studies show that drop boxes are associated with up to 98% reduction in discarded needles, with most significant reductions occurring within 200m of a drop box. Reductions were inversely proportional to walking distance from drop boxes.137 A study in the United States found that in the absence of syringe disposal opportunities, 95% of syringes used by people who inject drugs were disposed of improperly (as opposed to 13% in a city with needle disposal services).138 In the George Bush International airport, instances of accidental needle sticks declined sharply after the airport installed safe syringe disposal containers in all of its public bathrooms. In the ten years of program operation, there were just two needle-stick injuries among the airport workers.139 A New York program that installed community-based sharps disposal bins in every county collected over 2,600,000 syringes in 2006 and has been evaluated as an effective way to collect used needles.140
6. Safe Injection Sites Safe injection sites, also called supervised consumption sites, are locations where people who inject drugs can go to consume their drugs under supervision and with access to sanitary supplies and conditions. Staff do not assist with injection, but they ensure the safety of clients and can administer naloxone if someone experiences an overdose.141
134 National Academies of Sciences, Engineering, and Medicine et al., Pain Management and the Opioid Epidemic, report (Washington, DC: National Academies Press, 2013). 135 Edith Gagnon. Pharmaceutical Disposal Programs for the Public: A Canadian Perspective. Report. Health Canada Environmental Impact Initiative. November 6, 2009. 136 Megan Noonan, Allie VanSickle, and Jack Vest, Statewide Universal Needle Disposal, report, The Vermont Legislative Research Service, University of Vermont, March 4, 2015. 137 Luc De Montigny et al., "Assessing a Drop Box Programme: A Spatial Analysis of Discarded Needles," International Journal of Drug Policy 21, no. 3 (May 2010). 138 Hansel E. Tookes et al., "A Comparison of Syringe Disposal Practices among Injection Drug Users in a City with versus a City without Needle and Syringe Programs," Drug and Alcohol Dependence 123, no. 1-3 (June 1, 2012). 139 Julie E. Myers et al., "Safe Sharps Disposal in Public Restrooms, Bush Intercontinental Airport, Houston, Texas," Journal of the American Pharmaceutical Association (1996) 42, no. 6 (November/December 2002). 140 Susan J. Klein et al., "Increasing Safe Syringe Collection Sites in New York State," Public Health Reports 123, no. 4 (July/August 2008). 141 "Supervised Consumption Services." Drug Policy Alliance. http://www.drugpolicy.org/issues/supervised-consumption-services.
156
Safe injection sites are illegal in the United States. Several states are pushing to open locations,142 but the current Administration is strongly opposed, and the Department of Justice has forcefully said that it will take “swift and aggressive action” against cities and states that attempt to open a safe injection site.143 There is at least one secret, unauthorized safe injection site operating in the United States.144 Evidence indicates that safe injection sites can have significant benefits for people who use drugs, and in 2017, the American Medical Association announced its support for developing supervised injection facility pilot programs.145 Safe injection facilities exist in Canada, Europe, and Australia. Most of the research on safe injection sites has been conducted on two sites in Canada and Australia. Evidence from these studies finds that safe injection sites reduce overdose mortality (overdoses decreased by 35% in the area around the Vancouver safe injection site after its opening146) and increase access to drug treatment. Safe injection sites are associated with safer injection practices, but research does not indicate that these sites reduce instances of drug dealing or crime in surrounding areas.147 Evidence from the Vancouver safe injection site indicates that use of the facility by injecting drug users was followed by measurable reductions in public drug use and syringe sharing,148 as well as a reduction in publicly-discarded syringes and injection-related litter.149 A survey of 18 safe injection sites across Europe and Australia found that these facilities reduced public drug use, positioned people who use drugs in more direct contact with medical care and treatment, and reduced the volume of discarded drug-related litter.150
7. Fentanyl Test Strips Fentanyl is a synthetic opioid 50-100 times more potent than morphine. In 2016, the CDC reported that fentanyl and associated analogues were associated with over half of the opioid overdoses in ten states during the second half of that year.151 Many people who use drugs, and heroin in particular, do not know that their substance is contaminated with fentanyl (fentanyl is much cheaper than heroin, which incentivizes drug makers to mix it with more expensive substances). A study of heroin users in British Columbia found that of the 29% whose substances tested positive for fentanyl, 73% did not report knowingly using the drug.152 More alarmingly, a 2017 study in Vancouver found that 86% of all drug samples and 90% of heroin samples tested positive for fentanyl at a supervised injection site. 153 In Rhode Island,
142 Emily Mulder. "Seattle Plans First Safe Drug-injection Sites in the US." Al Jazeera, April 10, 2017; German Lopez. "Why Some US Cities Are Opening Safe Spaces for Injecting Heroin." Vox, September 27, 2018. 143 Rod J. Rosenstein, "Fight Drug Abuse, Don’t Subsidize It," The New York Times, August 27, 2018; Leo Beletsky et al., "The Law (and Politics) of Safe Injection Facilities in the United States," The Law (and Politics) of Safe Injection Facilities in the United States 98, no. 2 (February 1, 2008). 144 Amanda Holpuch, "Secret Supervised Drug Injection Facility Has Been Operating at US Site for Years," The Guardian, August 8, 2017. 145 Martha Bebinger, "AMA Endorses Trying Supervised Injection Facilities," WBUR, June 16, 2017. 146 Brandon Dl Marshall et al., "Reduction in Overdose Mortality after the Opening of North Americas First Medically Supervised Safer Injecting Facility: A Retrospective Population-based Study," The Lancet 377, no. 9775 (April 23-29, 2011). 147 Therese C. Fitzgerald, Establishment of a Pilot Medically Supervised Injection Facility in Massachusetts: Report of the Task Force on Opioid Therapy and Physician Communication, report, Massachusetts Medical Society, April 2017. 148 Evan Wood et al., "Service Uptake and Characteristics of Injection Drug Users Utilizing North America’s First Medically Supervised Safer Injecting Facility," American Journal of Public Health 96, no. 5 (May 1, 2006); Jennifer Ng, Christy Sutherland, and Michael R. Kolber, "Does Evidence Support Supervised Injection Sites?" Canadian Family Physician 63, no. 11 (November 2017). 149 Evan Wood et al., "Changes in Public Order after the Opening of a Medically Supervised Safer Injecting Facility for Illicit Injection Drug Users," Canadian Medical Association Journal 171, no. 7 (September 28, 2004). 150 Robert S. Broadhead et al., "Safer Injection Facilities in North America: Their Place in Public Policy and Health Initiatives," Journal of Drug Issues 32, no. 1 (January 1, 2002). 151 Fentanyl Overdose Reduction Checking Analysis Survey. Report. Johns Hopkins Bloomberg School of Public Health. February 6, 2018. 152 Ibid. 153 "86% of Drugs Checked at Insite Contain Fentanyl." Vancouver Coastal Health. August 31, 2016; Catherine R. Mcgowan et al., "Fentanyl Self-testing outside Supervised Injection Settings to Prevent Opioid Overdose: Do We Know Enough to Promote It?" International Journal of Drug Policy 58 (2018).
157
a study found that 50% of study participants who use illicit drugs encountered fentanyl in the past year (2016), and that these individuals routinely experienced non-fatal overdose. Interest among this population in risk mitigation strategies regarding fentanyl were high.154 Fentanyl test strips (FTS) allow people who use drugs to test their substances for the presence of fentanyl and its analogues. There is very limited research on FTS, although the studies that have been completed indicate some positive effects of FTS use. A 2017 study of people who use drugs and have been given FTS in North Carolina found that 81% of the sample used an FTS before consuming their drugs. When the FTS tested positive for fentanyl, an individual was five times more likely to report changes in drug use behavior, compared to those who received a negative result.155 The study at the Vancouver safe injection site revealed that a positive test result for fentanyl resulted in an individual being 10 times more likely to cut back on the amount of drugs consumed.156 There are some concerns about the ability of the test strips to detect a wide range of fentanyl analogues, and the fact that the test takes two to five minutes to work and requires drug dilution in water may deter individuals from using it.
There is limited evidence on the acceptability of FTS among people who use drugs.157 More research needs to be done in this area.
154 Jennifer J. Carroll et al., "Exposure to Fentanyl-contaminated Heroin and Overdose Risk among Illicit Opioid Users in Rhode Island: A Mixed Methods Study," International Journal of Drug Policy 46 (August 2017). 155 Nicholas C. Peiper et al., "Fentanyl Test Strips as an Opioid Overdose Prevention Strategy: Findings from a Syringe Services Program in the Southeastern United States," International Journal of Drug Policy, October 3, 2018. 156 "86% of Drugs Checked at Insite Contain Fentanyl." Vancouver Coastal Health. August 31, 2016; Catherine R. Mcgowan et al., "Fentanyl Self-testing outside Supervised Injection Settings to Prevent Opioid Overdose: Do We Know Enough to Promote It?" International Journal of Drug Policy 58 (2018). 157 Ibid.
158
Evidence-Based Intervention, Treatment & Recovery Interventions
Intervention, treatment, and recovery services for individuals with SUD are crucial steps in the path towards long-term recovery. Unfortunately, they are often some of the hardest services to adequately and efficiently provide. There is strong evidence that SBIRT interventions can help lower instances of risky substance use behavior and divert those with SUD towards treatment. Medically assisted treatment (MAT) for SUD also has a strong body of evidence behind it and has been proven to be more effective at treating substance misuse than detoxification or other non-medical treatment programs.
Based on the literature, the following evidence-based intervention, treatment, and recovery interventions can be effective at treating substance use disorder in target groups: (*some evidence; **substantial evidence; ***very substantial evidence)
• Screening, Brief Intervention and Referral to Treatment (SBIRT)** • Medically Assisted Treatment (MAT)*** • Drug Courts* • Housing First* • LGBTQ Tailored Treatment Services* • Cognitive Behavioral Therapy (CBT) and the Matrix Model* • Contingency Management* • Peer to Peer Services* • Exercise**
1. Screening, Brief Intervention and Referral to Treatment (SBIRT) Screening, Brief Intervention and Referral to Treatment (SBIRT) is a model of care designed to provide universal screening, detection, early intervention, and treatment for people with problematic substance use. SBIRT typically occurs within a health care setting.158 There is substantial evidence demonstrating the effectiveness of SBIRT in reducing risky alcohol consumption,159 but less evidence for its role in reducing risky drug use.160 A 2005 randomized controlled trial suggests that brief interventions can reduce cocaine and heroin use,161 and a brief intervention for regular amphetamine users found significant increases in the likelihood of abstinence from amphetamines among those receiving two or more treatment sessions.162 A study of youth aged 14-18 found brief interventions in the emergency department of a hospital resulted in a decrease in self-
158 Evidence Supporting the Effectiveness of an SBIRT. Report. SAMHSA. April 1, 2011. 159 M. Fleming and LB Maxwell, "Brief Intervention in Primary Care Settings. A Primary Treatment Method for At-risk, Problem, and Dependent Drinkers.," Alcohol Research & Health 23, no. 2 (1999); TH Bien, WR Miller, and JS Tonigan, "Brief Interventions for Alcohol Problems: A Review.," Addiction 88, no. 3 (March 1993); Evidence Supporting the Effectiveness of an SBIRT. Report. SAMHSA. April 1, 2011; Thomas F. Babor et al., "Screening, Brief Intervention, and Referral to Treatment (SBIRT)," Substance Abuse 28, no. 3 (2007). 160 Bertha K. Madras et al., "Screening, Brief Interventions, Referral to Treatment (SBIRT) for Illicit Drug and Alcohol Use at Multiple Healthcare Sites: Comparison at Intake and 6 Months Later," Drug and Alcohol Dependence 99, no. 1-3 (January 1, 2009); Jan Gryczynski et al., "The Relationship between Services Delivered and Substance Use Outcomes in New Mexico’s Screening, Brief Intervention, Referral and Treatment (SBIRT) Initiative," Drug and Alcohol Dependence 118, no. 2-3 (2011). 161 Judith Bernstein et al., "Brief Motivational Intervention at a Clinic Visit Reduces Cocaine and Heroin Use," Drug and Alcohol Dependence 77, no. 1 (January 7, 2005). 162 Amanda Baker et al., "Brief Cognitive Behavioural Interventions for Regular Amphetamine Users: A Step in the Right Direction," Addiction 100, no. 3 (March 2005).
159
reported aggression and alcohol consequences.163 In 2008, WHO did a randomized controlled trial across five countries (including the United States) to evaluate the effectiveness of brief interventions on illicit drug use. It found that the group receiving brief intervention had reduced total illicit substance involvement, cannabis involvement, and stimulant involvement. However, opioid-specific substance involvement was not affected.164 SBIRT best practices:165
- Brief: Screening should be short (5-10 minutes) - Universal: all patients should receive the screening - Comprehensive and strong linkages to specialty treatment exist: if an individual is identified as at risk of or
possessing SUD, links to treatment should be immediately available - One or more specific behaviors targeted in the screening: a 2006 study validated a single question screening test
that accurately identified drug use in primary care patients166 There is an emerging focus on implementing SBIRT in schools, and the President’s 2017 Commission on Combatting Drug Addiction and the Opioid Crisis recommended that the Department of Education collaborate with states to implement SBIRT in middle school, high school, and college.167 However, there is very limited evidence on the feasibility, implementation and effectiveness of SBIRT in this setting. One 2013 study of 248 students in two urban New York schools found that 42% of students reported substance use in the screening, compared to 28% in the school-wide anonymous survey. All but one of the positively screened students voluntarily accepted one or more brief intervention sessions.168 A 2013 study in New Mexico of over 600 students across 13 schools found that brief intervention resulted in significant reductions in frequency of drinking to intoxication and drug use, but not alcohol use generally.169 More research is needed in this area.
2. Medication Assisted Treatment (MAT) Medication Assisted Treatment (MAT) is a combination of psychosocial therapy and FDA-approved medication to treat OUD. There are three FDA-approved drugs that can be used in MAT (listed below), and each treats OUD differently. Methadone and buprenorphine are opioid agonists, meaning that they bind to the same opioid receptors in the brain that an opioid like heroin or morphine does, and trick the brain into thinking it is getting the misused drug. Methadone and buprenorphine do not cause a feeling of euphoria or high, withdrawal does not occur, and they can be safely taken for a lifetime. Naltrexone is an opioid antagonist, which means that it blocks opioid substances from binding to the opioid receptors in the brain, thereby blocking the euphoric and sedative effects of misused opioids. An individual must detox before beginning treatment with naltrexone. Like methadone and buprenorphine, naltrexone can be safely used for a lifetime.170 163 Walton MA, Chermack ST, Shope JT, et al. Effects of a Brief Intervention for Reducing Violence and Alcohol Misuse Among Adolescents: A Randomized Controlled Trial. JAMA. 2010; 304 (5). 164 Rachel Mumeniuk, Victoria Dennington, and Robert Ali. The Effectiveness of a Brief Intervention for Illicit Drugs Linked to the Alcohol, Smoking and Substance Involvement Screening Test (ASSIST) in Primary Health Care Settings: A Technical Report of Phase III Findings of the WHO ASSIST Randomized Controlled Trial. Report. WHO ASSIST Phase III Technical Report. 2008. 165 Evidence Supporting the Effectiveness of an SBIRT. Report. SAMHSA. April 1, 2011. 166 Smith PC, Schmidt SM, Allensworth-Davies D, Saitz R. A Single-Question Screening Test for Drug Use in Primary Care. Arch Intern Med. 2010;170(13). 167 The President's Commission on Combatting Drug Addiction and the Opioid Crisis. November 1, 2017. 168 Brenda L. Curtis, A. Thomas Mclellan, and Beth N. Gabellini, "Translating SBIRT to Public School Settings: An Initial Test of Feasibility," Journal of Substance Abuse Treatment 46, no. 1 (January 2014). 169 Shannon Gwin Mitchell et al., "Screening, Brief Intervention, and Referral to Treatment (SBIRT) for Substance Use in a School-Based Program: Services and Outcomes," American Journal on Addictions21, no. 1 (November 2012). 170 SAMHSA. "Medication and Counseling Treatment." US Department of Health and Human Services. September 28, 2015.
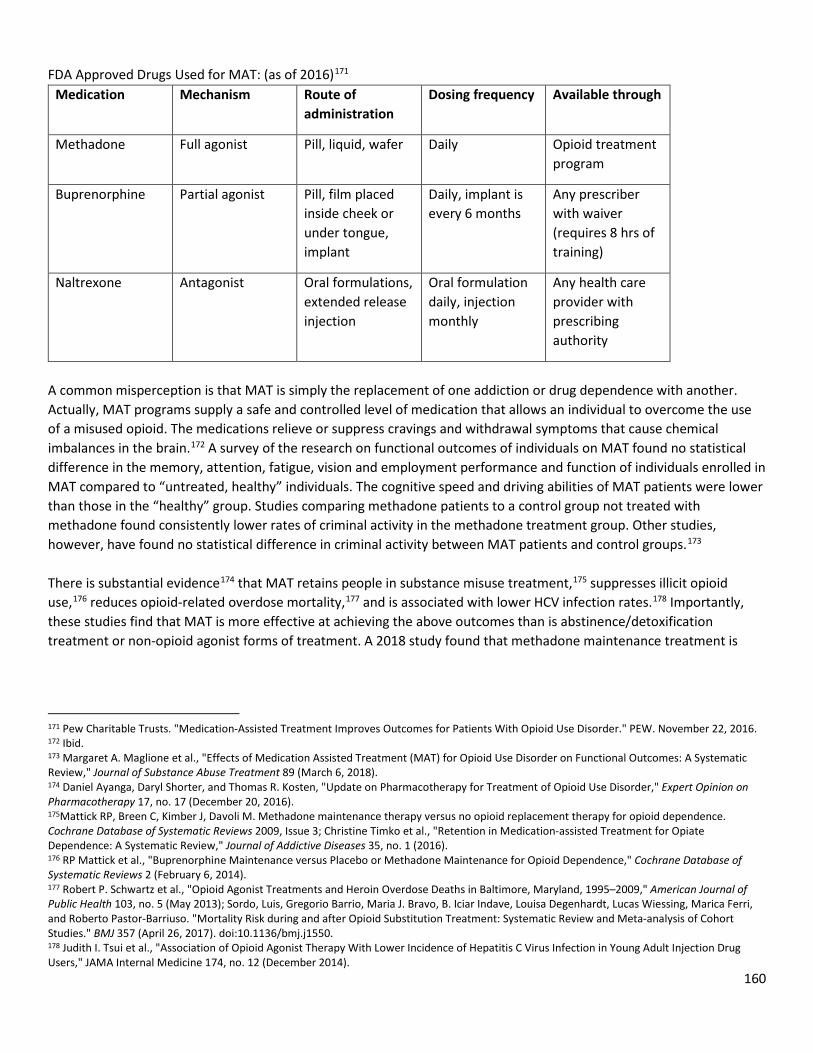
160
FDA Approved Drugs Used for MAT: (as of 2016)171 Medication Mechanism Route of
administration Dosing frequency Available through
Methadone Full agonist Pill, liquid, wafer Daily Opioid treatment program
Buprenorphine Partial agonist Pill, film placed inside cheek or under tongue, implant
Daily, implant is every 6 months
Any prescriber with waiver (requires 8 hrs of training)
Naltrexone Antagonist Oral formulations, extended release injection
Oral formulation daily, injection monthly
Any health care provider with prescribing authority
A common misperception is that MAT is simply the replacement of one addiction or drug dependence with another. Actually, MAT programs supply a safe and controlled level of medication that allows an individual to overcome the use of a misused opioid. The medications relieve or suppress cravings and withdrawal symptoms that cause chemical imbalances in the brain.172 A survey of the research on functional outcomes of individuals on MAT found no statistical difference in the memory, attention, fatigue, vision and employment performance and function of individuals enrolled in MAT compared to “untreated, healthy” individuals. The cognitive speed and driving abilities of MAT patients were lower than those in the “healthy” group. Studies comparing methadone patients to a control group not treated with methadone found consistently lower rates of criminal activity in the methadone treatment group. Other studies, however, have found no statistical difference in criminal activity between MAT patients and control groups.173 There is substantial evidence174 that MAT retains people in substance misuse treatment,175 suppresses illicit opioid use,176 reduces opioid-related overdose mortality,177 and is associated with lower HCV infection rates.178 Importantly, these studies find that MAT is more effective at achieving the above outcomes than is abstinence/detoxification treatment or non-opioid agonist forms of treatment. A 2018 study found that methadone maintenance treatment is
171 Pew Charitable Trusts. "Medication-Assisted Treatment Improves Outcomes for Patients With Opioid Use Disorder." PEW. November 22, 2016. 172 Ibid. 173 Margaret A. Maglione et al., "Effects of Medication Assisted Treatment (MAT) for Opioid Use Disorder on Functional Outcomes: A Systematic Review," Journal of Substance Abuse Treatment 89 (March 6, 2018). 174 Daniel Ayanga, Daryl Shorter, and Thomas R. Kosten, "Update on Pharmacotherapy for Treatment of Opioid Use Disorder," Expert Opinion on Pharmacotherapy 17, no. 17 (December 20, 2016). 175Mattick RP, Breen C, Kimber J, Davoli M. Methadone maintenance therapy versus no opioid replacement therapy for opioid dependence. Cochrane Database of Systematic Reviews 2009, Issue 3; Christine Timko et al., "Retention in Medication-assisted Treatment for Opiate Dependence: A Systematic Review," Journal of Addictive Diseases 35, no. 1 (2016). 176 RP Mattick et al., "Buprenorphine Maintenance versus Placebo or Methadone Maintenance for Opioid Dependence," Cochrane Database of Systematic Reviews 2 (February 6, 2014). 177 Robert P. Schwartz et al., "Opioid Agonist Treatments and Heroin Overdose Deaths in Baltimore, Maryland, 1995–2009," American Journal of Public Health 103, no. 5 (May 2013); Sordo, Luis, Gregorio Barrio, Maria J. Bravo, B. Iciar Indave, Louisa Degenhardt, Lucas Wiessing, Marica Ferri, and Roberto Pastor-Barriuso. "Mortality Risk during and after Opioid Substitution Treatment: Systematic Review and Meta-analysis of Cohort Studies." BMJ 357 (April 26, 2017). doi:10.1136/bmj.j1550. 178 Judith I. Tsui et al., "Association of Opioid Agonist Therapy With Lower Incidence of Hepatitis C Virus Infection in Young Adult Injection Drug Users," JAMA Internal Medicine 174, no. 12 (December 2014).
161
associated with success rates of 60-90%, compared to a 5-10% success rate for detoxification treatment without medication.179 Studies have found that there is a significant gap in the United States between the number of individuals suffering from SUD, and the number of MAT treatment facilities available to treat them. In the United States in 2012, the rate of opioid dependence was 891.9/100,000 people, while maximum potential buprenorphine treatment capacity was 420.3 and patients receiving methadone in opioid treatment programs was 119.9. 96% of states had opioid use disorder rates higher than their buprenorphine treatment capacity rates and 38 states had at least 75% of the opioid treatment programs operating at 80% capacity or more.180 In addition, privately funded substance treatment facilities often do not offer MAT as part of their treatment plan,181 and few prescribers are authorized to prescribe buprenorphine. A 2014 study found that 16% of psychiatrists and 3% of primary care physicians had obtained the DEA waiver that allows them to prescribe buprenorphine, meaning that most American counties had no physicians authorized to prescribe buprenorphine.182 Currently in the United States, 8% of physicians are approved to prescribe buprenorphine to 275 patients, and 20% are approved to prescribe to 100 patients. 72% of physicians are approved to prescribe to 30 patients.183 A 2017 survey-based study found that the main reasons that prescribers do not obtain a waiver to prescribe buprenorphine are: lack of belief in agonist treatment, lack of time for additional patients, and belief that reimbursement rates are insufficient.184 MAT for incarceration: implementing MAT in the prison system is an effective strategy to lower illicit opioid use, drug injection, and syringe sharing among prisoners.185 One study found an association between extended-release naltrexone treatment among male prisoners and significantly lower rates of opioid relapse after release from prison.186 Research also indicates that individuals who enter MAT programs while incarcerated are significantly more likely to continue treatment after release, compared to individuals who were referred to treatment at the time of release. Those who initiated MAT prior to release had lower levels of heroin use, opiate use, and injection drug use six months after release, compared to those referred to treatment upon release.187 MAT programs in prison can, along with retaining individuals in treatment after release and lowering rates of illicit drug use after release,188 significantly lower the risk of opioid related overdose death in the period immediately following release from incarceration.189 In 2016, Rhode Island started a comprehensive program in their corrections system that screens all individuals entering the system for opioid use disorder, offers MAT with all three FDA-approved drugs to medically eligible individuals, and
179 California Society of Addiction Medicine. "Methadone Treatment Issues." 2018. 180 Christopher M. Jones et al., "National and State Treatment Need and Capacity for Opioid Agonist Medication-Assisted Treatment," American Journal of Public Health 105, no. 8 (2015). 181 Hannah K. Knudsen, Amanda J. Abraham, and Paul M. Roman, "Adoption and Implementation of Medications in Addiction Treatment Programs," Journal of Addiction Medicine 5, no. 1 (March 2011). 182 R. A. Rosenblatt et al., "Geographic and Specialty Distribution of US Physicians Trained to Treat Opioid Use Disorder," The Annals of Family Medicine 13, no. 1 (January/February 2015). 183 SAMHSA. "Physician and Program Data." US Department of Health and Human Services. 184 Andrew S. Huhn and Kelly E. Dunn, "Why Aren’t Physicians Prescribing More Buprenorphine?" Journal of Substance Abuse Treatment 78 (July 2017). 185 Kate A. Dolan et al., "A Randomised Controlled Trial of Methadone Maintenance Treatment versus Wait List Control in an Australian Prison System," Drug and Alcohol Dependence 72, no. 1 (October 24, 2003). 186 Joshua D. Lee et al., "Opioid Treatment at Release from Jail Using Extended-release Naltrexone: A Pilot Proof-of-concept Randomized Effectiveness Trial," Addiction 110, no. 6 (June 2015). 187 Michelle Mckenzie et al., "A Randomized Trial of Methadone Initiation Prior to Release from Incarceration," Substance Abuse33, no. 1 (January 2012). 188 Timothy W. Kinlock et al., "A Randomized Clinical Trial of Methadone Maintenance for Prisoners: Results at 12 Months Postrelease," Journal of Substance Abuse Treatment 37, no. 3 (October 2009). 189 John Marsden et al., "Does Exposure to Opioid Substitution Treatment in Prison Reduce the Risk of Death after Release? A National Prospective Observational Study in England," Addiction112, no. 8 (2017).
162
provides linkages to care in the community after release from the corrections system. One year after the initiation of this program, statewide overdose deaths dropped by 12% and post incarceration overdose deaths dropped by 61%. Before the start of the program, from January-June 2016, 14.5% of people who died from an overdose in Rhode Island were recently incarcerated. After the start of the program, from January-June 2017, 5.7% of people who died of an overdose were recently incarcerated.190 Best Practices is MAT Programming for Incarcerated Individuals:
- Provide uninterrupted MAT services if an individual was receiving MAT before incarceration191 - Do not require forced withdrawal from methadone upon entry into the corrections system192 - Screen all individuals for SUD, offer all three forms of MAT medication, and initiate treatment in prison193
MAT in emergency rooms: The practice of initiating MAT in emergency rooms for patients with OUD is fairly new, and no best practices have been identified yet. However, there is evidence that “bridging the gap” between emergency services and long-term SUD treatment can increase the likelihood that an individual stays in treatment and reduce the use of illicit opioids.194 This means beginning MAT in the emergency room and sustaining the treatment until the patient can get off of a waiting list and into a treatment facility or program. A study out of the Yale School of Medicine found that emergency department initiated buprenorphine and naloxone treatment with continuation in primary care was associated with increased engagement in addiction treatment and reduced illicit opioid use during a two month interval compared to patients who received referral to treatment only or a brief intervention and referral only. However, no significant differences in illicit opioid use were observed at six or 12 months across the three groups.195
190 Traci C. Green et al., "Postincarceration Fatal Overdoses After Implementing Medications for Addiction Treatment in a Statewide Correctional System," JAMA Psychiatry 75, no. 4 (April 2018). 191 Shoshana V. Aronowitz and Jennifer Laurent, "Screaming Behind a Door," Journal of Correctional Health Care 22, no. 2 (April 2016). 192 Josiah D. Rich et al., "Methadone Continuation versus Forced Withdrawal on Incarceration in a Combined US Prison and Jail: A Randomised, Open-label Trial," The Lancet 386, no. 9991 (July 25, 2015). 193 Lauren Brinkley-Rubinstein et al., "Addressing Excess Risk of Overdose among Recently Incarcerated People in the USA: Harm Reduction Interventions in Correctional Settings," International Journal of Prisoner Health 13, no. 1 (March 13, 2017); Hilary Smith Connery, "Medication-Assisted Treatment of Opioid Use Disorder," Harvard Review of Psychiatry 23, no. 2 (March/April 2015). 194 Stacey C. Sigmon et al., "Interim Buprenorphine vs. Waiting List for Opioid Dependence," New England Journal of Medicine 375, no. 25 (December 22, 2016); Stacey C. Sigmon et al., "Bridging Waitlist Delays with Interim Buprenorphine Treatment: Initial Feasibility," Addictive Behaviors51 (December 2015). 195 G. D'Onofrio et al., "Emergency Department-Initiated Buprenorphine for Opioid Dependence with Continuation in Primary Care: Outcomes During and After Intervention," Journal of General Internal Medicine 32, no. 6 (June 2017).
Case Study: Vermont’s Hub & Spoke Model
In 2012, Vermont implemented its innovative “Hub & Spoke” model of treatment to address the opioid epidemic. The state was divided into five geographic regions, each with a “hub clinic” organized around an existing opioid treatment program. These hub clinics were given prescriptive authority to dispense buprenorphine as well as methadone. When a patient enters a hub (from a hospital, emergency department, residential program, corrections, etc.), they are assessed and the best MAT option is determined. After a patient is assessed to be stable on MAT, they are referred to a spoke provider (if a patient has no primary care provider, they are linked to a medical home for continuing MAT). Spokes are waivered physicians, and each spoke is supported by a MAT team of one registered nurse and a master’s level behavioral health provider per 100 Medicaid MAT patients. The MAT team takes care of the bulk of the work associated with treating a MAT patient.
Results: During the first three years of implementation, the number of patients served in hubs increased from 900 to 2800. Waiting list times decreased, and the Central and Northeast hubs eliminated their waiting lists by March 2016. By 2014, 10.5/1000 people were treated by the system, up from 3.7/1000 in 2012. The number of waivered physicians in Vermont increased 64% from 2012 to 2016. The Department of Vermont Health Access projected in March 2014 that for the 2000+ patients served by the Hub and Spoke model, the savings would be $6.7 million. Vermont now has the highest capacity for treating OUD in the country.
163
196 MAT for alcohol use disorder: Naltrexone is not only a treatment for OUD: it can also be used to treat alcohol use disorder. Research indicates that naltrexone is an effective treatment for alcohol addiction, particularly for more severe alcohol use disorders.197 That said, several studies have found naltrexone ineffective, including a randomized control trial sponsored by the Department of Veterans Affairs.198
3. Drug Courts Drug courts are specialized court programs that target criminal offenders with drug and alcohol misuse problems. The program is designed to divert individuals out of the traditional criminal justice system while preventing and treating substance misuse problems.199 The first drug court in the United States was started in 1989, in response to the increasing number of offenders with problematic substance use in the criminal justice system.200 As of December 2014, there were 3,057 drug courts in the United States and over 107,000 drug court participants. 44% of counties did not have an adult drug court. In urban adult drug courts, 22% of participants primarily misused heroin or pharmaceutical opioids; in suburban courts this number was 34% and in rural courts 31%.201 Drug courts have generally been evaluated as an effective intervention to reduce criminal recidivism in adult populations.202 Some studies indicate that drug courts can reduce substance misuse during and after court participation203 and increase the length of time that individuals spend in treatment.204 There is little research investigating the impact of drug courts on OUD or SUD broadly. More research is needed in this area to determine if drug courts can have a meaningful impact on substance misuse. The President’s 2017 Commission on Combatting Drug Addiction and the Opioid Crisis recommends that the Department of Justice establish federal drug courts within the federal district court system in all 93 federal judicial districts. The report also recommends that individuals with substance use disorder who violate probation terms with substance use should be diverted into drug court, rather than prison.205 In reviews of best practices within drug courts, the following patterns emerge:
196 John R. Brooklyn and Stacey C. Sigmon, "Vermont Hub-and-Spoke Model of Care for Opioid Use Disorder," Journal of Addiction Medicine 11, no. 4 (July/August 2017). 197 Pettinati, HM, CP O'Brien, AR Rabinowitz, SP Wortman, DW Oslin, KM Kampman, and CA Dackis. "The Status of Naltrexone in the Treatment of Alcohol Dependence: Specific Effects on Heavy Drinking." Journal of Clinical Psychopharmacology 26, no. 6 (December 2006); Anton, Rayomnd F. "Naltrexone for the Management of Alcohol Dependence." New England Journal of Medicine 359, no. 7 (August 14, 2008). 198 Ibid. 199 Drug Courts, report, Office of Justice Programs, US Department of Justice, May 2018, https://www.ncjrs.gov/pdffiles1/nij/238527.pdf. 200 Deborah Koetzle Shaffer, "Reconsidering Drug Court Effectiveness: A Meta-analytic Review," PhD diss., University of Cincinnati, 2006, abstract in Ohio Link, June 2006. 201 Douglas B. Marlow, Carolyn D. Hardin, and Carson L. Fox, Painting the Current Picture: A National Report on Drug Courts and Other Problem-Solving Courts in the United States, report, National Drug Court Institute, June 2016. 202 Steven Belenko, "Research on Drug Courts: A Critical Review," National Drug Court Institute Review 1, no. 1 (June 1998); Ojmarrh Mitchell et al., "Assessing the Effectiveness of Drug Courts on Recidivism: A Meta-analytic Review of Traditional and Non-traditional Drug Courts," Journal of Criminal Justice 40, no. 1 (January/February 2012); Amanda B. Cissner, Michael Rempel, and Allyson Walker Franklin, A Statewide Evaluation of New York's Adult Drug Courts: Identifying Which Policies Work Best, report, Center for Court Innovation, June 2013; Ojmarrh Mitchell et al., "Drug Courts Effects on Criminal Offending for Juveniles and Adults," Crime and Justice 8 (February 02, 2012). 203 Roger H. Peters and Mary R. Murrin, "Effectiveness of Treatment-Based Drug Courts in Reducing Criminal Recidivism," Criminal Justice and Behavior 27, no. 1 (February 1, 2000). 204 Douglas B. Marlowe, David S. DeMatteo, and David S. Festinger, "A Sober Assessment of Drug Courts," Federal Sentencing Reporter16, no. 2 (December 2003). 205 The President's Commission on Combatting Drug Addiction and the Opioid Crisis. November 1, 2017.
164
- Adult drug courts are more effective than youth drug courts in reducing recidivism and substance misuse. There is little to no evidence indicating that youth drug courts demonstrate effective outcomes in terms of recidivism or substance misuse.206
- Comprehensive treatment for substance use disorder is offered, including MAT.207 Despite the proven effectiveness of MAT, a 2012 study found that while 98% of drug courts surveyed had participants with OUD, only 47% offered some kind of opioid agonist treatment and 18% offered naltrexone.208
4. Housing First In 2016, the US Department of Housing and Urban Development found that approximately 17% of people experiencing homelessness had chronic SUD (compared to about 7% in the general population).209 Research also indicates that individuals experiencing homelessness have a risk of mortality 1.5-11.5 times greater than the risk in the general population,210 and homeless individuals using drugs tend to engage in more high-risk behavior and are at higher risk for fatal and nonfatal drug overdose, HIV seroconversion, and developing physical health conditions.211 Housing First is a housing policy that ensures that an individual can access supportive housing services regardless of whether he or she is using an illicit substance or on a MAT program. This is contrasted with many affordable housing policies that forbid participants from using any kind of illicit substances, called Treatment First policies. A review of six randomized controlled trials in different American cities found strong evidence that housing first can improve housing outcomes, reduce incarceration rates and prison time, and lower emergency department visits and inpatient spending among people experiencing homelessness. The study found that Housing First programs saw improved housing stability compared to Treatment First programs, but no impact on substance use outcomes. The study concluded that Housing First programs can offer some relief for people who are both suffering from SUD and experiencing homelessness. Importantly, the review found substantial cost savings in Housing First programs.212 A study of housing first programs in Anchorage and Fairbanks found that tenants in housing first reported significant declines in alcohol consumption after moving in to housing first. They also reported higher levels of community engagement, lower levels of pain, and fewer symptoms of depression.213 More research is needed to determine the impact of supportive housing on SUD and substance misuse generally. However, there is strong evidence to suggest that housing first policies and programs can aid highly vulnerable
206 Deborah Koetzle Shaffer, "Reconsidering Drug Court Effectiveness: A Meta-analytic Review," PhD diss., University of Cincinnati, 2006, abstract in Ohio Link, June 2006; Christopher J. Sullivan et al., "“Juvenile Drug Courts and Recidivism: Results from a Multisite Outcome Study”," Justice Quarterly 33, no. 2 (May 12, 2014); David M. Stein, Kendra J. Homan, and Scott DeBerard, "The Effectiveness of Juvenile Treatment Drug Courts: A Meta-Analytic Review of Literature," Journal of Child & Adolescent Substance Abuse 24, no. 2 (January 13, 2015). 207 Denise C. Gottfredson, Stacy S. Najaka, and Brook Kearley, "Effectiveness Of Drug Treatment Courts: Evidence From A Randomized Trial*," Criminology & Public Policy 2, no. 2 (March 2003); John S. Goldkamp, Michael D. White, and Jennifer B. Robinson, "Do Drug Courts Work? Getting inside the Drug Court Black Box," Journal of Drug Issues 31, no. 1 (January 1, 2001). 208 Harlan Matusow et al., "Medication Assisted Treatment in US Drug Courts: Results from a Nationwide Survey of Availability, Barriers and Attitudes," Journal of Substance Abuse Treatment 43, no. 5 (May/June 2013). 209 SAMHSA, "Homelessness and Housing," September 15, 2017, , https://www.samhsa.gov/homelessness-housing; Rachel N. Lipari and Struther L. Van Horn, Trends in Substance Use Disorders Among Adults Aged 18 or Older, report, The CBHSQ Report, SAMHSA, June 29, 2017. 210 Housing and Homelessness as a Public Health Issue, report, American Public Health Association, November 7, 2017. 211 Babor, Thomas F et al. Drug Policy and the Public Good. Vol. 2. Oxford, UK: Oxford University Press, 2018 pg. 62. 212 J-PAL North America U.S. Health Care Delivery Initiative Policy Brief. 2016. “Strategies to Combat the Opioid Epidemic: What We Know and Where to Go from Here.” Cambridge, MA: Abdul Latif Jameel Poverty Action Lab, North America. 213 Institute for Circumpolar Health Studies. Evaluating Housing First Programs in Anchorage and Fairbanks, Alaska: Final Report. Report. University of Alaska Anchorage. May 2017.
165
populations, connect them to medical and social resources, and keep them from entering or reentering the criminal justice system.
5. LGBTQ-Tailored Treatment Services Research on substance misuse in the LGBTQ community is thin, but studies on treatment of substance misuse in this community point in the same direction. Generally, sexual minorities are at greater risk for developing SUD and substance misuse treatment tailored to the specific needs of LGBTQ individuals results in better outcomes, yet there are few treatment facilities in the United States that offer services specifically for LGBTQ individuals. A 2015 National Institutes of Health (NIH) survey indicated that, while there is not enough data to draw conclusions about long term trends, there are higher rates of substance misuse and SUD among sexual minorities in the United States than in the heterosexual majority. 214 The same study found that 10.4% of adult sexual minorities had misused prescription pain relievers in the last year compared to 4.5% of heterosexual adults, and a 2013 study found higher rates of binge drinking in the LGBTQ population than the heterosexual population.215 Evidence also concludes that LGBTQ individuals have higher odds of frequent mental distress and depression than heterosexual individuals, issues that compound SUD.216 At the same time, health services specifically targeted to the LGBTQ population are limited. A 2017 study found that most LGBT community health centers are concentrated in urban and coastal areas, and that 13 states do not have an operating LGBT community health center.217 A 2007 study examining the number of SAMHSA treatment facilities offering services to LGBTQ individuals found that 11.8% of listed programs advertised specific LGBTQ services. Upon further investigation, the study found that 70% of these programs offered services no different from those offered to the general public, and only 7% could identify a service specifically tailored to the needs of LGBTQ clients.218 Finally, a review of research from 2004-2014 indicates that non-heterosexual orientation was a determining factor in difficulty of accessing health care, predominantly due to heteronormative attitudes219 of health professionals.220 While service options are limited and barriers to access real, evidence shows that the LGBT population enters SUD treatment with more severe substance problems that heterosexual individuals, and they demonstrate different patterns of substance use and psychosocial characteristics once in treatment.221 More research is needed in this area, but it appears that substance misuse treatment services that are tailored to the specific needs of the LGBTQ population result in better outcomes for this community.222 One review of research on substance misuse treatment programs for LGB 214 Grace Medley et al., Sexual Orientation and Estimates of Adult Substance Use and Mental Health: Results from the 2015 National Survey on Drug Use and Health, report, NSDUH Data Review, SAMHSA, October 2016. 215 KE Greene and BA Feinstein, "Substance Use in Lesbian, Gay, and Bisexual Populations: An Update on Empirical Research and Implications for Treatment.," Psychology of Addictive Behaviors26, no. 2 (June 2012); Sean Esteban McCabe et al., "Sexual Orientation and Substance Abuse Treatment Utilization in the United States: Results from a National Survey," Journal of Substance Abuse Treatment 44, no. 1 (January 2013). 216 Gilbert Gonzales and Carrie Henning-Smith, "Health Disparities by Sexual Orientation: Results and Implications from the Behavioral Risk Factor Surveillance System," Journal of Community Health 42, no. 6 (December 2017). 217 AJ Martos, Wilson PA, Meyer IH (2017) Lesbian, gay, bisexual, and transgender (LGBT) health services in the United States: Origins, evolution, and contemporary landscape. PLoS ONE 12(7). 218 Bryan N. Cochran, K. Michelle Peavy, and Jennifer S. Robohm, "Do Specialized Services Exist for LGBT Individuals Seeking Treatment for Substance Misuse? A Study of Available Treatment Programs," Substance Use & Misuse 42, no. 1 (2007). 219 Attitudes or views promoting heterosexuality as the normal or preferred sexual orientation 220 Grayce Alencar Albuquerque et al., "Access to Health Services by Lesbian, Gay, Bisexual, and Transgender Persons: Systematic Literature Review," BMC International Health and Human Rights16, no. 2 (2016). 221 Bryan N. Cochran and Ana Mari Cauce, "Characteristics of Lesbian, Gay, Bisexual, and Transgender Individuals Entering Substance Abuse Treatment," Journal of Substance Abuse Treatment 30, no. 2 (March 2006). 222 Evan Senreich, "Are Specialized LGBT Program Components Helpful for Gay and Bisexual Men in Substance Abuse Treatment?" Substance Use & Misuse 45, no. 7-8 (June 2010).
166
women recommends both more specific treatment programs for the LGBTQ population, as well as a greater incorporation of LGBTQ-informed care into all treatment services, to reduce the segregation of this already marginalized group.223
6. Cognitive Behavioral Therapy and the Matrix Model Cognitive behavioral therapy (CBT) was originally developed to prevent relapse of alcohol use disorder and was later adapted for cocaine addiction. CBT focuses on helping individuals identify and correct problematic behaviors by applying a range of skills that can be used to stop drug misuse and address a range of co-occurring morbidities.224 There is some evidence that CBT can be an effective treatment for methamphetamine225 and other SUDs.226 Unlike for OUD, there is no FDA-approved pharmacological treatment for methamphetamine use disorder. CBT combined with motivational interviewing has showed promise for treating methamphetamine use in gay and bisexual men,227 and CBT may improve control of impulsivity and self-regulation for people with methamphetamine use disorder.228
Additionally, CBT is a recognized treatment option for cannabis use disorder. Research suggests that CBT significantly reduces levels of cannabis consumption, increases abstinence levels, and results in fewer cannabis related problems among people in treatment for a cannabis use disorder.229 Given the overlaps between psychosis, anxiety, and marijuana misuse, CBT combined with anxiety treatment has also proven to be an effective treatment for cannabis use disorder.230
The Matrix Model is a treatment approach developed in the 1980s to treat stimulant drug use, particularly cocaine. The treatment therapy integrates CBT, 12-step treatment modalities, and motivational enhancement treatment to target behavioral, emotional, cognitive, and relationship issues. It is a highly structured and scheduled treatment that can be monitored through urine testing.231
There is some evidence to demonstrate the effectiveness of the Matrix Model in treating SUD. One study found that compared to treatment as usual, the Matrix Model showed increased abstinence of longer duration, and better rates of
223 Sally Stevens, "Meeting the Substance Abuse Treatment Needs of Lesbian, Bisexual and Transgender Women: Implications from Research to Practice," Substance Abuse and Rehabilitation 3, no. 1 (2012). 224 National Institute on Drug Abuse, “Cognitive Behavioral Therapy.” January 2018. https://www.drugabuse.gov/publications/principles-drug-addiction-treatment-research-based-guide-third-edition/evidence-based-approaches-to-drug-addiction-treatment/behavioral 225 LEE, N. K. and RAWSON, R. A. (2008), A systematic review of cognitive and behavioural therapies for methamphetamine dependence. Drug and Alcohol Review, 27: 309-317. 226 HIDES, L. , SAMET, S. and LUBMAN, D. I. (2010), Cognitive behaviour therapy (CBT) for the treatment of co-occurring depression and substance use: Current evidence and directions for future research. Drug and Alcohol Review, 29: 508-517. 227 Parsons JT et al, “Testing the Efficacy of Combined Motivational Interviewing and Cognitive Behavioral Skills Training to Reduce Methamphetamine Use and Improve HIV Medication Adherence Among HIV-Positive Gay and Bisexual Men.” AIDS and Behavior 22, no. 8. August, 2018. 228 Brooks SJ et al, “The impact of cognitive training in substance use disorder: the effect of working memory training on impulse control in methamphetamine users.” Psychopharmacology 234, no. 12. June, 2017. 229 Copeland, Jan, Wendy Swift, Roger Roffman, and Robert Stephens. "A Randomized Controlled Trial of Brief Cognitive–behavioral Interventions for Cannabis Use Disorder." Journal of Substance Abuse Treatment 21, no. 2 (September 2001). 230 Buckner, Julia D., Michael J. Zvolensky, Norman B. Schmidt, Kathleen M. Carroll, Chris Schatschneider, and Kathleen Crapanzano. "Integrated Cognitive Behavioral Therapy for Cannabis Use and Anxiety Disorders: Rationale and Development." Addictive Behaviors 39, no. 3 (March 2014). 231 Center for Substance Abuse Treatment. Substance Abuse: Clinical Issues in Intensive Outpatient Treatment. Rockville (MD): Substance Abuse and Mental Health Services Administration (US); 2006. (Treatment Improvement Protocol (TIP) Series, No. 47.) Chapter 8. Intensive Outpatient Treatment Approaches.
167
treatment retention and program completion, but these benefits were not sustained at follow up.232 There is some limited evidence that the Matrix Model can be effective for cocaine and methamphetamine addictions.233
7. Contingency Management
Contingency Management is a treatment therapy that provides financial incentives or other rewards for completing treatment-related goals. For example, giving a voucher to a patient for every substance-free urine test completed.
Research indicates that contingency management for amphetamine use disorders is generally effective234 and increases abstinence, particularly when carried out for longer periods of time.235 One study found that contingency management for methamphetamine addiction was also effective in treating co-occurring tobacco use disorder,236 and another found positive effects of contingency management for gay men with HIV and methamphetamine use disorder.237 However, a 2010 randomized controlled trial of contingency management for men who have sex with men and use methamphetamine found that the treatment did not have large or sustained effects on methamphetamine use.238
There is more evidence to suggest that contingency management is an effective treatment modality than there is for CBT or the Matrix Model. That said, the research base is not as strong as it is for MAT, for example.
8. Peer to Peer Services
Peer supports is an emerging field in addiction treatment that revolves around an individual with lived experience of addiction and recovery providing support and advocacy for someone with an active addiction. One study designated peer supports as the “fastest growing occupation in the mental health sector.”239
Research on peer supports is limited given the relatively new emergence of this strategy within the addiction treatment field. A 2016 review of 10 studies on peer to peer services found that these programs can be effective in addressing and supplementing substance use treatment, HIV and HCV risk behaviors, and secondary substance-related behaviors like craving and self-efficacy.240 Similarly, an assessment of peer recovery support services studies from 1995-2012 found that these services resulted in reduced relapse rates, increased treatment retention, improved relationships with
232 Rawson, RA et al. "Methamphetamine Treatment Project: Multisite Comparison of Psychosocial Treatment Approaches." Addiction 99, no. 6 (June 2004). 233 Obert, Jeanne L, Michael J. McCann, Patricia Marinelli-Casey, Ahndrea Weiner, Sam Minsky, Paul Brethen & Richard Rawson. “The Matrix Model of Outpatient Stimulant Abuse Treatment: History and Description.” Journal of Psychoactive Drugs, no. 32:2 (2000). 234 Roll, JM. "Contingency Management: An Evidence-based Component of Methamphetamine Use Disorder Treatments." Addiction 102, no. Suppl (April 2007); Roll, JM et al. "Contingency Management for the Treatment of Methamphetamine Use Disorders." American Journal of Psychiatry 163, no. 11 (November 2006); Shoptaw, S., RJ Landovitz, and CJ Reback. "Contingent Vs. Non-Contingent Rewards: Time-Based Intervention Response Patterns Among Stimulant-Using Men Who Have Sex With Men." Journal of Substance Abuse Treatment 72 (January 2017). 235 Roll, JM, J. Chudzynski, JM Cameron, DN Howell, and S. McPherson. "Duration Effects in Contingency Management Treatment of Methamphetamine Disorders." Addictive Behaviors 38, no. 9 (September 2013). 236 McPherson, S et al. "Decreases in Smoking during Treatment for Methamphetamine-use Disorders: Preliminary Evidence." Behavioral Pharmacology 29, no. 4 (June 2018). 237 Carrico, AW et al. "Randomized Controlled Trial of a Positive Affect Intervention for Methamphetamine Users." Drug and Alcohol Dependence 192 (November 1, 2018). 238 Menza, TW, DR Jameson, JP Hughes, GN Colfax, S. Shoptaw, and MR Golden. "Contingency Management to Reduce Methamphetamine Use and Sexual Risk among Men Who Have Sex with Men: A Randomized Controlled Trial." BMC Public Health 10 (December 20, 2010). 239 Rebeiro Gruhl, Karen L., Sara LaCarte, and Shana Calixte. "Authentic Peer Support Work: Challenges and Opportunities for an Evolving Occupation." Journal of Mental Health 25, no. 1 (2016). 240 Tracy, Kathleen, and Samantha P. Wallace. "Benefits of Peer Support Groups in the Treatment of Addiction." Substance Abuse Rehabilitation 7 (2016).
168
treatment providers, and increased satisfaction with the overall treatment experience.241 Peer supports can also increase engagement in care in the short term and reduce substance use over the long term for adults with co-occurring psychosis and substance use,242 and reduce the risk of relapse not only for substance use disorders but homelessness as well.243
Finally, a 2017 study found that peer supports not only increase treatment retention and decrease relapse rates, but can increase measures like self-esteem, confidence, sense of control, empowerment, empathy, acceptance, and engagement in self-care and wellness for people in treatment for SUD. At the same time, they can decrease depression, psychotic symptoms, and hospital admission rates for these patients.244
9. Exercise
There is relatively strong evidence to suggest that exercise can improve SUD treatment outcomes and even prevent substance misuse. Exercise and physical activity activate release dopamine in the brain in the same ways that substance use does. Therefore, exercise can activate the same pathways as a drug like morphine. Numerous studies on rats have found that when provided with the opportunity to exercise, rats choose to administer less of the available substance (usually morphine or cocaine).245
Additionally, research indicates that exercise can decrease the reinforcing effects of drugs of misuse, and may prevent substance use initiation and relapse.246 At the same time, exercise can be an effective supplement to treatment programs for SUD. It has been found to reduce anxiety and depression among methamphetamine users, enhancing their recovery outcomes,247 and to relieve cigarette craving and improve treatment outcomes for individuals with nicotine use disorders.248
Exercise can also be an effective substance misuse prevention method. Research has found that promoting physical activity in youth may protect against cocaine misuse,249 and exercise may reduce relapse vulnerability for youth with nicotine addictions.250 Exercise in patients in recovery from methamphetamine use disorders can also result in positive physiological changes that can enhance recovery from drug dependency.251
241 Reif, Sharon et al. "Peer Recovery Support for Individuals With Substance Use Disorders: Assessing the Evidence." Psychiatric Services, July 1, 2014. 242 O'Connell, Maria J., Elizabeth H. Flanagan, Miriam E. Delphin-Rittmon, and Larry Davidson. "Enhancing Outcomes for Persons with Co-occurring Disorders through Skills Training and Peer Recovery Support." Journal of Mental Health, 2017. 243 Boisvert, Rosemary A., Linda M. Martin, Maria Grosek, and Anna June Clarie. "Effectiveness of a Peer-support Community in Addiction Recovery: Participation as Intervention." Occupational Therapy International 15, no. 4 (October 9, 2008). 244 Substance Abuse and Mental Health Administration. Value of Peers, 2017. Presentation. 2017. https://www.samhsa.gov/sites/default/files/programs_campaigns/brss_tacs/value-of-peers-2017.pdf. 245 Hosseini, Mahmoud, Hojjat Allah Alaei, Asieh Naderi, Mohammad Reza Sharifi, and Reza Zahed. "Treadmill Exercise Reduces Self-administration of Morphine in Male Rats." Pathophysiology 16, no. 1 (June 2009); Smith, Mark A., Michael M. Pennock, Katherine L. Walker, and Kimberley C. Lang. "Access to a Running Wheel Decreases Cocaine-primed and Cue-induced Reinstatement in Male and Female Rats." Drug and Alcohol Dependence 121, no. 1-2 (February 2012). 246 Lynch, Wendy J., Alexis B. Peterson, Victoria Sanchez, Jean Abel, and Mark A. Smith. "Exercise as a Novel Treatment for Drug Addiction: A Neurobiological and Stage-dependent Hypothesis." Neuroscience & Behavioral Reviews 37, no. 8 (September 2013). 247 Droutman, V., F. Xue, E. Barkley-Levenson, HY Lam, A. Bechara, B. Smith, ZL Lu, G. Xue, LC Miller, and SJ Read. "Neurocognitive Decision-making Processes of Casual Methamphetamine Users." NeuroImage Clinical 21 (2019). 248 Zshucke, Elizabeth, Katharina Gaudlitz, and Andreas Strohle. "Exercise and Physical Activity in Mental Disorders: Clinical and Experimental Evidence." Journal of Preventive Medicine & Public Health 46, no. Suppl 1 (2013). 249 Thanos, Panayotis K et al. "Chronic Forced Exercise during Adolescence Decreases Cocaine Conditioned Place Preference in Lewis Rats." Behavioural Brain Research 215, no. 1 (December 20, 2010): 77-82. 250 Sanchez, Victoria, Catherine F. Moore, Darlene H. Brunzell, and Wendy J. Lynch. "Effect of Wheel-running during Abstinence on Subsequent Nicotine-seeking in Rats." Psychopharmacology 277, no. 3 (June 2013). 251 Dolezal, Brett A et al. "Eight Weeks of Exercise Training Improves Fitness Measures in Methamphetamine-Dependent Individuals in Residential Treatment." Journal of Addiction Medicine 7, no. 2 (March 2013).
169
Evidence-Based Public Awareness & Stigma Reduction Interventions
Stigma can have highly damaging effects on marginalized individuals. Broadly, stigma can result in poor access to mental and physical health care, reduced life expectancy, exclusion from higher education and employment, increased risk of contact with the criminal justice system, victimization, poverty, and homelessness.252 Specific to substance misuse, evidence shows that people with SUD in the United States are highly stigmatized, and this can result in barriers to access to treatment and poorer treatment outcomes. Based on the literature, the following evidence-based public awareness and stigma reduction interventions can be effective at increasing knowledge of substance use disorder and decreasing stigma surrounding the disorder in target groups: (*some evidence; **substantial evidence; ***very substantial evidence) Changing the Language of Addiction** Public Awareness Campaigns*
1. Changing the Language of Addiction In 2016, an estimated 7.5% of Americans 12 years or older had a SUD involving either alcohol or illicit drugs. In the 18-25 year age group, that number was 15.1%. At the same time, of those with a SUD, about 19% of people 12 and older received some kind of treatment, and about 12% of people 18-25 years old with SUD received treatment.253 This means that overall, about 81% of Americans with SUD do not receive treatment, and 88% of Americans 18-25 years old do not receive treatment. Stigma is an often-cited reason for why people with SUD do not seek treatment.254 A 2009 study found that people are more likely to assign blame to individuals with SUD (due to their disorder) than to individuals with mental illness or a physical illness.255 A 2014 study reinforced this finding: in a national survey, more respondents were unwilling to have a person with “drug addiction” marry into their family or work closely with them, compared to a person with mental illness. Respondents were also more likely to accept discriminatory practices against people with SUD and more likely to oppose policies aimed at helping these individuals.256 A 2013 evaluation of studies from 2000-2011 regarding health professionals’ attitudes towards patients with SUD found that health professionals generally had a negative attitude towards these patients. These negative attitudes diminished patient empowerment and treatment outcomes.257
252 Petra C. Gronholm et al., "Interventions to Reduce Discrimination and Stigma: The State of the Art," Social Psychiatry and Psychiatric Epidemiology 52, no. 3 (March 2017). 253 Results from the 2016 National Survey on Drug Use and Health: Detailed Tables, report, SAMHSA, September 7, 2017. 254 Carmen L. Masson et al., "Possible Barriers to Enrollment in Substance Abuse Treatment among a Diverse Sample of Asian Americans and Pacific Islanders: Opinions of Treatment Clients," Journal of Substance Abuse Treatment 44, no. 3 (March 2013); John F. Kelly and Cassandra M. Westerhoff, "Does It Matter How We Refer to Individuals with Substance-related Conditions? A Randomized Study of Two Commonly Used Terms," International Journal of Drug Policy 21, no. 3 (May 2010). 255 Patrick W. Corrigan, Sachiko A . Kuwabara, and John O'Shaughnessy, "The Public Stigma of Mental Illness and Drug Addiction," Journal of Social Work 9, no. 2 (April 1, 2009). 256 Colleen L. Barry et al., "Stigma, Discrimination, Treatment Effectiveness, and Policy: Public Views About Drug Addiction and Mental Illness," Psychiatric Services 65, no. 10 (October 2014). 257 Leonieke C. Van Boekel et al., "Stigma among Health Professionals towards Patients with Substance Use Disorders and Its Consequences for Healthcare Delivery: Systematic Review," Drug and Alcohol Dependence 131, no. 1-2 (July 1, 2013).
170
One of the evidence-based methods of overcoming stigma is through language change. Studies have found that when individuals with SUD are referred to as a “substance abuser” rather than a “person with substance use disorder,” clinicians are more likely to agree with the sentiment that the person is personally culpable and that punitive measures should be taken. A 2010 study found that using person first language (“person with substance use disorder” rather than “substance abuser”) caused participants to be substantially more likely to view the individual as more in need of treatment and less deserving of punitive measures like jail sentences and fines.258 In 2004, SAMHSA released “Substance Use Disorders – A Guide to the Use of Language.”259 In it, the word “abuse” is listed as stigmatizing because “it negates the fact that substance use disorders are a medical condition, blames illness solely on the individual with the illness, ignoring environmental and genetic factors, as well as the drugs’ abilities to change brain chemistry… and it feeds into the stigma experienced not only by individuals with substance use disorders, but also by family members and the treatment/recovery field.” The Guide recommends using “substance use disorder” rather than “drug abuser,” or “substance abuse.” In 2017 the Office of National Drug Control Policy released a memo entitled “Changing the Language of Addiction.” The memo recommends the use of person-first language when referring to substance use disorder.260 The Diagnostic and Statistical Manual of Mental Disorders, Fifth Edition (DSM-5) refers to substance use disorders, eliminating old language like “substance abuse” and “substance dependence.”261 Research now strongly emphasizes that an important step in overcoming stigma both publically and amongst health care professionals is aligning the language of addiction with scientific evidence.262 Using person-first language can improve perceptions of individuals with substance use disorder, which in turn can have positive treatment outcomes and may even encourage more individuals to seek treatment, as the barrier of stigma is reduced.
2. Public Awareness Campaigns While it is evident that stigma creates barriers to treatment and can even lower treatment outcomes for people with SUD, it is difficult to measure the effectiveness of public awareness campaigns aimed at lowering this stigma. Many states and individual organizations have implemented public awareness campaigns aimed at precisely this goal.263 However, few studies of their effectiveness have been conducted. Of the very few studies examining stigma reduction campaigns regarding substance misuse, one found that it is quite difficult to combat negative perceptions among medical students with educational interventions.264 A review of 13 campaigns aimed at reducing substance misuse stigma found that the following approaches were most effective:265 - Self-stigma: can be reduced through group-based acceptance and commitment therapy266 - Social stigma: can be reduced through communicating positive stories of people with SUD
258 John F. Kelly and Cassandra M. Westerhoff, "Does It Matter How We Refer to Individuals with Substance-related Conditions? A Randomized Study of Two Commonly Used Terms," International Journal of Drug Policy 21, no. 3 (May 2010). 259 SAMHSA, Substance Use Disorders: A Guide to the Use of Language, report, December 4, 2004. 260 Office of National Drug Control Policy, Memo - Changing Federal Terminology Regrading Substance Use and Substance Use Disorders, report, January 9, 2017. 261 "Substance Use Disorders," Substance Use Disorders SAMHSA - Substance Abuse and Mental Health Services Administration, September 30, 2014. 262 Linda Richter and Susan E. Foster, "Effectively Addressing Addiction Requires Changing the Language of Addiction," Journal of Public Health Policy 35, no. 1 (February 2014). 263 For example: Lift the Label, Use Only as Directed, Dose of Reality 264 Kathleen Crapanzano, Richard J. Vath, and Dixie Fisher, "Reducing Stigma Towards Substance Users Through an Educational Intervention: Harder Than It Looks," Academic Psychiatry 38, no. 4 (August 2014). 265 James D. Livingston et al., "The Effectiveness of Interventions for Reducing Stigma Related to Substance Use Disorders: A Systematic Review," Addiction 107, no. 1 (January 2012). 266 Acceptance and Commitment Therapy (ACT) is a psychological therapy aimed at mindfulness, acceptance, and dealing with negative thoughts rather than avoiding them
171
- Structural stigma: can be reduced through training based on contact with individuals with SUD and education targeting medical students and professionals (like police and counselors)
Because the research on substance misuse stigma reduction awareness campaigns is so thin, it is useful to investigate awareness campaigns aimed at stigma reduction in a similar (and often overlapping) field: mental illness. A broad review of public awareness campaigns aimed at increasing awareness of and decreasing stigma around mental illness found that such campaigns can be somewhat successful at achieving both of these goals.267 Successful campaigns included: - Using several interaction methods together: distribution of educational materials, a media campaign, and training of gatekeepers and medical professionals was more successful than implementing one of these strategies alone - Local level programs worked better than national level: adapting messages to smaller, more homogenous groups is more effective - Target one or two diseases: this proved more effective than trying to make the public aware of mental illness generally - Repeated exposure to the campaign: this reinforces messages - Employ multiple methods of transmission: for example, use TV, internet, billboards, radio, etc. - Involve people with mental illness: sharing real experiences increases effectiveness of the campaign
- Redefine recovery: research indicates that conversations about recovery from mental illness should not focus solely on the medical perspective of recovery as an end-state, but on recovery as a “sense of hope, goal attainment, and community.”268
As an interesting nuance, a recent survey by Civis Analytics looked at messaging to increase support for MAT and needle exchanges among Americans. The study of 5500 Americans in 2018 compared the following four messages about addiction, and examined their effects on support for MAT and needle exchanges. 1. “Accidental Addiction:” addiction is an unintentional consequence of opioid prescription 2. “Community Impact:” addiction has a devastating impact of families and communities
3. “Treatment Efficacy:” MAT and needle exchanges in other countries are successful, OUD can be effectively treated
4. “Victim-Blaming:” people with OUD are “weak-minded degenerates” At baseline, the study found that 56% of Americans support MAT and 49% support needle exchanges. After testing the four messages, Civis Analytics found that all four appeared to increase support for both MAT and needle exchanges. Overall, the “Treatment Efficacy” message increased support for both interventions the most (+18% support for MAT and +15% for needle exchanges), followed by the “Community Impact” message (+13% for MAT and +9% for needle exchanges). The “Victim Blaming” messaging increased support for MAT by 11% and needle exchanges by 7%.269 This study has not been confirmed by other research, but serves as an interesting addition to the small body of research evaluating public opinion on substance misuse. Many states, local governments, and organizations are implementing public awareness campaigns to reduce stigma related to substance misuse, with the hope that reductions in stigma will help individuals with SUD get treatment. It is unclear, due to a lack of evidence, whether these campaigns have been successful. However, research indicates that there are some evidence-based best practices that can be applied to public awareness campaigns that can reduce stigma in a target population. 267 Hélène Dumesnil and Pierre Verger, "Public Awareness Campaigns About Depression and Suicide: A Review," Psychiatric Services 60, no. 9 (September 2009). 268 Patrick W. Corrigan, Kristin A. Kosyluk, and Nicolas Rüsch, "Reducing Self-Stigma by Coming Out Proud," American Journal of Public Health 103, no. 5 (May 2013). 269 German Lopez, There Are Solutions to the Opioid Epidemic. Here’s How You Convince People to Support Them., September 13, 2018.
172
Emerging Interventions 1. The Gloucester Police Model: In 2015 the Gloucester Police Department in Gloucester, Massachusetts, developed the voluntary, no-arrest Angel Program. The program refers individuals to treatment or detoxification services instead of to the criminal justice system. The police ensure that referral occurs immediately, and they transport individuals directly to the treatment center. If there is a wait time, a volunteer Samaritan is assigned to wait with the individual. 376 people sought help through this program in the first year and 95% of them were immediately placed in treatment. 20 people declined participation in the program. The Gloucester Model has been adopted in at least 153 other police departments across 28 states.270 2. Arlington Police Department Overdose Prevention: In 2015, the Arlington Police Department identified those at most risk of fatal opiate overdose to be people who had already overdosed. Using this data, they went with a mental health clinician to everyone who had overdosed in Arlington previously, offering them a Narcan kit and immediate access to treatment if desired. The program received a $5,000 grant from the Police Assisted Addiction and Recovery Initiative to continue operating.271 3. Rhode Island Recovery Coach Program: The Rhode Island Department of Health, emergency room physicians, and the Anchor Community Recovery Center created an emergency room naloxone distribution and recovery coach program in 2014. Patients at risk for overdose are offered a naloxone kit, patient education video, and a peer recovery coach to support treatment, if desired.272 4. San Francisco’s Street Medicine Team: The street medicine team goes directly to individuals living on the streets in San Francisco, offering them buprenorphine treatment for OUD immediately, and providing them with as many other medical and treatment services that the person will accept (including access to housing). During the yearlong pilot, the program connected 100 people experiencing homelessness and OUD with buprenorphine treatment. 22% of participants were still on MAT and being treated by the street medicine team after one year. San Francisco plans to invest $6 million in the program.273 5. Minnesota’s Guide for Businesses: The Minnesota Department of Health and the Minnesota Business Partnership (an organization of 120 CEOs) worked together to create an “opioid toolkit” for businesses to help employees struggling with addiction. They hope that the toolkit will reduce stigma, encourage safe disposal of medicine, and help connect people with treatment if needed.274 6. Spokane Fire Department Mapping Project: The Spokane Fire Department maps overdose calls and Narcan administrations across the city in order to facilitate data-driven analysis of opioid related overdoses in the community. They plan to work with the Regional Health District to develop an opioid overdose prevention public awareness campaign targeted at the areas where overdoses are most common.275
270 Davida M. Schiff et al., "A Police-Led Addiction Treatment Referral Program in Massachusetts," New England Journal of Medicine 375, no. 25 (December 22, 2016); Davida M. Schiff et al., "A Police-led Addiction Treatment Referral Program in Gloucester, MA: Implementation and Participants Experiences," Journal of Substance Abuse Treatment 82 (November 2017). 271 Lisa Mullins, "Arlington Police Trying New Approach To Stem Drug Addiction," wbur, July 10, 2015. 272 E. Samuels, "Emergency Department Naloxone Distribution: A Rhode Island Department of Health, Recovery Community, and Emergency Department Partnership to Reduce Opioid Overdose Deaths.," Rhode Island Medical Journal 97, no. 10 (October 1, 2014). 273 Fran Kritz, "San Francisco Takes Treatment for Opioid Use Disorder to the Streets," California Health Report, June 28, 2018. 274 Christopher Magan, "Minnesota Businesses Confront Opioid Crisis," Brainerd Dispatch, September 18, 2018. 275 Doug Nadvornick, "Spokane Valley Fire Officials Map Opioid Hot Spots," Spokane Public Radio, September 12, 2018.
173
7. New York State Law on Naloxone in Schools and Libraries: New York State amended its laws to allow public schools and libraries across the state to maintain naloxone on site and use it to reverse overdoses if necessary.276 Starting in 2018, the state also provided all teachers and coaches in public schools with information about opioids, opioid overdoses, and SUD in youth.277 8. New Jersey Opioid Overdose Education: New Jersey is considering starting a mandatory opioid overdose course on naloxone administration and overdose recognition for students in 7th-12th grade. The state already passed a law requiring schools to stock naloxone.278
276 NYSED.gov, "Guidance for Implementing Opioid Overdose Prevention Measures in Public Libraries," New York State Library, November 7, 2017. 277 "Governor Cuomo Announces New Initiatives to Combat Substance Abuse Among School-Aged Children and Student Athletes," New York State, April 05, 2018. 278 Nina Feldman, "N.J. May Require That Students Learn to Administer OD-reversing Drug," WHYY, July 11, 2018.
174
Bibliography
"86% of Drugs Checked at Insite Contain Fentanyl." Vancouver Coastal Health. August 31, 2016. http://www.vch.ca/about-us/news/news-releases/86-of-drugs-checked-at-insite-contain-fentanyl.
Abdul-Quader, Abu S., Jonathan Feelemyer, Shilpa Modi, Ellen S. Stein, Alya Briceno, Salaam Semaan, Tara Horvath, Gail E. Kennedy, and Don C. Des Jarlais. "Effectiveness of Structural-Level Needle/Syringe Programs to Reduce HCV and HIV Infection Among People Who Inject Drugs: A Systematic Review." AIDS and Behavior 17, no. 9 (November 2013): 2878-892. doi:10.1007/s10461-013-0593-y.
"About the CDC-Kaiser ACE Study." Centers for Disease Control and Prevention. June 14, 2016. Accessed September 20, 2018. https://www.cdc.gov/violenceprevention/acestudy/about.html.
Albert, Su, Fred W. Brason, Catherine K. Sanford, Nabarun Dasgupta, Jim Graham, and Beth Lovette. "Project Lazarus: Community-Based Overdose Prevention in Rural North Carolina." Pain Medicine 12, no. 2 (June 13, 2011): 77-85. doi:10.1111/j.1526-4637.2011.01128.x.
Albuquerque, Grayce Alencar, Cintia De Lima Garcia, Glauberto De Silva Quirino, Maria Juscinaide Henrique Alves, Jameson Moreira Belem, Franciso Winter Dos Santos Figueiredo, Laercio De Silva Paiva, Vania Barbosa Do Nascimento, Erika De Silva Maciel, Vitor Engracia Valenti, Luiz Carlos De Abreu, and Fernando Adami. "Access to Health Services by Lesbian, Gay, Bisexual, and Transgender Persons: Systematic Literature Review." BMC International Health and Human Rights 16, no. 2 (2016). doi:10.1186/s12914-015-0072-9.
Alexander, Bruce K., Barry L. Beyerstein, Patricia F. Hadaway, and Robert B. Coambs. "Effect of Early and Later Colony Housing on Oral Ingestion of Morphine in Rats." Pharmacology Biochemistry and Behavior 15, no. 4 (October 1981): 571-76. doi:10.1016/0091-3057(81)90211-2.
American Medical Association Opioid Task Force. Help save Lives: Co-prescribe Naloxone to Patients at Risk of Overdose. Report. August 2017. https://www.end-opioid-epidemic.org/wp-content/uploads/2017/08/AMA-Opioid-Task-Force-naloxone-one-pager-updated-August-2017-FINAL.pdf.
Anton, Rayomnd F. "Naltrexone for the Management of Alcohol Dependence." New England Journal of Medicine 359, no. 7 (August 14, 2008): 715-21.
Argento E et al, “Violence, trauma and living with HIV: Longitudinal predictors of initiating crystal methamphetamine injection among sex workers.” Drug and Alcohol Dependence 175: 198-204. June 1, 2017.
Aronowitz, Shoshana V., and Jennifer Laurent. "Screaming Behind a Door." Journal of Correctional Health Care 22, no. 2 (April 2016): 98-108. doi:10.1177/1078345816634079.
Audie, Cornish. "Congress Ends Ban On Federal Funding For Needle Exchange Programs." NPR All Things Considered, January 8, 2016. https://www.npr.org/2016/01/08/462412631/congress-ends-ban-on-federal-funding-for-needle-exchange-programs.
Ayanga, Daniel, Daryl Shorter, and Thomas R. Kosten. "Update on Pharmacotherapy for Treatment of Opioid Use Disorder." Expert Opinion on Pharmacotherapy 17, no. 17 (December 20, 2016): 2307-318. doi:10.1080/14656566.2016.1244529.
Babor, Thomas F., Bonnie G. Mcree, Patricia A. Kassebaum, Paul L. Grimaldi, Kazi Ahmed, and Jeremy Bray. "Screening, Brief Intervention, and Referral to Treatment (SBIRT)." Substance Abuse28, no. 3 (2007): 7-30. doi:10.1300/j465v28n03_03.
Babor, Thomas F et al. Drug Policy and the Public Good. Vol. 2. Oxford, UK: Oxford University Press, 2018.
Bagley, Sarah M., Leah S. Forman, Sarah Ruiz, Kevin Cranston, and Alexander Y. Walley. "Expanding Access to Naloxone for Family Members: The Massachusetts Experience." Drug and Alcohol Review 37, no. 4 (April 20, 2017): 480-86. doi:10.1111/dar.12551.
175
Baker, Amanda, Nicole K. Lee, Melissa Claire, Terry J. Lewin, Tanya Grant, Sonja Pohlman, John B. Saunders, Frances Kay-Lambkin, Paul Constable, Linda Jenner, and Vaughan J. Carr. "Brief Cognitive Behavioural Interventions for Regular Amphetamine Users: A Step in the Right Direction." Addiction 100, no. 3 (March 2005): 367-78. doi:10.1111/j.1360-0443.2005.01002.x.
Barry, Colleen L., Emma E. Mcginty, Bernice A. Pescosolido, and Howard H. Goldman. "Stigma, Discrimination, Treatment Effectiveness, and Policy: Public Views About Drug Addiction and Mental Illness." Psychiatric Services 65, no. 10 (October 2014): 1269-272. doi:10.1176/appi.ps.201400140.
Bebinger, Martha. "AMA Endorses Trying Supervised Injection Facilities." WBUR, June 16, 2017. http://www.wbur.org/commonhealth/2017/06/16/ama-supervised-injection-facilities-opioids.
Behar, Emily, Glenn-Milo Santos, Eliza Wheeler, Christopher Rowe, and Phillip O. Coffin. "Brief Overdose Education Is Sufficient for Naloxone Distribution to Opioid Users." Drug and Alcohol Dependence 148 (March 1, 2015): 209-12. doi:10.1016/j.drugalcdep.2014.12.009.
Belenko, Steven. "Research on Drug Courts: A Critical Review." National Drug Court Institute Review 1, no. 1 (June 1998). http://www.ndci.org/sites/default/files/ndci/CASA.Bekenko.1998.pdf.
Beletsky, Leo, Corey S. Davis, Evan Anderson, and Scott Burris. "The Law (and Politics) of Safe Injection Facilities in the United States." The Law (and Politics) of Safe Injection Facilities in the United States 98, no. 2 (February 1, 2008): 231-37. doi:10.2105/AJPH.2006.103747.
Bernstein, Judith, Edward Bernstein, Katherine Tassiopoulos, Timothy Heeren, Suzette Levenson, and Ralph Hingson. "Brief Motivational Intervention at a Clinic Visit Reduces Cocaine and Heroin Use." Drug and Alcohol Dependence 77, no. 1 (January 7, 2005): 49-59. doi:10.1016/j.drugalcdep.2004.07.006.
Bettington, Emilie, Jean Spinks, Fiona Kelly, and Amanda J. Wheeler. "Returning Unwanted Medicines to Pharmacies: Prescribing to Reduce Waste." Australian Prescriber 41, no. 3 (June 01, 2018): 78-81. doi:10.18773/austprescr.2018.015.
Bien, TH, WR Miller, and JS Tonigan. "Brief Interventions for Alcohol Problems: A Review." Addiction 88, no. 3 (March 1993): 315-35. https://www.ncbi.nlm.nih.gov/pubmed/8461850.
Bird, Sheila M., Andrew Mcauley, Samantha Perry, and Carole Hunter. "Effectiveness of Scotlands National Naloxone Programme for Reducing Opioid-related Deaths: A before (2006-10) versus after (2011-13) Comparison." Addiction 111, no. 5 (May 2016): 883-91. doi:10.1111/add.13265
Bluthenthal, Ricky N., Greg Ridgeway, Terry Schell, Rachel Anderson, Neil M. Flynn, and Alex H. Kral. "Examination of the Association between Syringe Exchange Program (SEP) Dispensation Policy and SEP Client-level Syringe Coverage among Injection Drug Users." Addiction 102, no. 4 (April 2007): 638-46. doi:10.1111/j.1360-0443.2006.01741.x.
Boekel, Leonieke C. Van, Evelien P.m. Brouwers, Jaap Van Weeghel, and Henk F.l. Garretsen. "Stigma among Health Professionals towards Patients with Substance Use Disorders and Its Consequences for Healthcare Delivery: Systematic Review." Drug and Alcohol Dependence 131, no. 1-2 (July 1, 2013): 23-35. doi:10.1016/j.drugalcdep.2013.02.018.
Bohnert, Amy SB, Marcia Valenstein, and Matthew J. Blair. "Association Between Opioid Prescribing Patterns and Opioid Overdose-Related Deaths." JAMA 305, no. 13 (April 06, 2011): 1315-321. doi:10.1001/jama.2011.370.
Boisvert, Rosemary A., Linda M. Martin, Maria Grosek, and Anna June Clarie. "Effectiveness of a Peer-support Community in Addiction Recovery: Participation as Intervention." Occupational Therapy International 15, no. 4 (October 9, 2008): 205-20.
Bravo, MJ, L. Royuela, MT Brugal, A. Domingo, and L. De La Fuente. "Access to Sterile Syringes among Young Drug Injectors in Madrid and Barcelona and Its Association with Risk Behaviour." Gaceta Sanitaria 22, no. 2 (March/April 2008): 128-32. https://www.ncbi.nlm.nih.gov/pubmed/18420010.
"Briefing on PDMP Effectiveness." Prescription Drug Monitoring Program Center of Excellence at Brandeis, September 2014. https://www.pdmpassist.org/pdf/Resources/Briefing on PDMP Effectiveness 3rd revision.pdf.
176
Brinkley-Rubinstein, Lauren, David H. Cloud, Chelsea Davis, Nickolas Zaller, Ayesha Delany-Brumsey, Leah Pope, Sarah Martino, Benjamin Bouvier, and Josiah Rich. "Addressing Excess Risk of Overdose among Recently Incarcerated People in the USA: Harm Reduction Interventions in Correctional Settings." International Journal of Prisoner Health 13, no. 1 (March 13, 2017): 25-31. doi:10.1108/ijph-08-2016-0039.
Broadhead, RS, Y. Van Hulst, and DD Heckathorn. "The Impact of a Needle Exchange's Closure." Public Health Reports 114, no. 5 (September/October 1999): 439-47. https://www.ncbi.nlm.nih.gov/pmc/articles/PMC1308516/.
Broadhead, Robert S., Thomas H. Kerr, Jean-Paul C. Grund, and Frederick L. Altice. "Safer Injection Facilities in North America: Their Place in Public Policy and Health Initiatives." Journal of Drug Issues 32, no. 1 (January 1, 2002): 329-55. doi:10.1177/002204260203200113.
Brooklyn, John R., and Stacey C. Sigmon. "Vermont Hub-and-Spoke Model of Care for Opioid Use Disorder." Journal of Addiction Medicine 11, no. 4 (July/August 2017): 286-92. doi:10.1097/adm.0000000000000310.
Brooks S.J. et al, “The impact of cognitive training in substance use disorder: the effect of working memory training on impulse control in methamphetamine users.” Psychopharmacology 234, no. 12. June, 2017.
Buckner, Julia D., Michael J. Zvolensky, Norman B. Schmidt, Kathleen M. Carroll, Chris Schatschneider, and Kathleen Crapanzano. "Integrated Cognitive Behavioral Therapy for Cannabis Use and Anxiety Disorders: Rationale and Development." Addictive Behaviors 39, no. 3 (March 2014): 495-96.
"California Evidence-Based Clearinghouse for Childhood Welfare." List of Programs. Accessed October 6, 2018. http://www.cebc4cw.org/search/by-program-name/.
California Society of Addiction Medicine. "Methadone Treatment Issues." 2018. https://www.csam-asam.org/methadone-treatment-issues.
Carrico, AW et al. "Randomized Controlled Trial of a Positive Affect Intervention for Methamphetamine Users." Drug and Alcohol Dependence 192 (November 1, 2018): 8-15.
Carroll, Jennifer J., Brandon D.l. Marshall, Josiah D. Rich, and Traci C. Green. "Exposure to Fentanyl-contaminated Heroin and Overdose Risk among Illicit Opioid Users in Rhode Island: A Mixed Methods Study." International Journal of Drug Policy 46 (August 2017): 136-45. doi:10.1016/j.drugpo.2017.05.023.
Carroll, Jennifer J., Traci C. Green, and Rita K. Noonan. "Evidence-Based Strategies for Preventing Opioid Overdose: What’s Working in the United States." Centers for Disease Control and Prevention, 2018. https://www.cdc.gov/drugoverdose/pdf/pubs/2018-evidence-based-strategies.pdf.
Centers for Disease Control and Prevention. “2018 Annual Surveillance Report of Drug-Related Risks and Outcomes — United States.” Surveillance Special Report. Centers for Disease Control and Prevention, U.S. Department of Health and Human Services. Published August 31, 2018. https://www.cdc.gov/ drugoverdose/pdf/pubs/2018- cdc-drug-surveillance-report.pdf
Centers for Disease Control and Prevention Morbidity and Mortality Weekly Report, Methamphetamine use and HIV risk behaviors among heterosexual men – preliminary results from five northern California counties, December 2001-November 2003. CDC 55, no. 10 (March 2006).
Centers for Disease Control and Prevention. "Guideline for Prescribing Opioids for Chronic Pain." March 18, 2016. https://www.cdc.gov/drugoverdose/pdf/guidelines_factsheet-a.pdf.
Center for Substance Abuse Treatment. Substance Abuse: Clinical Issues in Intensive Outpatient Treatment. Rockville (MD): Substance Abuse and Mental Health Services Administration (US); 2006. (Treatment Improvement Protocol (TIP) Series, No. 47.) Chapter 8. Intensive Outpatient Treatment Approaches.
Chen Q, Larochelle MR, Weaver DT, et al. Prevention of Prescription Opioid Misuse and Projected Overdose Deaths in the United States. JAMA Netw Open. 2019;2(2).
177
"Child Abuse and Neglect: Prevention Strategies." Centers for Disease Control and Prevention. April 10, 2018. Accessed September 20, 2018. https://www.cdc.gov/violenceprevention/childabuseandneglect/prevention.html.
Choi, Namkee G., Diana M. Dinitto, C. Nathan Marti, and Bryan Y. Choi. "Association of Adverse Childhood Experiences with Lifetime Mental and Substance Use Disorders among Men and Women Aged 50 Years." International Psychogeriatrics 29, no. 03 (2016): 359-72. doi:10.1017/s1041610216001800.
Cissner, Amanda B., Michael Rempel, and Allyson Walker Franklin. A Statewide Evaluation of New York's Adult Drug Courts: Identifying Which Policies Work Best. Report. Center for Court Innovation. June 2013. https://www.urban.org/sites/default/files/publication/23826/412867-A-Statewide-Evaluation-of-New-York-s-Adult-Drug-Courts.PDF.
Cochran, Bryan N., and Ana Mari Cauce. "Characteristics of Lesbian, Gay, Bisexual, and Transgender Individuals Entering Substance Abuse Treatment." Journal of Substance Abuse Treatment 30, no. 2 (March 2006): 135-46. doi:10.1016/j.jsat.2005.11.009.
Cochran, Bryan N., K. Michelle Peavy, and Jennifer S. Robohm. "Do Specialized Services Exist for LGBT Individuals Seeking Treatment for Substance Misuse? A Study of Available Treatment Programs." Substance Use & Misuse 42, no. 1 (2007): 161-76. doi:10.1080/10826080601094207.
Coffin, PO, E. Behar, C. Rowe, GM Santos, D. Coffa, M. Bald, and E. Vittinghoff. "Nonrandomized Intervention Study of Naloxone Coprescription for Primary Care Patients Receiving Long-Term Opioid Therapy for Pain." Annals of Internal Medicine 165, no. 4 (August 16, 2016): 245-52. doi:10.7326/M15-2771.
Compton, Wilson M., Christopher M. Jones, Pharm D, and Grant T. Baldwin. "Relationship between Nonmedical Prescription-Opioid Use and Heroin Use." The New England Journal of Medicine 374 (2016): 154-63. doi:10.1056/NEJMra1508490.
Connery, Hilary Smith. "Medication-Assisted Treatment of Opioid Use Disorder." Harvard Review of Psychiatry 23, no. 2 (March/April 2015): 63-75. doi:10.1097/hrp.0000000000000075.
Copeland, Jan, Wendy Swift, Roger Roffman, and Robert Stephens. "A Randomized Controlled Trial of Brief Cognitive–behavioral Interventions for Cannabis Use Disorder." Journal of Substance Abuse Treatment 21, no. 2 (September 2001): 55-64.
Corrigan, Patrick W., Kristin A. Kosyluk, and Nicolas Rüsch. "Reducing Self-Stigma by Coming Out Proud." American Journal of Public Health 103, no. 5 (May 2013): 794-800. doi:10.2105/ajph.2012.301037.
Corrigan, Patrick W., Sachiko A . Kuwabara, and John O'Shaughnessy. "The Public Stigma of Mental Illness and Drug Addiction." Journal of Social Work 9, no. 2 (April 1, 2009): 139-47. doi:10.1177/1468017308101818.
Crapanzano, Kathleen, Richard J. Vath, and Dixie Fisher. "Reducing Stigma Towards Substance Users Through an Educational Intervention: Harder Than It Looks." Academic Psychiatry 38, no. 4 (August 2014): 420-25. doi:10.1007/s40596-014-0067-1.
Curtis, Brenda L., A. Thomas Mclellan, and Beth N. Gabellini. "Translating SBIRT to Public School Settings: An Initial Test of Feasibility." Journal of Substance Abuse Treatment 46, no. 1 (January 2014): 15-21. doi:10.1016/j.jsat.2013.08.001.
Davoli, Marina, Anna M. Bargagli, Carlo A. Perucci, Patrizia Schifano, Valeria Belleudi, Matthew Hickman, Giuseppe Salamina, Roberto Diecidue, Federica Vigna-Taglianti, and Fabrizio Faggiano. "Risk of Fatal Overdose during and after Specialist Drug Treatment: The VEdeTTE Study, a National Multi-site Prospective Cohort Study." Addiction 102, no. 12 (December 2007): 1954-959. doi:10.1111/j.1360-0443.2007.02025.x.
Dewit, D. J. "Age at First Alcohol Use: A Risk Factor for the Development of Alcohol Disorders." American Journal of Psychiatry 157, no. 5 (2000): 745-50. doi:10.1176/appi.ajp.157.5.745.
Dolan, Kate A., James Shearer, Margaret Macdonald, Richard P. Mattick, Wayne Hall, and Alex D. Wodak. "A Randomised Controlled Trial of Methadone Maintenance Treatment versus Wait List Control in an Australian Prison System." Drug and Alcohol Dependence 72, no. 1 (October 24, 2003): 59-65. doi:10.1016/s0376-8716(03)00187-x.
178
Dolezal, Brett A et al. "Eight Weeks of Exercise Training Improves Fitness Measures in Methamphetamine-Dependent Individuals in Residential Treatment." Journal of Addiction Medicine 7, no. 2 (March 2013): 122-28.
D'Onofrio, G., MC Chawarski, PG O'Connor, MV Pantalon, SH Busch, PH Owens, K. Hawk, SL Bernstein, and DA Fiellin. "Emergency Department-Initiated Buprenorphine for Opioid Dependence with Continuation in Primary Care: Outcomes During and After Intervention." Journal of General Internal Medicine 32, no. 6 (June 2017): 660-66. doi:10.1007/s11606-017-3993-2.
Dowell, Deborah, Kun Zhang, Rita K. Noonan, and Jason M. Hockenberry. "Mandatory Provider Review And Pain Clinic Laws Reduce The Amounts Of Opioids Prescribed And Overdose Death Rates." Health Affairs 35, no. 10 (October 2016). doi:10.1377/hlthaff.2016.0448.
Dowell, Deborah, Tamara M. Haegerich, and Roger Chou. "CDC Guideline for Prescribing Opioids for Chronic Pain—United States, 2016." JAMA 315, no. 15 (April 19, 2016): 1624-645. doi:10.1001/jama.2016.1464.
Downing, Moher, Thomas H. Riess, Karen Vernon, Nina Mulia, Marilyn Hollinquest, Courtney Mcknight, Don C. Des Jarlais, and Brian R. Edlin. "Whats Community Got to Do With It? Implementation Models of Syringe Exchange Programs." AIDS Education and Prevention 17, no. 1 (February 2005): 68-78. doi:10.1521/aeap.17.1.68.58688.
Droutman, V., F. Xue, E. Barkley-Levenson, HY Lam, A. Bechara, B. Smith, ZL Lu, G. Xue, LC Miller, and SJ Read. "Neurocognitive Decision-making Processes of Casual Methamphetamine Users." NeuroImage Clinical 21 (2019).
Drug Courts. Report. Office of Justice Programs, US Department of Justice. May 2018. https://www.ncjrs.gov/pdffiles1/nij/238527.pdf.
Dube, Shanta R., Robert F. Anda, Vincent J. Felitti, Valerie J. Edwards, and Janet B. Croft. "Adverse Childhood Experiences and Personal Alcohol Abuse as an Adult." Addictive Behaviors 27, no. 5 (September/October 2002): 713-25. doi:10.1016/s0306-4603(01)00204-0.
Dumesnil, Hélène, and Pierre Verger. "Public Awareness Campaigns About Depression and Suicide: A Review." Psychiatric Services 60, no. 9 (September 2009): 1203-213. doi:10.1176/appi.ps.60.9.1203.
Dunn, Kelly E., Frederick S. Barrett, Claudia Yepez-Laubach, Andrew C. Meyer, Bryce J. Hruska, Kathy Petrush, Suzan Berman, Stacey C. Sigmon, Michael Fingerhood, and George E. Bigelow. "Opioid Overdose Experience, Risk Behaviors, and Knowledge in Drug Users from a Rural Versus an Urban Setting." Journal of Substance Abuse Treatment 71 (December 2016): 1-7. doi:10.1016/j.jsat.2016.08.006.
Egan, Kathleen L., Eric Gregory, Michael Sparks, and Mark Wolfson. "From Dispensed to Disposed: Evaluating the Effectiveness of Disposal Programs through a Comparison with Prescription Drug Monitoring Program Data." The American Journal of Drug and Alcohol Abuse 43, no. 1 (January 2017): 69-77. doi:10.1080/00952990.2016.1240801.
Egan, Kathleen L., Mark Wolfson, William N. Dudley, Vincent T. Francisco, Robert W. Strack, David L. Wyrick, and Michael A. Perko. "Diffusion of Medication Drop-boxes in North Carolina from 2007 to 2016." Addictive Behaviors 86 (November 2018): 44-50. doi:10.1016/j.addbeh.2018.03.029.
Ennett, S. T., N. S. Tobler, C. L. Ringwalt, and R. L. Flewelling. "How Effective Is Drug Abuse Resistance Education? A Meta-analysis of Project DARE Outcome Evaluations." American Journal of Public Health 84, no. 9 (1994): 1394-1401. doi:10.2105/ajph.84.9.1394.
Evidence Supporting the Effectiveness of an SBIRT. Report. SAMHSA. April 1, 2011. https://www.samhsa.gov/sites/default/files/sbirtwhitepaper_0.pdf.
Faggiano, F., FD Vigna-Taglianti, E. Versino, A. Zambon, A. Borraccino, and P. Lemma. "School-based Prevention for Illicit Drugs Use." Cochrane Database of Systematic Reviews, April 18, 2005. doi:10.1002/14651858.CD003020.pub2.
Faul, Mark, Michael W. Dailey, David E. Sugerman, Scott M. Sasser, Benjamin Levy, and Len J. Paulozzi. "Disparity in Naloxone Administration by Emergency Medical Service Providers and the Burden of Drug Overdose in US Rural Communities." American Journal of Public Health 105, no. S3 (July 2015): 26-32. doi:10.2105/ajph.2014.302520.
179
Feldman, Nina. "N.J. May Require That Students Learn to Administer OD-reversing Drug." WHYY, July 11, 2018. https://whyy.org/segments/n-j-may-require-that-students-learn-to-administer-od-reversing-drug/.
Fentanyl Overdose Reduction Checking Analysis Survey. Report. Johns Hopkins Bloomberg School of Public Health. February 6, 2018. https://americanhealth.jhu.edu/sites/default/files/inline-files/Fentanyl_Executive_Summary_032018.pdf.
Fink, David S., Julia P. Schleimer, Aaron Sarvet, Kiran K. Grover, Chris Delcher, Alvaro Castillo-Carniglia, June H. Kim, Ariadne E. Rivera-Aguirre, Stephen G. Henry, Silvia S. Martins, and Magdalena Cerdá. "Association Between Prescription Drug Monitoring Programs and Nonfatal and Fatal Drug Overdoses." Annals of Internal Medicine 168, no. 11 (May 08, 2018): 783-90. doi:10.7326/M17-3074.
Fischer, Benedikt, and Yoko Murphy. "Policy Measures for Prescription Opioids and Harms: Enough to Protect Public Health? A Comment on Yanovitzky (2016) and Piper Et Al. (2016)." Journal of Studies on Alcohol and Drugs 77, no. 4 (June 28, 2016): 566-67. doi:10.15288/jsad.2016.77.566.
Fitzgerald, Therese C. Establishment of a Pilot Medically Supervised Injection Facility in Massachusetts: Report of the Task Force on Opioid Therapy and Physician Communication.Report. Massachusetts Medical Society. April 2017. http://www.massmed.org/advocacy/state-advocacy/sif-report-2017/.
Fleming, M., and LB Maxwell. "Brief Intervention in Primary Care Settings. A Primary Treatment Method for At-risk, Problem, and Dependent Drinkers." Alcohol Research & Health 23, no. 2 (1999): 128-37. https://www.ncbi.nlm.nih.gov/pubmed/10890807.
Ford, Earl S., Robert F. Anda, Valerie J. Edwards, Geraldine S. Perry, Guixiang Zhao, Chaoyang Li, and Janet B. Croft. "Adverse Childhood Experiences and Smoking Status in Five States." Preventive Medicine 53, no. 3 (September 2011): 188-93. doi:10.1016/j.ypmed.2011.06.015.
Forster, Myriam, Amy L. Gower, Iris W. Borowsky, and Barbara J. Mcmorris. "Associations between Adverse Childhood Experiences, Student-teacher Relationships, and Non-medical Use of Prescription Medications among Adolescents." Addictive Behaviors 68 (May 2017): 30-34. doi:10.1016/j.addbeh.2017.01.004.
Foxcroft, David R., and Alexander Tsertsvadze. "Universal School-based Prevention Programs for Alcohol Misuse in Young People." Cochrane Database of Systematic Reviews 5 (May 11, 2011). doi:10.1002/14651858.cd009113.
Gabrhelik, Roman, Alexandra Duncan, Michal Miovsky, C. Debra M. Furr-Holden, Lenka Stastna, and Lucie Jurystova. "“Unplugged”: A School-based Randomized Control Trial to Prevent and Reduce Adolescent Substance Use in the Czech Republic." Drug and Alcohol Dependence 124, no. 1-2 (July 2012): 79-87. doi:10.1016/j.drugalcdep.2011.12.010.
Gagnon, Edith. Pharmaceutical Disposal Programs for the Public: A Canadian Perspective. Report. Health Canada Environmental Impact Initiative. November 6, 2009. https://c.ymcdn.com/sites/www.productstewardship.us/resource/resmgr/imported/Takeback (2).pdf.
Gaston, Romina, David Best, Victoria Manning, and Ed Day. "Can We Prevent Drug Related Deaths by Training Opioid Users to Recognise and Manage Overdoses?" Harm Reduction Journal 6, no. 26 (September 25, 2009). doi:10.1186/1477-7517-6-26.
"Good Behavior Game." American Institutes for Research. October 19, 2016. Accessed October 10, 2018. https://www.air.org/topic/education/good-behavior-game.
Gottfredson, DC, and DB Wilson. "Characteristics of Effective School-based Substance Abuse Prevention." Prevention Science 4, no. 1 (March 2003): 27-38. https://link.springer.com/article/10.1023/A:1021782710278.
Gottfredson, Denise C., Stacy S. Najaka, and Brook Kearley. "Effectiveness Of Drug Treatment Courts: Evidence From A Randomized Trial*." Criminology & Public Policy 2, no. 2 (March 2003): 171-96. doi:10.1111/j.1745-9133.2003.tb00117.x.
Goldkamp, John S., Michael D. White, and Jennifer B. Robinson. "Do Drug Courts Work? Getting inside the Drug Court Black Box." Journal of Drug Issues 31, no. 1 (January 1, 2001): 27-72. doi:10.1177/002204260103100104.
180
Gonzales, Gilbert, and Carrie Henning-Smith. "Health Disparities by Sexual Orientation: Results and Implications from the Behavioral Risk Factor Surveillance System." Journal of Community Health42, no. 6 (December 2017): 1163-172. doi:10.1007/s10900-017-0366-z.
"Governor Cuomo Announces New Initiatives to Combat Substance Abuse Among School-Aged Children and Student Athletes." New York State. April 05, 2018. https://www.governor.ny.gov/news/governor-cuomo-announces-new-initiatives-combat-substance-abuse-among-school-aged-children-an-0.
Gray, Jeffrey A., and Nicholas E. Hagemeier. "Prescription Drug Abuse and DEA-Sanctioned Drug Take-Back Events: Characteristics and Outcomes in Rural Appalachia." Archives of Internal Medicine 172, no. 15 (August 13, 2012). doi:10.1001/archinternmed.2012.2374.
Gray, Jeffrey, Nicholas Hagemeier, Billy Brooks, and Arsham Alamian. "Prescription Disposal Practices: A 2-Year Ecological Study of Drug Drop Box Donations in Appalachia." American Journal of Public Health 105, no. 9 (September 2015): 89-94. doi:10.2105/ajph.2015.302689.
Green, Traci C., Jennifer Clarke, Lauren Brinkley-Rubinstein, Brandon D. L. Marshall, Nicole Alexander-Scott, Rebecca Boss, and Josiah D. Rich. "Postincarceration Fatal Overdoses After Implementing Medications for Addiction Treatment in a Statewide Correctional System." JAMA Psychiatry 75, no. 4 (April 2018): 405-07. doi:10.1001/jamapsychiatry.2017.4614.
Greene, KE, and BA Feinstein. "Substance Use in Lesbian, Gay, and Bisexual Populations: An Update on Empirical Research and Implications for Treatment." Psychology of Addictive Behaviors26, no. 2 (June 2012): 265-78. doi:10.1037/a0025424.
Grimshaw, Jeremy M., and Ian T. Russell. "Effect of Clinical Guidelines on Medical Practice." The Lancet 342, no. 8883 (November 27, 1993): 1317-322. doi:https://doi.org/10.1016/0140-6736(93)92244-N.
Gronholm, Petra C., Claire Henderson, Tanya Deb, and Graham Thornicroft. "Interventions to Reduce Discrimination and Stigma: The State of the Art." Social Psychiatry and Psychiatric Epidemiology 52, no. 3 (March 2017): 249-58. doi:10.1007/s00127-017-1341-9.
Gryczynski, Jan, Shannon Gwin Mitchell, Thomas R. Peterson, Arturo Gonzales, Ana Moseley, and Robert P. Schwartz. "The Relationship between Services Delivered and Substance Use Outcomes in New Mexicos Screening, Brief Intervention, Referral and Treatment (SBIRT) Initiative." Drug and Alcohol Dependence 118, no. 2-3 (2011): 152-57. doi:10.1016/j.drugalcdep.2011.03.012.
Gupta, Ravi, Nilay D. Shah, and Joseph S. Ross. "The Rising Price of Naloxone — Risks to Efforts to Stem Overdose Deaths." New England Journal of Medicine 375 (December 08, 2016): 2213-215. doi:10.1056/NEJMp1609578.
Guy, Gery P., Kun Zhang, Michele K. Bohm, Jan Losby, Brian Lewis, Randall Young, Louise B. Murphy, and Deborah Dowell. "Vital Signs: Changes in Opioid Prescribing in the United States, 2006–2015." MMWR. Morbidity and Mortality Weekly Report 66, no. 26 (July 07, 2017): 697-704. doi:10.15585/mmwr.mm6626a4.
Hari, Johann. "Everything You Think You Know About Addiction Is Wrong." TedTalks. June 2015. https://www.ted.com/talks/johann_hari_everything_you_think_you_know_about_addiction_is_wrong?language=en.
Hawkins, J. David, Richard F. Catalano, and Michael W. Arthur. "Promoting Science-based Prevention in Communities." Addictive Behaviors 27, no. 6 (2002): 951-76. doi:10.1016/s0306-4603(02)00298-8.
Heimer, R. "Syringe Exchange Programs: Lowering the Transmission of Syringe-borne Diseases and beyond." Public Health Rep 113 (June 1998): 67-74. https://www.ncbi.nlm.nih.gov/pmc/articles/PMC1307728/?page=1.
Hides, L., Samet, S. and Lubman, D.I. (2010), Cognitive behaviour therapy (CBT) for the treatment of co-occurring depression and substance use: Current evidence and directions for future research. Drug and Alcohol Review, 29: 508-517.
Hollingworth, W., D. Cohen, J. Hawkins, R. A. Hughes, L. A. R. Moore, J. C. Holliday, S. Audrey, F. Starkey, and R. Campbell. "Reducing Smoking in Adolescents: Cost-Effectiveness Results From the Cluster Randomized ASSIST (A Stop Smoking In Schools Trial)." Nicotine & Tobacco Research 14, no. 2 (December 16, 2011): 161-68. doi:10.1093/ntr/ntr155.
181
Holpuch, Amanda. "Secret Supervised Drug Injection Facility Has Been Operating at US Site for Years." The Guardian, August 8, 2017. https://www.theguardian.com/society/2017/aug/08/secret-supervised-drug-injection-facility-us-opioids-overdoses.
Horton, Meredith, Rebecca Mcdonald, Traci C. Green, Suzanne Nielsen, John Strang, Louisa Degenhardt, and Sarah Larney. "A Mapping Review of Take-home Naloxone for People Released from Correctional Settings." International Journal of Drug Policy 46 (May 2, 2017): 7-16. doi:10.1016/j.drugpo.2017.05.015.
Hosseini, Mahmoud, Hojjat Allah Alaei, Asieh Naderi, Mohammad Reza Sharifi, and Reza Zahed. "Treadmill Exercise Reduces Self-administration of Morphine in Male Rats." Pathophysiology 16, no. 1 (June 2009): 3-7.
Housing and Homelessness as a Public Health Issue. Report. American Public Health Association. November 7, 2017. https://www.apha.org/policies-and-advocacy/public-health-policy-statements/policy-database/2018/01/18/housing-and-homelessness-as-a-public-health-issue.
Huhn, Andrew S., and Kelly E. Dunn. "Why Arent Physicians Prescribing More Buprenorphine?" Journal of Substance Abuse Treatment 78 (July 2017): 1-7. doi:10.1016/j.jsat.2017.04.005.
Hwang, S W. “Homelessness and health” CMAJ : Canadian Medical Association journal = journal de l'Association medicale canadienne vol. 164,2 (2001): 229-33.
Hyshka, Elaine, Steffanie Strathdee, Evan Wood, and Thomas Kerr. "Needle Exchange and the HIV Epidemic in Vancouver: Lessons Learned from 15 Years of Research." International Journal of Drug Policy 23, no. 4 (July 2012): 261-70. doi:10.1016/j.drugpo.2012.03.006.
Inciardi, James A., Hilary L. Surratt, Theodore J. Cicero, and Ronald A. Beard. "Prescription Opioid Abuse and Diversion in an Urban Community: The Results of an Ultrarapid Assessment." Pain Medicine 10, no. 3 (April 1, 2009): 537-48. doi:10.1111/j.1526-4637.2009.00603.x.
Institute for Circumpolar Health Studies. Evaluating Housing First Programs in Anchorage and Fairbanks, Alaska: Final Report. Report. University of Alaska Anchorage. May 2017.
Irvine, Michael A et al. “Distribution of take-home opioid antagonist kits during synthetic opioids epidemic in British Columbia, Canada: a modeling study.” The Lancet 3, no. 5 (May 1, 2018).
Johns Hopkins Bloomberg School of Public Health. The Prescription Opioid Epidemic: An Evidence-Based Approach. Report. November 2015. https://www.jhsph.edu/research/centers-and-institutes/center-for-drug-safety-and-effectiveness/research/prescription-opioids/JHSPH_OPIOID_EPIDEMIC_REPORT.pdf.
Jones, CM, PG Lurie, and WM Compton. "Increase in Naloxone Prescriptions Dispensed in US Retail Pharmacies Since 2013." American Journal of Public Health 106, no. 4 (April 2016): 689-90. doi:10.2105/AJPH.2016.303062.
Jones, Christopher M., Melinda Campopiano, Grant Baldwin, and Elinore Mccance-Katz. "National and State Treatment Need and Capacity for Opioid Agonist Medication-Assisted Treatment." American Journal of Public Health 105, no. 8 (2015). doi:10.2105/ajph.2015.302664.
J-PAL North America U.S. Health Care Delivery Initiative Policy Brief. 2016. “Strategies to Combat the Opioid Epidemic: What We Know and Where to Go from Here.” Cambridge, MA: Abdul Latif Jameel Poverty Action Lab, North America. https://www.povertyactionlab.org/sites/default/files/documents/Final_Opioid%20Brief_1.5.17.pdf
Katz, Josh. "How a Police Chief, a Governor and a Sociologist Would Spend $100 Billion to Solve the Opioid Crisis." The New York Times. February 14, 2018. Accessed October 5, 2018. https://www.nytimes.com/interactive/2018/02/14/upshot/opioid-crisis-solutions.html.
Kelly, Daniel. "Medical Students Lead Research into Opioid Disposal Bags." Wright State University. January 22, 2018. https://webapp2.wright.edu/web1/newsroom/2018/01/22/medical-students-lead-research-into-opioid-disposal-bags/.
182
Kelly, John F., and Cassandra M. Westerhoff. "Does It Matter How We Refer to Individuals with Substance-related Conditions? A Randomized Study of Two Commonly Used Terms." International Journal of Drug Policy 21, no. 3 (May 2010): 202-07. doi:10.1016/j.drugpo.2009.10.010.
Kerensky, Todd, and Alexander Y. Walley. "Opioid Overdose Prevention and Naloxone Rescue Kits: What We Know and What We Don’t Know." Addiction Science & Clinical Practice 12, no. 4 (January 07, 2017). doi:10.1186/s13722-016-0068-3.
Kim, Daniel, Kevin S. Irwin, and Kaveh Khoshnood. "Expanded Access to Naloxone: Options for Critical Response to the Epidemic of Opioid Overdose Mortality." American Journal of Public Health 99, no. 3 (March 2009): 402-07. doi:10.2105/ajph.2008.136937.
Kinlock, Timothy W., Michael S. Gordon, Robert P. Schwartz, Terrence T. Fitzgerald, and Kevin E. O'Grady. "A Randomized Clinical Trial of Methadone Maintenance for Prisoners: Results at 12 Months Postrelease." Journal of Substance Abuse Treatment 37, no. 3 (October 2009).
Klein, Susan J., Alma R. Candelas, Jay G. Cooper, Wesley E. Badillo, James M. Tesoriero, Haven B. Battles, and Hope A. Plavin. "Increasing Safe Syringe Collection Sites in New York State." Public Health Reports 123, no. 4 (July/August 2008): 433-40. doi:10.1177/003335490812300404.
Knudsen, Hannah K., Amanda J. Abraham, and Paul M. Roman. "Adoption and Implementation of Medications in Addiction Treatment Programs." Journal of Addiction Medicine 5, no. 1 (March 2011): 21-27. doi:10.1097/adm.0b013e3181d41ddb.
Kristjansson, Alfgeir Logi, Jack E. James, John P. Allegrante, Inga Dora Sigfusdottir, and Asgeir R. Helgason. "Adolescent Substance Use, Parental Monitoring, and Leisure-time Activities: 12-year Outcomes of Primary Prevention in Iceland." Preventive Medicine 51, no. 2 (August 2010): 168-71. doi:10.1016/j.ypmed.2010.05.001.
Kritz, Fran. "San Francisco Takes Treatment for Opioid Use Disorder to the Streets." California Health Report, June 28, 2018. http://www.calhealthreport.org/2018/06/28/san-francisco-takes-treatment-opioid-use-disorder-streets/.
Kwon, Jisoo A., Jonathan Anderson, Cliff C. Kerr, Hla-Hla Thein, Lei Zhang, Jenny Iversen, Gregory J. Dore, John M. Kaldor, Matthew G. Law, Lisa Maher, and David P. Wilson. "Estimating the Cost-effectiveness of Needle-syringe Programs in Australia." AIDS 26, no. 17 (November 13, 2012): 2201-210. doi:10.1097/qad.0b013e3283578b5d.
Lee, Joshua D., Ryan Mcdonald, Ellie Grossman, Jennifer Mcneely, Eugene Laska, John Rotrosen, and Marc N. Gourevitch. "Opioid Treatment at Release from Jail Using Extended-release Naltrexone: A Pilot Proof-of-concept Randomized Effectiveness Trial." Addiction 110, no. 6 (June 2015): 1008-014. doi:10.1111/add.12894.
Lee, N. K. and Rawson, R. A. (2008), A systematic review of cognitive and behavioural therapies for methamphetamine dependence. Drug and Alcohol Review, 27: 309-317.
Lipari, Rachel N., and Struther L. Van Horn. Trends in Substance Use Disorders Among Adults Aged 18 or Older. Report. The CBHSQ Report, SAMHSA. June 29, 2017. https://www.samhsa.gov/data/sites/default/files/report_2790/ShortReport-2790.html.
Livingston, James D., Teresa Milne, Mei Lan Fang, and Erica Amari. "The Effectiveness of Interventions for Reducing Stigma Related to Substance Use Disorders: A Systematic Review." Addiction 107, no. 1 (January 2012): 39-50. doi:10.1111/j.1360-0443.2011.03601.x.
Lopez, German. “There Are Solutions to the Opioid Epidemic. Here’s How You Convince People to Support Them.” Vox, September 13, 2018. https://www.vox.com/policy-and-politics/2018/9/13/17852100/opioid-epidemic-solutions-survey.
Lopez, German. "Why Some US Cities Are Opening Safe Spaces for Injecting Heroin." Vox, September 27, 2018. https://www.vox.com/science-and-health/2018/1/25/16928144/safe-injection-sites-heroin-opioid-epidemic.
Lynch, Wendy J., Alexis B. Peterson, Victoria Sanchez, Jean Abel, and Mark A. Smith. "Exercise as a Novel Treatment for Drug Addiction: A Neurobiological and Stage-dependent Hypothesis." Neuroscience & Behavioral Reviews 37, no. 8 (September 2013): 1622-644.
183
Madras, Bertha K., Wilson M. Compton, Deepa Avula, Tom Stegbauer, Jack B. Stein, and H.westley Clark. "Screening, Brief Interventions, Referral to Treatment (SBIRT) for Illicit Drug and Alcohol Use at Multiple Healthcare Sites: Comparison at Intake and 6 Months Later." Drug and Alcohol Dependence 99, no. 1-3 (January 1, 2009): 280-95. doi:10.1016/j.drugalcdep.2008.08.003.
Magan, Christopher. "Minnesota Businesses Confront Opioid Crisis." Brainerd Dispatch, September 18, 2018. http://www.brainerddispatch.com/business/workplace/4501202-minnesota-businesses-confront-opioid-crisis.
Maglione, Margaret A., Laura Raaen, Christine Chen, Gulrez Azhar, Nima Shahidinia, Mimi Shen, Ervant Maksabedian, Roberta Shanman, Sydne Newberry, and Susanne Hempel. "Effects of Medication Assisted Treatment (MAT) for Opioid Use Disorder on Functional Outcomes: A Systematic Review." Journal of Substance Abuse Treatment 89 (March 6, 2018): 28-51. https://www.journalofsubstanceabusetreatment.com/article/S0740-5472(17)30482-8/pdf.
Marlowe, Douglas B., Carolyn D. Hardin, and Carson L. Fox. Painting the Current Picture: A National Report on Drug Courts and Other Problem-Solving Courts in the United States. Report. National Drug Court Institute. June 2016. https://www.ndci.org/wp-content/uploads/2016/05/Painting-the-Current-Picture-2016.pdf.
Marlowe, Douglas B., David S. DeMatteo, and David S. Festinger. "A Sober Assessment of Drug Courts." Federal Sentencing Reporter 16, no. 2 (December 2003): 153-57. doi:10.1525/fsr.2003.16.2.153.
Marsden, John, Garry Stillwell, Hayley Jones, Alisha Cooper, Brian Eastwood, Michael Farrell, Tim Lowden, Nino Maddalena, Chris Metcalfe, Jenny Shaw, and Matthew Hickman. "Does Exposure to Opioid Substitution Treatment in Prison Reduce the Risk of Death after Release? A National Prospective Observational Study in England." Addiction 112, no. 8 (2017): 1408-418. doi:10.1111/add.13779.
Marshall, Brandon Dl, M-J Milloy, Evan Wood, Julio Sg Montaner, and Thomas Kerr. "Reduction in Overdose Mortality after the Opening of North Americas First Medically Supervised Safer Injecting Facility: A Retrospective Population-based Study." The Lancet 377, no. 9775 (April 23-29, 2011): 1429-437. doi:10.1016/s0140-6736(10)62353-7.
Marshall BD et al, “Individual, social, and environmental factors associated with initiating methamphetamine injection: implications for drug use and HIV prevention strategies.” Prevention Science 12(2): 173-180. June, 2011.
Martos AJ, Wilson PA, Meyer IH (2017) Lesbian, gay, bisexual, and transgender (LGBT) health services in the United States: Origins, evolution, and contemporary landscape. PLoS ONE 12(7): e0180544. https://doi.org/10.1371/journal. pone.0180544
Masson, Carmen L., Michael S. Shopshire, Soma Sen, Kim A. Hoffman, Nicholas S. Hengl, John Bartolome, Dennis Mccarty, James L. Sorensen, and Martin Y. Iguchi. "Possible Barriers to Enrollment in Substance Abuse Treatment among a Diverse Sample of Asian Americans and Pacific Islanders: Opinions of Treatment Clients." Journal of Substance Abuse Treatment 44, no. 3 (March 2013): 309-15. doi:10.1016/j.jsat.2012.08.005.
Mattick RP, Breen C, Kimber J, Davoli M. Methadone maintenance therapy versus no opioid replacement therapy for opioid dependence. Cochrane Database of Systematic Reviews 2009, Issue 3. Art. No.: CD002209. DOI: 10.1002/14651858.CD002209.pub2.
Mattick, RP, J. Kimber, C. Breen, and M. Davoli. "Buprenorphine Maintenance versus Placebo or Methadone Maintenance for Opioid Dependence." Cochrane Database of Systematic Reviews 2 (February 6, 2014). doi:10.1002/14651858.CD002207.pub4.
Matusow, Harlan, Samuel L. Dickman, Josiah D. Rich, Chunki Fong, Dora M. Dumont, Carolyn Hardin, Douglas Marlowe, and Andrew Rosenblum. "Medication Assisted Treatment in US Drug Courts: Results from a Nationwide Survey of Availability, Barriers and Attitudes." Journal of Substance Abuse Treatment 43, no. 5 (May/June 2013): 473-80. doi:10.1016/j.jsat.2012.10.004.
McCabe, Sean Esteban, Brady T. West, Tonda L. Hughes, and Carol J. Boyd. "Sexual Orientation and Substance Abuse Treatment Utilization in the United States: Results from a National Survey." Journal of Substance Abuse Treatment 44, no. 1 (January 2013): 4-12. doi:10.1016/j.jsat.2012.01.007.
McCabe, Sean Esteban, James A. Cranford, Carol J. Boyd, and Christian J. Teter. "Motives, Diversion and Routes of Administration Associated with Nonmedical Use of Prescription Opioids." Addictive Behaviors 32, no. 3 (March 2007): 562-75. doi:10.1016/j.addbeh.2006.05.022.
184
McCauley, Lauren. "Despite Rising Death Toll, LePage Vetoes Opioid Treatment Bills." Maine Beacon. July 9, 2018. http://mainebeacon.com/despite-rising-death-toll-lepage-vetoes-opioid-treatment-bills/.
McGowan, Catherine R., Magdalena Harris, Lucy Platt, Vivian Hope, and Tim Rhodes. "Fentanyl Self-testing outside Supervised Injection Settings to Prevent Opioid Overdose: Do We Know Enough to Promote It?" International Journal of Drug Policy 58 (2018): 31-36. doi:10.1016/j.drugpo.2018.04.017.
Mckenzie, Michelle, Nickolas Zaller, Samuel L. Dickman, Traci C. Green, Amisha Parihk, Peter D. Friedmann, and Josiah D. Rich. "A Randomized Trial of Methadone Initiation Prior to Release from Incarceration." Substance Abuse 33, no. 1 (January 2012): 19-29. doi:10.1080/08897077.2011.609446.
McPherson, S et al. "Decreases in Smoking during Treatment for Methamphetamine-use Disorders: Preliminary Evidence." Behavioral Pharmacology 29, no. 4 (June 2018): 370-74.
Medley, Grace, Rachel N. Lipari, Jonaki Bose, Devon S. Cribb, Larry A. Kroutil, and Gretchen McHenry. Sexual Orientation and Estimates of Adult Substance Use and Mental Health: Results from the 2015 National Survey on Drug Use and Health. Report. NSDUH Data Review, SAMHSA. October 2016. https://www.samhsa.gov/data/sites/default/files/NSDUH-SexualOrientation-2015/NSDUH-SexualOrientation-2015/NSDUH-SexualOrientation-2015.htm.
Menza, TW, DR Jameson, JP Hughes, GN Colfax, S. Shoptaw, and MR Golden. "Contingency Management to Reduce Methamphetamine Use and Sexual Risk among Men Who Have Sex with Men: A Randomized Controlled Trial." BMC Public Health 10 (December 20, 2010): 774.
Miller, Kevin. "LePage Vetoes Bill Aimed at Increasing Access to Overdose Antidote." Press Herald. April 20, 2016. https://www.pressherald.com/2016/04/20/lepage-vetoes-bill-aimed-at-increasing-access-to-heroin-anti-overdose-drug/.
Miller, Ted R., and Delia Hendrie. "Substance Abuse Prevention Dollars and Cents: A Cost-Benefit Analysis." National Criminal Justice Reference Service, 2008. doi:10.1037/e569922009-001.
Mitchell, Shannon Gwin, Jan Gryczynski, Arturo Gonzales, Ana Moseley, Thomas Peterson, Kevin E. O'Grady, and Robert P. Schwartz. "Screening, Brief Intervention, and Referral to Treatment (SBIRT) for Substance Use in a School-Based Program: Services and Outcomes." American Journal on Addictions 21, no. 1 (November 2012): S5-S13. https://onlinelibrary.wiley.com/doi/abs/10.1111/j.1521-0391.2012.00299.x.
Mitchell, Ojmarrh, David B. Wilson, Amy Eggers, and Doris L. Mackenzie. "Assessing the Effectiveness of Drug Courts on Recidivism: A Meta-analytic Review of Traditional and Non-traditional Drug Courts." Journal of Criminal Justice 40, no. 1 (January/February 2012): 60-71. doi:10.1016/j.jcrimjus.2011.11.009.
Mitchell, Ojmarrh, David Wilson, Amy Eggers, and Doris MacKenzie. "Drug Courts Effects on Criminal Offending for Juveniles and Adults." Crime and Justice 8 (February 02, 2012). doi:10.4073/csr.2012.4.
MonQcle. "PDAPS | Prescription Drug Abuse Policy System." MonQcle - Good Samaritan Overdose Prevention Laws. July 1, 2018. http://pdaps.org/datasets/good-samaritan-overdose-laws-1501695153.
Montigny, Luc De, Anne Vernez Moudon, Barbara Leigh, and SY Kim. "Assessing a Drop Box Programme: A Spatial Analysis of Discarded Needles." International Journal of Drug Policy 21, no. 3 (May 2010): 208-14. doi:10.1016/j.drugpo.2009.07.003.
Moshki, Mahdi, Tahere Hassanzade, and Parvaneh Taymoori. "Effect of Life Skills Training on Drug Abuse Preventive Behaviors among University Students." International Journal of Preventive Medicine 5, no. 5 (May 2014): 577-83. https://www.ncbi.nlm.nih.gov/pmc/articles/PMC4050678/.
Mulder, Emily. "Seattle Plans First Safe Drug-injection Sites in the US." Al Jazeera, April 10, 2017. https://www.aljazeera.com/indepth/features/2017/03/seattle-plans-safe-drug-injection-sites-170329085008446.html.
Mullins, Lisa. "Arlington Police Trying New Approach To Stem Drug Addiction." Wbur, July 10, 2015. http://www.wbur.org/news/2015/07/10/arlington-police-drug-addiction-program.
185
Mumeniuk, Rachel, Victoria Dennington, and Robert Ali. The Effectiveness of a Brief Intervention for Illicit Drugs Linked to the Alcohol, Smoking and Substance Involvement Screening Test (ASSIST) in Primary Health Care Settings: A Technical Report of Phase III Findings of the WHO ASSIST Randomized Controlled Trial. Report. WHO ASSIST Phase III Technical Report. 2008. http://www.who.int/substance_abuse/activities/assist_technicalreport_phase3_final.pdf.
Myers, Julie E., Susan Eppes, Danni Lentine, and T. Stephen Jones. "Safe Sharps Disposal in Public Restrooms, Bush Intercontinental Airport, Houston, Texas." Journal of the American Pharmaceutical Association (1996) 42, no. 6 (November/December 2002): 118-19. doi:10.1331/1086-5802.42.0.s118.myers.
Nadvornick, Doug. "Spokane Valley Fire Officials Map Opioid Hot Spots." Spokane Public Radio, September 12, 2018. http://www.spokanepublicradio.org/post/spokane-valley-fire-officials-map-opioid-hot-spots.
National Academies of Sciences, Engineering, and Medicine, Health and Medicine Division, Board on Health Sciences Policy, and Committee on Pain Managament and Regulatory Strategies to Address Prescription Opioid Abuse. Pain Management and the Opioid Epidemic. Report. Washington, DC: National Academies Press, 2013. https://www.ncbi.nlm.nih.gov/books/NBK458660/.
National Institute on Drug Abuse, “Cognitive Behavioral Therapy.” January 2018. https://www.drugabuse.gov/publications/principles-drug-addiction-treatment-research-based-guide-third-edition/evidence-based-approaches-to-drug-addiction-treatment/behavioral
National Institute on Drug Abuse. "Naloxone for Opioid Overdose: Life-Saving Science." March 2017. https://www.drugabuse.gov/publications/naloxone-opioid-overdose-life-saving-science/naloxone-opioid-overdose-life-saving-science.
National Minority AIDS Council. Federal Funding for Syringe Exchange: An Issue Brief. Report. https://harmreduction.org/wp-content/uploads/2012/01/Syringe-Exchange-June-4-NMAC.pdf.
Ng, Jennifer, Christy Sutherland, and Michael R. Kolber. "Does Evidence Support Supervised Injection Sites?" Canadian Family Physician 63, no. 11 (November 2017): 866. https://www.ncbi.nlm.nih.gov/pmc/articles/PMC5685449/
Nguyen, Trang Quynh, Brian W. Weir, Don C. Des Jarlais, Steven D. Pinkerton, and David R. Holtgrave. "Syringe Exchange in the United States: A National Level Economic Evaluation of Hypothetical Increases in Investment." AIDS and Behavior 18, no. 11 (November 15, 2014): 2144-155. doi:10.1007/s10461-014-0789-9.
Noonan, Megan, Allie VanSickle, and Jack Vest. Statewide Universal Needle Disposal. Report. The Vermont Legislative Research Service, University of Vermont. March 4, 2015. https://www.uvm.edu/~vlrs/Safety/needle disposal.pdf.
NYSED.gov. "Guidance for Implementing Opioid Overdose Prevention Measures in Public Libraries." New York State Library. November 7, 2017. http://www.nysl.nysed.gov/libdev/opioid/guidance.htm.
O'Connell, Mary Ellen, Thomas Boat, and Kenneth E. Warner, eds. "Preventing Mental, Emotional, and Behavioral Disorders Among Young People." 2009. doi:10.17226/12480.
O'Connell, Maria J., Elizabeth H. Flanagan, Miriam E. Delphin-Rittmon, and Larry Davidson. "Enhancing Outcomes for Persons with Co-occurring Disorders through Skills Training and Peer Recovery Support." Journal of Mental Health, 2017.
Obert, Jeanne L, Michael J. McCann, Patricia Marinelli-Casey, Ahndrea Weiner, Sam Minsky, Paul Brethen & Richard Rawson. “The Matrix Model of Outpatient Stimulant Abuse Treatment: History and Description.” Journal of Psychoactive Drugs, no. 32:2 (2000), 157-164.
Office of National Drug Control Policy. Memo - Changing Federal Terminology Regrading Substance Use and Substance Use Disorders. Report. January 9, 2017. https://obamawhitehouse.archives.gov/sites/whitehouse.gov/files/images/Memo - Changing Federal Terminology Regrading Substance Use and Substance Use Disorders.pdf.
Onrust, Simone A., Roy Otten, Jeroen Lammers, and Filip Smit. "School-based Programmes to Reduce and Prevent Substance Use in Different Age Groups: What Works for Whom? Systematic Review and Meta-regression Analysis." Clinical Psychology Review 44 (March 2016): 45-59. doi:10.1016/j.cpr.2015.11.002.
186
Oral, Resmiye, Marizen Ramirez, Carol Coohey, Stephanie Nakada, Amy Walz, Angela Kuntz, Jenna Benoit, and Corinne Peek-Asa. "Adverse Childhood Experiences and Trauma Informed Care: The Future of Health Care." Pediatric Research 79 (2016): 227-33. https://www.nature.com/articles/pr2015197#ref22.
Palmateer, Norah, Jo Kimber, Matthew Hickman, Sharon Hutchinson, Tim Rhodes, and David Goldberg. "Evidence for the Effectiveness of Sterile Injecting Equipment Provision in Preventing Hepatitis C and Human Immunodeficiency Virus Transmission among Injecting Drug Users: A Review of Reviews." Addiction 105, no. 5 (March 2, 2010): 844-59. doi:10.1111/j.1360-0443.2009.02888.x.
Parsons JT et al, “Testing the Efficacy of Combined Motivational Interviewing and Cognitive Behavioral Skills Training to Reduce Methamphetamine Use and Improve HIV Medication Adherence Among HIV-Positive Gay and Bisexual Men.” AIDS and Behavior 22, no. 8. August, 2018.
Peckham, Alyssa M., Maria E. Niculete, Howard Steinberg, and Douglas L. Boggs. "A Survey of Prescribersʼ Attitudes, Knowledge, Comfort, and Fear of Consequences Related to an Opioid Overdose Education and Naloxone Distribution Program." Journal of Public Health Management and Practice 24, no. 4 (July/August 2018): 310-17. doi:10.1097/phh.0000000000000668.
Peiper, Nicholas C., Sarah Duhart Clarke, Louise B. Vincent, Dan Ciccarone, Alex H. Kral, and Jon E. Zibbell. "Fentanyl Test Strips as an Opioid Overdose Prevention Strategy: Findings from a Syringe Services Program in the Southeastern United States." International Journal of Drug Policy, October 3, 2018. doi:10.1016/j.drugpo.2018.08.007.
Peters, Roger H., and Mary R. Murrin. "Effectiveness of Treatment-Based Drug Courts in Reducing Criminal Recidivism." Criminal Justice and Behavior 27, no. 1 (February 1, 2000): 72-96. doi:10.1177/0093854800027001005.
Pettinati, HM, CP O'Brien, AR Rabinowitz, SP Wortman, DW Oslin, KM Kampman, and CA Dackis. "The Status of Naltrexone in the Treatment of Alcohol Dependence: Specific Effects on Heavy Drinking." Journal of Clinical Psychopharmacology 26, no. 6 (December 2006): 610-25.
Pew Charitable Trusts. "Medication-Assisted Treatment Improves Outcomes for Patients With Opioid Use Disorder." PEW. November 22, 2016. https://www.pewtrusts.org/en/research-and-analysis/fact-sheets/2016/11/medication-assisted-treatment-improves-outcomes-for-patients-with-opioid-use-disorder.
Pew Charitable Trusts. Prescription Drug Monitoring Programs: Evidence-based Practices to Optimize Prescriber Use. Report. December 2016. https://www.pewtrusts.org/~/media/assets/2016/12/prescription_drug_monitoring_programs.pdf.
Pitt, Allison L., Keith Humphreys, and Margaret L. Brandeau. "Modeling Health Benefits and Harms of Public Policy Responses to the US Opioid Epidemic." American Journal of Public Health 108, no. 10 (October 1, 2018): 1394-400. doi:10.2105/AJPH.2018.304590.
"Principles of Harm Reduction." Harm Reduction Coalition. https://harmreduction.org/about-us/principles-of-harm-reduction/.
Rando, Jessica, Derek Broering, James E. Olson, Catherine Marco, and Stephen B. Evans. "Intranasal Naloxone Administration by Police First Responders Is Associated with Decreased Opioid Overdose Deaths." The American Journal of Emergency Medicine 33, no. 9 (September 2015): 1201-204. doi:10.1016/j.ajem.2015.05.022.
Rawson, RA et al. "Methamphetamine Treatment Project: Multisite Comparison of Psychosocial Treatment Approaches." Addiction 99, no. 6 (June 2004): 708-17.
Rebeiro Gruhl, Karen L., Sara LaCarte, and Shana Calixte. "Authentic Peer Support Work: Challenges and Opportunities for an Evolving Occupation." Journal of Mental Health 25, no. 1 (2016): 78-86.
Rees, Daniel, Joseph Sabia, Laura Argys, Joshua Latshaw, and Dhaval Dave. "With a Little Help from My Friends: The Effects of Naloxone Access and Good Samaritan Laws on Opioid-Related Deaths." National Bureau of Economic Research, February 2017. http://www.nber.org/papers/w23171.pdf.
Reif, Sharon et al. "Peer Recovery Support for Individuals With Substance Use Disorders: Assessing the Evidence." Psychiatric Services, July 1, 2014.
187
Results from the 2016 National Survey on Drug Use and Health: Detailed Tables. Report. SAMHSA. September 7, 2017. https://www.samhsa.gov/data/sites/default/files/NSDUH-DetTabs-2016/NSDUH-DetTabs-2016.pdf.
Rich, Josiah D., Michelle Mckenzie, Sarah Larney, John B. Wong, Liem Tran, Jennifer Clarke, Amanda Noska, Manasa Reddy, and Nickolas Zaller. "Methadone Continuation versus Forced Withdrawal on Incarceration in a Combined US Prison and Jail: A Randomised, Open-label Trial." The Lancet 386, no. 9991 (July 25, 2015): 350-59. doi:10.1016/s0140-6736(14)62338-2.
Richter, Linda, and Susan E. Foster. "Effectively Addressing Addiction Requires Changing the Language of Addiction." Journal of Public Health Policy 35, no. 1 (February 2014): 60-64. doi:10.1057/jphp.2013.44.
Roll, JM. "Contingency Management: An Evidence-based Component of Methamphetamine Use Disorder Treatments." Addiction 102, no. Suppl (April 2007): 114-20.
Roll, JM et al. "Contingency Management for the Treatment of Methamphetamine Use Disorders." American Journal of Psychiatry 163, no. 11 (November 2006): 1993-999.
Roll, JM, J. Chudzynski, JM Cameron, DN Howell, and S. McPherson. "Duration Effects in Contingency Management Treatment of Methamphetamine Disorders." Addictive Behaviors 38, no. 9 (September 2013): 2455-462.
Roos, Leslie E et al. “Relationship between adverse childhood experiences and homelessness and the impact of axis I and II disorders” American journal of public health vol. 103 Suppl 2,Suppl 2 (2013): S275-81.
Rosenblatt, R. A., C. H. A. Andrilla, M. Catlin, and E. H. Larson. "Geographic and Specialty Distribution of US Physicians Trained to Treat Opioid Use Disorder." The Annals of Family Medicine 13, no. 1 (January/February 2015): 23-26. doi:10.1370/afm.1735.
Rosenstein, Rod J. "Fight Drug Abuse, Don’t Subsidize It." The New York Times, August 27, 2018. https://www.nytimes.com/2018/08/27/opinion/opioids-heroin-injection-sites.html.
Rothman, E. F., E. M. Edwards, T. Heeren, and R. W. Hingson. "Adverse Childhood Experiences Predict Earlier Age of Drinking Onset: Results From a Representative US Sample of Current or Former Drinkers." Pediatrics 122, no. 2 (August 2008). doi:10.1542/peds.2007-3412.
SAMHSA. "Adverse Childhood Experiences." September 7, 2018. https://www.samhsa.gov/capt/practicing-effective-prevention/prevention-behavioral-health/adverse-childhood-experiences.
SAMHSA's Center for the Application of Prevention Technologies. Preventing the Consequences of Opioid Overdose: Understanding Naloxone Access Laws. Report. January 20, 2018. https://www.samhsa.gov/capt/sites/default/files/resources/naloxone-access-laws-tool.pdf.
SAMHSA's Center for the Application of Prevention Technologies. Preventing the Consequences of Opioid Overdose: Understanding 911 Good Samaritan Laws. Report. November 8, 2017. https://www.samhsa.gov/capt/sites/default/files/resources/good-samaritan-law-tool.pdf
SAMHSA. "Homelessness and Housing." September 15, 2017. https://www.samhsa.gov/homelessness-housing.
SAMHSA. "Medication and Counseling Treatment." US Department of Health and Human Services. September 28, 2015. https://www.samhsa.gov/medication-assisted-treatment/treatment#medications-used-in-mat.
SAMHSA. Value of Peers, 2017. Presentation. 2017. https://www.samhsa.gov/sites/default/files/programs_campaigns/brss_tacs/value-of-peers-2017.pdf.
SAMHSA. "Physician and Program Data." US Department of Health and Human Services. https://www.samhsa.gov/programs-campaigns/medication-assisted-treatment/training-materials-resources/physician-program-data
SAMHSA. "Risk and Protective Factors." August 13, 2018. https://www.samhsa.gov/capt/practicing-effective-prevention/prevention-behavioral-health/risk-protective-factors#universal-prevention-interventions.
188
SAMHSA. Substance Use Disorders: A Guide to the Use of Language. Report. December 4, 2004. https://www.naabt.org/documents/Languageofaddictionmedicine.pdf.
Samuels, E. "Emergency Department Naloxone Distribution: A Rhode Island Department of Health, Recovery Community, and Emergency Department Partnership to Reduce Opioid Overdose Deaths." Rhode Island Medical Journal 97, no. 10 (October 1, 2014): 38-39. https://www.ncbi.nlm.nih.gov/pubmed/25271659.
Sanchez, Victoria, Catherine F. Moore, Darlene H. Brunzell, and Wendy J. Lynch. "Effect of Wheel-running during Abstinence on Subsequent Nicotine-seeking in Rats." Psychopharmacology 277, no. 3 (June 2013): 403-11.
Schiff, Davida M., Mari-Lynn Drainoni, Megan Bair-Merritt, Zoe Weinstein, and David Rosenbloom. "A Police-Led Addiction Treatment Referral Program in Massachusetts." New England Journal of Medicine 375, no. 25 (December 22, 2016): 2502-503. doi:10.1056/nejmc1611640.
Schiff, Davida M., Mari-Lynn Drainoni, Zoe M. Weinstein, Lisa Chan, Megan Bair-Merritt, and David Rosenbloom. "A Police-led Addiction Treatment Referral Program in Gloucester, MA: Implementation and Participants Experiences." Journal of Substance Abuse Treatment 82 (November 2017): 41-47. doi:10.1016/j.jsat.2017.09.003.
Schuchat, Anne, Debra Houry, and Gery P. Guy. "New Data on Opioid Use and Prescribing in the United States." JAMA 318, no. 5 (August 01, 2017): 425-26. doi:10.1001/jama.2017.8913.
Schwartz, Robert P., Jan Gryczynski, Kevin E. O’Grady, Joshua M. Sharfstein, Gregory Warren, Yngvild Olsen, Shannon G. Mitchell, and Jerome H. Jaffe. "Opioid Agonist Treatments and Heroin Overdose Deaths in Baltimore, Maryland, 1995–2009." American Journal of Public Health 103, no. 5 (May 2013): 917-22. doi:10.2105/ajph.2012.301049.
Seiler, Naomi, Katherine Horton, and Mary-Beth Malcarney. Medicaid Reimbursement for Take-home Naloxone: A Toolkit for Advocates. Report. https://hsrc.himmelfarb.gwu.edu/cgi/viewcontent.cgi?article=1857&context=sphhs_policy_facpubs.
Senreich, Evan. "Are Specialized LGBT Program Components Helpful for Gay and Bisexual Men in Substance Abuse Treatment?" Substance Use & Misuse 45, no. 7-8 (June 2010): 1077-096. doi:10.3109/10826080903483855.
Shaffer, Deborah Koetzle. "Reconsidering Drug Court Effectiveness: A Meta-analytic Review." PhD diss., University of Cincinnati, 2006. Abstract in Ohio Link. June 2006. https://etd.ohiolink.edu/!etd.send_file?accession=ucin1152549096&disposition=inline.
Shatterproof. Prescription Drug Monitoring Programs: Critical Elements of Effective State Legislation. Report. March 2016. https://www.shatterproof.org/sites/default/files/2016-11/PDMP-white-paper-2016_0.pdf.
Shoptaw, S., RJ Landovitz, and CJ Reback. "Contingent Vs. Non-Contingent Rewards: Time-Based Intervention Response Patterns Among Stimulant-Using Men Who Have Sex With Men." Journal of Substance Abuse Treatment 72 (January 2017): 19-24.
Sigfusdottir, I. D., T. Thorlindsson, A. L. Kristjansson, K. M. Roe, and J. P. Allegrante. "Substance Use Prevention for Adolescents: The Icelandic Model." Health Promotion International 24, no. 1 (December 11, 2008): 16-25. doi:10.1093/heapro/dan038.
Sigmon, Stacey C., Andrew C. Meyer, Bryce Hruska, Taylor Ochalek, Gail Rose, Gary J. Badger, John R. Brooklyn, Sarah H. Heil, Stephen T. Higgins, Brent A. Moore, and Robert P. Schwartz. "Bridging Waitlist Delays with Interim Buprenorphine Treatment: Initial Feasibility." Addictive Behaviors 51 (December 2015): 136-42. doi:10.1016/j.addbeh.2015.07.030.
Sigmon, Stacey C., Taylor A. Ochalek, Andrew C. Meyer, Bryce Hruska, Sarah H. Heil, Gary J. Badger, Gail Rose, John R. Brooklyn, Robert P. Schwartz, Brent A. Moore, and Stephen T. Higgins. "Interim Buprenorphine vs. Waiting List for Opioid Dependence." New England Journal of Medicine 375, no. 25 (December 22, 2016): 2504-505. doi:10.1056/nejmc1610047.
Smith, Mark A., Michael M. Pennock, Katherine L. Walker, and Kimberley C. Lang. "Access to a Running Wheel Decreases Cocaine-primed and Cue-induced Reinstatement in Male and Female Rats." Drug and Alcohol Dependence 121, no. 1-2 (February 2012): 54-61.
Smith PC, Schmidt SM, Allensworth-Davies D, Saitz R. A Single-Question Screening Test for Drug Use in Primary Care. Arch Intern Med. 2010;170(13):1155–1160. doi:10.1001/archinternmed.2010.140
189
Sordo, Luis, Gregorio Barrio, Maria J. Bravo, B. Iciar Indave, Louisa Degenhardt, Lucas Wiessing, Marica Ferri, and Roberto Pastor-Barriuso. "Mortality Risk during and after Opioid Substitution Treatment: Systematic Review and Meta-analysis of Cohort Studies." BMJ 357 (April 26, 2017). doi:10.1136/bmj.j1550.
Spoth, R., L. Trudeau, C. Shin, E. Ralston, C. Redmond, M. Greenberg, and M. Feinberg. "Longitudinal Effects of Universal Preventive Intervention on Prescription Drug Misuse: Three Randomized Controlled Trials with Late Adolescents and Young Adults." American Journal of Public Health 103, no. 4 (April 2013): 665-72. doi:10.2105/AJPH.2012.301209.
Stein, David M., Kendra J. Homan, and Scott DeBerard. "The Effectiveness of Juvenile Treatment Drug Courts: A Meta-Analytic Review of Literature." Journal of Child & Adolescent Substance Abuse 24, no. 2 (January 13, 2015): 80-93. doi:10.1080/1067828X.2013.764371.
Stevens, Sally. "Meeting the Substance Abuse Treatment Needs of Lesbian, Bisexual and Transgender Women: Implications from Research to Practice." Substance Abuse and Rehabilitation3, no. 1 (2012): 27-36. doi:10.2147/sar.s26430.
Strathdee, Steffanie A., David D. Celentano, Nina Shah, Cynthia Lyles, Veronica A. Stambolis, Grace Macalino, Kenrad Nelson, and David Vlahov. "Needle-exchange Attendance and Health Care Utilization Promote Entry into Detoxification." Journal of Urban Health 76, no. 4 (December 1999): 448-60. doi:10.1007/bf02351502.
"Substance Use Disorders." Substance Use Disorders | SAMHSA - Substance Abuse and Mental Health Services Administration. September 30, 2014. https://www.samhsa.gov/disorders/substance-use.
Sullivan, Christopher J., Lesli Blair, Edward Latessa, and Carrie Coen Sullivan. "“Juvenile Drug Courts and Recidivism: Results from a Multisite Outcome Study”." Justice Quarterly 33, no. 2 (May 12, 2014): 291-318. doi:10.1080/07418825.2014.908937.
"Supervised Consumption Services." Drug Policy Alliance. http://www.drugpolicy.org/issues/supervised-consumption-services.
Thanos, Panayotis K et al. "Chronic Forced Exercise during Adolescence Decreases Cocaine Conditioned Place Preference in Lewis Rats." Behavioural Brain Research 215, no. 1 (December 20, 2010): 77-82.
The National Center on Addiction and Substance Abuse. Ending the Opioid Crisis: A Practical Guide for State Policymakers. Report. October 2017. https://www.centeronaddiction.org/sites/default/files/Ending the Opioid Crisis_A Practical Guide for State Policymakers_The National Center on Addiction and Substance Abuse_October 2017_0.pdf.
The President's Commission on Combatting Drug Addiction and the Opioid Crisis. November 1, 2017. https://www.whitehouse.gov/sites/whitehouse.gov/files/images/Final_Report_Draft_11-1-2017.pdf.
Timko, Christine, Nicole R. Schultz, Michael A. Cucciare, Lisa Vittorio, and Christina Garrison-Diehn. "Retention in Medication-assisted Treatment for Opiate Dependence: A Systematic Review." Journal of Addictive Diseases 35, no. 1 (2016): 22-35. doi:10.1080/10550887.2016.1100960.
Tookes, Hansel E., Alex H. Kral, Lynn D. Wenger, Gabriel A. Cardenas, Alexis N. Martinez, Recinda L. Sherman, Margaret Pereyra, David W. Forrest, Marlene Lalota, and Lisa R. Metsch. "A Comparison of Syringe Disposal Practices among Injection Drug Users in a City with versus a City without Needle and Syringe Programs." Drug and Alcohol Dependence 123, no. 1-3 (June 1, 2012): 255-59. doi:10.1016/j.drugalcdep.2011.12.001.
Tracy, Kathleen, and Samantha P. Wallace. "Benefits of Peer Support Groups in the Treatment of Addiction." Substance Abuse Rehabilitation 7 (2016): 143-54.
Tsui, Judith I., Jennifer L. Evans, Paula J. Lum, Judith A. Hahn, and Kimberly Page. "Association of Opioid Agonist Therapy With Lower Incidence of Hepatitis C Virus Infection in Young Adult Injection Drug Users." JAMA Internal Medicine 174, no. 12 (December 2014): 1974-981. doi:10.1001/jamainternmed.2014.5416.
U.S. Department of Health and Human Services (HHS), Office of the Surgeon General, Facing Addiction in America: The Surgeon General’s Report on Alcohol, Drugs, and Health. Washington, DC: HHS, November 2016. https://addiction.surgeongeneral.gov/sites/default/files/surgeon-generals-report.pdf
190
Walley, A. Y., Z. Xuan, H. H. Hackman, E. Quinn, M. Doe-Simkins, A. Sorensen-Alawad, S. Ruiz, and A. Ozonoff. "Opioid Overdose Rates and Implementation of Overdose Education and Nasal Naloxone Distribution in Massachusetts: Interrupted Time Series Analysis." Bmj 346 (January 31, 2013). doi:10.1136/bmj.f174.
Walton MA, Chermack ST, Shope JT, et al. Effects of a Brief Intervention for Reducing Violence and Alcohol Misuse Among AdolescentsA Randomized Controlled Trial. JAMA. 2010;304(5):527–535. doi:10.1001/jama.2010.1066
Wodak, Alex, and Annie Cooney. Effectiveness of Sterile Needle and Syringe Programming in Reducing HIV/AIDS Among Injecting Drug Users. Report. World Health Organization. 2004. http://www.who.int/hiv/pub/prev_care/effectivenesssterileneedle.pdf?ua=1.
Wood, Evan, Mark W. Tyndall, Zhenguo Qui, Ruth Zhang, Julio S. G. Montaner, and Thomas Kerr. "Service Uptake and Characteristics of Injection Drug Users Utilizing North America’s First Medically Supervised Safer Injecting Facility." American Journal of Public Health 96, no. 5 (May 1, 2006): 770-73. doi:10.2105/ajph.2004.057828.
Wood, Evan, Thomas Kerr, Will Small, Kathy Li, David C. Marsh, Julio SG Montaner, and Mark W. Tyndall. "Changes in Public Order after the Opening of a Medically Supervised Safer Injecting Facility for Illicit Injection Drug Users." Canadian Medical Association Journal 171, no. 7 (September 28, 2004): 731-34. doi:10.1503/cmaj.1040774.
Yanovitzky, Itzhak. "The American Medicine Chest Challenge: Evaluation of a Drug Take-Back and Disposal Campaign." Journal of Studies on Alcohol and Drugs 77, no. 4 (July 2016): 549-55. doi:10.15288/jsad.2016.77.549.
Zhang, Lei, Xi Chen, Jun Zheng, Junshi Zhao, Jun Jing, Jun Zhang, Eric Pf Chow, and David P. Wilson. "Ability to Access Community-based Needle-syringe Programs and Injecting Behaviors among Drug Users: A Cross-sectional Study in Hunan Province, China." Harm Reduction Journal10, no. 8 (May 7, 2013). doi:10.1186/1477-7517-10-8.
Zshucke, Elizabeth, Katharina Gaudlitz, and Andreas Strohle. "Exercise and Physical Activity in Mental Disorders: Clinical and Experimental Evidence." Journal of Preventive Medicine & Public Health 46, no. Suppl 1 (2013): S12-21.
Zule WA et al, “Methamphetamine use and risky sexual behaviors during heterosexual encounters.” Sexually Transmitted Diseases 34, no. 9 (September 2007).
191
Source List
1 Alaska Department of Labor and Workforce Development. Alaska Labor Force Data, State of Alaska, 9 Jan. 2019, live.laborstats.alaska.gov/pop/index.cfm (accessed February 2019). 2 “U.S. Census Bureau QuickFacts: Anchorage Municipality, Alaska (County).” Census Bureau QuickFacts, United States Census Bureau, www.census.gov/quickfacts/fact/table/anchoragemunicipalityalaskacounty/PST045217 (accessed February 2019). 3 Data Dashboard, Anchorage Coalition to End Homelessness, 2019, https://anchoragehomeless.org/get-the-facts/data-dashboard/ (accessed September 2018-February 2019). 4 Babor, Thomas F, et al. Drug Policy and the Public Good. Second ed., Oxford, 2018 (accessed January 2019). 5 Drugs of Abuse: A DEA Resource Guide. US Department of Justice Drug Enforcement Agency, 2017 (accessed January 2019). 6 National Institute on Drug Abuse. “National Institute on Drug Abuse (NIDA).” NIDA, www.drugabuse.gov/ (accessed November 2018-February 2019). 7 Botticelli MP, Koh HK. Changing the Language of Addiction. JAMA. 2016; 316(13):1361–1362 (accessed October 2018). 8 Diagnostic and Statistical Manual of Mental Disorders. American Psychiatric Association, 2013 (accessed February 2019). 9 Substance Abuse and Mental Health Administration. Impact of the DSM-IV to DSM-5 Changes on the National Survey on Drug Use and Health. Center for Behavioral Statistics and Quality, 2016, (accessed February 2019). 10 Substance Abuse and Mental Health Administration. 2015-2016 National Survey on Drug Use and Health: Model-Based Prevalence Estimates (50 States and District of Columbia). 2016 (accessed December 2018). 11 Substance Abuse and Mental Health Administration. 2016-2017 National Survey on Drug Use and Health: Model-Based Prevalence Estimates (50 States and District of Columbia). 2017 (accessed December 2018). 12 Alaska Department of Health and Social Services. Alaska Vital Statistics 2017 Annual Report. Division of Public Health, 2018 (accessed January 2019). 13 Alaska Health Analytics and Vital Records. Anchorage Drug Overdose Mortality Data, 2013-2018. 2019 (accessed January 2019). 14 Alaska Health Analytics and Vital Records. Health Facilities Reporting Data. Alaska Division of Public Health, 2016-2017 (accessed January 2019). 15 Anchorage Office of Children's Services. Characteristics Identified at the Time of Intake. September 2018 – February 2019 (accessed February 2019). 16 Alaska Health Analytics and Vital Records. Alaska Facts and Figures: 2017 Drug Overdose Mortality Update. Alaska Division of Public Health, 2017 (accessed October 2018). 17 Alaskan AIDS Assistance Association (Four A’s) FY17, FY18, July 2018-February 27, 2019 Reports (accessed February 2019). 18 Alaska Department of Health and Social Services. “Alaska Youth Risk Behavioral Surveillance System.” YRBSS Dataset, http://ibis.dhss.alaska.gov/query/selection/yrbsl23/YRBSSelection.html (accessed November 2018-February 2019). 19 Anchorage School District. Student Suspensions, Anchorage School District, 19 Feb. 2019, https://public.tableau.com/profile/asdk12#!/vizhome/BehaviorDashboardPublic/StudentSuspensionsoverview (accessed February 2019). 20 Alaska Department of Commerce, Community, and Economic Development. “Controlled Substances Dispensing.” Received by Pharmacists, Division of Corporations, Business and Professional Licensing, 23 Jan. 2019, www.commerce.alaska.gov/web/portals/5/pub/pha_ControlledSubstanceDispensing_2019.01.pdf (accessed February 2019). 21 Hanson, Bridget L, and Rebecca R. Porter. Project HOPE Naloxone Distribution & Administration Anchorage Data Summary: 2017-2018. March 1, 2019. UAA Institute of Social and Economic Research, Center for Behavioral Health Research and Services. 22 Centers for Disease Control and Prevention. Opioid Overdose, Centers of Disease Control and Prevention Division of Unintentional Injury Prevention, 19 Oct. 2018, www.cdc.gov/drugoverdose/ (accessed December 2018). 23 Anchorage Fire Department. Illicit Substances of Abuse (January 2016 - December 2018). 2019 (accessed January 2019). 24 Substance Abuse and Mental Health Administration. 2014-2016 National Survey on Drug Use and Health: Substate Region Estimates. 2016 (accessed December 2018). 25 Filley, Jessica, and Deborah Hull-Jilly. Epidemiology Bulletin: Health Impacts of Opioid Misuse in Alaska. State of Alaska Epidemiology, August 8 2018, (accessed September 2018). 26 Alaska Health Analytics and Vital Records. Alaska Facts and Figures: 2016 Alaska Resident Drug Overdose Outpatient Visits and Inpatient Hospitalizations. Alaska Division of Public Health, 2016 (accessed January 2019).
192
27 Alaska Health Analytics and Vital Records. Alaska Facts and Figures: 2017 Alaska Resident Drug Overdose Outpatient Visits and Inpatient Hospitalizations. Alaska Division of Public Health, 2017 (accessed January 2019). 28 Pitt, Allison L, Keith Humphreys, Margaret L Brandeau. “Modeling Health Benefits and Harms of Public Policy Responses to the US Opioid Epidemic.” American Journal of Public Health, vol. 108, no. 10, Oct. 2018, pp.1394-1400 (accessed October 2018). 29 Anchorage Health Department. Four A's Syringe Services Program Survey. November-December 2018. 30 Centers for Disease Control and Prevention. Trends in the Prevalence of Marijuana, Cocaine, and Other Illegal Drug Use National YRBS: 1991-2017. Centers for Disease Control and Prevention Division of Adolescent and School Health, 2018 (accessed December 2018). 31 Mars, Sarah G, et al. “Illicit Fentanyls in the Opioid Street Market: Desired or Imposed?” Addiction, Addiction Debate, 4 Dec. 2018. Wiley Online Library (accessed February 2019). 32 State Health Access Data Assistance Center (SHADAC) analysis of US Drug Enforcement Agency’s Automated Reports and Consolidated Ordering System Retail Drug Summary Reports, State Health Compare, SHADAC, University of Minnesota, https://statehealthcompare.shadac.org, (accessed January 2019). 33 Alaska Department of Health and Social Services. Helping Babies with Neonatal Abstinence Syndrome. November 2017, http://dhss.alaska.gov/dph/wcfh/Documents/perinatal/NAS%20Booklet.pdf (accessed January 2019). 34 Sanlorenzo, Lauren A et al. “Neonatal abstinence syndrome: an update” Current opinion in pediatrics vol. 30,2 (2018): 182-186 (accessed January 2019). 35 Alaska Department of Health and Social Services. Heroin and Opioids in the Last Frontier: Alaska Opioid Data Dashboard. 2018, http://dhss.alaska.gov/dph/Director/Pages/heroin-opioids/data.aspx (accessed September 2018 - January 2019). 36 Coughlin, Laura, and Deborah Hull-Jilly. Epidemiology Bulletin: Health Impacts of Methamphetamine Use in Alaska. State of Alaska Epidemiology, November 7 2017 (accessed September 2018). 37 State Health Access Data Assistance Center (SHADAC) analysis of Centers for Disease Control and Prevention, National Center for Health Statistics via CDC WONDER Database, State Health Compare, SHADAC, University of Minnesota, https://statehealthcompare.shadac.org, (accessed January 2019). 38 Springer, Yuri P, et al. Increase in Adverse Reactions Associated with Use of Synthetic Cannabinoids - Anchorage, Alaska 2015-2016. Morbidity and Mortality Weekly Report Vol. 65 No. 40. US Department of Health and Human Services/Centers for Disease Control and Prevention, 2016 (accessed October 2018). 39 National Cannabis Industry Association. State by State Marijuana Policies, 2019, https://thecannabisindustry.org/ncia-news-resources/state-by-state-policies/ (accessed January 2019). 40 Alaska Department of Health and Social Services Division of Public Health. Get the Facts About Marijuana, 2019, https://dhss.alaska.gov/dph/director/pages/marijuana/law.aspx (accessed January 2019). 41 Alaska Department of Health and Social Services. “Alaska Behavioral Risk Factor Surveillance System.” BRFSS Dataset, https://ibis.dhss.alaska.gov/query/selection/brfss23/BRFSSSelection.html (accessed November 2018-February 2019). 42 Alaska Department of Health and Social Services. “Alaska Pregnancy Risk Assessment Monitoring System.” PRAMS Dataset, http://ibis.dhss.alaska.gov/query/selection/prams23/PRAMSSelection.html (accessed November 2018-February 2019). 43 Hall, WD, and M Lynskey. “Is Cannabis a Gateway Drug? Testing Hypotheses about the Relationship between Cannabis Use and the Use of Other Illicit Drugs.” Drug and Alcohol Review, vol. 24, no. 1, Jan. 2005, pp. 39–48. PubMed (accessed December 2018). 44 Fairman, Brian J, et al. “When Marijuana Is Used before Cigarettes or Alcohol: Demographic Predictors and Associations with Heavy Use, Cannabis Use Disorder, and Other Drug-Related Outcomes.” Prevention Science, 2018, pp. 1–9. Springer Link (accessed February 2019). 45 American Lung Association. Report Card: Alaska, 2019, www.lung.org/our-initiatives/healthy-air/sota/city-rankings/states/alaska/ (accessed January 2019). 46 University of Michigan Institute for Social Research. Monitoring the Future Report 2018. 2018, (accessed December 2018). 47 Spindle TR, Cone EJ, Schlienz NJ, et al. “Acute Effects of Smoked and Vaporized Cannabis in Healthy Adults Who Infrequently Use Cannabis: A Crossover Trial.” JAMA Network Open. Vol. 1, no. 7, 2018. 48 National Institute on Alcohol Abuse and Alcoholism. Alcohol's Effects on the Body, National Institutes of Health, www.niaaa.nih.gov/ (accessed January 2019). 49 Pachoe, Madison. Epidemiology Bulletin: Health Impacts of Alcohol Misuse in Alaska. State of Alaska Epidemiology, May 7 2018, (accessed September 2018). 50 Centers for Disease Control and Prevention. Fetal Alcohol Spectrum Disorders (FASDs). Division of Birth Defects and Developmental Disabilities, 2018, https://www.cdc.gov/ncbddd/fasd/index.html (accessed January 2019). 51 Centers for Disease Control and Prevention. HIV/AIDS: Syringe Services Programs. Division of HIV/AIDS Prevention, 13 Dec. 2018, https://www.cdc.gov/hiv/risk/ssps.html (accessed December 2018).
193
52 Boyette, Melissa, and Jessica Harvill. HIV Surveillance Report - Alaska, 1982-2017. Alaska Division of Public Health Section of Epidemiology, 2018 (accessed October 2018). 53 Alaska Department of Health and Social Services. Hepatitis C, https://dhss.alaska.gov/dph/Epi/id/Pages/hepatitis/c.aspx (accessed December 2018). 54 Alaska Drug Enforcement Agency. Drug Takeback Day Weights 2013-2018, (accessed December 2018). 55 Hwang, Stephen W. “Homelessness and Health.” Canadian Medical Association Journal, vol. 164, no. 2, 23 Jan. 2001, pp. 229–233. PMC (accessed January 2019). 56 US Department of Housing and Urban Development. Annual Homeless Assessment Report (AHAR) to Congress. 2013-2016, (accessed January 2019). 57 Seattle.gov. Homelessness Response: The Roots of the Crisis, City of Seattle, www.seattle.gov/homelessness/the-roots-of-the-crisis (accessed January 2019). 58 Roos, Leslie E, et al. “Relationship Between Adverse Childhood Experiences and Homelessness and the Impact of Axis I and II Disorders.” American Journal of Public Health, vol. 103, no. 2, Dec. 2013, pp. S275–S281. PMC (accessed December 2018). 59 Herman, DB, et al. “Adverse Childhood Experiences: Are They Risk Factors for Adult Homelessness?” American Journal of Public Health, vol. 87, no. 2, Feb. 1997, pp. 249–255. PMC (accessed December 2018). 60 Chauvet, Claudia et al. “Environmental enrichment reduces cocaine seeking and reinstatement induced by cues and stress but not by cocaine” Neuropsychopharmacology: official publication of the American College of Neuropsychopharmacology vol. 34, 13 (2009): 2767-78 (accessed November 2018). 61 Solinas, M, et al. “Environmental Enrichment during Early Stages of Life Reduces Behavioral, Neurochemical, and Molecular Effects of Cocaine.” Neuropsychopharmacology, vol. 34, no. 5, Apr. 2009, pp. 1002–1011. PubMed (accessed November 2018). 62 Nader, J, et al. “Loss of Environmental Enrichment Increases Vulnerability to Cocaine Addiction.” Neuropsychopharmacology, vol. 37, no. 7, June 2012, pp. 1579–1587. PubMed (accessed November 2018). 63 Milkman, Harvey B. Iceland Succeeds at Reversing Teenage Substance Abuse The US Should Follow Suit. 2016 (accessed November 2018). 64 Centers for Disease Control and Prevention. Adverse Childhood Experiences (ACEs), Centers for Disease Control and Prevention Violence Prevention, 1 Apr. 2016, www.cdc.gov/violenceprevention/childabuseandneglect/acestudy/index.html?CDC_AA_refVal=https://www.cdc.gov/violenceprevention/acestudy/index.html (accessed October 2018). 65 STAR Alaska. Statistics. http://www.staralaska.com/statistics.html (accessed January 2019). 66 Alaska Health Analytics and Vital Records. Alaska Facts and Figures: 2013-2017 Alaska Resident Leading Causes of Death. Alaska Division of Public Health, 2018 (accessed October 2018). 67 Substance Abuse and Mental Health Services Administration. Key substance use and mental health indicators in the United States: Results from the 2016 National Survey on Drug Use and Health. 2017. Rockville, MD: Center for Behavioral Health Statistics and Quality, Substance Abuse and Mental Health Services Administration (accessed January 2019). 69 Anchorage School District. “School Climate and Connectedness Survey.” https://www.asdk12.org/Page/4323 (accessed March 2019).


