Embed Size (px)
Citation preview
MYERS-BRIGGS TYPE INDICATOR PREFERENCE SCORES AND AGE
By
RICHARD IVOR KAINZ
A DISSERTATION PRESENTED TO THE GRADUATE SCHOOL OF THE UNIVERSITY OF FLORIDA IN PARTIAL FULFILLMENT OF THE REQUIREMENTS FOR THE DEGREE OF DOCTOR OF PHILOSOPHY
UNIVERSITY OF FLORIDA
1985
ACKNOWLEDGEMENTS
I would like to acknowledge, first, the patient support
and encouragement I have received from the members of my
supervisory committee. Particularly I would like to thank
my committee chair, Dr. Benjamin Barger, who was always
available when advice or review of the materials was
needed and Dr. Margaret K. Morgan, whose editorial assist
ance went far beyond the call of duty. I owe a very deep
debt to Dr. Mary H. McCaulley, who during my apprenticeship
in psychology has been the greatest influence on my work: as
a mentor, as a model of academic and professional integrity,
and as a friend. Her dedication to humane ideals has been a
constant inspiration to my own efforts to be of service.
wi thout her guidance and support this work would not have
been begun, much less completed.
I also acknowledge the support of the Center for
Applications of Psychological Type (CAPT), which has allowed
me to use the CAPT Myers-Briggs Type Indicator data bank in
this investigation and has permitted me to take leave from
my duties when this project required my time. Glenn
Grennade, data processing manager for CAPT, contributed
greatly in preparing the data selection and item analyses
computer programs I have used in the study. I appreciate
the interest and support for this proj ect of the entire
staff of CAPT.
ii

I am thankful to the friends and family who share my
life and home for supportively accepting in their midst a
person writing a doctoral dissertation. Their cheerful
affection during the preparation of this manuscript is
greater evidence of their love than I could wish for. In
particular, Deidre Bryan provided invaluable assisstance in
the editing of the final manuscript. Most important has
been Maria Cristina's patience and loving support while this
work took up so much of the time and attention that were
rightfully hers.
Finally, I lovingly dedicate this work to the person
who taught me to love scholarship and who was my first
teacher, Maxine Lenore Kitterman, my mother. Her contribu
tion is incalculable.
iii
TABLE OF CONTENTS
ACKNOWLEDGMENTS • ..
• • • • • • 11
TABLE OF CONTENTS . . iv
LIST OF TABLES · . . . . vi
LIST OF FIGURES . · . . ix
ABSTRACT x
CHAPTERS
I
II
III
IV
INTRODUCTION 1
Purpose of the Study • • • • . . . . . . . . • . . 1 Overview of the Problem . . . . . . . . . . . . . 3 Jung's Theory of Psychological Types ••..... 11 Description and History of the Myers-Briggs
Type Indicator . . . • . .. ..•.•... 28 History of the MBTI Item Weights • . . • • . . . • 33 Review of the Research Literature: Psychological
Type and Age • • . . . . . . . . . . . . . . . . 39 Summary of the Problem . . . . . . . . . . . . . . 49 Research Predictions • • • • . . • . • • • 57
METHODS • 68
Introduction . .....•• • • . . . 68 Selection of the Sample. • • • • . • . . • . • . • 68 Potential Sources of Sampling Bias • • . . . . . . 70 Analyses of Variance and Regression Analyses . . . 71 Homogeneity of Variance in the Sample . . • . 73 Analyses of the Item Weights . . . . . . . . . . . 73 Computer Software Used in Sample Selection and
Data Analyses . . . . . . • . . . • • . 76
RESULTS • • • 78
Introduction . . . . . • . . . . . . . . • . . . . 78 Analyses of Variance and Regression Analyses . . . 79 Analyses of the Item Weights . . .. ..... 98
SUMMARY, DISCUSSION, AND CONCLUSIONS.
Summary of the Study • . Discussion . . . • • . • . Conclusions . • • • • • •
iv
· •. 141
· • . • . 141 · • . . . 155 · . . . . 161

Recommendations for Further Investigation
APPENDIX: RESULTS FROM THE PILOT STUDY
REFERENCES
BIOGRAPHICAL SKETCH .
v
.162
. • . . .165
.170
.173
LIST OF TABLES
Table 1. Dominant and Auxiliary Attitude-Functions of MBTI Types . . . . . . . . . . . . . . . . . 63
Table 2. Predicted Changes of MBTI Preference Scores by Types. . . . . . . . . . . . . . •• 64
Table 3. MBTI Types Jung Grouped as Rational and Irrational. . . . .. ...... .... 65
Table 4. MBTI Types Sharing Dominant or Auxiliary Atitude-Fuctions • • • • . • • • . . . 65
Table 5. Predicted Changes of MBTI Preference Scores by Groups of Types . . . . . . . . . . • . . . 66
Table 6. Sample Frequencies per Gender for Age Groups. · .77
Table 7. Analyses of Variance: EI by Age Groups. · · · · 110
Table 8. Analyses of Variance: EI by Developmental Stages. . . . . . · · · · · 110
Table 9. Regressions of EI by Age: All Ages. · · · · 110
Table 10. Regressions of EI by Age: Stage Two. · · · · · III
Table II. Regressions of EI by Age: Stage Three. · · III
Table 12. Analyses of Variance: JP by Age Groups. · · · .114
Table 13. Analyses of Variance: JP by Developmental Stages. . . . . · · · · · .114
Table 14. Regressions of JP by Age: All Ages. · · · · · .115
Table 15. Regressions of JP by Age: Stage Two. · · · · · 115
Table 16. Regressions of JP by Age: Stage Three. · · 116
Table 17. Analyses of Variance: SN by Age Groups. · · · .119
Table 18. Analyses of Variance: SN by Developmental Stages. . . . . · · · · · .119
Table 19. Regressions of SN by Age: All Ages. · · · · · .120
Table 20. Regressions of SN by Age: Stage Two. · · · · · 120
vi
Table 2l. Regressions of SN by Age: stage Three. · · · · 121
Table 22. Analyses of Variance: Auxiliary SN by Age Groups. . . . . . · · . . · · · · · · · .124
Table 23. Analyses of Variance: Auxiliary SN by Developmental stages. · · · · · · · · · .124
Table 24. Regressions of Auxiliary SN by Age: All Ages ................... 125
Table 25. Regressions of Auxiliary SN by Age: stage Two ...••.•...•..•.•.. 125
Table 26. Regressions of Auxiliary SN by Age: stage Three .....••.•.•..•... 126
Table 27. Analyses of Variance: TF by Age Groups ..... 129
Table 28. Analyses of Variance: TF by Developmental stages ...
Table 29. Regressions of TF by Age: All Ages.
Table 30. Regressions of TF by Age: stage Two.
· .
Table 3l. Regressions of TF by Age: stage Three.
Table 32. Analyses of Variance: Auxiliary TF by Age Groups. . . . . . · · . . · · ·
Table 33. Analyses of Variance: Auxiliary TF by
· .129
· · · · .130
· · · · 130
· · · · 131
· · · · .134
Developmental Stages. •. ........134
Table 34. Regressions of Auxiliary TF by Age: Age Groups .........•........ 135
Table 35. Regressions of Auxiliary TF by Age: stage Two ..••.••........•.. 135
Table 36. Regressions of Auxiliary TF by Age: stage Three. . . . . • . .. .•.... 136
Table 40. Point Deviations By Age Groups: EI Items. .137
Table 41. Point Deviations By Age Groups: SN Items. .138
Table 42. Point Deviations By Age Groups: TF Items .... 139
Table 43. Point Deviations By Age Groups: JP Items. .140
vii

Table 44. Number of MBTI Items Having out-of-range Response Weights .•............. 164
Table 45. Summary Anovas By Age Groups: pilot Study ..• 165
viii
LIST OF FIGURES
Figure l. Mean EI Preference Scores by Age Groups. · · · 109
Figure 2 . Mean JP Preference Scores by Age Groups: Extraverts. · · · · · · · · · · · . . · · · .112
Figure 3 . Mean JP Preference Scores by Age Groups: Introverts. · · · · · · · · · · · · · · 113
Figure 4. Mean SN Preference Scores by Age Groups: Extraverts. · · · · · · · · · · · . . · · · .117
Figure 5. Mean SN Preference Scores by Age Groups: Introverts. · · · · · · · · · · · · · · .118
Figure 6. Mean Auxiliary SN Preference Scores by Age Groups: Introverts. . . . •. . ... 122
Figure 7. Mean Auxiliary SN Preference Scores by Age Groups: Extroverts. • . • .. . ... 123
Figure 8. Mean TF Preference Scores by Age Groups: Extraverts .•.....•..•....... 127
Figure 9. Mean TF Preference Scores by Age Groups: Introverts. . . . . .. . ..•..... 128
Figure 10. Mean Auxiliary TF Preference Scores by Age Groups: Introverts. . . . . . · · · 132
Figure 1l. Mean Auxiliary TF Preference Scores by Age Groups: Extraverts. . . . . . · 133
Figure 12. Mean EI Preference Scores: pilot Study. · · · 166
Figure 13. Mean SN Preference Scores: pilot Study. · · · 167
Figure 14. Mean TF Preference Scores: pilot Study. · · · 168
Figure 14. Mean JP Preference Scores: pilot Study. · · · 169
ix
Abstract of Dissertation Submitted to the Graduate School of the University of Florida in Partial Fulfillment of the
Requirements for the Degree Doctor of Philosophy
MYERS-BRIGGS TYPE INDICATOR PREFERENCE SCORES AND AGE
By
Richard Ivor Kainz
December, 1985
Chairman: Benjamin Barger Major Department: Clinical Psychology
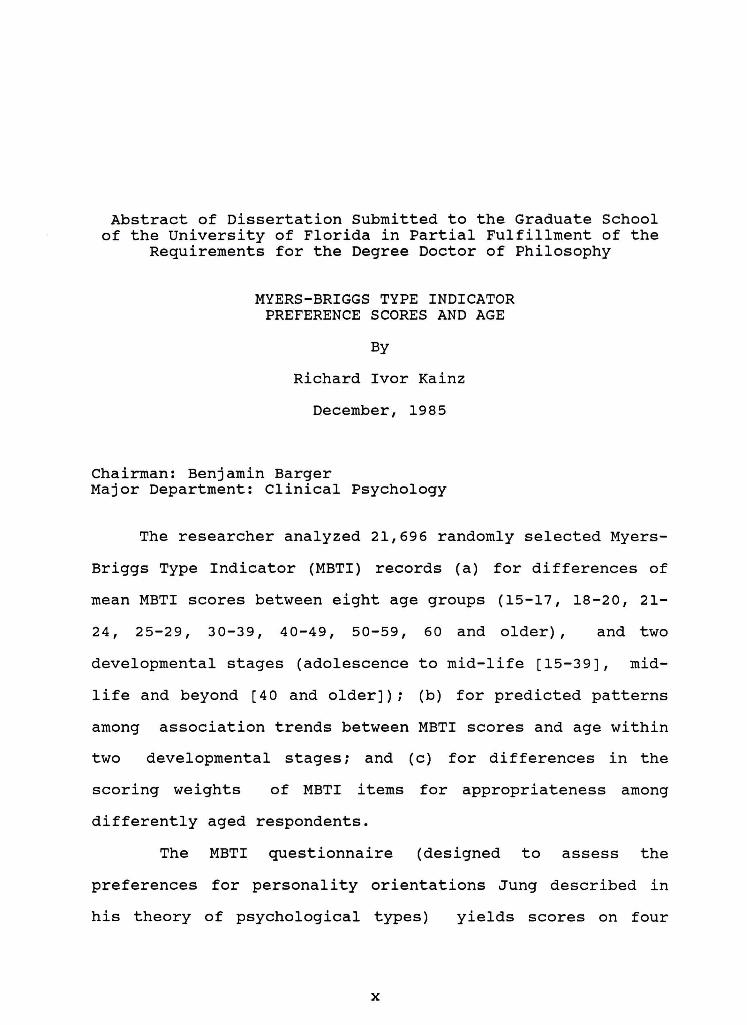
The researcher analyzed 21,696 randomly selected Myers-
Briggs Type Indicator (MBTI) records (a) for differences of
mean MBTI scores between eight age groups (IS-17, 18-20, 21-
24, 2S-29, 30-39, 40-49, SO-S9, 60 and older), and two
developmental stages (adolescence to mid-life [IS-39], mid-
life and beyond [40 and older]); (b) for predicted patterns
among association trends between MBTI scores and age within
two developmental stages; and (c) for differences in the
scoring weights of MBTI items for appropriateness among
differently aged respondents.
The MBTI questionnaire (designed to assess the
preferences for personality orientations Jung described in
his theory of psychological types) yields scores on four
x
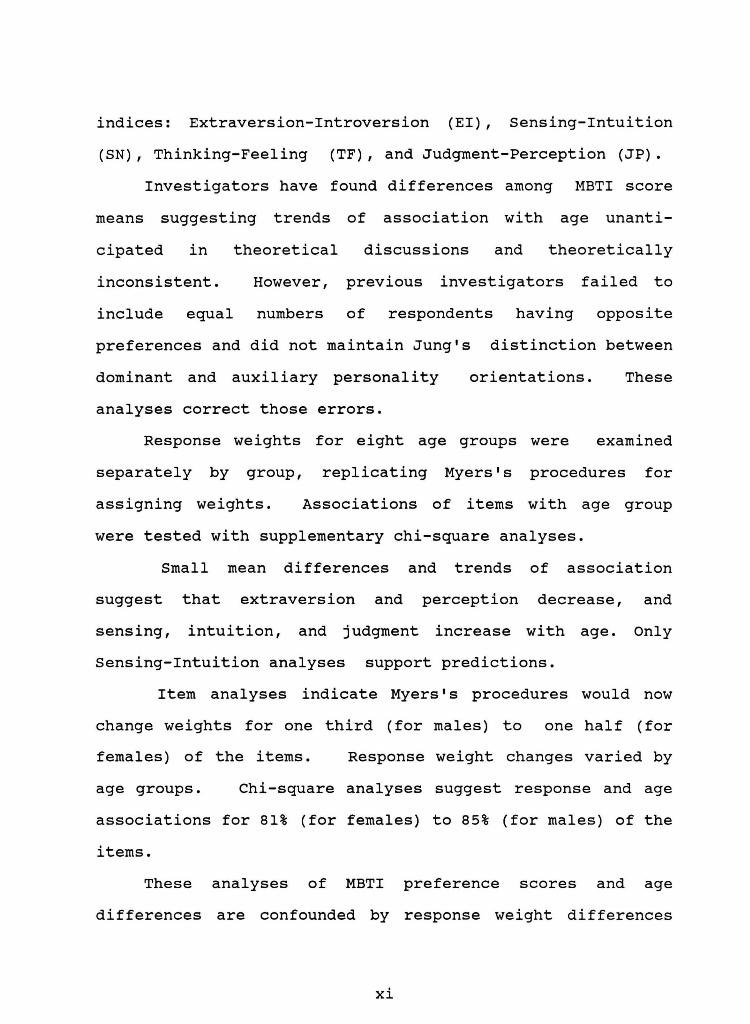
indices: Extraversion-Introversion (EI), Sensing-Intuition
(SN), Thinking-Feeling (TF), and Judgment-Perception (JP).
means
MBTI score Investigators have found differences among
suggesting trends of association with age unanti
theoretically cipated in theoretical discussions and
inconsistent. However, previous investigators failed to
include equal numbers of respondents having opposite
preferences and did not maintain Jung's distinction between
dominant and auxiliary personality orientations. These
analyses correct those errors.
Response weights for eight age groups were examined
separately by group, replicating Myers's procedures for
assigning weights. Associations of items with age group
were tested with supplementary chi-square analyses.
Small mean differences and trends of association
suggest that extraversion and perception decrease, and
sensing, intuition, and judgment increase with age. Only
Sensing-Intuition analyses support predictions.
Item analyses indicate Myers's procedures would now
change weights for one third (for males) to one half (for
females) of the items. Response weight changes varied by
age groups. Chi-square analyses suggest response and age
associations for 81% (for females) to 85% (for males) of the
items.
These analyses of MBTI preference scores and age
differences are confounded by response weight differences
xi
for differently aged respondents. Reliable analyses cannot
be performed until the response weights are updated.
The investigator recommends updating the MBTI response
weights, developing normative MBTI data for older
respondents, and distinguishing between generational and
longitudinal effects in future research.
xii
CHAPTER I INTRODUCTION
Purpose of the study
Carl Jung, the Swiss physician and psychologist,
published a theory of psychological types in 1921. within
this theory, Jung described and organized his observations
of personality differences that he believed to be basic and
differing orientations of normal consciousness. At its core
the Jungian typology is a cognitive rather than motivational
theory, based on Jung's observation that conscious
information processing and decision making are organized by
two complementary but opposing functions of perception
(sensation and intuition), and by two complementary but
opposing functions of judgment (thinking and feeling). Jung
observed also that the functions operate in one of two
complementary but opposing general orientations, or
atti tudes, which differentially focus consciousness toward
either external objects (extraversion) or internal objects
(introversion). The habitual use of one of these attitude-
function combinations, to the relative exclusion of the
others, results in the development of characteristics of
personality that Jung considered to be a psychological type.
Jung considered the development of habitual preferences for
a dominant attitude-function combination allied with a
lesser developed auxiliary attitude-function combination to
1
2
be an enduring and stable mark of normal ego growth (Jung
1968, 1971; Jacobi, 1973).
Katherine Briggs and Isabel Briggs Myers developed the
Myers-Briggs Type Indicator (MBTI) (Myers, 1975, 1977) to
make operational Jung's theory and published the MBTI Form F
in 1962. After 14 years of use as a research instrument,
the MBTI became widely available in 1976 for applied use.
The MBTI is now used with increasing frequency in a variety
of circumstances, including individual, marital, family,
pastoral, academic, and career counseling, and also in
management or organizational development consultation for a
variety of public and private institutions. Although
investigators focused research and applications of the MBTI
between 1962 and 1976 on samples of high school and college
students, broader applications are generalizing the
successful research reported for student samples to adult
populations. Respondents who comprised the original samples
used in the development of the MBTI were mature adults.
However, in a series of efforts to restandardize the MBTI
respondents were students from the fourth grade into the
first year of college. The restandardized scoring proced
ures are now applied for respondents of all ages.
The purpose of this study was to analyze data from a
large and previously unavailable sample of MBTI records to
see whether differences predicted from theory for the
relative importance of psychological type preferences for
3
different age groups are reflected in the MBTI scores. If
differences in preference scores can be demonstrated for age
groups, the results of this study could lead to refinements
of the scoring procedures and/or interpretation of the MBTI
reports.
overview of the Problem
The Myers-Briggs Type Indicator (MBTI), Form F (Myers,
1975, 1977) is a self-report questionnaire explicitly
designed to assess the psychological type preferences Jung
described by in his theory. The questionnaire consists of
95 forced-choice items scored on four scales and 71
additional items included for research to individualize MBTI
reports. Scoring of the four scales is used to indicate a
respondent's preferences on the three dichotomous
personality orientations Jung postulated and a fourth
dichotomous personality orientation that Briggs and Myers
considered implicit in Jung's theory and necessary to
properly interpret relationships among orientations ex
plicitly described by Jung.
Scale scores are considered to be an intermediate step
to the sorting of respondents into personality type classi
fications; however, the authors of the MBTI and numerous
other researchers have employed the scale scores directly in
the study of the relationship of the typology to a variety
of criterion variables. Investigators have studied major
demographic variables of gender and occupation with respect
4
to the MBTI scales. Counselors often consider the
respondent's age in the interpretation of the MBTI, but have
little explicit theory and no reliable research to guide
their interpretative adjustments.
Scoring of the MBTI results in a preference score
(one for each of the four indices) expressed as a letter
indicating the direction of the preference and a number
quantifying the strength of the preference. The letter
indices are combined to produce a type formula representing
the individual's psychological type. The four scales are
Extraversion-Introversion (EI) , Sensing-Intuition (SN) ,
Thinking-Feeling (TF), and Judging-Perceptive (JP). A type
formula combines one of each of the pairs, such as ENFP or
ISTJ. Each respondent is classified into one of the 16
possible combinations of the preferences and is assigned
four preference scores, such as E17, N33, F25, P13, or lIS,
S23, T29, J9. In these two examples the individuals would
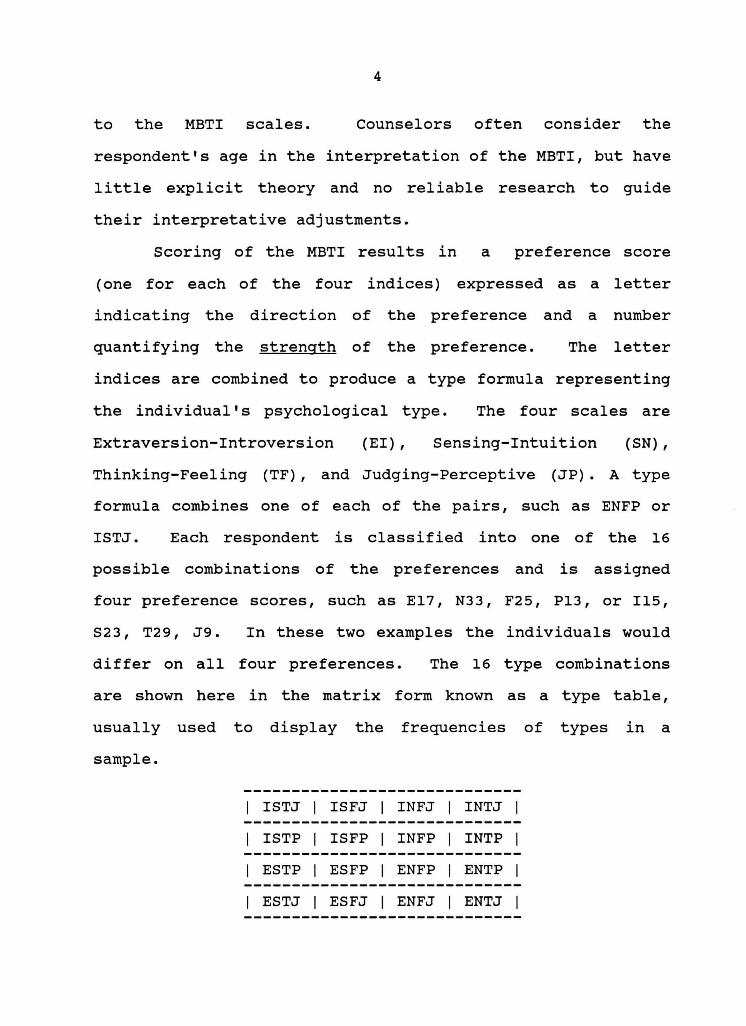
differ on all four preferences. The 16 type combinations
are shown here in the matrix form known as a type table,
usually used to display the frequencies of types in a
sample.
I ISTJ I ISFJ I INFJ I INTJ I
I ISTP I ISFP I INFP I INTP I
I ESTP I ESFP I ENFP I ENTP I
I ESTJ I ESFJ I ENFJ I ENTJ I
5
Broad searches of the computer databases of the
psychological research literature disclosed only one study
(Bloch, 1978) of the relationship of MBTI scale scores to
the respondents' age. Bloch found that regression analysis
associated higher scores for three (sensing, intuition, and
judging) of the eight preferences with increasing age. An
unpublished student paper submitted to the Center for
Applications of Psychological Type for inclusion in the
Isabel Myers Memorial Library collection of research
materials also reported MBTI types at two age levels. This
student, Susan Schaeffer (1974), found extraverts to occur
more frequently among a small sample of students over the
age of 35 ; however, she did not use scale scores in her
analyses.
Due to paucity of available data on MBTI scale scores
and age, the literature search also included studies of the
Jungian Type Survey (JTS) (Gray & Wheelwright, 1946). The
JTS (11th ed.), is a 75-item self-report questionnaire
scored on three scales representing the three dichotomous
personality orientations of Jung's theory. As with the
MBTI, the intent was to classify respondents into the
psychological types described by Jung. stricker and Ross
(reported in Myers, 1975) obtained high correlations among
47 male college students for the three scales common to the
two instruments. Myers concluded that after correction for
attenuation the three scales have their entire true-variance
6
components in common. Thus, JTS data should correlate with
MBTI data.
Al though investigators have done less research with
the JTS than with the MBTI, two have related the JTS scales
to the age of the respondents. Gray (1947b, 1948), using
regression analyses, found all three of the JTS scales to be
associated with age (introversion, sensing, and thinking
increased) in samples ranging over six decades. Driver
(1975) in a study of the elderly (mean age, 76.5; range, 55-
102 years) reported an increasing score with the progression
of age only for introversion.
In an analysis of the results reported for the MBTI
and the JTS altogether, investiigators twice reported
significant increases for introversion, once for
extraversion, twice for sensing, never for intuition, once
for thinking, never for feeling, once for judging, and never
for perceptive. The judging and perceptive preferences are
not assessed directly on the JTS scales.
Gray (1948) also reported the JTS scales to be
associated with gender (males having higher scores for
introversion, sensing, and thinking). He did not report
analyses in which he considered gender and age simul tan
eously.
Prior to conducting the literature search summarized
above, I conducted an exploratory analysis of 52,848 MBTI
Form F records contained in the MBTI data bank maintained by
7
the Center for Applications of Psychological Type. This
sample included all respondents reporting an age of 15 years
or greater (excluding scores for respondents omitting 35 or
more items). These MBTI records had been submitted to CAPT
for computer scoring from 1978 through 1982.
separate one-way analyses of variance on
preference scores at eight levels of age for
I performed
the eight
each sex.
These analyses produced significant differences among the
means of the eight preference scores when grouped by age
levels (see Appendix A, Table 42). However, the results
differ with respect to gender. All analyses of data from
females resulted in significant differences; two of the
analyses of data from males (extraversion and feeling) fell
just short of the .05 probability level. An inspection of
the means (plotted in Figures 12 through 15 in the Appendix)
suggests that more carefully controlled analyses are likely
to reveal systematic trends in the preference scores for
changes in age differentially for the respondents' gender
and type classification. A gender-by-age interaction
appears most probable for the extraverted and feeling
preferences.
These exploratory analyses are the first in which an
investigator attempted to separate the influence of gender
and age on scale scores of Jungian type indicators and in
this they are an improvement over the earlier studies. Yet
they are methodologically deficient in several respects,
8
with some problems in common withthe earlier studies. In
all of the studies summarized here the frequencies of the
ages, gender (except Gray, 1947b, 1948), and psychological
types of the respondents varied widely within each sample,
allowing the exaggerated influence of the over-represented
gender, ages, and types to be included in the analyses.
Only Bloch (1978) and Driver (1975) tested assumptions of
the comparability of variance of the dependent measures.
The findings of the published research and exploratory
analyses are of theoretical importance in so far as they
imply that individuals may change type preferences as they
age. A part of Jung' s theory is the idea that type
preferences are inborn or so thoroughly set early in child
hood as to be a lifelong pattern for the individual's
psychological differentiation. within the premises of the
theory an extravert does not later become an introvert, or
vice versa. However, theory does not preclude an extra-
vert, for example, from developing a greater appreciation of
and skill with introversion. In fact, such development is
considered necessary to overcome the one-sided development
of youth, making possible higher levels of personality
integration in later life. Nevertheless, an assumption of
the theory is that the type preferences differentiated by
early development will hold their relative dominance
throughout life.
9
The developers of the MBTI undertook the construction
with careful attention to the correct positioning of the
cutting scores, or mid-points, of the scales used as indices
of type preferences (Myers, 1961; Myers, 1975; Myers &
McCaulley, 1985). Myers has never asserted that the
respondent's true type preferences that Jung described in
his theory will always be reflected in the MBTI report.
McCaulley (Myers & McCaulley, 1985) cites several
circumstances that may interfere with the respondent's
ability or motivation to report type preferences on MBTI
scales. Notable among these are various forms of distortion
to conform with parental, societal, and occupational demands
fel t by the respondent, or administration of the MBTI to
respondents whose personality development is poorly
differentiated or who are in crisis. Myers and McCaulley
advised counselors that the error of measurement should
always be considered in the reporting of MBTI scores to
respondents, particularly when the preference scores are
low. The need for sensitive interpretation is advised on
the basis of a general, rather than a systematic, source of
error of measurement.
As a practical matter, the classification of
individuals into their types according to their positions on
the scales may be subject to systematic error if the items
and/or their associated weightings have differential
sensitivity to the manifestation of the type preferences at
10
different ages. This could arise through the inclusion of
item responses which reflect too great a specificity for
age-appropriate behaviors, or through changing perceptions
of the social desirability of certain responses as a result
of greater maturity and integration. If the items and the
item weights are not tested across the range of ages for
which they are to be used, the true cutting score would
shift from that prescribed by the scoring procedures. The
result would be the misclassification of individual
respondent's type preferences. Error of measurement is
unavoidable in any instrument, but when it can be determined
to be systematic every reasonable effort should be made to
eliminate it.
I undertook the present study for three purposes: (a)
to formulate a set of research predictions which may (in a
manner consistent with Jung's theory of psychological types
and the elaboration of that theory by Myers and others)
account for relationships associating MBTI preference scores
with age; (b) to provide a data analysis employing proper
statistical controls to identify age and age-by-gender
interactions with the MBTI preference scores, in order to
test the hypothetical formulations; and (c) to examine the
MBTI items scored for type preferences for the presence of
differential weights for age or age-by-gender combinations,
using the same item-analysis procedures described by Myers
11
(1962, 1978) with the addition of controls for age
differences.
Jung's Theory of Psychological Types
In designing this study I was concerned with the
association of MBTI preference scores with respondents'
ages. To develop research predictions that may account for
such an association, one must understand the Jungian theory
that guided the construction of the MBTI. The following
discussion is an explanation of the theoretical base for the
research predictions to be proposed.
Jung's theory of psychological types, initially
published in 1921, presents, "the various aspects of
consciousness, the various attitudes the conscious mind
might take toward the world, and thus constitutes a
psychology of consciousness regarded from what might be
called a clinical angle" (Jung, 1961, p. 207). Jung
considered the theory to reflect the clinical angle because
it derives not from his previous theoretical formulations,
or from experimental studies (as with his word-association
research), but from both his casual and his systematic
direct observational experience of his patients, colleagues,
and associates. Jung clearly continued to employ the
typology throughout his years of medical practice because he
found it essential to his psychotherapeutic work: "one
always has to answer people in their main function,
otherwise no contact is established" (Jung, 1968, p. 157).
12
Nevertheless, after completing his work Psychological Types
(Jung, 1971), he did not explicitly return to the subject to
offer further theoretical elaboration.
A possible explanation for the lack of elaboration may
lie in his frustration with the reception which the work
received (perhaps more with the admirers than the critics),
as evidenced by the following remarks: "there is little
practical purpose in making the typology still more
complicated when not even the elements have been properly
understood" (Jung, 1971, p. xii) and "my typology is far
rather a critical apparatus serving to sort out and organize
the welter of empirical material, but not in any sense to
stick labels on people at first sight" (Jung, 1971, p. xiv).
Clearly Jung intended his theory of personality types to be
understood within the broader context of his psychological
views of human development, rather than as an isolated
system of classification. Edinger asserts "Jung made no
effort to present a systematic theory of psychological
development" (1968, p. 8), and his followers who have done
so, e.g., Neumann (1954), have not explicitly incorporated
the type theory. However, some prominent Jungian theorists
regard the type theory as the initial formulation of Jung's
core developmental concept of individuation. Meier (1971)
argues against the view that Jung had abandoned the type
theory, "for what he really did was to devote the rest of
his life to the amplification of the dynamics of the
13
individuation process, the blueprint of which is already
neatly given with the typology" (p. 279). Fordham (1972)
concurred and suggested that the failure of Jung's followers
to elaborate the developmental aspects of the type theory is
"because the essence of Jung' s thesis has been ignored and
the stable (aeternal) view of types has replaced the dynamic
one altogether" (p. 114). Jung first presented the concept
of individuation in Psychological Types, though only through
definition in the final chapter.
The body of his work clearly shows Jung's overriding
concern with the problems of psychological maturation beyond
mid-life. At this age the individual has successfully
maneuvered through the vicissitudes of childhood and youth
and is prepared to actively embark on the process of
individuation. Individuation, in Jung's theory, is the
process by which a person becomes psychologically
differentiated from the collective in a manner that is self-
aware or conscious. For Jung the collective refers to
psychic contents (e.g., ideas, opinions, values, and general
concepts) which belong not to one individual but to many.
The task of childhood and youth is to come to terms with and
to adapt to the collective, thereby establishing a position
in one's society.
At the same time, culture effects a differentiation of the function that already enjoys a better capacity for development through heredi ty. In one man it is the capacity for thought, in another feeling, which is particularly amenable to development, and therefore impelled by
14
cultural demands, he will concern himself in special degree to developing an aptitude to which he is already favorably disposed by nature. Its cUltivation does not mean the function in question has an a priori claim to any particularly proficiency, on the contrary, one might say it presupposes a certain delicacy, lability, pliability, on which account the highest individual value is not always to be sought or found in this function, but rather, perhaps is developed for a collective end.. The differentiated function procures for him the possibility of a collective existence, but not always that satisfaction and joie de vivre which development of the individual values alone can give. (Jung, 1971, p. 75)
In this schema, Jung probably differs more from
Freud than from Adler. Mosak and Dreikers (1972) present
the Adlerian view of ego development: "At one end of the
spectrum we have the primary sense of inferiority; at the
other the mutual interdependence of people. As a rule of
thumb, to the extent that an individual possesses social
interest his feelings of inferiority subside or are
eliminated" (p. 46). However, for Jung the adaptation to
social interest results in a one-sided and unbalanced
development of the personality through repression or
suppression of latent capacities, which do indeed subside
during the first half of life only to reemerge later. "The
overdifferentiation of the superior function, which is
almost inevitable with the passage of the years, results
nearly always in tensions that are among the main problems
of the second half of life" (Jacobi, 1973; p. 18). Yet,
Jung argues that this one-sidedness of development not only
is necessary for adapting to the needs of collective life,
15
but may even be the impetus for the development of
consciousness itself. He does not describe an adult without
one-sided development as admirable, healthy, or even normal,
but rather as primitive and undifferentiated. A critical
task of youth is to identify and develop a differentiated
and adapted function. Jacobi (1973) marks the end of
adolescence as the time at which the dominant function will
have attained clear ascendancy and association with "ego
consciousness."
Jung's
psychological
description of the characteristics of the
types roughly corresponds to the level of
development at which the dominant attitude-function is most
exclusively associated with ego-consciousness. The
following summary presents the specific constructs of the
typology and the theoretical dynamics of the constructs.
The dynamic relationships postulated to exist among these
constructs provide the direction and necessity for further
psychological development.
Jung postulates two pairs of complementary
psychological functions and a pair of general attitudes by
which consciousness is oriented. The four functions are
labeled sensing, intuition, thinking, and feeling; the two
general attitudes are extraversion and introversion. The
first pair, sensing and intuition, are functions of
perception, being the processes by which information comes
into ego-consciousness.
16
Sensing is confined to the data that come to the
physical senses and represent immediate, present reality.
As a function of consciousness, it is not simply a passive
reception of sensory stimuli, but an active identification
or recognition of specific objects in consciousness. Jung
describes differentiated sensation as a conscious function
in that its operation is consciously directed and focused.
That is, the sensing function does not just see, it looks;
does not just hear, but listens. In the act of such looking
and listening, more details of the separate elements of
experience are brought into consciousness.
Intuition, by contrast, is vaguely defined as a
perceptual function of consciousness whose operation is
unconscious and whose contents appear in consciousness whole
and complete. The contents of intuition are perceptions of
relationship that go beyond what is directly available to
the senses. Marshall (1968) extends the definition,
describing intuition as a function whose operation results
in a restructuring of the original separate elements of
experience into a complete whole. In its most basic
manifestation, intuition is observed in the capacity to
recognize geometric figures in the relationship among
separate dots, Le., to perceive gestalts; in its
differentiated form it can be the finely tuned "third ear"
of the experienced psychotherapist. By completing the whole
from the elements, intuition perceives possibilities that go
17
beyond the specific information present, to a perception of
a possible reality.
Sensing and intuition are defined as opposing and
complementary functions that cannot operate simultaneously.
Marshall (1968) helped to make this clear in contrasting the
analytic quality of sensing with the synthetic quality of
intuition:
Thus, restructuring of experience may occur in either an analytic or a synthetic direction. One's perception may get nearer the elements or nearer the organizing principles. Either direction involves both a gain and a loss of information. Analysis reveals more detail about a smaller area; synthesis reveals more general but less detailed patterns. (p. 20)
The second pair of functions, thinking and feeling,
similarly contrasts alternative conscious acts of judgment
by which the objects of perception are considered for their
merit and rational conclusions are drawn. The thinking
function judges the relationship among objects according to
laws, concepts, rules, paradigms, principles, standards, or
any other method of relationship that may be separated from
evaluative associations, and finds the relationship valid or
invalid. The feeling function determines the relative value
among objects along a dimension of acceptance or rejection.
Exercising the feeling function makes it possible to
appreciate the importance of an object or the importance of
the relationship among objects. For example, thinking may
lead a man to the judgment that, as a gift, an electronic
calculator would provide his wife with extra hours of
18
leisure (assuming
feeling would lead
she handles the family finances),
him to celebrate Valentine's Day
but
by
giving her a dozen red roses.
In the infant, according
functions exists in a passive,
to Jung, each of
undifferentiated,
the
and
unadapted state. Through interaction with the environment
one function becomes increasingly more active due to its
greater capacity to adapt to the collective. Through its
activity this leading or dominant function separates from
the other functions and initiates a relationship of object
and subject, with respect both to external objects, of the
environment and to internal objects as states of the
organism. When the orientation of the function directs its
activity toward external objects, it takes on the attitude
that Jung defined as extraversion. When it orients toward
subjective states as objects, the function takes on the
attitude Jung defined as introversion. Ego, or the ego
complex, arises as the subject of the object-subject
relationship, and consciousness is the product of the
operation of the active differentiated function.
The effective adaptation of the most active, or
dominant, function requires the inactivity of the less
adapted functions insofar as they interfere with the
activity of the dominant function.
effectively until it is separated
Sensing cannot operate
from intuition. The
failure of differentiation results in perception of objects
19
that do not remain stable, being fused with their context or
surroundings; intuition that is not differentiated from
sensing produces the perception of relationships which
quickly fragment into unrelated specificity. Similarly,
thinking cannot become reliable in discerning valid
relationships among objects while feeling is actively
relating the value of the object to itself as the subject.
The most adaptive function takes its priority (as the
activity associated with the ego) through the repression or
exclusion from consciousness of the operations of the less
differentiated functions.
The extreme dependency of the child upon family and
society makes adaptation to the collective into which it is
born an imperative task of childhood. The dominant function
is most amenable to adaptation to the collective; this leads
to the most successful balancing of object-subject
conflicts. The adaptive success of the dominant function
establishes a recurring sequence wherein its preferred
activity is more frequently exercised and further
differentiated. Through exercise, the dominant function
increases its usefulness as a tool for adaptation and its
increased usefulness ensures its position as the preferred
activity of consciousness. This sequence accelerates and
stabilizes as persons near adulthood. Jung described
persons as psychological types when they orient their
20
conscious activity by use of their preferred function in a
habitual manner.
During the period of development when the
differentiation of the dominant function is progressing most
rapidly, the less preferred functions continue to develop.
But their operation is for the most part outside of
consciousness and is passive. They provide a necessary,
unconscious substrate for conscious activity. For example,
if intuition is the dominant function, its activity relates
sensory data which are passively perceived by sensing, have
been appreciated as relevant to the subject by feeling, and
whose relationship is judged valid by thinking.
Consciousness does not observe or direct the participation
of the passive functions, but receives the perception whole
and complete as a relationship or possibility present in
awareness. In another individual the active, dominant
function may be either sensing, thinking, or feeling. For
those individuals, as well, the dependency of the operation
of the function on the operations of the passive, sub
ordinate functions is just as inescapable. While the
operations of the undifferentiated functions are "invisible"
to the individual, they are not so to observers who more
easily see the less mature and unadapted aspects than indi
viduals permit themselves to acknowledge (Jung, 1971;
Jacobi, 1973; Myers, 1975).
21
The typology would be more obvious, far simpler,
easier to assess, and less useful if the process stopped
here. The adaptation by way of one function that takes on
one attitude would lead to a one-sided personality that has
narrow limitations. If the dominant function is one of
perception (8 or N), judgment remains passive and outside of
conscious control. Conversely, development of a judging
function (T or F) leaves perception passive and outside of
conscious control. Conscious activity is limited by the
emphasis of the dominant function. This one-sided
development of concsiousness is further limited because, in
Jung's model, the dominant function typically appears in one
of the two attitudes that orient consciousness to its
objects. If the dominant function takes the extraverted
attitude, only the individual's relations to external
objects are adapted and differentiated; internal objects are
recognized as belonging to the environment, often through
proj ection of the inner state onto an external obj ect. On
the other hand, an introverted dominant function does not
consciously relate to external objects as distinct from the
individual's own subjectivity, resulting in a vulnerability
to introjection. A mature and developed personality
requires balance in both perception and judgment, and in the
capacity to relate consciously to both external and internal
objects. The attempt of the immature personality to adapt
to the demands of the collective through the exclusive focus
22
on the dominant function, while ignoring the less adaptive
functions, inevitably begins to fail as the individual
reaches limits of the adaptability of the preferred
attitude-function combination. (Jung, 1971; Jacobi, 1973;
Myers, 1975).
In infancy, reliance on the dominant function provides
stability in emerging consciousness. The infant's failure
to exclude the opposing functions from its nascent,
minimally stable consciousness might precipitate the
dissolution of the ego-complex. However, once the
individual has attained a stable consciousness, the rigid
preference for the dominant and exclusion of the other
functions threatens the further growth of the personality.
When the adapted, conscious function is sufficiently secure,
it may permit the development of a second function of
conscious activity. This function will not be the most
ignored function, i.e., the function directly opposed to the
dominant; further, the second function will not have the
attitude of the dominant (Jung, 1971; Jacobi, 1973; Myers,
1975) .
The secondary function has a balancing effect, and
"always one whose nature is different from, though not
antagonistic to, the primary function" (Jung, 1971, p. 406).
For example, an introverted perceptive function may
associate with either of the extraverted judging functions,
or an extraverted perceptive function may associate with one
23
of the introverted judging functions. The development of the
secondary, auxiliary, function is generally overlooked in
what Fordham (1972) describes as the static interpretation
of the type theory. In the dynamic interpretation, with the
acceptance within the ego-complex of the development of an
auxiliary function comes the internalization of conflict as
an activity of consciousness. with his conceptualization of
differentiated ego functions having opposing aims and
autonomous operations Jung anticipated the contributions of
Hartmann to psychoanalytic theory.
In his seminal work Ego Psychology and the Problem of
Adaptation (1958), Hartmann introduced the concepts of
autonomous ego functions and the conflict-free ego sphere,
and adopted Kris's (1934) concept for relating the
functions, "regression in the service of the ego."
Hartmann specifically includes discussion of "perception,"
the "synthetic function," "goal-rational" action, "value-
rational" action, "objectively reality syntonic" action, and
"subjectively reality syntonic" action. These constructs
seem more familiar and less awkward if they are recognized
as Jung's sensing, intuition, thinking, feeling,
extraversion, and introversion, respectively. Hartmann
acknowledges the problem of the one-sidedness of the
developing personality, though his assessments appear to be
made from the perspective of an extraverted thinker:
If we keep in mind what we said above about synthesis and rank order [of the ego functions],
24
we arrive at a very different picture: the optimal role of goal-means thinking in adaptation is decided by the maturity, the strength, and the structure of the ego.
Why then is this picture so distorted? Because in it a particular ability has taken the place of all other mental functions. The picture becomes more human if we think of intelligence as organizing rather than taking the place of all other functions. At a certain level of development intelligence becomes aware of its own role as one function among others, sees its own activity in correct perspective among the other mental tendencies. (Hartmann, 1958, p. 69)
The admission of other functions into the conflict-free
ego sphere is accomplished by "regression in the service of
the ego." Thus, in Jungian terms the individual
accomplishes the development of the auxiliary function by
temporarily releasing the hold of the dominant function.
Jungians have generally ignored the dynamics and kept the
typology Jung employs to describe it. Freudians have
refused to assimilate the relativity of perspective implied
by alternative patterns of personality development because
that would undermine the scientific authority they claim for
their observational methods. Therefore, they have largely
ignored the implications of the typology but have readily
kept the dynamics.
At the end of adolescence, according to Jacobi's
(1973) summary of Jung's typology, the individual has
consolidated ego-consciousness, which is associated with the
dominant function; by the middle of life "all the functions
should fall into their proper order and be appropriately
25
differentiated" (p. 14). Though she does not explicitly
describe the development of personality from the end of
adolescence to the middle of life, the implication is clear
that this period must involve the growth and development of
the auxiliary function, as well as the further strengthening
of the dominant function. Experience with the internal
consistency of the MBTI scales would suggest that the
emergence of the auxiliary function may be reliably reported
by most subjects just past the age of puberty (Myers, 1962;
Myers & McCaulley, 1985). Though authors disagree on the
specific ages at which individuals will achieve a given
level of development, the period between middle adolescence
(about age 15) and mid-life (35-45 years) is probably the
greatest period of differentiation for the auxiliary
function.
with successful development, at mid-life the conscious
activity of the ego-complex should be marked by (a) the
dominance of a strongly differentiated function of either
perception or judgment using either the extraverted or
introverted attitude, and (b) the presence in consciousness
of an auxiliary function that is somewhat less differen
tiated than the dominant. The auxiliary differs from the
dominant in two ways in being a complementary function (of
perception or of judgment), and in operating through the
complementary attitude (extraversion or introversion). In
its structural and dynamic development the ego-complex
26
attains the capacity to maintain stable obj ect relations
with both external and internal objects. The developed ego
has served its necessary function of adapting the individual
to the conflicts arising between the organism and its
environment, and providing conscious mechanisms for
internalized conflict management. For Jung, the yardstick
of the effectiveness of the adaptation of the ego-complex is
its relationship to the collective. The development of this
tool for adaption is the task of childhood and youth. At
mid-life the stage is set for the adaptation of
consciousness to the needs of individuality; the stability
of the ego-complex provides a perspective from which
consciousness can relate to the more deeply unconscious
aspects of the personality described by Jung (Jung, 1968,
1971; Jacobi, 1973).While the deep unconscious psychological
structures described by Jung are of considerable interest in
other contexts, for the purpose of understanding the
relationship of the type functions it is sufficient to
recognize two points:
(1) Consciousness in the process of individuation becomes
less closely identified with the ego-complex, and there
fore less identified with the dominant and auxiliary
functions. The identification of consciousness becomes
associated with "self," which Jung understands to be the
totality of the personality; the self is partly knowable
27
and observable by consciousness and is partly unknowable
and transcendent (Jung, 1968; Jacobi, 1973).
(2) The functions that have not been differentiated and
integrated by the ego-complex may be further developed
in consciousness, especially the function opposite
the auxiliary. But this "inferior function" can
never become fully conscious, perhaps only
because life is finite and the task is too great for
a lifetime (Jung, 1968; Jacobi, 1973).
In summary, the theory of the development of (a) the
dominant, (b) the auxiliary, and (c) the less-preferred
functions throughout the life span forms the framework for
the analyses of the MBTI preference scores in this research.
In attempting to understand the expression of preferences
for type functions across the age span for which data are
available, differring expectations occur for two periods.
The first period, from approximately 15 to 40 years, should
show a continuing increase in the preference for the
dominant function, and an even greater increase in
preference for the auxiliary function. Associated with the
greater increase in preference for the auxiliary function
should be a trend for increased preference of the attitude
taken by the auxiliary function. This increased preference
for the auxiliary should result in a reduction of the
preference for the attitude of the dominant function. In
the second period, approximately age 40 and beyond, the
28
trend to increase the preference for the dominant function
should falloff, while the trend toward increasing
preference for the auxiliary should continue. In a later
section these expected trends will be stated with specific
reference to MBTI preference scores.
Description and History of the Myers-Briggs Type Indicator
The focus of this section is on the psychometric
features of the Myers-Briggs Type Indicator that are
relevant to the data analyses of this research. The Myers
Briggs Type Indicator (also known as the MBTI, and the Type
Indicator) is a self-report questionnaire consisting of 95
forced-choice items scored on four scales: Extraversion
Introversion (EI), Sensing-Intuition (SN), Thinking-Feeling
(TF), and Judgment-Perception (JP). The EI, SN, and TF
scales are explicitly constructed to assess the function and
attitude preferences described by Jung's typology.
Each item offers a choice of responses reflecting the
dichotomous index for which the item is scored. Current
scoring procedures provide separate weighting for each
response; thus a response may add two, one, or zero points
toward a point total for its respective preference. Scale
scores are computed by finding the difference of the point
totals for each pair. Since the primary purpose of the MBTI
is to indicate the Jungian preference types, and tied scores
would not indicate preferences, the point total differences
are doubled and one point is added or subtracted so that no
29
resulting preference score may be zero. The decision about
whether a point should be added or subtracted follows rules
devised by the authors of the MBTI. On the TF scale the
rule adds one point for males in the thinking direction or
one point for females in the feeling direction--by following
the rationale that the setting of item weights on that scale
may have overvalued evidence contrary to the prevailing
preference for each gender. On the remaining scales, one
point is added in the direction of the preferences occurring
less often in the general population--following the
rationale that evidence contrary to popular preferences is
to be believed. The resulting preference scores consist of
two parts, a letter indicating the direction of the
preference and a number indicating the "strength" of the
preference. The type is indicated by the four letters of
the preference scores.
Three indices indicate preferences for an attitude
(EI), a perceptive function (SN), and a jUdging function
(TF) . It is not possible to determine from these three
indices alone which preferred function (the perceptive or
the judging) is the dominant and which function is the
auxiliary. Briggs and Myers have resolved this ambiguity by
the addition of a fourth index labeled Judgment-Perception
(JP). In format and scoring procedures this scale parallels
the other three. Its item content is constructed to provide
for each item the choice between the use of (a) a judgment
30
function or (b) a perception function in relating to the
environment (implying orientation through extraversion). In
the interpretation of this scale Briggs and Myers have
exploited the dynamic relationships Jung postulated to exist
among the type functions. That is, for extraverts the
dominant function is extraverted and the auxiliary function
is introverted. For introverts the dominant function has
the introverted attitude, and the auxiliary, the extraverted
atitude. By indicating whether the respondent has a judging
or perceptive function associated with the extraverted
attitude, the JP scale leads to the identification of the
dominant function. If the JP scale indicates that a judging
function is extraverted, the dominant function for
extraverts is indicated by the TF scale. If the JP scale
indicates extraversion of a perceptive function, the
dominant function of an extravert is indicated by the SN
index. For introverts, the JP scale identifies the
auxiliary function, since the theory postulates that
introverts use the auxiliary function to relate to the
environment. By inference, the dominant function for an
introvert is the preferred function that wich is not
indicated by the JP scale to be extraverted.
Of the two components of the preference score, Myers
(1962) considers the letter indicating the direction of
preference to be more important than the numeric component.
She describes the numeric component as the "strength of the
preference." She
quantitative scores
that the respondent
31
cautions that interpretation of the
should be limited to the probability
has correctly reported his or her
preferences and the relative importance of these preferences
to him or her. She and numerous other researchers have
investigated correlates of the MBTI scales with other scales
of ability, aptitude, interests, and traits of personality
(e.g., Myers, 1962; stricker and Ross, 1964; McCaulley,
1978; Myers & McCaulley, 1985) reporting significant, but
generally moderate, associations in support of the
theoretical concurrent validity of the scales beyond their
use as categorical indices of Jungian types.
The interpretation of the quantitative score as a
measure of the "strength of the preference" is perhaps
confusing
taken to
in some instances where the term "strength" is
imply superiority of an ability to use the
function, or intensity of the preference for the function.
The procedures used in the item selections and the item
formats do not necessarily involve strength in either of
those connotations.
The preference scores are derived by summing the
responses in the direction of the preferred function, minus
the sum in the opposite direction, and applying a correction
when the scores are tied. This derivation seems more likely
to assess the "consistency" of the preference rather than
its "strength" or intensity. The difference here may be
32
largely semantic, particularly in light of Myers's cautions;
yet where the scale scores are used in correlational
studies, the term "consistency of preference" may lead to
less confusion. In this investigation, then, the magnitude
of the preference scores means the consistency with which
the respondents have indicated their use of the preferred
function among the opportunities provided by the
questionnaire to report them.
In selection of the items tested for inclusion in the
scales Briggs and Myers sought to avoid those that would
evoke extreme responses, favoring items that could reflect
the everyday manifestations of the type preference:
" . the questions can be trivial and often are" (Myers,
1961). The items sample a variety of situations in which
the response may be given easily from the respondent's
experience and with as little interference as possible from
the effects of social desirability or the requirement to
endorse extreme positions. Myers made no systematic attempt
to include items that would survey the full breadth of the
theoretical constructs (Myers, 1961); thus the items
retained through the selection process may reflect well some
aspects of the theoretical constructs and may not reflect
others. The evidence an item response predicts to the
expected direction sufficiently justified its retention.
The i terns are presented in two formats. Phrase
questions provide stems and alternative completions of the
33
stem. Word-pair items offer a choice between the attrac
tiveness of the meaning of two words. In both formats the
respondent may choose only one of the responses offered, or
may omit the item.
Myers (1962) explains that the selection and testing of
the items and the construction of the scales and their
and 1956-1958) prior to the first publication of Form F in
1962. The aspects of the MBTI development history relevant
to the current investigation concern the adoption of item
weights and the testing of the item weights on samples of
differing ages.
History of the MBTI Item Weights
Briggs and Myers first performed item analyses of Forms
A and B of the MBTI on a sample of 114 male and 110 female
adul ts. The sample consisted mostly of college graduates.
Myers intentionally dropped individuals undergoing
psychological counseling and job applicants, in order to
exclude the biasing influence those circumstances might
introduce. The adult sample was selected it was presumed to
have greater differentiation of the type functions. Items
were retained if the response given by 60% of individuals
whose type (as determined by the total scale score) was in
agreement with the direction of the response. A second
analysis was later performed using the same criteria on four
samples: 248 adult males, 268 adult females, 224 college
34
males, and 70 college females. Only items reaching the
acceptance criteria for all of the four groups independently
were retained in Form C. The development of Form C
completed the first period of item selection and item
analysis.
In creating scoring procedures for Form C Myers
introduced separate weighting of each item response was
introduced in an effort to control for social desirability,
omissions, and unequal attractiveness of the response for
all the types sharing the preference. (At one point Myers
described detailed scoring procedures for each type but
never implemented them). The weights of the item responses
were then determined by a prediction ratio, designated PR,
and calculated as in the following formulae:
35
PRj = %J[J] / (%J[J] + %P[J]) and
PRp = %P[P] / (%P[P] + %J[P])
where
PRj
PRp
%J[J]
%J[P]
%P[P]
%P[J]
is the predictive value of the J response,
is the predictive value of the P response,
is the percent of judging types giving the
judging response,
is the percent of judging types giving the
perceptive response,
is the percent of perceptive types giving
the perceptive response, and
is the percent of perceptive types giving
the judging response.
In 1956 Myers undertooka new series of item analyses on
the Form C items, to which she had appended about 130
experimental items; the new questionnaire was known as Form
O. She undertook item weight refinement and item selection
with 385 graduate students to create Form 01, then with an
unreported number of undergraduate students to create Form
02. Finally, 2,573 high school students were sampled to
provide, as nearly as possible, 200 MBTI records for each
type, for each gender. The prediction ratio values
determined from these item analyses were used to set the
item weights for Form F: responses obtaining values from .63
to .729 scored one point; responses with values of .73 and
above scored two points. Responses falling below .63 or
36
responses having values in the second term of the
denominator greater than .5 scored zero points. The items
having one zero point response were retained following the
rationale that the non-zero alternative (assuming the
prediction ratio obtained a value greater than .63)
reflected an aspect of the type preference less popularly
endorsed and the endorsement of that response provided good
evidence of the type preference.
In shifting item weights from Form C to Form DO,
Briggs and Myers compared the scoring of college students to
that of the adults to ensure that item weight revisions did
not result in changes of type indication for the adult
criterion group. The item weights for Form DO were found to
be valid both for the adults and the 18- to 20-year-old
students. Similar checks of adult populations were not
reported for revisions from Form DO to Form Dl, Form Dl to
Form D2, or for Form D2 to Form F. In each of these
revisions, item analyses for progressively younger popula
tions provided item weights which were adopted as the
standard for respondents of all ages.
In 1977, preparing for publication of Form G (which
contains simpler phrasing of some items), Myers conducted a
new item analysis on samples of students ranging from the
fourth to the twelfth grades and a sample of students just
entering college (Myers, 1977). These analyses showed that
the items , with the exception of a few, functioned among
37
students as young as the end of the fourth grade. That is,
they produced comparable i tem-to-scale correlations among
younger and older students. A second goal of the analyses
was to examine the prediction ratios to see if cultural
changes since the establishment of the item-weights 20 years
before had altered the popularity of some responses unduly.
The popularity of feeling responses was found to have
increased dramatically, and new item weights for the TF
scale were adjusted accordingly. Item weights established
in 1956 with the 11th and 12th grade students were retained
unchanged for the EI, SN, and JP scales. The new item
weights for the TF scale, derived from data obtained from
the students at the end of the fourth grade up to students
entering college, became standard for both Form G and
Form F. Myers (1977) reported that the new weights result in
reporting 5-15% more feeling types. The need to make these
item weight adjustments points to the difficulties of
calibrating the dividing points for the MBTI, since cultural
changes are likely to be reflected in the responses of
different generations.
The process of item selection and item weighting of
the MBTI began with small adult samples. Those items whose
responses correctly classified a type preference in the
criterion group were retained. In subsequent item selection
and weighting, the use of larger groups was necessary, and
for the type classification of these samples the criterion
38
was the scoring procedure of the previous version. The
weights currently being used were based mainly on the data
from matriculating college freshmen and high school and
middle school students. Also, regression analyses reported
by Myers (1962) in support of the correct placement of the
division points between the types were also based on high
school student data. These students were at the age that
Jacobi (1973) identified as having stable development of the
dominant function. Their reports of their preferences for
the dominant function, then, should have been reliable.
However, the students reports of their preferences for the
auxiliary function are likely to be less stable. No
investigators have reported analyses in which they made
this distinction--however, as noted above, Myers did explore
differential scoring procedures adjusted for the most
reliably reported preferences (Myers, 1961). Considering
the practical problems differential scoring procedures would
raise in manual scoring, that she did not implement them or
report them in detail is not surprising .
Current item weights may not be appropriate for
adults, especially for older adults. Even in the absence of
analyses indicating significant trends relating MBTI scale
scores to age, the consistency of the prediction ratios of
the i terns should be checked in older populations.
39
Review of the Research Literature: Psychological Type and Age
A search of the published MBTI literature cited through
May, 1984, revealed only one study that provided direct
evidence associating MBTI preference scores with the age of
respondents. In a doctoral dissertation, Bloch (1978)
reports tests of hypotheses advanced by Lundberg (1975) in
which Lundberg asserts that Jungian typology represents a
developmental sequence comparable to a stage theory of
psychological maturation. Following Lundberg, Bloch argues
that introversion, with its focus on abstraction reflects
psychological integration superior to that of extraversion,
which "focuses attention on external, concrete objects"
(Bloch, 1978, p. 6). Similar arguments are offered for the
superiority of intuition over sensing, thinking over
feeling, and judgment over perception. This arrangement
resul ts in a hypothetical progression for extraverts from
the lowest to the highest developed types as follows: ESFP,
ESTP, ESFJ, ESTJ, ENFP, ENTP, ENFJ, ENTJ. A parallel
progression for introverts is suggested, i.e., ISFP, ISTP,
ISFJ, ISTJ, INFP, INTP, INFJ, INTJ. In following strictly
the relative superiorities of the dichotomous pairs, the
developmental sequence should alternate between extraverted
and introverted types. Lundberg acknowledges that such
alternation was not only unlikely, but could not be
reconciled with theory. Thus, Lundberg hypothesizes
40
parallel sequences with individuals shifting from the
extraverted sequence to the introverted sequence at a point
where such a shift met less resistance than the shift to the
next highest extraverted type. No explicit point could be
indicated where this shift might occur. In formulating
these developmental sequences Lundberg has apparently relied
on superficial or very limited definitions of the attitudes
and functions and has largely ignored the dynamic inter
actions described by Jung. For example, Jung says expli
citly that the inferior may never be fully assimilated in
consciousness: "It would be a hopeless task--which never
theless has often been undertaken and as often has
foundered--to transform an inferior function into a superior
one" (Jung, 1971, p. 86). For several of the hypothesized
type shifts, e.g., ESFJ to ESTJ, the dominant feeling
function would be replaced by a dominant thinking function.
The sequence further violates the Jungian typology in its
postulation of the relative value of the attitudes and
functions.
Psychology:
directly to
Jung responds to a questioner in Analytical
Its Theory and Practice as though speaking
Lundberg: "I hope I did not give you the
impression that I was giving a preference to any of the
functions," and, "We have absolutely no criterion by which
we can say that this or that function in itself is best"
(1968, p. 61).
41
The irreconcilable differences between (a) Lundberg's
developmental hypotheses regarding MBTI types and (b) the
Jungian type theory on which the MBTI is based severely
limit the utility of Bloch's study as the basis for a
developmental model. The study is further distanced from
the theory in the methods of analysis employed. Bloch
tested his hypotheses that the EI, SN, TF, and JP continuous
scores would have different means for each age group
studied, with the means differing in the predicted
directions. Parallel tests were made of the means of the
separate preference scores for each age group. In addition,
separate regression analyses were performed for each of the
four continuous scores and each of the eight preference
scores. However, Jung (1971) emphasized the interactive
dynamic of the attitude and function types: "strictly
speaking, there are no introverts and extraverts pure and
simple, but only introverted and extraverted function types,
such as thinking types, sensation types, etc." (p. 523). If
we are to test Jung' s typology, it is important to retain
the interactive nature of the preferences as far as
possible. Thus, to test the association of the Jungian
types with the age of the respondents, Bloch minimally would
have had to perform separate analyses for introverted and
extraverted function types for each of the preference
scores, e.g., separate analyses for introverted sensing
types and extraverted sensing types. The result of the
42
analysis design used by Bloch has been to confound the
frequencies of the preference types and the consistency of
preferences reported.
However, we may disregard the problems with the
correspondence of Bloch's (1978) theoretical formulation to
Jungian theory and examine the results of Bloch's analyses
simply for empirical evidence of an association between the
respondents's ages and the MBTI scale scores. Bloch
carefully selected his sample to avoid demographic bias in
his sample of 266 males and 292 females; he found no
significant differences for variables of gender, race, and
occupation between his sample and norms. The source of the
norms was not identified. He made no attempt to control or
select for the distribution of the type preferences within
the age groups examined. He reported statistically
significant tests for mean preference scores for sensing
and judging, both results having a probability less than
.001. Further, on additional regressions of the preference
scores he found trends showing that judging, sensing, and
intuition preference scores increase with age. Bloch tested
for the homogeneity of variance for the continuous scores,
and rejected the null hypothesis for the SN scale. He
suggests that his findings may have been influenced by the
lack of homogeneous variance. The study is important for
being the first in which investigators report systematic
association of the MBTI scale scores with the ages of the
43
respondents. The results generally run counter to Bloch's
developmental hypotheses but indicate a need for further
investigation. The finding that preferences for both
sensing and intuition increase with age is consistent with
Jungian theory and the results this writer found in a pilot
analysis of MBTI data. Failure to find similar associations
with the other five preferences cannot stand as evidence
that the associations do not exist.
The Isabel Myers Memorial Library housed at the Center
for Applications of Psychological Type contains numerous
research reports not available in the published research.
Among these reports is a paper by Schaeffer (1974), in which
she compares the frequencies of the type preferences in two
groups of "adult extension students". On chi-square test
extraverts were more frequent among the 30 students over age
35 than among the 170 younger students. She did not report
analyses of preference scores. Because of the small sample
size and the restricted population sampled Schaeffer's
findings would probably not replicate.
Because the two studies just described were the only
data found in which the investigator attempted to examine
the relationship of the MBTI scores to age, I extended the
literature search to include studies of the Jungian Type
Survey (JTS) (Gray & Wheelwright, 1946). The JTS, 16th rev.
(Wheelwright, et aI, 1964), is a 75-item self-report
questionnaire developed independently of the MBTI by two
44
Jungian analysts, Horace Gray and Joseph Wheelwright. They
obtain scores on three scales that are constructed to
reflect extraversion-introversion, sensing-intuition, and
thinking-feeling. In scoring they do not use item weights
and they make type classifications solely on the percentage
of responses in the direction of the preference. Gray and
and Wheelwright determine which function is the dominant
function by its being the function preference having the
higher percentage of responses endorsed. The JTS does not
have a scale corresponding to the JP scale of the MBTI;
thus, correlations with the JP scale are not available.
stricker and Ross (reported in Myers, 1962) obtained high
correlations for the three comparable scales among 47 male
college students. Myers (1962) concludes that after
adjustment for attenuation the correlated scales have their
entire true variance in common. Thus, reports of
correlations of the JTS with age are considered relevant to
the present investigation.
Gray (1946) reports a study of 500 male and 500 female
subjects who responded to the tenth revision of the Jungian
Type Survey. He found that when the subjects were divided
into five-year age groups, regression analyses showed that
the percentages of subjects classified as introverts,
sensing types, and thinking types increased with age.
Regressions of the mean scale scores for each age group also
indicated significant trends for increased introversion and
45
sensing; the trend for increased thinking fell just short of
the .05 probability level. He reports that he considered
each scale separately and did not distinguish between scores
of male and female respondents.
In a later report Gray (1948) addresses the question of
gender differences among the type preferences for the same
sample and reported males to be more often introverted,
sensing, and thinking (at probability levels of .09, .03,
and .01, respectively). Further analyses indicated that the
percentage of subjects with a perception function (sensing
or intuition) dominant over a jUdging function (thinking or
feeling) did not differ significantly between the sexes
overall; nevertheless, with the genders pooled he found that
the preference for a perception function became more
frequent with increased age. Despi te having found these
differences separately relating the dominance of type
functions to gender and to age, he does not report any
analyses to determine whether the relationships associated
with gender may not be constant across the age groups. His
data may suggest that gender and age do interact in their
effect upon the respondents I reports of their type
preferences. Males separately and older respondents (males
and females combined) both reported a greater preference for
introversion, sensing, and thinking. Among the same
subj ects the percentage of respondents (males and females
combined) preferring a perceptive function (sensing and
46
intuition combined) increased with age over the percentage
preferring a judging function (thinking and feeling
combined) . A set of regression lines that would satisfy
each of these conditions simultaneously, and would not
involve significant interactions of age and gender, is
difficult to imagine.
Thus, two objections to the adequacy of Gray's
analyses are raised here. First, in considering each of the
scales separately, Gray ignored Jung's theoretical position
that "strictly speaking, there are no introverts and
extraverts pure and simple, but only introverted and
extraverted function types, such as thinking types,
sensation types, etc." (Jung, 1971, p. 523). Further, the
separate analyses of the main effects of gender have left
unexamined a possible interaction of those factors.
Driver (1974) includes the Jungian Type Survey in a
study of personality variables related to age, types of
retirement residence, and length of stay in the residence.
The 185 subjects in her sample were 55 years or older (mean
age = 76.5 years) . Analyses of variance indicated
significant increases in the preference for introversion for
older groups, and showed that the introversion scale was
positively correlated with age, while the extraverted
preference had a negative correlation. Results with respect
to sensing, intuition, thinking, and feeling were not
47
significant. She does not report the type distribution of
her sample or gender-by-age analyses of JTS score means.
Before conducting the literature search summarized
above, I conducted exploratory analyses of 52,848 MBTI,
Form F, records contained in the MBTI data bank maintained
by the staff of the Center for Applications of Psychological
Type (CAPT). These records included all Form F cases
submitted to the CAPT MBTI computer scoring service from the
adoption of the current item weights for computer scoring in
1978 through 1982, with the exception of records meeting two
criteria. Records were excluded if 35 or more items had
been omitted (about 1% of the sample). In earlier analyses
of the CAPT data bank investigators found that the split
half reliability coefficients for the MBTI scales dropped
markedly for subjects having more than 35 omissions (Kainz &
McCaulley, 1980). I also excluded records if the respond
ents's ages were unavailable or were below 15 years.
For the purposes of these analyses the data were
divided into eight age groups: 15-17, 18-20, 21-24, 25-29,
30-39, 40-49, 50-59, and 60 or over. These age groups were
selected in part according to the age distribution found in
the data bank. The frequencies of respondents in the
younger groups were greater, so the younger groups had a
narrower age range for two reasons. First,was the desire to
separate young people still in high school from college
students and from young adults who were beginning their
48
careers. The second reason was an attempt to make the
frequencies of respondents in each group less
disproportionate.
I performed separate one-way analyses of variance for
each gender for each of the eight MBTI preference scores. I
found significant r ratios were found for each of the
preference scores (see Appendix A, Table 42). However, the
resul ts were not parallel for males and females. All r ratios for females were significant beyond the probability
level of .0001. For male extraverts and male feeling types
the probability of the r ratio fell just short of the .05
level. Post hoc tests to identify the significant contrasts
were not performed.
Visual inspection of the means (see Appendix A, Figures
12 through 15) suggests strong trends for increases in MBTI
preference scores. The preference scores for sensing,
intuition, thinking, and judging tend to increase with age
for both genders at least to age 50. The perceptive
attitude and the extraverted attitude appear to decline
among females, while only the perceptive attitude declines
for males. No increase of reported feeling preference
emerges for males, and the distribution of female feeling
scores appears to be bi-modal with a dip at the 25-29 group.
Also interesting is a possible change in the direction of
the trends at either the 40-49 or the 50-59 group,
especially noticeable for intuition and thinking. These
49
findings suggest that systematic trends are to be found
between respondent's age and MBTI preference scores that are
moderated by the respondent's gender.
These exploratory analyses have several technical
inadequacies that limit their interpretation. The
frequencies of respondents varied widely among the age
groups, with many more data in the younger groups; the
distribution of types varied from group to group, thus
allowing interactions among the type preferences to
influence the preference score studied, and the position of
the function as the dominant or auxiliary was not taken into
account.
Summary of the Problem
The Myers-Briggs Type Indicator was constructed
explicitly to assess preferences for the psychological
atti tude-functions described in Jung' s theory of psycho
logical types. Previous theoretical discussions have not
suggested that MBTI preference scores would be
systematically related to the respondent's age in a manner
that is congruent with Jungian theory. Exploratory analyses
I performed on a large sample of MBTI records are suggestive
of systematic associations. Three of the four function
preferences (sensing, intuition, and thinking) appeared to
increase with age. The distribution of the preference
scores of the fourth function (feeling) differed by gender:
males did have a consistent increase in scores that did not
50
reach statistical significance; females seemed to produce a
bi-modal distribution having a valley at the 25-29 year
group. The attitude preferences suggested a systematic
increase in introversion and the judging attitude, with
corresponding decreases for extraversion and the perceptive
attitude.
In this review of the literature I found one writer
(Bloch, 1978) reporting increasing preferences for sensing
and judging among older respondents. An unpublished paper
by Schaeffer (1974) contained the report that extraverts
occurred more frequently in a small and biased sample of
students over 35 years old.
In a review of the literature regarding another Jungian
type indicator, the Jungian Type Survey, two reports by Gray
(1947b, 1948) contained reports of age and gender trends for
the JTS scores that partly paralleled the trends suggested
by my exploratory analyses. A study of elderly respondents
to the JTS (Driver, 1974) also associated introversion with
increased age. In all the analyses reviewed investigators
had problems with biased sampling and in every instance had
confounded the preferences of dominant and auxiliary
functions. The presence of significant findings across
several analyses suggests, nevertheless, that real trends
may exist that relate the Jungian type preferences to the
age and gender of the respondent.
51
Review of the Jungian type theory indicates that Jung
believed the type functions to be dynamically interrelated
in the development of ego-consciousness. The period from
childhood to adolescence is characterized by the
consolidation of one function and its associated attitude.
In adolescence or early adulthood there emerges in the ego
complex an auxiliary, or balancing, function that differs
from the dominant by being a function (of either perception
or judgment) not served by the dominant, and by taking the
attitude opposing (and complementing) the dominant. The
attitude of the auxiliary is the attitude of the unconscious
represented in the ego. Through the auxiliary function,
consciousness becomes capable of regression in the service
of the ego, allowing previously unconscious conflict to be
consciously represented and managed within the ego-complex.
This development is the first step in the process of
individuation by which the "self" replaces the ego as the
center of conscious activity. At mid-life, the
individuating shift of consciousness from ego to self
reduces the relative importance of the dominant function and
increases the importance of the auxiliary function as the
mediator between the ego-complex and the broadening scope of
consciousness.
This sequence of development of the functions leads to
hypotheses relating the consistency of the MBTI preference
scores with these theoretically different periods of
52
psychological development. with respect to the dominant and
auxiliary functions, three periods are relevant: birth to
adolescence, adolescence to mid-life, and mid-life to death.
During the first period, the preference for the dominant
attitude-function combination increases markedly, with the
greatest discrepancy between the dominant and auxiliary
preferences occurring during late adolescence or early
adulthood. During the second period, the dominant attitude
function combination continues to develop, but not so
rapidly as the auxiliary attitude-function combination
develops. At mid-life and beyond, the dominant attitude
function does not further increase and may decline; however,
the auxiliary attitude-function increases, though at a
slower rate than earlier. The third and fourth functions
(the functions not reported as preferred on the MBTI) are
not expected to show any change in the consistency of their
preference as a function of consciousness.
The pattern just described models the optimal psycho-
logical development theorized by Jung. However, Jung and
his followers reported clinical observations that a number
of individuals fail to develop a stable auxiliary attitude
function and reach mid-life unprepared for the task of
further psychological development which is described by Jung
to be marked by the shift from the ego to the self as the
focus of consciousness. For a number of others, the demands
of individuation beyond mid-life exceed the limits of their
53
capability. For those who respond to these demands by
broadening of consciousness, turning back from the
consciousness is decreased and narrowed as physical and
psychical energy declines. Reminiscences of the achieve
ments and pleasures of the past crowd out the future and
much of the present. Therefore, we are warned by the
clinicians that we must expect, in some cases, a retreat, in
a desperate ego-centricity, to the narrower limits of the
dominant attitude-function (Jung, 1968, 1971; Jacobi. 1973).
In considering the connection between MBTI preference
scores and age, an alternative potential cause of systematic
association appeared in the history of the item selection
and development of the item weights for the scales. The
MBTI has undergone a series of revisions in which the
respondents in the normative samples used for selecting
valid items and item weights have been progressively
younger. The current weights used for respondents of all
ages were tested on a sample which was largely between the
ages of 16 and 18. The weights for the EI, SN, and JP
scales are three revisions away from those tested on adults,
and the TF scale is four revisions removed. In item
selection those items that discriminated the type
preferences of older individuals may have been discarded in
favor of items performing better among the samples in late
adolescence. For later research Myers retained in the
questionnaire most of the items that were deleted from the
54
scoring procedure for type preferences by the revision from
Form D2 to Form F. Some of these may prove to be valuable
with older respondents. It is also possible that the
weighting of the items that were retained may be more
effective among younger respondents than among older
respondents. If evidence of the latter were found,
alternative weights that are more appropriate for adult
respondents could be derived for the current questionnaire .
If evidence of the former situation were found, valid
weights may be determined for the items that are not now
scored.
The problem I addressed in this research was to
determine if the consistency of preferences for Jungian type
functions changes systematically with the age of the
respondent. To this end,the Jungian typology is operation
ally assessed through responses to the MBTI. The consist
ency of the type preferences is assessed by the magnitude of
the MBTI preference scores. Statistical associations found
between the MBTI preference scores and age may be an
artifact of the item selection and item weights of the MBTI.
Unfortunately, this possibility necessarily confounds
analyses of theoretically hypothesized relationships. In
this research separating these effects or controling
statistically for this potential confounding is not
possible. However, separate analyses may be performed that
55
test the extent to which the analyses of preference scores
and age are influenced by the item weights.
Ideally, this problem would be addressed by analyses
of longitudinal data. However, suitable data do not exist
and cannot reasonably be obtained. The best alternative is
a large sample of cross-sectional data with controlled
sampling for gender, age, and type preferences. A suffi
ciently large sample has been generated through the MBTI
computer scoring service of the Center for Applications of
Psychological Type. Those data now include more than 75,000
MBTI Form F records obtained between 1978 and 1984.
The first step in determining trends associating the
MBTI preference scores with the respondent's age was
addressed by randomly selecting equal numbers of records for
each type and gender at each age group from the CAPT MBTI
data bank. The number of records selected for each
type/gender/age was determined by the number of
available to the smallest group to be included
particular analysis. The initial pool of records
records
in the
in the
Form F data bank was greater than 82,000. Excluding records
with excessive item omissions, no recorded age, or age less
than 15, left more than 75,000 potential observations. The
actual sample size analyzed was considerably smaller due to
the marked decrease in the frequency of records from younger
to older respondents. I examined these records of the
equal-type research sample by analyses of variance and
56
linear regression analyses for differences in mean
preference scores and for linear association. I identified
subsets of the data sample by dominant or auxiliary
functions, by the eight age groups used in the piolot
analyses, and by age period (15 to 39 years, or 40 years and
over), and by gender. The analyses of main effects and
interaction effects of these factors were used to test
research predictions derived from Jungian theory relating
the differentiation of the dominant and auxiliary functions
to the ages of the respondents.
The same MBTI records used in the regression analyses
were used to examine age differences in MBTI item weights.
Following the procedures described by Myers (1962), the
prediction ratio (PR) of each response was calculated for
each age group catagorized by sex. Correctly weighted item
responses were expected result in calculated prediction
ratios for each group that lie in the range used by Myers
for the assignment of the weight. Responses showing
deviation from the expected range were noted for further
study. The extensive evaluation which would be required to
establish alternative item weights was beyond the scope of
the present study. The purpose of this item analysis was to
determine if there are items which may be candidates for
such an evaluation. The presence of item responses that
have predictive value that varies with the ages of the
respondents was expected to influence the findings of
57
analyses of variance and analyses of trends of association
relating respondents's ages to MBTI preference scores.
Research Predictions
In this section the model of development of the Jungian
personality types discussed above will be related to
research predictions associating trends in the MBTI
preference scores with the respondent's age. In the Jungian
model three general periods of development may be
identified: (a) the development of a dominant attitude
function, (b) the development of an auxiliary attitude
function, and (c) individuation, or the development of self
consciousness from ego-consciousness. The first period
occurs from birth to approximately mid-adolescence; the
second period, from mid-adolescence to mid-life; the third
period, from mid-life to death. This research is limited to
the latter two periods because they are the age ranges for
which the MBTI may be reliably used, that is, 15-39, and
from 40 on. The division between the two periods is
arbitrary, lying within the 35-to-45-year range identified
by Jung as the beginning of mid-life.
During the second period (age 15-39) it is expected
that preference scores reflecting the consistency of the
preference for the dominant attitude-function should display
a low yet steady increase with aging; preference scores
reflecting the consistency of the preference for the
auxiliary attitude-function should show a greater tendency
58
to increase with age, relative to the increase of the
dominant attitude-function. During the third period the
preference scores reflecting the preference for the dominant
attitude-function should not increase, and may decline;
however, preference scores reflecting the consistency of the
preference for the auxiliary attitude-function should
continue to increase with age.
The possible combinations of dominant and auxiliary
attitude-functions describe 16 personality types. Any
single type shares the dominant attitude-function with one
other type, which always has a different auxiliary attitude
function. This relationship is more easily presented in
specific examples. For instance, the MBTI type formula ENFP
indicates preferences for extraversion (E), intuition (N),
feeling (F), and perception (P). The preference to orient a
function of perception by extraversion is indicated by the
fourth letter, P. Being an extravert, the individual uses
the dominant function to relate to the external world.
Therefore, the dominant attitude-function of the ENFP is
extraverted intuition. By extension, the auxiliary
attitude-function of the ENFP type is introverted feeling.
The ENFP type may also be described as an extraverted
intuitive type with introverted feeling. The ENTP type is
also an extraverted intuitive type, though for the ENTP the
auxiliary attitude-function is introverted thinking. The
preference for the dominant is theoretically independent of
59
the preference for the auxiliary, except that the auxiliary
may not be directly opposed to the dominant. For analyses
pertinent to trends of the preference for extraverted
intuition as a dominant attitude-function, ENFPs and ENTPs
may be pooled so long as both types are equally represented.
To pool these two types in analyses related to the auxiliary
atti tude-function would not be appropriate. However, the
ENFP type has the same auxiliary attitude-function as the
ESFP type, i.e., introverted feeling. In analyses of
introverted feeling as an auxiliary attitude-function the
statistician may, therefore, pool these two types. Table 1
displays the dominant and auxiliary attitude-functions
corresponding to each of the 16 MBTI type formulae. Table 2
displays the predicted direction and intensity of change of
the MBTI preference scores for each of the 16 types as they
age.
In the example of the ENFP type, the preference scores
reflecting the consistency of the preference for extraverted
intuition as the dominant attitude-function include those
for extraversion, intuition, and perception. The model then
predicts that these preferences should increase with the age
of the respondent during the second development period. For
the ENFP type, the preference scores reflecting the
consistency of the preference for introverted feeling as the
auxiliary attitude-function include those for introversion
and feeling. The model predicts a greater increase in these
60
preferences during the second development period than the
increase predicted for the dominant attitude-function.
Thus, for the ENFPs, the preference scores for intuition and
feeling should increase with age; feeling, the auxiliary
function, increases more rapidly during the second period
than does intui tion. Note that the preferences for
extraversion (associated with dominant intuition) and
introversion (associated with auxiliary feeling) are both
predicted to increase. However, during this period the
development of the auxiliary is more rapid. Therefore,
introversion ,associated with the auxiliary, is predicted to
increase more rapidly than extraversion, which is associated
with the dominant. Due to the method used to compute MBTI
scores, an increase in the reported preference for one
attitude (or function) necessarily produces a decrease in
the reported preference for its opposite. Thus, in
instance the result should be a net decrease in
extraversion preference score.
this
the
The preference score for perception as the attitude
used for orienting consciousness to the external (or extra
verted) world is associated, for the ENFP type, with the
continuing development of intuition. Nothing in the theory
predicts development of an extraverted judging function in
the ENFP; therefore the result is an increase in the
perception preference score with age.
61
During the third period (age 40 and beyond), the model
predicts that the preference for the dominant attitude
function should not increase, and the preference for the
auxiliary attitude-function should increase. Thus, for the
ENFP, the intuition preference score should remain constant
with age, and the feeling preference score should continue
to increase. The preference for extraversion, as with
intuition, stays constant; however, introversion, as with
feeling, increases. Again the result should be a decrease
in the extraversion preference score. The perception
preference score should stay constant in parallel with
intuition. These predictions are summarized in Table 2.
I have arranged the order of the types in Table 2 such
that four groups (each containing four types) share
identical patterns of predicted changes. Jung identified
these groups as extraverted rational types, extraverted
irrational types,
verted irrational
introverted rational
types, respectively.
types, and intro
Jung used these
terms to denote the fact that the four types within each of
the groups share a common aspect of the dominant attitude
function. The two groups (one extraverted and one
introverted) termed rational by Jung both have a judging
function dominant. The two groups termed irrational by Jung
both have a perceptive function dominant. The four types
associated with each group are listed in Table 3.
62
The patterns for the extraverted types and the
introverted types are symmetrical except for the JP scale.
The lack of symmetry arises because the JP scale reflects
development of the function oriented by extraversion.
Thus, predictions for change in
judgment or perception preference
the consistency of the
scores must follow the
extraverted. For extraverts the dominant function is
extraverted, while for introverts the auxiliary function is
extraverted.
Table 2 shows that the same predictions are made at
each stage for all of the extraverts and for all of the
introverts with respect to changes in the EI preference
scores. Likewise, within each of the four rational
irrational groups, identical predictions are made for
changes in the JP preference scores. Further, for the pairs
of types that share the same dominant or the same auxiliary
function, identical predictions are made for the shared
function. Types sharing the same dominant or auxiliary
attitude-function are listed in Table 4.
The research predictions shown in Table 2 for each
preference of each of the 16 types may be reorganized as in
Table 5 according to the type groups that have an identical
prediction for a preference score.
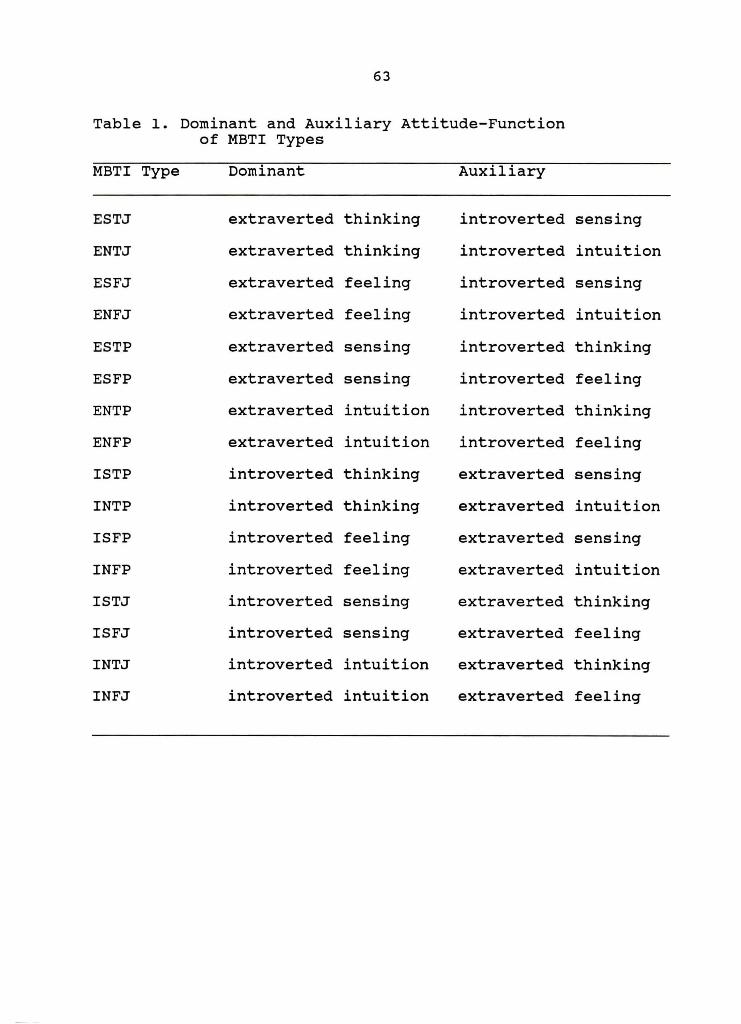
63
Table l. Dominant and Auxiliary Attitude-Function of MBTI Types
MBTI Type Dominant Auxiliary
ESTJ extraverted thinking introverted sensing
ENTJ extraverted thinking introverted intuition
ESFJ extraverted feeling introverted sensing
ENFJ extraverted feeling introverted intuition
ESTP extraverted sensing introverted thinking
ESFP extraverted sensing introverted feeling
ENTP extraverted intuition introverted thinking
ENFP extraverted intuition introverted feeling
ISTP introverted thinking extraverted sensing
INTP introverted thinking extraverted intuition
ISFP introverted feeling extraverted sensing
INFP introverted feeling extraverted intuition
ISTJ introverted sensing extraverted thinking
ISFJ introverted sensing extraverted feeling
INTJ introverted intuition extraverted thinking
INFJ introverted intuition extraverted feeling
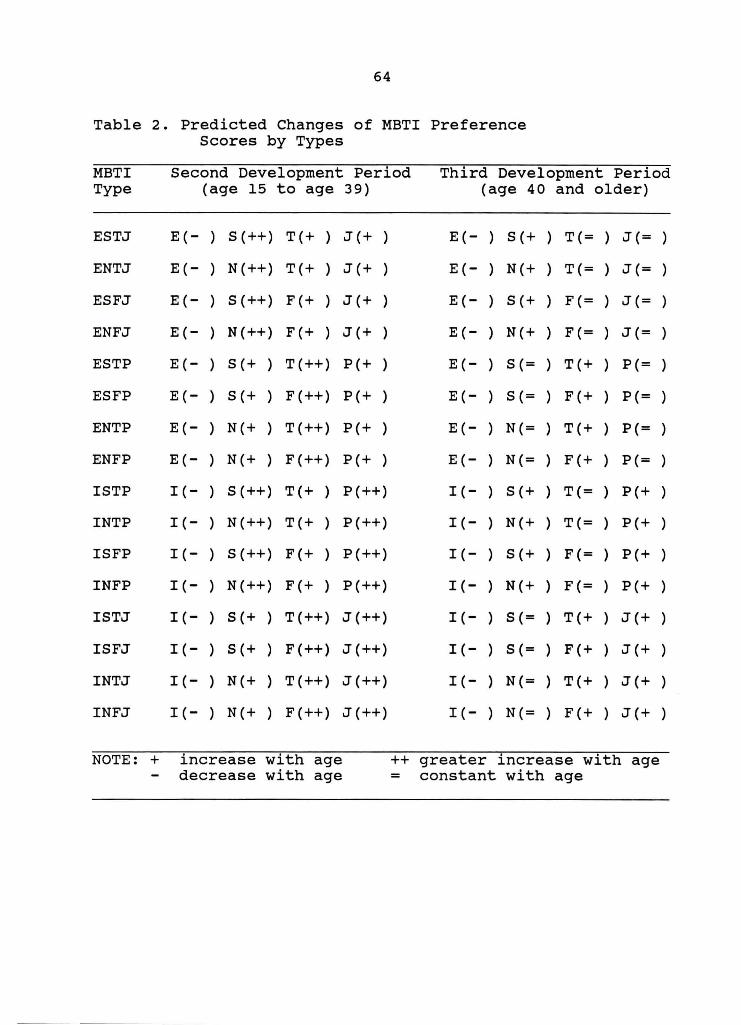
64
Table 2. Predicted Changes of MBTl Preference Scores by Types
MBTl Second Development Period Third Development Period Type (age 15 to age 39) (age 40 and older)
ESTJ E(- S(++) T(+ J(+ E(- S(+ T(= J(=
ENTJ E(- N(++) T(+ J(+ E(- N(+ T(= J(=
ESFJ E(- S(++) F(+ J(+ E(- S(+ F(= J(=
ENFJ E(- N(++) F(+ J(+ E(- N(+ F(= J(=
ESTP E(- S(+ T(++) P(+ E(- S(= T(+ P(=
ESFP E(- S(+ F(++) P(+ E(- S(= F(+ P(=
ENTP E(- N(+ T(++) P(+ E(- N(= T(+ P(=
ENFP E(- N(+ F(++) P(+ E(- N(= F(+ P(=
lSTP l(- S(++) T(+ P(++) l(- S(+ T(= P(+
lNTP l(- N(++) T(+ P(++) l(- N(+ T(= P(+
lSFP l(- S(++) F(+ P(++) l(- S(+ F(= P(+
lNFP l(- N(++) F(+ P(++) l(- N(+ F(= P(+
lSTJ l(- S(+ T(++) J(++) l(- S(= T(+ J(+
lSFJ l(- S(+ F(++) J(++) l(- S(= F(+ J(+
lNTJ l(- N(+ T(++) J(++) l(- N(= T(+ J(+
lNFJ l(- N(+ F(++) J(++) l(- N(= F(+ J(+
NOTE: + increase with age ++ greater increase with age decrease with age = constant with age
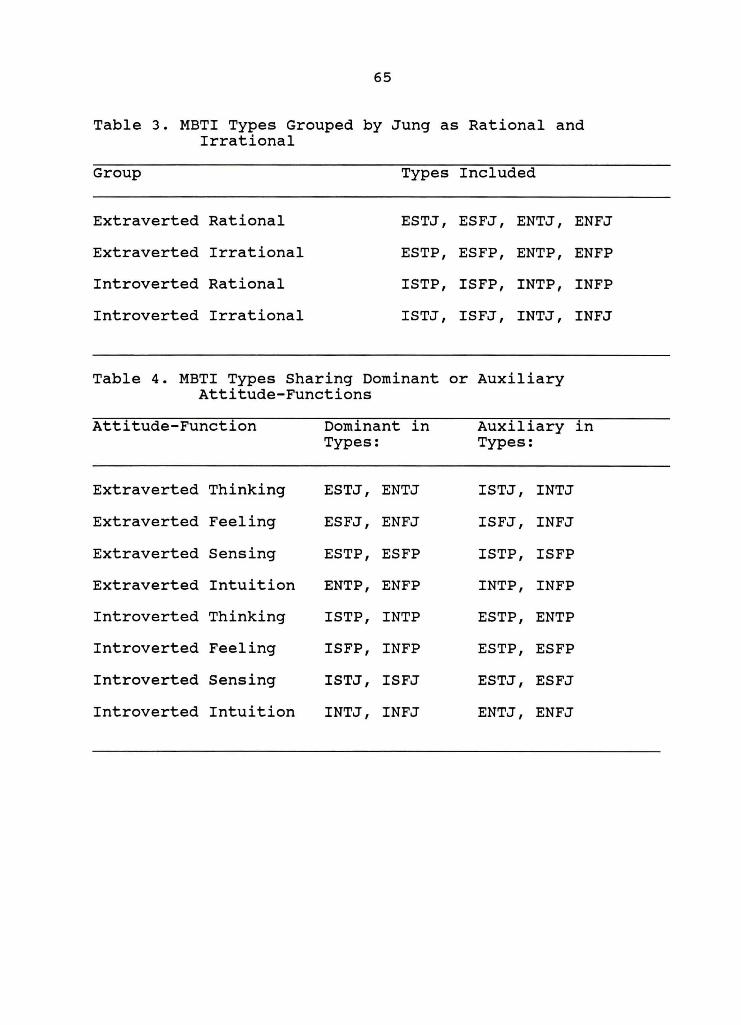
65
Table 3. MBTI Types Grouped by Jung as Rational and Irrational
Group Types Included
Extraverted Rational ESTJ, ESFJ, ENTJ, ENFJ
Extraverted Irrational ESTP, ESFP, ENTP, ENFP
Introverted Rational ISTP, ISFP, INTP, INFP
Introverted Irrational ISTJ, ISFJ, INTJ, INFJ
Table 4. MBTI Types Sharing Dominant or Auxiliary Attitude-Functions
Attitude-Function Dominant in Auxiliary in Types: Types:
Extraverted Thinking ESTJ, ENTJ ISTJ, INTJ
Extraverted Feeling ESFJ, ENFJ ISFJ, INFJ
Extraverted Sensing ESTP, ESFP ISTP, ISFP
Extraverted Intuition ENTP, ENFP INTP, INFP
Introverted Thinking ISTP, INTP ESTP, ENTP
Introverted Feeling ISFP, INFP ESTP, ESFP
Introverted Sensing ISTJ, ISFJ ESTJ, ESFJ
Introverted Intuition INTJ, INFJ ENTJ, ENFJ
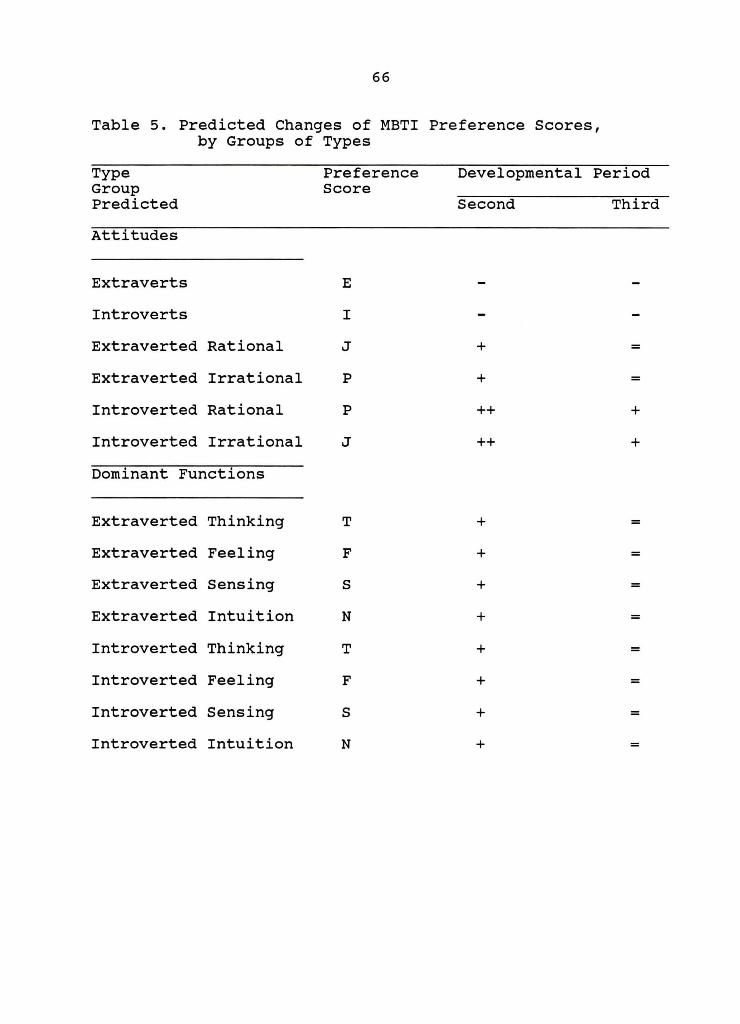
66
Table 5. Predicted Changes of MBTI Preference Scores, by Groups of Types
Type Group Predicted
Preference Score
Developmental Period
Second Third
Attitudes
Extraverts E
Introverts I
Extraverted Rational J + =
Extraverted Irrational P + =
Introverted Rational P ++ +
Introverted Irrational J ++ +
Dominant Functions
Extraverted Thinking T + =
Extraverted Feeling F + =
Extraverted Sensing S + =
Extraverted Intuition N + =
Introverted Thinking T + =
Introverted Feeling F + =
Introverted Sensing S + =
Introverted Intuition N + =
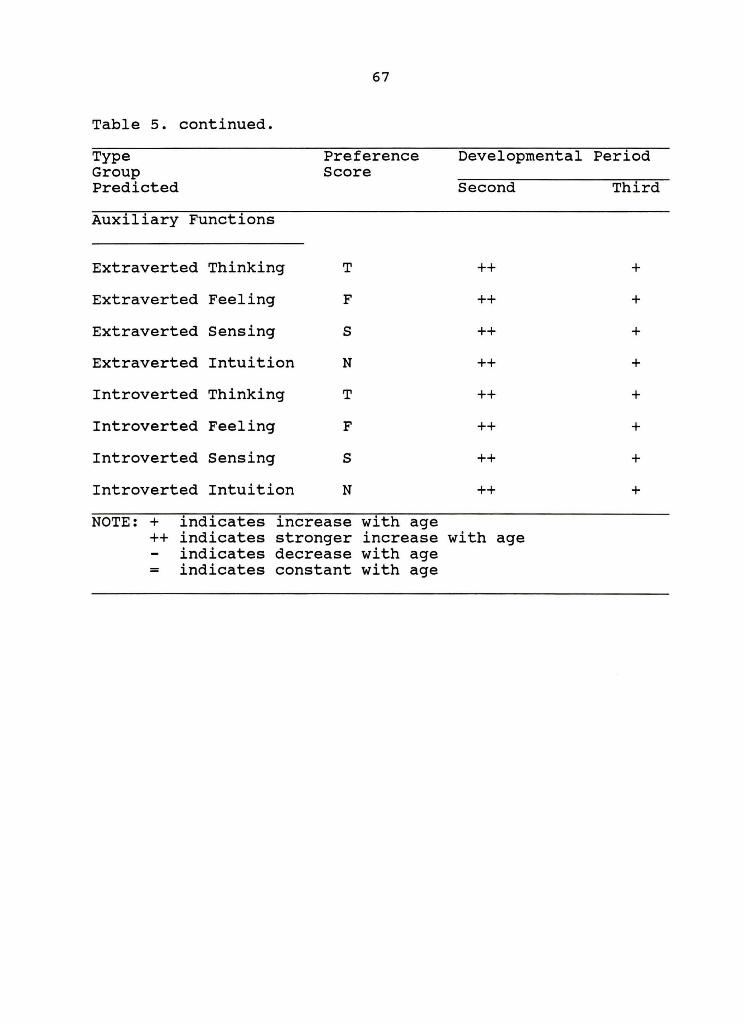
67
Table 5. continued.
Type Preference Developmental Period Group Score Predicted Second Third
Auxiliary Functions
Extraverted Thinking T ++ +
Extraverted Feeling F ++ +
Extraverted sensing S ++ +
Extraverted Intuition N ++ +
Introverted Thinking T ++ +
Introverted Feeling F ++ +
Introverted Sensing S ++ +
Introverted Intuition N ++ +
NOTE: + indicates increase with age ++ indicates stronger increase with age
indicates decrease with age = indicates constant with age
CHAPTER II METHODS
Introduction
This chapter is a description of the data sample
selection and the methods of data analysis used in this
study. The problem, as discussed in the previous chapter,
required a large sample of MBTI records which was equally
representative of each of the 16 MBTI types and of each
gender at each of the age levels selected for study. I
analyzed the data in two separate ways: (a) analyses of
variance and regression analyses on the preference scores by
age groups and by age respectively for each gender, and (b)
item analyses of the prediction ratios at each of the age
groups for each gender.
Selection of the Sample
The Center for Applications of Psychological Type
(CAPT) in Gainesville, Florida, maintains a databank con-
taining of all MBTI questionnaires submitted to CAPT for
computer scoring. Mary H. McCaulley and Isabel Myers
established the data bank to make available large samples of
MBTI records for psychometric and normative studies. Those
who submit MBTIs for computer scoring--individuals and
68
69
groups--are informed that the records are archived for
research requiring aggregated data and that the data they
submit will be so used. Data used in this study were drawn
from the CAPT MBTI records submitted between March, 1978,
and June, 1984.
In June, 1984, the CAPT data bank contained 82,498
MBTI Form F records. Respondents had omitted 35 or more
items on 637 (.08%) of the indicators. These records were
dropped because earlier studies done at CAPT (Kainz &
McCaulley, 1980) of split-half reliability co-efficients had
shown unacceptable reliability co-efficients for MBTI
scores from such records. The remaining 82,831 records were
sorted alphabetically by the respondents' names and
sequentially assigned a random number drawn from a file of
90,000 non-repeating random numbers; thus, each record had a
unique randomly generated identifier.
The MBTI respondent's age was computed by subtracting
the reported date of birth from the reported date of
testing or from the date the MBTI was scored if the date of
testing was not reported. After the deletion of 5,187 cases
for which no age could be computed, the resulting sample
contained 76,764 records.
These records were separated into nine age groups:
9-14, 15-17, 18-20, 21-24, 25-29, 30-39, 40-49, 50-59, and
60 or over. The youngest group (9-14 years) was dropped as
being below the age for which the MBTI is known to be
70
reliable. Members of the remaining eight age groups were
further separated by gender and type. This process produced
256 groups (8 ages x 2 genders x 16 types). Each of these
groups was placed in random order by sorting the records
into the sequential order of their randomly generated
identifiers. The frequencies of records varied widely
across types and gender wi thin the age groups and this
required further selection to balance the inequities.
The frequency of the smallest type-gender group at
each of the eight age levels determined the frequency for
all other type-gender groups at that age level. The
required number of records was selected sequentially from
each of the randomly ordered groups. This process achieved
the goal of randomly selecting, at each age level, the
largest possible sample size thatwas balanced for type and
gender. Table 6 displays the frequencies at each age level
of the final sample.
Potential Sources of Sampling Bias
The process for selecting the sample provided an equal
representation of types and gender at each age level, but
was limited by the records available in the CAPT data bank.
McCaulley (Myers & McCaulley, 1985) noted several factors
that limit the representativeness of the CAPT data bank with
respect to the general population. Most significant among
these is the relatively high education levels of the MBTI
respondents (31 report having completed at least some
71
college). The CAPT data bank and the data sample drawn from
it should not be considered to be representative of the
general population. For the purposes of this study such
representativeness is not a requirement. Regarding other
factors, however, the data bank sample is likely to be
representative of the populations with whom the MBTI is
currently being used.
Analyses of Variance and Regression Analyses
within the data sample the MBTI records weresub
divided into 256 groups (2 genders x 8 age groups x 16
types), each containing the records for MBTI respondents
reporting the same type, gender, and age group. Sub-samples
consisting of groups of types were compiled. For each sub
sample (hereafter referred to as sample) the MBTI preference
score treated as the dependent variable shared the same
attitude-function as the other types in the sample, e.g.,
dominant extraverted intuition. The MBTI records included in
each analysis were determined by the groupings of types
listed in Table 5. Separate analyses of variance and
regression analyses were performed for each gender. Thus,
analyses of the relationship of age to females preference
for extraversion included all records from female
extraverts. Likewise, analyses of the relationship of age
to males preference for extraverted thinking as an auxiliary
attitude-function included all males whose reported type
preferred extraverted thinking as an auxiliary function,
72
i. e., ISTJ and INTJ. For each analysis the type of MBTI
respondents included may be found in Tables 3 and 4.
Differences of mean preference scores were predicted
both (a) across the eight age groups and (b) across the two
theoretical stages of the development of type preferences
(age 15-39, and 39 and over). Also, a definite pattern of
trends of association between the preference scores and age
were predicted for the two developmental stages. Analyses
of variance were performed for both the eight age groups
(see Table 6) and the two theoretical stages of development
defined as the independent variable. Regression analyses
were performed across the full age range of the sample and
separately for the age ranges of the developmental stages.
For each analysis of variance, the null hypothesis
being tested was that no differences exist among the means
of the MBTI preference scores between the age groups, or
between the developmental stages. For each regression
analysis for trends of association, the null hypothesis
being tested was that no trend of association exists between
the MBTI preference scores and the ages of the respondents.
In Table 5 are listed the 22 samples of MBTI types on
which the analyses in this study were performed. For each
grouping of types, two analyses of variance and two
regression analyses are indicated for each gender. The
study, thus, includes 88 separate analyses for each gender
or 166 analyses in all. Because so many analyses were
73
performed, the null hypothesis was not rejected unless the
probability of the test statistic E was .005 or less.
Homogeneity of Variance in the Sample
The large variation in the frequencies of observations
available for each of the eight age groups raised consid
erable concern that the analyses might be distorted by large
departures from the homogeneity of the variance of the
dependent measures. For each of the 22 type groupings the
homogeneity of variance of the relevant MBTI preference
score was tested across the age
stages used in the analyses.
groups and developmental
Analyses of the Item weights
Myers and McCaulley (1985) reported that the weights
assigned to the item responses scored on the MBTI are
determined according to a prediction ratio (PR) which is
calculated as follows:
PRj = %J[J] / (%J[J] + %P[J]) and
PRp = %P[P] / (%P[P] + %J[P])
where:
is the predictive value of
is the predictive value of
the J response,
the P response,
PRj
PRp
%J[J] is the percent of Judging types giving the
jUdging response,
%J[P] is the percent of Judging types giving the
perceptive response,
74
%P[P] is the percent of Perceptive types giving
the perceptive response, and
%P[J] is the percent of Perceptive types giving
the jUdging response.
Responses obtaining a calculated PR from .630 and .729
have a weight of one point. Responses obtaining a
calculated PR of .730 or above have a weight of two points.
Responses with calculated PRs below .630 or endorsed by more
than 50% of respondents reporting the opposite preference
(e.g., %P[J] or %J[P] greater than 50 percent) have a weight
of zero points. The zero point weight is assigned on the
assumption that responses that are generally too popular
provide little evidence of a type preference. The items
with zero point responses were retained because the
endorsement of the unpopular alternate response may provide
good evidence of a type preference.
The prediction ratios and popularity of each of the
item responses were calculated by the MBTI Item Analysis
Program (Grennade, 1985) for the total sample, for females,
for males, for all age groups combined, each age group
separately and each stage separately. Following Myers's
procedures in all analyses, records were dropped from the
calculation if the preference score on the relevant scale
was within one point of the mid-point of that scale.
omitted responses were not included in the calculations for
that item.
75
The assumption underlying analyses of the response
weights undertaken in this study is that Myers, in her
original method of response weighting, established an appro
priate standard of predictive value for each response based
on the MBTI samples available to her, and established an
appropriate method (prediction ratios and popularity) to
assess a response's performance. Myers reported (1961) that
thousands of proposed item responses that failed to meet her
standard were discarded as inadequate. The central question
addressed in these analyses is whether the responses that
met the predictive criteria among the high school and
college students perform as well among older groups.
Responses that are not as predictive as expected by Myers's
criteria are considered over-weighted. Responses that
exceed the criteria are considered under-weighted.
Responses are considered over-weighted if the
calculated PR was less than the minimum PR specified by
Myers for the assigned weight of the response, or if the
popularity of the response exceeded 50%. Responses are con
sidered under-weighted if the calculated PR was greater than
the maximum PR specified by Myers for the assigned weight,
and if the popularity of the response did not exceed 50%.
Responses are considered correctly weighted if the calcu
lated PR was between the maximum and minimum PRs specified
by Myers for the assigned weight of the response, and if the
popularity of the response does not exceed 50%.
76
computer Software Used in Sample Selection and Data Analyses
All record manipulations and random selection of
records were performed by specially written computer
programs prepared at CAPT, or by utility programs contained
in the UNIX V. 7 operating system. All statistical calcu-
lations were performed by the SPSS/PC: Release 1.1 statis-
tical analysis software system (Norusis, 1984). Item
analysis calculations were performed by the MBTI Item
Analysis Program (Grennade, 1985).
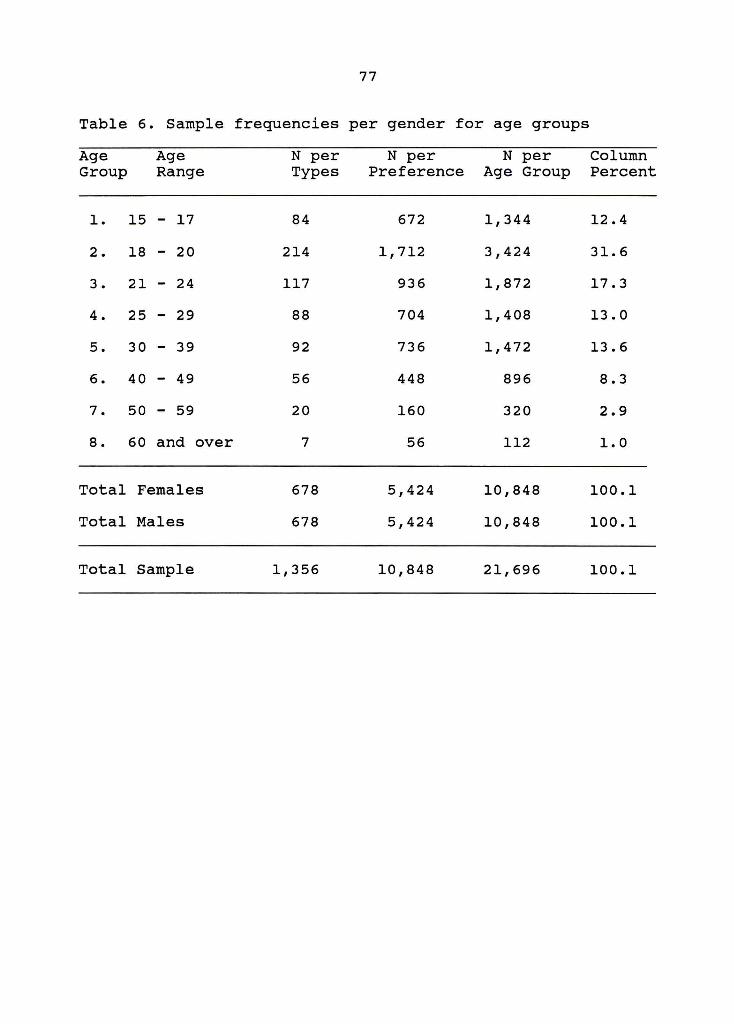
77
Table 6. Sample frequencies per gender for age groups
Age Age N per N per N per Column Group Range Types Preference Age Group Percent
1. 15 - 17 84 672 1,344 12.4
2 . 18 - 20 214 1,712 3,424 31. 6
3 . 21 - 24 117 936 1,872 17.3
4. 25 - 29 88 704 1,408 13.0
5. 30 - 39 92 736 1,472 13.6
6. 40 - 49 56 448 896 8.3
7. 50 - 59 20 160 320 2.9
8. 60 and over 7 56 112 1.0
Total Females 678 5,424 10,848 100.1
Total Males 678 5,424 10,848 100.1
Total Sample 1,356 10,848 21,696 100.1
CHAPTER III RESULTS
Introduction
This chapter is a presentation of the results of the
analyses of variance and the regression analyses of the MBTI
preference scores by age of the respondents, and the results
of the item analyses. Chapter I included a review of
several studies in which investigators reported a 'statis-
tical association between MBTI preference scores and the
respondents's ages. The sampling procedures in those
studies and several investigators omission Jung's distinc-
tion between dominant and auxiliary attitude-functions were
cited as methodological deficiencies that limit the utility
of the results they reported.
I undertook the present study to correct those
deficiencies and to evaluate a set of research predictions
that attempt to relate changes in MBTI to age in a manner
consistent with Jung' s theory. A further purpose was to
examine the MBTI item weights to determine if the weights
are appropriate across the age range for which the MBTI is
used.
78
79
To achieve these purposes I selected a large sample
(N = 21,696) of MBTI records from the data bank of MBTI
records maintained at the Center for Applications of Psycho
logical Type (CAPT). The selection procedures insured that
equal numbers of records were included for each of the 16
MBTI types for each gender within eight age groups. I
analyzed the differences among the mean MBTI preference
scores by age groups and by hypothesized stages of type
preference development, and trends of association between
the MBTI preference scores and age were analyzed by
regression analyses across the full age range and within the
age ranges of the developmental stages. I tested the
variances of the preference scores across the age groups and
stages used in the analyses for departures from homogeneity.
Finally, I replicated on the full age range the procedures
for item analyses employed by Myers (Myers & McCaulley,
1985) to determine the current item weights, and replicated,
also, for each age group and developmental stage separately.
Analyses of Variance and Regression Analyses
The results of the analyses of variance, tests for
departure from homogeneity of variance, and regression
analyses for trends of association will be presented in
separate sections for the attitude scales (EI and JP), the
function scales, the dominant attitude-functions (ET, EF,
ES, EN, IT, IF, IS, IN), and the auxiliary atti tude-
functions (ET, EF, ES,. etc.)
80
Due to the large number of analyses of variance and
regression analyses performed in this study the null hypo
theses (of no difference among group means or no linear
trends of association) were rejected only if the test
statistics had a probability of .005 or less of occurring by
chance.
Extraversion and Introversion
The research predictions for the EI preference scores
(summarized in Table 5) were consistent for all types for
both developmental stages. Both preferences were predicted
to decrease with the age of the respondent, because during
the second developmental stage (age 15- 39), the preference
for the auxiliary attitude function is expected to have
greater increase than the preference for the dominant. Due
to the ipsative nature of the MBTI scales, an increase in
the auxiliary attitude also produces a decrease in the
dominant attitude. For all subjects preference for the
attitude of the dominant is always greater. Thus, an
increase in the consistency of the auxiliary is observed in
a decrease in the consistency of the attitude of the
dominant.
In Figure 1 the mean EI preference score was plotted
for extraverts and introverts of each gender by age groups.
By visual inspection, what variability is present appears to
be relatively small. Nevertheless, the stability of the
variance estimates from such a large sample permits
81
statistical analysis to detect even
effects. Table 7 is a summary of
small but reliable
the results of the
analyses of variance for the age groups. Each of those
tests indicates differences among the mean EI preference
scores for each of the samples. Bartlett-Box tests for the
homogeneity of variance indicate departure from homogeneity
among the variances for female extraverts. Analyses of
variance of the EI preference scores by developmental stage
(see Table 8) indicate that only female extraverts differ
significantly in the consistency of preference at different
stages. Variance estimates are homogeneous across the
developmental stages.
Tables 9, 10 and 11 summarize the results of regres-
sion analyses for trends of association with age. Across
the full age range, a small trend is indicated for female
extraverts to decrease their preference for extraversion and
for both male and female introverts to increase their
preference for
extraverts.
introversion. No trend occurs for male
During the second developmental stage (15-39 years),
trends occurring for the full age range are present with
slightly greater strength (see Table 10). It would appear
that the trends of the second stage largely account for the
trends found for all ages. For the third developmental
stage (age 40 and over) no statistically reliable trends
occurred (see Table 11).
82
Taken together the results show that the consistency
of preference for extraversion and introversion varies
reliably with the age of the respondent but only to a small
degree. The largest effect is among female extraverts
between the ages of 15 and 39, who report a decreasing
preference for extraversion. Analyses of variance show
reliable differences among the mean EI preference scores for
both males and females across eight age groups. However,
when the data are grouped by developmental stages, the
differences appear only among female extraverts. Among the
other samples the differences of the means lie more within
the stages than across them.
Al though younger extraverts did show a decrease in
reported extraversion over time, the overall trends are
more consistent with the interpretation that respondents
either do not change their reported preference for extra
version or introversion or they increase their reported
preference for introversion as they grow older.
Judging and Perceptive Attitudes
The jUdging and perceptive attitudes are interpreted
as being the result of extraverting either a judging or a
perceptive function. According to Jung's theory of types,
the dominant function of extraverts will be extraverted and
the auxiliary function of introverts will be extraverted.
Predicted changes in the consistency of the preference for
the judging or perceptive attitude are the same as changes
83
predicted for the extraverted function, i. e., for extra
verts, the dominant function, and for introverts, auxiliary
function. During the second developmental stage, the prefer
ence for the dominant function is predicted to increase to a
small extent and the preference for the auxiliary function
is expected to increase to a greater degree. During the
third developmental period, the preference for the dominant
function is expected to remain constant and the preference
for the auxiliary function is expected to increase. There
fore, during the second stage, the JP preference score of
extraverts is expected to increase to a small degree and
the JP preference score of introverts is expected to have a
greater increase. During the third stage the JP preference
scores of extraverts is expected to remain constant and the
JP preference score of introverts is expected to increase to
a small degree.
The analyses were performed separately for samples
having the same predicted changes and the same jUdging or
perceptive preference. Jung termed these groups: extra-
verted rational, extraverted irrational,
rational, and introverted irrational.
introverted
Figures 2 and 3 display the mean JP preference scores
across the eight age groups. By visual inspection it is
apparent that among both genders the samples reporting a
preference for the judging attitude (extraverted rational
and introverted irrational types) report a more consistent
84
preference for jUdging among the older age groups. Among
the samples reporting a preference for the perceptive
atti tude (extraverted irrational and introverted rational
types) the reported preference for perception apparently
decreases among the older groups for extraverted irrational
types of both genders, and for male introverted rational
types. Among the female introverted rational types the
preference for the perceptive attitude appears to decrease
slightly from the first through the fourth age group, to
increase about the same degree through the seventh age
group, and finally decline to the level of preference
reported by the male introverted rational types.
Analyses of variance by age groups, summarized in
Table 12, confirmed reliable differences among the mean JP
preference scores for the seven samples. The mean JP
preference
introverted
scores do not differ by age among the female
rational types. Analyses of variance by
developmental stages, summarized in Table 13, also indicate
differences that are statistically reliable. Five of the
eight samples show differences at the .005 probability level
or beyond. All but the introverted rational types and the
male extraverted irrational types differ in the preference
for the perceptive attitude between the second and third
developmental stages. The fourth sample reporting a prefer
ence for the perceptive attitude (Le., male introverted
rational types) does not have homogeneity of variance of the
85
JP preference scores at the two developmental stages.
Therefore, the results for that sample may be distorted.
The analyses of trends across the full age range
summarized in Table 14 show that the differences detected by
the analyses of variance have a reliable linear association
for all samples except female introverted irrational types.
Each of the samples reporting preference for the judging
attitude have reliably positive associations between age and
the JP preference score. Three of the samples preferring the
perceptive attitude have reliable, though smaller, negative
associations between age and the JP preference score. The
trends for the second developmental stage, shown in Table
15, are similar to those for the full age range. However,
for each sample having reliable associations, the trend is
weaker. While some small trends continue into the third
stage, none are statistically reliable beyond a probability
of .005 (see Table 16).
The pattern of trends of association between the
consistency of preference for the judging or perceptive
atti tude do not follow the expectations presented above.
Negative trends occur among the extraverted irrational types
and male introverted rational types, for whom a positive
trend was predicted. The results obtained are more
consistent with another interpretation: that for those
samples reporting a preference for the judging attitude, the
preference is reported more consistently at older ages;
86
whereas, among those samples reporting a preference for the
perceptive attitude (except female introverted rational
types) the preference is reported less consistently at older
ages.
It is of interest to note the differing results
obtained for male and female introverted rational types.
Type theory provides no basis for predicting gender differ
ences between these two samples. Much of the gender differ
ence observed (Figure 4) is accounted for by the relatively
lower preference for the perceptive attitude reported by
female introverted rational types in the lowest age groups,
when compared to male introverted rational types and to all
extraverted irrational types.
Figures 3 and 4 (although
reliability) that females who
It may also be observed from
not tested for statistical
report a judging attitude
report a more consistent preference at the lowest age groups
than do males who prefer jUdging.
Dominant Sensing-Intuition
Parallel research predictions were made for all of the
attitude-functions. The second developmental stage (age
15- 39) is theoretically the period of greatest development
of the auxiliary attitude-function and, to a lesser extent,
of further development of the dominant attitude-function.
During the third developmental stage (age 40 and over), the
demands of individuation require a lessening of identifi
cation of ego consciousness with the dominant attitude-
87
function and an increasing interest in previously undevel
oped attitude-functions. Therefore, it was predicted that
the MBTI preference scores related to the dominant attitude
function would show a small yet reliable increase during the
second developmental stage, and then would remain constant
during the third developmental stage.
Figures 4 and 5 display plots of the mean SN
preference scores by age groups for those samples having a
dominant perceptive attitude-function. By visual inspec
tion, distinct patterns of association appear for each of
the attitude-function samples, patterns that are largely
shared by both genders. Among the extraverted samples there
is a general tendency for the preference to increase slowly
through the age groups of the second developmental stage
(groups I 5), with the exception of a drop in the
preference for extraverted intuition among the 18-20-year
olds. Among extraverted respondents aged 60 and older,
females who prefer extraverted sensing show a continued
increase in their preference, but the preferences of the
other extraverted samples decrease. Among introverts, those
preferring sensing display a clear tendency to increase
their preference in the older age groups. The introverted
intuitives increase their preferences as well, but to a
lesser degree. Also of note are the consistent shifts in the
level of the reported preference by attitude-function
samples. Extraverts preferring intuition prefer it more
88
than extraverts preferring sensing prefer sensing. Among
introverts the relationship is opposite and even more
apparent.
means.
All of the sensing means exceed the intuition
The analyses of variance of the SN preference scores
by age groups, summarized in Table 17, indicate reliable
differences among the means for all samples except
extraverted sensing. However, Bartlett-Box tests indicate
that significant departures from homogeneity of variance
exist among the introverted sensing samples for both
genders. The differences remain in mean SN preference
scores for extraverted intuition among males and for intro
verted sensing, when the data are grouped by developmental
stages (see Table 18). The differences among the means for
the introverted intuitive samples appear to lie within the
stages rather than between them.
The regression analyses for trends of association
between the SN preference score and age are summarized in
Tables 19, 20 and 21. Across the full age range small but
reliable trends are indicated for the SN preference scores
to increase with age for all samples having a dominant
perceptive attitude-function, with the exception of female
extraverted sensing types. Findings for the extraverted
sensing sample also indicate a positive association; how
ever, the results are not statistically reliable (see Table
19). During the second developmental stage, the analyses of
trends summarized in
associations for all
types for both genders.
89
Table 20, show reliable positive
samples except extraverted sensing
For the third developmental stage,
the results show that for four samples (female and male
extraverted intuition, female introverted intuition, and
male extraverted sensing) a negative trend is indicated (see
Table 21). Although none of the findings for the third
stage are statistically reliable, the BETA values reported
are as large for some samples as those that are reported as
statistically reliable for the second stage. That is to say,
the trends of association are as strong, but the variance
estimates from the much smaller samples do not permit the
same degree of confidence in the findings.
Among the samples reporting a dominant perceptive
attitude-function, the research predictions for the second
developmental stage are supported for seven of eight
samples. For the remaining sample, female extraverted
sensing, the BETA value observed indicates a positive, but
unreliable, trend. The research predictions for the third
stage--of no reliable trends--are supported for all eight
groups; however, the magnitudes of the reported BETA values
suggests the possibility that larger samples, providing more
stable variance estimates, might not show the mix of
positive and negative trends to be reliable.
The generally close correspondence of the means for
the two genders seen in Figures 4 and 5, is strongly
90
suggestive that the age effects observed in tnese data
affect males and females in a similar manner. Also of
interest are the differing levels of reported preference by
samples in each age group. Among extraverts, intuition is
more consistently reported by intuitives than sensing is by
sensing types. Among introverts, the reverse relationship
is found: the sensing types report their sensing preference
more consistently than the intuitives report their
preference for intuition.
Auxiliary Sensing-Intuition
The predictions made for the preference scores
associated with the auxiliary attitude-functions were all
identical. During the second developmental stage the pre
ference scores were expected to increase and the increase
was expected to be greater than when the preference score is
associated with a dominant attitude-function. During the
third stage, the preference scores were expected to continue
to increase with age, but more moderately. Therefore, it
was predicted that the SN preference scores would have
moderate and reliable increases with the respondents' age
during the second stage and small but reliable increases
with the respondents' age during the third stage.
The means of the SN preference scores for the eight
samples having a perceptive auxiliary function are plotted
in Figures 6 and 7. Considerable variability of the means
can be seen for each of the samples and, at least for
91
portions of the age ranges of each sample, an increase in
the preference score appears to be related to the increased
age of the groups.
The analyses of variance by age groups, summarized in
Table 22, confirm the statistically reliable differences
among the mean auxiliary SN preference scores for all
samples. However, Bartlett-Box tests indicate departures
from homogeneity of variance for three of the samples:
female extraverted sensing, female introverted intuition,
and male introverted sensing. Analyses of variance by
stages, summarized in Table 23, indicate that all samples
have reliably different means for the second and third
stages, except for females whose auxiliary is introverted
sensing and males whose auxiliary is introverted intuition.
However, in these analyses, departures from homogeneity of
variance also have been detected for three samples:
extraverted sensing (both genders ) and female introverted
sensing.
Regression analyses for trends of association between
auxiliary SN preference scores and age across the full age
range are summarized in Table 24. All trends show positive
association; however, the trends for female extraverted
sensing and both male and female extraverted intuition are
not statistically reliable. The gender difference among
the samples with auxiliary extraverted sensing is note
worthy. The strongest degree of association observed in
92
these samples is among males, the weakest is among females.
This is in contrast to the gender similarities for the
introverted functions and for extraverted intuition.
Regression analyses for stage two, summarized in Table
25, showed that small, statistically reliable associations
between age and auxiliary SN preference scores are present
during this stage, except among the female auxiliary extra
verted sensing sample. For the third developmental stage no
reliable trends are observed (see Table 26).
The results obtained from the analyses of SN
preference scores associated with the auxiliary atti tude
functions demonstrate the trend to increase with age during
the second stage, as was predicted. Further, the absence of
reliable trends during the third stage is also consistent
with predictions. However, the negative trends found for
the third stage (even though they are not statistically
reliable) are not consistent with the theoretical model.
Dominant Thinking-Feeling
As noted above, I made parallel research predictions
for all of the attitude-functions. The second developmental
stage (age 15-39) is theoretically related to the greatest
period of development of the auxiliary attitude-function and
to a lesser extent to the further development of the
dominant attitude-function. During the third developmental
stage, the demands of
identification of ego
individuation require a lessening of
consciousness with the dominant
93
attitude-function, with an increasing interest in the pre-
viously undeveloped attitude-functions. Therefore, one
prediction was that the MBTI SN preference scores related to
the dominant attitude-function would show a small yet
reliable increase during the second developmental stage,
then remain constant during the third developmental stage.
In the analyses of the samples reporting a dominant
judging attitude-function (thinking or feeling), the TF
preference scores were predicted to increase with age during the second stage (age 15-39), and remain constant there-
after.
The plots of the mean TF preference scores are
displayed in Figures 8 and 9. Upon visual inspection, the
TF preference appears to increase with age only among the
male extraverted thinking sample. This observation is con-
firmed by analyses of variance, both by age groups and by
stage, which indicate reliable differences among the group
means only for the male extraverted thinking sample (see
Tables 27 and 28). However, the probability (2 = .0054) of
the result for the analysis of variance by age groups for
the female extraverted thinking sample barely fell short of
the criterion (2 = .005) for reliability in this study.
Regression analyses for trends of association across
the full age range indicate a reliable trend in the male
extraverted thinking sample for the TF preference score to
increase with age (see Table 29). During the second devel-
94
opmental stage both male and female extraverted samples
increase their preferences for thinking (see Table 30). No
reliable trends are observed for the third stage (see Table
31), and the largest of the nonreliable trends are negative.
The small increases in TF preference scores during the
second developmental stage (which were expected for all of
the samples reporting a preference for a dominant judging
function) appear in these data only among the samples pre
ferring extraverted thinking. As expected, no reliable
trends were observed during the third stage, although, as
with other analyses reported here, the BETA values are large
enough (particularly for male introverts) to suggest that
reliable trends might be detected in larger samples.
Because the TF scale is scored with different weights
for males and females, the differences in level of
preference scores that appear in Figures 8 and 9 are likely
to reflect only the differences in the maximum available
scores. However, it is interesting to note the apparent
difference in level of TF preference for extraverted versus
introverted functions. Introverted feeling appears to be
reported more consistently at all age groups than is
extraverted feeling,
extraverted thinking
introverted thinking.
and older males appear to report
more consistently than they report
Although, these differences are
suggested by the plots of the means, they were not tested
statistically.
95
Auxiliary Thinking-Feeling
As with the dominant attitude-functions, the predic
tions made for the preference scores associated with the
auxiliary attitude-functions are all identical. During the
second developmental stage the preference scores are
expected to increase; the increase is expected to be greater
than when the preference score is associated with a
dominant attitude-function. During the third stage, the
preference scores are expected to continue to increase with
age, but more moderately. Therefore, one prediction was
that the TF preference scores would have moderate, and
reliable associations with the respondents' age during the
second stage, and small but reliable associations with the
respondents' age during the third stage.
The plots of the mean auxiliary TF preference scores
are displayed in Figures 10 and 11. Visual inspection of
the plots suggests that there is somewhat more 'bounce' in
the pattern of variability for the judging preference when
it is the auxiliary function than when it is the dominant
(compare Figures 8 and 9 to Figures 10 and 11). Positive
trends appear most likely among the two male samples
reporting auxiliary thinking, though both samples show a
pronounced decline in the consistency of their preference
among the 50-to-59-year-old respondents (age group 7).
Analyses of variance by age groups, summarized in
Table 32, indicate reliable differences among the mean
96
auxiliary TF scores for the male and female extraverted
thinking samples and for the male introverted thinking
sample. Analyses of variance by developmental stages,
summarized in Table 33, show that the differences of the
means among the males are also present across the stages,
while the differences among the female extraverted thinking
sample are not.
Regression analyses across the full age range indicate
that small and reliable, positive trends associate age and
auxiliary TF preference scores for all of the introverted
functions and for male extraverted thinking (see Table 34).
During the second developmental stage, only the trend among
the male introverted thinking sample is reliable, although
the probability (2 = .0073) of the trend among the male
extraverted thinking sample closely approaches the criterion
for reliability (see Table 35). During the third stage
small negative, nonreliable, trends are present among
extraverted thinking samples of both sexes and the female
introverted thinking sample, and a small non-reliable trend
of positive association appears among the female
verted feeling sample.
intro-
In general, the pattern of trends for auxiliary TF
preference scores to increase with the age of the respondent
during the second developmental stage is not present in
these data. The trends observed during the third stage are
not statistically reliable, but suggest that both positive
97
and negative associations of age and preference scores may
occur.
Additional observations of the patterns of the
attitude-function preference scores have not been tested
for statistical reliability, yet are of note for theoret
ical and methodological reasons. These observations concern
the utility of the distinction made in these analyses
between extraverted and introverted functions, and between
dominant and auxiliary functions. The value of the extra
verted-versus-introverted distinction is most obvious with
respect to the relative levels of the preferences for
sensing and intuition (see Figures 4 and 5). Among
introverted sensing samples the preference for sensing is
noticeably more consistent than the intuitive preference of
the introverted intui ti ves. Conversely, the extraverted
intuitives reported intuition more consistently than the
extraverted sensing samples reported sensing. Though not to
the same extent, a similar difference of level
distinguishing extraverted feeling from introverted feeling
among females appears to be present.
The distinction between dominant and auxiliary
functions may also prove useful with respect to
understanding changes in the consistency of preference at
differing ages. The pattern of the means for extraverted
sensing among males appears to differ according to whether
the attitude-function is dominant or auxil iary (compare
98
Figures 4 and 7). Further, the homogeneity of the variance
of the preference scores is more consistent among analyses
in which the variance was associated with the dominant
rather than the auxiliary function. This is most clear for
the SN preference scores where 7 of 16 analyses showed
departures from homogeneity. That the dominant differs from
the auxiliary in this respect may reflect the generally less
even development of the auxiliary function that is expected
from theory.
Analyses of the Item Weights
Findings of statistically reliable changes in the
consistency of MBTI preference scores related to the ages of
the respondents prompted the present research. The pub
lished literature contains several references to such
findings. My pilot analyses of a large unselected sample of
MBTI records substantially agreed with the published
reports. The methodological deficiencies of sample
selection in both the published analyses and the pilot
analyses provided one possible explanation for the reported
results. However, in reviewing the development of the MBTI
scales and the selection of the items comprising the
scales, I found a second possible explanation. The MBTI has
been revised 10 times since the first selection of the
items. New items and modifications of the scoring proce-
dures, such as differential weighting of the responses, were
introduced and revised to control for the relative
99
predictive value and social desirability of the responses.
Scoring procedures that had been adjusted initially to a
mature sample were revised for progressively younger samples
of respondents. The final item response weights were estab
lished mainly using high school student samples. Thus, the
items and/or the assigned weights may be more appropriate
for younger, rather than older, respondents.
Myers assigned the item weights according to a predic
tion ratio (PR) formula that may vary from zero to one.
Responses obtaining PR values of .630 to .729 received a
weight of one point, responses with a PR of .73 or above
received a weight of two points, and responses with PR
values below .630 or are endorsed by 50% or more respondents
having the opposite preference received a weight of zero
points.
In conducting the analyses of response weights in this
study I made the assumption that Myers's use of the
prediction ratios and response popularity were appropriate
methods for assessing the capacity of a response to predict
type preferences. Myers's standards were rigorous. Myers
(1961) reported that she discarded as inadequate thousands
of proposed item responses that failed to meet her
standards. Her early studies of items were based on adults
who were functioning well in society. Later she worked with
samples at lower ages and educational levels so that the
Indicator be able to predict type in these groups, where
100
type may be more difficult to assess. The current published
weights are based mainly on high school and younger student
samples.
The central question
data from the MBTI data
I addressed, using the
bank, was whether the
current
weights
established more than a decade ago with younger samples are
less than, equal to, or more than weights that would be
assigned by Myers's formulae on the basis of data bank
responses from older age groups. Responses where Myers's
weights are higher than weights that would be set by my
analyses of the data bank responses for any given age group
are designated over-weighted--that is, according to the
results of these analyses, the published scoring keys weight
the predictive value of the response higher than or over its
data bank weight. Responses where Myers's weights are
lower than weights established from data bank responses of
that age group are designated under-weighted--that is,
according to the results of these analyses, the published
scoring keys weight the predictive value of the response
lower than or under its data bank weight.
In the present study, to evaluate the appropriateness
of the item weights at different ages, I calculated the
prediction ratios for each of the scored items separately
for respondents at each age level used in the analyses of
variance and the regression analyses. Responses were
considered over-weighted if the calculated PR is less than
101
the minimum PR specified by Myers for the response's
assigned weight, or if the popularity of the response
exceeded 50&. Responses are considered under-weighted if
the calculated PR was greater than the maximum PR specified
by Myers for the response's assigned weight, and if the
popularity of the response does not exceed 50%. Responses
are considered correctly weighted if the calculated PR was
between the maximum and minimum PRs specified by Myers for
the response's assigned weight, and if the responses popu
larity did not exceed 50%.
Where responses were under-weighted, I calculated the
sum of the potential under-weighting of the point totals for
that preference. Likewise, where responses were over
weighted, I calculated the sum of the potential over
weighting of the point totals for that preference. For each
preference, I calculated a total potential over-weighting
and a total potential under-weighting. The results of these
calculations appear in Tables 37-40 for the EI, SN, TF, and
JP scales, respectively.
These tables require some detailed explanation. In
Table 37 the calculations for the E and the I responses for
the age groups are displayed by rows. The separate sums are
arranged in blocks of three columns for female, male, and
combined sexes, respectively. The first two blocks refer
only to responses weighted for
second two blocks refer only to
extraversion, while
responses weighted
the
for
102
introversion. The first block displays the sums obtained by
adding, for all responses with an extraverted weight, the
point deviations obtained by comparing the published scoring
weights (Myers, 1977) to the weights prescribed by the
current prediction ratios calculated from the sample of MBTI
records used in this study. The point sums in the first
block are from responses that are under-weighted according
the current prediction ratios. The point sums in the second
block are from responses that are over-weighted according to
current prediction ratios. The third and fourth blocks are
from introverted responses that are under-weighted or over
weighted, respectively. The sums are for points rather than
counts of items because the two-point range of the possible
weights permits a two-point weight to fall to zero, or a
zero weight to rise
would underestimate
to two points.
the potential
Counts of responses
effects of the point
deviations on the resulting preference scores. In each row,
data for the age group are presented in the order of
females, males, and total sample to facilitate comparisons
of gender differences.
For example, the last row of Table 37 shows the point
sums calculated for all ages combined and the last column of
each block shows the point sums for both sexes combined.
The point deviation sums for all ages and gender combined
are the sums that most directly relate to the published
scoring weights because the published keys for the EI scale
103
do not distinguish between gender or age. Three extraverted
responses were found to be under-weighted by one point each,
nine extraverted responses were found to be over-weighted by
one point each, six introverted responses were found to be
under-weighted by one point each, and four introverted
responses were found to be over-weighted by one point each,
while another introverted response was found to be over
weighted by two points. The corresponding sums, then, are
3, 9, 6 , and 5.
No simple method is available to determine the actual
effects on the resulting preference scores that a particular
set of deviations from the published weights potentially
may have. For some items, one response may be correctly
weighted and its alternative response is under- or over
weighted. In that instance the deviation would affect only
the scores for respondents who selected the under-weighted
response. Some patterns of responses to the scale items
could result in none of the improprely weighted responses
being selected. other patterns might neatly balance the
selection of under-weighted and over-weighted responses to
produce no net effect. Finally, some patterns might, as
though perversely guided, select responses improperly
weighted in one direction only, thereby maximizing the
distortion of the resulting preference score in that
direction.
104
We can only examine relative size of the sums at the
different age levels to speculate on the likely direction of
the general effect. In so speculating, it is necessary to
realize that selecting under-weighted responses for one
preference produces the same net effect on the preference
scores as does selecting over-weighted responses for the
opposite preference (see page 28 above for a description of
the MBTI scoring procedures). Specifically, under-weighted
extraverted responses and over-weighted introverted
responses combine to underestimate the extraverted
respondent's consistency of the preference for extraversion,
or over-estimate the consistency of the introvert's
preference for introversion. Further, the effects of the
point differences on the preferences is doubled due to the
tie-breaking formula that doubles the difference between
the point totals to calculate the preference score (see page
29) •
Therefore, examining the sums from the EI scale
example above for all ages and both sexes combined, we find
extraversion under-weighted by 3 points, introversion over
weighted by 5 points, extraversion over-weighted by 9
points, and introversion under-weighted by 6 points. The
combined effects moving preference scores toward
introversion and away from extraversion are larger than the
opposi te effects (9 and 6 versus 3 and 5). Al though the
extent of the effect will vary with the actual pattern of
105
responses selected by any given respondent, the general
effect in this instance is for the preference for
introversion to be underestimated, or the preference for
extraversion to be overestimated.
This finding has two consequences. First, if the MBTI
records were to be rescored with the weights prescribed by
the present analysis, there would be a tendency for all
respondents to obtain scores indicating more introversion.
Second, some respondents with low scores would be re
classified from extraverts to introverts. The scores from
these cases have been included in analyses of age trends for
extraverts (reported above), when, if rescored, they would
have been included in the analyses of trends for introverts.
The finding of improperly weighted responses based on
the total sample was not expected in this study. Never-
theless, based on the type of analysis just presented for
the EI scale, Table 38 shows that a small overall effect is
also found for overestimating intuition and underestimating
sensing (3 and 3 versus 2 and 1). The TF scale is weighted
separately for males and females, thus the effects must be
considered separately. In Table 39, no effect occurs for
males, but for females a strong effect is found to result in
overestimation of feeling and underestimation of thinking
(3 and 5 versus 0 and 0).
Finally, as shown in Table 40, a strong effect toward
overestimating judgment and underestimating perception is
106
found (1 and 5 versus 6 and 6). Calculating the point
deviation sums for the JP responses is complicated by items
having three or more responses. The sums in parentheses in
Table 40 result from correctly weighted and improperly
weighted responses for the same preference being available
for a particular item. The parenthetical entries are for
sums calculated based on the responses with the least
deviation from the published weights. The effect to over
estimate judgment and underestimate perception is very
similar if those sums are used (0 and 4 versus 6 and 4).
These results raise issues I have not previously
addressed in this investigation. The predictive value and/or
the popularity of the item responses scored for
psychological type has changed markedly from the analyses
Myers (1975) conducted for the El, SN, and JP scales in
preparation for the publication of the MBTl Form F in 1962;
for females these parameters have changed from Myers (1977)
analysis of the TF scale. Myers (1977) argued that the
revision was necessary for the TF scale because of
generation differences in the social desirability of the
thinking and feeling responses respective to the changing
social roles of men and women. The results of this study
indicate that the changes extend beyond the thinking and
feeling responses and that each of the scales need revised
item weights.
107
However, the possibility of a shift in response
weights for all respondents does not account for the
associations of the preference scores with age in a cross
sectional sample. All of these data were collected during
the same period, 1978 to 1984. The purpose of these
analyses was to determine if
equally appropriate for all
the
the
response weights are
age groups sampled.
Therefore, differences of overestimation or underestimation
of a preference score at different ages is the particular
interest of this study.
Examining the sums of the point deviations for
different age groups discloses that the deviations are not
not constant across the age groups. A tendency for increase
appears in some columns, and for decrease in others. For
some preferences, the pattern appears curvilinear.
There is no precise way to determine the effects which
the age differences of the sums of the point deviations
have on the trends of association reported earlier, without
actually rescoring the CAPT data bank and replicating the
analyses reported above. However, the trends may be
expected to be altered if the records would be scored by
revised weights.
The tables just presented are useful in speculating
about the effects of improper weighting of the item
responses, but do not provide statistically reliable tests
of the associations of the selection of particular item
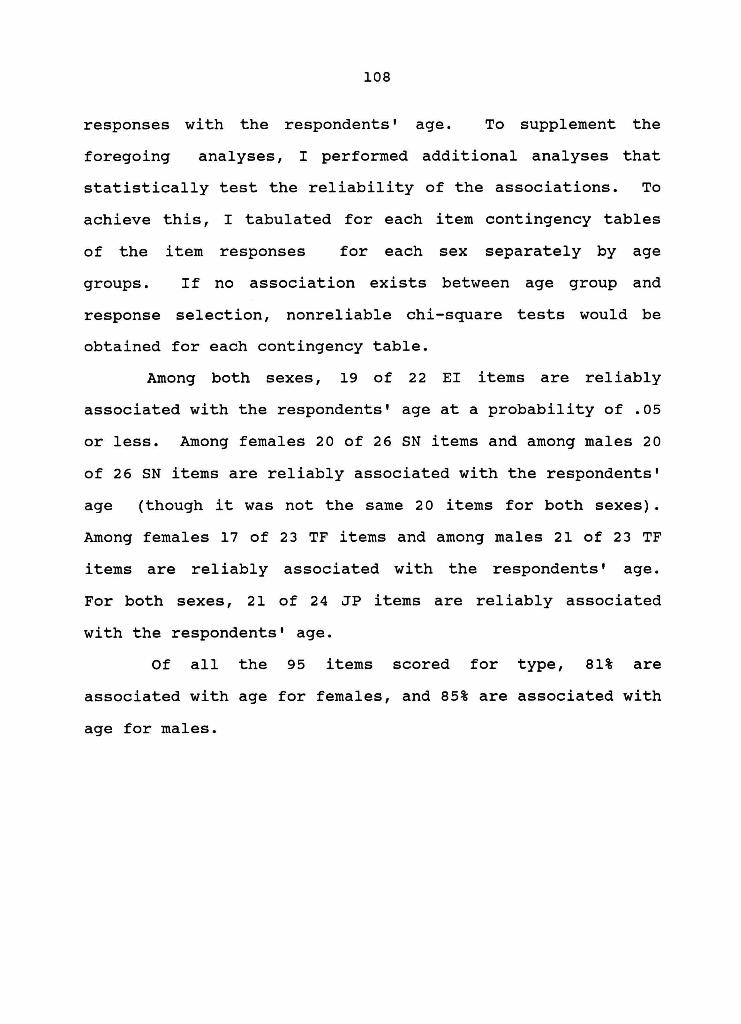
108
responses with the respondents' age. To supplement the
foregoing analyses, I performed additional analyses that
statistically test the reliability of the associations. To
achieve this, I tabulated for each item contingency tables
of the item responses for each sex separately by age
groups. If no association exists between age group and
response selection, nonreliable chi-square tests would be
obtained for each contingency table.
Among both sexes, 19 of 22 EI items are reliably
associated with the respondents' age at a probability of .05
or less. Among females 20 of 26 SN items and among males 20
of 26 SN items are reliably associated with the respondents'
age (though it was not the same 20 items for both sexes).
Among females 17 of 23 TF items and among males 21 of 23 TF
items are reliably associated with the respondents' age.
For both sexes, 21 of 24 JP items are reliably associated
with the respondents' age.
Of all the 95 items scored for type, 81% are
associated with age for females, and 85% are associated with
age for males.
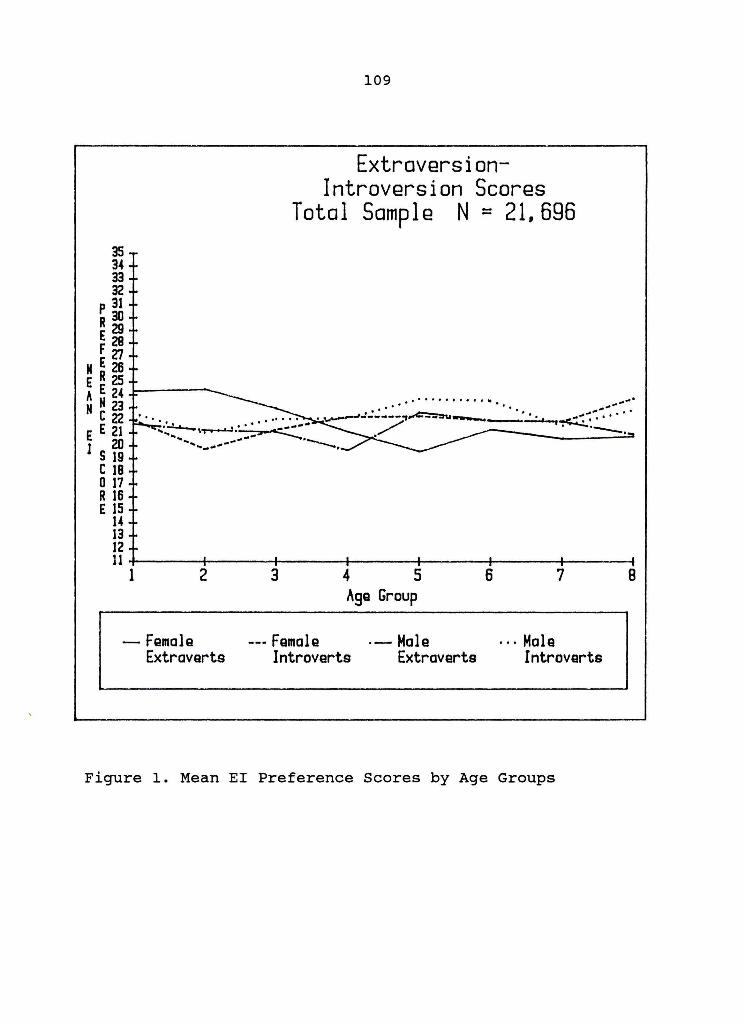
35 3-4 33 32
P 31 R30 E29 F~
109
ExtraversionIntroversion Scores
Total Sample N = 21,696
M E 26 E R 25 A E 2-4 1----__
N N 23 ............... -- .. '
C22 E E 21
I S ~ C 18 o 17 R 16 E 15
1-4 13
...... ..... ... ........... . . . ~-•• / .. - • .,...c=:n. ___ ~..L-:-: • •• ' ••• ....t...&.-.. • ••••• , • '_If .. _ ------. .---... ........ \,...,...........~. . .--......... ~ ... ~ .. -~ ..... ~- .~,
12 1l+-----~----~~----4------+------~----~-----4
1 2 3 4 5 6 7 B Age Group
- Female ... Female .- Male ... Male Extraverts Introverts Extraverts Introverts
Figure 1. Mean EI Preference Scores by Age Groups
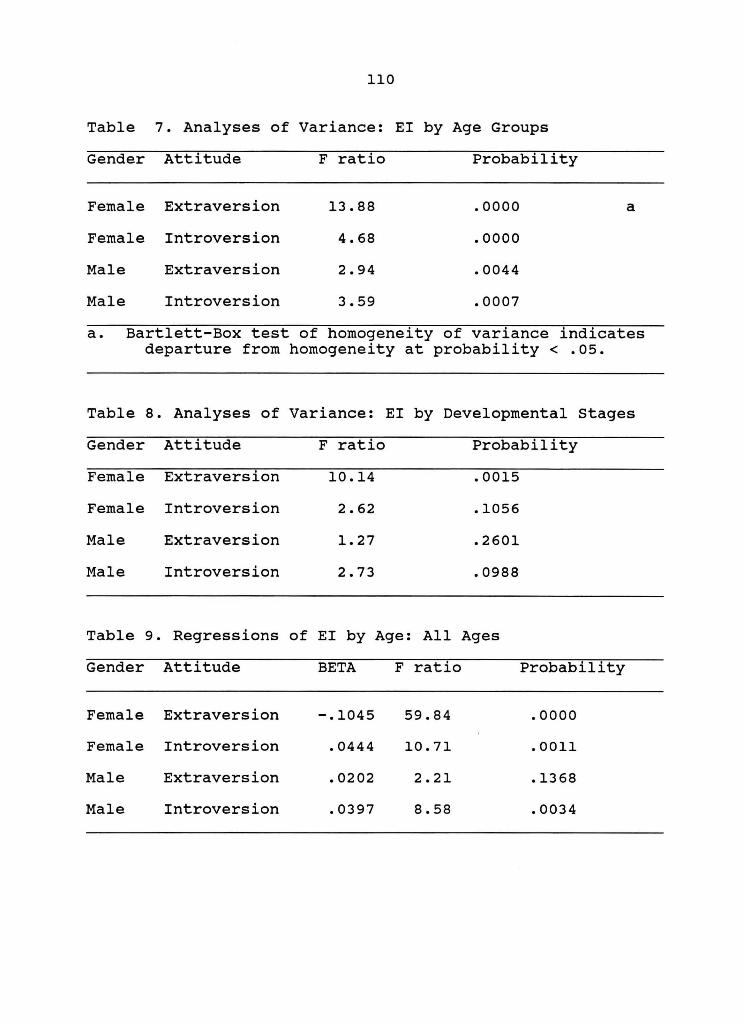
110
Table 7. Analyses of Variance: EI by Age Groups
Gender Attitude F ratio Probability
Female Extraversion 13.88 .0000 a
Female Introversion 4.68 .0000
Male Extraversion 2.94 .0044
Male Introversion 3.59 .0007
a. Bartlett-Box test of homogeneity of variance indicates departure from homogeneity at probability < .05.
Table 8. Analyses of Variance: EI by Developmental stages
Gender Attitude F ratio Probability
Female Extraversion 10.14 .0015
Female Introversion 2.62 .1056
Male Extraversion 1. 27 .2601
Male Introversion 2.73 .0988
Table 9. Regressions of EI by Age: All Ages
Gender Attitude BETA F ratio Probability
Female Extraversion -.1045 59.84 .0000
Female Introversion .0444 10.71 .0011
Male Extraversion .0202 2.21 .1368
Male Introversion .0397 8.58 .0034
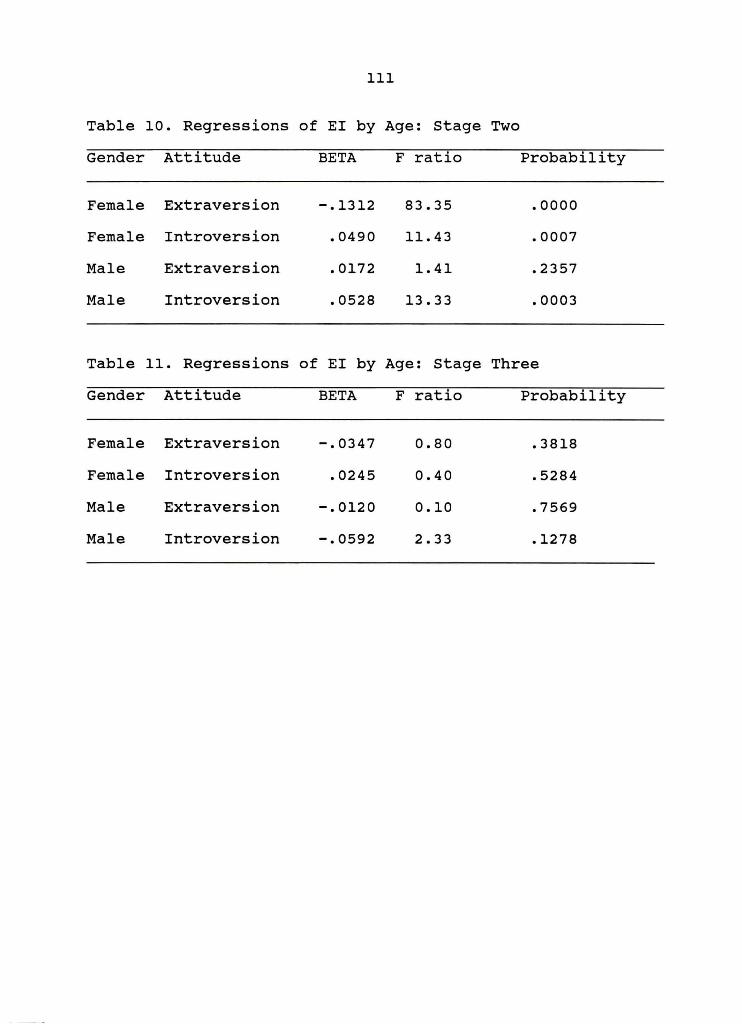
III
Table 10. Regressions of EI by Age: stage Two
Gender Attitude BETA F ratio Probability
Female Extraversion -.1312 83.35 .0000
Female Introversion .0490 11.43 .0007
Male Extraversion .0172 1.41 .2357
Male Introversion .0528 13.33 .0003
Table 11. Regressions of EI by Age: stage Three
Gender Attitude BETA F ratio Probability
Female Extraversion -.0347 0.80 .3818
Female Introversion .0245 0.40 .5284
Male Extraversion -.0120 0.10 .7569
Male Introversion -.0592 2.33 .1278
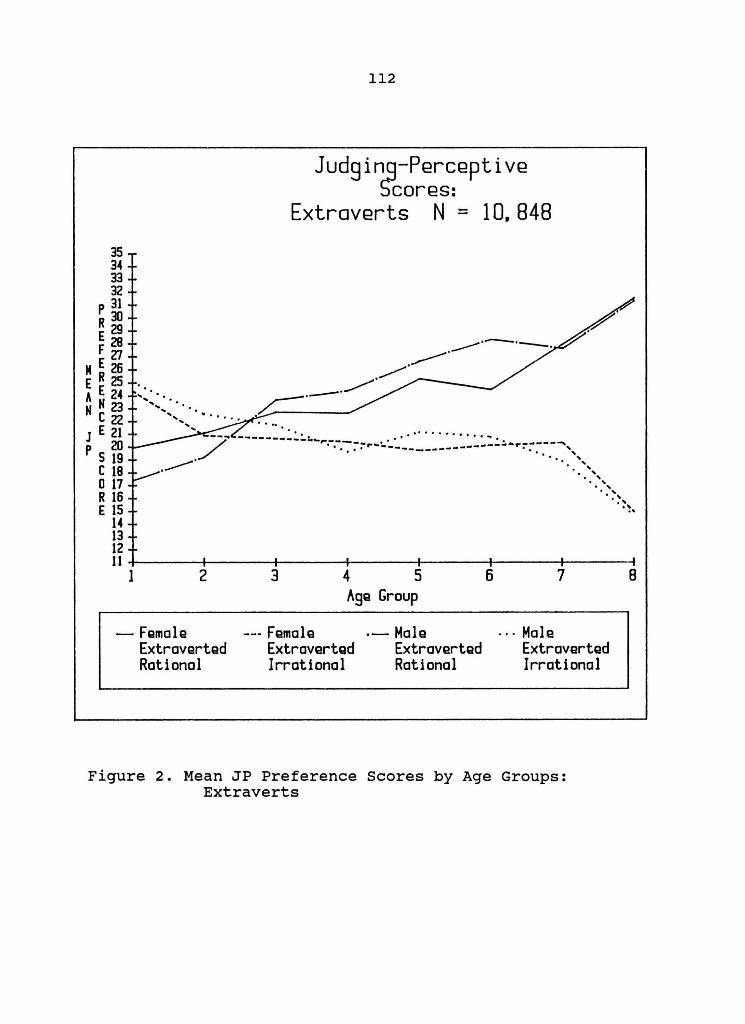
35 34 33 32
P 31 R30 E29 F~
M E 26 E R 2S " E 24 N N 23
C22 J E 21
P 5 ~ C 18 o 17 R 16 E 15
14 13
112
Judging-Perceptive S-cores:
Extraverts N = 10,848
". . ... . . ..... . . / ---. - ... _------_:._,.,-----,. .... ". ~:.::. .... -----""""'"
" . . . . -------------- .. , . " -----. . ". " . ' .. " . , . , . , .... '. ~, ., ..
12 11+------4------~------r------+------~----_4~----~
I 2
- Female Extraverted Rational
3 4 5 Age Group
--- Female Extraverted Irrational
.- Male Extraverted Rational
6 7
... Male Extraverted Irrational
Figure 2. Mean JP Preference Scores by Age Groups: Extraverts
B
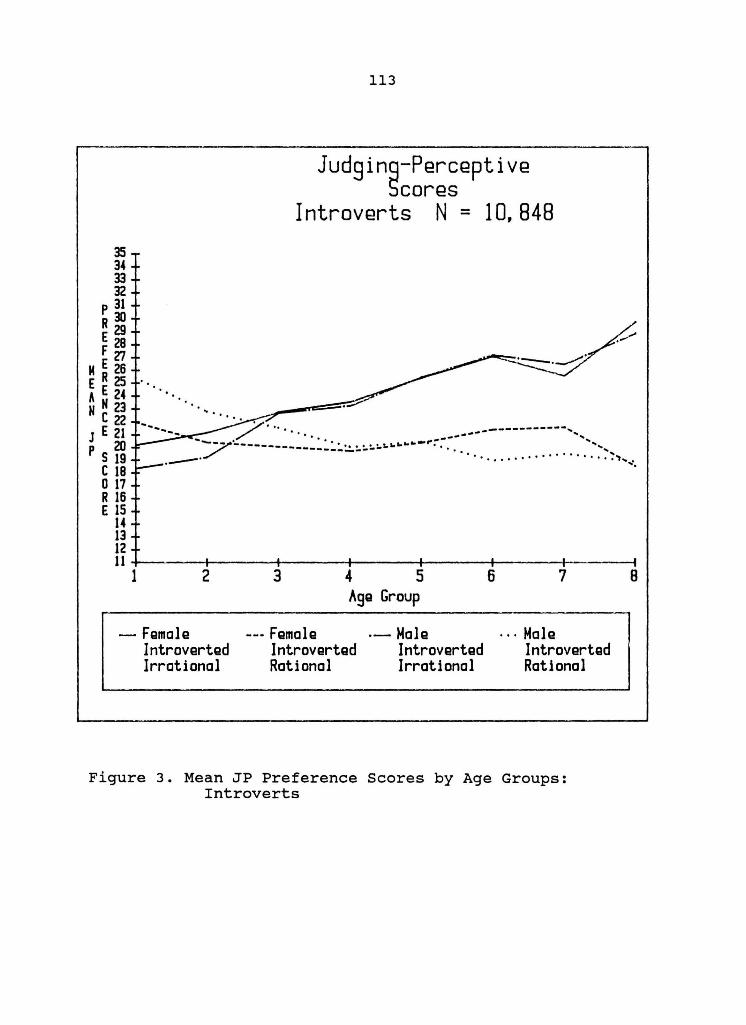
3S 34 33 32
P 31 R30 E~ F"
M E 26 E R 25 A E 24 N N 23
C22 J E 21
P S ~ C 18 o 17 R 16 E 15
14 13
113
Judging-Perceptive Scores
Introverts N = 10,848
.. to .... '_ :7' " . . . . . . . . .._,..------------------...... 7 - --------- .. -..... .. :,..:....... .. .. ...., ..... ----------- ...... . --. . ........ .......... .. ":'., ... ....
12 11+------+------+------+------+------+------+-----~
1 2
- Female Introverted Irrational
3 4 5 AgQ Group
--. Female Introverted Rational
.- Male Introverted Irrational
6 7
... Male Introverted Rational
Figure 3. Mean JP Preference Scores by Age Groups: Introverts
8
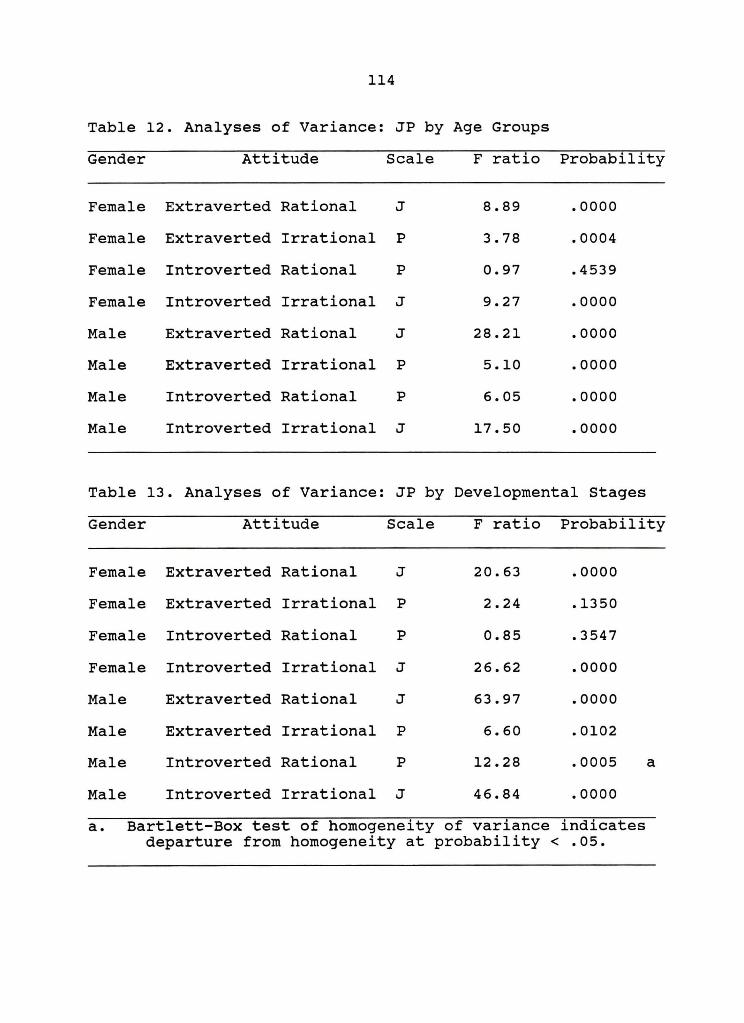
114
Table 12. Analyses of Variance: JP by Age Groups
Gender Attitude Scale F ratio Probability
Female Extraverted Rational J 8.89 .0000
Female Extraverted Irrational P 3.78 .0004
Female Introverted Rational P 0.97 .4539
Female Introverted Irrational J 9.27 .0000
Male Extraverted Rational J 28.21 .0000
Male Extraverted Irrational P 5.10 .0000
Male Introverted Rational P 6.05 .0000
Male Introverted Irrational J 17.50 .0000
Table 13. Analyses of Variance: JP by Developmental Stages
Gender Attitude Scale F ratio Probability
Female Extraverted Rational J 20.63 .0000
Female Extraverted Irrational P 2.24 .1350
Female Introverted Rational P 0.85 .3547
Female Introverted Irrational J 26.62 .0000
Male Extraverted Rational J 63.97 .0000
Male Extraverted Irrational P 6.60 .0102
Male Introverted Rational P 12.28 .0005 a
Male Introverted Irrational J 46.84 .0000
a. Bartlett-Box test of homogeneity of variance indicates departure from homogeneity at probability < .05.
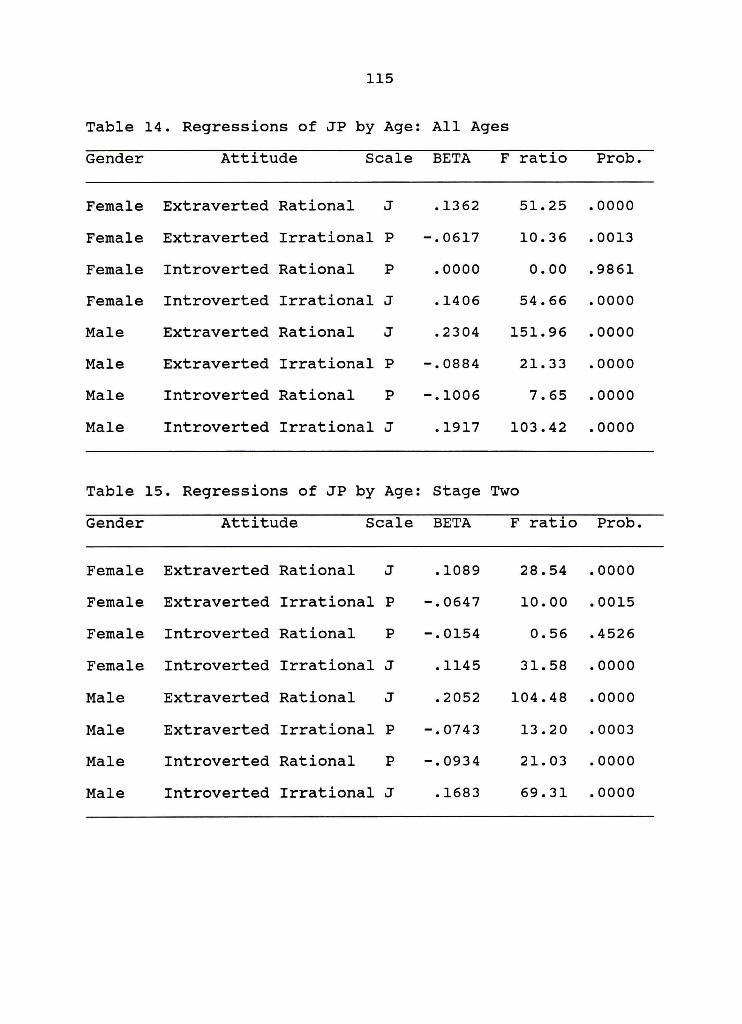
115
Table 14. Regressions of JP by Age: All Ages
Gender Attitude Scale BETA F ratio Prob.
Female Extraverted Rational J .1362 51. 25 .0000
Female Extraverted Irrational P -.0617 10.36 .0013
Female Introverted Rational P .0000 0.00 .9861
Female Introverted Irrational J .1406 54.66 .0000
Male Extraverted Rational J .2304 151. 96 .0000
Male Extraverted Irrational P -.0884 21. 33 .0000
Male Introverted Rational P -.1006 7.65 .0000
Male Introverted Irrational J .1917 103.42 .0000
Table 15. Regressions of JP by Age: Stage Two
Gender Attitude Scale BETA F ratio Prob.
Female Extraverted Rational J .1089 28.54 .0000
Female Extraverted Irrational P -.0647 10.00 .0015
Female Introverted Rational P -.0154 0.56 .4526
Female Introverted Irrational J .1145 31. 58 .0000
Male Extraverted Rational J .2052 104.48 .0000
Male Extraverted Irrational P -.0743 13.20 .0003
Male Introverted Rational P -.0934 21. 03 .0000
Male Introverted Irrational J .1683 69.31 .0000
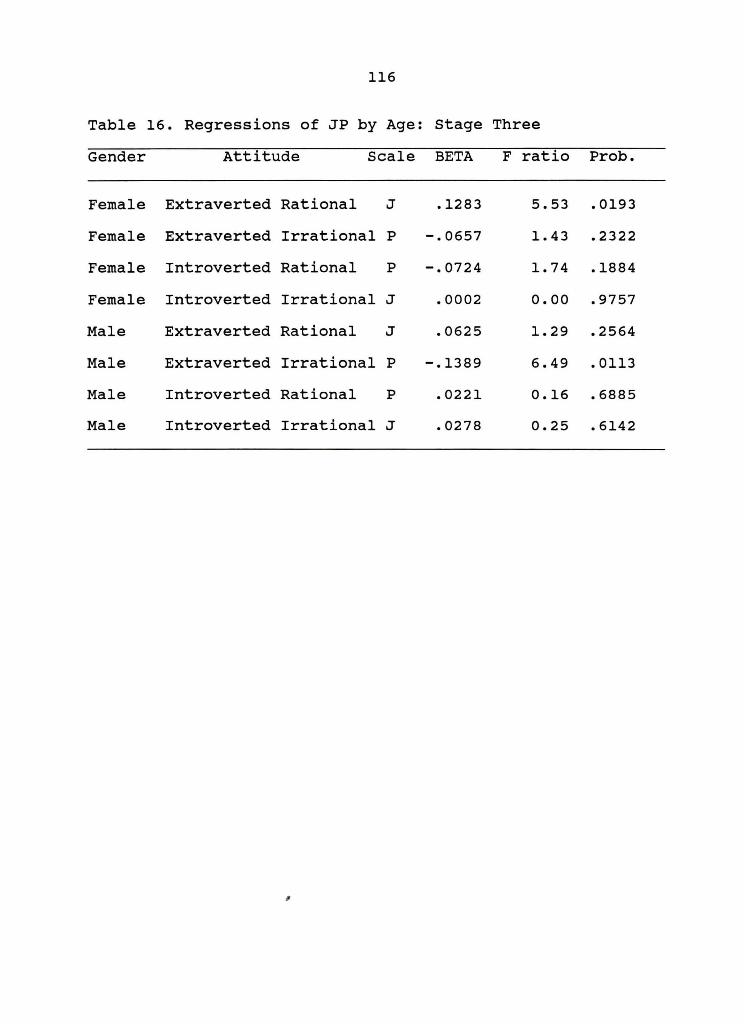
116
Table 16. Regressions of JP by Age: stage Three
Gender Attitude Scale BETA F ratio Prob.
Female Extraverted Rational J .1283 5.53 .0193
Female Extraverted Irrational P -.0657 1. 43 .2322
Female Introverted Rational P -.0724 1. 74 .1884
Female Introverted Irrational J .0002 0.00 .9757
Male Extraverted Rational J .0625 1. 29 .2564
Male Extraverted Irrational P -.1389 6.49 .0113
Male Introverted Rational P .0221 0.16 .6885
Male Introverted Irrational J .0278 0.25 .6142
,
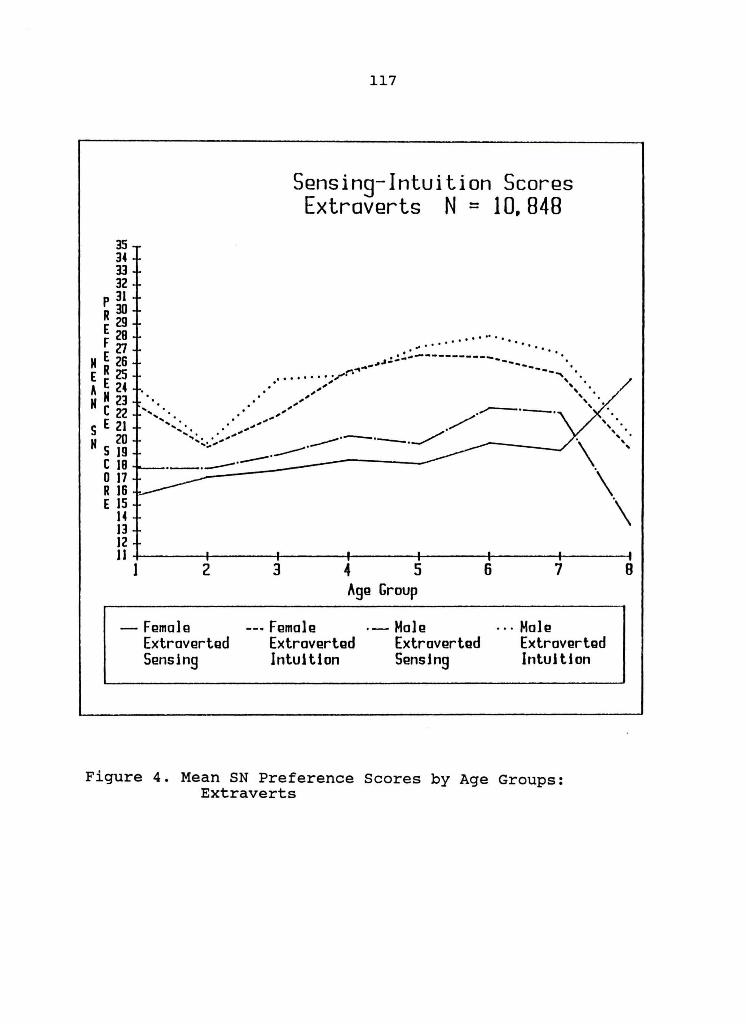
3S 34 n 32
p 31 R30 E29 F~
M E 26 E R 2S A E 24 N N 23
[22 S E 21
N S ~ C 18 017 R 16 E 15
14 13
117
Sensing-Intuition Scores Extraverts N = 10,848
.. ...... ............ . ' '" .. ~~;- .. ------------....... f"l-t--- ----_ '. ........ ;/ . " '. . , " .
", " ' . ", " '. ....... ' . ", /.,.,--,--.
"'~ '.,.. ~ ......... .' ."", /' ........ :..:. .... " ~.--.----.--" --.---. . _.--. -------
12 11+------4------4------4~----~------r_----_r----~
1 2
- Female Extraverted Sensing
3 4 5 Age Group
--. Female Extraverted Intuition
.- Male Extravertod Sensing
6 7
. .. Male Extraverted Intuition
Figure 4. Mean SN Preference Scores by Age Groups: Extraverts
B
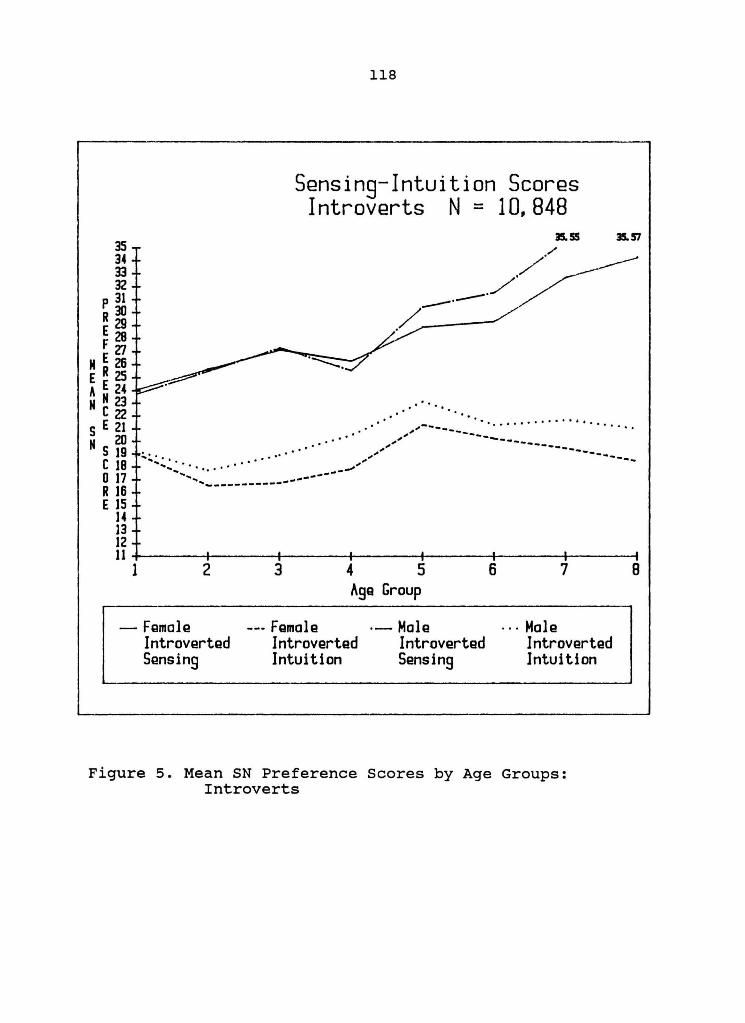
118
SQnsing-Intuition ScorQS IntrovQrts N = 10,848
35.55 35.57 3S 34 33 32
P 31 R30 E29 F~
M E 26 E R 2S A E 24 N N 23
C22 S E 21
N S ~ C 18 o 17 R 16 E 15
14 13
..... ' ..
- • I •••••••• ••• .. • ........ ..
",,,, -.. _---- ..... -.... " ...
.. .. .. . .. .. ,,,,,' ----------.. .. .' .. , ... ' ---------',~.... ...... ,
............... ~ .. I. .. .. .. .._---'
' .... _---------------
12 11+------+------+------+------+------+------+-----~
1 2
- Female Introverted Sansing
3 4 5 Age Group
--- Female Introverted Intuition
'- Male Introverted Sensing
6 7
... Male Introverted Intuition
Figure 5. Mean SN Preference Scores by Age Groups: Introverts
B
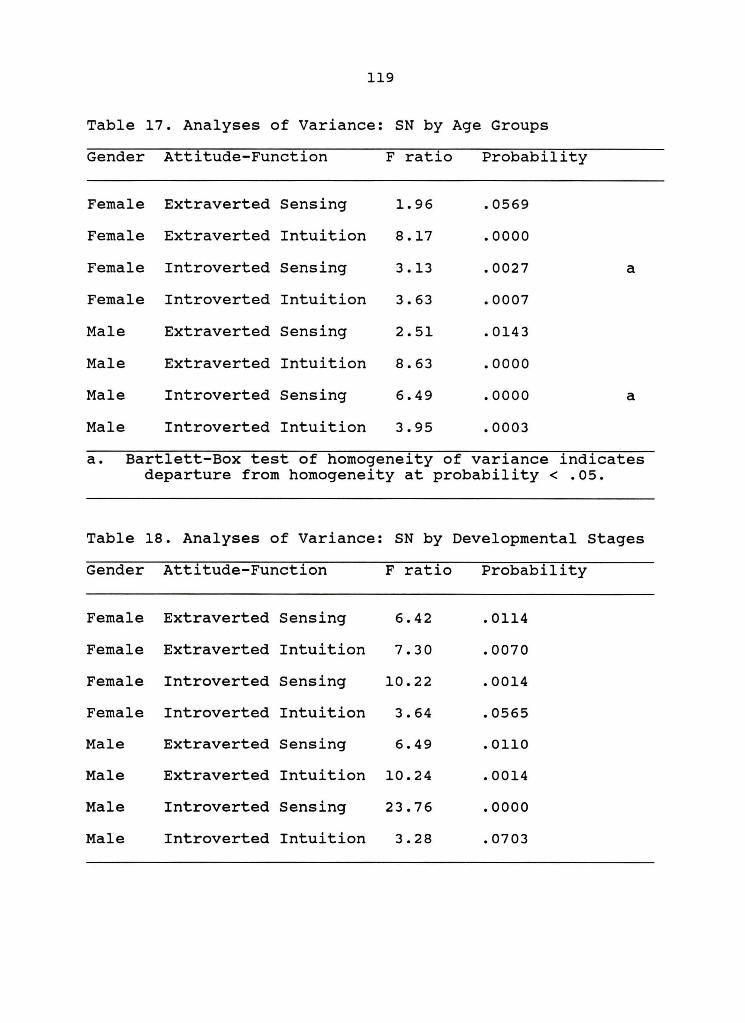
119
Table 17. Analyses of Variance: SN by Age Groups
Gender Attitude-Function F ratio Probability
Female Extraverted Sensing 1. 96 .0569
Female Extraverted Intuition 8.17 .0000
Female Introverted Sensing 3.13 .0027 a
Female Introverted Intuition 3.63 .0007
Male Extraverted Sensing 2.51 .0143
Male Extraverted Intuition 8.63 .0000
Male Introverted Sensing 6.49 .0000 a
Male Introverted Intuition 3.95 .0003
a. Bartlett-Box test of homogeneity of variance indicates departure from homogeneity at probability < .05.
Table 18. Analyses of Variance: SN by Developmental Stages
Gender Attitude-Function F ratio Probability
Female Extraverted Sensing 6.42 .0114
Female Extraverted Intuition 7.30 .0070
Female Introverted Sensing 10.22 .0014
Female Introverted Intuition 3.64 .0565
Male Extraverted Sensing 6.49 .0110
Male Extraverted Intuition 10.24 .0014
Male Introverted Sensing 23.76 .0000
Male Introverted Intuition 3.28 .0703
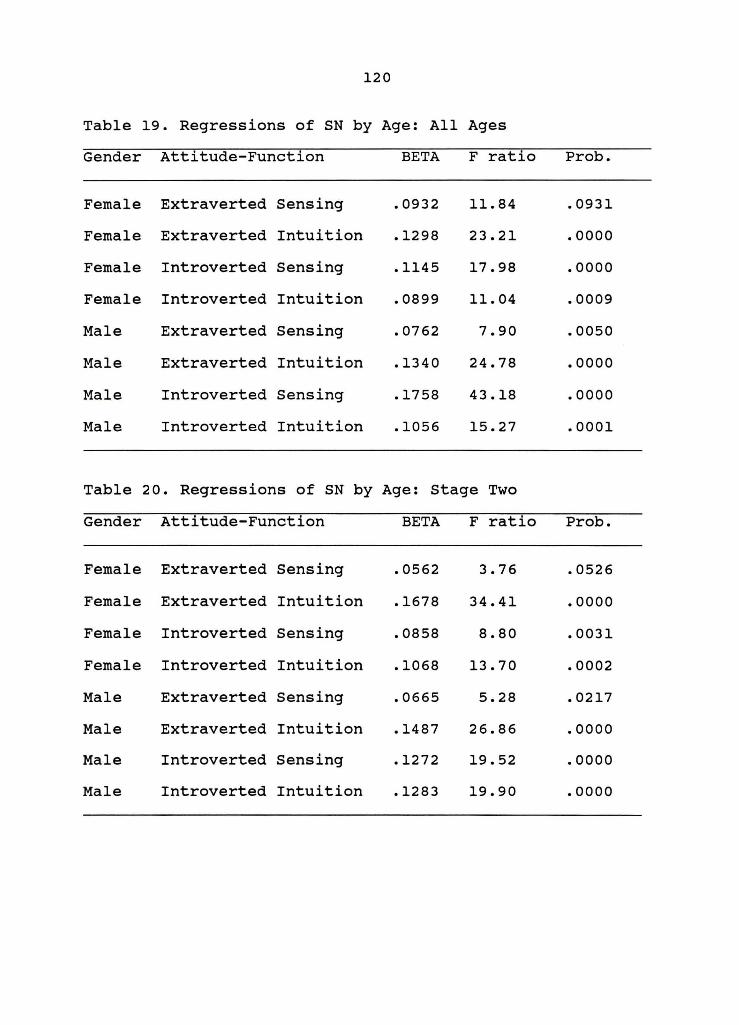
120
Table 19. Regressions of SN by Age: All Ages
Gender Attitude-Function BETA F ratio Prob.
Female Extraverted Sensing .0932 11.84 .0931
Female Extraverted Intuition .1298 23.21 .0000
Female Introverted Sensing .1145 17.98 .0000
Female Introverted Intuition .0899 11.04 .0009
Male Extraverted Sensing .0762 7.90 .0050
Male Extraverted Intuition .1340 24.78 .0000
Male Introverted Sensing .1758 43.18 .0000
Male Introverted Intuition .1056 15.27 .0001
Table 20. Regressions of SN by Age: Stage Two
Gender Attitude-Function BETA F ratio Prob.
Female Extraverted Sensing .0562 3.76 .0526
Female Extraverted Intuition .1678 34.41 .0000
Female Introverted Sensing .0858 8.80 .0031
Female Introverted Intuition .1068 13.70 .0002
Male Extraverted Sensing .0665 5.28 .0217
Male Extraverted Intuition .1487 26.86 .0000
Male Introverted Sensing .1272 19.52 .0000
Male Introverted Intuition .1283 19.90 .0000
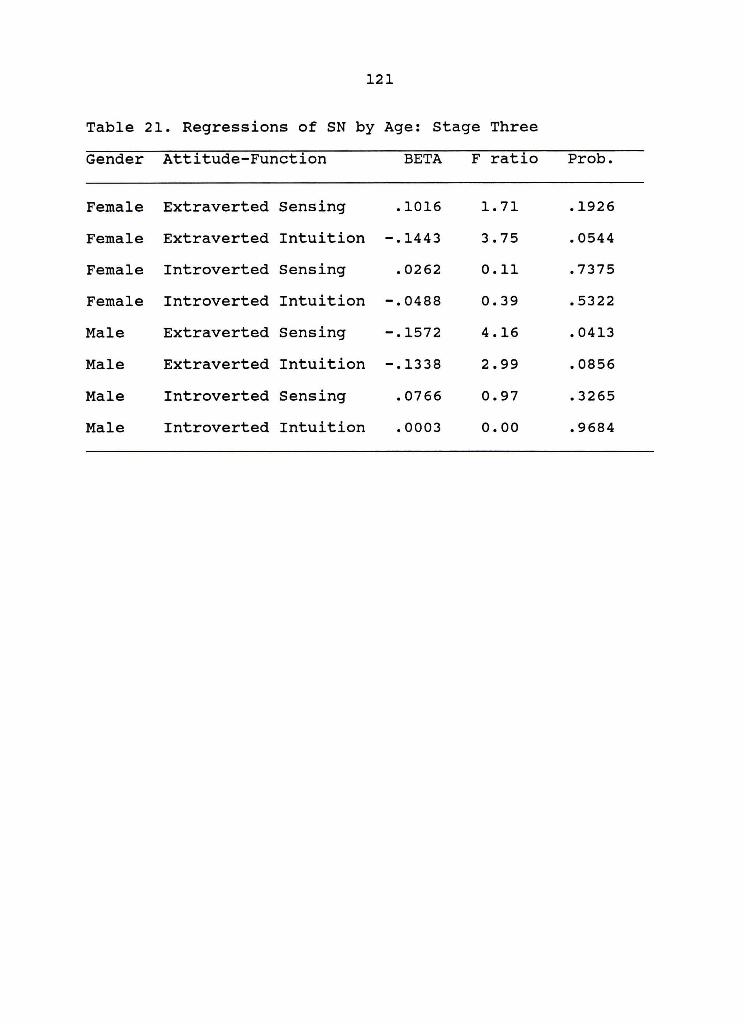
121
Table 21. Regressions of SN by Age: stage Three
Gender Attitude-Function BETA F ratio Probe
Female Extraverted Sensing .1016 1. 71 .1926
Female Extraverted Intuition -.1443 3.75 .0544
Female Introverted Sensing .0262 0.11 .7375
Female Introverted Intuition -.0488 0.39 .5322
Male Extraverted Sensing -.1572 4.16 .0413
Male Extraverted Intuition -.1338 2.99 .0856
Male Introverted Sensing .0766 0.97 .3265
Male Introverted Intuition .0003 0.00 .9684
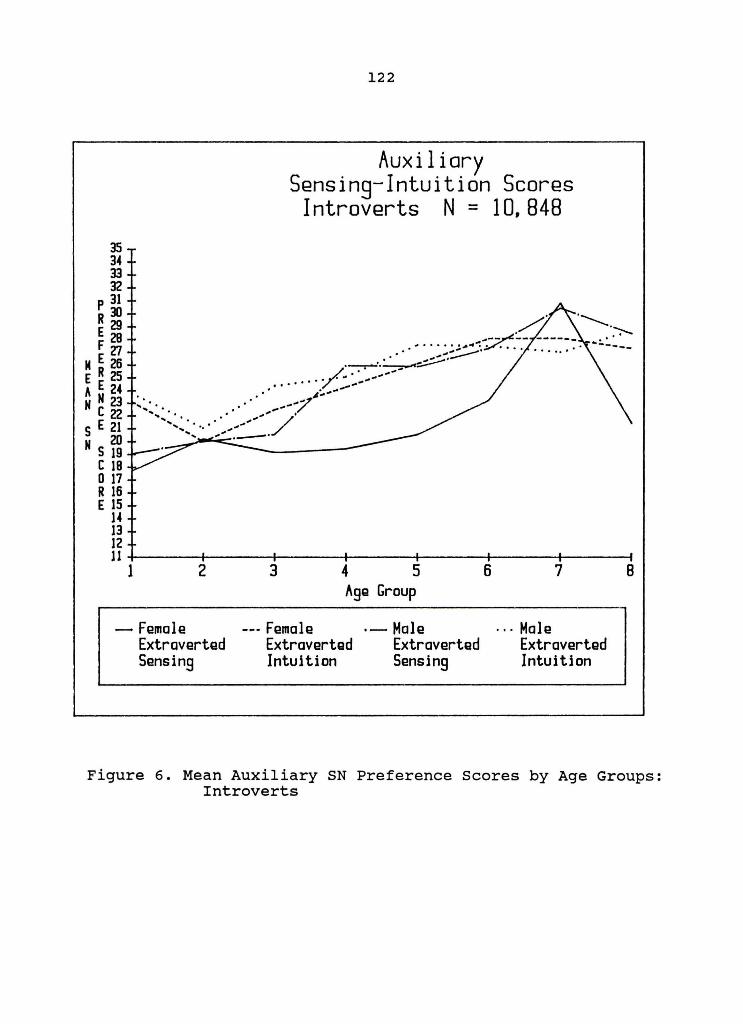
35 34 33 32
P 31 R30 [29
F~ M E 26 E R 25 It E 24 N N 23
C22 S E 21
N S ~ C 18 o 17 R 16 E 15
14 13
122
Auxiliary Sensing-Intuition Scores
Introverts N = 10,848
. . -....... ./; .';--..
~~--~-- ------ _ .. ' .* ...... . ..:..:.~ •• v...... ..... ....... -----.. , .. ~
'--'-'.~~' .. " ..... / ., ~ ...
...... . ..' . . .... ~:. .. ~-~ ..... .... "-' ... .. .., ..
.......... : ........... .,'/. ....... ..... .. .. '
........... ---'
12 J1+-----_+------+-----_+------~----_+------~----~
1 2
- Fgmalg Extravgrtgd Sensing
3 4 5 "gg Group
--- Female Extravertgd Intuition
.- Male Extravertgd Sensing
6 7
... Malg Extravgrtgd Intuition
8
Figure 6. Mean Auxiliary SN Preference Scores by Age Groups: Introverts
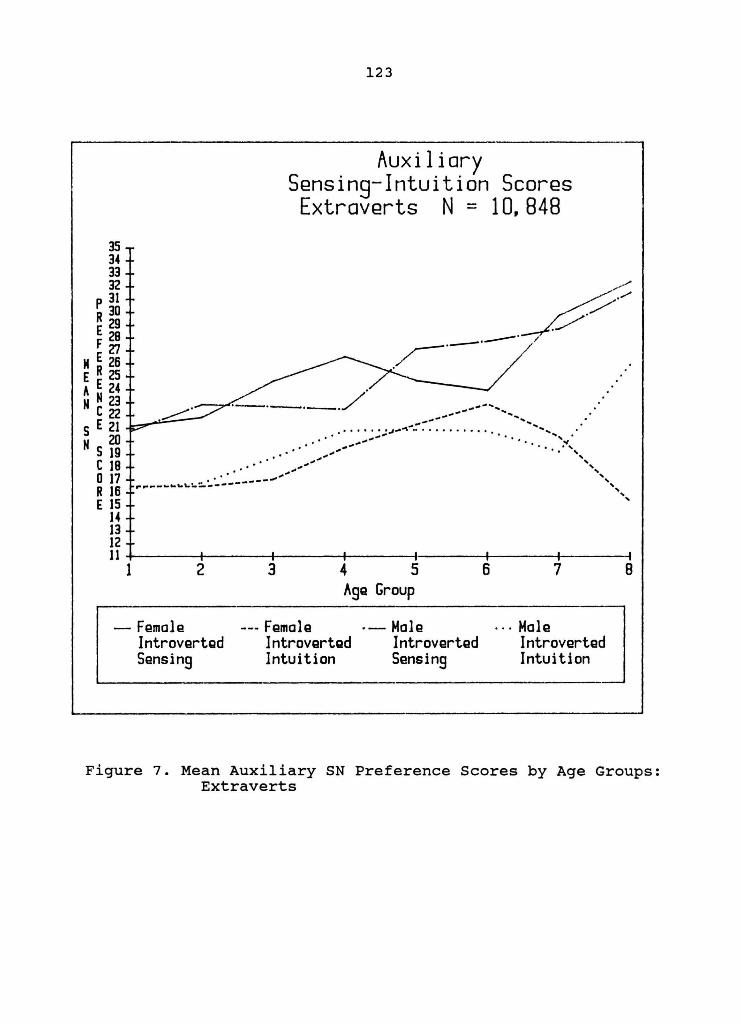
35 3-4 33 32
P 31 R 30 E29 F~
123
Auxiliary Sensing-Intuition Scores Extraverts N = 10,848
/--:::.
/' ."..
.~.-.--. /
M E 26 E R 2S A E 2-4 N N 23 e22 ~. .. ...................... ...
E L--- .. .,._........ ...., ...... 5 21 .' .. ........... - . . . . . . . . . . . .. .. N 5 20
19 _#""........ . ' . . ... ~':<
,,;- . " C 18 .. ".... " o 17 . . ...... "
,. .. --...... ~~::.:.~ .. ------.." '" R 16 , E 15 '
1-4 13 12 11+------;------~------r------;-------+1------41------~1 123 4 5 6 7 B
- Famala Introvartad Sansing
Aga Group
... Famala Introvartad Intuition
.- Mala Introvartad Sansing
... Mala Introvartad Intuition
Figure 7. Mean Auxiliary SN Preference Scores by Age Groups: Extraverts
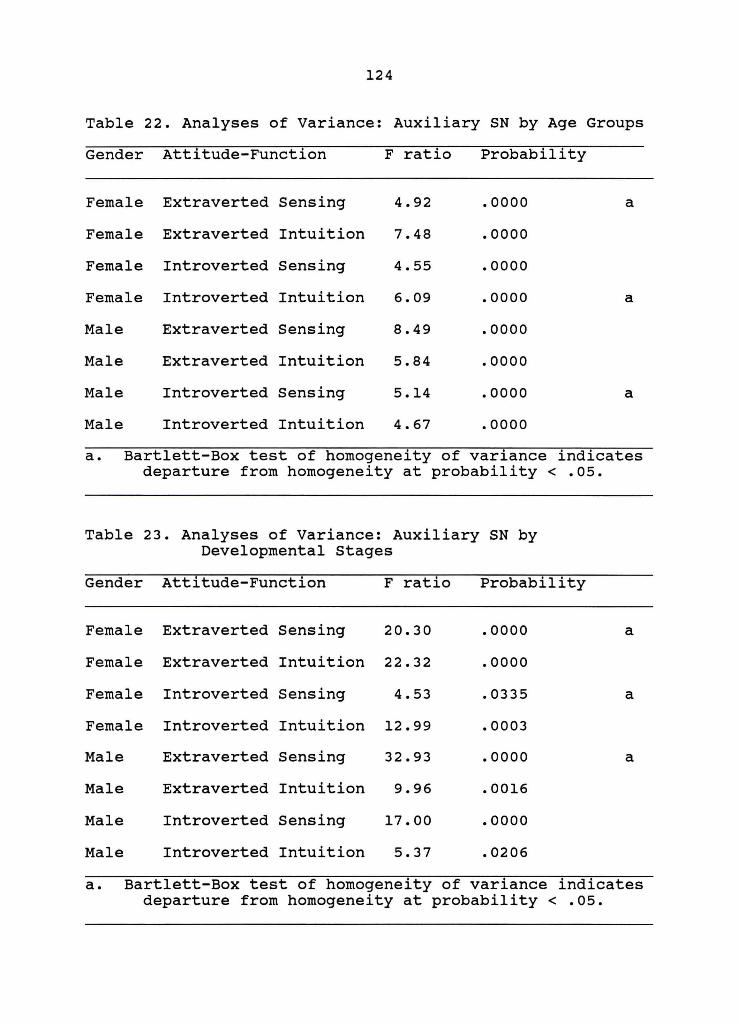
124
Table 22. Analyses of Variance: Auxiliary SN by Age Groups
Gender Attitude-Function F ratio Probability
Female Extraverted Sensing 4.92 .0000 a
Female Extraverted Intuition 7.48 .0000
Female Introverted Sensing 4.55 .0000
Female Introverted Intuition 6.09 .0000 a
Male Extraverted Sensing 8.49 .0000
Male Extraverted Intuition 5.84 .0000
Male Introverted Sensing 5.14 .0000 a
Male Introverted Intuition 4.67 .0000
a. Bartlett-Box test of homogeneity of variance indicates departure from homogeneity at probability < .05.
Table 23. Analyses of Variance: Auxiliary SN by Developmental Stages
Gender Attitude-Function F ratio Probability
Female Extraverted Sensing 20.30 .0000 a
Female Extraverted Intuition 22.32 .0000
Female Introverted Sensing 4.53 .0335 a
Female Introverted Intuition 12.99 .0003
Male Extraverted Sensing 32.93 .0000 a
Male Extraverted Intuition 9.96 .0016
Male Introverted Sensing 17.00 .0000
Male Introverted Intuition 5.37 .0206
a. Bartlett-Box test of homogeneity of variance indicates departure from homogeneity at probability < .05.
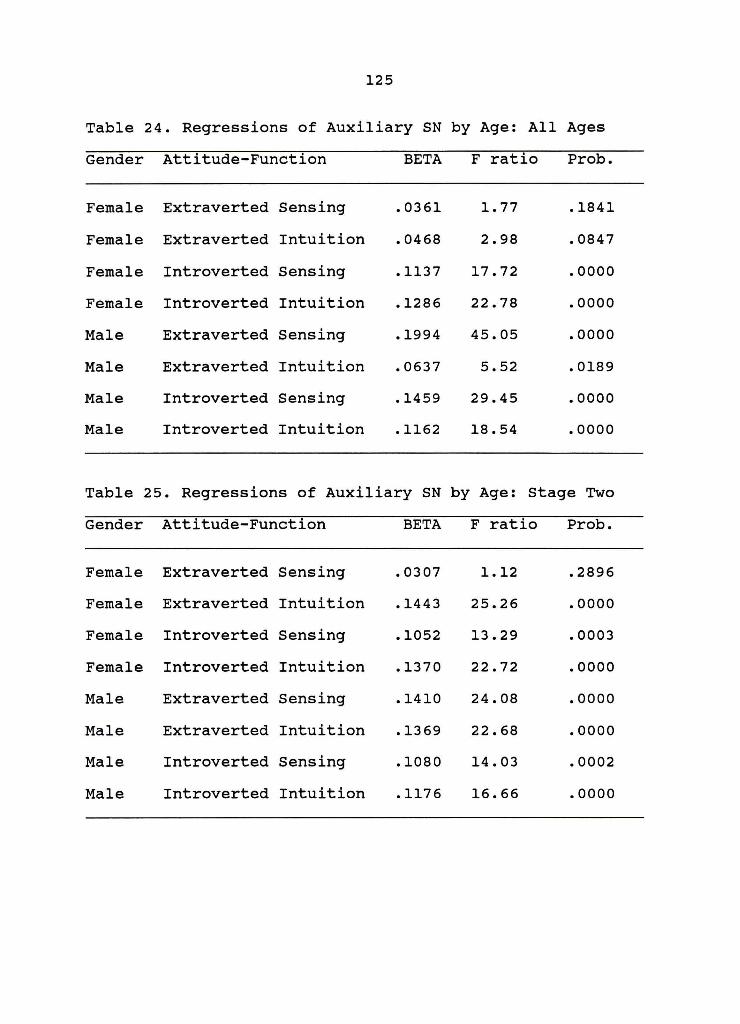
125
Table 24. Regressions of Auxiliary SN by Age: All Ages
Gender Attitude-Function BETA F ratio Prob.
Female Extraverted Sensing .0361 1. 77 .1841
Female Extraverted Intuition .0468 2.98 .0847
Female Introverted Sensing .1137 17.72 .0000
Female Introverted Intuition .1286 22.78 .0000
Male Extraverted Sensing .1994 45.05 .0000
Male Extraverted Intuition .0637 5.52 .0189
Male Introverted Sensing .1459 29.45 .0000
Male Introverted Intuition .1162 18.54 .0000
Table 25. Regressions of Auxiliary SN by Age: Stage Two
Gender Attitude-Function BETA F ratio Prob.
Female Extraverted Sensing .0307 1.12 .2896
Female Extraverted Intuition .1443 25.26 .0000
Female Introverted Sensing .1052 13.29 .0003
Female Introverted Intuition .1370 22.72 .0000
Male Extraverted Sensing .1410 24.08 .0000
Male Extraverted Intuition .1369 22.68 .0000
Male Introverted Sensing .1080 14.03 .0002
Male Introverted Intuition .1176 16.66 .0000

126
Table 26. Regressions of Auxiliary SN by Age: stage Three
Gender Attitude-Function BETA F ratio Probe
Female Extraverted Sensing .0772 0.98 .3231
Female Extraverted Intuition -.0193 0.06 .8048
Female Introverted Sensing .1524 3.90 .0500
Female Introverted Intuition -.2003 6.85 .0097
Male Extraverted Sensing .0688 0.78 .3784
Male Extraverted Intuition .0102 0.01 .8958
Male Introverted sensing .0292 0.14 .7092
Male Introverted Intuition .0681 0.76 .3834
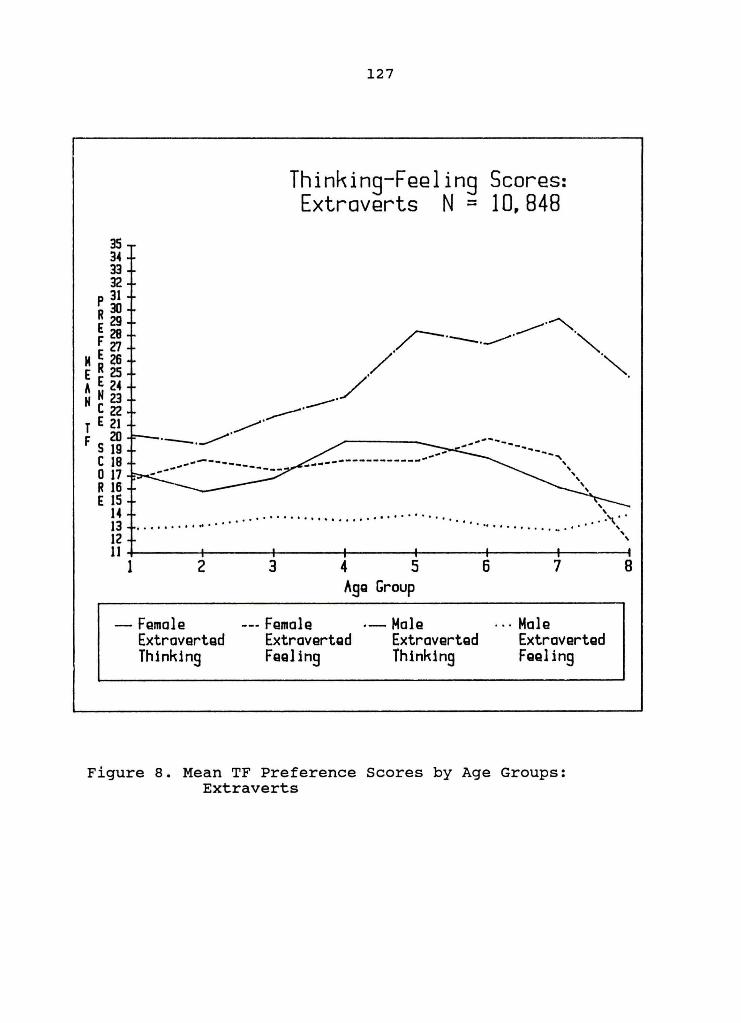
35 34 33 32
P 31 R30 £29 F~
M E 26 E R 2S A E 24 N N 23
(22 T E 21
F S ~ ( 18 o 17 R 16 E 15
14 13
.-.~.
127
Thinking-Feeling Scores: Extraverts N = 10,848
~.---. --' ---.~
.~.--.--. .'" / .'" /. .
... ....... -..... -------,
" " " " " "
f"" " "" •
" " .................................... ., .. f 'f ............... • ' "
" 12 11+------+------+------+------+------+------r-----~
1 2
- Fgmole Extroverted Thinking
3 4 5 Age Group
--- Female Extroverted Feeling
.- Mole Extroverted Thinking
6 7
.. , Mole Extroverted Feel ing
Figure 8. Mean TF Preference Scores by Age Groups: Extraverts
B
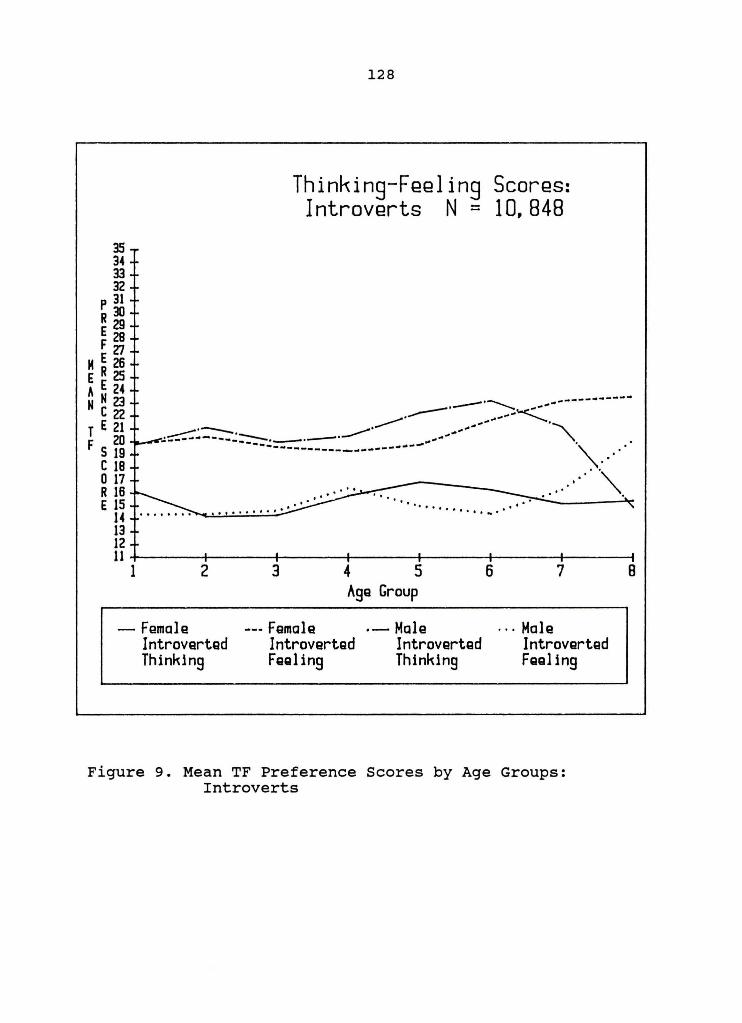
35 34 33 32
P 31 R30 Era F"
M E 26 E R 2S A E 24 N N 23
C22 T E 21 F 20
S 19 C 18 o 17 R 16 E 15
14 13
10. ' .···,·,· '
128
Thinking-Faaling Scores: Introvarts N = 10,848
.. • ••••••• 10 .... .. ••
12 11+------+------~-----+------~----_r------r_----~
1 2
- Female Introvartad Thinking
3 4 5 Aga Group
--- Famala Introvartad FaQling
.- Male Introvertad Thinking
6 7
... Male Introvertad Faal ing
Figure 9. Mean TF Preference Scores by Age Groups: Introverts
8
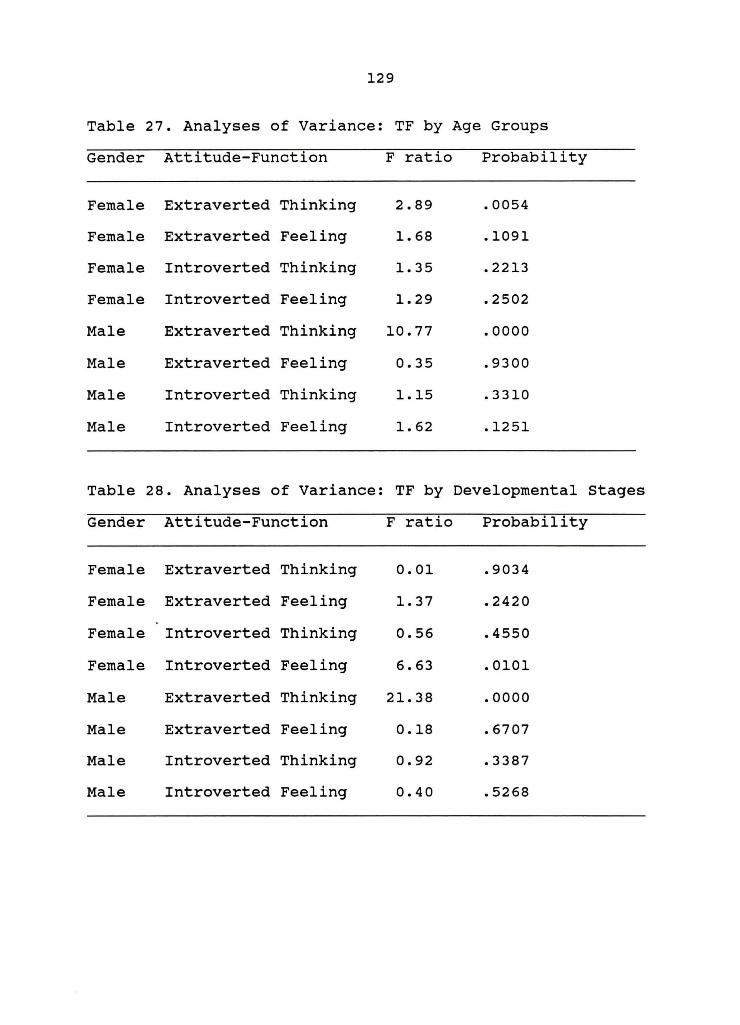
129
Table 27. Analyses of Variance: TF by Age Groups
Gender Attitude-Function F ratio Probability
Female Extraverted Thinking 2.89 .0054
Female Extraverted Feeling 1. 68 .1091
Female Introverted Thinking 1. 35 .2213
Female Introverted Feeling 1.29 .2502
Male Extraverted Thinking 10.77 .0000
Male Extraverted Feeling 0.35 .9300
Male Introverted Thinking 1.15 .3310
Male Introverted Feeling 1. 62 .1251
Table 28. Analyses of Variance: TF by Developmental stages
Gender Attitude-Function F ratio Probability
Female Extraverted Thinking 0.01 .9034
Female Extraverted Feeling 1. 37 .2420
Female Introverted Thinking 0.56 .4550
Female Introverted Feeling 6.63 .0101
Male Extraverted Thinking 21. 38 .0000
Male Extraverted Feeling 0.18 .6707
Male Introverted Thinking 0.92 .3387
Male Introverted Feeling 0.40 .5268
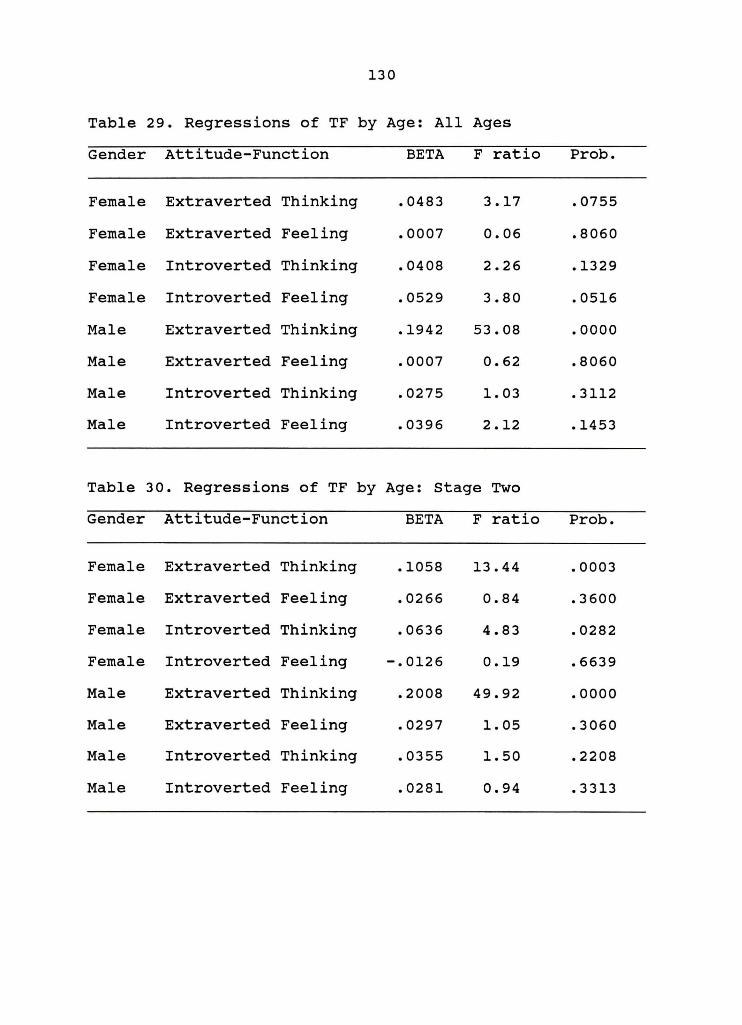
130
Table 29. Regressions of TF by Age: All Ages
Gender Attitude-Function BETA F ratio Probe
Female Extraverted Thinking .0483 3.17 .0755
Female Extraverted Feeling .0007 0.06 .8060
Female Introverted Thinking .0408 2.26 .1329
Female Introverted Feeling .0529 3.80 .0516
Male Extraverted Thinking .1942 53.08 .0000
Male Extraverted Feeling .0007 0.62 .8060
Male Introverted Thinking .0275 1. 03 .3112
Male Introverted Feeling .0396 2.12 .1453
Table 30. Regressions of TF by Age: stage Two
Gender Attitude-Function BETA F ratio Probe
Female Extraverted Thinking .1058 13.44 .0003
Female Extraverted Feeling .0266 0.84 .3600
Female Introverted Thinking .0636 4.83 .0282
Female Introverted Feeling -.0126 0.19 .6639
Male Extraverted Thinking .2008 49.92 .0000
Male Extraverted Feeling .0297 1. 05 .3060
Male Introverted Thinking .0355 1. 50 .2208
Male Introverted Feeling .0281 0.94 .3313
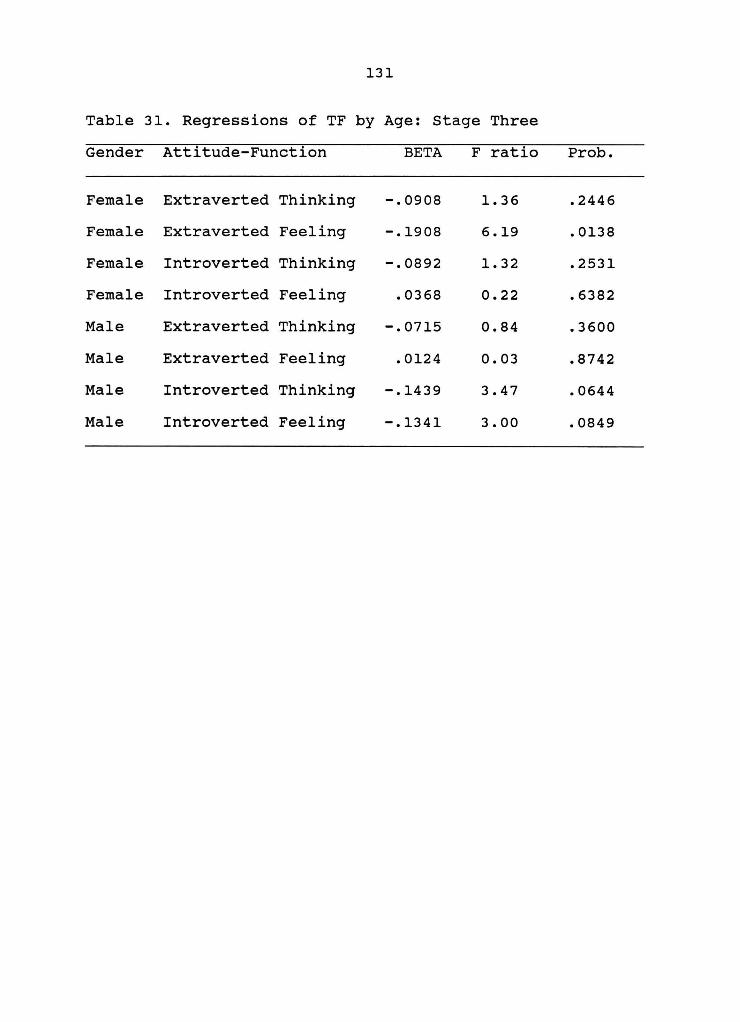
131
Table 31. Regressions of TF by Age: stage Three
Gender Attitude-Function BETA F ratio Probe
Female Extraverted Thinking -.0908 1. 36 .2446
Female Extraverted Feeling -.1908 6.19 .0138
Female Introverted Thinking -.0892 1. 32 .2531
Female Introverted Feeling .0368 0.22 .6382
Male Extraverted Thinking -.0715 0.84 .3600
Male Extraverted Feeling .0124 0.03 .8742
Male Introverted Thinking -.1439 3.47 .0644
Male Introverted Feeling -.1341 3.00 .0849
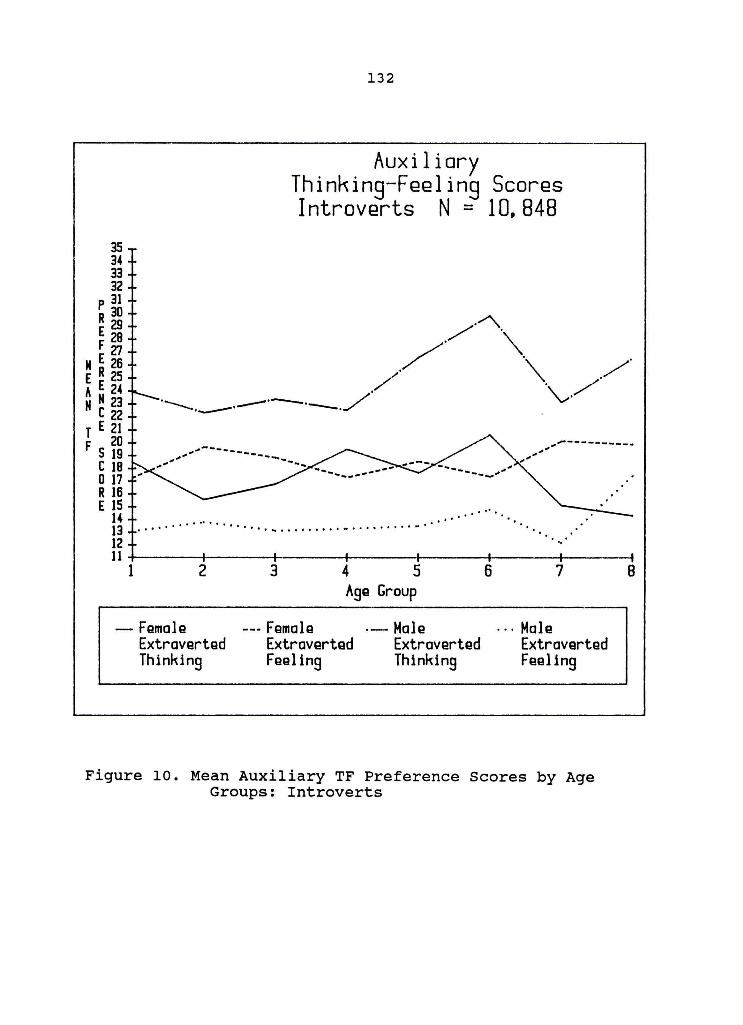
35 34 33 32
p 31 R30 E~ F£1
M E 26 E R 25 A E 24 N N 23 Czz T E 21 F 20
5 19 C IB o 17 .. R 16 E 15
14 13
132
Auxiliary Thinking-Feeling Scores Introverts N = 10,848
.. .. .. .. .. .... .... .. .. .. ........ .. .. .... .. .. .... .. .. .... .. .... ... ................ " .. .......... ..
... .... .....
,.,.----------
12 11+------r------~----~----~------+_----_r---~ 123 4 5 6 7 8
- Fgmole Extroverted Thinking
Age Group
--- Female Extrovgrted Fegling
.- Malg Extrovgrtgd Thinking
... Mole Extroverted Feel ing
Figure 10. Mean Auxiliary TF Preference Scores by Age Groups: Introverts
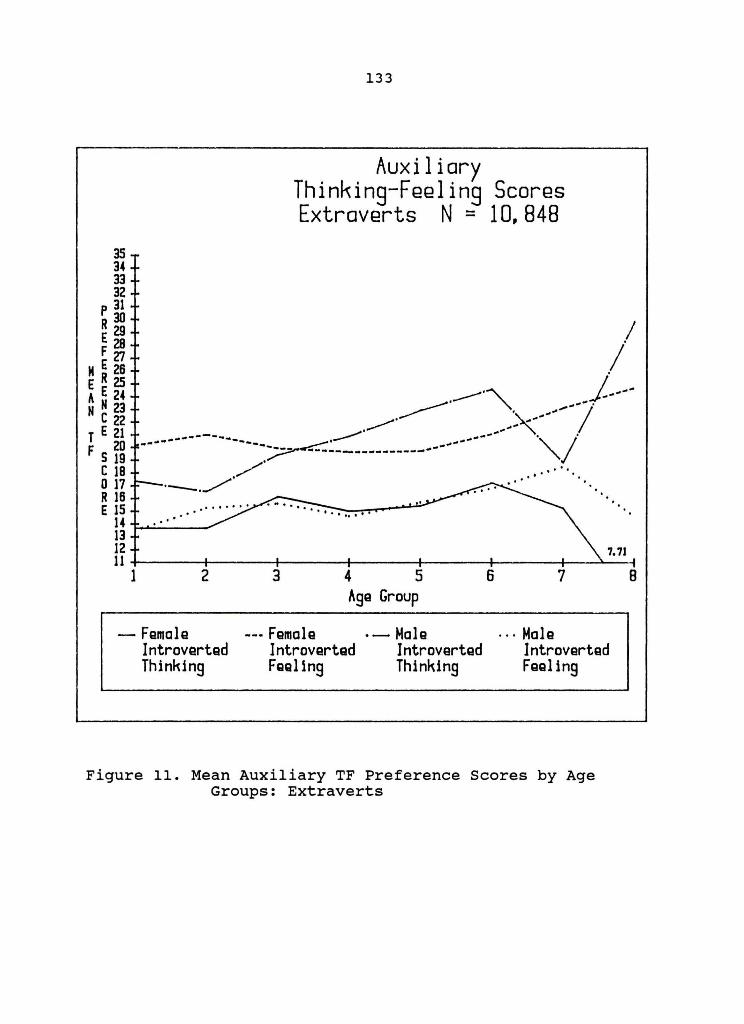
35 34 33 32
P 31 R30 E29 F~
M E 26 E R 2S A E 24 N N 23
C22 T E 21
F S ~ C 18 o 17 R 16 E 15
14 f+-'-'--' ' -' -~ 13
133
Auxiliary Thinking-Feeling Scores Extraverts N = 10,848
." .. 12 7.71 11~-----r----~~----1------+------r-----~--~~
1 2
- Femah~ Introverted Thinking
3 4 5 Age Group
--- Female Introverted FeQl1ng
.- Male Introverted Thinking
6 7
... Male Introverted Feeling
Figure 11. Mean Auxiliary TF Preference Scores by Age Groups: Extraverts
8
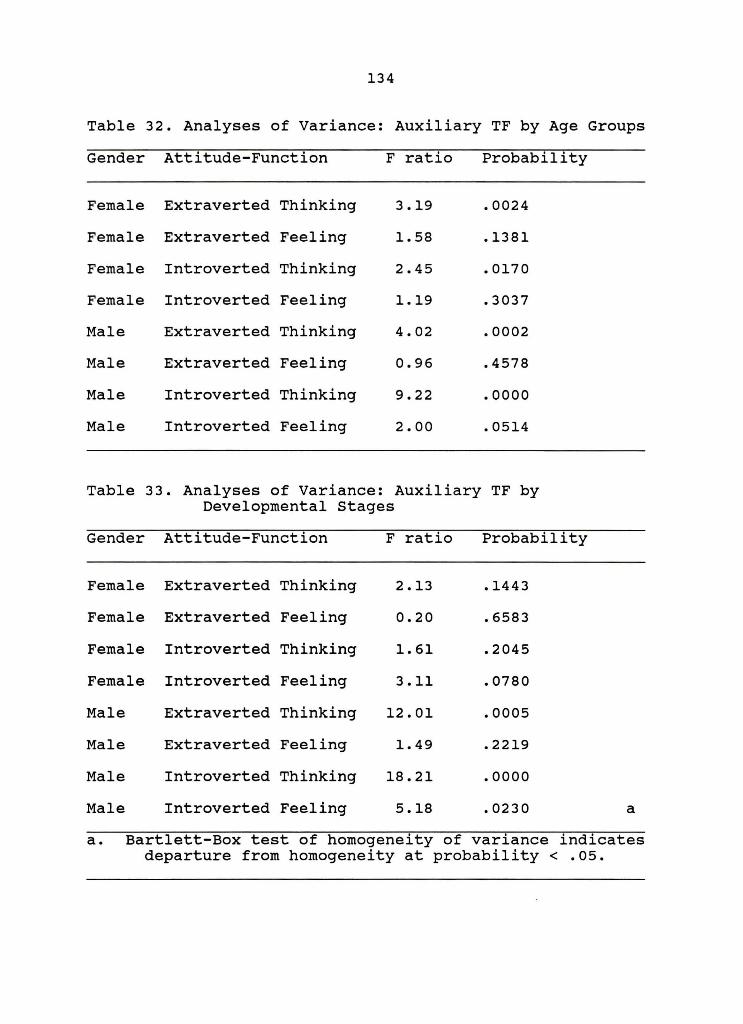
134
Table 32. Analyses of Variance: Auxiliary TF by Age Groups
Gender Attitude-Function F ratio Probability
Female Extraverted Thinking 3.19 .0024
Female Extraverted Feeling 1. 58 .1381
Female Introverted Thinking 2.45 .0170
Female Introverted Feeling 1.19 .3037
Male Extraverted Thinking 4.02 .0002
Male Extraverted Feeling 0.96 .4578
Male Introverted Thinking 9.22 .0000
Male Introverted Feeling 2.00 .0514
Table 33. Analyses of Variance: Auxiliary TF by Developmental stages
Gender Attitude-Function F ratio Probability
Female Extraverted Thinking 2.13 .1443
Female Extraverted Feeling 0.20 .6583
Female Introverted Thinking 1. 61 .2045
Female Introverted Feeling 3.11 .0780
Male Extraverted Thinking 12.01 .0005
Male Extraverted Feeling 1.49 .2219
Male Introverted Thinking 18.21 .0000
Male Introverted Feeling 5.18 .0230 a
a. Bartlett-Box test of homogeneity of variance indicates departure from homogeneity at probability < .05.
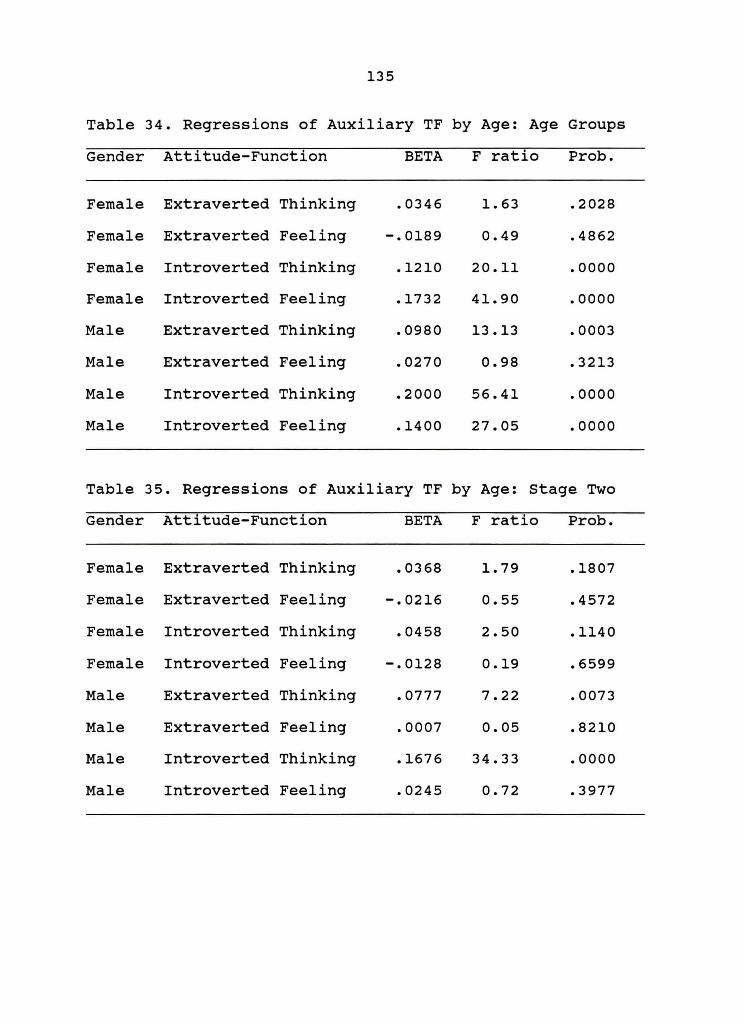
135
Table 34. Regressions of Auxiliary TF by Age: Age Groups
Gender Attitude-Function BETA F ratio Prob.
Female Extraverted Thinking .0346 1. 63 .2028
Female Extraverted Feeling -.0189 0.49 .4862
Female Introverted Thinking .1210 20.11 .0000
Female Introverted Feeling .1732 41.90 .0000
Male Extraverted Thinking .0980 13.13 .0003
Male Extraverted Feeling .0270 0.98 .3213
Male Introverted Thinking .2000 56.41 .0000
Male Introverted Feeling .1400 27.05 .0000
Table 35. Regressions of Auxiliary TF by Age: stage Two
Gender Attitude-Function BETA F ratio Prob.
Female Extraverted Thinking .0368 1. 79 .1807
Female Extraverted Feeling -.0216 0.55 .4572
Female Introverted Thinking .0458 2.50 .1140
Female Introverted Feeling -.0128 0.19 .6599
Male Extraverted Thinking .0777 7.22 .0073
Male Extraverted Feeling .0007 0.05 .8210
Male Introverted Thinking .1676 34.33 .0000
Male Introverted Feeling .0245 0.72 .3977
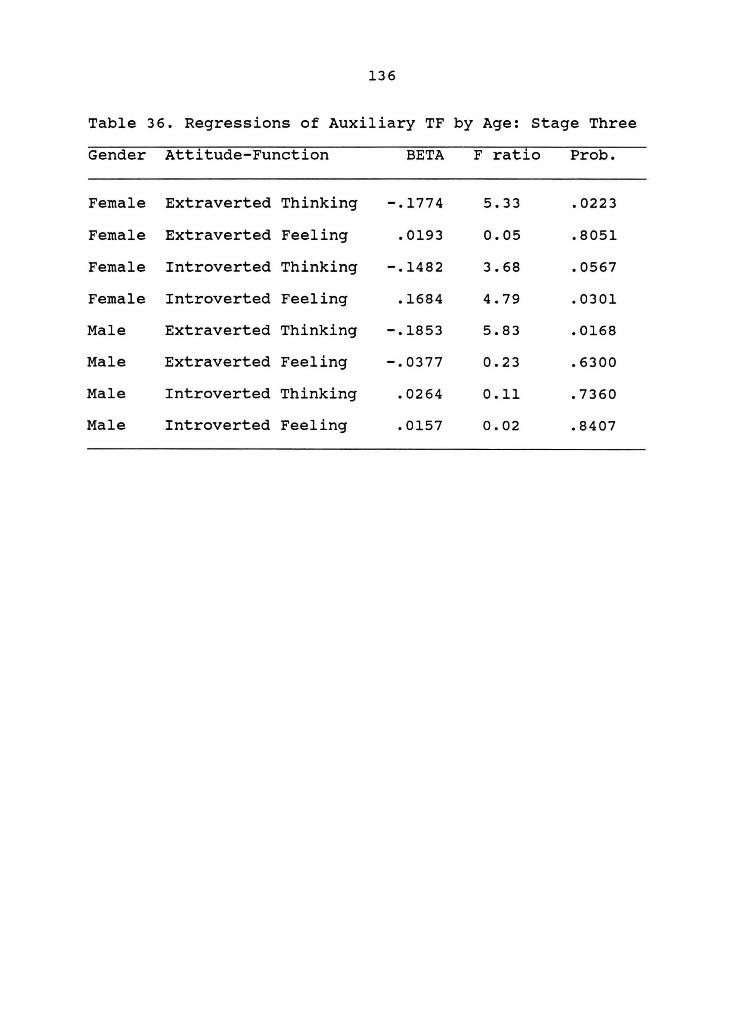
136
Table 36. Regressions of Auxiliary TF by Age: stage Three
Gender Attitude-Function BETA F ratio Probe
Female Extraverted Thinking -.1774 5.33 .0223
Female Extraverted Feeling .0193 0.05 .8051
Female Introverted Thinking -.1482 3.68 .0567
Female Introverted Feeling .1684 4.79 .0301
Male Extraverted Thinking -.1853 5.83 .0168
Male Extraverted Feeling -.0377 0.23 .6300
Male Introverted Thinking .0264 0.11 .7360
Male Introverted Feeling .0157 0.02 .8407
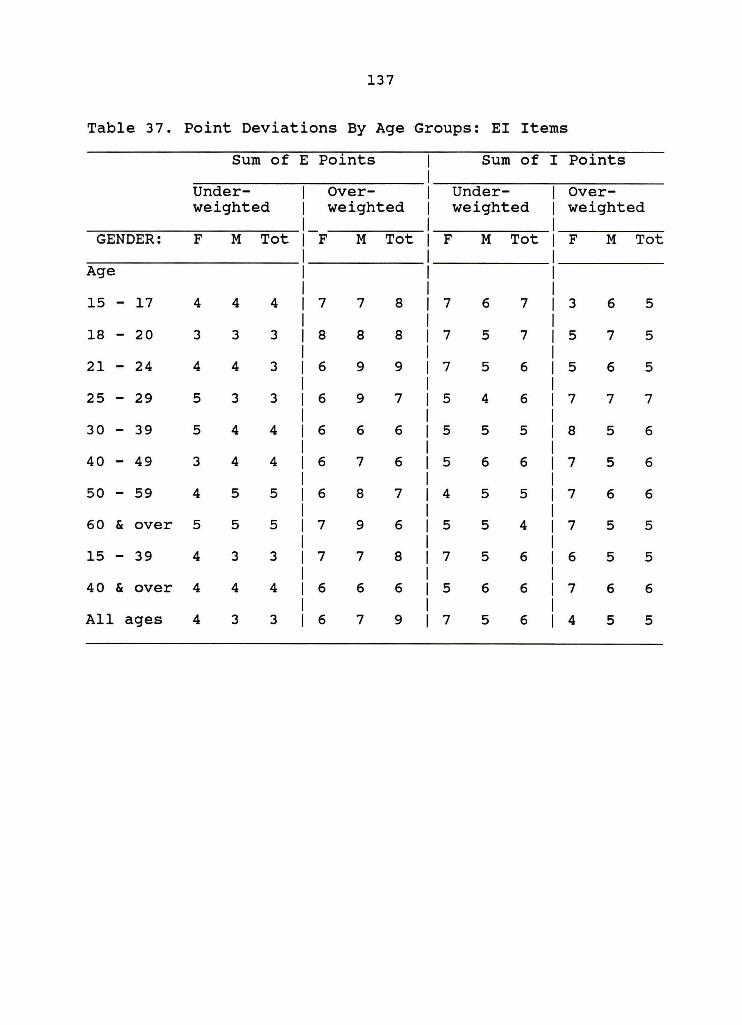
137
Table 37. Point Deviations By Age Groups: EI Items
Sum of E Points Sum of I Points
Under- Over- Under- Over-weighted weighted weighted weighted
GENDER: F M Tot F M Tot F M Tot F M Tot
Age
15 - 17 4 4 4 7 7 8 7 6 7 3 6 5
18 - 20 3 3 3 8 8 8 7 5 7 5 7 5
21 - 24 4 4 3 6 9 9 7 5 6 5 6 5
25 - 29 5 3 3 6 9 7 5 4 6 7 7 7
30 - 39 5 4 4 6 6 6 5 5 5 8 5 6
40 - 49 3 4 4 6 7 6 5 6 6 7 5 6
50 - 59 4 5 5 6 8 7 4 5 5 7 6 6
60 & over 5 5 5 7 9 6 5 5 4 7 5 5
15 - 39 4 3 3 7 7 8 7 5 6 6 5 5
40 & over 4 4 4 6 6 6 5 6 6 7 6 6
All ages 4 3 3 6 7 9 7 5 6 4 5 5
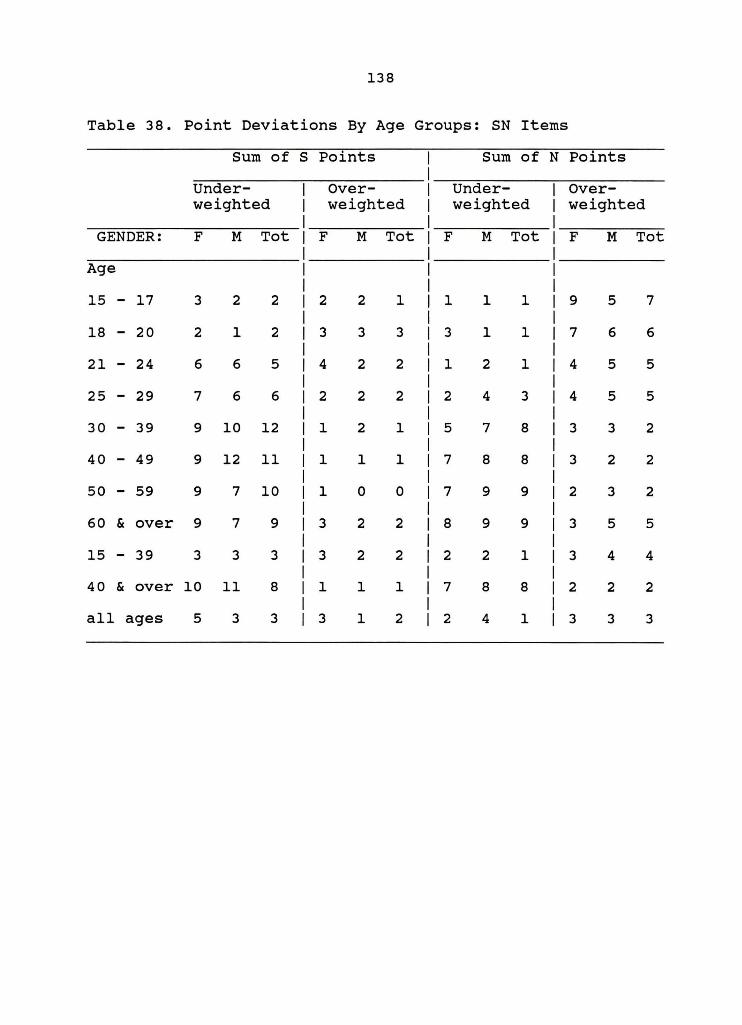
138
Table 38. Point Deviations By Age Groups: SN Items
Sum of S Points Sum of N Points
Under- Over- Under- Over-weighted weighted weighted weighted
GENDER: F M Tot F M Tot F M Tot F M Tot
Age
15 - 17 3 2 2 2 2 1 1 1 1 9 5 7
18 - 20 2 1 2 3 3 3 3 1 1 7 6 6
21 - 24 6 6 5 4 2 2 1 2 1 4 5 5
25 - 29 7 6 6 2 2 2 2 4 3 4 5 5
30 - 39 9 10 12 1 2 1 5 7 8 3 3 2
40 - 49 9 12 11 1 1 1 7 8 8 3 2 2
50 - 59 9 7 10 1 0 0 7 9 9 2 3 2
60 & over 9 7 9 3 2 2 8 9 9 3 5 5
15 - 39 3 3 3 3 2 2 2 2 1 3 4 4
40 & over 10 11 8 1 1 1 7 8 8 2 2 2
all ages 5 3 3 3 1 2 2 4 1 3 3 3
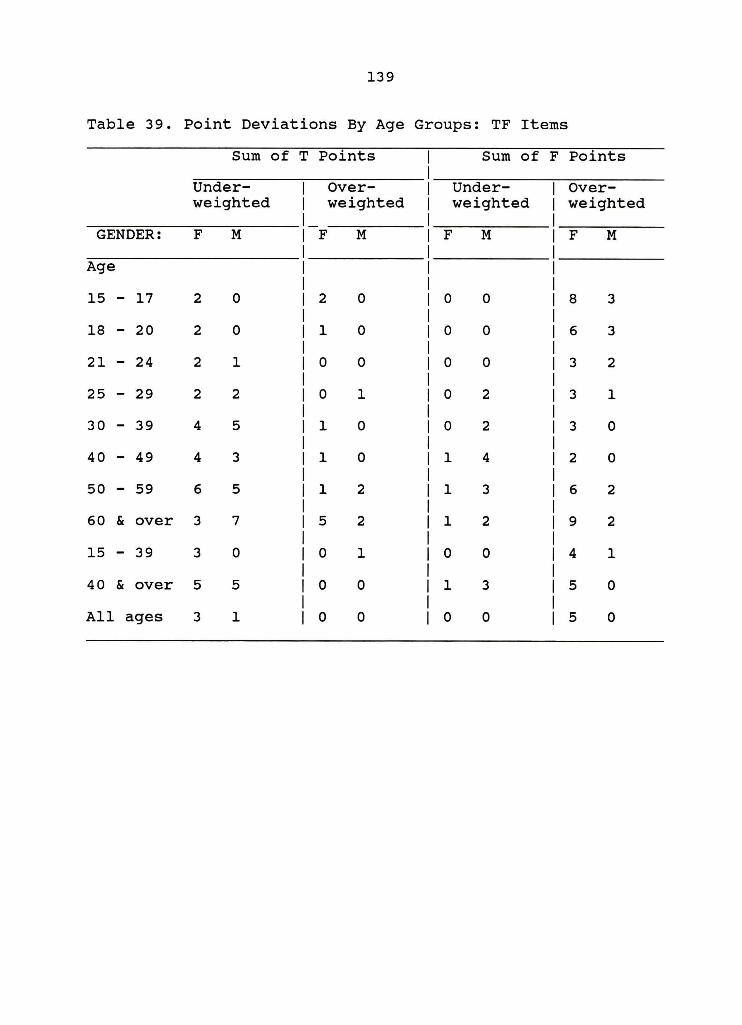
139
Table 39. Point Deviations By Age Groups: TF Items
Sum of T Points Sum of F Points
Under- 1 Over- Under- Over-weighted 1 weighted weighted weighted
1-GENDER: F M 1 F M F M F M
1 Age 1
1 15 - 17 2 0 1 2 0 0 0 8 3
1 18 - 20 2 0 1 1 0 0 0 6 3
1 21 - 24 2 1 0 0 0 0 3 2
25 - 29 2 2 0 1 0 2 3 1
30 - 39 4 5 1 0 0 2 3 0
40 - 49 4 3 1 0 1 4 2 0
50 - 59 6 5 1 2 1 3 6 2
60 & over 3 7 5 2 1 2 9 2
15 - 39 3 0 0 1 0 0 4 1
40 & over 5 5 0 0 1 3 5 0
All ages 3 1 0 0 0 0 5 0
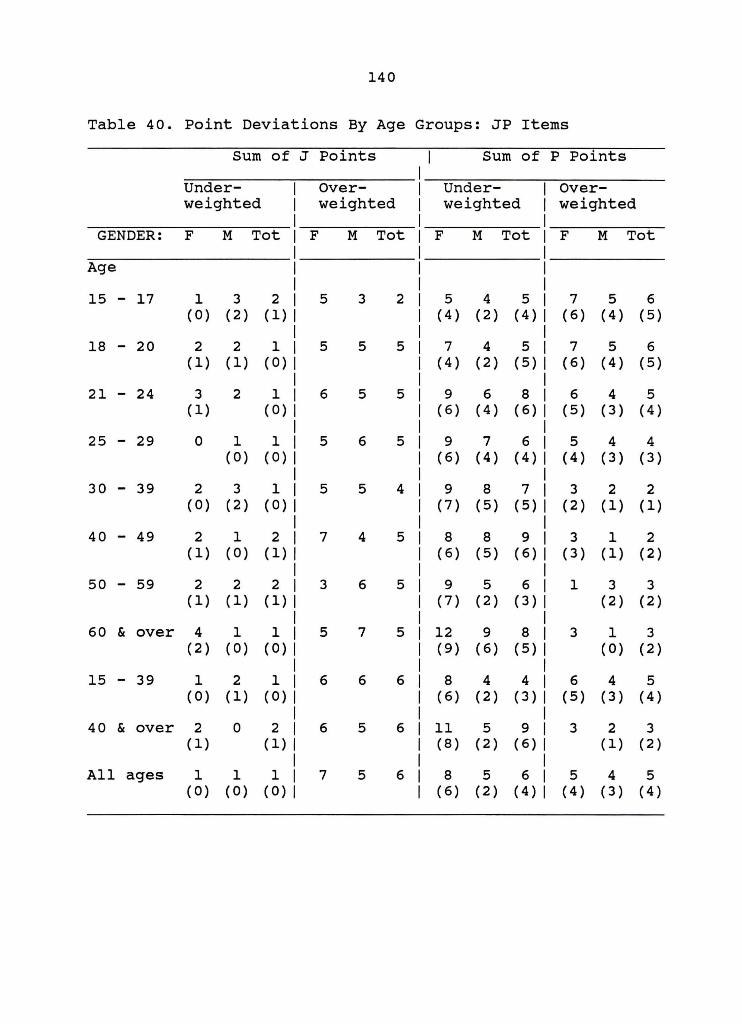
140
Table 40. Point Deviations By Age Groups: JP Items
Sum of J Points Sum of P Points
Under- Over- Under- Over-weighted weighted weighted weighted
GENDER: F M Tot F M Tot F M Tot F M Tot
Age
15 - 17 1 3 2 5 3 2 5 4 5 7 5 6 (0) (2) (1) (4) (2) (4) (6) (4) (5)
18 - 20 2 2 1 5 5 5 7 4 5 7 5 6 (1) (1) (0) (4) (2) (5) (6) (4) (5)
21 - 24 3 2 1 6 5 5 9 6 8 6 4 5 (1) (0) (6) (4) (6) (5) (3) (4)
25 - 29 0 1 1 5 6 5 9 7 6 5 4 4 (0) (0) (6) (4) (4) (4) (3) (3)
30 - 39 2 3 1 5 5 4 9 8 7 3 2 2 (0) (2) (0) (7) (5) (5) (2) (1) (1)
40 - 49 2 1 2 7 4 5 8 8 9 3 1 2 (1) (0) (1) (6) (5) (6) (3) (1) (2 )
50 - 59 2 2 2 3 6 5 9 5 6 1 3 3 (1) (1) (1) (7) (2) (3 ) (2) (2)
60 & over 4 1 1 5 7 5 12 9 8 I 3 1 3 (2) (0) (0) (9) (6) (5) I (0) (2)
I 15 - 39 1 2 1 6 6 6 8 4 4 I 6 4 5
(0) (1) (0) (6) (2) (3) I (5) (3 ) (4) I
40 & over 2 0 2 6 5 6 I 11 5 9 I 3 2 3 (1) (1) I (8) (2) (6) I (1) (2)
I I All ages 1 1 1 7 5 6 I 8 5 6 I 5 4 5
(0) (0) (0) I (6) (2) (4) I (4) (3 ) (4)
CHAPTER IV SUMMARY, DISCUSSION, AND CONCLUSIONS
Summary of the Study
This study was an investigation into the relationship
of Myers-Briggs Type Indicator preference scores to the age
of the respondents. Previous investigators have reported
that the MBTI preference scores are associated with age in a
manner that is not predicted by previous discussions of
psychological type and which appear to be inconsistent with
Jung's type theory. In this study I have attempted to find
a theoretical basis for associations of MBTI scores with age
and to correct methodological errors of the previous
analyses. Additionally, I sought a non-theoretical explan-
ation for the reported associations by examining the current
scoring procedures of the MBTI. I proposed that the
response weights employed for all respondents may not be
equally appropriate at all ages.
The Myers-Briggs Type Indicator (Myers & McCaulley,
1985) is a self-report questionnaire explicitly designed to
indicate the preferences of conscious orientation described
by Jung (1971) in his theory of psychological types.
Scoring the MBTI yields preference scores on four scales:
141
142
Extraversion-Introversion (EI) , Sensing-Intuition
Thinking-Feeling (TF), and Judgment-Perception (JP).
(SN) ,
Each preference score consists of a letter and a
number, e. g., E37, F15. The letter portion indicates the
direction of the preference and the number reflects the
strength or consistency with which the respondent has
reported the preference. Myers (1975) cautioned that the
interpretation of the number portion be limited to the
probability that the respondent has correctly reported the
preference and the relative importance of the preference to
the respondent, until further correlates aer empirically
found. Subsequently, Myers and other researchers have
investigated correlates of the MBTI scale scores with other
scores of abilities, aptitude, attitude, interests, values,
and traits of personality (see review in Myers & McCaulley,
1985) and have reported reliable, but generally moderate,
associations in support for the theoretical concurrent
validity of the scales.
Clearly, Myers did not intend for the MBTI scales to
be considered an exact measure of type preferences, but
rather a gauge for the preponderance of the evidence that
one function or attitude is preferred above its opposite.
However, the broader interpretation of the preference scores
is widely employed, with considerable empirical justifi
cation, particularly in research analyses.
143
According to Jung's theory, consciousness is oriented
by either a function of perception (sensing [5] or intuition
[N]) or a function of judgment (thinking [T] or feeling [F])
that operates in one of two attitudes (extraversion [E] or
introversion [I]). In this study the term attitude-function
refers to the combination of those attitudes and functions,
such as extraverted sensing or introverted sensing. One
attitude-function, called the dominant function, is said to
dominate or lead the orientation of consciousness. A second
attitude-function, called the auxiliary function serves as a
complementary orientation. The auxil iary is complementary
with respect to attitude--if the dominant attitude-function
is extraverted, the auxiliary will be oriented toward
introversion; if the dominant attitude is introverted, the
auxiliary will be oriented toward extraversion. Further,
the dominant and auxiliary attitude-functions are
complementary with regard to judgment and perception. If
the dominant is a perceptive function (sensing or
intuition), the auxiliary must be a jUdging function
(thinking or feeling), and vice versa. For example,
extraverted sensing may be complemented by either
introverted thinking or introverted feel ing . The theory
assumes that the dominant attitude-function is the first to
develop; the auxiliary attitude-function develops later and to a lesser degree than does the dominant attitude-
function. The combination of the dominant and auxiliary
144
attitude-functions (such as, introverted thinking with
extraverted sensing) describes an individual's psychological
type.
Jung never presented an explicit developmental theory
and those presented by his followers did not deal with
psychological type. However, the central theme of his
theory, individuation, is defined as the psychological
development of adult life. Some prominent Jungian theorists
(Meier, 1971; Fordham, 1972) argue that the dynamic inter
actions of the dominant and auxiliary attitude-functions
described in the type theory are the first steps of the
process of individuation. A central process of individ-
uation is the disengagement of consciousness from its iden
tification with the ego-complex, which retains its asso
ciation with the dominant and auxiliary attitude-function.
Therefore, the early importance of the dominant and
auxiliary attitude-functions is lessened as the individual
moves toward individuation in later life.
The individuation process, which Jung believed became
prominent at the mid-point of an individual's life (age 35
to 45), is a more extensive recapitulation of the process in
adolescence by which the auxiliary attitude-function within
the ego-complex emerges. Although, the dominant attitude
function retains control, the auxiliary becomes increasingly
important in the individual's adaptation to the demands of
reality. According to Myers, such changes in the importance
145
of the attitude-function would be reflected in the MBTI
preference scores.
The theory assumes the changes of individuation occur
gradually over a period of time, and in some individuals
development may stop before the individuation process takes
hold. For the purposes of this study, I assumed that the
behavioral changes of the individuation process might be
reflected in the ways individuals emphasized or de
emphasized their preferences when they responded to the
MBTI. The changes predicted, then, depended on the position
of the attitude-function as dominant or auxiliary at
different stages of the developmental cycle. The analyses
included eight separate age groups from 15-17 to GO-and
over. In addition, development was considered to fall into
three main time spans: stage one included the ages 14 and
under (which did not enter into the analyses because of the
unreliability of the MBTI at younger ages and the
unavailability of data); stage two, the ages 15-39; and
stage three, the ages 40 and over. Preference scores
associated with the dominant function were expected to
increase to a small degree between adolescence and mid-life;
it was assumed that as the auxiliary developed, the hold of
the dominant function would be somewhat relaxed, and that
this relaxation would appear in a tendency of the preference
scores related to the dominant to remain constant or even
decline after mid-life. Preference scores associated with
146
the auxiliary were predicted to increase to a greater degree
from adolescence to mid-life (stage two) and to continue to
increase, but to a lesser degree, thereafter. Such changes
should appear clearly only when the distinction between
dominant and auxiliary attitude-functions can be maintained
in the analyses.
I found differences in mean MBTI preference scores of
respondents at various age levels that suggest that the
consistency of the preference, and possibly the direction of
the preference, may be associated with the age of the
respondent. Other investigators (Bloch, 1978; Schaeffer,
1974) have reported similar findings. still other
investigators (Gray, 1947b; Gray, 1948; Driver, 1974) have
reported age and degree-of-preference associations using
another independently developed Jungian type indicator, the
Jungian Type Survey (JTS) (Wheelwright, Wheelwright, &
Buehler, 1964). Across all these studies of type prefer
ences and age, reliable positive associations have been
reported for introversion twice, for extraversion once, for
sensing twice, never for intuition, for thinking once, never
for feel ing , for judgment once, and never for perception.
These findings are not consistent with Jung's theory,
however, I proposed that methodological errors and failure
to take Jung' s theory fully into account may have caused
erroneous results.
147
The investigators who reported reliable associations
between MBTI scores and age did not select their samples to
control for the differences of the frequencies of the 16
possible types at different age levels. Thus, the reported
results could be an artifact of sampling bias. For example,
if more introverts at older ages than at younger ages were
included in the samples, the EI preference score would
necessarily increase. Furthermore, the previous investi
gators did not distinguish preference scores associated with
dominant attitude-functions from those associated with
auxiliary attitude-functions. In theory, the consistency
with which an individual reports a preference at different
stages of life may be related to whether the preference is
dominant or auxiliary. New analyses were required to
correct the deficiencies of the previous studies.
One possible explanation for the reported associations
between age and MBTI preference scores might lie in sampling
bias by the investigators reporting the associations.
Another source of the associations might lie in the scoring
procedures of the MBTI. The initial development of the MBTI
mature adults were sampled to obtain the scale and item
statistics
revisions
that time
necessary to calibrate scales.
of the scales required larger samples,
were only available at younger ages.
Subsequent
which at
Items or
item responses that predicted type preferences more effec
tively for mature adults may have been discarded in the
148
process of scale revisions, or may have been assigned
weights more appropriate for younger respondents. This
possibility could be investigated by replication of Myers's
item analyses separately for respondents at different age
levels.
I undertook this study to test theoretical predictions
of changes in consistency of preferences at different life
stages, and to investigate the possibility that persons of
different ages might respond differently to specific items
of the MBTI. I took advantage of a collection more than
250,000 MBTI records in the MBTI data bank maintained by the
Center for Applications of Psychological Type (CAPT). I
performed the analyses on a sample of 21,696 MBTI records
drawn randomly from the MBTI data bank. I selected the
sample to include equal numbers of each of the 16 MBTI types
for each gender at each of eight age groups (15-17, 18-20,
21-24, 25-29, 30-39, 40-49, 50-59, 60 and over). As may be
seen in Table 6 above, the frequencies of respondents at the
eight age levels differed widely; many more respondents at
the younger ages were available.
The research sample was used in a series of analyses:
analyses of variance by age groups and developmental stages,
regression analyses of trends of association of scores with
age, and item analyses controlled for age. The analyses
included a series of permutations of type combinations
related to the theoretical issues under examination.
149
Trends of association were predicted to occur between
specific MBTI preference scores and the respondents' ages
according to whether the preference score was associated
with the dominant or auxiliary attitude-function, and also
whether the respondents' ages fell into the range of
adolescence to mid-life (stage two: age 15 to 39 years) or
the range of mid-life and beyond (stage three: age 40 and
over). The trends were predicted to occur in patterns that
were related to psychological type theory by a simple model:
preference scores related to the dominant attitude-function
were expected to increase slightly from adolescence to mid
life, and thereafter to remain constant or decline;
preference scores related to the auxiliary were expected to
increase moderately during the period from adolescence to
mid-life, and thereafter to increase only slightly. Because
of the large number of analyses I performed in this study, I
rejected the null hypotheses only when the probability of
the E ratio was .005 or less. The use of such a
conservative test decreased the risk of type I error but at
the same time increases the risk of type II error,
especially among the analyses for stage three, where the
estimates of the variances (being based on much smaller
samples) were less stable.
Extraversion declined with age among female extraverts
as predicted, but remained constant among males. For both
sexes, introversion, contrary to prediction, showed reliable
150
increases during stage two and remained constant thereafter.
These findings are more congruent with the interpretation of
a trend among both extraverts and introverts to increase
their reported introversion with increasing age than they
are congruent with my predictions.
Myers devised the MBTI JP scale to be a method for
identifying the dominant and auxiliary functions. She
derived it from Jung's theory, but it is not a direct
measure of Jung's constructs.
tion that preference scores
For this reason, the predic
for judgment and perception
would increase with age have less theoretical support than
predictions for EI, SN, and TF.
Samples of respondents reporting a preference of the
judging attitude showed the predicted increases of the JP
preference score during stage two, and the two jUdging
samples predicted to show no JP score increase during the
third stage did not increase. However, two other jUdging
samples predicted to have an increase during the third stage
did not. Four samples reporting a preference for the
perceptive attitude were expected to show increases in
preference scores with age; contrary to predictions, three
of the four samples showed a reliable decrease in their JP
preference
perceptive
scores.
samples
preference scores.
During the third
were predicted to
stage, two of the
increase their JP
No reliable trends occurred. In
general, where trends occur between age and the JP
preference scores,
judging increases
151
it appears that
and the preference
attitude decreases with age.
the
for
preference for
the perceptive
Preference scores were expected to increase with age
in eight samples with either sensing or intuition as the
dominant function. six of the eight samples had reliable
increases in their SN preference scores during stage two; in
stage three no reliable trends emerged. However, the
relative size of some of the standardized regression
coefficients (BETA) among the stage three results suggests
the possibility of type II error.
As was predicted for samples reporting auxiliary
sensing or intuition, seven of eight samples had
significant increases in their SN preference scores in stage
two, and the expected positive trends did not occur during
stage three. Again, the relative size of some of the BETA
values suggests the possibility of type II error.
Of the samples of respondents reporting a preference
for dominant thinking or feeling, only two (male and female
extraverted thinking samples) had an increase of the TF
preference scores during stage two. No reliable trends
appeared during stage three. Some of the BETA values for
these analyses also suggest the possibility of type II
error.
For samples where thinking or feeling were auxiliary
functions, only two samples (male extraverted thinking and
152
male introverted thinking) had expected increases of the TF
preference scores during stage two.
trends did not emerge for stage three.
error may be suspected.
The expected positive
Once again, type II
In summary, significant support for the proposed model
appeared only among analyses of the SN preference scores.
Reliable associations found between the EI preference scores
and age, and between the JP preference scores and age, do
not fit expectations derived from theory. Rather, these
results are more consistent with the interpretation of
extraversion-introversion and judgment-perception as
continuously distributed attitudes that shift with
increasing age toward introversion and judgment, respec
tively. This finding is not consistent with the underlying
theory of psychological types. Furthermore, because these
results were obtained from a carefully selected samples, the
lack of correspondence between expectations and the results
obtained does not appear to be accountable to biases in the
selection of MBTI records for the analyses.
The focus of the next series of analyses was on the
MBTI items themselves. The item analysis procedures that
Myers used to evaluate the predictive value for each of the
item responses are not associated with a statistical test to
estimate the probability of the results obtained. Myers
assigned weights according to the value of a prediction
ratio (PR). The PR was used to establish item weights of
153
zero, one, or two for each response. The replication of
Myers's procedures in this study generated prediction
ratios; these could not be matched directly with prediction
ratios obtained by Myers, because she did not publish the
ratios she obtained. Therefore, for my analyses I assigned
weights of zero, one, or two to the data bank samples and
compared these to the published weights. When the
calculated PR for a response was higher than the maximum for
its assigned weight, the current scoring key for that
response was considered under-weighted for its predictive
value. When the calculated PR for a response was lower
than the minimum for its assigned weight, the current
scoring key for that response was considered over-weighted
for its predictive value. In the analyses, therefore, if
more responses are under-weighted than are over-weighted for
a preference, the present scoring keys for that scale under
estimate that preference. Conversely, if more responses are
over-weighted, the present scoring keys for that scale over
estimate that preference.
The MBTI preference scores are calculated from the
difference between the points for responses related to one
preference and the points for responses related to the
opposite preference. Thus, overestimation of one preference
results also in underestimation of its opposite (the MBTI
scales are all ipsative). The result of the item analyses
most directly related to the problem of the study (trends of
154
association between the MBTI preference scores and age) is
the degree by which a preference may be overestimated at one
age (preference score too high) and underestimated at
another age (preference score too low).
The actual effects on the trends of association--
caused by the differential mis-estimation by age for the
consistency of the attitude-function preferences--could only
be determined by re-scoring the scales with response weights
revised according to the current calculations of the
prediction ratios, which is beyond the scope of this study.
However, the analyses indicate that the degree to which a
preference score would be affected is dependent on the age
of the respondent. After response weight revisions the
subsequent trends of association between the preference
scores and the respondents' ages would probably be changed.
Item analyses calculated for the total sample showed
that many responses did not fall into the range for their
assigned weight. The current response weights tend to over-
estimate the preferences
the judging attitude for
feeling among females.
for extraversion, intui tion, and
both sexes; and to overestimate
Because Myers's item analysis procedures do not have
an associated test statistic, I supplemented the analyses
with statistical tests of association between the
frequencies of the responses for each item and the eight age
groups. For each item I tabulated a contingency table of
155
responses by age groups for each sex. A two-tailed chi-
square test of association was applied to each table. I
rejected the null hypothesis (of no association) if the
probability of the chi-square statistic was .05 or less.
I rejected the null hypothesis for 19 of 22 items on
the EI scale for both genders, for 20 of 26 SN items for
females, for 20 of 26 SN items for males, for 17 of 23 TF
items for females, for 21 of 23 TF items for males, and for
21 of 24 JP items for both sexes. Thus, the choice of
response is associated with the age of the respondent for a
large majority of the items on each of the MBTI scales.
Discussion
This section is a discussion of some limitations of
the study, and of the relevance of the reported results for
understanding changes in the consistency of respondents'
reported preference for psychological attitude-functions
that are associated with the their age.
The data analyzed in this study were drawn from cross-
sectional samples. The central concern of the study is to
understand better how individuals may change the consistency
of their reported type preferences as they grow older. A
sample of longitudinal data would have made possible a more
rigorous test of the predictions, but such a sample does not
exist and cannot reasonably be obtained. Using a cross
sectional sample implies an assumption that the mean
preference scores currently obtained from respondents in the
156
younger age groups are directly comparable to the mean
preference scores that would have been obtained from the
older respondents had the data been collected from them
when they were the age of the younger group. In making this
assumption I am ignoring differences of social climate
between the times when each group was of an equivalent age.
Uses of language, social attitudes, and other factors that
may alter the attractiveness of a particular response,
phrased in a particular way, may change considerably in a
generation or less.
guish the effects
Cross-sectional sampling cannot distin
of social change from the effects of
maturation. In this study, those effects are confounded.
The limitation of using cross-sectional data may be an
inherent difficulty with the MBTI items, since Myers
intentionally selected items that reflect the ordinary
choices of everyday life, items that do not require the
respondent to take an extreme position. These may also be
the choices most easily influenced by the social climate and
by the choices of one's peers.
The effects being studied are small effects, although
the statistical analyses show them to be very reliable. The
evidence for their statistical reliability is demonstrable
because the large numbers of MBTI records studied allowed me
to obtain very stable estimates of the sample variances.
However, a great disparity among the frequencies of
respondents in the eight age groups occurred the sample.
157
One effect of this disparity was that data from analyses of
the younger respondents (who were more numerous) were far
more stable than that of the older respondents. This was
true both across the eight age groups, and wi thin both of
the developmental stages. A superior statistical design
might have been to limit the number of younger respondents
to equal the number of older respondents. However, such a
limitation would have reduced the stability of the variance
estimates for the younger age groups, making less detectable
the reliable trends that appeared. In most psychological
instruments careful study of these small effects would be of
little consequence, because a difference of a few points in
a respondent's scale position does not markedly change the
interpretation of the result. In the use of the MBTI as an
index of psychological type, fairly small differences in
scale position can shift the indicated type for respondents
whose scores lie near the mid-points. For this reason,
Myers took especial care correctly classify scores that were
near the mid-point. This study is a continuation of her
concern in that regard.
I performed a large number of independent statistical
analyses were performed on these data, and therefore adopted
an unusually small probability of the test statistics (.005)
for rejection of the null hypothesis. Some readers
inspecting the results, especially results for the third
developmental stage, may decide this probability level is
158
too conservative. For their consideration, the exact
probability of each result is provided with every test.
Although I designed the research to test specific
theoretical predictions, the findings that may have the most
practical consequences are the number of disparities between
the response weights used in the published MBTI scoring keys
and the predictive value of the responses indicated by the
analyses of the CAPT data bank records. Perhaps the need
for weight revisions of the TF scale in the mid-1970s should
have made this result more predictable. However, at that
time Myers examined all four scales and found sufficient
evidence for needed revisions only in the TF scale.
McCaulley (1985, personal communication) reported that
Myers did find discrepancies between prediction ratios and
assigned weights for the other scales, but concluded that
the results of her earlier analyses were more reliable
(having been based on better sampling procedures) .
It would be surprising if Myers's item analyses in
1977 had not found some discrepancies, considering the
number found in the current analyses. It is reassuring that
the drift found for the predictive values of the responses
for the EI, SN and JP has developed over 20 years rather
than 8 years. The smaller discrepancies detected for the TF
responses for males certainly reflect the more recent
corrections. The finding that the scoring weights now
underestimate thinking among females suggests that perhaps
159
the mid-1970s may not have been the best time to make
revisions in the weights of the female TF responses.
Because the data Myers analyzed at that time indicated that
thinking responses had become more popular among females,
she reduced their weight for some items. Those data may have
reflected too much of intense conflict concerning women's
changing roles. That is, women may now be more accepting
that the feeling function is neither simply a stereotyping
of traditional womens' roles, nor inconsistent with their
new roles; they may, therefore, be more readily endorsing
the feeling responses.
Table 41 shows the number of MBTI items per scale that
have one under-weighted or over-weighted response. For each
scale the number of items requiring revised weighting
indicates a clear need for a restandardization of the MBTI
scales. Some items now predict better than indicated by the
weights of the scoring keys, others, less well.
In general, the model developed in Chapter I, relating
changes of MBTI preference scores to the respondents' ages,
gained little support from the results reported here. The
SN preference scores most closely conformed to the
predictions based on the model. The model predicted that
preference scores associated with the dominant attitude
function would increase reliably with age from adolescence
to mid-life and then remain constant. Also, the preference
scores associated with the auxiliary attitude-function would
160
increase more steeply than the dominant from adolescence to
mid-life, and show only slight increase thereafter. Even
with the SN scale, where the age differences most clearly
conformed to predictions, the preference score differences
in the strengths of the associations did not show the
auxiliary more closely associated with age than the
dominant; and for a number of samples the association of
the dominant was greater.
Analyses of the response weights did show noticeable
differences in the predictive value of numerous responses at
different ages. I observed both increases and decreases of
the sums of points that would be added to each scale by re
weighting; other, non-linear patterns, appeared as well.
wi thout actually rescoring the entire data bank and re
peating all the analyses, one cannot conclude that the age
differences among the response weight deviations account for
the pattern of associations between preference scores and
age found in the regression analyses.
ciations would probably be different.
The pattern of asso
Speculating on the
basis of visual inspection alone, the trends of association
with age for sensing, intuition, thinking, feeling, and
perception are likely to increase, and the trends for
extraversion and introversion to decrease. Such a pattern
would not be incompatible with the type theory, although it
would not be consistent with the model I presented in this
study.
An inspection of
preference scores by age
161
the progression of the mean SN
showed distinct patterns related
to whether the preference was associated with an extraverted
or an introverted attitude for those samples. Differences
were also apparent between some samples depending on whether
the preference was dominant or auxiliary. If similar
patterns appear in future studies, their existence will
provide support for the theoretical distinction Jung made
between the extraverted and introverted attitudes and
between the dominant and auxiliary functions. Several of
the reliable associations reported in this research support
the possibility that further work will support Jung's
distinctions.
Conclusions
Sufficient numbers of MBTI item response weights on each of
the MBTI scales show deviation from their predictive
value to warrant a restandardization of all four scales.
Sufficient numbers of MBTI item responses differ in their
predictive value at different age levels to make
separate response weighting by age level desirable.
Using current scoring weights, reliable differences among
the means of the MBTI preference scores occur at
different age levels, and reliable trends of association
occur between the respondents' ages and preference
scores.
162
The differences of predictive value of the item responses at
different age levels influence the observed differences
among the means and the trends of association .
Revision of the MBTI item response weights would alter the
pattern of trends of association between MBTI preference
scores and the respondents' ages from those trends
reported in this study.
Recommendations For Further Investigation
In this research I attempted to test theoretical
predictions and to investigate the possibility of changes
in MBTI item weights. The changes in the predictive value
of the MBTI item responses that have occurred among all age
groups made it impossible, within the scope of this study,
to separate out these changes from the effects of the
developmental stages. Thus, further research is needed to
control separately for effects of both generational and age
differences.
The predictive value of the item responses does appear
to change with time. Therefore, the item analyses should be
replicated at intervals in order to determine when restan
dardization is required.
Although, large samples of high school and college
students, and other young adults were available for analyses
in this investigation, the number of respondents aged 50
years and older cannot be considered sufficient for
normative studies. The use of the MBTI with older

163
populations is increasing rapidly. The findings from the
present study indicate the need for age-related normative
data for older samples. until such norms are available,
investigators and counselors interpreting the MBTI scores of
respondents over age 50 should give careful consideration to
the fact that the scales are presently normed on high school
students.
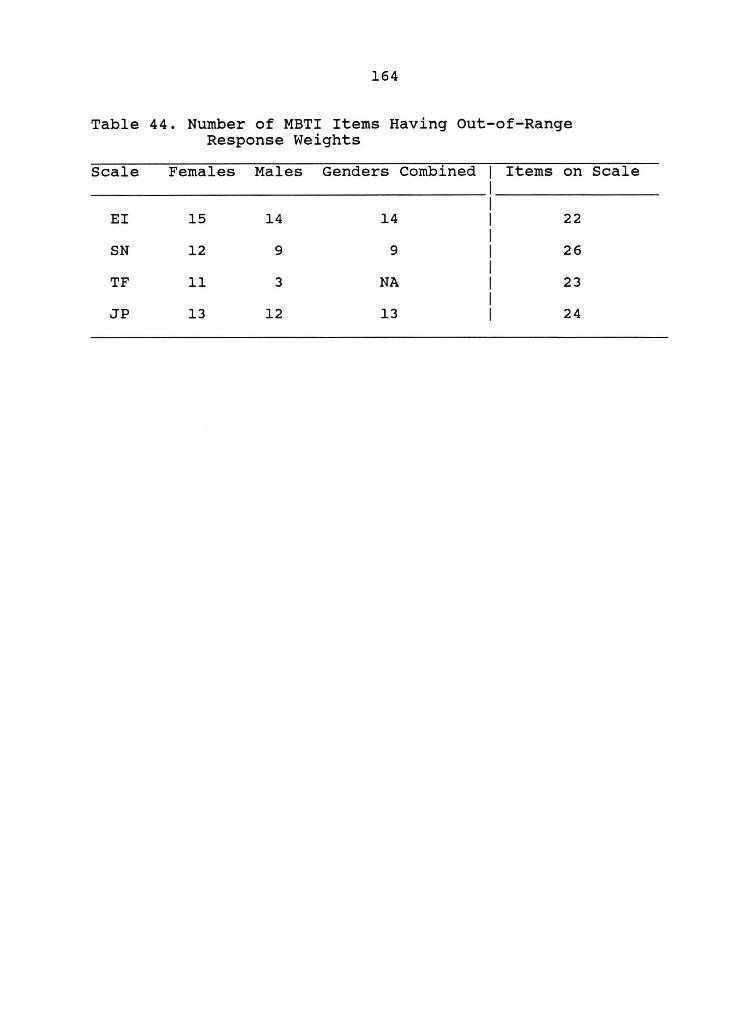
164
Table 44. Number of MBTI Items Having out-of-Range Response Weights
Scale Females Males Genders Combined Items on Scale
EI 15 14 14 22
SN 12 9 9 26
TF 11 3 NA 23
JP 13 12 13 24
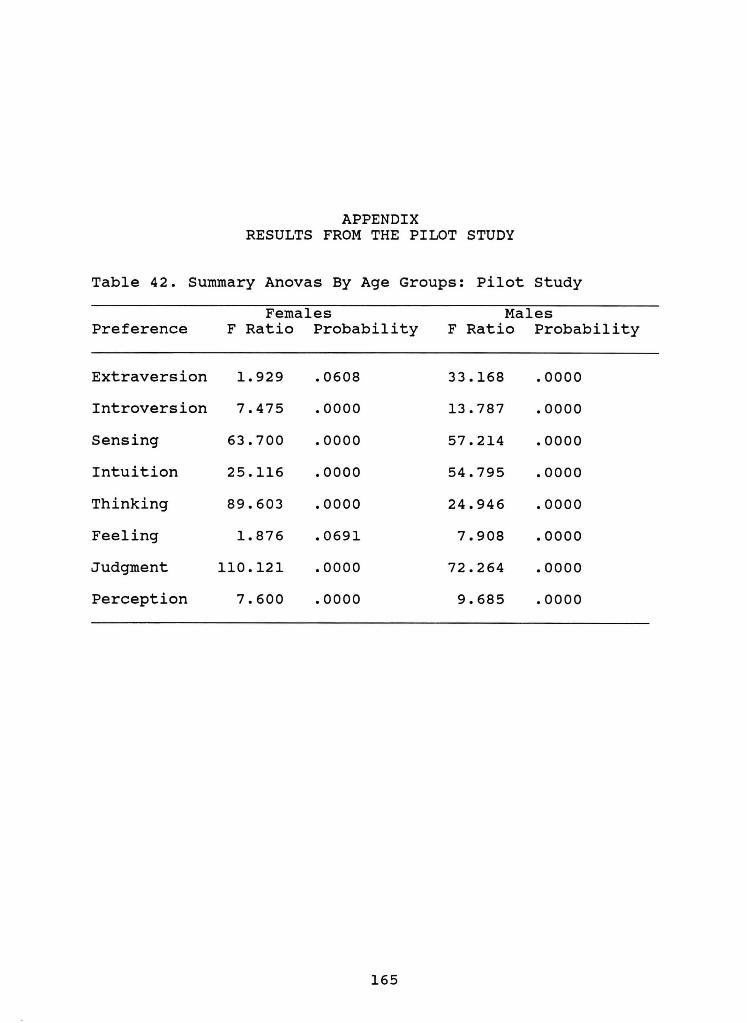
APPENDIX RESULTS FROM THE PILOT STUDY
Table 42. Summary Anovas By Age Groups: Pilot Study
Females Males Preference F Ratio Probability F Ratio Probability
Extraversion 1. 929 .0608 33.168 .0000
Introversion 7.475 .0000 13.787 .0000
Sensing 63.700 .0000 57.214 .0000
Intuition 25.116 .0000 54.795 .0000
Thinking 89.603 .0000 24.946 .0000
Feeling 1.876 .0691 7.908 .0000
Judgment 110.121 .0000 72.264 .0000
Perception 7.600 .0000 9.685 .0000
165
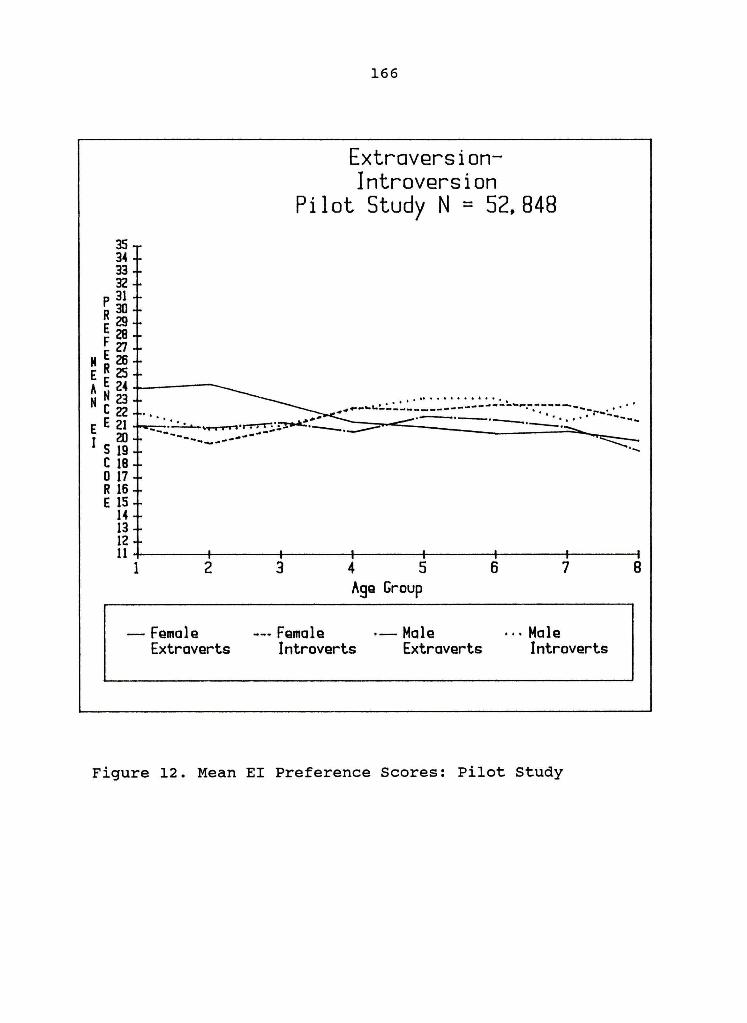
35 34 33 32
P 31 R30 E29 F~
166
ExtraversionIntroversion
Pilot Study N = 52,848
M E 26 E R 2S A E 24~---N N 23
(22 E E 21
I S ~ ( 18 o 17 R 16 E 15
14 13 12
••••••• f • •••• :.:.~:.:.:.~_,.. ... _____ ••
~~~-~~------------ .... ---r~~·· . . . . .~"~ --.::~.....::::::...--.--=.-=-:.:..-==-::.. ':::'~' '-' - -- ..... .. _.:~~.r-:=~:;..:... ' ___ . ______ - ... _------_ ... -- ~ .....
11+------+------+------+------+------+------+-----~
1 2 3 4 5 6 7 8 Age Group
- Female --- Female .- Male ... Male Extraverts Introverts Extraverts Introverts
Figure 12. Mean EI Preference Scores: pilot Study
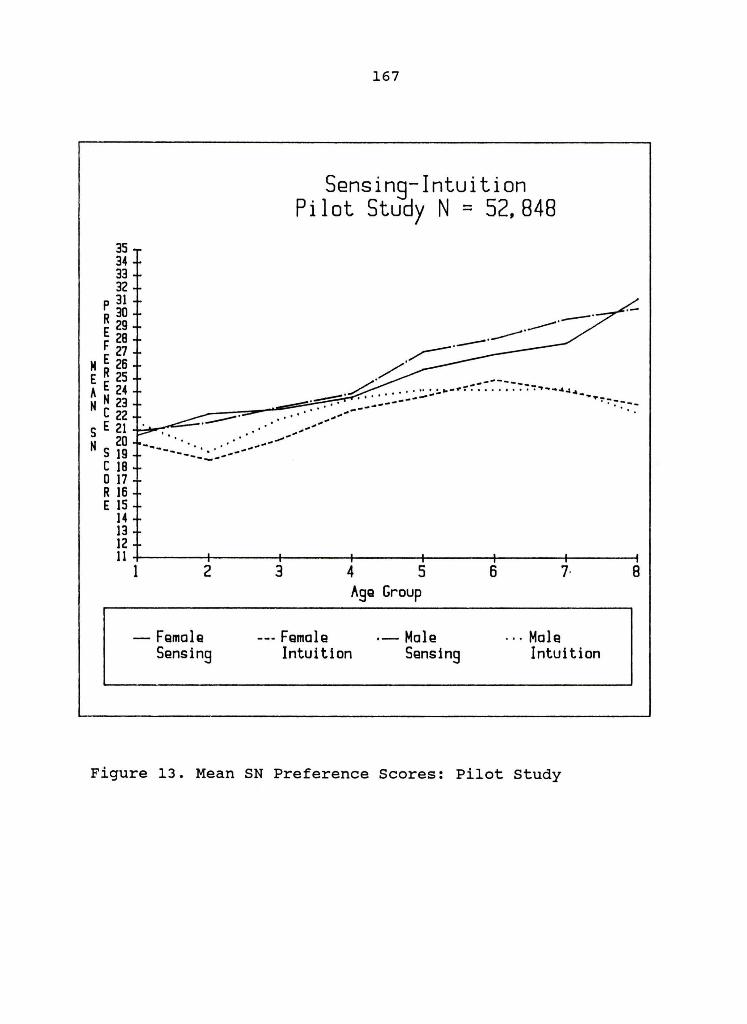
35 34 33 32
167
Sensing-Intuition Pilot Stuay N = 52.848
P 31 R 30 __ . E 29 ___ .--.
F~~ ~.--. M E 26 . /' E R 25 /-A E 24 b- ..... :. .. _ .. ~':"-:7~:::7~-:"h_4..a .. _ N N 23 _-.,=-", __ ~'7"' ---::::.;-:-. ' .. . .. ~ ~ - - - - ... 7' ~ :- -. -. -
~ ... ...... --~ .. -C 22 . __ ...• .._ .. -S E 21 .J....:...a. __ - ........
N S ~~ _~~:..:.~._-- .... -----c 18 o 17 R 16 E 15
14 13 12 ll+------+------+------+------+------+------+-----~
1 2
- Female Sensing
3 4 5 Age Group
-.- Female .- Mole Intuition Sensing
6
. .. Mole Intuition
Figure 13. Mean SN Preference Scores: pilot Study
8
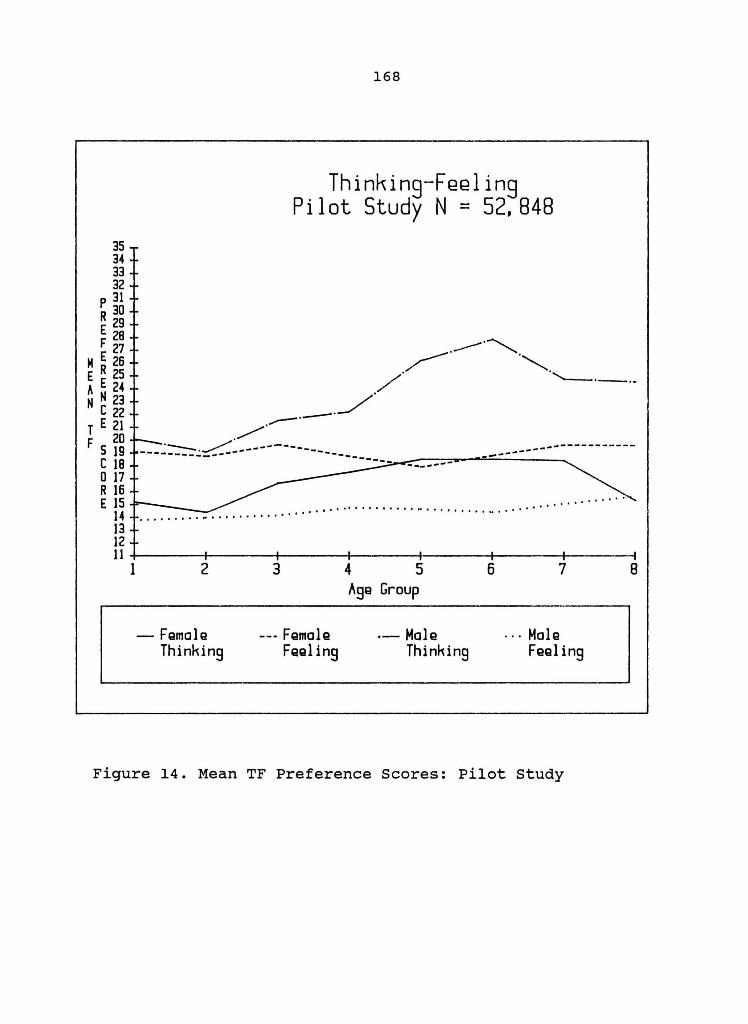
35 34 33 32
P 31 R 30 E 29
28 F 27
168
Thinking-Feeling Pilot Study N = 52,848
--'~ M E 26 E R 25 A E 24 N N 23
~' '~ /' ',--._.-
Czz T E 21 ,..,-'
-,/.
F 20 5 19 C 18
/' ---~:::::-~~~---------------- ----------------------.. --.. --. --. -:--~--=---..-.£.:::..:..-_-........
o 17 R 16 .. . .. . . . ~ E 15--14 ...... -. . -. ~---.............. ' .. ' ............ ~ ......... ~ , .. , ..
13 12 11
1 2
- Fgmale Thinking
3
--- Fgmale FQeling
I I 4 5 6 7 ~gg Group
.- Male ... Male Thinking Fegling
Figure 14. Mean TF Preference Scores: Pilot Study
I 8
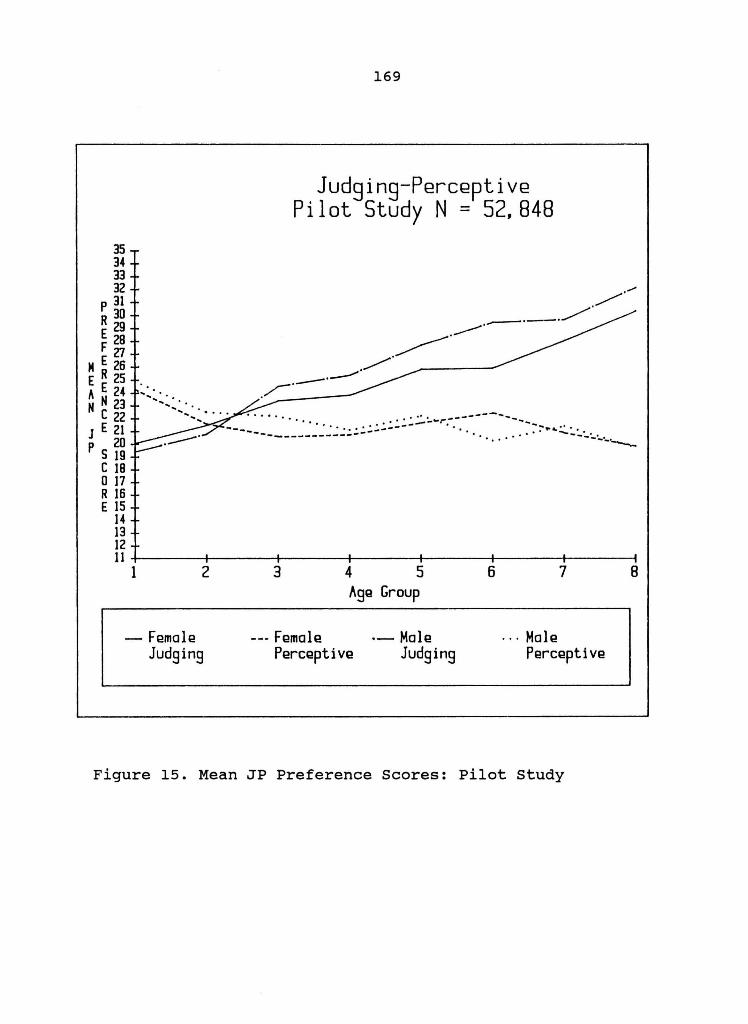
35 3. 33 32
P 31 R 30 E 29
F~ M E 26 E R 25 A E 2. N N 23
C 22 J E 21
P 5 ~ C 18 o 17 R 16 E 15
1. 13
169
Judging-Perceptive Pilot Study N = 52,848
--,-,~
---' ~' /' --,--' /'
,/ ,---
_____ '~ ~ ~ ~ ~,;.:.:..:..:..:..:..:..:..:..:..:.::- '..wr",-,-,-,- - ~ ~ ~ ~ ~~ ~ ~:-"":':':.:. :"_'_,_, __
12 11+------+------+------+------+------+------+------;
1 2
- Female Judging
3 4 5 AgQ Group
-_. Female Perceptive
0- Male Judging
6 7
.. , Male Perceptive
Figure 15. Mean JP Preference Scores: pilot Study
8
170
REFERENCES
Bloch, D. L. (1978). The developmental properties of Jungian psychological type as measured by the MyersBrigg Type Indicator (Doctoral dissertation, Mississippi State University, 1978). Dissertation Abstracts International, ~, 1429A.
Driver, J. D. (1975). Personality differences in the elderly as a function of type and length of residence (Doctoral dissertation, University of Maryland, 1974). Dissertation Abstracts International, 2§ (03), 1860A -1861A.
Edinger, E. F. (1968). An outline of analytical psychology. Quadrant,~, 1-12.
Fordham, M. (1972). Note on psychological types. The Journal of Analytical Psychology, 17 (2), 111-115.
Gray, H. (1946). Jung's psychological types in relation to occupation, race, body-build. Stanford Medical Bulletin, i (3-4), 100-103.
Gray, H. (1947a). Jung's psychological types: Meaning and consistency of the questionnaire. The Journal of General Psychology, 37, 177-186.
Gray, H. (1947b). Psychological types and changes with age. Journal of Clinical Psychology, ~ (3), 273-277.
Gray, H. (1948). Jung's psychological types in men and women. Stanford Medical Bulletin, Q (1), 29-36.
Gray, H., & Wheelwright, J. B. (1945). Jung's psychological types, including the four functions. The Journal of General Psychology, ~, 265-284.
Gray, H., & Wheelwright, J. B. (1946). Jung's psychological types, their frequency of occurrence. The Journal of General Psychology, 34, 3-17.
Grenade, G. (1985). MBTI item analysis program [Computer program]. Gainesville, Florida: Center for Applications of Psychological Type, Inc.
Hartmann, H. (1958). Ego psychology and the problem of adaptation (D. Rapaport, Trans.). Journal of the American Psychoanalytic Association Monograph Series, 1. New York: International Universities Press. (original work published 1939).

171
Jacobi, J. (1973). The psychology of C. G. Jung (8th ed.). New Haven: Yale University Press.
Jung, C. G. (1961). Memories, dreams, and reflections (R. Winston, & C. Winston, Trans.; A. Jaffe, Ed.). New York: Vintage Books.
Jung, C. G. (1968). Analytical psychology: Its theory and practice (The Tavistock lectures). New York: Vintage Books. (original work published 1935).
Jung, C. G. (1971). Psychological types (H. G. Baynes, Trans.; R. F. C. Hull, Rev.). In H. Read, M. Fordham, & G. Adler (Eds.), The collected works of C. G. Jung, Bollingen series xx, § (whole volume). Princeton, N. J.: Princeton University Press. (Original work published 1921) .
Kainz, R. I., & McCaulley, M. H. (1980). Item omissions and MBTI split-half reliabilities]. Raw data analysis. Reported in Myers, I. B., & McCaulley, M. H. (1985). Manual: The Myers-Briggs Type Indicator (2nd ed.). Palo Alto, Calif.: Consulting Psychologists Press.
Kris, E. (1934). The psychology of caricature. Psychoanalytic Explorations in Art. New York: International Universities Press.
Lundberg, M. (1975). Developmental aspects of the MyersBriggs Type Indicator. Paper presented at the first national conference on the Myers-Briggs Type Indicator, University of Florida, Gainesville, Fla., October, 1975. (Available from the Center for Applications of Psychological Type, 2720 N. W. 6th st., Gainesville, Fla., 32607.)
Marshall I. N. (1968). The four functions: A conceptual analysis. The Journal of Analytic Psychology, 13 (1), 1-32.
McCaulley, M. H. (1978). Applications of the Myers-Briggs Type Indicator to medicine and other health professions (Monograph I, Contract No. 231-76-0051, Health Resources Administration, DHEW). Gainesville, Florida: Center for Applications of Psychological Type.
Meier, C. A. (1971). Psychological types and individuation: A plea for a more scientific approach in Jungian psychology. In J. B. Wheelwright (Ed.), The Analytic Process (pp. 276-289). New York: G. P. Putnam's Sons.
172
Mosak, H. H., & Dreikurs R (1973). Adlerian psychotherapy. In Corsini, R., Current Psychotherapies (pp. 85-118). Itasca, Illinois: F. E. Peacock Publishers.
Myers, I. B. (1961). Construction of the type indicator: Form Zero to F. Unpublished manuscript.
Myers, I. B. (1975). Manual: The Myers-Briggs Type Indicator. Palo Alto, Calif.: Consulting Psychologists Press. (Original work published 1962).
Myers, I. B. (1977). Supplementary manual: the MyersBriggs Type Indicator. Palo Alto, Calif.: Consulting Psychologists Press.
Myers, I. B., & McCaulley, M. H. (1985). Myers-Briggs Type Indicator (2nd ed.). Calif.: Consulting Psychologists Press.
Manual: The Palo Alto,
Neumann, E. (1954). The origins and history of consciousness (R. F. C. Hull, Trans). New York: Harper Torchbooks. (original work published 1949).
Norusis, M. J. (1984). SPSS/PC: Release 1.1 [Computer program]. Chicago: SPSS Inc.
Schaeffer, S. (1974). A study of sex and age differentials in typologies as derived from test scores of 200 adults on the Jungian Type Survey and the MyersBriggs Type Indicator. Unpublished manuscript.
Stricker, L. J., & Ross, J. (1964). Some correlates of a Jungian personality inventory. Psychological Reports, 14, 623-643.
Wheelwright, J. B., Wheelwright, J. H., & Buehler, J. A. (1964). Jungian Type Survey, the Gray-Wheelwright Test, (16th revision> Manual. San Francisco: Society of Jungian Analysts of Northern California.
BIOGRAPHICAL SKETCH
Richard Ivor Kainz was born in 1945 in Cedar Rapids,
Iowa, where he lived until moving to Windermere, Florida, in
1957. In 1963 he graduated from Lakeview High School,
winter Garden, Florida. After attending New College in
Sarasota, Florida, and the University of Florida, he
received a Bachelor of Arts in psychology from the
University of Florida in 1973. He worked as a psychology
technician in the Typology Laboratory at the University of
Florida until beginning doctoral studies in the Department
of Clinical Psychology in 1974. He served as a Clinical
Fellow in Psychiatry at Harvard Medical School during 1978-
1979 and completed a clinical internship in psychology at
The Massachusetts General Hospital and Erich Lindemann
Community Mental Health Center in 1979. He has continued to
do research in psychological type as: graduate research
assistant, research associate, and director of research, at
the Typology Laboratory and its subsequent incarnation, the
Center for Applications of Psychological Type, Inc. (CAPT),
in Gainesville, Florida.
theory of psychological
Indicator at CAPT.
He continues to research Jung' s
types and the Myers-Briggs Type
173
I certify that I have read this study and that in my opinion it conforms to acceptable standards of scholarly presentation and is fully adequate, in scope and quality, as a dissertation for the degree of Doctor of Philosophy.
~in Barger, airman Professor of Clinical
Psychology
I certify that I have read this study and that in my opinion it conforms to acceptable standards of scholarly presentation and is fully adequate, in scope and quality, as a dissertation for the degree of Doctor of Philosophy.
ffiJ:jA:' /7u C' 4~ Mary . McCaulley ASSisar:t Professor of
Clinical Psychology
I certify that I have read this study and that in my opinion it conforms to acceptable standards of scholarly presentation and is fully adequate, in scope and quality, as a dissertation for the degree of Doctor of Philosophy.
Davis, Jr. Profe sor of Clinical
Psychology
I certify that I have read this study and that in my opinion it conforms to acceptable standards of scholarly presentation and is fully adequate, in scope and quality, as a dissertation for the degree of Doctor of Philosophy.
~rJf1:4Qp7'15 Professor of Psychology

I certify that I have read this study and that in my opinion it conforms to acceptable standards of scholarly presentation and is fully adequate, in scope and quality, as a dissertation for the degree of Doctor of Philosophy.
This dissertation was submitted to the Graduate Faculty of the College of Health Related Professions and to the Graduate School and was accepted as partial fulfillment of the requirements for the degree of Doctor of Philosophy.
December, 1985 Dean, College of Health Related
Professions
Madelyn Lockhart Dean, Graduate School


