Embed Size (px)
Citation preview
Nanofiltration of textile plant effluent for color removal andreduction in COD
S. Chakraborty, M.K. Purkait, S. DasGupta *, S. De, J.K. Basu
Department of Chemical Engineering Indian Institute of Technology, Kharagpur 721 302, India
Received 20 May 2002; received in revised form 30 August 2002; accepted 12 September 2002
Abstract
A membrane based separation process (nanofiltration, NF) is used to treat the effluent from a textile plant. The dye
mixture contains reactive black dye (Cibacron Black B) and reactive red dye (Cibacron Red RB). An organic membrane
with molecular weight cut-off of 400 is used for the experiments. The experiments are conducted in an unstirred batch
and a rectangular cross flow cell. Separations with retentions up to 94 and 92% of the two dyes are achieved respectively
in the cross flow cell where steady state is attained quickly. It is important to note that NF techniques achieve a sharp
reduction in chemical oxygen demand (COD), (up to 94% in cross flow cell), as the dyes are removed from the
permeate. A parametric study of the separation process is undertaken to characterize the effects of the operating
variables, e.g., trans-membrane pressure, dye concentration in the feed and cross flow velocity in case of cross flow NF.
# 2002 Elsevier Science B.V. All rights reserved.
Keywords: Nanofiltration; Cross flow; Textile effluent; Dye; Chemical oxygen demand
1. Introduction
Industrialization and urbanization have resulted
in rapid deterioration of water quality. The
scientific evidences prove that the effluents re-
leased from different industries e.g. textile, leather,
paint etc. comprise of different hazardous and
toxic compounds, some of which are known
carcinogens and others probable carcinogens.
The emergence of industrial centers without a
corresponding growth in civic amenities and
pollution control mechanisms results in a gradual
decay of water quality.
Textile industries, particularly those involved in
finishing processes are major water consumers and
the source of considerable pollution. The environ-
mental challenge for the textile industry is asso-
ciated with liquid waste, which tends to dominate
over air-emissions and solid wastes in terms of the
severity of environmental impacts. A typical textile
unit generates various types of wastewater differ-
ing in magnitude and quality. The wastewater
from printing and dyeing units in a textile plant are
often rich in color, containing residual of reactive
dyes and chemicals, and needs proper treatment
before releasing into the environment.
* Corresponding author. Tel.: �/91-03222-83922; fax: �/91-
03222-75303
E-mail address: [email protected] (S. DasGupta).
Separation and Purification Technology 31 (2003) 141�/151
www.elsevier.com/locate/seppur
1383-5866/02/$ - see front matter # 2002 Elsevier Science B.V. All rights reserved.
PII: S 1 3 8 3 - 5 8 6 6 ( 0 2 ) 0 0 1 7 7 - 6
Among the conventional methods for removal
of color from wastewater, viz. chemical coagula-
tion, flotation, chemical oxidation and adsorption
[1], adsorption is the most common technique. But
it is inherently a slow process and its performance
is limited by the equilibrium. Thus there is a
definite need to find alternative treatment pro-
cesses. Membrane techniques hold great promise
in this field, [2] as they have the potential to either
remove the dyestuff and allow reuse of the
auxiliary chemicals used for dyeing or to concen-
trate the dyestuffs and auxiliaries and produce
purified water. Microfiltration is suitable for
removing colloidal dyes from the exhausted dye
bath and the subsequent rinses. Ultrafiltration is
effective as single-step treatment of secondary
textile wastewater. Nanofiltration (NF) allows
the separation of low molecular weight (B/1000)
organic compounds and salts, with an appreciable
softening effect. Reverse osmosis (RO) is suitable
for removing ions and larger species from dye bath
effluents. The permeate produced is usually color-
less and low in total salinity.
Membrane based processes have been used to
treat the textile dye house effluent. The wastewater
from different washing and rinsing steps is treated
by RO [3]. Permeate is reused as washwater and
the retentate is either reused or discarded. Bran-
don et al. [4] and Porter and Goodman [5] used
dynamically formed Zirconium Oxide�/polyacry-
late membrane in tubular form to treat textile dye
house effluent. More than 95% of dye recovery
was observed. Similar results were obtained using
spiral-wound modules [6]. El-Nasher [7] studied
economic feasibility of using RO to treat dye
containing effluent. It was concluded that mem-
brane based separation processes are technically
and economically feasible processes to treat dye-
containing effluent. Nowak et al., [8,9] studied
cross flow ultrafiltration of a textile dye bath in a
tubular membrane and reported up to 97% dye (of
molecular weight �/780) removal and removal of
chemical oxygen demand (COD) and TOC by 75�/
85% and 50�/60%, respectively.
Yazhen et al. [10] had used NF for the treatment
of textile dye plant effluent. Experimental runs
with pure dye solutions as well as an industrial dye
solution confirmed the potential of the process.
Schrig and Widmer [11] undertook NF of a
mixture of dye salt and sodium chloride in a
spiral-wound module. Similarly, Yu et al. [12]
applied NF membrane technology for the desalt-
Nomenclature
C0 feed concentration (ppm)C1,0 concentration of dye 1 in feed (ppm)C2,0 concentration of dye 2 in feed (ppm)Cp permeate concentration (ppm)CFC cross flow cellCOD chemical oxygen demandCP concentration polarizationLp membrane permeability (m3/N s)NF nanofiltrationR0 observed retentionR0,1 observed retention for dye 1 (1�/Cp,1/C1,0)R0,2 observed retention for dye 2 (1�/Cp,2/C2,0)RO reverse osmosisTds total dissolved solidTS total solid contentu0 cross flow velocity (cm/s)UF ultrafiltrationVw permeate flux (m/s)
S. Chakraborty et al. / Separation and Purification Technology 31 (2003) 141�/151142
ing and concentrating of aqueous dye at a dyeproducing plant. The newly developed process
using NF was continuous in operation, was not
labor intensive, and produced a high purity
product of consistent quality.
Recently, Dhale and Mahajani [13] reported a
combined process of NF and wet oxidation to
treat the dye bath waste stream. Rejections up to
99% of color and 97% of COD were reported inNF and retentate was treated by wet oxidation
process. In the work of Van der Bruggen et al. [14]
different samples from the wastewater treatment
sequence of a textile factory were filtrated with
different NF membranes. It had been observed
that flux decline due to adsorption of organic
material on the membrane decreased the mem-
brane capacity by up to 73%, but the process waterflux, which is largely concentration dependent,
reached a stable value in all experiments. It was
concluded that membrane based separation pro-
cesses are technically and economically feasible
processes to treat dye-containing effluent.
However there are certain difficulties in predict-
ing membrane performance as the process is
influenced by several operating parameters. Oneof the most important drawbacks of the membrane
separation processes is the decline in flux due to
concentration polarization (CP) and membrane
fouling during the operation [15,16]. CP refers to
the build up of solute species within a thin
boundary layer adjacent to the membrane surface.
The accumulation of species at the membrane
surface adversely affects the membrane perfor-mance. Due to the limitations imposed by CP and
membrane fouling, there is a need for a detailed
study of the effects of the controlling parameters in
the process.
The present work is a part of a larger work,
which is the combined use of adsorption comple-
mented by NF in the treatment of colored
industrial effluent. It is envisaged that the bulkremoval of the dye will take place in an adsorption
unit, whereas removal of remaining amount (10�/
30 ppm approximately) will be handled in the NF
unit. The present effluent is a mixture of two
reactive dyes namely Cibacron black B and
Cibacron red RB which have been used in dyeing
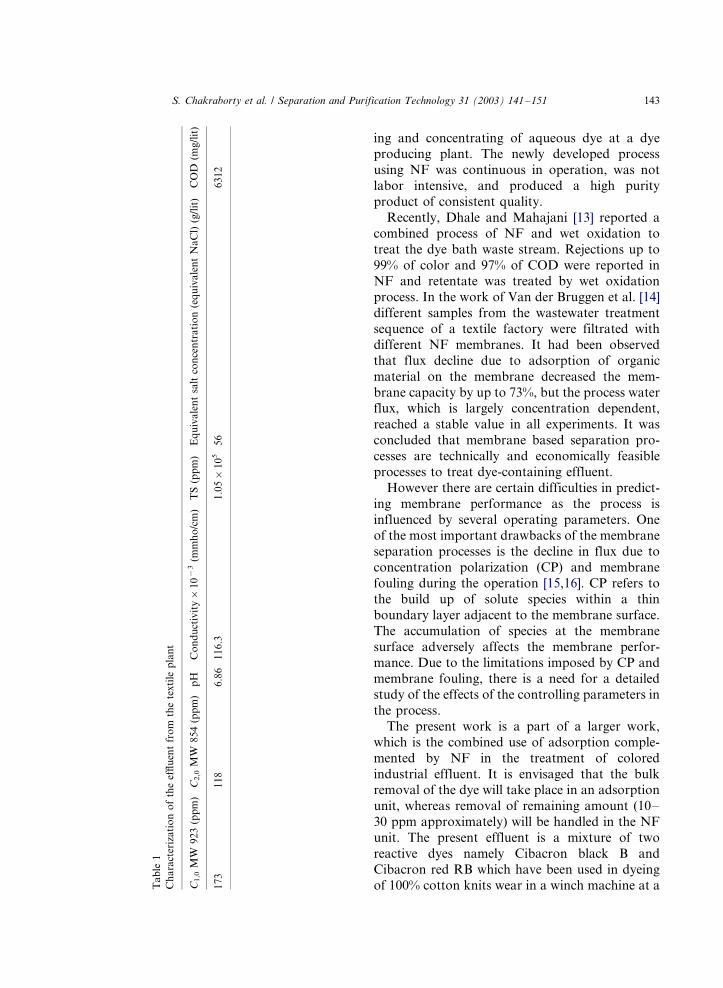
of 100% cotton knits wear in a winch machine at aTa
ble
1
Ch
ara
cter
izati
on
of
the
effl
uen
tfr
om
the
tex
tile
pla
nt
C1,0
MW
92
3(p
pm
)C
2,0
MW
85
4(p
pm
)p
HC
on
du
ctiv
ity�
/10�
3(m
mh
o/c
m)
TS
(pp
m)
Eq
uiv
ale
nt
salt
con
cen
tra
tio
n(e
qu
iva
len
tN
aC
l)(g
/lit
)C
OD
(mg
/lit
)
17
31
18
6.8
61
16
.31
.05�
/10
55
66
31
2
S. Chakraborty et al. / Separation and Purification Technology 31 (2003) 141�/151 143
hosiery dye house, Singhal Brothers’, located atTangra, Kolkata. In this work, an extensive study
has been carried out to observe the effects of the
process parameters like applied pressure, bulk
velocity and feed concentration in the NF of the
effluent. Two different process configurations,
namely, unstirred batch cell and cross flow cell
have been used. Solution mixture characteristics
e.g., pH, total dissolved solid, conductivity etc. ofthe feed, permeate and retentate streams have been
measured at different operating conditions.
2. Experimental
2.1. Materials
2.1.1. Dyes
The present industrial effluent, which has been
collected from a textile dye house, contains a
mixture of two reactive dyes, namely Cibacron
Black B and Cibacron Red RB, which will be
denoted by dye 1 and 2 respectively in the rest of
the paper. The molecular weights of the two dyes
are 923 and 854, respectively. The characterizationof feed effluent is presented in Table 1.
2.1.2. Membrane
An organic membrane (thin film composite
polyamide) of molecular weight cut-off 400, sup-
plied by M/s Permionics, Baroda was used in the
experiments.
2.2. System configuration
2.2.1. Unstirred batch cell
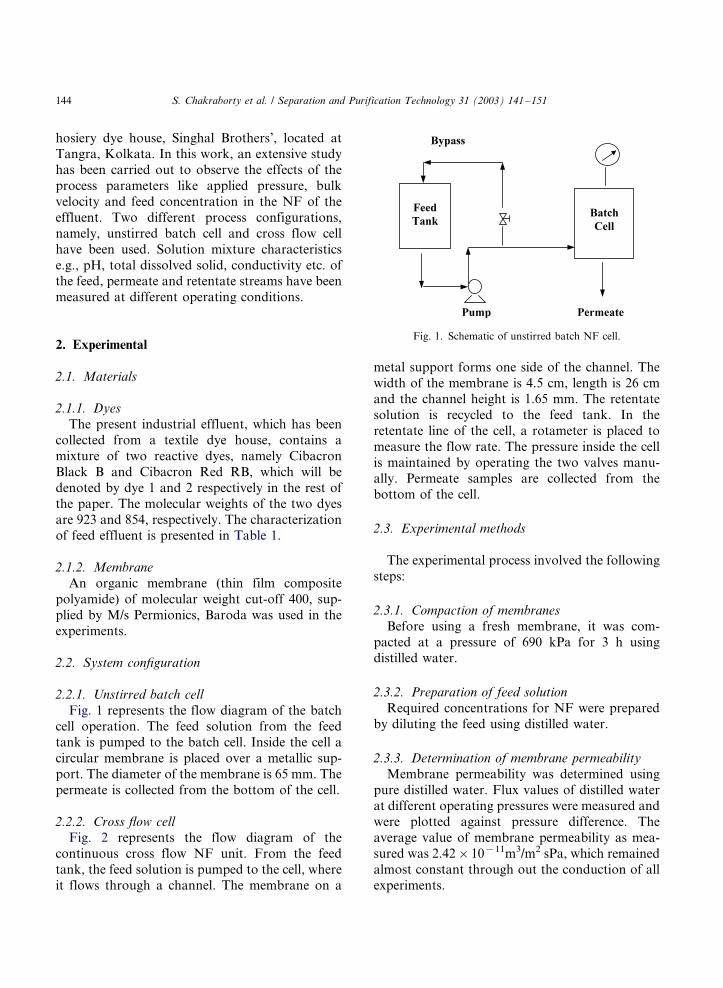
Fig. 1 represents the flow diagram of the batch
cell operation. The feed solution from the feed
tank is pumped to the batch cell. Inside the cell a
circular membrane is placed over a metallic sup-
port. The diameter of the membrane is 65 mm. The
permeate is collected from the bottom of the cell.
2.2.2. Cross flow cell
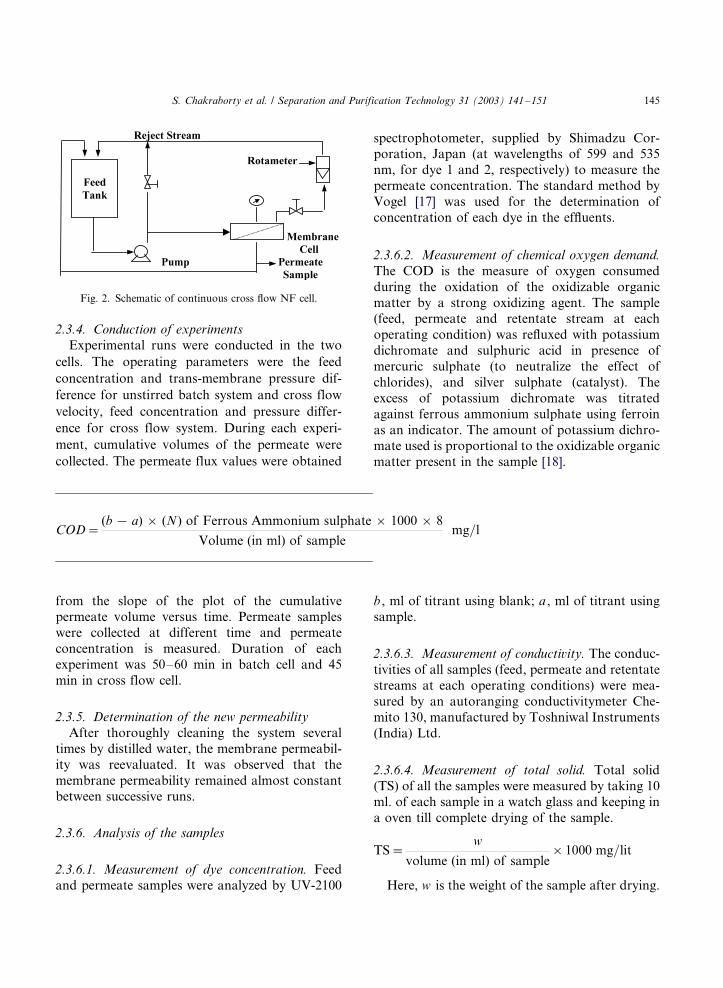
Fig. 2 represents the flow diagram of the
continuous cross flow NF unit. From the feed
tank, the feed solution is pumped to the cell, where
it flows through a channel. The membrane on a
metal support forms one side of the channel. The
width of the membrane is 4.5 cm, length is 26 cmand the channel height is 1.65 mm. The retentate
solution is recycled to the feed tank. In the
retentate line of the cell, a rotameter is placed to
measure the flow rate. The pressure inside the cell
is maintained by operating the two valves manu-
ally. Permeate samples are collected from the
bottom of the cell.
2.3. Experimental methods
The experimental process involved the following
steps:
2.3.1. Compaction of membranes
Before using a fresh membrane, it was com-
pacted at a pressure of 690 kPa for 3 h usingdistilled water.
2.3.2. Preparation of feed solution
Required concentrations for NF were prepared
by diluting the feed using distilled water.
2.3.3. Determination of membrane permeability
Membrane permeability was determined using
pure distilled water. Flux values of distilled waterat different operating pressures were measured and
were plotted against pressure difference. The
average value of membrane permeability as mea-
sured was 2.42�/10�11m3/m2 sPa, which remained
almost constant through out the conduction of all
experiments.
Fig. 1. Schematic of unstirred batch NF cell.
S. Chakraborty et al. / Separation and Purification Technology 31 (2003) 141�/151144
2.3.4. Conduction of experiments
Experimental runs were conducted in the two
cells. The operating parameters were the feed
concentration and trans-membrane pressure dif-
ference for unstirred batch system and cross flow
velocity, feed concentration and pressure differ-
ence for cross flow system. During each experi-
ment, cumulative volumes of the permeate were
collected. The permeate flux values were obtained
from the slope of the plot of the cumulativepermeate volume versus time. Permeate samples
were collected at different time and permeate
concentration is measured. Duration of each
experiment was 50�/60 min in batch cell and 45
min in cross flow cell.
2.3.5. Determination of the new permeability
After thoroughly cleaning the system several
times by distilled water, the membrane permeabil-
ity was reevaluated. It was observed that the
membrane permeability remained almost constantbetween successive runs.
2.3.6. Analysis of the samples
2.3.6.1. Measurement of dye concentration. Feed
and permeate samples were analyzed by UV-2100
spectrophotometer, supplied by Shimadzu Cor-poration, Japan (at wavelengths of 599 and 535
nm, for dye 1 and 2, respectively) to measure the
permeate concentration. The standard method by
Vogel [17] was used for the determination of
concentration of each dye in the effluents.
2.3.6.2. Measurement of chemical oxygen demand.
The COD is the measure of oxygen consumed
during the oxidation of the oxidizable organic
matter by a strong oxidizing agent. The sample(feed, permeate and retentate stream at each
operating condition) was refluxed with potassium
dichromate and sulphuric acid in presence of
mercuric sulphate (to neutralize the effect of
chlorides), and silver sulphate (catalyst). The
excess of potassium dichromate was titrated
against ferrous ammonium sulphate using ferroin
as an indicator. The amount of potassium dichro-mate used is proportional to the oxidizable organic
matter present in the sample [18].
b , ml of titrant using blank; a , ml of titrant usingsample.
2.3.6.3. Measurement of conductivity. The conduc-
tivities of all samples (feed, permeate and retentate
streams at each operating conditions) were mea-
sured by an autoranging conductivitymeter Che-
mito 130, manufactured by Toshniwal Instruments
(India) Ltd.
2.3.6.4. Measurement of total solid. Total solid
(TS) of all the samples were measured by taking 10
ml. of each sample in a watch glass and keeping in
a oven till complete drying of the sample.
TS�w
volume (in ml) of sample�1000 mg=lit
Here, w is the weight of the sample after drying.
Fig. 2. Schematic of continuous cross flow NF cell.
COD�(b � a) � (N) of Ferrous Ammonium sulphate � 1000 � 8
Volume (in ml) of samplemg=l
S. Chakraborty et al. / Separation and Purification Technology 31 (2003) 141�/151 145
2.3.6.5. Measurement of pH. After each experi-ment, pH of the samples was measured, by a pH-
meter, supplied by Toshniwal Instruments (India)
Ltd.
2.4. Operating conditions
2.4.1. Batch cell
For batch cell, three feed concentrations areused. These are a mixture of (i) 25, 15 ppm (ii) 13,
7 ppm and (iii) 20, 10 ppm of the dye 1 and 2,
respectively. In the subsequent tables and figures
C1,0 and C2,0 refer to the feed concentrations of
dye 1 and 2, respectively. The operating pressures
selected are 276, 484, 550 kPa.
2.4.2. Cross flow cell
Two feed concentrations are chosen for experi-
ments (i) 25, 15 ppm and (ii) 13, 7 ppm of the dye 1
and 2, respectively. Cross flow velocities are 14, 21
and 28 cm/s and applied pressures are 276, 415 and
550 kPa.
3. Results and discussions
3.1. Batch cell
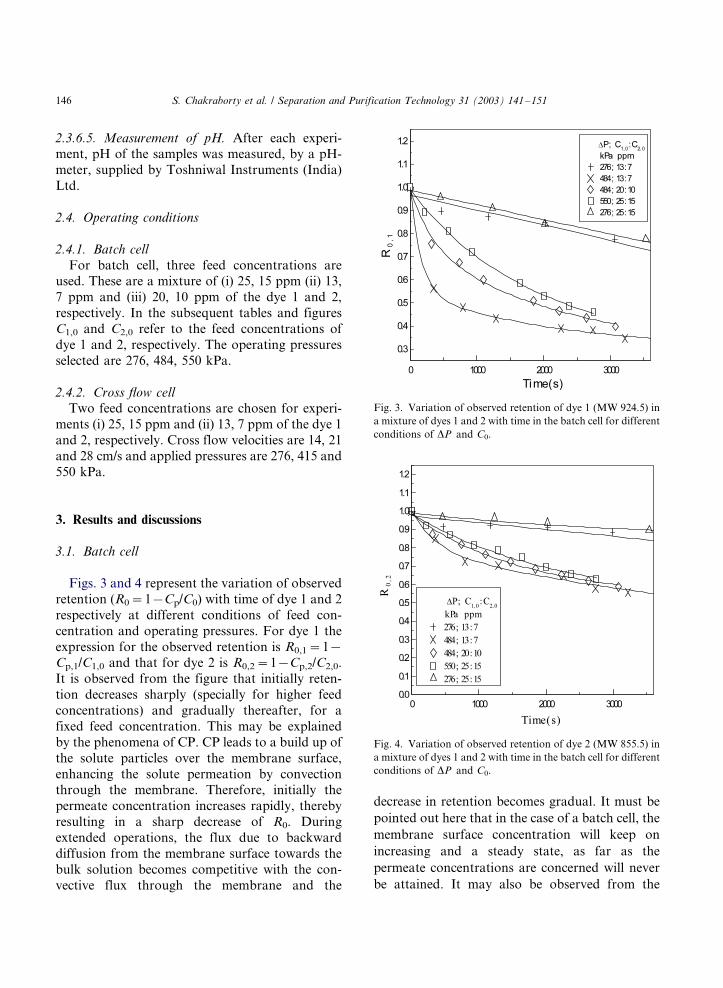
Figs. 3 and 4 represent the variation of observed
retention (R0�/1�/Cp/C0) with time of dye 1 and 2
respectively at different conditions of feed con-
centration and operating pressures. For dye 1 the
expression for the observed retention is R0,1�/1�/
Cp,1/C1,0 and that for dye 2 is R0,2�/1�/Cp,2/C2,0.
It is observed from the figure that initially reten-
tion decreases sharply (specially for higher feed
concentrations) and gradually thereafter, for a
fixed feed concentration. This may be explained
by the phenomena of CP. CP leads to a build up of
the solute particles over the membrane surface,
enhancing the solute permeation by convectionthrough the membrane. Therefore, initially the
permeate concentration increases rapidly, thereby
resulting in a sharp decrease of R0. During
extended operations, the flux due to backward
diffusion from the membrane surface towards the
bulk solution becomes competitive with the con-
vective flux through the membrane and the
decrease in retention becomes gradual. It must be
pointed out here that in the case of a batch cell, the
membrane surface concentration will keep on
increasing and a steady state, as far as the
permeate concentrations are concerned will never
be attained. It may also be observed from the
Fig. 3. Variation of observed retention of dye 1 (MW 924.5) in
a mixture of dyes 1 and 2 with time in the batch cell for different
conditions of DP and C0.
Fig. 4. Variation of observed retention of dye 2 (MW 855.5) in
a mixture of dyes 1 and 2 with time in the batch cell for different
conditions of DP and C0.
S. Chakraborty et al. / Separation and Purification Technology 31 (2003) 141�/151146
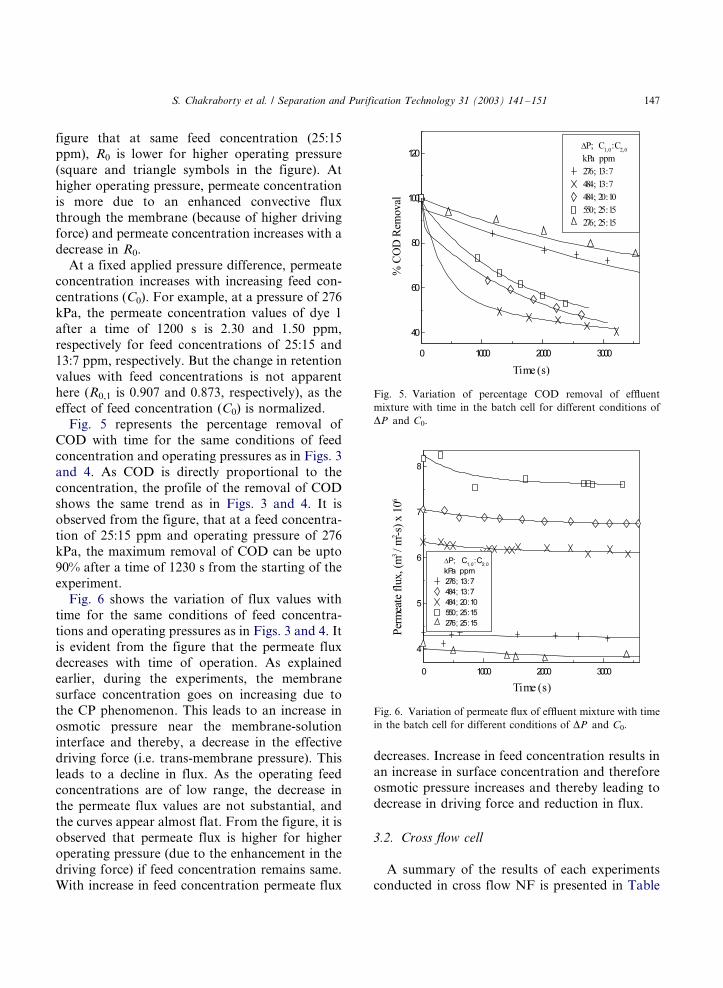
figure that at same feed concentration (25:15ppm), R0 is lower for higher operating pressure
(square and triangle symbols in the figure). At
higher operating pressure, permeate concentration
is more due to an enhanced convective flux
through the membrane (because of higher driving
force) and permeate concentration increases with a
decrease in R0.
At a fixed applied pressure difference, permeateconcentration increases with increasing feed con-
centrations (C0). For example, at a pressure of 276
kPa, the permeate concentration values of dye 1
after a time of 1200 s is 2.30 and 1.50 ppm,
respectively for feed concentrations of 25:15 and
13:7 ppm, respectively. But the change in retention
values with feed concentrations is not apparent
here (R0,1 is 0.907 and 0.873, respectively), as theeffect of feed concentration (C0) is normalized.
Fig. 5 represents the percentage removal of
COD with time for the same conditions of feed
concentration and operating pressures as in Figs. 3
and 4. As COD is directly proportional to the
concentration, the profile of the removal of COD
shows the same trend as in Figs. 3 and 4. It is
observed from the figure, that at a feed concentra-tion of 25:15 ppm and operating pressure of 276
kPa, the maximum removal of COD can be upto
90% after a time of 1230 s from the starting of the
experiment.
Fig. 6 shows the variation of flux values with
time for the same conditions of feed concentra-
tions and operating pressures as in Figs. 3 and 4. It
is evident from the figure that the permeate fluxdecreases with time of operation. As explained
earlier, during the experiments, the membrane
surface concentration goes on increasing due to
the CP phenomenon. This leads to an increase in
osmotic pressure near the membrane-solution
interface and thereby, a decrease in the effective
driving force (i.e. trans-membrane pressure). This
leads to a decline in flux. As the operating feedconcentrations are of low range, the decrease in
the permeate flux values are not substantial, and
the curves appear almost flat. From the figure, it is
observed that permeate flux is higher for higher
operating pressure (due to the enhancement in the
driving force) if feed concentration remains same.
With increase in feed concentration permeate flux
decreases. Increase in feed concentration results in
an increase in surface concentration and therefore
osmotic pressure increases and thereby leading to
decrease in driving force and reduction in flux.
3.2. Cross flow cell
A summary of the results of each experiments
conducted in cross flow NF is presented in Table
Fig. 5. Variation of percentage COD removal of effluent
mixture with time in the batch cell for different conditions of
DP and C0.
Fig. 6. Variation of permeate flux of effluent mixture with time
in the batch cell for different conditions of DP and C0.
S. Chakraborty et al. / Separation and Purification Technology 31 (2003) 141�/151 147
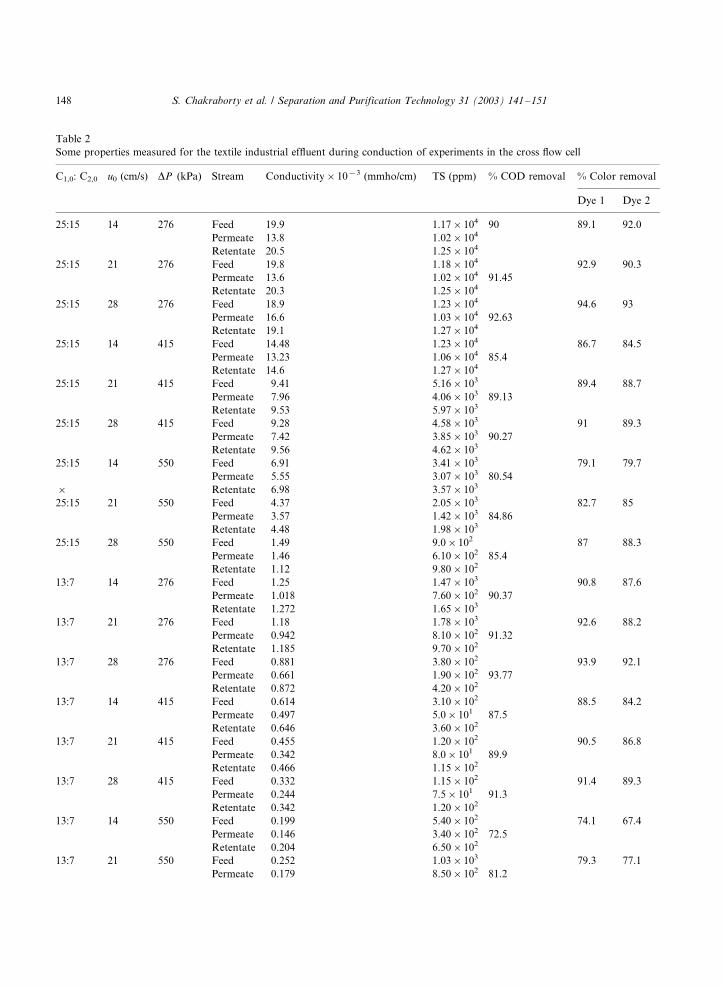
Table 2
Some properties measured for the textile industrial effluent during conduction of experiments in the cross flow cell
C1,0: C2,0 u0 (cm/s) DP (kPa) Stream Conductivity�/10�3 (mmho/cm) TS (ppm) % COD removal % Color removal
Dye 1 Dye 2
25:15 14 276 Feed 19.9 1.17�/104 90 89.1 92.0
Permeate 13.8 1.02�/104
Retentate 20.5 1.25�/104
25:15 21 276 Feed 19.8 1.18�/104 92.9 90.3
Permeate 13.6 1.02�/104 91.45
Retentate 20.3 1.25�/104
25:15 28 276 Feed 18.9 1.23�/104 94.6 93
Permeate 16.6 1.03�/104 92.63
Retentate 19.1 1.27�/104
25:15 14 415 Feed 14.48 1.23�/104 86.7 84.5
Permeate 13.23 1.06�/104 85.4
Retentate 14.6 1.27�/104
25:15 21 415 Feed 9.41 5.16�/103 89.4 88.7
Permeate 7.96 4.06�/103 89.13
Retentate 9.53 5.97�/103
25:15 28 415 Feed 9.28 4.58�/103 91 89.3
Permeate 7.42 3.85�/103 90.27
Retentate 9.56 4.62�/103
25:15 14 550 Feed 6.91 3.41�/103 79.1 79.7
Permeate 5.55 3.07�/103 80.54
�/ Retentate 6.98 3.57�/103
25:15 21 550 Feed 4.37 2.05�/103 82.7 85
Permeate 3.57 1.42�/103 84.86
Retentate 4.48 1.98�/103
25:15 28 550 Feed 1.49 9.0�/102 87 88.3
Permeate 1.46 6.10�/102 85.4
Retentate 1.12 9.80�/102
13:7 14 276 Feed 1.25 1.47�/103 90.8 87.6
Permeate 1.018 7.60�/102 90.37
Retentate 1.272 1.65�/103
13:7 21 276 Feed 1.18 1.78�/103 92.6 88.2
Permeate 0.942 8.10�/102 91.32
Retentate 1.185 9.70�/102
13:7 28 276 Feed 0.881 3.80�/102 93.9 92.1
Permeate 0.661 1.90�/102 93.77
Retentate 0.872 4.20�/102
13:7 14 415 Feed 0.614 3.10�/102 88.5 84.2
Permeate 0.497 5.0�/101 87.5
Retentate 0.646 3.60�/102
13:7 21 415 Feed 0.455 1.20�/102 90.5 86.8
Permeate 0.342 8.0�/101 89.9
Retentate 0.466 1.15�/102
13:7 28 415 Feed 0.332 1.15�/102 91.4 89.3
Permeate 0.244 7.5�/101 91.3
Retentate 0.342 1.20�/102
13:7 14 550 Feed 0.199 5.40�/102 74.1 67.4
Permeate 0.146 3.40�/102 72.5
Retentate 0.204 6.50�/102
13:7 21 550 Feed 0.252 1.03�/103 79.3 77.1
Permeate 0.179 8.50�/102 81.2
S. Chakraborty et al. / Separation and Purification Technology 31 (2003) 141�/151148
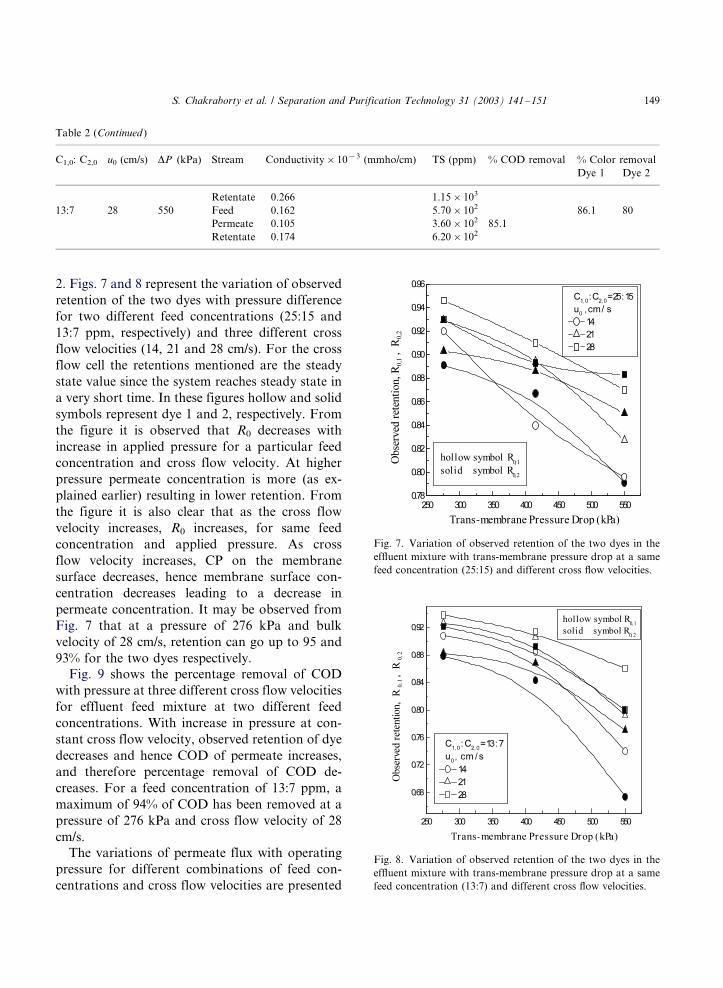
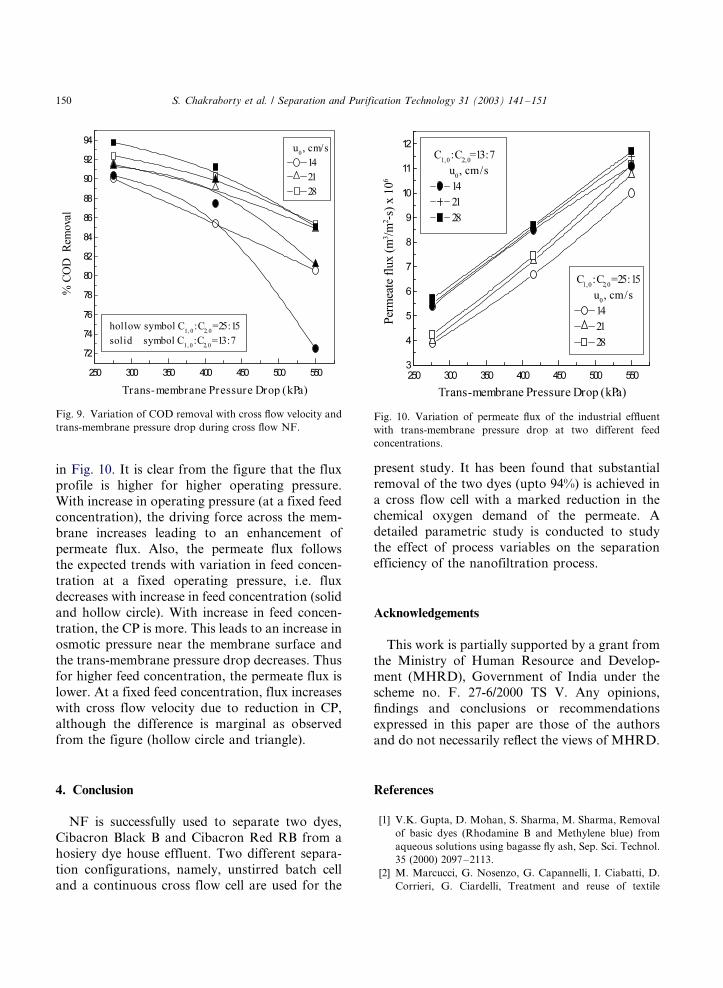
2. Figs. 7 and 8 represent the variation of observed
retention of the two dyes with pressure difference
for two different feed concentrations (25:15 and
13:7 ppm, respectively) and three different cross
flow velocities (14, 21 and 28 cm/s). For the cross
flow cell the retentions mentioned are the steady
state value since the system reaches steady state in
a very short time. In these figures hollow and solid
symbols represent dye 1 and 2, respectively. From
the figure it is observed that R0 decreases with
increase in applied pressure for a particular feed
concentration and cross flow velocity. At higher
pressure permeate concentration is more (as ex-
plained earlier) resulting in lower retention. From
the figure it is also clear that as the cross flow
velocity increases, R0 increases, for same feed
concentration and applied pressure. As cross
flow velocity increases, CP on the membrane
surface decreases, hence membrane surface con-
centration decreases leading to a decrease in
permeate concentration. It may be observed from
Fig. 7 that at a pressure of 276 kPa and bulk
velocity of 28 cm/s, retention can go up to 95 and
93% for the two dyes respectively.
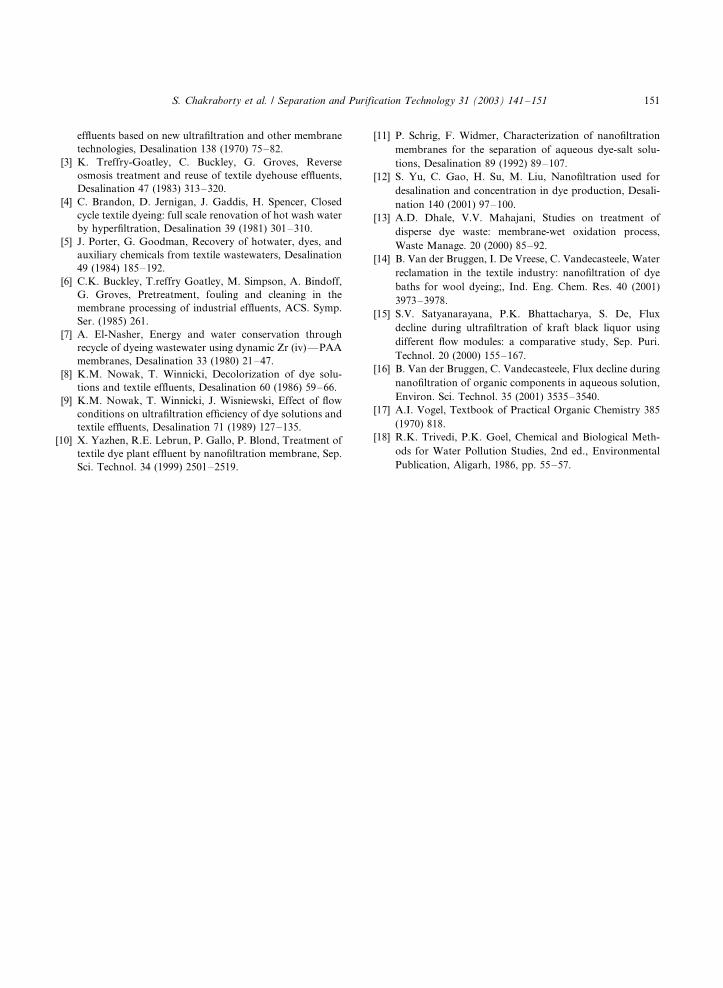
Fig. 9 shows the percentage removal of COD
with pressure at three different cross flow velocities
for effluent feed mixture at two different feed
concentrations. With increase in pressure at con-
stant cross flow velocity, observed retention of dye
decreases and hence COD of permeate increases,
and therefore percentage removal of COD de-
creases. For a feed concentration of 13:7 ppm, a
maximum of 94% of COD has been removed at a
pressure of 276 kPa and cross flow velocity of 28
cm/s.
The variations of permeate flux with operating
pressure for different combinations of feed con-
centrations and cross flow velocities are presented
Table 2 (Continued )
C1,0: C2,0 u0 (cm/s) DP (kPa) Stream Conductivity�/10�3 (mmho/cm) TS (ppm) % COD removal % Color removal
Dye 1 Dye 2
Retentate 0.266 1.15�/103
13:7 28 550 Feed 0.162 5.70�/102 86.1 80
Permeate 0.105 3.60�/102 85.1
Retentate 0.174 6.20�/102
Fig. 7. Variation of observed retention of the two dyes in the
effluent mixture with trans-membrane pressure drop at a same
feed concentration (25:15) and different cross flow velocities.
Fig. 8. Variation of observed retention of the two dyes in the
effluent mixture with trans-membrane pressure drop at a same
feed concentration (13:7) and different cross flow velocities.
S. Chakraborty et al. / Separation and Purification Technology 31 (2003) 141�/151 149
in Fig. 10. It is clear from the figure that the flux
profile is higher for higher operating pressure.
With increase in operating pressure (at a fixed feedconcentration), the driving force across the mem-
brane increases leading to an enhancement of
permeate flux. Also, the permeate flux follows
the expected trends with variation in feed concen-
tration at a fixed operating pressure, i.e. flux
decreases with increase in feed concentration (solid
and hollow circle). With increase in feed concen-
tration, the CP is more. This leads to an increase inosmotic pressure near the membrane surface and
the trans-membrane pressure drop decreases. Thus
for higher feed concentration, the permeate flux is
lower. At a fixed feed concentration, flux increases
with cross flow velocity due to reduction in CP,
although the difference is marginal as observed
from the figure (hollow circle and triangle).
4. Conclusion
NF is successfully used to separate two dyes,
Cibacron Black B and Cibacron Red RB from a
hosiery dye house effluent. Two different separa-
tion configurations, namely, unstirred batch cell
and a continuous cross flow cell are used for the
present study. It has been found that substantial
removal of the two dyes (upto 94%) is achieved in
a cross flow cell with a marked reduction in the
chemical oxygen demand of the permeate. A
detailed parametric study is conducted to studythe effect of process variables on the separation
efficiency of the nanofiltration process.
Acknowledgements
This work is partially supported by a grant from
the Ministry of Human Resource and Develop-ment (MHRD), Government of India under the
scheme no. F. 27-6/2000 TS V. Any opinions,
findings and conclusions or recommendations
expressed in this paper are those of the authors
and do not necessarily reflect the views of MHRD.
References
[1] V.K. Gupta, D. Mohan, S. Sharma, M. Sharma, Removal
of basic dyes (Rhodamine B and Methylene blue) from
aqueous solutions using bagasse fly ash, Sep. Sci. Technol.
35 (2000) 2097�/2113.
[2] M. Marcucci, G. Nosenzo, G. Capannelli, I. Ciabatti, D.
Corrieri, G. Ciardelli, Treatment and reuse of textile
Fig. 9. Variation of COD removal with cross flow velocity and
trans-membrane pressure drop during cross flow NF.Fig. 10. Variation of permeate flux of the industrial effluent
with trans-membrane pressure drop at two different feed
concentrations.
S. Chakraborty et al. / Separation and Purification Technology 31 (2003) 141�/151150
effluents based on new ultrafiltration and other membrane
technologies, Desalination 138 (1970) 75�/82.
[3] K. Treffry-Goatley, C. Buckley, G. Groves, Reverse
osmosis treatment and reuse of textile dyehouse effluents,
Desalination 47 (1983) 313�/320.
[4] C. Brandon, D. Jernigan, J. Gaddis, H. Spencer, Closed
cycle textile dyeing: full scale renovation of hot wash water
by hyperfiltration, Desalination 39 (1981) 301�/310.
[5] J. Porter, G. Goodman, Recovery of hotwater, dyes, and
auxiliary chemicals from textile wastewaters, Desalination
49 (1984) 185�/192.
[6] C.K. Buckley, T.reffry Goatley, M. Simpson, A. Bindoff,
G. Groves, Pretreatment, fouling and cleaning in the
membrane processing of industrial effluents, ACS. Symp.
Ser. (1985) 261.
[7] A. El-Nasher, Energy and water conservation through
recycle of dyeing wastewater using dynamic Zr (iv)*/PAA
membranes, Desalination 33 (1980) 21�/47.
[8] K.M. Nowak, T. Winnicki, Decolorization of dye solu-
tions and textile effluents, Desalination 60 (1986) 59�/66.
[9] K.M. Nowak, T. Winnicki, J. Wisniewski, Effect of flow
conditions on ultrafiltration efficiency of dye solutions and
textile effluents, Desalination 71 (1989) 127�/135.
[10] X. Yazhen, R.E. Lebrun, P. Gallo, P. Blond, Treatment of
textile dye plant effluent by nanofiltration membrane, Sep.
Sci. Technol. 34 (1999) 2501�/2519.
[11] P. Schrig, F. Widmer, Characterization of nanofiltration
membranes for the separation of aqueous dye-salt solu-
tions, Desalination 89 (1992) 89�/107.
[12] S. Yu, C. Gao, H. Su, M. Liu, Nanofiltration used for
desalination and concentration in dye production, Desali-
nation 140 (2001) 97�/100.
[13] A.D. Dhale, V.V. Mahajani, Studies on treatment of
disperse dye waste: membrane-wet oxidation process,
Waste Manage. 20 (2000) 85�/92.
[14] B. Van der Bruggen, I. De Vreese, C. Vandecasteele, Water
reclamation in the textile industry: nanofiltration of dye
baths for wool dyeing;, Ind. Eng. Chem. Res. 40 (2001)
3973�/3978.
[15] S.V. Satyanarayana, P.K. Bhattacharya, S. De, Flux
decline during ultrafiltration of kraft black liquor using
different flow modules: a comparative study, Sep. Puri.
Technol. 20 (2000) 155�/167.
[16] B. Van der Bruggen, C. Vandecasteele, Flux decline during
nanofiltration of organic components in aqueous solution,
Environ. Sci. Technol. 35 (2001) 3535�/3540.
[17] A.I. Vogel, Textbook of Practical Organic Chemistry 385
(1970) 818.
[18] R.K. Trivedi, P.K. Goel, Chemical and Biological Meth-
ods for Water Pollution Studies, 2nd ed., Environmental
Publication, Aligarh, 1986, pp. 55�/57.
S. Chakraborty et al. / Separation and Purification Technology 31 (2003) 141�/151 151


