Embed Size (px)
Citation preview
NASA CR-112082
,/
THERMOPHYSlCAL CHARACTERIZATION OF COMPOSITE MATERIALS
UNDER TRANSIENT HEATING CONDITIONS
By J. Roetling and J. Hanson
Prepared under Contract No. NAS1-10805 by
GENERAL ELECTRIC COMPANY
Re-entry and Environmental Systems Division
Philadelphia, Pennsylvania 19101
for
i NATIONAL AERONAUTICS AND SPACE ADMINISTRATION
(_AsA-CR-1 12082)CBARAcTERIZATIO_
U_DBR TB_SIEBT
_oetlinq, et al
.[1972] 132 P
RMOPH¥SICAL
HE_TI_G cONDiTIOnS J"
{General Elect_ic Co.)cscL 11D G3/18
0nclaS31390
J
i
PRECEDING PAGE BLANK NOT FILMED
CONTENTS
Section Page
Illustrations ......................................... v
Symbols ............................................. xi
SUMMARY ..... 1
MATERIALS .......................................... 7
ATJ Graphite ...................................... 7
Carbitex 700 ...................................... 7
RPP-4 ........................................... 8
MX 2600 Silica Phenolic ............................... 8
FM 5272 Cellulose Phenolic ............................ 8
TEST METHODS ...................................... 9
Thermal expansion .................................. 9
Restrained Expansion Tests ............................ 14
Strength Measurement ................................ 21
Compression Measurements ............................ 21
Transient Thermal Conductivity Test ...................... 21
Analytic base of the GE-RESD transient numerical
thermal conductivity technique ....................... 24
Sample geometry ................................. 26
Experimental procedure ............................ 27
Data Reduction .................................. 28
-- 35TEST RESULTS .......................................
Measurements on ATJ Graphite .......................... 35
Free thermal expansion of ATJ ....................... 35
Restrained expansion of ATJ ......................... 36
Transient thermal conductivity of ATJ .................. 37
Measurements on MX 2600 ...................... ....... 37
Free thermal expansion of MX 2600 .................... 42
Restrained expansion of MX 2600 ...................... 42
Strength measurements on MX 2600 .................... 44
Transient thermal conductivity of MX 2600 char ............ 44
Measurements on FM 5272 ............................. 45
Free thermal expansion of FM 5272 .................... 45
Restrained expansion of FM 5272 ...................... 45
Strength measurements on FM 5272 .................... 75
Transient thermal conductivity of FM 5272 char ............ 75
iii
CONTENTS(Continued)
Section Page
TEST RESULTS (continued)
Measurements on Carbitex 700 ............................ 83
Free thermal expansion of Carbitex 700 .................... 83
Restrained thermal expansion of Carbitex 700 ................ 84
Compressive stress-strain of Carbitex 700 ................. 85
Strength measurements on Carbitex 700 ................... 85
Transient thermal conductivity of Carbitex 700 ............... 86
Measurements on RPP-4 ................................ 97
Free thermal expansion RPP-4 ......................... 97
Restrained thermal expansion of RPP-4 ................... 98
Compression stress=strain tests on RPP-4 ................. 98
Strength measurements on RPP-4 ....................... 100
Transient thermal conductivity of RPP-4 ................... 102UTILIZATION OF TRANSIENT DATA IN THERMO-STRUCTURAL
ANALYSIS .......................................... 111
CONCLUSIONS ......................................... 113
ATJ Graphite ....................................... 113
MX 2600 Silica Phenolic ................................ 113
EM 5272 Cellulose Phenolic ............................. 114
Carbitex 700 ....................................... 114
RPP-4 ............................................ 115
General .......................................... 115
APPENDIX ........................................... 117
REFERENCES ......................................... 119
iv
/
L
T
Figure
1
2
5
6
7
8
9
10
11
12
13
14
15
16
17
18
19
20
21
22
-23
24
25
26
27
28
29
3O
IL LUS TRA TIONS
Page
A Hypothetical Thermal Expansion Curve for Defining Terms ...... 11
Experimental Arrangement for High Heating Rate Thermal
Expansion Measurements .......................... 12
High Heating Rate Dilatometer ........................... 12
Close-up of Specimen and Induction Coil; High Heating Rate
Dilatometer ................................... 13
Thermal Expansion Test on Nickel ........................ 13
MTI Servo-Controlled Electro-hydraulic Test Machine ........... 18
Basic Control Circuit for the Restrained Expansion Test ......... 18
Loading Arrangement, Restrained Expansion Test ............. 19
Close-up of Restrained Expansion Specimen in the Test Machine .... ] 9
Coaxial Extensometer ................................ 20
Stress-Strain Relations in the Restrained Expansion Test ........ 20
Tensile Specimen .................................. 22
Tensile Specimen with Unassembled Grips ................... 22
Transient Thermal Conductivity Model ..................... 31
Unassembled Specimen Holder and Specimen; Transient Thermal
Conductivity Test ................................ 32
Instrumented Transient Thermal Conductivity Model ............ 32
Small Arc Facility, Showing the Specimen Mounted on the Pneumat-" 33ically Activated Sting • . ............................
Hyperthermal Arc Facility, Showing the Dual Specimen Setup ...... 33
Data Reduction Technique, Thermal Conductivity .............. 34
Thermal Expansio_i of ATJ Graphite, with Grain, at T=0. 033 K/s... 35
Thermal Expansion of ATJ, with Grain, Comparison of Static
and Transient Methods .............................. 38
Effective Thermal Expansion of ATJ, with Grain, T=27.8 K/s,
R=55% ......................................... 39
Effective Thermal Expansion of ATJ, with Grain, T=27.8 K/s,
R=75% .......................................... 39
Effective Thermal Expansion of ATJ, with Grain, Comparison,
Showing Effect of Restraint ........................... 40
Modulus of Restrained ATJ Graphite, with Grain .............. 40
Thermal Conductivity of ATJ, Perpendicular to Grain ........... 41
Heating Rate Data for ATJ Thermal Conductivity Test ........... 41
Thermal Expansion of MX 2600 With Lamina, Low Heating Rate
Rate (0. 033 K/s) ................................... 46
Thermal Expansion of M:X 2600 Across Lamina, Low Heating
Rate ........................................... 46
Thermal Expansion of MX 2600, Comparison of With and AcrossLamina . 47
• • • • • • • • • • • o • • • • • • • • • • • • • * • • • e • • • • o • • • Q • o
v
Figure
31
32
33
34
35
36
37
38
39
40
41
42
43
44
45
46
47
48
49
ILLUSTRATIONS (Continued)
Page
Restrained Expansmn of
Heating rate = 2.9 K/s
Restrained Expansmn of
Heating rate = 2.9 K/s
Restrained Expansion of
Heating rate = 5.0 K/s
Restrained Expansion of
Heating rate = 5.0 K/s
Restrained Expansion of
Heating rate = 2.9 K/s
Restrained Expansion of
Heating rate = 2.9 K/s
Restrained Expansion of
Heating rate = 5.0 K/s
Restrained Expansmn of
Thermal Expansion of MX 2600, With Lamina at
5.55 K/s (60¢ F/min) ............................. 47
Thermal Expansion of MX 2600, With Lamina at
13.9 K/s (1500 _ F/min) ............................ 48
Thermal Expansion of M:X 2600, Effect of Heating
Rate, With Lamina ............................... 48
MX 2600, With Lamina,
(31¢ F/rain) R = 65% 49
MX 2600, With Lamina,
(310 _ F/min) R = 30% .............. 49
MX 2600, With Lamina,
(54¢ F/min ) R = 65% 50• • • • • • • • • • • • • • •
MX 2600, With Lamina,
(540 _ F/rain ) R = 30% 50
MX 2600, Across Lamina,
(310 _ F/min) R = 85% 51
MX 2600, Across Lamina,
(310 _ F/min) R = 55% .............. 51
MX 2600, Across Lamina,
(540 _ F/min) R = 65% 52• • $ • • • • • • • • • • o
MX 2600, Across Lamina,
Heating rate = 5.0 K/s (540 _ F/min) R = 60% .............. 52
Effect of Restraint and Heating Rate on Effective Thermal
Expansion of MX 2600, With Lamina .................... 53
Effect of Restraint and Heating Rate on Effective Thermal
Expansion of MX 2600, Across Lamina .................. 53
MX 2600 Specimen after Testing at High Heating Rate and
High Restraint (Note two "Blow outs") 54m • • • • • • • • • • • • • • • • • • •
Restrained Expansion Tests on Thick Walled Specimen
MX 2600, with Lamina, Heating Rate = 2.9 K/s R = 30% ...... 54
Modulus of Restrained MX 2600, With Lamina,
Heating Rate = 2.9 K/s (310 _ F/min) R = 65% .............. 55
Modulus of Restrained MX 2600, With Lamina,
Heating Rate = 2.9 K/s (310 ° F/min) R = 30% .............. 55
Modulus of Restrained MX 2600, With Lamina,
Heating Rate = 5.0 K/s (540 ° F/min) R = 65% .............. 56
Modulus of Restrained MX 2600, With Lamina,
Heating Rate = 5.0 K/s (540 ° F/min) R = 30% .............. 56
vi
Figure
50
51
52
53
54
55
56
57
58
59
6O
61
62
63
64
65
66
67
68
69
ILLUSTRATIONS (Continued)
Page
Modulus of Restrained MX 2600, Across Lamina
Heating Rate = 2.9 K/s (310 ° F/min) R = 85% ............... 57
Modulus of Restrained MX 2600, Across Lamina
Heating Rate = 2.9 K/s (310 _ F/min) R = 55% ............... 57
Modulus of Restrained MX 2600, Across Lamina
Heating Rate = 5. 0 K/s (540 ° F/rain) R = 85% ............... 58
Modulus of Restrained MX 2600, Across Lamina
Heating Rate = 5.0 K/s (540 ° F/min) R = 60% .......... ..... 58
Modulus of Restrained MX 2600, With Lamina,
Thick Wall Specimen, Heating Rate = 2.9 K/s
(310 ° F/min) R = 30% "" M:X2600,Across'''--'----''--""L'_'_a" .......--..59Summary of Modulus Data, ...........59
Summary of Modulus Data, MX 2600_With Lamina ............ 60
Strength Measurements, MX 2600, With Lamina, ............. 60
Thermal Conductivity of MX 2600, Silica Phenolic
Char, With Lamina, Transient Measurement ............... 61
Thermal Conductivity of MX 2600,Silica Phenolic
Char, Across Lamina, Transient Measurement ............. 61
Thermal Conductivity of MX 2600 Silica Phenolic
Char, From Rocket Nozzle (Approx. 30-Degree
Orientation) .....Thermal Conductivity of _'2600 S;1;ca'P'he;o'l;c"
Char, Summary of Transient Data ....... .
Thermal Conductivity of MX 2600 Silica Phenolic
Char, Summary of Heating Rate Data ............... , .... 63
Thermal Expanmon of FM 5272,Across Lamina,
Low Heating Rate (0.033K/s) (3.6 _ F/min) ............... 64
Thermal Expanmon of FM 5272jWith Lamina,
Low Heating Rate (0.033K/s) (3.6 _ F/rain) ................. 64
Thermal Expanmon of FM 5272, Comparison of
With and Across Lamina ............................ 65
Thermal Expansion Specimens After Testing in the
Brinkmarm Dilatometer ............................. 65
Thermal Expanmon of FM 5272, With Lamina at 5.55 K/s
(600 ° F/min) .................................... 66
Thermal Expanmon of FM 5272, With Lamina at 13.9 K/s
(150¢ F/min) ................................... 66
Thermal Expanmon of FM 5272, Effect of Heating Rate ......... 67
............. 62
............. 62
vii
Figure
70
71
72
73
74
75
76
77
78
79
8O
81
82
83
84
85
86
87
88
89
9O
ILLUSTRATIONS(Continued)
Restrained Expansmnof FM 5272,With Lamina,HeatingRate= 2.9 K/s (310" F/Min) R = 90% ..............
Restrained Expansmn of FM 5272, With Lamina,
Heating Rate = 2.9 K/s (310" F/Min) R = 60% ..............
Restrained Expansion of
Heating Rate = 5.0 K/s
Restrained Expansion of
Heating Rate = 5.0 K/s
FM 5272, With Lamina,
(54¢ F/Min) R = 90% ..............
FM 5272, With Lamina
(54¢ F/Min) R = 70% ..............
Restrained Expansmn of FM 5272, Across Lamina
Heating Rate = 2.9 K/s (310" F/min) R = 95% .............
Restrained Expansion of FM 5272, Across Lamina
Heating Rate = 2.9 K/s (310" F/min) R = 90% .............
Restrained Expansmn of
Heating Rate = 2.9 K/s
Restrained Expansion of
Heating Rate = 2.9 K/s
Restrained Expansmn of
Heating Rate = 5.0 K/s
Restrained Expansmn of
FM 5272, Across Lamina
(31¢ F/rain) R = 82% ..............
FM 5272, Across Lamina
(31¢ F/min) R = 65% .............
FM 5272, Across Lamina
(54¢ F/min) R = 90% .............
FM 5272, Across Lamina
Heating Rate = 5.0 K/s (540 ° F/min) R = 80% .............
Restrained Expansmn Tests on Thick Wall Specimen of FM
5272, Heating rate = 2.9 K/s (310 _ F/min) R = 60% .........
Sttmmary of Restrained Expansion Data FM 5272,
Across Lamina .................................
Summary of Restrained Expansion Data FM 5272,
With Lamina ...................................
Modulus of Restrained FM 5272, With Lamina,
Heating Rate = 2.9 K/s (310" F/min) R = 90% ..............
Modulus of Restrained FM 5272, With Lamina,
Heating Rate = 2.9 K/s (310" F/min) R = 60% ..............Modulus of Restrained FM 5272, With Lamina,
Heating Rate = 5.0 K/s (540 _ F/min) R = 90% ..............
Modulus of Restrained FM 5272, With Lamina,
Heating Rate = 5.0 K/s (540 _ F/min) R = 70% ..............
Modulus of Restrained FM 5272, Across Lamina,
Heating Rate = 2.9 K/s (310 ° F/min) R = 95% ..............
Modulus of Restrained FM 5272, Across Lamina,
Heating Rate = 2.9 K/s (310 _ F/min) R = 90% ..............
Modulus of Restrained FM 5272, Across Lamina,
Heating Rate = 2.9 K/s (310 _ F/min) R = 82% ..............
Modulus of Restrained FM 5272, Across Lamina,
Heating Rate = 2.9 K/s (31¢ F/rain) R = 65% ..............
P age
67
68
69
69
70
71
71
72
72
73
73
74
74
76
76
77
77
78
78
79
79
viii
Figure
91
92
93
949596
9798
99
100
101
102
103
104
105
106
107
108
109
110
ILLUSTRATIONS (Continued)
Page
Modulus of Restrained FM 5272, Across Lamina,
Heating Rate = 5.0 K/s (540 _ F/min) R = 90% .............. 80
Modulus of Restrained FM 5272, Across Lamina,
Heating Rate = 5.0 K/s (540 ° F/min) R = 80% .............. 80
Modulus of Restrained FM 5272, With Lamina, Thick
Wall Specimen, Heating Rate = 2. 9 K/s (310 ° F/min)
R = 70% ....................................... 81Summary of Modulus Data, FM 5272, With Lamina .......... 81
Summary of Modulus Data, FM 5272, Across Lamina ......... 82
FM 5272 Restrained Expansion Specimen after Testing
at High Heating Rate .... 82
Strength Measurements, FM 5272 With Lam;na': : :. : :: :. :: :. 83
Thermal Expansion of Carbitex 700, Across Lamina,
0.033K/s (3.6 _ F/rain) ............................. 88
Thermal Expansion of Carbitex 700, With Lamina,
0. 033K/s (3. 6_ F/min) ............................. 88
Thermal Expansion of Carbitex 700, With Lamina,
13.9 K/s (150¢ F/min) ............................. 89
Thermal Expansion of Carbitex 700, With Lamina,
27.8 K/s (300¢ F/rain) ............................. 89
Summary of Free Thermal Expansion Data, Carbitex 700,With Lamina .................................... 90
Restrained Expansion of Carbitex 700, With Lamina,
Heating Rate = 13.9 K/s (1500 ° F/rain) R = 55% ............ 90
Restrained Expansion of Carbitex 700, With Lamina,
Heating Rate = 27.8 K/s (3000 ° F/rain) R = 55% ............. 91
Restrained Expansion of Carbitex 700, With Lamina,
Heating Rate = 27.8 K/s (3000 ° F/rain) R = 75% ............ 91
Summary of Restrained Expansion Data,92
Carbitex 700, With Lamina ..........................93
Modulus of Restrained Carbitex 700, With Lamina ...........
Compressive Stress-Strain Behavior of Carbitex 700 to1800 K With Lamina (Average curves, not loaded to
failure) ....................................... 94
Compressive Stress-Strain Behavior of Carbitex 700 to
1800 K Across Lamina (Average curves, not loaded
to failure) ..................................... 95
Thermal Conductivity of Carbitex 700, Transient Test
With Lamina .................................... 96
ix
5. ¸ ";
Figure
IIi
112
113
114
115
116
117
118
119
120
121
122
123
124
125
ILLUSTRATIONS (Continued)
Pag_
Thermal Conductivity of Carbitex 700, Transient Test,
Across Lamina ................................... 96
Thermal Conductivity of Carbitex 700, Transient Test
Summary of Heating Rate Data ........... , ............. 97
Thermal Expansion of RPP-4, With and Across Lamina
at 0. 033 K/s (3.6 ° F/min) ............................ 102
Thermal Expansion of RPP-4, With Lamina, 13.9 K/s
(1500 ° F/rain) .................................... 103
Thermal Expansion of RPP-4, With Lamina, 27.8 K/s
(3000 ° F/min) .................................... 103
Mean Thermal Expansion Coefficient of RPP-4, With Lamina ..... 104
Restrained Thermal Expansion of RPP-4, With Lamina,
Heating Rate = 13.9 K/s (1500 ° F/min) R = 65% .............. 104
Restrained Thermal Expansion of RPP-4, With Lamina,
Heating Rate = 27.8 K/s (3000 ° F/min) R = 65%.... .......... 105
Summary of Free and Restrained Thermal Expansion
Data, RPP-4,With Lamina ........................... 105
Modulus of Restrained RPP-4, With Lamina, R = 65% .......... 106
Compressive Stress-Strain Behavior of RPP-4 to 1800 K107
(Average curves, not loaded to failure), With Lamina ........
Compressive Stress-Strain Behavior of RPP-4 to 1800 K107
(Average curves, not loaded to failure), Across Lamina .......
Thermal Conductivity of RPP-4 Transient Tests,
-Across Lamina . . .
Thermal Conductivityo;RPP'iT;ans;en(Te;t;,'iiiiiiiill i1108With Lamina ........................ 108
Thermal Conductivity of RPP-4 Transient Tests,
Summary of Heating Rate Data ........................ 109
X
.H
A
CP
CPg
E
AE
%AH
L
AL
AL/L
(_) eff
P
Pc
R
t
T
(T)
AT
SYMBOLS
Pre-exponential Constant (Collision frequency)
Specific Heat at Constant Pressure
Specific Heat of Pyrolysis Gas
Modulus of elasticity
Activation Energy
Latent Heat of Gas Cracking
Heat of Decomposition
Length
Change in Length
Strain (Change in length per unit length) $ usually
thermal strain (i.e., expansion).
The effective (or apparent) thermal expansion which is
derived from the restrained expansion test
Mass Flux
Pressure
Char Density
Gas Constant (conductivity equation) or Restraint in
Restrained Expansion Test
Time
Temperature
A temperature dependent change in dilatometer dimensions
Temperature Change
xi
dT/dt or
X
P
pg
o
Heating Rate {Time rate of change of temperature)
Depth in Material
Thermal Expansion Coefficient
Mean Thermal Expansion Coefficient
Area Ratio
Thermal Conductivity
The thermal strain which is permitted to occur under
partially restrained expansion
Density
Gas Density
Stress
xii
SUMMARY
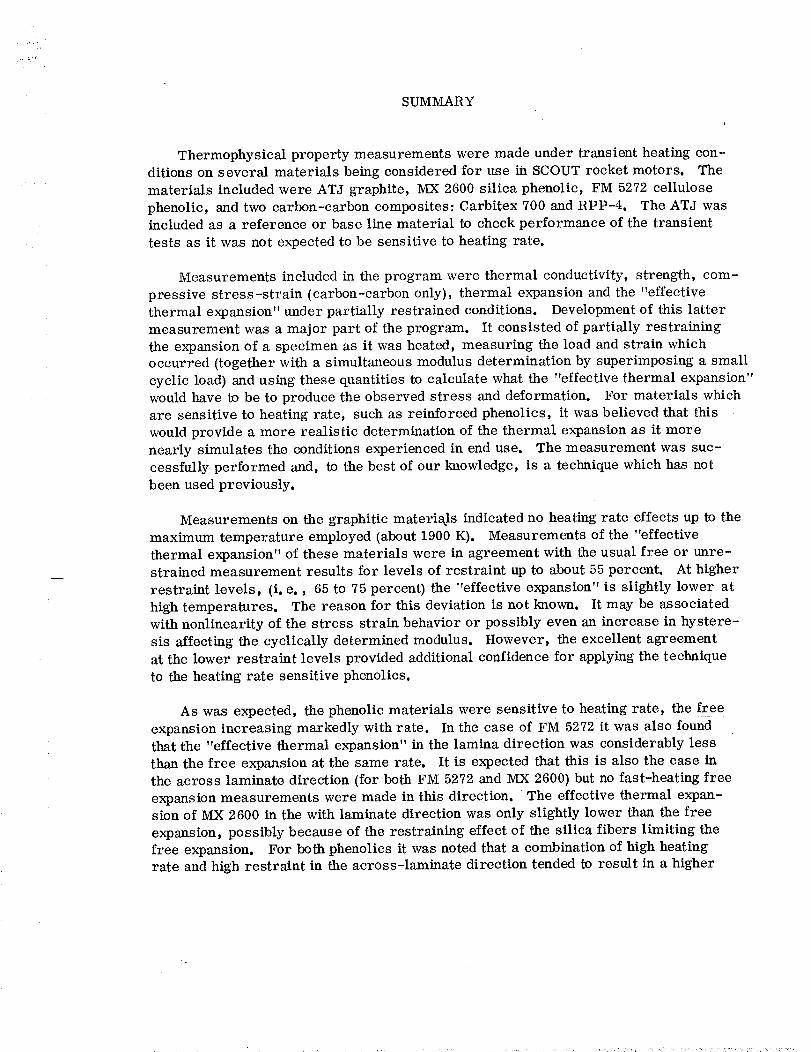
Thermophysicalproperty measurementswere madeunder transient heatingcon-ditions on several materials beingconsideredfor use in SCOUTrocket motors. Thematerials includedwere ATJ graphite, MX 2600silica phenolic, FM 5272cellulosephenolic, andtwo carbon-carboncomposites:Carbitex 700andRPP-4. TheATJ wasincludedas a reference or baseline material to checkperformanceof the transienttests as it wasnot expectedto be sensitiveto heating rate.
Measurementsincludedin the program were thermal conductivity, strength, com-pressive stress-strain (carbon-carbononly), thermal expansionandthe "effectivethermal expansion"underpartially restrained conditions. Developmentof this lattermeasurementwas a major part of theprogram. It consistedof partially restrainingthe expansionof a specimenas it washeated, measuringthe loadandstrain whichoccurred (togetherwith a simultaneousmodulusdeterminationby superimposinga smallcyclic load)andusingthesequantitiesto calculatewhat the "effective thermal expansion"wouldhaveto be to producetheobservedstress anddeformation. For materials whichare sensitive to heatingrate, suchasreinforced phenolics, it wasbelievedthat thiswouldprovide a more realistic determinationof the thermal expansionas it morenearly simulatesthe conditionsexperiencedin enduse. The measurementwassuc-:cessfully performed and, to thebest of our knowledge,is a techniquewhichhasnotbeenusedpreviously.
Measurementson the graphitic materia_lsindicatedno heatingrate effectsup to themaximumtemperature employed(about1900K). Measurementsof the "effectivethermal expansion"of thesematerials were in agreementwith theusual free or unre-strained measurementresults for levels of restraint up to about55percent. At higherrestraint levels, (i. e., 65 to 75percent)the "effective expansion"is slightly lower athightemperatures. Thereasonfor this deviationis not known. It maybe associatedwith nonlinearity of the stress strain behavioror possibly evenan increasein hystere-sis affecting the cyclically determinedmodulus. However, the excellentagreementat the lower restraint levels providedadditional confidencefor applyingthe techniqueto theheatingrate sensitivephenolics.
As was expected,thephenolicmaterials were sensitive to heatingrate, the freeexpansionincreasing markedly with rate. In the caseof FM 5272it wasalso foundthatthe "effective thermal expansion"in the lamina direction wasconsiderablylessthan thefree expansionat the samerate. It is expectedthat this is also the caseinthe across laminatedirection (for bothFM 5272andMX 2600)but no fast-heatingfreeexpansionmeasurementswere madein this direction. The effectivethermal expan-sion of MX 2600in the with laminatedirection wasonly slightly lower thanthe freeexpansion,possibly becauseof the restraining effectof the silica fibers limiting thefree expansion. For bothphenolics it wasnotedthat a combinationof highheatingrate andhigh restraint in theacross-laminatedirection tendedto result in ahigher
effective thermal expansion,probably as a result of restricting theescapeof decom-position products. This also resulted in piecesof the MX 2600beingviolently blownout of thespecimensurface.
Transient thermal conductivitiesmeasuredon the carbon-carbonmaterials werein agreementwith the steadystate, low temperaturedataandextendedthe datatoabout2000K. Measurementson the phenolicswere madeby first preparing charunder very fast heatingconditions. In the caseof the FM 5272, thechar wasso softandweakthat it disintegratedrapidly evenat fairly low flow rates.
2
•r.
_TRODUCTION
The SCOUT system consists of a family of solid propellant rocket motors which
are utilized in a number of three to five stage vehicles. In general, these motors have
provided highly satisfactory service but are constantly being upgraded for improved
performance and reliability. As noted in Reference 1, many new and improved mate-
rials have become available since the earliest SCOUT flights and these have provided
the basis for reassessment of both materials and design of the SCOUT motors.
One of the most important areas associated with thermostructural analysis and
reliability assessment of rocket nozzle materials is that of reliable and reproducible
environmental response data. It is, of course, important that the data employed in
analyses be representative of the material under whatever conditions exist in hhe end
use application being analyzed. The effect of temperature, for example, is recognized
and taken into account. However, other factors such as time at temperature, rate of
strain and rate of change of temperature can often be very important but may be
neglected. Since an analysis based on invalid data can be misleading, the effects of
environment upon material properties should be carefully examined. Some classesof materials are more sensitive than others to these environmental factors and when
this is the case, it becomes apparent that certain of the engineering design data should
be generated under conditions that approach the heating and loading rates encountered
in the end use application. As compared to "static" tests, these transient tests are
considerably more difficult to perform, require more time, and tend to be less pre-
cise, but the resulting data are far more meaningful.
In considering the dependence of material properties on time or rate, it should
be noted that there are at least two distinct types of rate effects which one may be con-
cerned with. One of these is connected with flow of the material. For example, the
flow stress of aluminum increases with increasing strain rate (ref. 2), a phenomenon
that may be explained in terms of thermal activation of dislocation motion. Similarly,the deformation of a polymer will frequently result in the motion of molecules past one
another, i.e., viscous flow of the material and viscosity may also be treated (ref. 3)
as a thermally activated or rate process. Since higher stresses are required to causeviscous flow to occur more rapidly, many polymer mechanical properties, such as the
yield stress (ref. 4) are dependent on the strain rate. This type of time dependence is
associated with material flow and although this flow is temperature dependent it is
generally regarded as being independent of time at temperature* or heating rate except
in those cases where the material is being altered. This qualification, "the material
is being altered," introduces a second type of time dependence and is the one with
which this program was primarily concerned.
*It is possible that a finite time is required for response to a temperature rise so thattime at temperature effects may be observed at extreme heating rates and very short
times.
3
• , fi
If a polymeric material such as a phenolic is heated to a sufficiently high tempera-
tare, it will undergo chemical changes that affect its properties. It is possible, for
example, for additional cross-linking to occur which would increase the modulus overthat which would exist in the absence of such a reaction. Since reactions of this type
are rate processes, one would expect that if the material could be heated very rapidly,the modulus would decrease during heating, but would then rise to some intermediate
value as the cross-linking reaction progressed. Such an effect has been observed at
this laboratory during studies on an epoxy adhesive. A very similar effect has been
observed on heating certain crystallizable (but initially amorphous) polymers. With
these polymers, Young's modulus (above Tg) increases as the degree of crystallizationincreases, and the rate of crystallization increases as the temperature is increased.
In addition, these materials often show an incubation period (also temperature de-
pendent) before the onset of crystallization.
With thermoset polymers, such as the phenolics, a degradation reaction occurs
at elevated temperatures. The onset of such a reaction is accompanied by a weight
loss and hence may be followed by thermogravimetric analysis (TGA). As this re-
action progresses, gases are evolved that diffuse to the surface to escape, and the
remaining material reduces to a carbonaceous char. Since the degradation is again
a rate process, one finds that the onset of the reaction is shifted to a higher tempera-
ture as the heating rate is increased. At the higher rate, the weight loss (or extent
of reaction) will be less at any given temperature, but the rate of reaction at that
temperature will be higher.
In an earlier program, it had been observed that when carbon phenolic or silica
phenolic laminates were heated slowly, some thermal expansion occurred up to about450 K, after which the material contracted. The change from expansion to contraction
corresponds _ the onset of thermal degradation. At high heating rates, it was ob-
served that a sharp increase in the thermal expansion coefficient occurred in about the
same temperature region as that where contraction started at low rate. It is believed
that at high heating rates, the resin initially softens and then a rapid evolution of gases
occurs. These gases cannot escape readily and create a pressure within the material
which causes rapid expansion and the opening of fissures. Properties other than the
thermal espansion are also affected by heating rate, since the structure of the mate-rial is affected.
In considering the heating rates to which a material may be subjected within a
rocket moor, it may be noted that propellant flame temperature in the SCOUT motorsis roughly 3600 IL The heating rate which the material experiences will depend on the
thermal conductivity, time, the distance of a given point below the heated surface, etc.
However, past experience with ablation testing of a carbon phenolic material indi-
cates that a 3600 K surface temperature may be expected to result in heating rates of
about 10 to 200 K/s in the region of 2. 5 to 10 mm (0. 1 to 0. 4 inch) below the surface.
4
:L
The program described in the following report was concerned with the investiga-
tion of several materials of interest to the SCOUT program to determine whether the
properties of these materials were sensitive to heating rate and to provide meaningful
property data on these materials.
General Electric Company personnel who have made significant contributions to
this program include J. Roetling {Program Manager), L. Sponar, J. Hanson,
J. Brazel, B. Kennedy and S. Schlusberg.
The program was administered by the Thermal Protection Materials Branch of
NASA/Langley Research Center. Mr. J. P. Howell, Heat Shield Section, acted asTechnical Monitor.
5
MATERIALS
Five materials were included in this study. These were as follows:
ATJ Graphite
ATJ graphite is a fine grain, high strength, premium quality graphite produced
by the Union Carbide Corporation. It is probably one of the most uniform of the high
performance graphites which became available in the early 1960's and can be machined
to very close tolerances with fine surface finish. ATJ has been used as a rocket motor
nozzle (throat) insert material and in general has proven very successful in this appli-
cation. However, polycrystalline graphites may be considered to be fairly brittlematerials and there has been some concern that if a crack did initiate it would propa-
gate catastrophically. Hence there has been interest in materials which would possessthe excellent thermal shock resistance and ablation performance of ATJ while pro-
viding greater resistance to fracture propagation.
In general, ATJ graphite was not expected to show any significant dependence of
properties upon heating rate. It was therefore included in this program more for
demonstration purposes than to provide new data. That is, if the properties of theATJ were insensitive to heating rate, then one would expect good agreement between
static test data and transient test data if the latter tests are properly conducted. In
this respect, it was known from past experience (ref. 5) that the thermal conductivity
of ATJ as obtained by the GE transient technique was in agreement with steady-statedeterminations. However, it was less certain that mechanical properties would be
independent of heating rate. It is known, for example, that when polycrystalline
graphites are strained at room temperature they acquire a "permanent" set (ref. 6)which can be recovered by annealing at about 1300 K or higher. The reasons for this
set and its recovery by annealing are not certain but may involve a change in the
crystal structure (a stress induced change from hexagonal to rhombohedral structureof a very small percentage of the material). Because this set can be annealed out at
relatively low temperature and because such a crystalline change is probably besttreated as a rate process, it was considered possible that some heating rate effects
might be seen. However, it seemed probable that if any such rate effects did exist
they would be small.
C arbitex 700
Carbitex 700 is a carbon composite material consisting of grapMte base fibers
in a graphite matrix. The fibrous base is in the form of a square weave fabric which
7
is laid-up in a layered fiat construction. Althoughthe material includedin this pro-gram wasa flat lay up, Carbitex canalso beproducedby tapeandfilament windingtechniques. It is manufacturedby the CarborundumCompany.
Carbon-carboncompositematerials suchas Carbitex are of interest as rocketmotor throat insert materials since they appearto combinethe manydesirableproperties of graphitewith a much improved resistanceto fracture propagation.
Carbitex is available in a widevariety of sizes. Theparticular panelswhichwere purchasedfor useonthis program were approximately20x 20x 5.1 cm.(8x 8x 2 inches)in size, the 5.1 cm dimensionbeingperpendicular to the fabricplane (i. e., across laminate).
RPP-4
RPP-4 is also a carbon-carbon composite and was also obtained in a flat lay up
construction. It was manufactured by LTV Aerospace Corporation. The panels
purchased for this program were cut into cubes approximately 5.1 cm on a side be-
fore the final impregnation and firing. This was done in order to obtain an impreg-
nation which would be comparable to that which would exist on SCOUT throat insertsfabricated from this material.
MX 2600 Silica Phenolic
MX 2600 is also a flat lay-up material consisting of layers of silica fiber fabric
impregnated with a phenolic resin. It has been used in rocket motors such as the
Algol II-B as entrance insulation and exit cone insulation (ref. 1). Being a phenolic
material, it was expected to show significant heating rate effects.
FM 5272 Cellulose Phenolic
FM 5272 cellulose phenolic is also a laminated material and was obtained as
a flat lay up. The cellulose laminates are in the form of kraft paper. This materialhas been under consideration for use as insert backup insulation on submerged
nozzles and as an exit cone insulation (ref. 1).
8
TESTMETHODS
Themeasurementsincludedin this program consistedof thermal expansiondeterminationsat bothhigh andlow heatingrates, strengthmeasurementsunder fastheatingconditions, transient thermal conductivitymeasurements,andthe measurementof an "effective thermal expansion"underpartially restrained conditions. This lattermeasurementalso includeda modulusdetermination. In caseswherenoheatingratesensitivity existed, someof the restrained expansiontests were replacedby com-pressivestress-strain measurements. Eachof these test methodsis describedbelow.
Thermal Expansion
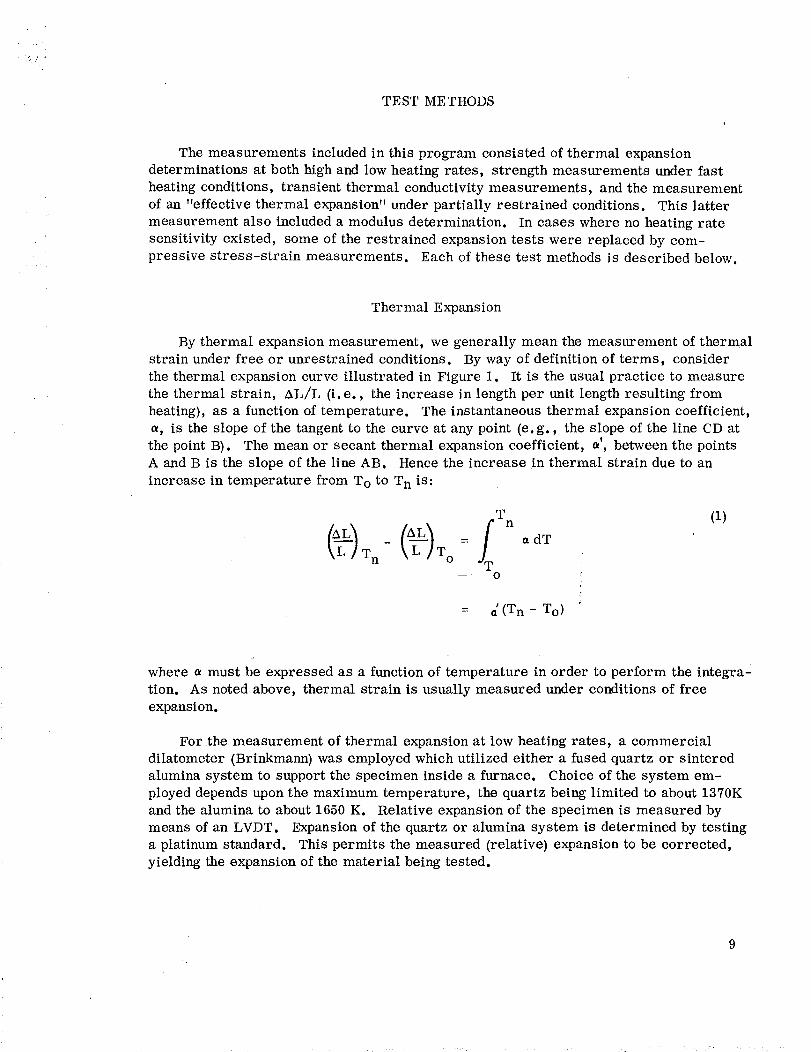
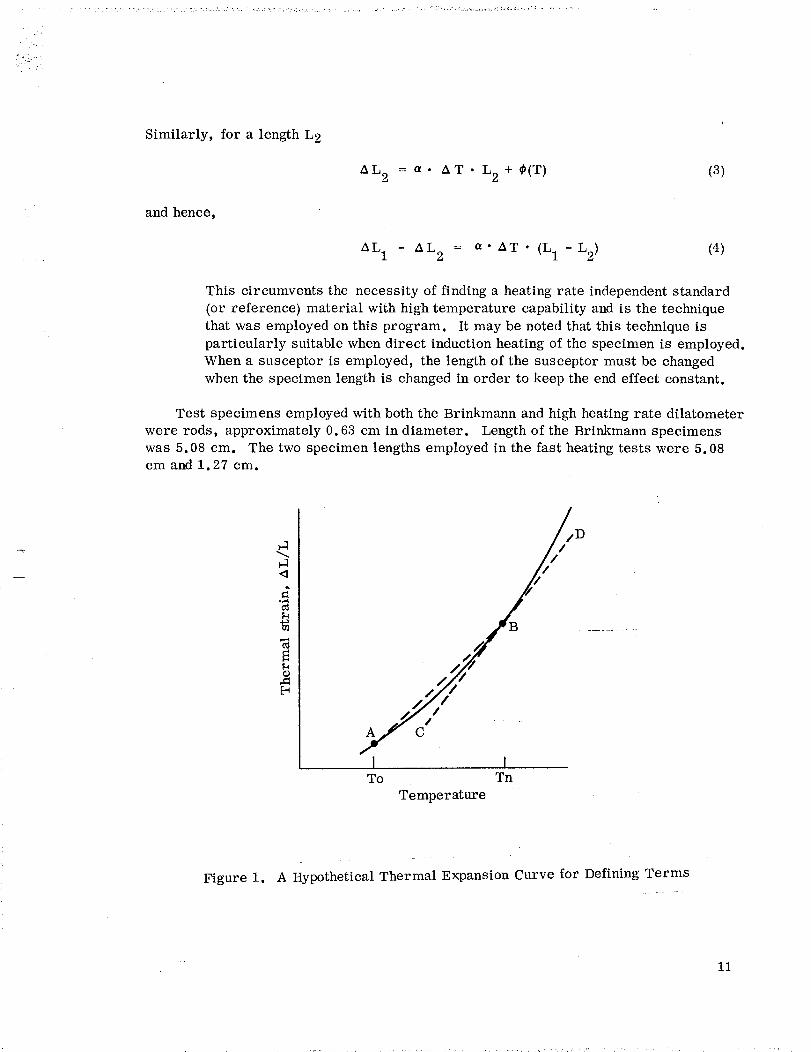
By thermal expansionmeasurement,wegenerally meanthe measurementof thermalstrain under free or unrestrainedconditions. By wayof definition of terms, considerthethermal expansioncurve illustrated in Figure 1. It is the usualpractice to measurethe thermal strain, AL/L (i. e., the increase in lengthper unit lengthresulting fromheating),as a functionof temperature. Theinstantaneousthermal expansioncoefficient,a, is the slope of the tangent to the curve at any point (e. g., the slope of the line CD at
the point B). The mean or secant thermal expansion coefficient, a', between the points
A and B is the slope of the line AB. Hence the increase in thermal strain due to an
increase in temperature from To to T n is:
T
(_-_)Tn- t_-)To = fT n
-- O
a dT
(1)
= a' (Tn - To)
where a must be expressed as a function of temperature in order to perform the integra-
tion. As noted above, thermal strain is usually measured under conditions of free
expansion.
For the measurement of thermal expansion at low heating rates, a commercial
dilatometer (Brinkmann) was employed which utilized either a fused quartz or sintered
alumina system to support the specimen inside a furnace. Choice of the system em-
ployed depends upon the maximum temperature, the quartz being limited to about 1370K
and the alumina to about 1650 K. Relative expansion of the specimen is measured by
means of an LVDT. Expansion of the quartz or alumina system is determined by testing
a platinum standard. This permits the measured (relative) expansion to be corrected,
yielding the expansion of the material being tested.
9
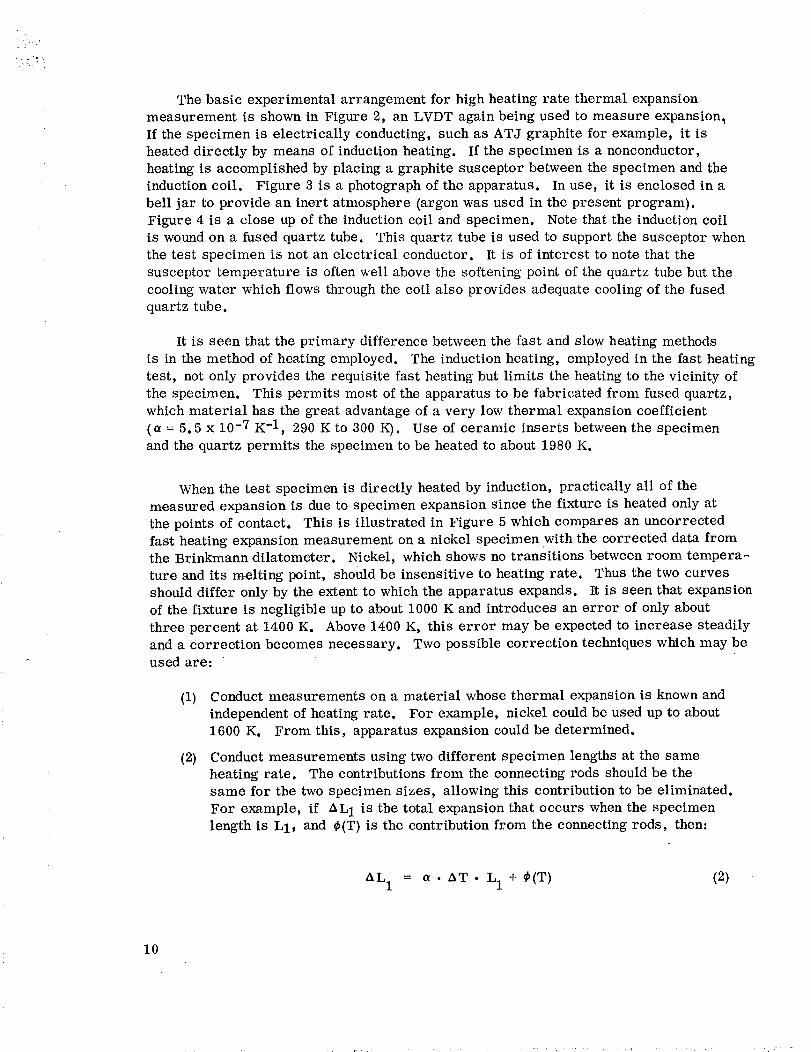
Thebasic experimentalarrangementfor high heatingrate thermal expansionmeasurementis shownin Figure 2, an LVDT againbeingusedto measureexpansion_If the specimenis electrically conducting, suchas ATJ graphite for example, it isheateddirectly by meansof inductionheating. If the specimenis a nonconductor,heatingis accomplishedby placinga graphite susceptorbetweenthe specimenandtheinductioncoil. Figure 3 is a photographof the apparatus. In use, it is enclosedin abell jar to provide an inert atmosphere(argonwasusedin the presentprogram).Figure 4 is a close upof the inductioncoil andspecimen. Notethat the inductioncoilis woundona fusedquartz tube. This quartz tube is usedto supportthe susceptorwhenthe test specimenis not an electrical conductor. It is of interest to note that thesusceptortemperature is oftenwell abovethe softeningpoint of thequartz tubebut thecoolingwater which flows throughthe coil also provides adequatecooling of the fusedquartz tube.
It is seenthat the primary differencebetweenthe fast andslow heatingmethodsis in themethodof heatingemployed. Theinductionheating, employedin the fast heatingtest, not only provides the requisite fast heatingbut limits the heatingto the vicinity ofthe specimen. This permits most of the apparatusto be fabricatedfrom fusedquartz,whichmaterial has the great advantageof a very low thermal expansioncoefficient(_ = 5.5 x 10 -7 K -1, 290 K to 300 K). Use of ceramic inserts between the specimen
and the quartz permits the specimen to be heated to about 1980 K.
When the test specimen is directly heated by induction, practically all of the
measured expansion is due to specimen expansion since the fixture is heated only at
the points of contact. This is illustrated in Figure 5 which compares an uncorrected
fast heating expansion measurement on a nickel specimen with the corrected data fromthe Brinkmann dilatometer. Nickel, which shows no transitions between room tempera-
ture and its melting point, should be insensitive to heating rate. Thus the two curves
should differ only by the extent to which the apparatus expands. It is seen that expansionof the fixture is negligible up to about 1000 K and introduces an error of only about
three percent at 1400 K. Above 1400 K, this error may be expected to increase steadilyand a correction becomes necessary. Two possible correction techniques which may be
used are:
(i)
(2)
Conduct measurements on a material whose thermal expansion is known and
independent of heating rate. For example, nickel could be used up to about
1600 K. From this, apparatus expansion could be determined.
Conduct measurements using two different specimen lengths at the same
heating rate. The contributions from the connecting rods should be the
same for the two specimen sizes, allowing this contribution to be eliminated.
For example, if AL 1 is the total expansion that occurs when the specimenlength is L1, and ¢(T) is the contribution from the connecting rods, then:
AL 1 = a • AT. LI + _(T) (2)
I0
Similarly, for a length L 2
A L 2 = a • AT • L 2 + _(T) (3)
and hence,
AL 1 - AL2 = a. A T • (L 1 - L2 ) (4)
This circumvents the necessity of finding a heating rate independent standard
(or reference) material with high temperature capability and is the technique
that was employed on this program. It may be noted that this technique is
particularly suitable when direct induction heating of the specimen is employed.
When a susceptor is employed, the length of the susceptor must be changed
when the specimen length is changed in order to keep the end effect constant.
Test specimens employed with both the Brinkmann and high heating rate dilatometer
were rods, approximately 0.63 cm in diameter. Length of the Brinkmann specimens
was 5.08 cm. The two specimen lengths employed in the fast heating tests were 5.08cm and 1.27 cm.
o
/ /
z '4 B
A
7I I
To Tn
Temperature
Figure 1. A Hypothetical Thermal Expansion Curve for Defining Terms
11
Restrained Expansion Tests
Although thermal expansion is normally measured under conditions of free or un-
restrained expansion, this condition seldom exists in end use applications. In a typical
application, a material may be heated on one surface and a thermal gradient created
through the thickness. While expansion normal to this surface is unrestrained, theexpansion parallel to the surface is restrained by the cooler underlying material. Thus
the hot material experiences a compressive stress and the cool material experiences
a tensile stress. It is situations such as this, where a thermal stress is developed,
that are of primary interest.
Under high heating rate conditions, the expansion of a reinforced thermoset
polymer such as a phenolic is due in part to an internal pressure that develops as gas
is generated by thermal decomposition of the resin. Under conditions of unrestrained
expansion, fissures can open which allow the gases to escape. If the expansion isrestrained, such fissures are not as readily developed, and one would expect that the
resultant internal pressure would be higher. Consequently, one might expect that the"effective thermal expansion" for the restrained case would not necessarily be the same
as the thermal expansion measured under unrestrained conditions. By "effect thermal
expansion, " we mean the value which should be used in thermal stress analyses in order
to correctly calculate the stresses which occur. For example, if one used data obtained
from a free expansion measurement and used this to calculate the stress developed when
the material was not able to expand freely, one might find that this calculated stress was
incorrect. An alternative then would be to measure the stress when the specimen wasrestrained and calculate what the "effective thermal expansion" would have to be in order
to produce the observed stress.
If a specimen is heated from T o to T n and is totally restrained from expanding, acompressive stress, a, is developed which is given by:
a -Ea I -= (T n To) (5)
where a'is the secant or mean thermal expansion coefficient between To and T n and
E is the modulus, measured at Tn.
It is apparent from equation (5) that if the restraining force and temperature are
measured, the product E a" is readily obtained. A separate measurement of either
E or a" is then necessary if the individual quantities are required.
Although this would seem to be a simple measurement to perform, the conditionof total restraint is not particularly easy to achieve. The condition can be practically
achieved with a test machine having closed-loop servo control and controlled by an
extensometer on the specimen. However, what is more important is the fact that total
restraint, like free expansion, is a condition which is not normally encountered in end
use applications. Of primary interest is the case of partially restrained expansion.
14
Equation(5) gives the stress which is developedif a specimenis completelyrestrained from expandingwhenit is heated. If, instead, a partial expansionispermitted, then the equationbecomes:
a = -E (a'AT-}) (6)
where
a • is the secant thermal expansion coefficient for this temperature interval,
is the thermal strain which does occur, and
E is the modulus at the temperature T n.
Note that the condition } = 0 corresponds to complete restraint of the specimen and
equation (6) reduces to equation (5), whereas at a = 0, } = a'. AT, which is the free
expansion condition. We are concerned here with the case where neither o nor } is
zero. In this case, if a, }, AT and E are all measured quantities, the effective
thermal expansion coefficient is given by:
E }-aa_- E. AT (7)
From this one may also calculate an effective expansion (i.e., A L/Lo) for comparison
with the free-expansion curves, or for use in analyses if this is the data form pre-
ferred. Thus from (7) we have:
A("_O-O)e_ a'. AT - E • } -aEf
(8)
(Note that a is negative for compressive stress).
Measurements of this type were performed using an MTI servo-controlled, hydraulic
powered testing machine. This test machine and the associated apparatus employed in
these tests is shown in Figure 6. Basically the servo control was used to prevent
expansion of the specimen (extensometer control), but as load is developed, a part of
the signal from the load cell is combined with the extensometer signal. This combined
signal is matched to a reference signal as is shown in the control diagram given in
Figure 7, allowing an expansion to occur which was proportional to the load developed.
Operation of the test was essentially as follows: The test specimen was placed
between two platens, one of which connected to a load cell, the other to the hydraulic
ram. An extensometer provided a signal proportional to any changes in specimen
length and the load cell provided a signal proportional to load. The specimen was heated
15
by inductionheatingandas it attemptedto expandit was partially restrained by thetest machine, thus causinga load to be developed. The loadandstrain signalswere.combinedsothat the machinepermitted an expansionto occur which wasproportionalto the load developed. Thedegreeto whichexpansionof the specimenwas restrainedwas controlled by the relative amplitudeof the load andstrain signals. For example,if the loadsignal was reducedto zero, then the machinewouldcontrol onstrain onlyandwouldhold expansionto essentially zero (completerestraint). Onthe other hand,if the load signalwasvery large comparedto the strain signal thenwewouldhavehadloadcontrol andif set at low loadwouldessentially havehadfree expansion.
In conductingthis test, the combinedload-strain signal waskept matchedto a dcreference signal (fig. 7)as the specimenwasheated, andthe load andstrain wererecorded. However, examinationof equation(8) showsthat to calculatethe effective_L/Lo, the modulusmust also beknown. For materials suchas thephenolics, themoduluscanalso bedependentonheatingrate andmay, in a test suchas this, alsodependon the degreeto whichthe specimenis restrained. Thusthe ideal arrangementappearedto be to makea simultaneousdetermination of the modulus. To do this, asmall amplitude squarewavesignalwassuperimposeduponthe dc reference signal(frequencyabout0.4 cps). This resulted in correspondingcyclic variations in boththe load andstrain, from whichthe moduluswas calculated.
Sincerestraint of the specimenresulted in the developmentof a compressiveload, the specimendesignhadto be suchas to minimize the possibility of buckling. Ahollow cylindrical specimenwasusedbecausethis alloweda large diameter to lengthratio to preventbuckling andat the sametime kept the thicknessof the material downto maintainuniform heating.
Theload arrangementemployedis illustrated it/Figure 8. The cylindrical speci-menis heldbetweentwo pyrolytic graphiteendcapswhich serve to supportthe extensom-eter andwhich act to insulate the platensandalignment piecefrom the specimen. Thealignmentpiece is, essentially, a hardenedsteel hemispherewhich is usedto obtainuniform loadingof the specimen. Theplatensare water cooledandthe lower platenisequippedwith a panwhich is fiIled with water to provide cooling of the alignmentpiece.A close upview of the specimenandplatensis shownin Figure 9.
Theupper platenis an integral part of the load cell andis mountedin the "fixed"cross-headof thetest machine.* Thesectionjust abovethe upperplaten (loadlink) isequippedwith strain gagesandis calibrated to provide a load signal. A hole throughtheentire cell along its axis permits useof a coaxial extensometer.
Details of the coaxial extensometerare shownin Figure 10. Theextensometeriscoaxialwith the specimenandis supportedby the pyrolytic endcapson the specimen
*Actually this crossheadcanbemovedfor initial positioning, but it remains fixedduring testing.
16
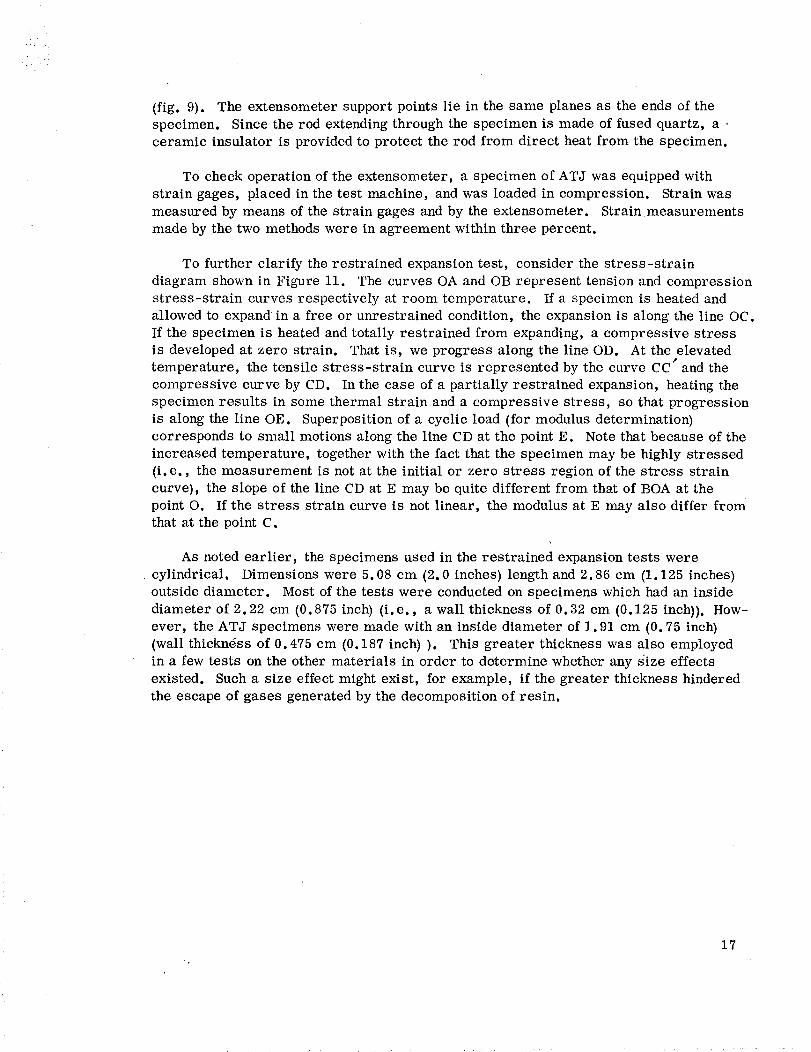
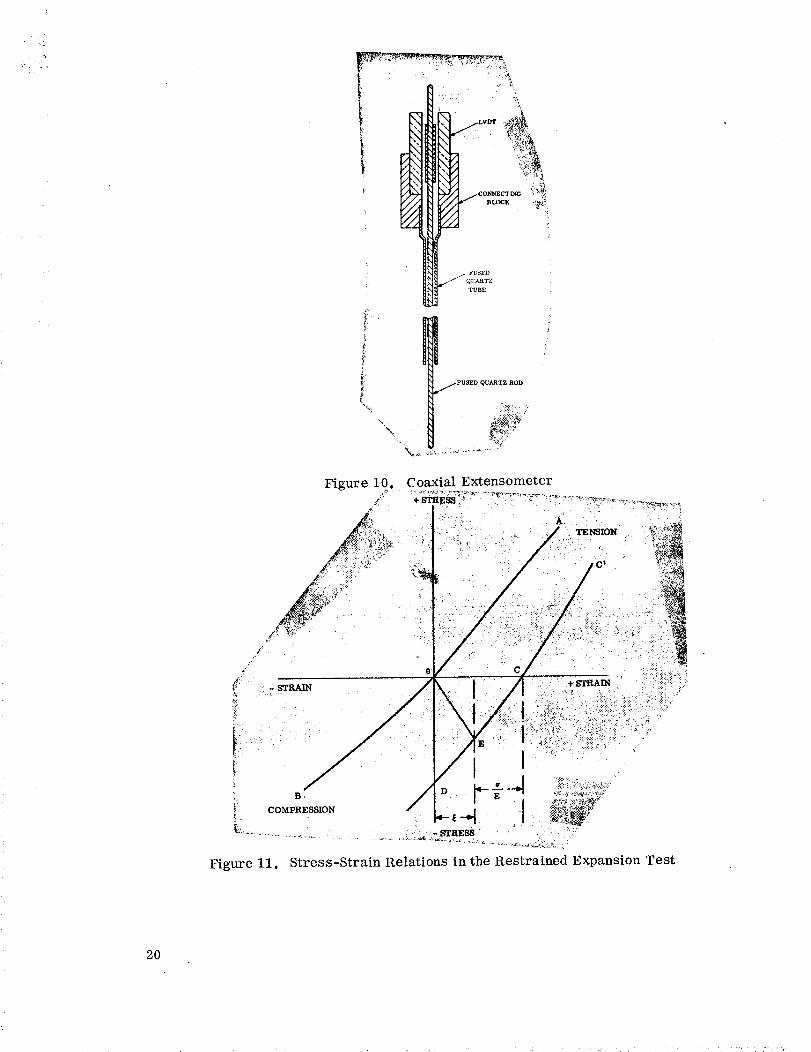
(fig. 9). The extensometersupportpoints lie in the sameplanesasthe endsof thespecimen. Sincethe rod extendingthroughthe specimenis madeof fusedquartz, aceramic insulator is providedto protect the rod from direct heat from the specimen.
To checkoperationof the extensometer,a specimenof ATJ wasequippedwithstrain gages, placedin thetest machine, andwas loadedin compression. Strain wasmeasuredby meansof the strain gagesandby the extensometer. Strainmeasurementsmadeby the two methodswere in agreementwithin three percent.
To further clarify the restrained expansiontest, consider the stress-straindiagram shownin Figure 11. The curvesOAandOBrepresent tensionand compressionstress-strain curves respectivelyat room temperature. If a specimenis heatedandallowedto expandin a free or unrestrained condition, the expansionis along the line OC.If the specimenis heatedandtotally restrained from expanding,a compressivestressis developedat zero strain. That is, weprogress along the line OD. At the elevatedtemperature, the tensile stress-strain curve is representedbythe curve CC' andthecompressivecurve by CD. In the caseof a partially restrained expansion,heatingthespecimenresults in somethermal strain anda compressivestress, so that progressionis alongthe line OE. Superpositionof a cyclic load (for modulusdetermination)correspondsto small motionsalongthe line CDat the point E. Note that becauseof theincreasedtemperature, togetherwith the fact that the specimenmaybe highly stressed(i. e., the measurementis not at the initial or zero stress region of the stress straincurve), the slope of the line CD at E may bequite different from that of BOAat thepoint O. If the stress strain curve is not linear, the modulusat E mayalso differ fromthat at the point C.
As notedearlier, the specimensusedin therestrained expansiontests were_cylindrical. Dimensionswere 5.08 cm (2.0 inches) lengthand2.86 cm (1.125inches)outsidediameter. Most of thetests were conductedonspecimenswhichhadan insidediameterof 2.22 cm (0.875inch) (i.e., a wall thicknessof 0.32 cm (0.125 inch)). How-ever, the ATJ specimenswere madewith an inside diameter of 1.91 cm (0.75 inch)(wall thicknessof 0.475 cm (0.187 inch) ). This greater thicknesswasalso employedin a few tests onthe other materials in order to determinewhetheranysize effectsexisted. Sucha size effect might exist, for example, if the greater thickness hinderedthe escapeof gasesgeneratedbythe decompositionof resin.
17
_ "_iI "_ i_j/i_ii___I.__
,/
CONNECTING
i
FUSED
QUA.qT'Z
TUBE
_./FUSED QUARTZ ROD
/
Figure 11.
Figure I0. Coaxial Extensometer
/<_ / / i'i_i!_
o • - C " " ::/::: _,. i
-s'r_m _m _ _:::'i}!iii:::.!:::
B
-. ....... _. - STRESS
Stress-Strain Relations in the Restrained Expansion Test
2O
StrengthMeasurement
Preliminary strengthmeasurementswere madeat room temperatureby meansofa flexure test. At elevatedtemperatures, a tensile measurementwasemployed.Becauseof the small size of theRPP-4 panelsandto conservematerial, a smallspecimenwith conical endswasadopted. This basic specimendesignhadprovensatisfactory in earlier testing of polycrystalline graphites. Specimendimensionsareshownin Figure 12. Figure 13 showsa specimenandthe specimengrips beforeassembly.
In the elevatedtemperaturetests, specimenswere heatedrapidly to the desiredtemperatureusing inductionheating(aswasdonein the other tests)andthen loadedfairly rapidly. Strain rates employedwere on the order of 0.01 sec-1 for the graphiticmaterials andaboutone-tenthof this for the phenolics. Theseloadingrates weresufficiently fast that the specimenswere not at elevatedtemperature for more thanafew secondsbut were slow enoughto avoidthe problemswhich canaccompanyhighstrain rate testing (ref. 7).
CompressionMeasurements
Compressivestress strain measurementswere madeusingthe samespecimensandthe samebasic apparatusas wasusedto perform the restrained expansionmeasure-ments. This required somechangesin circuitry butwas straight forward. Feed-backsignal from the load cell wasdisconnectedso that the control signalwasobtainedfromthe extensometerandthe fixed reference signalwas replacedby a linear ramp. Thus,oncethe specimenwasat temperature, the rampwas initiated andthe strain increasedlinearly. Both load andstrain were recorded.
Thesetests were not conductedto stresseshigh enoughto fail the specimen. Itwas learnedearly in the program that sucha specimenfailure couldresult in damageto theextensometerwith resultant loss of control of the test machineandpossibledamageto the load cell andinductioncoil. "Disasters" of this nature hadoccurred onat least two occasionsandconsiderablecautionwasexercised to preventany furtheroccurrencesof this nature.
Transient Thermal ConductivityTest
Time dependentthermal transport effects havelongbeenobservedin ablativeheat shieldphenomena.Thehighperformanceof the ablative classof materials wasusually lumpedin a high "Q-Star" - the effectiveheat of ablation, theheat required toremovea massor thickness of material. However, until the adventof ablators thatgeneratedchar layers of sufficient refractoriness to cling tenaciouslyto the underlying
21
degradingandvirgin material layers, the char's contribution to net heataccommodationwas insignificant or marginal. Thenylon phenolicsystemwas comprehensivelydescribedby Kratsch, Hearne, andMcChesney(ref. 8) who, althoughtheyhadnotransiently derived thermal conductivitydataandonly rudimentary thermophysicaldegradationdata, demonstratedthe sensitivity of thermal performancepredictions tothe parameters usedto describetransport in the char layer, andespeciallyheatabsorptionandgenerationof transpiring gasspecies in the critical decompositionzone.
The implications of charandvirgin material thermal conductivitywere directlytreated by Shaw,Garner, andFlorence (ref. 9) for refractory-reinforced phenolics,usingexperimentaldatageneratedin our laboratory. Theyshowedthe effect onheatshieldweight of usingtransiently deriveddataas opposedto conventionalsteady-statethermal conductivities. It wasshownthat shield overdesignsof asmuchas 25percentcouldoriginate from plausibly highsteadystate char thermal conductivitydata.
Theseinvestigationsdocumentedthe impact of thermophysicalparameter evaluationon re-entry heat shields. Transient methodsof makingthermal conductivitymeasure-mentshadbeendevelopedby the early 1960's, e.g., Parker's nowwidespread"flashdiffusivity method" (ref. 10). However, thesemethodsall require appreciableheatingtimes to get the sample, howeverprepared, up to temperature; thenthe samplemustbeascertainedto be isothermal so that the small temperature differential imposedacross the small thicknessof material canbe attributed completelyto the radiationimposedon the front face. For ablative, thermally degradableheat shieldmaterials,this protracted heatingperiod is usuallymuch longer than that experiencedby thematerial in flight andwill changethe structure. The small thickness- typically 0.158cm (1/16 inch) or less - required to satisfy optimum experimentaldesignconditionswasobservedto permit throughtransmission of the incident radiant energy, producingmuchhigher apparentthermal conductivities. These-phenomenawere studiedby Cunnington,et. al. (ref. 11), whowere ableto reducethe heatingcycle downto 15minutes ascomparedto the 2 to 3 minutesobservedfor ballistic re-entry vehicleheatingtimes.
Theoptimumtechniquethenfor valid characterization of thermally degradablematerials wouldbeonewhich:
(1) Madeits measurementonthe material in the anticipatedenduseenvironment(e.g., pressure, temperature, heatingrate).
(2) In a period of time representativeof enduse (i.e., a transient technique).
(3) Testedthe material in its flight-representative form (e.g., completelycharred but not graphitized).
23
r_, _,
}i
/
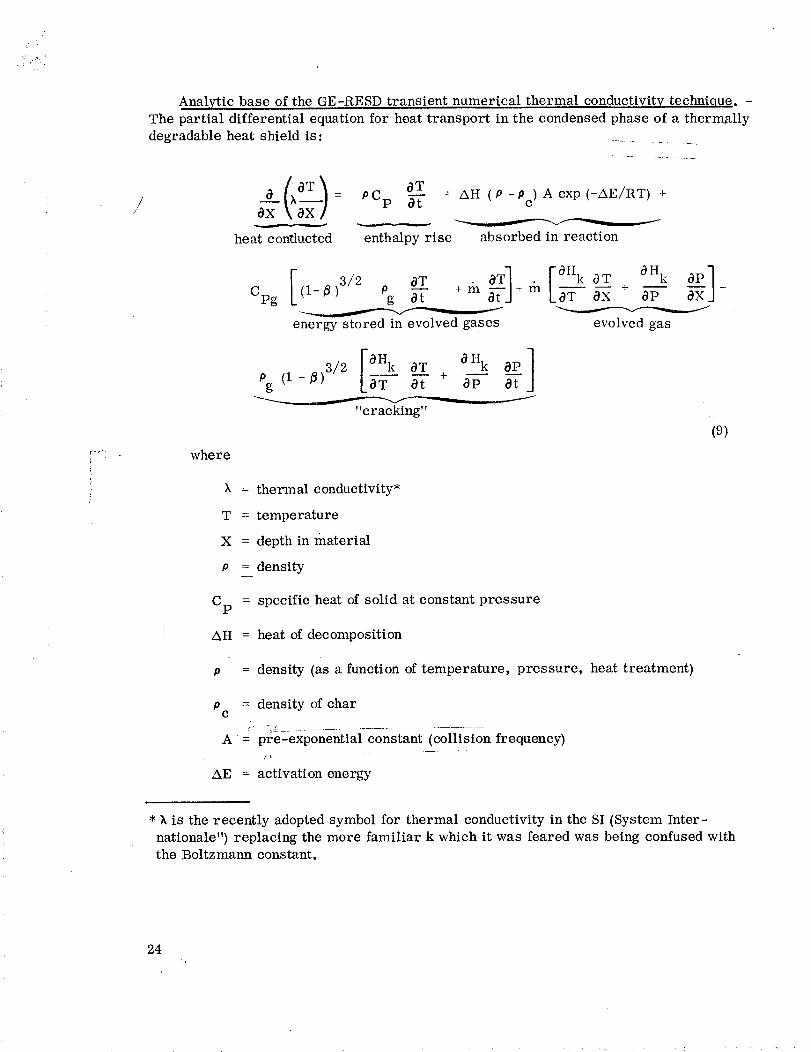
Analytic base of the GE-RESD transient numerical thermal conductivity technique. -
The partial differential equation for heat transport in the condensed phase of a thermally
degradable heat shield is:
heat e onttucted
PCp 0T0._t. + AH (P -pc) A exp (-AE/RT) +
enthalpy rise absorbed in reaction
Cpg
energy stored in evolved gases evolved gas
(1_f_)3/2 IOHk 0T 0Hk 8P]Og [_0-T 0t + 0p 0t
"cracking"
(9)
where
X = thermal conductivity*
T = temperature
X = depth in material
p = density
Cp = specific heat of solid at constant pressure
AH = heat of decomposition
p = density (as a function of temperature, pressure, heat treatment)
p = density of charc
A = pre-exponential constant (collision frequency)
AE = activation energy
* X is the recently adopted symbol for thermal conductivity in the SI (System Inter-
nationale") replacing the more familiar k which it was feared was being confused withthe Boltzmann constant.
24
%.
?i:i: i" "i
i
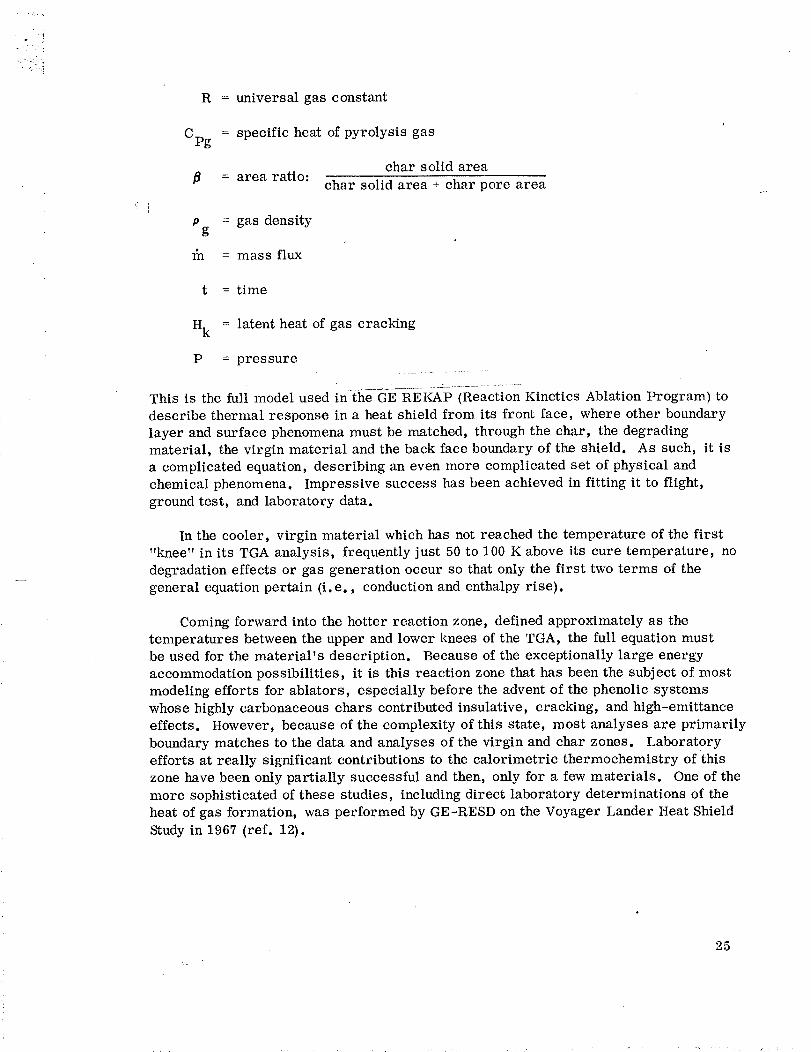
R = universal gas constant
Cpg= specific heat of pyrolysis gas
= area ratio:char solid area
char solid area + char pore area
p = gas densityg
= mass flux
t = time
Hk = latent heat of gas cracMng
P = pressure
......... 2 ...... -:" .................
This is the full model used in the GE REKAP (Reaction Kinetics Ablation Program) to
describe thermal response in a heat shield from its front face, where other boundary
layer and surface phenomena must be matched, through the char, the degradingmaterial, the virgin material and the back face boundary of the shield. As such, it is
a complicated equation, describing an even more complicated set of physical and
chemical phenomena. Impressive success has been achieved in fitting it to flight,
ground test, and laboratory data.
In the cooler, virgin material which has not reached the temperature of the first
"knee" in its TGA analysis, frequently lust 50 to 100 K above its cure temperature, no
degradation effects or gas generation occur so that only the first two terms of the
general equation pertain (i.e., conduction and enthalpy rise).
Coming forward into the hotter reaction zone, defined approximately as the
temperatures between the upper and lower knees of the TGA, the full equation must
be used for the material's description. Because of the exceptionally large energy
accommodation possibilities, it is this reaction zone that has been the subject of most
modeling efforts for ablators, especially before the advent of the phenolic systems
whose highly carbonaceous chars contributed insulative, cracking, and high-emittance
effects. However, because of the complexity of this state, most analyses are primarily
boundary matches to the data and analyses of the virgin and char zones. Laboratory
efforts at really significant contributions to the calorimetric thermochemistry of this
zone have been only partially successful and then, only for a few materials. One of the
more sophisticated of these studies, including direct laboratory determinations of the
heat of gas formation, was performed by GE-RESD on the Voyager Lander Heat Shield
Study in 1967 (ref. 12).
25
Thechar layer presentsonly slightly less complexity in itself, with only theremoval of the decompositionterm but the additionof a surfaceboundarymatchingproblemandthe experimentaldifficulties of extremehigh-temperature technologywhichare involved in obtainingmeaningfulablationor laboratory data. The very"refractoriness" of the char - its resistanceto heat - makesmeasurementsoncharringcap {over a deg_:adation and virgin substrate) operationally all but impossible. Considerthe terms in the complete equation, minus only the degradation term.
If char thermal conductivity were being sought, the portion of total energyaccommodation involved in this parameter, _tnet, is (ref. 9) on the order of 10 percent
of the total heating rate for a low-angle, low heat flux trajectory. It would be even
lower for ballistic entry. Thus char thermal conductivity would appear to be too
completely masked by other contributions to heat flux when a complete simulation
sample is tested. This problem has been circumvented in the development of the
GE-RESD transient technique by the following procedure that assures both the
representative validity* of the char material and the test technique.
First, the char sample is prepared in a plasma jet or recovered from a flightvehicle. Then the char cap is removed for instrumentation and test. At this point
in its temperature-time history, the specimen is no different from the cap on the
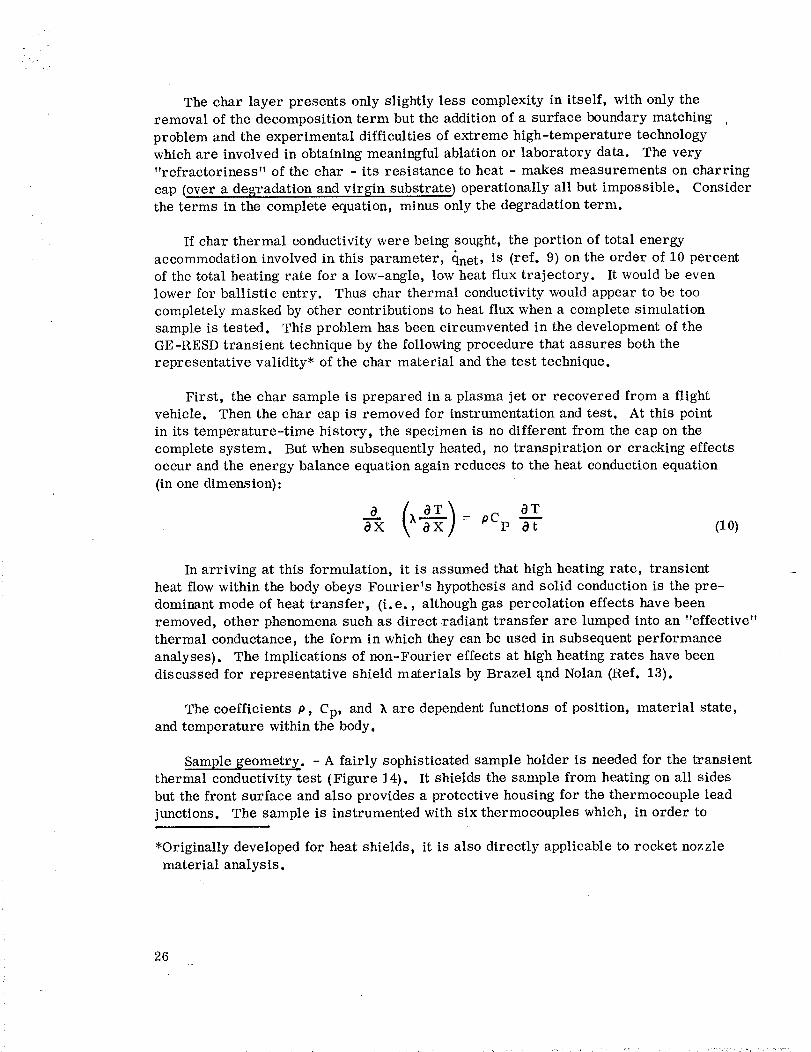
complete system. But when subsequently heated, no transpiration or cracking effects
occur and the energy balance equation again reduces to the heat conduction equation
(in one dimension):
/_ 0T _= 0T\ -g-f} pep (lo)
In arriving at this formulation, it is assumed that high heating rate, transient
heat flow within the body obeys Fourier's hypothesis and solid conduction is the pr e-
dominant mode of heat transfer, (i. e., although gas percolation effects have been
removed, other phenomena such as direct radiant transfer are lumped into an "effective"
thermal conductance, the form in which they can be used in subsequent performance
analyses). The implications of non-Fourier effects at high heating rates have been
discussed for representative shield materials by Brazel _nd Nolan (Ref. 13).
The coefficients p, Cp, and _ are dependent functions of position, material state,and temperature within the body.
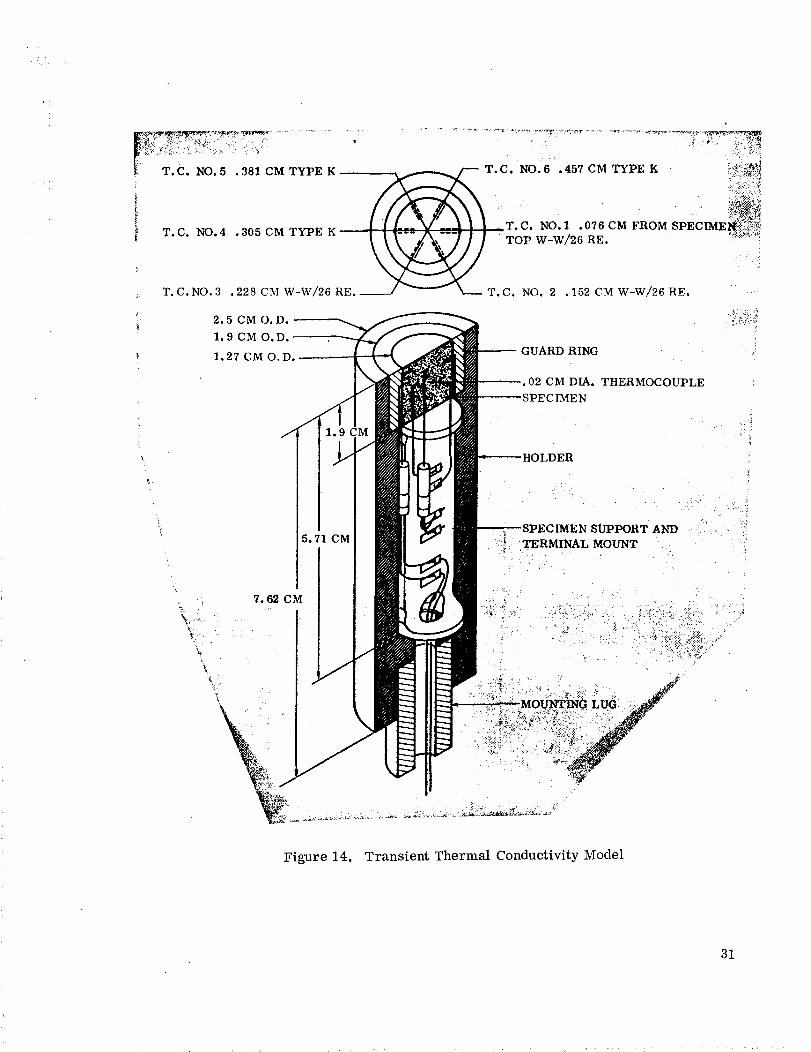
Sample geometry. - A fairly sophisticated sample holder is needed for the transientthermal conductivity test (Figure 14). It shields the sample from heating on all sides
but the front surface and also provides a protective housing for the thermocouple lead
]unctions. The sample is instrumented with six thermocouples which, in order to
*Originally developed for heat shields, it is also directly applicable to rocket nozzle
material analysis.
26
minimize measurementserror, enter the cylindrical sampleradially to a depthof 0.5cm alongisothermal planes. Twotypesof ultra miniature thermocouplesensorswerepurchased(from Robinson-Halpern)for this test. W-W/26Rethermocouples, in 0.02cm diameter tantalum sheathingare usedin the three uppermosttemperaturemeasure-ment positionsbecauseof their high temperaturecapability andchromel-alumel thermo-couples, in 0.02 cm diameter stainless steel sheathing,are usedat the three lowermeasurementpositions. Thethermocoupleleadwires leavethe holder througha holein the mountinglug. Figure 15 showsan unassembledspecimenholderwith the speci-mentready for instrumentationandFigure 16 showsthe instrumentedspecimen.
Experimental procedure. - Initially, it was proposed that either a small TandemGerdien arc facility or a CO2 laser would be used as a heat source for the thermal
conductivity tests. As it turned out, the particular laser available did not have
sufficient power to produce the heating rates required when the beam was diverged to
the specimen size. As a result, the small arc facility, which had previously been used
as a heat source for the transient thermal conductivity tests was again used (Figure 17).The test model was mounted on a pneumatically activated sting which moved the speci-
men into the arc flow for a preset heating time.
Midway through the testing program, a transformer failed in the power supply ofthe small arc and could not be repaired in time to complete this program. The next
step was to try an oxyacetylene torch as a heat source but the heat flux output was too
low to be useful. We therefore utilized the hyperthermal arc facility and were eventually
able to complete the major part of our testing at that facility. Figure 18 shows the
orifice of the arc and two samples mounted on pneumatic stings on either side of the
arc flow. Thus duel specimen setup conserved the number of times the arc needed to
be lit and accelerated the testing schedule. The major disadvantage of this facility was
the increased erosion of the sample due to the much higher flow. The greatest erosion
occurred at the interface of the guard ring and the specimen and resulted in early
thermocouple failure. When the retaining lip on the guard ring eroded through, it
allowed the arc flow to enter the holder and burn off the exposed portion of the thermo-
couple sensors at the side of the specimen.
The last set of samples, cellulose phenolic char, needed a heat flux lower then
that which could readily be obtained with the larger thermal arc facility. We therefore
used a Linde torch facility, which is intermediate in heat flux between the oxyacetylene
torch and the hyperthermal arc facility.
The recording instrument used with all the transient thermal conductivity tests,
was an 18 channel CEC oscillograph recorder. This recording system contained an
internal calibration circuit which greatly facilitated the test setup and improved theresultant accuracy.
27
.... <:
Data reduction. - As stated above, the specimen geometry is such that essentially
one dimensional heat flow can be assumed and the defining differential equation is:
0T 0 {k 0TpCp : k (11)
In the past, }, as a function of temperature has been calculated from the measured data
by the technique which is briefly described below. Equation (11) expanded is:
0T _ k0-_T + _ (12)pCp Ot OX 2
At any given instantin time equation (12)can be written:
dxd-_-k= fa3al-X a2]
where a1, a 2, a 3 are all functions of X and are known.
(13)
0T 0 2 T 3T
al : 0"--_ a2 - X 2 a3 = pCP0
Then, knowing the boundary condition _o at some point Xo, equation (13) wasreadily solved by the Runge-Kutta numerical technique for the conductivity as a function
of depth, X, in the tes_t material. Since T as a function of X is known in the sample
at that particular time, then k was found as a function of T by cross-plotting. A more
detailed description of this technique can be found in Reference 5.
The one possible disadvantage of this data reduction scheme was that it required
the second derivative of temperature with respect to time as an input. Since T was
only known at six points in the material, the exact shape of the curve of T versus X was
not known. Hence, errors likely resulted when the first derivative was taken and were
compounded drastically when the second derivative was taken.
The data reduction technique employed on this program utilized the heat conduction
equation in a different form, as shown below. Integrating both sides of equation (11)
with respect to X:
X X
pcp o-'Y -- \ ox ]x - xT-f x6X 6 X 6 \ 0X
(14)
28
then
X
0T = f pCp 0t 0X
_' _ X X6 X 6
where X is any point between the first thermocouple location, X1, and the last thermo-
couple location, X6.
This equation simply states that rate of energy flow through the sample at a
depth of X, (_ 0T/0 X ) X, is equal to the rate at which energy is being stored in the
material between the point X and X6, the integral term, plus the rate at which energy
is flowing past the point X 6, (_ 0T/0 X ) X6
Then, from equation (15),
X
f 0T IpCp _dX + _X6 0 t X 6 0X X6
_, =
x 0_T_w [ (16)0X X
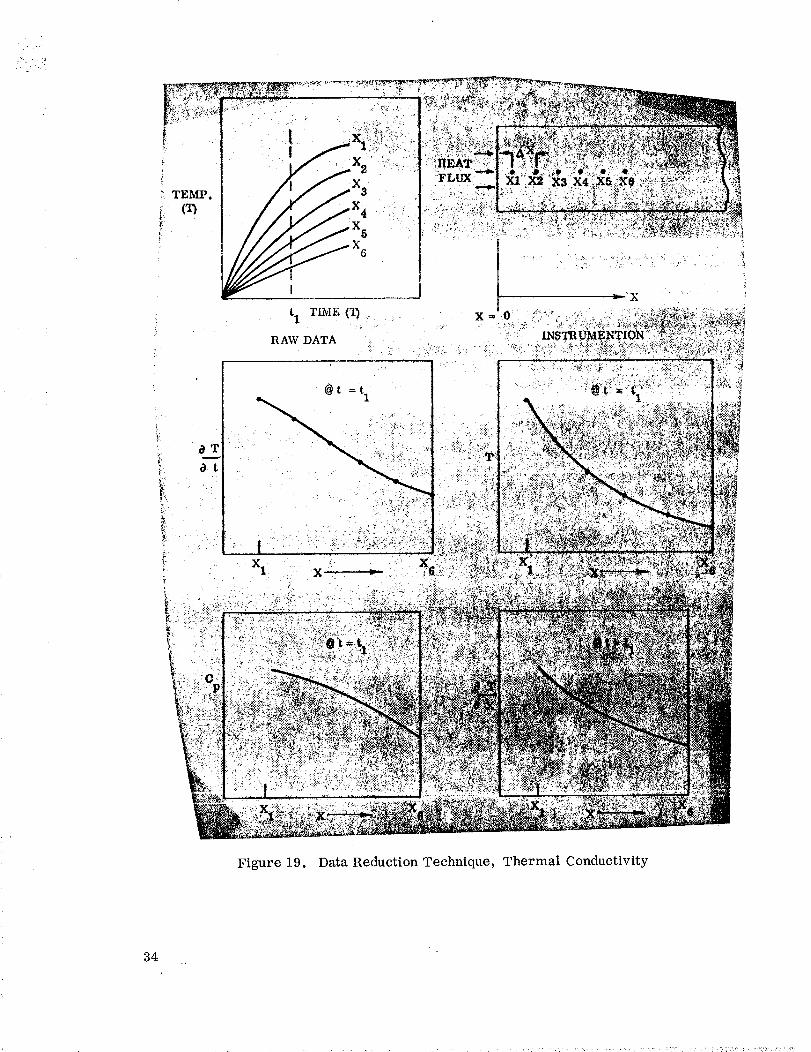
Equation (16) is the equation used for data reduction. To start reduction from the
six thermoeouple voltage traces, a temperature versus time curve was drawn for each
thermocouple position (Figure 19). Then-a time, tl, was selected at which the con-ductivity versus temperature was to be calculated. 0T/0t was then graphically
determined at t 1, for each thermocouple position, X 1 ..... X 6 and a curve wasplotted of 0T/0t versus X. Also the function of T versus X at t = tl, was plotted.
And from this curve, a plot of 0T/c]X versus X at t = t I was obtained. Cp for thematerial was usually known or could be estimated as a function of temperature and
using the T versus X curve a cross plot could be performed to obtain a Cp versus Xplot. The last curve needed was in general p versus X, but in all cases consideredhere, p was constant.
A computer program was written to perform the calculation in equation (16). The
inputs needed were functions; T, 0T/0X, 0T/0t, Cp and p (if needed) as a function of
X between X = X 1 and X = X6. Also, an input was needed for XX6 if 0T/0X [ X6 _ 0.The value of _6 could usually be obtained by steady state means, except in the case of
the char samples where t 1 was selected such that 0T/0X [ X6 was essentially zero,in which case that term containing
29
kX_ droppedout of the equation. Theoutputof the computerprogram wasa tableof temperatureand k at approximately10pointsthroughthe sample. To get moredata,the aboveprocesswas repeatedat two or three different times for eachsample.
Thetechniquewe usedhere is the sameas that usedby E. D. Smyly* with theexceptionof the useof the computer.
*E. D° Smyly, SouthernResearchInstitute, PersonalCommunicationto J. Brazel,GE, RESD10/10/69.
30 :'
_:_ :i_:i!-_i_i' ;'!:
T.C. NO. 5 .381CM TYPE K
T.C. NO.4 .305CM TYPE Kt
T.C.NO.3 .228 CM W-W/26RE.
;_ 2.5 CM O.D.
1.9 CM O.D.--
,-- T.C. NO. 6 . 457 CM TYPE K "2',_
_ T.C. _O._ .076 CM F_O_ SPEC__,
] ] TOP,Vw/20_E.,//
T.C. NO. 2 .152 CM W-W/26RE.
GUARD RING
02 CM DIA. THERMOCOUPLE
?ECIMEN
I5.71 CM
I
SUPPORT AND
....TERMINAL MOUNT
Figure 14. Transient Thermal Conductivity Model
31
t1 ThOlE(_
RAW DATAi:.
@t =t 11
Figure 19. Data Reduction Technique, Thermal Conductivity
34
TEST RESULTS
Measurements on ATJ Graphite
Density and modulus measurements were made on the ATJ for comparison withavailable data on this material. Results were as follows:
Density: 1720 kg/m 3 (Mean of five measurements). This density is typical.
Modulus: ]1.2 GN/m 2 (1.62 x 10⁶ psi) (Mean of two ultrasonic measurements
made on thermal expansion specimens at a frequency of 0.73 • 0.02 MHz). This value
is typical of the with-grain tensile modulus of ATJ. Actually, ATJ with grain tensile
moduli have been reported which range as low as 6.5 GN/m 2 and as high as 13.3
GN/m 2. A value of 11.8 has been used at GE-RESD as the maximum for design pur-
poses. Moduli reported from compression tests have generally run lower with values
as low as 4.86 GN/m 2 being reported.
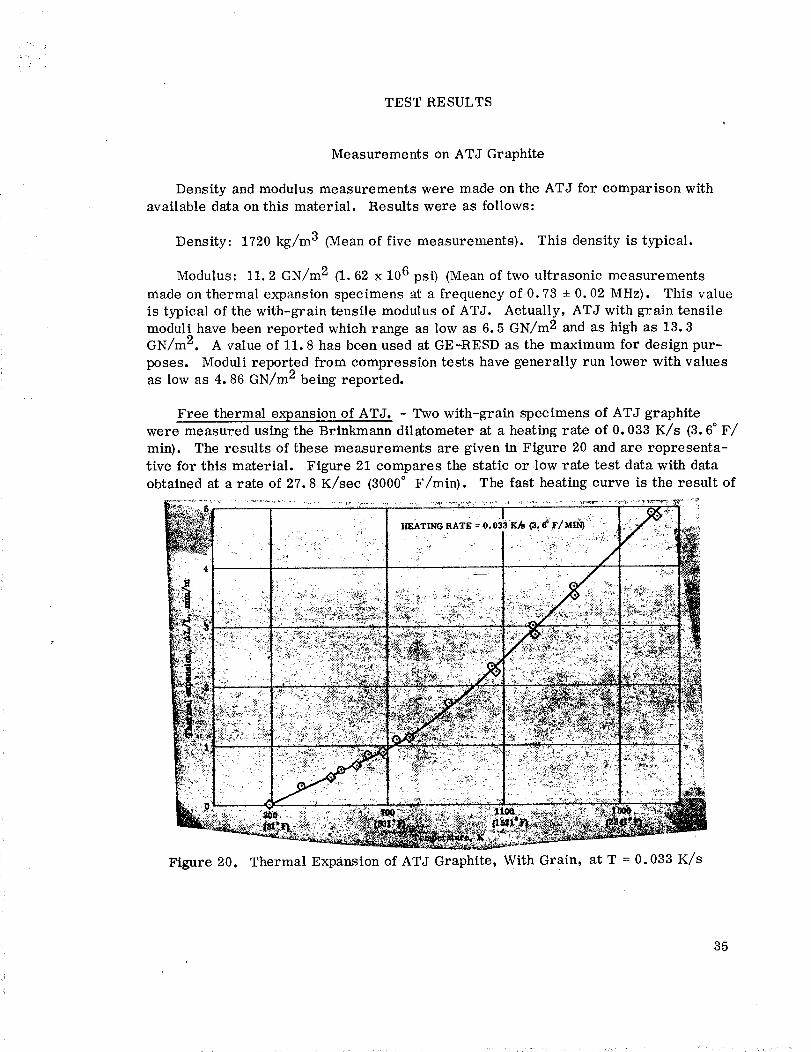
Free thermal expansion of ATJ. - Two with-grain specimens of ATJ graphite
were measured using the Brinkmann dilatometer at a heating rate of 0. 033 K/s (3.6 ° F/
min). The results of these measurements are given in Figure 20 and are representa-
tive for this material. Figure 21 compares the static or low rate test data with data
obtained at a rate of 27.8 K/sec (3000 ° F/min). The fast heating curve is the result of
I I o.o3,K,,3:¢F/M "
""' _ I .....-"!_.:.":,,._._':::_:L|_'_:_?_" - --""l "=-",_,_,_.I_!":_- _ ...._', "'_
Figure 20. Thermal Expansion of ATJ Graphite, With Grain, at T = 0. 033 K/s
35
eight tests on four long (5.08 cm) (2.0 inches) and four short (1.27 cm (0.5 inch)
specimens. The four test results at each length were averaged and the differenceof these taken to eliminate end effects (i. e., expansion of the fixture at the points
of contact with the specimen) as is described in a previous section of this report.
The differences between the fast and slow heating curves are not significant and are
probably close to the limit of resolution of the apparatus.
The range indicated on each of the data points of the high heating rate curve is the
square root of the sum of the squares of the ranges for the long and short specimens.
That is: ._
Range of AL _/(R of _L1)2 of AL2)2= ange + (Range (17)
L -L1 2
where L 1 is the length of the long specimen and L 2 is the length of the short specimen(See Test Methods section).
Restrained expansion of ATJ. - The results of restrained expansion tests on ATJgraphite are given in Figures 22 and 23, where the effective thermal expansion,
(AL/L)e ff , is plotted as a function of temperature. As noted in a previous section
(AL/L)e ff , is calculated using the relation:
_ E}-o
eff E(8)
where
E = modulus
= the expansion which is allowed to occur
a =compression stress developed as a result of restraining the thermal expansion.
This equation assumes a linear stress-strain relation.
36
For a restraint of 55percent (i. e., the quantity - a/E is 55 percent of (AL/L)eff
and the actual expansion allowed, _, is 45 percent*), the effective thermal expansion is
in excellent agreement with the free expansion data. At a restraint of 75 percent,
however, the effective thermal expansion is low at temperatures above about 1000K butthe difference is small. A comparison of free and restrained expsnsions is given in
Figure 24. The reason for this deviation at the higher stress levels is not certain but
is believed to be the result of non-linearity of the stress-strain relation.
In general, it may be said that no heating rate effect is observed for the ATJ andthat the free and restrained expansion test yield the same result.
As a part of the restrained expansion tests, modulus measurements were made by
superimposing a small cyclic load on the specimen as it was heated. This provided
the modulus-temperature data needed for equation (8). The results of these modulus
measurements are given in Figure 25. The values obtained at room temperature appear
to be typical for compressive data for ATJ and the scatter is also typical.
Considering the modulus data, the scatter wss such that there appeared to be no
justification for drawing any kind of curve other than a straight line through-the data
points. This is illustrated by the points shown on the curves obtained at 55 percent
restraint. In using these modulus data, it should be kept in mind that at room tem-
perature the modulus is measured at low stress but the measurement is made at in-
creasingly negative stress as the temperature increases. This may be seen by refer-
ring to Figure 11.
Transient thermal conductivity of ATJ. - The graphite specimens were instrumented
with a thermocouple spacing of 0.15 cm (0.017 inch} and were tested with a heat flux of1.25 x 107 watts/meter 2 with the Tandem Gerdien Are Facility. The results are shown
in Figure 26. The data agree well with the steady state conductivity curve althoughconsiderable scatter is observed. This scatter, however, is normal for this type of
conductivity measurement.
The heating rates involved in the transient thermal conductivity test are shown in
Figure 27.
Measurements on MX 2600
Density of the MX 2600 silica phenolic used on this program was 1710 kg/m 3 (107lb/ft3). Ultrasonic measurements indicated a with-laminate modulus of about 21 GN/m 2
(3.0 x 10⁶ psi}. However, as will be noted below, the modulus obtained in the restrained
*The degree of restraint, oR, may be defined as %R = 100( -
(o,/E)
37

spoq_oIAI _uolgu_a& pu_ o!_S _o uos!a_duzoo 'u!_D q:_!A_ 'f,LV _o uo._su_dx_t T_UZ_oq_L •Ig ozn_!d
)i_:_!_:_7_:': ,
:',}i_,, _!:',_!.: I¢ [
_5_i:C": :7:i_ [
t:_ii}'!i.y: ;
'I_2!-:i!!i:i_!:!:,;,
O0
, '.,
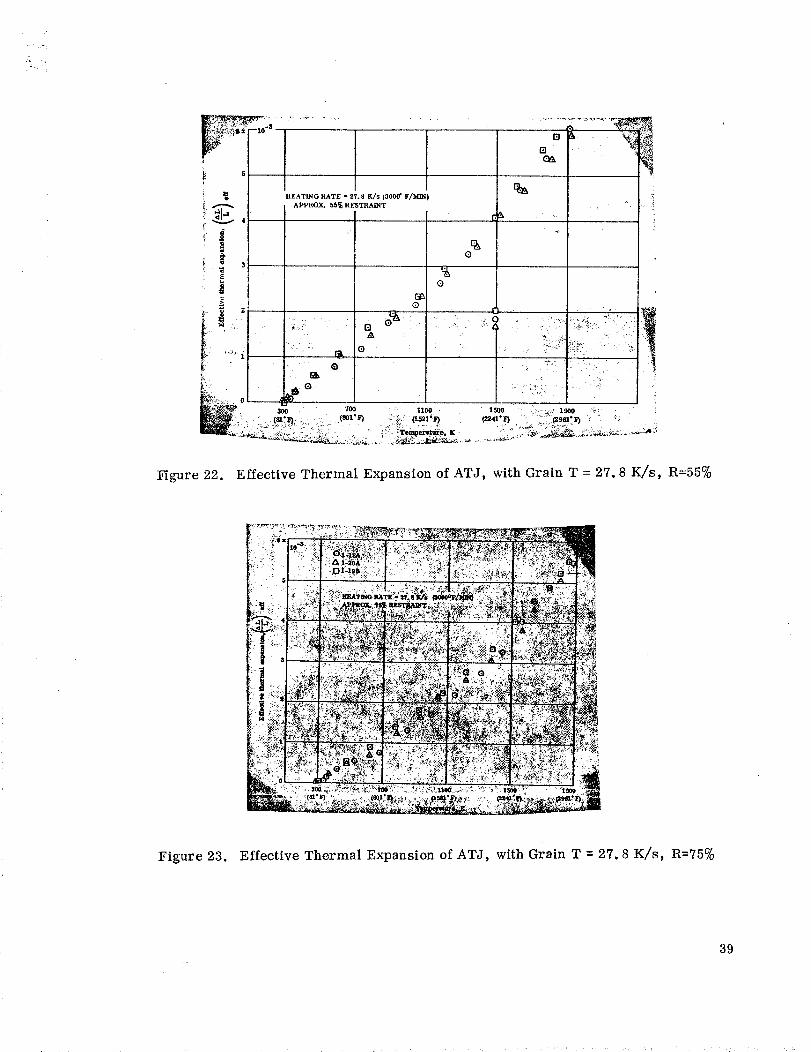
Figure 22. Effective Thermal Expansion of ATJ, with Grain T = 27.8 K/s, R=55%
Figure 23. Effective Thermal Expsnsion of ATJ, with Grain T = 27.8 K/s, R=75%
39
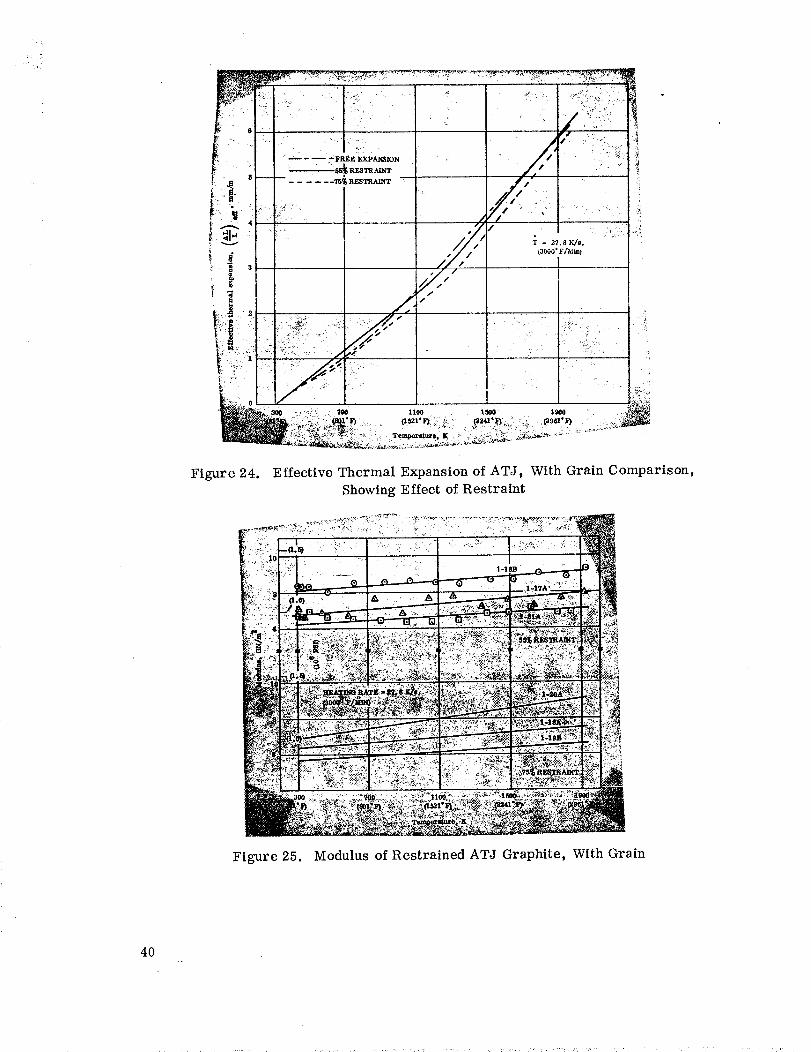
• 7@0 U00 1_oe
Iv/ .i_.:_.....
/ _ ........ -! ):ii.2- "27.8 K,/s,
(3000" F/"_ m_
Figure 24. Effective Thermal Expansion of ATJ, With Grain Comparison,
Showing Effect of Restraint
_.
-. ......... _ ,_
Figure 25. Modulus of Restrained ATJ Graphite, With Grain
4O
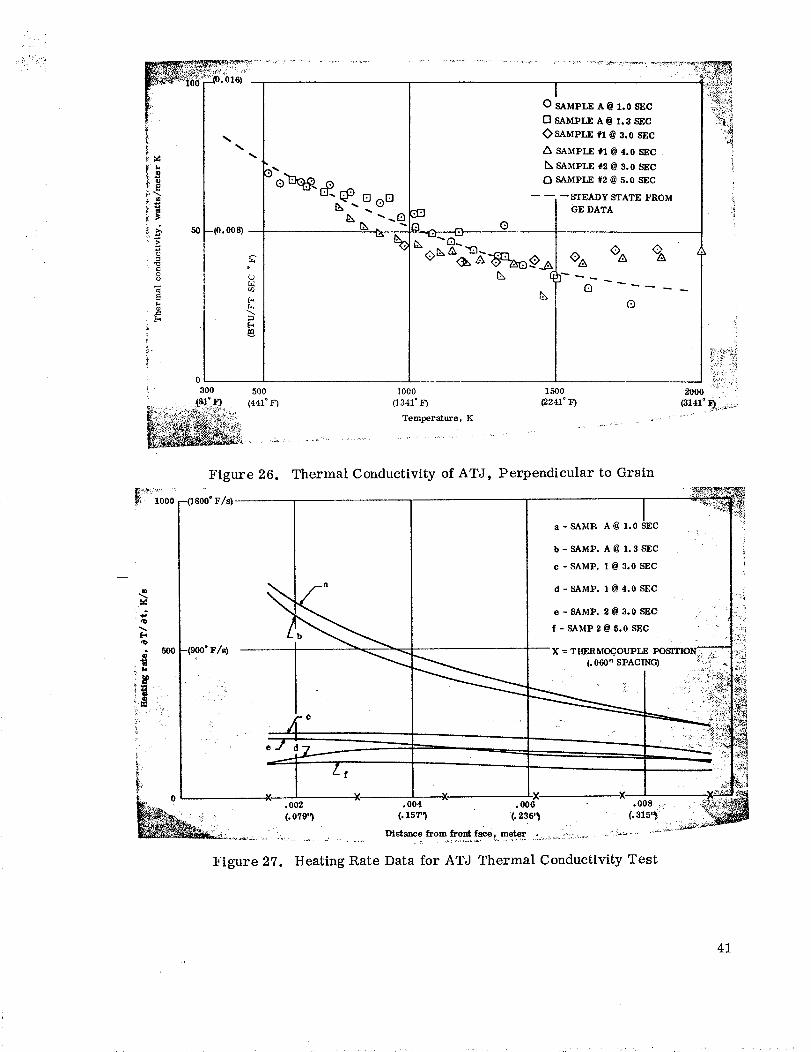
?
I il
', LI
_ " 50 _(o.oo8)-_
_' r,.
b.
N
IO SAMPLE A @ 1.0 $EC
n SAMPLE A @1.3 S_C<>SAMPLE #1 @ 3.0 SEC
/k SAMPLE #1 @ 4.0 SEC
{XSAMPLE #2 @ 3.0 SEC
SAMPLE #2 @ 5.0 SEC
_. _STEADY STATE FROM
I GE DATA
%14
):i1
300 500 1000
......... t_,_ (441° _) (134_° F)_;_;'_i:_:._:_ T_m_a_=_, K
1500(2241°
2000
c_4_°D ._
Figure 26. Thermal Conductivity of ATJ, Perpendicular to Gr8in
M
o
5o0 -(9oo"FA)
!i.
I
e-C
• /
'%"_ 'i .002(. 079")
Figure 27.
a-SAM]?. A@ ] .
b-SAMP. A@I. 3SEC [ _! i
c-SAMP. 1@ 3.0 _
d - SAMP. 1 @ 4.0
e-SAMP. [email protected]_
f- SAMP 2@ 5.0 SE
X = THERMO(_OUPLE POSITION_
Heating Rate Data for ATJ Thermal Conductivity Test
41
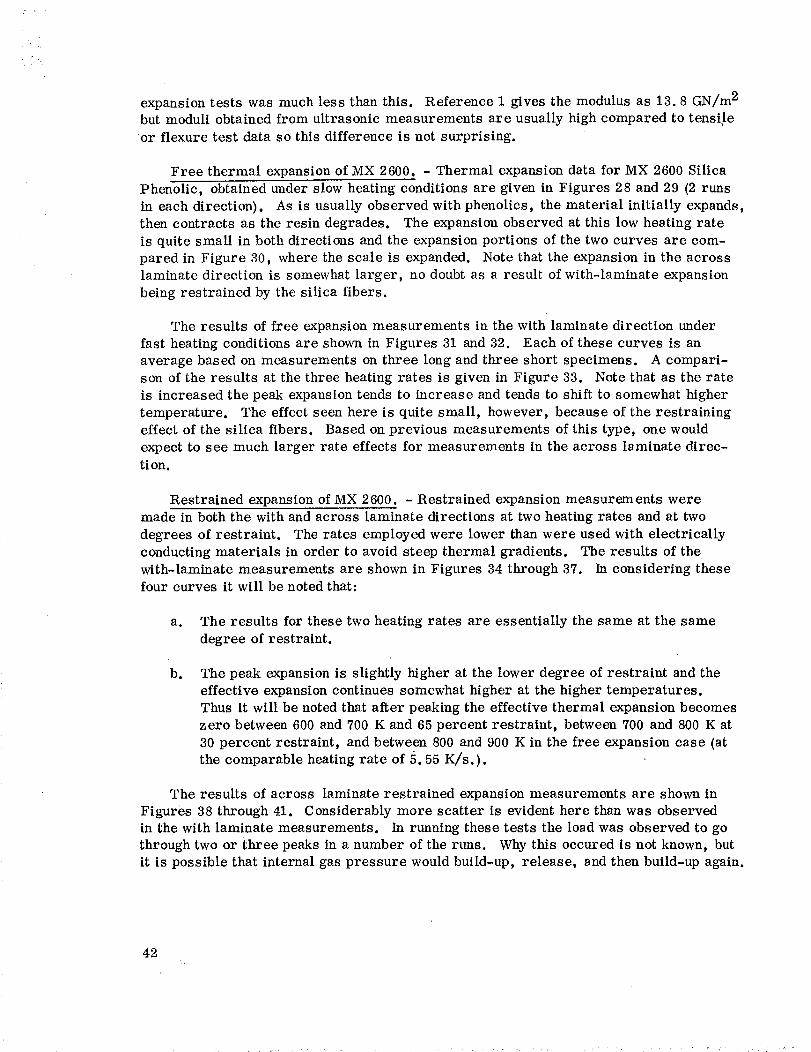
expansiontests wasmuchless than this. Reference1 gives the modulusas13.8 GN/m2but moduli obtainedfrom ultrasonic measurementsare usually highcomparedto tensileor flexure test datasothis difference is not surprising.
Free thermal expansion of MX 2600. - Thermal expansion data for MX 2600 Silica
Phenolic, obtained under slow heating conditions are given in Figures 28 and 29 (2 runs
in each direction}. As is usually observed with phenolics, the material initially expands,
then contracts as the resin degrades. The expansion observed at this low heating rate
is quite small in both directions and the expansion portions of the two curves are com-pared in Figure 30, where the scale is expanded. Note that the expansion in the across
laminate direction is somewhat larger, no doubt as s result of with-laminate expansion
being restrained by the silica fibers.
The results of free expansion measurements in the with laminate direction under
fast heating conditions are shown in Figures 31 and 32. Each of these curves is an
average based on measurements on three long and three short specimens. A compari-son of the results at the three heating rates is given in Figure 33. Note that as the rate
is increased the peak expansion tends to increase and tends to shift to somewhat higher
temperature. The effect seen here is quite small, however, because of the restrainingeffect of the silica fibers. Based on previous measurements of this type, one would
expect to see much larger rate effects for measurements in the across laminate direc-tion.
Restrained expansion of MX 2600. - Restrained expansion measurements were
made in both the with and across laminate directions at two heating rates and at two
degrees of restraint. The rates employed were lower than were used with electrically
conducting materials in order to avoid steep thermal gradients. The results of thewith-laminate measurements are shown in Figures 34 through 37. In considering thesefour curves it will be noted that:
a. The results for these two heating rates are essentially the same at the same
degree of restraint.
Do The peak expansion is slightly higher at the lower degree of restraint and theeffective expansion continues somewhat higher at the higher temperatures.
Thus it will be noted that after peaking the effective thermal expansion becomes
zero between 600 and 700 K and 65 percent restraint, between 700 and 800 K at
30 percent restraint, and between 800 and 900 K in the free expansion case (stthe comparable heating rate of 5.55 K/s.).
The results of across laminate restrained expansion measurements are shown in
Figures 38 through 41. Considerably more scatter is evident here than was observedin the with laminate measurements. In running these tests the lo_d was observed to go
through two or three peaks in a number of the runs. Why this occured is not known, but
it is possible that internal gas pressure would build-up, release, 8nd then build-up again.
42
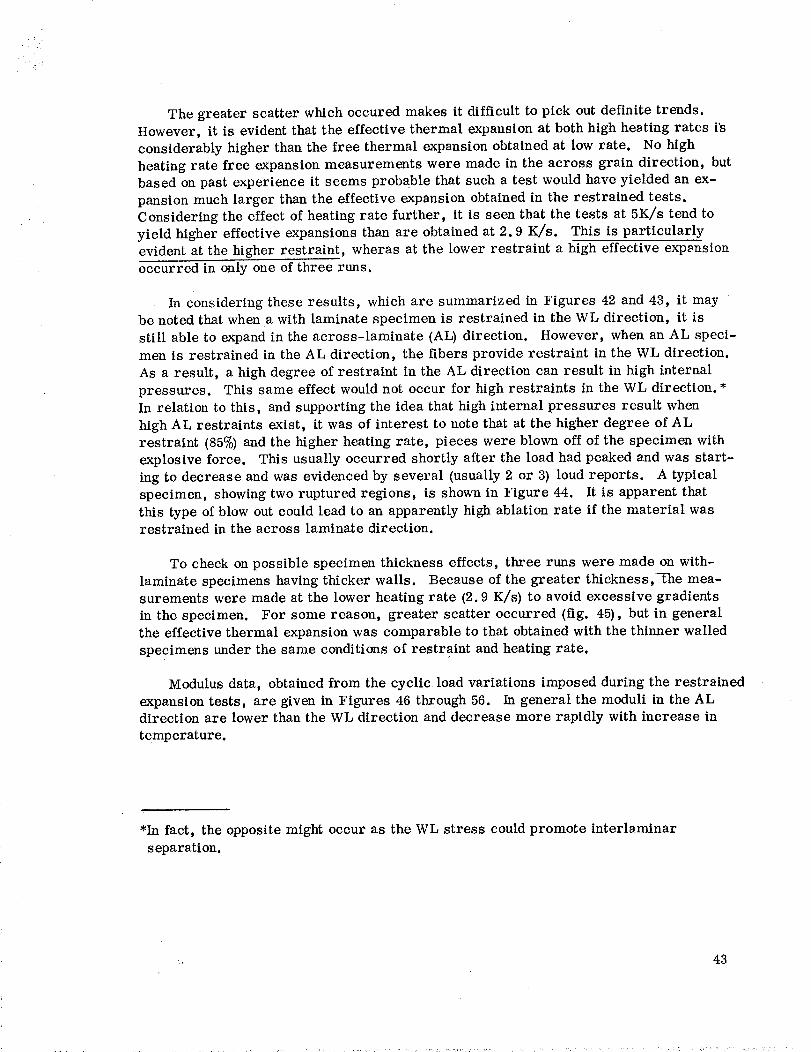
The greater scatter whichoccuredmakesit difficult to pick out definite trends.However, it is evidentthat the effective thermal expansionat bothhigh hestingrates fsconsiderablyhigher than the free thermal expansionobtainedat low rate. Nohighheatingrate free expansionmeasurementswere madein the across grain direction, butbasedonpast experienceit seemsprobablethat sucha test wouldhaveyielded anex-pansionmuchlarger thanthe effective expsnsionobtainedin the restrained tests.Consideringthe effect of heatingrate further, it is seenthat the tests at 5K/s tend toyield higher effective expansionsthanare obtainedat 2.9 K/s. This is particularlyevident at the higher restraint, wheras at the lower restraint a high effective expsasion
occurred in only one of three runs.
In considering these results, which are summarized in Figures 42 and 43, it may
be noted that when a with laminate specimen is restrained in the WL direction, it is
still able to expand in the across-laminate (AL) direction. However, when an AL speci-men is restrained in the AL direction, the fibers provide restraint in the WL direction.
As a result, a high degree of restraint in the AL direction can result in high internal
pressures. This same effect would not occur for high restraints in the WL direction. *In relation to this, and supporting the idea that high internal pressures result when
high AL restraints exist, it was of interest to note that at the higher degree of AL
restraint (85%) and the higher heating rate, pieces were blown off of the specimen with
explosive force. This usually occurred shortly after the load had peaked and was start-
ing to decrease and was evidenced by several (usually 2 or 3) loud reports. A typical
specimen, showing two ruptured regions, is shown in Figure 44. It is apparent that
this type of blow out could lead to an apparently high ablation rate if the material wasrestrained in the across laminate direction.
To check on possible specimen thickness effects, three runs were made on with-
laminate specimens having thicker walls. Because of the greater thickness, t--he mea-surements were made at the lower heating rate (2.9 K/s) to avoid excessive gradients
in the specimen. For some reason, greater scatter occurred (fig. 45), but in generalthe effective thermal expansion was comparable to that obtained with the thinner walled
specimens under the same conditions of restraint and heating rate.
Modulus data, obtained from the cyclic load variations imposed during the restrained
expansion tests, are given in Figures 46 through 56. In general the moduli in the ALdirection are lower than the WL direction and decrease more rapidly with increase in
temperature.
*In fact, the opposite might occur as the WL stress could promote interlaminar
separation.
: 43
Strength measurements on MX 2600. - Room tempersture strength measurementswere made by means of a flexure test (quarter-point loading) with results as follows
(with laminate direction).
74.2 MN/m 2
51.5
65.5
57.2
64.1
Mean 62.5 MN/m 2 (9070 psi)
At elevated temperatures, tensile measurements were made at two heating rates
(2.8 and 7.0 K/s). These results are shown in Figure 57. The difference in heating
rates employed did not appear to have any effect on the observed strength.
Transient thermal conductivity of MX 2600 char. - The silica phenolic specimens
for the transient thermal conductivity test were charred by means of the tandem Gerdien
Arc facility. The specimens were premachined to the approximate desired sampledimension and mounted in graphite holders. They were then exposed to a flux of
1.25 x 10⁷ watts/meter 2 for a duration of 25 seconds.
The density of a charred specimen was measured as a function of position by re-
moving layers from the end of the cylindrical specimen in a lathe and weighing theremainder. The density was found to be a constant value of about 1410 kg/meter 3 over
the entire 2 cm of char depth.
The specific heat of front and aft sections of another charred specimen were mes-sured with the Perkin-Elmer Differential Scanning Calorimeter at a temperature of
340 K and both found to be a _800 Joules/Kg. K. This specific heat data agrees exactly
with the specific heat measurements previously done on another silica phenolic char.
Therefore, for the purposes of data reduction, the specific heat of the sample was
assumed to be only a function of temperature, not position in sample, and that the
specific heat varied with temperature as had previously been measured.
A sample of silica phenolic char, 30-degree orientation, from a SCOUT rocket noz-
zle was supplied by J. Howell of NASA/Langley Research Center. A char density profilewas measured and it too was uniform through the thickness but a slightly higher value,
1540 kg/m 3, than the previously mentioned arc produced char. * The specific heat of
the sample measured the same as the arc char at 340 K.
*This could be due to initial density differences or as a result of some difference in
heat flux.
44
. :"..,
The silica phenolic specimens were instrumented with a thermocouple spacing of0.076 cm and tested in the Tandem Geridien Arc Facility with a heat flux of 5.6 x 10⁶.
watts/meter 2. The results of the tests are shown in Figures 58 through 62. The con-
ductivity curves in the two orthogonal directions are slightly lower than the previouslymeasured data on silica phenolic char. In general, the results are what would be ex-
pected; at low temperature the conductivity in the with grain direction is about twice
that of the across grain direction and both tend to increase with temperature as most
low conductivity materials do.
The conductivity of the rocket nozzle material, 30-degree orientation, falls between
the conductivity of the two orthogonal directions at lower temperature, as it should, but
goes higher than both at higher temperatures.
Measurements on FM 5272
Density measurements on specimens from the panel of FM 5272 cellulose phenolic
gave a value of 1320 kg/m 3 (82 lb/ft3). The with laminate modulus, as determinedfrom ultrasonic wave velocity was 8.15 GN/m 2 (1.18 x 10 6 psi).
Free thermal expansion of FM 5272. - The results of free thermal expansion mea-
surements, made at low heating rate in the Brinkmann dilatometer are shown in Figures
63 and 64. It will be noted that the peak expansion across laminate is considerably
larger than the with laminate expansion and that both peaks are larger than were ob-
served for the MX 2600. Figure 65 gives a comparison of the expansion portion of the
curves with an expanded scale.
In addition to the greater expansion shown by FM 5272 (as compared to MX 2600),this material also showed a much larger shrinkage as the resin degraded. This is
evident in Figure 66 which shows specimens of Carbitex, MX 2600 and FM 5272 after
testing in the Brinkmann dilatometer. All specimens were the same length and diameter
before being tested.
Figures 67 and 68 show the results of high heating rate, free expansion tests on FM5272 in the with laminate direction. As with the MX 2600, each of these curves repre-
sents measurements on six long and six short specimens. A comparison, showing the
effect of heating rate on free thermal expansion is shown in Figure 69. It is apparent
that not only are the peak expansions considerably larger than those observed for MX2600, but the effect of heating rate is much greater. As is typical, the peak is not only
larger but is shifted to higher temperature as the heating rate is increased.
Restrained expansion of FM 5272. - The results of restrained thermal expansion
tests on FM 5272 in the with laminate direction are given in Figures 70 through 73. It
is interesting to note that the peak effective expansions obtained are not much different
45
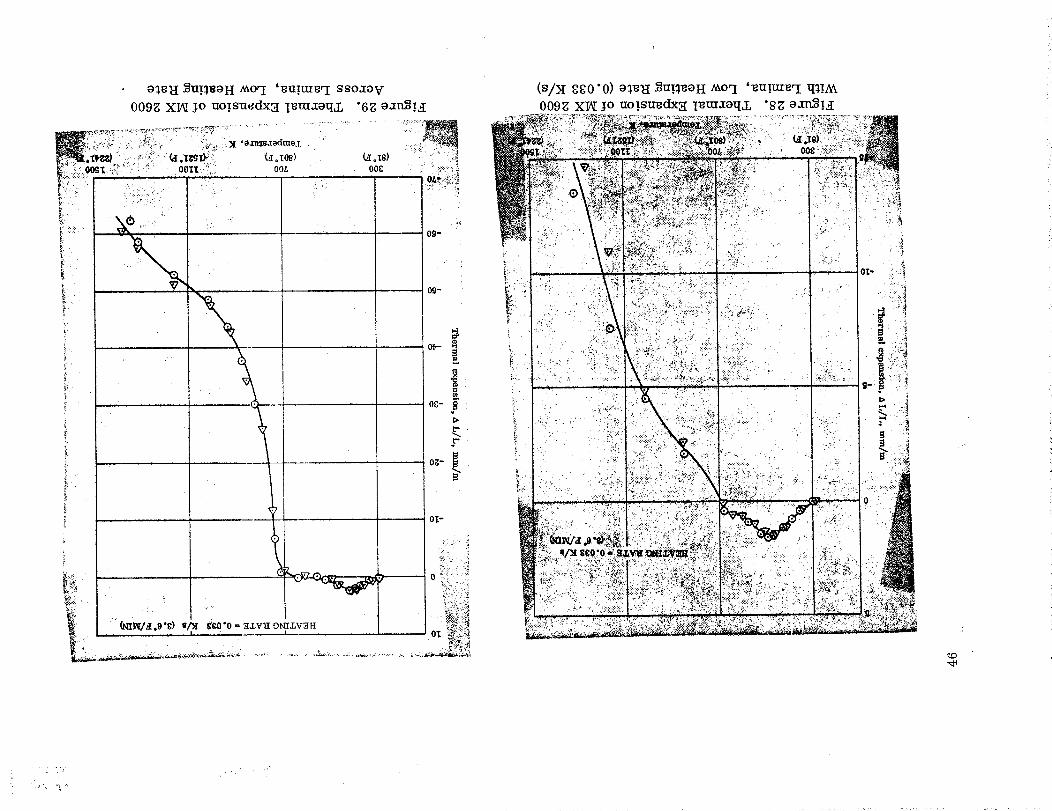
i,
o_l:I _u!_eOH _o_I '_u!tu_l ssozov
009g XIAI_o uol.suedx,_ I_tu_oqj_ "6g o_ru_!3
' 09-
..... 0_- _
?-
(s/_ _0 "0) o3s_t _u!3soH _o_I 'su!me_ tI3!_009_ X_ _o uo!su_dx:E I_m_oq,T, "f3Zoxr_!zI
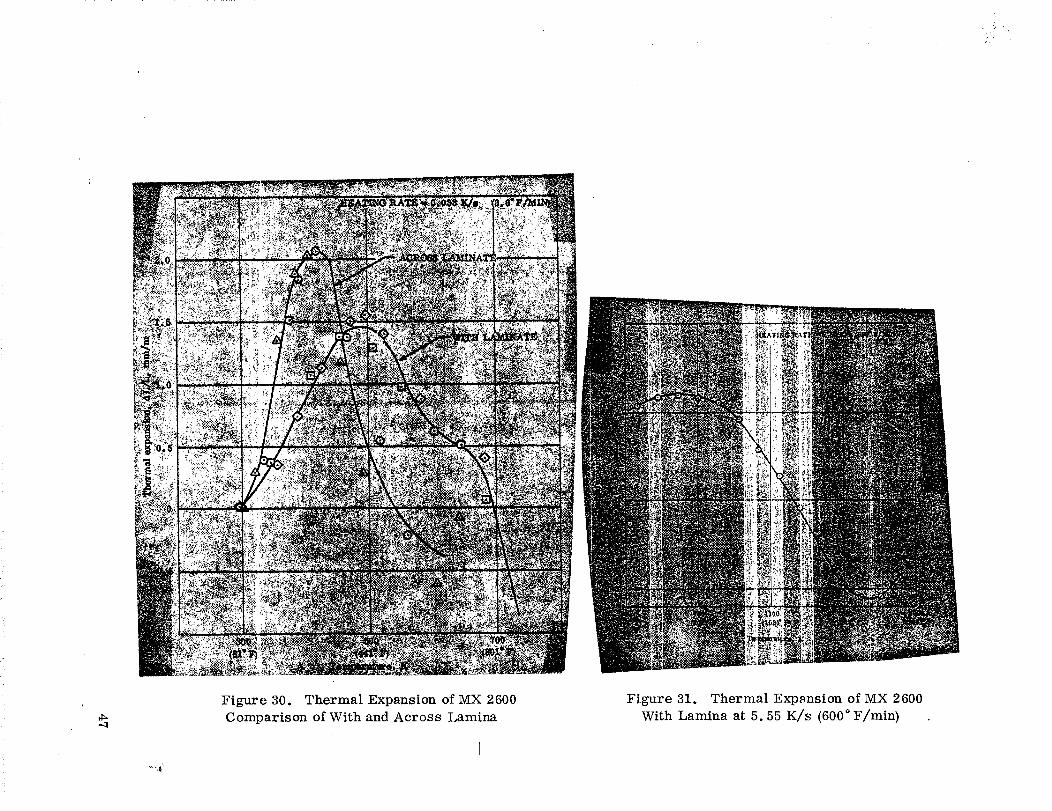
• L, .
Figure 30. Thermal Expansion of MX 2600
Comparison of With and Across Lamina
Figure 31. Thermal Expsnsion of MX 2600
With Lamina at 5.55 K/s (600 ° F/min)
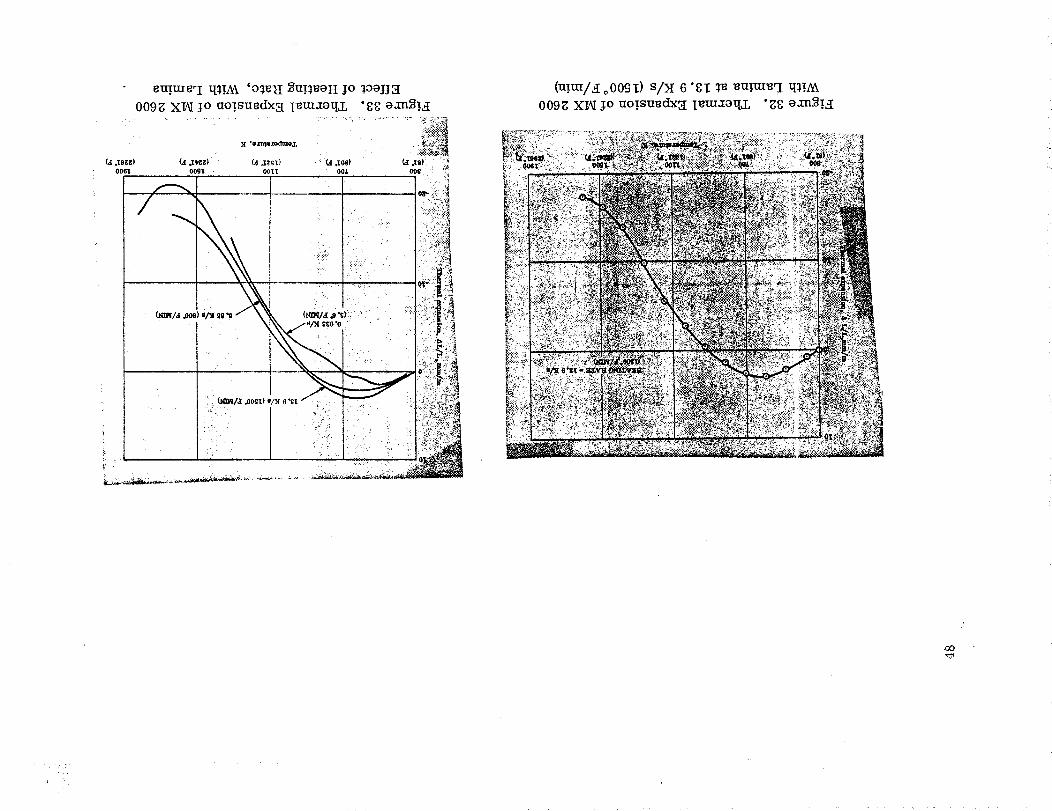
/
(uvu/,_ oO0gO s/_ 6O09g XIAI _o uo_.su_dx_
N
I_mXoq, L "gg _,zn_!_
.o0
., .:_.
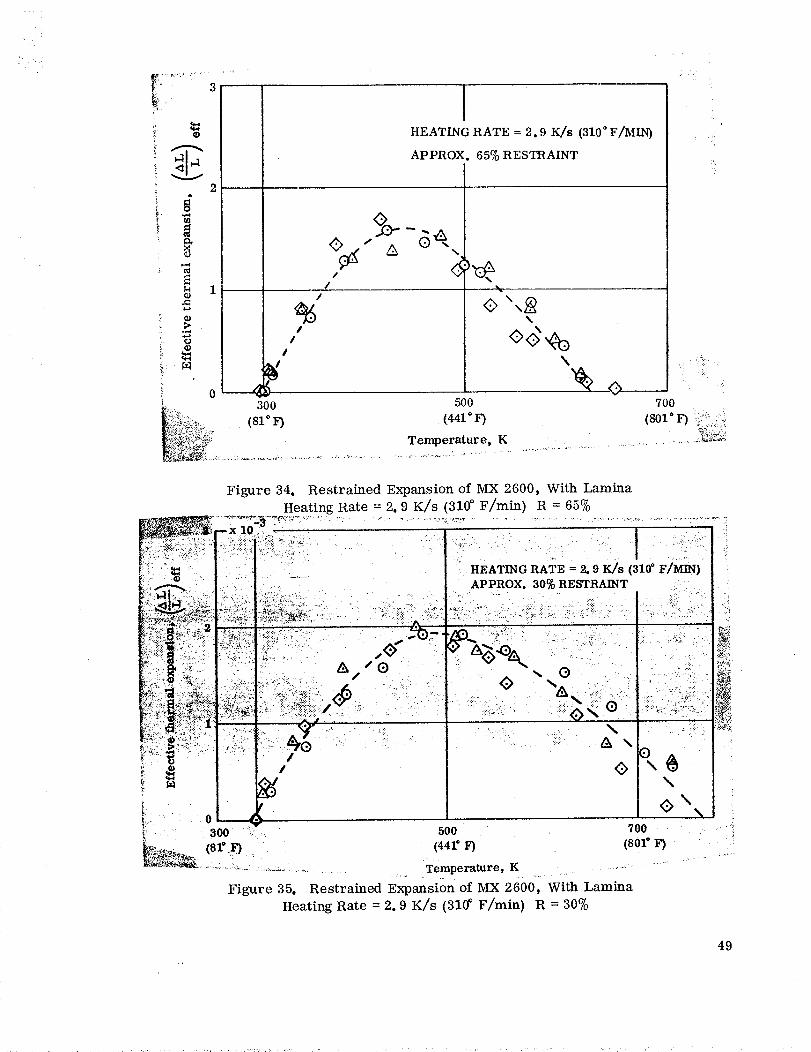
"i
, . !
o
.
1 i J
I I
I !
0L-_
//
/
/.I
/
HEATING RATE = 2.9 K/s (310 ° F/MIN)
APPROX. 65% RESTRAINT
/ /% -,
%
\
300 500
_,i_::::_,._:,_ (81°).') (441"__:'i_%_. Temperature, K;_,_ ...... ......
_:.:.::.:_. ,.,....... _........_... ................................
70(
Figure 34. Restrained Expansion of MX 2600, With Lamina
Heating Rate = 2. 9 K/s (310 _ F/min) R = 65%._77-__.__ _>'.......... . ................ _....................................... :........ ..,
--X 10 ,
. HEATING RATE = 2. 9 K/S (310 ° F/M:IN)
APPROX. 30% RESTRAINT_!!i:_!:!_,.::!..,..:_. :: ..>..ii:: ::-I .i: .,.." ..::.:....:. :i:i .. -._...::.!i:
. : -..I
/
r
.... / ..... : _ _. O .,, , ..... ": ".._-.......:: /-_ ":::' " I _ _A -:,- •: ,: .:-, :-_:i::.
N
O \o \300 500 700
(81" F) (441" F) (801" F)
.... ::-..................... Temperature, K .....
Figure 35. Restrained Expansion of MX 2600, With Lamina
Heating Rate = 2.9 K/s (310 _ F/min) R = 30%
i
49
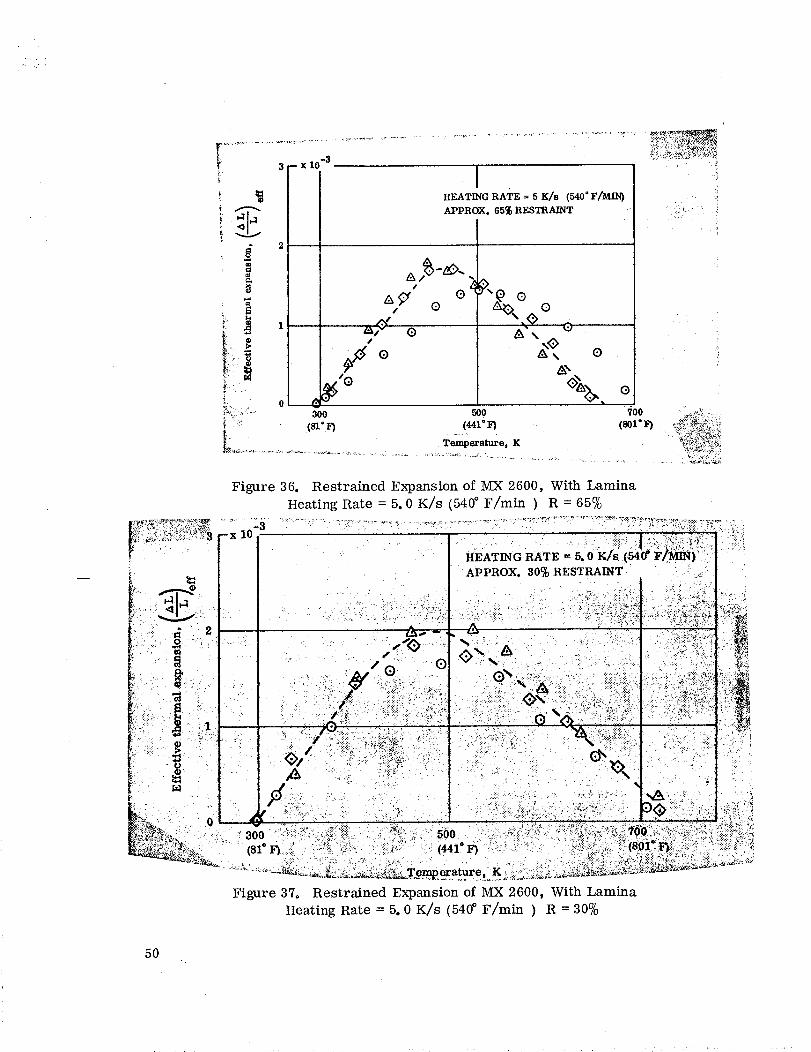
I 3 - Xlo-'
iN:,_ 2_%: ":' 300
HEATING RATE = 5 K/s (540" F/ML_
APPROX. 65% RESTRAINT
s
O
_x.O 0
_'\ ,0, 0
.Ax
%, ®
500 700 " _ "
Temperature, K - _;-_,_'_:_i _
Figure 36. Restrained Expansion of MX 2600, With Lamina
Heating Rate = 5. 0 K/s (540 ° F/min ) R = 65%
!" ,_::%_?"_,!__i::._._;"r__".3 - _
_ APPROX. 30% RESTRAINT '.- _:
";!:. &
300 ..../!_:i::'_.':,__ '::
(81 ° F):.ii!i ' i , : (441 ° F)
Figure 37. Restrained Expansion of MX 2600, With Lamina
Heating Rate = 5. 0 K/s (540 ° F/rain ) R = 30%
5O
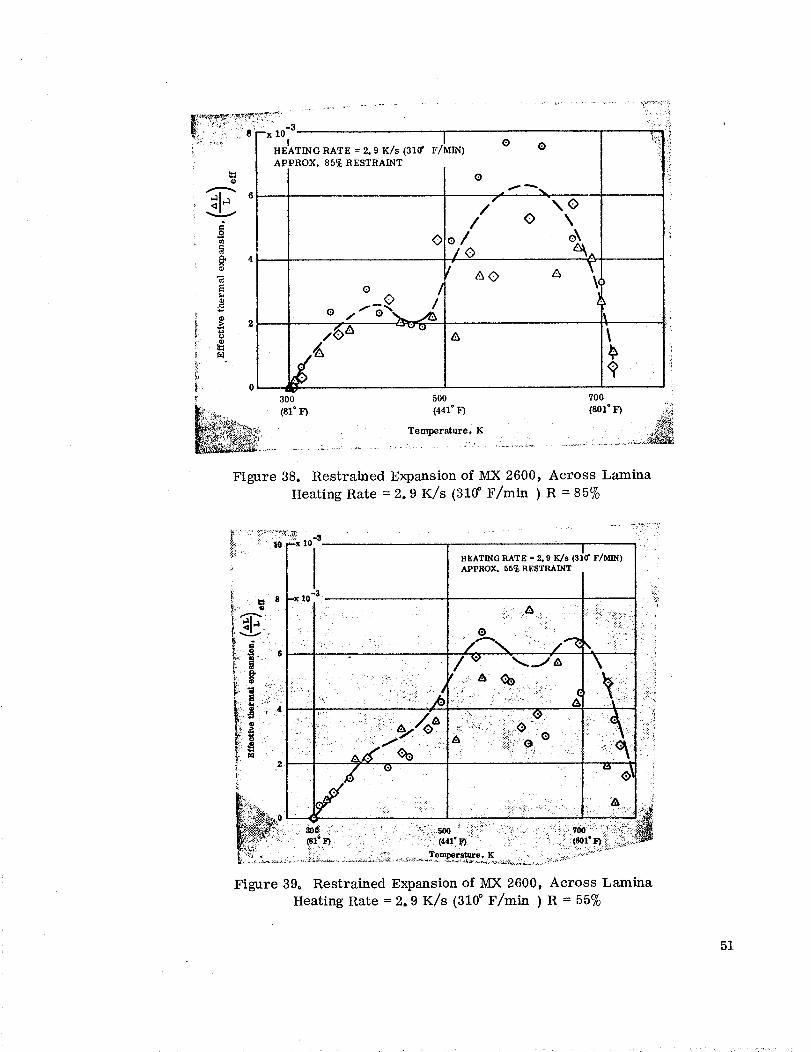
<=., ...................+ ,,,
t71 10-3 IHEATING RATE = 2. 9 K/s (310" F/MIN)
APPROX. 85_ RESTRAINT
I I® ®
_.
\00 \
o\
Figure 38. Restrained Expansion of MX 2600, Across Lamina
Heating Rate = 2.9 K/s (310 ° F/min ) R = 85%
i _.2L:r
,l!!_ 2
1
-3
--A _V I
III
I
IHEATING RATE = 2. 9 K/s (310 ° F/MIN)
APPROX. 55% RESTRAINT
/ _ __i_
.._:& .:...: . I:: ii_i ,._..._• K , +' -i::i_
\
:<,
_ ' --,::"__:i!(_:!_.... :'. _ .:::: " ." .-_: , Temperature, K _ --
Figure 39° Restrained Expansion of MX 2600, Across Lamina
Heating Rate = 2.9 K/s (310 ° F/min ) R = 55%
51
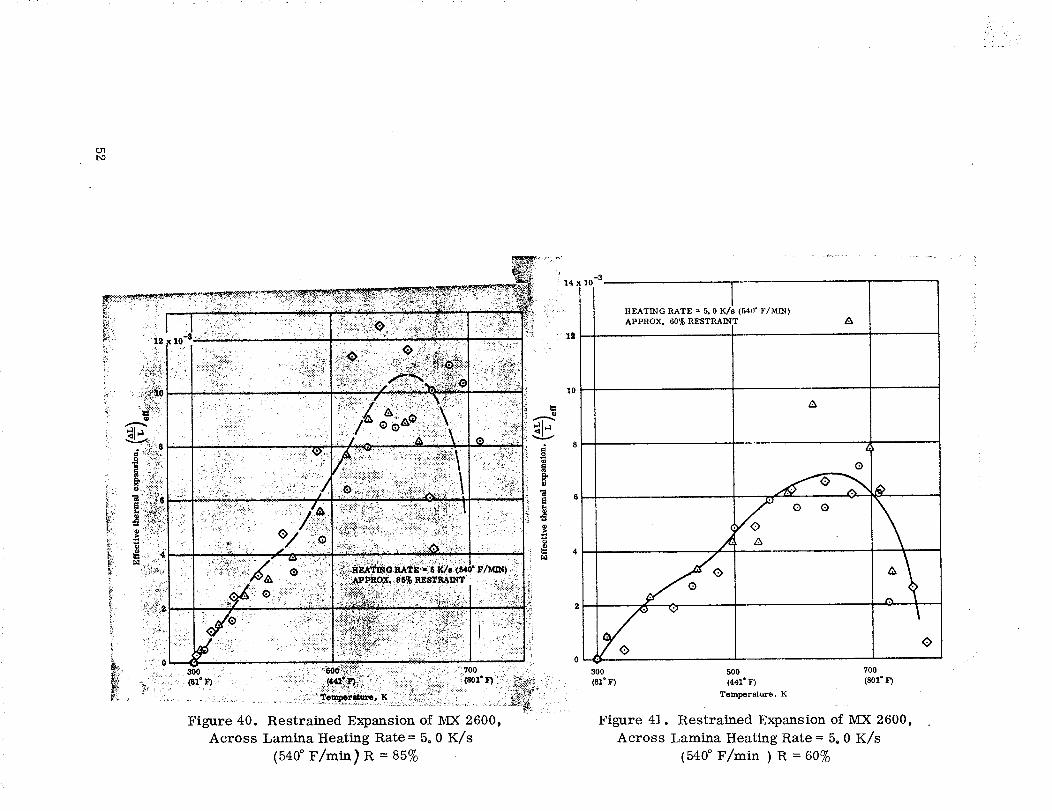
:.. .' •
7+
!:.
{
j
14 x lo -3
Figure 40. Restrained Expansion of M:X 2600,
Across Lamina Heating Rate = 5. 0 K/s
(540° F/min ) R = 85%
10
IHEATING RATE = 5. 0 Z_s (540" F/M_N)
APPROX. 60% RESTRAI_NT
,%
(9
\
300 500 700
(81" F) (441" F) (S01" F)
Temperature. K
Figure 41. Restrained Expansion of MX 2600,
Across Lamina Heating Rate = 5. 0 K/s
(540 ° F/min ) R = 60%
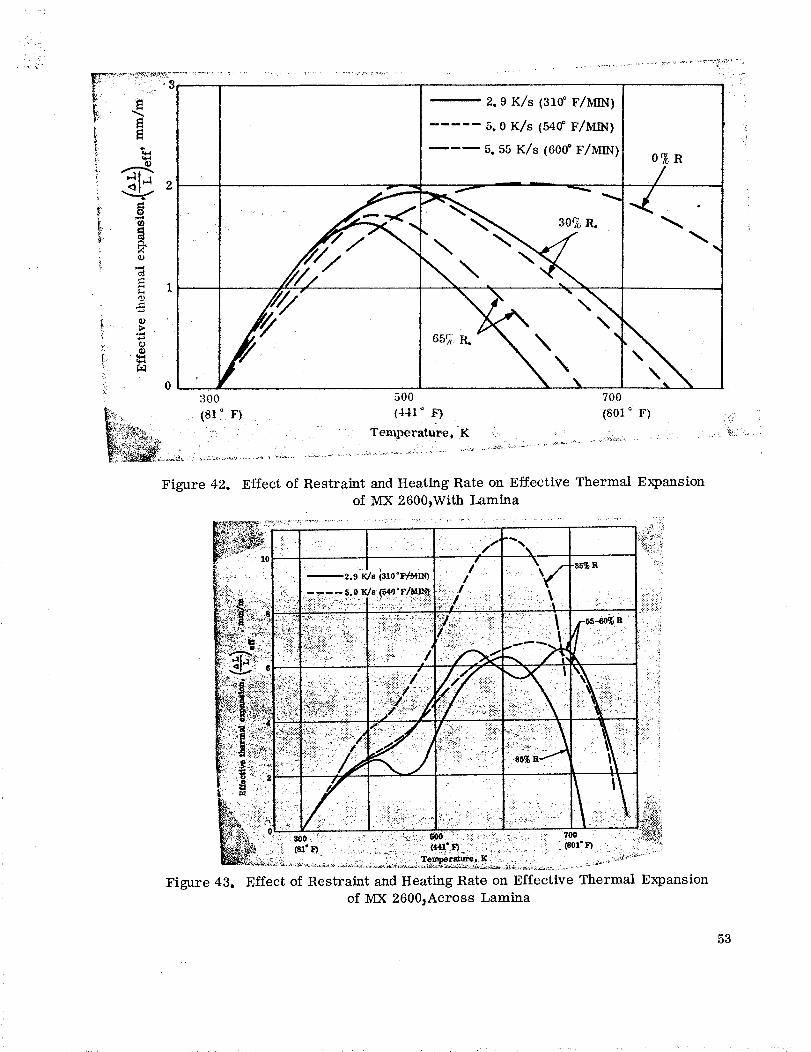
F :_:•!IL;•¸;-¸•
ei
O
2. 9 K/s (310 ° F/MIN)
5. 0 Kls (54¢ FIMIN)
5. 55 K/s (600° F/_m_)i R]
\ \
300 500 700
......:_ _ (81_ F) (441 ° F) _ (801 ° F) - .
Figure 42. Effect of Restraint and Heating Rate on Effective Thermal Expansion
of MX 2600,With Lamina
/ -85%R :__.9'_s _310"F_m) / • ..... _/-
!
::C: cl : :: :::: "?00 .<_:]:]i (81"!l :
Figure 43. Effect of Restraint and Heating Rate on Effective Thermal Expansion
of MX 2600_Across Lamina
53
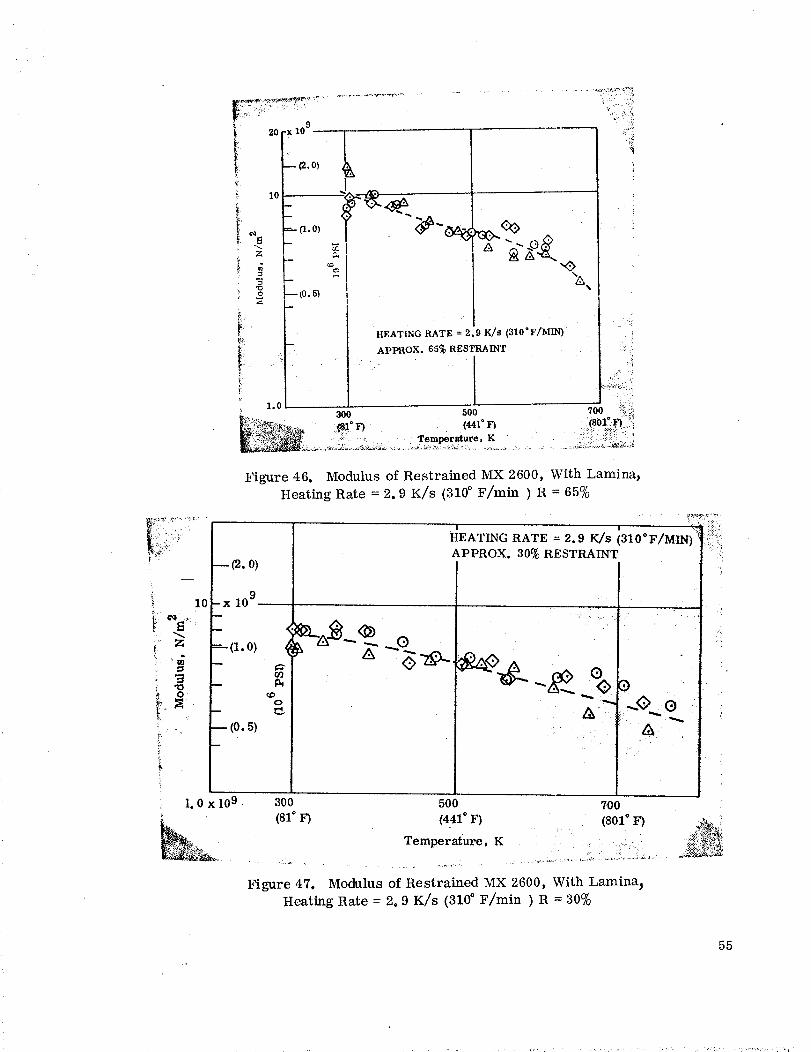
HEATING RATE = 2.9 K/s _10°F/MIN)
APPROX. 65% RESTRAINT
Figure 46. Modulus of Restrained MX 2600, With Lamina_
Heating Rate = 2.9 K/s (310 ° F/min ) R = 65%
_ lO
--(2. o)
x 10 9-
=- (1.0)
oo
0
(o. 5)
1. 0 x 109
J-.%
i , _,:: '
HEATING RATE = 2.9 K/S (310"F/MIN) !!iii/ii
APPROX. 30% RESTRAINT
,!
_ ,
300 500 700
(81 ° F) (441 ° F) (801 ° F)
Temperature, K
Figure 47. Modulus of Restrained MX 2600, With Lamina_
Heating Rate = 2.9 K/s (310 ° F/min } R = 30%
55
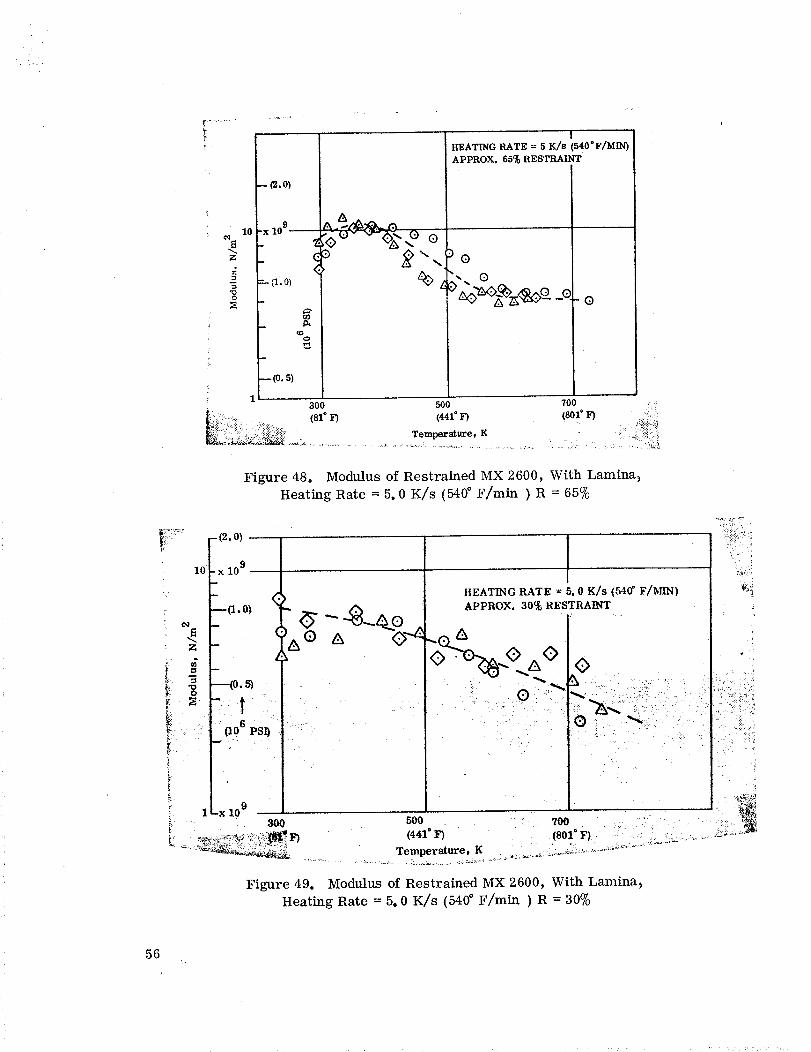
i
¢)
?
-- Ca.o)
-x lo9-----_..2 .0_?$7,, 0 0
"-- (1.0) %
r#o
¢D
g
300
10
...... (st
!
HEATING RATE = 5 K/s (540"F/MRQ
APPROX. 65% RESTRAINT
.DO
).o
500 700 ) :
(441° _) {8o1" F) •_,
Temperature, K
......... ,. :_.._ ......... _ ....... _, . ., .: ..... .:._ • , _ ::.: ,,..:.. _
Figure 48. Modulus of Restrained MX 2600, With Lamina_
Heating Rate = 5. 0 K/s (540 ° F/min ) R = 65%
¢q
lO
(2. O)
_x 10 9
.--¢o. s} • ,
_ao Ps_ i '_
-x 10 9
HEATING RATE = 5. 0 K/s (540" F/_)
APPROX. 30% RESTRAINT
o %.%0 0_ ,_ _ L ,I ,,
:
_ 30_ 500 700- _ ,-" -* (441 ° F) (801" F)
_,_,_ ....... Temperature, K ............... : ..............
:_, .[
_i!i:
,w
Figure 49. Modulus of Restrained MX 2600, With Lamina_
Heating Rate = 5. 0 K/s (540 ° F/min ) R = 30%
56
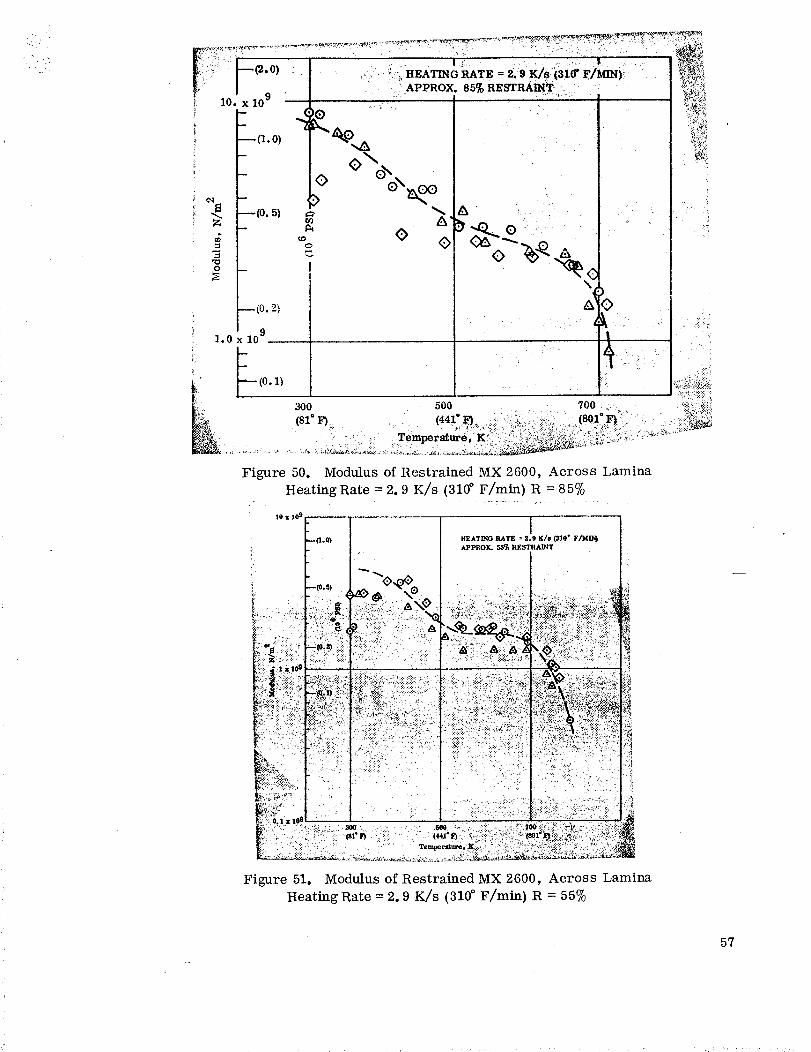
HEATING RATE = 2.9 K/s (310_ F/MIN)
APPROX 85% RESTRAINT ....
300 500 700
(81" F)._ (441"_ ,, i:i_ii .Di::_ ._ili::i_:::,........!801_,_ ,.
Figure 50. Modulus of Restrained MX 2600, Across LaminaHeating Rate = 2.9 K/s (310 _ F/rain) R = 85%
I0 x 10 _
. +iiiiiii:-::, ? : ::_..... _,_r_
Figure 51. Modulus of Restrained MX 2600, Across LaminaHeating Rate = 2.9 K/s (310 ° F/min) R = 55%
57
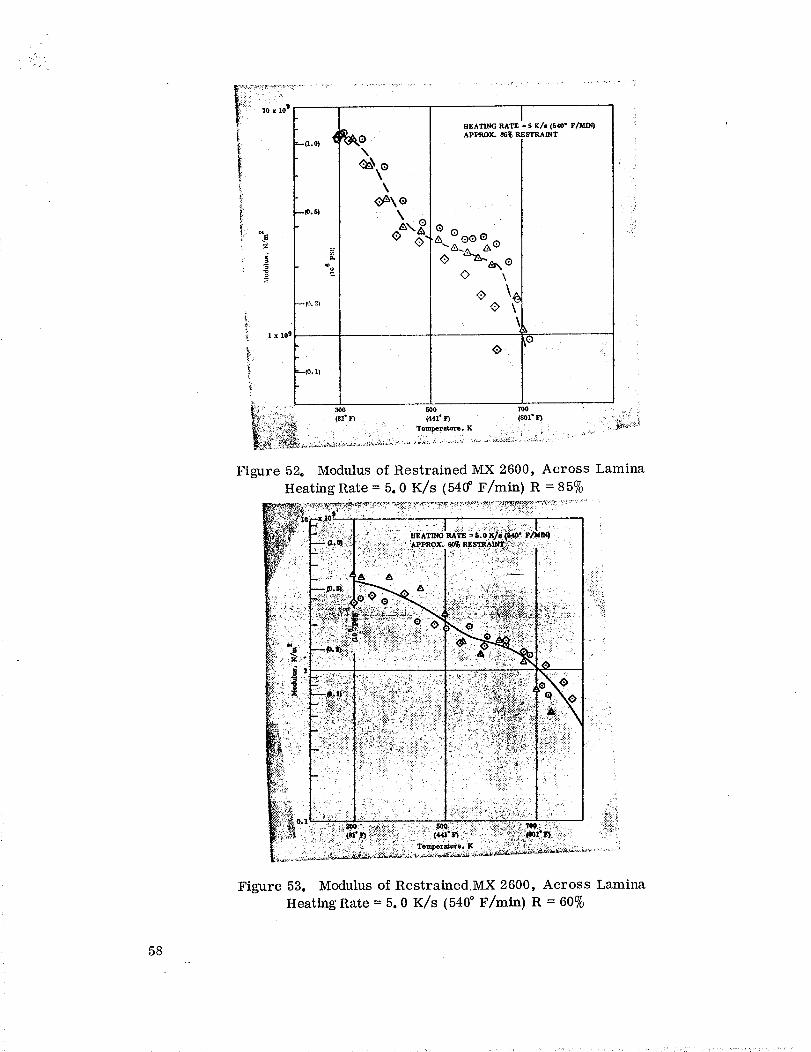
• ...:,, :
i::,_:_i_:i_,,_•,....f: -0.0)
--(0.2)
1 x 10⁹
%
\
\_\o
IHEATING RATE _ 5 K/s (540 ° F/MIN)
APPROX. 85_ RESTRAINT
® ®
0 \
_e
_?_ , _.-i _.__ (sl"_ (441"}3 (8o1"
Figure 52. Modulus of Restrained MX 2600, Across Lamina
Heating Rate = 5. 0 K/s (540 ° F/min) R = 85%
Figure 53. Modulus of Restrained:MX 2600, Across Lamina
Heating Rate = 5.0 K/s (540 ° F/min) R = 60%
58
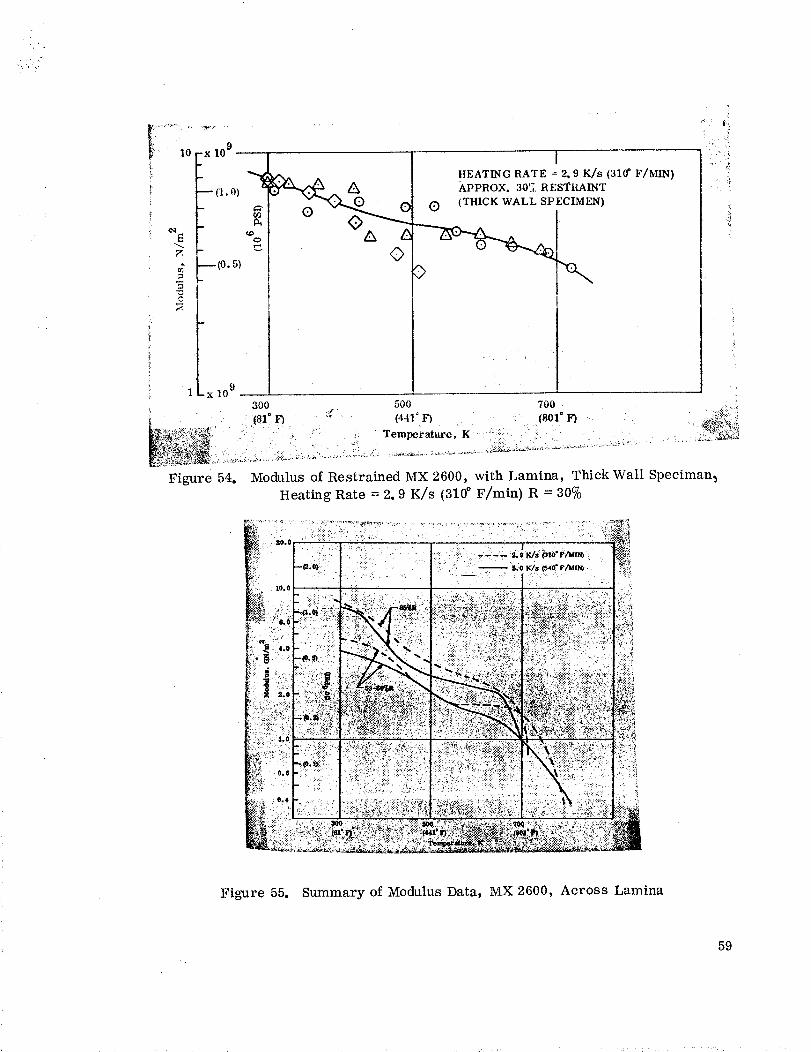
I¸ ,o lo.-X
-- (1. o)
g --(o. 5)
!1 _ x 10 9
APPROX. 30_+ RESTRAINT
O (THICK WALL SPECIMEN)
IHEATING RATE = 2. 9 K/s (310' F/b_IN)
• "_
300 z 500 700 .... :_
: {sl n (41in _soxD _6_}_i_$_': - :' Temperature, K "i:+iii_ iii '. ., i : _ .... :"+_'_'_::::'_
Figure 54. Modulus of Restrained MX 2600, with Lamina, Thick Wall Speciman_
Heating Rate = 2.9 K/s (310 ° F/rain) R = 30%
Figure 55. Summary of Modulus Data, MX 2600, Across Lamina
59
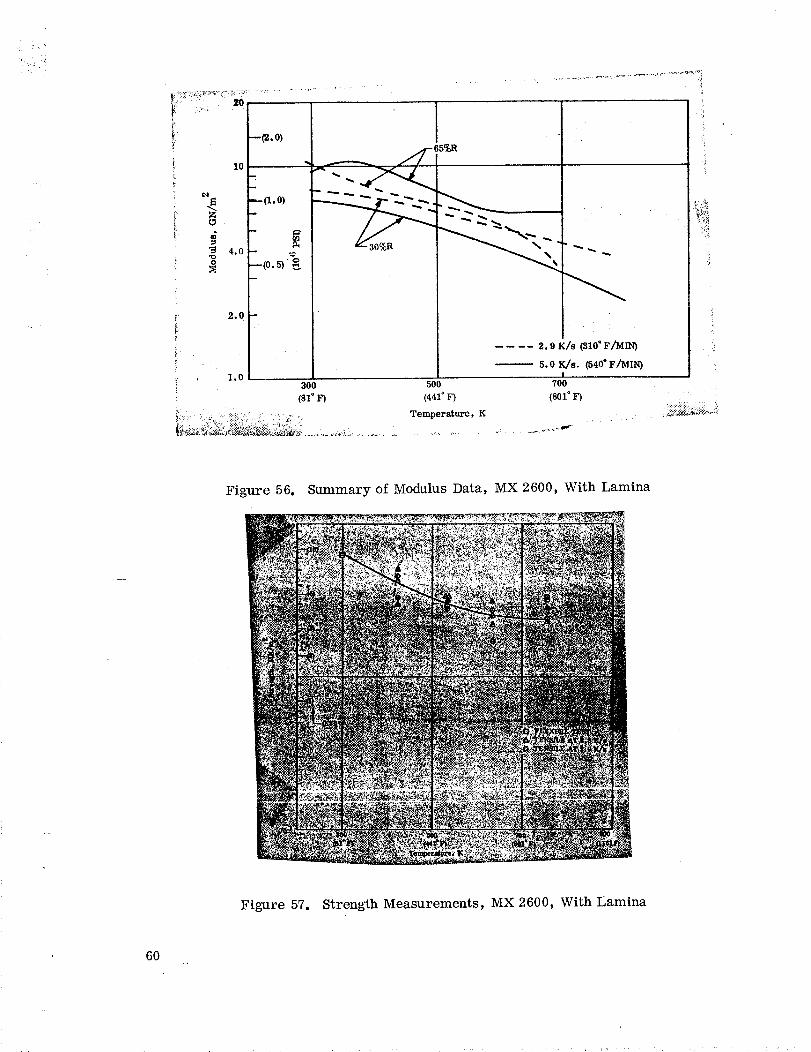
i?__:"_!i_'_i" _ .........................
.¢. o)!-7'
m
:. _ ---0.o)i -
"_ 4.0- ,_
2.0--,
1.0
/,,_- 65%R
30_
.... 2.9 K/s (310" F/MIN)
5.o K/s. (540"F/MI_)I
300 500 700
(81°F) (441°F) (801° F)
Temperature, K
Figure 56. Summary of Modulus Data, MX 2600, With Lamina
Figure 57. Strength Measurements, MX 2600, With Lamina
6O
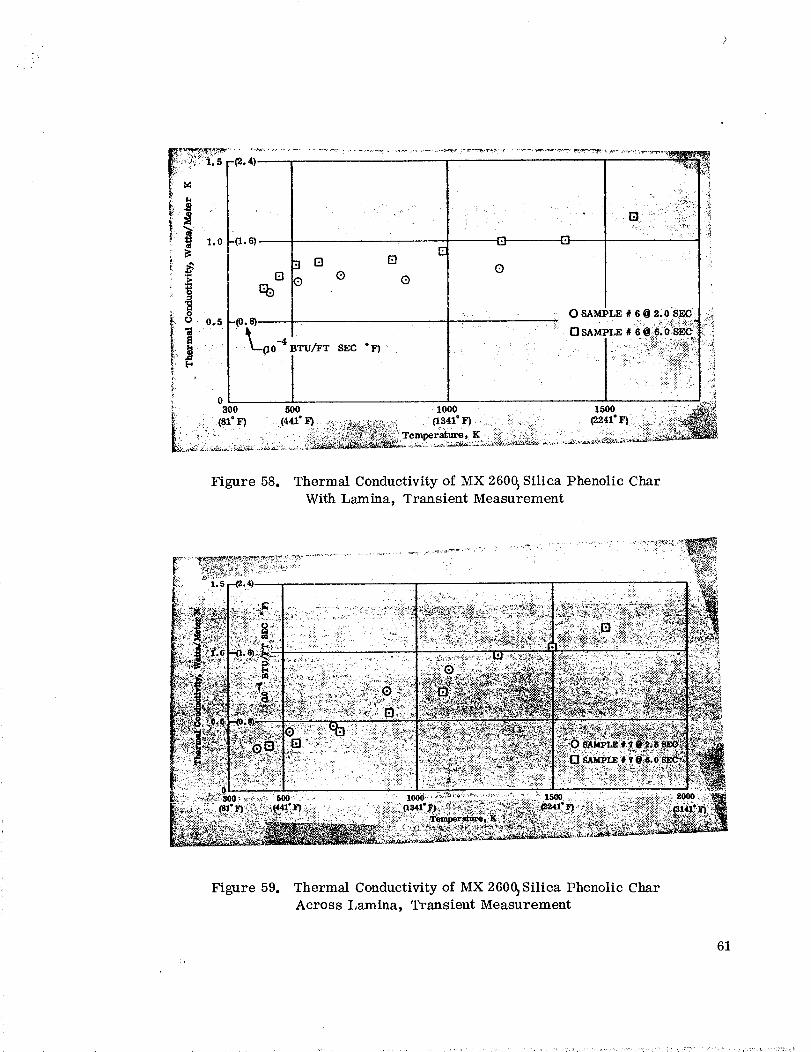
!°
1.0
0.5
3 fq
f_ QEb
Q
SEC ° F)
53
Q
[]
.
300 500 1000 1500
(81" F) (441" F) ++....:_,,:_-+_:_, _...... 0341" F) : _ + . " (2241 ° F)---.- • " - +_:_,:-:,!_;_+_+_i_.,,_+:_, .... : . ','i -
..... _- . ,:__: _._: .'_:?.)_-_:_:. Temperature, K _ ::_:i:i_. ':'_ ::i:
Figure 58. Thermal Conductivity of MX 2600> Silica Phenolic Char
With Lamina, Transient Measurement
il
• +
Figure 59. Thermal Conductivity of MX 260(_Silica Phenolic Char
Across Lamina, Transient Measurement
61
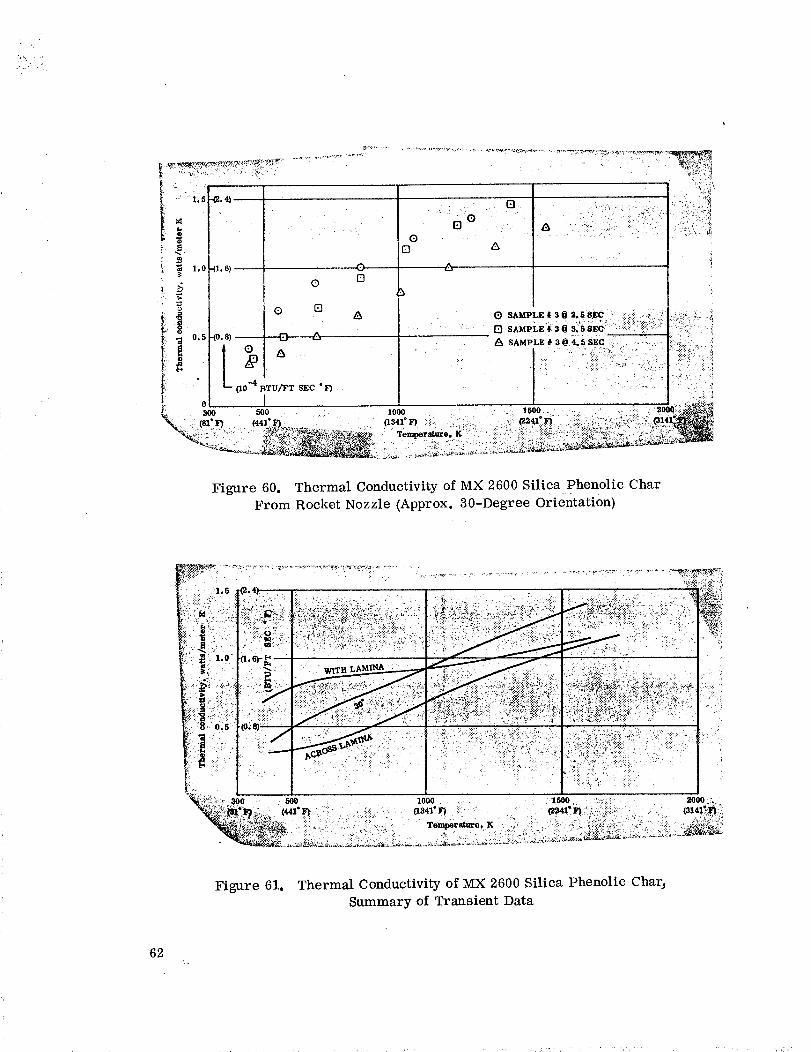
•1% " :'..-. )_s_ °.
Figure 60. Thermal Conductivity of MX 2600 Silica Phenolic Char
From Rocket Nozzle (Approx. 30-Degree Orientation)
• ::::::::: ; : _::_ _" ;! _:_"_' 1! : ::: _ 7 :r:__; "_::: : '__:' : _ :!!i _,_'_1- ,_'] 71_::i::: _]:_
:- _ ._O _ " 1::: ' ::. _ :: ;!;::;>'r_ :_ i ' -_:_: _: _:::::i_, _ ::_:::' 1' :::: :'b_?_" " _1 :i:iE7 ::_: " . :; • i:i_:::i:i:i: _.:.: :
_!_: _ 3oo _ . : iooo ...... _, , .:::::i!., . 2000,_.
Figure 61, Thermal Conductivity of MX 2600 Silica Phenolic Char_
Summary of Transient Data
62
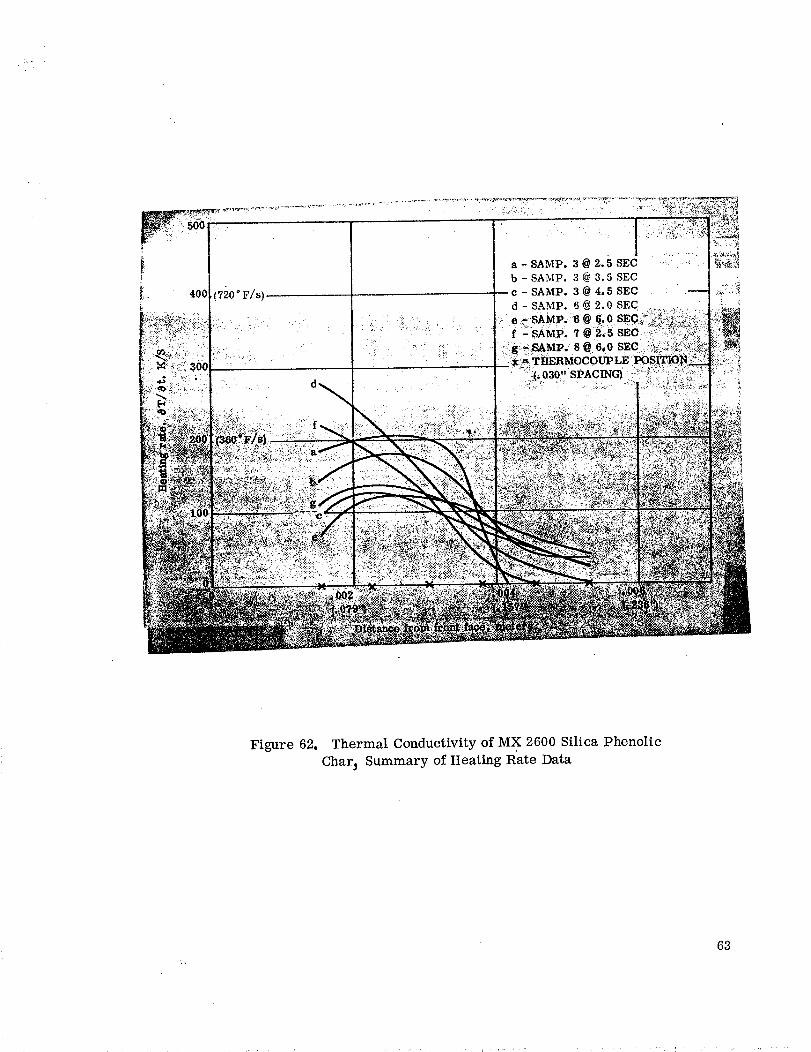
Figure 62. Thermal Conductivityof MX 2600Silica PhenolicChar_Summaryof HeatingRateData
63
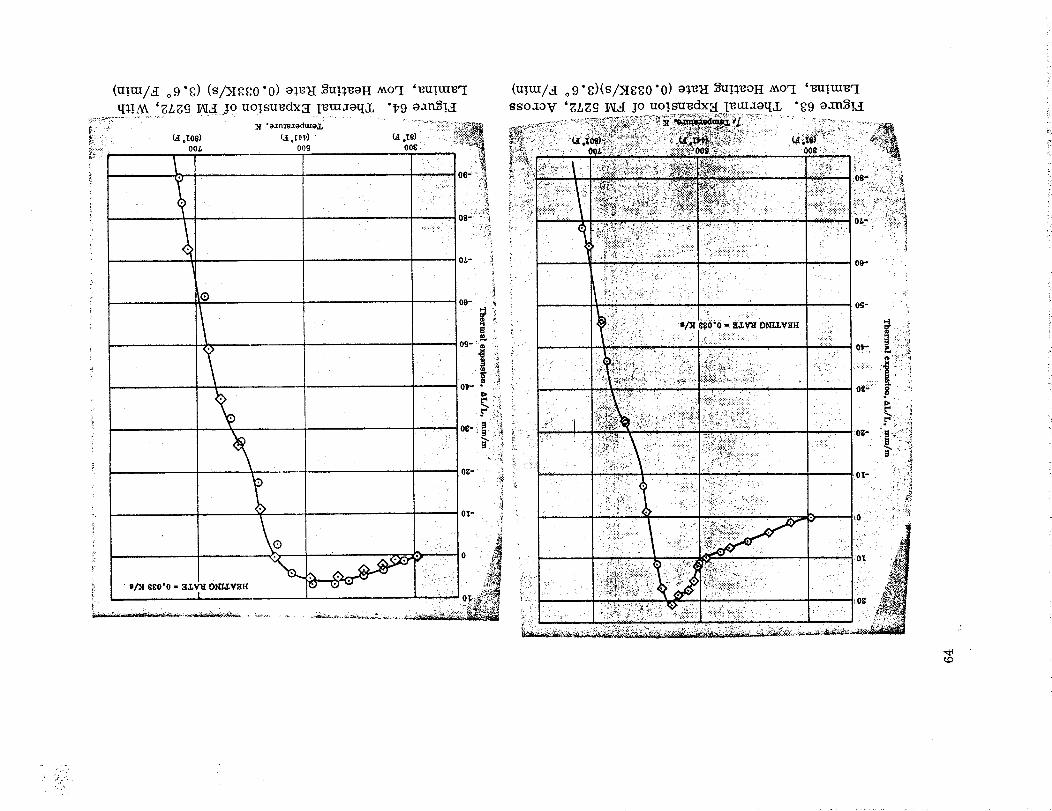
L
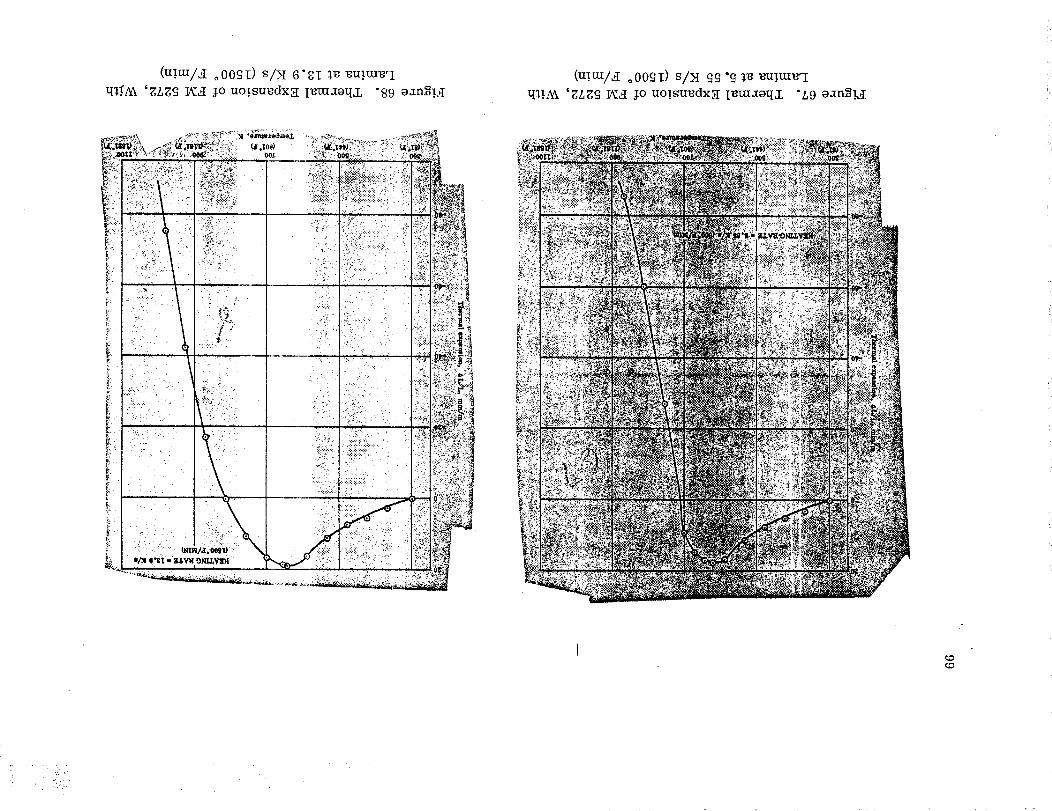
tt_AX 'gLgg IAI_I lo UO.lSu'_dxx IetLtzeq_L "89 ozn_!_I(Ul.m/_I oOOgI) s/>I gg "g _ mi.tm_q
q_._ 'ZLZg _aI _o uo:su_dx:_ I_m=toq_L "2_9 ozn_l._I
OOL
......,...... ,=
t • "
t
ZOZO
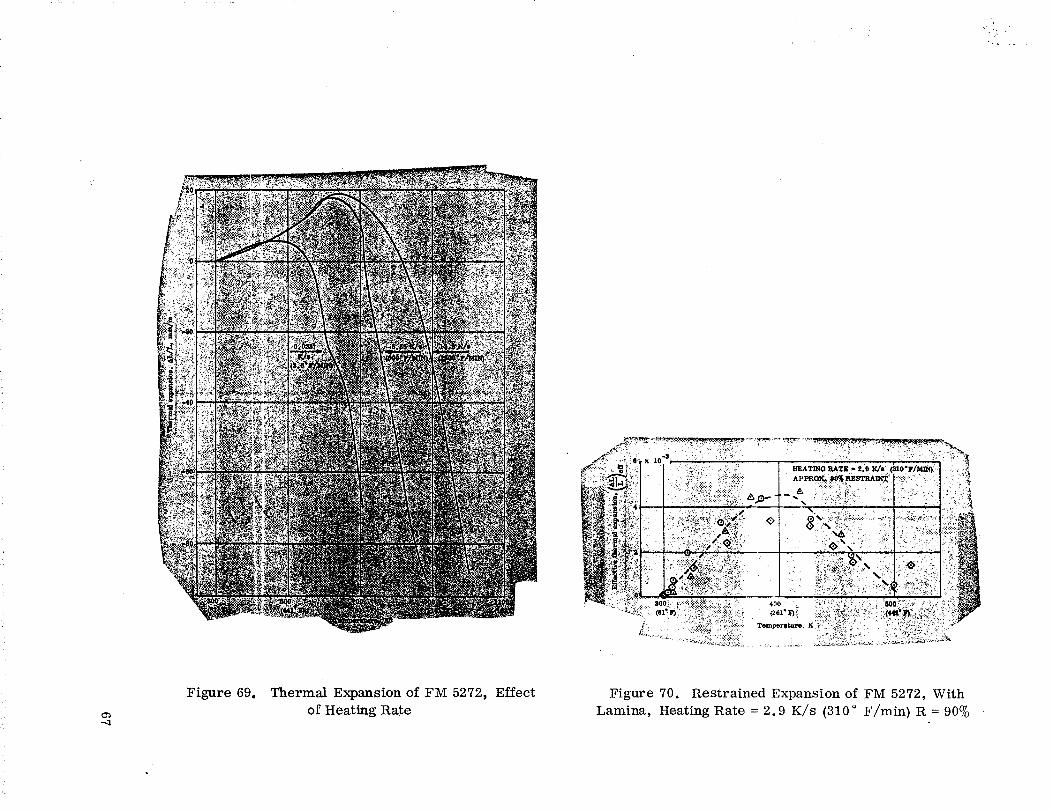
+'; •
,.. ._
Figure 69. Thermal Expansion of FM 5272, Effect
of Heating Rate
Figure 70. Restrained Expansion of FM 5272, With
Lamina, Heating Rate = 2.9 K/s (3]0 ° F/min) R = 90%
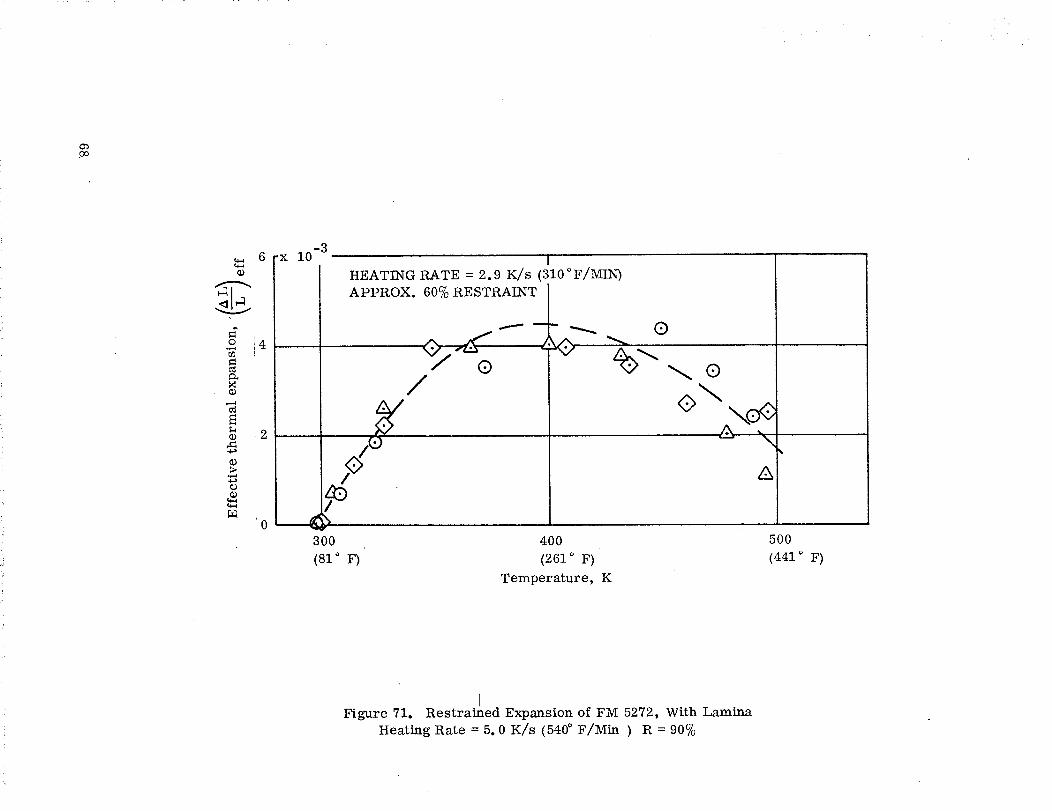
oo
(1.)
o 4
c6e_MCO
¢6
CO 2'4,a
CO>
CO
0
-3"X IU
300
(81 ° F)
IHEATING RATE = 2.9 K/s (310°F/MIN)APPROX. 60% RESTRAINT
IQ
®/
YA
4OO
(261 ° F)
Temperature, K
50O
(441 ° F)
IFigure 71. Restrained Expansion of FM 5272, With Lamina
Heating Rate = 5.0 K/s (540 _ F/Min ) R = 90%
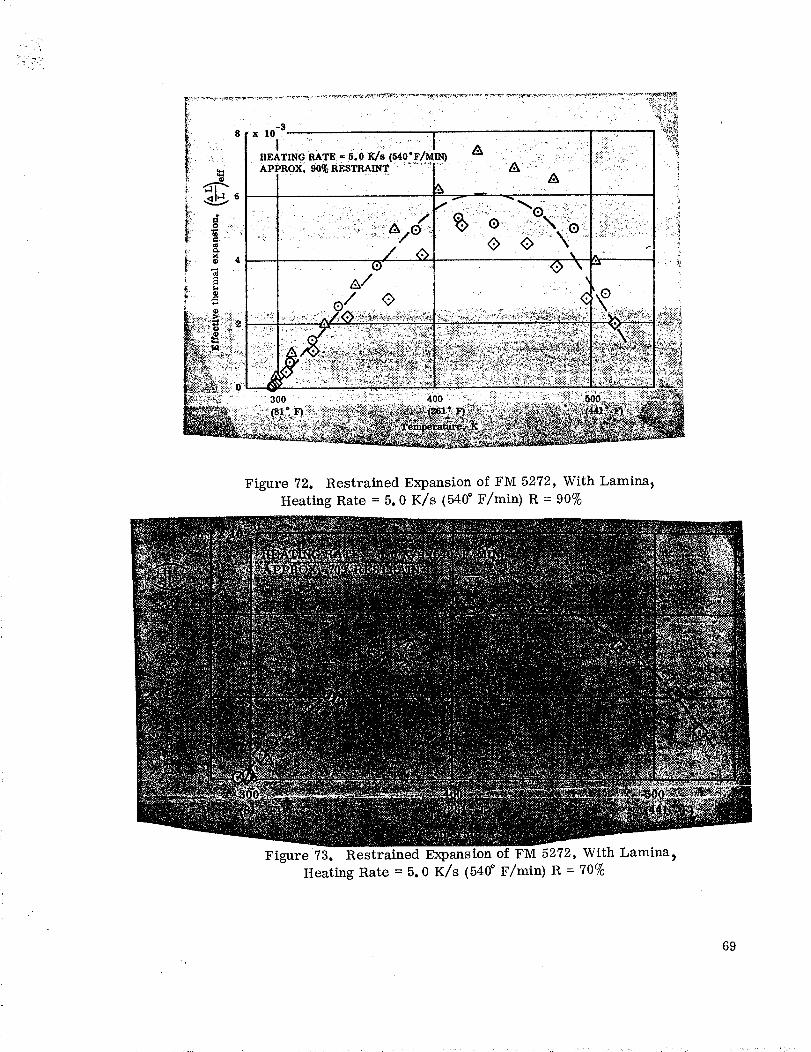
.,,,.,
4
8
t
" 0 s f_O" _ ...... '....... "_. ..=: HEATING RATE = 5o I_, ( F/MIN) - _ " ' IL':...,_.
I _ APPRox. 90% RESTRAINT ...."......"_I'" _ -".... i. l -',." i
• . " i • . f _'7. _-,,_ .,: .,, -_._..,.
i \ ,>, .;, • .I
A/ • •
.... 300 . .: ,,: 400 " !7-. :i:i; :; .-7 "::k:...:;-,._i:_
;7i J
Figure 72. Restrained Expansion of FM 5272, With Lamin%Heating Rate = 5. 0 K/s (540 ° F/min) R = 90%
Figure 73, Restrained Expansion of FM 5272, With Lamina_Heating Rate = 5. 0 K/s (540 ° F/min) R = 70%
69
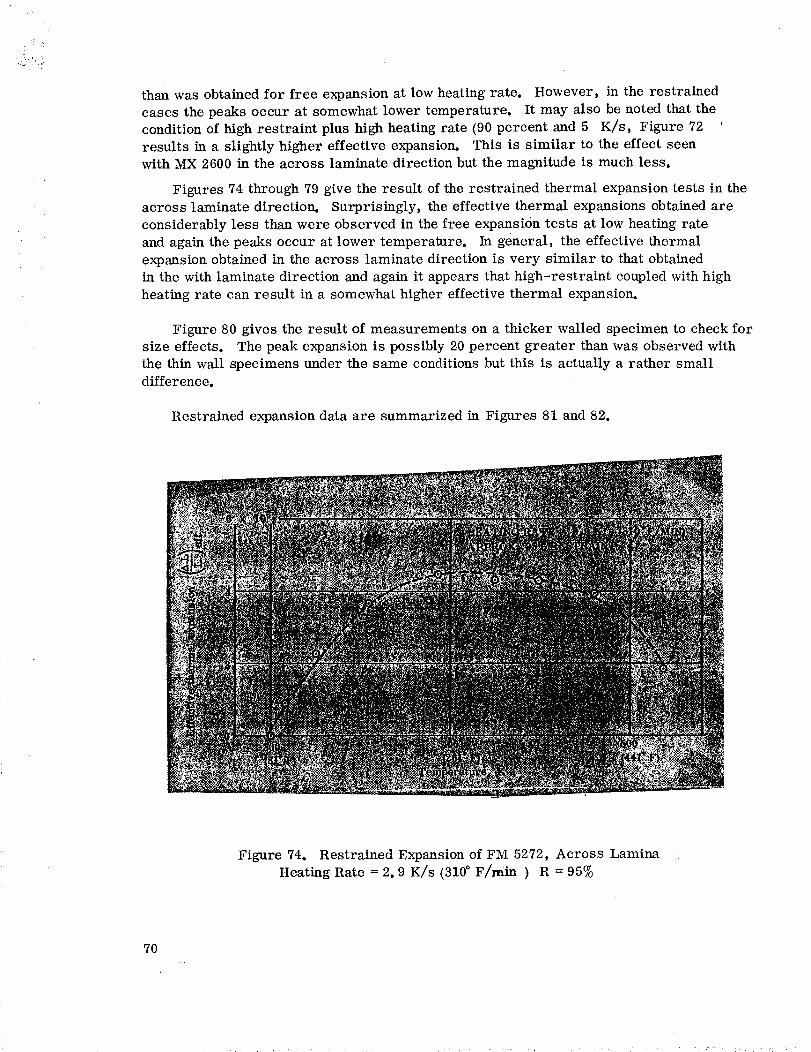
thanwasobtainedfor free expansionat low heatingrate. However, in the restrainedcasesthe peaksoccur at somewhatlower temperature. It may also benotedthat theconditionof high restraint plus high heatingrate (90percent and5 K/s, Figure 72results in a slightly higher effective expansion. This is similar to the effect seenwith MX 2600in the across laminatedirection but the magnitudeis muchless.
Figures 74through 79give the result of the restrained thermal expansiontests in theacross laminatedirection. Surprisingly, theeffective thermal expansionsobtainedareconsiderablyless thanwere observedin thefree expansiontests at low heatingrateandagainthe peaksoccur at lower temperature. In general, the effective thermalexpansionobtainedin the across laminatedirection is very similar to that obtainedin thewith laminatedirection and againit appearsthat high-restraint coupledwithhighheatingrate can result in a somewhathigher effectivethermal expansion.
Figure 80gives the result of measurementsona thicker walled specimento checkforsize effects. Thepeak expansionis possibly 20percent greater thanwasobservedwiththe thin wall specimensunder the sameconditionsbut this is actually a rather smalldifference.
Restrainedexpansiondataare summarizedin Figures 81 and82.
Figure 74. RestrainedExpansionof FM 5272,Across LaminaHeatingRate= 2.9 K/s (310 ° F/rain ) R = 95%
7O
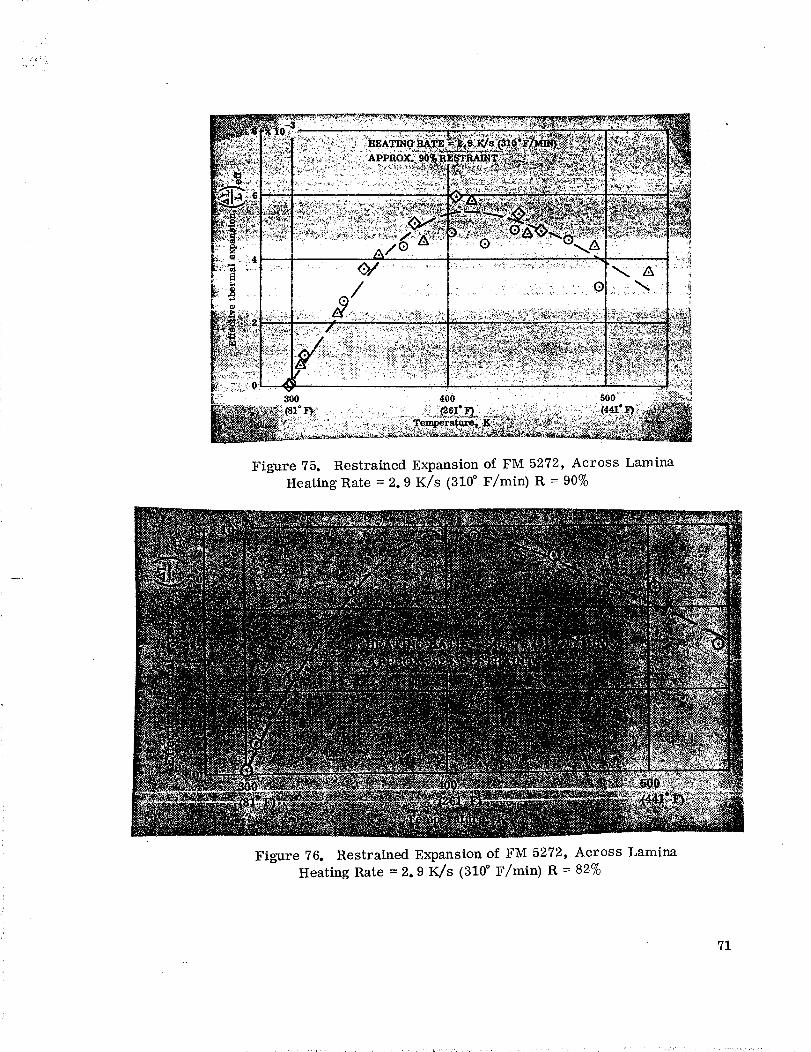
............. _ " " _,_'_,_._:_',_;,%'__ 2_ _.,_" " " _ " "d
.... .A/0 - 0 ...." ....--_'_A
/ :. - .... - ......_:,<...,,. o
_.i _":_._..._;._,...
..... • _,._._. "__: 300 400 500 ::. _.:_::_-,_
Figure 75. Restrained Expansion of FM 5272, Across Lamina
Heating Rate = 2.9 K/s (310 ° F/min) R = 90%
Figure 76. Restrained Expansion of FM 5272, Across Lamina
Heating Rate = 2.9 K/s (310 _ F/rain) R = 82%
71
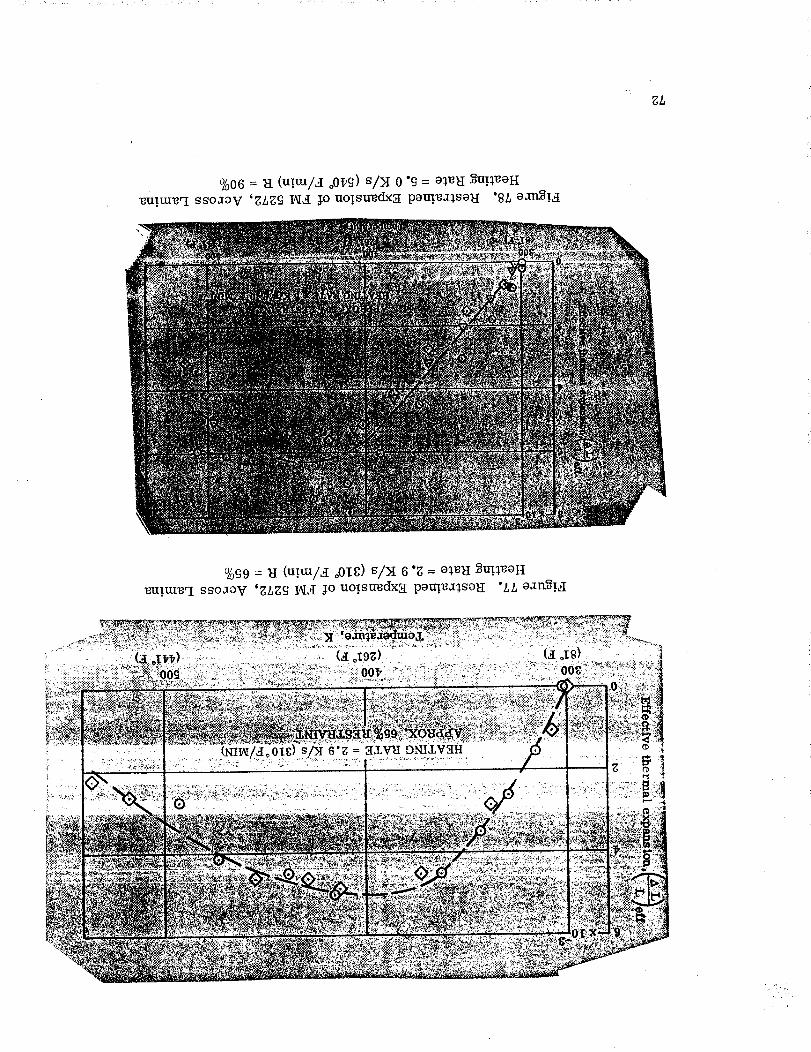
g2,,
%06 = _t (ut.m/_I o0+Z_) s/H 0 "_ = o_kI _ut._OH
_u!m_I sso:tov 'gLg_ IAI_I _o uo!stredxz pom._:t_soE "gL oa_!_I
%_9 = _I (U.lm/_I o018) s/M 6 "g = o_I _m._OH
wal.m_I sso:toV 'gLg_ IAI_I l o uot.stmdxz pom._:t_sokI "LL O:tl_t_I
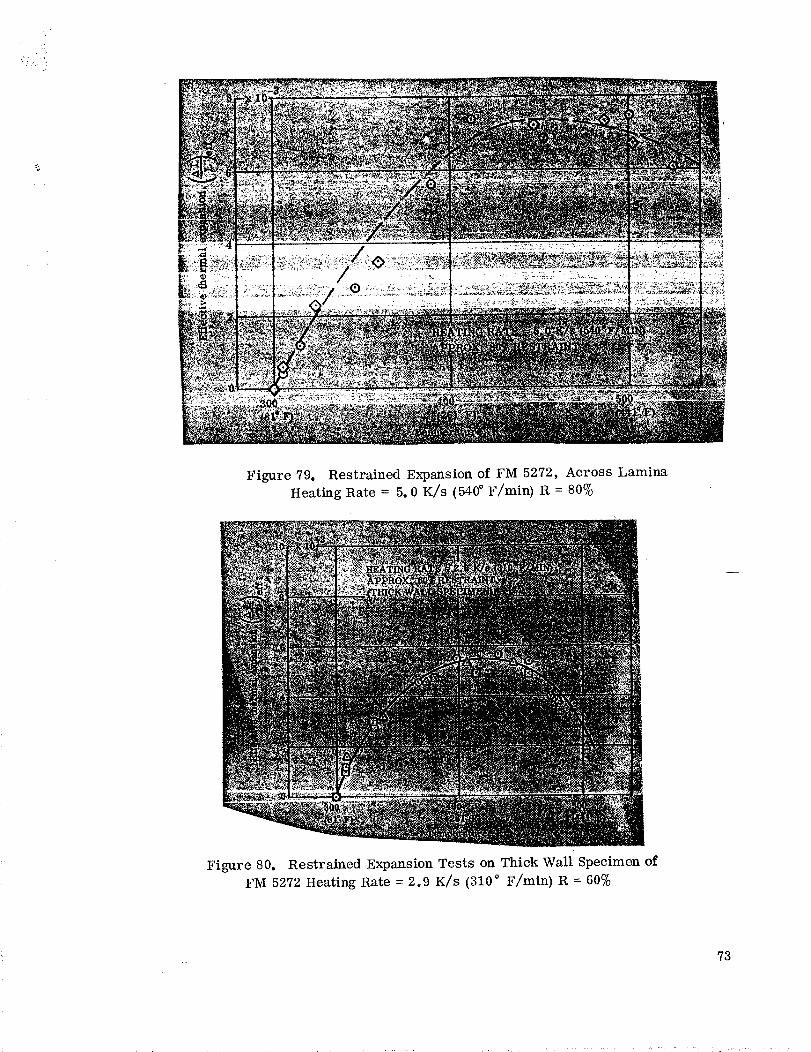
Figure 79. RestrainedExpansionof FM 5272, Across LaminaHeatingRate = 5. 0 K/s (540 ° F/min) R = 80%
Figure 80. Restrained Expansion Tests on Thick Wall Specimen of
FM 5272 Heating Rate = 2.9 K/s (310 ° F/min) R = 607o
73
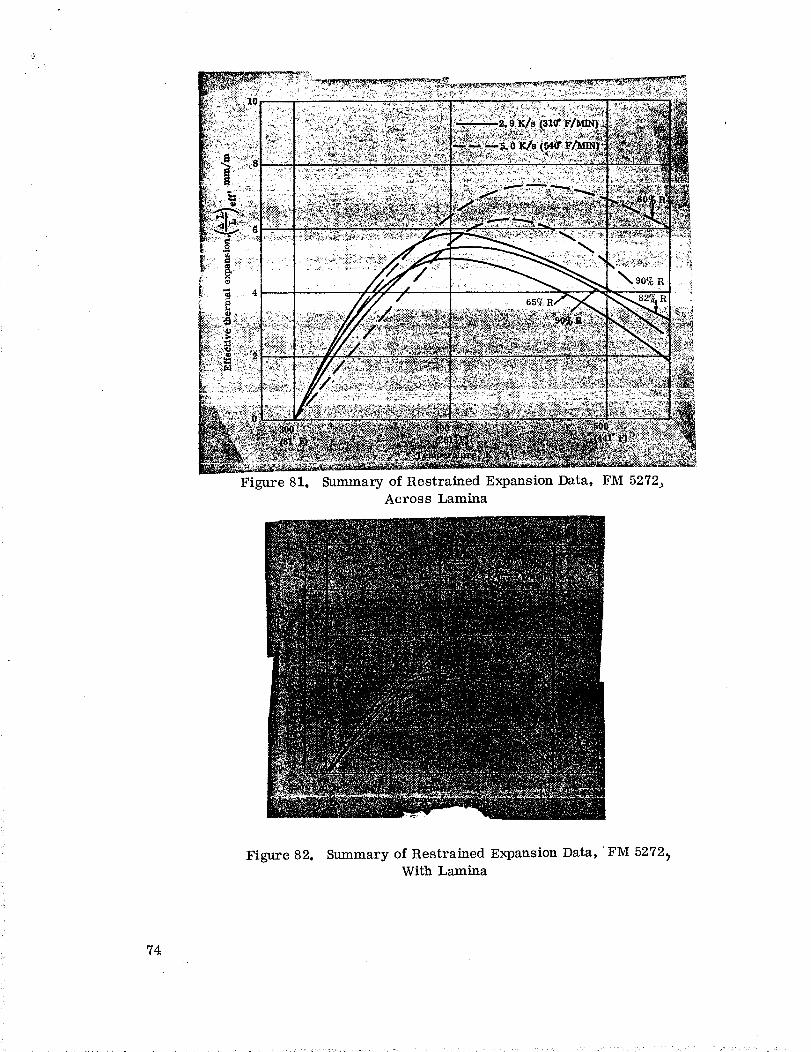
Figure 81. Summaryof Restrained ExpansionData, FM 5272)Across Lamina
Figure 82. Summaryof RestrainedExpansionData, ':FM 52727With Lamina
74
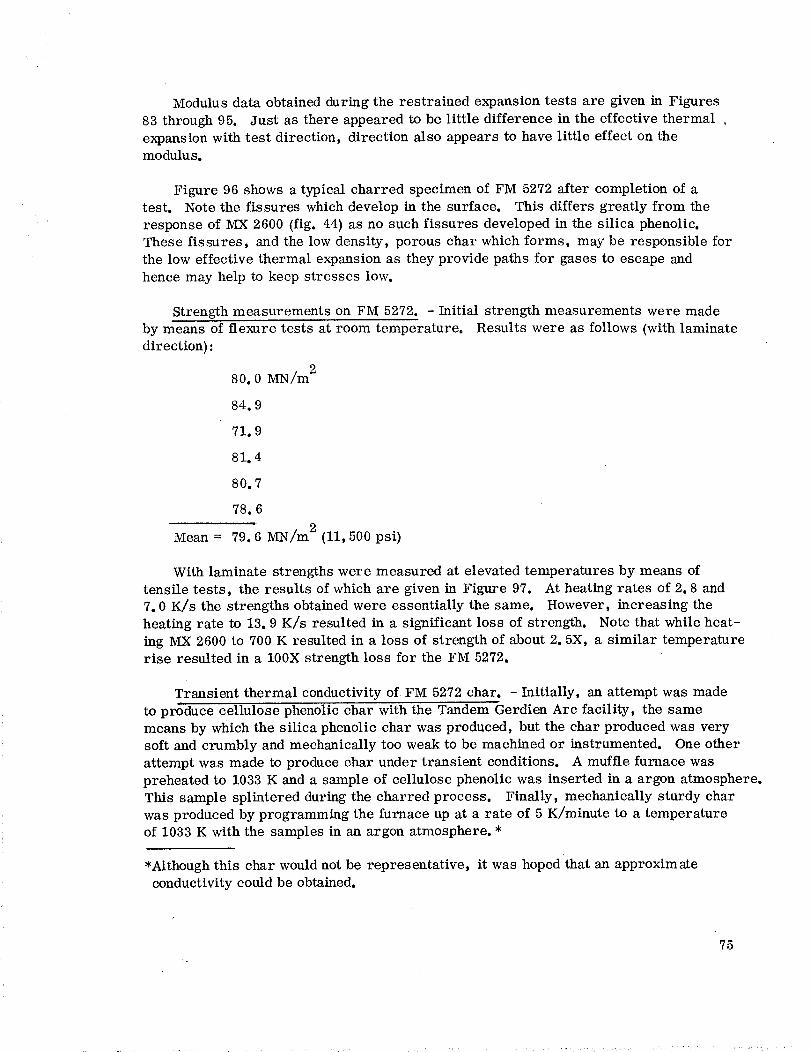
Modulus data obtained during the restrained expansion tests are given in Figures
83 through 95. Just as there appeared to be little difference in the effective thermal ,
expansion with test direction, direction also appears to have little effect on themodulus.
Figure 96 shows a typical charred specimen of FM 5272 after completion of a
test. Note the fissures which develop in the surface. This differs greatly from the
response of MX 2600 (fig. 44) as no such fissures developed in the silica phenolic.
These fissures, and the low density, porous char which forms, may be responsible for
the low effective thermal expansion as they provide paths for gases to escape and
hence may help to keep stresses low.
Strength measurements on FM 5272. - Initial strength measurements were made
by means of flexure tests at room temperature. Results were as follows (with laminate
direction):
80.0 lVIN/m 2
84.9
71.9
81. 4
80.7
78.6
Mean = 79.6 MN/m 2 (11,500 psi)
With laminate strengths were measured at elevated temperatures by means of
tensile tests, the results of which are given in Figure 97. At heating rates of 2.8 and
7.0 K/s the strengths obtained were essentially the same. However, increasing the
heating rate to 13. 9 K/s resulted in a significant loss of strength. Note that while heat-
ing MX 2600 to 700 K resulted in a loss of strength of about 2.5X, a similar temperature
rise resulted in a 100X strength loss for the FM 5272.
Transient thermal conductivity of FM 5272 char. - Initially, an attempt was made
to produce cellulose phenolic char with the Tandem Gerdien Arc facility, the same
means by which the silica phenolic char was produced, but the char produced was verysoft and crumbly and mechanically too weak to be machined or instrumented. One other
attempt was made to produce char under transient conditions. A muffle furnace was
preheated to 1033 K and a sample of cellulose phenolic was inserted in a argon atmosphere.
This sample splintered during the charred process. Finally, mechanically sturdy char
was produced by programming the furnace up at a rate of 5 K/minute to a temperature
of 1033 K with the samples in an argon atmosphere. *
*Although this char would not be representative, it was hoped that an approximate
conductivity could be obtained.
75
10.
_(_.o)HEATING RATE = 2.9 K/s {310" F/MIN)
APPROX. 90c/c RESTRAINT
Figure 83. Modulus of Restrained FM 5272, With LaminaHeating Rate = 2.9 K/s 310 ° F/min R = 90%
Figure 84. Modulus of Restrained FM 5272, With Lamina
Heating Rate = 2.9 K/s (310 ° F/min) R = 60%
76
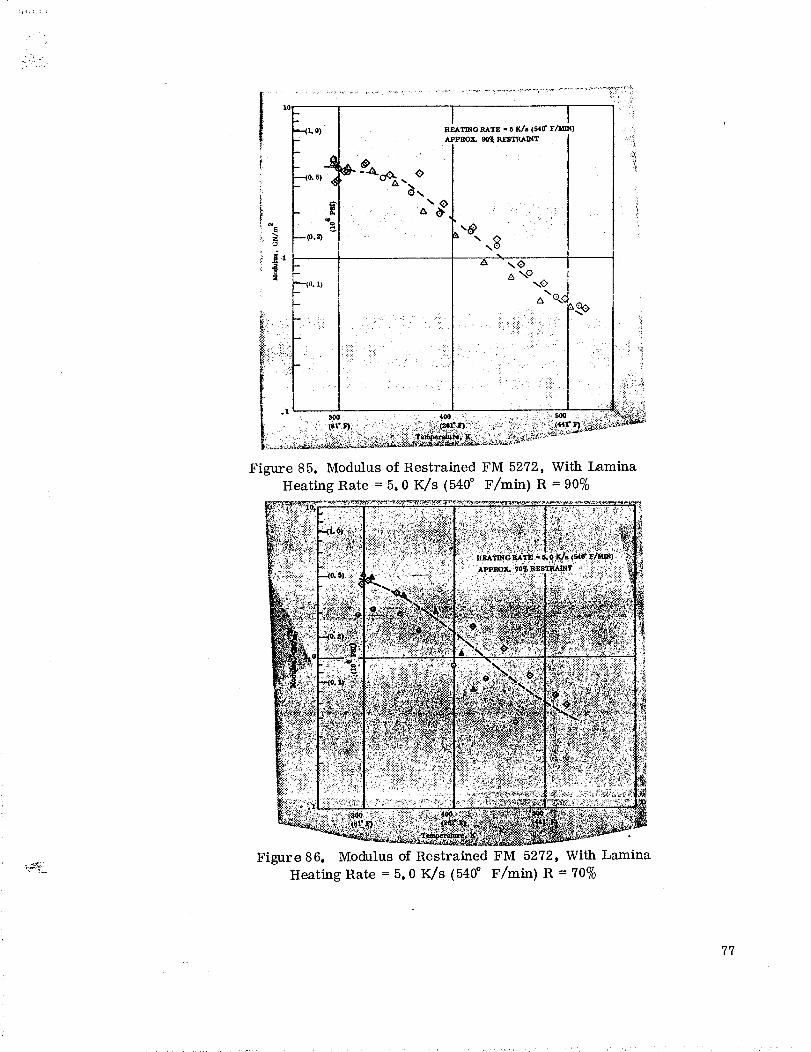
i
l0
m
) o. s) •
i
i _.,z _ Z
---_o. 1)
3OO
H_,TmG RATE= 5 x</. (54o"F/m_
APPHO_ 90_ RE_
A_ o
• i : •_¸_ • ¸_¸_¸,I : :__:i_̧iii::_
.!
tOO •• _.' r ..
Figure 85. Modulus of Restrained FM 5272, With Lamina
Heating Rate = 5.0 K/s (540 ° F/min) R = 90%
Figure 86. Modulus of Restrained FM 5272, With Lamina
Heating Rate = 5.0 K/s (540 ° F/rain) R = 70%
77
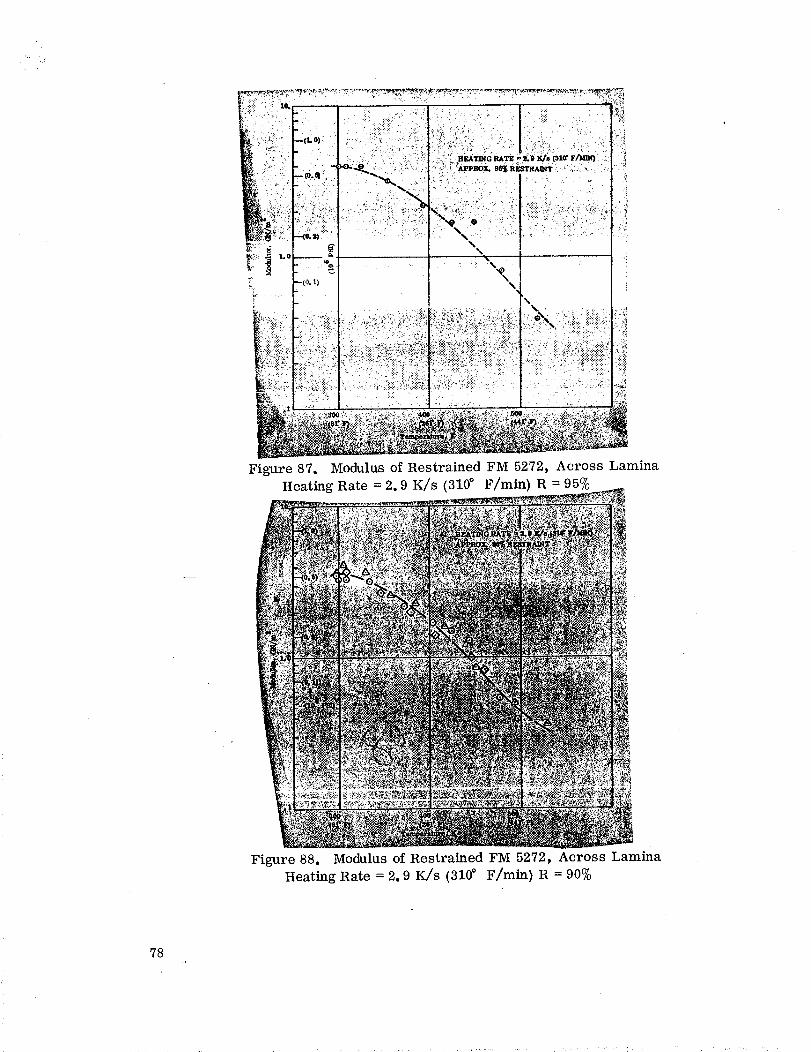
ii i ii!ilil
\
\
\
_i_i_i_?iii!_i_iii_i,:!:•:_ii _i_i!_i:iiii:ii_iiii••_i_
! r.:_
J
Figure 87. Modulus of Restrained FM 5272, Across Lamina
Heating Rate = 2.9 K/s (310 ° F/min) R = 95%
Figure 88. Modulus of Restrained FM 5272, Across Lamina
Heating Rate = 2.9 K/s (310 ° F/min) R = 90%
78
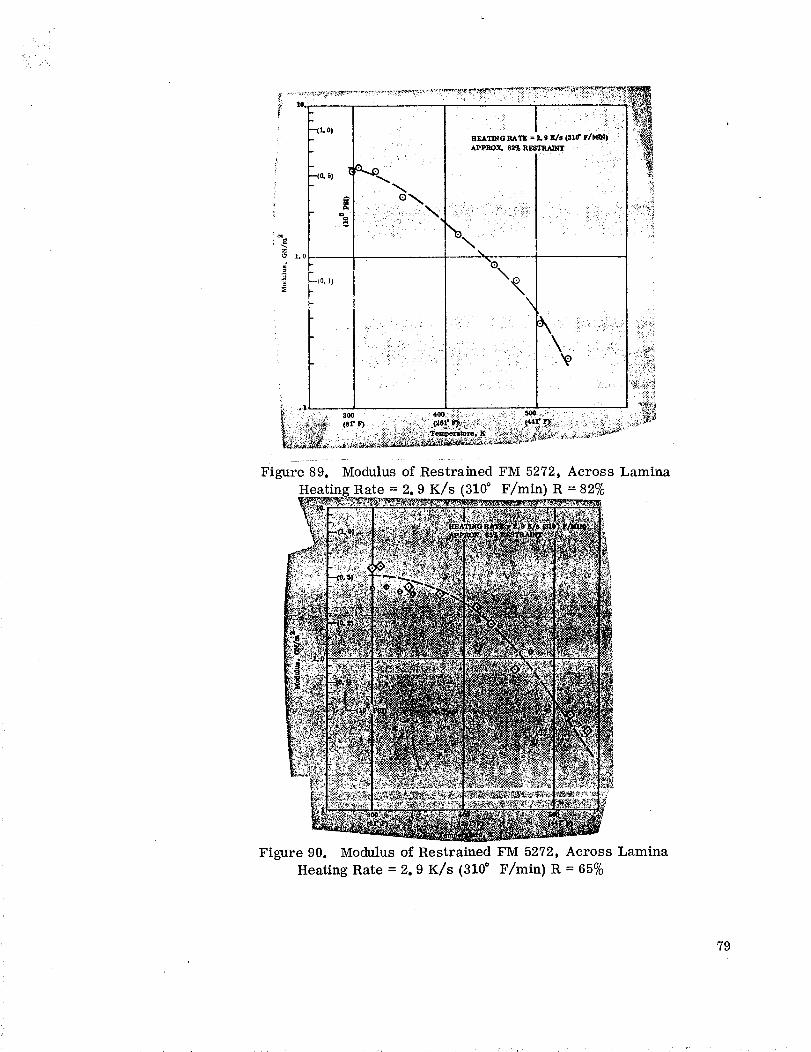
le. •
i--(1. 0)
• H_TmO _T_ =Le ¢Js (31_ F/Mm)
' ' APPROX. 8_o RESTRAINT '
_o.o, _._'--_
\
r
...i _- _ _i_
Figure 89.
i !
Modulus of Restrained FM 5272, Across Lamina
Rate 2.9 K/s (310 ° F/min) R =82%
Figure 90. Modulus of Restrained FM 5272, Across Lamina
Heating Rate = 2. 9 K/s (310 ° F/min) R = 65%
79
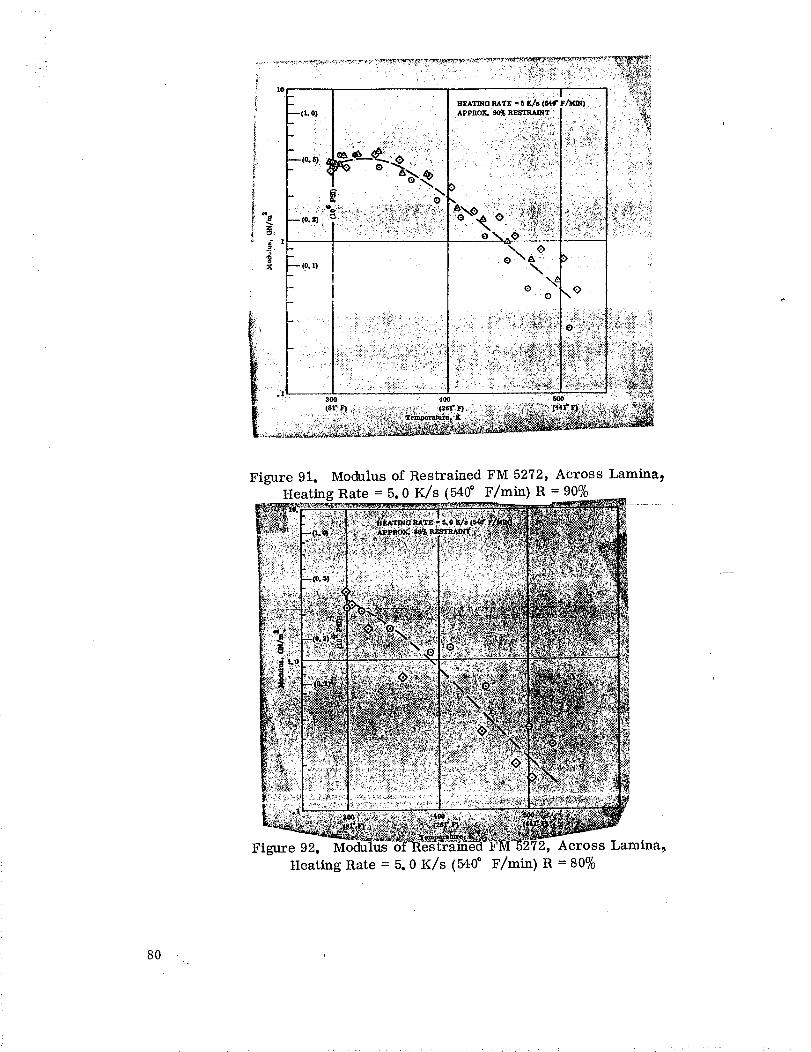
- o "4\o ,0
Figure 91. Modulus of Restrained FM 5272, Across Lamina_
Heating Rate = 5. 0 K/s (540 _ F/min) R = 90%
_:_. ___ _,'.
ii::?:',
............._!_.:,.._@_
Figure 92. I72, Across Lamina,
Heating Rate = 5. 0 K/s (540 ° F/min) R = 80%
80
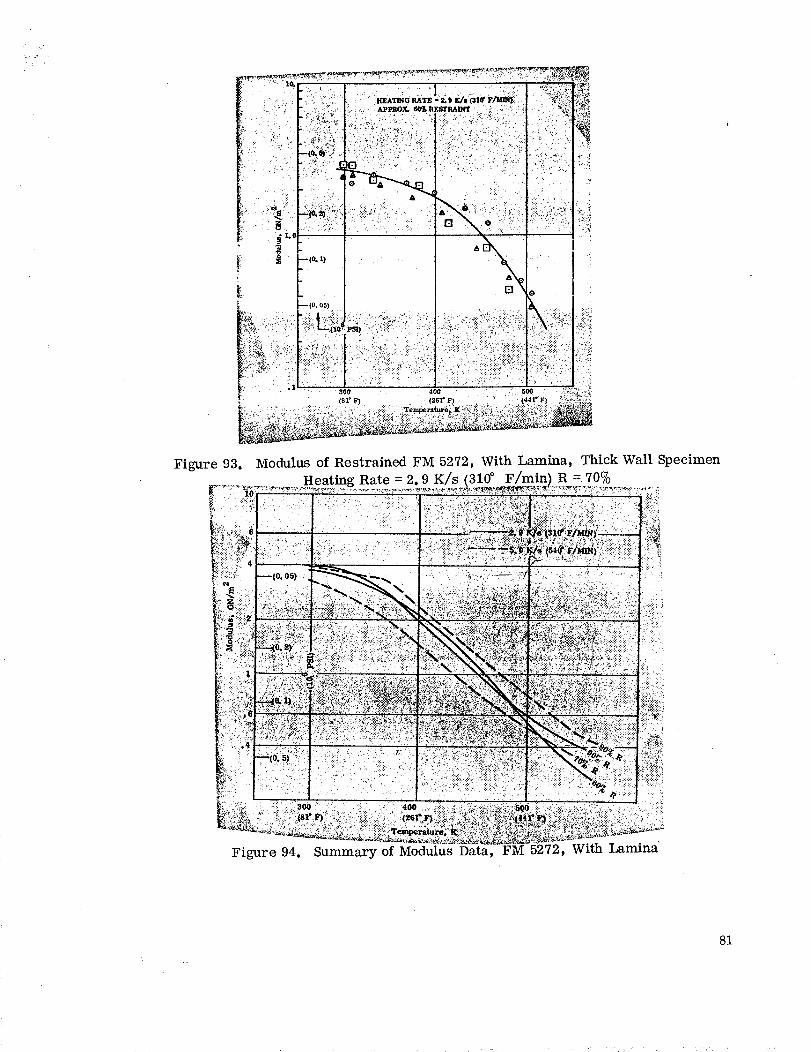
Figure 93.
:_ %': ::
{::_ii!:@" :.
,. : (:
Modulus of Restrained FM 5272, With Lamina, Thick Wall Specimen
Heating Rate = 2.9 K/s (310 _ = 70%
Figure 94. Summary of Modulus Data, FM 5272, With Lamina
81
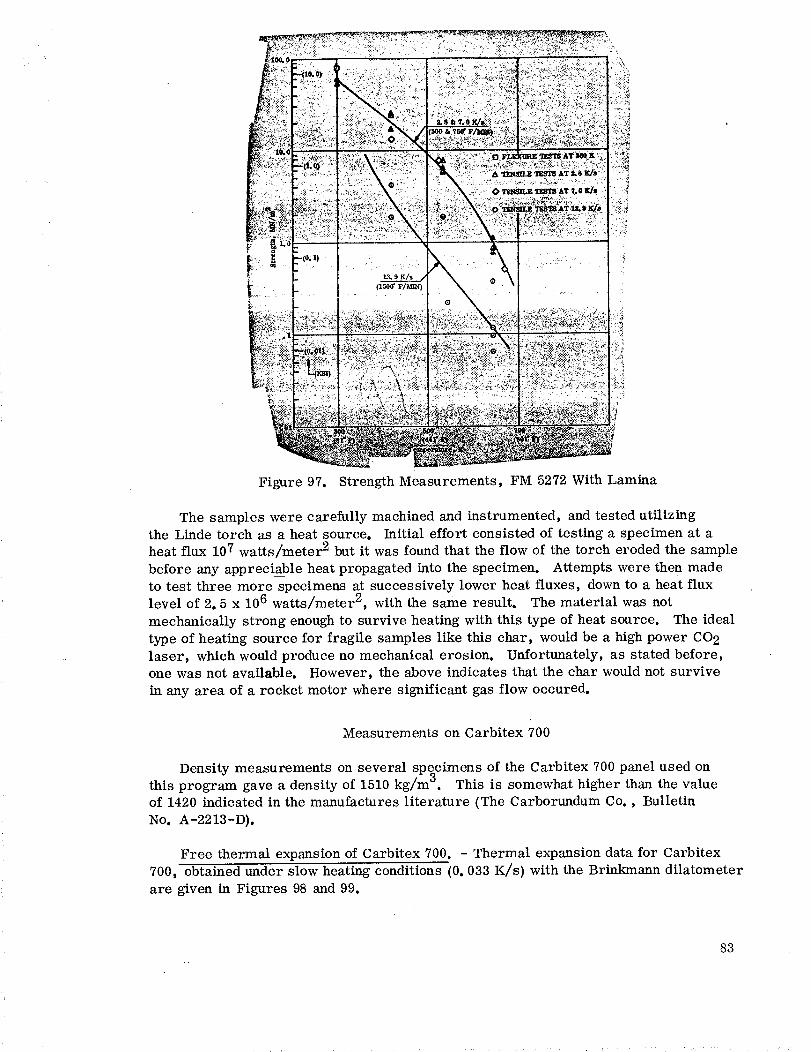
! •!ii̧_'_ __!i_!<i<_i_%__7i<_
il ii!ii</ .....6111̧i_.:i
:L_ i_,_,_ _
• - (Isoo_F/M_)
: "::2 : -% ;:;
:i_!i.!:::it:!2>:i< :'i_?'. _:1
\ , ! ........
Figure 97. Strength Measurements, FM 5272 With Lamina
The samples were carefully machined and instrumented, and tested utilizing
the Linde torch as a heat source. Initial effort consisted of testing a specimen at a
heat flux 107 watts/meter 2 but it was found that the flow of the torch eroded the sample
before any appreciable heat propagated into the specimen. Attempts were then made
to test three more specimens at successively lower heat fluxes, down to a heat flux
level of 2.5 x 10⁶ watts/meter 2, with the same result. The material was not
mechanically strong enough to survive heating with this type of heat source. The ideal
type of heating source for fragile samples like this char, would be a high power CO 2
laser, which would produce no mechanical erosion. Unfortunately, as stated before,
one was not available. However, the above indicates that the char would not survive
in any area of a rocket motor where significant gas flow occured.
Measurements on Carbitex 700
Density measurements on several specimens of the Carbitex 700 panel used on
this program gave a density of 1510 kg/m3. This is somewhat higher than the value
of 1420 indicated in the manufactures literature (The Carborundum Co., Bulletin
No. A-2213-D).
Free thermal expansion of Carbitex 700. - Thermal expansion data for Carbitex
700, obtained under slow heating conditions (0. 033 K/s) with the Brinkmann dilatometer
are given in Figures 98 and 99.
83
With laminate thermal expansion data which were obtained under fast heating
conditions are shown in Figures 100 and 101. The data given in Figure 100 were
obtained at a rate of 13. 9 K/s (1500 F/min) and the data in Figure 101 at 27.8
K/s (3000 ° F/min). Each of the high heating rate curves represents measurementson three long (5.08 cm ) and three short (1. 27 cm ) specimens, the measurements
on each length being averaged and the difference taken to eliminate and effects asdescribed in the section on test methods. The curve shown in Figure 100 is practically
identical to the slow heating data (Figure 99) as shown in Figure 102. The curve
obtained at the highest heating rate is slightly lower at high temperature but the
difference is not significant. Thus the expansion is independent of the heating rate.
In view of the absence of any heating rate dependence of the ATJ, this result was
expected.
Restrained thermal expansion of Carbitex 700. - The results of restrained expansiontests on Carbitex 700 in the with laminate direction are given in Figures 103, 104 and
105, where the effective thermal expansion is plotted as a function of temperature. The
data given in Figures 103 and 104 are both for 55 percent restraint but the former isfor a heating rate of 13. 9 K/s (1500 ° F/min ) and the latter for a rate of 27.8 K/s
(3000 ° F/min ). The result was essentially the same, again indicating no rate effect.If these data are compared with the data given in Figure 99 (slow heating, free expansion),
it is seen that ( _L/L)eff runs slightly low at the higher temperatures (Fig. 106). Asnoted earlier, this may be the result of curvature (i. e., non-linearity) of the stress-
strain relation. It is also seen that the higher level of restraint (hence higher stress)
results in a somewhat lower effective thermal expansion. This is in agreement with
the results obtained on ATJ.
Modulus measurements from small cyclic loads imposed during restrained expansion
are shown in Figure 107. These moduli at room temperature are somewhat lower thanthe with laminate moduli obtained from room temperature flexure tests. Flexure
tests (3 point loading) yielded the following modulus data:
10. 2 GN/m 2
8.9
9.9
11. 0
10. 5
12. 3
1L6
Mean 10. 6 GN/m 2 (1. 54 x 10 6 psi)
This is roughly 10 percent higher than the starting moduli from the restrained expansion
tests, but the latter are essentially compression moduli and, for some reason, com-
pression moduli for graphitics seem to run somewhat lower than the tensile moduli.
84
Compressive stress-strain of Carbitex 700. - In view of the lack of any heating
rate sensitivity of the Carbitex 700, a number of compressive stress-strain tests
were conducted rather than additional restrained expansion tests as it appeared that
more of the latter tests would provide no additional information. As explained in an
earlier section of this report, these tests were not conducted to failure because of the
high risk of damage to the apparatus. The resultant compression data are given in
Figures 108 and 109 and in Table 1. According to the manufacturer, the compressive
strengths at room temperature are:
With laminate: 41. 4 MN/m 2 (6000 psi)
Across laminate: 103.5 MN/m 2 (15,000 psi)
However, in some preliminary experiments in connection with the set-up of these tests,
one of the with laminate specimens failed at a strain of 0. 0045 m/re. Because of this it
appeared that to test to higher strains was a high risk situation which had to be avoided.
In addition, the WL thermal expansion is only about 0. 005 m/m at the highest
temperature available (1900 K) so that it would appear that for thermal analyses the
portion of the stress-strain curve up to this strain would be of the greatest interest.
Strength measurements on Carbitex 700. - Preliminary flex strength measurements
on Carbitex 700 gave the following result (with laminate direction strength):
54.5 MN/m 2
53.8
56.6
63. I
58.6
60.0
56.6
Mean: 57.5 MN/m 2 (8350 psi)
iThis result is in good agreement with the flex strength of 62 MN/m 2 (9000 psi) given in
the manufacturer's literature.
The results of with laminate tensile measurements at elevated temperatures
are given in Table 2 for two heating rates.
85
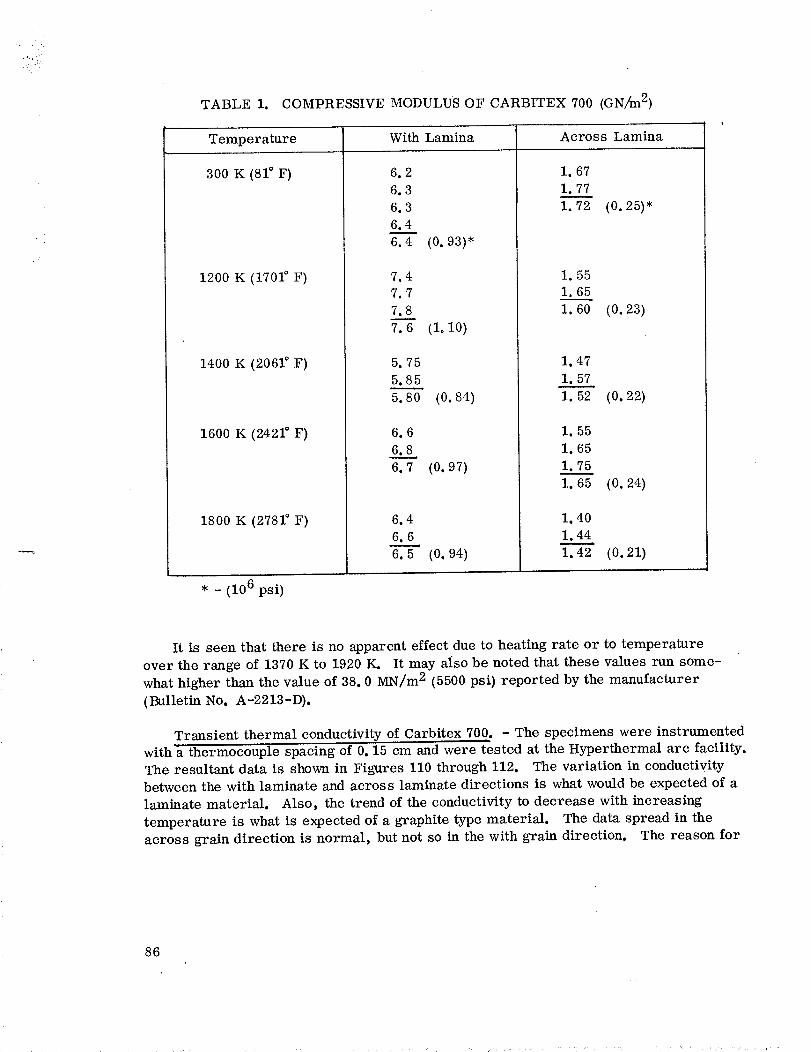
:i:i_
TABLE i. COMPRESSIVE MODULUS OF CARBITEX 700 (GN/_n 2)
Temperature With Lamina Across Lamina
300 K (81° F)
1200 K (1701° F)
1400 K (2061 _ F)
1600 K (2421 ° F)
1800 K (2781° F)
6.2
6.3
6.3
6.4
6.4
7.4
7.7
7.8
7.6
5.75
5.85
5.80
6.6
6.__S6.7
6.4
6.6m
6.5
(0.93)*
(1. I0)
(o. 84)
(0.97)
(0.94)
1. 67
1.77
1.72
1.55
1.65
1.60
1.47
1, 57
1.52
I. 55
i.65
I. 75
1.65
1.40
1.44
1.42
(0.25)*
(0.23)
(0.22)
(0.24)
(0.21)
* - (106 psi)
It is seen that there is no apparent effect due to heating rate or to temperature
over the range of 1370 K to 1920 K. It may aiso be noted that these values run some-
what higher than the value of 38.0 MN/m 2 (5500 psi) reported by the manufacturer
(Bulletin No. A-2213-D).
Transient thermal conductivity of Carbitex 700. - The specimens were instrumented
with a thermocouple spacing of 0. 15 cm and were tested at the Hyperthermal arc facility.
The resultant data is shown in Figures 110 through 112. The variation in conductivity
between the with laminate and across laminate directions is what would be expected of a
laminate material. Also, the trend of the conductivity to decrease with increasing
temperature is what is expected of a graphite type material. The data spread in the
across grain direction is normal, but not so in the with grain direction. The reason for
86
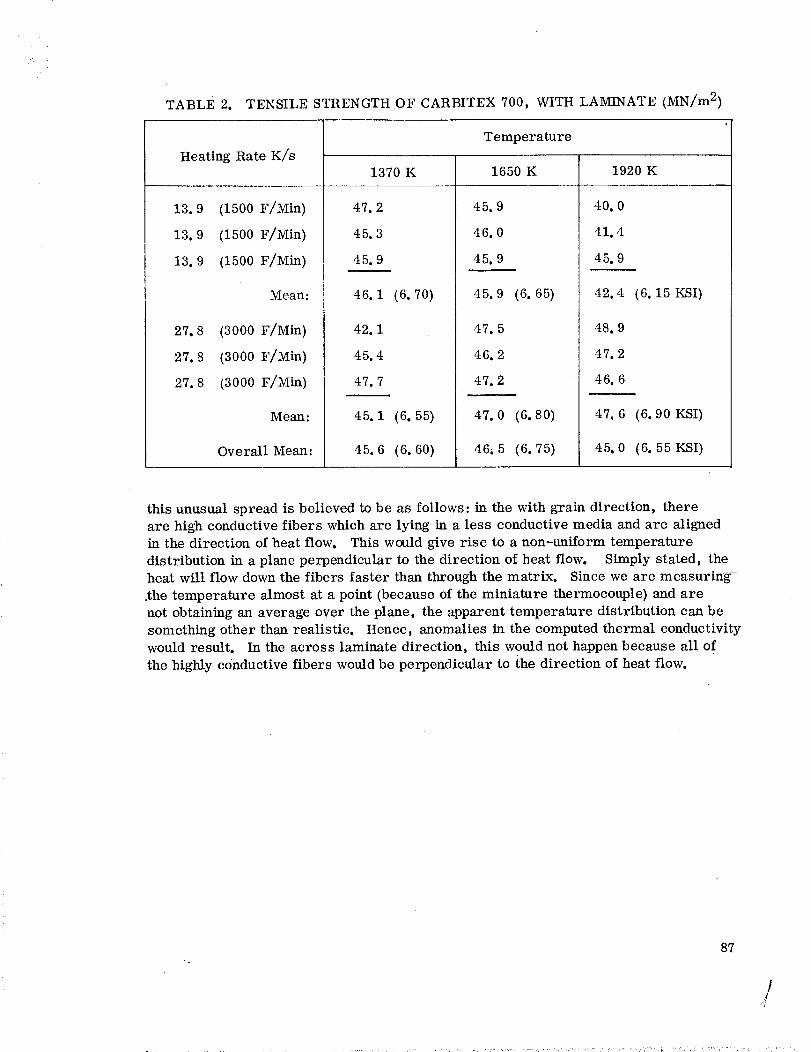
TABLE 2. TENSILESTRENGTHOF CARBITEX700, WITH LAMINATE (MN/m2)
HeatingRateK/s
13.9 (1500F/Min)
13.9 (1500F/Min)
13.9 (1500F/Min)
Mean:
27. 8 (3000 F/Min)
27.8 (3000 F/Min)
27.8 (3000 F/Min)
Mean:
Overall Mean:
1370 K
47.2
45.3
45.9
46.1
42. 1
45.4
47.7
Temperature
(6. 70)
45. 1 (6. 55)
45. 6 (6. 60)
1650 K
45.9
46.0
45.9
45.9 (6. 65)
47.5
46.2
47.2
40.0
41.4
45.9
42.4
48.9
47.2
46.6
1920 K
(6. 15 KSI)
47. 0 (6.80)
46_ 5 (6. 75)
m_
47. 6 (6. 90 KSI)
45. 0 (6. 55 KSI)
this unusual spread is believed to be as follows: in the with grain direction, there
are high conductive fibers which are lying in a less conductive media and are aligned
in the direction of heat flow. This would give rise to a non-uniform temperature
distribution in a plane perpendicular to the direction of heat flow. Simply stated, the
heat will flow down the fibers faster than through the matrix. Since we are measuring-
the temperature almost at a point (because of the miniature thermocouple) and are
not obtaining an average over the plane, the apparent temperature distribution can be
something other than realistic. Hence, anomalies in the computed thermal conductivity
would result. In the across laminate direction, this would not happen because all of
the highly conductive fibers would be perpendicular to the direction of heat flow.
87
/
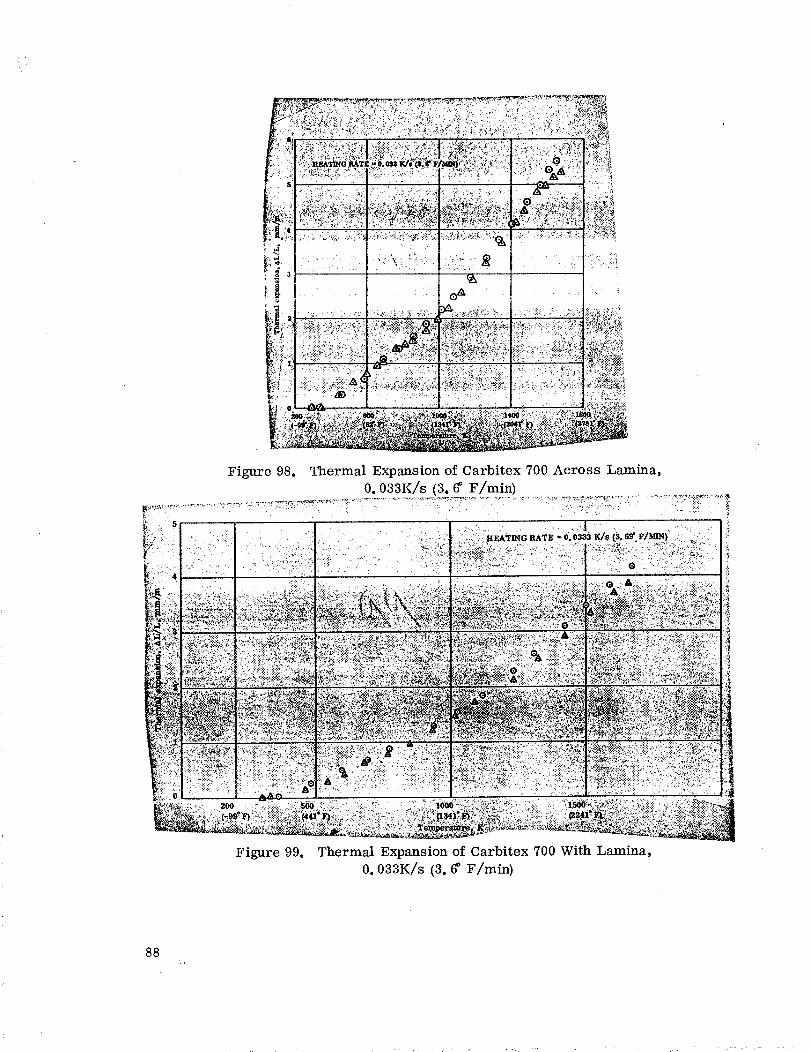
Figure 98. Thermal Expansion of Carbitex 700 Across Lamina,
0. 033K/s (3.6 _ F/min)
"• ....... -- ' : '. - , ._;-,_....V_._.,.............. ",'u:-:....,_-_. .- :_}">: :.._;'"_
I .............. - ......-_..... -_ .......:;':.:....... . " +=_-:_+"'.:_i::;., ' . _;- !:_(_._-_+?+_,:-+- - .:"
Figure 99. Thermal Expansion of Carbitex 700 With Lamina,
0. 033K/s (3. 6° F/min)
88
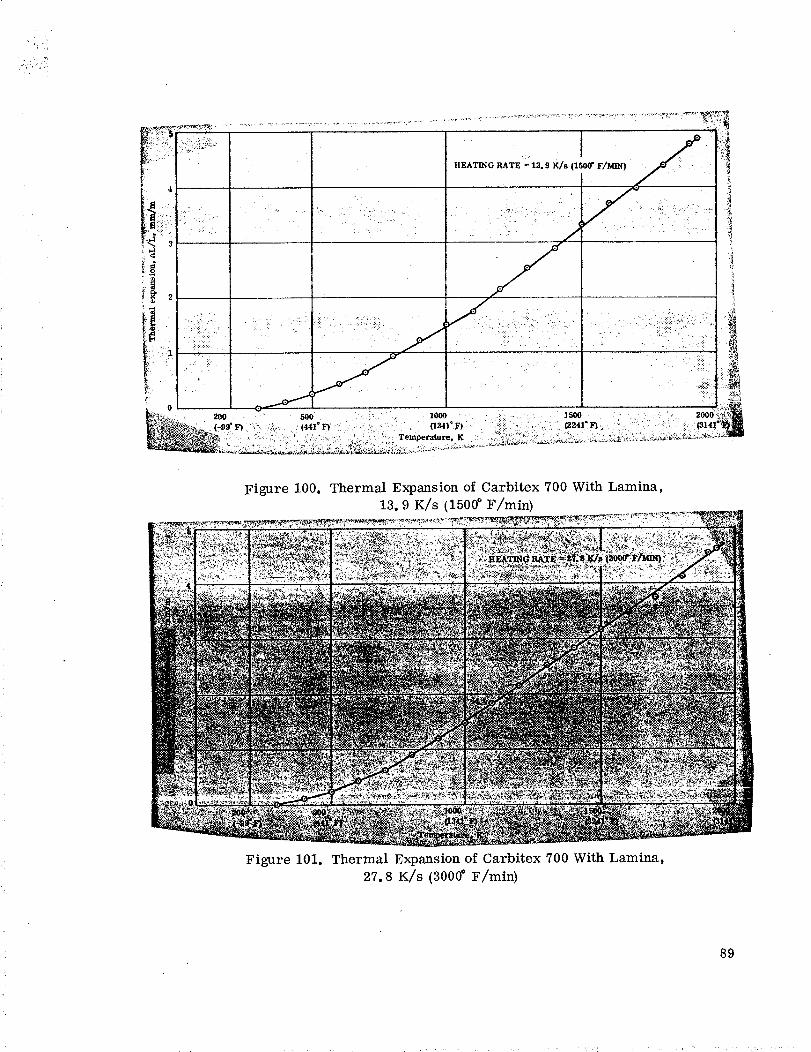
i_ . :_.
i!2
i!,i¸.-¸0
_._ . 200 500 . 1000 ... • 1500
'_ _._ _ _ _ " ...... - - : '." '_ • Temperature, K _ :!:_ '' ";....... _- _ • : _
HEATIN 13 " [ J "
[ GRATE= .9K/H(1500"F/MIN) ,_ ::_ " ii}il
?
• • _'.!i. _141r_.:_
Figure 100. Thermal Expansion of Carbitex 700 With Lamina,13, 9 K/s (1500 _ F/min)
Figure 101. Thermal Expansion of Carbitex 700 With Lamina,
27. S K/s (300¢ F/min)
89
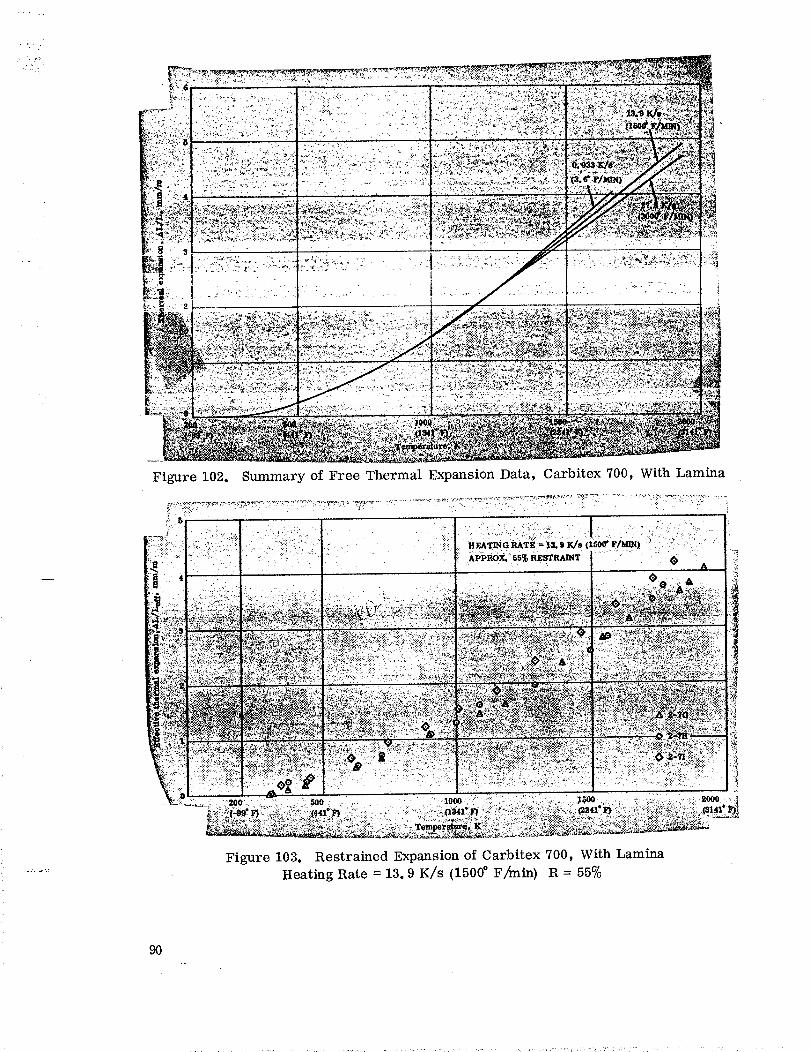
,.
• ....': (
Figure 102. Summary of Free Thermal Expansion Data, Carbitex 700, With Lamina
,_ . .>>+ + ., • . +....
::: : : 4 i +,++"_+°_++:""<""+''+"'+p.,o_0,+..+_.,,+++ A'2 ' . - a
_:_:.___++.+_._.++_+_._ +
:• :+;;?,:>'I: ".o_ ,+
Figure 103. Restrained Expansion of Carbitex 700, With Lamina
Heating Rate = 13.9 K/s (1500 ° F/min) 1R = 55%
9O
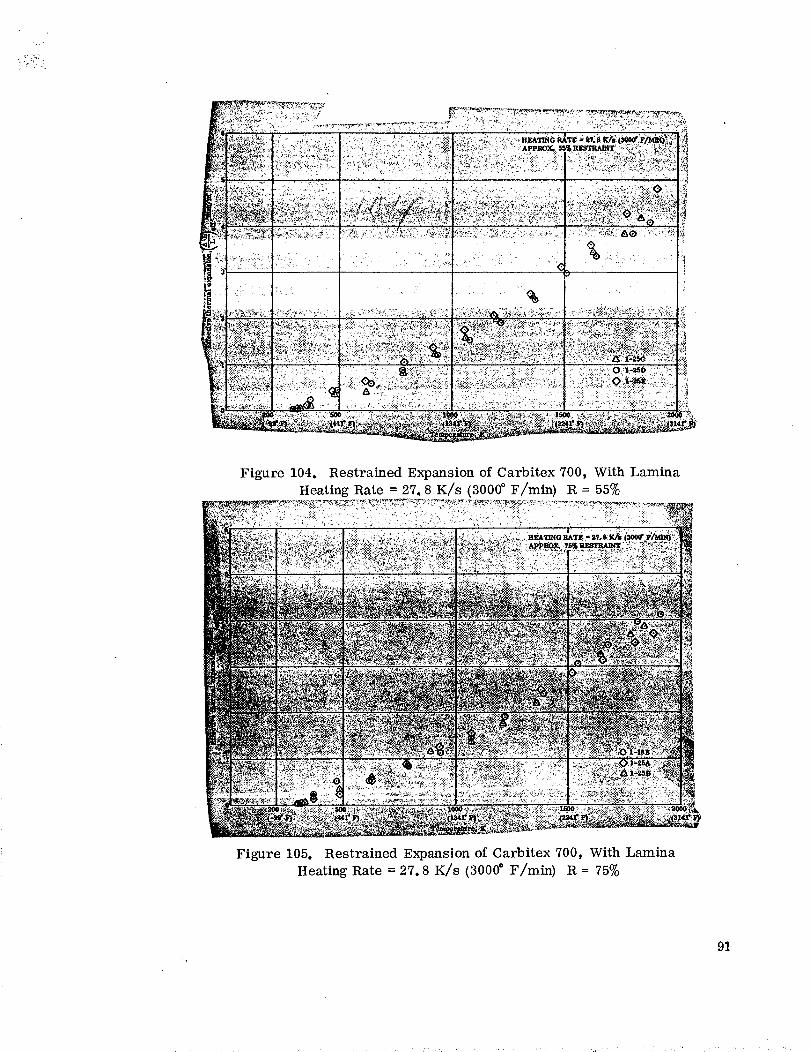
Figure 104. Restrained Expansion of Carbitex 700, With Lamina
Heating Rate = 27. 8 K/s {3000 ° F/min) R = 55%
Figure 105. Restrained Expansion of Carbitex 700, With Lamina
Heating Rate = 27.8 K/s (3000 _ F/min) R = 75%
91
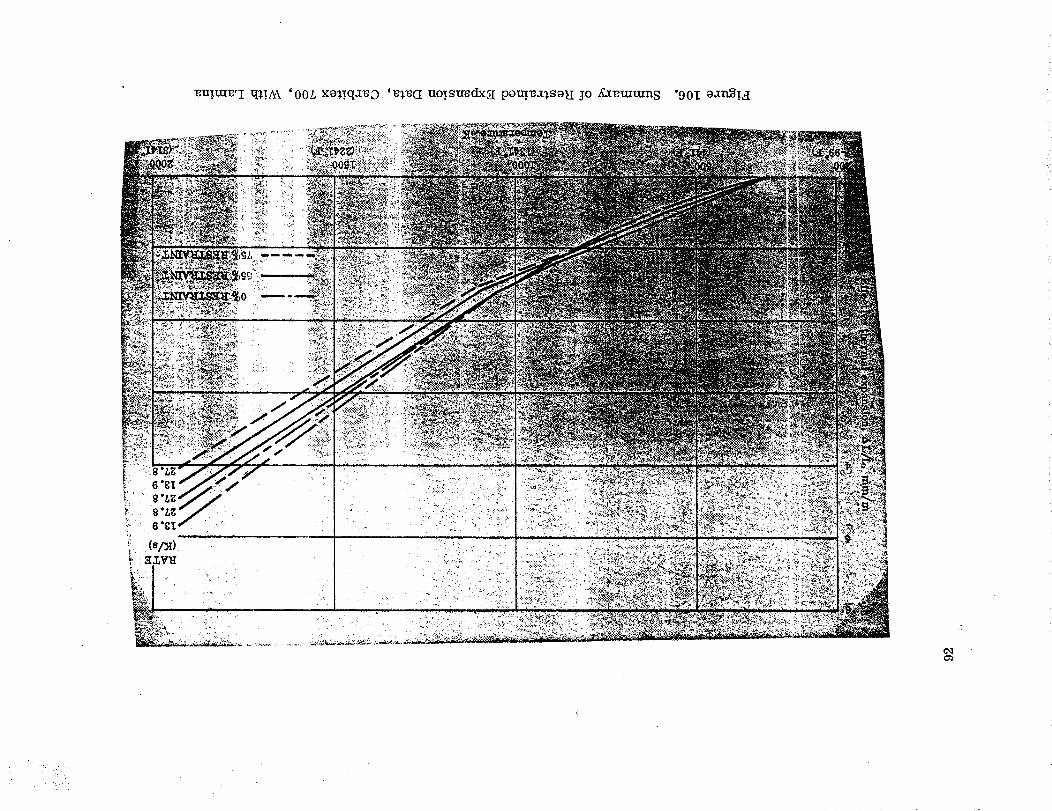
_uTm_'I q_,ThA '00L xo$t.q:t_O '_._(I uot.szmdxsI pom._:t_,SOH IO 2c_t_lxlmn_ "90I _=l_!_I
¢q
i _ .:_ '.:.
..:
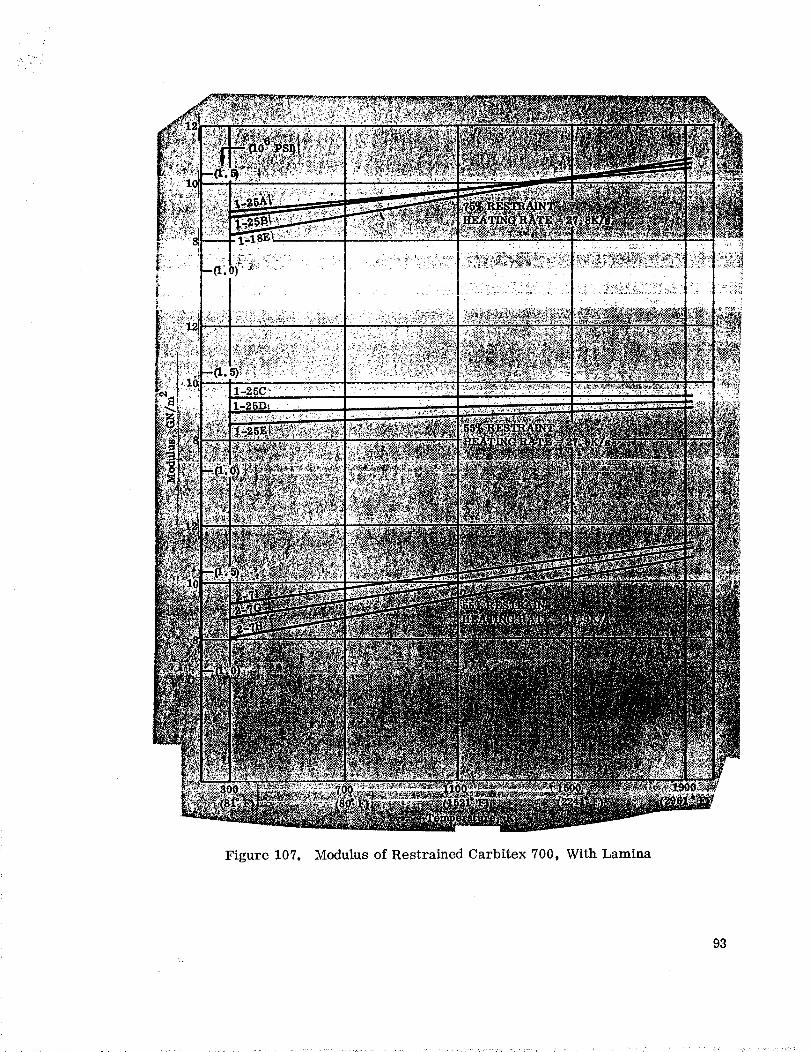
Figure 107. Modulus of Restrained Carbitex 700, With Lamina
93
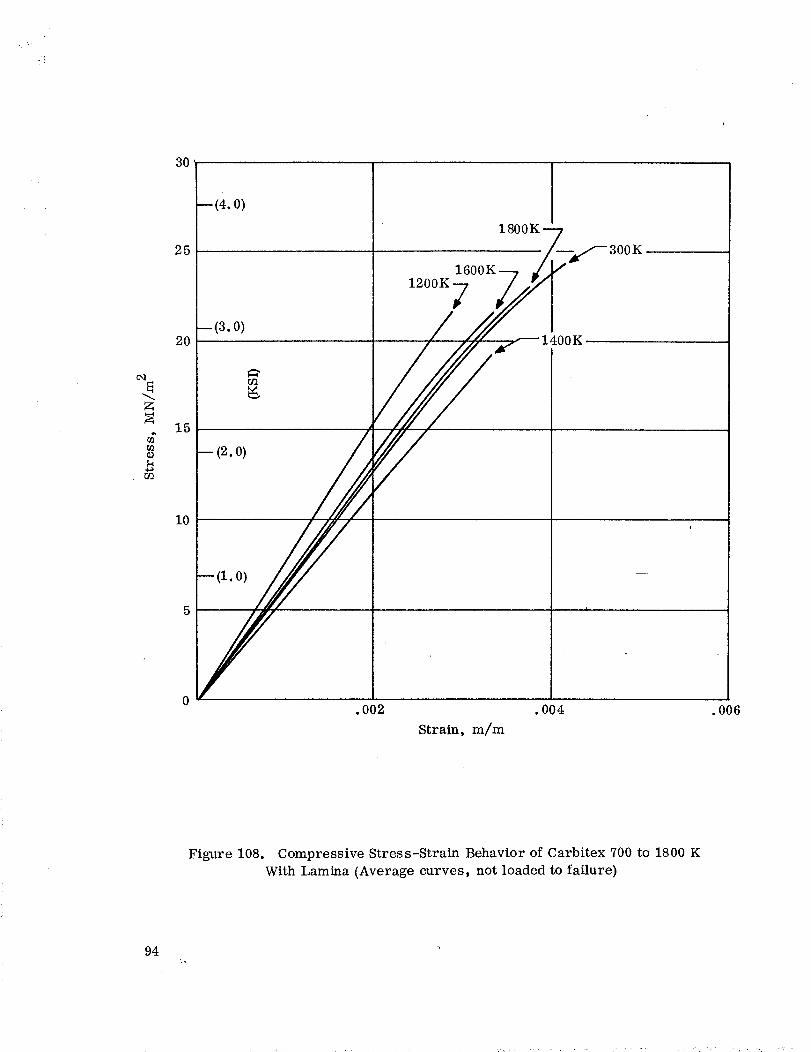
¢q
(Dk
4_
3O
25
2O
15
10
-- (4.0)
1800K ---]
-- (3.0)1400K.
-- (2. o) ///_/
/I
--(i.o)
0
300K
.002 .004 .006
Strain, m/m
Figure 108. Compressive Stress-Strain Behavior of Carbitex 700 to 1800 K
With Lamina (Average curves, not loaded to failure)
94
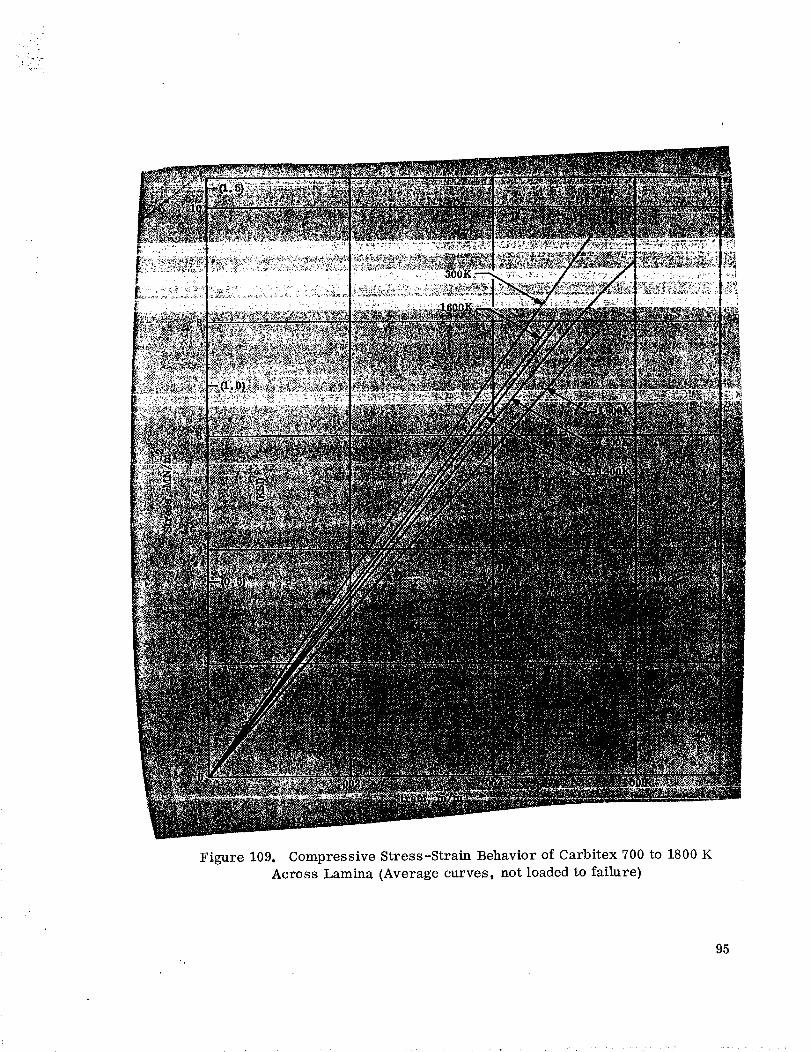
..o.
• !
Figure 109. Compressive Stress-Strain Behavior of Carbitex 700 to 1800 KAcross Lamina (Average curves, not loaded to failure)
95
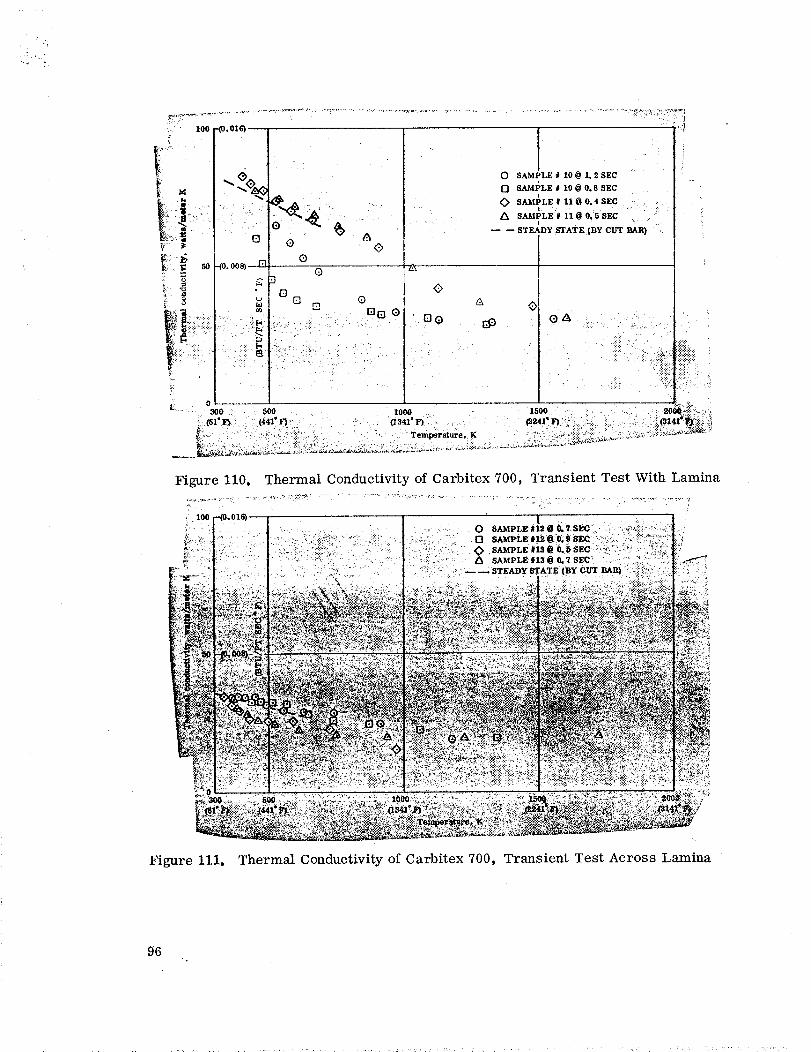
10o -Iv° vao_
0
f3E] _ Q
•:: ::!; . Beo Be
.. %:.: ::.: _ • / "
•.. : :.::k" ' I - ' ' .... "':'" ' "
J2 0- 300 . 500 1004}
_4;_''' k "_ -," _ _.. _ >-:_.',L._ ' '_,! -- _ '.. J: - : :: "- -A, :_...-._..:_..
A
L
0 SAMPL_ # lo @ ].. 2 sEc
17 8AMI_LE # 10 @ O. S SEC1
SAMPLE # 11 0 0,4 SEC , :.
SAMPLE # ].1 0 0.5 SEC :::
-- -- STEADY STATE (BY CUT BAR)
':!* _. _.,i "ji:iiii
I '
Thermal Conductivity of Carbitex 700, Transient Test With Lamina
Figure 111, Therm_ Conductivity of Carbitex 700, Transient Test Across _,amina '
96
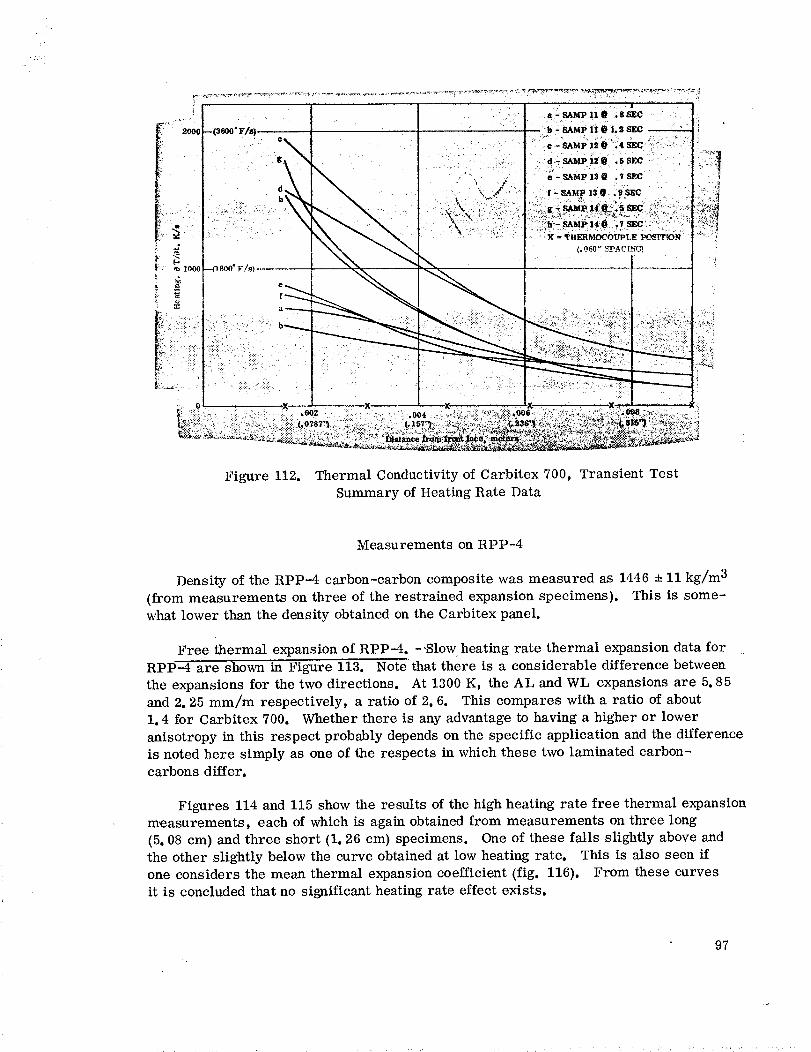
-- (3600" F/s),_
i.'.\\\°-_ .
f
• 2_o
:
I _ I()00 .B{, 800" F/.,
r
,oo)
- • : :::
)--
- - .'I ,S-.CAMI_IIO .$SEC ,
-: i .:'b_SA_i_Oi.2sec- _:
Figure 112. Thermal Conductivity of Carbitex 700, Transient Test
Summary of Heating Rate Data
Measurements on RPP-4
Density of the RPP-4 carbon-carbon composite was measured as 1446 ± 11 kg/m 3
(from measurements on three of the restrained expansion specimens). This is some-
what lower than the density obtained on the Carbitex panel.
Free thermal expansion of RPP--4. --Slow heating rate thermal expansion data for
RPP-4 are shown in Figure 113. Note that there is a considerable difference between
the expansions for the two directions. At 1300 K, the AL and WL expansions are 5. 85
and 2. 25 mm/m respectively, a ratio of 2. 6. This compares with a ratio of about1.4 for Carbitex 700. Whether there is any advantage to having a higher or lower
anisotropy in th'm respect probably depends on the specific application and the difference
is noted here simply as one of the respects in which these two laminated carbon-
carbons differ.
Figures 114 and 115 show the results of the high heating rate free thermal expansionmeasurements, each of which is again obtained from measurements on three long
(5. 08 cm) and three short (1. 26 cm) specimens. One of these falls slightly above andthe other slightly below the curve obtained at low heating rate. This is also seen if
one considers the mean thermal expansion coefficient (fig. 116). From these curves
it is concluded that no significant heating rate effect exists.
97
Restrained thermal expansion of RPP-4. - The results of restrained thermal
expansion measurements are shown in Figures 117 and 118. There appears to be no
significant difference between these two sets of data other than that considerably morescatter occured at the higher heating rate. Thus there again is no evidence of any
effect due to heating rate.
Comparing the effective thermal expansion obtained from the restrained expansiontests with the thermal expansion obtained from the free or unrestrained tests at com-
parable rates (fig. 119), it initially appears that a significant difference exists at the
higher temperatures with the expansion obtained from the restrained tests runningsomewhat lower than the free expansion. The reason for this difference is not known.
In the case of ATJ graphite and Carbitex 700 a similar deviation was also noted at the
higher levels of restraint and, particularly in the case of ATJ, it was thought that this
might be due to non-linearity of the stress-strain relation. However, in the case ofRPP-4 the stress-strain curves are, for the most part, remarkably linear and it
appears that this could not be the reason. As will be noted below (i. e., in the section
on compression tests) there is sufficient variability indicated by the stress-strain
curves that what appears to be a significant difference may only be a result of material
variability and an insufficient number of replicate tests to establish a reliable mean
curve. Note, for example, that the two free expansion curves (fig. 119), each of whichis based on six tests, differ by about 0. 50 mm/m. The mean of these two curves
differs from the restrained expansion curve by about 0. 75 mm/m, which would also
suggest that this difference may not be as significant as it first appears or that thereal difference between the two methods may be less than is indicated by this limited
number of tests. On the other hand, considering all of the tests on the three graphitic
materials (i. e., ATJ, Carbitex and RPP-4), it appears quite certain that the
restrained expansion tests do indicate an effective expansion which is somewhat lower
when the degree of restraint is high.
The with laminate modulus determinations made as a part of the restrained expansion
tests are shown in Figure 120. Compared to the corresponding measurements on
Carbitex 700 (fig. 107), it is seen that the starting values are about the same but the
RPP-4 shows a larger increase with increase in temperature.
Compression stress-strain tests on RPP-4. - As was the case with Carbitex, the
RPP-4 showed no significant heating rate effect. Therefore a number of compressivestress-strain tests were run rather than additional restrained expansion tests. The
results of:these measurements are given in Table 3 and Figures 121 and 122. As with
the Carbitex, and for the same reason, the specimens were not loaded to failure.
Considering the with laminate curves, there does not appear to be any trend with
increasing temperature. In general, the modulus of graphitics tend to increasesomewhat with increase in temperature over the temperature range covered in these
98
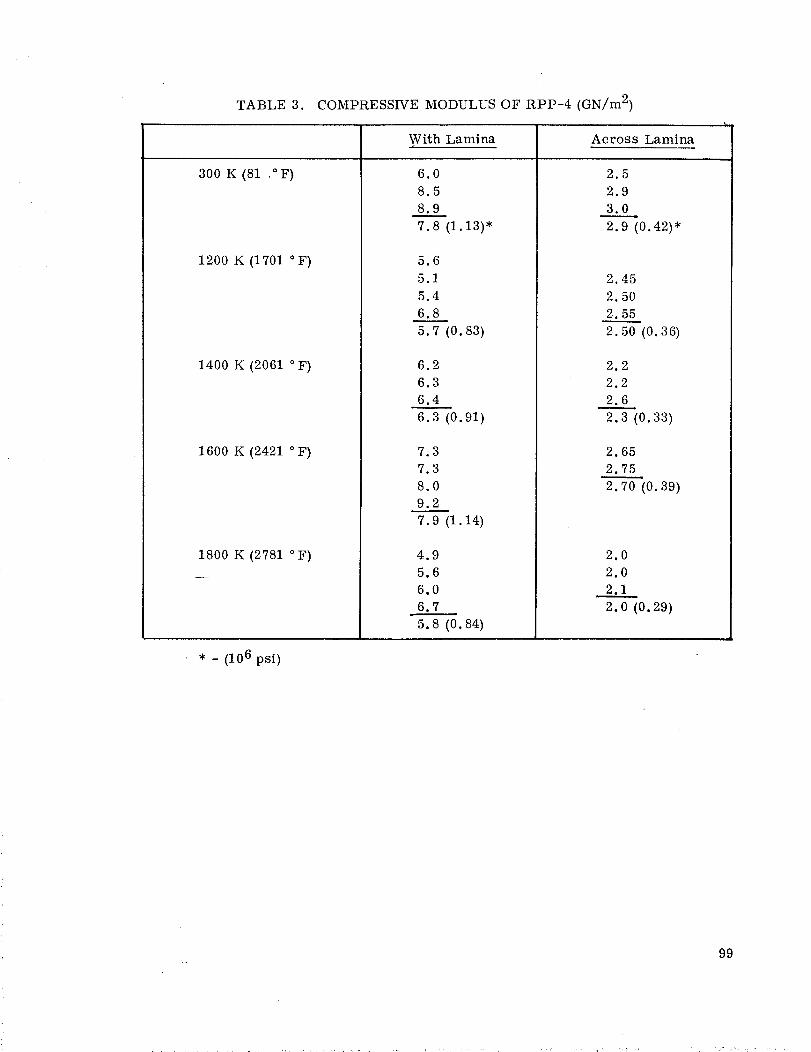
TABLE 3. COMPRESSIVE MODULUS OF RPP-4 (GN/m 2)
300 K (81 .°F)
1200 K (1701 ° F)
1400 K (2061 °F)
1600 K (2421 °F)
With Lamina
6.0
8.5
8.9
7.8 (1.13)*
5.6
5.1
5.4
6.8
5.7 (0.83)
6.2
6'3
6.4
6.3 (0.91)
7.3
7.3
8.0
9.2
7.9 (1.14)
Across Lamina
2.5
2.9
3.0
2.9 (0.42)*
2.45
2.50
2.5____5
2.50 (0.36)
2.2
2.2
2.6
2.3 (0.33)
2.65
2.75
2-_-_(0.39)
1800 K (2781 °F) 4.9
5.6
6.0
6.7
2.0
2.0
2._.__2__12.0 (0.29)
5.8 (0.84)
* - (106 psi)
99
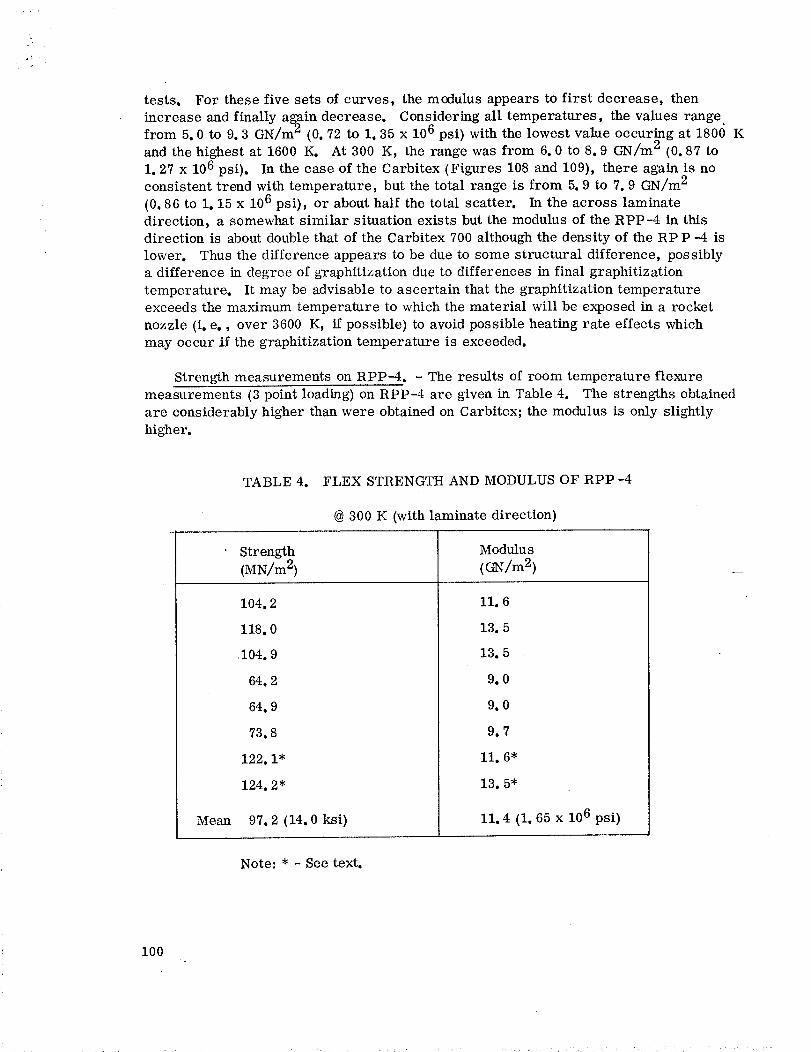
tests. For thesefive sets of curves, the modulusappearsto first decrease, thenincreaseandfinally ag;aindecrease. Consideringall temperatures, the valuesrangefrom 5.0 to 9.3 GN/m2 C0.72 to 1. 35x 106psi) with the lowest valueoccuring at 1800Kandthehighestat 1600tL At 300 K, the rangewasfrom 6.0 to 8.9 GN/m2 (0.87 to1. 27x 106psi). In the caseof the Carbitex CFigures108and109), there againis noconsistenttrend with temperature, but the total rangeis from 5.9 to 7.9 GN/m2C0.86to 1.15 x 10⁶psi), or abouthalf the total scatter. In the across laminatedirection, a somewhatsimilar situation exists but the modulusof theRPP-4 in thisdirection is aboutdoublethat of the Carbitex 700althoughthe densityof the RPP -4 islower. Thusthe differenceappearsto bedueto somestructural difference, possiblya difference in degreeof graphitizationdueto differencesin final graphitizationtemperature. It may beadvisableto ascertain that the graphitization temperatureexceedsthe maximumtemperatureto whichthe material will beexposedin a rocketnozzle Ci. e., over 3600K, if possible) to avoidpossibleheatingrate effects whichmay occur if the graphitization temperature is exceeded.
Strength measurements on RPP-4. - The results of room temperature flexure
measurements C3 point loading) on RPP-4 are given in Table 4. The strengths obtained
are considerably higher than were obtained on Carbitex; the modulus is only slightly
higher.
Mean
TABLE 4. FLEX STRENGTH AND MODULUS OF RPP-4
@ 300 K (with laminate direction)
Strength
(MN/m 2)
104.2
118.0
104.9
64.2
64.9
73.8
122.1"
124.2*
97.2 (14.0 ksi)
Modulus
(GN/m 2)
II. 6
13. 5
13.5
9.0
9.0
9.7
11. 6*
13.5*
Ii. 4 (I.65 x 106 psi)
Note: * - See text.
100
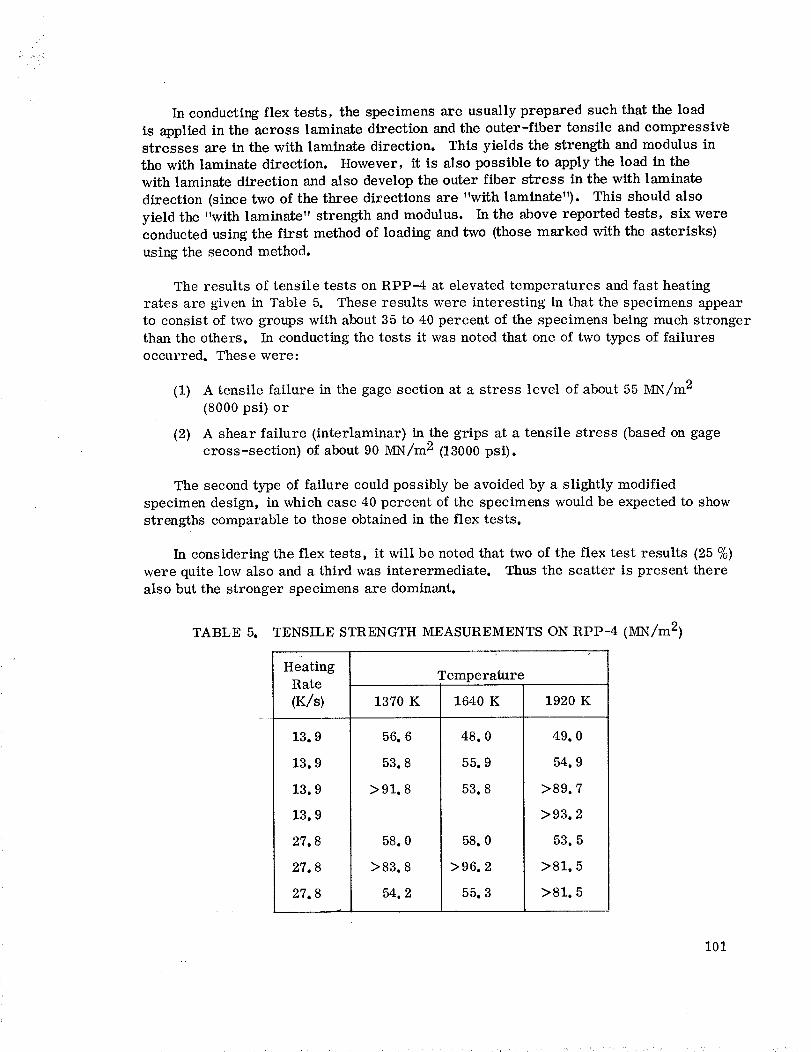
In conductingflex tests, the specimensare usuallyprepared suchthat the loadis appliedin the across laminatedirection andthe outer-fiber tensile andcompressivestresses are in the with laminate direction. This yields the strength andmodulusinthe with laminatedirection. However, it is alsopossible to apply the load in thewith laminatedirection andalso developthe outer fiber stress in the with laminatedirection (sincetwo of the three directions are "with laminate"). This shouldalsoyield the "with laminate" strengthandmodulus. In the abovereportedtests, six wereconductedusingthe first methodof loadingandtwo (thosemarked with the asterisks)usingthe secondmethod.
Theresults of tensile tests onRPP-4 at elevatedtemperatures andfast heatingrates are given in Table 5. Theseresults were interesting in that the specimensappearto consist of two groupswith about35 to 40percent of the specimensbeingmuchstrongerthan the others. In conductingthe tests it wasnotedthat oneof two typesof failuresoccurred. Thesewere.
(1) A tensile failure in the gagesectionat a stress level of about55MN/m2(8000psi) or
(2) A shear failure (interlaminar) in thegrips at a tensile stress (basedon gagecross-section) of about90MN/m2 (13000psi).
Thesecondtype of failure couldpossiblybeavoidedby a slightly modifiedspecimendesign, in which case40percentof the specimenswouldbeexpectedto showstrengthscomparableto thoseobtainedin theflex tests.
In consideringthe flex tests, it will benotedthat two of the flex test results (25%)were quite low also anda third was interermediate. Thusthe scatter is present therealso but the stronger specimensare dominant.
TABLE 5. TENSILESTRENGTHMEASUREMENTSONRPP-4 (MN/m2)
HeatingRate(K/s)
13.
13.
13.
13.
27.
27.
27.
1370 K
56. 6
53.8
>91.8
58.0
>83.8
54.2
Temperature
1640 K
48.0
55. 9
53.8
58.0
>96.2
55. 3
1920 K
49.0
54. 9
>89.7
>93.2
53.5
>81.5
>81.5
101
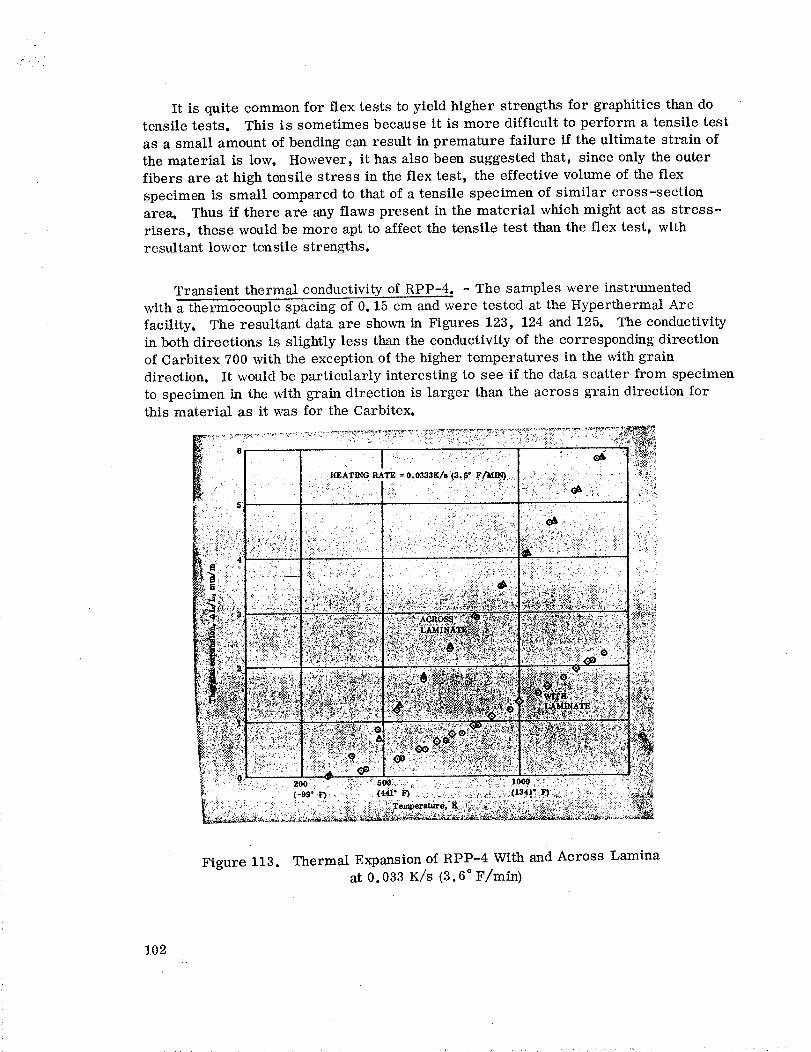
It is quite common for flex tests to yield higher strengths for graphitics than do
tensile tests. This is sometimes because it is more difficult to perform a tensile test
as a small amount of bending can result in premature failure if the ultimate strain of
the material is low. However, it has also been suggested that, since only the outer
fibers are at high tensile stress in the flex test, the effective volume of the flex
specimen is small compared to that of a tensile specimen of similar cross-sectionarea. Thus if there are any flaws present in the material which might act as stress-
risers, these would be more apt to affect the tensile test than the flex test, with
resultant lower tensile strengths.
Transient thermal conductivity of RPP-4. - The samples were instrumented
with a thermocouple spacing of 0.15 cm and were tested at the Hyperthermal Arc
facility. The resultant data are shown in Figures 123, 124 and 125. The conductivity
in both directions is slightly less than the conductivity of the corresponding direction
of Carbitex 700 with the exception of the higher temperatures in the with grain
direction. It would be particularly interesting to see if the data scatter from specimen
to specimen in the with grain direction is larger than the across grain direction forthis material as it was for the Carbitex.
HEATIIqG PATE = 0.0333K/s;(3. 6" F/MI]_,.. _ ,.? ::. : "
Figure 113. Thermal Expansion of RPP-4 With and Across Laminaat 0.033 K/s (3.6 ° F/min)
102
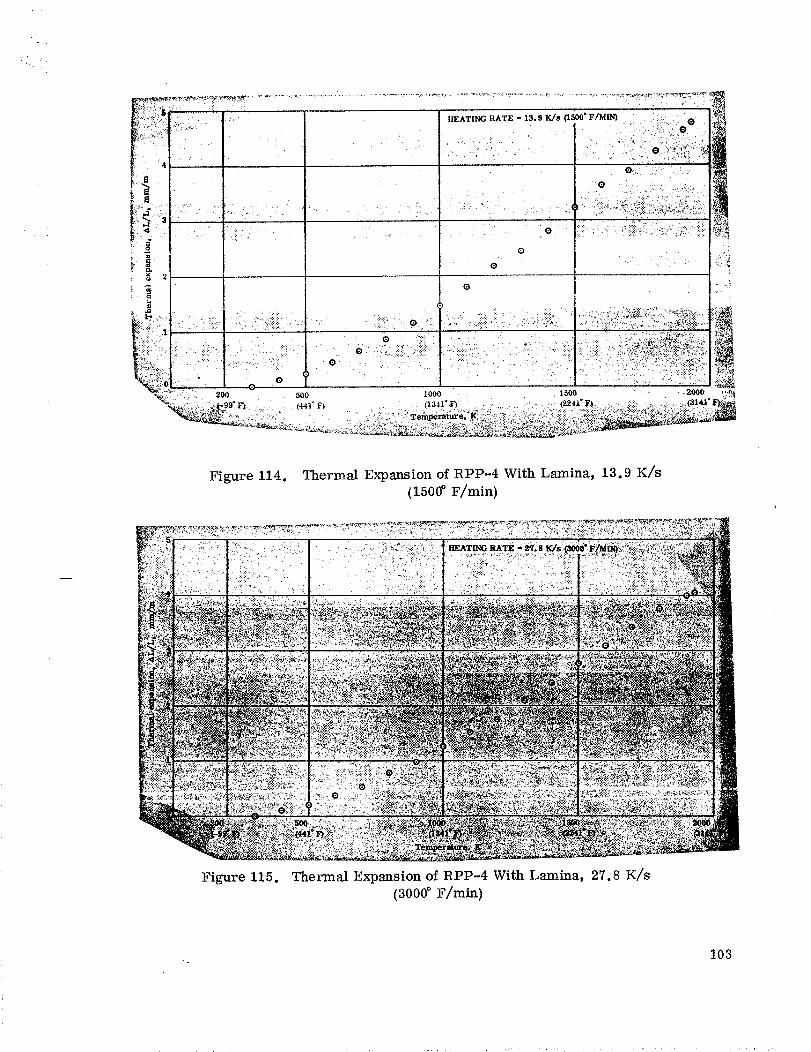
: ...... ::::. i ,+..:I:i i .ii+,;!i+::!:. !:!iiiii_:+F .... +._:+_+:+:+:.+-..... - .... '+!i+.:::++i ' ". +,+_, -: :+::-'
, ' • i , 0 ::::: .... ' i ,. _ ,: ::++,_¢_+,_ ++:++_
O • , .:i!i:1. , iii_!+: : :+ :i:+: (_ , : ., +-,:- _+_ ii!+i:._ .!_ii! +:_. ,_£-£;_,,._{_i!:_++q;..}_,-::_-_:,
t •_. .... :, - ,' :i:::, . , : + ++ .- +I ..;,:+ -_:.[;,+ +-?i.2../_.;.12,,,
• -":- - +,i. -:: " O _ + I ...... +....... :._::+._ -
5 " " 0 " _
_., - ..... 200 500 ]000(13.,J1+p} .... ]500C2241+¥._ [+...+.,(31,_t_2000 + ,.++_"_.+._+:.:::,+,,_-9s°_ <.re°F) -+..+, . . _...........
+ _+/+_ + ..... ? + + " ..... ..... , ..... +;k 5 _: "y._ + Fk+ "'_ ,>" : :+: r ' +++_+_[?_ k ++ _< rr +1 +_ ++:+_'t '_+q _+:_ .+++ ++_+++ ++::+ r " "[ +,+ +
Figure 114. Thermal Expansion of RPP-4 With Lamina, 13.9 K/s
(1500 + F/min)
Figure 115. Thermal Expansion of RPP-4 With Lamina, 27.8 K/s
(300¢ F/min)
103
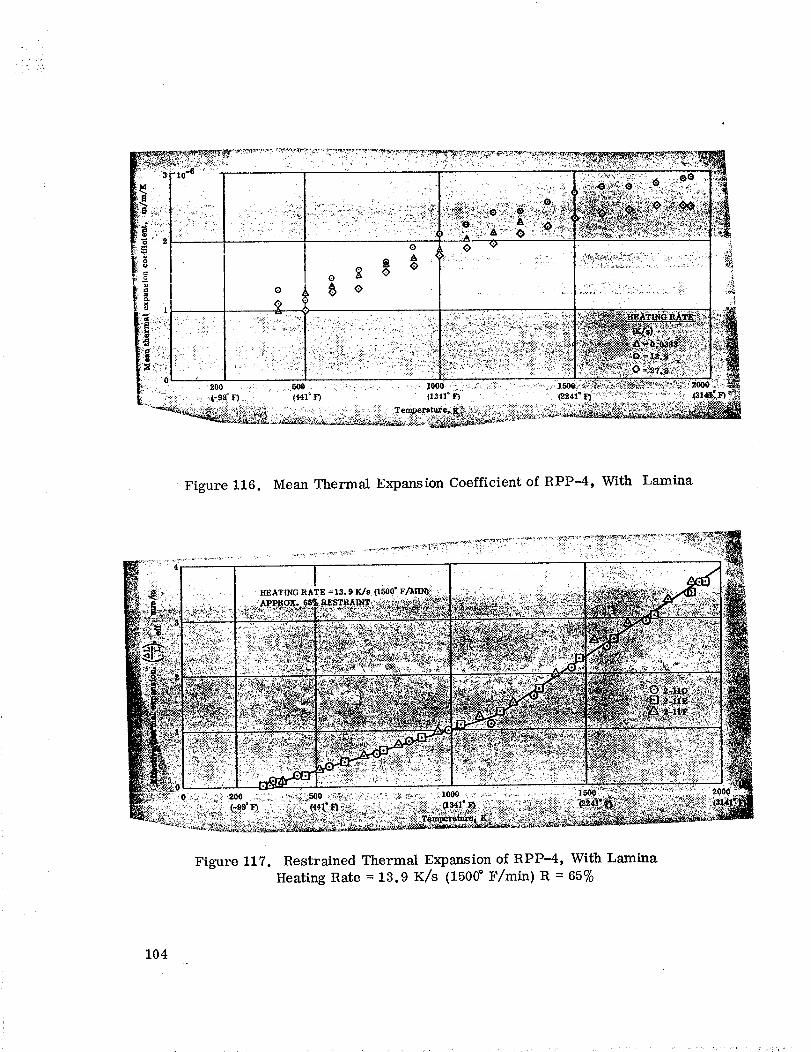
""_ " " 0 _ _> _ " i . " ' -;
o _ e e ..... ............................
•. ,._ 200 500 _.:_..... I0_0 - -
•Figure 116. Mean Thermal Expansion Coefficientof RPP-4, With Lamina
Figure 117. Restrained Thermal Expansion of RPP-4, With Lamina
Heating Rate = 13.9 K/s (1500 ° F/rain) R = 65%
104
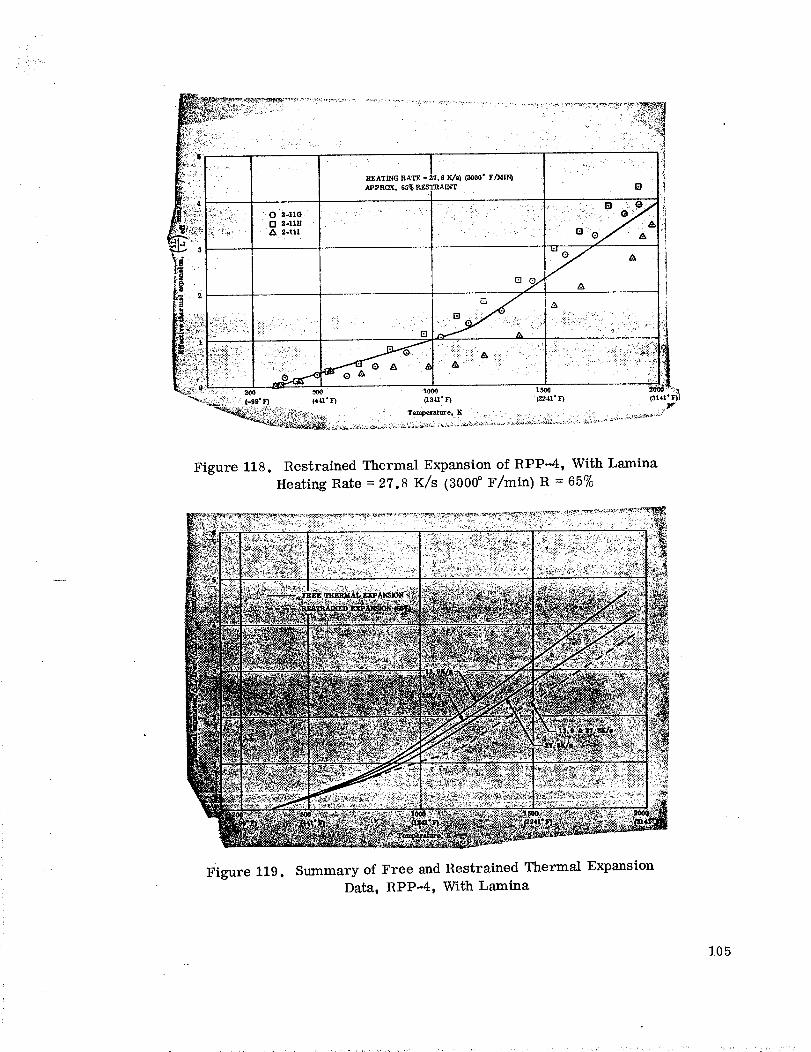
: ii̧ !`I
i:+++,i-_++,"
HEATING RATE = _'q.8 KiSs}
APpRCOC. 657o P.,F.s'rI_I_'T
I"I 2-11B •A 2o111
.... °
• "-2_:§:,-e{
(3ooo"F/M_ I_
Figure 118. Restrained Thermal Expansion of RPP-4, With Lamina
Heating Rate = 27.8 K/s (3000 ° F/rain) R = 65%
Figure 119. Summary of Free and Restrained Thermal Expansion
Data, RPP-4, With Lamina
105
• .,: , . i.: +
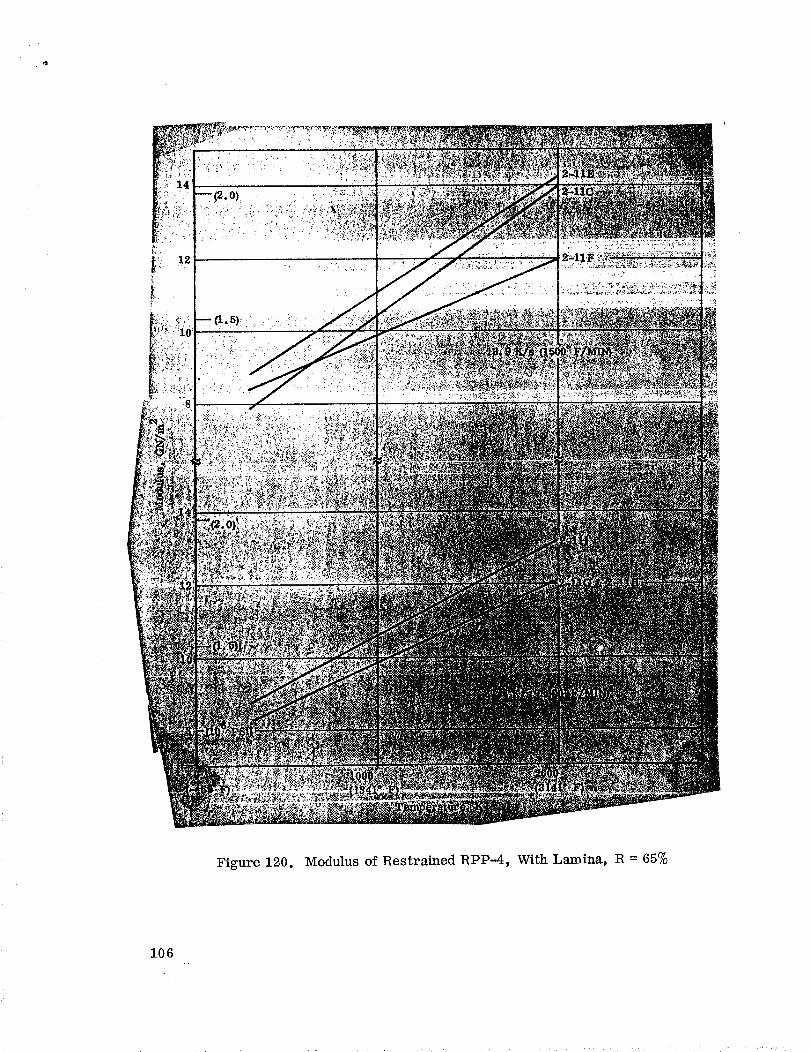
!
Figure 120. Modulus of Restrained RPP-4, With Lamina, R = 65%
106
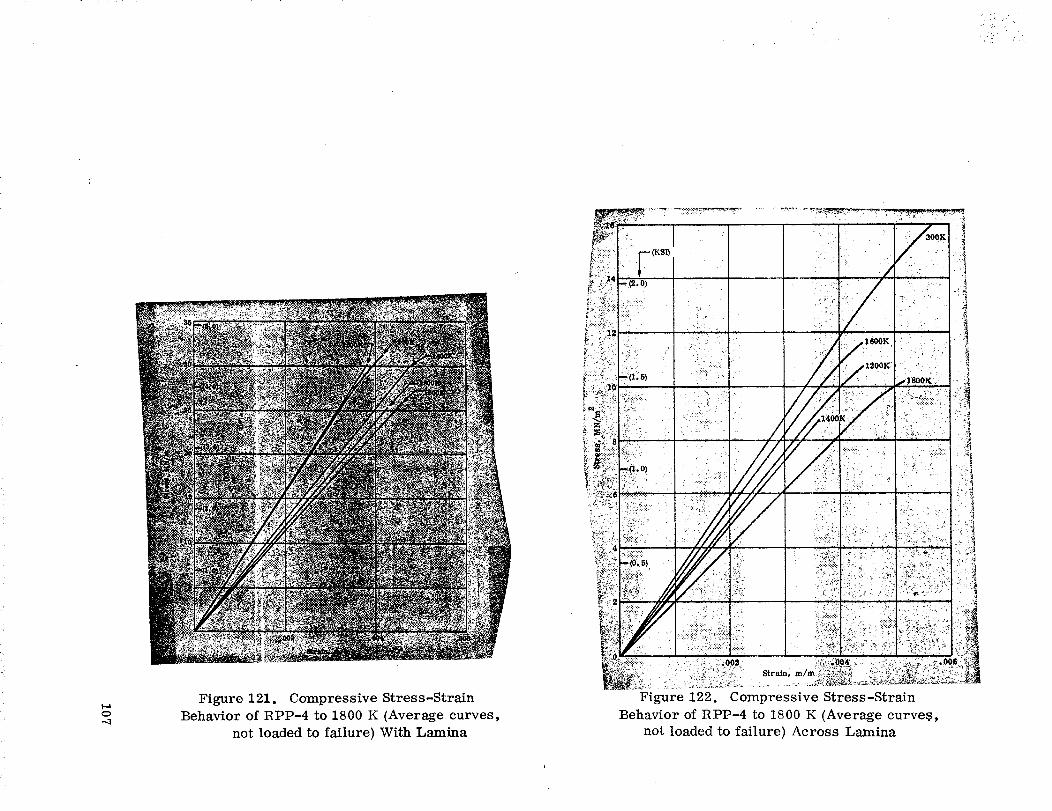
Figure 121. Compressive Stress-Strain
Behavior of RPP-4 to 1800 K (Average curves,
not loaded to failure) With Lamina
: : :_:(_ Strain, m/m
Figure 122. Compressive Stress-Strain
Behavior of RPP-4 to 1800 K (Average curve@,
not loaded to failure) Across Lamina
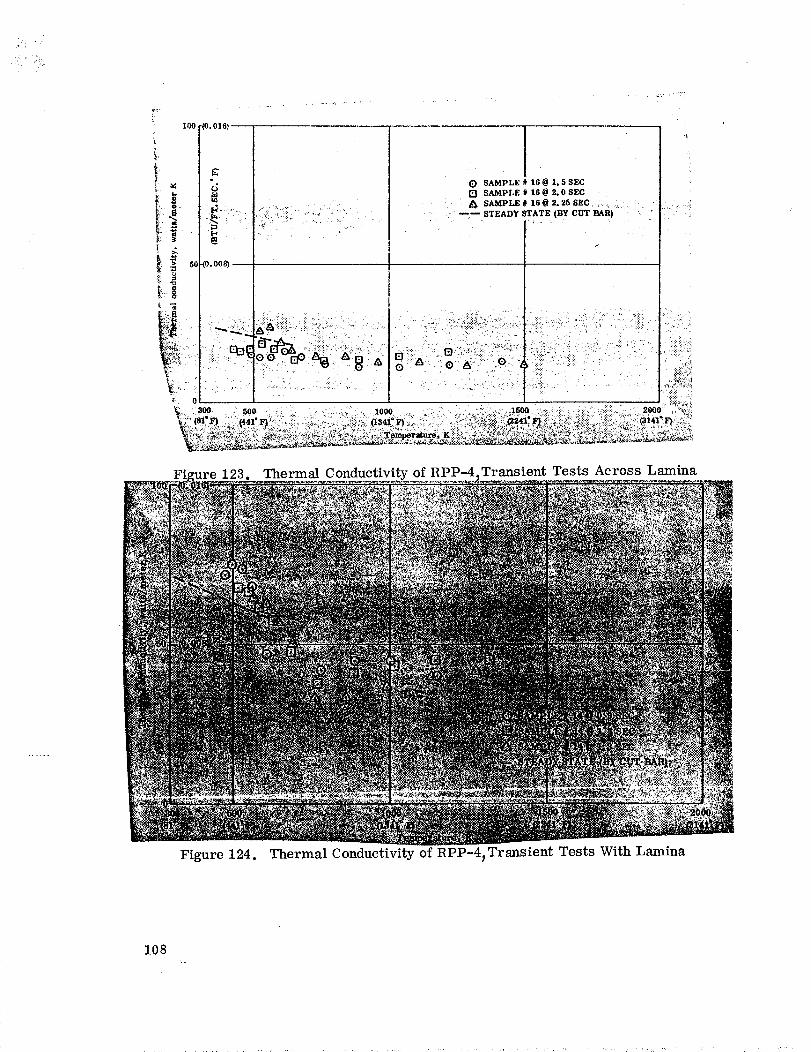
100
!t
i:
': "g 5(
::" "a
i
?i
u° U.LUl
o
d
_o.oos)
0 SAMPLE # 16@ 1.5SEC
SAMPLE # 16 @ 2. 0 SEC
• A SAMPLE#[email protected] ._ _ -
. . _m STEADY STATE (BY CUT BAR) - '-
f
.300 500 ...... :,. I000 ._ . 7. p , _,500 -:: -:: : ::?: ,:-:::. • 2000 , _-;:,
123. Thermal Conductivity of RPP-4 Transient Tests Across Lamina
Figure 124. Thermal Conductivity of RPP-4_Transient Tests With Lamina
108
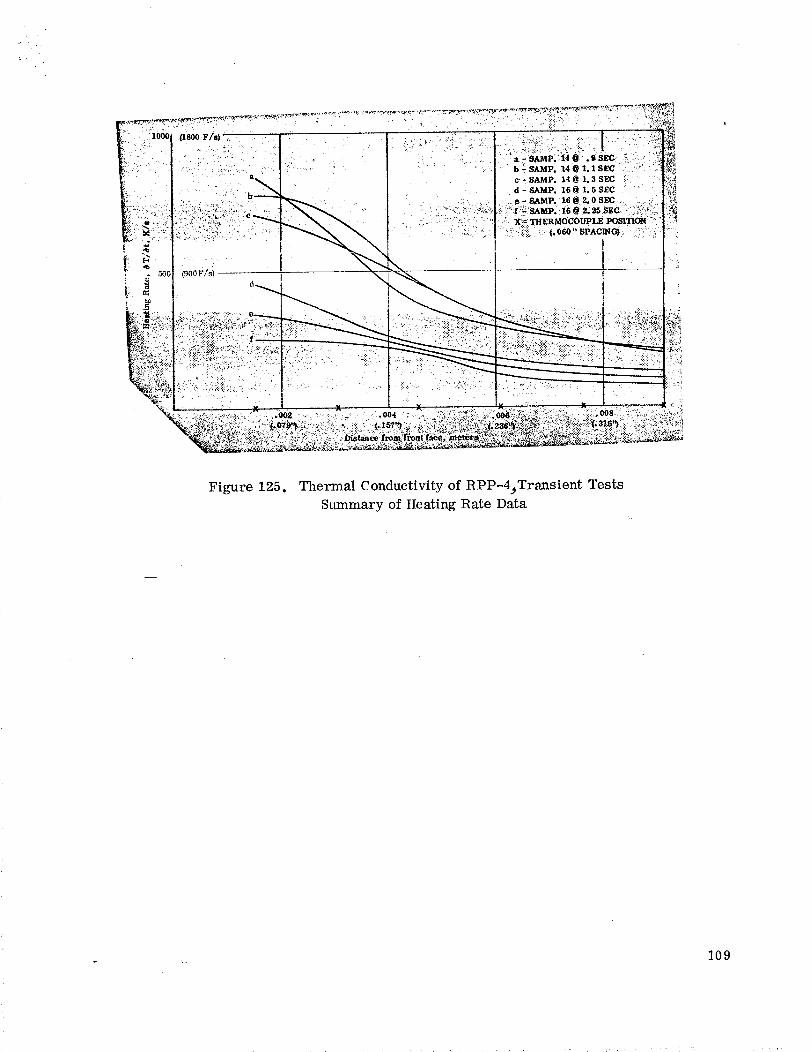
i¸5_0 (9ooF/s)
, f d_.
c - SAMP. 14 @ 1. 3 SEC ':"
d - S_M_. z6 @ Z. _ SZC
X X
.... ?",_
Figure 125. Thermal Conductivity of RPP-4_Transient Tests
Summary of Heating Rate Data
]09
UTILIZATIONOF TRANSIENTDATA IN THERMO-STRUCTURALANALYSIS
As additional knowledgeof material behavior becomesavailable, the designer/structural analyst must answerthe question, "How canrecent understandingsof materialbehaviorbest be factored into the present design/analysistechniques?" For loading rate
sensitive materials, one must estimate the loading rate, then determine the suitable
properties for analysis of the resulting stresses and deformation.
In the present work, thermal expansion has been found to be dependent on constraint
and rate of change in temperature. Consequently, before predicting thermal stresses,one must determine the rate of change of temperature at a given location, along with
the relative physical constraints. The appropriate thermal expansion curves may thenbe used to determine the thermal expansion for use in thermal stress calculations. In
relatively simple geometric problems the contraint on the material may be easily
characterized and one need only determine thermal expansion as a function of the given
rate of change of temperature. Stated more simply, material properties such as
thermal expansion must now be considered as a function of the material, the rate of
change of temperature, and the physical constraints on the material. That is, thermal
expansion becomes:
AL = f dTT (-_-, o, constraint)
Given the temperature history of a material, the time rate of change of temperature
can be determined rather easily for any point in the material. However, except for
simple geometries, the constraint at a given point is not so easily determined. For
highly cons--traint sensitive materials one must first estimate the final stress levels
(hence constraint), then calculate a stress solution for the assumed constraint. A
comparison of the resulting constraints with those assumed will determine the accuracy
of the results. A few iterations of the analysis should be sufficient to define a final
stress state which reflects the proper material properties.
111
CONCLUSIONS
ATJ Graphite
1. Thermal expansionunder free or unrestrainedconditionsis independentofheatingrate for rates up to 27.8 K/s (3000°F/min.) andtemperatures upto 1900K(2961°F).
2. Effective thermal expansion,obtainedfrom restrained expansiontests, isessentially the sameasthe free expansionfor restraints up to at least 55 percent.Highrestraint (75%)appearsto yield a slightly low result.
3. Thermal conductivityobtainedfrom thetransient test agreeswith earlierstatic data, indicating a lack of anyheatingrate sensitivity.
4. No significantheatingrate effects were anticipatedfor ATJ graphiteandtheagreementbetweenstatic andtransient techniquesindicatesthe validity of the transienttechniques.
MX 2600Silica Phenolic
1. Heatingrate hasa significant effect uponthe free thermal expansion. In-creasing the heatingrate results in higherpeakexpansionandthe return to zeroexpansionoccurs at higher temperature.
2. Thepeakin the effectivethermal expansionversus temperature curve (withlamina direction) is shiftedto lower temperaturesandthe expansionreturns to zeroat lower temperature asthe degreeof restraint is increased. Thus, increasedre-straint hasessentially the oppositeeffect of increasingheating rate.
3. Across lamina restraint appearsto havea similar effect. However, thecombinationof highrestraint with high heatingrate can result in high stress (duetogaspressure) andhence, a higheffective thermal expansion. This condition canre-sult in large piecesof material beingblownoff of the surface asgasesescape. Thus,in enduse, a combinationof high heatingrate andhighrestraint could leadto a highablationrate.
4. Within a limited rangeof heatingrates (2.9 and5.0 K/s), heatingrate andrestraint did not appearto havea significant effectuponthe modulusobtainedunderrestrained conditions.
113
5. Strengthdecreasedwith increase in temperature. Heatingrate did nothavea significanteffect within the narrow rangeof 2.8 to 7.0 K/s but thesecould differfrom static data.
6. Density of char formedby exposureto the plasma from atandemGerdienarc wassomewhatlower (8%)thanchar obtainedfrom a fired SCOUTmotor.
7. Thermal conductivityof the char from a SCOUTmotor (30degreelay-up)was intermediate to the with andacross-lamina dataobtainedon arc formed char,aswouldbe expected,at low temperatures. However, at hightemperaturestheconductivityof the motor formed charwas higher thaneither of the arc-formed chars.This couldbedueto the somewhathigher density.
FM 5272CellulosePhenolic
1. Thermal expansionof FM 5272is significantly affectedby heatingrate.Peakexpansionis increasedandthe peakis shifted to higher temperature astheheatingrate is increased.
2. Thepeakeffective thermal expansion(restrained test) is considerablylessthan the expansionobtainedfrom a free or unrestrainedtest at a comparableheatingrate andthe peaksoccur at lower temperature.
3. Within a narrow rangeof heatingrates, heating rate andrestraint donotappearto affect the moduluswhich is obtainedunderrestrained conditions.
4. Strengthdecreasessignificantly with increase in temperature. Heatingratesof 2.8 and7 K/s gavecomparableresults but increasingthe rate to 13.9 K/s(1500° F/min ) resulted in lower strengthsandconsiderablymore scatter.
5. Char formed in the Gerdienarc facility was so weakthat transient thermalconductivitymodelsdisintegratedalmost instantly uponsubsequentexposureto thearc. Char formed underslower heatingconditionswas stronger but still couldnotsurvive theplasma flow of thearc (or eventhe gas flow from a Linde torch) longenoughto provide useful data.
Carbitex 700
1. Thermal expansionis independentof heatingrate within the range of rates andtemperaturesemployed.
2. As with the ATJ graphite, the restrained expansiontests gives aneffectiveex-pansionwhich is slightly low at the higher temperatureswith the deviation increasingasthe restraint is increased. Upto about55percent restraint the deviationis minor.
114
3. Heatingrate andtemperature had no effect upon strength within the range of
rates and temperatures employed.
4. At low temperatures, thermal conductivities were the same for both the
transient and cut-bar techniques, indicating no rate effect.
5. Thermal conductivity in the with-lamina direction shows considerable scatter
(transient technique). This may be related to the fact that fiber bundles have higherconductivities than surrounding matrix material and the thermocouples are very small
in diameter and measure temperature in a very localized region.
RPI_-4
1. Thermal expansion is independent of heating rate within the range of rates and
temperatures employed.
2. Effective thermal expansion obtained from restrained expansion tests runs
somewhat lower than the free expansion. However, restrained expansion tests were
only run at 65 percent restraint and the other graphities also showed such a deviationat restraints above about 55 percent.
3. Compressive stress-strain curves showed greater variability as comparedwith the Carbitex 700.
4. With lamina tensile strength appeared to be independent of heating rate and
temperature within the ranges employed.
5. About 60 percent of the tensile specimens had tensile stren_hs of about 55 MN/m2
(8,000 psi). The other 40 percent had strengths in excess of 90 NM/m 2 (13,000 psi).
6. At low temperature, the transient and cut-bar techniques gave essentially the
same thermal conductivity, thus indicating no rate effect.
7. As with the Carbitex 700, transiently determined thermal conductivity in the
with-lamina direction shows anomalies which may be related to the difference in con-
ductivities of the fibers and matrix.
General
1. Graphite materials generally would not be expected to show significant heating
rate effects at temperatures below their graphitization temperature. This has beentrue of the materials tested. As a result, material properties determined under
static heating conditions should be adequate.
115
2. Reinforced polymeric materials exhibit significant heating rate effects on
properties. As a result, thermal expansion data in particular shouldbe determinedunder conditions of heating rate and restraint which approach, as near as possible,
the conditions expected in the end-use application.
116
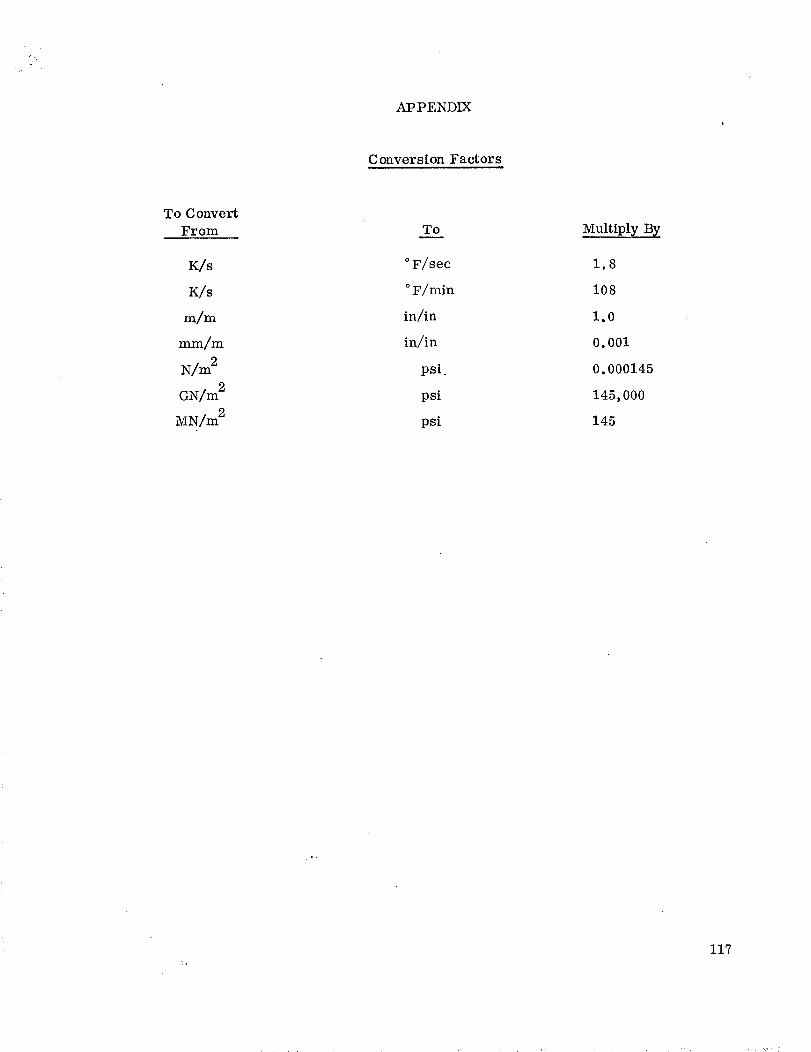
APPENDIX
C onversion Factors
To Convert
From
K/s
K/s
m/m
mm/m
GN/m 2
MN/m 2
To
° F/sec
° F/rain
in/in
in/in
psi
psi
psi
Multiply By
1.8
108
1.0
0. 001
0. 000145
145,000
145
117
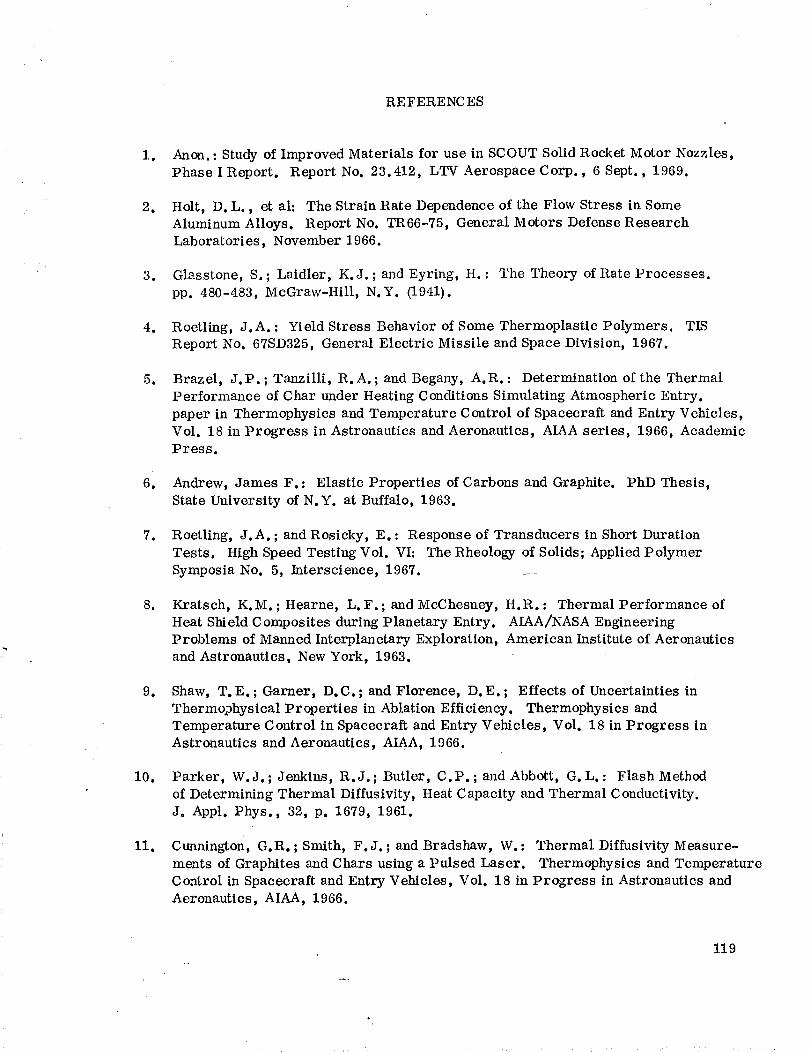
RE FERENC ES
Io
.
.
.
.
.
.
.
.
I0.
11.
Anon. : Study of Improved Materials for use in SCOUT Solid Rocket Motor Nozzles,
Phase I Report. Report No. 23.412, LTV Aerospace Corp., 6 Sept., 1969.
Holt, D.L., et al: The Strain Rate Dependence of the Flow Stress in Some
Aluminum Alloys. Report No. TR66-75, General Motors Defense Research
Laboratories, November 1966.
Glasstone, S. ; Laidler, K.J. ; and Eyring, H. : The Theory of Rate Processes.
pp. 480-483, McGraw-Hill, N.Y. (1941).
Roetling, J.A. : Yield Stress Behavior of Some Thermoplastic Polymers. TIS
Report No. 67SD325, General Electric Missile and Space Division, 1967.
Brazel, J.P. ; Tanzilli, R.A. ; and Begany, A.R. : Determination of the Thermal
Performance of Char under Heating Conditions Simulating Atmospheric Entry.
paper in Thermophysics and Temperature Control of Spacecraft and Entry Vehicles,
Vol. 18 in Progress in Astronautics and Aeronautics, AIAA series, 1966, AcademicPress.
Andrew, James F.: Elastic Properties of Carbons and Graphite. PhD Thesis,
State University of N.Y. at Buffalo, 1963.
Roetling, J.A. ; and Rosicky, E. : Response of Transducers in Short Duration
Tests. High Speed Testing Vol. Vh The Rheology of Solids; Applied Polymer
Symposia No. 5, Interscience, 1967.
Kratsch, K.M. ; Hearne, L.F. ; and McChesney, H.R. : Thermal Performance of
Heat Shield Composites during Planetary Entry. AIAA/NASA Engineering
Problems of Manned Interplanetary Exploration, American Institute of Aeronautics
and Astronautics, New York, 1963.
Shaw, T.E. ; Garners D.C. ; and Florenee_ D.E. ; Effects of Uncertainties in
Thermophysieal Properties in Ablation Efficiency. Thermophysics and
Temperature Control in Spacecraft and Entry Vehicles, Vol. 18 in Progress in
Astronautics and Aeronautics_ AIAA, 1966.
Parker, W.J. ; Jenkins9 R.J. ; Butler, C.P. ; and Abbott, G.L. : Flash Method
of Determining Thermal Diffusivity, Heat Capacity and Thermal Conductivity.J. Appl. Phys., 32, p. 1679, 1961.
Cunnington, G.R. ; Smith, F.J. ; and Bradshaw, W. : Thermal Diffusivity Measure-
meats of Graphites and Chars using a Pulsed Laser. Thermophysics and Temperature
Control in Spacecraft and Entry Vehicles, Vol. 18 in Pro_oTess in Astronautics and
Aeronautics, AIAA, 1966.
119
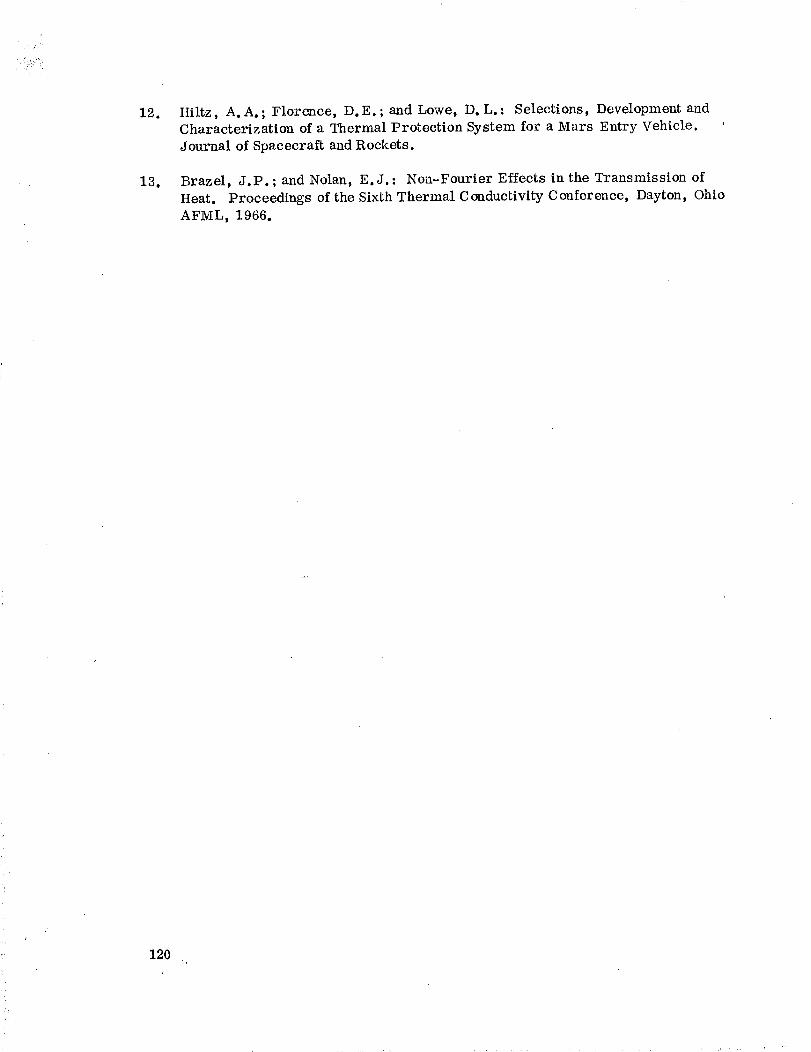
12.
13.
Hiltz, A.A. ;Florence, D.E. ;and Lowej D.L.: Selections, DevelopmentandCharacterization of a Thermal Protection Systemfor a Mars Entry Vehicle.Journal of SpacecraftandRockets.
Brazel, J.P. ; andNolan, E.J. : Non-Fourier Effects in the TransmissionofHeat. Proceedingsof the SixthThermal ConductivityConference,Dayton,OhioAFML, 1966.
120


