Embed Size (px)
Citation preview

(Other than Muslims)
Report Submitted to:
National Commission for Minorities (NCM)
Preet Rustagi Abhay Kumar
Balwant Singh Mehta Sunil Kumar Mishra
Payel Dutta Mazumdar
March 2008
INSTITUTE FOR HUMAN DEVELOPMENT
NIDM Building, 3rd
Floor, IIPA Campus, I.P Estate, New Delhi-110002 Ph: 23358166, 23321610; Fax: 23765410; Email: [email protected]; www.ihdindia.org

Preet Rustagi, Ph.D March 25, 2008 Senior Fellow
Subject: Project Report Submission “Socio-Economic Status of the Notified Minority Communities (Other than Muslims)”
Dear Shri Qureshi, We are happy that the National Commission for Minorities (NCM), Government of India gave us this opportunity to conduct a study based on secondary data sources regarding the socio-economic profile of the four notified minority communities. As agreed upon in our discussions with the NCM prior to the initiation of the study, the report provides a detailed quantitative account of the four notified minority communities – Sikhs, Christians, Buddhists and Parsis – using all available information.
The terms of reference for the study were as follows:
1. The Socio-economic study will be done in respect of the four notified minority communities i.e. Christians, Sikhs, Buddhists, including Neo Buddhists and Parsis.
2. The study will cover the educational, economic and social status of the four minority communities apart from their hygiene, health and religion related problems.
3. The study will take into account the three strata of the four minority communities for the assessment of their socio-economic and religious status i.e. the elites, the middle class and lowest strata including artisans and labourers.
4. The study will highlight the problematic areas and suggest viable measures to resolve the problems of the minorities so that the minorities can walk abreast with other privileged communities in all walks of life in due course.
5. The study will include detailed recommendations based on their findings on the socio-economic and educational backwardness of the minorities.
The Institute for Human Development (IHD) research team attempted to provide a comprehensive account and address all the above stated dimensions subject to the data availability. Information has been collated and analysed from unit records of National Sample Survey (NSS), Census and National Family Health Survey (NFHS). We hope that the report will be useful for the NCM in taking its mandate further. We look forward to your comments and suggestions on the report.
With warm regards,
Yours sincerely,
(Preet Rustagi)
Shri Mohamed Shafi Qureshi Chairperson National Commission for Minorities (NCM) Lok Nayak Bhavan (Fifth Floor), Khan Market New Delhi – 110003
Copy to: 1. Smt. Deepa Jain Singh, Secretary, NCM 2. Shri S.K. Swami, Joint Secretary, NCM
Enclosed: Eight copies of the Report

ACKNOWLEDGEMENTS
We wish to thank the National Commission for Minorities (NCM), Government of India
for sponsoring this study on the Socio-Economic Status of the Notified Minority
Communities (other than Muslims). Particularly, we are extremely thankful to Prof. Zoya
Hasan, Member of the NCM for providing us the opportunity to undertake this study. We
also benefited tremendously through the several detailed discussions with her. Thanks
are also due to Dr. Mehroo Dhunjisha Bengalee, Member of the NCM for sharing time
and information in the course of the meetings we held with her at the inception of the
study.
Prof. Alakh N. Sharma, Director, Institute for Human Development (IHD) has been a
constant source of inspiration and support in all our research endeavours and we wish to
extend our thanks to him for always being there when we needed him. Senior visiting
faculty and colleagues at IHD have shared ideas and held discussions making all our
research pursuits pleasurable.
Research assistance ably provided by Mr. Pinaki Joddar at the early stages of the
project (after which he left IHD) and Dr. Rajani Menon towards the final stages of the
study when she joined the IHD team deserve to be acknowledged. Thanks are also due
to Mr. Prem Chandra, Administrative Manager along with his team for extending their
support in all administrative matters and Shri S.P. Sharma for responsibly undertaking
the typing, page setting and related tasks within a short time period. Ms. Shashikala
Menon undertook the copyediting of the report and her help in this direction is
acknowledged.
The rich data available from different secondary sources makes it feasible to undertake
very interesting analysis. Given the short period of four months, we have been able to
only undertake an all India profiling of the four notified minority communities – Sikhs,
Christians, Buddhists and Parsis/Zoroastrians – which provides some very insightful
findings. We hope this study will pave the way for further state and region level
explorations on the minority communities.
- IHD Research Team
Preet Rustagi Abhay Kumar
Balwant Singh Mehta Sunil Kumar Mishra
Payel Dutta Mazumdar

CONTENTSCONTENTSCONTENTSCONTENTS
Acknowledgements------------------------------------------------------------------------ i
Contents -------------------------------------------------------------------------------- ii-iii
List of Tables, Figures and Appendices-----------------------------------------------iv-vii
Main Highlights of the Report------------------------------------------------------ viii-xxii
CHAPTER I: INTRODUCTIONCHAPTER I: INTRODUCTIONCHAPTER I: INTRODUCTIONCHAPTER I: INTRODUCTION ------------------------------------------------------------------------------------------------------------------------------------------------------------------------------------------------------------------------------------------------------------------------------------------------1111----19191919
1. Chapter Structure -------------------------------------------------------------------1
2. Data Sources and Limitations ------------------------------------------------------2
3. Share of Notified Minority Communities -------------------------------------------3
4. Geographical Profile -----------------------------------------------------------------4
5. Christians ----------------------------------------------------------------------------5
6. Sikhs ---------------------------------------------------------------------------------5
7. Buddhists ----------------------------------------------------------------------------6
8. Parsis/Zoroastrians------------------------------------------------------------------6
CHAPTER II: DEMOGRAPHIC PROFILECHAPTER II: DEMOGRAPHIC PROFILECHAPTER II: DEMOGRAPHIC PROFILECHAPTER II: DEMOGRAPHIC PROFILE ---------------------------------------------------------------------------------------------------------------------------------------------------------------------------------------------------------------------------- 20202020----33333333
1. Number and Percentage Share --------------------------------------------------- 20
2. Distribution of Population by State and Social Groups -------------------------- 22
3. Rate of Urbanisation -------------------------------------------------------------- 24
4. Household and household Size --------------------------------------------------- 24
5. Head of the Household------------------------------------------------------------ 25
6. Marital Status---------------------------------------------------------------------- 26
7. Age at Marriage ------------------------------------------------------------------- 26
8. Sex- Ratio and the Child Sex Ratio----------------------------------------------- 29
9. Literacy Rate ---------------------------------------------------------------------- 31
10. Number of Literates per household ---------------------------------------------- 32
11. Work Participation Rate ----------------------------------------------------------- 32
CHAPTER III: EDUCATIONAL ATTAINMENTCHAPTER III: EDUCATIONAL ATTAINMENTCHAPTER III: EDUCATIONAL ATTAINMENTCHAPTER III: EDUCATIONAL ATTAINMENT -------------------------------------------------------------------------------------------------------------------------------------------------------------------------------------------- 34343434----47474747
1. Age-wise Literacy Rate------------------------------------------------------------ 34
2. Age-wise Female Literacy Rate --------------------------------------------------- 35
3. Literacy Rate of the Different Social Groups ------------------------------------- 36
4. Percentage Change in the Literacy Rate of the Notified Minority -------------- 37
Communities (Other than Muslims) during 1999-2000 and 2004-05
5. Educational levels among the Notified Minority Communities ------------------ 38
6. Graduates and above ------------------------------------------------------------- 40
7. Currently Enrolled Children (5-14 years) ---------------------------------------- 41
8. Currently Enrolled Children (15-29 years) --------------------------------------- 42
9. Never Enrolled Children (5-14 years) -------------------------------------------- 43
10. Never Enrolled Children (15-29 years)------------------------------------------- 44
11. Dropout Children (5-14 years) --------------------------------------------------- 45
12. Out of School Children (5-14 years) --------------------------------------------- 46
CHAPTER CHAPTER CHAPTER CHAPTER IV: HEALTH ATTAINMENTIV: HEALTH ATTAINMENTIV: HEALTH ATTAINMENTIV: HEALTH ATTAINMENT---------------------------------------------------------------------------------------------------------------------------------------------------------------------------------------------------------------------------------------- 48484848----64646464
1. Nutritional Status ----------------------------------------------------------------- 48
2. Mortality Rates -------------------------------------------------------------------- 50
3. Prevalence of Anaemia------------------------------------------------------------ 52
4. Immunization---------------------------------------------------------------------- 56

5. Son Preference -------------------------------------------------------------------- 57
6. Fertility Rates---------------------------------------------------------------------- 58
7. Contraception --------------------------------------------------------------------- 59
8. Maternal Health ------------------------------------------------------------------- 62
9. Teenage Pregnancies-------------------------------------------------------------- 63
CHAPTER V: LAND AND POVERTYCHAPTER V: LAND AND POVERTYCHAPTER V: LAND AND POVERTYCHAPTER V: LAND AND POVERTY ---------------------------------------------------------------------------------------------------------------------------------------------------------------------------------------------------------------------------------------------------- 65656565----76767676
1. Operational Landholding --------------------------------------------------------- 66
2. Trends in Operational Landholding ----------------------------------------------- 67
3. Poverty level----------------------------------------------------------------------- 68
4. Trends in Poverty (1993-94 to 2004-05) ---------------------------------------- 70
5. Education and Employment Statuses Across MPCE Quintiles ------------------- 71
5.1 Rural Profile ------------------------------------------------------------------- 75
5.2 Urban Profile ------------------------------------------------------------------ 75
CHAPTER VI: EMPLOYMENT AND UNEMPLOYMENTCHAPTER VI: EMPLOYMENT AND UNEMPLOYMENTCHAPTER VI: EMPLOYMENT AND UNEMPLOYMENTCHAPTER VI: EMPLOYMENT AND UNEMPLOYMENT ---------------------------------------------------------------------------------------------------------------------------------------- 77777777----97979797
1. Labour force Participation Rates (LFPR)------------------------------------------ 78
2. Work Participation Rates (WPR) -------------------------------------------------- 79
3. Unemployment Rate -------------------------------------------------------------- 80
4. Employment Status --------------------------------------------------------------- 81
5. Industrial Distribution of Workers ------------------------------------------------ 83
6. Occupational Distribution -------------------------------------------------------- 84
7. Age wise LFPR --------------------------------------------------------------------- 86
8. Educational Status (5-9 Groups) ------------------------------------------------- 88
9. Distribution of Tertiary Sector (Urban)------------------------------------------- 89
10. Rural Buddhists – Employment Status ------------------------------------------- 90
11. Employment Status of Urban Christians and Sikhs------------------------------ 91
12. Distribution of Primary Sector Employment in Rural Areas by MPCE Quintiles 91
13. Conclusion ------------------------------------------------------------------------- 92
CHAPTER VII: CONCLUDING RERMARKS & RCHAPTER VII: CONCLUDING RERMARKS & RCHAPTER VII: CONCLUDING RERMARKS & RCHAPTER VII: CONCLUDING RERMARKS & RECOMMENDATIONSECOMMENDATIONSECOMMENDATIONSECOMMENDATIONS ---------------------------------------- 97979797----104104104104
APPENDIX TABLE..APPENDIX TABLE..APPENDIX TABLE..APPENDIX TABLE..------------------------------------------------------------------------------------------------------------------------------------------------------------------------------------------------------------------------------------------------------------------------------------------------------------------------------------ 105105105105----117117117117

LIST OF TABLES, FIGURES AND APPENDICES
LIST OF TABLES & APPENDICES
Tables &
Appendix No
Title Page Nos
Table 1.1 Share and Growth Rate of Three NMCs Over Last Two Decades 4
Table 1.2 State-wise Percentage of Minority Population in India, 2001 4
Table 1.3 Distribution of Districts by NMC Concentration Levels 5
Appendix 1.1 Districtwise Concentration of Christian Population in India, 2001( Rural+urban) 14
Appendix 1.2 Districtwise Concentration of Sikh Population in India, 2001 (Rural+Urban) 15
Appendix 1.3 Districtwise Concentration of Buddhist Population in India, 2001 (Rural+urban) 16
Appendix 1.4 Statewise Number of Christian Concentrated District in India, 2001 17
Appendix 1.5 Statewise Number of Sikh Concentrated District in India, 2001 18
Appendix 1.6 Statewise Number of Buddhist Concentrated District in India, 2001 19
Table 2.1 Number and Percentage Share of the Four Notified Minority Communities 21
Table 2.2 Percentage Share of the Four Notified Minority Communities in their Total Population
21
Table 2.3 States with Significant Share of Minority Population 22
Table 2.4 States with Major Proportion of Minority Population 23
Table 2.5 Share of Minorities by Social Groups – 2004-05 24
Table 2.6 Rate of Urbanisation for the Four Notified Minority Communities 24
Table 2.7 Household Size of the Minority Communities (Other than Muslims) 25
Table 2.8 Male and Female headed Households in Notified Minority Communities Other than Muslims
26
Table 2.9 Marital Status of the Different Religious Communities 27
Table 2.10 Sex-Ratio for the Four Notified Minority Communities 29
Table 2.11 Child Sex-Ratio in Notified Minority Communities 30
Table 2.12 Literacy Rate for the Four Notified Minority communities 31
Table 2.13 Percentage of Households and Number of Literate members in Notified Minority communities
32
Table 2.14 Work Participation Rate for the Notified Minority communities 33
Table 3.1 Age-wise Literacy Rate of the Notified Minority Notified communities, 2001 35
Table 3.2 Age-wise Female Literacy Rate of the Notified Minority communities, 2001 36
Table 3.3 Educational Level of the Notified Minority Communities (Other than Muslims) by Sex and Residence
40
Table 3.4 Percentage of Graduates and Above of the Educated Population in the Notified Minority Communities (Other than Muslims), 2001
40
Table 3.5 Percentage of Currently Enrolled Children (5-14) 41
Table 3.6 Percentage Change of Currently Enrolled Children (5-14) among the Notified Minority Communities from 1999-00 to 2004-05
42
Table 3.7 Percentage of Currently Enrolled Children (15-29) in the Notified Minority Communities, 2004-05
42
Table 3.8 Percentage Change of Currently Enrolled Children (15-29) among the Notified Minority Communities during 1999-00 and 2004-05
43
Table 3.9 Percentage of Never Enrolled Children (5-14) in the Notified Minority Communities, 2004-05
43
Table 3.10 Percentage Change of Never Enrolled Children (5-14) among the Notified Minority Communities during 1999-00 and 2004-05
44
Table 3.11 Percentage of Never Enrolled Children (15-29 yrs) in the Notified Minority Communities, 2004-05
45

Tables &
Appendix No
Title Page Nos
Table 3.12 Percentage Change of Never Enrolled Children (15-29 yrs) among the Notified Minority Communities during 1999-00 and 2004-05
45
Table 3.13 Percentage of Dropout Children (5-14) in the Notified Minority Communities, 2004-05
46
Table 3.14 Percentage Change of Dropout Children (5-14) among the Notified Minority communities during 1999-00 and 2004-05
46
Table 3.15 Percentage Change of Out of School Children (5-14) among the Notified Minority Communities during 1999-00 and 2004-05
47
Table 4.1 Nutritional Status of Children among the Notified minority Communities 48
Table 4.2 Early Childhood Mortality Rates among the Notified Minority Communities (lives per 1000 births)
51
Table 4.3 Anaemia Status of the Children in Notified Minority Communities 54
Table 4.4 Prevalence of Anaemia among Women in the Notified Minority Communities 55
Table 4.5 Prevalence of Anaemia among Men in the Notified Minority Communities (2005-06)
55
Table 4.6 Immunization among Children in the Notified Minority Communities 56
Table 4.7 Son Preference in the Notified Minority Communities 58
Table 4.8 Total fertility Rate of Women in the Notified Minority Communities 59
Table 4.9 Women’s Exposure to Family Planning Messages in the Notified Minority Communities (%)
60
Table 4.10 Current Use of Contraception by Women of the Notified Minority Communities (%)
60
Table 4.11 Usage of Various Methods of Contraception in the Notified Minority communities (%)
61
Table 4.12 Discussion of Family Planning in the Notified Minority Communities (1998-99 (%)
62
Table 4.13 Place of Delivery in the Notified Minority Communities (%) 62
Table 4.14 Assistance during Delivery (2005-06) (%) 63
Table 4.15 Teenage Pregnancies in the Notified Minority Communities 64
Table 5.1 Operational Landholding Size Among Notified Minority Communities 66
Table 5.2 Literacy Level of NMCs by Quintiles (%) 73
Table 5.3 Educational Level Upto Secondary level of NMCs in the Rural Areas (%) 73
Table 5.4 Educational Level Above Secondary of NMCs in the Rural Areas (%) 74
Table 5.5 Educational level Upto Secondary Level of NMCs in the Urban Areas (%) 74
Table 5.6 Educational Level Above Secondary Level of NMCs in the Urban areas (%) 74
Table 5.7 Self-Employed in different NMCs by MPCE Quintiles (%) 75
Table 5.8 Regular Employment in different NMCs by MPCE Quintiles (%) 76
Table 5.9 Casual Employment in different NMCs by MPCE Quintiles 76
Table 6.1 Labour Force Participation Rates for Persons for Notified Minority Groups during 2004-05 (UPSS) (%)
78
Table 6.2 Worker Participation Rates for Notified Minority Community Groups during 2004-05 (UPSS) (%)
79
Table 6.3 Unemployment Rate for the Other Notified Minority Communities in 2004-05 (UPSS) (%)
81
Table 6.4 Percentage of Usual Principal and Subsidiary Status of Employed Persons for Notified Minority Groups during (2004-05) (%)
82
Table 6.5 Major Industrial Distribution of Workers by Notified Minority Communities in 2004-05 (%)
83
Table 6.6 Occupational Distribution of Major Notified Minority Community Group, 2004-05 85
Table 6.7 Occupational Distribution, persons (1993-94) (%) 86
Table 6.8 Age-wise Labour Force Participation Rates (%) 87
Tables & Title Page

Appendix No Nos
Table 6.9 Educational Status of 5-19 years Age Group (%) 88
Table 6.10 Distribution of Tertiary Sector in Urban Areas (%) 89
Table 6.11 Employment Status of Rural Buddhists (%) 90
Table 6.12 Employment Status of Urban Christians and Sikhs (%) 91
Table 6.13 Distribution of Primary Sector in Rural Areas by MPCE Quintile (%) 92
Annexure 1 Labour Force Participation Rates (%) 94
Annexure 2 Work Force Participation Rates (%) 94
Annexure 3 Unemployment (%) 95
Annexure 4 Employment Status (%) 95
Annexure 5a Major Industrial Distribution of Workers by Notified Minority Communities in 1993-94 (%)
96
Annexure 5b Major Industrial Distribution of Workers by Notified Communities in 1999-2000 (%)
96
LIST OF FIGURES
Fig. No. Title Page Nos
Fig. 2.1 Percentage Share of the Four Minority Communities in Their Total Population
22
Fig. 2.2 Average Household Size of Different Religious Communities 25
Fig. 2.3 Age at Marriage of the Females among the Notified Minority Communities (Other than Muslims)
28
Fig. 2.4 Age at Marriage of the Males among the Notified Minority Communities (other than Muslims)
28
Fig. 3.1 Literacy Rate for the Social Categories of Notified Minority communities (Other than Muslims), 2004-05
37
Fig. 3.2 Percentage Change in the Literacy Rate of the Notified Minority communities (Other than Muslims) during 1999-2000 and 2004-05
38
Fig. 3.3 Educational Level among the Notified Minority communities (other than Muslims) 2001
39
Fig. 3.4 Percentage of Out of School Children (5-14 years) in the Notified Minority Communities (other than Muslims), 2004-05
47
Fig. 4.1 Percentage of Underweight Children (Weight-for-Age) among the Notified Minority communities
49
Fig. 4.2 Percentage of Stunted Children (Height-for-Age) among the Notified Minority Communities
49
Fig. 4.3 Percentage of Wasting Children (Weight-for-Height) among Notified Minority Communities
50
Fig. 4.4 Child Mortality among the Notified Minority communities (other than Muslims)
51
Fig. 4.5 Child Mortality among the Buddhist Community 52
Fig. 4.6 Incidence of Anemia among Children in the Minority Communities (Other than Muslims)
53
Fig. 4.7 Incidence of Anemia among Women in the Notified Minority communities (Other than Muslims)
53
Fig. 4.8 Immunization of the Children among the Notified Minority Communities 57
Fig. 4.9 Usage of Contraception among the Notified Minority Communities (other than Muslims)
61
Fig 5.1a Landless 66
`Fig. No. Title Page Nos
Fig 5.1b Below Marginal (0.00-0.40 ha) 66

Fig 5.1c Small Landholding (1.0-2.0 ha) 66
Fig. 5.1d Medium Landholding (2.01-4.00 ha) 66
Fig. 5.1e Large Landholding (4.01 +) 66
Fig 5.2 Percentage of Population Below Poverty Line among the Major Religious Communities, 2004-05
70
Fig 5.3 Population Below Poverty Line among Notified Minority Communities, 1993-94 to 2004-05
71
Fig 5.4 Rural Population Below Poverty Line among Notified Minority Communities 1993-94 to 2004-05
72
Fig 5.5 Urban Population Below Poverty Line among Notified Minority Communities, 1993-94 to 2004-2005
71
Fig 6.1 Work Participation Rates - Rural Male 80
Fig 6.2 Work Participation Rates - Rural Female 80
Fig 6.3 Work Participation Rates – Urban Male 80
Fig 6.4 Work Participation Rates – Urban Females 80
LIST OF MAPS
Map No Title Page Nos
Map. 1.1 Districtwise Share of Christian Population in India, 2001 6
Map. 1.2 Districtwise Share of Sikh Population in India, 2001 7
Map. 1.3 Districtwise Share of Buddhist Population in India, 2001 8
Map. 1.4 Statewise Share of Christian Population in India, 2001 9
Map. 1.5 Statewise Share of Sikh Population in India, 2001 10
Map. 1.6 Statewise Share of Buddhist Population in India, 2001 11
Map. 1.7 Statewise Number of Parsi Population in India, 2001 12

MAIN HIGHLIGHTS OF THE REPORT
DEMOGRAPHY
Number & Percentage Share
� The 4 minorities (Christians, Sikhs, Buddhists and Parsis (Zoroastrians) constitute 5 per cent of the total population of India; together their total population is 51.32 million). Of this, Christians are 2.3 per cent of the population, Sikhs are 1.9 per cent, Buddhists are 8 per cent and the Parsis are just 0.007 per cent.
� Though the proportion of Parsis is negligible, they are one of the most developed communities in India.
� Among these 4 minorities, males constitute 51.14 per cent and females 48.86 per cent.
� A major proportion – 68 per cent – of the four minority communities lives in rural areas.
� Among the 4 minorities, Christians constitute 46.92 per cent, Sikhs 37.44 per cent, Buddhists 15.5 per cent and Parsis 14 per cent.
Distribution of Population
� The minority populations are concentrated in a few states:
- 25 per cent of the Christian community is in Kerala, and 16 per cent is in Tamil Nadu.
- 76 per cent of the Sikhs are found in Punjab and 6 per cent in Haryana.
- 73 per cent of the Buddhist population is located in Maharashtra and 6 per cent in Karnataka.
- 79 per cent of the Parsis are in Maharashtra and 17 per cent are in Gujarat.
States with Significant share of Minority Population
� The minorities are so concentrated in some states that they come close to becoming a majority.
� In the northeastern states, Christians account for as much as 90 per cent in Nagaland, 87 per cent in Mizoram and 70 per cent in Meghalaya.
� Sikhs constitute 60 per cent of the population in Punjab.

� The Buddhists in Sikkim constitute 28 per cent of the population.
Rate of Urbanization
� The rate of urbanization for the four minority communities is 32 per cent.
� Parsis are the most urbanized community with 96.14 per cent of them inhabiting urban areas, while Sikhs are the least urbanized with only 26.59 per cent in urban areas.
Households & Household Size
� Of the total households in India, 71.20 per cent are rural.
� Of the total households in India, Christians account for 2.6 per cent, Sikhs are 1.77 per cent, and Buddhists are 0.83 per cent. Statistics on Parsis households is not available.
� Sikhs have the highest average household size of 5.6, which is greater than the average household size for India (5.3). Christians have the lowest average household size of 4.8.
Household Head
� Of the minorities, Christians have the highest proportion of female-headed households, greater than the national average, and Sikhs have the least at 9.3 per cent.
� For all the communities, the proportion of female-headed households is higher in the urban areas.
Marital Status
� The highest proportion of Christians is in the never married category i.e. 51.4 per cent, followed by Buddhists with 50.83 per cent, and Sikhs with 48.07 per cent.
Age at Marriage
� In India, 43.48 per cent of married females are married off below the legal age of marriage, especially in the rural areas.
� Early marriages are found to be highest among Buddhist females (41.04 per cent) and lowest among Christians (16.46 per cent), followed by Sikhs (17.02 per cent).
Sex-Ratio

� There is a wide variation in sex ratio among the minorities i.e. 1050 among Parsis, 1009 among Christians, 953 among Buddhists and the lowest at 893 among Sikhs, compared to the national figure of 955.
Child Sex-Ratio
� The child sex-ratio is low for all the four minority communities.
� The very low sex-ratio among the 0-4 age group of the Sikh community seems to be alarming, with a huge deficit of 220 female children per thousand male children.
� Except for the Christian community, the child sex-ratio is lower in the urban areas, particularly for the Sikhs, indicating a high level of sex determination and female foeticide being practiced especially among the Sikhs in the urban areas.
Literacy Rate
� The minority communities have a literacy rate higher than the average literacy rate for India at 64.8 per cent, though females, especially in the rural areas, have a lower literacy rate than their male counterparts.
� Parsis have a very high literacy rate of 97.9 per cent, followed by Christians with 80.3 per cent, Buddhists with 72.7 per cent and Sikhs with 69.4 per cent.
� The female literacy rate is relatively high among the Christian community with 76.2 per cent, and lowest among Buddhists i.e 61.7 per cent.
� The male-female literacy gap is the highest among Buddhists and the lowest among the Parsis.
Number of Literates per Household
� Across the country, 14.4 per cent of the households have no literate members. This proportion of households is lower among the minority communities, at less than 10 per cent. It is lowest among the Christians (7.1 per cent) followed by Sikhs (9.2 per cent) and Buddhists (9.1 per cent).
� Across all communities, households with illiterate members are higher in rural areas than in urban areas. This is also true for the minority communities.
Work Participation Rate
� The WPR for the nation is 39.1 per cent; 25.62 per cent for females and 51.67 per cent for males..
� The WPR among Buddhist females is very high at 32 per cent, making the overall WPR for the community highest among the NMCs.

� The male-female gap in the WPR is high among Sikhs i.e. 33.06, and even wider in urban areas i.e. 40.86 per cent. Only 9.96 per cent of females from Sikh community in the urban areas are economically active.
� The low level of sex-ratios, low level of WPR, and low level of literacy among Sikh females all indicate gender discrimination, which requires urgent attention by policy makers.
EDUCATIONAL ATTAINMENT
Age-wise literacy rates
� The literacy rate for the four minority communities is invariably higher than the national average.
Age-wise Female Literacy Rate
� The female literacy rate is lower than the male literacy rate, and is lower than the total literacy levels for all age-groups.
� Buddhist females record the maximum literacy for children and adolescents, whereas Christian females record maximum literacy among subsequent age groups.
Literacy Rate among Different Social Groups
� The NMCs report a relatively higher literacy rate compared to the all India scenario, except for the general category of Buddhists.
� Irrespective of social category, the Buddhists have very little variation in the literacy rates.
� Among the Sikhs, the SCs and OBCs have the lowest literacy rate compared to all other social categories across the NMCs.
� The Christians have better literacy rates compared to Sikhs and Buddhists, but among the Christian community, the Scheduled Tribes have a lower literacy rate
Percentage Change in the Literacy Rate
� A decline in the literacy rate is observed over 1999-2000 to 2004-05 in the case of the Other Backward Classes of Christians and Sikhs, and also among the General category of Buddhists.
Education Level among Notified Minorities
� Christians have the highest proportion of population with a higher level of education (10.89 per cent), and the Buddhists have the lowest proportion of higher educated population (6.04 per cent).
Education Levels of Females

� The national figures show that a lower proportion of females pursue higher levels of education and the minority communities also exhibit the same pattern, with higher levels of elementary education and lower levels of higher education among females in the rural areas.
� The Christian community has the highest proportion of higher educated females (10.47 per cent) and the Buddhist community has the lowest proportion (3.94 per cent).
Graduates and Above
� Of the total literate population of India, 6.72 per cent is educated to the graduate and above level.
� The male-female gap in the proportion of graduates is in favour of males, except for the Sikh women in the urban areas. Among the urban Sikh community, females with graduation and above are in a higher proportion than their male counterparts.
� The proportion of total female graduates is highest among the Christian community.
Currently Enrolled Children (5-14 years)
� 82.49 per cent of the children in the age group of 5-14 years are currently enrolled in some school in India, and the enrolment rate of children in the age group 5-14 years among the minority communities is well above the national average.
� The percentage of currently enrolled children (5-14 years) is lowest among the Sikh community, while the Parsi community has recorded universal enrolment.
� During the period from 1999-2000 and 2004-05, the proportion of currently enrolled children (5-14 years) among the minority communities is lower than the national average, except for the rural females of the Buddhist community where enrolment is higher. However, the number of enrolled Buddhist children (both male and female) in the urban areas has actually declined, as has the enrolment rate among the urban males of the Sikh community.
Currently Enrolled Children (15-29 years)
� Except for the Parsi community, the enrolment rate for adolescents and youths among the minority communities is higher than the national average, though the enrolment rate for the urban females of this category is higher.
� For the period 1999-2000 and 2004-05, a mass decline is witnessed in the enrolment rate for the age group 15-29 years at the national level, and also among the minority communities, except for the Parsi community (particularly the males) and for the males of the Buddhist community, for whom the enrolment rate went up.

Never Enrolled Children (5-14 years)
� The proportion of never enrolled children among the minority communities is far below the national average. The Sikh community has the highest proportion of never enrolled children (8.35 per cent), followed by the Buddhists (6.08 per cent) and Christians (6.3 per cent).
� Unlike the national pattern, the Buddhist community has a larger proportion of never enrolled males than females, and also a higher proportion of never enrolled children in the urban areas than the rural areas.
� A decline in children never enrolled is visible for a greater proportion of the males rather than females of the Christian and Sikh communities, and for the females rather than males of the Buddhist community.
Never Enrolled Children (15-29 years)
� The proportion of never enrolled children (15-29 years) among the minority communities is far below the national average.
� The proportion is higher among the females than the males, and in the rural areas rather than the urban areas. It is highest among the Sikhs (15.98 per cent), followed by the Christians (10.57 per cent) and the Buddhists (7.71 per cent).
� The proportion of never enrolled children declined over the years, more among the females than the males, and in the rural areas compared to the urban areas, especially among the Christian children. A remarkable decline in the rate (by 25.82 per cent) is witnessed among the rural Buddhist females during the last five years.
Dropout Children (5-14 years)
� The dropout rate among the minority communities is lower than that at the national level.
� Except for Christian males, the dropout rate (5-14 years) is higher among the females, and in the rural areas. There is only a minor decline in dropout rate among the minority communities, except for the Buddhist females in the rural areas.
Out of School Children (5-14 years)
� The proportion of out of school children (5-14 years) among the minority communities is lower than the national average.
� Except for the rural males of the Buddhist community, the percentage of out of school children is higher among the females, and in the rural areas. The proportion of out of school children is the highest among the females of the Sikh community, especially the rural females.

� During the last five years, a greater decline in the proportion of out of school children is witnessed among the Buddhists, and there is a major decline in out of school Buddhist females, especially in the rural areas.
HEALTH AND NUTRITION
Nutritional Status of children
� Among the minorities, the proportion of undernourished children is the highest among the Buddhists i.e. 43.7 per cent in 1998-99 and 39.2 per cent in 2005-06. It is the lowest among the Sikhs i.e. 26.8 per cent in 1998-99 and 22 per cent in 2005-06.
� For the period 1998-99 to 2005-06, there is a marginal increase in the proportion of stunted and wasted children at the national level and also among the minorities, except for the Sikh community where it has declined.
� The comparative overall nutritional status of children reveals the status of Buddhist infants to be the worst. In all the three nutritional indicators - stunting, wasting and underweight children belonging to Buddhist households report higher percentages below the set standards, followed by Christians.
Mortality Rates
� The infant mortality rate, childhood mortality rates, neonatal mortality rate, post-neonatal rate, as well as the under-5 child mortality rates at the national level all show a declining trend. However, this is not necessarily the case with all the minority communities.
� The neonatal mortality rates have fallen for all communities except Buddhists, for whom they have risen, from 39.5/1000 in 1998-1999 to 43/1000 live births in 2005-06.
� The scenario is the same for the child mortality rate, as well as the under-five mortality rates, with Buddhists showing an increase in both rates for the period, from 14.1/1000 to 17.1/1000 in the case of the former, and from 69/1000 to 66.9/ 1000 live births in the latter.
Anaemia among Children
� The proportion of children suffering from anaemia declined from 74.2 per cent in 1998-99 to 69.5 per cent in 2005-06. However, the prevalence of anaemia among children still remains a matter of general concern.
� Except for the Buddhists, mild anaemia among children increased at the national level and also among the minorities, while moderate anaemia declined. Severe anaemia also declined, except for the Sikhs.
� A significant improvement is witnessed in the case of Buddhists, where the incidence of severe anaemia declined from 3.5 per cent in 1998-99 to 0.2 per cent in 2005-06.

Anaemia among Women
� Among the minorities also, the incidence of anaemia has shown an increase, except for a marginal decline among the Sikh women from 39.6 per cent in 1998-99 to 39.2 per cent in 2005-06.
� The Buddhist women who were severely anaemic in 98-99 (3.1 per cent) seem to have attained a better health status in 2005-06, with a lower incidence of anaemia (1.9 per cent), which may be considered a good sign of improvement.
Prevalence of Anaemia among Men
� While the incidence of anaemia is more among women than men, the incidence of anaemia is the maximum among the Buddhist men, and the incidence is less among Sikh men (15.9 per cent).
Immunization
� The rate of immunization of children among the minority communities is well above the national rate of immunization.
� The percentage of children with all vaccinations have declined for all communities, for the period from 1998-99 to 2005-06.
� The proportion of children who have not received any vaccination is the greatest among the Christians i.e. 9.4 per cent in 2005-06, and the least among the Buddhists, at 0.7 per cent in 2005-06.
Son Preference
� Among the minority communities, the majority of the Sikh women (18 per cent) want more sons than daughters and only a very low proportion of them (1.4 per cent) want daughters rather than sons. The Buddhist women have a similar view, as 17.2 per cent want more sons than daughters and only 3.6 per cent of them want more daughters than sons.
� Among Christians, a majority of them being tribal populations, a different picture emerged, with men exhibiting more of a son preference compared to the women, in wanting more sons than daughters.
Fertility Rates
� All the minority communities, except the Buddhists (whose rate of growth is very low), experienced a fall in fertility rates. The rate of fall in fertility rate is the highest among the Sikh community.
Contraception
� The Sikh community (75.6 per cent in 1998-99 and 69 per cent in 2005-06) and the Buddhist community (61.8 per cent in 1998-99 and 55.9 per cent in 2005-06)

gather knowledge on family planning methods mainly through television, but dependence on television is less among the Christians.
� Dependence on newspapers (3.3 per cent in 1998-99 and 34.4 per cent in 2005-06) and wall paintings (48 per cent in 1998-99 and 32.3 per cent in 2005-06) as a source of awareness on family planning methods is the maximum among the Christians.
� Dependence on newspapers is comparatively the least among the Buddhists (21.8 per cent in 1998-99 and 29.8 per cent in 2005-06).
Use of Contraceptives
� The proportion of currently married women using contraceptives is the highest among the Buddhists (64.7 per cent in 1998-99 and 67.7 per cent in 2005-06) followed by Sikhs (65.3 per cent in 1998-99 and 66.5 per cent in 2005-06), but contraceptive use among Christian women is less.
� Among the various methods of contraception used, female sterilization is highest among the Buddhists (54 per cent), while it is the lowest among the Sikhs (31.4 per cent). The use of pills, condoms and IUDs is quite high among the Sikhs, compared to other minorities.
� Compared to the women of other minority communities, the percentage of women who discussed family planning with others is higher among the Sikh community. 41 per cent of Sikh women discussed family planning with their husbands and 21.3 per cent discussed it with their friends.
Maternal Health
� The Sikh community shows the maximum preference for deliveries in private hospitals. Their proportion is 35.3 per cent in 1998-99 and 42 per cent in 2005-06.
� Only 46.6 per cent of deliveries in India are attended by a health professional, including 35 per cent by doctors and 10.3 per cent by an ANM/nurse or midwife.
� The Buddhist community shows the maximum proportion of deliveries being attended by friends or relatives who are non-health professionals (18.8 per cent). Yet, more, than half of their deliveries are attended by doctors.
� 24.1 per cent of Sikh deliveries are attended by Dais. This position is high compared to other minorities.
� Compared to the national average of 46.6 per cent, the proportion of deliveries assisted by skilled health care professionals is high among all the minority communities.
Teenage Pregnancies

� Among the minority communities, the level of teenage pregnancy and motherhood is high among the Buddhists, i.e. 7.6 per cent of the teenagers have had a live birth, 3 per cent are pregnant with their first child and 10.6 per cent have begun child bearing.
LAND AND POVERTY
� 56.39 per cent of the total population of India is landless.
� Among the minority communities, the Christian community is the least landless (54.81 per cent), who also have the highest percentage of population with below marginal (20.51 per cent) and marginal operational holdings (14.30 per cent).
� The proportion of medium (8.72 per cent) and large farmers (7.13 per cent) is the maximum among the Sikh community.
Trends in Operational Landholdings
� Among the minority communities, the proportion of landless among the Christians declined sharply from 64.38 per cent in 1993-94 to 54.81 per cent in 2004-05.
� The Sikhs and the Buddhists exhibited fluctuating trends. The proportion of landless among the Sikhs declined from 60.59 per cent in 1993-94 to 59.71 per cent in 1999-2000 and then increased to 66.50 per cent in 2004-05.
� Among the Buddhists, the proportion of landless declined from 71.62 per cent in 1993-94 to 67.71 per cent in 1999-2000, and then increased to 71.60 per cent in 2004-05.
� The proportion of minority communities holding marginal operational land also declined over the years for all the three communities, and especially for the Sikhs and the Buddhists.
� There was a notable increase in their proportion smallholdings during the second duration (1999-2000 to 2004-05), especially among the Christian community (increased from 0.48 per cent to 14.30 per cent in 2004-05).
� The proportion of medium and small farmers showed a significant increase, particularly among the Buddhists (medium farmers) (increased from 0.01 per cent to 8.62 per cent), and also among the Sikhs (small farmers) (increased from 0.15 per cent 8.72 per cent).
� 8.60 per cent of the rural Sikhs are the only notable proportion of large farmers among the minority communities.
Poverty
� 19.8 per cent of the total population of India lives below the poverty line, and the minority communities have a greater incidence of urban poverty than rural poverty.

� The Buddhist community is the poorest of the minority communities, having a poverty level (29.86 per cent) greater than the national average (19.80 per cent).
Trends in Poverty (1993-94 to 2004-05)
� The poverty rate in India generally showed a declining trend, especially in the case of the Christian and Buddhist communities, showing a decline from 26.36 per cent to 11.19 per cent, and from 50.24 per cent to 29.86 per cent respectively. A similar trend was seen for both urban and rural areas.
� The poverty ratio for the Sikh community remained constant at around 6 per cent.
Literacy by MPCE quintiles
� Among the lowest strata of the minorities, the literacy rate is the lowest among the Sikhs (44.09 per cent) and the highest among the Buddhists (61.79 per cent). Among the richer sections of the minorities also the Sikh community has a lower literacy rate of 72.44 per cent, while the Parsi with 97.33 per cent are the highest.
� For the lowest strata, upto secondary level of education is lowest among the Sikhs (42.60 per cent), and high among the Buddhists (56.42 per cent). Among the richest sections of the minorities, the Buddhist community (54.24 per cent) has the lowest proportion while the Christian community has the highest.
� The above secondary level of education for all the strata (only exception being the urban rich) is very low among the Sikh community, and is also far below the national average for all the strata.
� Above secondary education among all strata of the minorities is highest among the Parsi community, followed by the Buddhist community.
Employment by MPCE quintiles
� The proportion of self-employed workers increases as we move from the poorest to the richest.
� Among the lowest strata of the minority communities, the Christian community (48.28 per cent) has largest proportion of self-employed workers, and Buddhists (16.02 per cent) are the least self-employed. Among the rich, self-employment is high among the Sikhs (75.74 per cent) and least among the Parsis (44.09 per cent).
� Except for the Sikhs, there is an increase in the proportion of regularly employment. In the rural areas, a major proportion of regularly employed persons among all strata are from the Christian community.
� The proportion of self-employed, regularly employed and casual workers among the rich rural Buddhists showed a decline, but the proportion of regularly employed and casual workers among the poor rural Buddhists increased. Further, 52.91 per cent of the richer rural Buddhists are regular workers; where as the proportion of regular workers among the poorest is only 6.96 per cent.

EMPLOYMENT AND UNEMPLOYMENT
Labour Force Participation Rates
� Rural areas have a better LFPR (44.62 per cent) than urban areas (38.25 per cent), and the LFPR among the minorities has increased among both the males and females of rural and urban areas.
� The Buddhist community has the highest LFPR (48.85 per cent) and the Parsi community has the lowest LFPR (44.56%).
� The LFPR is highest among Parsi males (60.04 per cent), and Sikh females have the lowest (32.74 per cent), while Buddhist women showed the maximum LFPR of 40.87 per cent.
Work Participation Rates
� The proportion of workers increased over the period from 1993-94 to 2004-05, and is higher in the rural areas, except for the Sikhs.
� The Buddhists community have the highest WPR among the minorities (47.22 per cent).
� Among the males, the Sikh men (55.14 per cent) have the highest work participation rate, especially the urban men (55.55 per cent.)
� Buddhist women (40.53 per cent) showed a high WPR among the females, especially the rural women (50.54 per cent). In urban areas, Sikh women have the lowest WPR (15.30 per cent), while it is highest among Parsi women (33.82 per cent).
Unemployment
� The unemployment rate is higher in urban India (5.21 per cent) than in rural India (1.80 per cent). The rate declined for the period 1993-94 to 1999-2000 and then rose in 2004-05.
� Among the minority communities the Christian community has the highest unemployment rate of 6.32 per cent. The Sikh community has the lowest unemployment rate among the males (1.62 per cent) and a relatively high unemployment rate among females (7.05 per cent).
� The unemployment rate is highest among Christian males (4.70%) and females (5.79 per cent and 13.22 per cent in urban and rural areas respectively.) There was a major increase in the unemployment rate among Christian women from 8.10 per cent to 13.95 per cent, and among Sikh women from 5.08 per cent to 9 per cent.
Employment Status
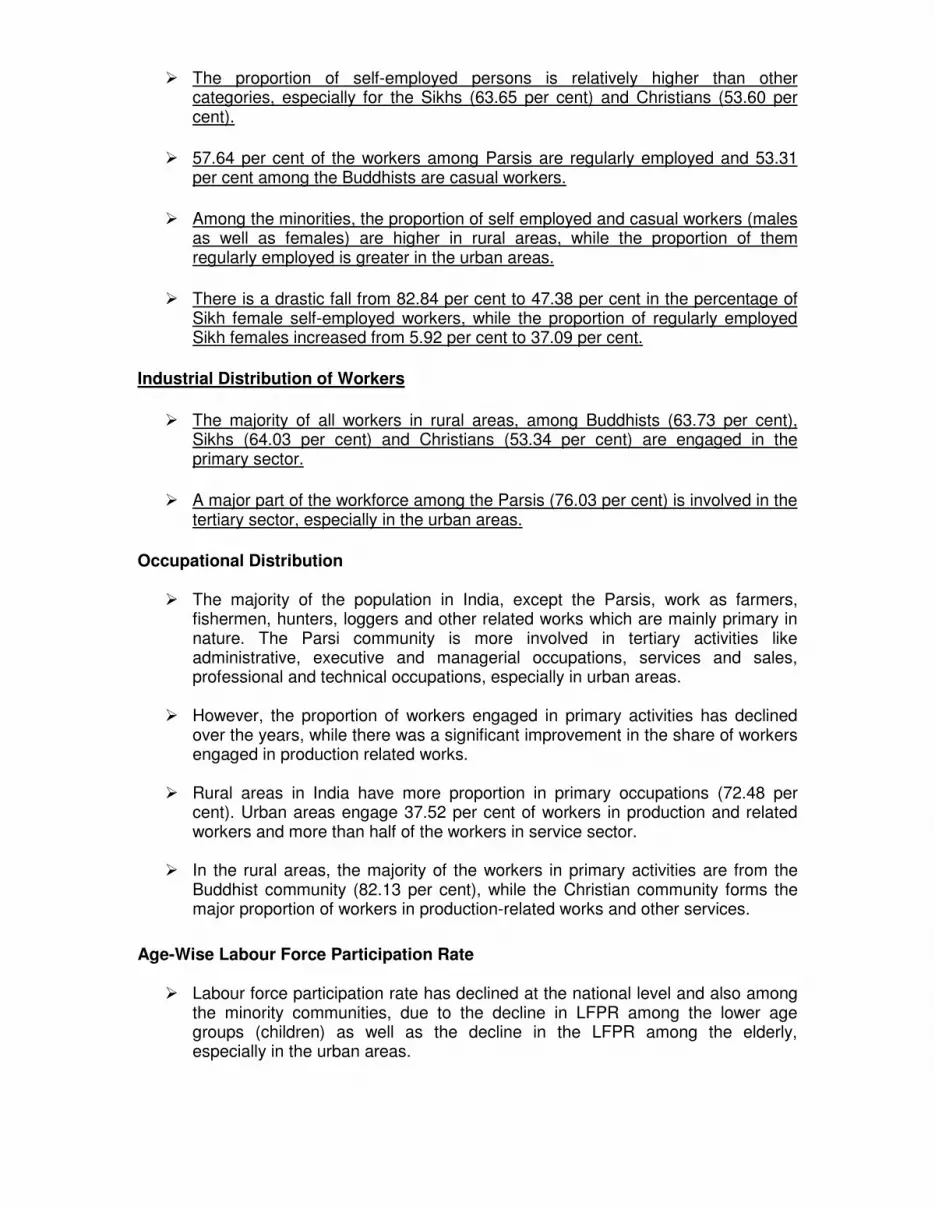
� The proportion of self-employed persons is relatively higher than other categories, especially for the Sikhs (63.65 per cent) and Christians (53.60 per cent).
� 57.64 per cent of the workers among Parsis are regularly employed and 53.31 per cent among the Buddhists are casual workers.
� Among the minorities, the proportion of self employed and casual workers (males as well as females) are higher in rural areas, while the proportion of them regularly employed is greater in the urban areas.
� There is a drastic fall from 82.84 per cent to 47.38 per cent in the percentage of Sikh female self-employed workers, while the proportion of regularly employed Sikh females increased from 5.92 per cent to 37.09 per cent.
Industrial Distribution of Workers
� The majority of all workers in rural areas, among Buddhists (63.73 per cent), Sikhs (64.03 per cent) and Christians (53.34 per cent) are engaged in the primary sector.
� A major part of the workforce among the Parsis (76.03 per cent) is involved in the tertiary sector, especially in the urban areas.
Occupational Distribution
� The majority of the population in India, except the Parsis, work as farmers, fishermen, hunters, loggers and other related works which are mainly primary in nature. The Parsi community is more involved in tertiary activities like administrative, executive and managerial occupations, services and sales, professional and technical occupations, especially in urban areas.
� However, the proportion of workers engaged in primary activities has declined
over the years, while there was a significant improvement in the share of workers engaged in production related works.
� Rural areas in India have more proportion in primary occupations (72.48 per
cent). Urban areas engage 37.52 per cent of workers in production and related workers and more than half of the workers in service sector.
� In the rural areas, the majority of the workers in primary activities are from the
Buddhist community (82.13 per cent), while the Christian community forms the major proportion of workers in production-related works and other services.
Age-Wise Labour Force Participation Rate
� Labour force participation rate has declined at the national level and also among the minority communities, due to the decline in LFPR among the lower age groups (children) as well as the decline in the LFPR among the elderly, especially in the urban areas.

� The main reason for fall in the LFPR among children is that a majority of these children are enjoying the privilege of schooling and formal education.
� The decline in child labour force participation rate is more pronounced in the rural
areas, but among the minority communities, the Sikh community reports an increase in the child LFPR in the urban areas.
Distribution of Tertiary Sector
� 47.17 per cent of the total male labour force is engaged in the tertiary sector of trade, hotels and restaurants. Public administration, education, health and others engage 24.98 per cent of the male labour force in India.
� The Sikh and Christian males in the tertiary sector are mainly occupied in trade,
hotels and restaurants. Both these communities also show new entries to this field for the period from 1993-94 to 2004-05.
� Buddhists form the major work seekers in transport, storage and communication.
� The proportion of males entering public administration, education and health has
declined, especially among the Christian males (from 46.94 per cent to 28.34 per cent). Two thirds of the total tertiary sector female labour force is engaged in public administration, education, health and others, but this proportion has declined over the period.
Urban Christians & Sikhs
� A major proportion of urban Christians in the richest strata are regularly
employed, and Christian women of the elite strata are more regularly employed (44.73 per cent) than the males (41.93 per cent) of the group. Further, the proportion of casual labourers is very low among this group, while 31 per cent of them are self-employed.
� 54.45 per cent of the poor Sikh females work as casual labourers in the urban
areas, the next strata (25.65 per cent) seems to seek some sort of self-employment, while the richest strata (53.64 per cent) outshine their male counterparts (38.08) by getting into regular employment.
Distribution of Primary Sector in Rural Areas by MPCE Quintile
� The poorest of Christians and Sikhs show a withdrawal from the primary sector over the years, while there is a major increase is visible among affluent of these communities who are seen entering the primary sector.
� The Buddhist community, which engages a major share of its population in the
primary sector, maintains the same trend over the period.
MAIN HIGHLIGHTS OF THE REPORT

DEMOGRAPHY
Number & Percentage Share
� The 4 minorities (Christians, Sikhs, Buddhists and Parsis (Zoroastrians) constitute 5 per cent of the total population of India; together their total population is 51.32 million). Of this, Christians are 2.3 per cent of the population, Sikhs are 1.9 per cent, Buddhists are 8 per cent and the Parsis are just 0.007 per cent.
� Though the proportion of Parsis is negligible, they are one of the most developed communities in India.
� Among these 4 minorities, males constitute 51.14 per cent and females 48.86 per cent.
� A major proportion – 68 per cent – of the four minority communities lives in rural areas.
� Among the 4 minorities, Christians constitute 46.92 per cent, Sikhs 37.44 per cent, Buddhists 15.5 per cent and Parsis 14 per cent.
Distribution of Population
� The minority populations are concentrated in a few states:
- 25 per cent of the Christian community is in Kerala, and 16 per cent is in Tamil Nadu.
- 76 per cent of the Sikhs are found in Punjab and 6 per cent in Haryana.
- 73 per cent of the Buddhist population is located in Maharashtra and 6 per cent in Karnataka.
- 79 per cent of the Parsis are in Maharashtra and 17 per cent are in Gujarat.
States with Significant share of Minority Population
� The minorities are so concentrated in some states that they come close to becoming a majority.
� In the northeastern states, Christians account for as much as 90 per cent in Nagaland, 87 per cent in Mizoram and 70 per cent in Meghalaya.
� Sikhs constitute 60 per cent of the population in Punjab.

� The Buddhists in Sikkim constitute 28 per cent of the population.
Rate of Urbanization
� The rate of urbanization for the four minority communities is 32 per cent.
� Parsis are the most urbanized community with 96.14 per cent of them inhabiting urban areas, while Sikhs are the least urbanized with only 26.59 per cent in urban areas.
Households & Household Size
� Of the total households in India, 71.20 per cent are rural.
� Of the total households in India, Christians account for 2.6 per cent, Sikhs are 1.77 per cent, and Buddhists are 0.83 per cent. Statistics on Parsis households is not available.
� Sikhs have the highest average household size of 5.6, which is greater than the average household size for India (5.3). Christians have the lowest average household size of 4.8.
Household Head
� Of the minorities, Christians have the highest proportion of female-headed households, greater than the national average, and Sikhs have the least at 9.3 per cent.
� For all the communities, the proportion of female-headed households is higher in the urban areas.
Marital Status
� The highest proportion of Christians is in the never married category i.e. 51.4 per cent, followed by Buddhists with 50.83 per cent, and Sikhs with 48.07 per cent.
Age at Marriage
� In India, 43.48 per cent of married females are married off below the legal age of marriage, especially in the rural areas.
� Early marriages are found to be highest among Buddhist females (41.04 per cent) and lowest among Christians (16.46 per cent), followed by Sikhs (17.02 per cent).
Sex-Ratio

� There is a wide variation in sex ratio among the minorities i.e. 1050 among Parsis, 1009 among Christians, 953 among Buddhists and the lowest at 893 among Sikhs, compared to the national figure of 955.
Child Sex-Ratio
� The child sex-ratio is low for all the four minority communities.
� The very low sex-ratio among the 0-4 age group of the Sikh community seems to be alarming, with a huge deficit of 220 female children per thousand male children.
� Except for the Christian community, the child sex-ratio is lower in the urban areas, particularly for the Sikhs, indicating a high level of sex determination and female foeticide being practiced especially among the Sikhs in the urban areas.
Literacy Rate
� The minority communities have a literacy rate higher than the average literacy rate for India at 64.8 per cent, though females, especially in the rural areas, have a lower literacy rate than their male counterparts.
� Parsis have a very high literacy rate of 97.9 per cent, followed by Christians with 80.3 per cent, Buddhists with 72.7 per cent and Sikhs with 69.4 per cent.
� The female literacy rate is relatively high among the Christian community with 76.2 per cent, and lowest among Buddhists i.e 61.7 per cent.
� The male-female literacy gap is the highest among Buddhists and the lowest among the Parsis.
Number of Literates per Household
� Across the country, 14.4 per cent of the households have no literate members. This proportion of households is lower among the minority communities, at less than 10 per cent. It is lowest among the Christians (7.1 per cent) followed by Sikhs (9.2 per cent) and Buddhists (9.1 per cent).
� Across all communities, households with illiterate members are higher in rural areas than in urban areas. This is also true for the minority communities.
Work Participation Rate
� The WPR for the nation is 39.1 per cent; 25.62 per cent for females and 51.67 per cent for males..
� The WPR among Buddhist females is very high at 32 per cent, making the overall WPR for the community highest among the NMCs.

� The male-female gap in the WPR is high among Sikhs i.e. 33.06, and even wider in urban areas i.e. 40.86 per cent. Only 9.96 per cent of females from Sikh community in the urban areas are economically active.
� The low level of sex-ratios, low level of WPR, and low level of literacy among Sikh females all indicate gender discrimination, which requires urgent attention by policy makers.
EDUCATIONAL ATTAINMENT
Age-wise literacy rates
� The literacy rate for the four minority communities is invariably higher than the national average.
Age-wise Female Literacy Rate
� The female literacy rate is lower than the male literacy rate, and is lower than the total literacy levels for all age-groups.
� Buddhist females record the maximum literacy for children and adolescents, whereas Christian females record maximum literacy among subsequent age groups.
Literacy Rate among Different Social Groups
� The NMCs report a relatively higher literacy rate compared to the all India scenario, except for the general category of Buddhists.
� Irrespective of social category, the Buddhists have very little variation in the literacy rates.
� Among the Sikhs, the SCs and OBCs have the lowest literacy rate compared to all other social categories across the NMCs.
� The Christians have better literacy rates compared to Sikhs and Buddhists, but among the Christian community, the Scheduled Tribes have a lower literacy rate
Percentage Change in the Literacy Rate
� A decline in the literacy rate is observed over 1999-2000 to 2004-05 in the case of the Other Backward Classes of Christians and Sikhs, and also among the General category of Buddhists.
Education Level among Notified Minorities
� Christians have the highest proportion of population with a higher level of education (10.89 per cent), and the Buddhists have the lowest proportion of higher educated population (6.04 per cent).
Education Levels of Females

� The national figures show that a lower proportion of females pursue higher levels of education and the minority communities also exhibit the same pattern, with higher levels of elementary education and lower levels of higher education among females in the rural areas.
� The Christian community has the highest proportion of higher educated females (10.47 per cent) and the Buddhist community has the lowest proportion (3.94 per cent).
Graduates and Above
� Of the total literate population of India, 6.72 per cent is educated to the graduate and above level.
� The male-female gap in the proportion of graduates is in favour of males, except for the Sikh women in the urban areas. Among the urban Sikh community, females with graduation and above are in a higher proportion than their male counterparts.
� The proportion of total female graduates is highest among the Christian community.
Currently Enrolled Children (5-14 years)
� 82.49 per cent of the children in the age group of 5-14 years are currently enrolled in some school in India, and the enrolment rate of children in the age group 5-14 years among the minority communities is well above the national average.
� The percentage of currently enrolled children (5-14 years) is lowest among the Sikh community, while the Parsi community has recorded universal enrolment.
� During the period from 1999-2000 and 2004-05, the proportion of currently enrolled children (5-14 years) among the minority communities is lower than the national average, except for the rural females of the Buddhist community where enrolment is higher. However, the number of enrolled Buddhist children (both male and female) in the urban areas has actually declined, as has the enrolment rate among the urban males of the Sikh community.
Currently Enrolled Children (15-29 years)
� Except for the Parsi community, the enrolment rate for adolescents and youths among the minority communities is higher than the national average, though the enrolment rate for the urban females of this category is higher.
� For the period 1999-2000 and 2004-05, a mass decline is witnessed in the enrolment rate for the age group 15-29 years at the national level, and also among the minority communities, except for the Parsi community (particularly the males) and for the males of the Buddhist community, for whom the enrolment rate went up.

Never Enrolled Children (5-14 years)
� The proportion of never enrolled children among the minority communities is far below the national average. The Sikh community has the highest proportion of never enrolled children (8.35 per cent), followed by the Buddhists (6.08 per cent) and Christians (6.3 per cent).
� Unlike the national pattern, the Buddhist community has a larger proportion of never enrolled males than females, and also a higher proportion of never enrolled children in the urban areas than the rural areas.
� A decline in children never enrolled is visible for a greater proportion of the males rather than females of the Christian and Sikh communities, and for the females rather than males of the Buddhist community.
Never Enrolled Children (15-29 years)
� The proportion of never enrolled children (15-29 years) among the minority communities is far below the national average.
� The proportion is higher among the females than the males, and in the rural areas rather than the urban areas. It is highest among the Sikhs (15.98 per cent), followed by the Christians (10.57 per cent) and the Buddhists (7.71 per cent).
� The proportion of never enrolled children declined over the years, more among the females than the males, and in the rural areas compared to the urban areas, especially among the Christian children. A remarkable decline in the rate (by 25.82 per cent) is witnessed among the rural Buddhist females during the last five years.
Dropout Children (5-14 years)
� The dropout rate among the minority communities is lower than that at the national level.
� Except for Christian males, the dropout rate (5-14 years) is higher among the females, and in the rural areas. There is only a minor decline in dropout rate among the minority communities, except for the Buddhist females in the rural areas.
Out of School Children (5-14 years)
� The proportion of out of school children (5-14 years) among the minority communities is lower than the national average.
� Except for the rural males of the Buddhist community, the percentage of out of school children is higher among the females, and in the rural areas. The proportion of out of school children is the highest among the females of the Sikh community, especially the rural females.

� During the last five years, a greater decline in the proportion of out of school children is witnessed among the Buddhists, and there is a major decline in out of school Buddhist females, especially in the rural areas.
HEALTH AND NUTRITION
Nutritional Status of children
� Among the minorities, the proportion of undernourished children is the highest among the Buddhists i.e. 43.7 per cent in 1998-99 and 39.2 per cent in 2005-06. It is the lowest among the Sikhs i.e. 26.8 per cent in 1998-99 and 22 per cent in 2005-06.
� For the period 1998-99 to 2005-06, there is a marginal increase in the proportion of stunted and wasted children at the national level and also among the minorities, except for the Sikh community where it has declined.
� The comparative overall nutritional status of children reveals the status of Buddhist infants to be the worst. In all the three nutritional indicators - stunting, wasting and underweight children belonging to Buddhist households report higher percentages below the set standards, followed by Christians.
Mortality Rates
� The infant mortality rate, childhood mortality rates, neonatal mortality rate, post-neonatal rate, as well as the under-5 child mortality rates at the national level all show a declining trend. However, this is not necessarily the case with all the minority communities.
� The neonatal mortality rates have fallen for all communities except Buddhists, for whom they have risen, from 39.5/1000 in 1998-1999 to 43/1000 live births in 2005-06.
� The scenario is the same for the child mortality rate, as well as the under-five mortality rates, with Buddhists showing an increase in both rates for the period, from 14.1/1000 to 17.1/1000 in the case of the former, and from 69/1000 to 66.9/ 1000 live births in the latter.
Anaemia among Children
� The proportion of children suffering from anaemia declined from 74.2 per cent in 1998-99 to 69.5 per cent in 2005-06. However, the prevalence of anaemia among children still remains a matter of general concern.
� Except for the Buddhists, mild anaemia among children increased at the national level and also among the minorities, while moderate anaemia declined. Severe anaemia also declined, except for the Sikhs.
� A significant improvement is witnessed in the case of Buddhists, where the incidence of severe anaemia declined from 3.5 per cent in 1998-99 to 0.2 per cent in 2005-06.

Anaemia among Women
� Among the minorities also, the incidence of anaemia has shown an increase, except for a marginal decline among the Sikh women from 39.6 per cent in 1998-99 to 39.2 per cent in 2005-06.
� The Buddhist women who were severely anaemic in 98-99 (3.1 per cent) seem to have attained a better health status in 2005-06, with a lower incidence of anaemia (1.9 per cent), which may be considered a good sign of improvement.
Prevalence of Anaemia among Men
� While the incidence of anaemia is more among women than men, the incidence of anaemia is the maximum among the Buddhist men, and the incidence is less among Sikh men (15.9 per cent).
Immunization
� The rate of immunization of children among the minority communities is well above the national rate of immunization.
� The percentage of children with all vaccinations have declined for all communities, for the period from 1998-99 to 2005-06.
� The proportion of children who have not received any vaccination is the greatest among the Christians i.e. 9.4 per cent in 2005-06, and the least among the Buddhists, at 0.7 per cent in 2005-06.
Son Preference
� Among the minority communities, the majority of the Sikh women (18 per cent) want more sons than daughters and only a very low proportion of them (1.4 per cent) want daughters rather than sons. The Buddhist women have a similar view, as 17.2 per cent want more sons than daughters and only 3.6 per cent of them want more daughters than sons.
� Among Christians, a majority of them being tribal populations, a different picture emerged, with men exhibiting more of a son preference compared to the women, in wanting more sons than daughters.
Fertility Rates
� All the minority communities, except the Buddhists (whose rate of growth is very low), experienced a fall in fertility rates. The rate of fall in fertility rate is the highest among the Sikh community.
Contraception
� The Sikh community (75.6 per cent in 1998-99 and 69 per cent in 2005-06) and the Buddhist community (61.8 per cent in 1998-99 and 55.9 per cent in 2005-06)
gather knowledge on family planning methods mainly through television, but dependence on television is less among the Christians.
� Dependence on newspapers (3.3 per cent in 1998-99 and 34.4 per cent in 2005-06) and wall paintings (48 per cent in 1998-99 and 32.3 per cent in 2005-06) as a source of awareness on family planning methods is the maximum among the Christians.
� Dependence on newspapers is comparatively the least among the Buddhists (21.8 per cent in 1998-99 and 29.8 per cent in 2005-06).
Use of Contraceptives
� The proportion of currently married women using contraceptives is the highest among the Buddhists (64.7 per cent in 1998-99 and 67.7 per cent in 2005-06) followed by Sikhs (65.3 per cent in 1998-99 and 66.5 per cent in 2005-06), but contraceptive use among Christian women is less.
� Among the various methods of contraception used, female sterilization is highest among the Buddhists (54 per cent), while it is the lowest among the Sikhs (31.4 per cent). The use of pills, condoms and IUDs is quite high among the Sikhs, compared to other minorities.
� Compared to the women of other minority communities, the percentage of women who discussed family planning with others is higher among the Sikh community. 41 per cent of Sikh women discussed family planning with their husbands and 21.3 per cent discussed it with their friends.
Maternal Health
� The Sikh community shows the maximum preference for deliveries in private hospitals. Their proportion is 35.3 per cent in 1998-99 and 42 per cent in 2005-06.
� Only 46.6 per cent of deliveries in India are attended by a health professional, including 35 per cent by doctors and 10.3 per cent by an ANM/nurse or midwife.
� The Buddhist community shows the maximum proportion of deliveries being attended by friends or relatives who are non-health professionals (18.8 per cent). Yet, more, than half of their deliveries are attended by doctors.
� 24.1 per cent of Sikh deliveries are attended by Dais. This position is high compared to other minorities.
� Compared to the national average of 46.6 per cent, the proportion of deliveries assisted by skilled health care professionals is high among all the minority communities.
Teenage Pregnancies

� Among the minority communities, the level of teenage pregnancy and motherhood is high among the Buddhists, i.e. 7.6 per cent of the teenagers have had a live birth, 3 per cent are pregnant with their first child and 10.6 per cent have begun child bearing.
LAND AND POVERTY
� 56.39 per cent of the total population of India is landless.
� Among the minority communities, the Christian community is the least landless (54.81 per cent), who also have the highest percentage of population with below marginal (20.51 per cent) and marginal operational holdings (14.30 per cent).
� The proportion of medium (8.72 per cent) and large farmers (7.13 per cent) is the maximum among the Sikh community.
Trends in Operational Landholdings
� Among the minority communities, the proportion of landless among the Christians declined sharply from 64.38 per cent in 1993-94 to 54.81 per cent in 2004-05.
� The Sikhs and the Buddhists exhibited fluctuating trends. The proportion of landless among the Sikhs declined from 60.59 per cent in 1993-94 to 59.71 per cent in 1999-2000 and then increased to 66.50 per cent in 2004-05.
� Among the Buddhists, the proportion of landless declined from 71.62 per cent in 1993-94 to 67.71 per cent in 1999-2000, and then increased to 71.60 per cent in 2004-05.
� The proportion of minority communities holding marginal operational land also declined over the years for all the three communities, and especially for the Sikhs and the Buddhists.
� There was a notable increase in their proportion smallholdings during the second duration (1999-2000 to 2004-05), especially among the Christian community (increased from 0.48 per cent to 14.30 per cent in 2004-05).
� The proportion of medium and small farmers showed a significant increase, particularly among the Buddhists (medium farmers) (increased from 0.01 per cent to 8.62 per cent), and also among the Sikhs (small farmers) (increased from 0.15 per cent 8.72 per cent).
� 8.60 per cent of the rural Sikhs are the only notable proportion of large farmers among the minority communities.
Poverty
� 19.8 per cent of the total population of India lives below the poverty line, and the minority communities have a greater incidence of urban poverty than rural poverty.

� The Buddhist community is the poorest of the minority communities, having a poverty level (29.86 per cent) greater than the national average (19.80 per cent).
Trends in Poverty (1993-94 to 2004-05)
� The poverty rate in India generally showed a declining trend, especially in the case of the Christian and Buddhist communities, showing a decline from 26.36 per cent to 11.19 per cent, and from 50.24 per cent to 29.86 per cent respectively. A similar trend was seen for both urban and rural areas.
� The poverty ratio for the Sikh community remained constant at around 6 per cent.
Literacy by MPCE quintiles
� Among the lowest strata of the minorities, the literacy rate is the lowest among the Sikhs (44.09 per cent) and the highest among the Buddhists (61.79 per cent). Among the richer sections of the minorities also the Sikh community has a lower literacy rate of 72.44 per cent, while the Parsi with 97.33 per cent are the highest.
� For the lowest strata, upto secondary level of education is lowest among the Sikhs (42.60 per cent), and high among the Buddhists (56.42 per cent). Among the richest sections of the minorities, the Buddhist community (54.24 per cent) has the lowest proportion while the Christian community has the highest.
� The above secondary level of education for all the strata (only exception being the urban rich) is very low among the Sikh community, and is also far below the national average for all the strata.
� Above secondary education among all strata of the minorities is highest among the Parsi community, followed by the Buddhist community.
Employment by MPCE quintiles
� The proportion of self-employed workers increases as we move from the poorest to the richest.
� Among the lowest strata of the minority communities, the Christian community (48.28 per cent) has largest proportion of self-employed workers, and Buddhists (16.02 per cent) are the least self-employed. Among the rich, self-employment is high among the Sikhs (75.74 per cent) and least among the Parsis (44.09 per cent).
� Except for the Sikhs, there is an increase in the proportion of regularly employment. In the rural areas, a major proportion of regularly employed persons among all strata are from the Christian community.
� The proportion of self-employed, regularly employed and casual workers among the rich rural Buddhists showed a decline, but the proportion of regularly employed and casual workers among the poor rural Buddhists increased. Further, 52.91 per cent of the richer rural Buddhists are regular workers; where as the proportion of regular workers among the poorest is only 6.96 per cent.

EMPLOYMENT AND UNEMPLOYMENT
Labour Force Participation Rates
� Rural areas have a better LFPR (44.62 per cent) than urban areas (38.25 per cent), and the LFPR among the minorities has increased among both the males and females of rural and urban areas.
� The Buddhist community has the highest LFPR (48.85 per cent) and the Parsi community has the lowest LFPR (44.56%).
� The LFPR is highest among Parsi males (60.04 per cent), and Sikh females have the lowest (32.74 per cent), while Buddhist women showed the maximum LFPR of 40.87 per cent.
Work Participation Rates
� The proportion of workers increased over the period from 1993-94 to 2004-05, and is higher in the rural areas, except for the Sikhs.
� The Buddhists community have the highest WPR among the minorities (47.22 per cent).
� Among the males, the Sikh men (55.14 per cent) have the highest work participation rate, especially the urban men (55.55 per cent.)
� Buddhist women (40.53 per cent) showed a high WPR among the females, especially the rural women (50.54 per cent). In urban areas, Sikh women have the lowest WPR (15.30 per cent), while it is highest among Parsi women (33.82 per cent).
Unemployment
� The unemployment rate is higher in urban India (5.21 per cent) than in rural India (1.80 per cent). The rate declined for the period 1993-94 to 1999-2000 and then rose in 2004-05.
� Among the minority communities the Christian community has the highest unemployment rate of 6.32 per cent. The Sikh community has the lowest unemployment rate among the males (1.62 per cent) and a relatively high unemployment rate among females (7.05 per cent).
� The unemployment rate is highest among Christian males (4.70%) and females (5.79 per cent and 13.22 per cent in urban and rural areas respectively.) There was a major increase in the unemployment rate among Christian women from 8.10 per cent to 13.95 per cent, and among Sikh women from 5.08 per cent to 9 per cent.
Employment Status

� The proportion of self-employed persons is relatively higher than other categories, especially for the Sikhs (63.65 per cent) and Christians (53.60 per cent).
� 57.64 per cent of the workers among Parsis are regularly employed and 53.31 per cent among the Buddhists are casual workers.
� Among the minorities, the proportion of self employed and casual workers (males as well as females) are higher in rural areas, while the proportion of them regularly employed is greater in the urban areas.
� There is a drastic fall from 82.84 per cent to 47.38 per cent in the percentage of Sikh female self-employed workers, while the proportion of regularly employed Sikh females increased from 5.92 per cent to 37.09 per cent.
Industrial Distribution of Workers
� The majority of all workers in rural areas, among Buddhists (63.73 per cent), Sikhs (64.03 per cent) and Christians (53.34 per cent) are engaged in the primary sector.
� A major part of the workforce among the Parsis (76.03 per cent) is involved in the tertiary sector, especially in the urban areas.
Occupational Distribution
� The majority of the population in India, except the Parsis, work as farmers, fishermen, hunters, loggers and other related works which are mainly primary in nature. The Parsi community is more involved in tertiary activities like administrative, executive and managerial occupations, services and sales, professional and technical occupations, especially in urban areas.
� However, the proportion of workers engaged in primary activities has declined
over the years, while there was a significant improvement in the share of workers engaged in production related works.
� Rural areas in India have more proportion in primary occupations (72.48 per
cent). Urban areas engage 37.52 per cent of workers in production and related workers and more than half of the workers in service sector.
� In the rural areas, the majority of the workers in primary activities are from the
Buddhist community (82.13 per cent), while the Christian community forms the major proportion of workers in production-related works and other services.
Age-Wise Labour Force Participation Rate
� Labour force participation rate has declined at the national level and also among the minority communities, due to the decline in LFPR among the lower age groups (children) as well as the decline in the LFPR among the elderly, especially in the urban areas.

� The main reason for fall in the LFPR among children is that a majority of these children are enjoying the privilege of schooling and formal education.
� The decline in child labour force participation rate is more pronounced in the rural
areas, but among the minority communities, the Sikh community reports an increase in the child LFPR in the urban areas.
Distribution of Tertiary Sector
� 47.17 per cent of the total male labour force is engaged in the tertiary sector of trade, hotels and restaurants. Public administration, education, health and others engage 24.98 per cent of the male labour force in India.
� The Sikh and Christian males in the tertiary sector are mainly occupied in trade,
hotels and restaurants. Both these communities also show new entries to this field for the period from 1993-94 to 2004-05.
� Buddhists form the major work seekers in transport, storage and communication.
� The proportion of males entering public administration, education and health has
declined, especially among the Christian males (from 46.94 per cent to 28.34 per cent). Two thirds of the total tertiary sector female labour force is engaged in public administration, education, health and others, but this proportion has declined over the period.
Urban Christians & Sikhs
� A major proportion of urban Christians in the richest strata are regularly
employed, and Christian women of the elite strata are more regularly employed (44.73 per cent) than the males (41.93 per cent) of the group. Further, the proportion of casual labourers is very low among this group, while 31 per cent of them are self-employed.
� 54.45 per cent of the poor Sikh females work as casual labourers in the urban
areas, the next strata (25.65 per cent) seems to seek some sort of self-employment, while the richest strata (53.64 per cent) outshine their male counterparts (38.08) by getting into regular employment.
Distribution of Primary Sector in Rural Areas by MPCE Quintile
� The poorest of Christians and Sikhs show a withdrawal from the primary sector over the years, while there is a major increase is visible among affluent of these communities who are seen entering the primary sector.
� The Buddhist community, which engages a major share of its population in the
primary sector, maintains the same trend over the period.

Chapter Chapter Chapter Chapter ---- I I I I
INTRODUCTIONINTRODUCTIONINTRODUCTIONINTRODUCTION
Five religious communities have been notified as minority communities under Section
2(c) of the National Commission for Minorities Act, 1992. These are: Muslims, Sikhs,
Christians, Buddhists and Zoroastrians (Parsis). A comprehensive account of the social,
economic and educational status of the Muslim community in India has been provided in
the Sachar Committee Report (GOI, 2006). The mandate of the present report is to
focus on the socio-economic status of the other four minorities, excluding the Muslims,
that is, the Sikhs, Christians, Buddhists (including Neo Buddhists) and Zoroastrians
(Parsis). The report analyzes secondary sources of data such as the Census and NSS,
in addition to information from the National Family Health Survey (NFHS) at the all-India
level, to provide a profile of the educational, social and economic status of these four
minority communities.
1. CHAPTER STRUCTURE
After this introduction, which also provides the geographical spread of the four notified
minorities presented in maps, the chapters in the report cover the general demographic
profile in the second chapter. The third chapter covers the educational status and
attainment levels of the notified minorities, while their health and nutritional status is
dealt with in the fourth chapter. Land operation and poverty among the NMCs and
changes over time are discussed in the fifth chapter. The educational attainment and
employment status across MPCE quintiles as a proxy for socio-economic class
categories is provided in this and the following chapter. A detailed analysis of the
employment and unemployment profile of the four minority communities is undertaken in
the Sixth Chapter. The rural-urban scenario with respect to the status of employment
among the Christians, Sikhs and Buddhists is provided, and differences in the profile of
labour market participation among the women and men are also highlighted, with
changes over time being discussed as well.
2. Data Sources and Limitations

The Census of India 2001 for the first time provided relatively detailed tables on religion-
based statistics. Until the 1991 Census, only the proportion of the population in the
different communities was published. All other data was available only with the Registrar
General’s Office. Some specific Muslim-related statistics were generated for the Sachar
Committee Report in response to a special request. The current report has limited the
analysis to 2001 data from the Census, as was available. The Zoroastrian/Parsi
community has been clubbed with the other religious communities, in the Census data,
and very little information is available separately on the community from the Census due
to this. All Census-based tables hence are limited to the three notified minority
communities (NMCs), that is, Christians, Sikhs and Buddhists.
The Registrar General’s Census data is used for a range of demographic variables such
as proportion of NMC population, urbanization rates, household size and head of the
household, marital status, age at marriage, sex ratios, literacy rates, work participation
rates and so on. The NMCs have been compared among themselves as well as in
relation to the all-India scenario in most cases. Ideally, an exercise that uses all the
notified minorities including Muslims should have been undertaken, in comparison to the
rest of the population excluding these minorities, for a clearer comparative picture of the
minorities as opposed.
The National Sample Survey (NSS) constitutes the other significant secondary data
source on which this report is based. This data source provides information on all the
four notified minorities, although the sample for the Parsis is relatively very small1. The
use of unit level data from the NSS allows analysis from social groups such as the
Scheduled Castes, Scheduled Tribes, Other Backward Classes and Others. It has also
been used to generate information across the five consumption expenditure-based
quintiles. The monthly per capita consumption expenditure is the best proxy available for
class-based analysis in the country. Quintile 1 is the lowest and constitutes the poorest
segment of the households, while the topmost quintile, Q5 refers to the relatively better
off sections of the population. These factors aid in assessing whether behaviour or
achievements among different communities vary across the socio-economic indicators,
and thereby help in identifying in what ways and in which dimensions any given
community is affected.
1 The smaller the sample for any category, the more difficult it is to generate information on
indicators pertaining to that component. At times, the data generated based on small samples can be unreliable as well. The rural sample size of Parsis is very small and therefore cannot be considered reliable.

The NSS data has also been used for employment-unemployment, poverty and land-
ownership analysis. The employment status of different communities in terms of self-
employment, regular and casual employment as well as their industrial and occupational
profiles are also discussed. This provides a clear indication of the nature of labour
market participation of men and women belonging to the different NMCs in rural and
urban locations.
Poverty calculations that estimate the proportion of population below a poverty line
defined as per the Planning Commission estimations are provided here. In addition, the
extent of land operational holdings among the NMCs is estimated to reflect on the
changes therein over time. Amidst overall growth in landlessness, there is a tendency of
increasing operational holdings, especially among the larger land operating households.
The other useful source which also provides information along religious communities is
the NFHS data. The all-India profile of the health status and performance on different
indicators from the NFHS-3 has been taken. Wherever comparable indicators were
available from the earlier rounds of the NFHS, these have also been analyzed to show
the trends and changes over time. An entire range of health and nutrition indicators are
analyzed from this source of information across the three NMCs (since Parsis are not
included in this source).
3. SHARE OF NOTIFIED MINORITY COMMUNITIES
The share of the notified minorities that are included in this study is quite minuscule in
the entire population, close to 5 per cent. However, given the population of the country
as a whole, this amounts to 51.32 million persons, of which 24 million are Christians, 19
million are Sikhs and close to 8 million are Buddhists as per the 2001 Census. Over
time, the proportion of the NMCs in the total population has been relatively stagnant for
most communities, if not declining, except for the Christians who have experienced a
marginal increase in the growth rate over the last two decades, that is, 1981-1991 to
1991-2001. The share of the population even of the Christians however, remains at 2.3
per cent of the entire population, while the Sikhs and Buddhists constitute 1.9 per cent
and 0.8 per cent respectively (see Table 1.1).
Table 1.1: Share and Growth Rate of Three NMCs Over Last Two Decades
Community Share of Population Growth Rate
NMCs 1991 2001 1981-91 1991-2001
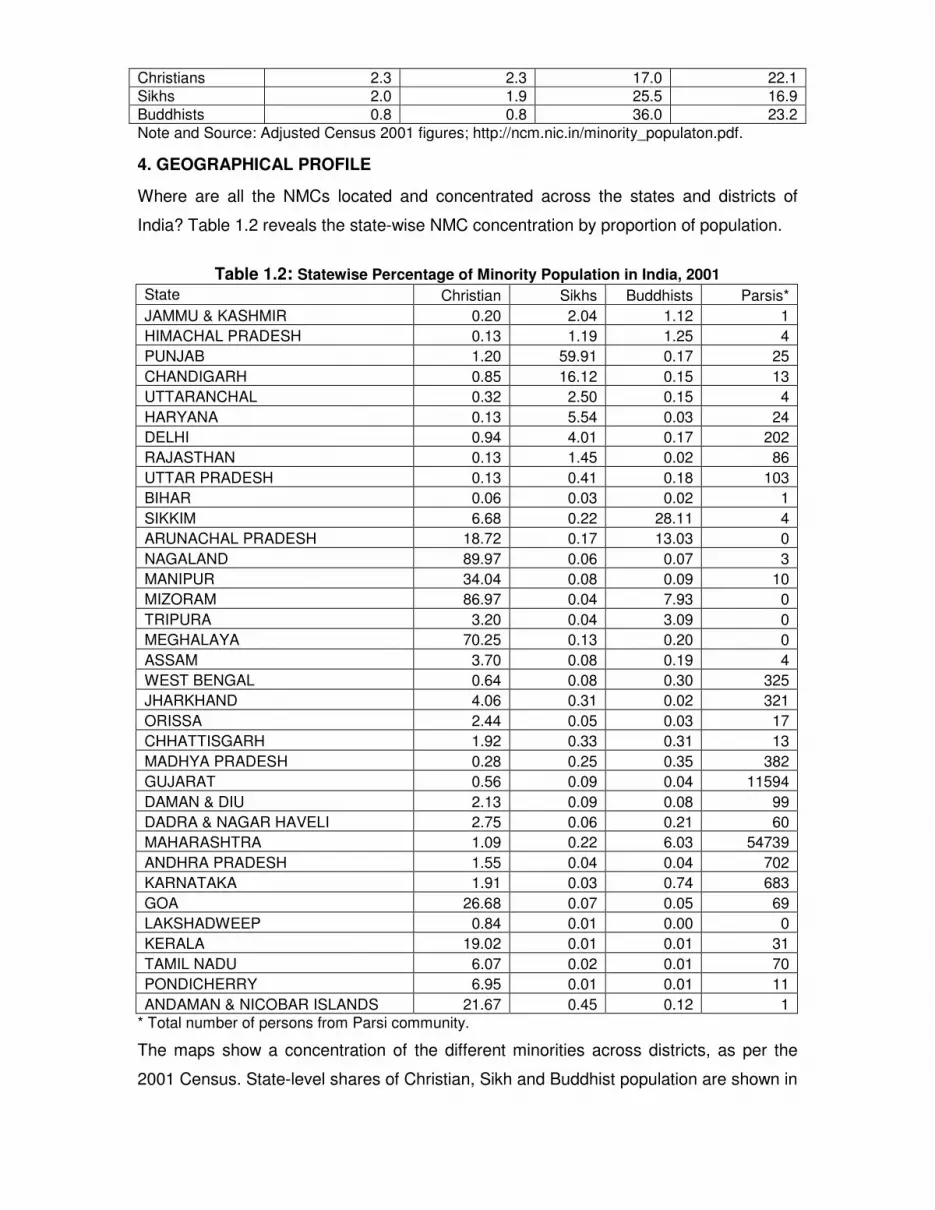
Christians 2.3 2.3 17.0 22.1
Sikhs 2.0 1.9 25.5 16.9
Buddhists 0.8 0.8 36.0 23.2
Note and Source: Adjusted Census 2001 figures; http://ncm.nic.in/minority_populaton.pdf.
4. GEOGRAPHICAL PROFILE
Where are all the NMCs located and concentrated across the states and districts of
India? Table 1.2 reveals the state-wise NMC concentration by proportion of population.
Table 1.2: Statewise Percentage of Minority Population in India, 2001 State Christian Sikhs Buddhists Parsis*
JAMMU & KASHMIR 0.20 2.04 1.12 1
HIMACHAL PRADESH 0.13 1.19 1.25 4
PUNJAB 1.20 59.91 0.17 25
CHANDIGARH 0.85 16.12 0.15 13
UTTARANCHAL 0.32 2.50 0.15 4
HARYANA 0.13 5.54 0.03 24
DELHI 0.94 4.01 0.17 202
RAJASTHAN 0.13 1.45 0.02 86
UTTAR PRADESH 0.13 0.41 0.18 103
BIHAR 0.06 0.03 0.02 1
SIKKIM 6.68 0.22 28.11 4
ARUNACHAL PRADESH 18.72 0.17 13.03 0
NAGALAND 89.97 0.06 0.07 3
MANIPUR 34.04 0.08 0.09 10
MIZORAM 86.97 0.04 7.93 0
TRIPURA 3.20 0.04 3.09 0
MEGHALAYA 70.25 0.13 0.20 0
ASSAM 3.70 0.08 0.19 4
WEST BENGAL 0.64 0.08 0.30 325
JHARKHAND 4.06 0.31 0.02 321
ORISSA 2.44 0.05 0.03 17
CHHATTISGARH 1.92 0.33 0.31 13
MADHYA PRADESH 0.28 0.25 0.35 382
GUJARAT 0.56 0.09 0.04 11594
DAMAN & DIU 2.13 0.09 0.08 99
DADRA & NAGAR HAVELI 2.75 0.06 0.21 60
MAHARASHTRA 1.09 0.22 6.03 54739
ANDHRA PRADESH 1.55 0.04 0.04 702
KARNATAKA 1.91 0.03 0.74 683
GOA 26.68 0.07 0.05 69
LAKSHADWEEP 0.84 0.01 0.00 0
KERALA 19.02 0.01 0.01 31
TAMIL NADU 6.07 0.02 0.01 70
PONDICHERRY 6.95 0.01 0.01 11
ANDAMAN & NICOBAR ISLANDS 21.67 0.45 0.12 1 * Total number of persons from Parsi community.
The maps show a concentration of the different minorities across districts, as per the
2001 Census. State-level shares of Christian, Sikh and Buddhist population are shown in

separate maps, along with the actual numbers of persons among the Parsi/Zoroastrian
population. Table 1.3 shows the distribution of the notified minority communities in the
districts of India, highlighting the few numbers of districts with significant proportions of
each of the NMCs. For instance, there are only 33 districts with more than 40 per cent
concentration of Christians within the population of the respective districts, while there
are only 14 and 6 districts for Sikhs and Buddhists respectively, with similar levels of
concentration (above 40 per cent). A large majority of the districts have less than 1 per
cent of NMC population.
Table 1.3: Distribution of Districts by NMC Concentration Levels Percentage Range Sikhs Buddhists Christians
>90 - - 15
60-90 8 2 12
40-60 6 4 6
20-40 5 5 13
10-20 7 16 17
5-10 6 11 34
1-5 37 34 107
<1 524 521 389 Total 593 593 593
Source: Calculated from the Census of India, 2001.
5. CHRISTIANS
The Christians are located in the northeastern states of Nagaland (90 per cent), Mizoram
(87 per cent), Meghalaya (70 per cent), Manipur (34 per cent); and the states of Goa (27
per cent), Andaman and Nicobar Islands (22 per cent), Kerala (19 per cent) and
Arunachal Pradesh (19 per cent). A list of the districts with higher concentration of
Christian population is provided in Appendix Table 1.1, which is also reflected in the Map
1.1. The number of districts by the range of concentration levels as per the percentage
share of Christians in the total population of the district is given in Appendix Table 1.4.
Map 1.4 shows the state-wise distribution of Christians in the country.
6. SIKHS
The Sikh population is concentrated in Punjab (60 per cent), Chandigarh (16 per cent),
Haryana (6 per cent) and Delhi (4 per cent). A list of the districts with higher
concentrations of Sikh population is provided in Appendix Table 1.2, and is also reflected
in the Map 1.2. The number of districts by the range of concentration levels in terms of
the percentage share of Sikhs in the total population of the district is given in Appendix
Table 1.5. Map 1.5 shows the state-wise distribution of Sikhs in the country.
7. BUDDHISTS

The bulk of the Buddhist population of the entire country (73 per cent) is concentrated in
the state of Maharashtra. However, their share in the population within the state is only 6
per cent. Across the country, Sikkim with 28 per cent, Arunachal Pradesh with 13 per
cent and Mizoram with 8 per cent report higher proportions of Buddhists in the
respective states. A list of the districts with higher concentrations of Buddhist population
is provided in Appendix Table 1.3, which is also reflected in the Map 1.3. The number of
districts by the range of concentration levels as per the percentage share of Buddhists in
the total population of the district is given in Appendix Table 1.6. Map 1.6 shows the
state-wise distribution of Buddhists in the country.
8. PARSIS/ZOROASTRIANS
The Parsi community is dwindling over the years, with only 69,601 persons recorded as
per the 2001 Census. The states in which the community is located are Maharashtra and
Gujarat, which is clearly visible in Map 1.7.

Map 1.1

Map 1.2

Map 1.3

Map 1.4
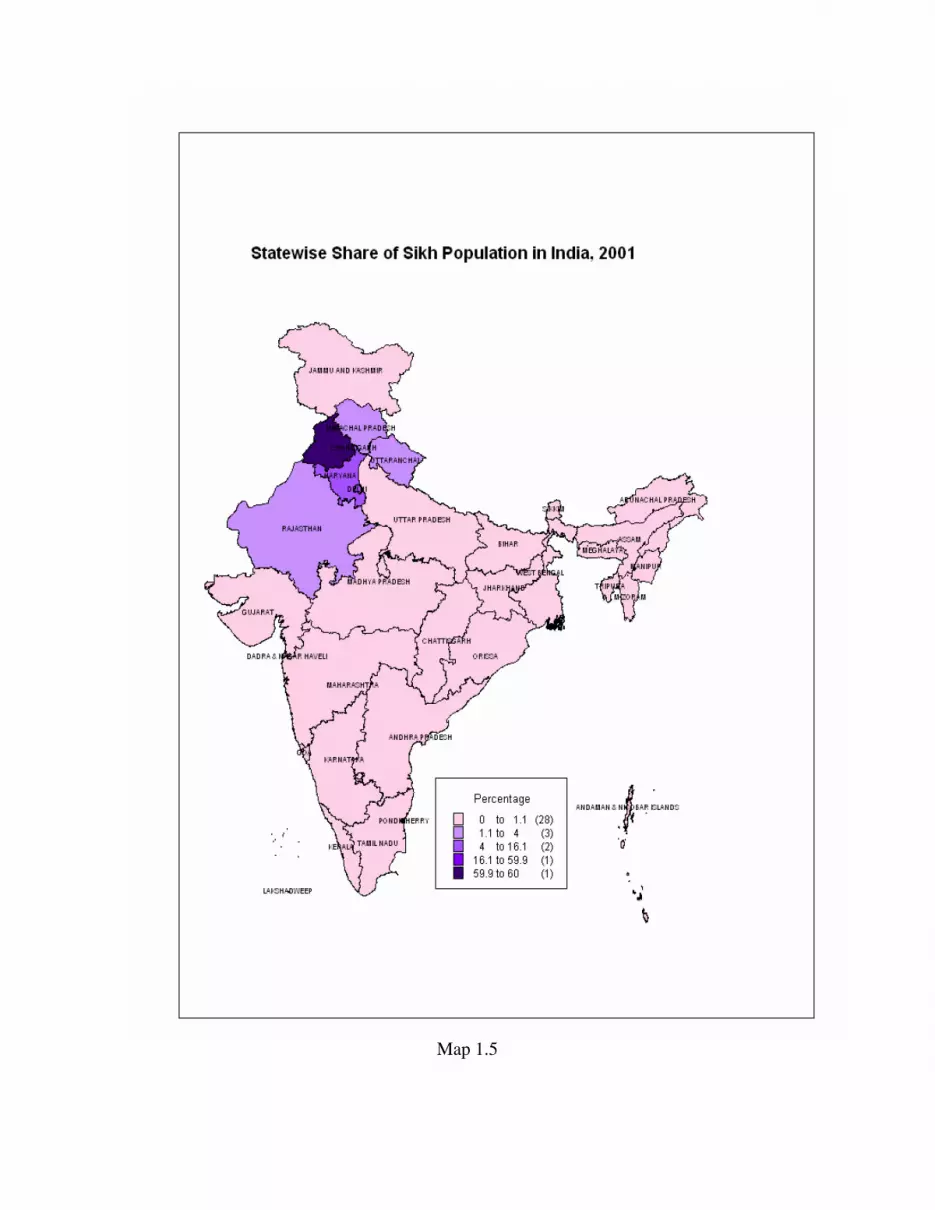
Map 1.5

Map 1.6

Map 1.7

Appendix Table 1.1: Districtwise Concentration of Christian Population in India, 2001 (Rural + Urban)
State District Percentage State District Percentage
Nagaland Tuensang 97.94 Arunachal Pradesh West Siang 19.36
Mizoram Saiha 97.64 Kerala Thiruvananthapuram 18.41
Nagaland Zunheboto 97.49 Orissa Kandhamal 18.20
Mizoram Serchhip 97.46 Goa North Goa 17.98
Mizoram Champhai 96.93 Arunachal Pradesh Changlang 17.49
Nagaland Phek 96.53 Orissa Sundargarh 16.85
Nagaland Wokha 96.15 Tamil Nadu Thoothukkudi 16.71
Nagaland Mon 95.41 Kerala Kollam 16.39
Manipur Ukhrul 95.16 Andaman & Nicobar Andamans 15.61
Manipur Tamenglong 94.88 Arunachal Pradesh East Siang 15.34
Meghalaya West Khasi Hills 94.76 Assam Karbi Anglong 14.48
Nagaland Mokokchung 94.48 Assam Kokrajhar 13.72
Manipur Churachandpur 93.54 Arunachal Pradesh Upper Siang 12.86
Mizoram Aizawl 93.31 Tamil Nadu The Nilgiris 11.45
Manipur Chandel 92.23 Tamil Nadu Tirunelveli 10.89
Nagaland Kohima 89.93 Kerala Kannur 10.84
Meghalaya South Garo Hills 89.65 Arunachal Pradesh Dibang Valley 10.63
Mizoram Kolasib 89.60 Sikkim South 9.70
Meghalaya East Garo Hills 88.95 Gujarat The Dangs 9.51
Mizoram Mamit 80.53 Pondicherry Karaikal 9.45
Meghalaya Ri Bhoi 79.71 Jharkhand Ranchi 9.10
Mizoram Lunglei 79.58 Tamil Nadu Tiruchirappalli 9.02
Manipur Senapati 78.41 Karnataka Dakshina Kannada 8.69
Andaman & Nicobar Nicobars 66.90 Assam Goalpara 7.87
Meghalaya Jaintia Hills 65.26 Tamil Nadu Chennai 7.63
Nagaland Dimapur 61.19 Tamil Nadu Dindigul 7.55
Meghalaya East Khasi Hills 61.02 Tamil Nadu Ramanathapuram 7.08
Meghalaya West Garo Hills 54.57 Punjab Gurdaspur 7.08
Arunachal Pradesh Tirap 50.04 Kerala Kasaragod 7.05
Mizoram Lawngtlai 44.66 Assam Sonitpur 6.88
Kerala Kottayam 44.60 Pondicherry Pondicherry 6.83
Tamil Nadu Kanniyakumari 44.47 Orissa Rayagada 6.64
Kerala Idukki 42.52 Assam Darrang 6.47
Kerala Pathanamthitta 39.03 Jharkhand Sahibganj 6.33
Kerala Ernakulam 38.78 West Bengal Darjiling 6.17
Goa South Goa 37.88 Tamil Nadu Thiruvallur 6.16
Orissa Gajapati 33.47 Manipur Imphal East 5.93
Jharkhand Gumla 31.56 Tamil Nadu Kancheepuram 5.92
Arunachal Pradesh Papum Pare 29.98 Sikkim East 5.92
Assam North Cachar Hills 26.68 Tripura North Tripura 5.91
Arunachal Pradesh East Kameng 25.45 Karnataka Udupi 5.90
Arunachal Pradesh Lower Subansiri 24.51 Sikkim West 5.87
Kerala Thrissur 24.21 Tamil Nadu Sivaganga 5.86
Chhatisgarh Jashpur 22.82 Jharkhand Pakaur 5.86
Kerala Wayanad 22.48 Arunachal Pradesh Upper Subansiri 5.85
Kerala Alappuzha 20.94 Karnataka Bangalore 5.80
Note: % denotes percentage of Christian population to total population in the district.
Source: Calculated from Census of India, 2001.

Appendix Table 1.2: Districtwise Concentration of Sikh
Population in India, 2001 (Rural + Urban)
State District Percentage
Punjab Moga 85.80
Punjab Mansa 78.33
Punjab Faridkot 77.53
Punjab Amritsar 76.99
Punjab Fatehgarh Sahib 74.56
Punjab Muktsar 74.11
Punjab Bathinda 74.07
Punjab Sangrur 70.00
Punjab Kapurthala 59.46
Punjab Ludhiana 57.52
Punjab Rupnagar 56.95
Punjab Patiala 55.53
Punjab Firozpur 51.35
Punjab Gurdaspur 44.44
Punjab Hoshiarpur 38.82
Punjab Jalandhar 37.75
Punjab Nawanshahr 37.42
Haryana Sirsa 27.13
Rajasthan Ganganagar 24.67
Haryana Fatehabad 16.95
Haryana Kurukshetra 16.42
Chandigarh Chandigarh 16.12
Haryana Ambala 13.06
Rajasthan Hanumangarh 12.65
Delhi West 11.62
Uttaranchal Udham Singh Nagar 11.45
Haryana Karnal 9.67
Haryana Kaithal 9.38
Haryana Yamunanagar 8.02
Haryana Panchkula 7.73
Jammu & Kashmir Jammu 7.40
Himachal Pradesh Una 5.21
Uttar Pradesh Pilibhit 4.59
Delhi East 3.50
Delhi South 3.31
Uttar Pradesh Rampur 3.21
Delhi North West 3.21
Haryana Panipat 2.84
Jammu & Kashmir Punch 2.76
Delhi North 2.66
Delhi Central 2.65
Himachal Pradesh Sirmaur 2.64
Uttar Pradesh Kheri 2.64
Uttaranchal Dehradun 2.60
Haryana Jind 2.45
Note: % denotes percentage of Sikh population to total population in the district.
Source: Calculated from Census of India, 2001.

Appendix Table 1.3: Districtwise Concentration of Buddhist Population in India, 2001 (Rural + Urban)
State District Percentage
Jammu & Kashmir Leh (Ladakh) 77.30
Arunachal Pradesh Tawang 74.72
Himachal Pradesh Lahul & Spiti 58.80
Sikkim North 55.09
Mizoram Lawngtlai 52.17
Arunachal Pradesh West Kameng 44.38
Arunachal Pradesh Changlang 34.08
Sikkim West 27.26
Sikkim East 26.42
Himachal Pradesh Kinnaur 24.77
Sikkim South 23.65
Maharashtra Akola 17.98
Mizoram Lunglei 16.34
Arunachal Pradesh Lohit 15.98
Maharashtra Hingoli 14.99
Jammu & Kashmir Kargil 14.98
Maharashtra Washim 14.76
Maharashtra Nagpur 14.49
Maharashtra Buldana 13.73
Maharashtra Wardha 13.71
Mizoram Mamit 13.66
Maharashtra Amravati 13.44
Maharashtra Chandrapur 13.23
Maharashtra Bhandara 12.72
West Bengal Darjiling 11.02
Maharashtra Nanded 10.51
Maharashtra Parbhani 10.03
Maharashtra Gondiya 9.96
Tripura Dhalai 9.15
Maharashtra Yavatmal 9.02
Maharashtra Aurangabad 8.53
Karnataka Bidar 8.13
Maharashtra Gadchiroli 8.04
Arunachal Pradesh Upper Siang 7.81
Maharashtra Jalna 7.50
Maharashtra Ratnagiri 7.12
Tripura South Tripura 5.60
Maharashtra Mumbai (Suburban) 5.37
Arunachal Pradesh Dibang Valley 4.99
Karnataka Gulbarga 4.91
Maharashtra Mumbai 4.84
Maharashtra Satara 4.58
Madhya Pradesh Balaghat 4.48
Maharashtra Pune 4.45
Tripura North Tripura 4.44
Maharashtra Raigarh 4.22 Note: % denotes percentage of Buddhist population to total population in the district.
Source: Calculated from Census of India, 2001.

Appendix Table 1.4: Statewise Number of Christian Concentrated Districts in India, 2001
Number of Districts by Concentration Levels*
State >90 60-90 40-60 20-40 10-20 5-10 1-5 <1 Total
Andaman & Nicobar 1 1 2
Andhra Pradesh 15 8 23
Arunachal Pradesh 1 3 5 2 1 1 13
Assam 1 2 5 10 5 23
Bihar 37 37
Chandigarh 1 1
Chhatisgarh 1 5 10 16 Dadra & Nagar Haveli 1 1
Daman & Diu 1 1 2
Delhi 3 6 9
Goa 1 1 2
Gujarat 1 5 19 25
Haryana 19 19
Himachal Pradesh 12 12
Jammu & Kashmir 14 14
Jharkhand 1 3 7 7 18
Karnataka 3 9 15 27
Kerala 2 5 3 1 3 14
Lakshadweep 1 1
Madhya Pradesh 3 42 45
Maharashtra 6 29 35
Manipur 4 1 1 3 9
Meghalaya 1 5 1 7
Mizoram 4 3 1 8
Nagaland 6 2 8
Orissa 1 2 1 7 19 30
Pondicherry 2 2 4
Punjab 1 3 13 17
Rajasthan 1 31 32
Sikkim 3 1 4
Tamil Nadu 1 3 9 16 1 30
Tripura 1 3 4
Uttar Pradesh 70 70
Uttaranchal 13 13
West Bengal 1 2 15 18
Grand Total 15 12 6 13 17 34 107 389 593
Note: * Concentration levels provide different ranges of percentage of Christian
population to total population in each district.
Source: Calculated from Census of India, 2001.

Appendix Table 1.5: Statewise Number of Sikh Concentrated Districts in India, 2001
Number of Districts by Concentration Levels*
State 60-90 40-60 20-40 10-20 5-10 1-5 <1 Total
Andaman & Nicobar 1 1 2
Andhra Pradesh 23 23
Arunachal Pradesh 1 12 13
Assam 23 23
Bihar 37 37
Chandigarh 1 1
Chhatisgarh 16 16 Dadra & Nagar Haveli 1 1
Daman & Diu 2 2
Delhi 1 8 9
Goa 2 2
Gujarat 25 25
Haryana 1 3 4 3 8 19
Himachal Pradesh 1 2 9 12
Jammu & Kashmir 1 7 6 14
Jharkhand 1 17 18
Karnataka 27 27
Kerala 14 14
Lakshadweep 1 1
Madhya Pradesh 2 43 45
Maharashtra 35 35
Manipur 9 9
Meghalaya 7 7
Mizoram 8 8
Nagaland 8 8
Orissa 30 30
Pondicherry 4 4
Punjab 8 6 3 17
Rajasthan 1 1 4 26 32
Sikkim 4 4
Tamil Nadu 30 30
Tripura 4 4
Uttar Pradesh 5 65 70
Uttaranchal 1 3 9 13
West Bengal 18 18
Grand Total 8 6 5 7 6 37 524 593
Note: * Concentration levels provide different ranges of percentage of Sikh population to
total population in each district.
Source: Calculated from Census of India, 2001.

Appendix Table 1.6: Statewise Number of Buddhist Concentrated Districts in India, 2001
Number of Districts by Concentration Levels*
State 60-90 40-60 20-40 10-20 5-10 1-5 <1 Total
Andaman & Nicobar 2 2
Andhra Pradesh 23 23
Arunachal Pradesh 1 1 1 1 1 5 3 13
Assam 1 22 23
Bihar 37 37
Chandigarh 1 1
Chhatisgarh 1 15 16 Dadra & Nagar Haveli 1 1
Daman & Diu 2 2
Delhi 9 9
Goa 2 2
Gujarat 25 25
Haryana 19 19
Himachal Pradesh 1 1 1 9 12
Jammu & Kashmir 1 1 12 14
Jharkhand 18 18
Karnataka 1 3 23 27
Kerala 14 14
Lakshadweep 1 1
Madhya Pradesh 5 40 45
Maharashtra 11 7 14 3 35
Manipur 9 9
Meghalaya 7 7
Mizoram 1 2 5 8
Nagaland 8 8
Orissa 30 30
Pondicherry 4 4
Punjab 1 16 17
Rajasthan 32 32
Sikkim 1 3 4
Tamil Nadu 30 30
Tripura 2 1 1 4
Uttar Pradesh 1 69 70
Uttaranchal 13 13
West Bengal 1 1 16 18
Grand Total 2 4 5 16 11 34 521 593
Note: * Concentration levels provide different ranges of percentage of Buddhist
population to total population in each district.
Source: Calculated from Census of India, 2001.

Chapter Chapter Chapter Chapter ---- IIIIIIII
DEMOGRAPHIC PROFILEDEMOGRAPHIC PROFILEDEMOGRAPHIC PROFILEDEMOGRAPHIC PROFILE
This chapter presents the demographic profile of the four notified minority communities
(FNMCs) (other than Muslims) in the country. The total number and percentage share of
these FNMCs, along with the distribution of their population across the states of India as
well as by social groups has been provided in the first two sections. This is followed by
the rate of urbanization, numbers of households and their average size, and the head of
the households for these communities. The marital status, age at marriage, sex-ratio of
the population and the child-sex ratio among 0-9 years of these communities are
presented in the subsequent sections. Literacy rates as well as the number of literates
per minority household are discussed in following section. Finally. the work participation
rate, which indicates the extent of reported labour market participation among the men
and women belonging to the FNMCs in comparison to the overall all-India scenario, is
presented in the last section. All these indicators are discussed for all the FNMCs
wherever data is available; however in some cases where data for the Parsis is not
available, only the other 3 communities are discussed.
1. Number and Percentage Share
The Census of India 2001 has for the first time published a detailed report on the
religious communities of India. As per the 2001 Census report, only two communities,
namely the Hindus (81.4 per cent) and Muslims (12.4 per cent), constitute almost 93.8
per cent of the total population of India. This study, however, will discuss the four notified
minority communities other than Muslims i.e. the Christians, Sikhs, Buddhists and
Parsis/Zoroastrians. These four minorities, with a total population of 51.32 million,
account for nearly five per cent of the total population of India. Christians constitute 2.3
per cent, Sikhs - 1.9 per cent and Buddhists - 0.8 per cent of the population respectively.
There are only 69,601 Parsis in this country, which is negligible in percentage terms.
However, they constitute one of the most developed communities in India. (Table 2.1).
Table 2.1: Number and Percentage Share of the Four Notified Minority Communities

Number Proportion of
Total Population Community Total Male Female Total Male Female
TOTAL
Christians 24,080,016 11,984,663 12,095,353 2.34 2.25 2.44
Sikhs 19,215,730 10,152,298 9,063,432 1.87 1.91 1.83
Buddhists 7,955,207 4,074,155 3,881,052 0.77 0.77 0.78
Parsis 69,601 33,949 35,652 0.01 0.0064 0.0072
Total (All Four) 51,320,554 26,245,065 25,075,489 4.99 4.93 5.05
All India 1,028,610,328 532,156,772 496,453,556 100.00 100.00 100.00
RURAL
Christians 15,893,958 7,943,541 7,950,417 2.14 2.08 2.20
Sikhs 14,106,481 7,443,893 6,662,588 0.66 1.95 1.85
Buddhists 4,893,610 2,499,409 2,394,201 1.90 0.66 0.66
Parsis 2,689 1,445 1,244 0.0004 0.00 0.00
Total (All Four) 34,896,738 17,888,288 17,008,450 4.70 4.69 4.71
All India 742,490,639 381,602,674 360,887,965 100.00 100.00 100.00
URBAN
Christians 8,186,058 4,041,122 4,144,936 2.86 2.69 3.06
Sikhs 5,109,249 2,708,405 2,400,844 1.79 1.80 1.77
Buddhists 3,061,597 1,574,746 1,486,851 1.07 1.05 1.10
Parsis 66,912 32,504 34,408 0.0007 0.0216 0.03
Total (All Four) 16,423,816 8,356,777 8,067,039 5.72 5.55 5.95
All India 286,119,689 150,554,098 135,565,591 100.00 100.00 100.00
Source: Calculated from the Census of India, 2001.
The four notified minority communities together account for 26.24 million males and
25.07 million females. In percentage terms, 51.14 per cent of the total population of
these four communities is male and 48.86 per cent is female. Similarly, 34.89 million
people live in the rural areas while 16.42 million people reside in the urban areas. The
rate of urbanization of the four communities taken together is 32.
Table 2.2: Percentage Share of the Four Notified Minority Communities in their Total Population
Percentage Share Community
Total Male Female
Christian 46.92 45.66 48.24
Sikhs 37.44 38.68 36.14 Buddhists 15.50 15.52 15.48
Parsis 0.14 0.13 0.14 Total (All Four) 100.00 100.00 100.00
Source: Calculated from the Census of India, 2001.
An intra–community analysis of the four communities indicates that Christians constitute
46.92 per cent, Sikhs 37.44 per cent, Buddhists 15.5 per cent and the share of Parsis is
only 0.14 per cent (Tab. 2.2). The male-female distribution of these communities can be
seen in Fig.2.1.

Percentage Share of the Four Minority Communities in Their
Total Population
0
5
10
15
20
25
30
35
40
45
50
Christian Sikhs Budhists Parsis
Percentage
Co
mm
un
itie
s
Total Male Female
Fig. 2.1
Source: Census of India, 2001.
2. Distribution of Population by State and Social Groups
The state-level distribution of the four notified minority communities (other than Muslims)
provides a picture of a concentration of minorities in a few states, where these minorities
come close to becoming a majority. For instance, the Christians in the northeastern
states account for as much as 90 per cent in Nagaland, 87 per cent in Mizoram and 70
per cent in Meghalaya (Table 2.3).
Table 2.3: States with Significant Share of Minority Population S.No. Community States (Percentage)
1. Christians Nagaland (90), Mizoram (87), Meghalaya (70), Manipur (34), Goa (27), Andaman & Nicobar Islands (22), Kerala (19), Aruanachal Pradesh (19)
2. Sikhs Punjab (60), Chandigarh (16), Haryana (6) 3. Buddhists Sikkim (28), Arunachal Pradesh (13), Mizoram (8), Maharashtra
(6)
Source: Calculated from the Census of India, 2001.
Similarly, Sikhs in Punjab constitute 60 per cent of the population. and the Buddhists in
Sikkim are 28 per cent of the population. If the distribution of the specific minority
community across the country is considered, a large proportion of all Parsis are located
in Maharashtra (79 per cent) and Gujarat (17 percent), while Kerala and Tamil Nadu
have 25 and 16 per cent of all Christians in the country. Buddhists, including the neo-
Buddhists are largely concentrated in Maharashtra (73 per cent). As may be expected,
76 per cent of Sikhs are in the state of Punjab (Table 2.4).

Table 2.4: States with Major Proportion of Minority Population S.No. Community States (Percentage)
1. Christians Kerala (25), Tamil Nadu (16) 2. Sikhs Punjab (76), Haryana (6) 3. Buddhists Maharashtra (73), Karnataka (5) 4. Parsis Maharashtra (79), Gujarat (17)
Source: Calculated from Census of India, 2001.
The share of minorities by social groups2 has been given in Table 2.5. The overall share
of the different social categories in India as per the National Sample Survey
Organization’s (NSSO) latest round (2004-05) is 41.1 per cent for OBCs, 30.7 per cent
for General, 19.7 per cent for the Scheduled Castes and 8.4 per cent Scheduled Tribes.
33.1 per cent of the Christian population is in the General category, while 32.8 per cent
is in the Scheduled Tribes category and 25.5 per cent in the OBC category. Only 8.3 per
cent of the Christians are Scheduled Castes. The composition of the Sikh population is
spread into three main groups i.e., General population (46.4 per cent), Scheduled
Castes (31.1 per cent) and the OBC (21.8 per cent). The percentage of Scheduled
Tribes among the Sikhs is insignificant (0.8 per cent). Buddhists are predominantly
Scheduled Castes (89.5 per cent). Other social categories are in marginal proportions
among Buddhists.
Table 2.5: Share of Minorities by Social Groups – 2004-05 Minority ST SC OBC General Total
Christians 32.8 8.3 25.5 33.1 2.2 Sikhs 0.8 31.1 21.8 46.4 1.9 Buddhists 7.0 89.5 0.4 3.1 0.7 Parsis 2.4 - - 97.6 0.01 All India 8.4 19.7 41.1 30.7 100.0
Source: Calculated from Unit level data, NSSO, 61st Round.
3. Rate of Urbanization
The rate of urbanization for all the four communities together is 32 per cent, which is
higher than the national average of 27.82 per cent. However, the rate of urbanization
varies a lot among these communities. Parsis/Zoroastrians are among the most
urbanized communities in the country with 96.14 per cent of them inhabiting urban areas
(Table 2.6). Among the other notified minority communities, Sikhs are the only ones who
continue to be predominantly rural. The rate of urbanization for Christians and Buddhists
is 34 and 39 per cent respectively, which is slightly higher than the all- India rate. There
is not much variation in the male-female rates of urbanization for these communities.
2 Social groups are Scheduled Castes (SC), Scheduled Tribes (ST), Other Backward Classes (OBC) and
General, which includes the upper castes.

Table 2.6: Rate of Urbanization for the Four Notified Minority Communities
TOTAL Rate of Urbanization
Community Total Male Female
Christians 34.00 33.72 34.27
Sikhs 26.59 26.68 26.49
Buddhists 38.49 38.65 38.31
Parsis 96.14 95.74 96.51
Total (All Four) 32.00 31.84 32.17
All India 27.82 28.29 27.31
Source: Calculated from the Census of India, 2001.
4. Households and Household Size
The Census of India defines a household as ‘a group of persons who commonly live
together and would take their meals from a common kitchen unless the exigencies of
work prevented any of them from doing so'3. In India, there are 193.31 million
households. Of these, 137.49 million households are in the rural areas and 55.62 million
households are in the urban areas. In other words, 71.20 per cent of the total
households are in the rural areas and 28.80 per cent are in the urban areas. The
Christians are spread over 5.01 million households, which is 2.6 per cent of the total
households of India. The total number of Sikh households is 3.41 million, that is 1.77 per
cent of the total households, and the total Buddhist households are 1.61 million or only
0.83 per cent of the total households in India. The statistic of Parsis households is not
available.
Table 2.7: Household Size of the Minority Communities (Other than Muslims)
Residence Total % Christian % Sikh % Buddhist %
Total 193,119,360 100.00 5,018,503 2.60 3,410,491 1.77 1611,175 0.83
Rural 137,495,260 100.00 3,223,411 2.34 2,435,055 1.77 1006,342 0.73
Urban 55,624,100 100.00 1,795,092 3.23 975,436 1.75 604,833 1.09
Source: Calculated from the Census of India, 2001.
The average household size of the different minority communities is illustrated in Fig 2.2.
It is seen that the Christian community has the lowest average household size of 4.8,
while Sikhs have the largest average household size of 5.6. The mean household size of
the Buddhists is small (4.9). At the national level, for all religions, the larger households
are associated with the rural areas whereas the urban areas have smaller households.
Among the notified minority communities, Christians and Sikhs follow the national
pattern, while Buddhists have the larger households in the urban areas.
3 Census of India, 2001. The definition is being used since the 1971 census.

Fig 2.2: Average Household Size of Different Religious Communites
5.3
4.8
5.6
4.9
5.4
4.9
5.8
4.95
.1
4.6
5.2
5.1
0.0
1.0
2.0
3.0
4.0
5.0
6.0
7.0
Total Christian Sikh Buddhist
Religious Communities
Mean
HH
Siz
e
Total Rural Urban
Source: Census of India, 2001
5. Head of the Household
The indicator on the head of the household can be taken as a broad indicator of the
customs, respect, and other beliefs of different religious communities towards males and
females. On an average, nine-tenths of the total households in India are headed by
males and only one tenth of the households are headed by females. Among the notified
minority communities other than Muslims, Christians have the highest proportion of
female-headed households (15.2 per cent). Sikhs on the other hand have the lowest
proportion (9.3 per cent). The percentage of households headed by females among the
Sikh community is infact the lowest among all the religious communities in India. The
proportion of female-headed households among the Buddhist community is 12.6 per
cent, which is higher than the national average. Males predominantly head the rural and
urban households but their proportion declines in the urban areas, whereas the
percentage of female-headed households is more in the urban areas than the rural
areas. This pattern can be observed across all the religious communities, including all
the notified minority communities.
Table 2.8: Male and Female Headed Households in Notified Minority Communities Other than Muslims
Total Christian Sikh Buddhist
Residence Male Female Male Female Male Female Male Female
Total 89.6 10.4 84.8 15.2 90.7 9.3 87.4 12.6
Rural 89.9 10.1 85.7 14.3 91.2 8.8 87.5 12.5
Urban 89.0 11.0 83.2 16.8 89.5 10.5 87.1 12.9 Source: Calculated from the Census of India, 2001.

6. Marital Status
The Census of India classifies marital status into five categories, namely ‘never married’,
‘married’, ‘widowed’, ‘divorced/separated’ and ‘unspecified’. Among the three
communities, Christians have the highest proportion (51.4 per cent) in the ‘never
married’ category, followed by Buddhists (50.83 per cent) and Sikhs (48.07 per cent)
(Table 2.9). The reverse is true for the ‘married’ category. Buddhists have the highest
percentage of persons widowed and divorced / separated, followed by Christians and
Sikhs. There is not much variation in the marital status in the rural and urban
populations of these communities, except for Christians in the urban areas It has also
been observed that the proportion of married females are more than the males for all the
three categories, where as more males are in the ‘never married’ category than females.
The marital profile for the Parsis is not available separately in the Census.
7. Age at Marriage
The legal age of marriage for males and females in India is 21 years and 18 years
respectively. However, child marriage has been found to be widely practiced in different
parts of the country. The community-wise age at marriage has been presented for males
and females of the different notified minority communities. Different age-groups have
been combined into two categories - less than 18 years and more than 18 years for
females, and for males, it is upto 21 years and more than 21 years4. In India, 43.48 per
cent of the married females are of less than 18 years of age. In the rural areas, such
females are 47.31 per cent of the total, whereas in the urban areas they are 33.33 per
cent of the total. Comparing this national figure with the corresponding figure for the
notified minority communities, the prevalence of early marriages is found to be lower for
Christians (16.46) and Sikhs (17.02). However, among Buddhist females, the proportion
of those marrying at less than 18 years of age is as high as 41.04 percent.
Table 2.9: Marital Status of the Different Religious Communities
All Religions Christian Sikh Buddhist Marital Status
P M F P M F P M F P M F
TOTAL
Total 100.00 100.00 100.00 100.00 100.00 100.00 100.00 100.00 100.00 100.00 100.00 100.00
Never married 49.84 54.42 44.93 51.40 55.23 47.60 48.07 52.61 42.99 50.83 55.94 45.47
Married 45.56 43.56 47.69 43.6 3 42.85 44.41 47.74 44.91 50.90 43.73 42.14 45.41
Widowed 4.28 1.83 6.91 4.45 1.62 7.25 3.99 2.28 5.90 4.88 1.64 8.28
Divorced/ Separated 0.32 0.19 0.47 0.52 0.30 0.74 0.20 0.20 0.21 0.55 0.29 0.83
Unspecified 0.00 0.00 0.00 0.00 0.00 0.00 0.00 0.00 0.00 0.00 0.00 0.00
4 The male category of upto 21 years includes the 21-year olds as well.

RURAL
Total 100.00 100.00 100.00 100.00 100.00 100.00 100.00 100.00 100.00 100.00 100.00 100.00
Never married 49.90 54.57 44.97 52.23 56.08 48.39 48.44 53.11 43.23 50.32 55.48 44.94
Married 45.37 43.24 47.63 42.89 41.91 43.87 47.30 44.28 50.68 44.02 42.29 45.82
Widowed 4.39 2.00 6.91 4.35 1.71 6.99 4.06 2.41 5.91 5.05 1.90 8.34
Divorced/ Separated 0.33 0.20 0.48 0.53 0.31 0.75 0.19 0.20 0.19 0.61 0.33 0.90
Unspecified 0.00 0.00 0.00 0.00 0.00 0.00 0.00 0.00 0.00 0.00 0.00 0.00
URBAN
Total 100.00 100.00 100.00 100.00 100.00 100.00 100.00 100.00 100.00 100.00 100.00 100.00
Never married 49.68 54.06 44.81 49.77 53.55 46.09 47.06 51.24 42.34 51.65 56.67 46.33
Married 46.03 44.39 47.85 45.07 44.70 45.43 48.94 46.64 51.53 43.28 41.88 44.76
Widowed 4.00 1.39 6.89 4.64 1.45 7.75 3.78 1.93 5.86 4.61 1.23 8.19
Divorced/ Separated 0.30 0.16 0.45 0.51 0.29 0.72 0.22 0.18 0.26 0.46 0.22 0.72
Unspecified 0.00 0.00 0.00 0.00 0.00 0.00 0.00 0.00 0.00 0.00 0.00 0.00
M= Males, F= Females, P= Persons Source: Calculated from Census of India, 2001.
Fig 2.3: Age at marriage of the Females among the Notified Minority Communities
(Other than Muslims)
0
10
20
30
40
50
60
70
80
90
<18 18+ <18 18+ <18 18+ <18 18+
Christ ian Sikhs Buddhist Total
Communi t i e s Tot al Rural Urban
Fig. 2.3
Source: Census of India, 2001.
Normally, early marriages have been found to be more prevalent in the rural areas in
comparison to the urban areas.

Fig 2.4: Age at Marriage of the Males among the Notified Minority Communities (Other
than Muslims)
19
.81
75
.82
37
.64
58
.38
39
.15
57
.82
49
.50
47
.32
23
.38
72
.52
41
.77
54
.40
44
.77 5
2.3
5
56
.02
41
.25
13
.18
81
.94
26
.73
68
.88
29
.98
66
.74
33
.15
62
.54
0
10
20
30
40
50
60
70
80
90
upto 21 >21 upto 21 >21 upto 21 >21 upto 21 >21
Christian Sikhs Buddhist Total
Communities
% M
arr
ied
Total Rural Urban
Source: Census of India, 2001.
Males marrying at an age upto 21 years have been found to be 49.50 per cent of the
married population in India. Of the total married males=, 56.02 per cent in the rural areas
and 33.15 per cent in the urban areas have been found to be below the legal age of
marriage. The proportion is lower in the Christian communities (19.81). However, among
the Buddhist (39.15) and Sikh (37.64) communities, the percentage of males marrying
early has been found to be higher. The rural areas have experienced more early
marriages for males (upto 21 yrs) in comparison to the urban areas.
8. Sex-Ratio and the Child Sex-Ratio
The sex–ratio for the four communities together is 955 females per thousand males. It is
951 for rural areas and 965 for urban areas. Though the sex-ratio for the four
communities combined together is higher then the national average for the total
population, as well as the rural and urban populations, there are wide variations in the
sex–ratio among these communities. Parsis have a sex ratio of 1050, whereas Sikhs
have a sex–ratio of 893 females per thousand males. These two communities are the
two extremes of the sex–ratio among all the communities in the country. Christians have
1009 females per thousand males whereas Buddhists have 953. The rural-urban
differentiation in sex–ratio is not distinct in these communities, except for Parsis who
have a sex–ratio of 861 in the rural areas and 1059 in the urban areas. The Parsis
inhabit mostly urban areas, with only a small number of 2,689 residing in villages in
India. Thus, a miniscule 4 per cent of the Parsi populations is located in rural areas.
Given the insignificant proportion of Parsi households, it is possible that the sex-ratios
among the rural Parsi population is skewed. The sex–ratio for the country as a whole

records more females in the rural areas in comparison to the urban areas. However,
these communities reflect a far more balanced sex-ratio in urban areas, except for Sikhs
(Table 2.10).
Table 2.10: Sex-Ratio for the Four Notified Minority Communities
Sex-Ratio Community
Total Rural Urban
Christians 1009 1001 1026
Sikhs 893 895 886
Buddhists 953 953 958
Parsis 1050 861 1059
Total (All Four) 955 951 965
All India 933 946 900
Source: Calculated from Census of India, 2001.
The all-age sex-ratio reflects the overall picture of gender discrimination. However, it is
the birth, infant, and child sex-ratios that reveal the nature of discrimination the female
faces. The sex-ratios at birth and at different age groups reveal the play of socio-cultural
factors in determining the possibility of female survival. An adverse sex-ratio at birth
indicates that even prior to birth, certain factors influence the sex of the foetus to be
male - this could be at the time of conception, gestation or delivery. However, the decline
in the sex-ratio after birth (infant sex-ratio and sex-ratio for other age groups) stresses
the significance of neglect and also the use of technology in influencing the natural
number of males and females. Table 2.11 depicts the child sex-ratio at the age groups 0-
4, 5-9 and 10 plus. The child sex-ratio is low for all the communities, in comparison to
the 10 years and above sex-ratio. The sex-ratio of the Sikh community at the 0-4 age
group is alarming. There is a huge deficit of 220 female children per thousand male
children, which invites the serious and immediate attention of the government to act, as
many female fetuses are being eliminated even before they can take birth. However, the
sex-ratio improves for subsequent age groups in the Sikh community. The Buddhist
community does not show much variation in sex-ratio for different age-groups.
Table 2.11: Child Sex-Ratio in Notified Minority Communities
Age-Group (in Yrs.)
Religious Communities 0-4 5--9 0-9 10+
Total
Christian 969 959 964 1021
Sikh 780 815 799 917
Buddhist 944 950 947 954
Rural
Christian 970 956 963 1011
Sikh 781 819 802 920

Buddhist 948 951 949 960
Urban
Christian 966 968 967 1038
Sikh 774 802 789 908
Buddhist 937 949 943 944
Source: Calculated from the Census of India, 2001
Akin to the high all-age sex-ratio in the urban areas among Christians, the child sex-ratio
too exhibits a similar pattern. In all other communities, the child sex-ratio is high in the
rural areas. The child sex-ratio for the Sikhs in the urban areas is much lower, indicating
the high level of sex-determination and female foeticide practiced by Sikhs in the urban
areas, where the access to technology and expertise of medical professionals can aid
the elimination of female foetuses.
Table 2.12: Literacy Rate for the Four Notified Minority Communities
Community Total Male Female Male-Female Literacy Gap
Total
Christians 80.3 84.4 76.2 8.2
Sikhs 69.4 75.2 63.1 12.1
Buddhists 72.7 83.1 61.7 21.4
Parsis 97.9 - 97.1 -
All-India 64.8 75.3 53.7 21.6
Rural
Christians 74.5 79.5 69.7 9.8
Sikhs 64.2 70.6 57.2 13.4
Buddhists 66.9 78.8 54.6 24.2
Parsis - - - -
All-India 58.7 70.7 46.1 24.6
Urban
Christians 90.9 93.6 88.3 5.3
Sikhs 83.6 87.5 79.2 8.3
Buddhists 81.6 89.8 72.9 16.9
Parsis - - - -
All-India 79.9 86.3 72.9 13.4
Source: Calculated from the Census of India, 2001.

9. Literacy Rate
The All-India literacy rate as recorded by the Census 2001 is 64.8 per cent. All the four
minority communities have a higher literacy rate in comparison to the national average.
The Parsis have a very high rate of literacy and in general, and their educational levels
are also quite advanced. The literacy rate of Parsis is 97.9, which is the highest among
all the communities.
Christians have a literacy rate of 80.3, while for Buddhists it is 72.7 and 69.4 for Sikhs .
The female literacy rates are generally found to be lower than those of their male
counterparts, which is also true for these four minority communities. The female literacy
rate for Christians, Sikhs and Buddhists are 76.2, 63.1, and 61.7 respectively. The
male-female gap in the literacy rates is highest among the Buddhist community and
lowest among the Christians. It can also be seen that the male-female gap is
comparatively wider in the rural areas. The low literacy rate in the rural areas and
particularly among females is the national pattern and the minority communities are no
different here.
10. Number of Literates Per Household
The number of literates per household is another measure of the literacy level. Table
2.13 gives the percentage of households with various numbers of literate members. Also
given is the percentage of households where none of its members are literate. Across
the country, there are 14.4 per cent of households that have no literate members at all.
However, among the notified minority communities other than Muslims, the percentage
of such households is less than 10 per cent. Christians have the lowest proportion (7.1)
of such households. Among Sikhs and Buddhists, the percentage of households with all
of its members illiterate is 9.2 and 9.1 respectively.
Table 2.13: Percentage of Households and Number of Literate members in Notified Minority Communities
1 2 3 4 5 6 7 None Total
Total
Christians 10.6 20.5 18.8 20.1 12.1 5.8 5.1 7.1 100.0
Sikhs 10.5 15.9 17.7 19.7 13.4 6.7 7.0 9.2 100.0
Buddhists 13.5 21.5 17.5 16.4 12.1 5.9 4.1 9.1 100.0
All Religions 15.0 19.0 16.3 15.1 9.7 5.0 5.4 14.4 100.0
Rural
Christians 12.2 20.0 17.8 18.5 11.2 5.5 4.8 9.8 100.0
Sikhs 12.0 16.5 18.0 17.9 12.0 6.0 6.5 11.2 100.0
Buddhists 16.0 22.2 17.6 14.9 10.0 4.5 2.8 12.0 100.0
All Religions 17.1 19.1 15.8 13.3 8.3 4.2 4.5 17.6 100.0
Urban
Christians 7.6 21.4 20.4 23.0 13.5 6.3 5.5 2.3 100.0

Sikhs 6.8 14.4 17.0 24.2 16.8 8.2 8.2 4.4 100.0
Buddhists 9.3 20.3 17.3 18.8 15.6 8.1 6.2 4.4 100.0
All Religions 9.9 18.6 17.6 19.7 13.2 6.9 7.8 6.4 100.0 Source: Calculated from the Census of India, 2001.
In the rural areas, households with no literate members are high in proportion (17.6 per
cent), in comparison to the urban areas (6.4 per cent). This observation is true for all the
religious communities, including the notified minority communities. The Christians have
the lowest percentage of such households.
The percentage of households with only one or two of its member/s literate is high
among the Buddhist community. As the household size of the Sikhs is high, a higher
percentage of households with seven literate members are also associated with them.
11. Work Participation Rate
At the national level, the work participation rate (WPR) is 39.1 per cent. The WPR for the
females is only half (25.62) of the male WPR (51.67). Among the minority communities,
the pattern is akin to the above national pattern, but the male-female gap in the WPRs is
narrower, except for the Sikhs, who have wide male-female gap in WPRs. This gap is of
33.06 for total population, which is even higher in the urban areas (40.86). In absolute
terms, only 9.96 per cent females from the Sikh community in the urban areas are
economically active and engaged in one or more pursuits. This indicates some social
stigma or taboos in this community, which prevents the females from participating in any
economic activities. The low level of sex-ratio, WPR and literacy rate among the females
of the Sikh community indicates social and gender discrimination, which requires
attention by the policy makers.
Table 2.14: Work Participation Rate for the Notified Minority Communities
Residence Community Total Male Female Male-Female Gap
Christian 39.67 50.71 28.72 21.99
Sikh 37.69 53.29 20.23 33.06
Buddhist 40.64 49.16 31.7 17.46 Total
All Religions 39.1 51.67 25.62 26.05
Christian 41.96 51.3 32.63 18.67
Sikh 39.89 54.19 23.93 30.26
Buddhist 46.85 51.32 42.19 9.13 Rural
All Religions 41.74 52.11 30.72 21.39
Christian 35.2 49.56 21.21 28.35
Sikh 31.62 50.82 9.96 40.86
Buddhist 30.72 45.73 14.81 30.92 Urban
All Religions 32.27 50.55 11.95 38.6

Source: Calculated from the Census of India, 2001.
Among the other notified minority communities, Buddhists have a relatively high WPR in
both the rural and urban areas. Though the male-female gap in WPRs of Buddhists is
narrow in their total population, wide differences can be observed in the urban areas.
The WPR for the females of the Buddhist community in the rural areas is relatively high
(42.19 per cent). The WPR among the Christian community is generally found to be
higher than the national average. The male-female gap in the WPRs is also narrow in
the Christian community. In the urban areas particularly, the WPR for the females is
highest among the Christian communities, even though it is less than half the male
WPR.

Chapter Chapter Chapter Chapter ---- IIIIIIIIIIII
EDUCATIONAL ATTAINMENTEDUCATIONAL ATTAINMENTEDUCATIONAL ATTAINMENTEDUCATIONAL ATTAINMENT
Education plays an important role in the progress of an individual’s mind in particular and
the country in general. Ignorance can be overcome only through education. The literacy
rate is the minimum level of any education. Literacy, in fact, is a threshold for education.
Many so-called literates did not have the ability to apply their reading and writing skills to
real-life situations, and often a substantial proportion revert to illiteracy within 4-5 years
of leaving schools5. In this chapter, the literacy rate of different notified minority
communities (other than Muslims), disaggregated by sex and residence, has been
discussed. Some other aspects of literacy, education and school education are also
discussed. Parameters relating to literacy like age-wise literacy, age-wise female
literacy, literacy among different social categories of minorities, and percentage change
in literacy rates have been analyzed. Under educational status, the levels of primary,
secondary and higher education among the communities under study have been
discussed separately. Those attaining graduate degrees and above are also discussed
separately. The indicators of school education that are discussed are the proportion of
population currently enrolled, never enrolled, dropouts, girl-child dropouts and children
out of school.
1. Age-wise Literacy Rate
The age-wise literacy rate for different notified minority communities has been computed
for children (7-14 years), adolescents (15-19), youths (20-34), the working population
(35-59 years) and the elderly population (60 years and above). It has been found that for
the child, adolescent and youth population, the literacy rate for the minority communities
under study has been invariably higher than the national average, in the case of the
total, rural as well as urban population. In the case of the elderly population, the literacy
rate is lower among Sikhs (31.36 per cent) and Buddhists (27.60 per cent), in
comparison to the national average for the same population. The literacy rate for the
Christians has remained uniformly higher than the national average for all the age-
groups. The literacy rate for children (7-14 years) and adolescents (15-19 years) has
been observed to be the maximum (89.24 and 90.83 per cent respectively) for the
5 The Prime Minister’s High Level Committee’s report on the Social, Economic and Educational Status of the Muslim Community of India (Sachar Committee Report), 2006, p.51.

Buddhist population. In the subsequent age-groups, the literacy rate is the highest for
the Christian community. In the rural areas, the pattern is similar to that of the total
population; however, in the urban areas, the literacy rate is unvaryingly the highest for
the Christian community (Table 3.1). Buddhists recorded a lower literacy rate for the
working population in the urban areas than the national average.
Table 3.1: Age-Wise Literacy Rate of the Notified Minority Communities, 2001
Age (in Yrs.) Minority Community T/R/U All Age 7-14 15-19 20-34 35-59 60+
Total 64.84 77.69 79.29 67.68 54.34 36.31
Rural 58.74 74.62 75.25 60.90 45.70 29.05 All Religions Urban 79.92 86.79 88.69 82.80 74.38 58.08
Total 80.25 82.43 88.22 84.23 76.80 65.50
Rural 74.55 77.67 84.28 78.72 69.76 59.13 Christians Urban 90.90 93.45 95.76 93.60 89.04 78.27
Total 69.45 86.87 86.63 74.88 59.47 31.36
Rural 64.21 85.62 84.52 70.08 50.56 23.20 Sikhs Urban 83.56 90.61 92.33 87.40 80.78 57.80
Total 72.66 89.24 90.83 79.92 59.55 27.60
Rural 66.93 87.00 88.21 74.49 51.60 23.65 Buddhists Urban 81.60 93.05 94.64 87.11 71.46 38.05
Source: Calculated from the Census of India, 2001
2. Age-wise Female Literacy Rate
Women's education plays a very important role in the overall development of the
country. It not only leads to the development of half of the human resources, but it also
improves the quality of life, both at home and outside. The female literacy rate for all the
communities has remained lower than the male literacy rate. Even for the different age-
groups, the level of literacy among females is lower than the total literacy levels. The
pattern of age-wise literacy rates for females present a similar pattern to those of age-
wise total literacy rates. Buddhist females record the maximum literacy rates for children
and adolescents among the minorities under study, whereas Christian females have the
higher literacy rate in the subsequent age-groups (Table 3.2).
Table 3.2: Age-wise Female Literacy Rate of the Notified Minority Communities, 2001
Minority T/R/U Age (in Yrs.)

Community All Age 7-14 15-19 20-34 35-59 60+
Total 53.67 73.47 72.66 55.71 38.71 20.25
Rural 46.13 69.46 66.56 46.85 28.58 13.01 All Religions
Urban 72.86 85.40 86.78 76.51 63.27 41.80
Total 76.19 81.50 86.73 80.63 70.76 57.19
Rural 69.65 76.42 82.25 73.98 62.50 50.18 Christians
Urban 88.26 93.11 95.03 91.89 85.14 70.72
Total 63.09 85.45 84.94 69.35 49.77 19.28
Rural 57.15 83.93 82.25 63.56 39.51 11.91 Sikhs
Urban 79.18 90.08 92.20 84.59 74.52 43.27
Total 61.69 87.67 87.79 69.88 41.22 9.40
Rural 54.56 85.06 83.97 61.97 31.79 6.49 Buddhists
Urban 72.91 92.12 93.15 80.31 55.89 16.91
Source: Calculated from the Census of India, 2001
3. Literacy Rate of the Different Social Groups
The National Sample Survey (NSS) has published data on literacy by different social
categories of the religious communities. The NSS 61st Round (2004-05) records that the
literacy rate among Scheduled Castes, Scheduled Tribes and Other Backward Classes
of the minority communities (other than Muslims) is much better than the national
average for the same categories. The literacy gap for these categories is also low vis-à-
vis the General category, which is comparatively high. The literacy rate for the General
category is high for all the communities except for the Buddhists, where the Scheduled
Tribe population has a higher literacy rate than the other categories. This is peculiar.
However, the low proportion of the Other and SC population in the Buddhist community
must be kept in mind while reading these figures. The literacy gap between the different
categories is also the lowest among the Buddhists. At the national level, the literacy rate
for the Scheduled Tribes is the lowest among all the categories; however, the Scheduled
Tribes among the notified minorities (other than Muslims) have recorded a better literacy
rate, and among Buddhists they have the highest literacy rate among all the other
categories. The Scheduled Castes have recorded the lowest literacy rate among the
Sikh community. For Parsis, the literacy rate is 96.16 per cent, the General category of
which has a 98.55 per cent literacy rate.

Source: NSSO, 61st Round
4. Percentage Change in the Literacy Rate of the Notified Minority Communities (Other than Muslims) during 1999-2000 and 2004-05
Quinquennial data of the National Sample Survey provide the trend of the literacy rates
among the different social categories of the minority communities. As is evident from Fig.
3.2, the maximum increase in the literacy rate has been observed among the Scheduled
Tribes in the Sikh communities. The Scheduled Castes among the Christians have also
shown a fair improvement in terms of literacy. The real concern is about the Other
Backward Classes in the Christian and Sikh communities, where the literacy level has
declined. The General category among the Buddhists have also shown a decline in the
literacy rate. It can also be noted that the percentage change in the literacy rate of the
total population in India is not showing much variation among the different categories,
though different social categories among the notified minority communities show wide
variations.
Fig 3.1 : Literacy Rate for the Social Categories of Notified Minority Communities
(Other than Muslims), 2004-05
67.4
7
69.0
4
69.9
8
46.6
8
66.7
2
53.6
3
66.2
6
51.0
6
75.5
9
64.3
1
67.1
4
57.8
8
84.0
1
74.5
5
68.2
6
98.5
5
71.4
0
74.7
8
65.7
7
66.5
9
96.1
6
59.7
3
0
10
20
30
40
50
60
70
80
90
100
Christians Sikhs Buddhists Parsis Total
Minority Communities
Lit
era
cy R
ate
(%
)
ST SC OBC Others Total

Fig 3.2 : Percentage Change in the Literacy Rate of the Notified Minority Communities
(Other than Muslims) during 1999-2000 and 2004-05
5.3
7
13.8
8
8.5
9
6.1
0
12.8
9
9.0
9
6.9
9
6.3
7
-1.6
4
-5.7
2
3.3
4
5.6
1
0.2
0
5.6
8
-6.7
0
8.3
4
4.4
7
2.8
6 4.9
1 6.6
6
11.3
8
4.7
7
-10
-5
0
5
10
15
20
Christianity Sikhism Buddhism Zoroastrianism Total
Minority Communities
Perc
en
tag
e C
han
ge
ST SC OBC Others Total
Source: NSSO, 61st Round
5. Educational Level among the Notified Minority Communities
The level of education among the four notified communities has been represented in Fig.
3.3. The Census of India classifies educational status into eleven categories. They are
Literate, Literate without Educational Level, Below Primary, Primary, Middle,
Matric/Secondary, Higher Secondary/Intermediate/Pre-University/Senior Secondary,
Non-Technical Diploma or Certificate not equal to degree, Technical Diploma or
Certificate not equal to degree, Graduate and Above and Unclassified. These broad
educational categories have been reclassified into three categories: Elementary6,
Secondary7 and Higher Education,8 by combining two or more of the above categories.
The bulk of the Indian population is only educated to the elementary level, and as much
as 71.67 per cent the total literate population of India has only elementary education.
6 Elementary education has been calculated by combining Literate without Educational Level,
Below Primary, Primary and Middle categories. 7 Secondary Education has been calculated by combining Matric/Secondary, and Higher
Secondary / Intermediate/Pre-University/ Senior Secondary categories. 8 Higher Education has been calculated by combining Non-Technical Diploma or Certificate not
equal to degree, Technical Diploma or Certificate not equal to degree, and Graduate and Above categories.

Fig 3.3: Educational Level among the Notified Minority Communities (Other than
Muslims), 2001
71.67
20.88
7.44
62.92
26.18
10.89
63.62
28.52
7.84
72.20
21.74
6.04
0
10
20
30
40
50
60
70
80
Elementary Secondary Higher
Educational Level
Perc
en
tag
e o
f P
op
ula
tio
n
All Religious Communities Christian Sikh Buddhist
Source: Census of India, 2001
Among the minority communities, 63 per cent of literate Christians have an elementary
level of education, whereas the corresponding figures for the literate Sikhs and
Buddhists are 64 and 72 per cent respectively. In India, 21 per cent of the total literate
population has an education till the Secondary level. The maximum proportion of the
population with Secondary level of education has been found among the Sikh
community. Only 7.44 per cent of the total literate population of India has higher
education. Among the minority communities, Christians have the highest proportion of
literate population with higher education. The level of higher education among Buddhists
is the lowest (6.04 per cent) among the minority communities.
The educational levels of females too need a mention here. The highest proportion of
literate females is at the elementary level of education. As the level of education
increases, the proportion of females declines. The proportion of females with higher
education is only 5.81 per cent for India. Among the minority communities, higher
educated Buddhist females are only 3.94 per cent, whereas the corresponding figure for
Christians is 10.47 per cent. Similarly, rural India in general and the minority
communities in particular have a higher level of elementary education and lower level of
higher education. In the urban areas, the proportion of the population with higher
education is relatively higher, and proportion of population with elementary education is
relatively lower.
Table 3.3: Educational Level of the Notified Minority Communities (Other than Muslims) by Sex and Residence

Minority Community Total Rural Urban
Elementary Education
Total Male Female Total Male Female Total Male Female
All India 71.67 68.93 75.77 78.97 75.76 84.16 58.36 55.41 62.25
Christian 62.92 62.98 62.85 70.24 70.32 70.16 51.70 51.19 52.23
Sikh 63.62 61.78 66.05 71.13 68.55 74.62 48.10 47.14 49.27
Buddhist 72.20 68.64 77.23 78.37 74.75 83.81 64.31 60.33 69.48
Secondary Education
All India 20.88 22.52 18.40 17.17 19.35 13.64 27.62 28.80 26.08
Christian 26.18 25.73 26.66 22.77 22.40 23.19 31.39 31.08 31.71
Sikh 28.52 30.33 26.13 25.64 27.87 22.62 34.46 35.64 33.02
Buddhist 21.74 23.81 18.83 17.91 20.17 14.51 26.65 28.76 23.91
Higher Education
All India 7.44 8.53 5.81 3.84 4.87 2.19 13.99 15.77 11.65
Christian 10.89 11.28 10.47 6.98 7.27 6.64 16.89 17.72 16.05
Sikh 7.84 7.87 7.80 3.22 3.57 2.75 17.41 17.18 17.68
Buddhist 6.04 7.54 3.94 3.71 5.06 1.68 9.03 10.90 6.60
Source: Calculated from the Census of India, 2001
6. Graduates and Above
Of the total literate population of India, there are 6.72 per cent with an education level of
graduation and above. The male-female gap among the category of graduates and
above is 2.17 per cent, in favour of the males. The rural-urban gap is wider (9.47), in
favour of the urban areas. Among the notified minority communities, the highest
proportion of graduates is found in the Christian community. Buddhists have the lowest
proportion of graduates. As mentioned earlier, more males are graduates than females.
Table 3.4: Percentage of Graduates and Above of the Educated Population in the Notified Minority Communities (other than Muslims), 2001.
Total Rural Urban Minority Community Total Male Female Total Male Female Total Male Female
All India 6.72 7.59 5.41 3.36 4.26 1.91 12.83 14.18 11.06
Christian 8.71 8.82 8.58 5.06 5.19 4.92 14.29 14.64 13.92
Sikh 6.94 6.90 7.00 2.61 2.90 2.21 15.92 15.53 16.39
Buddhist 5.70 7.05 3.79 3.51 4.77 1.60 8.51 10.15 6.37
Source: Calculated from the Census of India, 2001.
However, among the Sikh community, females with graduation and above are in a
higher proportion than their male counterparts, in the urban areas. As is the scenario in
the all-India context, the rural areas have a lower proportion of graduates. In the urban
areas, among the notified minority communities, Sikh women have the highest
proportion of graduates.
7. Currently Enrolled Children (5-14 years)

As per the NSS 61st Round (2004-05), 82.49 per cent of the children in the age group of
5-14 years are currently enrolled in some school in India. The enrolment level in India is
higher for males (85.03 per cent) than for females (79.65 per cent), and for the urban
areas (88.7 per cent) than the rural areas (80.73 per cent). For the minority communities
under study, except for the Buddhist community, the pattern is similar. The Buddhist
community recorded a higher percentage of currently enrolled female children (92.44)
than male children (90.51). Also, the rural-urban differential is in favour of urban areas,
though it is miniscule. Another point that is to be mentioned is that unlike the national
pattern, the male-female and rural-urban gap for the currently enrolled children is lower
for these communities. Among these four minority communities, Sikhs recorded the
lowest enrolment (88.53 per cent) and the Parsis recorded universal enrolment.
Table 3.5: Percentage of Currently Enrolled Children (5-14) in the Notified Minority Communities, 2004-05
Total Rural Urban
Community Total Male Female Total Male Female Total Male Female
Christian 90.32 90.69 89.88 88.28 89.2 87.19 95.87 94.82 97.07
Sikh 88.53 89.18 87.71 87.88 88.92 86.53 91.85 90.57 93.27
Buddhist 91.46 90.51 92.44 91.26 89.44 93.53 91.91 93.86 90.59
Parsi 100 100 100 0 0 0 100 100 100
All India 82.49 85.03 79.65 80.73 83.86 77.19 88.7 89.25 88.11
Source: Calculated from Unit Level data, NSS, 61st Round, 2004-05
The percentage change in the number of currently enrolled children during the period
from 1999-2000 to 2004-05 for India is 9.49, and is more for females (11.25) than males
(7.92), and for the rural areas (10.89) than the urban areas (5.06). Among the notified
minority communities, the major improvement in the current enrolment can be witnessed
by the Buddhist communities (7.36). Sikhs on the other hand showed the lowest
improvement (4.65) in the number of currently enrolled children (5-14 years). It is also to
be noted here that the improvement in the number of currently enrolled children among
the Buddhist community is mainly in the rural areas, as the number of enrolled Buddhist
children (both male and female) in the urban areas has ironically witnessed a decline. A
decline in the currently enrolled children (5-14) can also be noticed among the Sikh male
children in the urban areas.
Table 3.6: Percentage Change of Currently Enrolled Children (5-14) among the Notified Minority Communities from 1999-00 to 2004-05
Community Total Rural Urban

Total Total Male Female Total Male Female Total Male Female
Christian 5.29 5.02 5.54 6.67 6.46 6.82 1.94 1.51 2.47
Sikh 4.65 4.87 4.33 5.73 6.48 4.73 1.62 -0.11 3.63
Buddhist 7.36 2.80 12.43 12.12 5.63 19.73 -2.33 -1.99 -1.87
Parsi 0.00 0.00 0.00 0.00 0.00 0.00 0.00 0.00 0.00
All India 9.49 7.92 11.25 10.89 9.21 12.75 5.06 3.80 6.48
Source: Calculated from Unit Level data, NSS, 55th (1999-2000) and 61
st Round (2004-05)
8. Currently Enrolled Children (15-29 years)
The enrolment level for the adolescent and youth (15-29 years) population has also
been calculated from the NSS 55th and 61st Round. In India as a whole, the enrolment
rate for the 15-29 years population is 21.33 per cent. The sex-wise and residence-wise
enrolment shows a similar pattern to that of the enrolment rate for children (5-14), where
the male enrolment is higher (25.30) than the female enrolment (17.12), and the
enrolment in the urban areas (28.70) is higher than that in rural areas (18.43). Among
the notified minority communities also, the pattern is similar, with the exception of the
Parsi community. The enrolment rate for the females particularly, is the highest among
this community.
Table 3.7: Percentage of Currently Enrolled Children (15-29) in the Notified Minority Communities, 2004-05
Total Rural Urban
Community Total Male Female Total Male Female Total Male Female
Christian 29.58 31.54 27.65 25.80 27.52 24.20 37.89 39.66 35.93
Sikh 24.28 25.75 22.71 20.56 22.06 19.05 37.39 37.12 37.75
Buddhist 28.35 30.83 25.58 23.37 25.84 20.64 37.03 39.33 34.38
Parsi 18.81 7.62 23.97 0.00 0.00 0.00 19.41 7.62 25.11
All India 21.33 25.30 17.12 18.43 23.02 13.73 28.70 30.79 26.29Source: Calculated from Unit Level data, NSS, 61
st Round, 2004-05
The percentage change of the number of currently enrolled adolescent and youth (15-29
years) is also calculated and shows a mass decline for India in general and for the
notified minority communities in particular. The Parsi community has shown a real
increase in the enrolment. Males among the Parsi communities have shown widespread
enrolment, which was as expected. What was noteworthy is the fact that there is an
increase in the level of enrolment among the Buddhist males. Given that Buddhists
constitute a largely Scheduled Caste population, this increase is a welcome sign of their
educational advancement.
Table 3.8: Percentage Change of Currently Enrolled Children (15-29) among the Notified Minority Communities during 1999-00 and 2004-05

Community Total Rural Urban
Total Total Male Female Total Male Female Total Male Female
Christian -1.63 -1.66 -1.52 -2.95 -3.80 -2.18 0.07 2.52 -1.85
Sikh -2.36 -1.58 -3.22 -2.55 -0.94 -4.33 -2.71 -3.42 -1.93
Buddhist 2.04 8.51 -5.09 1.50 9.48 -6.51 3.30 6.53 -1.08
Parsi 19.44 38.13 8.40 100.00 0.00 0.00 16.93 34.14 7.27
All India -1.86 -1.14 -2.56 -2.28 -1.65 -2.92 -0.61 0.34 -1.57 Source: Calculated from Unit Level data, NSS, 55
th (1999-2000) and 61
st Round (2004-05)
9. Never Enrolled Children (5-14 Years)
As per the NSS 61st Round, 13.4 per cent of the total children in the age group of 5-14
years have never been enrolled in any school. Such children of the notified minority
communities (other than Muslims) are less than half of the national average for
Christians (6.3 per cent) and Buddhists (6.08 per cent), and little more than half (8.35
per cent) for Sikhs. Evidently, the pattern of the number of never enrolled children for
males and females and for rural and urban areas is opposite to the pattern observed for
the currently enrolled children. In other words, more female children are never enrolled
in comparison to the male children, and more rural children are never enrolled than the
urban children. The only exception is the case of the Buddhist community, where more
male children are never enrolled than females, and also the urban children who have
never enrolled are in a greater proportion than their rural counterparts.
Table 3.9: Percentage of Never Enrolled Children (5-14) in the Notified Minority Communities, 2004-05
Total Rural Urban
Community Total Male Female Total Male Female Total Male Female
Christian 6.3 5.47 7.27 7.7 6.36 9.29 2.49 3.01 1.89
Sikh 8.35 7.95 8.86 8.98 8.45 9.65 5.19 5.23 5.16
Buddhist 6.08 7.09 5.04 5.99 8.3 3.12 6.28 3.31 8.28
Parsi 0.00 0.00 0.00 0.00 0.00 0.00 0.00 0.00 0.00
All India 13.4 11.69 15.31 15 12.91 17.36 7.76 7.32 8.24
Source: Calculated from Unit Level data, NSS, 61st Round, 2004-05
The percentage change in the number of never enrolled children (5-14
years) during the 55th and 61st round of NSS is also calculated, to observe the trend in children joining school during the period, and also thereby to see the decline in the number of never enrolled children. There has been a decline by 9.44 per cent in the number of never enrolled children during the
last five years for India’s total children in the age group of 5-14 years. Among the Buddist community, this decline is of 5.57 per cent, for
Christians it is 5.12 per cent and for Sikhs it is the lowest at 3.92 per cent. For all religious communities combined together, the percentage of never enrolled children has declined by more for the females (11.56) than males
(7.55), and in the rural areas (10.91) than the urban areas (4.75). A decline in

the percentage of never enrolled children in rural areas in comparison to the urban areas can also be observed for all the minority communities
under study. However, the sex-wise percentage change in the number of never enrolled children among the minority communities does not produce a uniform pattern. Buddhists have recorded a decline of 9.41 per cent for females and 2.09 per cent for males, whereas Christians and Sikhs have
recorded a greater decline for its male children than female children.
Table 3.10: Percentage Change of Never Enrolled Children (5-14) among the Notified Minority Communities during 1999-00 and 2004-05
Community Total Rural Urban
Total Total Male Female Total Male Female Total Male Female
Christian -5.12 -5.24 -4.92 -6.68 -6.84 -6.37 -1.25 -1.21 -1.33
Sikh -3.92 -4.14 -3.63 -4.46 -4.71 -4.10 -2.86 -3.22 -2.38
Buddhist -5.57 -2.09 -9.41 -9.64 -4.16 -16.12 2.77 0.98 3.47
Parsi 0.00 0.00 0.00 0.00 0.00 0.00 0.00 0.00 0.00
All India -9.44 -7.55 -11.56 -10.91 -8.73 -13.34 -4.75 -3.78 -5.83
Source: Calculated from Unit Level data, NSS, 55th (1999-2000) and 61
st Round (2004-05)
10. Never Enrolled Children (15-29 years)
In the age-group of 15-29 years, the never enrolled population is as high as 21.52 per cent for India. For Sikhs, it is 15.98 per cent, which is the highest among the four communities under study. Christians account for 10.57 per
cent of such population. The lowest percentage of never enrolled population (15-29 years) is in the Buddhist community (7.71). As may be
expected, there are more females in the never enrolled category than males, and more in the rural areas than in the urban areas. This is a general pattern that can be seen for all the religions combined together as well as
the four minority communities under study.
Table 3.11: Percentage of Never Enrolled Children (15-29 yrs) in the Notified Minority Communities, 2004-05
Total Rural Urban Community
Total Male Female Total Male Female Total Male Female
Christian 10.57 8.52 12.58 13.46 10.98 15.78 4.21 3.58 4.91
Sikh 15.98 13.31 18.86 18.93 15.62 22.28 5.59 6.19 4.76
Buddhist 7.71 7.39 8.07 9.59 9.37 9.84 4.42 4.00 4.91
Parsi 5.50 0.00 8.03 - - - 2.48 0.00 3.68
All India 21.52 14.63 28.83 25.78 17.41 34.36 10.67 7.92 13.84
Source: Calculated from Unit Level data, NSS, 61st Round, 2004-05
The percentage change in the never enrolled population (15-29 years) during the 55th
Round and the 61st Round of the NSS indicates a similar sex-wise and residence-wise
pattern, where there has been a greater decline in the never enrolled population for
females and for the rural areas.

Table 3.12: Percentage Change of Never Enrolled Children (15-29 yrs) among the Notified Minority Communities during 1999-00 and 2004-05
Community Total Rural Urban
Total Total Male Female Total Male Female Total Male Female
Christian -6.73 -6.08 -7.26 -8.88 -8.16 -9.62 -3.20 -2.00 -4.20
Sikh -9.88 -8.37 -11.54 -11.30 -9.75 -13.11 -6.00 -3.95 -8.50
Buddhist -10.74 -3.78 -18.45 -16.31 -7.03 -25.82 -0.63 1.34 -3.20
Parsi 0.78 0.00 -0.38 100.00 0.00 0.00 -2.38 0.00 -4.73
All India -9.90 -7.54 -12.27 -11.19 -8.32 -14.10 -6.32 -5.35 -7.28
Source: Calculated from Unit Level data, NSS, 55th (1999-2000) and 61
st Round (2004-05)
The maximum change can be seen in the Buddhist population (10.74 per cent) where
there has been a remarkable decline in the never enrolled female population (25.82 per
cent) in the rural areas during the last five years.
11. Dropout Children (5-14 years)
There are 4.11 per cent of the children in India in the age-group of 5-14 years who have not completed their schooling and are dropouts. For all the
four minority communities, the dropouts are lower in proportion than the national figure. Christians have the highest dropout rate (3.38 per cent)
whereas Sikhs have a rate of 3.12 per cent and Buddhists of 2.46 per cent. The dropout rate is higher for females than males, and it is also higher in the rural areas in comparison to the urban areas. The only exception is in the case of the Christian community, where there are more male dropouts
in comparison to the females.
Table 3.13: Percentage of Dropout Children (5-14) in the Notified Minority Communities, 2004-05
Total Rural Urban
Communities Total Male Female Total Male Female Total Male Female
Christians 3.38 3.84 2.85 4.02 4.44 3.52 1.64 2.17 1.04
Sikh 3.12 2.87 3.42 3.15 2.63 3.82 2.96 4.21 1.57
Buddhist 2.46 2.4 2.52 2.75 2.26 3.35 1.81 2.83 1.12
Parsi 0 0 0 0 0 0 0 0 0
All India 4.11 3.28 5.05 4.27 3.23 5.45 3.54 3.43 3.65
Source: Calculated from Unit Level data, NSS, 61st Round, 2004-05
The percentage change in the dropout rate during the last five years has also been calculated. A major decline in the dropout rate can be witnessed
in the case of the Table 3.14: Percentage Change of Dropout Children (5-14) among the Notified Minority
Communities during 1999-00 and 2004-05
Community Total Rural Urban

Total Total Male Female Total Male Female Total Male Female
Christian -0.17 0.22 -0.62 0.01 0.38 -0.44 -0.69 -0.30 -1.14
Sikh -0.72 -0.73 -0.69 -1.27 -1.77 -0.63 1.24 3.33 -1.24
Buddhist -1.79 -0.71 -3.02 -2.49 -1.47 -3.61 -0.44 1.01 -1.60
Parsi 0.00 0.00 0.00 0.00 0.00 0.00 0.00 0.00 0.00
All India -0.05 -0.38 0.31 0.02 -0.48 0.59 -0.31 -0.02 -0.64
Source: Calculated from Unit Level data, NSS, 55th (1999-2000) and 61
st Round (2004-05)
Buddhist children (1.79). In the case of all the other minority communities, the decline is minimal.
12. Out of School Children (5-14 years)
Out of school children refer to the sum of the never enrolled children and the dropouts.
This indicates the total number of the children who are not part of any educational
system at a point of time. Figure 3.4 represents the percentage of out of school children
by sex and residence. Evidently, the percentage of the out of school children is lower for
all the notified minority communities in comparison to the national average. Among the
four notified minority communities, Sikhs have the highest proportion of out of school
children (11.47 per cent). The proportion of females out of school is more than males,
except for the Buddhist community where the percentage is more in the case of the male
children in the rural areas. Further, in the rural areas, more children are found to be out
of school in comparison to the urban areas. This is invariably true for all the minority
communities as well.
Fig 3.4: Percentage of Out of School Children (5-14 years) in the Notified Minority
Communities (Other than Muslims), 2004-05
9.6
8
9.3
1
10.1
2 11.7
2
10.8
0 12.8
1
4.1
3 5.1
8
2.9
3
11.4
7
10.8
2 12.2
9
12.1
2
11.0
8
13.4
7
8.1
5 9.4
3
6.7
3
8.5
4 9.4
9
7.5
6 8.7
4
10.5
6
6.4
7 8.0
9
6.1
4
9.4
1
0.0
0
0.0
0
0.0
0
0.0
0
0.0
0
0.0
0
0.0
0
0.0
0
0.0
0
17.5
1
14.9
7
20.3
5
19.2
7
16.1
4
22.8
1
11.3
0
10.7
5
11.8
9
0
5
10
15
20
25
Persons Male Female Persons Male Female Persons Male Female
Total Rural Urban
Minority Communities
Perc
enta
ge
Christians Sikh Buddhist Parsi All India

Source: NSSO, 61st Round
Table 3.15: Percentage Change of Out of School Children (5-14) among the Notified Minority Communities during 1999-00 and 2004-05
Total Rural Urban Community Persons Male Female Persons Male Female Persons Male Female
Christian -5.29 -5.02 -5.54 -6.67 -6.46 -6.82 -1.94 -1.51 -2.47
Sikh -4.65 -4.87 -4.33 -5.73 -6.48 -4.73 -1.62 0.11 -3.63
Buddhist -7.36 -2.80 -12.43 -12.12 -5.63 -19.73 2.33 1.99 1.87
Parsi 0.00 0.00 0.00 0.00 0.00 0.00 0.00 0.00 0.00
All India -9.49 -7.92 -11.25 -10.89 -9.21 -12.75 -5.06 -3.80 -6.48
Source: Calculated from Unit Level data, NSS, 55th (1999-2000) and 61
st Round (2004-05)
The percentage change in the dropout rates during the period from 1999-00 to 2004-05
shows a decline in the out of school children, and indicates more children joining school.
More Buddhist children have joined school in comparison to the Christians and Sikhs. A
major improvement among Buddhists can be seen for the girl child, particularly the one
residing in the rural areas. Among the Sikh community, the improvement can be seen
more in the case of the male children in comparison to the female children. There has
been a modest decline in the proportion of out of school children in the urban areas for
all the communities.

Chapter Chapter Chapter Chapter ---- IVIVIVIV
HEALTH ATTAINMENTHEALTH ATTAINMENTHEALTH ATTAINMENTHEALTH ATTAINMENT
This chapter provides a profile of the health and nutrition situation of the three notified
minority communities (NMCs), since the NFHS does not provide any information for
Parsis. The issues covered here include the three indicators of nutritional status –
underweight, stunting and wasting; mortality status; anaemia among children, women
and men; immunization; fertility rates, maternal health, practice of contraception use;
preference for sons and teenage pregnancies.
1. Nutritional Status
The nutritional status is a major component determining the health and well-being of
children. However, inadequate nutrition is a common problem in India. The nutritional
status is usually measured with the help of three indicators: 1) weight for age
(underweight), 2) height for age (stunting) and 3) weight for height (wasting). The
percentage of underweight children has decreased from 47 per cent in 1998-99 to 42.5
per cent in 2005-06 for the country as a whole. The incidence of underweight children is
substantially higher among Buddhists (39.2 per cent), followed by Christians (29.7 per
cent), while it is lower among Sikhs (22 per cent). Over time, the percentage of children
who are underweight has been declining (see Table 4.1 and Fig. 4.1) across all the 3
NMCs.
Table 4.1: Nutritional Status of Children among the Notified Minority Communities
Weight for age (Underweight)
Height for age (Stunting)
Weight for height (Wasting) Community
Percentage age
below -2 SD * Percentage age
below -2 SD * Percentage age
below -2 SD *
NFHS 3
Christian 29.7 39 15.5
Sikh 22 29.8 11
Buddhist/Neo-Buddhist 39.2 56.1 21
Total 42.5 48 19.8
NFHS 2
Christian 30.8 30.6 13.4
Sikh 26.8 35.4 7
Buddhist/Neo-Buddhist 43.7 32.5 11.9
Total 47 45.5 15.5 Source: NFHS 2, NFHS 3

The percentage of stunted and wasted children has increased over the same time
period. The percentage of stunted children has increased across all communities except
the Sikhs, where the percentage has declined from 35.4 per cent to 29.8 per cent. (See
Fig. 4.2.) Buddhists have experienced the maximum increase in terms of stunted
children from 33 per cent in 1998-99 to 56 per cent in 2005-06. The percentage of
wasted children has also increased across all communities. Here too the Buddhists, who
are largely from the Scheduled Caste and economically poor category, report the worst
levels of wasting among children (see Fig. 4.3).
Fig 4.1: Percentage of Underweight Children (Weight-for-Age) among the Notified
Minority Communities
0
5
10
15
20
25
30
35
40
45
50
Christian Sikh Buddhist/Neo-Buddhist Total
Communities
% C
hil
dre
n
NFHS 2 NFHS 3
Source: NFHS 2 and NFHS 3
Fig 4.2: Percentage of Stunted Children (Height-for-Age) among the Notified Minority
Communities
0
10
20
30
40
50
60
Christian Sikh Buddhist/Neo-Buddhist TotalCommunities
% C
hild
ren
NFHS 2 NFHS 3
Source: NFHS 2 and NFHS 3

Fig 4.3: Percentage of Wasting Children (Weight-for-Height) among Notified Minority
Communities
0
5
10
15
20
25
Christian Sikh Buddhist/Neo-Buddhist Total
Communities
% C
hild
ren
NFHS 2 NFHS 3
Source: NFHS 2 and NFHS 3
Overall, the comparative nutritional status of children belonging to the Christian, Sikh
and Buddhist minority communities also reveal the status of Buddhist infants to be the
worst. In all the three nutritional indicators - stunting, wasting and underweight measured
by height for age, weight for height and weight for age respectively – children belonging
to Buddhist households report higher percentages below the set standards, followed by
Christian households.
2. Mortality Rates
Infant and child mortality rates are one of the most important health indicators which
reflect the country’s level of socio–economic conditions and the quality of life of the
population. In India, the infant mortality rate has reduced from 73 per 1000 live births in
1998-99, to 57 per 1000 live births in 2005-06. The child mortality rate has also declined
steadily from 30.6 to 18.4 over the same time period. The picture is the same for the
neonatal mortality rate, post-neonatal rate, as well as the under-5 child mortality rates.
However, a comparison across religious communities shows mixed results. (See Table
4.2. and Fig. 4.4.) In the case of the neonatal mortality rate, all religious communities
have experienced a steady fall except for Buddhists, for whom the rate has gone up from
39.5 per 1000 live births in 1998-99 to 43 per 1000 live births in 2005-06. The scenario is
the same for the child mortality rate as well as the under-five mortality rates. For the
child mortality rate, the figure for Buddhists has increased from 14.1 to 17.1, and in case
of the under-five mortality rate, the rate has risen to 69 per 1000 live births, from 66.9
per 1000 live births. (See Fig. 4.5).

Table 4.2: Early Childhood Mortality Rates among the Notified Minority Communities (lives per 1000 births)
Community Neonatal Mortality
Post neonatal Mortality
Infant Mortality
Child Mortality
Under Five Mortality
NFHS 3
Christian 31.5 10.1 41.7 11.6 52.8
Sikh 35.9 9.7 45.6 6.8 52.1
Buddhist/ Neo-Buddhist 43 9.8 52.8 17.1 69
Total 39 18 57 18.4 74.3
NFHS 2
Christian 29.8 19.4 49.2 19.7 68
Sikh 38 15.3 53.3 12.3 64.9 Buddhist/ Neo-Buddhist 39.5 14 53.6 14.1 66.9
Total 47.7 25.3 73 30.6 101.4
Source: NFHS 2 and NFHS 3
Fig 4.4: Child Mortality among the Notified Minority Communities (Other than Muslims)
0
20
40
60
80
100
120
NFHS-2 NFHS-3 NFHS-2 NFHS-3 NFHS-2 NFHS-3 NFHS-2 NFHS-3 NFHS-2 NFHS-3
Neonatal Mortality(NN) Postneonatal
mortality(PNN)
Infant mortality Child Mortality Under 5 mortality
Child Mortality Types
% C
hild
ren
Christian Sikh Buddhist/Neo-Buddhist Total
Source: NFHS 2 and NFHS 3

Fig 4.5: Child Mortality among the Buddhist Community
0
10
20
30
40
50
60
70
80
Neonatal Mortality(NN) Child Mortality Under 5 mortality
Child Mortality Indicators
% C
hil
dre
n
NFHS-2 NFHS-3
Source: NFHS 2 and NFHS 3
The early childhood mortality indicators provided by NFHS reveal the relative survival
status of children across different minority communities. While the status over time is
improving in the case of most of the mortality indicators in the country, the Buddhists
(including neo-Buddhists) have recorded a very poor performance – in fact alarmingly
recording increases in the childhood mortality rates (See Fig 4.5).
Needless to state, the Buddhist community (a large bulk of whom belong to the
Scheduled Castes) have the worst health indicators as noted by the mortality rates,
when compared across the four notified minority communities.
3. Prevalence of Anaemia
The prevalence of anaemia in India is widespread. Women and children especially are
among the worst affected. Anaemia has detrimental effects on the health of bth the
women and children. It may hamper the normal mental and physical growth of children
and can also increase the risk of premature delivery, maternal mortality and prenatal
mortality.
According to the NFHS-3, around 70 per cent of children in India are suffering from
anaemia. Though the figure has declined over time from 74.2 in 1998-99 to 69.5 in 2005-
06, its significantly high level is still a cause of concern. The NFHS-3 reports that the
incidence of severe anaemia is the highest among Sikh children (5.7 per cent). (See Fig.
4.6.) Over the two NFHS rounds, this incidence remains the same. The Christian
children report an incidence of severe anaemia among 1.9 per cent of the children in
2005-6, a decline from the 3.3 per cent in 1998-99. The improvement among Buddhist

children is significant – from 3.5 in 1998-99 to a negligible 0.2 per cent in 2005-06. The
mother’s anaemic status has a strong correlation with anaemic status of the children.
Data reveals that a child is more likely suffer from anaemia if its mother is also anaemic
(see Table 4.3).
Fig 4.6: Incidence of Anemia among Children in the Minority communties
(Other than Muslims)
0
10
20
30
40
50
60
70
80
90
NFHS-2 NFHS-3 NFHS-2 NFHS-3 NFHS-2 NFHS-3 NFHS-2 NFHS-3
Mild Moderate Severe Any type of Anaemia
Anemia Types
% C
hil
dre
n
Christian Sikh Buddhist/Neo-Buddhist Total
Source: NFHS 2 and NFHS 3
Fig 4.7: Incidence of Anemia among Women in the Notified Minority Communities (Other than
Muslims)
0
10
20
30
40
50
60
NFHS-2 NFHS-3 NFHS-2 NFHS-3 NFHS-2 NFHS-3 NFHS-2 NFHS-3
Mild Moderate Severe Any type of Anaemia
Anemia Types
% W
om
en
Christian Sikh Buddhist/Neo-Buddhist Total
a
Source: NFHS 2 and NFHS 3
Table 4.3: Anaemia Status of the Children in Notified Minority Communities

Source:
NFHS-2 and
NFHS-3
The prevalence of anaemia among women is also quite high in India; 55.3 per cent of
women have been suffering from some type of anaemia. (See Fig. 4.7). The percentage
of women suffering from any type of anaemia has been dropping across all communities
except the Buddhists, where the percentage has actually increased from 48.5 per cent in
1998-99 to 52.5 per cent in 2005-06 (see Table 4.4). The incidence of severe anaemia is
the highest among Christian women with 2.2 per cent, followed by the Buddhist women
at 1.9, and it is the lowest among Sikh women (1.3 per cent).
Percentage of children with
Community Mild
Moderate
Severe
Any form of anaemia
NFHS 3
Christian 25.6 32.5 1.9 60
Sikh 22.3 35.9 5.7 63.8 Buddhist/ Neo-Buddhist 15.9 49.9 0.2 66
Mother's Anaemia Status
Not anaemic 26.8 33.1 1.6 61.5
Mildly anaemic 27.3 43 2.7 73
Moderately anaemic 23.2 50 5.6 78.8
Severely anaemic 21.6 49.7 10.5 81.9
Total 26.3 40.2 2.9 69.5
NFHS 2
Christian 23.7 34.1 3.3 61.1
Sikh 18 52.8 5.7 76.5
Buddhist/ Neo-Buddhist 27.9 41.9 3.5 73.3
Mother's Anaemia Status
Not anaemic 23.2 40.7 3.9 67.8
Mildly anaemic 23.4 48.4 5.1 76.9
Moderately anaemic 21.6 55.5 8.5 85.6
Severely anaemic 18 45.3 23.6 86.9
Total 22.9 45.9 5.4 74.2

Table 4.4: Prevalence of Anaemia among Women in the Notified Minority Communities
Percentage of women with
Community Mild
Moderate
Severe
Any Type of
Anaemia
NFHS 3
Christian 32 16.2 2.2 50.3
Sikh 27.6 10.3 1.3 39.2 Buddhist/ Neo-Buddhist 35.4 15.2 1.9 52.5
Total 38.6 15 1.8 55.3
NFHS 2
Christian 30.7 14.4 2 47.1
Sikh 26.6 11.8 1.2 39.6
Buddhist/ Neo-Buddhist 30.1 15.3 3.1 48.5
Total 35 14.8 1.9 51.7
Source: NFHS 2 and NFHS 3
The incidence of anaemia across men is generally lower (25 per cent) than that of
children and women. This is as expected, since they are viewed by and large as the
breadwinners and primary income earners of the household, thus being given priority as
well as preference in consumption. While Sikh men have the lowest prevalence of any
anaemia, the Christian and Buddhist men seem to suffer from a relatively higher
incidence of anaemia (see Table 4.5).
Table 4.5: Prevalence of Anaemia among Men in the Notified Minority Communities (2005-06)
Percentage of men with
Community
Mild
Moderate
Severe
Any Type of Anaemia
Christian 10.5 9.6 1 21.1
Sikh 8.1 7 0.8 15.9 Buddhist/Neo-Buddhist 11.5 9.4 0.3 21.2
Total age 15-54 13.1 10.2 1.4 24.7
Source: NFHS 3
It may be noteworthy that the Sikh community reports higher levels of severe anaemia
among children – which has remained at the same level over the two NFHS rounds – at
nearly 6 per cent. The women belonging to both Buddhist and Christian households
report higher anaemia levels, compared to the Sikh women. Therefore, while the
anaemia noted among Sikh children may still be derived from the mother’s anaemia
levels, this factor cannot be the major cause. It is probably due much more to a factor of

overall deprivation among some of these Sikh households, which leads to anaemia
among men, women and children, albeit with varying degrees. Even the Sikh men, who
are otherwise much better off compared to their womenfolk, report similar levels of
severe anaemia among men and women, 0.8 and 0.9 per cent respectively.
4. IMMUNIZATION
The vaccination of children against six serious but preventable diseases (tuberculosis,
diphtheria, pertussis, tetanus, poliomyelitis and measles) has received the maximum
attention in child health care programmes in India. The percentage of children who were
vaccinated against all the diseases has increased by only 1.5 percentage point over the
time period from 1998-99 to 2004-05. Across the minority communities however, the
percentage of children vaccinated has declined for the Buddhists, Christians and Sikhs.
(See Table 4.6 and Fig 4.8.) In 2005-06, 67.3 per cent Sikh children were completely
vaccinated, and. a little over one half of both Christian and Buddhist children were
immunized with all the vaccinations.
Table 4.6: Immunization among Children in the Notified Minority Communities
Community % of Children with All Vaccinations
No Vaccination
NFHS 3
Christian 56.3 9.4
Sikh 67.3 6.6
Buddhist/ Neo-Buddhist 50.9 0.7
Total 43.5 5.1
NFHS 2
Christian 61.1 11
Sikh 69.5 11.1 Buddhist/ Neo-Buddhist 73 1.1
Total 42 14.4
Source: NFHS-2 and NFHS-3
The percentage of children having no vaccinations has declined by 9 percentage points
over the two NFHS rounds – from 14.4 per cent to 5.1 per cent. (See Fig. 4.8.) The
proportion of children who have not received any vaccinations among Christians was 9.4
per cent, while it was 6.6 per cent for Sikh children and a little less than one per cent for
the Buddhist children. What is worrisome however, is the worsening in immunization
Situation, with the proportion of children who have received all vaccinations among all
the three notified minorities actually declining.

Fig 4.8: Immunization of the Children among the Notified Minority Communities
0
10
20
30
40
50
60
70
80
NFHS 2 NFHS 3 NFHS 2 NFHS 3
all vacination no vaccination
Vaccination
% C
hil
dre
n
Christian Sikh Buddhist/Neo-Buddhist Total
Source: NFHS 2 and NFHS 3
5. SON PREFERENCE There has always been a strong preference in India for male children. The NFHS 3
reports that both men and women have a strong preference for sons over daughters.
Twenty-two per cent of the women want more sons than daughters, while only 3 per cent
want more daughters than sons. (See Table 4.7.) Similarly, twenty percent of the men
want more sons than daughters, but only 2 per cent want more daughters than sons.
This pattern holds across all communities.
Table 4.7: Son Preference in the Notified Minority Communities
Source: NFHS 3
Mean number of
Community Sons Daughters
Either Sex
% wanting more sons than daughters
% wanting more daughters than sons
% wanting at least one son
% wanting at least one daughter
Women
Christian 1 0.9 0.5 13 6 72.4 71.4
Sikh 0.9 0.7 0.4 18 1.4 74.5 67.3
Buddhist/Neo-Buddhist 1 0.8 0.2 17.2 3.6 83.5 77.2
Total 1.1 0.8 0.4 22.4 2.6 77.4 74
Men
Christian 0.9 0.8 0.7 15.2 4.8 65 61.3
Sikh 0.7 0.5 0.7 14.9 1.4 55.4 47.6
Buddhist/Neo-Buddhist 0.8 0.7 0.5 13.1 2.6 68.4 64.6
Total age 15-54 1 0.7 0.6 20.4 2 70.2 65.4
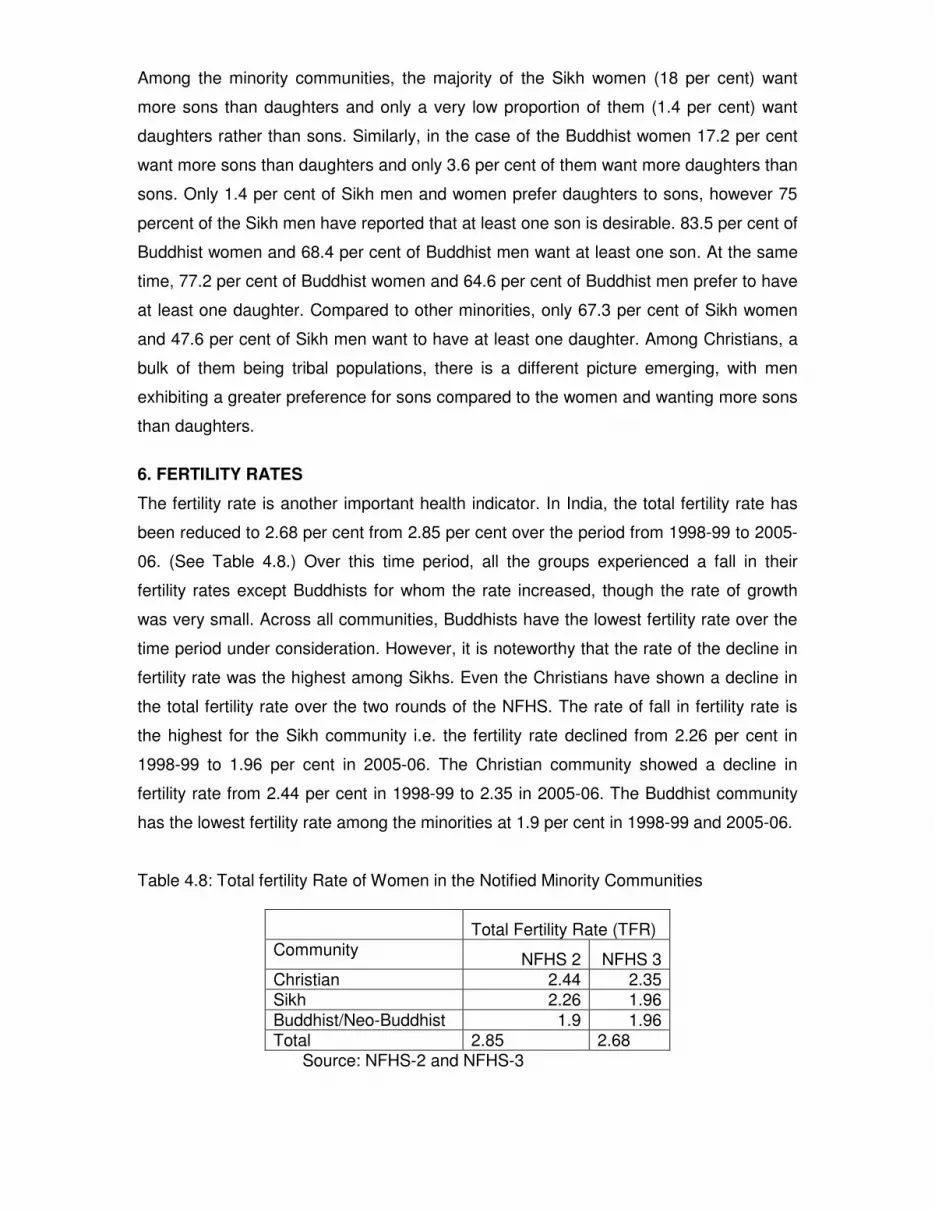
Among the minority communities, the majority of the Sikh women (18 per cent) want
more sons than daughters and only a very low proportion of them (1.4 per cent) want
daughters rather than sons. Similarly, in the case of the Buddhist women 17.2 per cent
want more sons than daughters and only 3.6 per cent of them want more daughters than
sons. Only 1.4 per cent of Sikh men and women prefer daughters to sons, however 75
percent of the Sikh men have reported that at least one son is desirable. 83.5 per cent of
Buddhist women and 68.4 per cent of Buddhist men want at least one son. At the same
time, 77.2 per cent of Buddhist women and 64.6 per cent of Buddhist men prefer to have
at least one daughter. Compared to other minorities, only 67.3 per cent of Sikh women
and 47.6 per cent of Sikh men want to have at least one daughter. Among Christians, a
bulk of them being tribal populations, there is a different picture emerging, with men
exhibiting a greater preference for sons compared to the women and wanting more sons
than daughters.
6. FERTILITY RATES
The fertility rate is another important health indicator. In India, the total fertility rate has
been reduced to 2.68 per cent from 2.85 per cent over the period from 1998-99 to 2005-
06. (See Table 4.8.) Over this time period, all the groups experienced a fall in their
fertility rates except Buddhists for whom the rate increased, though the rate of growth
was very small. Across all communities, Buddhists have the lowest fertility rate over the
time period under consideration. However, it is noteworthy that the rate of the decline in
fertility rate was the highest among Sikhs. Even the Christians have shown a decline in
the total fertility rate over the two rounds of the NFHS. The rate of fall in fertility rate is
the highest for the Sikh community i.e. the fertility rate declined from 2.26 per cent in
1998-99 to 1.96 per cent in 2005-06. The Christian community showed a decline in
fertility rate from 2.44 per cent in 1998-99 to 2.35 in 2005-06. The Buddhist community
has the lowest fertility rate among the minorities at 1.9 per cent in 1998-99 and 2005-06.
Table 4.8: Total fertility Rate of Women in the Notified Minority Communities
Total Fertility Rate (TFR)
Community NFHS 2 NFHS 3
Christian 2.44 2.35 Sikh 2.26 1.96
Buddhist/Neo-Buddhist 1.9 1.96 Total 2.85 2.68
Source: NFHS-2 and NFHS-3

7. CONTRACEPTION
Ignorance about family planning methods is a major obstacle to their use. The electronic
and print media has been playing a key role in promoting the family welfare program in
India. The NFHS 3 reports that almost 50 per cent of women saw family planning
messages on television, while 22 per cent of the women saw the messages in
newspapers. (See Table 4.9.). There has been a significant variation across the notified
minority communities, as Christian and Buddhist women have greater exposure to
television and newspaper.
Exposure to family planning messages is closely related with education. The NFHS 3
reports that illiterate women are less likely to see family planning messages whereas the
likelihood of seeing the message increases with more years of education. Among the
illiterate women, 25.1 per cent have reported that they had seen the message on
television, while 86.6 per cent of women with 12 years or more of education reported
seeing the message.
Table 4.9: Women’s Exposure to Family Planning Messages in the Notified Minority Communities (%)
Community Radio Television Newspaper or magazine
Wall paintings or hoarding
NFHS 3 Christian 33.9 54.1 34.4 38.1
Sikh 19.4 69 34.8 32.3 Buddhist/Neo-Buddhist 35.1 61.8 29.8 35.9 Total 32.8 49.5 22.2 26.7
NFHS 2
Christian 51.9 50.8 37.3 48 Sikh 34.4 75.6 28.3 39.3 Buddhist/Neo-Buddhist 38.2 55.9 24.8 43.3 Total 38.1 43.9 18.1 30.9
Source: NFHS 2, NFHS 3 The NFHS-3 reports that about 56.3 per cent currently married women have used
contraceptives, a rise from 48.2 per cent in 1998-99. (See Table 4.10.) The percentage
varies widely across the minority groups. The proportion of people using contraceptives
is highest among Buddhists (68 per cent) and Sikhs (67 per cent), while Christian

women (58 per cent) have the lowest proportion. The NFHS 3 reports that among
various methods used,, the method of female sterilization is the highest among
Buddhists (54 per cent), while it is the lowest among Sikhs (31 per cent). (See Table
4.11 and Fig. 4.9.) Male sterilization as a method of contraception is rare across all
groups except Buddhists (4.5 per cent). The use of condoms or Nirodh is quite high
among Sikhs (16 per cent) compared to other communities. A similar trend is found in
the case of IUDs where usage among Sikhs is the highest.
Table 4.10: Current Use of Contraception by Women of the Notified Minority Communities (%)
Community
Any Method Any Modern Method
Any Traditional Method
No method Currently Used
NFHS 3
Christian 57.6 48.9 8.8 42.4
Sikh 66.5 58.4 8.1 33.5
Buddhist/Neo-Buddhist 67.7 64.7 3 32.3
Total 56.3 48.5 7.8 43.7
NFHS 2
Christian 52.4 44.9 7.1 47.6
Sikh 65.2 54.7 10.1 34.8
Buddhist/Neo-Buddhist 64.7 63.9 0.8 35.3
Total 48.2 42.8 5 51.8
Source: NFHS 2, NFHS 3
Table 4.11: Usage of Various Methods of Contraception in the Notified Minority Communities (%)
Community Female Sterilization
Male Sterilization Pill IUD Injectables
Condom /Nirodh
NFHS 3
Christian 40.7 0.7 1.4 2.4 0.1 3.6
Sikh 31.4 0.8 2.6 7.9 0.1 15.8
Buddhist/Neo-Buddhist 54.1 4.5 1.6 0.7 0.1 3.7
Other 14.2 0.4 4 0.6 0.1 1.8
Source: NFHS 3
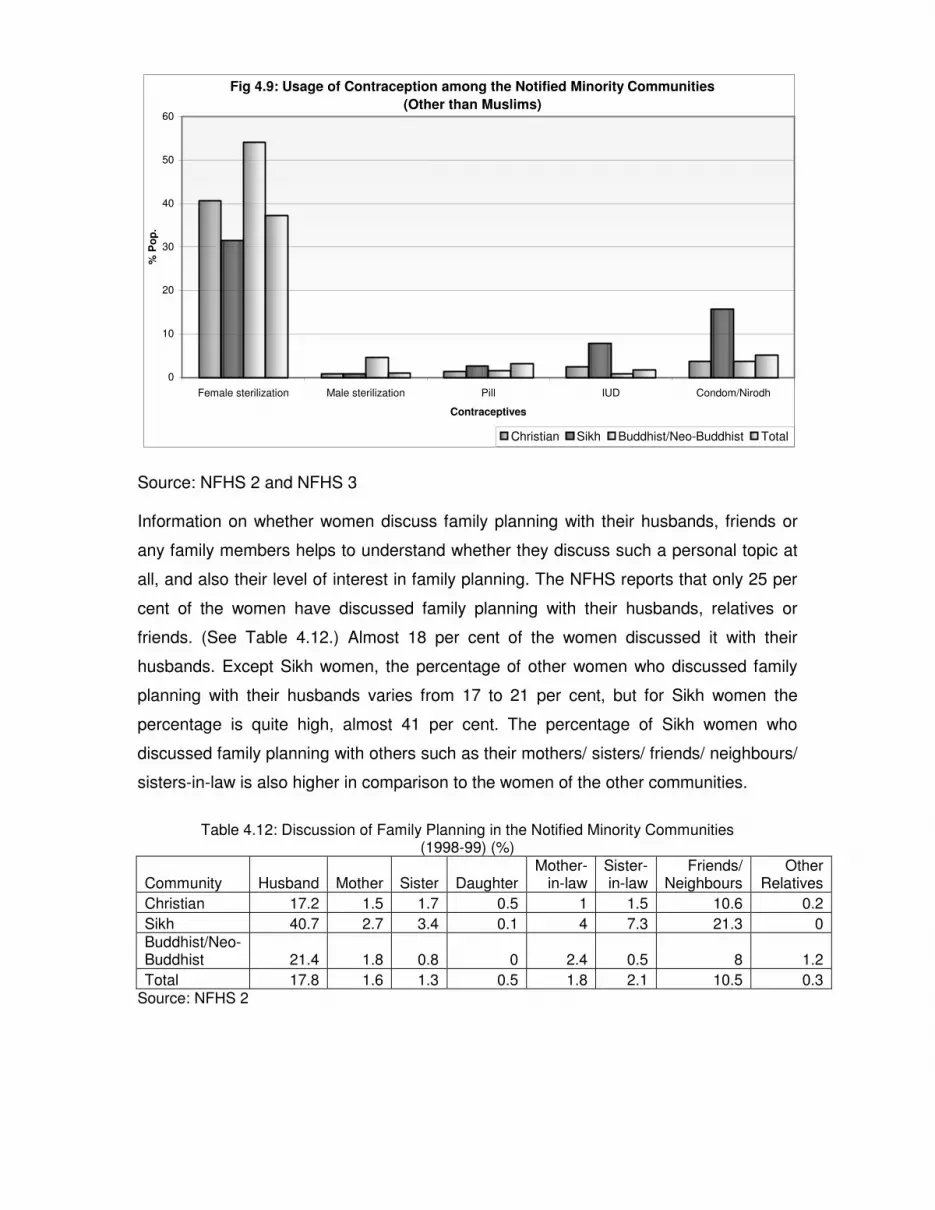
Fig 4.9: Usage of Contraception among the Notified Minority Communities
(Other than Muslims)
0
10
20
30
40
50
60
Female sterilization Male sterilization Pill IUD Condom/Nirodh
Contraceptives
% P
op
.
Christian Sikh Buddhist/Neo-Buddhist Total
Source: NFHS 2 and NFHS 3 Information on whether women discuss family planning with their husbands, friends or
any family members helps to understand whether they discuss such a personal topic at
all, and also their level of interest in family planning. The NFHS reports that only 25 per
cent of the women have discussed family planning with their husbands, relatives or
friends. (See Table 4.12.) Almost 18 per cent of the women discussed it with their
husbands. Except Sikh women, the percentage of other women who discussed family
planning with their husbands varies from 17 to 21 per cent, but for Sikh women the
percentage is quite high, almost 41 per cent. The percentage of Sikh women who
discussed family planning with others such as their mothers/ sisters/ friends/ neighbours/
sisters-in-law is also higher in comparison to the women of the other communities.
Table 4.12: Discussion of Family Planning in the Notified Minority Communities
(1998-99) (%)
Community Husband Mother Sister Daughter Mother-
in-law Sister-in-law
Friends/ Neighbours
Other Relatives
Christian 17.2 1.5 1.7 0.5 1 1.5 10.6 0.2
Sikh 40.7 2.7 3.4 0.1 4 7.3 21.3 0 Buddhist/Neo-Buddhist 21.4 1.8 0.8 0 2.4 0.5 8 1.2
Total 17.8 1.6 1.3 0.5 1.8 2.1 10.5 0.3 Source: NFHS 2

8. MATERNAL HEALTH
Maternal health care is one of the important indicators of a country’s social and
economic development. In India, an immense thrust was given to delivery care, which
ensures child deliveries under proper hygienic conditions. Though non–institutional
deliveries have decreased from 66.4 per cent in 1998-99 to 61 per cent in 2005-06, the
percentage is still high. (See Table 4.13.) A comparison across communities reveals that
all the religious communities, except Christians, experienced a fall in the percentage of
non-institutional deliveries. The percentage of non-institutional deliveries for Christians
has increased by one percentage point from 45.2 in 1998-99 to 46.5 per cent in 2005-06.
The use of the public sector is the maximum among Buddhists (37.2 per cent) and
lowest among Sikhs (15 per cent). All the three notified minority communities -
Christians, Sikhs and Buddhists - report relatively higher non-institutional deliveries
(46.5, 41.6, and 41.2 per cent respectively).
Table 4.13: Place of Delivery in the Notified Minority Communities (%)
Community Public sector NGO/ trust Private sector Non Institution
NFHS 3
Christian 23.6 0.9 28.9 46.5
Sikh 15.1 1.2 42 41.6 Buddhist/Neo-Buddhist 37.2 0.2 21.3 41.2
Total 18 0.4 20.2 61 NFHS 2
Christian 19.8 2.6 32 45.2
Sikh 10.8 0.9 35.3 52.7 Buddhist/Neo-Buddhist 38.9 0 16.3 44.5
Total 16.2 0.7 16.7 66.4 Source: NFHS 2, NFHS 3
Assistance during delivery is also a crucial indicator when we talk about delivery care.
The NFHS 3 reports that only 46.6 per cent of births were attended by a health
professional, including 35 per cent by doctors and 10.3 per cent by ANMs ,nurses,
midwives or LHVs. (See Table 4.14.)This percentage has risen by four percentage
points from 42.3 per cent in 1998-99 to 46.6 per cent in 2005-06. This implies that more
than half of the births in the country are taking place without any health professional or
trained person present.. Across communities, Buddhist women (52.4 per cent) are the
most likely to be attended by a doctor or a skilled person (94.3 per cent).

Table 4.14: Assistance during Delivery (2005-06) (%)
Source: NFHS 3
Overall, the access to a skilled provider for assisting deliveries is reportedly better
among the 3 MNCs. The dependence on friends and relatives for assistance during
deliveries is higher among Buddhists and Christian women, while the Sikh women
mainly use the services of a trained basic attendant or an ANM/nurse/midwife/LHV.
9. TEENAGE PREGNANCIES
Marriage at an early age leads to teenage pregnancy and early motherhood, which has
detrimental effects on the health of both the mother and the baby. In India, 12 per cent of
women aged 15-19 years have become mothers, and 4 per cent of women aged 15-19
years are currently pregnant with their first child. (See Table 4.15.) This implies that one
in every six women aged 15-19 years has begun childbearing. The percentage of
women who have started childbearing increases exponentially with age, from 3 per cent
at age 15 to 36 per cent at age 19. Across communities, the level of teenage
motherhood and pregnancy is higher for Buddhists/Neo-Buddhists (11 per cent) followed
by Christians, and Sikhs with ,8 per cent and 6 per cent respectively.
Table 4.15: Teenage Pregnancies in the Notified Minority Communities
Percentage who Background Characteristics
Have had a live birth
Pregnant with first child
Have begun child bearing
Age
15 1.3 1.2 2.5 16 4.1 2.3 6.4 17 8.6 3.8 12.5
18 17.9 6.1 24 19 29.7 6.1 35.7 Community
Christian 5.9 2 7.8 Sikh 3.5 2.2 5.7
Buddhist/Neo-Buddhist 7.6 3 10.6
Community Doctor ANM/ nurse/ midwife/LHV
Other health personnel
Dai (TBA)
Other Friends /Relatives
Delivered by a skilled provider
NFHS 3
Christian 48.1 11.5 0.5 21.6 0 16.7 60.2
Sikh 50.2 23.6 1.6 24.1 0 0.5 75.4 Buddhist/Neo-Buddhist 52.4 12.4 0.1 16.2 0 18.8 94.3
Total 35.2 10.3 1.1 36.5 0.1 16.2 46.6

Residence
Urban 6.3 2.4 8.7
Rural 14.5 4.6 19.1 Education
No education 25.9 6.6 32.6
<5 years complete 16.2 5.1 21.2 5-7 years complete 14.9 4.7 19.6
8-9 years complete 6 2.4 8.5 10-11 years complete 3.7 2.4 6.1 12 or more years complete 2 1.6 3.6
Total 12.1 3.9 16 Source: NFHS 3
The rural urban differential is also huge, with teenage pregnancy being much higher in
rural areas (14.5 per cent) than urban areas (6.3 per cent). The percentage of teenage
pregnancy is much higher among girls having no education than among girls having
more than 12 years of education. Education thus has a very important role in ensuring
that girls are married only after attaining the legal age for marriage. Education has the
added positive outcome, by influencing the age at marriage, of thereby protecting the
health of the women and ensuring safer childbearing and rearing. Better levels of
awareness accorded with higher educational status help safeguard the women’s own
health and protect their children from malnutrition and ill health to a large extent.

Chapter Chapter Chapter Chapter ---- VVVV
LAND AND POVERTYLAND AND POVERTYLAND AND POVERTYLAND AND POVERTY
About two thirds of the workforce of our country is dependent on income from
agricultural and allied activities, even though the sector’s share in the national income
was only about 18 per cent in 2006-07. Although its share has declined, it is still the
single largest contributor to GDP, and plays a vital role in the overall socio-economic
development of the country.
Out of the total geographical area, about 43 per cent is used for agricultural activities.
The most formidable challenge in agriculture is the declining per capita land availability,
which has declined drastically due to the severe population pressure in the past few
years. As a result, the proportion of landless households in the country has increased
and a larger number of marginal farmers have also joined the landless labourers. Due to
these reasons, the number of poor households has increased, which ultimately
increases the level of poverty. Therefore in this chapter, an attempt has been made to
analyze these two important attributes of the households: land in the first section and
poverty in the second.
In order to ascertain how the NMCs across class categories fare in terms of the two key
indicators, that is, literacy and employment status, this chapter undertakes an analysis of
the different monthly per capita consumption expenditure (MPCE) quintile groups. The
lowest quintile (Q1) refers to the poorest segment within any NMC, while the highest
quintile (Q5) refers to the relatively better-off sections.
Most of the published data available on the size of land holdings is from the National
Sample Surveys (NSS). The NSS gives data on land possessed by households and land
under operation. We have used operating land for this analysis. The NSS defines it as
land “for each household with respect to a particular reference period and encompasses
all land - either owned, leased in or otherwise possessed - under physical possession of
the household during the major part of the reference period, provided some agricultural
production was carried out on any part of the land during the reference period; if not, that
is, for non-operating households, the household operational holding is considered as ‘nil’
and its size as zero.”

The National Sample Survey provides data on the operating land by the various minority
communities. The operating land has been calculated for rural and urban areas under
five different categories – landless (0.0 ha), below marginal farmers (0.01-0.40 ha),
marginal farmers (0.4-1.0), small farmers (1.01-2.0 ha), medium farmers (2.01-4.0 ha)
and large farmers (4.01+ ha). The landholdings are organized and discussed based on
these categories.
1. Operational Landholding
More than half of the total population of India (56.39 per cent) is landless. Except for
Christians (where the percentage of the landless is lower than the national average), the
percentage of landless people is higher for Sikhs (66.5), Buddhists (71.60) and Parsis
(97.19). Parsis are almost completely landless. They are mostly settled in the urban
areas and are engaged in the tertiary sector, having little or no direct links with the land.
There are wide rural-urban differentials and, as is obvious, the urban areas are
associated with high levels of landlessness for all the minority communities.
Table 5.1: Operational Landholding Size Among Notified Minority Communities, 2004-05 (%)
0.0 ha 0.01-0.40 ha 0.41-1.0 ha 1.01-2.0 ha 2.01-4.0 ha 4.01+ ha Residence Community
LandlessBelow
Marginal Marginal Small Medium Large
Christian 54.81 20.51 14.30 6.87 2.71 0.80
Sikh 66.50 3.56 6.41 7.67 8.72 7.13
Buddhist 71.60 6.61 8.75 8.62 3.01 1.41
Parsi 97.19 0.00 2.81 0.00 0.00 0.00
Total
Total 56.39 14.22 13.61 8.52 4.92 2.34
Christian 40.12 25.91 19.57 9.54 3.72 1.13
Sikh 58.40 4.12 8.31 9.46 11.10 8.60
Buddhist 58.99 9.63 12.93 12.16 4.26 2.03
Parsi 0.00 0.00 100.00 0.00 0.00 0.00
Rural
Total 42.80 18.35 18.05 11.31 6.52 2.97
Christian 86.65 8.81 2.87 1.06 0.53 0.09
Sikh 92.89 1.75 0.22 1.84 0.98 2.32
Buddhist 97.99 0.27 0.02 1.21 0.37 0.12
Parsi 98.75 0.00 1.25 0.00 0.00 0.00
Urban
Total 92.20 3.32 1.93 1.18 0.70 0.67Source: Calculated from the Unit level data of NSS 61
st Round, 2004-05.
The category of the Below Marginal group is next to the landless category. People under
this category are deemed to be on the threshold of becoming landless anytime. So, if the
landless and below marginal categories are combined, more than two-thirds of India’s
population falls under the category which is almost landless, and the notified minority
community is no exception. Christians have the maximum percentage of population
(20.51) with below marginal operational landholdings. In India, the percentages of

population with marginal, small, medium and large farms are 13.61, 8.52, 4.92 and 2.34
per cent respectively. Among the notified minority communities, the percentage of
population with marginal operational landholdings is the highest among Christians (14.30
per cent). In the small farmer category, the maximum proportion of population is from the
Buddhist community (8.62 per cent). More medium and large farmers are found in the
Sikh community. The rural-urban distribution of the operational landholding size is
presented in Table 5.1.
2. Trends in Operational Landholdings
The operational landholdings during 1993-94 and 2004-05 among the different
communities has been represented with the help of diagrams. As discussed earlier, the
proportion of people with no land at all has remained higher during the last one decade
in India. Among the minority communities, however, there is a different trend. Christians
have shown a decline in its landless population, and this decline is sharper during the
period from 1993-94 to 1999-00. Among the Sikh and Buddhist communities, there is a
fluctuating trend. During 1993-94 to 1999-00, there has been a decline in the landless
population but in 2004-05, there has again been an increase in the proportion of landless
people among the Sikh and Buddhist communities. A decline can also be witnessed
among the different minority communities in the below marginal operational landholding
category (0.0-0.4 ha). Among the Christians, Sikhs and Buddhists, there has been a
marginal increase in the percentage of population with below marginal operational
landholdings during 1993-94 and 1999-2000. However subsequently, a sharp decline
can be observed during 1999-2000 and 2004-05. The study of Parsis is not significant in
these cases. In the marginal and small landholding size categories, the trend of
percentage of population among notified minority communities has shown a marginal
decline in the first duration and then a sudden increase in proportion during the second
duration (1999-2000 to 2004-05). The trend is more or less similar for the population with
the medium and large landholding sizes, the only difference being the initial decline,
which is absent in this case. As expected, Sikhs have shown a steep rise in population
with medium and large landholding sizes in comparison to the other minority
communities.

Landless
0
10
20
30
40
50
60
70
80
90
100
1993-94 1999-00 2004-05Years
% P
op
.
Christians Sikhs Buddhist
Parsis Total
Below Marginal (0.00-0.40 Ha.)
-5
0
5
10
15
20
25
30
35
40
45
50
1993-94 1999-00 2004-05
Years
% P
op
.
Christians Sikhs Buddhist
Parsis Total
Small Landholding (1.0-2.0 ha)
0
1
2
3
4
5
6
7
8
9
10
1993-94 1999-00 2004-05Years
% P
op
.
Christians Sikhs Buddhist
Parsis Total
Medium Landholding (2.01-4.00 ha)
0
1
2
3
4
5
6
7
8
9
10
1993-94 1999-00 2004-05Years
% P
op
.
Christians Sikhs Buddhist
Parsis Total
Large Landholdings (4.01+)
0
1
2
3
4
5
6
7
8
1993-94 1999-00 2004-05Years
% P
op
.
Christians Sikhs Buddhist Parsis Total
Fig. 5.1a-5e
Source: Calculated from the Unit level data of the NSSO
3. Poverty Level
Poverty has been defined in a number of ways by different countries, organizations and
people. The two basic definitions are: first the inability to attain a minimal standard of
living (World Bank, 1990), and second “want of adequate income, howsoever defined, is

poverty…” Dandekar (1981). Thus, lack of adequate income to buy the basic goods for
subsistence living is an important element of the definitions of poverty.
In this chapter, we have used the incidence of poverty by the head count method on the
basis of poverty line given by the Planning Commission, which is derived from the large-
scale quinquennial sample surveys on household expenditure conducted by the National
Sample Survey Organisation (NSSO). For our analysis, poverty has been calculated
from the consumption expenditure data of the employment and unemployment survey
data for the notified minorities, to relate the employment-related features with poverty.
The Planning Commission has calculated poverty from the detailed household consumer
expenditure survey data, which is a different data set, and one cannot relate the detailed
employment features with this definition of poverty. In the results, there is a slight
difference in the overall poverty calculated by these different data sets. In the
employment and unemployment round, the data for household consumption expenditure
has been collected on the basis of MRP (mixed recall period consumption method),
where expenditure data for five non-food items, namely clothing, footwear, durable
goods, education and institutional medical expenses are collected from a 365-day recall
period, and the consumption data for the remaining items are collected from a 30-day
recall period. Thus, the MRP method of the Planning Commission for the head count of
poverty has been used for calculation. However in the consumption round, both MRP
and URP9 methods are used for data collection and poverty estimation. The poverty
calculated by the Planning Commission on the basis of the URP and MRP methods from
the consumption round is 27.5 per cent and 21.8 per cent respectively, whereas poverty
calculated from the employment and unemployment rounds is around 19 per cent,
because of the different data set used.
As per this calculation, the proportion of people living below the poverty line in India is
19.8 per cent in the 61st Round (2004-05) of the NSSO. (See Fig. 5.2.) Among the
minority communities, the Buddhists have the maximum proportion of their population
(29.86 percent) categorized as poor. Parsis at the other extreme are not associated with
poverty at all. Christians have a poverty level of 11.19 per cent whereas Sikhs have a
poverty level of 5.23 per cent.
Usually in India, the rural areas are associated with a higher poverty rate in comparison
to the urban areas. But among the notified minority communities the proportion of the
9 Another method of consumption data collected using a 30-day recall period (also known as reference
period) for all the items
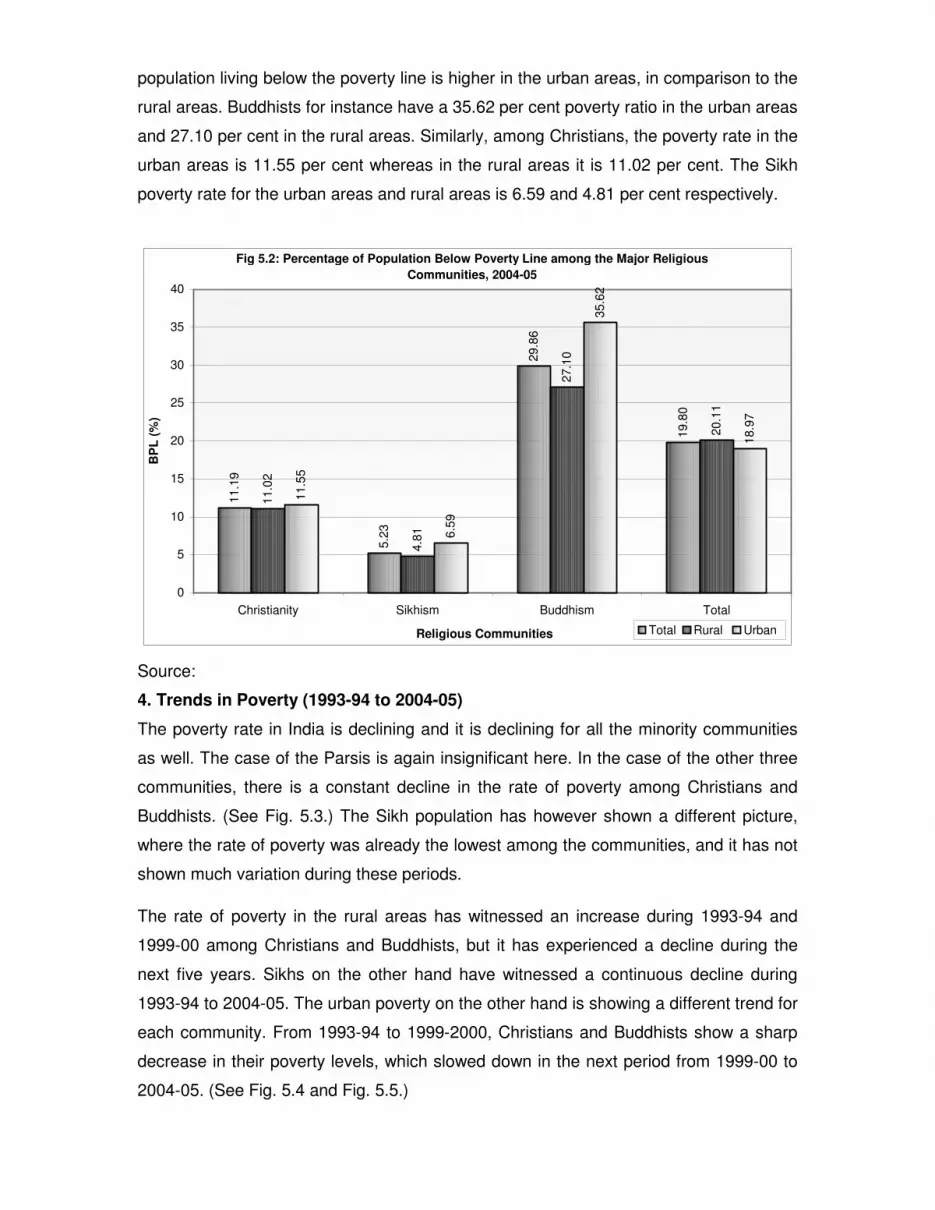
population living below the poverty line is higher in the urban areas, in comparison to the
rural areas. Buddhists for instance have a 35.62 per cent poverty ratio in the urban areas
and 27.10 per cent in the rural areas. Similarly, among Christians, the poverty rate in the
urban areas is 11.55 per cent whereas in the rural areas it is 11.02 per cent. The Sikh
poverty rate for the urban areas and rural areas is 6.59 and 4.81 per cent respectively.
Fig 5.2: Percentage of Population Below Poverty Line among the Major Religious
Communities, 2004-05
11.1
9
5.2
3
29.8
6
19.8
0
11.0
2
4.8
1
27.1
0
20.1
1
11.5
5
35.6
2
18.9
7
6.5
9
0
5
10
15
20
25
30
35
40
Christianity Sikhism Buddhism Total
Religious Communities
BP
L (
%)
Total Rural Urban
Source:
4. Trends in Poverty (1993-94 to 2004-05)
The poverty rate in India is declining and it is declining for all the minority communities
as well. The case of the Parsis is again insignificant here. In the case of the other three
communities, there is a constant decline in the rate of poverty among Christians and
Buddhists. (See Fig. 5.3.) The Sikh population has however shown a different picture,
where the rate of poverty was already the lowest among the communities, and it has not
shown much variation during these periods.
The rate of poverty in the rural areas has witnessed an increase during 1993-94 and
1999-00 among Christians and Buddhists, but it has experienced a decline during the
next five years. Sikhs on the other hand have witnessed a continuous decline during
1993-94 to 2004-05. The urban poverty on the other hand is showing a different trend for
each community. From 1993-94 to 1999-2000, Christians and Buddhists show a sharp
decrease in their poverty levels, which slowed down in the next period from 1999-00 to
2004-05. (See Fig. 5.4 and Fig. 5.5.)

Population Below Poverty Line among Notified Minority Communities,
1993-94 to 2004-05
0
10
20
30
40
50
60
1993-94 1999-00 2004-05
Years
% P
op
.
Christians Sikhs Buddhist Parsis Total
Fig. 5.3
Source: Calculated from the unit level data of NSS, 2004-05 (61st Round).
Rural Population Below Poverty Line among Notified Minority Communities,
1993-94 to 2004-05
-5
0
5
10
15
20
25
30
35
40
45
50
1993-94 1999-00 2004-05
% Pop.
Years
Christians Sikhs Buddhist Parsis Total
Fig. 5.4
Source: Calculated from the unit level data of NSS, 2004-05 (61st Round).

Urban Population Below Poverty Line among Notified Minority Communities, 1993-94 to
2004-2005
0
5
10
15
20
25
30
35
40
45
50
1993-94 1999-00 2004-05Years
% P
op
.
Christians Sikhs Buddhist Parsis Total
Fig. 5.5
Source: Calculated from the unit level data of NSS, 2004-05 (61st Round).
Sikhs on the other hand have experienced an intial increase in their proverty levels, and
a decline thereafter.
5. Education and Employment Statuses Across MPCE Quintiles In what ways does poverty affect the NMCs? Do the different NMCs under study have
equitable access to education? Or is it the case, as for the population in the rest of the
country, that the literacy levels are better for the ‘haves’ than the ‘have-nots’? A
classification of all the educated NMC population into two levels – upto secondary
education and above secondary education levels – has been done to ascertain the
proportion of higher education among the different minority communities. The
possibilities of gaining from labour market participation are substantially enhanced with
better educational status.
The literacy, education and employment status of the different minority communities has
been discussed under this section over the various monthly per capita consumption
expenditure (MPCE) quintiles. The literacy level classified by the MPCE quintiles has
been presented in Table 5.2. The table indicates that the MPCE quintile V has the
highest literacy rate where as Quintile I has the lowest literacy rate. The literacy rate is
relatively high in the rich sections of all the communities, and in both rural and urban
areas: The literacy rate increases in all the communities and in both rural and urban
areas, as one moves from poorest to the richest quintiles. Parsis and Christians have the
highest literacy rate in comparison to the other communities. Overall, the Sikhs show the

lowest literacy rate in all the MPCE quintiles among the four notified minority
communities. The Parsis are highly concentrated in only the higher quintiles, and in the
urban areas, with an overall high educational attainment, so the figures for this
community are not included in the Tables that follow.
Table 5.2: Literacy level of NMCs by Quintiles (%)
Rural Urban
Community Q1 Q2 Q3 Q4 Q5 Q1 Q2 Q3 Q4 Q5
Christian 50.51 60.41 61.93 69.54 82.50 65.81 76.31 83.26 86.81 94.12
Sikh 39.79 43.23 51.74 58.17 69.34 53.53 69.10 77.48 81.77 91.29
Buddhist 60.32 62.07 60.33 62.94 71.40 63.96 66.11 81.84 83.76 93.96
Total 40.63 47.98 53.30 60.01 70.39 55.93 67.33 77.07 83.97 91.54Source: Calculated from the unit level data of NSS, 2004-05 (61
st Round).
The educational level of the minority communities classified by MPCE quintiles in the
rural areas has been presented in Table 5.3 and Table 5.4. The tables indicate that the
relatively better-off sections of the community have higher educational levels in
comparison to the poorer sections of the community. The educational levels have been
clubbed into two broad categories - upto secondary level and above secondary level.
Generally, in both the categories, the educational level increases moving from the poor
section to the richer sections of the community. However, there is a slight deviation in
this general pattern. The educational levels in the urban areas show much variation in
different MPCE quintiles: The upto secondary level of education has shown a decline
from quintile IV to quintile V. The Buddhist community also does not follow the general
pattern, as the educational level among the different sections of the community is
dwindling in quintile III and IV. In the urban areas, the upto secondary level of education
has been observed to be lower as one moves from the lower to the upper MPCE
quintiles. (See Table 5.5 and Table 5.6.)
Table 5.3: Educational Level Upto Secondary Level of NMCs in the Rural Areas (%)
Q1 Q2 Q3 Q4 Q5 Community Upto Secondary
Christian 49.82 56.95 58.06 63.75 66.04
Sikh 38.71 42.03 50.09 54.80 59.13
Buddhist 53.93 57.41 55.29 50.41 56.56
Total 39.53 46.05 50.14 54.75 57.65Source: Calculated from the unit level data of NSS (2004-05), 61
st round.
Table 5.4: Educational Level Above Secondary of NMCs in the Rural Areas (%)
Q1 Q2 Q3 Q4 Q5 Community Above Secondary
Christian 0.68 3.12 3.71 5.52 16.42
Sikh 1.08 1.21 1.65 3.37 10.17
Buddhist 6.36 4.64 5.01 12.53 14.84

Total 1.00 1.89 3.11 5.23 12.72
Source: Calculated from the unit level data of NSS (2004-05), 61st round.
Table 5.5: Educational Level Upto Secondary Level of NMCs in the Urban Areas (%)
Q1 Q2 Q3 Q4 Q5 Community Upto Secondary
Christian 60.24 63.89 69.51 61.24 49.73
Sikh 51.16 65.90 63.24 57.13 45.69
Buddhist 60.09 58.35 58.86 41.18 48.50
Parsi - - 57.14 0.0 31.17
Total 52.63 59.84 63.29 59.53 44.35 Source: Calculated from the unit level data of NSS (2004-05), 61
st round.
Table 5.6: Educational Level Above Secondary Level of NMCs in the Urban Areas (%)
Q1 Q2 Q3 Q4 Q5
Community Above Secondary
Christian 5.57 12.39 13.73 25.52 44.39
Sikh 2.37 3.20 14.24 24.64 45.60
Buddhist 3.87 7.76 22.98 42.59 45.46
Parsi - - 0.0 100.0 68.83
Total 3.24 7.44 13.74 24.40 47.18
Source: Calculated from the unit level data of NSS (2004-05), 61st round.
In the case of above secondary level of education, however, the increase has been
phenomenal from the poor to the rich sections of the community. While only 3.24 per
cent of the poorest have above secondary levels of education, the level for the richest
section of the population is 47.18 percent.
The usual status of workers has also been studied with the help of MPCE quintiles. In
the NSS, the usual status of worker has been broadly divided into three categories –
self-employed, regular employment and casual workers. Usually it has been found that
the percentage of self-employed and regular workers increases from Q1 to Q5 for India
as a whole, whereas the percentage of casual workers decline as one moves to the
higher stratas of the society. However, the notified minority communities deviate from
this pattern. The situation also differs from rural to urban labour market context as
discussed further.
5.1. Rural Profile
Consider first the rural labour market scenario. Self-employment is the major source of
livelihood for rural Indians – with nearly one half or more working persons across quintile
groups being thus employed. While the Christians are seen to be self-employed
irrespective of quintile groups in the rural areas, it is only the relatively better-off sections

among the Sikhs and Buddhists who are self-employed entrepreneurs (Table 5.7), with
the Sikh Q5 segment having the highest proportion of entrepreneurs.
Among the lowest quintile, the Buddhists, who also happen to have the highest
proportion of population below the poverty line, exhibit very minimal levels in the self-
employed categories. They are largely found to be employed in casual labour, especially
among the relatively poorer quintiles (see Table 5.9). Although share of casual work
declines as one moves from Q1 to Q5 quite significantly, among the Buddhists and
Christians, 18 per cent of the Q5 segment reflecting the relatively better-of sections are
casual workers. Regular employment, especially in the rural areas, is observed more
among the higher quintiles in general. Relatively among the NMCs, it is the Christians
who seem to have higher proportions of regular workers across quintile groups. The
topmost quintile - Q5 - records 18 per cent regular employment in rural areas for
Christians, while it is 17 per cent for Buddhists.
Table 5.7: Self-Employed in different NMCs by MPCE Quintiles (%)
Rural Urban Community
Q1 Q2 Q3 Q4 Q5 Q1 Q2 Q3 Q4 Q5
Christian 51.09 64.05 51.69 61.60 64.27 38.40 28.75 37.09 37.73 28.26
Sikh 30.20 31.46 44.21 60.67 79.13 15.73 37.88 55.54 58.43 50.04
Buddhist 15.02 35.13 25.50 44.12 64.43 17.95 11.72 18.79 23.89 27.88
Total 46.82 54.65 60.02 66.74 69.34 48.63 48.94 47.84 43.36 38.83
Source: Calculated from Unit level data of NSSO, 61st Round.
5.2. Urban Profile
As seen in the rural employment scenario, even in the urban context, the Sikh
community – especially the better-off sections – report more than 50 per cent as self
employed (see Table 5.7). In the case of the Christians on the other hand, even in urban
areas, irrespective of quintile groups, 30 to 38 per cent of them are self-employed, while
the Buddhists have the lowest proportions of self-employed compared to other NMCs.
Table 5.8: Regular Employment in different NMCs by MPCE Quintiles (%)
Rural Urban Community
Q1 Q2 Q3 Q4 Q5 Q1 Q2 Q3 Q4 Q5
Christian 7.38 8.14 13.25 9.10 18.08 24.53 49.16 42.51 49.51 68.14 Sikh 6.15 8.64 9.70 7.61 12.02 44.66 45.07 35.06 40.74 49.28 Buddhist 5.83 4.27 7.30 7.24 17.22 23.66 34.05 54.10 63.54 71.19 Total 3.25 3.81 5.19 7.15 14.49 20.87 29.14 37.86 48.53 59.25
Source: Calculated from Unit level data of NSSO, 61st Round.

The urban casual and regular employment provides a very interesting picture across
communities by quintile groups. Casual employment is highest among the Q1 and Q2
quintiles of Buddhists (see Table 5.9). All the NMCs in urban areas, excluding Parsis,
report relatively higher levels of casual employment. This corroborates with the higher
urban poverty levels noted for the NMCs earlier in the chapter.
Table 5.9: Casual Employment in different NMCs by MPCE Quintiles Rural Urban Community
Q1 Q2 Q3 Q4 Q5 Q1 Q2 Q3 Q4 Q5
Christian 41.53 27.80 35.06 29.30 17.65 37.07 22.09 20.41 12.76 3.60 Sikh 63.65 59.90 46.06 31.72 8.85 39.62 17.05 9.40 0.82 0.68 Buddhist 79.15 60.59 67.19 48.64 18.35 58.40 54.23 27.11 12.57 0.93 Total 49.93 41.54 34.79 26.11 16.17 30.50 21.93 14.29 8.11 1.93
Source: Calculated from Unit level data of NSSO, 61st Round.
Regular employment in urban areas forms the most significant share for the better-off
sections of all NMCs, with the Buddhists and Christians reporting 71 and 68 per cent
regular workers among the Q5 segment. The Sikhs, on the other hand, seem to find
themselves in regular employment irrespective of the quintile groups – ranging from 35
per cent to 49 per cent. Even the poorest Sikhs (Q1) record 45 per cent regular
employment, while for the Buddhists and Christians, only one-fourth of the Q1 group find
such secure and steady employment avenues (see Table 5.8).

Chapter Chapter Chapter Chapter ---- VVVVIIII
EMPLOYMENT AND UNEMPLOYMENTEMPLOYMENT AND UNEMPLOYMENTEMPLOYMENT AND UNEMPLOYMENTEMPLOYMENT AND UNEMPLOYMENT
Economic growth plays an important role in the overall dynamism of a country’s
economy. The extent of growth in the economy and well-being of the people largely
depends on the degree to which its labour force gets absorbed in productive avenues of
work. In this context, an assessment of the employment-unemployment profile among
the notified minorities is crucial for understanding how they participate in and benefit
from such growth. Here an attempt has been made to deal with various facets relating
to the employment dimensions and economic performance of the people belonging to
the four notified minority communities (other than Muslims).
The analysis is based on three rounds of National Sample Survey (NSS) data, i.e. 50th
1993-94), 55th (1999-00) and 61st (2004-05). The NSS survey for each household
covering the religion of the head of the household has been collected. The religion of the
head is considered as the religion of the household, irrespective of the religion of other
members. The sample sizes pertaining to the notified communities are considerably
small at the state level, so the estimates based on such small samples may not reveal
the true situation. Hence all the estimates relating to these communities are to be used
with a great deal of caution. In this chapter, therefore, the estimates are given at an all-
India level only. However, the estimates for all-India are inclusive of all the states and
union territories. The concentration of Parsis in urban areas largely limits any calculation
of the rural situation for them, due to their insignificant sample size.
This chapter discusses the different aspects related to employment and unemployment
of the NMCs. It mainly includes the labour force participation rate (LFPR), work force
participation rates (WPR), unemployment, employment status, industrial distribution of
workers, occupational distribution, age-wise LFPR, educational status (5-19 yrs),
distribution of tertiary sector (urban), employment status of rural Buddhists and urban
Christians and Sikhs, and the distribution of primary sector in rural areas by MPCE
quintiles. The detailed tables for all the years are given in the Annexure Table 1-4, 5a
and 5b.
1. Labour Force Participation Rates (LFPR)

Labour force, or in other words, the ‘economically active’ population, refers to the
population which supplies or seeks to supply labour for production and, therefore,
includes both the ‘employed’ and the ‘unemployed’. The estimates of the labour force
participation rate (LFPR) on the usual principal and subsidiary status (UPSS) criterion
have been given for the notified minority communities at the all-India level in Table 6.1
and Annexure 1.
The LFPR of all the notified minority communities is higher than the overall rate. There is
a marginal difference among the communities, and it is highest among Buddhists (48.85
per cent) and lowest among Parsis (44.56 per cent) during 2004-05. There is a
marginally higher LFPR among male (around 3 points) and lower among female Parsis
(about 5 to 8 points) in comparison to other minority communities, in 2004-05. (Table
6.1)
Table 6.1: Labour Force Participation Rates for Persons for Notified Minority Groups during 2004-05 (UPSS) (%)
Rural Urban Total Community M F P M F P M F P
Christian 57.69 38.46 48.10 53.55 28.34 40.95 56.48 35.48 46.00
Sikh 56.90 36.87 47.32 57.52 16.82 38.27 57.03 32.74 45.44
Buddhist 57.93 50.71 54.34 55.26 22.42 37.96 57.07 40.87 48.85
Parsi* 100.00 33.33 50.00 59.47 32.82 44.43 60.04 32.83 44.56
All Religions 55.51 33.30 44.62 57.03 17.82 38.25 55.90 29.43 43.00 Source: National Sample Survey, 61
st Round
*Insignificant rural sample size may lead to the unreliable estimates for rural areas
The difference in the LFPR among males and females is the highest among Parsis
(about 67 points) in the rural area, and Sikhs (about 39 points) in the urban areas, in
2004-05. The female LFPR among Sikhs is only 16.82 per cent and surprisingly, all
Parsi males in rural areas are in the labour force during the same period.
The data further reveals that LFPRs have increased for all the notified minority
communities in rural and urban areas, as well as for males and females, except in the
case of Christians (-0.73 points) in urban areas, during the period from 1993-94 to 2004-
05. The long term increase is also evident among both males and females for the Parsis
and Sikhs in the rural as well as the urban areas during the same period. The above
growth phenomenon is more pronounced during the shorter period (1999-00 to 2004-05)
than the longer period (1993-94 to 2004-05). This could be partially due to population
growth and the higher participation of the aged population. (Annexure 1).

2. Work Participation Rates (WPR) This is an important indicator of development showing the proportion of working
population in an economy. Table 6.2 presents the WPR by notified minority communities
based on the UPSS criterion.
The WPR of all the notified minority communities is higher than the overall, and is
highest among Buddhists (47.22 per cent) and lowest among Parsis (42.42 per cent).
Among the males, the proportion of workers is highest among Sikhs (55.14 per cent)
closely followed by the other minority communities, whereas in the case of females it is
highest among Buddhists (40.53 per cent) and lowest among Sikhs (31.33 per cent) in
2004-05.
A similar picture has been observed in case of rural areas, including males and females
also, but in the urban areas the situation is different with Parsis (42.24 per cent) having
the highest WPR in comparison to other communities during the time. The reasons for
this in the case of the Parsis, could be the higher education levels in urban areas, while
in the case of the Buddhists, in rural areas, their higher work participation rate is a
reflection of their landlessness and poverty, which compels the women among them to
join the workforce
Table 6.2: Worker Participation Rates for Notified Minority Community Groups during 2004-05 (UPSS) (%)
Rural Urban Total Community M F P M F P M F P
Christian 56.15 35.89 46.05 50.54 24.38 37.46 54.51 32.50 43.53
Sikh 55.04 35.48 45.68 55.55 15.30 36.52 55.14 31.33 43.78
Buddhist 56.33 50.54 53.45 49.46 21.76 34.86 54.12 40.53 47.22
Parsi* 100.00 33.33 50.00 54.44 32.82 42.24 55.08 32.83 42.42
All Religions 54.62 32.70 43.88 54.86 16.60 36.53 54.68 28.67 42.01
Source: National Sample Survey, 61st Round
*Insignificant rural sample size may lead to the unreliable estimates for rural areas
The proportion of workers of all the notified minority communities have increased during
1993-94 to 2004-05, and the improvement is the highest among Parsis (5.83 points),
followed by Sikhs (4.69 points), Buddhists (2.90 points) and Christians (only 0.60 points).
The improvement in WPRs has been higher in the rural than urban areas, except in the
case of the Sikhs where the change was 4.47 points in the rural and 5.03 points in urban
areas during the same period. The proportion of male workers among Christians have
improved marginally (3.75 points) and declined significantly for Parsis (-58.38 points).
However, among rural females, the WPRs have increased substantially for Parsis (16.66
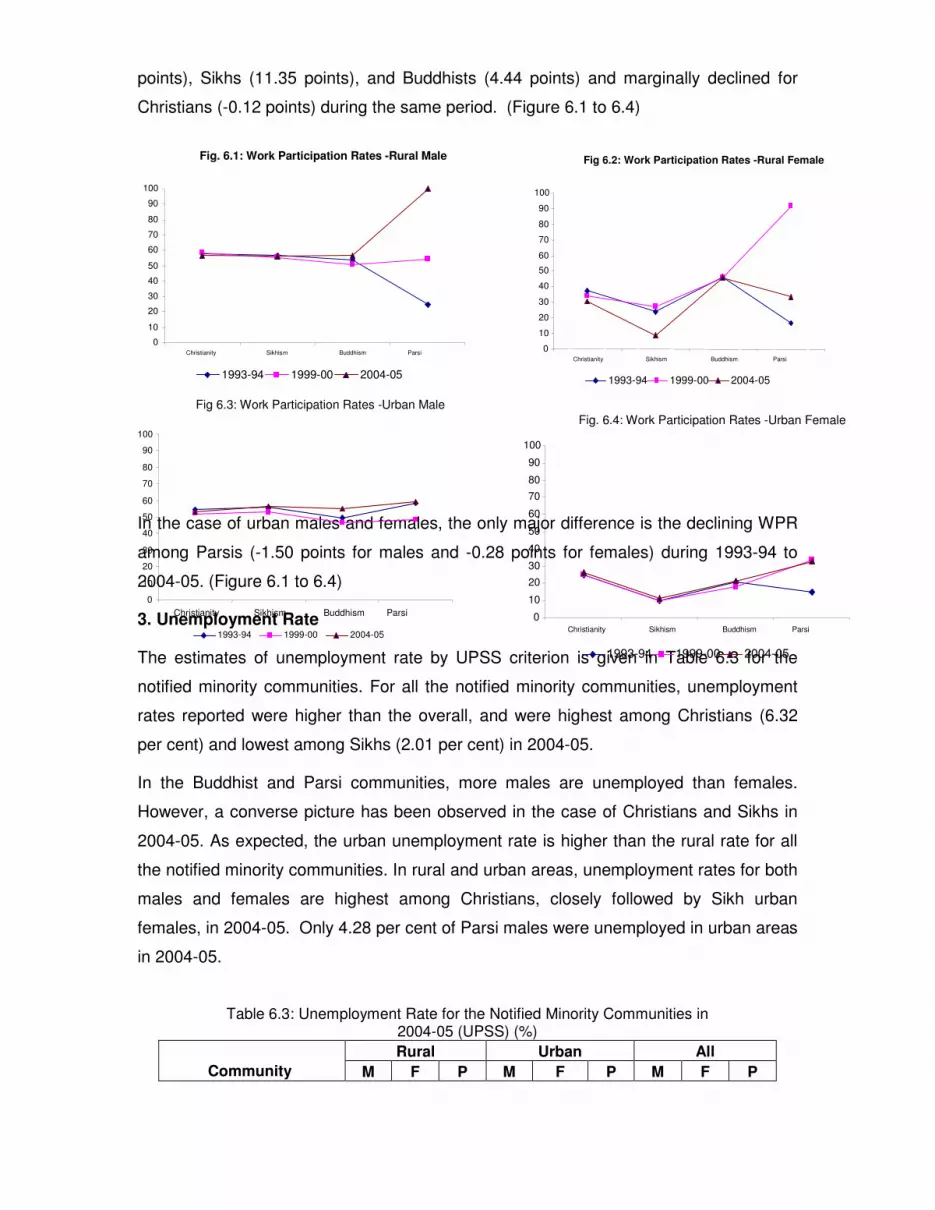
points), Sikhs (11.35 points), and Buddhists (4.44 points) and marginally declined for
Christians (-0.12 points) during the same period. (Figure 6.1 to 6.4)
In the case of urban males and females, the only major difference is the declining WPR
among Parsis (-1.50 points for males and -0.28 points for females) during 1993-94 to
2004-05. (Figure 6.1 to 6.4)
3. Unemployment Rate
The estimates of unemployment rate by UPSS criterion is given in Table 6.3 for the
notified minority communities. For all the notified minority communities, unemployment
rates reported were higher than the overall, and were highest among Christians (6.32
per cent) and lowest among Sikhs (2.01 per cent) in 2004-05.
In the Buddhist and Parsi communities, more males are unemployed than females.
However, a converse picture has been observed in the case of Christians and Sikhs in
2004-05. As expected, the urban unemployment rate is higher than the rural rate for all
the notified minority communities. In rural and urban areas, unemployment rates for both
males and females are highest among Christians, closely followed by Sikh urban
females, in 2004-05. Only 4.28 per cent of Parsi males were unemployed in urban areas
in 2004-05.
Table 6.3: Unemployment Rate for the Notified Minority Communities in 2004-05 (UPSS) (%)
Rural Urban All
Community M F P M F P M F P
Fig. 6.1: Work Participation Rates -Rural Male
0 10 20 30 40 50 60 70 80 90
100
Christianity Sikhism Buddhism Parsi
1993-94 1999-00 2004-05
Fig 6.2: Work Participation Rates -Rural Female
0
10 20 30 40 50 60 70 80 90
100
Christianity Sikhism Buddhism Parsi
1993-94 1999-00 2004-05
Fig 6.3: Work Participation Rates -Urban Male
0
10
20
30
40
50
60
70
80
90
100
Christianity Sikhism Buddhism Parsi
1993-94 1999-00 2004-05
Fig. 6.4: Work Participation Rates -Urban Female
0 10 20 30 40 50 60 70 80 90
100
Christianity Sikhism Buddhism Parsi
1993-94 1999-00 2004-05

Source: National Sample Survey, 61st Round
*Insignificant rural sample size may lead to the unreliable estimates for rural areas
The analysis over the period from 1993-94 to 2004-05 shows that the unemployment
rates among Sikhs, Parsis and Buddhists have increased, and declined marginally in the
case of the Christian community (0.94 per cent) during the same period. In the case of
the Parsi, Sikh and Buddhist males, the unemployment rate has shown an upward trend,
whereas an opposite trend was observed for female Sikhs and Buddhists during the
period from 1993-94 to 2004-05.
In the rural and urban areas for both males as well as females, a similar trend has been
observed. This shows that though the work participation rate has increased during the
last ten years, there is still a labour supply and demand gap in the labour market for
other minority communities. This consequently has led to a growth in the unemployment
rate among the Sikh, Parsi and Buddhist communities.
4. Employment Status
Employed persons have been categorized into three broad groups according to their
status of employment (i) Self-employment, (ii) Regular employees (iii) Casual labourers.
Table 6.4 and Annexure 3 shows the distribution of workers by status of activity for the
notified minority communities at the all-India level. The analysis of status of employment
reveals that the proportion of self-employed persons is relatively higher than other forms
of employment. Among the notified minority communities, more than half the Sikhs
(63.65 per cent) and Christians (53.60 per cent) are self-employed, more than half the
Parsis (57.64 per cent) are regular workers and more than half the Buddhists (53.31 per
cent) are casual workers, in 2004-05. The proportions of self-employed and casually
employed males as well as females in rural areas are higher than in urban areas, for all
the notified minority communities. However, a contrasting picture has been observed in
the case of regular workers in urban areas, where for both males and females the
proportions of urban workers are relatively higher than in the rural areas, in 2004-05.
The above analysis reveals that among the workers, a larger proportion of Buddhists are
involved in casual (the worst) form of employment and Parsis in more secure forms of
employment i.e. regular employment.
Table 6.4: Percentage of Usual Principal and Subsidiary Status of Employed
Christian 4.70 5.79 5.07 8.21 13.23 9.64 5.72 7.56 6.32
Sikh 0.98 4.13 1.17 4.07 13.18 5.04 1.62 7.05 2.01
Buddhist 2.22 0.25 1.38 7.07 9.30 7.61 3.78 1.79 3.03
Parsi* 0.00 0.00 0.00 4.28 0.00 3.68 3.91 0.00 3.40
Total 1.96 1.40 1.80 4.54 8.21 5.21 2.60 2.44 2.56

Persons for Notified Minority Groups during 2004-05 (%)
Self-Employed Regular Employed Casual Worker Community M F P M F P M F P
All
Christian 50.87 58.19 53.60 23.18 22.80 23.04 25.94 19.01 23.36
Sikh 54.07 82.12 63.65 20.32 8.62 16.32 25.61 9.26 20.03
Buddhist 29.21 31.97 30.41 20.63 10.65 16.28 50.17 57.38 53.31
Parsi 37.05 49.11 42.36 62.95 50.89 57.64 0.00 0.00 0.00 All Religions 54.67 61.36 56.90 17.20 8.33 14.25 28.13 30.31 28.85
Rural
Christian 56.95 66.11 60.51 13.97 11.93 13.18 29.08 21.96 26.32
Sikh 54.99 86.31 66.63 14.61 3.57 10.51 30.39 10.11 22.86
Buddhist 33.52 34.85 34.15 10.77 4.26 7.71 55.71 60.89 58.14
Parsi* 100.00 100.00 100.00 0.00 0.00 0.00 0.00 0.00 0.00 All Religions 58.14 63.67 60.16 8.98 3.71 7.06 32.88 32.61 32.78
Urban
Christian 34.62 30.28 33.21 47.82 61.12 52.15 17.55 8.60 14.64
Sikh 50.60 44.59 49.41 41.68 53.73 44.07 7.72 1.68 6.52
Buddhist 18.84 19.46 19.04 44.30 38.46 42.38 36.87 42.08 38.58
Parsi 35.40 47.41 40.67 64.60 52.59 59.33 0.00 0.00 0.00 All Religions 44.78 47.69 45.42 40.63 35.59 39.53 14.58 16.72 15.05
Source: National Sample Survey, 61st Round
*Insignificant rural sample size may lead to the unreliable estimates for rural areas
The analysis over the period 1993-94 to 2004-05 indicates that the proportion of the self-
employed has increased among Christians and Buddhists, and declined in the Parsi and
Sikh communities. Contrary to this, the proportions of Parsi and Sikh regular workers
have increased, and declined in the case of the Buddhists. However, in case of casual
workers, the proportion of Sikhs has increased during the same period. Overall, the
relative change among male and female workers in all forms of employment is the same,
except for a few contradictory results in the case of male self-employed and regularly
employed females among Parsis.
5. Industrial Distribution of Workers Table 6.5 illustrates the distribution of workers by broad industries for the notified
minority communities at the all-India level. The industries are classified into three broad
categories i.e. primary, secondary and tertiary.
Overall, the majority of the workers, both males and females, among Buddhists, Sikhs
and Christians were engaged in the primary sector in 2004-05. A major proportion of the

workforce among the Parsis was involved in the tertiary sector during same time. A
similar proportion for both males and females has been observed in the case of the
Buddhist, Sikh and Christian communities in rural areas.
Table 6.5: Major Industrial Distribution of Workers by Notified Minority
Communities in 2004-05 (%)
Male Female All
Community P S T P S T P S T
All
Christian 48.81 19.56 31.63 42.58 26.64 33.70 53.34 16.73 29.93
Sikh 52.98 19.27 27.74 45.51 10.70 16.03 64.03 14.21 21.76
Buddhist 55.51 18.37 26.12 50.83 35.89 26.60 63.73 16.18 20.09
Parsi 6.53 32.34 61.13 28.11 14.05 53.67 5.09 21.06 73.86
All Religions 51.54 19.82 28.65 41.78 24.74 18.19 59.07 17.57 23.36
Rural
Christian 63.17 14.94 21.89 74.26 10.56 15.18 67.48 13.24 19.28
Sikh 65.01 17.70 17.29 92.59 2.58 4.84 75.26 12.08 12.66
Buddhist 76.87 9.16 13.97 88.87 7.98 3.15 82.52 8.60 8.88
Parsi* 100.00 0.00 0.00 100.00 0.00 0.00 100.00 0.00 0.00
All Religions 67.14 15.00 17.86 83.63 9.82 6.55 73.17 13.11 13.73
Urban
Christian 10.43 31.90 57.67 39.51 20.35 36.58 11.63 27.02 61.35
Sikh 8.00 25.15 66.85 38.71 17.28 17.73 10.47 24.37 65.16
Buddhist 4.20 40.49 55.31 57.03 30.74 31.53 6.56 39.23 54.21
Parsi 4.08 33.18 62.74 0.00 14.05 53.67 2.29 21.68 76.03
All Religions 7.06 33.56 59.38 41.90 21.07 18.82 9.51 33.26 57.23
Note: P=Primary; S=Secondary; T=Tertiary Source: National Sample Survey, 61
st Round
*Insignificant rural sample size may lead to the unreliable estimates for rural areas
Contrary to this in urban areas, as obvious, a majority of the workers are engaged in the
tertiary sector with the Parsis having the highest proportion (76.03 per cent), followed by
Sikhs (65.16 per cent), Christians (61.35 per cent) and Buddhists (54.21 per cent). In
urban areas, the proportion of males is the highest in the tertiary sector and an equal
proportion of females are working both in the tertiary and the primary sectors.
The distribution of workers by industry obtained for the periods 1993-94 and 2004-
05 showed different trends for different minority groups. In general, the proportion
of workers increased for the ‘tertiary’ sector.
6. Occupational Distribution
The recent survey of the NSS (61st Round) has brought out a fresh set of data on the
occupational distribution by communities. A large proportion of the population (58.37 per
cent) of different notified minority communities has been found to be working as farmers,
fishermen, hunters, loggers and in related works, which are mainly primary activities.
Parsis are an exception and they are more involved in tertiary activities like
administrative, executive and managerial occupations, services, sales, professional
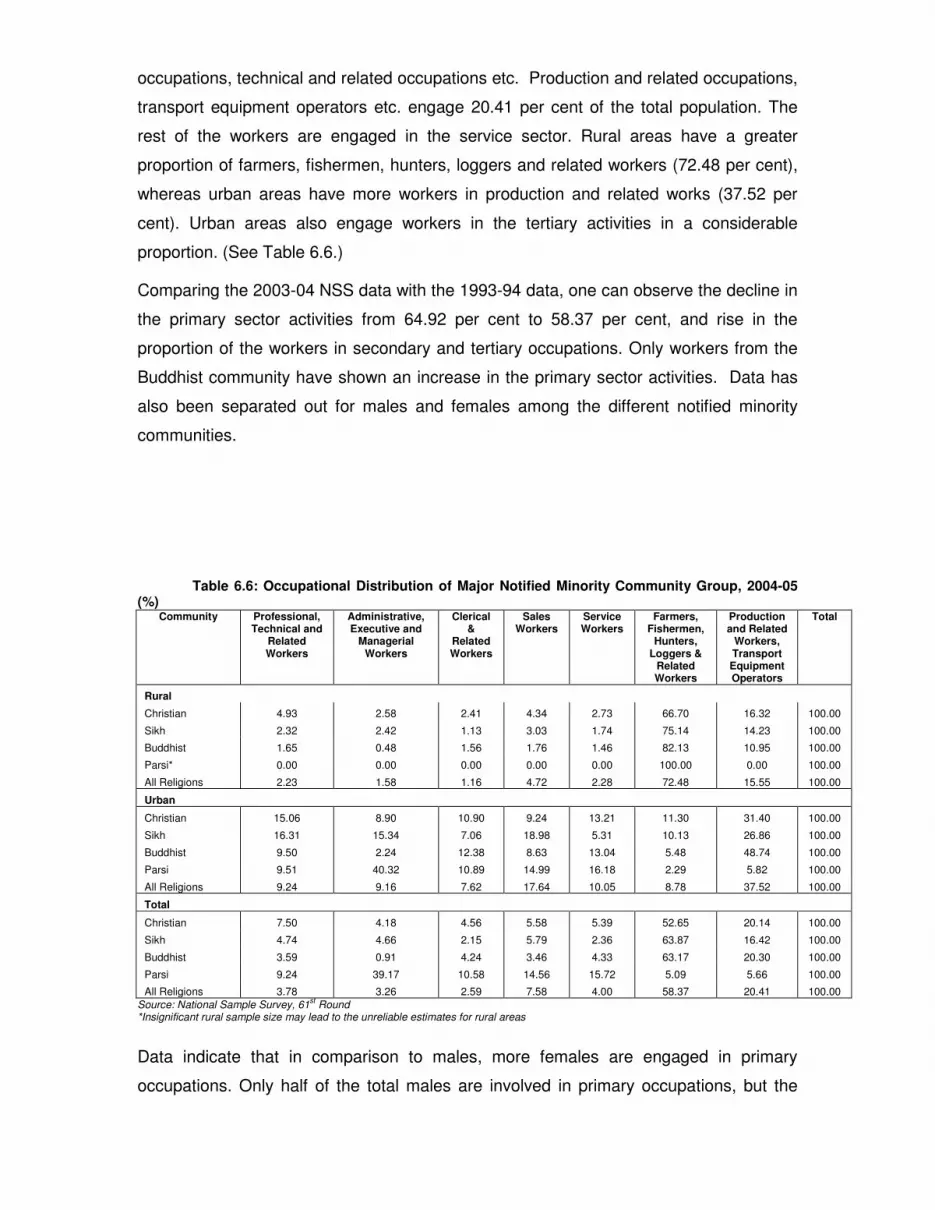
occupations, technical and related occupations etc. Production and related occupations,
transport equipment operators etc. engage 20.41 per cent of the total population. The
rest of the workers are engaged in the service sector. Rural areas have a greater
proportion of farmers, fishermen, hunters, loggers and related workers (72.48 per cent),
whereas urban areas have more workers in production and related works (37.52 per
cent). Urban areas also engage workers in the tertiary activities in a considerable
proportion. (See Table 6.6.)
Comparing the 2003-04 NSS data with the 1993-94 data, one can observe the decline in
the primary sector activities from 64.92 per cent to 58.37 per cent, and rise in the
proportion of the workers in secondary and tertiary occupations. Only workers from the
Buddhist community have shown an increase in the primary sector activities. Data has
also been separated out for males and females among the different notified minority
communities.
Table 6.6: Occupational Distribution of Major Notified Minority Community Group, 2004-05 (%)
Community Professional, Technical and
Related Workers
Administrative, Executive and
Managerial Workers
Clerical &
Related Workers
Sales Workers
Service Workers
Farmers, Fishermen,
Hunters, Loggers &
Related Workers
Production and Related
Workers, Transport Equipment Operators
Total
Rural
Christian 4.93 2.58 2.41 4.34 2.73 66.70 16.32 100.00
Sikh 2.32 2.42 1.13 3.03 1.74 75.14 14.23 100.00
Buddhist 1.65 0.48 1.56 1.76 1.46 82.13 10.95 100.00
Parsi* 0.00 0.00 0.00 0.00 0.00 100.00 0.00 100.00
All Religions 2.23 1.58 1.16 4.72 2.28 72.48 15.55 100.00
Urban
Christian 15.06 8.90 10.90 9.24 13.21 11.30 31.40 100.00
Sikh 16.31 15.34 7.06 18.98 5.31 10.13 26.86 100.00
Buddhist 9.50 2.24 12.38 8.63 13.04 5.48 48.74 100.00
Parsi 9.51 40.32 10.89 14.99 16.18 2.29 5.82 100.00
All Religions 9.24 9.16 7.62 17.64 10.05 8.78 37.52 100.00
Total
Christian 7.50 4.18 4.56 5.58 5.39 52.65 20.14 100.00
Sikh 4.74 4.66 2.15 5.79 2.36 63.87 16.42 100.00
Buddhist 3.59 0.91 4.24 3.46 4.33 63.17 20.30 100.00
Parsi 9.24 39.17 10.58 14.56 15.72 5.09 5.66 100.00
All Religions 3.78 3.26 2.59 7.58 4.00 58.37 20.41 100.00
Source: National Sample Survey, 61st Round
*Insignificant rural sample size may lead to the unreliable estimates for rural areas
Data indicate that in comparison to males, more females are engaged in primary
occupations. Only half of the total males are involved in primary occupations, but the

same is true for three-fourths of the females. Nearly one-fourth of the male workers are
also involved in production and related occupations, whereas the female participation is
only 12.33 per cent. Male workers are also involved in the service sector in more
proportion than females.
Comparing the NSSO 61st Round with the 55th Round (1993-94), (See Table 6.7) one
can observe a decline in the participation of the workers in primary occupations for both
males and females in all the notified minority communities, and a rise in the percentage
for all the other occupations. The percentage of population in clerical and related works
has witnessed a marginal decline in the case of males in all the notified minority
communities.
Table 6.7: Occupational Distribution, Persons (1993-94) (%)
Community
Professional, Technical and Related Workers
Administrative, Executive and Managerial Workers
Clerical & Related Workers
Sales Workers
Service Workers
Farmers, Fishermen, Hunters, Loggers & Related Workers
Production and Related Workers, Transport Equipment Operators Total
Rural
Christian 4.09 1.39 2.50 4.41 1.93 74.71 10.97 100
Sikh 1.74 0.88 1.26 2.28 1.54 82.73 9.56 100
Buddhist 1.92 0.53 2.37 1.61 1.93 78.51 13.13 100
Parsi* 0.00 0.00 0.00 0.57 0.00 99.43 0.00 100
Total 1.83 0.87 1.21 3.99 1.86 78.47 11.79 100
Urban
Christian 17.13 7.80 12.16 8.89 8.72 13.36 31.95 100
Sikh 9.85 11.34 7.52 18.99 4.87 13.64 33.79 100
Buddhist 2.91 3.14 13.53 9.26 16.46 12.94 41.76 100
Parsi 4.04 26.17 27.50 29.17 11.69 0.00 1.44 100
Total 8.39 5.78 9.20 16.71 9.07 12.43 38.43 100
Total
Christian 7.36 3.00 4.93 5.53 3.63 59.31 16.23 100
Sikh 3.17 2.72 2.36 5.22 2.13 70.57 13.83 100
Buddhist 2.17 1.18 5.15 3.51 5.54 62.21 20.25 100
Parsi 3.72 24.15 25.37 26.96 10.79 7.68 1.33 100
Total 3.17 1.87 2.85 6.60 3.34 64.92 17.26 100 Source: Calculated from the Unit level data of NSSO (55
th Round and 61
st Round)
*Insignificant rural sample size may lead to the unreliable estimates for rural areas
7. Age-wise LFPR
The age-wise Labour Force Participation Rate has also been calculated for all the
notified minority communities, for two rounds of NSS data (1993-94 and 2004-05). The
data indicates that overall the LFPR has increased marginally in the country during the

last ten years, from 42.78 per cent to 43 per cent. (See Table 6.8.) Even among the four
notified minority communities, the LFPR is showing a rise. Among Sikhs and Parsis, the
LFPR has increased substantially in comparison to Christians and Buddhists. The rural-
urban pattern is no different. It can also be observed that the LFPR has declined among
the children and the elderly population of India in general, and the notified minority
communities in particular. Here again the rural-urban pattern is akin to that of the total
except for the three facts: One, that the child LFPR among Sikhs has increased.
Second, that the decline in child LFPR is more pronounced in the rural areas in
comparison to the urban areas; and finally, the decline in the elderly LFPR is more
pronounced in the urban areas in comparison to the rural areas.
Table 6.8: Age-wise Labour Force Participation Rates (%)
Christian Sikh Buddhist Parsi* Total Christian Sikh Buddhist Parsi* Total Age Group
1993-94 2004-05
Rural
5-9 0.05 0.08 0.98 0.00 1.28 0.08 0.03 0.01 0.00 0.27
10-14 9.88 9.16 14.34 0.00 14.06 3.90 5.19 7.66 0.00 7.24
15-19 38.52 46.06 52.64 66.67 49.51 32.99 42.34 40.98 0.00 43.71
20-24 71.13 61.75 75.20 100.00 67.92 66.72 70.88 78.64 100.00 65.64
25-29 75.16 68.67 86.90 0.00 74.60 78.57 78.13 83.09 0.00 75.00
30-34 79.32 69.85 90.64 0.00 78.62 78.63 78.89 90.84 100.00 77.64
35-39 78.08 74.56 92.30 100.00 80.86 82.23 83.16 95.34 0.00 81.49
40-44 83.50 75.52 94.25 0.00 79.81 85.77 83.40 94.20 0.00 81.13
45-49 81.51 72.17 88.31 0.00 78.94 78.50 82.01 95.66 0.00 80.89
50-54 78.91 70.95 87.33 0.00 76.34 77.53 73.98 85.95 0.00 76.93
55-59 75.34 62.09 87.79 0.00 70.16 72.36 76.13 79.45 0.00 72.10
59+ 46.03 39.92 45.65 0.00 47.43 40.28 42.13 54.57 0.00 44.82
Total 47.60 41.53 50.09 25.11 44.90 48.10 47.32 54.34 50.00 44.62
Urban
5-9 0.46 0.00 0.00 0.00 0.49 0.05 0.00 0.00 0.00 0.29
10-14 2.93 2.94 5.31 0.00 5.83 1.48 3.16 1.56 0.00 4.43
15-19 23.20 22.01 28.36 0.00 28.42 16.60 24.27 22.76 0.00 27.32
20-24 54.48 46.25 42.54 47.20 51.05 52.69 56.14 45.34 60.39 52.64
25-29 62.04 54.22 58.03 47.06 61.04 76.08 56.41 60.20 53.50 62.60
30-34 72.78 56.80 74.72 100.00 64.70 71.56 63.24 76.01 54.12 65.10
35-39 73.27 59.31 79.30 100.00 65.58 70.63 65.46 73.00 100.00 66.76
40-44 70.14 65.75 75.97 68.39 68.73 73.34 57.35 79.24 85.17 66.53
45-49 73.17 63.58 63.23 79.13 68.01 68.08 66.95 72.83 89.24 64.29
50-54 69.68 63.97 57.64 33.38 63.80 65.61 58.46 69.15 78.01 62.11
55-59 51.55 55.53 67.53 56.14 55.08 44.37 63.98 56.68 100.00 53.31
59+ 20.13 21.17 23.15 22.36 27.34 21.26 22.44 13.56 0.00 22.79
Total 39.63 33.03 36.02 39.46 36.35 40.95 38.27 37.96 44.43 38.25
Total
5-9 0.16 0.06 0.68 0.00 1.10 0.07 0.03 0.01 0.00 0.27
10-14 7.80 7.75 11.68 0.00 12.00 3.25 4.85 5.81 0.00 6.59
15-19 34.21 41.21 43.70 2.16 43.81 27.55 38.07 34.49 0.00 39.28

20-24 66.12 57.87 61.74 47.24 63.34 62.58 67.64 67.37 63.60 61.87
25-29 70.79 65.69 75.12 47.06 71.00 77.81 73.79 73.85 53.50 71.48
30-34 77.14 66.84 85.81 99.70 74.91 76.44 75.82 85.90 57.07 74.19
35-39 76.47 70.66 88.03 100.00 76.70 78.55 79.86 86.27 100.00 77.47
40-44 79.22 73.15 88.41 68.39 76.81 81.86 76.91 88.94 85.17 77.02
45-49 79.29 70.02 79.51 79.13 76.15 75.49 78.02 88.13 89.24 76.31
50-54 76.25 69.21 78.99 33.38 73.38 74.22 69.31 80.54 78.01 72.88
55-59 68.64 60.64 83.12 56.07 66.63 62.95 73.17 74.18 100.00 67.23
59+ 38.90 36.71 39.14 22.36 42.94 34.88 37.81 45.31 0.00 39.39
Total 45.23 39.67 45.48 37.85 42.78 46.00 45.44 48.85 44.56 43.00
Source: Calculated from the Unit level data of NSSO (55th Round and 61
st Round)
*Insignificant rural sample size may lead to the unreliable estimates for rural areas
8. Educational Status (5-19 Age Groups)
As discussed earlier, the LFPR among children (5-19 years) has declined during the last
ten years. The issue now was whether the children coming out of the labour force
market were really going into education. To answer this question, the education status
of the 5-19 age group was calculated from the unit level NSS data for the two points of
time (1993-94 and 2003-04). (See Table 6.9).
Table 6.9: Educational Status of 5-19 Years Age Group (%)
1993-94 2004-05
Christian Sikh Buddhist Parsi* Total Christian Sikh Buddhist Parsi* Total
Rural
Not literate 18.75 24.60 21.16 33.37 35.24 12.64 12.88 7.71 0.00 21.60
Literate without formal schooling
1.63 1.16 1.35 0.00 1.45 2.99 2.07 2.96 0.00 3.07
Literate and upto primary
30.18 35.61 34.80 33.17 32.07 35.06 36.66 26.64 0.00 34.45
Primary 21.74 19.33 21.83 0.19 15.99 22.46 24.35 26.82 0.00 20.46
Middle 18.51 11.53 15.61 33.17 10.54 17.23 13.05 24.37 0.00 13.50
Secondary 7.02 6.43 4.64 0.00 3.74 7.01 7.77 7.45 0.00 5.01
Higher secondary 2.02 1.33 0.63 0.10 0.93 2.40 3.16 3.50 0.00 1.77
Graduate and above 0.14 0.01 0.00 0.00 0.04 0.03 0.04 0.51 0.00 0.08
Total 100 100 100 100 100 100 100 100 0.00 100
Urban
Not literate 6.62 11.33 10.78 60.20 15.58 6.46 7.10 5.65 0.00 11.93
Literate without formal schooling
1.13 1.94 3.49 0.00 1.61 0.81 0.89 0.73 0.00 2.22
Literate and upto primary
29.82 35.66 33.30 20.72 34.04 30.41 28.68 23.62 20.11 30.57
Primary 25.05 19.72 22.34 4.66 20.61 21.96 24.82 27.49 42.05 22.47
Middle 21.19 14.69 20.74 13.24 15.58 20.14 14.95 28.26 20.11 17.60
Secondary 11.46 10.24 7.01 1.18 8.39 12.00 14.57 6.98 17.72 9.49
Higher secondary 4.56 6.23 2.34 0.00 4.01 8.00 8.75 7.26 0.00 5.45
Graduate and above 0.18 0.20 0.00 0.00 0.18 0.22 0.22 0.00 0.00 0.24
Total 100 100 100 100 100 100 100 100 100 100
All
Not literate 15.30 21.80 17.82 50.15 30.41 10.87 11.78 7.04 0.00 19.33
Literate without formal schooling
1.49 1.32 2.04 0.00 1.49 2.36 1.85 2.24 0.00 2.87
Literate and upto primary
30.07 35.62 34.32 25.39 32.55 33.73 35.15 25.67 20.11 33.54
Primary 22.68 19.41 21.99 2.99 17.12 22.31 24.44 27.04 42.05 20.93

Middle 19.28 12.20 17.26 20.70 11.78 18.06 13.41 25.63 20.11 14.47
Secondary 8.29 7.23 5.40 0.74 4.88 8.44 9.06 7.30 17.72 6.07
Higher secondary 2.74 2.36 1.18 0.04 1.69 4.00 4.22 4.72 0.00 2.63
Graduate and above 0.15 0.05 0.00 0.00 0.08 0.08 0.08 0.35 0.00 0.11
Total 100 100 100 100 100 100 100 100 100 100
Source: Calculated from the Unit level data of NSSO (55th Round and 61
st Round)
*Insignificant rural sample size may lead to the unreliable estimates for rural areas
The educational level data indicates that illiteracy has declined substantially among the 5-19
years age-group among all the notified minority communities. Further, there has been
an improvement in all the educational categories and among all the notified minority
communities. There are a few exceptions to this uniform pattern: The literate and upto
primary categories of education have experienced a decline in proportion for Sikhs and
Buddhists. Primary education has also witnessed a marginal decline among Christian
children. Rural and urban areas too present a similar pattern. Thus, the educational
status of the 5-19 age group indicates that more children are entering educational
institutions.
Table 6.10: Distribution of Tertiary Sector in Urban Areas (%)
Trade,Hotels &
Restaurants
Transport,Storage & Communication
Finance., Real Est.
& Business
Pub Admn.,Edu.,Health
& Others Community
1993-94 (Male)
Christian 23.00 20.66 9.39 46.94 Sikh 34.57 21.97 5.51 37.94 Buddhist 21.86 32.44 5.50 40.20 Parsi 47.93 9.85 28.85 13.37 Total 38.04 16.86 6.59 38.51
2004-05 (Male)
Christian 38.77 21.59 11.30 28.34 Sikh 48.37 14.80 11.83 25.00 Buddhist 25.45 23.89 13.92 36.74 Parsi 21.27 16.53 52.86 9.34 Total 47.17 17.95 9.90 24.98
1993-94 (Females)
Christian 12.63 0.96 5.59 80.82 Sikh 8.20 1.06 5.09 85.65 Buddhist 23.76 6.13 4.96 65.15 Parsi 34.63 0.00 18.53 46.84 Total 21.97 2.78 4.09 71.15
2004-05 (Females)
Christian 17.10 1.59 7.49 73.81 Sikh 10.35 2.67 8.14 78.84 Buddhist 17.00 7.66 2.35 72.98 Parsi 12.62 0.00 35.49 51.89 Total 24.67 2.74 6.57 66.02
Source: Calculated from the Unit level data of NSSO (55th Round and 61
st Round)
*Insignificant rural sample size may lead to the unreliable estimates for rural areas
9. Distribution of Tertiary Sector (Urban)

The Tertiary Sector has been looked into separately to study the involvement of the
notified minority communities. Trade, hotels and restaurants; transport, storage and
communication; finance; real estate and business; public administration, education,
health and others are the four main categories of the tertiary sector which have been
studied. (See Table 6.10.) In India, 47.17 per cent of the total male labour force is
engaged in the tertiary sector of trade, hotels and restaurants. Public administration,
education, health & others engage 24.98 per cent of the tertiary sector’s male labour
force. Transport, storage and communication & finance, real estate & business account
for 17.95 and 9.90 per cent respectively of the total male labour force in the tertiary
sector. Sikh males are more involved in trade-related works. The proportion of Christian
males in the trade-related works has also increased substantially during the last one
decade. Buddhist males are more in the fields of public administration, education, health
& others. The sample size for Parsis did not provide significant data.
As far as females are concerned, among the notified minority communities other than
Muslims, more than two-thirds of the total tertiary sector labour force is in the field of
public administration, education, health & others. Their involvement in the rest of the
activities is very low.
Table 6.11: Employment Status of Rural Buddhists (%)
Self Employment Regular Casual
M F P M F P M F P
1993-94
Q1 13.48 8.59 11.53 9.40 0.00 6.96 19.08 24.07 21.68
Q2 13.85 30.05 20.34 5.67 4.96 5.49 24.34 24.68 24.52
Q3 18.00 16.37 17.35 7.63 14.75 9.47 26.39 22.63 24.43
Q4 25.91 21.76 24.25 19.97 40.00 25.16 19.97 19.16 19.55
Q5 28.76 23.23 26.54 57.33 40.29 52.91 10.21 9.47 9.82
All 100 100 100 100 100 100 100 100 100
2004-05
Q1 7.54 13.91 10.59 7.74 48.01 18.21 33.67 31.88 32.79
Q2 22.62 23.97 23.27 15.49 4.12 12.53 21.38 25.81 23.56
Q3 19.97 11.09 15.71 19.25 21.84 19.92 24.64 23.97 24.31
Q4 22.24 23.21 22.71 19.41 8.21 16.50 14.40 15.01 14.70
Q5 27.64 27.82 27.73 38.11 17.82 32.83 5.91 3.33 4.64
All 100 100 100 100 100 100 100 100 100
Source: Calculated from the Unit level data of NSSO (55th
Round and 61st Round)
*Insignificant rural sample size may lead to the unreliable estimates for rural areas
10. Rural Buddhists – Employment Status.
The employment status of the rural Buddhists with different MPCE quintiles has been
presented in the following table. Quintile one is the poorest of the Buddhists with the
lowest MPCE, whereas Quintile five is the richest of the Buddhists with the highest
MPCE. The employment status is of three types – self-employment, regular and casual.

Table 6.11 indicates that the proportion of the self-employed rural Buddhists is high for
Q5 (27.73 per cent) whereas it is only 10.59 per cent for Q1. Among the rural Buddhists,
18.21 per cent of Q1 and 32.83 per cent in Q5 are in regular employment. The
percentage of the casually employed rural Buddhists is high (32.79 per cent) in the
poorer section, whereas it is as low as 4.64 per cent in Q5. The temporal data of the
rural Buddhists in different quintiles indicate a surge in the casual employment in the
poorer section of the rural Buddhists, and a decline in the casual employment in the
richer section of the Buddhists.
11. Employment Status of Urban Christians and Sikhs
The quintile-wise employment status of urban Christians and Sikhs indicates that there is
a decline in all the three employment categories in quintile one, and an increase in all
the three categories of employment in the richer sections. Even casual employment
shows an increase in the richer sections of urban Christians and Sikhs. (Table 6.12)
Table 6.12: Employment Status of Urban Christians and Sikhs (%)
Self Regular Casual
M F P M F P M F P
1993-94
Q1 15.86 20.71 17.36 12.10 10.12 11.46 38.94 59.33 43.04
Q2 19.20 21.73 19.98 16.09 11.86 14.71 28.24 18.07 26.19
Q3 24.85 20.31 23.45 17.99 14.62 16.89 19.14 15.99 18.50
Q4 21.31 14.50 19.21 25.27 24.20 24.92 9.29 5.00 8.42
Q5 18.78 22.74 20.00 28.54 39.20 32.02 4.41 1.60 3.84
Christians
All 100 100 100 100 100 100 100 100 100
Q1 15.84 12.40 15.41 13.03 11.04 12.70 53.18 63.24 54.66
Q2 22.10 23.76 22.31 14.55 4.24 12.82 19.62 12.37 18.55
Q3 20.67 28.29 21.63 21.16 10.50 19.37 18.40 24.39 19.29
Q4 19.81 21.06 19.96 21.91 22.27 21.97 5.89 0.00 5.02
Q5 21.57 14.49 20.69 29.35 51.95 33.14 2.91 0.00 2.48
Sikhs
All 100 100 100 100 100 100 100 100 100
2004-05
Q1 8.41 14.00 10.07 4.22 3.88 4.09 21.50 24.36 22.05
Q2 13.54 11.62 12.97 9.72 21.28 14.13 22.92 21.30 22.61
Q3 18.89 23.11 20.14 17.24 10.60 14.70 26.81 18.13 25.15
Q4 27.69 31.49 28.81 26.90 19.51 24.08 20.67 28.20 22.11
Q5 31.47 19.78 28.00 41.93 44.73 43.00 8.10 8.01 8.09
Christians
All 100 100 100 100 100 100 100 100 100
Q1 2.01 1.57 1.93 6.40 5.36 6.15 35.90 54.45 36.84
Q2 8.51 21.89 10.91 14.93 13.37 14.55 38.41 13.93 37.16
Q3 11.89 25.65 14.35 11.96 4.49 10.16 17.69 31.62 18.40
Q4 37.66 22.30 34.92 28.62 23.14 27.30 3.92 0.00 3.72
Q5 39.92 28.60 37.90 38.08 53.64 41.84 4.08 0.00 3.87
Sikhs
All 100 100 100 100 100 100 100 100 100
Source: Calculated from the Unit level data of NSSO (55th Round and 61
st Round)
12. Distribution of Primary Sector Employment in Rural Areas by MPCE Quintile Table 6.13 shows the distribution of the Primary Sector employment in rural areas by
MPCE quintiles and presents an interesting picture. The poorer sections of the

Christians and Sikhs are now less involved in the primary sector than they were a
decade before, whereas the affluent section of the Christians and Sikhs are entering
more and more into the primary sector, which is supported by the increase in operational
land holdings of these communities over time. This, highlights the fact that the better-off
sections among these NMCs have been acquiring land more than the rest of the
population. However, for the Buddhist communities, the scenario remains unchanged as
a large number of the poorer section is still engaged in the primary sector.
Table 6.13: Distribution of Primary Sector in Rural Areas by MPCE Quintile (%)
Community Quintiles 1993-94 2004-05
Q1 22.08 12.99
Q2 21.98 11.40
Q3 22.42 15.31
Q4 18.59 24.83
Christian
Q5 14.93 35.47
Q1 17.04 2.97
Q2 19.02 7.86
Q3 18.37 11.75
Q4 21.37 17.98
Sikh
Q5 24.19 59.44
Q1 21.53 24.54
Q2 23.13 23.64
Q3 22.64 20.70
Q4 20.35 18.17
Buddhist
Q5 12.35 12.96
Q1 0.00 0.00
Q2 0.00 0.00
Q3 99.42 0.00
Q4 0.00 0.00
Parsi*
Q5 0.58 100.00
Source: Calculated from the Unit level data of NSSO (55th Round and 61
st Round)
*Insignificant rural sample size may lead to the unreliable estimates for rural areas
13. Conclusion
The employment status of the different notified minority communities reflects various
socio-economic factors working behind them. For instance, Q1 of the MPCE consists of
a larger proportion of the casual workers among all the NMCs, indicating that the poorer
sections of the communities are in casual employment. These sections of the
communities are largely not equipped with the required education, technical skills and
capital to initiate self-enterprise or enter into regular employment. They also form a large
proportion of the landless people and hence their self-employment in the agricultural
sector is also limited. They, therefore, resort to casual employment. The Buddhists, both
in rural and urban areas, depend critically on casual employment for a livelihood and this

is much more among the poorest quintile group. For all NMCs, the share of casual
workers declines among the higher quintile groups.
As far as the regular workers are concerned, they are largely educated. The educational
levels of the NMCs by MPCE quintiles, as discussed in the previous chapters, has
indicated that well-off sections of the communities (Q5) receive higher levels of
education. Here, the same affluent sections of the NMCs are showing more participation
into regular employment. It can therefore be inferred that better education improves their
access to regular employment. The Christians and Buddhists, especially among higher
quintiles and more so in urban locations, are found to be working as regular salaried
workers. This is directly correlated to their higher educational attainment upto graduation
and above.
Unlike the case of casual and regular employment, self-employment comprises of
persons from different economic strata. While the better-off households have access to
credit, technical know-how and social support to establish enterprises, the poor resort to
self-employment as a survival strategy. It may, however, be interesting to note the
distinct scenario among poor Christians and Sikhs who manage to be involved in self-
employed activities. The poorest of the Buddhists are not more in the self-employed
category whereas a good proportion of those who are well-off are.

Annexure 1: Labour Force Participation Rates (%)
Rural Urban Total M F P M F P M F P
2004-05
Christian 57.69 38.46 48.10 53.55 28.34 40.95 56.48 35.48 46.00
Sikh 56.90 36.87 47.32 57.52 16.82 38.27 57.03 32.74 45.44
Buddhist 57.93 50.71 54.34 55.26 22.42 37.96 57.07 40.87 48.85
Parsi* 100.00 33.33 50.00 59.47 32.82 44.43 60.04 32.83 44.56 All
Religions 55.51 33.30 44.62 57.03 17.82 38.25 55.90 29.43 43.00
1999-00
Christian 58.29 34.21 46.14 52.19 25.24 38.64 56.42 31.47 43.84
Sikh 55.74 27.44 42.23 53.18 10.38 32.89 55.15 23.54 40.09
Buddhist 51.03 45.81 48.48 46.75 18.07 33.29 49.62 37.15 43.61
Parsi* 54.14 91.71 72.93 48.72 33.10 40.96 48.86 34.62 41.79 All
Religions 54.04 30.03 42.30 54.31 14.73 35.41 54.11 26.21 40.55
1993-94
Christian 57.57 37.63 47.61 54.28 24.75 39.63 56.58 33.82 45.24
Sikh 56.85 24.29 41.53 55.65 9.97 33.01 56.60 21.04 39.67
Buddhist 54.03 46.19 50.09 49.55 20.83 36.02 52.50 38.26 45.48
Parsi* 25.14 16.67 25.11 58.45 14.76 39.46 52.37 14.76 37.85 All
Religions 56.09 33.04 44.90 54.30 16.50 36.34 55.64 29.00 42.77 Source: National Sample Survey, Various Rounds *Insignificant rural sample size may lead to the unreliable estimates for rural areas
Annexure 2: Work Force Participation Rates (%)
Rural Urban Total
M F P M F P M F P 2004-05
Christian 56.15 35.89 46.05 50.54 24.38 37.46 54.51 32.50 43.53
Sikh 55.04 35.48 45.68 55.55 15.30 36.52 55.14 31.33 43.78
Buddhist 56.33 50.54 53.45 49.46 21.76 34.86 54.12 40.53 47.22
Parsi* 100.00 33.33 50.00 54.44 32.82 42.24 55.08 32.83 42.42
All Religions 54.62 32.70 43.88 54.86 16.60 36.53 54.68 28.67 42.01
1999-00
Christian 56.66 32.22 44.33 48.57 23.20 35.80 54.18 29.47 41.72
Sikh 54.66 27.29 41.60 51.39 9.85 31.69 53.90 23.31 39.32
Buddhist 50.39 45.79 48.14 42.05 17.12 30.35 47.65 36.85 42.44
Parsi* 54.14 91.71 72.93 48.72 33.10 40.96 48.86 34.62 41.79
All Religions 53.09 29.71 41.66 51.82 13.89 33.71 52.76 25.77 39.64
1993-94
Christian 55.46 36.01 45.75 50.34 21.97 36.27 53.93 31.86 42.93
Sikh 56.40 24.13 41.21 53.49 9.11 31.49 55.79 20.72 39.09
Buddhist 53.04 46.10 49.55 46.17 19.42 33.57 50.70 37.75 44.32
Parsi* 25.14 16.67 25.11 55.94 14.76 38.05 50.32 14.76 36.59
All Religions 55.29 32.78 44.36 52.10 15.47 34.70 54.48 28.55 41.96
Source: National Sample Survey, Various Rounds *Insignificant rural sample size may lead to the unreliable estimates for rural areas
Annexure 3: Unemployment (%)
1993-94 1999-00 2004-05
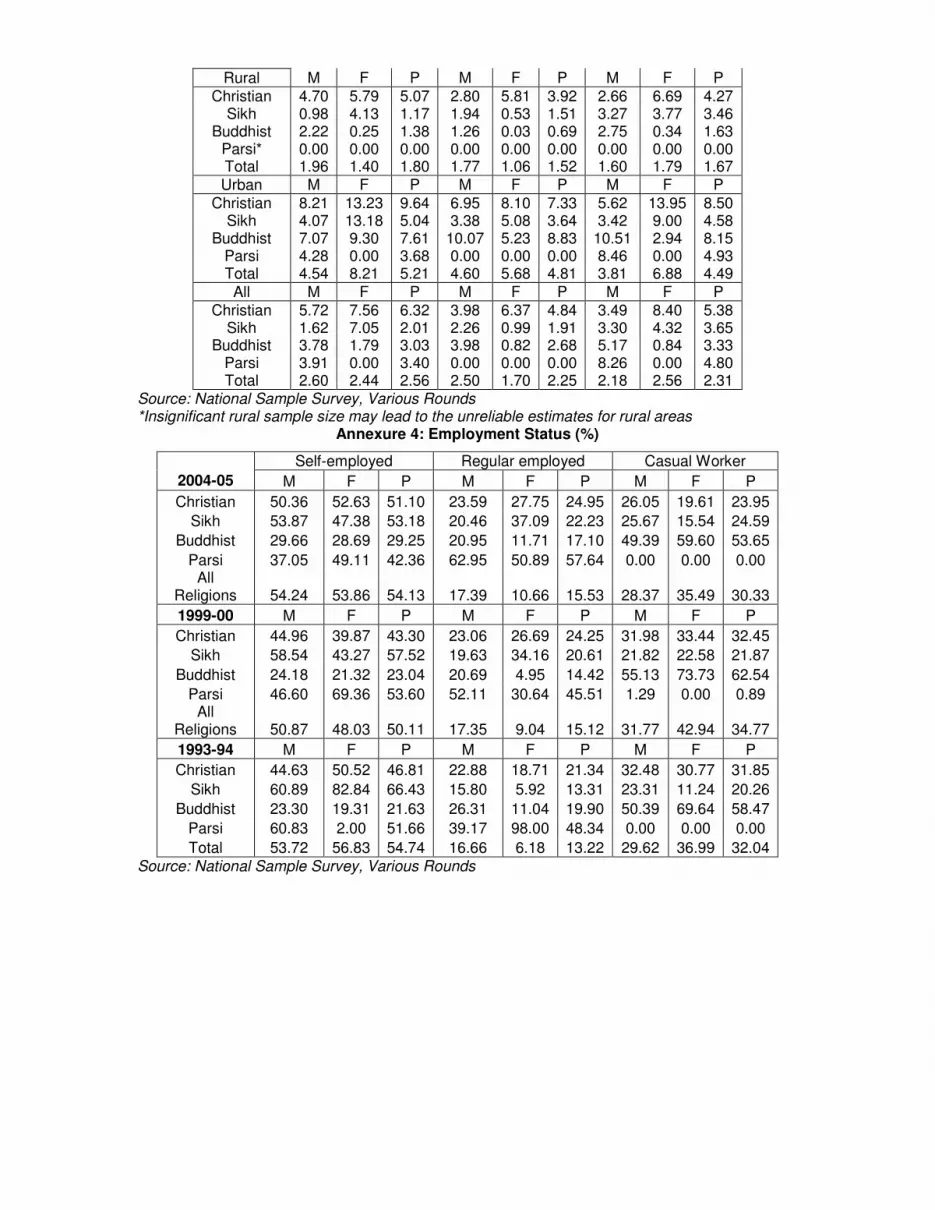
Rural M F P M F P M F P
Christian 4.70 5.79 5.07 2.80 5.81 3.92 2.66 6.69 4.27 Sikh 0.98 4.13 1.17 1.94 0.53 1.51 3.27 3.77 3.46
Buddhist 2.22 0.25 1.38 1.26 0.03 0.69 2.75 0.34 1.63 Parsi* 0.00 0.00 0.00 0.00 0.00 0.00 0.00 0.00 0.00 Total 1.96 1.40 1.80 1.77 1.06 1.52 1.60 1.79 1.67
Urban M F P M F P M F P
Christian 8.21 13.23 9.64 6.95 8.10 7.33 5.62 13.95 8.50 Sikh 4.07 13.18 5.04 3.38 5.08 3.64 3.42 9.00 4.58
Buddhist 7.07 9.30 7.61 10.07 5.23 8.83 10.51 2.94 8.15 Parsi 4.28 0.00 3.68 0.00 0.00 0.00 8.46 0.00 4.93 Total 4.54 8.21 5.21 4.60 5.68 4.81 3.81 6.88 4.49
All M F P M F P M F P
Christian 5.72 7.56 6.32 3.98 6.37 4.84 3.49 8.40 5.38 Sikh 1.62 7.05 2.01 2.26 0.99 1.91 3.30 4.32 3.65
Buddhist 3.78 1.79 3.03 3.98 0.82 2.68 5.17 0.84 3.33 Parsi 3.91 0.00 3.40 0.00 0.00 0.00 8.26 0.00 4.80 Total 2.60 2.44 2.56 2.50 1.70 2.25 2.18 2.56 2.31
Source: National Sample Survey, Various Rounds *Insignificant rural sample size may lead to the unreliable estimates for rural areas
Annexure 4: Employment Status (%)
Self-employed Regular employed Casual Worker 2004-05 M F P M F P M F P
Christian 50.36 52.63 51.10 23.59 27.75 24.95 26.05 19.61 23.95
Sikh 53.87 47.38 53.18 20.46 37.09 22.23 25.67 15.54 24.59
Buddhist 29.66 28.69 29.25 20.95 11.71 17.10 49.39 59.60 53.65
Parsi 37.05 49.11 42.36 62.95 50.89 57.64 0.00 0.00 0.00 All
Religions 54.24 53.86 54.13 17.39 10.66 15.53 28.37 35.49 30.33
1999-00 M F P M F P M F P
Christian 44.96 39.87 43.30 23.06 26.69 24.25 31.98 33.44 32.45
Sikh 58.54 43.27 57.52 19.63 34.16 20.61 21.82 22.58 21.87
Buddhist 24.18 21.32 23.04 20.69 4.95 14.42 55.13 73.73 62.54
Parsi 46.60 69.36 53.60 52.11 30.64 45.51 1.29 0.00 0.89 All
Religions 50.87 48.03 50.11 17.35 9.04 15.12 31.77 42.94 34.77
1993-94 M F P M F P M F P
Christian 44.63 50.52 46.81 22.88 18.71 21.34 32.48 30.77 31.85
Sikh 60.89 82.84 66.43 15.80 5.92 13.31 23.31 11.24 20.26
Buddhist 23.30 19.31 21.63 26.31 11.04 19.90 50.39 69.64 58.47
Parsi 60.83 2.00 51.66 39.17 98.00 48.34 0.00 0.00 0.00
Total 53.72 56.83 54.74 16.66 6.18 13.22 29.62 36.99 32.04
Source: National Sample Survey, Various Rounds
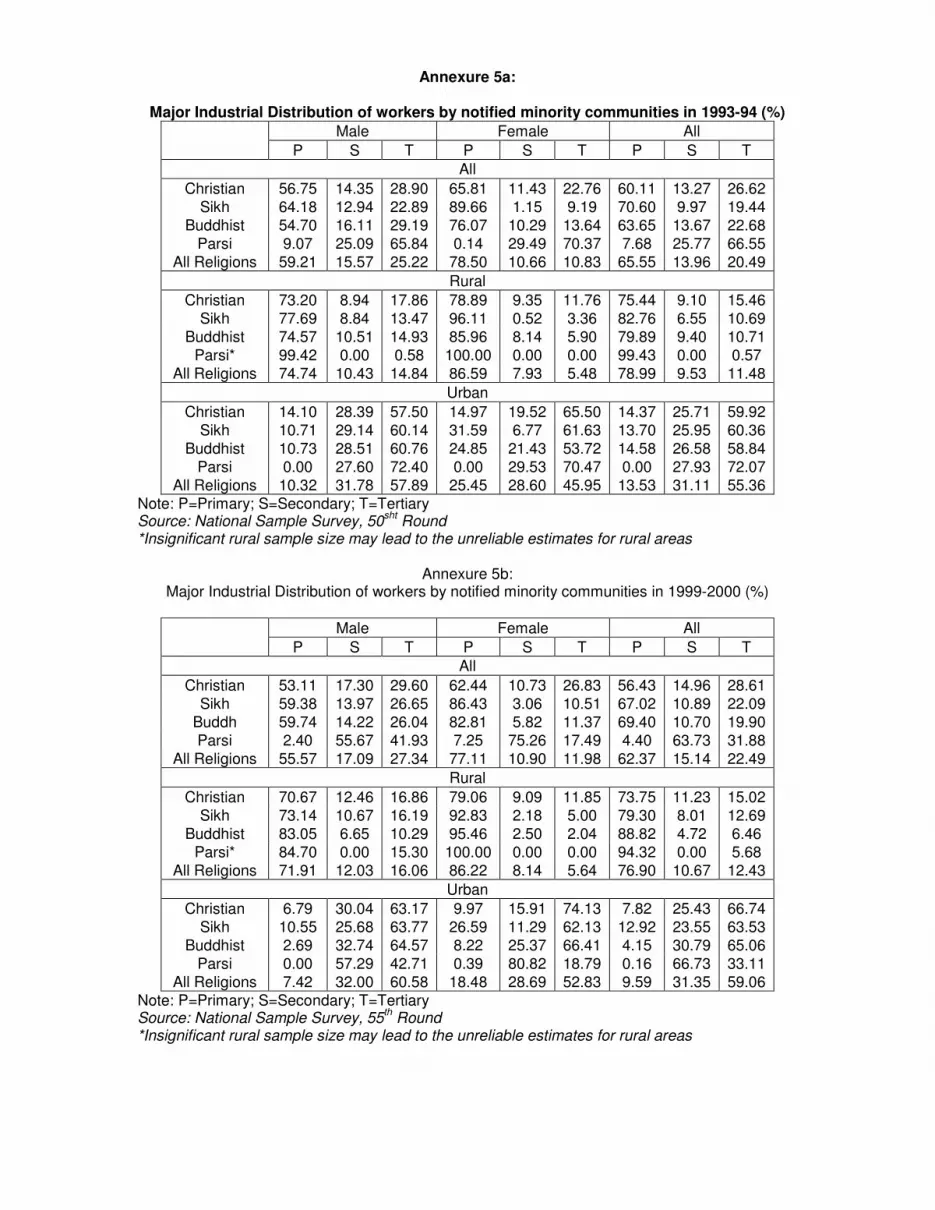
Annexure 5a:
Major Industrial Distribution of workers by notified minority communities in 1993-94 (%)
Male Female All
P S T P S T P S T
All
Christian 56.75 14.35 28.90 65.81 11.43 22.76 60.11 13.27 26.62
Sikh 64.18 12.94 22.89 89.66 1.15 9.19 70.60 9.97 19.44
Buddhist 54.70 16.11 29.19 76.07 10.29 13.64 63.65 13.67 22.68
Parsi 9.07 25.09 65.84 0.14 29.49 70.37 7.68 25.77 66.55
All Religions 59.21 15.57 25.22 78.50 10.66 10.83 65.55 13.96 20.49
Rural
Christian 73.20 8.94 17.86 78.89 9.35 11.76 75.44 9.10 15.46
Sikh 77.69 8.84 13.47 96.11 0.52 3.36 82.76 6.55 10.69
Buddhist 74.57 10.51 14.93 85.96 8.14 5.90 79.89 9.40 10.71
Parsi* 99.42 0.00 0.58 100.00 0.00 0.00 99.43 0.00 0.57
All Religions 74.74 10.43 14.84 86.59 7.93 5.48 78.99 9.53 11.48
Urban
Christian 14.10 28.39 57.50 14.97 19.52 65.50 14.37 25.71 59.92
Sikh 10.71 29.14 60.14 31.59 6.77 61.63 13.70 25.95 60.36
Buddhist 10.73 28.51 60.76 24.85 21.43 53.72 14.58 26.58 58.84
Parsi 0.00 27.60 72.40 0.00 29.53 70.47 0.00 27.93 72.07
All Religions 10.32 31.78 57.89 25.45 28.60 45.95 13.53 31.11 55.36
Note: P=Primary; S=Secondary; T=Tertiary Source: National Sample Survey, 50
sht Round
*Insignificant rural sample size may lead to the unreliable estimates for rural areas
Annexure 5b: Major Industrial Distribution of workers by notified minority communities in 1999-2000 (%)
Male Female All
P S T P S T P S T
All
Christian 53.11 17.30 29.60 62.44 10.73 26.83 56.43 14.96 28.61
Sikh 59.38 13.97 26.65 86.43 3.06 10.51 67.02 10.89 22.09
Buddh 59.74 14.22 26.04 82.81 5.82 11.37 69.40 10.70 19.90
Parsi 2.40 55.67 41.93 7.25 75.26 17.49 4.40 63.73 31.88
All Religions 55.57 17.09 27.34 77.11 10.90 11.98 62.37 15.14 22.49
Rural
Christian 70.67 12.46 16.86 79.06 9.09 11.85 73.75 11.23 15.02
Sikh 73.14 10.67 16.19 92.83 2.18 5.00 79.30 8.01 12.69
Buddhist 83.05 6.65 10.29 95.46 2.50 2.04 88.82 4.72 6.46
Parsi* 84.70 0.00 15.30 100.00 0.00 0.00 94.32 0.00 5.68
All Religions 71.91 12.03 16.06 86.22 8.14 5.64 76.90 10.67 12.43
Urban
Christian 6.79 30.04 63.17 9.97 15.91 74.13 7.82 25.43 66.74
Sikh 10.55 25.68 63.77 26.59 11.29 62.13 12.92 23.55 63.53
Buddhist 2.69 32.74 64.57 8.22 25.37 66.41 4.15 30.79 65.06
Parsi 0.00 57.29 42.71 0.39 80.82 18.79 0.16 66.73 33.11
All Religions 7.42 32.00 60.58 18.48 28.69 52.83 9.59 31.35 59.06
Note: P=Primary; S=Secondary; T=Tertiary Source: National Sample Survey, 55
th Round
*Insignificant rural sample size may lead to the unreliable estimates for rural areas
CHAPTER CHAPTER CHAPTER CHAPTER ---- VII VII VII VII
CONCLUDING REMARKS AND RECOMMENDATIONSCONCLUDING REMARKS AND RECOMMENDATIONSCONCLUDING REMARKS AND RECOMMENDATIONSCONCLUDING REMARKS AND RECOMMENDATIONS
The final chapter of this report provides a short profile of each of the four NMCs based
on the secondary data analysis undertaken in the different dimensions.
While considering the demographic, educational, health and nutrition, land and poverty
and employment-unemployment profile of the four notified minority communities (other
than Muslims), here an attempt is made to present a bird’s eye view of the four
communities, based on the facts and figures already discussed in the earlier chapters.
The way forward subsequent to this study highlights the limitations and future prospects
in terms of pursuing research on related subjects. This is followed by some
recommendations on different dimensions.
Buddhists
Among the four NMCs, Buddhists deserve primary focus, as they perform the poorest on
several indicators and require special attention. Almost nine-tenths of the Buddhists are
from the Scheduled Caste population, which itself speaks volumes. The poverty level of
this community is the highest among the four NMCs (30 per cent). Almost 72 per cent of
the Buddhists do not possess any operational landholdings. This landlessness or land
poverty restricts their capabilities for self-employment in the agricultural sector. They are
therefore pushed out of the rural areas to grab employment opportunities in the urban
areas, most often in the casual labour market (evidenced by their high proportion of 53
per cent in this market), considered the most vulnerable form of employment. This is the
reason their rate of urbanization is high (38 per cent). Further, the work participation rate
among the Buddhist females is the highest (41 per cent), which corroborates the fact
that the male and female workers are entering into the workforce more out of poverty-
induced compulsions. However, since most of them are entering into the casual labour
market, their situation remains vulnerable.
On the several socio-economic indicators discussed, the educational level of this
community is the poorest. Only 6 per cent of the total Buddhists are graduates. Poor
educational levels, hence, prevents them from accessing regular employment. The age
at marriage for the Buddhist community is also far lower than the country’s legal age for
marriage, with 41 per cent women getting married before the age of 18 years. On most

of the health indicators, the Buddhists have fared poorly. Over the period covered by the
NFHS II (1998-99) to III (2005-06), stunting and wasting among Buddhist children has
increased, mortality rates of neonatals and children under-five have risen, anaemia
among women has increased, and the percentage of children with full immunization has
declined from 73 to 51 per cent. Given the early marriages among Buddhist females, the
proportion of teenage pregnancies are also very high among them compared to the
other NMCs.
Christians
Christians are the largest notified minority community other than Muslims. They
constitute 33.1 per cent of the general population (upper caste), 32.8 per cent of
Scheduled Tribes and 25.5 per cent of the Other Backward Classes. Scheduled Castes
among the Christians are only 8.3 per cent. The poverty level is relatively low at 11 per
cent, and the landless population is 55 per cent, which is low in comparison to other
communities. The temporal data indicates a decline in the landless among Christians
during the last one decade, implying more households of the community have access to
operational landholdings, either through ownership or leasing in of land for cultivation.
Large operational landholdings, on the other hand, have experienced an increase.
The rate of urbanization of Christians is 34 per cent. The literacy and educational level is
relatively higher than the other communities (except for Parsis). The male-female gap in
literacy is also lower. This enables them to enter into the regular employment in higher
proportions. Even the rate of self-employment among Christians is high. Casual
employment among Christians is 23 per cent, which is lower than the national average
but more than that of Sikhs.
Christians have the highest proportion of non-institutional child deliveries as well as
having registered an increase in the neonatal mortality rate. The total fertility rate among
Christian women is higher compared to other NMCs, other than Muslims.
Sikhs
The Sikh community records a relatively low poverty level (5 per cent). This community
constitutes of 46.4 per cent of the general population, 31.1 per cent of the Scheduled
Castes and 21.8 per cent of the Other Backward Classes. Despite the low poverty level,
the landlessness among the Sikhs is high (66.50 per cent) and during the last one
decade, it has witnessed an increase. However, there has been an increase in the
proportion of Sikhs with large operational landholdings. It indicates that the affluent Sikhs

are occupying more and more operational landholdings to cultivate in the rural areas.
This hints at a process of land acquisition by the better-off sections from the poorer
masses, or leasing in of landholdings from rural poor who are not in a position to
cultivate them themselves. In the urban areas, Sikhs have been found in a large
proportion in trade-related activities, many of which are entrepreneurial in nature. Sikhs
thus have the largest proportion of self-employed workers (63.65 per cent), taking the
rural and urban areas together. However, there is an interesting fact to note that while
the Sikh males are highly involved in self-employment, their female counterparts are
more into regular employment. The female regular workers are predominantly among
the better-off sections (Q5 quintile group). Among the relatively poorer Sikh women (in
the Q2 and Q3 quintile groups), the women participate in self-employment, as helpers,
unpaid family workers or home-based workers. This is also reflective of the socio-cultural
barriers among certain segments of the Sikh community wherein market-based, paid
casual work may not be desirable for women, given the stronghold of patriarchal biases.
These biases are also evidenced in the low child sex-ratios for the community.
It is noteworthy that the Sikh community records some better indicators of health, such
as improvements in underweight and stunting among children, low child mortality,
relatively low prevalence of anaemia among children and women and better
immunization levels. Most of these indicators reflect the better income levels of Sikhs. A
distinctive factor of Sikh women is the high proportion of those who have discussions on
family planning with their husbands (41 per cent) and with friends/ neighbours.
The educational level among Sikh females is also higher than that of the males. Nearly
16 per cent of the total Sikh females are graduates, which is the highest among all the
communities. Regular and casual workers are found in lower proportions among the
Sikh community. The rate of urbanization is also relatively lower (27 per cent); the
community still remains predominantly rural.
Parsis
The case of Parsis is different. To quote the Census: “The Parsi population deserves an
exceptional but definite mention and place in the this volume10 due to their very small
numbers not only in India, but also in the world. As per 2001 Census, the Parsi
10
The First Report on Religion Data, Census of India, 2001; p. xxiv.

population in the country is 69,601 as against their population of 76,382 in 1991 census.
This is a clear visible but extremely unfortunate decline in the rich civilization of
Zoroastrians and its people. It is apparent in the 2001 Census results that urgent and
drastic interventions are required by all concerned including possibly by the government
and definitely the Parsi community leaders to ensure survival of Parsi population in India.
Fertility improvement innovative initiatives rather than fertility control measures adopted
by the community so far are possibly the need of the hour before it reaches a point of no
return…” (p.xxiv, 2001).
The Census, however, has not provided much data to study the community in detail. The
National Sample Surveys do provides some estimates, however, the sample is quite
small, particularly in the rural areas, making the estimates unreliable. This community is
predominantly urban-based and a very small proportion resides in the rural areas. The
community has achieved universal literacy and higher education is also extensively
pursued by both males and females. The work participation rates are also generally
higher in the urban areas not only for men but also for the Parsi women (at 33 per cent).
Given the higher educational qualifications, the urban regular workforce among the
community is expectedly the highest (59 per cent) compared to the four NMCs. A
predominant concentration of tertiary sector activities is noted for the Parsis, both men
and women. The level at which they undertake this work is mostly administrative,
executive or managerial, based on the occupational distribution. While the Parsi men are
mostly involved in finance, business and real estate-related tertiary activities, the Parsi
women are more in the formal sector, with jobs within education, health, public
administration and so on. Being large entrepreneurs or salaried professionals, they are
economically much better-off and do not figure in poverty estimates. In a nutshell, they
are among the most advanced communities of the country.
Five religious communities have been notified as minority communities under Section
2(c) of the National Commission for Minorities Act, 1992. These are: Muslims, Sikhs,
Christians, Buddhists and Zoroastrians (Parsis). A comprehensive account of the social,
economic and educational status of the Muslim community in India has been provided in
the Sachar Committee Report (GOI, 2006). The mandate of the present report is to
focus on the socio-economic status of the other four minorities, excluding the Muslims,
that is, the Sikhs, Christians, Buddhists (including Neo Buddhists) and Zoroastrians
(Parsis). The report analyzes secondary sources of data such as the Census and NSS,
in addition to information from the National Family Health Survey (NFHS) at the all-India

level, to provide a profile of the educational, social and economic status of these four
minority communities.
The Way Forward
This study is the first attempt of its kind made feasible due to the availability of the
religion-based information from the Census of India and the initiative of the National
Commission for Minorities (NCM), Government of India. The Sachar Committee report
paved the path for research on the notified minority communities. This report is an
attempt to provide a socio-economic profile of the NMCs based on the analysis of all
sets of information available from secondary sources. It reveals the possible potential for
undertaking research on the subject in future.
Given the time and brief mandate of this study, we have been able to provide a broad
spectrum of what different indicators reveal for each of the NMCs. It was feasible only to
undertake an all India profiling to do justice to the information available.
A lot more research and analysis is feasible at the state and regional level, which will
require more time and resources. Such analysis can elicit a more finally-nuanced picture
of the NMCs, given the widespread social, cultural and regional variations across the
country. We hope this report will generate further interest among the research
community to undertake studies on the subject.
Recommendations
The need for making data available across NMCs, enhancing the legal basis for
ensuring equitable access as well as providing equal opportunities also enlisted in the
Sachar Committee report, may be overarching recommendations for this report also.
The emphasis laid on inclusive growth in the Eleventh Five Year Plan cannot be attained
unless issues of inequity and discrimination affecting the NMCs are also addressed.
Universal coverage of education and health, at least up to the basic levels, is critical.
Community and social group-specific factors affect enrolment into schools and
educational attainment. Class and gender dimensions also influence perceptions,
attitudes and behaviour. By undertaking a separate analysis of the NMCs, some of these
aspects are highlighted, which can be given due attention by planners and policy-
makers.
Health

• Children’s nutrition levels require special attention from the view of
addressing food security levels among the poor and backward sections of the
population. The Buddhist children report the worst stunting, washing and child
mortality indicators.
• Improving the anaemia status of mothers is critical for reduction of child
anaemia levels as well as for improving nutritional status. Efforts through
existing ICDS programmes to provide iron supplementation need to be
strengthened further to improve access of the minorities, especially the
socially and economically deprived sections among them.
• Outreach of immunization with children receiving all vaccinations must be
given special attention for the NMCs.
• Awareness regarding early marriages and childbirths for their detrimental
health impacts on women and children is required.
• Overall nutritional, child care and health awareness is essential. This
improves with higher female literacy levels.
• The Sikh community records the lowest child sex-ratios among the 0-9 years
category, which is extremely worrisome.
Education
• The literacy rate is the lowest among Scheduled Caste Sikhs, followed by
OBC Sikhs across all communities. The latter have in fact registered a
decline in literacy rate over time. The Sikhs have the highest proportion of out
of school children. Education that is sought to be universalised at least at the
elementary level, must address this community in a targeted fashion to
include the SC and OBC Sikhs specially.
Higher Education
• The country as a whole requires attention in this area, given the low
proportion of higher-educated persons. The NMCs too require support
through reservations, scholarships and special tutorials to increase their
share in higher education levels. The Buddhists, who are predominantly SCs,

have lower shares of literates among the tertiary levels of education than the
all-India figures.
Skill Development
• Special support is required for improving access to technical degrees and
diplomas, especially for the poor and backward segments of the NMCs.
Entrepreneurial Support and Development
• Social barriers influence participation in the labour markets and act as
deterrents for entrepreneurial endeavours. This is further compounded by
inaccessibility to credit channels. Mere policies to develop entrepreneurship
or provide training and credit may not be adequate for elimination of such
barriers. Positive interventions through direct policies such as reservations for
the socio-economically poorer segments are required.
Credit Access and Self Help Groups (SHGs)
• Improving access to credit and initiatives such as SHGs, especially for
women who are not in a position to participate in labour activities outside the
household given their domestic responsibilities, can help enhance female
work participation.
• Given the high dependence on self employment by most NMCs, improving
access to credit can the scale of their activities.
Social Security
• Improving social security measures for the NMCs, especially the poor,
informal sector workers among them is extremely critical.

Appendix Table 1: Districtwise Percentage Distribution of Minority
Population in India, 2001 (Rural + Urban)
State District Christian Sikh Buddhist
Jammu & Kashmir Anantnag 0.02 0.47 0.01
Jammu & Kashmir Badgam 0.03 0.84 0.01
Jammu & Kashmir Baramula 0.05 1.04 0.06
Jammu & Kashmir Doda 0.06 0.28 0.27
Jammu & Kashmir Jammu 0.70 7.40 0.07
Jammu & Kashmir Kargil 0.06 0.19 14.98
Jammu & Kashmir Kathua 0.27 1.66 0.03
Jammu & Kashmir Kupwara 0.08 0.53 0.03
Jammu & Kashmir Leh (Ladakh) 0.29 0.43 77.30
Jammu & Kashmir Pulwama 0.10 1.35 0.01
Jammu & Kashmir Punch 0.08 2.76 0.03
Jammu & Kashmir Rajauri 0.04 2.40 0.02
Jammu & Kashmir Srinagar 0.13 1.08 0.04
Jammu & Kashmir Udhampur 0.35 1.04 0.03
Himachal Pradesh Bilaspur 0.01 0.79 0.06
Himachal Pradesh Chamba 0.23 0.54 0.51
Himachal Pradesh Hamirpur 0.01 0.13 0.05
Himachal Pradesh Kangra 0.16 0.64 0.79
Himachal Pradesh Kinnaur 0.41 0.33 24.77
Himachal Pradesh Kullu 0.25 0.33 3.61
Himachal Pradesh Lahul & Spiti 0.25 0.10 58.80
Himachal Pradesh Mandi 0.03 0.53 0.32
Himachal Pradesh Shimla 0.20 0.67 0.46
Himachal Pradesh Sirmaur 0.05 2.64 0.47
Himachal Pradesh Solan 0.18 2.29 0.19
Himachal Pradesh Una 0.03 5.21 0.11
Punjab Amritsar 1.68 76.99 0.04
Punjab Bathinda 0.14 74.07 0.02
Punjab Faridkot 0.17 77.53 0.02
Punjab Fatehgarh Sahib 0.20 74.56 0.01
Punjab Firozpur 1.32 51.35 0.03
Punjab Gurdaspur 7.08 44.44 0.10
Punjab Hoshiarpur 0.86 38.82 0.20
Punjab Jalandhar 1.13 37.75 0.96
Punjab Kapurthala 0.58 59.46 1.03
Punjab Ludhiana 0.38 57.52 0.06
Punjab Mansa 0.06 78.33 0.00
Punjab Moga 0.29 85.80 0.00
Punjab Muktsar 0.18 74.11 0.03
Punjab Nawanshahr 0.11 37.42 0.85
Punjab Patiala 0.20 55.53 0.01
Punjab Rupnagar 0.31 56.95 0.02
Punjab Sangrur 0.10 70.00 0.01
Cont….
State District Christian Sikh Buddhist
Chandigarh Chandigarh 0.85 16.12 0.15

Uttaranchal Almora 0.15 0.08 0.03
Uttaranchal Bageshwar 0.14 0.05 0.07
Uttaranchal Chamoli 0.06 0.12 0.05
Uttaranchal Champawat 0.28 0.21 0.03
Uttaranchal Dehradun 0.81 2.60 0.58
Uttaranchal Garhwal 0.27 0.13 0.01
Uttaranchal Hardwar 0.21 1.20 0.05
Uttaranchal Nainital 0.49 2.11 0.08
Uttaranchal Pithoragarh 0.26 0.09 0.04
Uttaranchal Rudraprayag 0.02 0.02 0.01
Uttaranchal Tehri Garhwal 0.09 0.09 0.01
Uttaranchal Udham Singh Nagar 0.31 11.45 0.12
Uttaranchal Uttarkashi 0.08 0.10 0.42
Haryana Ambala 0.28 13.06 0.02
Haryana Bhiwani 0.02 0.18 0.02
Haryana Faridabad 0.32 1.64 0.08
Haryana Fatehabad 0.06 16.95 0.02
Haryana Gurgaon 0.20 0.40 0.05
Haryana Hisar 0.08 0.95 0.02
Haryana Jhajjar 0.01 0.15 0.02
Haryana Jind 0.02 2.45 0.01
Haryana Kaithal 0.12 9.38 0.02
Haryana Karnal 0.08 9.67 0.02
Haryana Kurukshetra 0.18 16.42 0.04
Haryana Mahendragarh 0.00 0.25 0.01
Haryana Panchkula 0.42 7.73 0.03
Haryana Panipat 0.11 2.84 0.07
Haryana Rewari 0.04 0.22 0.02
Haryana Rohtak 0.02 0.54 0.06
Haryana Sirsa 0.15 27.13 0.03
Haryana Sonipat 0.04 0.39 0.06
Haryana Yamunanagar 0.24 8.02 0.01
Delhi Central 0.72 2.65 0.06
Delhi East 0.95 3.50 0.31
Delhi New Delhi 3.50 2.45 0.22
Delhi North 0.88 2.66 0.26
Delhi North East 0.43 1.05 0.27
Delhi North West 0.41 3.21 0.12
Delhi South 1.67 3.31 0.17
Delhi South West 1.45 1.68 0.14
Delhi West 0.75 11.62 0.09
Rajasthan Bhilwara 0.06 0.09 0.00
Rajasthan Bikaner 0.07 1.43 0.01
Rajasthan Bundi 0.03 1.13 0.00
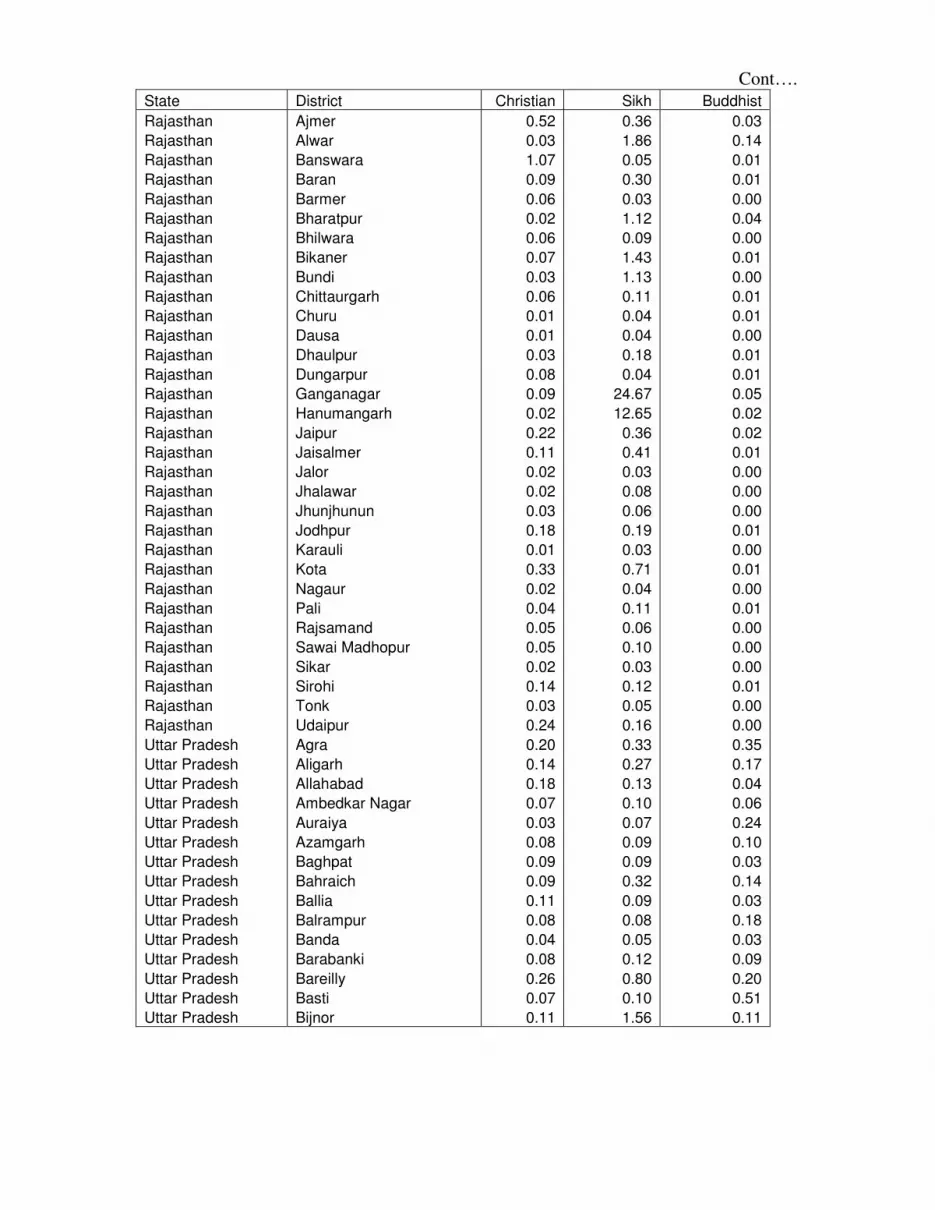
Cont….
State District Christian Sikh Buddhist
Rajasthan Ajmer 0.52 0.36 0.03
Rajasthan Alwar 0.03 1.86 0.14
Rajasthan Banswara 1.07 0.05 0.01
Rajasthan Baran 0.09 0.30 0.01
Rajasthan Barmer 0.06 0.03 0.00
Rajasthan Bharatpur 0.02 1.12 0.04
Rajasthan Bhilwara 0.06 0.09 0.00
Rajasthan Bikaner 0.07 1.43 0.01
Rajasthan Bundi 0.03 1.13 0.00
Rajasthan Chittaurgarh 0.06 0.11 0.01
Rajasthan Churu 0.01 0.04 0.01
Rajasthan Dausa 0.01 0.04 0.00
Rajasthan Dhaulpur 0.03 0.18 0.01
Rajasthan Dungarpur 0.08 0.04 0.01
Rajasthan Ganganagar 0.09 24.67 0.05
Rajasthan Hanumangarh 0.02 12.65 0.02
Rajasthan Jaipur 0.22 0.36 0.02
Rajasthan Jaisalmer 0.11 0.41 0.01
Rajasthan Jalor 0.02 0.03 0.00
Rajasthan Jhalawar 0.02 0.08 0.00
Rajasthan Jhunjhunun 0.03 0.06 0.00
Rajasthan Jodhpur 0.18 0.19 0.01
Rajasthan Karauli 0.01 0.03 0.00
Rajasthan Kota 0.33 0.71 0.01
Rajasthan Nagaur 0.02 0.04 0.00
Rajasthan Pali 0.04 0.11 0.01
Rajasthan Rajsamand 0.05 0.06 0.00
Rajasthan Sawai Madhopur 0.05 0.10 0.00
Rajasthan Sikar 0.02 0.03 0.00
Rajasthan Sirohi 0.14 0.12 0.01
Rajasthan Tonk 0.03 0.05 0.00
Rajasthan Udaipur 0.24 0.16 0.00
Uttar Pradesh Agra 0.20 0.33 0.35
Uttar Pradesh Aligarh 0.14 0.27 0.17
Uttar Pradesh Allahabad 0.18 0.13 0.04
Uttar Pradesh Ambedkar Nagar 0.07 0.10 0.06
Uttar Pradesh Auraiya 0.03 0.07 0.24
Uttar Pradesh Azamgarh 0.08 0.09 0.10
Uttar Pradesh Baghpat 0.09 0.09 0.03
Uttar Pradesh Bahraich 0.09 0.32 0.14
Uttar Pradesh Ballia 0.11 0.09 0.03
Uttar Pradesh Balrampur 0.08 0.08 0.18
Uttar Pradesh Banda 0.04 0.05 0.03
Uttar Pradesh Barabanki 0.08 0.12 0.09
Uttar Pradesh Bareilly 0.26 0.80 0.20
Uttar Pradesh Basti 0.07 0.10 0.51
Uttar Pradesh Bijnor 0.11 1.56 0.11

Cont….
State District Christian Sikh Buddhist
Uttar Pradesh Budaun 0.11 0.09 0.16
Uttar Pradesh Bulandshahr 0.13 0.16 0.07
Uttar Pradesh Chandauli 0.07 0.14 0.03
Uttar Pradesh Chitrakoot 0.11 0.06 0.01
Uttar Pradesh Deoria 0.06 0.08 0.03
Uttar Pradesh Etah 0.15 0.18 0.67
Uttar Pradesh Etawah 0.04 0.11 0.25
Uttar Pradesh Faizabad 0.07 0.10 0.05
Uttar Pradesh Farrukhabad 0.14 0.20 0.32
Uttar Pradesh Fatehpur 0.04 0.07 0.02
Uttar Pradesh Firozabad 0.08 0.18 0.15
Uttar Pradesh Gautam Buddha Nagar 0.41 0.57 0.16
Uttar Pradesh Ghaziabad 0.27 0.64 0.10
Uttar Pradesh Ghazipur 0.07 0.05 0.32
Uttar Pradesh Gonda 0.06 0.10 0.05
Uttar Pradesh Gorakhpur 0.17 0.09 0.14
Uttar Pradesh Hamirpur 0.03 0.04 0.01
Uttar Pradesh Hardoi 0.06 0.18 0.36
Uttar Pradesh Hathras 0.08 0.16 0.08
Uttar Pradesh Jalaun 0.06 0.09 0.37
Uttar Pradesh Jaunpur 0.08 0.09 0.44
Uttar Pradesh Jhansi 0.41 0.33 0.07
Uttar Pradesh Jyotiba Phule Nagar 0.28 0.37 0.02
Uttar Pradesh Kannauj 0.04 0.06 0.16
Uttar Pradesh Kanpur Dehat 0.08 0.10 0.20
Uttar Pradesh Kanpur Nagar 0.33 0.89 0.11
Uttar Pradesh Kaushambi 0.03 0.04 0.02
Uttar Pradesh Kheri 0.12 2.64 0.66
Uttar Pradesh Kushinagar 0.05 0.03 0.24
Uttar Pradesh Lalitpur 0.11 0.11 0.02
Uttar Pradesh Lucknow 0.34 0.63 0.12
Uttar Pradesh Maharajganj 0.08 0.14 0.74
Uttar Pradesh Mahoba 0.08 0.08 0.01
Uttar Pradesh Mainpuri 0.06 0.09 1.19
Uttar Pradesh Mathura 0.09 0.16 0.04
Uttar Pradesh Mau 0.06 0.05 0.18
Uttar Pradesh Meerut 0.25 0.88 0.09
Uttar Pradesh Mirzapur 0.05 0.08 0.03
Uttar Pradesh Moradabad 0.23 0.23 0.06
Uttar Pradesh Muzaffarnagar 0.09 0.54 0.07
Uttar Pradesh Pilibhit 0.11 4.59 0.11
Uttar Pradesh Pratapgarh 0.05 0.07 0.21
Uttar Pradesh Rae Bareli 0.05 0.10 0.01
Uttar Pradesh Rampur 0.38 3.21 0.12
Uttar Pradesh Saharanpur 0.17 0.71 0.13
Uttar Pradesh Sant Kabir Nagar 0.05 0.04 0.27
Uttar Pradesh Sant Ravidas Nagar 0.06 0.05 0.13

Cont…..
State District Christian Sikh Buddhist
Uttar Pradesh Shahjahanpur 0.11 2.14 0.20
Uttar Pradesh Shrawasti 0.05 0.07 0.05
Uttar Pradesh Siddharthnagar 0.06 0.06 0.39
Uttar Pradesh Sitapur 0.06 0.32 0.23
Uttar Pradesh Sonbhadra 0.22 0.13 0.21
Uttar Pradesh Sultanpur 0.08 0.13 0.15
Uttar Pradesh Unnao 0.04 0.07 0.07
Uttar Pradesh Varanasi 0.14 0.14 0.03
Bihar Araria 0.06 0.02 0.05
Bihar Aurangabad 0.01 0.00 0.01
Bihar Banka 0.19 0.01 0.02
Bihar Begusarai 0.03 0.01 0.01
Bihar Bhagalpur 0.08 0.05 0.04
Bihar Bhojpur 0.03 0.02 0.02
Bihar Buxar 0.09 0.01 0.32
Bihar Darbhanga 0.02 0.01 0.00
Bihar Gaya 0.03 0.02 0.04
Bihar Gopalganj 0.01 0.00 0.00
Bihar Jamui * 0.33 0.00 0.01
Bihar Jehanabad 0.01 0.00 0.01
Bihar Kaimur (Bhabua) 0.02 0.01 0.22
Bihar Katihar 0.21 0.09 0.00
Bihar Khagaria 0.01 0.01 0.02
Bihar Kishanganj 0.22 0.04 0.03
Bihar Lakhisarai 0.01 0.03 0.01
Bihar Madhepura 0.02 0.00 0.00
Bihar Madhubani 0.01 0.02 0.01
Bihar Munger 0.10 0.03 0.01
Bihar Muzaffarpur 0.03 0.02 0.01
Bihar Nalanda 0.01 0.01 0.01
Bihar Nawada 0.01 0.00 0.00
Bihar Pashchim Champaran 0.20 0.02 0.05
Bihar Patna 0.19 0.10 0.02
Bihar Purba Champaran 0.02 0.01 0.02
Bihar Purnia 0.17 0.05 0.00
Bihar Rohtas 0.03 0.10 0.01
Bihar Saharsa 0.03 0.01 0.01
Bihar Samastipur 0.03 0.01 0.00
Bihar Saran 0.01 0.00 0.00
Bihar Sheikhpura 0.07 0.01 0.01
Bihar Sheohar 0.02 0.02 0.02
Bihar Sitamarhi 0.02 0.01 0.01
Bihar Siwan 0.01 0.01 0.00
Bihar Supaul 0.11 0.02 0.00
Bihar Vaishali 0.00 0.01 0.01

Cont…..
State District Christian Sikh Buddhist
Sikkim East 5.92 0.39 26.42
Sikkim North 3.96 0.36 55.09
Sikkim South 9.70 0.04 23.65
Sikkim West 5.87 0.01 27.26
Arunachal Pradesh Changlang 17.49 0.04 34.08
Arunachal Pradesh Dibang Valley 10.63 0.08 4.99
Arunachal Pradesh East Kameng 25.45 0.08 1.23
Arunachal Pradesh East Siang 15.34 0.09 0.88
Arunachal Pradesh Lohit 5.75 0.15 15.98
Arunachal Pradesh Lower Subansiri 24.51 0.05 0.29
Arunachal Pradesh Papum Pare 29.98 0.22 2.73
Arunachal Pradesh Tawang 0.79 1.08 74.72
Arunachal Pradesh Tirap 50.04 0.10 0.67
Arunachal Pradesh Upper Siang 12.86 0.17 7.81
Arunachal Pradesh Upper Subansiri 5.85 0.05 1.20
Arunachal Pradesh West Kameng 3.30 0.57 44.38
Arunachal Pradesh West Siang 19.36 0.09 3.13
Nagaland Dimapur 61.19 0.17 0.18
Nagaland Kohima 89.93 0.06 0.10
Nagaland Mokokchung 94.48 0.05 0.04
Nagaland Mon 95.41 0.02 0.05
Nagaland Phek 96.53 0.02 0.04
Nagaland Tuensang 97.94 0.03 0.02
Nagaland Wokha 96.15 0.02 0.06
Nagaland Zunheboto 97.49 0.06 0.02
Manipur Bishnupur 2.95 0.06 0.00
Manipur Chandel 92.23 0.11 0.05
Manipur Churachandpur 93.54 0.05 0.02
Manipur Imphal East 5.93 0.05 0.02
Manipur Imphal West 4.07 0.15 0.07
Manipur Senapati 78.41 0.10 0.82
Manipur Tamenglong 94.88 0.06 0.01
Manipur Thoubal 1.41 0.03 0.01
Manipur Ukhrul 95.16 0.07 0.06
Mizoram Aizawl 93.31 0.03 0.18
Mizoram Champhai 96.93 0.02 0.15
Mizoram Kolasib 89.60 0.05 0.27
Mizoram Lawngtlai 44.66 0.10 52.17
Mizoram Lunglei 79.58 0.05 16.34
Mizoram Mamit 80.53 0.04 13.66
Mizoram Saiha 97.64 0.00 0.12
Mizoram Serchhip 97.46 0.00 0.16
Tripura Dhalai 4.82 0.04 9.15
Tripura North Tripura 5.91 0.02 4.44
Tripura South Tripura 3.08 0.02 5.60
Tripura West Tripura 1.90 0.05 0.10

Cont….
State District Christian Sikh Buddhist
Meghalaya East Garo Hills 88.95 0.02 0.14
Meghalaya East Khasi Hills 61.02 0.38 0.35
Meghalaya Jaintia Hills 65.26 0.01 0.07
Meghalaya Ri Bhoi 79.71 0.09 0.08
Meghalaya South Garo Hills 89.65 0.03 0.16
Meghalaya West Garo Hills 54.57 0.05 0.28
Meghalaya West Khasi Hills 94.76 0.01 0.02
Assam Barpeta 0.32 0.02 0.01
Assam Bongaigaon 2.07 0.06 0.04
Assam Cachar 2.17 0.04 0.05
Assam Darrang 6.47 0.03 0.12
Assam Dhemaji 1.12 0.02 0.21
Assam Dhubri 0.76 0.01 0.02
Assam Dibrugarh 3.80 0.22 0.35
Assam Goalpara 7.87 0.01 0.02
Assam Golaghat 5.52 0.11 0.34
Assam Hailakandi 1.00 0.00 0.11
Assam Jorhat 1.86 0.16 0.24
Assam Kamrup 1.75 0.19 0.07
Assam Karbi Anglong 14.48 0.05 0.79
Assam Karimganj 0.87 0.01 0.03
Assam Kokrajhar 13.72 0.01 0.17
Assam Lakhimpur 4.12 0.08 0.15
Assam Marigaon 0.10 0.01 0.01
Assam Nagaon 0.93 0.13 0.05
Assam Nalbari 1.61 0.01 0.08
Assam North Cachar Hills 26.68 0.12 0.46
Assam Sibsagar 2.71 0.15 0.38
Assam Sonitpur 6.88 0.09 0.23
Assam Tinsukia 5.43 0.20 1.19
West Bengal Bankura 0.09 0.00 0.00
West Bengal Barddhaman 0.23 0.32 0.02
West Bengal Birbhum 0.24 0.01 0.01
West Bengal Dakshin Dinajpur 1.47 0.01 0.01
West Bengal Darjiling 6.17 0.14 11.02
West Bengal Haora 0.15 0.09 0.03
West Bengal Hugli 0.09 0.04 0.03
West Bengal Jalpaiguri 4.34 0.05 1.29
West Bengal Koch Bihar 0.09 0.01 0.02
West Bengal Kolkata 0.88 0.34 0.14
West Bengal Maldah 0.25 0.01 0.00
West Bengal Medinipur 0.23 0.03 0.02
West Bengal Murshidabad 0.23 0.01 0.00
West Bengal Nadia 0.64 0.02 0.01
West Bengal North Twenty Four Parganas 0.23 0.12 0.07
West Bengal Puruliya 0.28 0.02 0.01
West Bengal South Twenty Four Parganas 0.76 0.02 0.03
West Bengal Uttar Dinajpur 0.54 0.01 0.01
Cont….
State District Christian Sikh Buddhist

Jharkhand Bokaro 0.72 0.32 0.02
Jharkhand Chatra 0.61 0.10 0.00
Jharkhand Deoghar 0.36 0.03 0.02
Jharkhand Dhanbad 0.42 0.51 0.01
Jharkhand Dumka 3.18 0.05 0.03
Jharkhand Garhwa 1.19 0.04 0.00
Jharkhand Giridih 0.55 0.07 0.04
Jharkhand Godda 2.07 0.04 0.01
Jharkhand Gumla 31.56 0.04 0.02
Jharkhand Hazaribag 0.96 0.37 0.01
Jharkhand Kodarma 0.18 0.21 0.00
Jharkhand Lohardaga 3.98 0.03 0.01
Jharkhand Pakaur 5.86 0.06 0.01
Jharkhand Palamu 2.27 0.11 0.00
Jharkhand Pashchimi Singhbhum 3.35 0.14 0.04
Jharkhand Purbi Singhbhum 1.42 1.91 0.05
Jharkhand Ranchi 9.10 0.27 0.05
Jharkhand Sahibganj 6.33 0.03 0.00
Orissa Anugul 0.29 0.07 0.00
Orissa Balangir 1.03 0.03 0.00
Orissa Baleshwar 0.29 0.01 0.00
Orissa Bargarh 0.75 0.03 0.00
Orissa Baudh 0.06 0.00 0.00
Orissa Bhadrak 0.04 0.00 0.00
Orissa Cuttack 0.46 0.04 0.24
Orissa Debagarh 4.09 0.03 0.00
Orissa Dhenkanal 0.04 0.00 0.03
Orissa Gajapati 33.47 0.00 0.38
Orissa Ganjam 0.47 0.01 0.00
Orissa Jagatsinghapur 0.11 0.02 0.02
Orissa Jajapur 0.08 0.02 0.00
Orissa Jharsuguda 1.66 0.21 0.04
Orissa Kalahandi 0.52 0.05 0.00
Orissa Kandhamal 18.20 0.00 0.00
Orissa Kendrapara 0.07 0.00 0.00
Orissa Kendujhar 0.39 0.12 0.00
Orissa Khordha 0.47 0.06 0.01
Orissa Koraput 4.35 0.02 0.01
Orissa Malkangiri 1.25 0.00 0.00
Orissa Mayurbhanj 0.41 0.02 0.00
Orissa Nabarangapur 2.55 0.01 0.00
Orissa Nayagarh 0.05 0.00 0.00
Orissa Nuapada 0.28 0.14 0.01
Orissa Puri 0.18 0.00 0.01
Orissa Rayagada 6.64 0.02 0.00
Orissa Sambalpur 4.15 0.22 0.02
Orissa Sonapur 0.26 0.00 0.00
Orissa Sundargarh 16.85 0.30 0.01
Cont….
State District Christian Sikh Buddhist
Chhatisgarh Bastar 1.33 0.18 0.07
Chhatisgarh Bilaspur 0.87 0.31 0.14

Chhatisgarh Dantewada 0.86 0.08 0.05
Chhatisgarh Dhamtari 0.36 0.17 0.08
Chhatisgarh Durg 0.79 0.83 0.65
Chhatisgarh Janjgir - Champa 0.19 0.07 0.05
Chhatisgarh Jashpur 22.82 0.08 0.02
Chhatisgarh Kanker 0.44 0.10 0.19
Chhatisgarh Kawardha 0.10 0.17 0.10
Chhatisgarh Korba 1.74 0.40 0.09
Chhatisgarh Koriya 1.29 0.29 0.03
Chhatisgarh Mahasamund 0.59 0.32 0.07
Chhatisgarh Raigarh 2.85 0.15 0.07
Chhatisgarh Raipur 0.56 0.52 0.26
Chhatisgarh Rajnandgaon 0.33 0.30 2.18
Chhatisgarh Surguja 3.67 0.13 0.08
Madhya Pradesh Balaghat 0.33 0.09 4.48
Madhya Pradesh Barwani 0.34 0.19 0.04
Madhya Pradesh Betul 0.24 0.10 0.93
Madhya Pradesh Bhind 0.04 0.29 0.60
Madhya Pradesh Bhopal 1.11 0.62 1.12
Madhya Pradesh Chhatarpur 0.08 0.09 0.01
Madhya Pradesh Chhindwara 0.26 0.13 1.38
Madhya Pradesh Damoh 0.14 0.09 0.02
Madhya Pradesh Datia 0.07 0.11 1.50
Madhya Pradesh Dewas 0.17 0.21 0.06
Madhya Pradesh Dhar 0.09 0.09 0.01
Madhya Pradesh Dindori 0.44 0.04 0.02
Madhya Pradesh East Nimar 0.25 0.18 1.05
Madhya Pradesh Guna 0.08 0.57 0.07
Madhya Pradesh Gwalior 0.22 1.35 0.45
Madhya Pradesh Harda 0.10 0.15 0.06
Madhya Pradesh Hoshangabad 0.40 0.28 0.15
Madhya Pradesh Indore 0.57 0.97 0.39
Madhya Pradesh Jabalpur 1.08 0.65 0.22
Madhya Pradesh Jhabua 1.95 0.02 0.01
Madhya Pradesh Katni 0.25 0.14 0.02
Madhya Pradesh Mandla 0.81 0.07 0.05
Madhya Pradesh Mandsaur 0.09 0.10 0.03
Madhya Pradesh Morena 0.03 0.07 0.02
Madhya Pradesh Narsimhapur 0.07 0.12 0.08
Madhya Pradesh Neemuch 0.21 0.22 0.03
Madhya Pradesh Panna 0.04 0.04 0.03
Madhya Pradesh Raisen 0.11 0.11 0.02
Madhya Pradesh Rajgarh 0.06 0.05 0.02
Madhya Pradesh Ratlam 0.31 0.13 0.03
Madhya Pradesh Rewa 0.05 0.05 0.03

Cont….
State District Christian Sikh Buddhist
Madhya Pradesh Sagar 0.22 0.14 0.08
Madhya Pradesh Satna 0.08 0.09 0.03
Madhya Pradesh Sehore 0.08 0.07 0.02
Madhya Pradesh Seoni 0.14 0.04 0.54
Madhya Pradesh Shahdol 0.22 0.11 0.02
Madhya Pradesh Shajapur 0.06 0.06 0.02
Madhya Pradesh Sheopur 0.04 1.05 0.02
Madhya Pradesh Shivpuri 0.06 0.49 0.31
Madhya Pradesh Sidhi 0.12 0.10 0.02
Madhya Pradesh Tikamgarh 0.03 0.03 0.01
Madhya Pradesh Ujjain 0.25 0.24 0.08
Madhya Pradesh Umaria 0.13 0.07 0.03
Madhya Pradesh Vidisha 0.07 0.10 0.04
Madhya Pradesh West Nimar 0.09 0.20 0.01
Gujarat Ahmadabad 0.72 0.20 0.04
Gujarat Amreli 0.01 0.01 0.01
Gujarat Anand 1.59 0.05 0.00
Gujarat Banas Kantha 0.02 0.01 0.00
Gujarat Bharuch 0.64 0.10 0.02
Gujarat Bhavnagar 0.07 0.04 0.00
Gujarat Dohad 0.54 0.02 0.00
Gujarat Gandhinagar 0.27 0.15 0.03
Gujarat Jamnagar 0.13 0.09 0.06
Gujarat Junagadh 0.05 0.03 0.02
Gujarat Kachchh 0.18 0.21 0.01
Gujarat Kheda 1.15 0.05 0.00
Gujarat Mahesana 0.05 0.05 0.00
Gujarat Narmada 1.00 0.05 0.01
Gujarat Navsari 0.31 0.19 0.03
Gujarat Panch Mahals 0.11 0.02 0.00
Gujarat Patan 0.02 0.02 0.00
Gujarat Porbandar 0.06 0.02 0.01
Gujarat Rajkot 0.09 0.03 0.01
Gujarat Sabar Kantha 0.27 0.02 0.00
Gujarat Surat 1.67 0.08 0.21
Gujarat Surendranagar 0.04 0.07 0.00
Gujarat The Dangs 9.51 0.04 0.01
Gujarat Vadodara 0.57 0.25 0.02
Gujarat Valsad 1.09 0.07 0.03
Daman & Diu Daman 2.77 0.12 0.11
Daman & Diu Diu 0.46 0.01 0.01
Dadra & Nagar Haveli Dadra & Nagar Haveli 2.75 0.06 0.21
Maharashtra Ahmadnagar 0.64 0.14 0.89
Maharashtra Akola 0.21 0.07 17.98
Maharashtra Amravati 0.28 0.11 13.44
Maharashtra Aurangabad 0.54 0.15 8.53
Maharashtra Bhandara 0.16 0.07 12.72

Cont……
State District Christian Sikh Buddhist
Maharashtra Bid 0.06 0.03 3.01
Maharashtra Buldana 0.11 0.07 13.73
Maharashtra Chandrapur 0.55 0.24 13.23
Maharashtra Dhule 0.29 0.08 0.86
Maharashtra Gadchiroli 0.35 0.06 8.04
Maharashtra Gondiya 0.11 0.15 9.96
Maharashtra Hingoli 0.05 0.05 14.99
Maharashtra Jalgaon 0.15 0.07 3.43
Maharashtra Jalna 0.77 0.09 7.50
Maharashtra Kolhapur 0.46 0.06 1.08
Maharashtra Latur 0.07 0.07 3.57
Maharashtra Mumbai 3.18 0.49 4.84
Maharashtra Mumbai (Suburban) 3.94 0.62 5.37
Maharashtra Nagpur 0.78 0.48 14.49
Maharashtra Nanded 0.13 0.44 10.51
Maharashtra Nandurbar 1.37 0.04 0.39
Maharashtra Nashik 0.46 0.18 1.68
Maharashtra Osmanabad 0.05 0.06 1.91
Maharashtra Parbhani 0.09 0.05 10.03
Maharashtra Pune 1.61 0.30 4.45
Maharashtra Raigarh 0.46 0.20 4.22
Maharashtra Ratnagiri 0.17 0.04 7.12
Maharashtra Sangli 0.38 0.05 1.36
Maharashtra Satara 0.13 0.04 4.58
Maharashtra Sindhudurg 1.84 0.03 2.80
Maharashtra Solapur 0.25 0.07 1.00
Maharashtra Thane 2.98 0.39 3.81
Maharashtra Wardha 0.21 0.15 13.71
Maharashtra Washim 0.12 0.05 14.76
Maharashtra Yavatmal 0.16 0.07 9.02
Andhra Pradesh Adilabad 0.59 0.04 0.98
Andhra Pradesh Anantapur 0.57 0.01 0.01
Andhra Pradesh Chittoor 0.76 0.01 0.00
Andhra Pradesh Cuddapah 1.11 0.01 0.00
Andhra Pradesh East Godavari 1.43 0.01 0.00
Andhra Pradesh Guntur 2.95 0.01 0.00
Andhra Pradesh Hyderabad 2.43 0.29 0.02
Andhra Pradesh Karimnagar 0.59 0.06 0.00
Andhra Pradesh Khammam 1.19 0.02 0.00
Andhra Pradesh Krishna 4.36 0.02 0.00
Andhra Pradesh Kurnool 1.15 0.01 0.00
Andhra Pradesh Mahbubnagar 0.54 0.01 0.00
Andhra Pradesh Medak 1.30 0.03 0.02
Andhra Pradesh Nalgonda 1.00 0.03 0.00
Andhra Pradesh Nellore 1.18 0.01 0.01
Andhra Pradesh Nizamabad 0.69 0.08 0.08
Andhra Pradesh Prakasam 1.07 0.01 0.00

Cont…..
State District Christian Sikh Buddhist
Andhra Pradesh Rangareddi 2.51 0.13 0.04
Andhra Pradesh Srikakulam 0.56 0.00 0.00
Andhra Pradesh Visakhapatnam 1.62 0.07 0.02
Andhra Pradesh Vizianagaram 0.69 0.01 0.00
Andhra Pradesh Warangal 1.03 0.03 0.00
Andhra Pradesh West Godavari 3.64 0.01 0.00
Karnataka Bagalkot 0.17 0.01 0.05
Karnataka Bangalore 5.80 0.10 0.06
Karnataka Bangalore Rural 0.46 0.01 0.04
Karnataka Belgaum 0.42 0.02 0.12
Karnataka Bellary 0.65 0.02 0.02
Karnataka Bidar 2.87 0.04 8.13
Karnataka Bijapur 0.08 0.01 0.13
Karnataka Chamarajanagar 2.20 0.01 3.53
Karnataka Chikmagalur 2.41 0.01 0.10
Karnataka Chitradurga 0.15 0.04 0.01
Karnataka Dakshina Kannada 8.69 0.02 0.03
Karnataka Davanagere 0.30 0.01 0.00
Karnataka Dharwad 1.72 0.07 0.14
Karnataka Gadag 0.33 0.01 0.04
Karnataka Gulbarga 0.59 0.02 4.91
Karnataka Hassan 0.91 0.02 0.13
Karnataka Haveri 0.15 0.01 0.01
Karnataka Kodagu 3.27 0.01 0.12
Karnataka Kolar 1.28 0.01 0.02
Karnataka Koppal 0.34 0.01 0.01
Karnataka Mandya 0.46 0.01 0.63
Karnataka Mysore 1.32 0.02 1.44
Karnataka Raichur 0.74 0.01 0.09
Karnataka Shimoga 1.61 0.02 0.01
Karnataka Tumkur 0.30 0.01 0.01
Karnataka Udupi 5.90 0.02 0.01
Karnataka Uttara Kannada 3.32 0.02 0.79
Goa North Goa 17.98 0.05 0.06
Goa South Goa 37.88 0.10 0.03
Lakshadweep Lakshadweep 0.84 0.01 0.00
Kerala Alappuzha 20.94 0.01 0.01
Kerala Ernakulam 38.78 0.02 0.01
Kerala Idukki 42.52 0.01 0.01
Kerala Kannur 10.84 0.01 0.00
Kerala Kasaragod 7.05 0.01 0.00
Kerala Kollam 16.39 0.01 0.01
Kerala Kottayam 44.60 0.00 0.00
Kerala Kozhikode 4.43 0.00 0.00
Kerala Malappuram 2.22 0.01 0.01
Kerala Palakkad 4.17 0.01 0.00
Kerala Pathanamthitta 39.03 0.01 0.01
Cont…..
State District Christian Sikh Buddhist
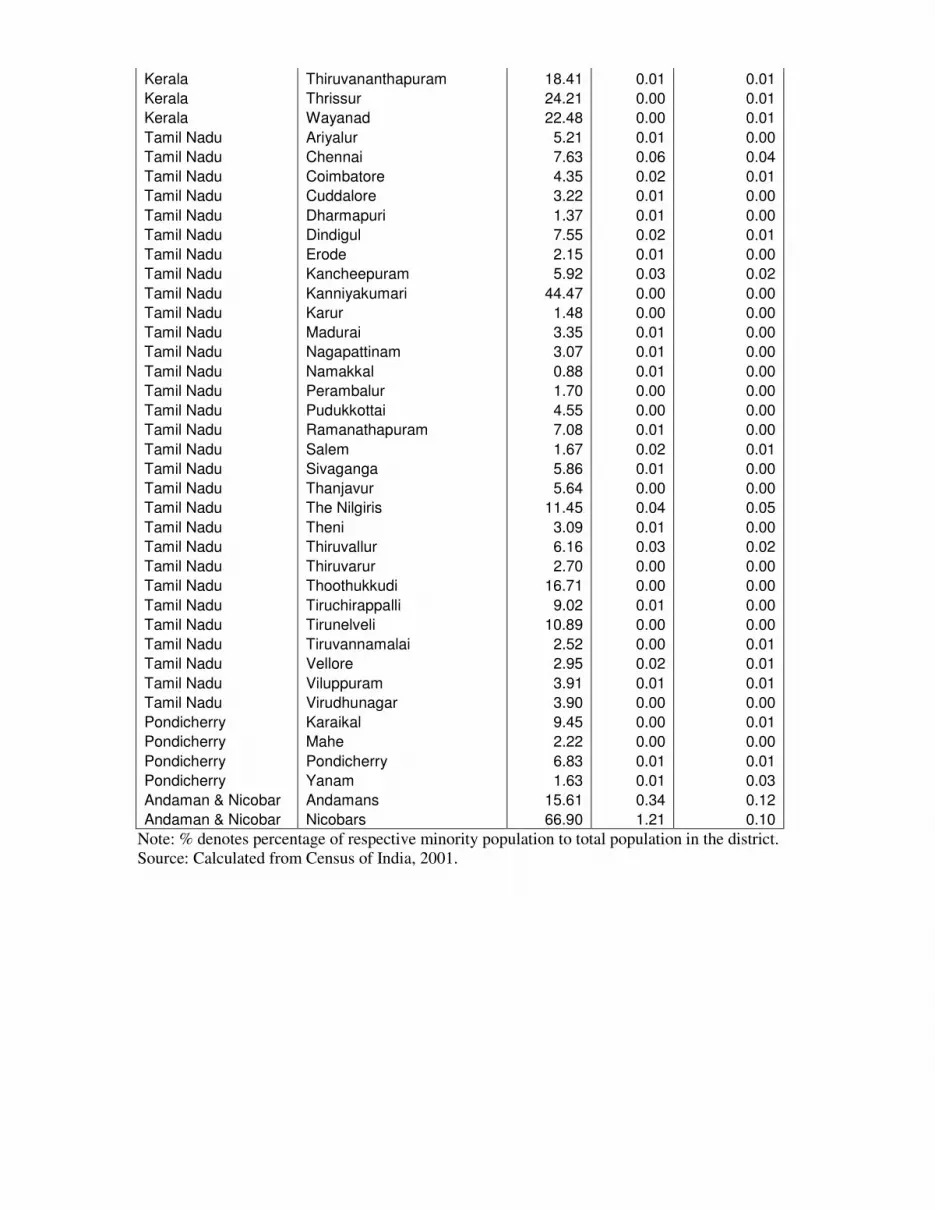
Kerala Thiruvananthapuram 18.41 0.01 0.01
Kerala Thrissur 24.21 0.00 0.01
Kerala Wayanad 22.48 0.00 0.01
Tamil Nadu Ariyalur 5.21 0.01 0.00
Tamil Nadu Chennai 7.63 0.06 0.04
Tamil Nadu Coimbatore 4.35 0.02 0.01
Tamil Nadu Cuddalore 3.22 0.01 0.00
Tamil Nadu Dharmapuri 1.37 0.01 0.00
Tamil Nadu Dindigul 7.55 0.02 0.01
Tamil Nadu Erode 2.15 0.01 0.00
Tamil Nadu Kancheepuram 5.92 0.03 0.02
Tamil Nadu Kanniyakumari 44.47 0.00 0.00
Tamil Nadu Karur 1.48 0.00 0.00
Tamil Nadu Madurai 3.35 0.01 0.00
Tamil Nadu Nagapattinam 3.07 0.01 0.00
Tamil Nadu Namakkal 0.88 0.01 0.00
Tamil Nadu Perambalur 1.70 0.00 0.00
Tamil Nadu Pudukkottai 4.55 0.00 0.00
Tamil Nadu Ramanathapuram 7.08 0.01 0.00
Tamil Nadu Salem 1.67 0.02 0.01
Tamil Nadu Sivaganga 5.86 0.01 0.00
Tamil Nadu Thanjavur 5.64 0.00 0.00
Tamil Nadu The Nilgiris 11.45 0.04 0.05
Tamil Nadu Theni 3.09 0.01 0.00
Tamil Nadu Thiruvallur 6.16 0.03 0.02
Tamil Nadu Thiruvarur 2.70 0.00 0.00
Tamil Nadu Thoothukkudi 16.71 0.00 0.00
Tamil Nadu Tiruchirappalli 9.02 0.01 0.00
Tamil Nadu Tirunelveli 10.89 0.00 0.00
Tamil Nadu Tiruvannamalai 2.52 0.00 0.01
Tamil Nadu Vellore 2.95 0.02 0.01
Tamil Nadu Viluppuram 3.91 0.01 0.01
Tamil Nadu Virudhunagar 3.90 0.00 0.00
Pondicherry Karaikal 9.45 0.00 0.01
Pondicherry Mahe 2.22 0.00 0.00
Pondicherry Pondicherry 6.83 0.01 0.01
Pondicherry Yanam 1.63 0.01 0.03
Andaman & Nicobar Andamans 15.61 0.34 0.12
Andaman & Nicobar Nicobars 66.90 1.21 0.10
Note: % denotes percentage of respective minority population to total population in the district.
Source: Calculated from Census of India, 2001.


