Embed Size (px)
Citation preview
822, IH83 \-e-0
NATIONAL MASTER PLANINDIA
INTERNATIONAL DRINKING WATERSUPPLY AND SANITATION DECADE
1981-1990
MINISTRY OF WORKS AND HOUSINGGOVERNMENT OF INDIA
NEW D E L H IJULY. 1983
INTERNATIONAL DRINKING WATER SUPPLY AND SANITATION DECADE
GOVERNMENT OF INDIA
NATIONAL
MASTER PLAN
FOR
WATER SUPPLY AMD SANITATION(APRIL 1981 - MARCH 1991)
JULY 1983
LIBRARY IRCPO Box 93190. 2509 AD THE HAGUE
Tel.: +31 70 30 689 80Fax:+31 70 35 899 64
BARCODE: S
m
INDl66° I | I
USSR
32°
" SAFGHANISTAN
-24'
I725
PAKISTAN
Î761
>JAMMU
KASHMIR t
"K>JHIMACHACX'T'; \PRADESH J
Jeo«IA
IB4< lee* ÏÏ/ÎÏÏKILOMETRES
196'
500
C H I N A
28 s
-16°
-12°
- 8
LAKSHAOWEEP(INDIA)
TrivO
o«172"
I N 0 I A176°
OCEAN|80° 184° |88° |92°
CONTENTS
VOLUME I
PART I Master Plan of the Water Supply and Sanitation Sector
Appendix I
Tables and Figures
Appendix II
National Water Resources
PART II Appendix III
Executive Summaries of Decade Plans in Water Supply andSanitation for States and Union Territories
VOLUME II
Compendium of Water Supply and Sanitation Projects forStates and Union Territories
VOLUME III
Decade Plans in the Water Supply and Sanitation Sector forStates and Union Territories
CONTENTS
VOLUME I PAGE
INTRODUCTION (i)-(v)
PART I
1. SOCIO-ECONOMIC AND HEALTH SITUATION 1
1. 1 Socio-economic 1
1.2 Health 21.3 20-Point Programme 3
2. SECTOR POSITION 4
2.1 Water Supply and Sanitation 42.2 Development Plan Allocations and Expenditures 5
3. DECADE PROGRAMME GOALS 7
3.1 General 73.2 Water Supply and Sanitation 7
4. COVERAGE PROGRAMME POLICIES 8
8889991010101011
111112121213
5. SUPPORT PROGRAMME POLICIES 13
5.1 Administration and Management 135.2 Manpower 14
4.14.24.2.14.2.24.34.3.14.3.2
4.44.4,14.4.24.4.34.4.4
4.4.54.4.64.4.6.14.4.6.24.4.6.3
GeneralWater SupplyUrbanRuralSanitationUrban
RuralFinancial
Source of FundsDevelopment PlansMinimum Needs Programme (MNP)State Government, Union Territories and Local
Governmental BodiesLife Insurance Corporation (LIC)Other Avenues of Generating Sector FundsRural Development FundExternal AssistanceNew Financing Institution for Sector Development
PAGE
5.2.:1 Engineering Staff 145.2.2 Technicians, Craftsmen and Skilled Workers 155.2.3 In-house Expertise 155.2.4 In-service Training 155.3 Materials and Equipment 155.3.1 General ^55.3.2 Specific Considerations 155.4 Operation and Maintenance 165.5 Research and Development of Appropriate Technology 175.6 Management Information System 175.6.1 Information System/Data Bank 175.6.2 Documentation 185.6.3 Transfer of Technical Information 185.7 Coordination with Other Sectors 195.7.1 General 195.7.2 Irrigation Programmes 195.7.3 Public Agencies 195.7.4 Ministry of Rural Reconstruction . 205.7.5 Ground Water Boards 205.7.6 Ministry of Health and Family Welfare 205.8 Health Education/ Community Participation 215.8.1 Health Education in the School 215.8.2 Health Education in the Community 215.8.3 Block Coordination Committees 225.9 Non-governmental Organizations (NGOs) 225.9.1 Non-governmental Organization Capability 225.9.2 Non-governmental Organization Involvement 235.9.3 Government Recognition and Support 23
6. DECADE PROGRAMME PRIORITIES 24
6.1 Priority Areas for Implementation 246.1.1 Special Priority Considerations for Water Supply 246.1.2 Special Priority Considerations for Sanitation 256.2 Phasing of Decade Programme 266.2.1 Phase I 266.2.2 Phase II f 26
7. DECADE PROGRAMME FUNDING 27
7.1 Programme Fund Requirements 277.2 Sources of Programme Funds 277.2.1 Phase I 277.2.2 . Phase II 297.2.3 Total Fund Requirements 30
111
PAGE
8. MANPOWER 31
8.1 Present Status and Future Requirements 318.2 Assessment in Relation to the Requirements of Phase
I and II 328.2.1 Professional Engineers 328.2.2 Engineering Education Institutions 33
8.2.3 Sector Recruitment Options 358.2.4 Other Professional Personnel 368.2.5 Technicians, Craftsmen and Skilled Workers 36
8.3 In-service training 37
9. MATERIALS AND EQUIPMENT 37
3738383839
3940V41414344444747474748484849
10. PROJECT FORMULATION 50
10.1 General 5010.2 Planning and Preparation Units 5010.3 Unit Operations and Functions 51
11. OPERATION AND MAINTENANCE 53
53545454
9.19.29.2.19.2.19.2.19.2.19.2.29.2.29.2.29.2.39.39.3.19.3.29.3.39.3.49.3.59.3.69.3.79.3.89.3.9
.1
.2
.3
.1
.2
GeneralRequirements and AssessmentPipeApplicationSector RequirementsProduction and AvailabilityCementSector DemandNational Demand and ProductionOther Sector Materials and EquipmentSuggested Actions to Benefit the SectorPipeHandpump sCementVehiclesEnergyTransportationRate ContractsDrilling RigsResearch and Development
11.111.211.2.11.2.
12
GeneralExisting SituationWater SupplySanitation
PAGE
11.3 Support Resources 5511.3.1 Institutional and Administrative 55
11.3.2 Manpower 5511.3.3 Materials and. Equipment 5511.3.A Community Participation in Relation to
Operation and Maintenance 5611.3.5 Suggested Elements of a Support Programme ' 56
12. EXTERNAL AND INTERNAL ASSISTANCE 57
12.1 General 57
12.2 On-going Project Assistance 5712.3 Assistance to Projects in Pipeline 59
VOLUME I
PART I
Appendix I
Table No.
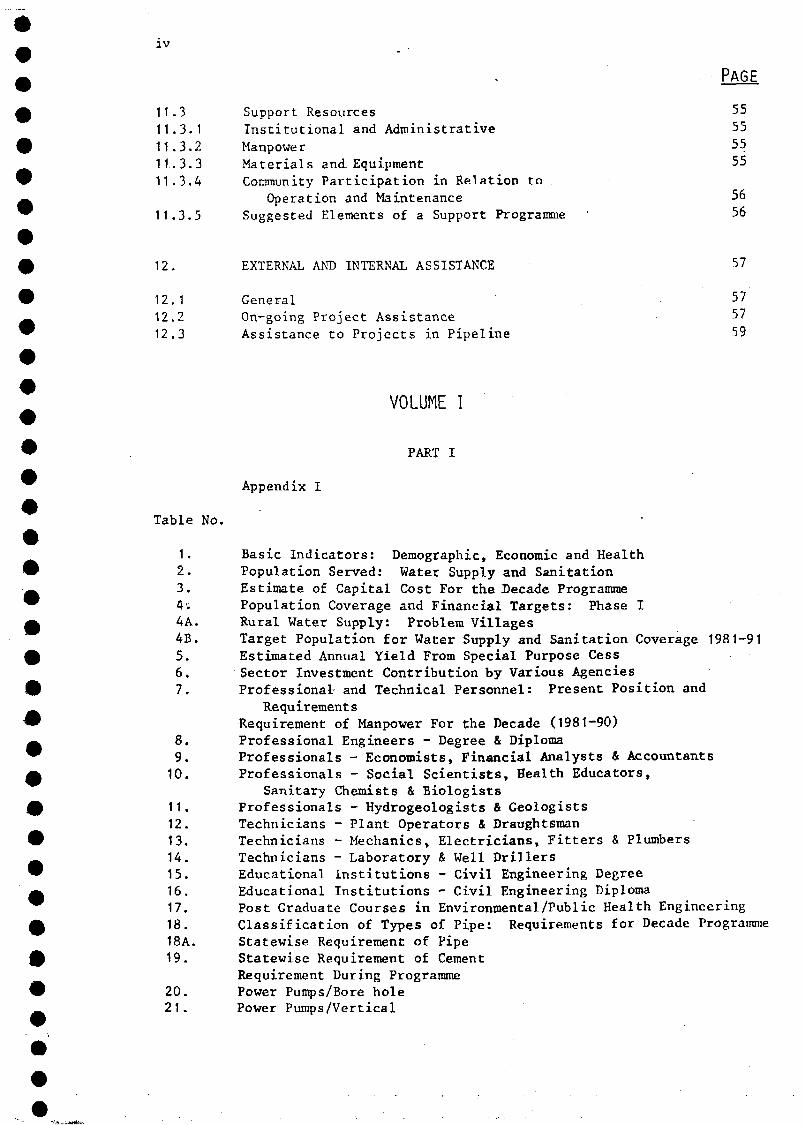
1. Basic Indicators: Demographic, Economic and Health2. Population Served: Water Supply and Sanitation3. Estimate of Capital Cost For the Decade Programme4'; Population Coverage and Financial Targets: Phase I4A. Rural Water Supply: Problem Villages4B. Target Population for Water Supply and Sanitation Coverage 1981-915. Estimated Annual Yield From Special Purpose Cess6. Sector Investment Contribution by Various Agencies7. Professional and Technical Personnel: Present Position and
RequirementsRequirement of Manpower For the Decade (1981-90)
8. Professional Engineers - Degree & Diploma9. Professionals - Economists, Financial Analysts & Accountants10. Professionals - Social Scientists, Health Educators,
Sanitary Chemists & Biologists11. Professionals - Hydrogeologists & Geologists12. Technicians - Plant Operators & Draughtsman13. Technicians - Mechanics, Electricians, Fitters & Plumbers14. Technicians - Laboratory & Well Drillers15. Educational Institutions - Civil Engineering Degree16. Educational Institutions - Civil Engineering Diploma17. Post Graduate Courses in Environmental/Public Health Engineering18. Classification of Types of Pipe: Requirements for Decade Programme18A. Statewise Requirement of Pipe
19. Statewise Requirement of CementRequirement During Programme
20. Power Pumps/Bore hole21. Power Pumps/Vertical
PAGE
PART I (contd.)
Appendix I
able No,
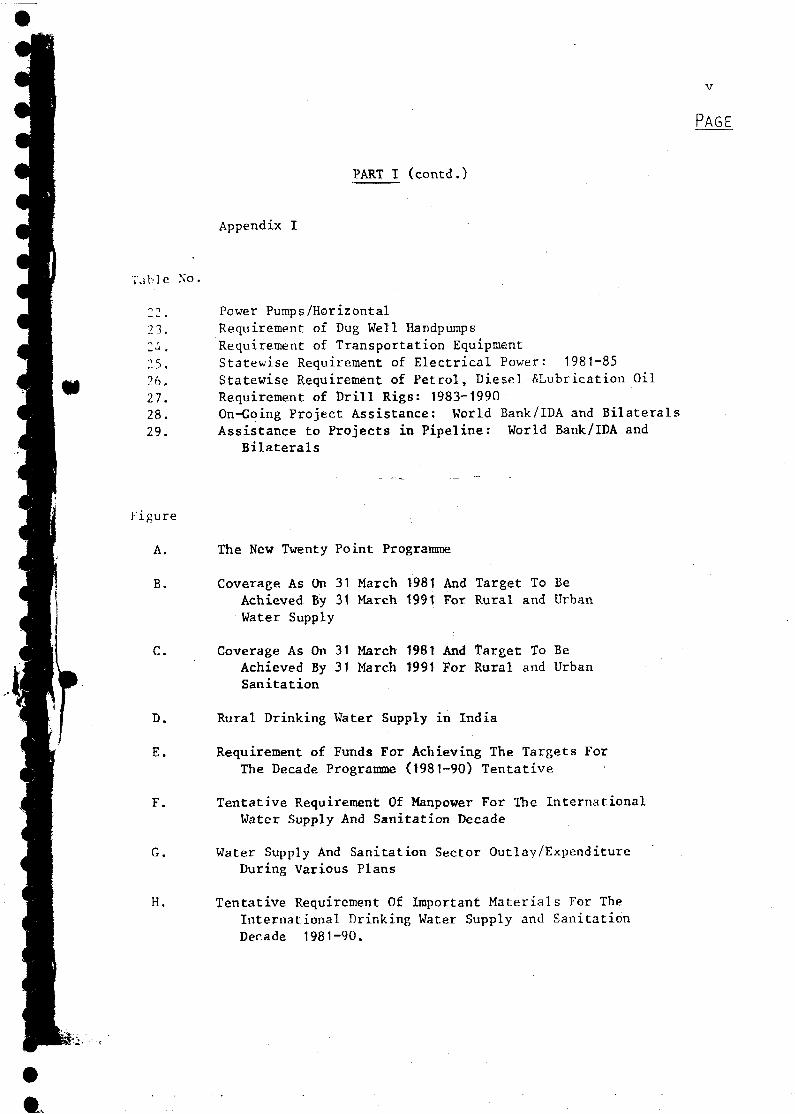
23.24.25.26.27.28.29.
Power Pumps/HorizontalRequirement of Dug Well HandpumpsRequirement of Transportation EquipmentStatewise Requirement of Electrical Power: 1981-85Statewise Requirement of Petrol, Diesel ^Lubrication OilRequirement of Drill Rigs: 1983-1990
On-Going Project Assistance: World Bank/IDA and BilateralsAssistance to Projects in Pipeline: World Bank/IDA and
Bilaterals
•"igure
A. The New Twenty Point Programme
B. Coverage As On 31 March 1981 And Target To BeAchieved By 31 March 1991 For Rural and UrbanWater Supply
C. Coverage As On 31 March 1981 And Target To BeAchieved By 31 March 1991 For Rural and UrbanSanitation
D. Rural Drinking Water Supply in India
E. Requirement of Funds For Achieving The Targets ForThe Decade Programme (1981-90) Tentative
F. Tentative Requirement Of Manpower For The InternationalWater Supply And Sanitation Decade
G. Water Supply And Sanitation Sector Outlay/ExpenditureDuring Various Plans
H. Tentative Requirement Of Important Materials For TheInternational Drinking Water Supply and SanitationDecade 1981-90.
PAGE
PART I (contd.)
Appendix I
Table No.
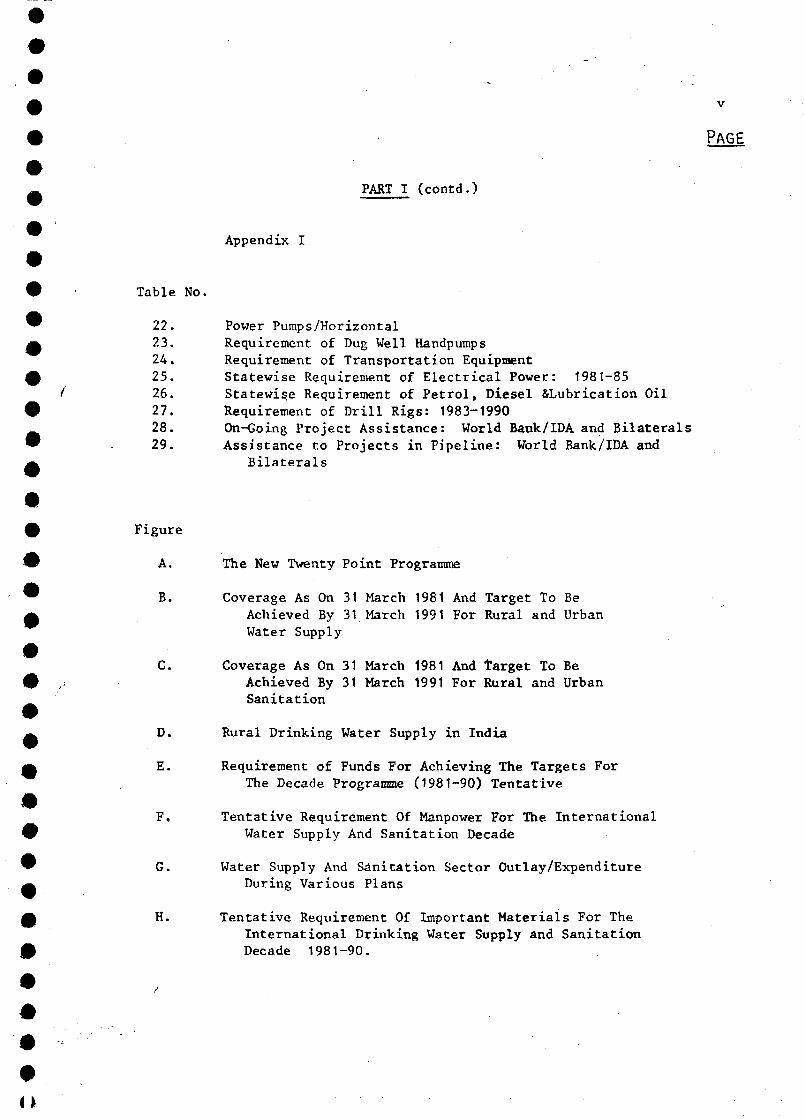
22. Power Pumps/Horizontal23. Requirement of Dug Well Handpumps24. Requirement of Transportation Equipment25. Statewise Requirement of Electrical Power: 1981-8526. Statewise Requirement of Petrol, Diesel &Lubrication Oil27. Requirement of Drill Rigs: 1983-199028. On-Going Project Assistance: World Bank/IDA and Bilaterals29. Assistance to Projects in Pipeline: World Bank/IDA and
Bilaterals
0 Figure
w A. The New Twenty Point Programme
™ B. Coverage As On 31 March 1981 And Target To BeA Achieved By 31 March 1991 For Rural and Urban
Water Supply
C. Coverage As On 31 March 1981 And target To Be0 ,:• Achieved By 31 March 1991 For Rural and Urban
Sanitation
^ D. Rural Drinking Water Supply in India
A E. Requirement of Funds For Achieving The Targets ForThe Decade Programme (1981-90) Tentative
F. Tentative Requirement Of Manpower For The InternationalW Water Supply And Sanitation Decade
™ G. Water Supply And Sanitation Sector Outlay/ExpenditureA During Various Plans
0 H. Tentative Requirement Of Important Materials For TheInternational Drinking Water Supply and Sanitation
A Decade 1981-90.
#
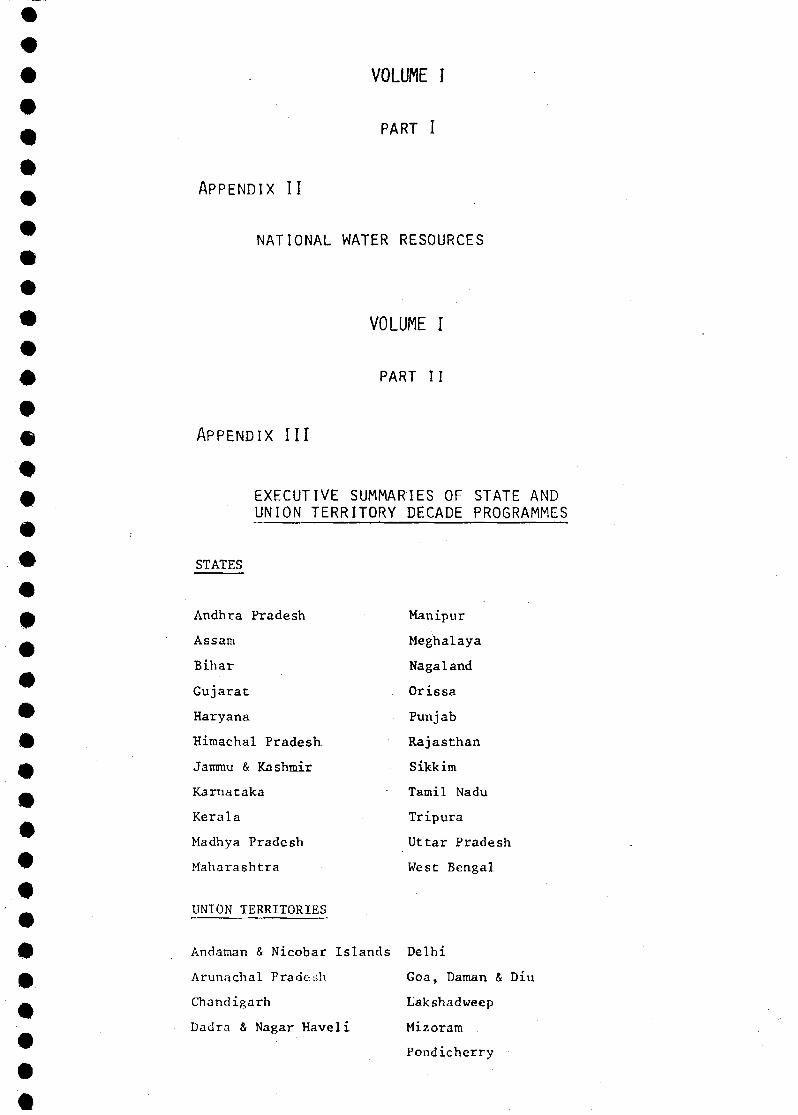
VOLUME I
PART I
APPENDIX II
NATIONAL WATER RESOURCES
VOLUME I
•
PART 11
A P P E N D I X III
EXECUTIVE SUMMARIES OF STATE ANDUNION TERRITORY DECADE PROGRAMMES
STATES
Andhra Pradesh
Assam
Bihar
Gujarat
Haryana
Himachal Pradesh
Jammu & Kashmir
Karnataka
Kerala
Madhya Pradesh
Maharashtra
UNION TERRITORIES
Manipur
Meghalaya
Nagaland
Orissa
Punj ab
Rajasthan
Sikkim
Tamil Nadu
Tripura
Uttar Pradesh
West Bengal
Andaman & Nicobar Islands Delhi
Arunachal Pradesh Goa, Daman & Diu
Chandigarh Lakshadweep
Dadra & Nagar Haveli Mizoram
Pondicherry
VOLUME I
PART I
NATIONAL MASTER PLAN OF WATER SUPPLY AND SANITATION
(i)
INTRODUCTION
The United Nations Conference on Human Settlements held in June 1976at Vancouver, British Colombia, recommended that safe water supply andhygienic waste disposal should receive high priority from Governments andInternational Agencies to enable Governments to achieve the target ofserving all the population by 1990. These objectives were reiterated inthe United Nations Water Conference at Mar del Plata, Argentina, in March1977 and when it was further, declared that the ten year period 1981-90be designated as the 'international Drinking Water Supply and SanitationDecade'. The Conference requested closer co-operation among internationalorganisations, and increased technical and financial assistance from externalbilateral and multi-lateral agencies, in order to achieve the goals of safewater supply and adequate sanitation by the year 1990.
The 31st United Nations General Assembly, meeting in late 1977, approvedthe recommendations of the Water Conference. The International Conferenceon Primary Health Care at Alma Ata, USSR, in September 1978, emphasised thatwater supply and sanitary .facilities must be provided to the people in thedeveloping countries, since a preponderent percentage of the sickness and
' disease in Lhe developing countries is attributable to contaminated water andinadequate sanitation.
India was a party in all these conferences and subscribed to theResolution of the 31st United Nations General Assembly, pledging itsfull support for the International Decade Programme.
India arrives at the launching of the Deeade with 50 years or moreof organised efforts on the part of the Government showing steady progressin providing water supply and sanitation services to her many millions ofinhabitants.
( Organised water supply systems were attempted first in the threePresidency Towns of Calcutta, Bombay and Madras in the late ' 18-seventies'Through the subsequent decades, measures to secure better health for the peoplefound emphasis on the curative side. Water-borne and filth-borne epidemicswere combated with drugs and vaccines. Preventive health measures wereorganised as palliatives in order to ward off periodic epidemics. A fewtowns came in for the benefit of protected water supply more due to thestress of local urgency and recurring epidemics, than under any organisedplan or programme.
The responsibilities for health and health measures were transferredby the Central Government to the Provincial Government, who in turn,transferred the burden on to the local-bodies. As a result, the history ofthe struggle of the local-bodies for these essential amenities - safewater supply and sanitation measures - for over half a century was difficultresulting in few systems. A few of the local-bodies, however, succeeded inprevailing on the Provincial Government to install limited water supplysystems, most of them heavily subsidised by the Governments. Local-bodieskept these systems going through the years without any improvements necessaryto meet the growing demands from the increasing populations. These few watersupply systems soon reached acute stages of inadequacy for the needs of the towns
o
• (ii)
A With the advent of popular Ministries just before the Second World
War, there was a sharp spell of an intensive programme to meet the challenge
0 of water supply, particularly in the rural areas, in Bengal, Madras, Bombay
and Mysore (old designations). A programme of rural water supply on a province-0 wide basis was planned and a tangible measure of progress achieved before» the war intervened.
£ In the Post-War Developmental era, the Bhore Committee came into
being and for the first time pin-pointed attention to the importance of safe0 water supply and sanitation measures on a country-wide basis. They assumed
importance in the National Developmental Plans. The Madras Government0 followed by appointing a Committee - in 1947, to examine and report on the^ question of water supply and drainage for urban and rural areas in the™ entire State. The Committee came out with far-reaching recommendations inA regard to organisation, finance, materials of construction and priorities.
The Environmental Hygiene Committee ( 1948-49) appointed by the Union0 Government was the first agency of its type charged with an overall
assessment of the country-wide problems in the entire field of Environmental• Hygiene. The Committee made notable recommendations in the broader field^ of Environmental Hygiene and urged for greater activity in this direction.^ They recommended specifically a comprehensive plan to provide water supplyQ and sanitation facilities for 90 per cent of the population within a period
of 40 years and also suggested a scheme of priorities for certain areas.
M As part of the post-war reconstruction activities, some of the States^ initiated their Five Year Plans in which provision was included for the™ implementation of urban and rural water supply and sanitation schemes.£ Some headway was being made in this direction, but the States" soon came
up against formidable obstacles in the way of raising finances forA such schemes, building up of organisations, and in the procurement of
proprietary materials needed for such schemes.
Over the past 30 years from 1951, through five Development Plans and• several intervening Annual Plans, to 1981 and start of the Decade, water» supply and sanitation sector expenditures compared with total Development^ and Annual Plan outlays increased by over 2.5 times, and population coverageA in urban and rural water supplies and urban sanitation services reached
over 75 percent, 30 percent and 25 percent, respectively. This gives some0 indication of the high priority that the Government has given to the water
supply and sanitation sector - and bodes well for the success of theW Decade Programme.
™ In preparation for the India Decade Programme many activities inA pursuit of Decade objectives have been and are now being carried out.
Important at the outset among these activities was the Government's decision£ in its selection of the Central Public Health and Environmental Engineering
Organization (CPHEEO) of the Ministry of Works and Housing as the£ Technical Office to serve as the National Coordinator and focal point in
respect of activities connected with the International Drinking Water Supply
o
(iii)
^ and Sanitation Decade. The CPHEEO provides guidelines and assistance to the
A 22 States and 9 Union Territories in the development of their Decadeprogrammes, and convenes national and regional conferences of chief and
^ senior public health engineers and other sector authorities to promote andadvance Decade activities. It collaborates with various multi-lateral
Q organizations as the UNDP, WHO, UNICEF, ESCAP and the World Bank in the, furtherence of these activities.
& Additionally, during the preparatory phase:
£ - rapid assessment was made of the status of drinking watersupply and sanitation, in collaboration with the World
Q Health Organization;
w - sector studies and briefs were prepared in respect of^ almost all the States and Union Territories;
A - a series of Conferences of Chief Engineers/Public Engineersof all States and Union Territories were convened at Delhi,
f Nagpur, Trivandrum, Ootacamund and Hyderabad from.November1978 to December 1980;
^ - two Conferences of State Ministers, Secretaries and Chief™ Engineers were held in February 1982 and January 1983A respectively wherein the Decade goals were accepted and
the recommendations of the three Working Groups of theA Apex Committee have also been endorsed,
£ - a regional consultation meeting was held at New Delhiby WHO in November 1979 to enable participants from
W countries of the South-East Asia Region and
•international agencies to review preparatory actions forthe Decade. India attended with representation from the
A Planning Commission, CPHEEO and Technical Cooperation,
Ministry of Finance. A follow-up regional consultationi0 meeting was held in September/October 1981 wherein support
programmes such as manpower development, community education£ and participation, operation and maintenance of water supply
projects as well as water quality surveillance were9 discussed.
™ Recognising the need for coordinated action and approach to achieveA the targets, the Government of India on 16 October 1980, constituted an Apex
Committee under the direction of the Secretary, Ministry of Works and Housing.0 This Committee is responsible for national policy formulation and guidance, and
overview of the programmes to be undertaken during the Decade.
^ The Apex Committee established three Working Groups, (1) Programmes^ and Manpower, (2) Financial Resources and (3) Materials and Equipment, toA develop specific and comprehensive recommendations on these activities. The
Apex Committee has agreed that targets established for the Sixth Plan period£ as well as those for the remaining years of the Deeade could be adopted in
preparing the National Master Plan Document,
(iv)
The foregoing historical review shows the importance attached todrinking water supply and sanitation by the Union of India - both theCentral and the State Governments. In fact, this sector, particularlyrural water supply, is one of the elements in Government of India's20 - Point Programme for socio-economic development. Die inspiringmessage given by the Prime Minister of India (attached to this introduction)through World Health, the official magazine of the World Health Organization,to the international community thus comes as no surprise.
The preparation of National Master Plan for the water and sanitationsector for a country of nearly 700 million population is not an easy task,especially as the responsibility for planning and implementing in thissubject area rests with the State Governments and Union Territories, withthe Union Government providing broad guidance and directives and financialallocations as well as coordination at the national level. There areprogrammes such as the Accelerated Rural Water Supply Programme, which aredirectly centrally funded but water supply and sanitation isessentially a State subject. The National Master Plan is really acomposite of the 31 State and 9 Union Territory Decade plans providingguidelines to action and programme goals, policies, priorities and funding.This explains why an extensive and intensive process of consultationwithin the States and between the States and the Union Government hadto take place before the Plan document could be finalised. The tremendousvolume of work that has been involved in preparation of this Master Plandocument has been done mainly by the State Governments and the UnionGovernment of India (Ministry of Works and Housing and the Central PublicHealth and Environmental Engineering Organization under that Ministry) ....with the collaboration of the World Health Organization and the UnitedNations Development Programme.
The International Drinking Water Supply and Sanitation Decade forIndia is from 1 April 1981 to 31 March 1991. This Decade period is coordinatedwith three Development Plans, embracing the last four years of the currentSixth Development Plan (April 1980 - March 1985), all five years of theSeventh Development Plan (April 1985 - March 1990) and the first year ofthe Eighth Development Plan (April 1990 - March 1995).
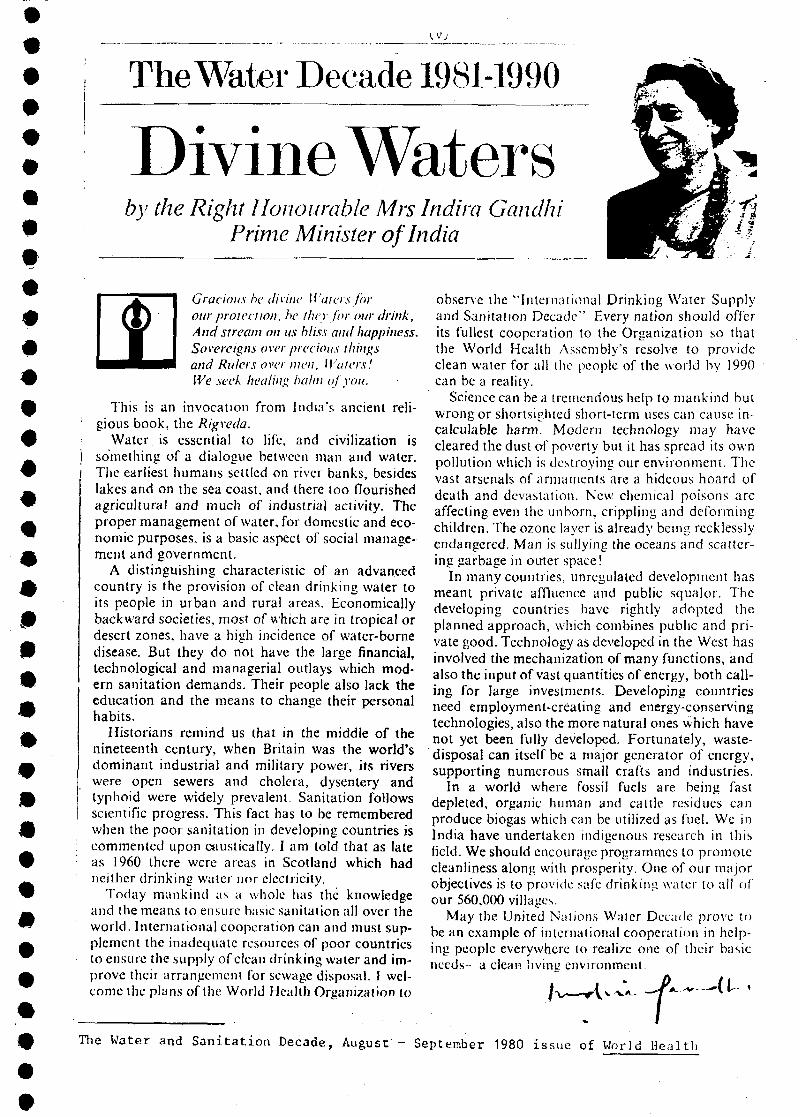
The Water Decade 1981-1990
Divine Watersby the Right Honourable Mrs Indira Gandhi
Prime Minister of India
mB9mmmmma
#
Gracious he divine Waters forour protection, he they for our drink.And stream on us bliss and happiness.Sovereigns over precious thingsand Rulers over men, Waters!We seek healing halm of you.
This is an invocation from India's ancient reli-gious book, the Rigveda.
Water is essential to life, and civilization issomething of a dialogue between man and water.The earliest humans settled on river banks, besideslakes and on the sea coast, and there too flourishedagricultural and much of industrial activity. Theproper management of water, for domestic and eco-nomic purposes, is a basic aspect of social manage-ment and government.
A distinguishing characteristic of an advancedcountry is the provision of clean drinking water toits people in urban and rural areas. Economicallybackward societies, most of which are in tropical ordesert zones, have a high incidence of water-bornedisease. But they do not have the large financial,technological and managerial outlays which mod-ern sanitation demands. Their people also lack theeducation and the means to change their personalhabits.
Historians remind us that in the middle of thenineteenth century, when Britain was the world'sdominant industrial and military power, its riverswere open sewers and cholera, dysentery andtyphoid were widely prevalent. Sanitation followsscientific progress. This fact has to be rememberedwhen the poor sanitation in developing countries iscommented upon caustically. I am told that as lateas 1960 there were areas in Scotland which hadneither drinking water nor electricity.
Today mankind as a whole has the knowledgeand the means to ensure basic sanitation all over theworld. International cooperation can and must sup-plement the inadequate resources of poor countriesto ensure the supply of clean drinking water and im-prove their arrangement for sewage disposal. I wel-come the plans of the World Health Organization to
observe the "International Drinking Water Supplyand Sanitation Decade". Every nation should offerits fullest cooperation to the Organization so thatthe World Health Assembly's resolve to provideclean water for all the people of the world by 1990can be a reality.
Science can be a tremendous help to mankind butwrong or shortsighted short-term uses can cause in-calculable harm. Modern technology may havecleared the dust of poverty but it has spread its ownpollution which is destroying our environment. Thevast arsenals of armaments are a hideous hoard ofdeath and devastation. New chemical poisons arc-affecting even the unborn, crippling and deformingchildren. The ozone layer is already being recklesslyendangered. Man is sullying the oceans and scatter-ing garbage in outer space!
In many countries, unregulated development hasmeant private affluence and public squalor. Thedeveloping countries have rightly adopted theplanned approach, which combines public and pri-vate good. Technology as developed in the West hasinvolved the mechanization of many functions, andalso the input of vast quantities of energy, both call-ing for large investments. Developing countriesneed employment-creating and energy-conservingtechnologies, also the more natural ones which havenot yet been fully developed. Fortunately, waste-disposal can itself be a major generator of energy,supporting numerous small crafts and industries.
In a world where fossil fuels are being fastdepleted, organic human and cattle residues canproduce biogas which can be utilized as fuel. We inIndia have undertaken indigenous research in thisfield. We should encourage programmes to promotecleanliness along with prosperity. One of our majorobjectives is to provide safe drinking water to all ofour 560,000 villages.
May the United Nations Water Decade prove tobe an example of international cooperation in help-ing people everywhere to realize one of their basicneeds - a clean livinii environment.
~ y-The Water and S a n i t a t i o n Decade, August - September 1980 issue of World Health
1, SOCIO-ECONOMIC AND HEALTH SITUATION
1.1 Socio-economic
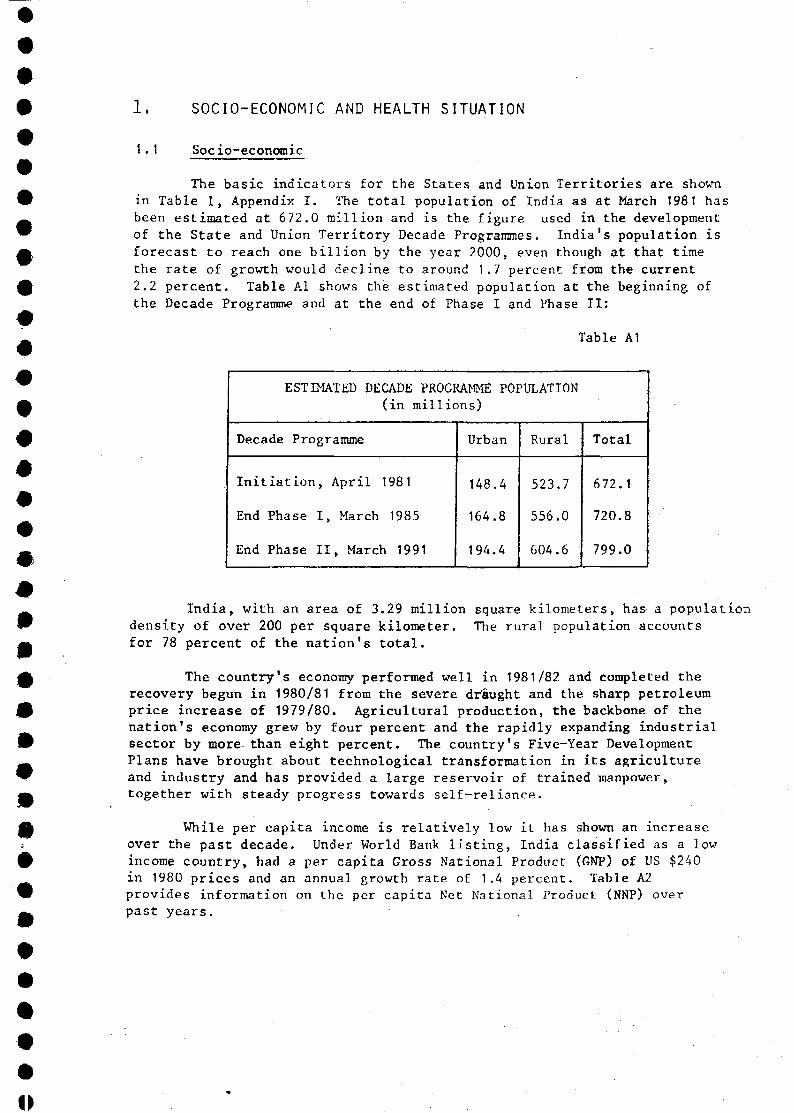
The basic indicators for the States and Union Territories are shownin Table 1, Appendix I. The total population of India as at March 1981 hasbeen estimated at 6 72.0 million and is the figure used in the developmentof the State and Union Territory Decade Programmes. India's population isforecast to reach one billion by the year 2000, even though at that timethe rate of growth would decline to around 1.7 percent from the current2.2 percent. Table Al shows the estimated population at the beginning ofthe Decade Programme and at the end of Phase I and Phase II:
Table A1
ESTIMATED DECADE PROGRAMME(in millions)
Decade Programme
Initiation, April 1981
End Phase I, March 1985
End Phase II, March 1991
POPULATION
Urban
148
164
194
.4
8
4
Rural
523.7
556.0
604.6
Total
672
720
799
. 1
8
0
•
India, with an area of 3.29 million square kilometers, has a populationdensity of over 200 per square kilometer. The rural population accountsfor 78 percent of the nation's total.
The country's economy performed well in 1981/82 and completed therecovery begun in 1980/81 from the severe draught and the sharp petroleumprice increase of 1979/80. Agricultural production, the backbone of thenation's economy grew by four percent and the rapidly expanding industrialsector by more than eight percent. The country's Five-Year DevelopmentPlans have brought about technological transformation in its agricultureand industry and has provided a large reservoir of trained manpower,together with steady progress towards self-reliance.
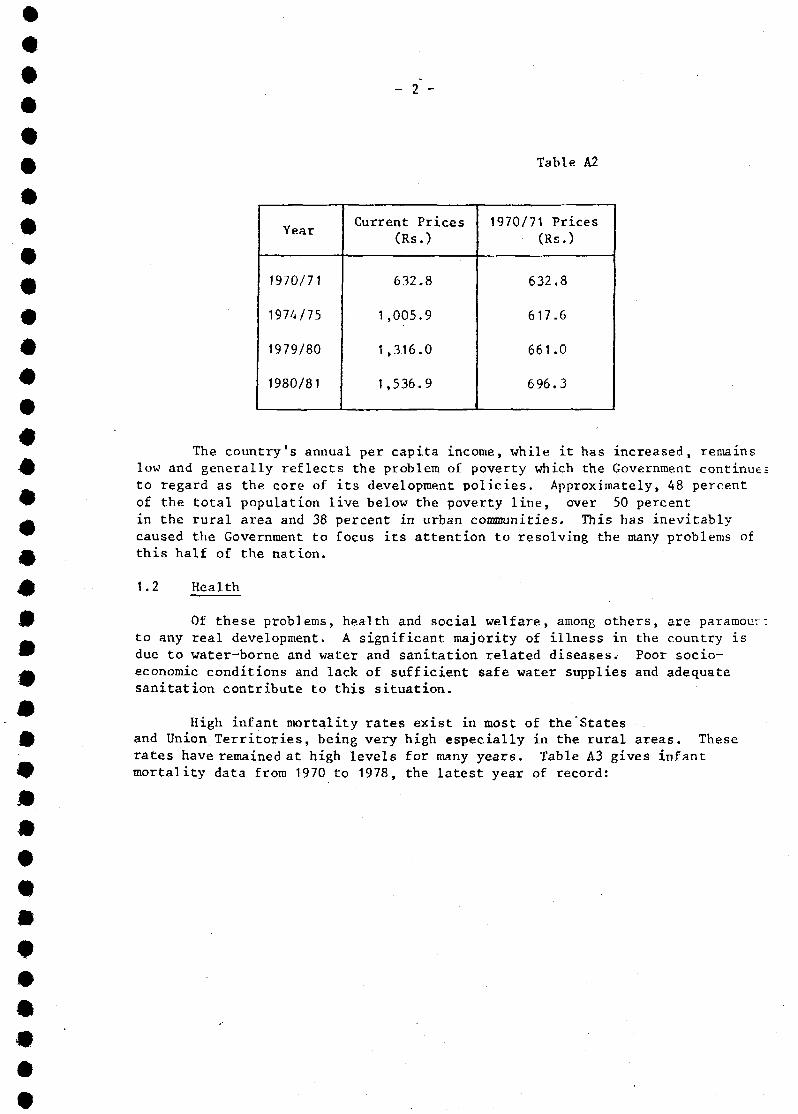
While per capita income is relatively low it has shown an increaseover the past decade. Under World Bank listing, India classified as a lowincome country, had a per capita Gross National Product (GNP) of US $240in 1980 prices and an annual growth rate of 1,4 percent. Table A2provides information on the per capita Net National Product (NNP) overpast years.
u
- 2 -
Table A2
#
Year
1970/71
1974/75
1979/80
1980/81
Current Prices(Rs.)
632.8
1,005.9
1 ,316.0
1,536.9
1970/71 Prices(Rs.)
632.8
617.6
661.0
696.3
#
mmm
The country's annual per capita income, while it has increased, remainslow and generally reflects the problem of poverty which the Government continue;to regard as the core of its development policies. Approximately, 48 percentof the total population live below the poverty line, over 50 percentin the rural area and 38 percent in urban communities. This has inevitablycaused the Government to focus its attention to resolving the many problems ofthis half of the nation.
1.2 Health
•
Of these problems, health and social welfare, among others, are paramourto any real development. A significant majority of illness in the country isdue to water-borne and water and sanitation related diseases. Poor socio-economic conditions and lack of sufficient safe water supplies and adequatesanitation contribute to this situation.
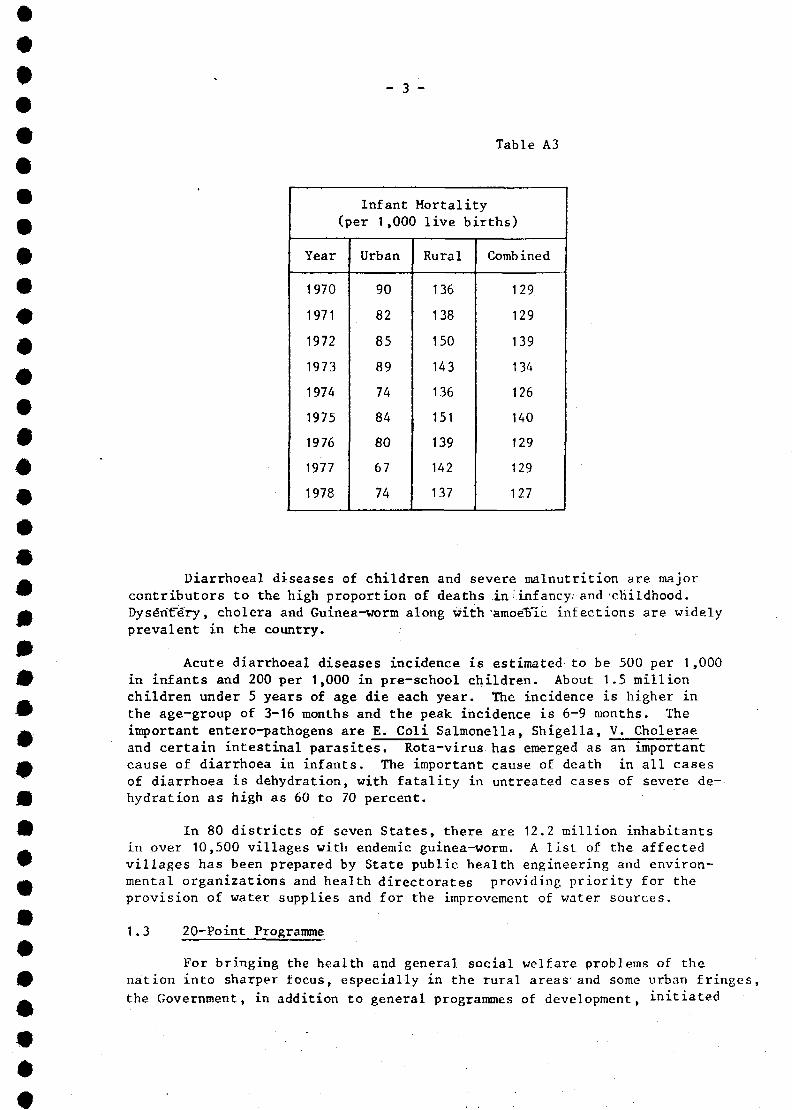
High infant mortality rates exist in most of the Statesand Union Territories, being very high especially in the rural areas. Theserates have remained at high levels for many years. Table A3 gives infantmortality data from 1970 to 1978, the latest year of record:
- 3 -
Table A3
#
Infant(per 1.00C
Year
1970
1971
1972
1973
1974
1975
1976
1977
1978
Urban
90
82
85
89
74
84
80
67
74
Mortality) l ive bir ths)
Rural
136
138
150
143
136
151
139
142
137
Combined
129
129
139
134
126
140
129
129
127
mmm
Diarrhoeal diseases of children and severe malnutrition are majorcontributors to the high proportion of deaths in infancy and childhood.Dysénféry, cholera and Guinea^worm along with "amoefric infections are widelyprevalent in the country.
Acute diarrhoeal diseases incidence is estimated to be 500 per 1,000in infants and 200 per 1,000 in pre-school children. About 1.5 millionchildren under 5 years of age die each year. The incidence is higher inthe age-group of 3-16 months and the peak incidence is 6-9 months. Theimportant entero-pathogens are E. Coli Salmonella, Shigella, V. Choleraeand certain intestinal parasites. Rota-virus has emerged as an importantcause of diarrhoea in infants. The important cause of death in all casesof diarrhoea is dehydration, with fatality in untreated cases of severe de-hydration as high as 60 to 70 percent.
In 80 districts of seven States, there are 12.2 million inhabitantsin over 10,500 villages with endemic guinea-worm. A list of the affectedvillages has been prepared by State public health engineering and environ-mental organizations and health directorates providing priority for theprovision of water supplies and for the improvement of water sources.
1 .3 20-Point Programme
For bringing the health and general social welfare problems of the
nation into sharper focus, especially in the rural areas1 and some urban fringes,
the Government, in addition to general programmes of development, initiated
*
#
t
a special activity in 1975, the 20-Point Programme. Through this programme,9 the Government continues to pursue a long-term comprehensive development plan_ across the broad spectrum of health, social welfare and education along^ with other sectors. The successful fulfillment of several targets brought abo.:A changes in economic and social areas necessitating a redefinition of the
programme in January 1982.
Point No. 8 of the 20 Point Programme, regarding the supply of drinking0 water to all problem villages is extremely vital to the water supply and
sanitation sector and the Decade Programme, since this particular Point has bee:» assigned the highest priority of eight priorities in the State and Union
A Territory sector programmes. Other Points relating to irrigation systems (1)strengthened and expanded coverage of integrated rural development (3) and
A the accelerated programmes for the development of scheduled castes and tribes(7) are all indirectly linked to the rural water supply programme for each
0 State and Union Territory. Resources for the execution for the sector segmentof the 20-Point Programme have been allocated in the current Sixth Development
# Plan.
£ 2, SECTOR POSITION
2.1 Water Supply and Sanitation
_ Table 2, Appendix I provides information on the status of the population9 served as of March 1981 with water supplies and sanitation in the States andA Union Territories, and the Decade Programme coverage goals at the end of Phase '.™ ' March 1985 and Phase II, March 1991.
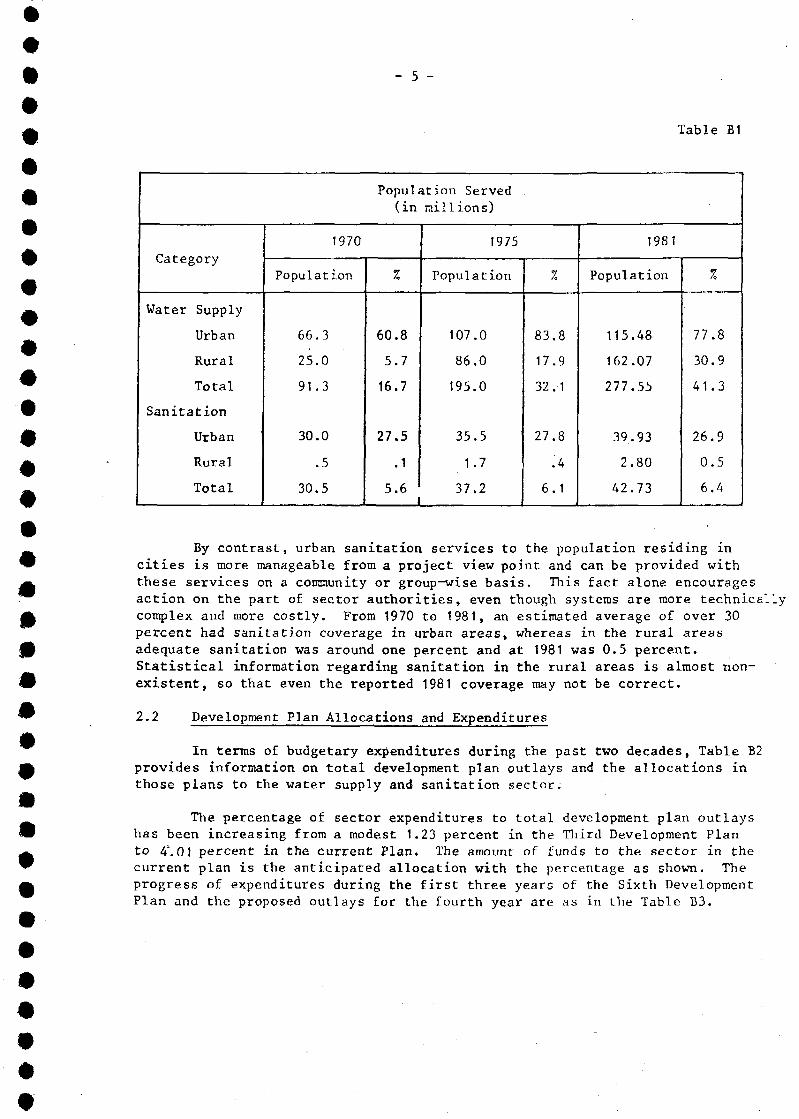
The sector position in 1981 on a nation-wide basis and the position in£ 1970 and 1975 of the estimated population served with water supplies and
sanitation is shown in Table B1.
^ V The progress made in total water supply coverage in the country since ;
™ 1970 in both urban and rural areas was almost 2.5 percent annually, slightlyA .over the annual growth rate in the nation's population. This was due in large
part to the gains made in rural water supply, the growth rate in coverageA reaching about 1.5 times that in the urban area. The urban water supply covers;
was well below the annual population growth rate at 1.7 percent and did not£ keep pace. There are several reasons for this, but the main reason is probably
the emphasis placed in sector planning in rural area development, wherew 78 percent of nation's inhabitants reside.
A In sanitation, the situation is quite different and much more severe,especially in the rural areas in terms of reaching each individual or family
£ with adequate sanitary facilities. While the service in technical terms issimple and primary, the large dispersed population, in some 576,000 villages,
9 all with various cultural, social and religious practices, and low levels ofliteracy, constitutes a formidable problem.
o
- 5 -
Table E1
Population Served(in millions)
Category
Water Supply
Urban
Rural
Total
Sanitation
Urban
Rural
Total
1970
Population
66.3
25.0
91.3
30.0
.5
30.5
%
60.8
5.7
16.7
27.5
.1
5.6I
1975
Population
107.0
86.0
195.0
35.5
1.7
37.2
%
83.8
17.9
32.1
27.8
.4
6.1
1981
Population
115.48
162.07
277.55
39.93
2.80
42.73
%
77.8
30.9
41.3
26.9
0.5
6.4
By contrast, urban sanitation services to the population residing incities is more manageable from a project view point and can be provided withthese services on a community or group-wise basis. This fact alone encouragesaction on the part of sector authorities, even though systems are more technicallycomplex and more costly. From 1970 to 1981, an estimated average of over 30percent had sanitation coverage in urban areas, whereas in the rural areasadequate sanitation was around one percent and at 1981 was 0.5 percent.Statistical information regarding sanitation in the rural areas is almost non-existent, so that even the reported 1981 coverage may not be correct.
2.2 Development Plan Allocations and Expenditures
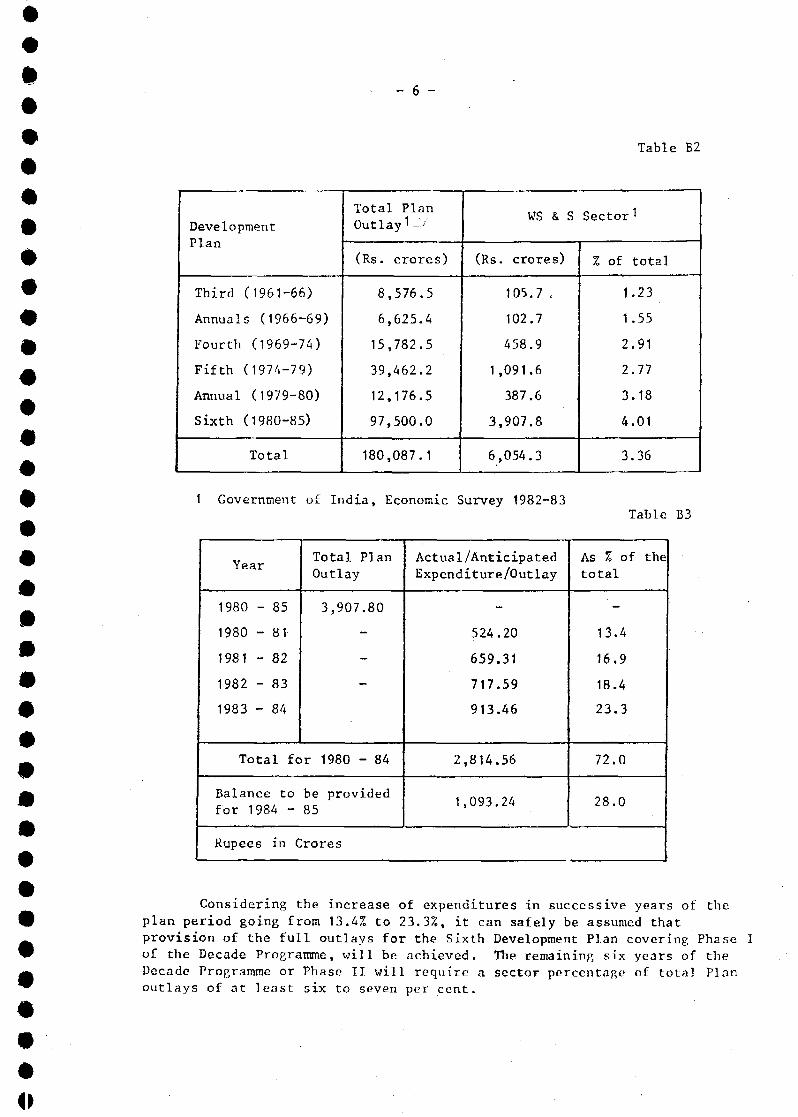
In terms of budgetary expenditures during the past two decades, Table B2provides information on total development plan outlays and the allocations inthose plans to the water supply and sanitation sector:
The percentage of sector expenditures to total development plan outlayshas been increasing from a modest 1.23 percent in the Third Development Planto 4\01 percent in the current Plan. The amount of funds to the sector in thecurrent plan is the anticipated allocation with the percentage as shown. Theprogress of expenditures during the first three years of the Sixth DevelopmentPlan and the proposed outlays for the fourth year are as in the Table B3.
- 6 -
*
#
Table B2
DevelopmentPlan
Third (1961-66)
Annuals (1966-69)
Fourth (1969-74)
Fifth (1974-79)
Annual (1979-80)
Sixth (1980-85)
Total
Total PlanOutlay1 -'•/
(Rs.
8
6
15
39
12
97
180
crores)
,576.5
,625.4
,782.5
,462.2
,176.5
,500.0
,087.1
(Rs.
1,
3,
WS & S
crores)
105.7 .
102.7
458.9
091.6
387.6
907.8
054.3
Sector1
% of total
1.23
1.55
2.91
2.77
3.18
4.01
3.36
1 Government of India, Economic Survey 1982-83Table B3
Year
1980 - 85
1980 - 81
1981 - 82
1982 - 83
1983 - 84
Total PlanOutlay
3,907.80
Total for 1980 - 84
Balance to be providedfor 1984 - 85
Actual/AnticipatedExpenditure/Outlay
524.20
659.31
717.59
913.46
2,814.56
1,093.24
As % of thetotal
13.4
16.9
18.4
23.3
72.0
28.0
Rupees in Crores
Considering the increase of expenditures in successive years of the.plan period going from 13.4% to 23.3%, it can safely be assumed thatprovision of the full outlays for the Sixth Development Plan covering Phase Iof the Decade Programme, will be achieved. The remaining six years of theDecade Programme or Phase II will require a sector percentage of total Planoutlays of at least six to seven per cent.
- 7 -
0 3. DECADE PROGRAMME GOALS
3.1 General
The Décade Programme should not be interpreted merely in terms ofA higher physical targets and more finances, but more importantly as an
opportunity to carry out much-needed reforms in the processes of planning,9 implementation, monitoring, operation and maintenance of water supply and
sanitation projects, so that facilities that are constructed and maintained9 efficiently and at reasonable cost are assured particularly to the rural and^ urban poor who need them critically. In the absence of such reforms, additional^ finances may not be used effectively or may remain unutilised or may even beA diverted to benefit groups other than those who need these basic facilities
most.
3.2 Water Supply and Sanitation
_ As at the end of the first year of the Sixth Development Plan, 31 March^ 1981, the start of the Decade Programme, an estimated 395 million population^ or about 58.7 percent of the total population were without safe water supplies,
302 million in the rural area and 93 million in the urban. In sanitation, the£ problem is even more severe in that there were some 629 million population or
94 percent of the country's total inhabitants without an" adequate and sanitary0 ( means of excreta disposal, 521 million or practically the entire rural area
and 108 million or 73 percent of the urban population.
^ In view of these low levels of coverage, particularly in the area of^ sanitation, and to bridge the existing wide gap in service, the followingA Decade targets to be reached by March 1991, have been agreed to by the
Central Government in concert with the States and Union Territories:
Sector Category Coverage Level of Service
Urban Water Supply 100% Piped water supplies in all™ communities, where feasible;^ demand range 70-250 lpcd,
• average 140 lpcd.
» Standposts in fringe areas, if^ necessary at strategic locations;^ demand range 25-70 lpcd, averageA 40 lpcd.
o
- 8 -
Sectory Category
Rural Water Supply
Urban Sanitation
Rural Sanitation
Coverage Level of Service
100% Piped water supplies for 30%of the population; demandrange 25-70 lpcd,; average40 lpcd.
Spot source water supplies for70% of the population in theform of dug or tubewells withhandpumps and/or power pumps;average demand 40 lpcd.
80% 100% coverage for Class I citieswith sewerage and sewage treat-ment facilities; low costsanitation methods in other towns,Overall coverage of 80% in allcities and towns.
25% Low cost sanitary methods ofdisposal.
COVERAGE PROGRAMME POLICIES
4.1 General
The task is one of great magnitude and calls for careful planning andprogramming in achieving the Decade targets. The selection of projects forproviding water supply and sanitation services must be realistic and determinedby the resources available, commensurate with the minimum needs of the popu-lation to be served. The projects should serve the maximum population atappropriate service levels with minimum investment- Concepts of low cost andappropriate technology suiting local conditions will, therefore, play a crucialrole.
The agencies responsible for the planning and implementation of watersupply and sanitation programmes at times adopt varying norms and standardswhich may result in increased project costs. Also there are different methodsused in projecting contingencies, pçice escalations and provision formaintenance expenditures in preparing capital cost estimates. As far aspossible, the norms and standards specified by the Government of India must befollowed.
4.2 Water Supply
4.2.1 Urban
In cities, the affluent sections of the population can afford andshould, wherever possible, be provided with house connections. In urbanfringe areas- and for the economically weaker sections, standpoets may be
o
- 9 -
provided at strategic locations. The water supply to uncovered towns should9 receive very high priority along with problem villages. The rehabilitation
of urban water supply systems should also receive special consideration,9 since in many of the urban communities, the systems have deteriorated due to^ age and usage. In such cases this will call for small investments as compared
^ to the investment required for new systems, and will substantially reduceA maintenance and operation problems.
0 4.2.2 Rural
• The rural population accounts for nearly 78 percent of the country's_ total population. There is a considerable backlog of projects for the provisio:^ of drinking water to the rural areas. The highest priority, therefore, will beA give-n to the rural areas in the provision of water supply, particularly in
regard to the problem villages. Special attention, must be given to hilly,£ desert and island areas, and to disadvantaged communities, such as the
scheduled castes and tribes.
The pattern of coverage to be followed would provide 30 percent of the9 population with piped water supply and 70 percent through spot sources. In^ general, the water supply in rural areas will be from tube wells fitted with
handpumps or power pumps.
Different approaches will be necessary due to problems of site location.£ In hilly areas preference has to be given to gravity systems, so as to reduce
overdependence on power supplies and to minimise operation and maintenance9 costs. Wherever feasible, devices such as hydraulic rams could be employed^ for lifting water for small rural communities. In desert areas, there is the™ possibility that the only available water sources exist at depths greaterA than 150 metres. In such cases water supply will have to be arranged through
tankers until alternative economical and feasible schemes are devised andA implemented. In the island areas, the ground water quality may be impaired and
may be unfit for human consumption, due to the intrusion of sea water. In such9 situations, it may be necessary to resort to various methods of desalination
of sea water, with per capita demands reduced very substantially to lower9 levels because of high production costs. Also in areas where the water^ quality is affected by excess fluorides and other toxic substances, reduced^ per capita demands may have to be ordered.
4.3 Sanitation
m ~~4.3.1 Urbanm —
_ = In regard to urban sanitation, Class-I cities must be provided with™ sewerage and sewage treatment facilities. However, in the fringe areasgk of these cities, community toilets may have to be provided; moreover in areas^ where sewerage systems are not possible, low cost sanitation methods have4h to be adopted. The other urban areas, Class-II through Class-VI cities, will
be provided with low cost sanitation facilities.
Low cost sanitation technology must be considered especially in rural/9 urban settings frequently referred to asxurban, as sewerage systems are not_ economically feasible for the majority of communities in these areas.
o
• - 10 -
A A.3.2 Rural
£ In regard to rural sanitation, simple sanitary latrines will be used.Small per capita cash provision could be made as an incentive for the
£ construction of sanitary latrines. Since such cash provision is not expected
to meet the full cost of latrine construction, these payments are consideredw as subsidies only. In view of this, the mobilisation of local manpower underA self-help programmes and the acquisition of materials for latrine construction
will be required. Proper care should be exercised to see that water sourcesA are not contaminated by latrines and that, wherever necessary, community latrines
are provided with attendants.
4.4 Financial
A 4.4.1 Source of Funds
A The financial resources required for implementation of water supply
and sanitation programmes during the Decade, to enable India to reach its£ established targets by March 1991, will be made available from the States,
Union Territories and Central Government's sector allocations of the Sixth,9 Seventh and Eighth Development Plans.
™ The funds for sector investment for the Sixth Development Plan haveA already been fixed and amount to slightly over four percent of the total outlay.
These funds will be made available for all programmes of the first four years^ of the Decade or to the end of the Sixth Development Plan on 31 March 1985.
^P The resources expected to be available during the remaining period
of the Decade, 1 April 1985 to 31 March 1991.will come from:
^ - related programmes of the Centre, States and Union Territories;
A - funds generated by local bodies through optimum exercise of
their existing powers;
- loans through the Life Insurance Corporation (LIC), Housing9 and Urban Development Corporation (HUDCO), and commercial
banks; and
A - external assistance from bi-lateral and multi-lateral agenciesand organizations.
4.4.2 Development Plans
Due to the large financial requirements of the Decade, a higher priority9 n as to be given to orogrammes under this sector. The plan provisions are to^ be stepped up in the future to provide adequate resources to achieve the^ targets of the Decade. The Development Plan outlays therefore, for the waterA supply and sanitation sector are to be increased from four percent in the
Sixth Development Plan to a minimum of six percent of the total- outlays ofA the Seventh and Eighth Development Plans." "*
o
- 11 -
A 4.4.3 Minimum Needs Programme (MNP)
0 Although rural water supply is getting a priority among the programmeslisted under the Minimum Needs Programmes, yet it is necessary that rural
w sanitation alongwith rural water supply should be given the highest priority anong_ these programmes and allocated not only the maximum but a much larger share9 of funds within the sector allocations for Minimum Needs.
Such larger allocations could be made during the remaining period of the0 Sixth Development Plan as well as in the Seventh and Eighth Plans.
9 4.4,4 State Government, Union Territories and Local Bodies
9 In providing for large and expanding urban and rural populations,& resources must be found not only for capital investment, but also for main-
tenance and operational costs and depreciation charges. Since the programme;A are implemented entirely within individual States and Union Territories, these
Governments must take up effective and innovative measures for raising9 additional resources.
9 Local governmental bodies are hesitant to raise water rates, but they^ must be persuaded to accept the concept of selling water as a commercial^ commodity based on its cost of production and the management of the service.A Reserve funds, in addition to current operational costs, must also be created
for the renewal and replacement of the water supply schemes.
State and Union Territory Governments must establish water rates to9 ensure repayment of loans and interest, as well as the recovery of operation^ and maintenance costs, and provisions for building reserve funds. Surplus9 net revenues from water supply service for industrial and commercial purpose:& are to be utilised as subsidies for sewerage and rural water supply systems.
9 Active participation of urban local bodies is to be secured. Minimumcontributions of 10 to 25 percent of capital costs are to be secured from suih
Q local bodies, depending on their size and their resources.
9 In the case of rural water supply schemes, the State and Union^ Territory Governments should stipulate minimum contributions by the people/^ Gram Panchayats of at least 10 percent of systems costs. These contributions^ should be substantially raised in suitable cases depending upon the public's
response and the resources of the Gram Panchayats concerned.
The State and Union Territory Governments should consider,-imposing9 a Special Purpose Cess as a surcharge on selected taxes, such as land revenue
sales tax, passenger tax, motor vehicle tax, etc. All revenues received frcr9 such a cess should be utilised exclusively for water supply and sanitation f-.-.ames
4.4.5 Life Insurance Corporation (LIC)
The Life Insurance Corporation provides loans upto a maximum of two-9 thirds of project costs, for the first one crore of the cost, 50 percent
for the next one crore, 40 percent for the next three crores and 25 percent
- 12 -
of project costs in excess of five crores. Under this broad pattern ofassistance, the LIC has made substantial funds available for the watersupply and sanitation sector. Considering the magnitude of the DecadeProgranme, however, a substantial increase of 15 to 20 percent annuallyin the provision of funds from the LIC will be necessary for project financing.
The LIC should, therefore.be persuaded to earmark at least ten percentof their investible funds for the sector in comparison to their current practiceof eight percent.
A.4.6 Other Avenues of Generating Sector Funds
A.A.6.1 Rural Development Fund
Expenditure directly incurred on approved Rural Development Programmesby companies and cooperative societies is eligible for full exemption fromincome tax. According to the latest policy decisions of the Government ofIndia, it has been decided to set up a Rural Development Fund at the Centrallevel and all contributions made to this Fund after April 1, 1983 by individuals,associations or corporate bodies will be entitled for cent per cent exemptionfrom income tax. The Fund will be centrally administered and allocations madefrom it for carrying out schemes of rural development, including schemes fordrinking water supply and sanitation. Since programmes of rural water supplyand sanitation already enjoy a high priority in the Minimum Needs Programmeand in the 20 Point Programme of the Prime Minister, a substantial and specifiedshare of the Fund should be earmarked for these programmes and allocations madefrom it according to the needs of the various States as an additionality totheir Development Plan outlays under the Central and the State Sectors.
To augment the Rural Development Fund industrial houses,philanthropicindividuals, charitable trusts and other public spirited bodies should bepersuaded and enthused to contribute generously to the Fund. If the donorsindicate a preference for a particular category of schemes, such as those fordrinking water supply, their wishes may be given due consideration in allocationof resources to the Sector programmes.
4.A.6.2 External Assistance
According to current practice, 70 percent of the external assistancereceived from the World Bank, other multi-lateral agencies and/or bilateraldonors is passed on to the States and Union Territories as additionality totheir plans. During the Decade Programme, this additionality should be ear-marked specifically for water supply and sanitation projects, for which itis provided. This will ensure that such external assistance availablefor schemes under this sector is not diverted to other sectors.
The United Nations Agencies headed by the United Nations DevelopmentProgramme have held several discussions with donor countries, who haveexpressed strong interest to assist member nations in achieving the targetsestablished for water supply and sanitation in the Decade Programme. Theprovision and distribution of external assistance funds, as received by theGovernment of India is on the basis of approved projects only. There isno sector-wise earmarking or reserving of such funds on a general basis.
A The State Governments and Union Territories must prepare a shelf ofpriority projects which can be proposed to external agencies for provision
A of credit assistance during the Decade Programme. Under these conditions, fundspassed on to the States and Union Territories from external sources are to be
9 used exclusively for the specified projects.
9 '4.4.6.3 New Financing Institution for Sector Development
^ For the implementation of water supply and sanitation projects, creditsA or loans at present are available mainly from the State and Union Territory
Governments and the LIC. In some projects, external assistance is available0 from the World Bank and bilateral donors, which is routed through the Central
Government. Other financial institutions and commercial banks provide very9 little if any financial support for sector projects and no organized attempt^ has so far been made to explore this source of funds.
A The effort in obtaining financial assistance is mainly left to localand/or State and Union Territory Governments, who have to promote support
0 for individual projects. There is no established system nor centralinstitution to coordinate, regulate, guide or monitor, the flow of financial
9 services to the water supply and sanitation sector equal to those existinginstitutions that provide such services for agricultural development (ARDC) , rural
9 electrification (REC) and housing and urban development (HUDCO).
In order to streamline the institutional arrangements for financing of£ water supply and sewerage schemes, an institution must be established at the
national level. The new institution must be empowered to raise loans from LIC,9 GIC, and other financial agencies and commercial banks, and to raise funds from
the open market by issue of debentures. This institution would serve as a vehicle9 for the routing of funds from the Government of India, national agencies and^ external sources to the various organizations implementing water supply and^ sewerage schemes. The institution would help to coordinate financial arrangementsA and greatly facilitate the flow of funds and would bring about a greater measure
of financial discipline and attention to economic viability of projects.
A national level financing institution needs to be established along the9 lines of HUDCO or EEC to serve as the aforementioned central agency. The magnitude
of the Decade Programme is of such scale that a separate national level institution9 would be fully justified.
5. SUPPORT PROGRAMME POLICIES
£ 5.1 Administration'and Management
9 The agencies responsible for planning and implementation of the Decade_ Programme are the public health engineering departments and water supply and™ sewerage boards in the States and Union Territories. Some States have separateA organisations for urban and rural water supply and sanitation programmes. It
would be desirable for one organisation at State and Union Territory levels toA be responsible for all water supply and sanitation activities. This would bring
about better implementation and control of the Decade Programme. At the Secre-9 tariat level, different departments handle urban and rural schemes or one depart-
ment controls the public health engineering staffs and another the programmes.9 The staff working in water supply and sanitation are often split on rural, urban
or municipal lines. It is necessary to have an integrated administrative frame™ work from the programme planning and formulation stage to execution of schemesA and technical guidance and support in operation and maintenance.
The administrative process in the Government must be streamlined and9 made flexible, keeping in view the importance of the Decade Programme. At& present there is considerable delay due principally to inadequate delegation
of powers to sanction schemes and incur expenditures for the purchase ofQ material and equipment and for the appointment of staff. The purchase of
materials is not well organized and often tied to different schedules of9 other departments. Delays in formal sanction of schemes result in escalation
of costs and start up problems. Necessary changes must be introduced in the9 present system after thorough study has been made of the situation.
^ There are frequent transfers of senior officers who are in charge of.£ water supply and sanitation activities in the State and Union Territory
Governments. While transfers in some circumstances cannot be helped, it would9 be advisable not to transfer senior personnel too frequently in the interest
of continuity and efficiency. It is suggested that, as far as possible, senior9 personnel should be allowed terms of at least three years in a post.
~ In many of the States, where water and sewerage boards exist, non-£ officials are often posted as Chairmen. To enable them to discharge their
functions more efficiently, it will be desirable for them to participate injQ appropriate training courses and seminars. Similarly elected members in local
bodies (municipal chairmen, village pradhan, etc.) should also be enrolled in9 such courses and seminars.
5.2 Manpower
The development of manpower is to be achieved basically in two ways, by^ improving the number and quality of trained persons at all levels and
by recruiting categories of persons, where needed, who are in short supply£ for systems construction and for the operation and maintenance of the services.
9 5.2.1 Engineering Staff
^ The development of engineering personnel for the sector will requirethat:
civil engineering curriculae be restructured to includeelective courses in environmental engineering, and thatgraduates with such électives be given preference in recruit-ment for posts in the various Public Health EngineeringDepartments of State Government and Union Territories;
diploma courses in civil engineering be remodeled to embraceenvironmental engineering subjects; and
graduates be attracted to the sector, by improving serviceconditions, providing incentives of increased remunerationand benefits, opportunities and advancement and careerdevelopment.
- 15 -
5.2.2 Technicians, Craftsmen and Skilled Workers
The personnel at grass root levels of public health engineeringdepartments and water and sewerage boards are the technicians, craftsmenand skilled workers, who are employed in the execution of water supply andsaiiitcti&n schemes, and in their operation and maintenance. These personnelshould have detailed orientation towards water supply and sanitation duringtheir course of basic studies, and should have opportunities of continuingeducation through in-service training to update and upgrade skills. Statepublic health engineering departments should coordinate and develop coursesto suit the needs of sector activities with existing industrial traininginstitutes in the States.
5.2.3 In-house Expertise
In the planning and preparation of projects for the water supplyand sanitation sector, there is a tendency to depend on outside or foreignconsultants. It will be advisable to reduce such dependence and to developinstead project planning and preparation units in public health engineeringdepartments and water and sewerage boards. Some of the expertise needed inthe field of project appraisal, financial analysis and monitoring could betransferred from various industries and irrigation agencies, where theseparticular functions have been part of their project planning and preparation.Foreign technical assistance could still be used to develop training capabilityin state level institutions and local and foreign consultants could beretained for project preparation where this is proved to be the mostfeasible procedure.
5.2.4 In-service Training
It is very essential that present programmes of on-the-job trainingin public health engineering be continued with increasing intensity andemphasis during the Decade period. Planners, administrators, engineers,subordinate engineers, plant operators, laboratory personnel and communityworkers should undergo training with respect to their special needs.
5.3 Materials and Equipment
5.3.1 General
Sector materials and equipment necessary to meet Decade requirementsare to be produced from indigenous or external sources, keeping in view,inter alia, existing capacities, increased production, new facilities and theGovernment's desire for the sector to remain self-sustaining by utilizationof natural resources.
5.3.2 Specific Considerations
Specially and to the maximum extent possible, the sector will:
- use only indigenous raw materials in the manufacture ofequipment and production of materials that will berequired;
- 16 -
0 - import only that equipment or those materials that cannotbe produced internally, are not existing within the country, or
^ by reason of price, can be secured at less cost from external& sources;
£ - urge the Government to reduce substantially or eliminateentirely import and/or excise duties now in effect or to be
0 imposed on any equipment or material vital to this sector,which by reason of such duties and restrictions prohibit or
w prevent their utilization because of resulting higher product» costs ; and
A - urge the Government through the Ministry of Energy, theMinistry of Petroleum, Chemical, and Fertilisers, the
0 Ministry of Industry and the Ministry of Transportation toearmark or reserve at appropriate periods „ in accordance with
0 State Government and Union Territory Decade Plans, sufficient_ supplies in advance to meet the requirements of electric power,™ petrol, diesel and lubricating oils, cement, steel, pipes andA vehicle wagon capacity and priority for the transportation
of sector materials and equipment on the national railwayf system.
0 5.4 Operation and Maintenance
» The operation and maintenance of water supply and sanitation systems isA a specialised field and requires a high degree of responsible attention in
order to conserve and prolong to the maximum extent, the useful service life£ of all facilities. The following aspects must be considered:
£ - adequate attention should be paid, during the planning and thedesign of systems to matters which will facilitate efficient
9 operation and maintenance, such as, access roads, maintenance_ schedules, measuring devices, testing and communication™ facilities;
- preventive maintenance rather than corrective maintenance£ should be emphasised with proper supervision of all staff
as one of the most vital and important functions;m
- field staff should be properly qualified and experienced, andw given status and authority;
^ - adequately trained operation and maintenance staffs should beA assigned at the time of installation of the plants and equipment;
A - provision should be made for appropriate maintenance depots,workshop stores, tools and equipment, spare parts,
V transport and communication facilities and training establishment"5for service personnel.
- 17 -
5.5 Research and Development of Appropriate Technology
_ In spite of the considerable research activity now on going in the9 water supply and sanitation sector, there have been communication gaps andA research benefits have not filtered down to field engineers, who could
fruitfully employ such research findings to better advantage. ResearchA activities need orientation towards the development of appropriate technology
in water supply and sanitation projects, utilising information available in9 developed and other developing countries and modified to suit local conditions,
so that the cost of implementation could be minimised. A case in example is9 the programme of low cost sanitation project in collaboration with UNDP,& which is an appropriate technology relevant to the country's needs.
£ Moreover, due to the absence of a Central coordination agency, thereis insufficient collaboration among the institutions which undertake research
9 activities, resulting in considerable overlap of efforts. It is necessaryto establish a national body to overview and guide research activities. If
9 necessary, established zonal centres could investigate the areas in which« research work is needed and select programmes according to their importance^ - and priority. Regarding the selection of subjects for research, StateA service departments are to be consulted to enable them to classify the selection
as to priority. If possible, local bodies should be consulted, particularlyQ in cases involving rural areas.
w Laboratory model projects undertaken for research studies can be_ demonstration projects and operated jointly by service departments and research9 institutes. During such exercises, working and design manuals should beA prepared and sent to all the service departments, laboratories and local
bodies. In initiating demonstration projects, zonal centres should adviseA nearby states so that they may participate in these projects.
0 It is suggested that the Central Public Health Engineering and Environ-mental Organization in the Ministry of Works and Housing be appointed as
9 the Central Coordinating Agency.
9 5.6 Management Information System
For sound planning, implementation, operation and maintenance of theA water supply and sanitation projects an improved and effective management
information system is to be introduced at the State and National level.
5.6.1 Information System/Data Bank
& Its is necessary to develop a data bank on the various schemes inwater supply and sanitation undertaken by the States and Union Territories.
£ The data is to be reported and compiled at the State levels and transmittedto the national data system maintained at and by the CPHEEO. Particular
9 emphasis must be given on schemes of water supply to problem villages. Thedata must be organised in terms of geographical coverage, physical targets,
9 costs for completion, people benefitted, levels of service and the overall_ achievements in physical and financial terms. These data are to be computer!zee9 with the help of the information centre for the purpose of storage and retrieval
- 18 -
£ Many separate programmes can be accommodated at the central data bank once thesystem is operating and after base-line data has been prepared and stored.
9 Conversion to the new system from manual data system will proceed at a pace
commensurate with acquired expertise of the reporting units. The present M & I9 units, may be trained and sanctioned for this purpose and the information& specialists in the CPHEEO should assist the State and Union Territory Governments
to set up the system. Without the benefit of timely and adequate data£ concerning the schemes executed by the different agencies it will be difficult
to adequately monitor the progress of Decade programmes.
9 5.6.2 Documentation
Documentation, one of the most vital and important steps in managementA information system design, is the physical record generally in written or
printed form, describing the structure, operation and method for testing and9 revising the information system. Documentation provides description of the
system from general to the fine detail. It will consist of the following9 data in regard to water supply and sanitation projects:
™ - summary flow charts of more detailed charts;
- operation activity sheets;
- specification of the data base or master files;
- hardware and software requirements, personnel requirements
^ by type of skill and discipline;
^ - final (updated) performance specifications, cost of
A implementation and operation of the system;
9 ~ programme for modification or termination of the system; and
9 an executive digest of the information system design, so that
the top management can be advised regarding the system, its9 potential, its cost, and general configuration.
Documentation is necessary in respect of various reports and studies£ generated in the process of formulating various schemes, revaluations,
internal control reports, consultancy studies, socio-economic studies, etc.9 This enables the exchange of experience and information for better performance.
The CPHEEO should organise the international documentation unit for disseminaticz.9 Over a period, these data could be stored on microfilm.
™ 5.6.3 Transfer of Technical Information
The technical cooperation among developing countries (TCDC) is very£ much essential to facilitate active implemntation of decade programmes. The
subject areas where TCDC is needed include information transfer, appropriate9 technology, programme development and formulation, experience in financial
aspects and other policies, standardisation of design criteria and legislation
w on water supply and sanitation.
• - 1 9 -
•
A The information available on common problems in the region or States
could be usefully gathered and disseminated to all concerned. Similarlyd liaison with countries in other regions may be required on subjects such as
ground water recharge as practiced in some South American countries, package0 programmes for community water supply and sanitation adopted in South-Korea
and desalination technology using solar energy in the Carribean Islands, to^ list only a few of the many examples of appropriate technology. Such transferA of technology would indeed prove beneficial. The CPHEEO at the Centre,
through its international documentation unit, when operational, would transferf the information as required.
0 5.7 Coordination with Other Sectors
• 5.7.1 General
There are many activities in the various Ministries and Departmentsf of the States and Central Government, which have a direct or indirect bearing
on the water supply and sanitation sector. The dovetailing of these activities0 will maximise the inputs and strengthen the sector.
5.7.2 Irrigation Programmes
™ Under the major and medium irrigation projects, reservoirs, canalA systems and tubewells are being constructed. All sources can quite easily
supply village drinking water requirements in addition to fulfiling their0 main irrigation purposes. In such cases the supply of drinking water will
be assured at all times including drought periods. The villages near embankment;ém of major and medium irrigation projects and those situated on the banks of_ irrigation canals should be provided with drinking water supply from such9 schemes free of cost, as far as possible, and,many water supply schemes can wellA be integrated as parts of irrigation projects. Thus maximising the utilisation™ of financial resources of the sector. Therefore, where the requirements of£ water supply schemes are small, water should be provided by irrigation tubewells
and where feasible, should also be stored in sumps and distributed at the£ desired pressures. Since drinking water supply needs are small compared
to irrigation demands some portion of the irrigation water should be allocated9 to water supply departments. Where the costs of such schemes are not^ substantial, they could be constructed by Irrigation Departments with their own™ funds and given to the village communities for operation and maintenance. InA large urban projects, charges for water supply for drinking purposes from irrita:
projects should not exceed the rates at which water is supplied for irrigation.£ The State Governments should advise their Irrigation Departments to integrate
drinking water supply schemes and set apart a portion of the water for drinking0 purposes as a part of irrigation projects in all possible areas.
5.7.3 Public Agencies
Agencies like the railways and public sector corporations, are£ constructing water supply schemes for their colonies. Various industrial
development corporations as well are also providing water supply and sewerage£ for their areas. These activities and the sector activities of public sector
townships constitute an additionality to the Decade Programme and should be£ integrated and coordinated with the sector programmes of their respective_ State Governments and Union Territories.
- 20 -
5.7.4 Ministry of Rural Development
The National Rural Employment Programme of the Ministry of RuralA Development is basically geared to provide employment in the rural areas
and in the process to create durable community assets through utilisation of0 provisions for the labour component of the project. Through these same
provisions, rural water supply and sanitation schemes can be implemented.
^ Although at present there is no earmarking of funds under this Programme^ for drinking water supply schemes or sanitation schemes, the State GovernmentsA and Union Territories are at liberty to select any of the works mentioned in
the guidelines for implementation of projects under this Scheme, including0 drinking water supply and sanitation. If necessary the guidelines could be
suitably amended. Community participation should also be secured for systemsw maintenance arrangements through the Block Development Administration and^ through the Panchayat Samities (Village Councils).
A 5.7.5 Ground Water Boards
£ Central and State Ground Water Boards play an important role inidentification of needed raw water sources that must comply with quantity
6 and quality specifications of water supplies. The Public Health EngineeringDepartments of the States and Union Territories should enlist the personnel and
™ coordinate the services of these Boards. Since, adequate numbers of senior& hydrogeologists and geophysicists are not available in the States and Union
Territories, senior personnel from the Central Ground Water Board should takeA up the work of site location and the scientific prospecting of ground water.
Gradually, the States and Union Territories and their Ground Water Boards can40 develop their own cadre of hydrogeological staff.
#A 5.7.6 Ministry of Health and Family Welfare
À In providing basic health care services, it is essential to establishtraining programmes for all levels of health personnel, in regard to the
£ important aspects of safe water supply and adequate sanitation. It is importantin turn to educate the public with regard to these aspects through the facilities
£ and services of Primary Health Care Centres, Block Development Offices andCommunity Health Volunteers.
^ The Ministry has formulated targets for training and employment of health~ personnel and the establishment of health facilities which are necessary to£ provide primary health care to the people under the programme of 'Health for
All' by the year 2000 AD.
The Ministry has already trained over 170,000 health guides to impartV health education among the rural people and there is a proposal to train at_ least one health guide for every village by the end of the Sixth Development™ Plan. These health guides possess the necessary training to educate theA rural masses in the proper maintenance of drinking water supplies from source
to use. They are also equipped to motivate the community and initiate actionA in the conversion of open wells into sanitary ones, and use of water seal
toilets followed by septic tanks and soak-pits for sanitary disposal of human
- 21 -
wastes. The Ministry through the Primary Health Care Centres will act as theliaison and coordinating agency in the execution of education campaigns inthe required rural areas.
5.8 Health Education/Community Participation
In the implementation of the Decade Programme, support programmes like'Health Education' and 'Community Participation1 will have to play crucialroles. It is a known fact that without proper education, there will be littleimpact on community health despite huge investments on water supply andsanitation facilities. Health education and community participation will becarried out by the Primary Health Care Centres, Block Coordination Committeesand trained health workers and community health volunteers.
5.8.1 Health Education in the School
As a part of the Primary Health Care Programme the following objectiveswould be pursued:
teachers trained to recognise defects and ailmentsin children at an early stage;
- school authorities advised as regards safe water, sanitary
latrines; and
- health education programmes arranged involving thechildren, teachers and parents.
5.8.2 Health Education in the Community
Trained community health volunteers would be working with the panchayatpersonnel and community leaders in planning for:
- selection of community representatives for trainingin maintenance and repair of hand-pumps and constructionof sanitary latrines and soak-pits; and
- health education programmes; and campaigns for safe water supply
and environmental sanitation-
Health education programmes in the community by health workers andcommunity health volunteers should lay greater stress on the following needs:
- safe water supplies and proper chlorination;
- maintenance of wells and hand-pumps by the community, andto prevent contamination of water sources by bathing andwashing of clothes, etc.;
- prevent accumulation of sullage water around dwellings; andto dispose of refuse in an hygienic manner; and
- 22 -
» - construct and use sanitary latrines and to maintain them^ properly.
Mass media such as radio, television, films and papers will augment9 the efforts in this direction.
9 5.8.3 Block Coordination Committees
^ Action programmes of health education and community participation can beA effectively executed by Block Coordination Committees whose principal functions,
among other activities, would be to:
- organise cleanliness campaigns;
^ - arrange for the community to procure at reasonable prices,9 materials for the construction of latrines and soakpits; and
- arrange for the training of community members in theA maintenance and repair of hand-pumps and construction
of sanitary latrines and soakpits.
5.9 Non-Governmental Organizations (NGOs)
& Non-governmental Organizations play a significant role in enlistingcommunity participation and in developing skills and activities which
A complement the implementation of government programmes. This complementaritycan be enhanced by providing means and mechanisms for a larger Non-govern-
9 mental Organization participation.
9 5.9.1 Non-Governmental Organization Capability
9 A recent survey by the UNDP of a sample group of 14 NGOs, representingJ^ a significant cross-section of these agencies in the country found that:
£ - several had developed complete capabilities in the provisionof drinking water and sanitation in urban and/or rural areas;
most had attempted community involvement and several had succèss-9 fully developed people's unions and organizations (Sangams,^ Sangathans etc.) for the promotion of activities in^ their areas;
- they had experimented with and innovated appropriate lowQ cost technologies in drinking water and sanitation facilities;
9 - all had experience of working with government departments andagencies and many were represented on different committees
9 of the State and Central Government;
- most emphasized that maintenance of drinking water and£ sanitation facilities should be an on-going responsibility
of the local community, although the training of local9 persons and provision of necessary minimum spares are critical
for this to succeed;
greater dissemination of information was necessary regarding theDecade and other government plans and programmes to enable moreeffective collaboration with government agencies in achievingnational goals; and
providing printed educational materials was necessary on drinkingwater and sanitation for motivating and educating the communityas well as field level workers.
5.9.2 Non-Governmental Organization Involvement
To ensure a greater involvement of the NGOs in sector programmes, it isnecessary for them to be adequately represented both at the State and CentralGovernment levels. Further, a committee of NGO representatives must be formed,which should:
prepare a resource profile of all NGOs for the information of theCentral and State Governments indicating the nature of theiractivities;
periodically review and monitor the implementation of the DecadeProgramme in areas of NGOs collaboration;
- identify the manner and type of NGOs involvement;
promote community participation;
- assist in the development and supply of educational materialsfor educating communities and project staffs in the local areas;
- identify areas of research and make social-economic assessmentof programme needs;
involve women's organizations as educators and motivators ofcommunity households especially women and children, and
establish implementation/coordination committees at State/Districtlevels, which should include women representatives as well aselected representatives and government officials.
5.9.3 Government Recognition and Support
To enlist the support of the Non-governmental Organizations in the areathe Central government should:
- provide appropriate recognition of NGOs as training resources, bot:,at the national and state levels;
involve NGOs in producing training materials, integrating healtheducational materials with other sectoral materials, etc.; and
assist in the provision of visual aid equipment for utilising abovematerials.
As some NGOs are already cooperating with government at State and locallevels in training and materials development and use, certain model experiencesand examples of such cooperation should be replicated elsewhere in the country.These pilot projects should be part of a strategy to expand the effectivenessof water supply and sanitation efforts in the country.
6. DECADE PROGRAMME PRIORITIES
6. 1 Priority Areas for Implementation
The following priorities should be adhered to by all State
Governments and Union Territories in drawing up and implementing the Decade
Programme:-
i) safe drinking water to problem villages;
ii) safe drinking water to uncovered towns or uncovered
urban areas;
iii) rehabilitation of old urban water supply schemes;
iv) low cost sanitation to towns other than Class I cities;
v) safe water supply to non-problem villages;
vi) augmentation of urban water supply systems;
vii) sewerage facilities to Class I cities lacking them
at present; and
viii) sanitation in rural areas.
6.1.1 Special Priority Considerations for Water Supply
The 231,000 problem villages is the planned target coverageunder the State Sector Minimum Needs Programme and the Central SectorAccelerated Rural Water Supply Programme during the Sixth DevelopmentPlan.
In the implementation of the rural water supply programme, the•needs of the scheduled castes and scheduled tribes must be given highpriority. Every new source of drinking water in a vilTage should belocated in the scheduled castes habitation, open to all communities, whereit is logistically and technically possible to do so.
The following guidelines must be followed in the implementationof all rural water supply schemes, in view of the limited resourcesavailable:
- first priority must be "accorded to no-source villageswhich have remained so far without water supplyfacilities ;
all villages which have sanitary dugwells as existingsources of water supply must be identified and deletedfrom the list of problem villages already sent by theState Governments. Moreover, problem villages thathave been provided with permanent safe water supplyfacilities under the advance plan assistance programmefor natural calamities, must also be deleted from thelist. In the remaining problem villages, first prioritymust be accorded to villages with no sources of supply.At least one source of potable water must be availablethroughout the year in every problem village;
where the population of villages is more than 300,additional sources should be provided on the basis ofone source per 250/300 inhabitants. New sources ofsupply should be provided preferably in harijan busteesj
for hard rock areas, tubewells with handpumps must bethe first preference. Piped water supply schemes mightbe necessary in places where water is brackish or source ofwater is at a distance. However, piped water supplyschemes or power pumps should be the last alternative;
suitable engineering solutions must b,e worked out andmost economical alternatives adopted in hilly areas,deserts and other strategic places;
in hilly areas, gravity flow systems or devices likehydraulic rams can be considered as economic alternatives; and
- augmentation of rural water supply schemes should beavoided at least until all unserved villages are covered.
6.1.2 Special Priority Considerations for Sanitation
In urban sanitation, only the Class I cities are to be providedwith complete sewerage systems. Even in these cities community toiletsand public latrines with attendants will have to be provided to meetparticular needs and circumstances. For other classes of towns, onlylow-cost sanitation techniques are to be considered as viable solutions.
Low cost sanitation techniques would provide flush toilets by:
- converting all dry latrines feasible into sanitarylatrines;
providing pourflush latrines with leach pits to individualhouseholds, wherever feasible; and
providing well maintained community latrines, with fulltime attendants for households which cannot be coveredunder either of the above, due to space limitations.
# - 26 -
0 The towns are to be selected based on the criteria that they:
^ - already have piped water supply systems;
- are not sewered and are not likely to be sewered during
0 the decade;
9 - have populations less than 100,000;
™ - represent varied socio-economic, cultural and geophysical» conditions; and
A - are interested and financially viable, so that the schemescan be implemented expeditiously.
In rural sanitation, 25 percent of the population are to bew provided with simple sanitary latrines. The Government should give
_ a cash subsidy on a per capita basis, as an incentive: to the
^ beneficiaries under the programme of low cost sanitation.
£ 6.2 Phasing of Decade Programme
The Decade Programme is divided into two Phases; Phase I£ covering the remaining four years of the Sixth Development Plan,
1981/82 to 198A/85; and Phase II the remaining six years of the• Decade, 1985/86 to 1990/91.
6.2.1 Phase I
A In Phase I, the estimated populations'^ that can be served withthe available resources provided in the Sixth Development Plan will
£ approach 87 percent in urban water supply and 52 percent in ruralwater supply; in sanitation, service will be provided to approximately
IP 34 percent in the urban area and 1.5 percent in the rural communities.
m6.2.2 Phase II
•
A In Phase II, service will be provided to the remaining unservedpopulation in both urban and rural water supply, and facilities
0 provided in sanitation to the urban and rural areas sufficient toreach the Decade targets of 80 and 25 percent, respectively.
iThe percentage of population is based on the projected population for 1985,
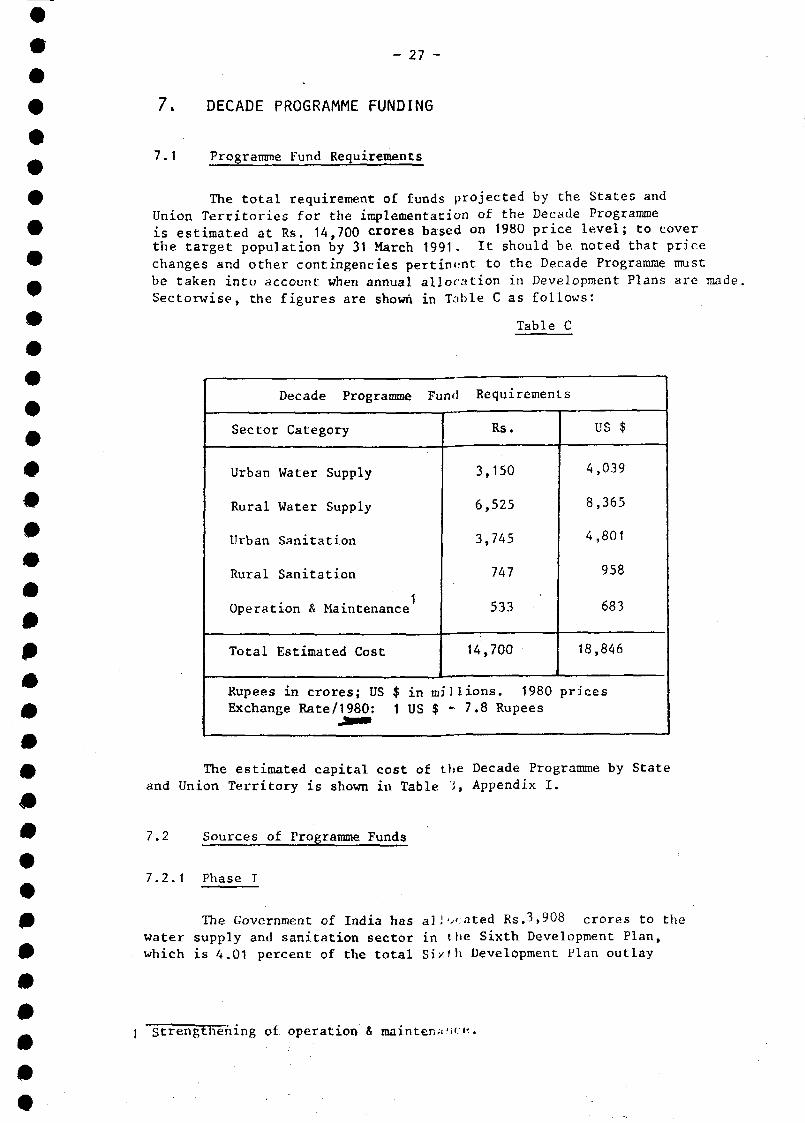
- 27 -
7. DECADE PROGRAMME FUNDING
7. 1 Programme Fund Requirements
The total requirement of funds projected by the States andUnion Territories for the implementation of the Decade Programmeis estimated at Rs. 14,700 crores based on 1980 price level; to coverthe target population by 31 March 1991. It should be noted that pricechanges and other contingencies pertinent to the Decade Programme mustbe taken into account when annual allocation in Development Plans are made.Sectorwise, the figures are shown in Table C as follows:
Table C
#
Decade Programme
Sector Category
Urban Water Supply
Rural Water Supply
Urban Sanitation
Rural Sanitation
Operation & Maintenance
Total Estimated Cost
Rupees in crores; US $ inExchange Rate/1980: 1 US
Fund
mill
$ -
Requirements
Rs.
3,150
6,525
3,745
747
533
14,700
ions. 19807.8 Rupees
4
8
4
18
US $
,039
,365
,801
958
683
,846
prices
The estimated capital cost of the Decade Programme by Stateand Union Territory is shown in Table 'J » Appendix I.
7.2 Sources of Programme Funds
7.2.1 Phase I
The Government of India has al ) ••>< ated Rs.3,908 crores to thewater supply and sanitation sector in the Sixth Development Plan,which is 4.01 percent of the total Si/'h Development Plan outlay
Strengthening of operation & maintenuac
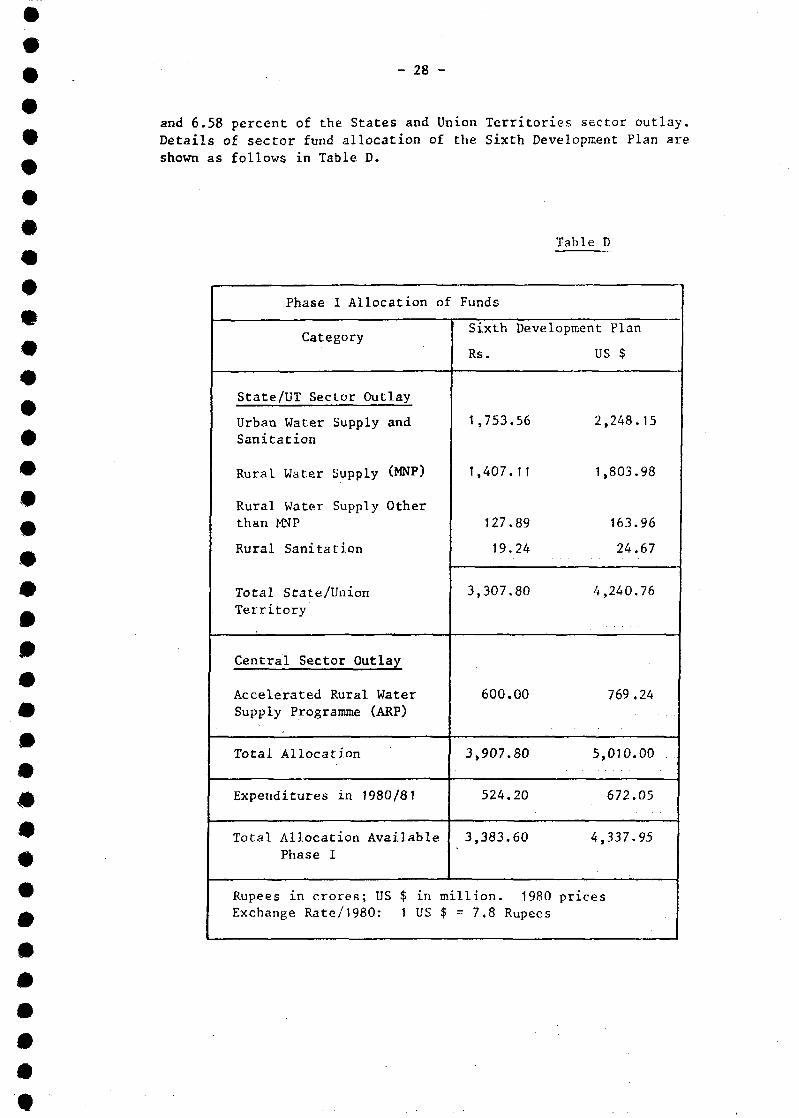
- 28 -
and 6.58 percent of the States and Union Territories sector outlay.
Details of sector fund allocation of the Sixth Development Plan are
shown as follows in Table D.
Table D
m
Phase I Allocation of
Category
State/UT Sector Outlay
Urban Water Supply andSanitation
Rural Water Supply (MNP)
Rural Water Supply Otherthan MNP
Rural Sanitation
Total State/UnionTerritory
Central Sector Outlay
Accelerated Rural WaterSupply Programme (ARP)
Total Allocation
Expenditures in 1980/81
Total Allocation AvailablePhase I
Funds
Sixth Development Plan
Rs.
1,753.56
1,407.11
127.89
19.24
3,307.80
600.00
3,907.80
524.20
3,383.60
Rupees in crores; US $ in million. 1980Exchange Rate/1980: 1 US $ = 7.8 Rupees
US $
2,248.15
1,803.98
163.96
24.67
4,240.76
769.24
5,010.00
672.05
4,337.95
prices
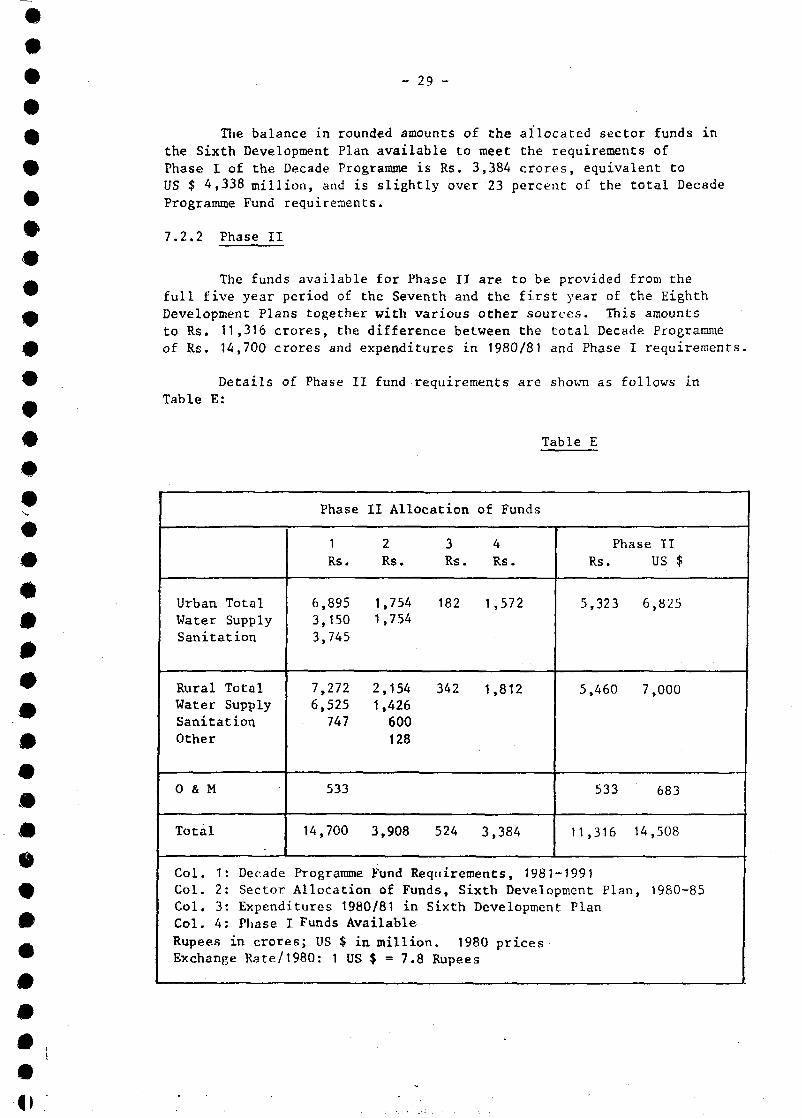
- 29 -
The balance in rounded amounts of the allocated sector funds inthe Sixth Development Plan available to meet the requirements ofPhase I of the Decade Programme is Rs. 3,384 crores, equivalent toUS $ 4,338 million, and is slightly over 23 percent of the total DecadeProgramme Fund requirements.
7.2.2 Phase II
The funds available for Phase II are to be provided from thefull five year period of the Seventh and the first year of the EighthDevelopment Plans together with various other sources. This amountsto Rs. 11,316 crores, the difference between the total Decade Programmeof Rs. 14,700 crores and expenditures in 1980/81 and Phase I requirements,
Details of Phase II fund requirements are shown as follows inTable E:
Table E
#
mm
Urban TotalWater SupplySanitation
Rural TotalWater SupplySanitationOther
0 & M
Total
Phase
1
Rs.
6,8953,1503,745
7,2726,525747
533
14,700
II Allocation of Funds
2 3 4Rs. Rs. Rs.
1,754 182 1,5721,754
2,154 342 1,8121,426600128
3,908 524 3,384
Phase
Rs.
5,
5,
11,
323 6
460 7
533
316 14
Col. 1: Decade Programme Fund Requirements, 1981-1991Col. 2: Sector Allocation of Funds, Sixth Development Plan,Col. 3: Expenditures 1980/81 in Sixth Development PlanCol. 4: Phase I Funds AvailableRupees in crores; US $ in million. 1980 pricesExchange Rate/1980: 1 US $ = 7.8 Rupees
IIUS $
,825
,000
683
,508
1980-85
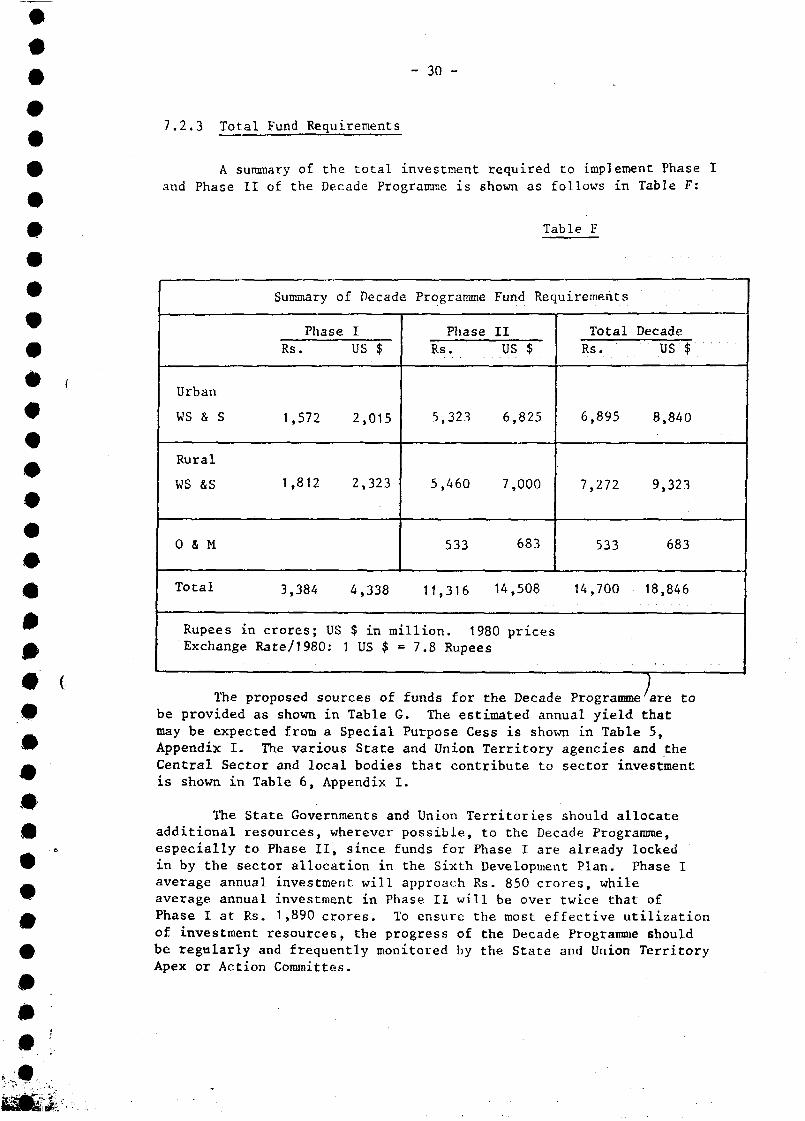
- 30 -
7.2.3 Total Fund Requirements
A summary of the total investment required to implement Phase Iand Phase II of the Decade Programme is shown as follows in Table F:
Table F
#
#
êm
Urban
WS & S
Rural
WS &S
0 & M
Total
Rupees inExchange
Summary of
PhaseRs.
1,572
1,812
3,384
crores; USRate/1980: 1
I
Decade Programme
US $
2
2
4
$1
,015
,323
,338
Phase
Rs.
5,323
5,460
533
11,3.16
Fund Requirements
IIUS $
6,825
7,000
683
14,508
in million. 1980 pricesJS $ = 7.8 Rupees
Total
Rs.
6,895
7,272
533
14,700
Decade
8
9
18
US $
,840
,323
683
,846
The proposed sources of funds for the Decade Programme are tobe provided as shown in Table G. The estimated annual yield thatmay be expected from a Special Purpose Cess is shown in Table 5,Appendix I. The various State and Union Territory agencies and theCentral Sector and local bodies that contribute to sector investmentis shown in Table 6, Appendix I.
The State Governments and Union Territories should allocateadditional resources, wherever possible, to the Decade Programme,especially to Phase II, since funds for Phase I are already lockedin by the sector allocation in the Sixth Development Plan. Phase Iaverage annual investment will approach Rs. 850 crores, whileaverage annual investment in Phase II will be over twice that ofPhase I at Rs. 1,890 crores. To ensure the most effective utilizationof investment resources, the progress of the Decade Programme shouldbe regularly and frequently monitored by the State and Union TerritoryApex or Action Committes.
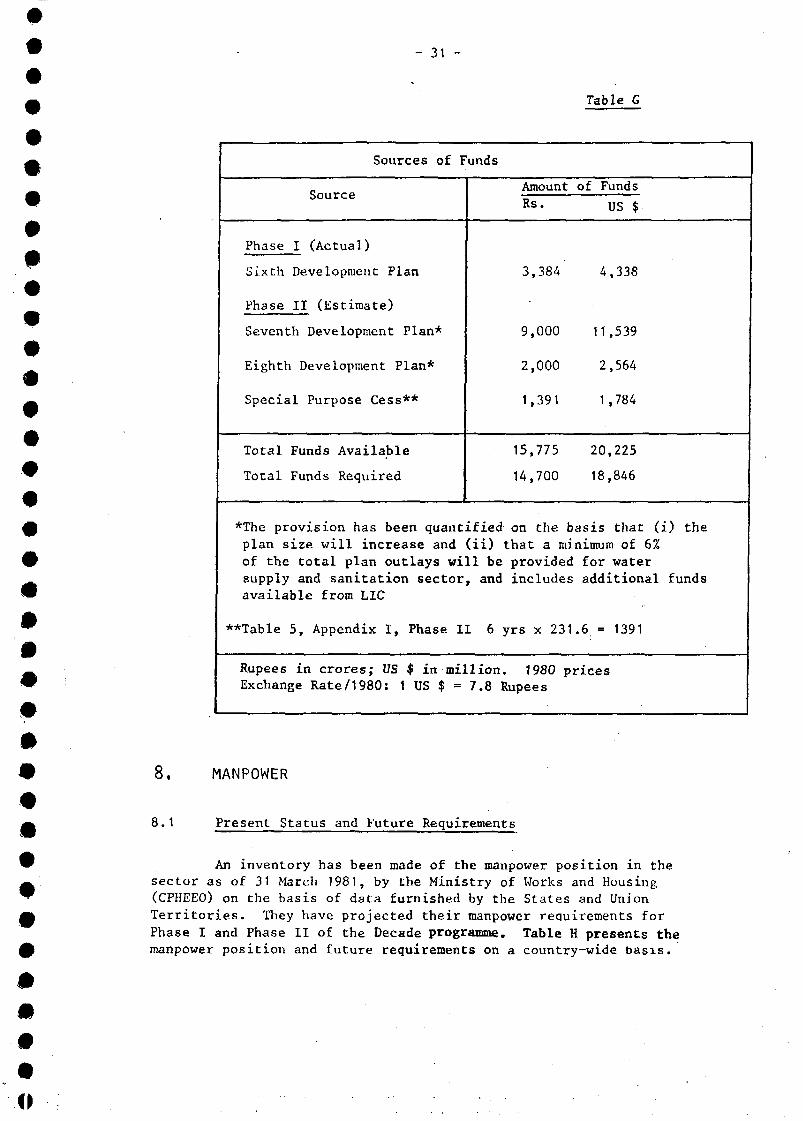
- 31 -
mmm
Table G
Sources of Funds
Source
Phase I (Actual)
Sixth Development Plan
Phase II (Estimate)
Seventh Development Plan*
Eighth Development Plan*
Special Purpose Cess**
Total Funds Available
Total Funds Required
Amount
Rs.
3,384
9,000
2,000
1,391
15,775
14,700
of Funds
4
11
2
1
20
18
US $•
,338
,539
,564
,784
,225
,846
*The provision has been quantified on the basis that (i) theplan size will increase and (ii) that a minimum of 6%of the total plan outlays will be provided for watersupply and sanitation sector, and includes additional fundsavailable from LIC
**Table 5, Appendix I, Phase II 6 yrs x 231.6 = 1391
Rupees in crores; US $ in million. 1980 pricesExchange Rate/1980: 1 US $ = 7.8 Rupees
8 . MANPOWER
8.1 Present Status and Future Requirements
An inventory has been made of the manpower position in thesector as of 31 March 1981, by the Ministry of Works and Housing(CPHEEO) on the basis of data furnished by the States and UnionTerritories. They have projected their manpower requirements forPhase I and Phase II of the Decade programme. Table H presents themanpower position and future requirements on a country-wide basis.
o
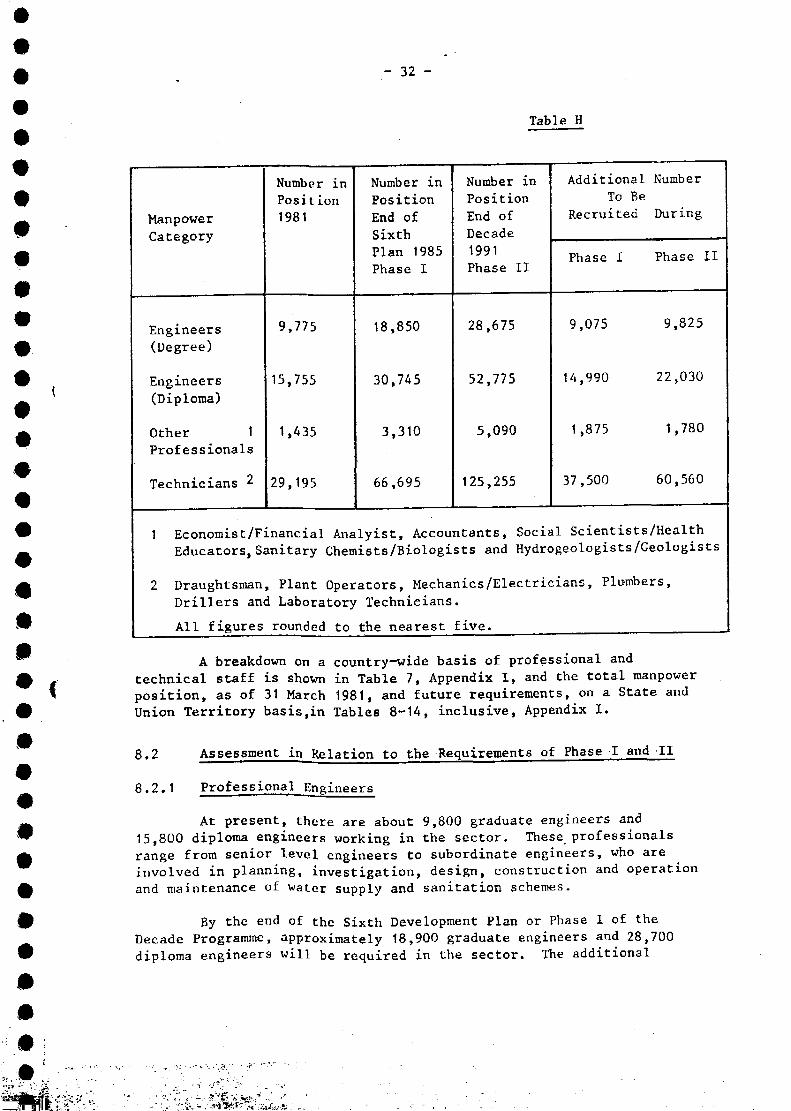
- 32 -
#
#
#
mm
Table H
Manpower
Category
Engineers(Degree)
Engineers
(Diploma)
Other 1Professionals
Technicians *•
Number inPosition1981
9,775
15,755
1,435
29,195
Number inPositionEnd ofSixthPlan 1985Phase I
18,850
30,745
3,310
66,695
Number inPositionEnd ofDecade1991Phase II
28,675
52,775
5,090
125,255
Additional NumberTo Be
Recruited During
Phase I Phase II
9,075 9,825
14,990 22,030
1,875 1,780
37,500 60,560
1 Economist/Financial Analyist, Accountants, Social Scientists/HealthEducators,Sanitary Chemists/Biologists and Hydrogeologists/Geologists
2 Draughtsman, Plant Operators, Mechanics/Electricians, Plumbers,
Drillers and Laboratory Technicians.
All figures rounded to the nearest five-
A breakdown on a country-wide basis of professional andtechnical staff is shown in Table 7, Appendix I, and the total manpowerposition, as of 31 March 1981, and future requirements, on a State andUnion Territory basis,in Tables 8-14, inclusive, Appendix I.
8.2 Assessment in Relation to the Requirements of Phase I and II
8.2.1 Professional Engineers
At present, there are about 9,800 graduate engineers and15,800 diploma engineers working in the sector. These professionalsrange from senior level engineers to subordinate engineers, who areinvolved in planning, investigation, design, construction and operationand maintenance of water supply and sanitation schemes.
By the end of the Sixth Development Plan or Phase I of theDecade Programme, approximately 18,900 graduate engineers and 28,700diploma engineers will be required in the sector. The additional
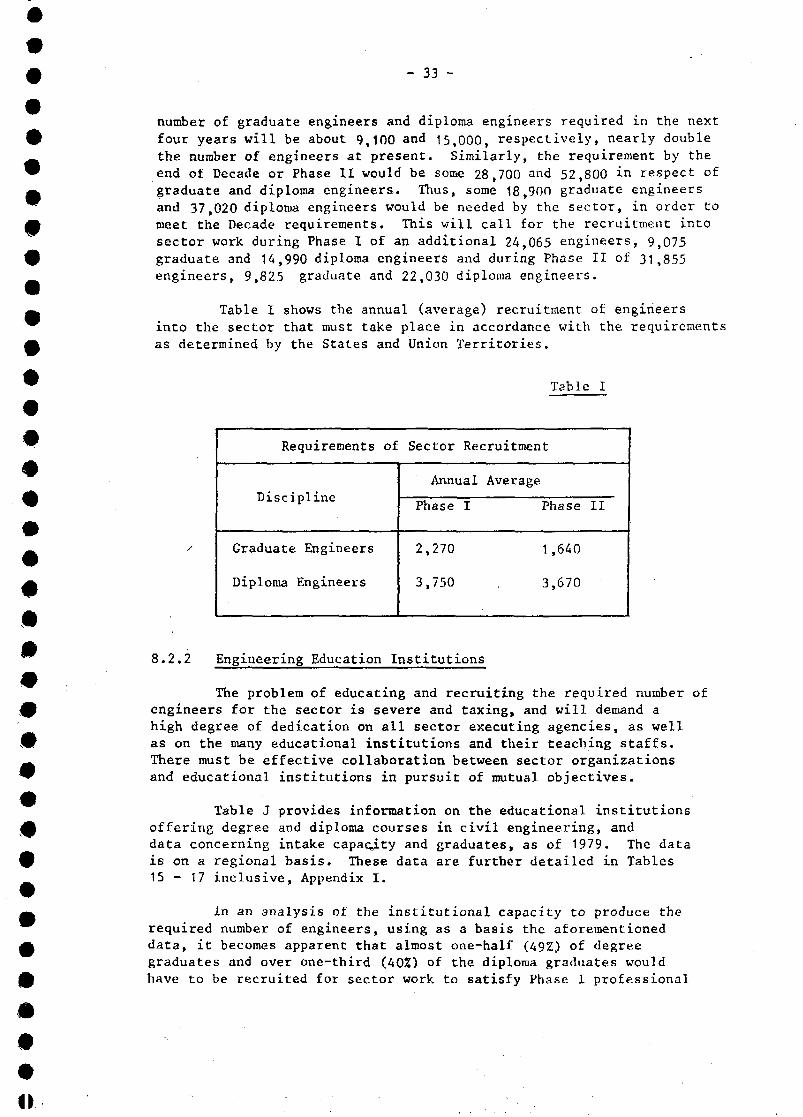
mm
mm
m
- 33 -
number of graduate engineers and diploma engineers required in the nextfour years will be about 9,100 and 15,000, respectively, nearly doublethe number of engineers at present. Similarly, the requirement by theend of Decade or Phase II would be some 28,700 and 52,800 in respect ofgraduate and diploma engineers. Thus, some 18,900 graduate engineersand 37,020 diploma engineers would be needed by the sector, in order tomeet the Decade requirements. This will call for the recruitment intosector work during Phase I of an additional 24,065 engineers, 9,075graduate and 14,990 diploma engineers and during Phase II of 31,855engineers, 9,825 graduate and 22,030 diploma engineers.
Table I shows the annual (average) recruitment of engineersinto the sector that must take place in accordance with the requirementsas determined by the States and Union Territories.
Table I
Requirements of Sector Recruitment
Discipline
Graduate Engineers
Diploma Engineers
Annual Average
Phase I Phase II
2,270 1,640
3,750 . 3,670
8.2.2 Engineering Education Institutions
The problem of educating and recruiting the required number ofengineers for the sector is severe and taxing, and will demand ahigh degree of dedication on all sector executing agencies, as wellas on the many educational institutions and their teaching staffs.There must be effective collaboration between sector organizationsand educational institutions in pursuit of mutual objectives.
Table J provides information on the educational institutionsoffering degree and diploma courses in civil engineering, anddata concerning intake capacity and graduates, as of 1979. The datais on a regional basis. These data are further detailed in Tables1 5 - 1 7 inclusive, Appendix I.
In an analysis of the institutional capacity to produce therequired number of engineers, using as a basis the aforementioneddata, it becomes apparent that almost one-half (49%) of degreegraduates and over one-third (40%) of the diploma graduates wouldhave to be recruited for sector work to satisfy Phase I professional
II»
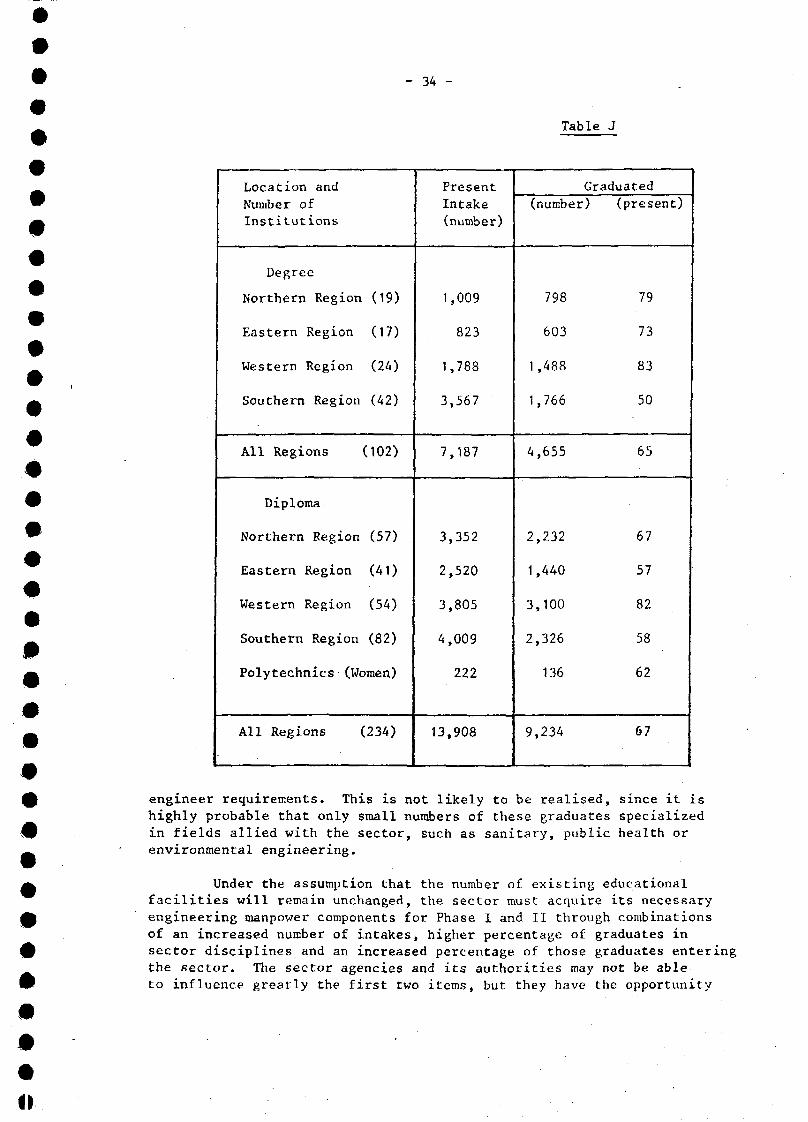
Table J
Location and
Number ofInstitutions
Degree
Northern Region
Eastern Region
Western Region
Southern Region
All Regions
Diploma
Northern Region
Eastern Region
Western Region
Southern Region
(19)
(17)
(24)
(42)
(102)
(57)
(41)
(54)
(82)
Polytechnics (Women)
All Regions (234)
Present
Intake(number)
1,009
823
1,788
3,567
7,187
3,352
2,520
3,805
4,009
222
13,908
Graduated
(number)
798
603
1,488
1,766
4,655
2,232
1,440
3,100
2,326
136
9,234
(present)
79
73
83
50
65
67
57
82
58
62
67
engineer requirements. This is not likely to be realised, since it ishighly probable that only small numbers of these graduates specializedin fields allied with the sector, such as sanitary, public health orenvironmental engineering.
Under the assumption that the number of existing educationalfacilities will remain unchanged, the sector must acquire its necessaryengineering manpower components for Phase I and II through combinationsof an increased number of intakes, higher percentage of graduates insector disciplines and an increased percentage of those graduates enteringthe sector. The sector agencies and its authorities may not be ableto influence greatly the first two items, but they have the opportunity
II
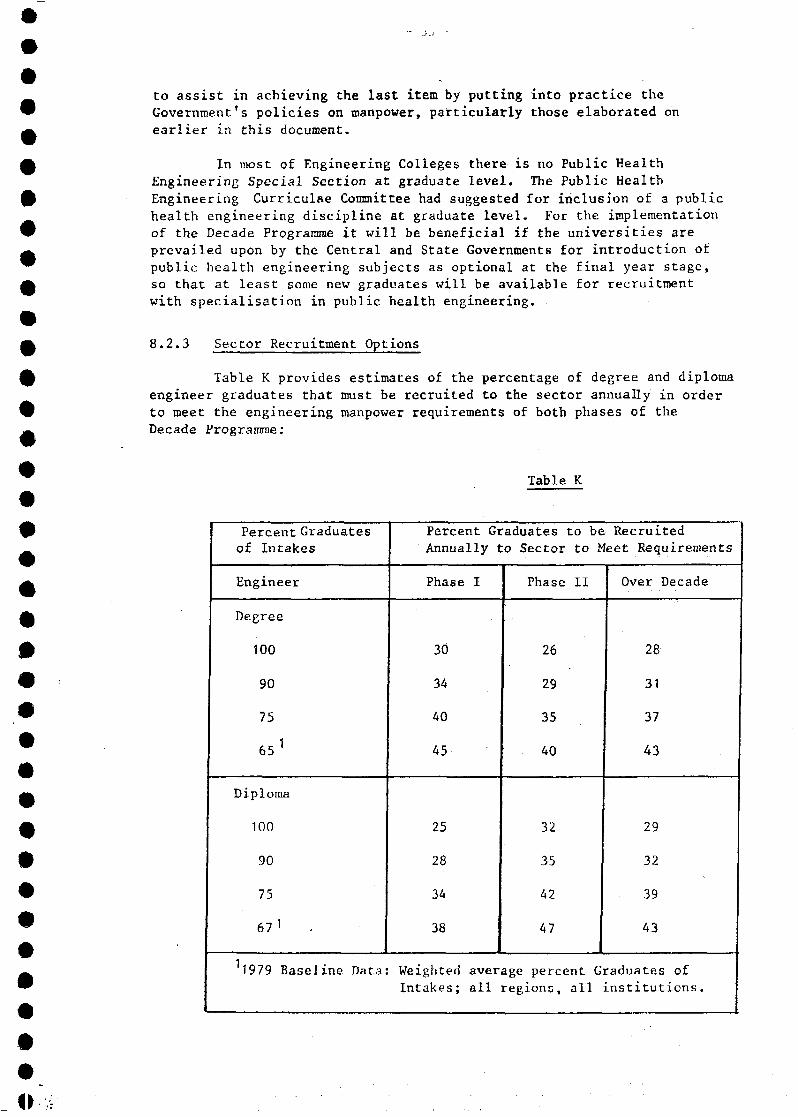
to assist in achieving the last item by putting into practice theGovernment's policies on manpower, particularly those elaborated onearlier in this document.
In most of Engineering Colleges there is no Public HealthEngineering Special Section at graduate level. The Public HealthEngineering Curriculae Committee had suggested for inclusion of a publichealth engineering discipline at graduate level. For the implementationof the Decade Programme it will be beneficial if the universities areprevailed upon by the Central and State Governments for introduction ofpublic health engineering subjects as optional at the final year stage,so that at least some new graduates will be available for recruitmentwith specialisation in public health engineering.
mmm
8.2.3 Sector Recruitment Options
Table K provides estimates of the percentage of degree and diplomaengineer graduates that must be recruited to the sector annually in orderto meet the engineering manpower requirements of both phases of theDecade Programme :
Table K
Percent Graduatesof Intakes
Engineer
Degree
100
90
75
65 1
Diploma
100
90
75
67 1 -
11979 Baseline Data:
Percent Graduates to be RecruitedAnnually to Sector to Meet Requirements
Phase I
30
34
40
45
25
28
34
38
Phase II
26
29
35
40
32
35
42
47
Over Decade
28
31
37
43
29
32
39
43
Weighted average percent Graduates ofIntakes; all regions, all institutions.
o
- 36 -
These figures emphasize that sector recruitment will have tobe in the neighbourhood of 30 to 40 percent of the annual graduates ofall the institutions with the corresponding improvements in percentgraduates of intakes to meet both Phase I and II requirements. Itshould also be noted that in the event percent graduates of intakesremains at the levels of 65 and 67 percent in degree and diplomagraduates, the chances of sector recruitment reaching annual levels of40 to almost 50 percent are remote, and the sector would have to operatewith a shortfall in engineering manpower.
8.2.4 Other Professional Personnel
In the case of other professional personnel, such as economists/financial analysts/health educators, the requirement by the end ofPhase I and Phase II appears to be more than double and triple of thatpresently available. These personnel will have to be drawn from thefield of general disciplines and trained for specific tasks as may berequired in the Decade Programme.
8.2.5 Technicians, Craftsmen and Skilled Workers
Generally the technicians, craftsmen and skilled workers requiredfor manning the Decade Programme have been classified as draughtsmen,plant operators, mechanics, electricians, fitters, plumbers, drillersand laboratory technicians. These personnel are mostly qualified fromIndustrial Training Institutes (ITI) in the respective trades. However,some of the trades may not be available in the existing institutes.
There are 466 such institutes, of which some are provisionallyaffiliated and some are permanently affiliated to provide training inthe engineering trades. The duration of the engineering trade courseis either one year or two years according to the type of the trade.The qualification for admission to these trades is two standards belowhigher secondary. After completion of the course, the candidates areawarded National Trade Certificates, if they qualify at the final AllIndia Trade Test. In the aforesaid programme, the training is givenfree of cost. It has been recently recommended that 50 percent of thecandidates are to be given Rs. 40. per month as a stipend. Thestipend is also given during their apprenticeship.
It is estimated that the additional requirements for personnelin these categories to meet the needs at the end of Phase I and Phase IIwould be over 38,000 and 60,000, respectively. This type of personnelwill by the end of Phase I be more than double and by the end of PhaseII more than four times the present level. The demand for plantoperators will be very large and may account for more than one-third.Thus, it is estimated that, on an average, about 10,000 skilled workerswould be needed annually during the Decade period. This can be met onlyif atleast 20 of the students passing out from each of the 466Industrial Training Institutes join public health engineering departmentsevery year.
8.3 In-service training
Public health engineering being a field of specialization requires
constant and continual training of its personnel to improve professional
skills. To effectively accomplish this task, on-the-job training must
be continued with increasing intensity and emphasis during the Decade.
The programme is to be tailored to the needs of:
- planners and administrators to provide more awarenessof service and health benefits, capital and
operating costs of water supply and sanitation projects andlong range implications of technologies, so that sectorproject investment can be more effectively programmed;
- engineers to update- technical information on planning,design, construction, and on operation and maintenanceof water supply and sanitation projects, and in additionorientation in systems analysis, least cost solutionsand appropriate application of low cost technology; and
- subordinate engineers, plant operators, laboratorypersonnel and community workers to undertake necessaryfield work, oversee operation a-nd maintenance andorganize communities.
The requirements of these training programmes can be met in the
following manner:
- Training at undergraduate level;
- Training at post graduate level;
. - Short term courses; and
- Public Health Engineering Training Programme under theMinistry of Works and Housing.
9. MATERIALS AND EQUIPMENT
9.1 General
The bulk of the capital investment in the water supply andsanitation sector is directed toward the procurement of proprietarymaterials and equipment and in the availability and sufficiency of theimportant services of the transportation and energy sectors. The totalrequirement of materials and equipment during the Decade will increasesubstantially, in fact many times, over the requirements of past years.While there may be adequate installed capacity for the manufacture andproduction of these sector materials many plants are working far belowtheir installed capacities, due mainly to the lack of sufficient fuel,power, raw materials and vehicles for transportation of the raw materialsand finished products. Of the materials and equipment required forthe sector, pipe and cement will represent a large portion of the capita]
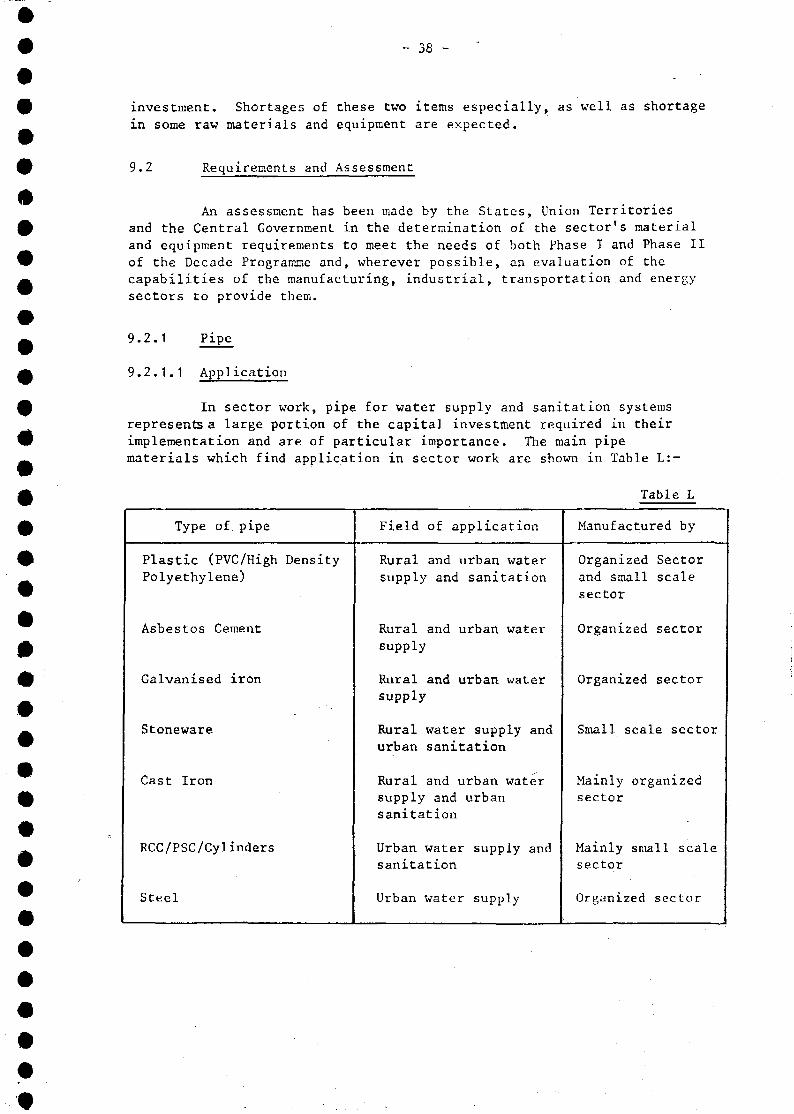
~ 38 -
investment. Shortages of these two items especially, as well as shortage
in some raw materials and equipment are expected.
9.2 Requirements and Assessment
An assessment has been made by the States, Union Territoriesand the Central Government in the determination of the sector's materialand equipment requirements to meet the needs of both Phase I and Phase IIof the Decade Programme and, wherever possible, an evaluation of thecapabilities of the manufacturing, industrial, transportation and energysectors to provide them.
9.2.1 Pipe
9.2.1.1 Application
In sector work, pipe for water supply and sanitation systemsrepresents a large portion of the capital investment required in theirimplementation and are of particular importance. The main pipematerials which find application in sector work are shown in Table L:
Table L
Type of pipe
Plastic (PVC/High DensityPolyethylene)
Asbestos Cement
Galvanised iron
Stoneware
Cast Iron
RCC/PSC/Cylinders
Steel
Field of application
Rural and urban watersupply and sanitation
Rural and urban watersupply
Rural and urban watersupply
Rural water supply andurban sanitation
Rural and urban watersupply and urbansanitation
Urban water supply andsanitation
Urban water supply
Manufactured by
Organized Sectorand small scalesector
Organized sector
Organized sector
Small scale sector
Mainly organizedsector
Mainly small scalesector
Organized sector
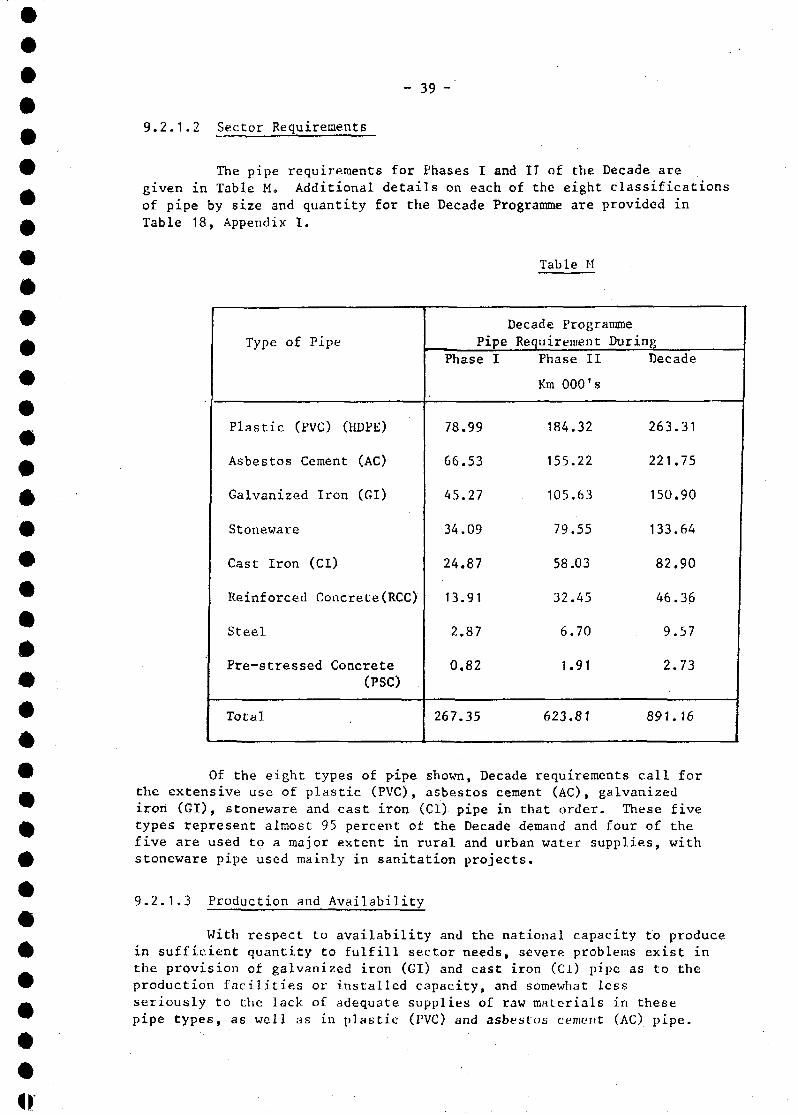
- 39 -
9.2.1.2 Sector Requirements
The pipe requirements for Phases I and II of the Decade aregiven in Table M, Additional details on each of the eight classificationsof pipe by size and quantity for the Decade Programme are provided inTable 18, Appendix I.
Table M
#
Type of Pipe
Plastic (PVC) (HDPE)
Asbestos Cement (AC)
Galvanized Iron (GI)
Stoneware
Cast Iron (CI)
Reinforced Concrete(RCC)
Steel
Pre-stressed Concrete
(PSC)
Total
Pipe
Phase I
78.99
66.53
45.27
34.09
24.87
13.91
2.87
0.82
267.35
Decade ProgrammeRequirement During
Phase II
Km 000's
184.32
155.22
105.63
79.55
58.03
32.45
6.70
1.91
623.81
Decade
263.31
221.75
150.90
133.64
82.90
46.36
9.57
2.73
891.16
Of the eight types of pipe shown, Decade requirements call forthe extensive use of plastic (PVC), asbestos cement (AC), galvanizediron (GI), stoneware and cast iron (CI) pipe in that order. These fivetypes represent almost 95 percent of the Decade demand and four of thefive are used to a major extent in rural and urban water supplies, withstoneware pipe used mainly in sanitation projects.
9.2.1.3 Production and Availability
With respect to availability and the national capacity to producein sufficient quantity to fulfill sector needs, severe problems exist inthe provision of galvanized iron (GI) and cast iron (Cl) pipe as to theproduction facilities or installed capacity, and somewhat lessseriously to the lack of adequate supplies of raw materials in thesepipe types, as well as in plastic (PVC) and asbestos cement (AC) pipe.
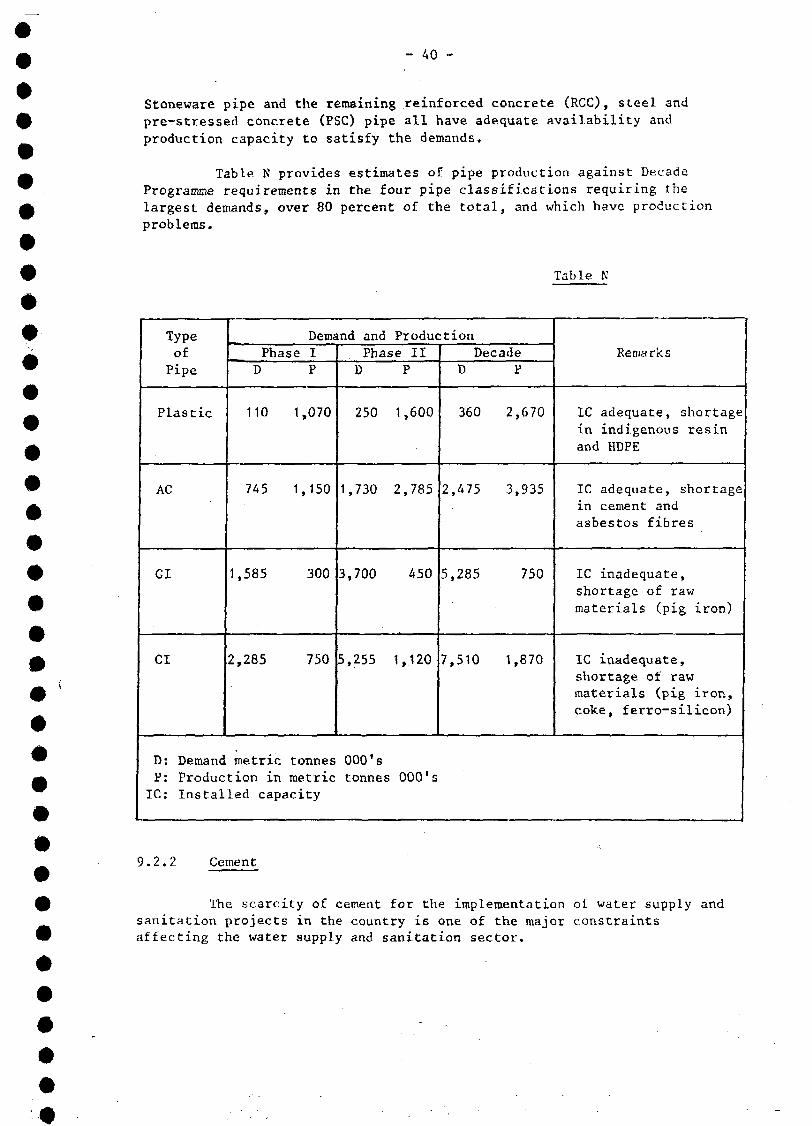
Stoneware pipe and the remaining reinforced concrete (RCC), steel and
pre-stressed concrete (PSC) pipe all have adequate availability and
production capacity to satisfy the demands.
Table N provides estimates of pipe production against DecadeProgramme requirements in the four pipe classifications requiring thelargest demands, over 80 percent of the total, and which have productionproblems.
Table N
Typeof
Pipe
Plastic
AC
GI
CI
Demand and ProductionPhase I
D P
110 1,070
745 1,150
1,585 300
2,285 750
Phase II
D P
250 1,600
1,730 2,785
3,700 450
5,255 1,120
DecadeD P
360 2,670
2,475 3,935
5,285 750
7,510 1,870
Remarks
IC adequate, shortagein indigenous resinand HDPE
IC adequate, shortagein cement andasbestos fibres
IC inadequate,shortage of rawmaterials (pig iron)
IC inadequate,shortage of rawmaterials (pig iron,coke, ferro-silicon)
D: Demand metric tonnes 000'sP; Production in metric tonnes 000' s
IC: Installed capacity
9.2.2 Cement
The scarcity of cement for the implementation of water supply andsanitation projects in the country is one of the major constraintsaffecting the water supply and sanitation sector.
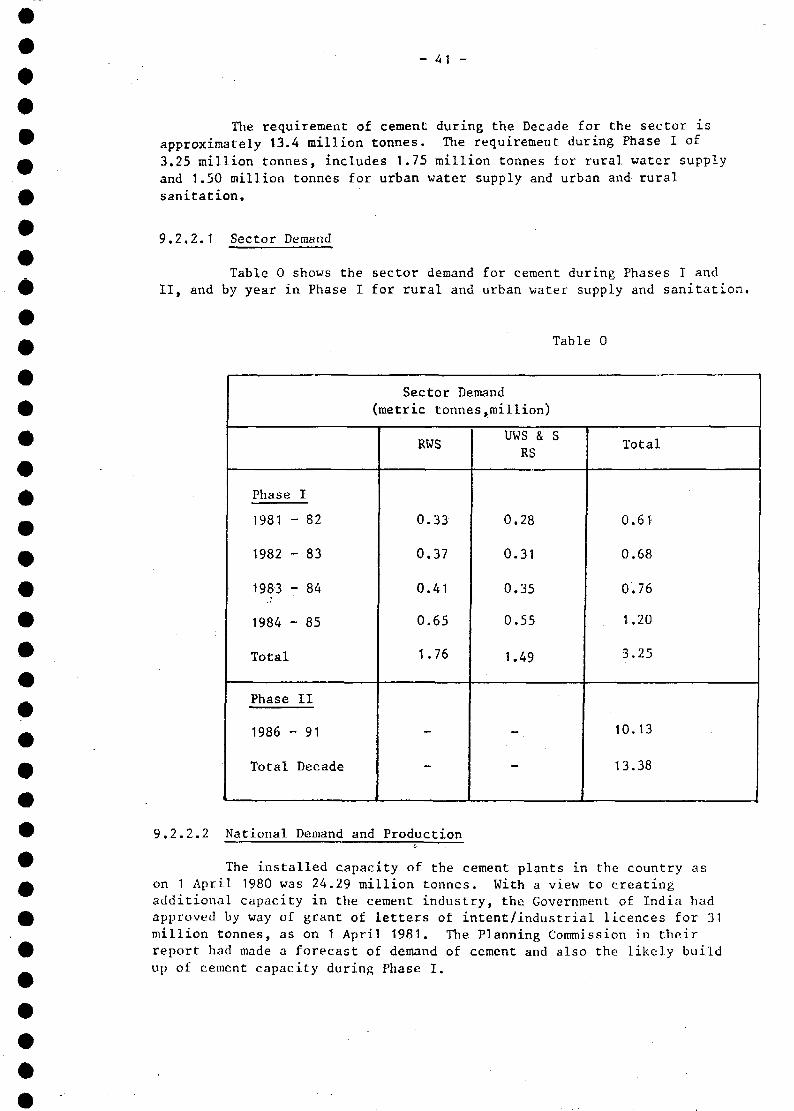
The requirement of cement during the Decade for the sector isapproximately 13.4 million tonnes. The requirement during Phase I of3.25 million tonnes, includes 1.75 million tonnes for rural water supplyand 1.50 million tonnes for urban water supply and urban and ruralsanitation.
9.2,2.1 Sector Demand
Table 0 shows the sector demand for cement during Phases I andII, and by year in Phase I for rural and urban water supply and sanitation,
Table 0
Sector Demand(metric tonnes,million)
Phase I
1981 - 82
1982 - 83
1983 - 84
1984 - 85
Total
Phase II
1986 - 91
Total Decade
RWS
0.33
0.37
0.41
0.65
1.76
-
-
uws & sRS
0.28
0.31
0.35
0.55
1.49
-
-
Total
0.61
0.68
0.76
1.20
3.25
10.13
13.38
9.2.2.2 National Demand and Production
The installed capacity of the cement plants in the country ason 1 April 1980 was 24.29 million tonnes. With a view to creatingadditional capacity in the cement industry, the Government of India hadapproved by way of grant of letters of intent/industrial licences for 31million tonnes, as on 1 April 1981. The Planning Commission in theirreport had made a forecast of demand of cement and also the likely buildup of cement capacity during Phase I.
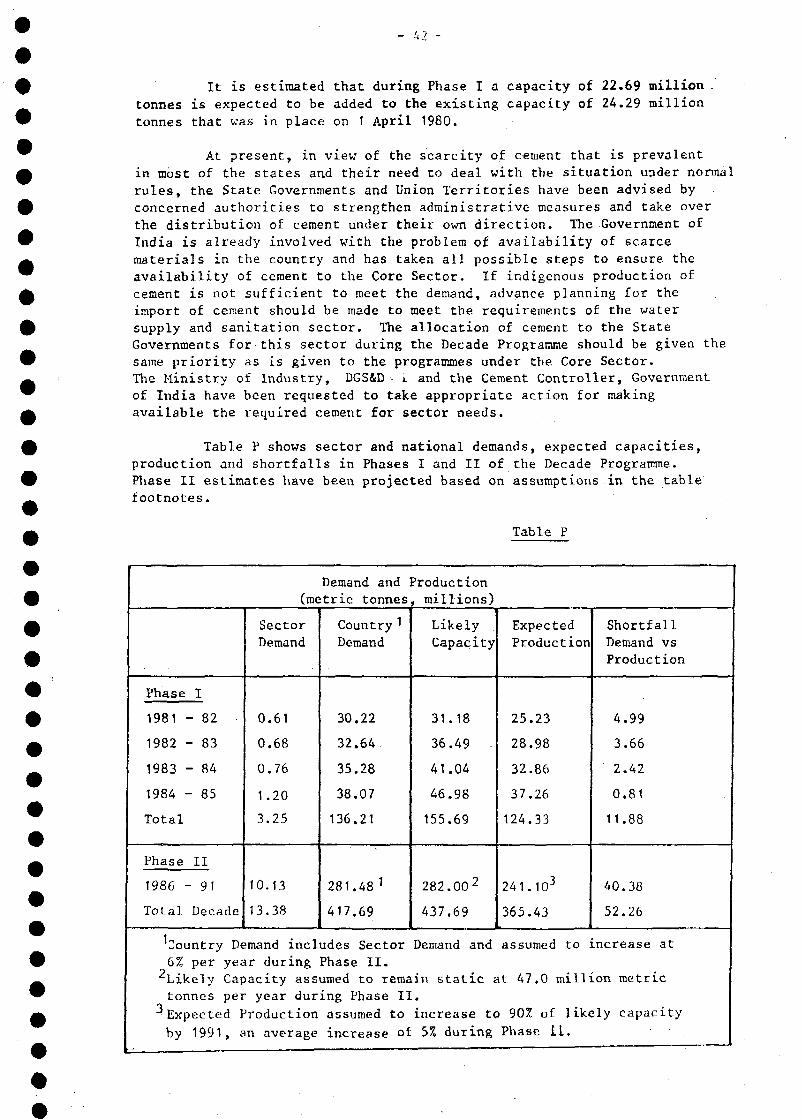
It is estimated that during Phase I a capacity of 22.69 million /
tonnes is expected to be added to the existing capacity of 24.29 million
tonnes that was in place on 1 April 1980.
At present, in view of the scarcity of cement that is prevalentin most of the states and their need to deal with the situation under normalrules, the State Governments and Union Territories have been advised byconcerned authorities to strengthen administrative measures and take overthe distribution of cement under their own direction. The Government ofIndia is already involved with the problem of availability of scarcematerials in the country and has taken all possible steps to ensure theavailability of cement to the Core Sector. If indigenous production ofcement is not sufficient to meet the demand, advance planning for theimport of cement should be made to meet the requirements of the watersupply and sanitation sector. The allocation of cement to the StateGovernments for this sector during the Decade Programme should be given thesame priority as is given to the programmes under the Core Sector.The Ministry of Industry, DGS&D • 1 and the Cement Controller, Governmentof India have been requested to take appropriate action for makingavailable the required cement for sector needs.
Table P shows sector and national demands, expected capacities,production and shortfalls in Phases I and II of the Decade Programme.Phase II estimates have been projected based on assumptions in the tablefootnotes.
Table P
Demand and(metric tonnes
Phase I
1981 - 82
1982 - 83
1983 - 84
1984 - 85
Total
Phase II
1986 - 91
Total Decade
SectorDemand
0.61
0.68
0.76
1.20
3.25
10.13
13.38
Country *
Demand
30.22
32.64
35.28
38.07
136.21
281.48 '
417.69
Country Demand includes Sector6% per year during Phase II.
Production, millions)
Likely
Capacity
31.18
36.49 -
41.04
46.98
155.69
282.002
437.69
Demand and
ExpectedProduction
25.23
28.98
32.86
37.26
124.33
241.103
365.43
assumed to
^Likely Capacity assumed to remain static at 47.0 milltonnes per year during Phase 11
•Expected Production assumed to
by 1991, an average increase of
•
ShortfallDemand vsProduction
4.99
3.66
2.42
0.81
11.88
40.38
52.26
increase at
Lon metric
increase to 90% of likely capacity
5% during Phase il.• • • - -
Table 19, Appendix I shows Decade Programme cement requirementsby State and Union Territory.
The projected shortfalls between national demand and productionin both Phase I and Phase II of the Decade Programme confirms theGovernment's concern regarding the inadequacy of cement production tomeet national needs, let alone those of the sector. If national demandcontinues to increase at the projected rate of six percent annually, theresolution to the production problem is two-fold: increase likely incapacity through improvement in existing plants of their operation andmanagement, and the construction of new plants; and/or import cement fromexternal sources in quantity to satisfy demand. This is especially validin respect of the Phase II projected demand and production.
During Phase I, new plants are coming on line and annual shortfallsare decreasing, until the last year of Phase I (end of Sixth DevelopmentPlan) the shortfall is less than one million metric tonnes. At this pointshortfalls will have accumulated to around 12 million metric tonnes.During Phase II, however, the situation is different in that likelycapacity remains at 47 million metric tonnes annually, unless new facilitiesare brought into operation, and shortfalls will accumulate over the sixyear period of 40 million metric tonnes. The total shortfall of cement tomeet national demands during the Decade period will be over 52 millionmetric tonnes.
9.2.3 Other Sector Materials and Equipment
Table Q provides estimates of Phase I and Phase II requirementsof steel, chemicals, pumps, transportation and energy for the DecadeProgramme. Tables 20-26, Appendix I give detailed data on thesematerials and equipment.
An assessment of the availability and sufficiency of the abovematerial and equipment to fulfill Decade Programme requirements indicatesthat no problems are envisaged.
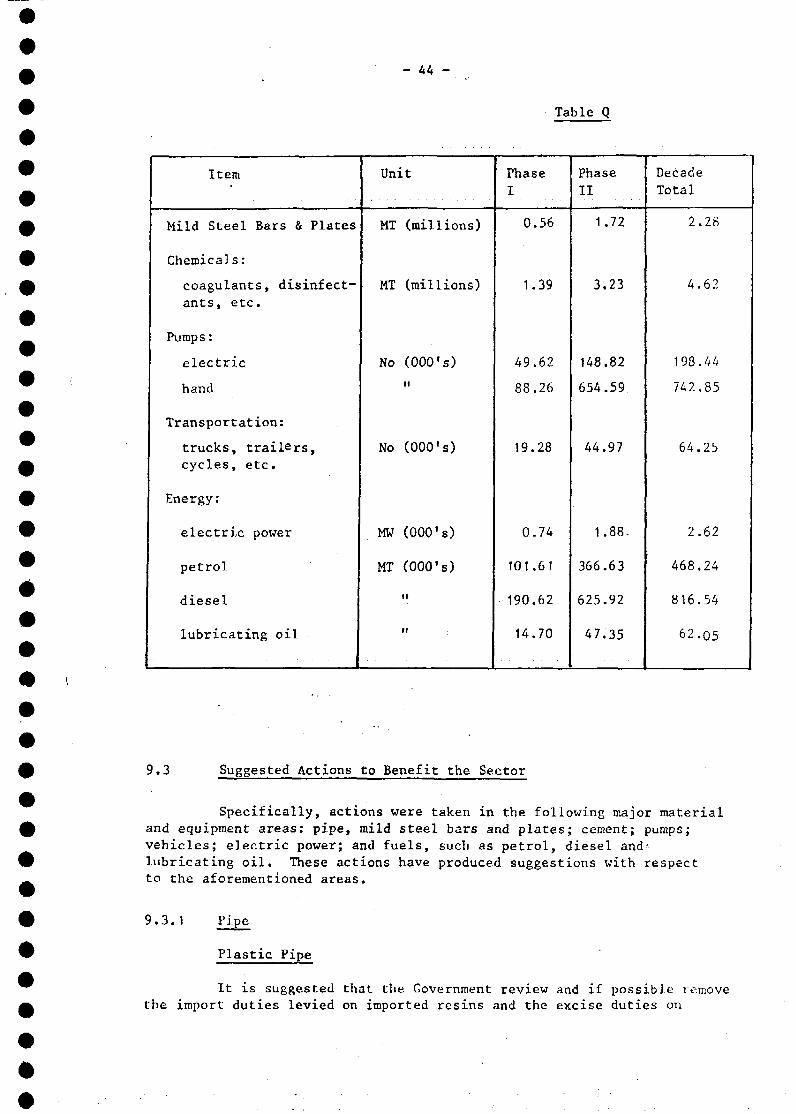
Table Q
Item
Mild Steel Bars & Plates
Chemicals:
coagulants, disinfect-ants, etc.
Pump s :
electric
hand
Transportation:
trucks, trailers,cycles, etc.
Energy:
electric power
petrol
diesel
lubricating oil
Unit
MT (millions)
MT (millions)
No (000's)
ii
No (000*s)
MW (000's)
MT (000's)
H
ti
PhaseI
0.56
1.39
49.62
88.26
19.28
0.74
101.61
190.62
14.70
Phase
II
1.72
3.23
148.82
654.59
44.97
1.88-
366.63
625.92
47.35
Decade
Total
2.28
4.62
198.44
742.85
64.25
2.62
468.24
816.54
62.05
9.3 Suggested Actions to Benefit the Sector
Specifically, actions were taken in the following major materialand equipment areas: pipe, mild steel bars and plates; cement; pumps;vehicles; electric power; and fuels, such as petrol, diesel and-lubricating oil. These actions have produced suggestions with respectto the aforementioned areas.
9.3.1 Pipe
Plastic Pipe
It is suggested that the Government review and if possible removethe import duties levied on imported resins and the excise duties on
indigenous resins. The finished product would be less expensive which is
essential for the implementation of rural water supply schemes.
AC Pressure Pipe
The Panel for Asbestos Products is under reorganization and willsoon look into requirements of AC products for various uses. Cement andasbestos fibres are the two basic raw materials for making AC pressure pipe.Since, cement is already in short supply in the country, all asbestos fibreis being imported, it is felt that the Panel should make available thenecessary raw materials to the concerned industries for the manufacture ofthese pipes, in order to meet the requirements.
GI Pipe
The procurement of raw materials for the manufacture of GI pipesis a difficult problem and the Ministry of Industry may be able to takeremedial measures, in order to meet the requirements of the DecadeProgramme.
Stoneware Pipe
The DGS&D has been requested to finalise the rate contract of thisitem, and any States experiencing difficulty in the procurement ofstoneware pipe are requested to contact DGS&D, furnishing the particularsof orders placed, the quantities required and other relevant details sothat they may resolve the matter.
CI Pipe
The assessment indicates that there is a shortage of pipe in thecountry, which has affected sector programmes. This is due to shortageof raw materials and power, industrial relations problems and the generalnon-availability of transportation vehicles. Since the shortage is veryacute in the smaller size, the Ministry of Works and Housing has alreadyissued a circular to all the State Governments and Union Territoriesurging them to use alternative pipe materials to assist in overcomingthis shortage. The response from the state governments is very encouraging.Keeping in view the above, the following recommendations are made:
- At present cast iron pipes are manufactured upto the sizeof 750 mm diameters. Therefore, the concerned StateGovernments who want ta use pipes above this size arerequested to use alternative pipe, e.g. RCC/pre-stressedconcrete pipe, etc.
- One of the important raw materials used is pig iron.Government should explore the possibility of reducing thecustoms duty on imported pig iron, so that the price ofthe finished product could be within the range of ratecontract entered into with DGS&D. Similarly, the industry
- 46 -
f should have available sufficient supplies of hard B.P.coke and ferro-silicon. Export of ferro-silicon should
Q be reviewed so that the quantity required for themanufacture of CI pipe to meet the demand of the Decade
w is available to the industries.
^ - At present CI pipe manufacturers import moulds for theA manufacture of spun pipe. Efforts should be made
to have them manufactured through Heavy Engineering£ Corporation, Ranchi, so that the dependence on import
could be reduced and at the same time save valuableW foreign exchange.
Ductile Iron Pipe
Ductile iron pipe is light, economical and has long useful life.,f , Efforts should be made to encourage industries to manufacture this type
of pipe.
A PSC Pipe
A , While ordinary RCC pipes can cater to the needs where pressuresare low and steel pipes cater to the needs of higher pressure, the
A prestressed concrete pipes cater to the intermediate pressure range, forwhich metalic pipes are expensive and . RCC pipes would not be suitable.
1& However, stringent quality control is called for in production of casketjointing work for a trouble free pipe line.
M Steel Pipe
A Due to their elasticity, steel pipes adapt themselves to changesin relative good level without failure. They can withstand high pressures.
^ However, they are more expensive than any other alternative. Theyinvariably need protection from corroding.m (
_ Steel welded Pipe & Cylinder Pipe
A These can be an alternative to the use of PSC and steel pipeseffecting over all economy and ensuring more flexibility and durability
£ and assured satisfactory performance. These provide ample protection fromSurge and water hammer. They have dependable water tight jointing system.
4) Steel cylinder pipes provide positive water seal.
™ This type of spiral steel strip welded pipes with concereteA coating combine the physical strength of steel with the protective
characteristics of cement mortar.
If the above efforts fail to meet the pipe requirements of thejQ Decade Programme, the only alternative is to import these pipes from
abroad. This should be resorted to as a last measure.
- 47 -
9.3.2 Handpumps
" . . . .The Indian Standards Institution has prepared specifications for
deep-well handpumps called "INDIA MARK II" under the specification numberIS: 9301-1979. Recently, they have revised this specification. Allpump manufacturers should follow this new specification and get ISImarking. State Governments should purchase only those pumps which conformto ISI specifications and have ISI marking.
The demand for this type of pump is expected to increase in theyears ahead. At present, purchases are made by State Governments atdifferent prices and the quality of pumps is not uniform. In order toovercome this, it is suggested that the rate contract for the supply ofthese pumps be concluded by DGS&D. This will prevent sub-standard pumpsbeing purchased at cheaper prices.
9.3.3 Cement
Cement is in short supply, at present, in the country. ThePlanning Commission has received reports that the industry would reacha stage of self sufficiency by 1984-85. However, if the production ofcement is not sufficient to meet the demand, including the water supplyand sanitation sector, advance planning for import of cement should bemade by the Ministry of Industry, Department of Industrial Development.While allocating the cement to the various State and Union TerritoryAdministrations, the cement required for the water supply and sanitationsector should also be earmarked.
9.3.4 Vehicles
The Ministry of Industry (Department of Industrial Development)has advised the manufacturers (numbering about 13) regarding therequirement of vehicles of various types needed in the programme.However, to enable the manufacturers to supply the right type of vehicles,it issuggested that State Governments while placing orders should furnishthe following particulars: complete specifications, models and typesand any other relevant details.
If the procurement is desired to be done through DGS&D, formalindents completed in all respects should be sent to them. This willenable DGS&D to determine whether their requirements "can be met fromindigenous sources or have to be imported.
9.3.5 Energy
Power - The statements indicating the requirement ofvarious State Governments and Union TerritoryAdministrations for electric power for the water supplyand sanitation sector have been forwarded to the Ministry
m of Energy. It is also suggested that the State Governmentsshould advise the electricity boards in their States
^ indicating the requirements so that the boards may takenecessary action on their behalf. For rural water supply
w schemes, it is suggested that energy may be supplied at^ concessional rates, as in the case of agriculture.
0 - Petrol, Diesel and Lubricating Oil - The requirements ofthe various States and Union Territories have been forwarded
^ to the Ministry of Petroleum Chemicals and Fertilizers.This Ministry must take into consideration the requirements
9 of the water supply and sanitation sector, while importing_ these items. They should earmark the quantity to be^ given to this sector, while allocating these items to the£ States and Union Territories from time to time.
f 9.3.6 Transportation
The State Governments and Union Territory Administrations should4) provide the overall requirements of wagons for the first four years and the
subsequent six years of the Decade programme to the Traffic Transportationw Directorate of the Railway Board in advance, commensurate with the stock^ of materials ready for despatch in order to arrange the highest priority^ for transportation of pipe and other essential material and equipment^ required for the sector.
•W 9.3.7 Rate Contracts
It is recommended that the DGS&D explore the possibility ofW developing a system of running contracts instead of rate contracts with^ regard to materials and equipment required for the Decade programme.
• ( 9.3.8 Drilling Rigs
^ Keeping in view the low cost solutions to tackle the drinkingA water problem, the available ground water should be exploited where it is
feasible. This is more so especially in consolidated and semi-consolidatedEt foundations, including hard rock areas which form the major part of the
country's area. The development of Down-the Hole (DTH) drilling rigs inA the past few years has opened up vast potential of exploiting such
ground water sources for village water supply aided by the newer version ofw dependable deepwell hand pumps (INDIA Mark II).
^ The development of other types of rigs notably, rotary, cableA tool, e tc, are also well established in suitable formations for this
activity. Keeping in view the full capacity utilisation of existing rigs^ with the State Governments and also mobilising the use of available
privately owned rigs, an assessment for the additional rigs required for the49 implementation of the Decade Programme is made by a Committee constituted by the
Ministry of Works and Housing. The Committee has assessed the requirement™ of different types of rigs in two phased periods:
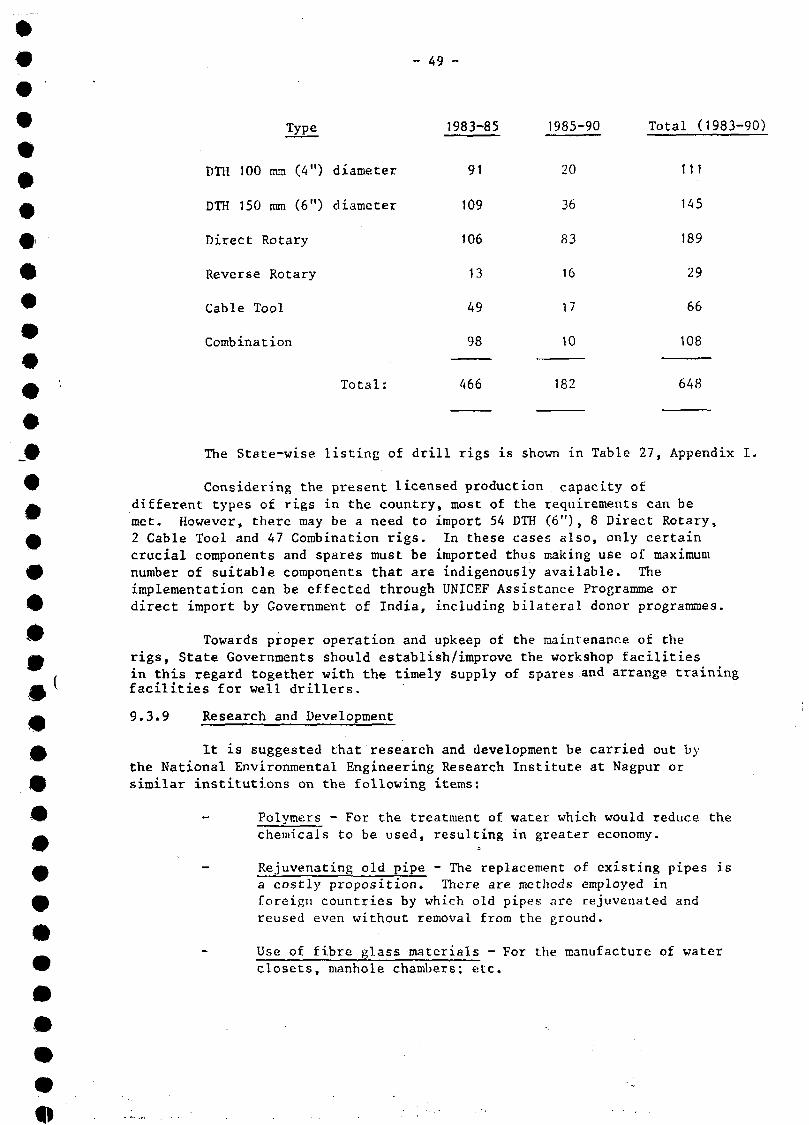
1983-85 1985-90 Total (1983-90)
DTH 100 mm (4") diameter
DTH 150 ram (6") diameter
Direct Rotary
Reverse Rotary
Cable Tool
Combination
Total:
91
109
106
13
49
98
466
20
36
83
16
17
10
182
111
145
189
29
66
108
648
mm
mmm
The State-wise listing of drill rigs is shown in Table 27, Appendix I.
Considering the present licensed production . capacity ofdifferent types of rigs in the country, most of the requirements can bemet. However, there may be a need to import 54 DTH (6"), 8 Direct Rotary,2 Cable Tool and 47 Combination rigs. In these cases also, only certaincrucial components and spares must be imported thus making use of maximumnumber of suitable components that are indigenously available. Theimplementation can be effected through UNICEF Assistance Programme ordirect import by Government of India, including bilateral donor programmes.
Towards proper operation and upkeep of the maintenance of therigs, State Governments should establish/improve the workshop facilitiesin this regard together with the timely supply of spares and arrange trainingfacilities for well drillers.
9.3.9 Research and Development
It is suggested that research and development be carried out bythe National Environmental Engineering Research Institute at Nagpur orsimilar institutions on the following items:
- Polymers - For the treatment of water which would reduce thechemicals to be used, resulting in greater economy.
- Rejuvenating old pipe - The replacement of existing pipes isa costly proposition. There are methods employed inforeign countries by which old pipes arc rejuvenated andreused even without removal from the ground.
Use of fibre glass materials - For the manufacture of waterclosets, manhole chambers; etc.
- 50 -
- Development of variable speed motors - To deal with variableflow rates of water.
Ductile Iron Pipe - Explore the best ways and means ofproducing ductile iron pipe and the special type of pig ironrequired, and the costs involved.
In general it is very essential to have nodal bodies at the Central,State and Union Territory levels for the purpose of channeling and monitoringsector material and equipment procurement, supply and distribution.
10. PROJECT FORMULATION
#
mf
0mm
10.1 General
In order to meet the varying conditions and characteristics ofdifferent States and Union Territories in the provision of water supplyand sanitation services appropriate project preparation is absolutely
• essential. This concept applies to all projects, large or small, complexor simple. Without this important element brought into play considerableeffort and substantial resources could be wasted. Further, the intensecompetition to obtain funds for projects within the country between lendingagencies, the water supply and sanitation sector and other sectors, as wellas attracting and securing what may be very limited financial resourcesfrom external agencies, demands adequately prepared and viable projects.This can be achieved through integrated administrative support and byprofessional personnel competent to perform the required tasks.
Since both limited financial resources and shortage of professionalmanpower may be significant constraints in may States/UT's, the responsiblesector agencies must be encouraged to use methods designed to make theplanning, preparation and implementation of projects as efficient as possible.Improvements in the project development process bring benefits to international,national and local agencies supporting the sector, but ultimately the primarybeneficiaries are those people in the States and Union Territories whopresently lack access to these basic services.
10.2 Planning and Preparation Units
The establishment of project planning and preparation units withinagencies responsible for urban and rural water supply and sanitation can providethe desired efficient project development process. Such units are usuallycomposed of one or more teams of sanitary, public health and/or environmentalengineers, economists, financial analysts and social scientists. A numberof States have such planning and preparation units in operation and couldprovide training and other assistance to States and Union Territories thatdo not have but des.ire and need to establish such units in their sectoragencies. The recruitment and training of the required personnel for suchunits should be given a very high priority in the nation's development ofits manpower resources.
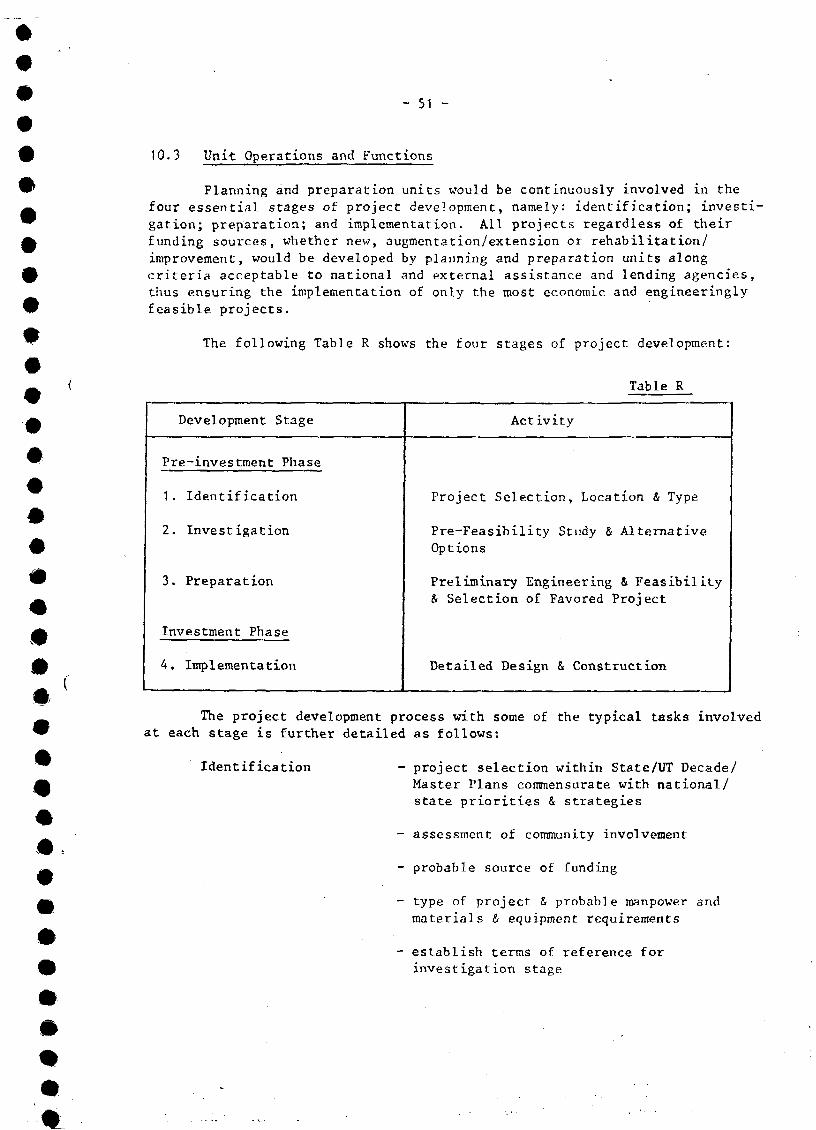
- 51 -
10.3 Unit Operations and Functions
Planning and preparation units would be continuously involved in thefour essential stages of project development, namely: identification; investi-gation; preparation; and implementation. All projects regardless of theirfunding sources, whether new, augmentation/extension or rehabilitation/improvement, would be developed by planning and preparation units alongcriteria acceptable to national and external assistance and lending agencies,thus ensuring the implementation of only the most economic and engineeringlyfeasible projects.
The following Table R shows the four stages of project development:
Table R
Development Stage
Pre-investment Phase
1. Identification
2. Investigation
3. Preparation
Investment Phase
4. Implementation
Activity
Project Selection, Location & Type
Pre-Feasibility Study & AlternativeOptions
Preliminary Engineering & Feasibility& Selection of Favored Project
Detailed Design & Construction
The project development process with some of the typical tasks involvedat each stage is further detailed as follows:
Identification - project selection within State/UT Decade/Master Plans commensurate with national/state priorities & strategies
- assessment of community involvement
- probable source of funding
- type of project & probable manpower andmaterials & equipment requirements
- establish terms of reference forinvestigation stage
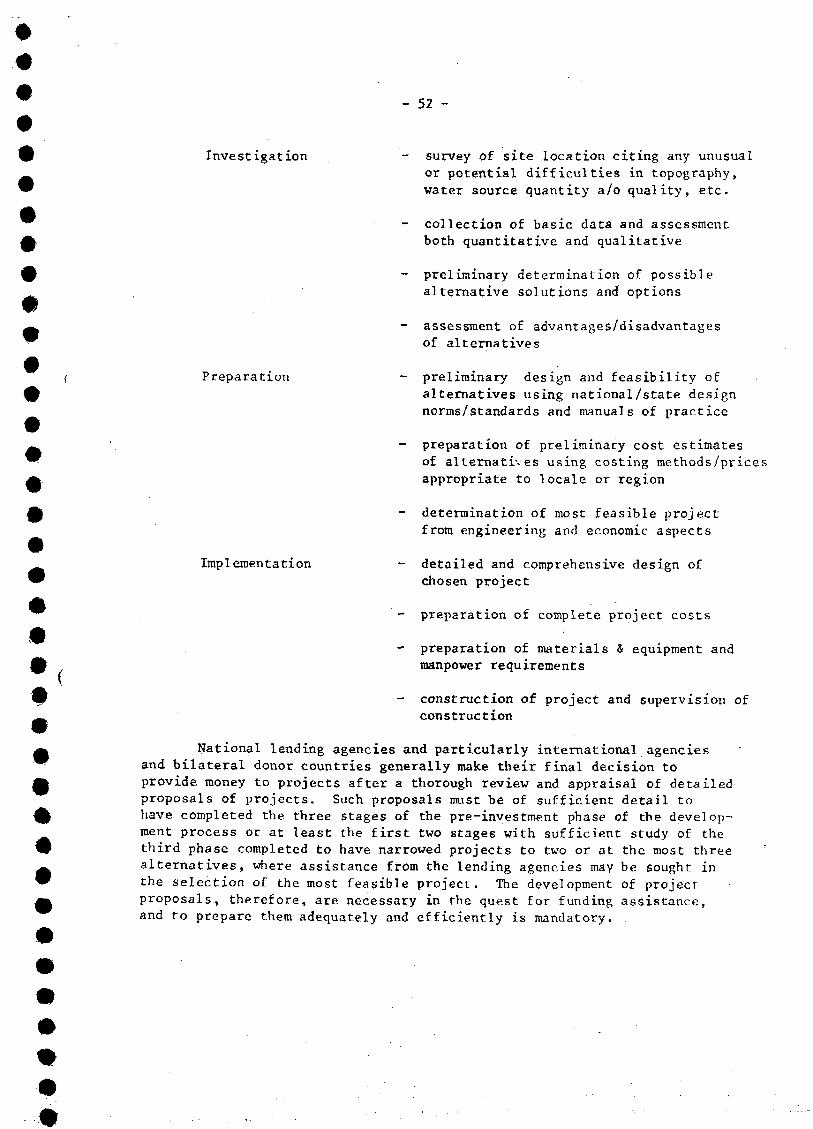
Investigation
Preparation
- 52 -
survey of site location citing any unusualor potential difficulties in topography,water source quantity a/o quality, etc.
collection of basic data and assessmentboth quantitative and qualitative
- preliminary determination of possiblealternative solutions and options
- assessment of advantages/disadvantagesof alternatives
- preliminary design and feasibility ofalternatives using national/state designnorms/standards and manuals of practice
- preparation of preliminary cost estimates
of alternatives using costing methods/pricesappropriate to locale or region
- determination of most feasible projectfrom engineering and economic aspects
- detailed and comprehensive design ofchosen project
preparation of complete project costs
preparation of materials & equipment andmanpower requirements
- construction of project and supervision ofconstruction
National lending agencies and particularly international agenciesand bilateral donor countries generally make their final decision toprovide money to projects after a thorough review and appraisal of detailedproposals of projects. Such proposals must be of sufficient detail tohave completed the three stages of the pre-investment phase of the develop-ment process or at least the first two stages with sufficient study of thethird phase completed to have narrowed projects to two or at the most threealternatives, where assistance from the lending agencies may be sought inthe selection of the most feasible project. The development of projectproposals, therefore, are necessary in the quest for funding assistance,and to prepare them adequately and efficiently is mandatory.
Implementation
- 5 3 -
The States and Union Territories have been requesed by theCentral Government to prepare a shelf of projects and to summarize suchprojects in "Project Data Sheets", which have already been provided.These project summaries will be compiled in a compendium of projects inwater supply and sanitation for reference and distribution by assistanceagencies, both national and international and will form Volume II of the
k National Master Plan for Water Supply and Sanitation.
11. OPERATION AND MAINTENANCE
^ 11.1 General
The poor state of operation and maintenance of water supply schemesf set up during the last five development plans is causing genuine concern_ V to sector authorities. Particularly in the rural areas a number of systemsw are notoperational and others are giving unsatisfactory service. Inattention^ to this critical aspect could easily result in undue deterioration cutting^ the useful life of the systems by 50 to 75 percent and necessitating premature£ replacement of many systems components. This is not only a waste of original
investment capital, but a severe set-back in attaining Decade Programme£ goals.
W Similarly pilot field studies by NEERI have shown water losses in_ the distribution system alone to be of the order of 23 to 35 per cent of^ the total flow in the system. In addition, losses occur in transmission, inA the water treatment plants and at source,which may come to another 30 per
cent of the total output. In the distribution system, it is feasible toA reduce water losses to a level of 10 per cent of total flow by carrying
out systematically leakage assessment, detection and control. For the0 urban population in India, the value of recoverable loss of processed water
has been estimated to be of the order of Rs.50 crores annually. Greater9. attention to water conservation and waste detection and control can help» in augmentation of available supplies and thus in attaining Decade goals.
^ In view of the large capital investments planned in the DecadeProgrammes, the vital area of systems operation and maintenance deserves
0 immediate and sustained attention. The States and Union Territories shoulddetermine and provide adequate resources in their development plans for
9 operation and maintenance of facilities to be created. An amount of_ Rs.533 crores or about five percent of Phase II investment has beenW estimated in the Seventh and Eighth Development Plans of the Decade ProgrammeA to be used for operation and maintenance expenditures.
9 11.2 Existing Situation
11.2.1 Water Supply
In major metropolitan areas and other large cities, municipalw corporations and metropolitan water boards that have been formed in certain_ States look after operation and maintenance. The resources for this™ activity are generated out of water charges that are collected and inA certain cases augmented by revenues of municipal corporations from other
than water accounts. There is no difficulty envisaged in the operation andA maintenance in these areas.
0 In smaller towns, the responsibility for operation and maintenance
rests with the muncipalities, and in States, where urban water supply
™ boards are formed, the Boards look after this activity. In other States,A the public health engineering departments discharge the responsibility of^ maintenance. In these cases, the major constraint is usually financial dueA to inadequate resources generated from water tariffs. These towns indent
for technical help from the public health engineering departments, wheneverfp necessary.
w Water supply maintenance in rural areas, where comprehensive
^ regional water supply systems are in operation, is handled mainly by^ State public health engineering departments or panchayats. In a few cases,A local bodies like Zila Prishads or Block Level Samitis are entrusted with
this responsibility. Water rates are not charged nor any other funds£ for water service recovered from the rural population and due to the lack
of financial and technical resources, Local bodies are not in a positionW-' to maintain the systems.
^ Regarding piped water supply systems in the villages, the situationA is. usually much worse as the Panchayats are not in a position, either
financially or technically, to maintain the system. These are functioning0 only where State Governments and Union Territories are making adequate
( allocations for maintenance.
In individual single point water supplies, either from dug wells,w tubewells, springs or public standpost systems, there is no responsibleA institution to provide proper systems maintenance, though State^ Governments are trying to lend financial support in a limited way.
A 11.2.2 Sanitation
A In sanitation, especially in rural areas, there is no organizedsystem of maintenance at present relative to individual facilities.
A Sanitary facilities such as individual family latrines, etc. must bemaintained by the families. In smaller towns, where sewerage systems
4) do not exist and low cost sanitation programmes are in operation, theindividual beneficiaries are in charge of maintenance. In the larger
w cities, where sewerage systems exist, the municipalities are responsible^ for systems maintenance.
mm
• - 5 5 -
11.3 Support Resources
^ 11.3.1 Institutional and Administrative
A In all major metropolitan areas and large cities, single agencies
such as water supply and sewerage boards or municipalities should be£ responsible for systems operation and maintenance. In such urban systems,
to the extent possible, realistic water rates should be established thusW generating revenues that could support all or part of the operation andA maintenance costs. Any gap or shortage between costs and revenues should^ be supplemented by the State and Union Territories.
In rural water supply systems, local situations will determine0 the agencies to be entrusted with responsibilities for systems operation
and maintenance. It can be a local body, a board or a department ofw \ Government, but it is necessary that a single agency be responsible for_ providing financial, technical and supervisory support for operation and^ maintenance. Actual routine operations and maintenance are carried out,A however, at the local levels, but the provision of materials and equipment,
their replacement and repair, together with the training, supervision andA technical guidance required by local personnel, must come from the
responsible single agency.
A 11.3.2 Manpower
9 The number of personnel employed to manage, operate and run thewater supply systems depends upon the size and nature of the plants and
W distribution networks. It has proved successful in many places to' A - select and train the key personnel at the construction phase, who later^ will be responsible for operational duties. During this phase the meng| have an opportunity to learn how the system has been put together and
works, and in this way they can best understand and perform the required£ ( maintenance. In-service training for operation and maintenance personnel
should be frequent and obligatory.
f 11.3.3 Materials and Equipment
9 Spares, materials, equipment, proper type of tools, and purchasingand storing of necessary chemicals well in advance of use are extremely
w important factors in achieving efficient plant operation. In urban areas^ it may be possible to procure and store all the material componentsw required for maintenance and operation. But in case of rural water£ supply systems, it may be difficult. Storing of spares and materials
at Block levels will have to be made with proper transport facilities(Q) from the responsible agency through its central or regional offices.
9 Systems of warehousing and procurement will have to be studiedand established in order to maintain an effective and timely distribution
™ of required materials and equipment.
- 56 -
11.3.4 Community Participation in Relation to
Operation and Maintenance
The local community has an important role to play in the operationand maintenance of water supplies and sanitation facilities, especiallyin the rural areas. Local bodies, leading citizens, religious leaders,teachers and other individuals can provide the impetus needed to assistin the proper operation and maintenance of community facilities.
Many prominent citizens may not be members of the local bodiesbut at the same time they may bring even more influence to bear on thesuccess of the programme than does the official administration. The mainadvantages of this may include:
the mobilization of the political support;
contribution of the community to the project in terms ofmoney, land, material, services or labour;
a more sympathetic attitude from the people towardspaying for the operation and maintenance cost; and
- the increased use of the water once it is supplied.
In case of rural water supplies and sanitation, the Non-GovernmentalOrganisations have made significant achievements in certain parts of thecountry. Such organisations should be associated with the DecadeProgramme for proper up-keep of the facilities installed. Non-Governmental Organisations, their capabilities and involvement in sectorwork, is discussed in 5.8 and 5.9 of this document.
It is extremely important to understand that small water supplysystems do not imply either small problems or small responsibilities.The local population needs to be educated regarding benefits of watersupply systems and develop a sense of ownership and pride in the same,and to understand that it has a right to demand better services. Theseprocesses are neither simple nor quick, much will depend on the effectivenessof the management and proper services in establishing good public relations.Once these are obtained the service concept will grow and become generallyunderstood and accepted. The critical time is in the early stages.
The Government of India already realising the importance of theoperation & maintenance sector during the Decade Programme and onward hasconstituted a Committee to go into this aspect exclusively and makerecommendations.
11.3.5 Suggested Elements of a Support Programme
Elements which should be incorporated as a support programme foroperation and maintenance include:
- allocation of responsibility for preventive maintenanceand repair at community, district, regional and Statelevels, together with logistical planning support;
- strengthening of services at appropriate levels, forA materials and spare parts, ordering, storing and
distribution ;
- development of replacement and repair facilities, e.g.™ for water meters in urban areas and for hand-pumps,& cylinders and vehicle overhaul in rural areas.
A - training of the instructors/trainers at the lowest possiblecommunity level so as to provide instruction to community
0 workers; and
W - a rehabilitation and replacement programme of installed
# equipment, listing present and future requirements of
expendable components and materials.
# 12. EXTERNAL AND INTERNAL ASSISTANCE
#A 12•1 General
A Extensive assistance, both external and within-country, vill berequired by the States and Union Territories in the financing of their
£ Decade programmes. The cost of the Decade Programme, an estimated Rs.14,700crores or US $18,846 million at 1980 price levels, demands a very thorough
£ exploration of all possible avenues for sources of funds as well as themost effective utilization by the sector of those funds when obtained. The
w continuation of financing by national agencies, multilateral organizations^ and bilateral donor countries is necessary, and most likely in increased^ amounts during the coming years. Estimates of the amounts of the assistanceA needed by the States and Union Territories for their programmes are under
, preparation, projects being formulated at the request of the Central Govern-£ ment. A compendium of programmes and projects for each State and Union
Territory should be ready in 1983 for publication and distribution to j9 interested national,multilateral and bilateral development and financing^ agencies.
& 12.2 On-going Project Assistance
£ A listing of financial assistance on specific projects by multi-lateral agencies and bilateral donor countries is given in Table S. Table
£ 28, Appendix I, provides details on the on-going projects. Direct projectassistance is being received from the World Bank/IDA and the Government of the
V Netherlands, Denmark, the Federal Republic of Germany and the EuropeanEconomic Community. The total estimated costs of these externally assisted
w projects is Rs.963.32 crores, of which Rs.554.91 crores is foreign assistance.A Almost all of these projects are likely to be completed by the end of the
Sixth Development Plan, Phase I of the Decade Programme, or during the firstA year of the Seventh Development Plan., It is estimated that approximately 80
percent of this assistance would be utilized during the sixth plan period or0 | an amount of Rs.445 crores. Since the Seventh Development Plan investment
#
- 58 -
in the water supply and sanitation sector is expected to be more than doublethe amount of the Sixth Plan, it is expected that external assistance vouldalso be increased substantially.
Table S
On-going Project Assistance(Rs. in crores)
Agency
World Bank/IDA
Netherlands
Denmark
Fed. Republicof Germany
European EconomicCommunity
Total
Numberof
Projects
6
6
6
1
1
20
Projectcosts
841.00
55.95
31.40
19.471
15.50
963.32
ExternalAssistance
460.73
53.53
13. 14
9.51
18.002
554.91
Percent ofExternalAssistance
54.8
95.7
41.8
48.8
57.6
1 Phase I of a possible three phase project, total cost estimatedat Rs.60 crores.
2 Counterpart fund in Rupees
•
The UNICEF is providing assistance in the areas of training, drilling,handpump rejuvenation and installation, health education and environmentalsanitation. The assistance from UNICEF is governed by the Plan of Operationssigned between the Government of India and UNICEF.
The input from the regular programmes of UNICEF for the period 1981-83is likely to be of the order of US $ 21 million and US $20.6 million in notedor supplementary assistance, US $5.6 million from Denmark (DANIDA) and US$15.6 million from Sweden (SIDA). As at the end of 1982, US $5.1 million ofDenmark's allocation and US $5.0 million of Sweden's and had been spent. Thelevel of assistance is not likejy to increase appreciably in the coming yearsand planning must be done on the basis of present assistance levels during theremaining years-of the Decade.
The UNDP, WHO and ODA are assisting the Decade efforts in this countryin the field of support services. The assistance from these agencies is inthe form of experts, consultants, grants, training facilities, fellowships,equipment and conduct of feasibility studies.
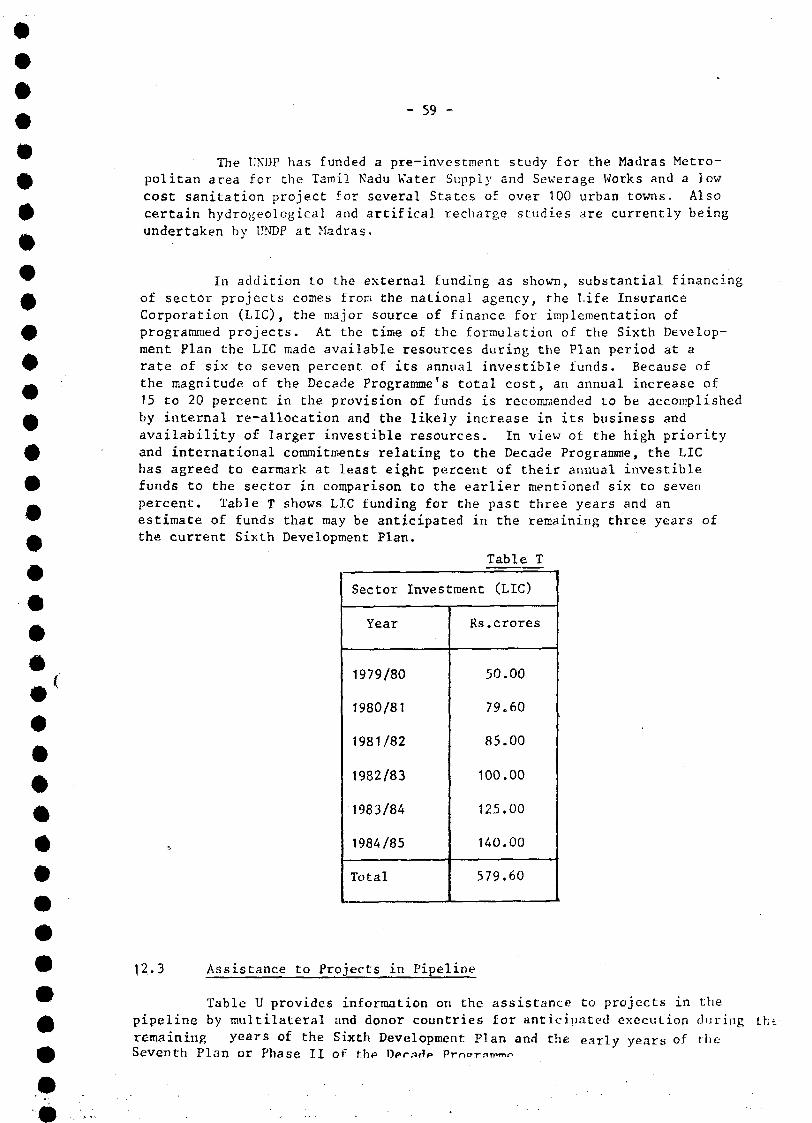
#
#
- 59 -
The UNDP has funded a pre-investment study for the Madras Metro-politan area for the Tamil Nadu Water Supply and Sewerage Works and a lowcost sanitation project for several States of over 100 urban towns. Alsocertain hydrogeological and artifical recharge studies are currently beingundertaken by UNDP at Madras.
In addition to the external funding as shown, substantial financingof sector projects comes from the national agency, the Life InsuranceCorporation (LIC), the major source of finance for implementation ofprogrammed projects. At the time of the formulation of the Sixth Develop-ment Plan the LIC made available resources during the Plan period at arate of six to seven percent of its annual investible funds. Because ofthe magnitude of the Decade Programme's total cost, an annual increase of15 to 20 percent in the provision of funds is recommended to be accomplishedby internal re-allocation and the likely increase in its business andavailability of larger investible resources. In view of the high priorityand international commitments relating to the Decade Programme, the LIChas agreed to earmark at least eight percent of their annual investiblefunds to the sector in comparison to the earlier mentioned six to sevenpercent. Table T shows LIC funding for the past three years and anestimate of funds that may be anticipated in the remaining three years ofthe current Sixth Development Plan.
Table T
Sector Investment (LIC)
Year
1979/80
1980/81
1981/82
1982/83
1983/84
1984/85
Total
Rs.crores
50.00
79.60
85.00
100.00
125.00
140.00
579.60
12.3 Assistance to Projects in Pipeline
Table U provides information on the assistance to projects in thepipeline by multilateral and donor countries for anticipated execution during thtremaining years of the Sixth Development Plan and the early years of flic-Seventh Plan or Phase II Of thf
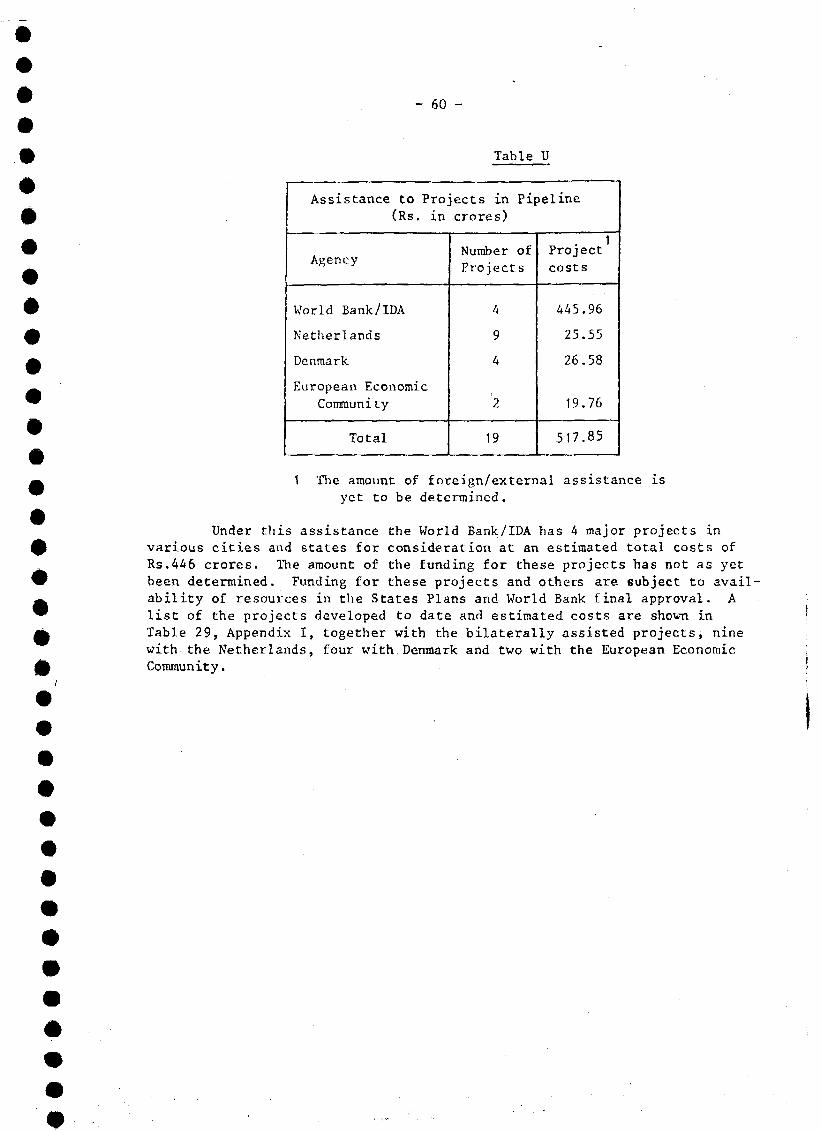
- 60 -
Table U
Assistance to Projects in Pipeline
(Rs. in crores)
Agency
World Bank/IDA
Netherlands
Denmark
European Economie
Community
Total
Number ofProjects
4
9
4
2
19
Projectcosts
445.96
25.55
26.58
19.76
517.85
1 The amount of foreign/external assistance isyet to be determined.
Under this assistance the World Bank/IDA has 4 major projects invarious cities and states for consideration at an estimated total costs ofRs.446 crores. The amount of the funding for these projects has not as yetbeen determined. Funding for these projects and others are subject to avail-ability of resources in the States Plans and World Bank final approval. Alist of the projects developed to date and estimated costs are shown inTable 29, Appendix I, together with the bilaterally assisted projects, ninewith the Netherlands, four with Denmark and two with the European EconomicCommunity.
o
VOLUME I
PART I
APPENDIX I
TABLES AND FIGURES
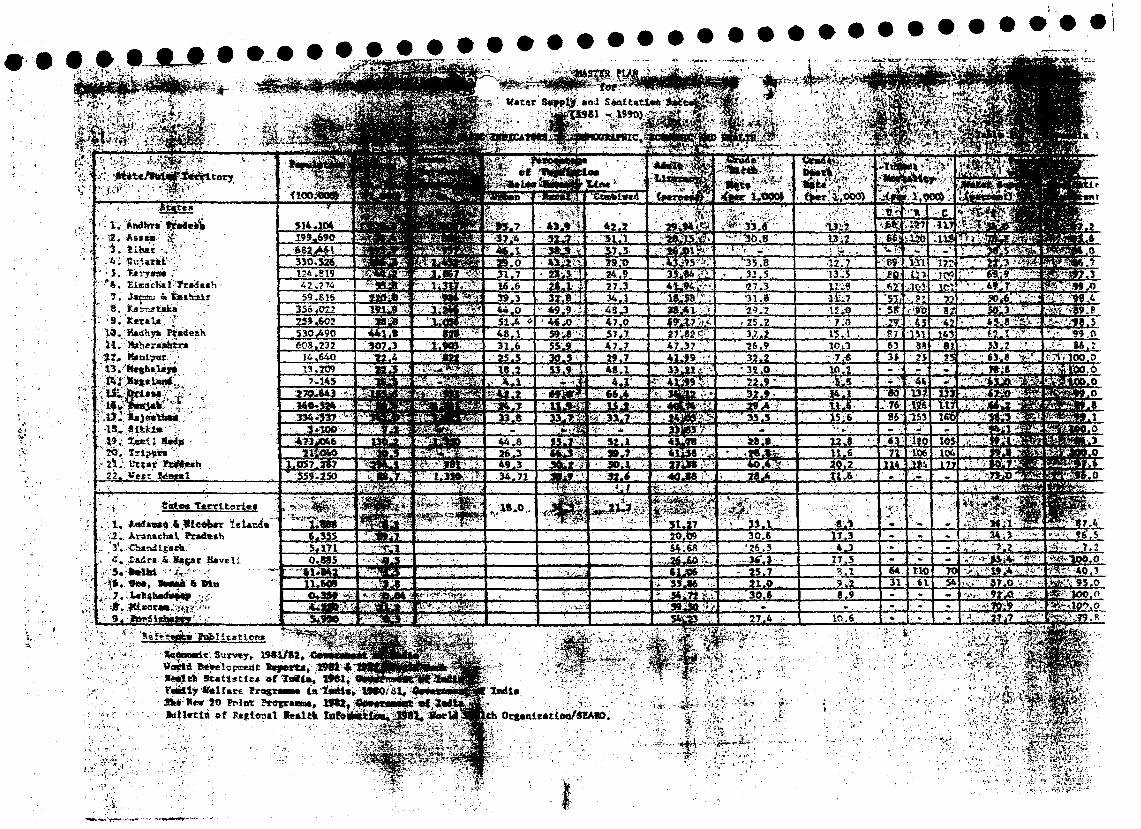
'-.••:, . '.,: ; . JSE*3*?A?5- .
7, J*e=!-j â'
Î9 . ii»dhy* Ftwiesh
: • • - • ( -• Catoa Territorie»
. 1. Aattwt 4 «eo*wr, .2. Arun*ch*l Pr»d«eh
4-Sfgar Saveli
pBetit sports
0rg»niEÉtioa/SEA8Dof Régional He.lth
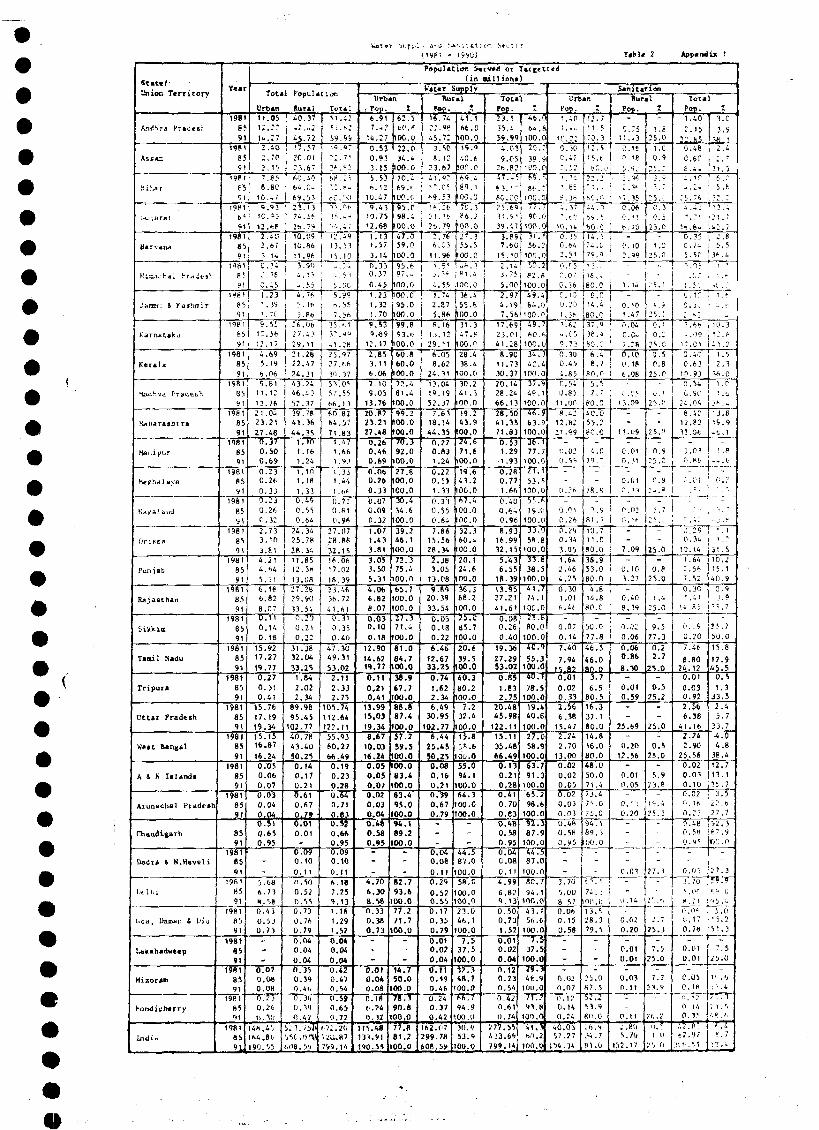
State/Union Territory
As (*=
,H i ha r
Barv*tu
Kls-ii'hal ITjiiesJi
..';tix^: S Kashmir
Kjrnataka
Ktraia
*ladhva Pradfcfih
MAkiitraabt rfl
Hani pur
Meehalava
Na^A ! and
OrlFfia
Punjab
Rajatthan
Tamil Nadu
Tripura
Utt»r Pradesh
Wett Bengal
A 1 N I«l»nd»
Chandigarh
DadlU & N,Haveli
lit 11, i
(ioa, Daman 4 Diu
Lakahadwesp
HixorADi
>-ondich*rry
Lntliu
Y«ar
1981
85
91
1981
8591
1981
8591
1981
?11981
65
91
Total Populat ion
Urban11.05
14.27
2.10
3.70
3, 15• 7.8?' 8.80
10..71 9.9 3
12.cf2.402.67
3.14
1981 C.J i8 5 i C. 16
91 0.45
19811 1.23
85
911981
6591
1981
85
91
8591
1981
85
911981
8591
198185
91
1981
85
91
198185
91
19818591
1981
8591
1981
8591
19818591
198185
911981
8591
198185
911981
85
911981
H8591
198185
9119fi1
85
91
198185
91
198185
911981
8591
198185'11
198185
,,..u
' . 70
9.51
10.5612.17
4.695.19
«.069 81
11.12
13.7621.0423.21
27.480.370.500.69
0.230.26
0.330.230.26
c.32
2.733.10
3.814.214.64
5,31
6.186.82
8.070.11
0.18
15.9217.27
19,77
0.270.310,41
15.7617.19
19.34
15:1516,87
16.24
0,050.060.070.03
0,040.510.65
0.95--
5.68
6 .7 3« , 580 . 4 3
0 .530.73
-
0,O70.0B0.08
~~0~.TT0.Ï6
(J.31I
14* .4 ' ,t64.B<j190.55
Rural
40,37
45.72
17.5720.01
: î . fj 7
60.4064 ,0-,
69.53
23.13
10,09j tO.86
1 11 .96
; 3.90
- . 5 :4.76
5. 1t>
5.8c
26.062 7.4?
29. 11
21.2822 .47
24.3143 2446.43
52.37
39.7841.36
44.351 .101.161.24
1.101.18
1.330.49
0.55O.fc4
24.3425.78
28.34
11.8513.31113.08
37.2829.90
33.540.20
0.22
31.3832.04
33.25
1.84
2.022.34
89.98
95,45102.77
40.78
43.4050.25
0.140.17
0.210.61
0.79-0.010.01
-0.090.10
0.11
O.500.520.550.730.76
0.790.040.04
0.040.350.390.41.0.360. '190.4Ï
5; 3./if '
iH.UIV.08.59
Trta!
M ,42
59.991 9 , ' "
22. 7 1
2 * , * 2
) b l - . 2 *
• ' . ' . - • -
SC'i»i ~* ~ f
' V . >, 1
' 2 , 4 9j 13 .53
' 1 5 . 1 0
- , 24• . . * 3
s . y t
5 . ?9ij.55
7.>h75, ' . 13~.')1
-1 .2b25,97
27.66
3". 17
57.55
66. 1360,8264.57
71.831 .471.661 .9.1
1.331.44
1 .bh
0.720.81
0.96
27.0728.88
32.1516.06
17.02
18,39
33.4636.72
41.61
O.ji
0.40
47.3049.31
53.02
2.11
2.332.75
105.74112.64
122.11
55.9360.27
66.490.190.230.280.64
0.63
o.SF0.66
0.950.090.10
0.11
6.187.259.131.16
1.291.52
0.040.04
0.0*0.420.470.54
0.5»0.650.72
6 72.20";;li,87799.14
«19fl - 1990)
Population Served or
( i n
Target
au 11ioni)
Wacar Sur.plV
Urbi
. Pop.
6.91
14.27
0.530.933.15
5,5:6. 13
10.47
3.43
12.68
I.i:1.57
3.14
0.3]0.37
0.45
1.231.321.70
9.531 . * 9
12. 17
2.853.116.06
7 109.05
13.76
20.8723.2127,48
0.260.460.69
0.060.260.33
0,07C.09
0.32
1.071.433.81
3.053.505.31
4.066.828.07
0.030.100.18
12.9014.6219.77
0.11
0.Î1
0.4)13.9915.03
19.34
8.6710.0316.24
0.050.050.070.02
0.04
0.480.58
O.»5---
4.706.30
8.580.330.380.73
--
-
0.010.0*0.08
D.18('.240.32
15.4D33.9190.55
nI
["•;fioc.o
i».o34.4
100.0
70.469.1.
I0C.0
95.C
100.0
47.059,0
IOO.0
95.697,-
100.0
100.095.0
100.0
99.893. *
100.0
60.860.0
100.0
7"* 481.4
100.0
99.2100.0100.0
70.392.0
100,0
27.800.0
100.0
30. i34.6
100,0
39.246,1
100.0
72/375.4
100.0
65.71O0.0100.0
27,J71 4
IOO.0
81.0
84.7100.0
3». 9
*7.7100.086.887.4
100.0
sf.T59.5
100.0
00.083.4
00.083.4"
95 000.09*4.189.1
00.0--
81.793.6
00.077.271.7
00.0--
-
50.000.0
90.800.0
77.(181.200.0
RuralPop.
16.74
4 5 . 7 :
3.50
8.1223.67
41,07•• ? . 0 ;
f-9. 53
! * . 2 *
26.79
- . 766, S3
11.96
1.5 '1 ? . ' ! t
4 .551,74
2.87
5.86
fi. 1613.12
29.11
6.058.62
24.31
19.1952.37
7.6318.!4
44.35
0.270.831.24
0.220. 5)1.31
0.330,550.64
7.8615.5628.34
2.383.05
13.08
9.8920.3933.54
0.05
0.22
6.46
12.6733.25
0.74
1.62
2.346,49
30.95
102.77
6.44
25.4556.25
0.080.160.210.-39
0 670.79
-,-
-
0.040.O80,11
0.29
0.520.550.170.350.79
0.010.02
0.04
0.110,190.46
0.240.370.42
162,(17299.78608.59
Î
41.1
100.019.9
40.6IW.O
69,469. 1
100.0
7C.3
'00.0
27.355.5
100.0
4 * . 3»1 .4
,10C. 0
K.i
55.6mo.o
31.347.fi
100.C
28.438.4
100.0
30 241 .3
100,0
"9.243.9
100.0
24,671.6
100,0
19.643.2
100.0
67,4100.0100.0
32.360.4
100.0
20.124.6
100.0
36.368.2
100.0
25.0
100.0
20,6
39.5100.0
40.3
80.2I00.O
7.232,4
100.0
T5.8"58.6
100.0
55.094.100.064.3
00.0
--
-
44.587.000.0
58.000.0
00,023.046.100.0
7.537.5
00.0
JÏ.348.700.0
6*6*. 7*94.9fXJ.lt
30.95.1.9
00.0
Total
Po_p.
23.5
59.99
4.03
9.052 6 . 8 2
17...S
h 3. ' "80.00
39.47
3.897.60
15. 10
2.143.75
5.00
2.974.197.56
17.6!
23.0141.28
8.9011.7330.37
20 1428.24
66.13
' "28.5(41.3571.83
0.531.291.93
0.280.771.66
0.400.6^
0.96
8.9:16.9932.15
5.4:6.55
18.39
13.9527.2141.61
o.oe0 2É
0.40
19.36
27.2953.02
0.85
1.832.75
20.4845.98
122.1115.11
35.4866.49
0.130.21
0.280.410 70
0.830.480.580.950.040.08
0.11
4.99
6.8.->9.13
O.50
0.731.52
0.010.02
0.040.120.230.54
0.42O.6I0.74
J/7.55/. 33.69799.14]
I
46.5
100.0
20.2
39.9iW.t£ 5 . 1
8*-.7100.0
100,0
1 1 .56.2
100.0
' T o . ;P2.S
100.0
49.464.0
100.0
W.76P.h
100.0
34.342.4
100.0
3?,949.1
100.0
il,,Ç63.9
100.0
36.177.7
100.0
if. 153.5
100.0
55.6"
79.0100.0
33.058.8
100,0
"33.fi38,5
100.0
ÏI.774.1
100.0
25.fi80 0
100.0
40.9
55.3100.0
40, 1
78.5
1O0.019.440.8
100.0
27. (58.9
100.0
63.791.3
100.065.2
98 6100.0
92.387.9
100.044.587.0
100.0
80.794.1
10O.0
43.156.6
100,07.5
37.5
100.0
24, $46.9
KJO.O
jr.?93.8
100.0
4.T7Ihit.2
100.0
t e d
Urban
Pop.
H P
,0.0;
0.300.-22 ..'. 2
1 _ Ti1 .«!
S . 3 64 . 3 7
10.14
0.350.64
2 . 5 '
c,, r, 5CO ^
0.360-10;.").:• 0
1.363.634 . 0 50 j t
0.300.45
4.650 540.85
11 .or
8.4212, R:
21.99
-11.020 .55
--
-
0.01
0.26
0.290.34
3.051.642,46
4.25
0.301.01
6.46
0 07
0.14
7.40
7.94
0,01
0.020.332.566.38
15.472.242.70
13.00
0.02
0.020.050.02
0 030,03
0.480.58
0.95---
3.70
•i.OU8.5?0.060.15D.58
--
-
0.02o.r>7
0.120.14O.?4
40.0.157,27
154.14
12.7
70.3
12. S
15.6
? r.. i.1
?-> T
SO. ' "4 4 . fl
8 0 . CU . 5? 4 . 07 0 , 0
' • ' > . :
1 6 , ,
80.0
c C14.4
80.C37.938.4
6 0 . C
6.48,7
80,0
5 <;
7.7
80.0
40.055.?
ec.o
-4 . 0
79.7
-
78.S
3 .9fil . 1
10.711.0
80.0
38.953.080.0
4.814.880.0
-
50 0
77.8
46.5
46.080.(1
3.7
6.5
80.516.337.1
80.0
14.816.0
80.0
48.050.071,473.47"-,0
75.094.189.300.0
--
-
(• C'1 "•
74 . i00.1113.5
28.379.5
-
-
-:i.o8 7 . 5
52.253 .9HO.O
Jit.H
'M . 7PI.G
T.M* 2
Sanitation
Kur
Poy.
-
11 .13
C I S" ' .18
2 . "<*•
H,?S
0.06
6.70-
C.IO2. si)
• 1 ^
Ï
25.0
I.C0.9
25.:3.9". '
2 5.''C.3
25.0
1.0Ti n
! ..
-
1. u
-
0.101.47
0.04
C.Ci7.28
0.100.18
6.08
; , . C,_<
1 3.01--
11.09
0.010.31" - • " I
0.01n, 11
_ . ^ __l0.02
(!, 1 ('
-
-
7.09
0.103.27
-0,40
8.39-
0.06
0.060.86
8.30
o.ot0.59
-
25.69-
0.20
12.56-
0.010.05
0. I :
0.20
--
--
0.03
-I) . 14
-
0,0;
0.20-
0.01
0,01-
0.0311.11
-
-
(1,11
* ." 05.70
15! .1 /
25, '
-
25 . :
C . I0 . :
2 5.0
0.5P.8
25.0
C . I25.( '
--
2 5 . "
0.925.0
0.924..=
_
1.7
--
25.0
-0.8
25.0
-1 .4
25.0
-9.5
27.3
0,22.7
25.0-
0.5
25.2--
2JL0J
-0.5
25,0
-5.9
?3.8
19.4
25.3
-
-77 .1
2 ' : . ?t
2.7
25.3-
7.5
25.0
7.721,9
11,.'1
1,0
.'•,,ii
Appcndu 1
Total
Pop.
1.40
3. 1523.650.48
0.60
6 . 4 .4 1 ^
~ .2 .
2i.~h4.43
14.84
0.350 . 7 45.5C
' . [ . • . "
' , . ! •."
O.y.j
2 -p'}
}. hh- . 0 9
1 :. c 1
C.40
0.6310,937) 54
G.91-24.09
8.4212.8233.0*
-).O3i'.'.86
> • . 0 1
. • . c . *
• ~ : • •• 1
" . 4 :
il.290 . .34
10. 14
1.64
2.567.52
0.3.C1 .4!
1 4 . 8 ;
0 'S
0.20
7.46
8.8024.12
0,01
0.030.922,566.38
41.16
2.242.90
25.560.020.0.30.100.020. I f
0.23
0.480.580.95
-
0,0 '1
J.7Q ""
S . <>r
8 . 7 1
Î
3.0
3.9
ï*.. 12.4
2. ^
31.36 . "5.6
3 2 . :' 1 3 . - .
42 .7
2.85.5
36 .4i . '
1 . *
1 . '_ _.'.
• • • , . .
10.3T J . p
4 1,?
1.52 . 3
36.0
3 « - . M
: 3 .s14.9
-t. !-
! .S
4 . . 6
• •
O . ?: , -
- . . 7
•, J . P
' . 1
1 , ;>
31.5
10.2'i5. 140.9
0 . 9
3.9' •5 .7
" • . 750.0
15.8
17.945.5
0.5
1.3
33.52.45.7
33.7
•4.04 . 8
38.4
12.713.135.7
3 .5
27 .7
£ 7 .9
I X . 0
-'.' y. 3
' . •- . 0
'O . 4
11,06 : 5 .Û0 . 1 7
0.7«
0.01
0,01-
0.050. 18iï . 120 .14O . J 1
.', ? . f> •
t7.'HM,'';''L.
' 3 . 2
5 1 . 3
7.52'J.Q
-T . . t); •'. 4
; ). *i<•*> j ,
f .i
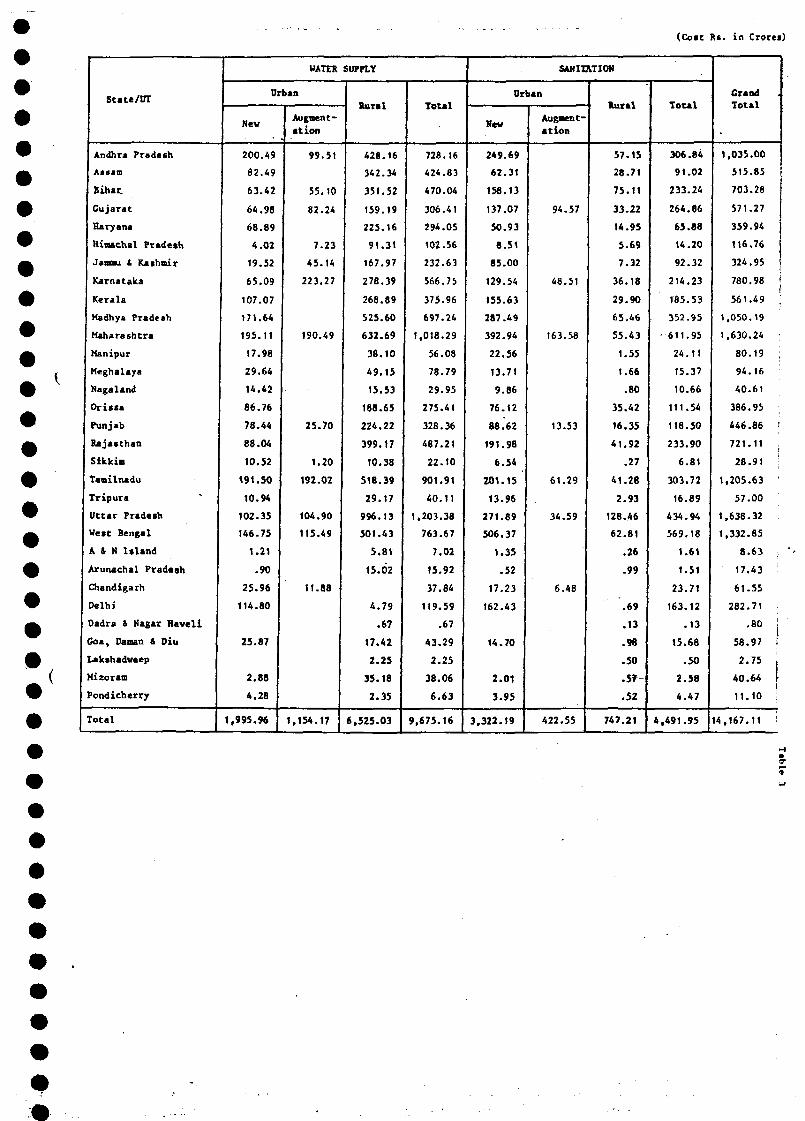
(Coït Rt. in Crorci)
State/UT
Andhra Pradesh
Allan
Bihar
Gujarat
Haryana
Hiaachal Pradesh
Jamu & Kashmir
Karnataka
Kerala
Madhya Fradcah
Maharashtra
Manipur
Meghalaya
Nagaland
Orissa
Punjab
Rajasthan
Sikkim
Tamilnadu
Tripura
Uttar Pradeah
We*t Bengal
A » N I*land
Arunachal Pradesh
Chandigarh
Delhi
Padra & Nagar Eaveli
Go*, Daman & Diu
Lakshadweep
Mi ioram
Fondicherry
Total
WATER
Urban
New
200.49
82.49
63.42
64.98
68.89
4.02
19.32
65.09
107.07
171.64
195.11
17.98
29.64
14.42
86.76
78.44
88.04
10.52
191.50
10.94
102.35
146.75
1.21
.90
25.96
114.80
25.87
2.88
4.28
1,995.96
Augment-
ation
99.51
55.10
82.24
7.23
45.14
223.27
190.49
25.70
1.20
192.02
104.90
115.49
11.88
1,154.17
SUPPLY
•urvi
428.16
342.34
351.52
159.19
225.16
91.31
167.97
278.39
268.89
525.60
632.69
38,10
49.15
15.53
188.65
224.22
399.17
10.38
518.39
29.17
996.13
501.43
5.81
15.02
4.79
.67
17.42
2.25
35.18
2.35
6,525.03
Total
728.16
424.83
470.04
306.41
294.05
102.56
232.63
566.75
375.96
697.24
1,018.29
56.08
78.79
29.95
275.41
328.36
487.21
22.10
901.91
40.11
1,203.38
763.67
7.02
15.92
37.84
119.59
.67
43.29
2.25
38.06
6.63
9,675.16
SANITATION
Urban
New
249.69
62.31
158.13
137.07
50.93
8.51
85.00
129.54
155.63
287.49
392.94
22.56
13.71
9.86
76.12
88.62
191.98
6.54
201.15
13.96
271.89
506.37
1.35
.52
17.23
162.43
14.70
2.01
3.95
3.322.19
Augment-ation
94.57
48.51
163.58
13.53
61.29
34.59
6.48
422.55
Rural
57.15
28.71
75.11
33.22
14.95
5.69
7.32
36.18
29.90
65.46
55.43
1.55
1.66
.80
35.42
16.35
41.92
.27
41.28
2.93
128.46
62.81
.26
.99
.69
.13
.98
.50
.37-
.52
747.21
Total
306.84
91.02
233.24
264.86
65.88
14.20
92.32
214.23
185.53
352.95
611.95
24.11
15.37
10.66
111.54
118.50
233.90
6.81
303.72
16.89
434.94
569.18
1.61
1.51
23.71
163.12
.13
15.68
.50
2.58
4.47
4,491.95
GrandTotal
1,035.00
515.85
703.28
571.27
359.94
116.76
324.95
780.98
561.49 \
1,050.19
1.630.24 ;
80.19
94.16
40.61
386.95
446.86 '
721.11 .
28.91
1,205.63
57.00
1.638.32
1,332.85
8.63 ;
17.43
61.55
282.71
.80
58.97 j
2.75 !
40.64 I
11.10 ;
4.167.11 !
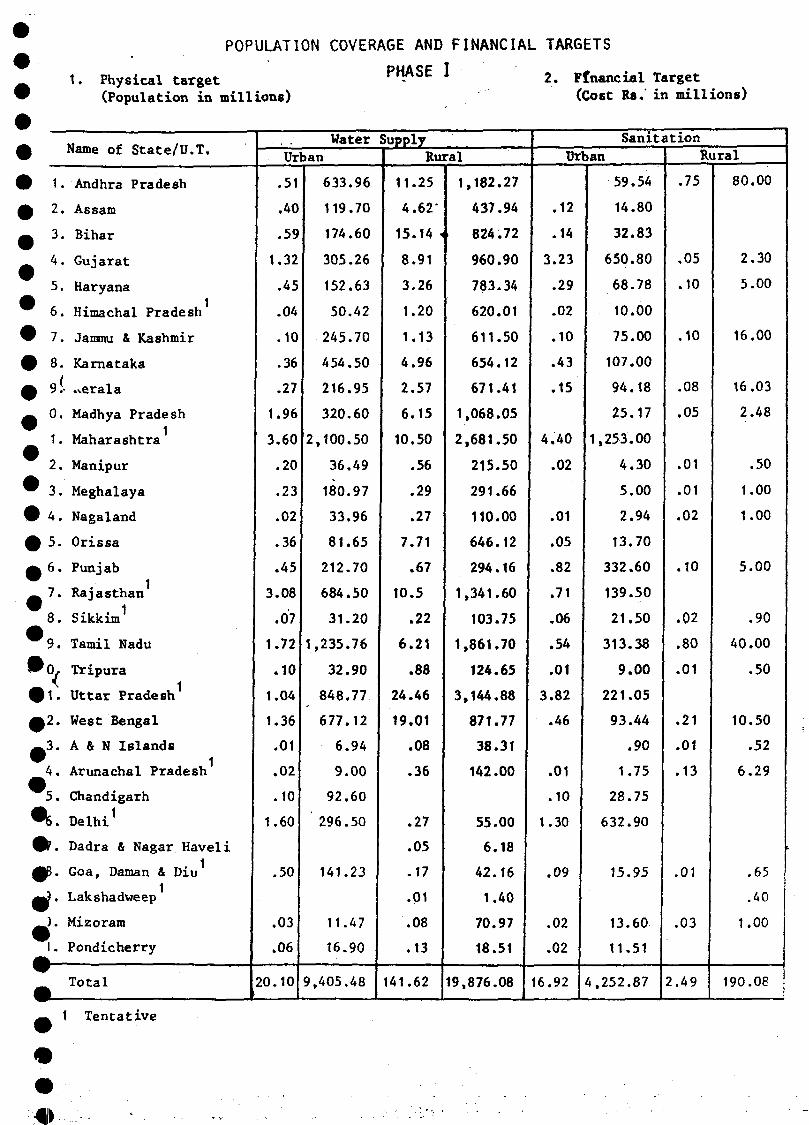
1. Physical target(Population in millions)
POPULATION COVERAGE AND FINANCIAL TARGETS
PHASE I 2. Financial Target(Cost Rs. in millions)
1.
2.
3.
4.
5.
6.
7.
8.
9i0.
1.
2.
3.
4.
5.
6.
7.
8.
9.
1.
2.
3.
4.
5.
6.
7 *
It
I -
Name of State/U.T.
Andhra Pradesh
Assam
Bihar
Gujarat
Haryana
Himachal Pradesh
Jamnu & Kashmir
Karnataka
.verala
Madhya Pradesh
Maharashtra
Manipur
Meghalaya
Nagaland
Orissa
Punjab
Rajasthan
Sikkim1
Tamil Nadu
Tripura
Uttar Pradesh
West Bengal
A & N Islands
Arunachal Pradesh
Chandigarh
Delhi1
Dadra & Nagar Haveli
Goa, Daman & Diu
Lakshadweep
Mizoram
Pondicherry
Total
1
1
3
3
1
1
1
1
20
Water
Urban
.51
.40
.59
.32
.45
.04
.10
.36
.27
.96
.60
.20
.23
.02
.36
.45
.08
.07
.72
.10
.04
.36
.01
.02
.10
.60
.50
03
06
.10
2
1
9
633.96
119.70
174.60
305.26
152.63
50.42
245.70
454.50
216.95
320.60
,100.50
36.49
180.97
33.96
81.65
212.70
684.50
31.20
,235.76
32.90
848.77
677.12
6.94
9.00
92.60
296.50
141.23
11.47
16.90
,405.48
SupplyRural
11.25
4.62*
15.14 1
8.91
3.26
1.20
1.13
4.96
2.57
6.15
10.50
.56
.29
.27
7.71
.67
10.5
.22
6.21
.88
24.46
19.01
.08
.36
.27
.05
.17
• 01
.08
.13
141.62
1
1
2
1
1
3,
19,
,182
437
824
960
783
620
611
654
671
,068
,681
215
291
110
646
294
,341
103
,861
124
,144
871
38
142
55
6.
42.
1.
70.
18.
876
.27
.94
.72
.90
.34
.01
.50
.12
.41
.05
.50
.50
.66
.00
.12
.16
.60
.75
.70
.65
.88
.77
.31
.00
00
18
16
40
97
51
08
3
4
3
i
i
a
1.
•
6,
Sanitation
Urban
.12
.14
.23
.29
.02
.10
.43
.15
.40
.02
.01
.05
.82
.71
.06
.54
.01
.82
46
01
10
30
09
02
02
92
59
14
32
650
68
10
75
107
94
25
1,253
4
5
2
13
332
139
21
313.
9
221
93
1.
28.
632.
15.
13.
11.
4,252.
.54
.80
.83
.80
.78
.00
.00
.00
.18
.17
.00
.30
.00
.94
.70
.60
.50
.50
38
00
.05
44
90
75
75
90
95
60
51
87
.75
.05
.10
.10
.08
.05
.01
.01
.02
.10
.02
.80
.01
.21
.01
.13
.01
.03
2.49
Rural
80
2
5
16
16
2
1
1
5
40
10
6
1
190
.00
.30
.00
.00
.03
.48
.50
.00
.00
.00
.90
.00
.50
.50
.52
.29
.65
.40
.00
.08
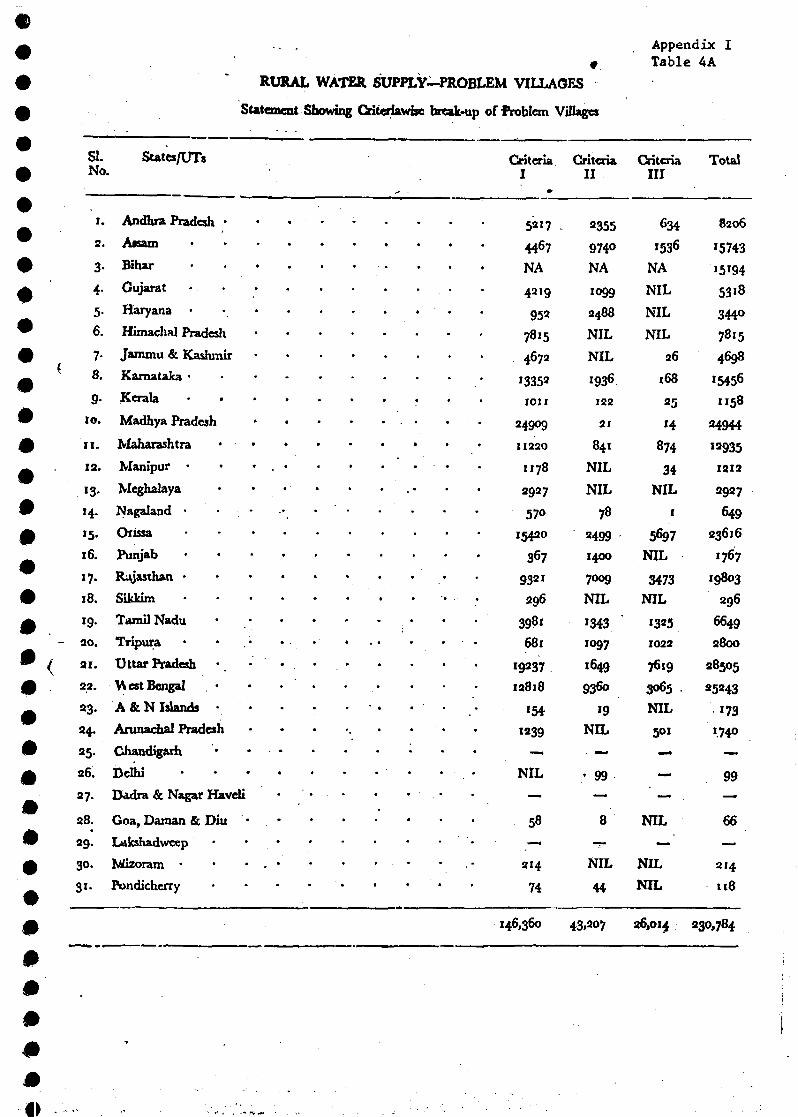
mAppendix ITable 4A
RURAL WATER SUPPLY—PROBLEM VILLAGES
Statement Showing Criteriawise break-up of Problem Villages
SLNo.
i .
2 .
3-
4-
5-6.
7-8.
9-to.
i i .
i a.
13-
14-
»5-16.
17.
18.
19.
2 0 .
31.
32.
33.
24.
25.
36.
37-
38.
29.
30.
31.
Sta te s /UTs
Andhra Pradesh *
A n a m . . . .
Bihar . . . .
Gujarat
Haryana •
Himaclml Pradesh
Jammu & Kashmir
Kamataka •
Kerala . . . .
Madhya Pradesh
Maharashtra • •
Manipur • • • . •
Meghalaya
N a g a l a n d • •
O r i s s a . . . .
P u n j a b . . . .
R a j a s t h a n •
S i k k i m . . . .
Tamil Nadu
Tripura * • , • •
Uttar Pradesh •.
West Bengal • • • "
A & N Islands
Arunachal Pradesh
Chandigarh • • • *
Delhi . . . .
Dadra & Nagar Haveli
Goa, Daman & Diu • -
Lakshadweep • •
Mi2oram • • • . *
Pondicherry
CriteriaI
52174467
NA
4319
952
78154672
13353IOII
24909
11230
II78
2927
57»15420
367
9321296
398l
68l
i923713818
154
1339
CriteriaII
8355
9740NA
1099
2488
NIL
NIL
1936.
193
91
84I
NIL
NIL
783499
1400
7009
NIL
13431097
1649
9360
19
NIL
CriteriaIII
634
1536
NA
NIL
NIL
NIL
26
.68
25
H874
34NIL
1
5697NIL
3473NIL
13251022
7619
3o65NIL
501
Total
8206
15743
'5'94
53 «8
344°
7815
4698
»5456
1158
24944
«9351213
2927
64923616
1767
I9803
296
6649
2800
38505
25243
173
1.74°
NIL ' 9 9 — 99
58 8 NIL 66
214 NIL NIL 314
74 44 NIL 118
146,360 43,207 26,014 230,784
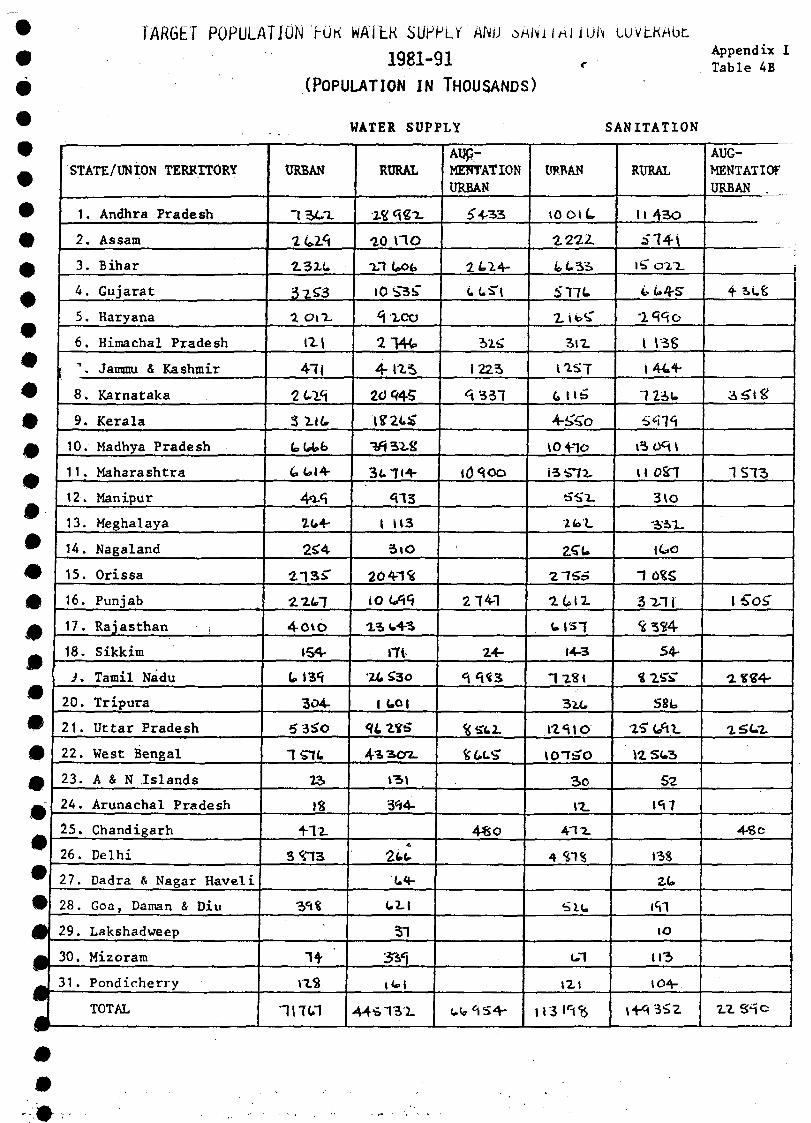
TARGET POPULATION >0K WAÏtK SUPPLY ANU
1981-91(POPULATION IN THOUSANDS)
luVtKAbtAppendix ITable 4B
t»•
0
W
•
#
#
•
0
m
•#•
•
••0m
*••
•431
STATE/UNION TERRITORY
1. Andhra Pradesh
2. Assam
3. Bihar
4. Gujarat
5. Haryana
6, Himachal Pradesh
"\ Jammu & Kashmir
8, Karnataka
9. Kerala
10. Madhya Pradesh
11. Maharashtra
12. Manipur
13. Meghalaya
14. Nagaland
15. Orissa
16. Punj ab
17. Rajasthan •,
18. Sikkim
J. Tamil Nadu
20. Tripura
2 1 . Ut tar Pradesh
22. West Bengal
23. A & N Is lands
24. Arunachal Pradesh
25. Chandigarh
26. Delhi
27. Dadra & Nagar Haveli
28. Goa, Daman & Diu
29. Lakshadweep
30. Mizoram
31 . Pondicherry
TOTAL
URBAN
2 U*
2.3ZC
32<T3
a i4 7 |
2ca<i3 2.16,
tW>fc
£,4,14-
4*-<î
2(,4-
4o»o154-
L tS<(
3O4-
5 3b'O
7 Sit
23
IS
+T2-
14
•7I7C7
WATER SUPPLY
RURAL
20 \7O
"Li UOfc
• 0 S-3Î"
2 14t
4-tZS
20<<45
i?2C5
^ 3 Z 8
3t7«4-
^13
1 H3
5 i O
2041%
iO i/i1^
Z%«.43
»7t
ZU S3O
<ïtzvs4*3CTC-
3*i4-
-A
U4-
31
4 4 * 1 3 X
AUG-MENTATION
URBAN
£4-33
2 414-
1225
^337
«(3 e» o o
2 741
24-
^*1«3
VU.*
4«o
(*(<. 1 S 4 -
SANITATION
URBAN
<0 ( M L
2222.
fc<-3à
517L
Zi*C
3IZ
l^S7
6 1 la
4-f^O
10 47O
IL.L
2CL
2 755
2UZ
<• 157
t4-B
7 2SI
3iX,
io-r^o3 o
IZ.
41Z
4 *Î1S
U1
»Z»
113 «Sft
RURAL
It 4.3O
A'74i
IS' O ^ l
-Z^o
t \3S
1444-
7 2iU
Wt
i3OC«»
»« 0S7
3tO
iGO
7 0«S
3 XI1
%3«4
S4-
581,
i2SU3
52
m
m
104-
AUG-
MENTATIOF
URBAN .
1 S 7 5
I £"OiT
ass4-
zscz
4 « c
ZZ S*o
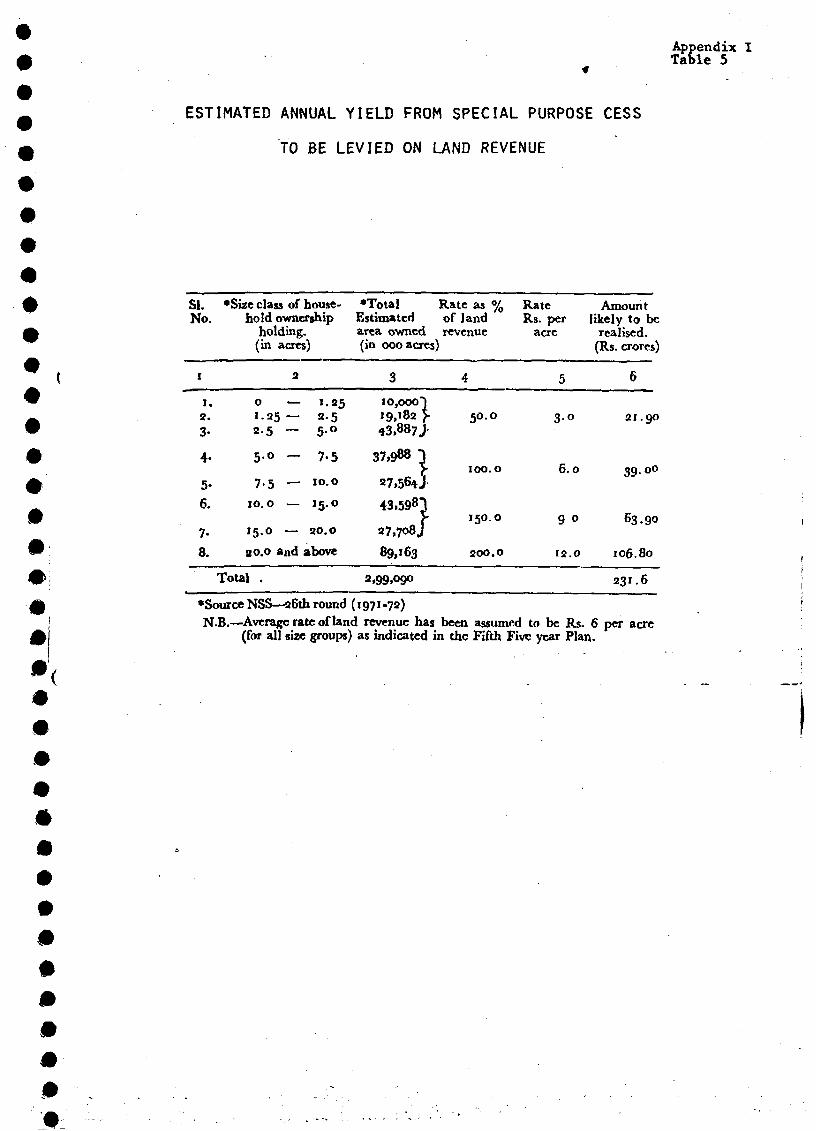
#
#
ESTIMATED ANNUAL YIELD FROM SPECIAL PURPOSE CESS
TO BE LEVIED ON LAND REVENUE
SI.No.
i
i.3.3-
4-
5-6.
7-8.
•Size class of house-hold ownership
holding,(in acres)
3
o — 1.251.35— 2-52-5 — 5 °
5.0 — 7.5
7.5 — 10.0
10.0 — 15.0
15.0 — 30.0
a 0.0 and above
Total .
•Total Rate asEstimated of landarea owned revenue(in 000 acres)
3
10,000")
37,988 1
37,564!43,5981
89,163
3,99,O9O
4
50.
1 0 0
150
200
0//o
0
. 0
, 0
. 0
RateRs. per
acre
5
3-
6
9
12
0
. 0
0
. 0
Amountlikely to be
realised.(Rs. crores)
6
21.90
3 9 - o 0
63.90
106.80
331.6
•Source NSS—26th round (1971-72)N-B.—Average rate of land revenue has been assumed to be Rs. 6 per acre
(for all size groups) as indicated in the Fifth Five year Plan.
Appendix ITable 5
mmm
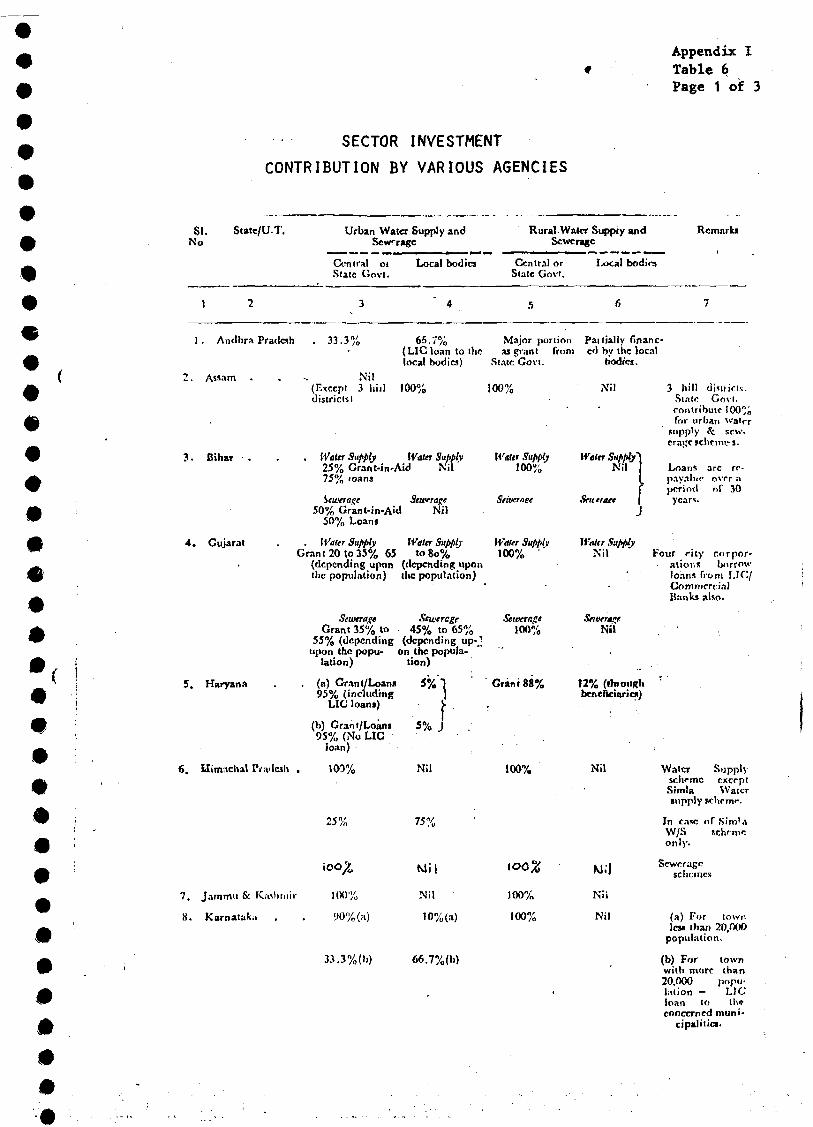
SI.No
SECTOR INVESTMENTCONTRIBUTION BY VARIOUS AGENCIES
Statc/U-T.
Appendix ITable 6Page 1 of 3
Urban Water Supply andSewerage
Rural-Water Supply andSewerage
Central 01State Govt.
Local bodies Central orState Govt.
bodirs
Remarks
#
mm*
1 . Andhra Pradesh 33.3
Assam
3. Bihar
4 . Gujarat
5. Haryana
6, tlirmchal 1
65.7% Major portion Paiiially financ-(LIC loan to the as grant from cd by the locall l b d i ) S G bdi
Nil(Except 3 hiildistrictsi
local bodies)
100%
gSlate Govt.
100%
. Water Supply Water Supply25% Grant-in-Aid Nil '75% loans
Seweraçe Sewtrage50% Grant-in-Aid Nil
50% Loans
. Water Supply Water SupplyGrant 20 to 35% 65 to 8o%
(depending upon (depending uponthe population) the population)
StweraçeGrant 35% to 45% to 65%
55% (depending (depending up-]upon the popu- on the p o p u -
lation) tion)
Water Sup/Uy100%
Sriucraee
Water Supply100%
Seioerage100%
(a) Grant/Loan»95% (including
LIC loans)
(b) Grant/Loans95% (No LIG
loan)
103%
25%
5%-j
% J' Grant 88%
5%
7, Jamm» & Kashmir 100%
8. Karnatak;» . . 90% (a)
ybodies.
Nil
Water Supply')Nil
Srutratt
Waltr SupplyNil
SewerageNil
12% (thoughbtnefictaricx)
3 hill <Slate Govl.contribute 100%for urban watrr
supply & sru1-crape scheme-s.
Loans arc rc-payabir over aperiod nf 30years.
Four ritya l i enloans from LIC/~ rrinl
corpor-bnrrow
Nil
75%
Mil
Nil
10% (a)
>6.7%(b)
100%
100%
100%
•
Nil
M.j
Nii
Nil
Waicr Supplyscheme exceptSimla Watersupply schrmr.
In caw of Sim'dW/S schrmronly.
Sewerageschemes
(a) For (ownles» lha» 20,000
population.
(b) For townwith more than20,000 popu-lation — LICloan to theconcerned muni-
cipalities.
#
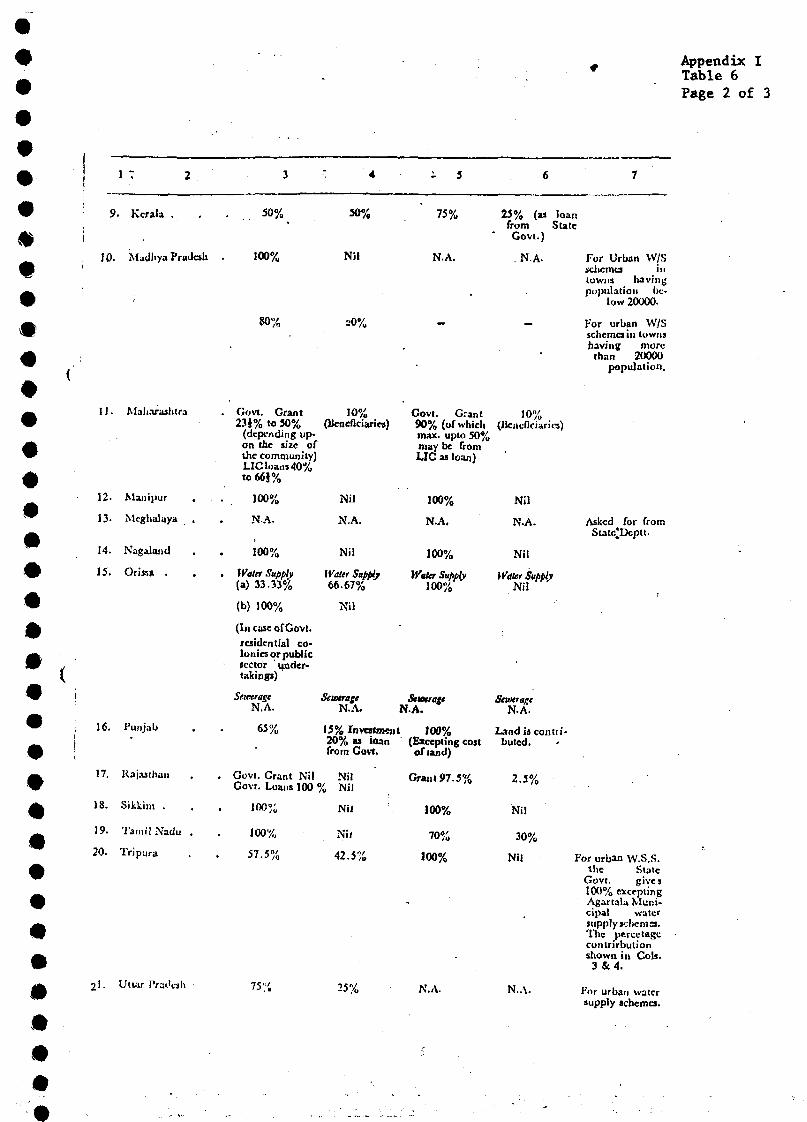
Appendix ITable 6Page 2 of 3
l :
9. Kerala . . . 50%
JO. Madhya Pradah . 100%
80%
50%
Nil
30%
75%
N.A.
23% (a» loanfrom StateGovi.)
For Urban W/Sschemo intowns havingpopulation bo
low 20000.
For urban W/Sschemes in townshaving more
than 20000population.
11. Maharashtra Govt. Grant 10%23 J% to 50% (JJeneficiarira)
(depending up-on the size ofthe community)U C loans 40%to66J%
Govt. Grant 10%90% (of which <Ifcn,:ficiwics)max. upto 50%may be fromLIC as loan}
m
12.
13-
14.
15.
i
16.
17.
18.
19.
20.
2.-
Manipur ,
McghaJaya ,
Nagaland
Orissa .
Punjab
Kajasthan ,
Sikkim .
Tamil Nadu .
Tripura
Uiuv IVai'csl»
100%
N.A.
100%
. Water SupplyW 33.33%
(b) 100%
(In case of Govt.residential co-lonies or publicsector under-takings)
StweragiN.A.
65%
. Govt. Grant NilGovt. Loans 100
100%
100%
57.5%
75%
Nil
N.A.
Nil
Water Supply66.67%
Nil
StwtrageN.A.
100%
N.A.
100%
Water Supply100%
StwtrageN.A.
15% Invotmçnt 100%20% as MUM ' (Excepting costfrom Govt. of land)
Nil% Nil
Nil
Nil
42.5%
25%
Grant 97.5%
100%
70%
100%
N.A.
Nil
N-A.
Nil
Water SupplyNil
SewtrgrtN.A.
I^nd is contri-buted.
2.5%
Nil
30%
Nil
N.A.
Asked for fromStat«£Dcplt.
For urban W.S.S.the Stale
Govt. gives100% exceptingAgartala Muni-cipal watersupply schemes.The percctagecontributionshown in Cols.
For urban watersupply schemes.
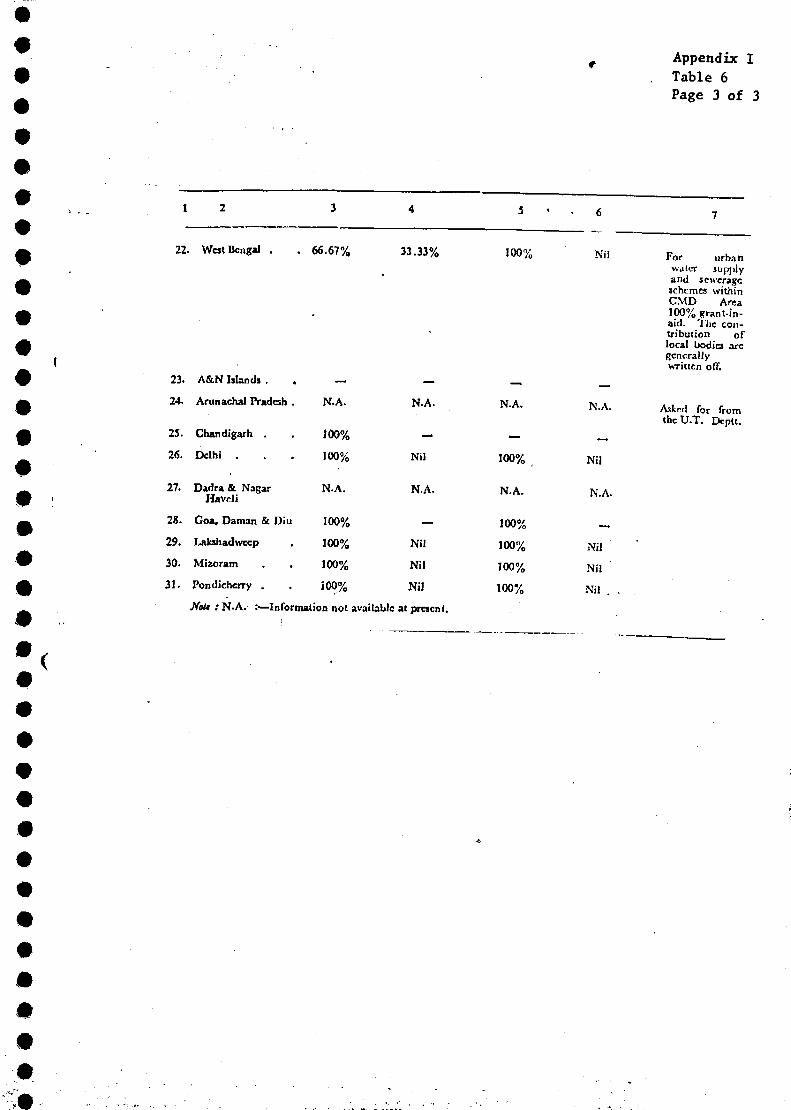
Appendix ITable 6Page 3 of 3
22. West Bengal . . 66.67%
23. A&N Islands .
24. Arunachal Pradesh . N.A.
33.33%
N.A.
5 - . 6
100%
N-A.
Nil
N.A-
25.
26.
27.
28.
29.
30.
31.
Chandigarh .
Delhi .
Dadra & NagarHavcli
Goa, Daman & Diu
Lakshadweep
Mizoram
Pondichcrry ,
100%
100%
N.A.
100%
100%
100%
100%
JVoto .• N-A. :—Information not available
—
Nil
N.A.
—
Nil
Nil
Nil
at present.
—
100%
N.A.
100%
100%
100%
100%
„
Nil
N.A
Nil
Nil
Nil .
For urbanwater supplyand sewerageschemes withinCMD Area100% grant-in-aid. llie con-tribution oflocal bodies arcgenerallywritten off.
Asked for fromtheU-T. Dcptt.
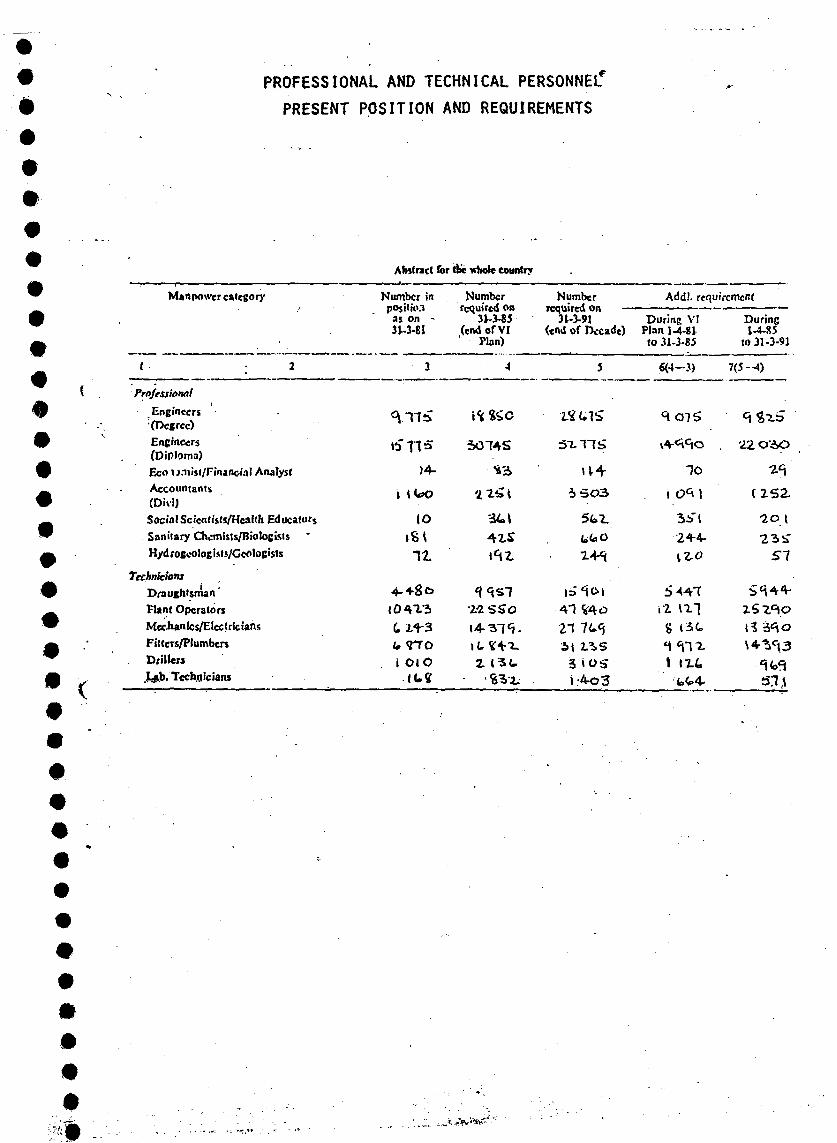
PROFESSIONAL AND TECHNICAL PERSONNELPRESENT POSITION AND REQUIREMENTS
m
Abstract for the whole country
Manpower category Number inposition
as on -
no-si
Numberrequired on
3^3-«5(end of VI' Plan)
Numberrequired on —
31-3-91(end of Decade)
Add/, requirement
During VIPlan 1-4-81to 31-3-85
During1-4-85
10 31-3-91
i .6(4-3) 7(5-4)
Professional
Engineers(Degree)
Engineers(Diploma)Eco u.-nis'/Financial AnalystAccountants(Divl)Social Scientists/Health EducatorsSanitary Chemists/BiologistsHyd rogeolos fct .«/Geologists
TechniciansDraughtsman 'Fiant OperatorsMechanics/ElectriciansF/ffcrs/PlumbersDrillers.Lab. Technicians
ZÎUS
5074S 2 2 O'AO
5O3
"JO
•56 12-f4-
1C[
23 b"
LI SSo 4*1
ti If 3vrroi 01 O
8 C3.C, ti
it-2. t 1X4 •Ufl
mm
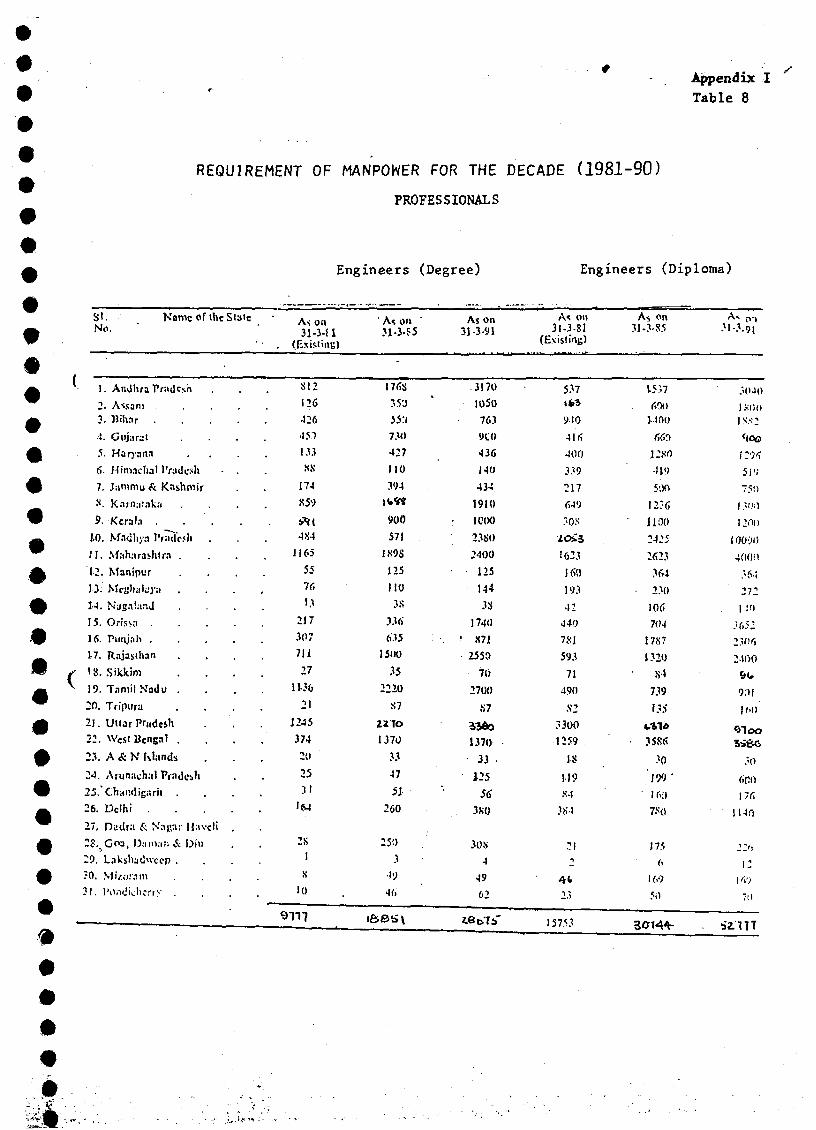
Appendix ITable 8
y-
REQUIREMENT OF MANPOWER FOR THE DECADE ( 1 9 8 1 - 9 0 )
PROFESSIONALS
Engineers (Degree) Engineers (Diploma)
#
S i . N a m e of the S la t eNo.
1. And lira P r adesh
2- Avsani . . . .
3 . B i h a r . . . .
4. Gujarat
5. Haryana
6. Himachal Pradesh - ,
7. Jammu & Kashmir
X. Karnaiaka
9. Kerala . . .
J.O. Madhya Pràiïc.Oi
II . Maharashtra .
J2. Manipur
1 3 . M c S J i a h j y ; i .
1 4 . N a g . i ! . « : i J
1 5 . O r i s s a . . . .
1 6 . P u n j a b . . . .
1 7 . R a j a s l h a n
IS. .SiJckim . .
19. Tamil N'odu .
20. Tripura
21. UuarPradcih
22. Wcst Bengal ,
23. A & K Mantis
24. Atunachal Pradesh
25. 'Chandigarh .
26. Delhi . . . .
27. Dadra & Najjar Uavcli .
- ? . Goa , D.unar. & Did
29. Lakshadwccp .
30. Mizo.'sm
31. Pondk-hcrry .
As on31-3-fl
' • . (KxixtiiiB)
SI 2
•126
451
133
NN
174
X59
SH{4SI
1165
55
'•'
217
307
711
27
11-36
21
1245
374
20
25
31
'64
:si
9TI7
1 As o»31-3-55
-
I7&S
35'J
55:i
730
427
no394
ifcW
900
571
1X9S
125
110
3X
336
635
15OU
^5
2220
X7
2 2 To
1370
}}
47
51
260
25D
3 :
19
46
As On31-3-91
3170
1050
763
910
436
140
434
1910
1000
2380
2400
125
144
3S
1740
. ' X71
2550
70
2700
S7
1370
33 •
125
56
3K0
4
49
62
As on31-3-81
(Exislme)
5374fc3
910
41fi
400
339
217
<I49
30S
tod
1623
160
193
42
440
7SJ
593
71
490
S2
3300
1259
IS
119
S4
3K4
212
2.1
15753
As on31-3-85
15.17
fîOO
MOO
Ml
12W
419
50O
1236
• noo2425
2623
364
• 230
lOrt
704
17S7
1320
S-»
739
13$
Vila35S6-
30
1 9 9 '
' ' 16"i)
7S()
175
W
Ax 0 . ,
•M-3.91
3040
is.-;:(w©
i:or,5 1 <;
"50
I 3 < i i l
1200
UKW
400n
;-6i
272
I-!'»
36522.u:r,
2100
&(.
9.11
\M
e
3â66
;<otien176
1140
i v .
12
7.1
I:
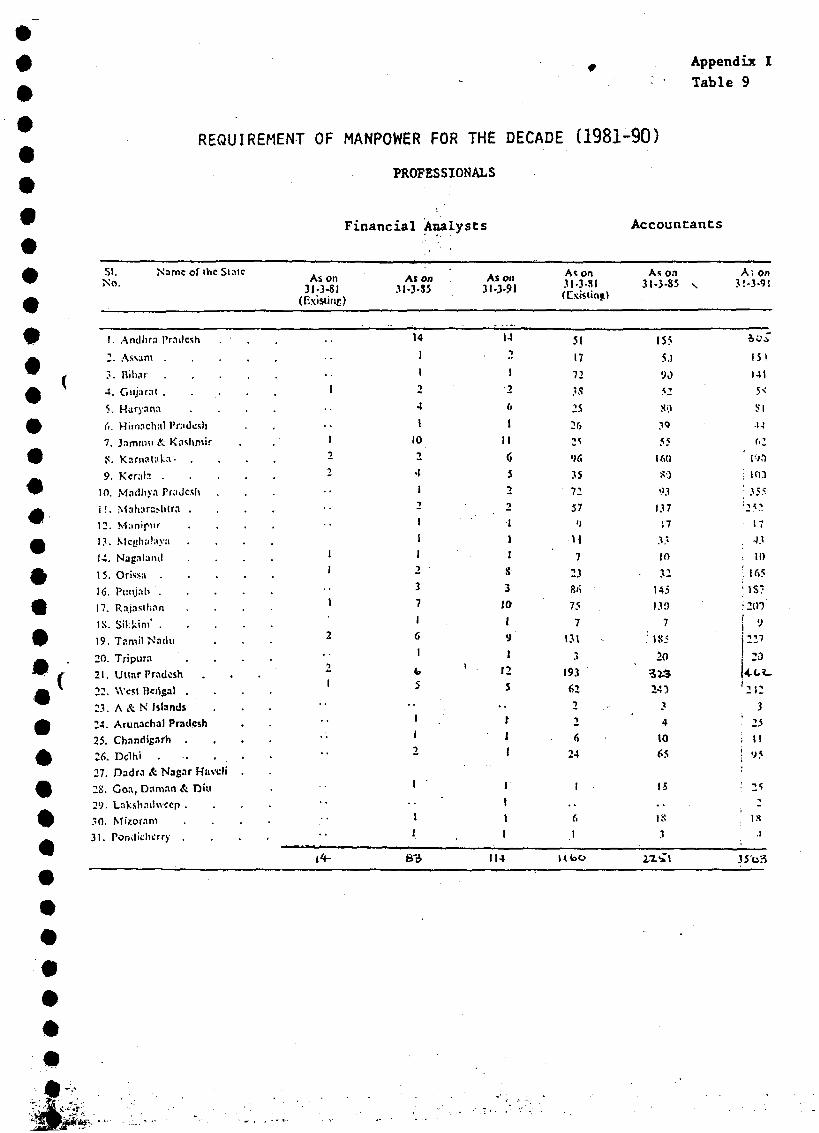
Appendix ITable 9
REQUIREMENT OF MANPOWER FOR THE DECADE (1981-90)
PROFESSIONALS
Financial Analysts Accountants
SI.No.
Name of the Stale As on31-3-8J
(Exisiinc)
As on31-3-35
As on3N3-9I
As on31-3-SI(Existing)
A* on3I-3-S5
A; on3!-3-9l
m
I••#••••m
••*
I. Andhrn Pradesh . •
2 . A s s a m
3 . B i h a r
4 . G u j a r a t . . . . .
? . H u r y a n n . . . .
(1. Himachtil Pradesh
7, Jnminii & Kashmir
S . K a r n n t a k a - . . . .
9 . K e r a l a
1 0 . M a d h y n P r a d e s h
i !. M a h a r a s h t r a . . . .
1 2 . M a n i p t i r . . . .
1 3 . M c ( ! h i i ! « y a . . . .
1 4 . N a g a b i u l . . . .
1 5 . O r i s s a
1 6 . P u n j a b
1 7 . R a j a s t h a n . . . .
I S . S i f c k i m '
1 9 . T a m i l N a d u
2 0 . T r i p u r a
2 1 . U t t a r P r a d e s h . . .
2 2 . W e s t B e r t j a l . . . .
2 3 . A & . N I s l a n d s
2 4 . A r u n a c h a l P r a d e s h
2 5 . C h a n d i g a r h . . . .
2 6 . D e l h i . . . . .
2 7 . D a d r a & N a g a r H a v c l i .
2 3 . G o a , D a m a n & D i n
2 9 . L n k s h a d w c c p . . . .
. " 0 . M i z o m n i . . . .
3 1 . P o n d i c h e r r y . . . .
1
1
2
2
• •
1
1
1
2
21
••
14-
14
I1
24
1
10
24
I• >
1
1
I
2
3
7
1
6
1
b
5
11
2
I
I
I
14
•>
126
1
11
05
2
2
•t
]
I
S
3
20
«
9
1
' 1 2
5
ri
»
i
i
i
i
114
51
17
72
.'S
2520
25
%
35
72
57'j
• H
, 7
238'i
75
7
131
3
193
62
2
2
6
24
1
• •6
.1
1555.)90
52
X;l
,1Q
55
160
S3
93
137
!7
.!.*•
10
32
145
13»
7
185
20
241
4
10
65
l i
• • -it:
3
ici"15)141
5<SI
.»-!
(>2
i 10.1
: -^s'25.7
17
•1}
10
165IS?
200
V
227
20
212
3
25
IIl>5
2 î
IS.1
S'o3
«Mars-
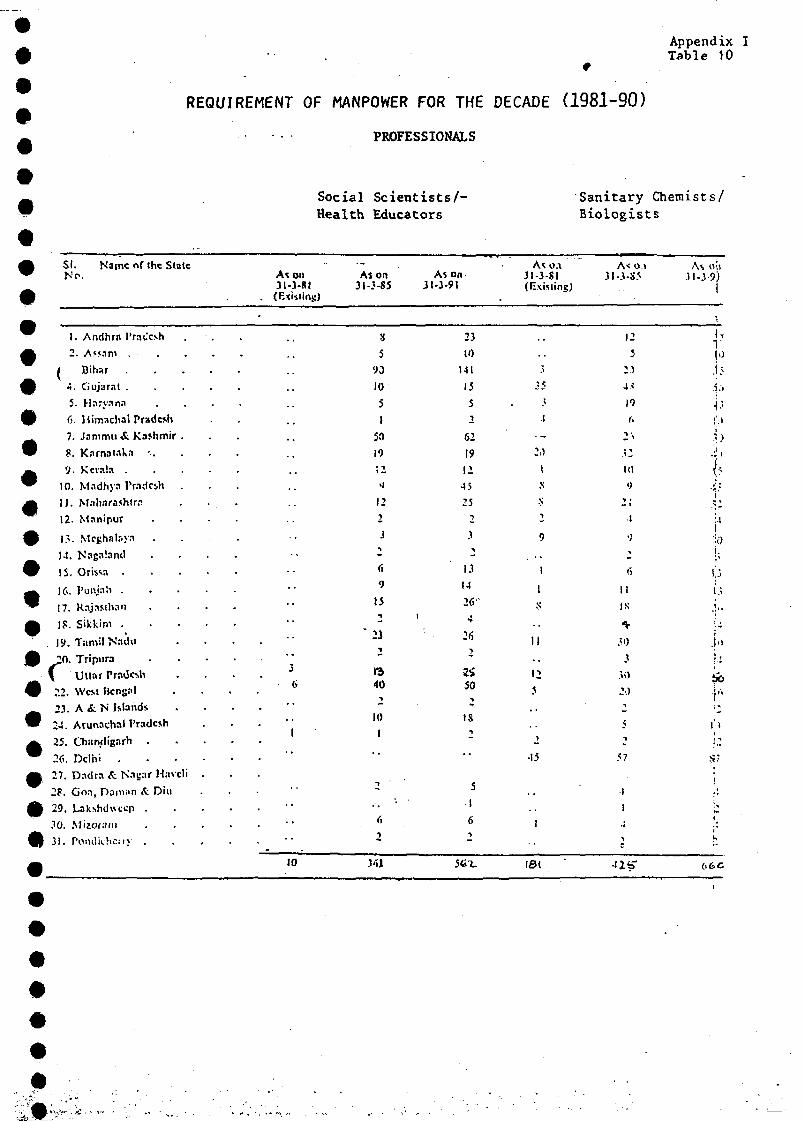
#Appendix ITable 10
REQUIREMENT OF MANPOWER FOR THE DECADE ( 1 9 8 1 - 9 0 )
PROFESSIONALS
1»1
i¥|
i
m
pA
•
•
•
•
•
•
•
•
*
•
SI. Name of the StateKo.
1 . A n d h r n l ' r a c c s h
2 . A * s a m . • .
i I 3 i h a r . . . .
A . G u j a r a t . . . .
5. Haryana
(>. Himachai Pradesh
7. Jammu & Kashmir .
g. Karnataka •..
9. Kerala . . . .
10. Madhya Pradesh
II. M.iharatht.-.-!
12. Manipur
13. Meghalnyn
) . » . N a g a i a n d
1 5 . O r i s s a . . . .
1 6 l ' u n i a ' o . . . .
1 7 . R a j a s t h a n
IV. Tamil Nadu2in. Tripura
\ Uuar Pradesh22. West HcngM23. A & N Islands24. Arunachal l'radcsh25. Chandigarh .
26. Delhi . • • •27. Dadrn & Nay"»' Havcli .2P. Go.i, Damiin & Diu
30. Siiiwiuii31, Pooilii-hcrry .
As on31-3-SI
Social Scientists/-Health Educators
As Ort As on31-3-SS 31-3-91
. (ExiitinK)
•
•
•
3
it
•
•
10
590
1051
5!)19
!2•i
12
23
-(,
')
15
2 '• 2 3
-
1340
-10
1
• •
-
«i
2
Ml
2310
141
15
52
621912
45
25t
3
213
14
26
26
zi50
-IS
-
" •
51
62
SÏT,
As o.n31-3-SI(Hxisling)
.1
.1531
201
5
•S
-
9
. . .1
1
•S
11
125,,
2•15
1
I0<
Sanitary Chemists/Biologists
A< o.i
12
5
2.1
4<
19
t.
2'.32
10
«>
2i
l
V
z« ) •
II
IS
M)}
30
Z:)
z5
257
t
1
•air
As oit31-3-9)
|
• ;
i7
11')J51'• ! • •
i
.ii
l>i
}i
i.
ù1 ;,
1
.:
2
i
2
:
6 6 C
ijfeJS
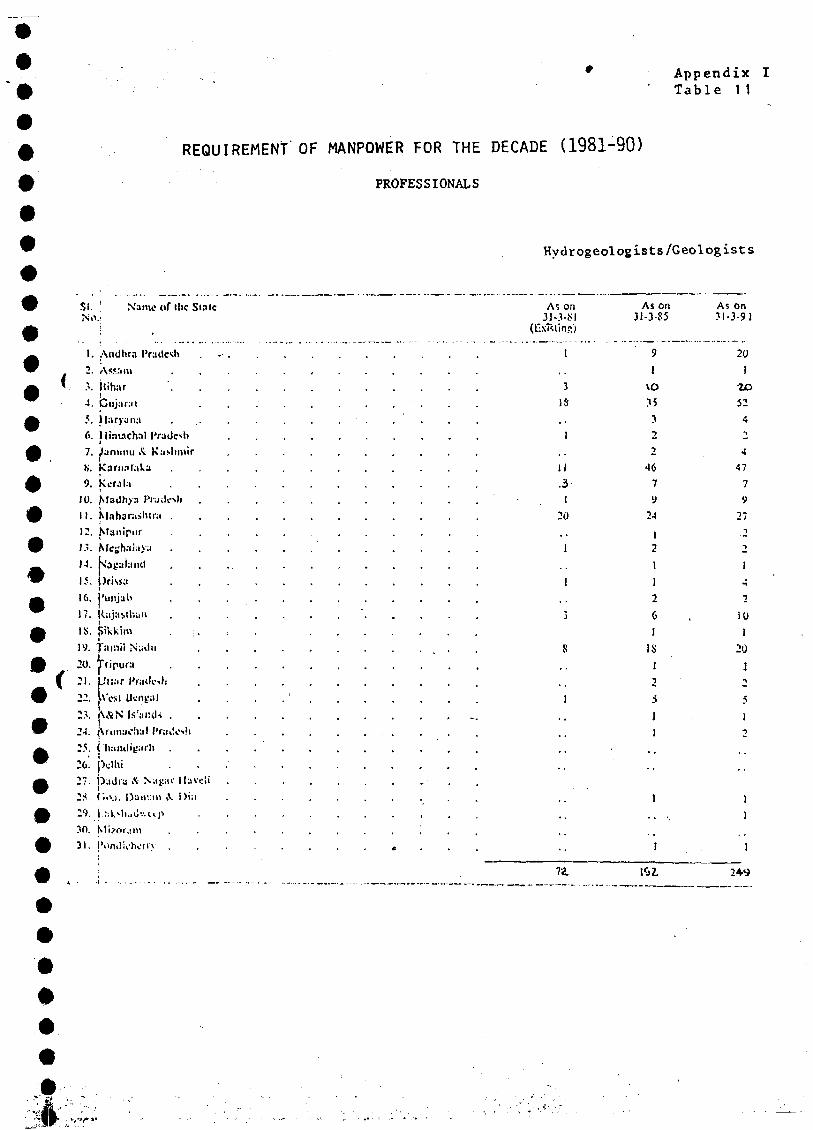
Appendix XTable 11
REQUIREMENT OF MANPOWER FOR THE DECADE (1981-90)
PROFESSIONALS
Hydrogeologists/Geologist s
si. : of I he Slate
I. AiJdlirn Pradesh
, 2. Ass:im
V .V jtihiir
-I. Cujar:ii
6.7. Junumi .<i K:iNhniir
N. Karii.il.il,^
9. Kerala
10. Msdliya J»iyJv-s)>
11. NInh3iiisliti:i .
12. Nlanipur
13. Megh.-iiiiy;i -
16. I'uiijali
17. H;ij:iMl;;iii
Jy. Xuiviii N;.i!n
20. Tripura
( 21. Jiuir22. Uesi
24. Armuichul f*r;it!c-»?«
25. ( Iiiiiiiliyjirli .
26.
27. i3:tdij & NiiiKii1 Jlavcii2S. (In.!. Dan'.-iii A Din
2'V. _|..-:k*1li.«3v.ti-p30. Mi/or.i in
31. IVimiU'hori'v .
As on3J-3-KI
(L*\ÎUins)
1
3
IS
1
11
.3I
20
1
]
j
8
É
1
As on31-3-S5
9J
»O.15
32
2
467
9
2-4
121
J2
6I
IS
]
2
5J1
As on31-3-91
20
1
•2O
52
1
4
47
7
y
27T
2
1
*
21U
1
20
1n
5
J
72. 24-9
#
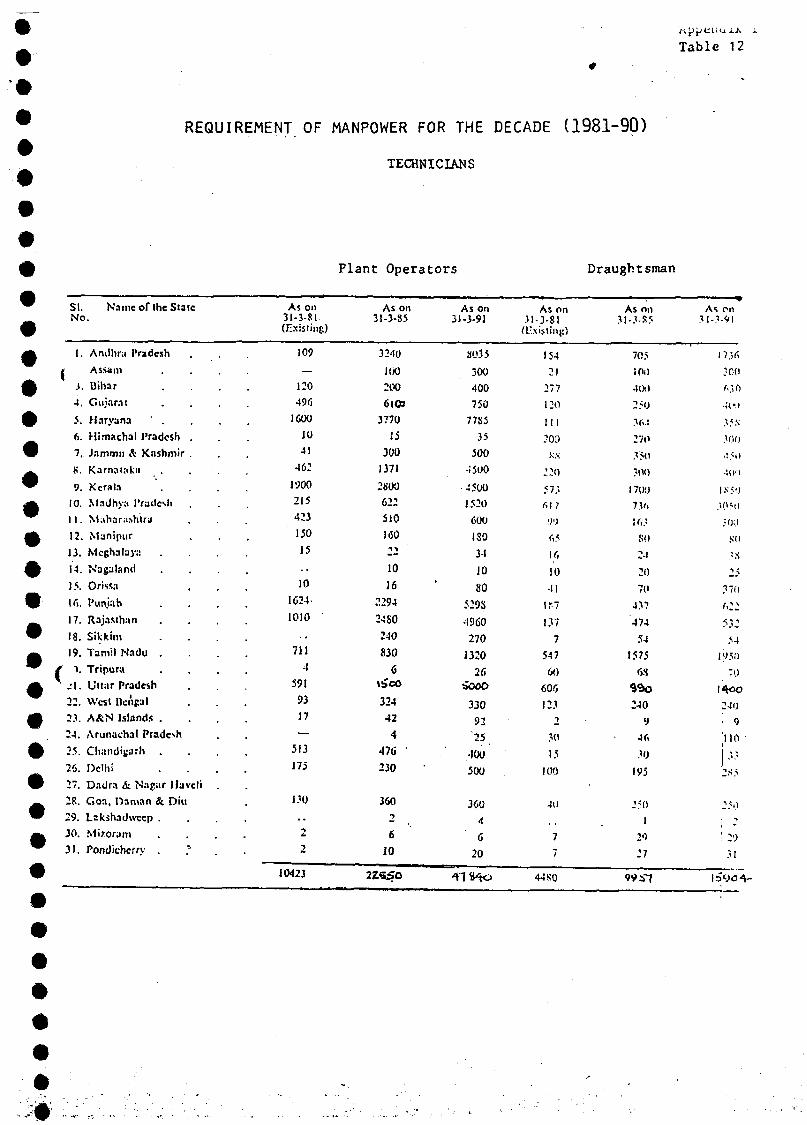
Table 12
REQUIREMENT OF MANPOWER FOR THE DECADE ( 1 9 8 1 - 9 0 )
TECHNICIANS
SI. Naine of Ihe StateNo.
1. Amlhnt Pradesh
* Assam
J. Uihar
4. Gujarat
5. Haryana
6. Himachal Pradesh .
7, Jammu A Kashmir .
K. Karnainka . , .
9. Kerala
10. Madhya Pradesh .
1 1. Maharashtra
12. Mjn ipur
13. Mcghalaj"!
14. Nagaland
)5. Orisw
16. Punjab
17. RajaMhan
18. Sikkim
19. Tamil Nadu .
i ">. Tripura
i\. LJiiar Pradesh
22. West Hcnpal
23. A & N Islands .
24. Arunachal Pradesh
23. Chandigarh .
2S. Delhi
27. Dadra & Nag;ir Havcli .
2K. Coa, Daman St. Di l i
29. Lakshadwccp .
30. Mi/.oram
31. Pondichcrry .
As on3J-3-8I(Existing)
109
—
120
496
1600
JO
41
462
1900
215
423
150
15
10
162-1
1010
711
4
591
53
J7
—513
130
22
10423
Plant Operators
As on31-3-35
32-10
100
200
6103
3770
15
300
J371
2800
622
510
160
22
10
16
2294
24S0
240
8306
324
42
4
476
230
3602
6
10
2Z*»O
As on3J-3-9J
SO35
300
•100
750
77S5
35
500
45UO
4500
J52O
600
ISO
34
10
80
529S
4960
270
1320
26•iooo
330
92
'25
•100
500
360
4
6
20
41VtO
As on.U-3-S!(L-xistinp)
154
21
277
120
I I I
200
•V.N
ro
r.17
»<>
\(,
10
41
IK7
137
7
5-17
M
60f,
1232
30
15
100
40
7
7
44 SO
Draughtsman
As o;i31-3-S5
705
iOO
4t)i)
250
.V.-1
270
350
?O<>
17t)!>
7.V.
Hi.'
SO
21
20
70
4.17
474
54
1575
6S
9do240
9
46
30
195
1
29
27
99 SI
As on31 -3-91
n:,r,30(1
.,'(•,
3* s
30O
--.5.1
.!()!!
IN;.!)
30* it
.•00
M»
3.S
25
(,::
?3:
54
I*»5.".>
: TO
I4«O240
• 9
110
I-''2S5
-
31
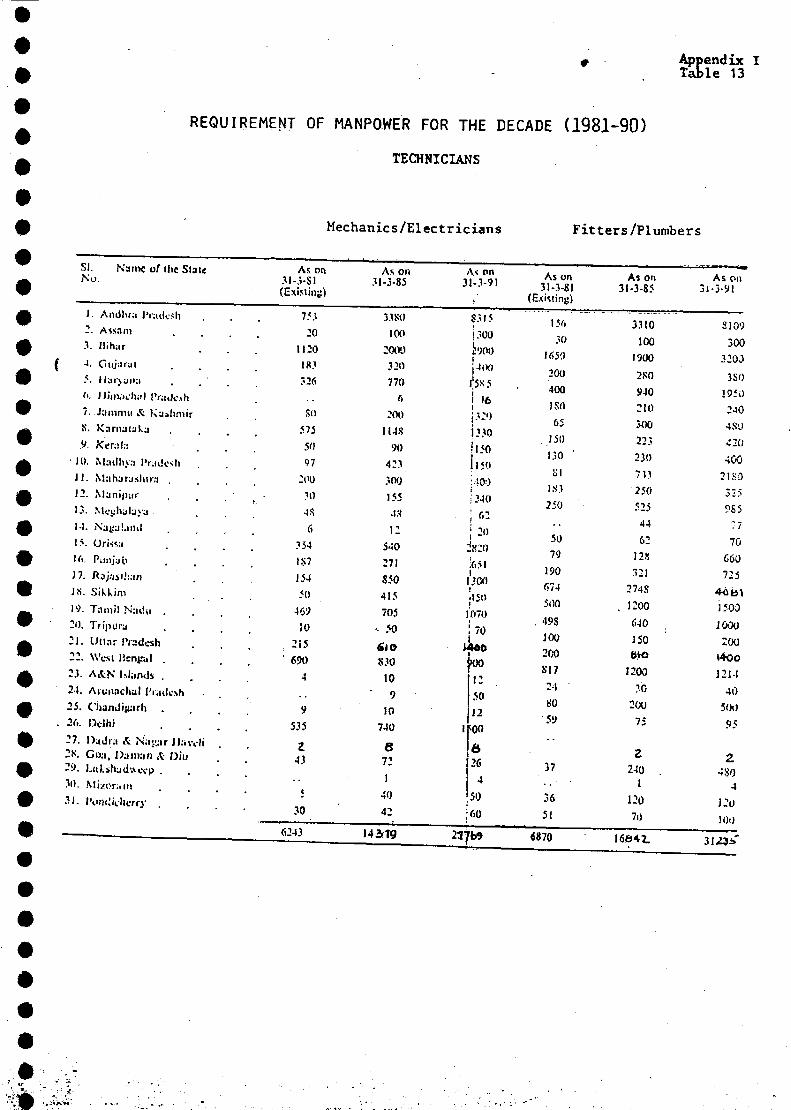
Appendix ITable 13
REQUIREMENT OF MANPOWER FOR THE DECADE (1981 -90 )
TECHNICIANS
Mechanics/Electricians Fitters/Plumbers
SI. Name of ilic SlateNu.
1. Andluii l'i'udv-^h2. Assam
3. llihar
4. Citijiirui5. ll;ir>;iii;i . . .
(>. Himuchul lV;iik->h
7. Jammu & KjihmirS. Karn.i(jt.:i.9. KenLt
10. Mailln.l IV.idosh .JJ. Maluushir.i .12. Munipur13. XU-tiluljyu14. N'a^yljiul15. Oris^a16. PunjabJ7. Rsj:mh:inJ.N. Sikkim
19. Tamil Nadu .20. Tripuru
21. l.'ttar IVadcsh
22. West lk-nt:;il .
23. A&N Maiuh .21. Aiunachul |'r;ukv>h
25. Chandigarh .
26. Delhi
27. O.idr;i .t N;i;;;ir Jlavcli .2S. Co;i, ])jin:iii A Oiu29. Ltiksha<l»v«:p .30. Mi/or;un
SI. IViM'iclicrry
As on31-3-S1
1 1— AI>'III(i/
753
-0u:o183
?26
SO
575
5097
200
30
4S
6
354
1S7
154
50
469
JO
215
' 690
4
535
Z43
* <
30
6243
As on31-3-85
33SO
100
2000
320770
ft
200
1I4S
90
423
300
155
43
i :
540
271
SW
415
705
• 50
6 ( 0S30
10
9
10
740
e721
14042
14*19
As on31-3-91
i'S315
1300
iwo1;4(Mp • • •
I'SS 5
[.6;3:<)*(330Î150
11 JO
:'(0J
;34O
i f > -i
' 20i
is:o;651
I ?(!01
•t5<)i
1070! 70
1400•00p
1
50)2
^00
626
4
50J60
As on31-3-81
(Existing)
156
30
1650
200
400
ISO
65
150
1308 !
I S3
250
50
79190
674
500
, 49S
100
200
SI7
21
SO
59
37
36
51
6870
As on31-3-85
3310
100
1900
280
940
210
300
223
230
733
250
525
44
6212K
321
274S
1:00
f>40
150
eto1200
30
200
75
Z240 .
1
120
70
1604Z
As o»31-3-91
3109
300
32OJ
3S0
1950
240
4S'J
42Û
400
2180
32?
PS5
77
70
660
725
1500
1000
:ooi4oo1214
40
500
95
Z4 SO
4
J:O
!0O
3 !,«*»'
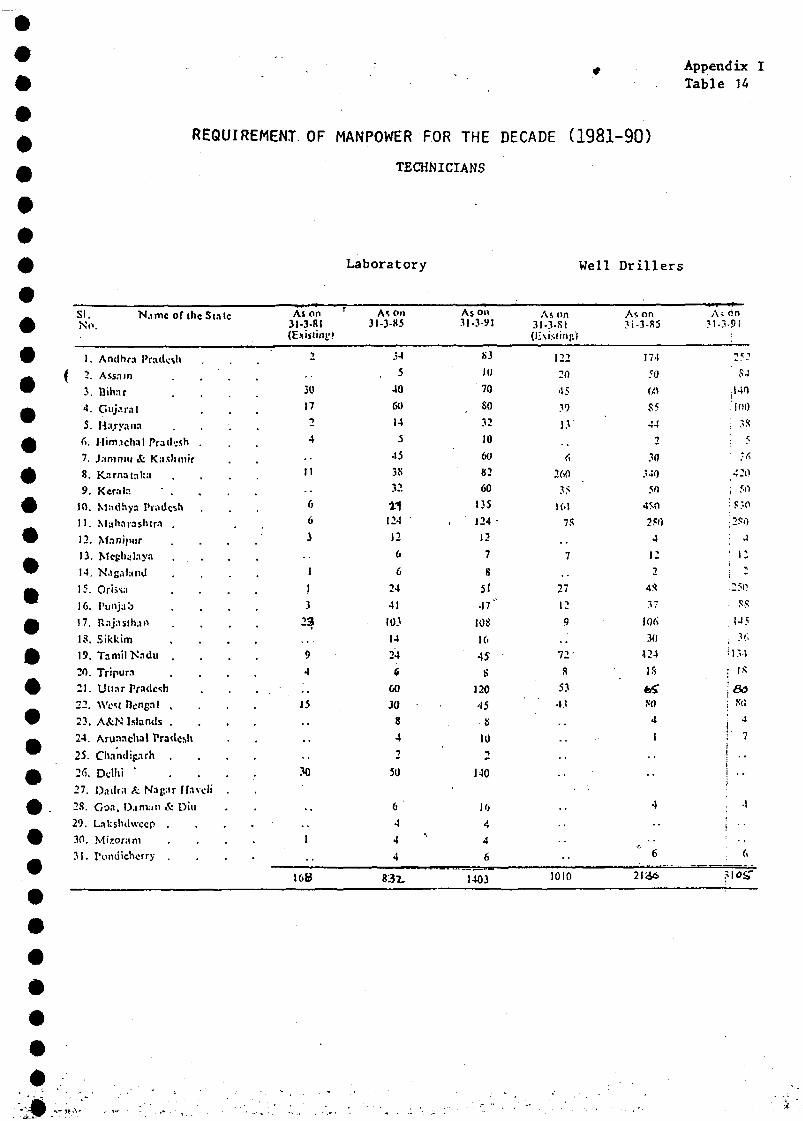
Appendix ITable 14
REQUIREMENT. OF MANPOWER FOR THE DECADE ( 1 9 8 1 - 9 0 )
TECHNICIANS
Laboratory Well Drillers
si.No.
N.ime of the Slate As on31-3-81(Existing)
As on3I-3-X5
As on31-3-91
As on3I-3-RI
As on3Ï-3-R5
As
1. Andhr.1
( 2. Assam
3. Bihar
4. Gujarat
5. Ha.ryaitafi. Hinuchal Pradesh ,7. Jam nui & Kashmir
8. Karnat.ika9. Kerala • .
10. Madhya Pradesh11. Maharashtra .12. M.inipiir13. Meglu-laya14. N.jgaland15. Oriss.i1G. Punjab17. R.-ijasdun18. Sifckiin
19. Tamil Nadu .20. Tripura21. Ultnr Pradesh22. Wtvsj Bengal ,23. A&N Islands .24. Arunachal Pradesh
25. Chandigarh .
26. Delhi '27. D.idra & Na^ir Jhv28. Can, D.iman & Din29. Lal:slul\vccp .30. Mizoram31. Ptmdichorry .
3017
II
6
6
3
1
I3
23
9
4
15
30
168
34
5
40
60
14
5
45
38
32
11124
12
6
6
24
41
10}
14
24
6
60
30
8
42
50
6
4
4
4
833.
HJ
10
70
SO
32
10
60
82
60
135
124 •
12
7
S
51
47"
/OS
16
45
S
120
45
S
10•y
140
10
4
A
6
1403
122
20
45
39
260
35
16!
73
27
12
9
72'
S
53
43
174
MS 54!2
?0340
504M)
4
i:
2
37
30
124IS
4
1
S4
;I4O
- IO0
; 3S
: 5
: *rt
;420
I M
! 2 SO
: J
' 12
1010 2136
I .w
IS
ao
4
7
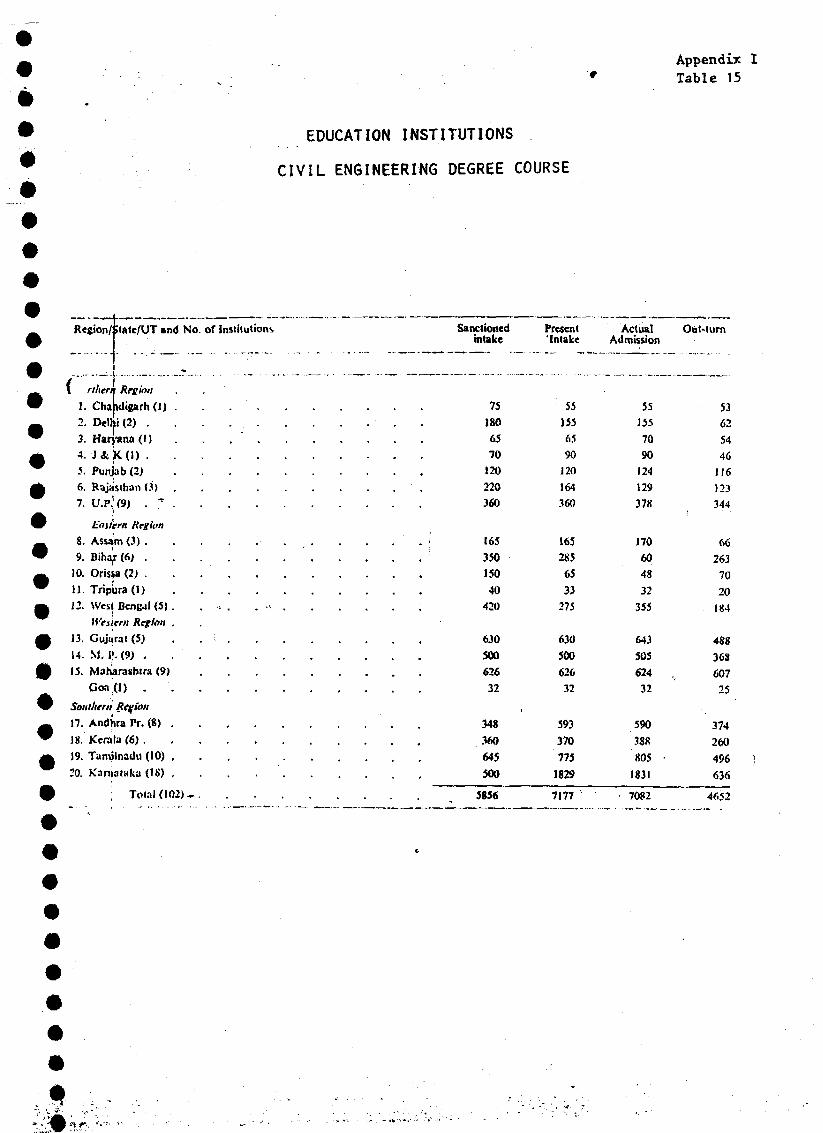
EDUCATION INSTITUTIONS
CIVIL ENGINEERING DEGREE COURSE
Appendix ITable 15
Region/ :<ale/UT and No. of Institutions Sanctionedintake
PresentIntake
ActualAdmission
Où l-l urn
rihen
1. ChaRegion
idigarh (1)rlhil2. Dell
3. Haryana (/)
4. j&k(i).5. Punjab (2)6. Rajasihan (3)7. U.PJ(9) . * .
t'nuern Reghn8. Assam (3) .9. Bihaf (6; .
10. Orisw (2; .11. Tripura(l)12. West Bcncul (5).
Western Region .13. Gujyrat (5)14. M. I». (9J . .15. Maharashtra (9)
Goafl) . .
Southern Ret/ion17. Andhra Pr. (8) ,18. Kerala (6).19. Taniilnadu (10) ,20. Karnatuka (18) .
Total (102)- .
180
65
70
120
220
360
165350150
40420
630
500626
32
348
360645
300
5856
55155
65
90
120
164
360
165
28565
33275
630
500
626
32
593
370
7751829
7177
55155
7090
124
129
378
170
60
48
32
355
643
505
624 .
32
590
388
805 •
1831
7082
53625446
116
123
344
66
263
70
20
184
488
368
607
25
374
260496636
4652
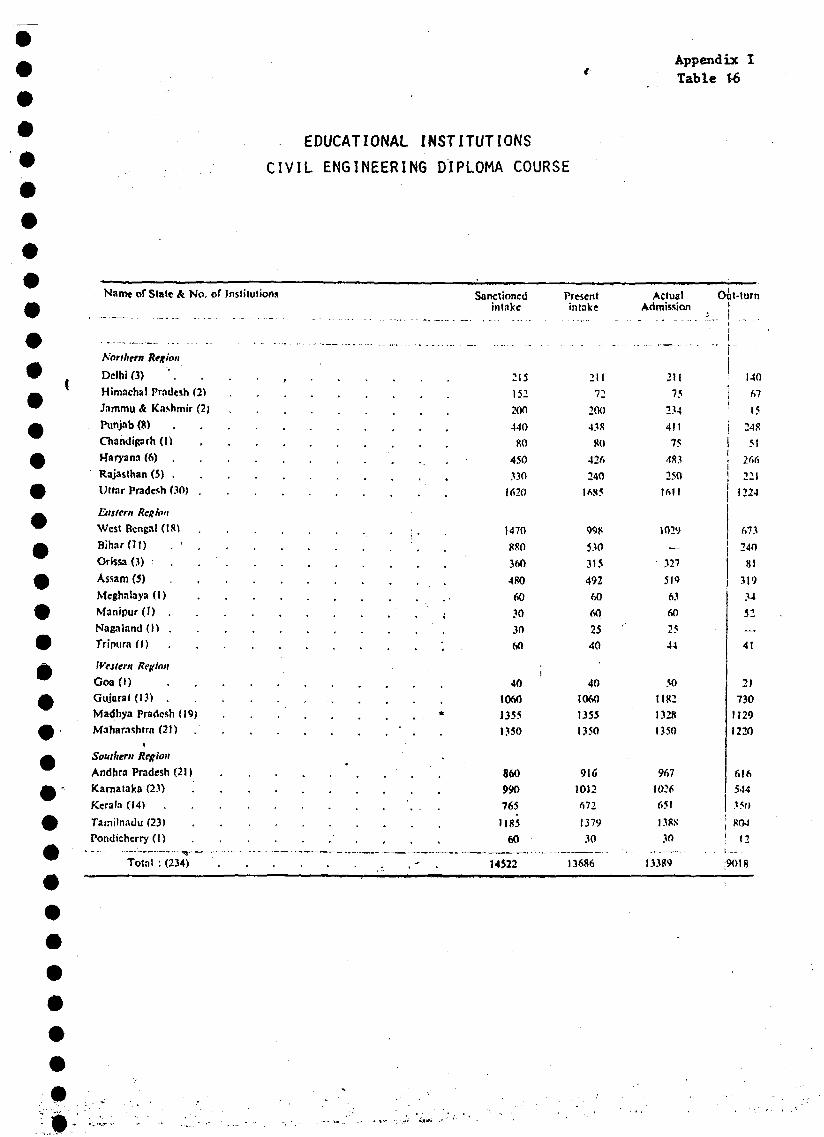
EDUCATIONAL INSTITUTIONSCIVIL ENGINEERING DIPLOMA COURSE
Appendix ITable 16
Name of Slate & No. of Institutions Sanctionedintake
Present•nlake
ActualAdmission
Oot-tum
Northern Region
Delhi (3)
Himachal Pradesh (2)
J.immu & Kashmir (2)
Punjab (8)
Chandigarh (I)
Haryana (6) .
Rajaslhan (5) .
Utfar Pradesh 0 0 ) .
Eastern Region
West Bengal (IS) .
Bihar(II)
Orissa (.1) .
Assam (5)
Nfcghnlaya (I)
Manipur(') .
Naealand(l) .
TYipura (I)
Western Region
Goa (I)
Gujarat (1.1) .
Madhya Pradesh (19)
Maharashtra (2))i
Southern Region
Andhra Pradesh (21)
Kamataka (23)
Kerala (14) .
Tainilnadu (23)
Pondichcrry (I)
215
152
200
440
80
450330
1620
1470
880
360
480
60
30
30
60
40
1060
1355
1350
860
990
765
1185
60
211
72200
43S
80
426
240
998
530
315
492
60
60
25
40
40
1060
1355
1350
916
1012
672
1379
211
75
234
411
75
483
250
Ifill
1029
327
519
63
60
25
44
50
1182
1328
1350
967
1026
651
I.18S
30
Total : (234) 14522 13686 13389
140
67
15
248
51
266
221
1224
673
240
81
319
34
52
41
21
730
M29
1220
616
544
35»
; 804
! '2i . — ...
;9OI8
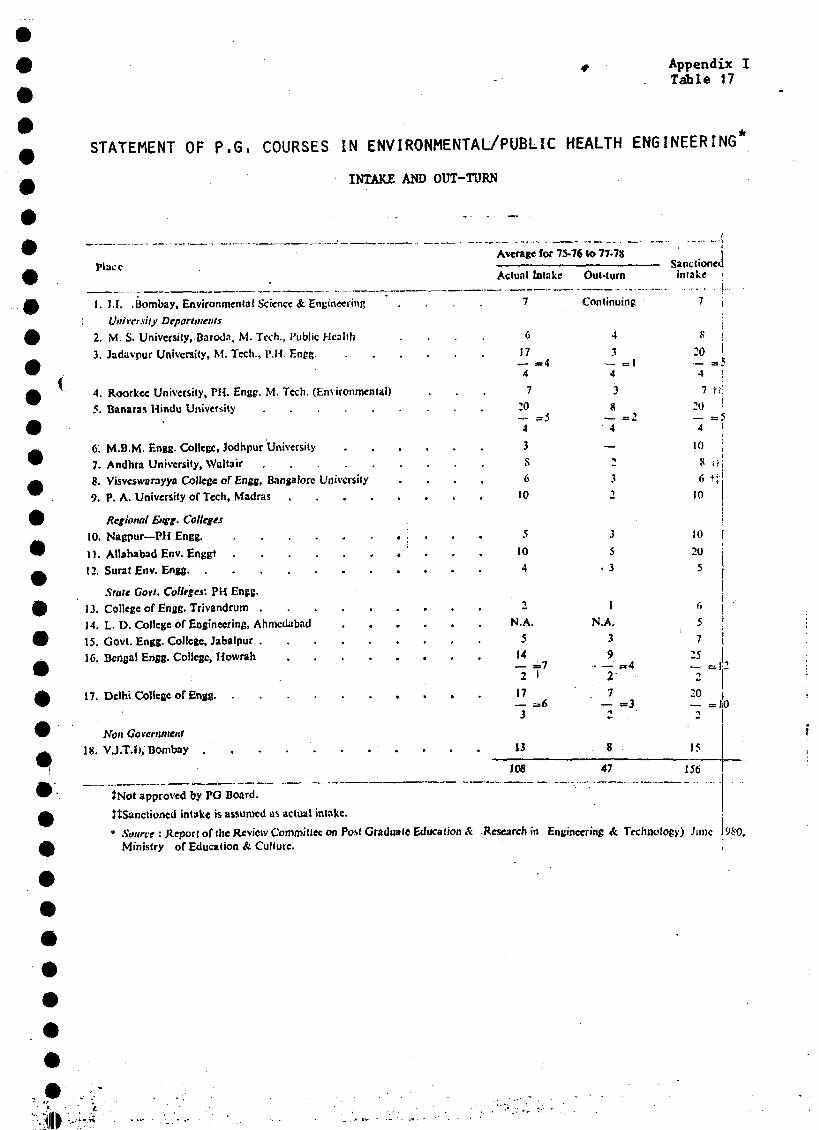
Appendix I, Table 17
STATEMENT OF P . G , COURSES IN ENVIRONMENTAL/PUBLIC HEALTH ENGINEERING*
INTAKE AND OUT-TURN
...'A v e r a g e f o r 7 5 - 7 6 1 0 7 7 - 7 8
p l a c e _ S a n c t i o n e dA c t u a l I n t a k e O u t - t u r n i n t a k e '•
ÎNot approved by PG Board.
îtSanctioncd intake is assumed as actual intake.
• Source : Jleport of the Review Committee on PcMinistry of Education & Culture.
I . I . I . . B o m b a y , E n v i r o n m e n t a l S c i e n c e <fe E n g i n e e r i n g . . . . 7 C o n t i n u i n g 7 j
: University Departments \2 . M . S . U n i v e r s i t y , B a r o d a , M . T e c h . , P u b l i c H e a l t h . . . . 6 4 K |
3 . J a d a v p u r U n i v e r s i t y , M . T e c h . , P . H . E n p g ' 7 3 M
4 4 4 |
4 . R o o r k e c U n i v e r s i t y , P H . E n g g , M . T e c h . ( E n v i r o n m e n t a l ) . . . 7 3 7 t i5 . B a n a r a s H i n d u U n i v e r s i t y - 0 8 ~(> i
— = 5 •— = 2 — —>4 4 4 i
6: M . B . M . E n g g . C o l l e g e , J o d h p u r U n i v e r s i t y 3 — 10 ;7 . A n d h r a U n i v e r s i t y , W a l l a i r S 2 S •»*!8. V i s v c s w a r a y y a C o l l e g e o f E n g g , B a n g a l o r e U n i v e r s i t y . . . . 6 3 69 . P . A . U n i v e r s i t y o f T e c h , M a d r a s 10 2 10
Regional Engg. Colleges
10. Nagpur—PH Engg. 5 3 10
11. Allahabad Env. Enggt 10 5 20
12. Surat Env. Engg 4 • 3 5
State Gort. Colleges'. PH Engg.
13. College of Engg. Trivandrum
14. L. D. College of Engineering, Ahmedabad . . . .
15. Govt. Engg. College, Jabalpur
16. Bengal Engg. ColJcgc, Howrah
17. Delhi College of Engg. . .
Non Government18. V.J.T.fi, Bombay . . , - - . .
2N.A.
514
1 T7
17— =63
13
JOS
<. Research in Enci
1N.A.
39
7~ =3
8
47
ncerinc & Techno
ft57
25— =1
220
15
156
loev) June
0
980
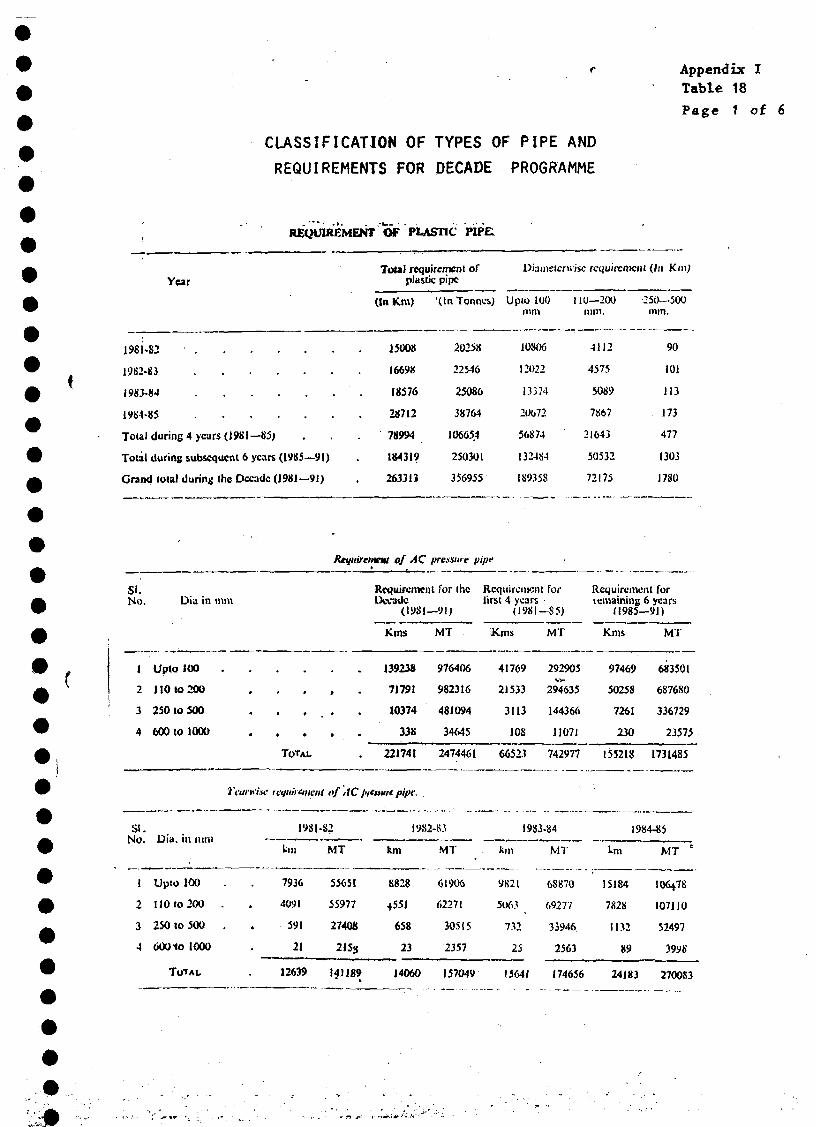
CLASSIFICATION OF TYPES OF PIPE ANDREQUIREMENTS FOR DECADE PROGRAMME
Appendix ITable 18
Page 1 of 6
REQUIREMENT OF PLASTIC PIPE,
Year
1981-82
1982-83
1983-84
1984-85
Total during 4 years (J981—85)
Total during subsequent 6 years (1985—91)
Grand total during the Decade (J98I—91)
Diameicnvisc requirement (In Km;Total requirement ofplastic pipe
(In Km) '(In Tonnes) Upio 100 110—200 250—500mm mm. mm.
J5OO8
16698
18576
28712
78994
184319
263313
20258
22546
25086
38764
10665.4
250301
356955
10806
12022
13374
20672
56874
I324S4
IS935S
4112
4575
5089
7867
21643
50532
72175
90
101
113
173
477
1303
1780
of AC press/we pipe
si.No.
1
2
3
4
SI.No.
1
2
3
4
Dia in mm
Upto 100
110 to 200
250 10 500
600 to 1000
Dia. in mm
Upio 100
110 to 200 .
250 lo 500 .
6001o I000
TOTAL
r . 9
* * f
• • •
TOTAL
• *
•
Requirement Tor (heDecide
(1981—91)
Kms
139238
71791
10374
338
22174I
irn'w requiriimnl of AC j'r'twrt pipe.
19SJ
km
7936
4091
591
21
12639
•82
MT
55651
55977
27408
141189
MT
976406
982316
481094
34645
2474461
1982-8.1
km
8828
4551
658
23
14060
MT
61906
62271
30515
2357
157049
Requirement forJirst 4 years .•
(1981—S 5)
JCms
41769
21533
3113
108
66523
MT
292905
294635
144366
J1071
742977
1983-84
9K2I
5063
7.12
25
15641
MT
68870
69277
33946
2563
174656
Requirement Torremaining 6 years
(1985—91)
Kms
97469
50258
7261
230
15521S
1984
tm
15184
7828
1132
89
24183
MT
683501
687680
336729
23575
1731485
-85
MT E
IO6478
107110
52497
3998
27OOS3
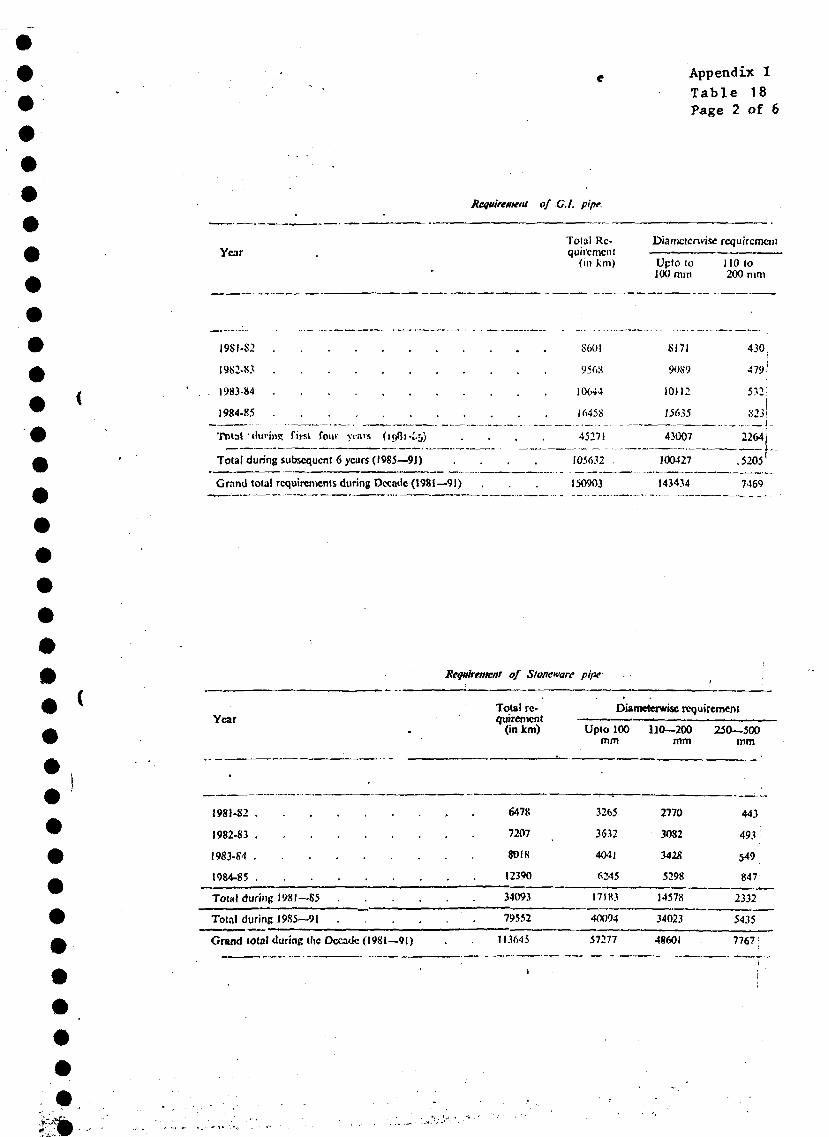
Appendix ITable 18Page 2 of 6
Requirement of C.I. pipe.
YearTotal Rc-quiiemcnl
(in km)
Diamcicrwise requirement
Upto to100 mm
110 lo200 mm
1981-82
1982-83
1983-84
1984-85
'filial ' during first four years
Total during subsequent 6 years (J985—9J)
Grand total requirements during Decade (1981—91)
S60!
956S
10644
I645S
45271
105632 .
150903
S171
9089
10J12
15635
43007
100427
143434
430,
47!».'
532:
S23i1
2264 j
.5205'
7469
Requirement of Stoneware pipe
Year
198I-S2
1982-83
J983-84
1984-85
Tola» during 1981 —85
Total during 1985—91
Grand total during (he Decade (1981—91)
Total re-quirement
(in km)
6478
7207
3018
12390
34093
79552
1136-15
Diameterwise requirement
Upio 100mm
-
12b5
3632
4041
M4S
171 K.I
40094
57277
no—2oomm
2770
3082
3428
5298
14578
34023
48601
250—500mm
443
493
549
847
2332
5435
7767:
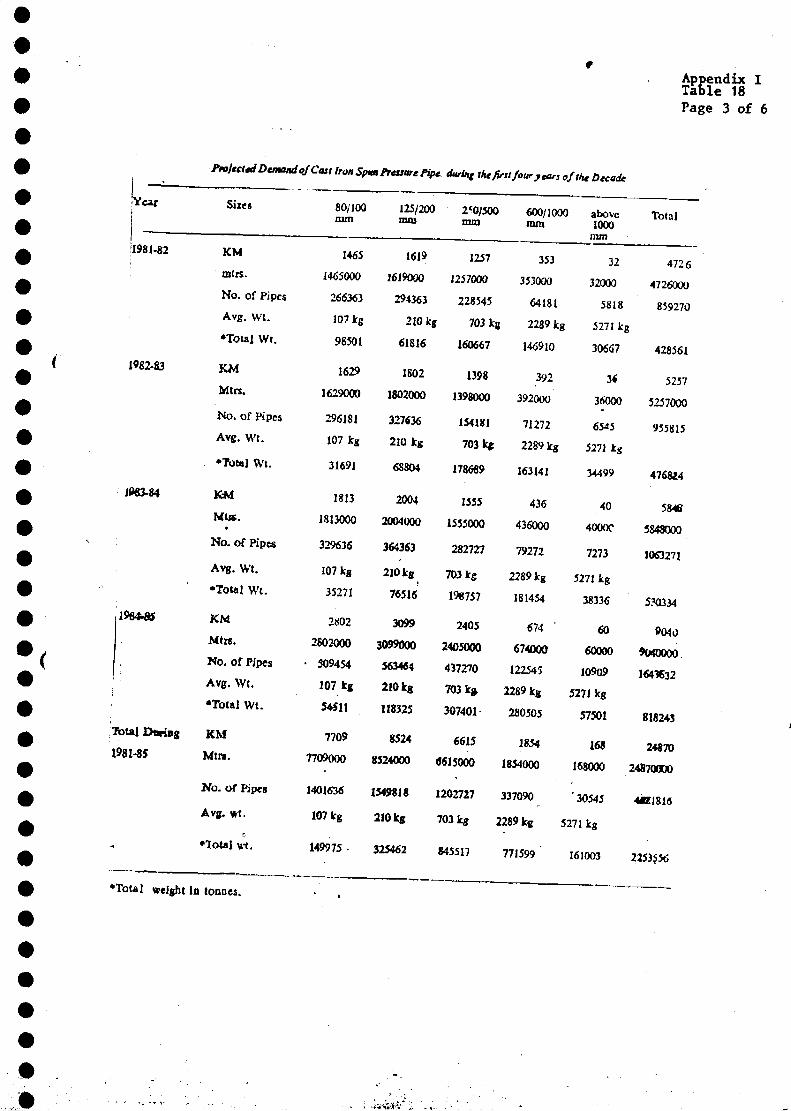
Appendix ITa&le 18Page 3 of 6
Year Sizes
J1981-82 KM
mtrs.
No. of Pipes
Avg. Wt.
•Total Wt.
l«82-a3 KM
Mtrs.
No. of Pipes
Avg. Wt.
•TVjtol Wt.
083-84 KM
Mtœ.*
No. of Pipes
Avg. Wt.
•Total w t .
198*8tf KM
: Mtrs.
No. of Pipes
Avg, Wt.
•Total Wt.
Total During KM
1581-85 Mtra.
No. of Pipes
Avg. wt.
• lou l wt.
80/100mm
1465
1465000
266363
107 kg
98501
1629
1629000
296181
107 kg
31691
1813
1813000
329636
107 kg
35271
2802
2803000
• 509454
107 kg
54511
7709
7709000
1401636
107 kg
149975 •
125/200 2^0/500moi mrH
1619
1619000
294363
1257
1257000
228545
210 kg 703 kg
61816
1S02
1802000
327636
210 kg
6SS04
2004
2004000
364363
210 kg
76516
3099
3099000
563464
210 kg
118325
8524
8524000
1549818
210 kg
325462
160667
1398
1398000
154181
703 k*
178669
1555
1555000
282727
703 kg
198757
2405
2405000
437270
703 k»
307401
6615
«615000
1202727
600/1000mm
353
353000
64181
2289 kg
146910
392
392000
71272
2289 kg
163141
436
436000
79272
2289 kg
181454
674 '
674000
122541
2289 kg
280505
1854
1854000
337090
above1000
mm
32
32000
5818
5271 kg
30667
3*
36000
65*5
5271 kg
34499
40
4000C
7273
5271 kg
38336
60
60000
10909
5271 kg
57501
168
168000
' 30545
703 kg 2289kg 5271kg
845517 771599 I61OO3
Total
4726
4726000
859270
428561
5257
5257000
955815
4768*4
5846
584SOOO
1063271
530334
9040
tofDOOO
164Î632
81824S
24870
24870000
44E1816
2253556
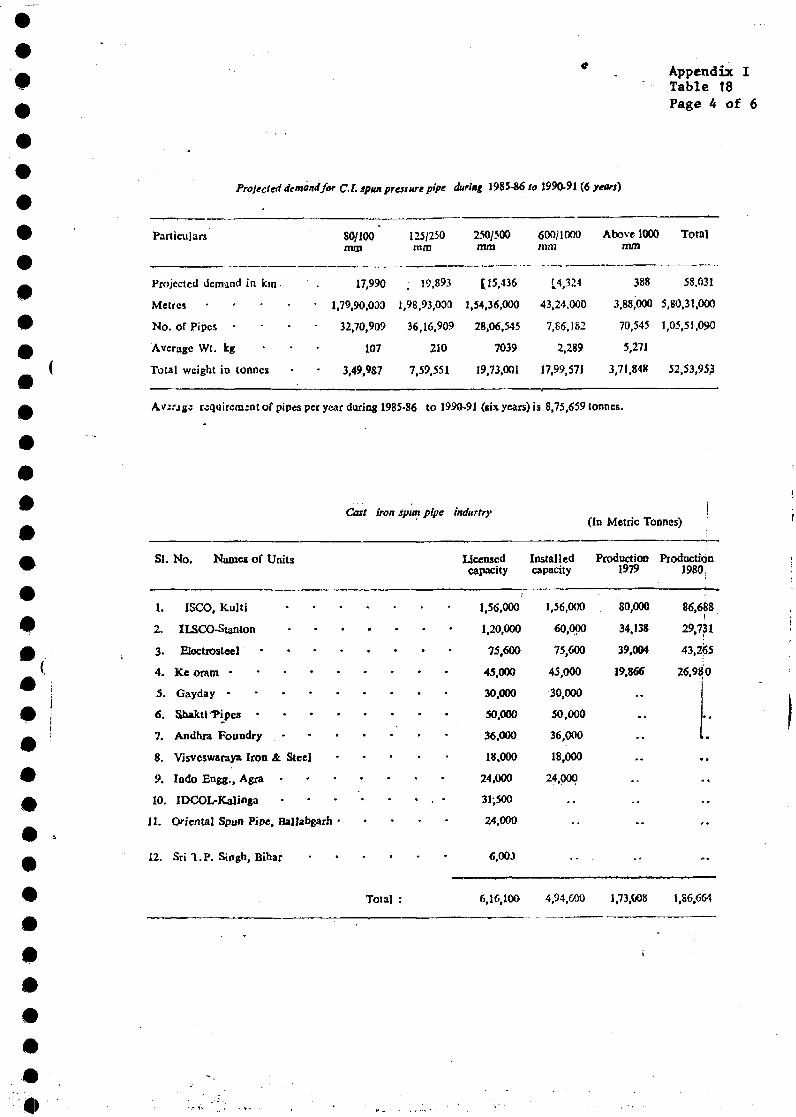
Appendix ITable 18Page 4 of 6
Projected demand for C.I. spun pressure pipe during I985-S6 to 1990-91 (6 years)
Particulars
Projected demand in kin
Metres . . . .
N o . of Pipes
Average W(. kg
Total weight in tonnes
80/100nun
17,990
• 1,79,90,033
32,70,909
107
3,49,987
125/250mm
19,893
1,98,93,033
36,16,909
210
7,59,551
250/500mm
[15.436
1,54,36,000
28,06.545
7039
19,73,001
600/1000mm
14,324
43,24.000
7,86,182
2,289
17,99,571
Above 1000mm
388
3,88,000
70,545
5,271
3,71,848
Total
58.031
5,80,31,000
1,05,51,090
52,53,953
Avjrjgj wquircrasnt of pipes per year during 1985-86 to 1990-91 (six years) is 8,75,659 tonnes.
Cast iron spun pipe indurtry(In Metric Tonnes)
SI. No. Names of Units Licensed Installed Production Pi eductioncapacity capacity 1979 1980:
1. ISCO, Kultj
2. ILSCO-Stanlon
3. Etectrosteel •
4. Kc orarn •
5. Gayday •
6. Shakti^Pipes •
7. Andhni Foundry •
8. Visveswaraya Iron & Steel
9. Indo Engg., Agra •
10. IDCOL-Kalinga
11. Oienta] Spun Pipe, Ballabgarh
12. Sr i i .P . Singh, Bihar
1,56,000
1,20,000
75,600
45.000
30,000
50,000
36.000
18,000
24,000
31,500
24,000
1,56,000
60,000
75,600
45,000
30,000
50,000
36,000
18,000
24,000
..
80,000
34,138
39,004
19,866
• -
• •
- •
. .
- -
. .
86,683
29,731
43,265
26,980
.
« *
• -
6.00J
Total : 6,16,100 4,94,600 1,73,008 1,86.664
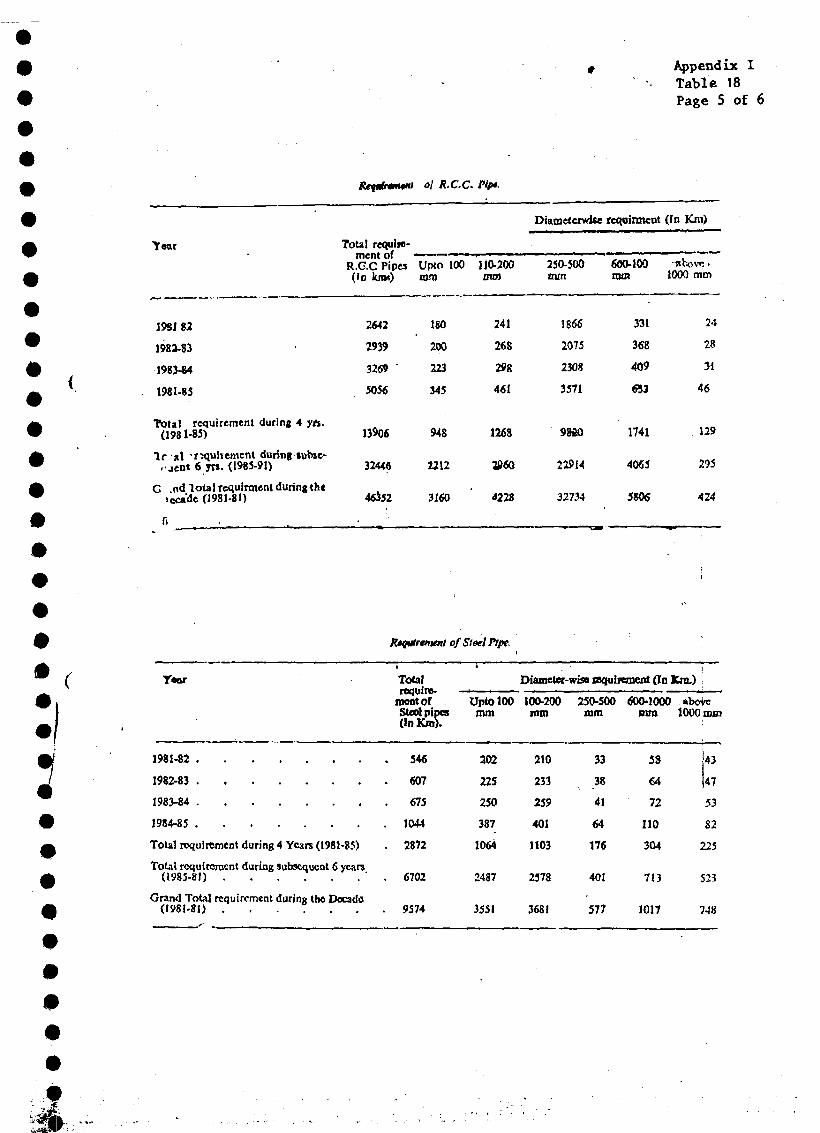
Appendix ITable 18Page 5 of 6
o] R.C.C. Pip*.
Diameterwicc requinncnt (In Km)
TTwir Total requlie-m e n t o f — — • • — - •>• • '" •
R.GC Pipes Upto 100 110-200(ïo kraft) rom mo)
250-500mm
600-100nun
••sfcovt: •1000 mm
196182
1983-83
I983-84
1981-85
Total requirement during 4 y/s.(1981-85)
I f s i -requirement during lubse-• jent 6 yn . (1985-91)
C nd lota l requinnent during the>ccade 0981-81)
2642
2939
32(59 "
5056
13906
32446
46352
ISO
200
223
345
948
2212
3160
241
268
2»8
461
1268
2060
4228
1866
2075
2308
3571
98ft0
22914
32734
331
368
409
«53
1741
4065
5BO6
24
28
M
46
129
295
424
TOOT
Rêqutremtnt of Steel Ptpt
Total Dianetcr-wisB «juirement (In Km.)require- —• • —•— ^—i .
moot o f Upto 100 100-200 250-500 «XM0OO aboveStool pipes nun mm mm m m 1000 m m(In Km) .
1981-82 546 202 210 33 58 43
1982-83 607 225 233 38 64 47
1983-84 675 250 259 41 72 53
1984-85 1044 387 401 64 110 82
Total requirement during 4 Years (1981-85) . 2872 1064 1103 176 304 225
Total requirement during subsequent 6 years(1985-81) ' . 6702 2487 2578 401 713 523
Grand Total requirement during the Docado(1981-81) 9574 3551 3681 577 1017 748
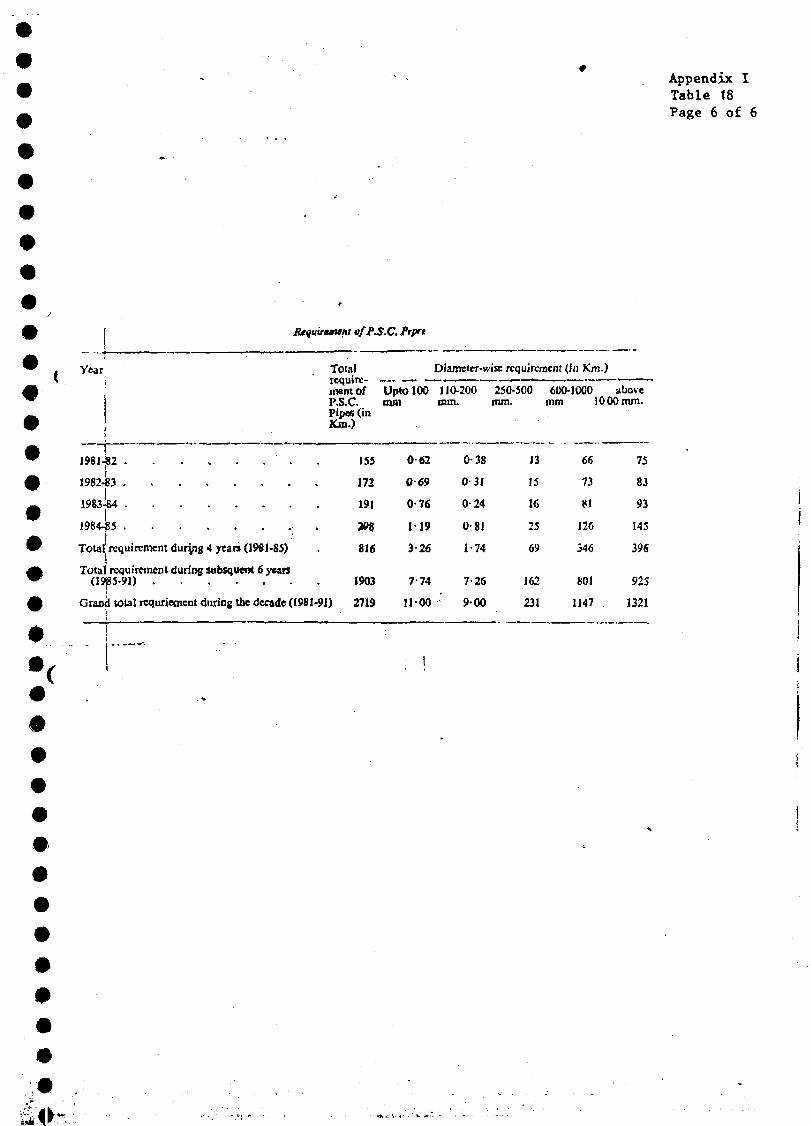
Appendix ITable 18Page 6 of 6
#
#
.C. Prprt
Year Totalrequire-ment ofP.S.C. mmPipes (inKm.)
Diameter-wise requirement <Jn Km.)
UptOlOO 110-200mm.
250-500mm.
600-1000 abovemm 1000 mm.
1981-J82 . 155 0 « 0-38 13
1982-83 172 0-69 0-31 15
1983-84 191 0-76 0-24 16
1984-85 , : m I-19 0-81 25
Total requirement duryjg 4 years (1981-85) . 816 3-26 1-74 69
Total requirement during subsquent 6 y*an(1985-91) 1903 7-74 7-26 162
Grand total icqurietncnt during the decade (1981-91) 2719 1100 9-00 231
66
73
VI
126
346
801
1147
75
83
93
145
39S
925
1321
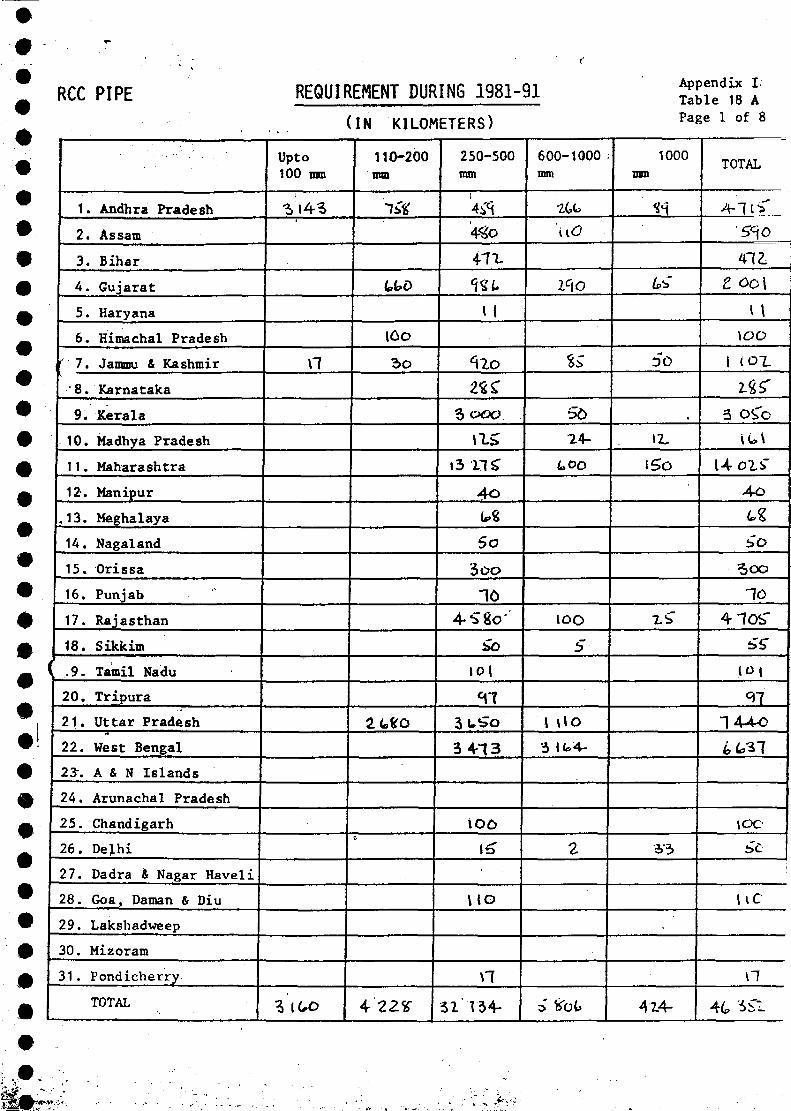
0
#
RCC PIPE REQUIREMENT DURING 1981-91(IN KILOMETERS)
Appendix ITable 18 APage 1 of 8
1. Andhra Pradesh
2. Assam
3. Bihar
4. Gujarat
5. Haryana
6. Himachal Pradesh
7. Jammu & Kashmir
8. Karnataka
9. Kerala
10. Madhya Pradesh
11. Maharashtra
12. Manipur
,13. Meghalaya
14. Nagaland
15. Orissa
16. Punjab
17. Rajasthan
18. Sikkim
, 9 . Tamil Nadu
20. Tripura
21 . Uttar Pradesh
22. West Bengal
23-. A & N Islands
24. Arunachal Pradesh
25. Chandigarh
26. Delhi
27. Dadra & Nagar Haveli
28. Goa, Daman & Diu
29. Lakshadweep
30. Mizoram
31. Fondicherry
TOTAL
Upto100 mm
n
3 IC-O
110-200
4>fct>
4-22Ï
250-500
4#o
41X
l 1
<\lo
i3 IK
4 o
5o
3ùo
10
bb
10 t
3 4-13
\€
H O
M
31 T34-
600-1000
'no
v\o
%S
50
24-
L>OO
S
\ \\o
2
1000nsn
So
»
• 4 3
414-
TOTAL
2 Ool
I I
I O Û
1 tox
3 OiTo
14- oli"
4-û
t «
5oo
1 0
bS"
to »
144-0
uc
\1
• * - , • :
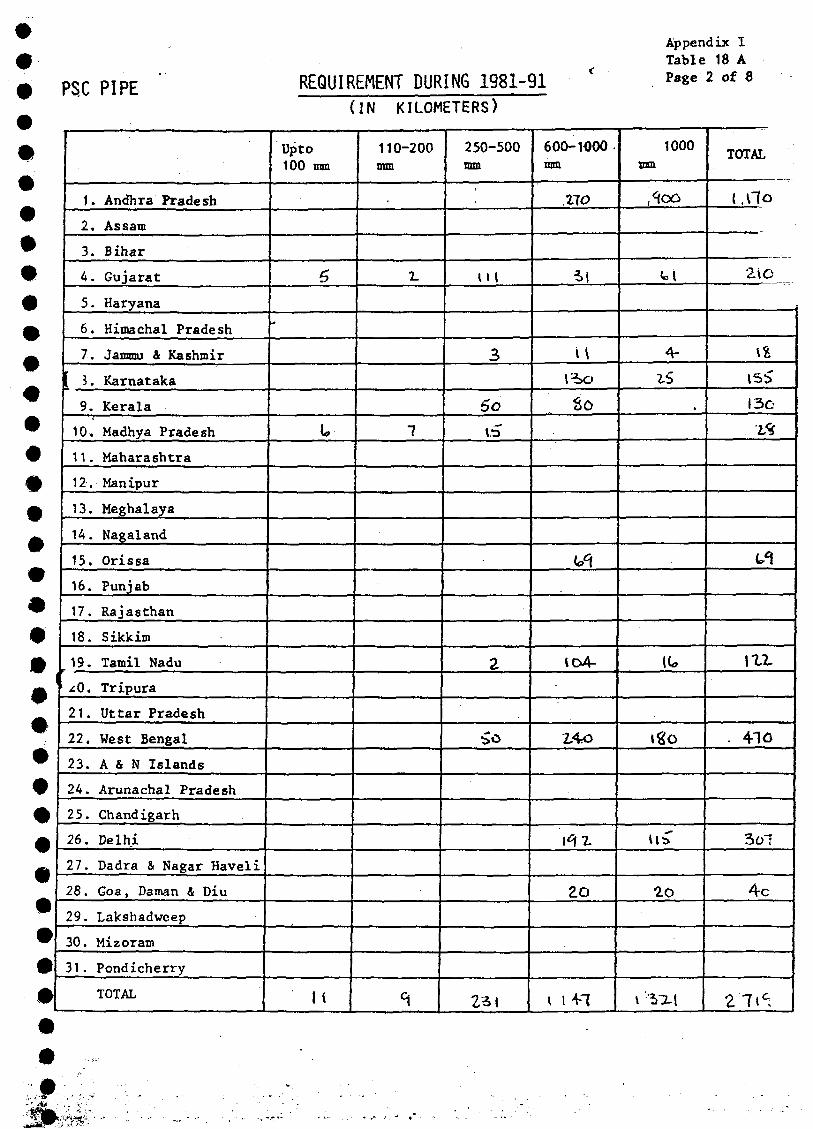
PSC PIPE REQUIREMENT DURING 1981-91(IN KILOMETERS)
Appendix ITable 18 APage 2 of 8
1. Andhra Pradesh
2. Assam
3. Bihar
4. Gujarat
5. Haryana
6. Himachal Pradesh
7, Jammu & Kashmir
3. Karnataka
9. Kerala
10., Madhya Pradesh
11. Maharashtra
12. Manipur
13. Meghalaya
14. Nagaland
15. Orissa
16. Punj ab
17. Rajasthan
18. Sikkim
19. Tamil Nadu
zO. Tripura
21. Uttar Pradesh
22. West Bengal
23. A & N Islands
24. Arunachal Pradesh
25. Chandigarh
26. Delhi
27. Dadra & Nagar Haveli
28. Goa, Daman & Diu
29. Lakshadweep
30. Mizoram
31. Pondicherry
TOTAL
Opto100 mm
•
II
110-200
7
<i
250-500
3
SoitT
Z
io
600-1000
X1O
il
w
So
IO4-
MZ
2O
1000
,<foo
tl
4-
#
It,
«go
TOTAL
( ,Uo
l£
ISÎ
I3O
m
. 410
4c
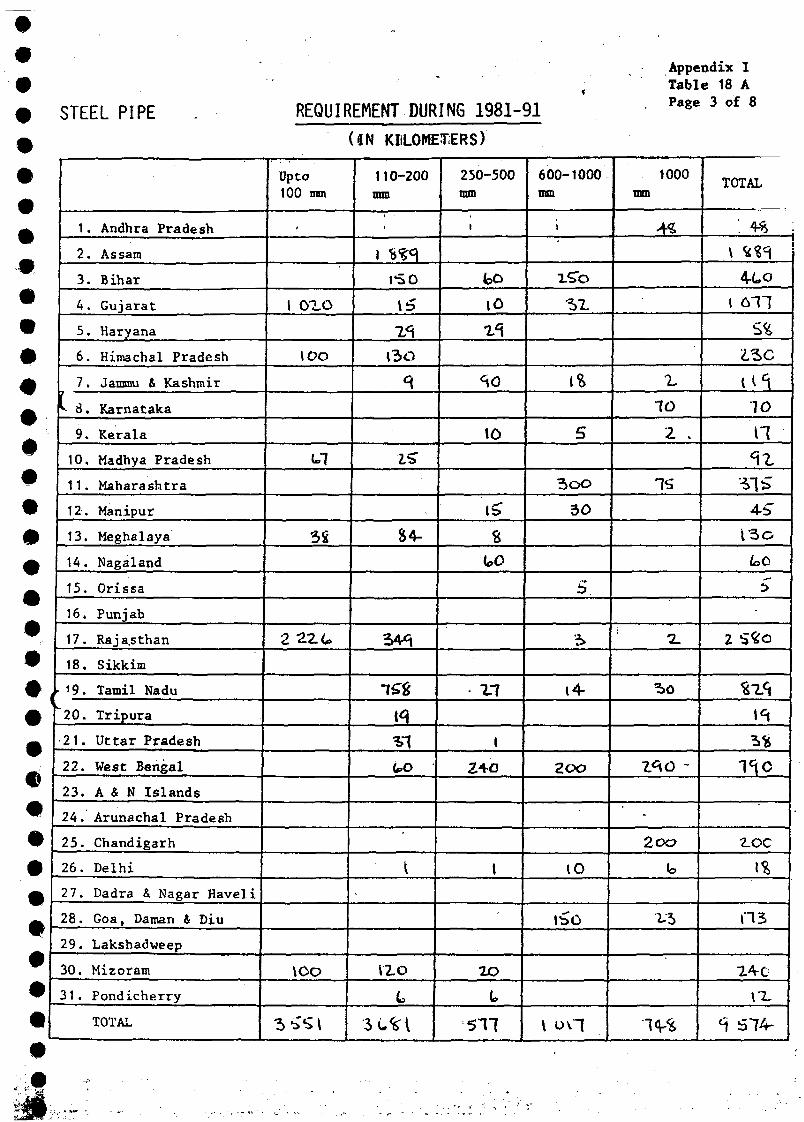
•
#
STEEL PIPE REQUIREMENT DURING 1 9 8 1 - 9 1(UN KIiLOMET;ERS)
Appendix ITable 18 APage 3 of 8
1. Andhra Pradesh
2. Assam
3. Bihar
4. Gujarat
5. Haryana
6. Himachal Pradesh
| 7. Jammu & Kashmir
K 8. Karnataka
9. Kerala
10. Madhya Pradesh
11. Maharashtra
12-. Manipur
13. Meghalaya
14. Nagaland
15. Orissa
16. Pun j ab
17. Raj a.s than
18. Sikkim
•19. Tamil Nadu
20. Tripura
2 1 . Uttar Pradesh
22. West Bengal
23. A & N Islands
24. Arunachal Pradesh
25. Chandigarh
26. Delhi
27. Dadra & Nagar Haveli
28. Goa, Daman & Diu
29. Lakshadweep
30. Mizoram
3 1 . Pondicherry
TOTAL
Up to100 mm
1 O Z O
(-1
3 S
2 2ZC
ICO
110-200
ISO
\6
Z<\13O
IS
CO
i
izoL
250-500nun
i
loO
\O
^ £ î
i
24O
»
2O
L
517
600-1000fffiT)
i
IS
S
30
5
1000Hsu
X
TO
2 .
l*î
2-'5
TOTAL
J o i l
TO
i l<\Z
4 b
I5o
2 5«C
l'tc
•Z-OC
IS
ZA-C
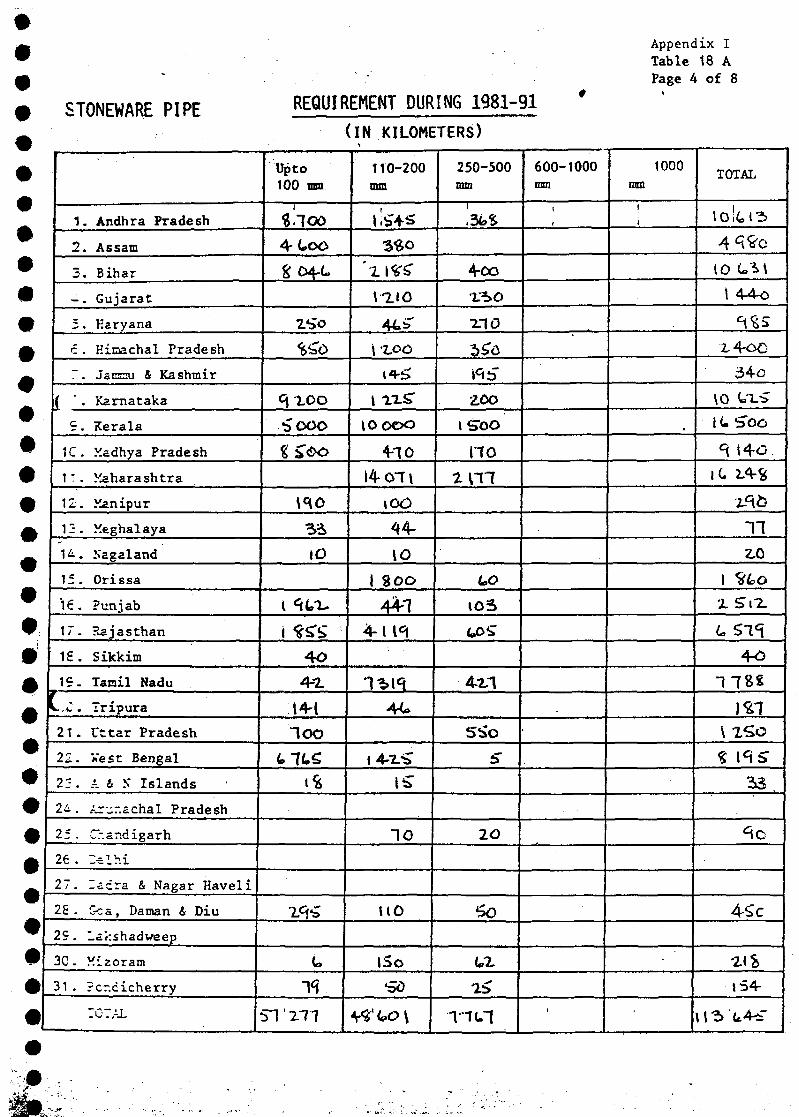
Appendix ITable 18 APage A of 8
STONEWARE PIPE REQUIREMENT DURING 1 9 8 1 - 9 1
1. Andhra Pradesh
2. Assam
3 . Bihar
- . Gujarat
5 . Karyana
c . Hinachal Pradesh
T. Janszu & Kashmir
( ' . Kamataka
9. Kerala
1C. Madhya Pradesh
1T. Maharashtra
12. Manipur
12. Keghalaya
1^-. ^agaland
15. Orissa
'16. Punjab
17. Kajasthan
1£. Eikkim
M£* Taroil Nadu
K-.C . Iripura
2T. t t t a r Pradesh
22. nest Bengal
23 . A & X Islands
2 i . Arunachal Pradesh
25. Chandigarh
26. Delhi
27. lacra & Nagar Haveli
25 . Gca, Daman & Diu
2Ç. lakshadweep
3C. Mizoram
31 . rcr.cicherry
TG7AL
Upto100 mm
%.looA-Loo
S: 04-L
c\xoobOOO
S i
JO
i ^S"S
4o4-7.
t4-l7OO
t7te
Û
S 7 ' 2 7 7
(IN KILOMETERS)
110-200
mo445*
» -Z.OO
i axs"10000
4-70
14-07»
\0O
44-10
1 800
4474-1 11
4<*
«4-7-^
7 0
HO
I5o
'où
250-500
4-cox-io
XI0
zoois-oo
no
1 0 3
4-Vl
SSo
5"
So
Tit.7
600-1000mm
*
1
1000ran
1
1
m
TOTAL
io!(.»3
A^o10 C3t
! 4-4o
34o
10 CXS
) I» S"oc
*t t4û
772,0
1 ^O
I S 17.
1 I & 4
1 .7\ ISO
% 11'fi-
as
f - • y
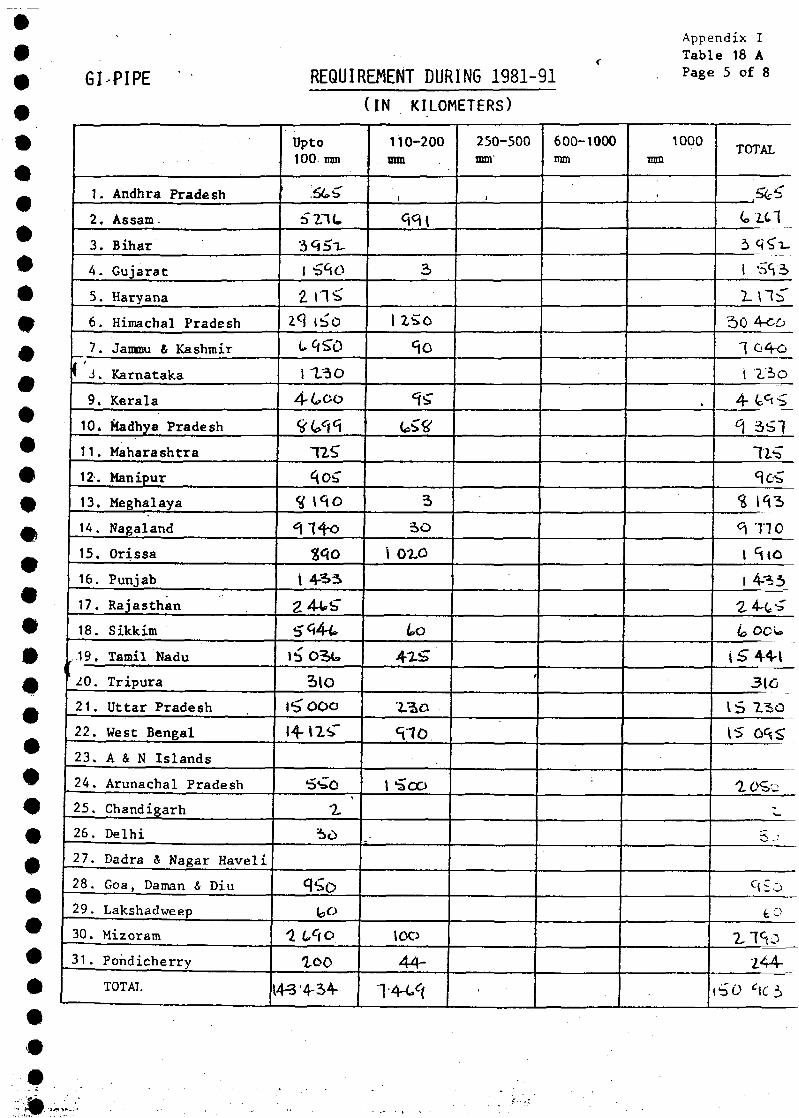
GI-PIPE REQUIREMENT DURING 1981-91(IN KILOMETERS)
Appendix ITable 18 APage 5 of 8
1. Andhra Pradesh
2. Assam.
3. Bihar
4. Gujarat
5. Haryana
6. Himachal Pradesh
7. Jammu & Kashmir
p i . Karnataka
9. Kerala
10, Madhya Pradesh
11. Maharashtra
12. Manipur
| 13. Meghalaya
14. Nagaland
15. Orissa
16. Punjab
17. Rajasthan
18. Sikkim
,19. Tamil Nadul 2 0 . Tripura
21. Uttar Pradesh
22. West Bengal
23. A & N Islands
24. Arunachal Pradesh
25. Chandigarh
26. Delhi
27. Dadra & Nagar Haveli
28. Goa, Daman & Diu
29. Lakshadweep
30. Mizoram
31 . Pondicherry
TOTAL I
Upto100 mm
i n<:
4-Coo
«Ob
\ 435
2 445"
5lo
«4 tlC
%
t o
loo4^'4-5-V
110-200mm
3
^O
3
i o
j 0-2-O
u>
44-
250-500mm'
•
600-1000mm
1000TOTAL
5fcb
l l l b
i zio
°\ nol S to
i 4^3
2 4-t^"
i S 4-4-I3 k i
IS Ô^S
-
t o
Z44-
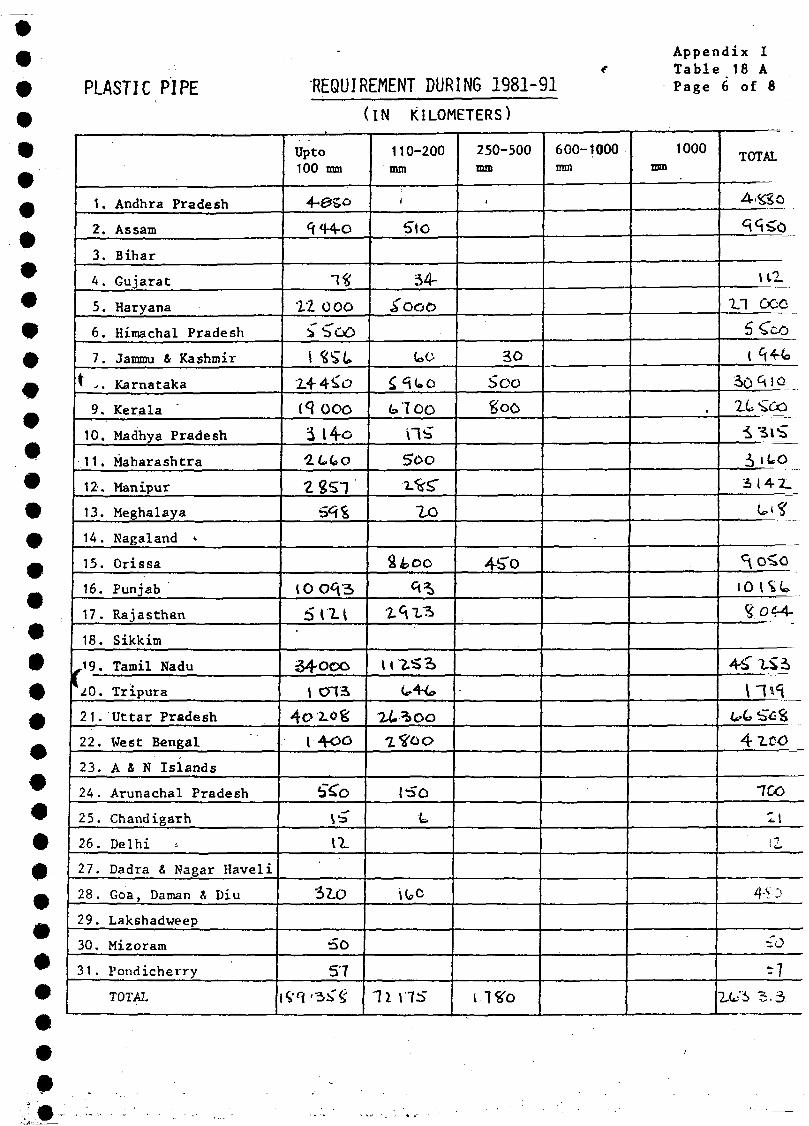
PLASTIC PIPE •REQUIREMENT DURING 1 9 8 1 - 9 1
(IN KILOMETERS)
Appendix ITable 18 APage 6 of 8
1. Andhra Pradesh
2. Assam
3. Bihar
4. Gujarat
5. Haryana
6. Himachal Pradesh
7. Jammu & Kashmir
* J . Karnataka
9. Kerala '
10. Madhya Pradesh
11. Maharashtra
12. Manipur
13. Meghalaya
14. Nagaland *
15. Orissa
16. Punjab
17. Rajasthan
18. Sikkim
J 9 . Tamil Nadu
Z0. Tripura
21. Uttar Pradesh
22. West Bengal
23. A & N Islands
24. Arunachal Pradesh
25. Chandigarh
26. Delhi
27. Dadra & Nagar Haveli
28. Goa, Daman & Diu
29. Lakshadweep
30. Mizoram
31. Pondicherry
TOTAL
Upto100 mm
4-0SOCi ai.A f\
It OOO
i ÎSU
(<< OOO
'i I4o1LUO
ZÎS1
10 O<V3
5 m
i54-oooi ens
4C>;LOS
I4oo
a
32.O
57
110-200mm
>
34-/ O O O
t Toons
XO
^ ^
lass<^4^
CDU
Tl 175
250-500mm
•
3 0
5oogoo
45*o
i.1*o
600-1000mm
1000nun
TOTAL
A.S80
111
n ooe5 Ceoi ^-w,
XÛSOû
i«<.O
3(4-2_
^ O ^ O
10 ISU
^.04-4-
4T.CO
ico2!
a
i"O
- 7
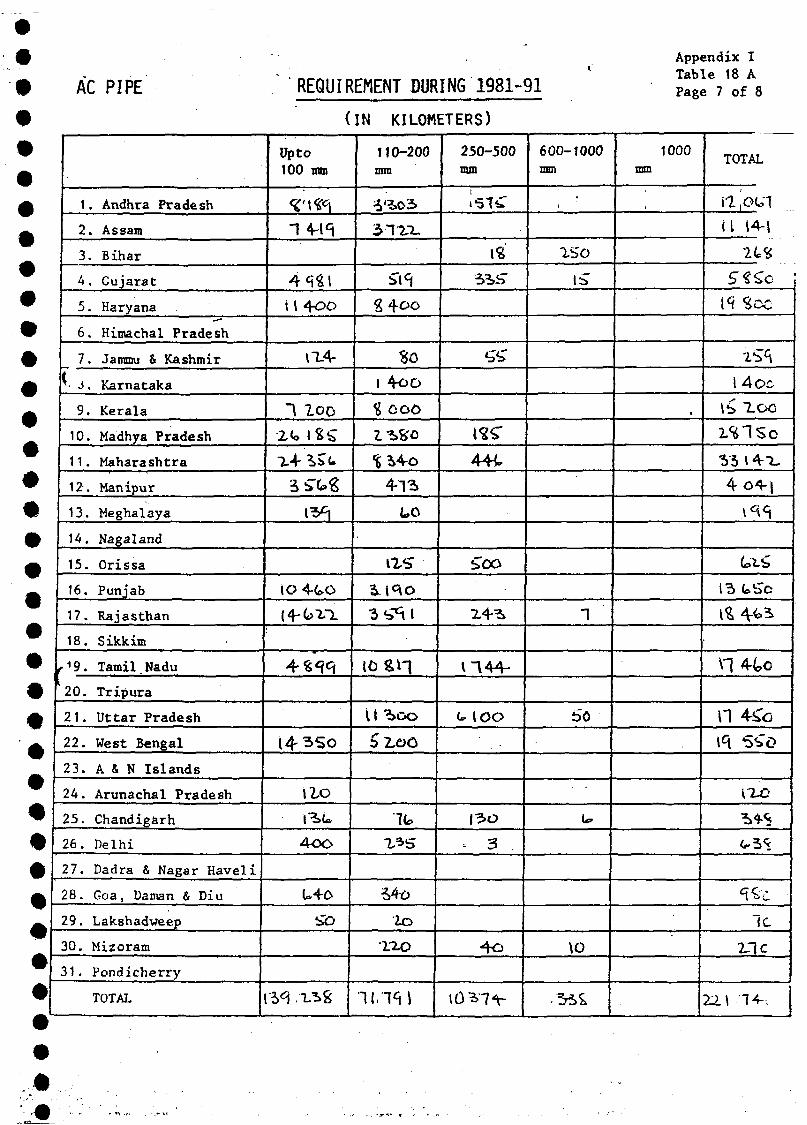
AC PIPE REQUIREMENT DURING 1981-91
Appendix ITable 18 APage 7 of 8
>
»
1
r
11»»
p
»
i•
m••
#
#*
•
A -
••
1,
2 .
3 .
4 .
5 .
6 .
7.
9 .
10.
11 .
12.
13.
14.
15.
16.
17.
18.
20 .
2 1 .
22 .
2 3 .
24 .
2 5 .
26 .
27 .
28 .
29 .
30.
3 1 .
Andhra Pradesh
Assam
Bihar
Gujarat
Haryana
Himachal Pradesh
Jammu & Kashmir
Karnataka
Kerala
Madhya Pradesh
Maharashtra
Manipur
Meghalaya
Nagaland
Orissa
Punjab
Rajasthan
Sikkim
Tamil Nadu
Tripura
Uttar Pradesh
West Bengal
A & N Islands
Arunachal Pradesh
Chandigarh
Delhi
Dadra & Nagar Haveli
Goa, Daman & Diu
Lakshadweep
Mizoram
Pondicherry
TOTAL
(
Upto100 mm
14-l<i
4M \it 4oo
11-4-
~\ l o o
I0 4to
4S<fCj
\Zo
4oo
U4o
IN KILOMETERS)
110-200mm
31ZT-
Soi 4oo
i ooo
«5^4o41*5
LO
\XS
5 2,oû
^3s
•no
250-500
44t
Z4-^
V144-
< loo
| 3 O
4o
600-1000mm
•
ISO
\Z
"I
50
\O
1000
;
TOTAL
n.otn-H t^i
2CS
t<f Sec
1 Aoc
\5 XooiSlSo"53 147_4 û4-|
i ^
i«4<>i
\14-4o
H 4^o
1c21C
22.1-14-,
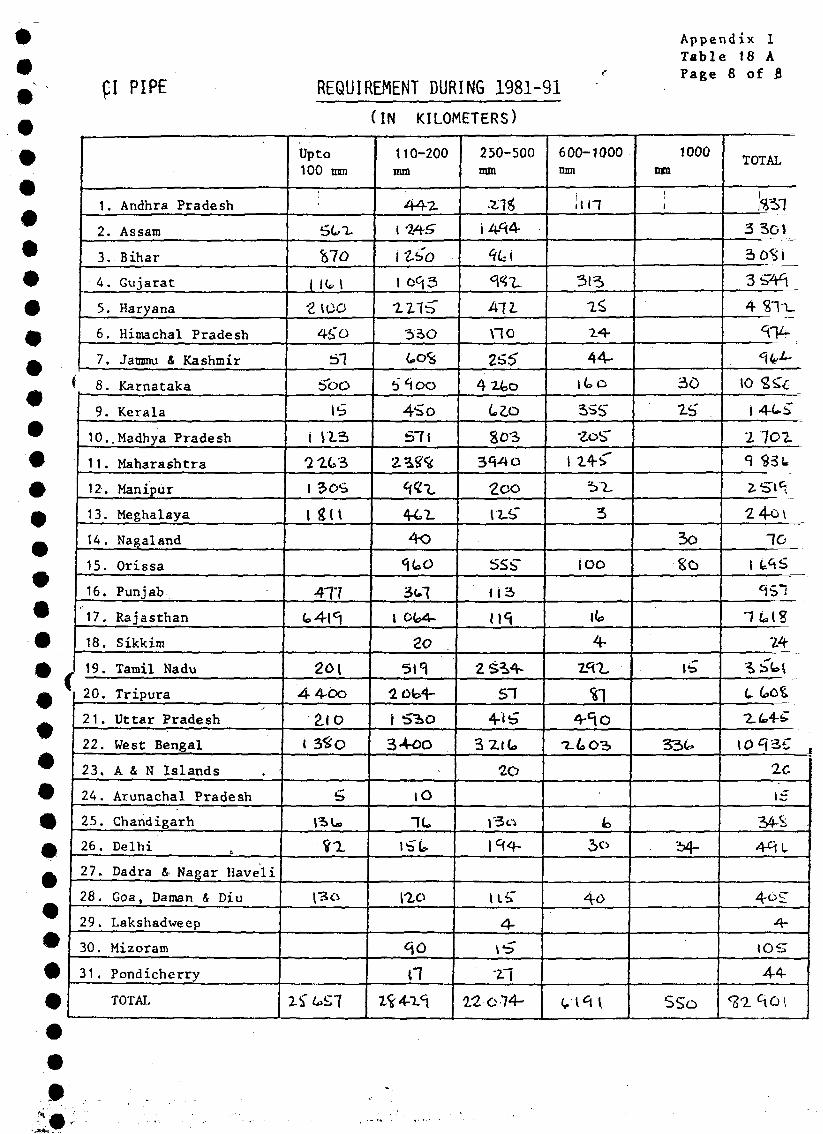
m
ÇI PIPE REQUIREMENT DURING 1981-91(IN KILOMETERS)
Appendix ITable 18 APage 8 of 8
1. Andhra Pradesh
2. Assam
3. Bihar
4. Gujarat
5. Haryana
6. Himachal Pradesh
7. Jammu 4 Kashmir
'_ 8. Karnataka
9. Kerala
1O.,Madhya Pradesh
11. Maharashtra
12. Manipur
13. Meghalaya
14. Nagaland
15. Orissa
16. Punjab
17, Rajasthan
18. Sikkim
19. Tamil Nadu
20. Tripura
2 1 . Uttar Pradesh
22. West Bengal
23. A & N Is lands
24. Arunachal Pradesh
25. Chandigarh
26. Delhi
27. Dadra & Nagar Haveli
28. Goa, Daman & Diu
29. Lakshadweep
30. Mizoram
31. Pondicherry
TOTAL
Up t o100 ram
507-
%lo
( !(c- 1
Z \0O
4S'O
S I
IS
j 113
Q1GS
1 SU
477
<*4l<i
2 0 1
-4 4-bo
2.IO
i 3*O
• ^ T
110-200mm
44-Z
I'2^<T
i isb
3àO
Go§
6 ioo45 o5 7 (
< < ^
4tX4o
1 01*4-
2o
sn2 Ofc>4~
i ^iO
34^)O
i O
IL
\io
a
250-500mm
i 4-^4
*=»«!.
4zfcO
80s
Zoo\\£
( 1 3
09
2SVK
5 7
4»^
2O
1 4-
UfT
4-
600-1000nun
J i n
3 I 5
2S
2 4 -
44-I t û
eos"! 24-S"
3
ioo
i t
4-
o I
4-cio
4o
mi
1000ltd
t
•50
2 b
3oSu
24-
SSo
TOTAL
! ^73 301
30%i
3S¥i
4 STL.
14-Cb
2 701
24o\10
24
2,4.4-Î :
15
54S
4qt
4-
IÛS
4 4
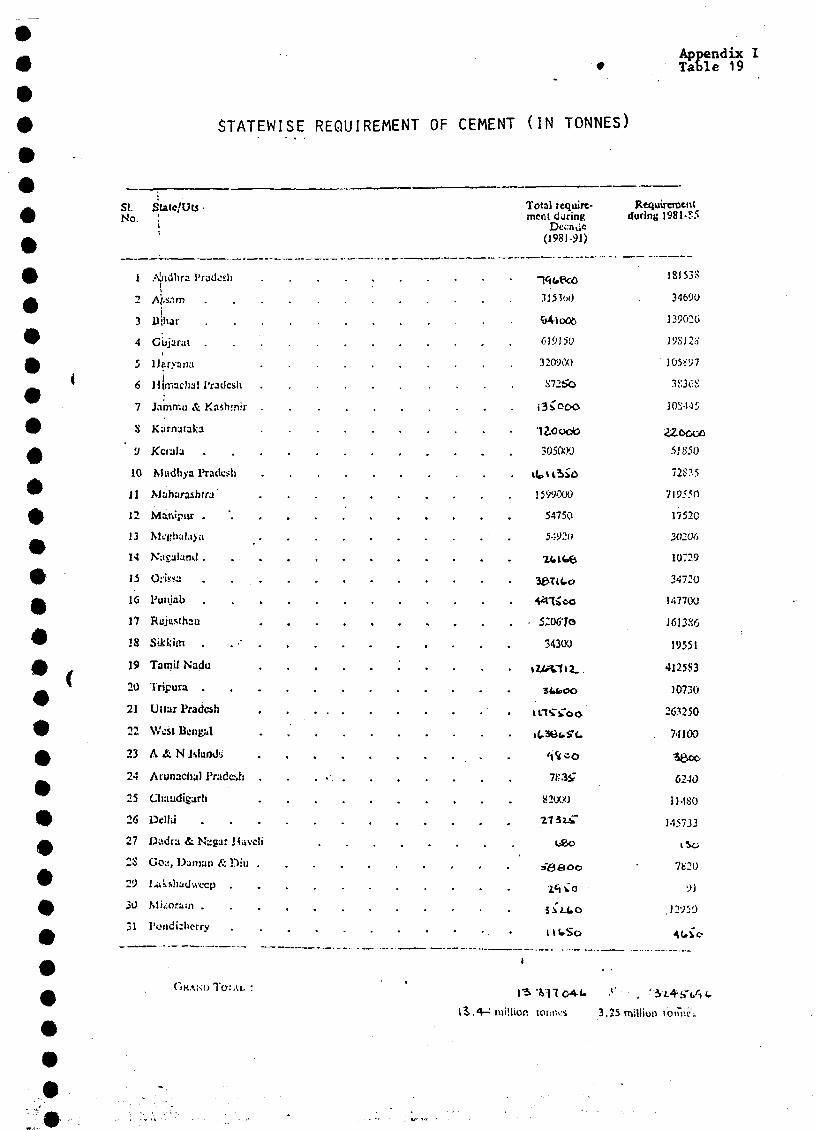
Appendix ITable 19
•
•
STATEWISE REQUIREMENT OF CEMENT ( I N TONNES)
SI. Statc/UtsNo. :
a l'radosh
3 ll-har
4 Gujarat .
5 IJcryana
6 Himaclia! I'radcsh
7 Jamir.u & Kashmir
S Kurnutaka
V Kerala .
10 Miidbya ftadtsl!
11 Waharasbtra
12 Mar.ipiir .
13
14
15 O:issa .
1G Punjab
17 Riîjusthan
38 Sikkim .
19 TatniJ Nadu
20 Tripura .
21 Ullar Pradesh
22 West
23
24 Arunadial
25 CJi:iudi£ar!i
26 Delhi
27 JJadra & Nygjr JJavcli
2S Go:;, Daman & Din .
29 lxksi)jtlw<xp .
30 Mi/o.TJin .
31 I'ondizhorry
Total requirc-mcnl djring
D(J98J-9J)
Udo
1<1 V O
Requirementduring J981-S5
3153oU
619150
32090/0
S72S6
1S153S
34690
139026
19SJ2.Ï
1O5>';7
305000
itUii'û
1599000
54750
5-f«»
^ 7 i û o
52067O
34300
SUeOO
7 ^
BMW
5JS5O
72S35
719J5O
17520
30206
10729
34720
I--.7700
J6I3S6
19551
4125S3
10730
263250
. 7-JIOO
6240
11-ISO
145733
7K2O
M (-So
.»'
million ior:i~.i.s 3.25 million
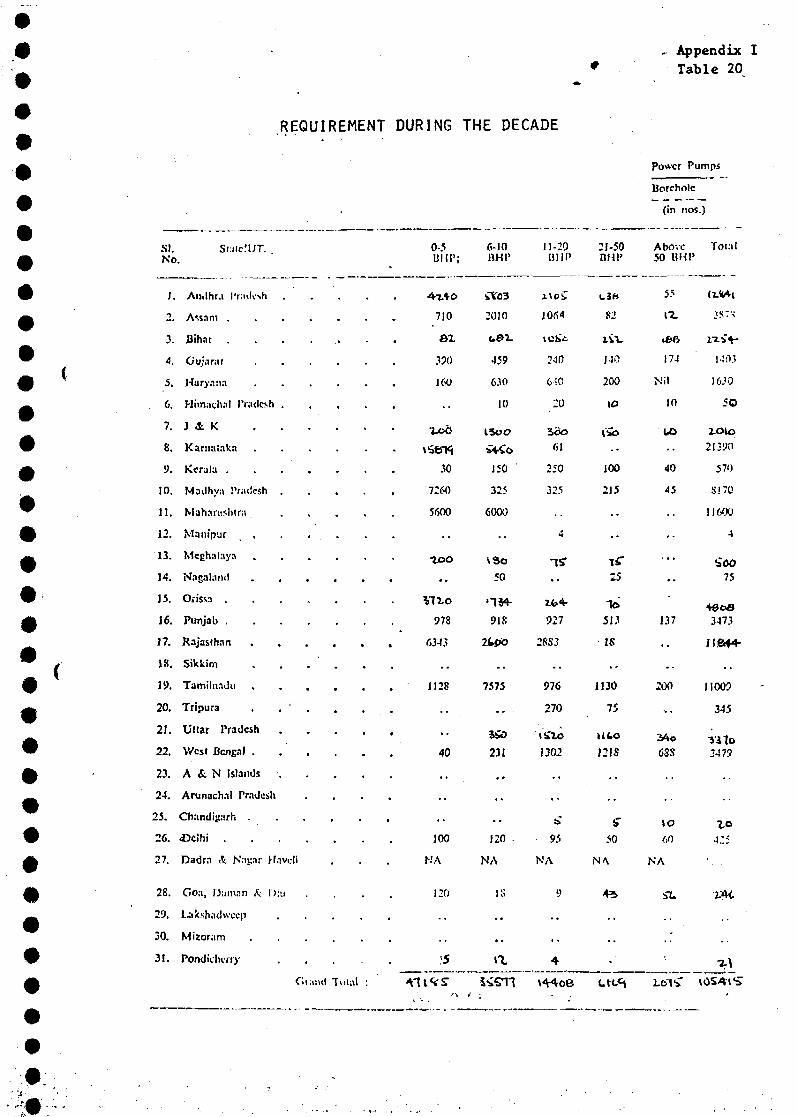
REQUIREMENT DURING THE DECADE
- Appendix ITable 20
Power Pumps
Borehole
(in nos.)
SI.No
1.
i
1
4.
6.
7.
8.
9.
10.
11.
p
n
14
15.
16.
Î 7
1R
?0
21.
??
23.
24.
25.
26.
27.
28.
29.
30.
31.
S i : i l e ! U T . .
A n d h r . i P r a d o h . . . . .
Bihar
Oojara l . . . . . .
H a r y - ' n
Mimachal Pradesh
J £ K
Karna lak . i
Kerala . . . . . . .
Madhya l'raiïcsh
Maharashtra
Orissa
Punjab
U l t a r Pradesh
A & N Islands
Arunach. i l Pradesh . . . .
Chandi j jarh
<Dcihi . .
Dadra A Naisir Havcli
Goa , Daman & Diu . . . .
U k s t a d w c c p
Mizo ram
Pondid ic r ry
Cii.iiid Toial :
UIIP;
4*ft
710
Ô l
330
160
X^d
30
7260
5600
978
63-11
1P8
• •
. .
. -
100
NA
120
:5
6-10«HP
«.3-
2010
U0t
459
630
10
&•<<>
1Î0
325
6000
VSo
;o
•134-
91S
2tf>&
7575
211
. *
120 .
NA
* •
a
Jl-20
une
nosJ0rt4
tcU
240
CiO
20
61
250
325
927
2SS3
976
270
1302
95
NA
y
. .
4
21-50DM!»
U3B
82
xil.
140
200
l i b
-•
100
215
25
T6
513
IS
1J30
75
H t o
PIS
IT
50
NA
4 3
,.
•"
Above50 «HP
55
17.
17-1
Nil
10
40
45
137
?00
6SS
M
NA
SU
•
LOÏC
Toi:il
a«^
N03
16J0
5O
2-Oto
21390
570
S !70
11WJ0
4
75
3473
JI6H4-
11009
345
Tilo"479
..
425
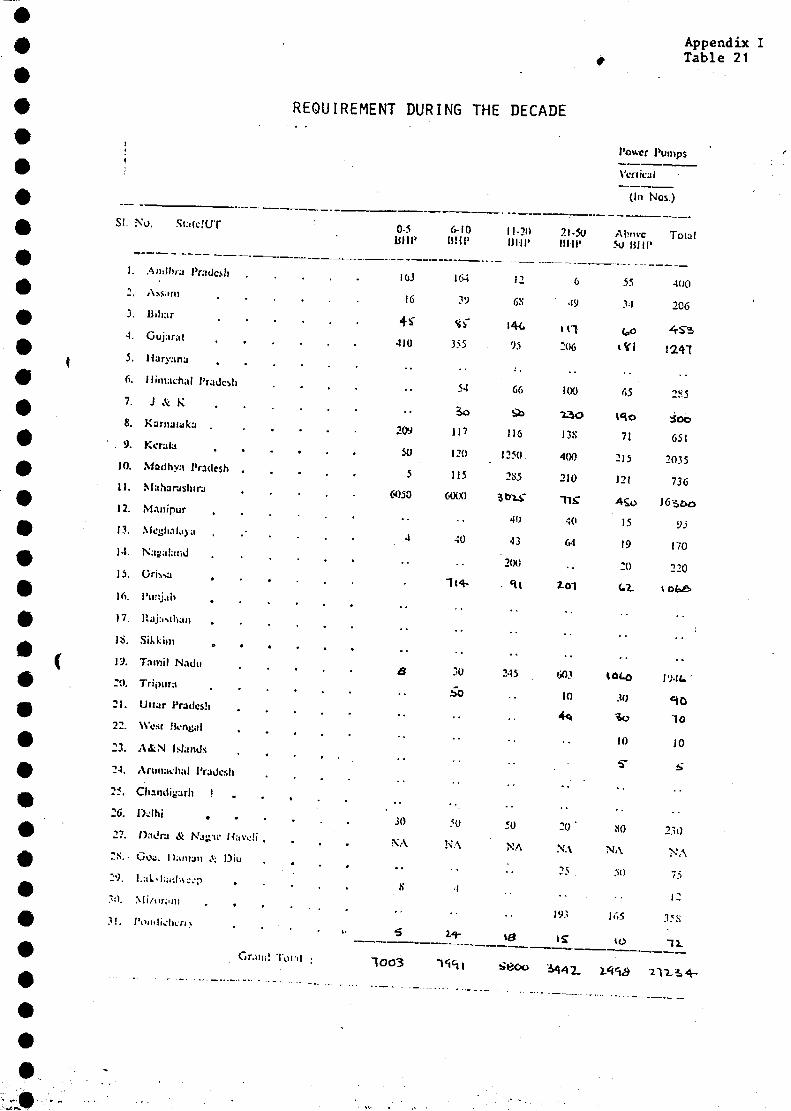
Appendix ITable 21
REQUIREMENT DURING THE DECADE
Power Pumps
Si. No, ,Si:i(e!UI'
J. A»I1I)I-J IV.nic.li
2, Assam
3. Uiluir
A. Gujarat
5. Haryana
<>. ilirmchal 1'radcsh
7. J A; K
8. Karnaiiika
9. Kerala
JO. Maclhyn Pradesh
11. Maharashtra
12. Manipur
13.
J5.
16.
17.
IS.
V).
20.
21.
22.
2.1.
21.
25.
26.
27.
Oriv>a
l'unj.iîi ,
ilaj:iiih;in
Sikkim
Tamil Nadu
Tripui;t
Uilar Pradesh
Wcsi !k-naal
A&N Islands
Aiunatlial I'radcsl)
Chandigarh ! .
IX-lhi
Daiira Ji Nj»ii- Mavc.'i
Goa. Daiiun f; Diu
].:il.|;;,.|-.v;i.i,
Mi/UMDl . ,
31.
(III
0-5UUP
163
16
4!»410
•
2(W
50
J
6050
•
4
•
6-10imp
16-4
3V
*?
353
54
i i ?
120
115
6000
••
40
11-201)111'
12
6S
\AL
'J5
66
&
116
1250
2S5
SMS"
•iO
43
200
*»«
21-50Mil l '
6
• a206
UK)
73O
13.S
400
210
Tl<T
40
A4
Xû1
Above5u BMP
55
31
65
11©
71
215
121
ASo
15
19
:o<-.•>
Tola!
400
206
1-Z47
2S5
Sob
651
2035
736
Vi
170
220
1 A l CV
.10
So
• •
215
••
603
10
4*
tÛLO
-'0
10
S"
J W t
•HO
10
10
i»
30
NA
S
5
50
NA
•I
• •
50
NA
10
2 0 '
N'A
25
î
jy;.
.so
NA
50
li'.5
230
NA
75
i :
.15 S
1 1
1OO3M47. l.c\^ 2-J^î,4-
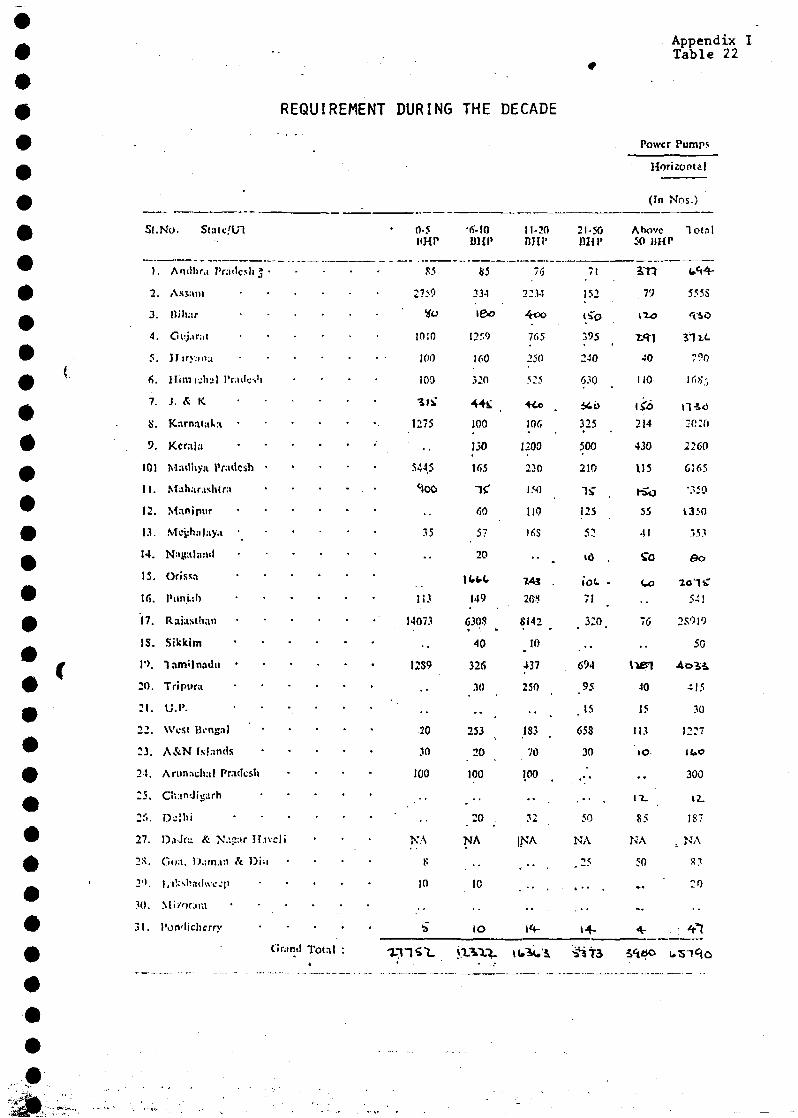
Appendix ITable 22
REQUIREMENT DURING THE DECADE
SI.No. Scttc/in
I. Amlhr.i J'r;i<!c<li5
3. Dili.-.r .
4. Oi!j;ir;it .
5. JIiry:i»a .
6. HimrJial Pradesh
7. J. & K
S, K:\rn.ii;tk:i . .
9. Kerala . .
101 Matlhya Pradesh •
11. Maharashtra
12. Manipur . .
13. Meghalaya •
14. N;lsal;i:ul . .
15. On'sxa . .
lf>. Pnni.;b . .
17. Raiasthaii •
IS. Sikkim . .
l'>. 1am<Jnadii « .
20. Triptira . .
21. U.P. • "
22. West BingaJ ' •
23. A&N Islands
24. Arunnchal Pradesh
27. OiiJf:i & N.'.?;tr H.tvc l i
2 * . G I M . I);tm.tn «t D i u
2'.>. l.'iUshndwtfjp
30. Mi /or .pr . i . . .
3 1 . 1'on' l ichcrry
0-5HHP
S5
27ï9
Va
1010
100
100
1275
5445
35
••
113
14073
1259
..
20
30
100
KA
S
10
J(ï-t0IMP
«5
33-1
\eo
1250
lf>0
320
100
150
165
"K
60
57
20
149
630$
40
326
30
. .
253
20
100
20
NA
10
11-20Mil"
7.5
2234
4 * 0
765
250
525
\0f,
1200
230
150
110
)6S
* *
Ms .
2GS
SI42
10
437
250
. .
183
70
100
32
|NA
21-50«HP
71
152
iïb395
240
630
325
500
210
IS
125
52
10 .
ioL .
71
320
694
95
15
65S
30
. - .
. • • ,
50
NA
25
Power !Pumps
Horizontal
(In Nos.)
AboveÎ0 J1HP
*n,79
1XO
M l
40
110
214
430
115
55
41
U>
76
, .
40
15
113
lO
. .
IT-
S 5
NA
Î 0
lol.il
555S
790
if,nr,
;o;o
2260
C;<ÎS
•:.ÎO
4350
353
eo
54!
2S019
50
4oï4
415
30
1227
<UO
300
12.
IS7
K3
:o
IO
CJr;inil Total tuït.i
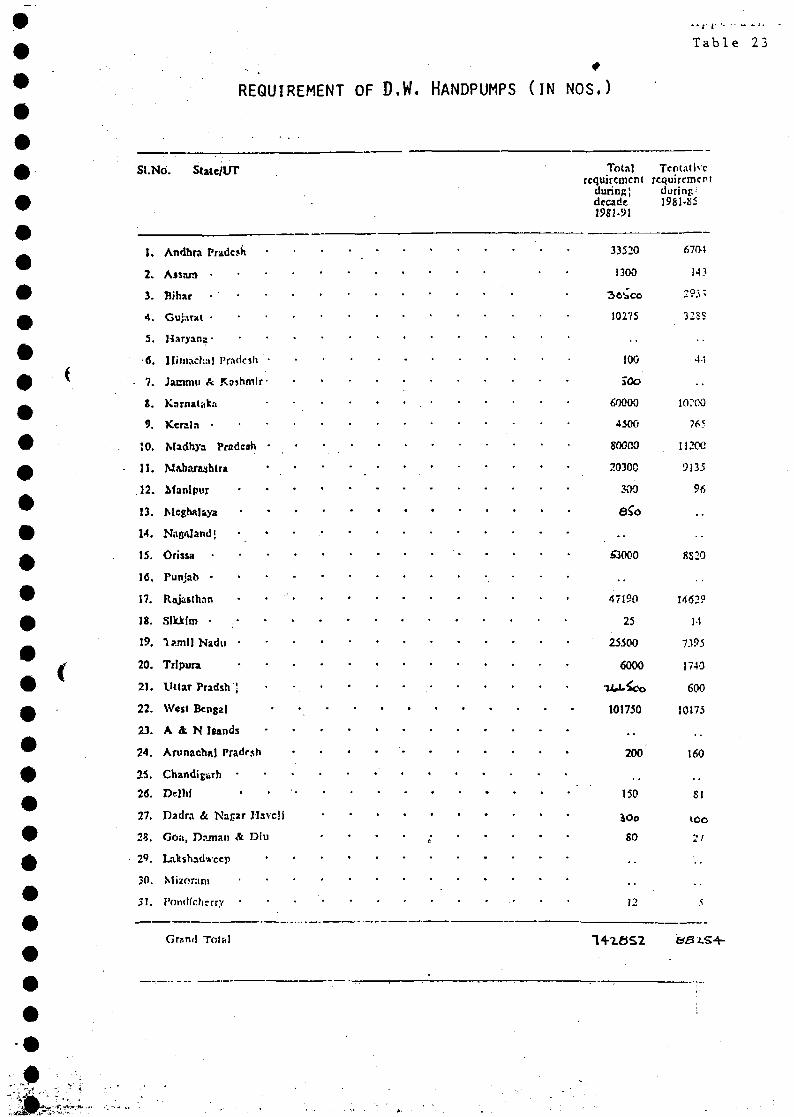
Table 23
REQUIREMENT OF D.W. HANDPUMPS ( I N NOS. )
SI.No. State/UT
1. Andhra Pradesh
2. Auara •
3. Bihar • •
5. Haryanz •
(S. llim,ict;:il Pradesh
• 7. Jammu A Kashmir-
S. Knrnataka
9. Kerala •
10. Madhya P«dc»h
11. Maharashtra
.12. Manipur
13.
14.
15. Orissa
]<J. Punjab •
17. Rajasthan
18. Slkilm •
19.
20. Tripura
21. U U a r P r a d s h ;
22. W«st Bensal
23. A & N Iiands
24. Artinachnl Pradesh
25. Chandigarh •
2<J. Delhi
27. Dadra & Nagar HsvcH
28. Goa , Daman & Diu
29. Lai: shad weep
30. Mi'/r>r;tm
31. Ponrfkhcrrv
Totalrequirement
during;decade19SÎ-91
33520
1300
Tentai kcrequirement
during:
1981-S5
6704
143
10275
53000
200
12
32SS
100
Sûo
<M0O0
4500
80000
20300
300
4-;
io:oo
765
1120C
9135
96
8S2O
47190
25
25500
6000
101750
1462?
It
7395
1740
600
10175
160
150
SO
51
71
Grand Total
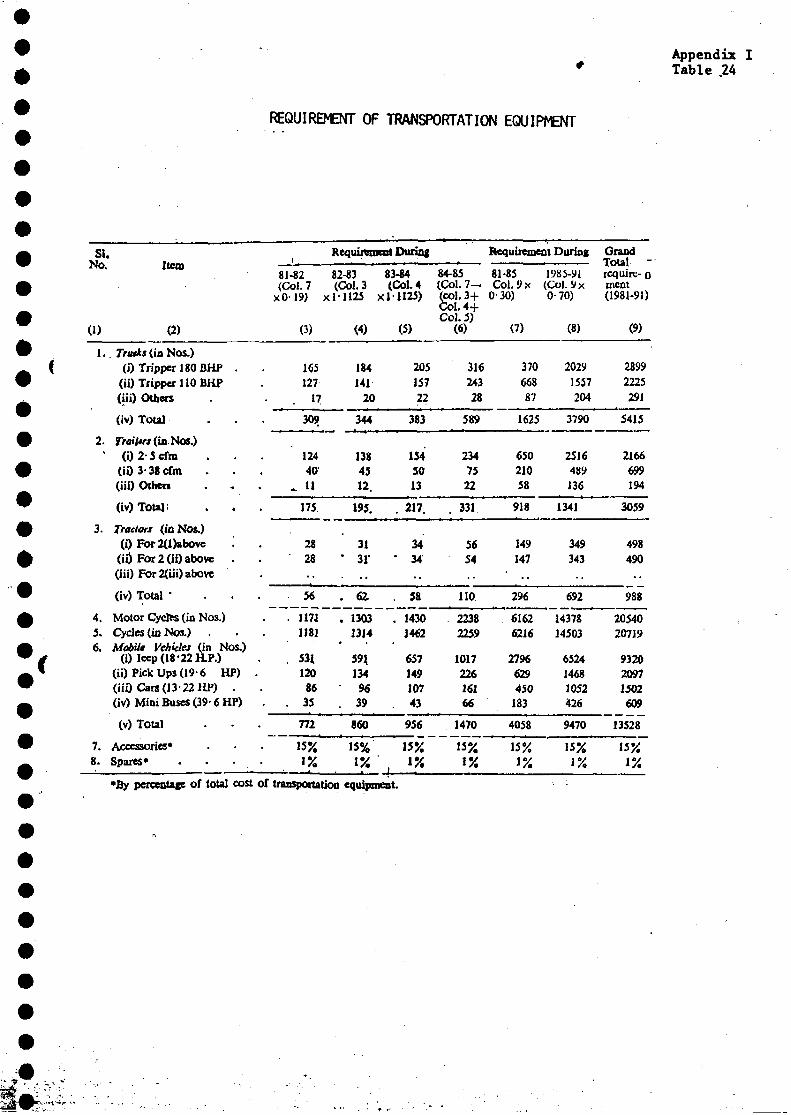
Appendix ITable 24
REQUIREMENT OF TRANSPORTATION EQUIPMENT
#
si.wo*
(i)
î .
2.*
3.
4.5.6.
7.8.
Item
(2)
. Trutks (in Nos.)(i) Tripper 180 BHP .
(ii) Tripper 110 BHP(iii) Others
(iv) Total
Trmlm (in Nos.)(i) 2- 5 cfm
(ii)3-38cfm(iii) Others
(iv)Toui;
Tractors (in Nos.)(i) For2(l)abovc
(ii) FOr2(ii)above .(iii) For 2(iii) above
(iv) Total "
Motor Cycles (in Nos.)Cycles (in Nos.)Mobile Vehicles (in Nos.)
(i) Iccp (18-22 H.P.)(ii) PickUpS (19-6 HP)(iii) Cars(13-22 HP) .(iv) Mini Buses (39- 6 HP)
(v) Total
Accessories*Spares*
81-82(Col. 7
xO-19)
(3)
165127
17
309
12440
* H
175.
2828
56
. J171mi
. 53412086
. . 35
772
15%>%
Requirement During
82-83(Col. 3
xl-1125 :
(4)
184141
20
344
1384512.
195.
31• 31-.
, 62.
. 13031314
* *59*13496
. 39
860
15%1%
83-84(Col. 4
xl 1125)
(5)
20515722
383
154SO13
. 217.
34• 34
••
. 58
. 14301462
*657149107
. 43
956
15%
, ' *
84-85(Col. 7—(col. 3+Col.4-fCol. 5)
(6)
31624328
589
2347522
. 331
5654
110
. 22382259
101722616166
1470
15%
1%
Requirement During
81-85Col.9x
0-30)
(7)
37066887
1625
65021058
918
149147
296
61626216
27%629450
183
4058
15%1%
1985-91(Col. 9x0-70)
(8)
20291557204
3790
2516489136
1341
349343
• •
692
1437814503
652414681052426
9470
15%1%
GrandTotalrequire- 0ment(1981-91)
(9)
28992225291
5415
2166699194
3059
498490
••
988
20540207J9
932020971502«09
13528
15%1%
•By percentage of total cost of transportation equipment.
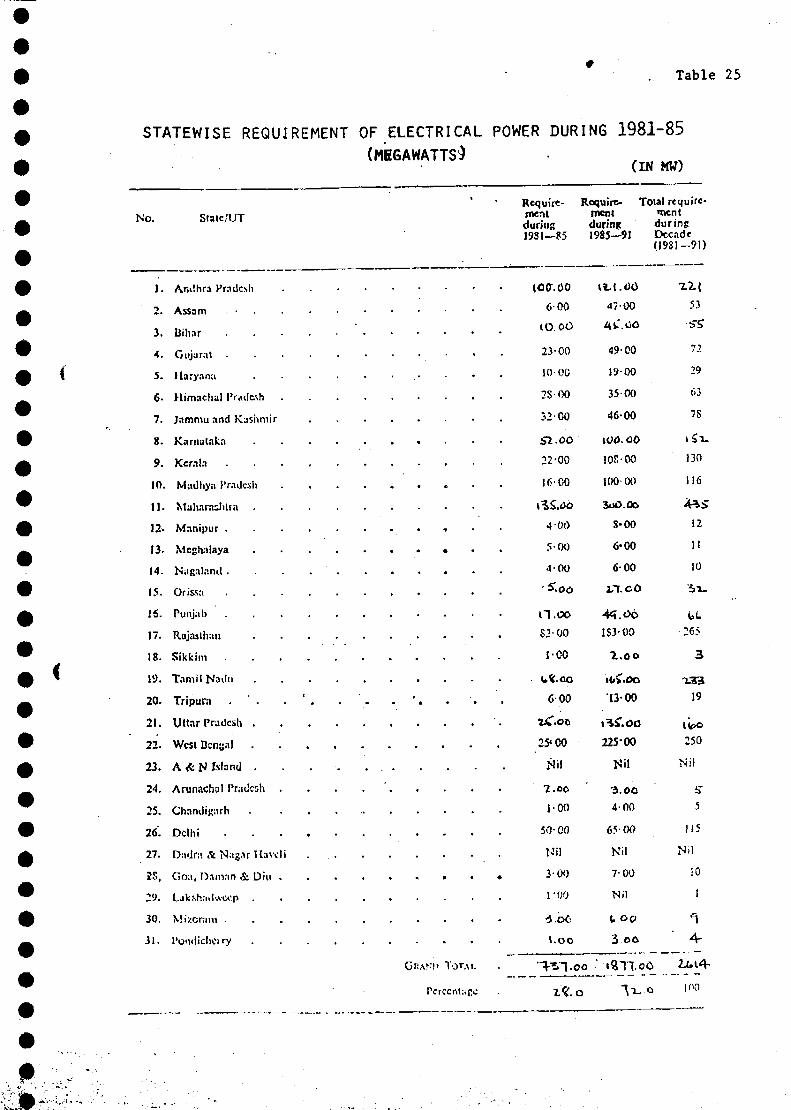
Table 25
STATEWISE REQUIREMENT OF ELECTRICAL POWER DURING 1981-85
(MEGAWATTS^( IN MW)
No. Siatc/UT
3.
4.
5.
6.
7.
8.
9.
10.
11.
12.
13.
14.
15.
16.
17.
18.
19.
20.
21.
22.
23.
24.
25.
26.
27.
2S,
29.
30.
3 1 .
Pradesh
Assam . • .
Bihar
Gujarat .
llary.in;»
Himachal Pradesh
J.-tmmu and Knshmir
Karnalakn
Kerala .
M;idliy;i Pradesh
Maharashtra
Manipur .
Meghalaya
Orissa
Punj;ib
R;ijasth;m
Sikkim •
T.imil Nailti
Tripura .
Uttar Pradesh .
West Dcnu^I
A & N Island .
Arunachal Pradesh .
Cbniuliearh
Delhi . . .
Diidi'H A N;ig."»r Havcli
Go:», Danvin & Din .
Wizcnim .
Pomlichci ry
Require- Roquirc- Total rtquirc-mentduring1931—85
ment itentduring during1985—91 Decade
(19S1-9I)
\CV.60
6 00iO.C-0
23-00
10 00
2S0O
32-00
bl.OO
22-00
16-00
4 00
5-00
•100
n.oo$2- 00
1 0 0
tA.GO
6-00
25'00
Nil
7.06
100
50-00
Nil
3-00
TOO
•J.OC
l.OO
[VI. Où
47-00
49-00
19-00
35 00
46-OO
WO. 00
10S00
100-00
S-00
6*00
6-00
2,1. CO
4<Î.O61S3-00
1300
225-00
Nil
3.OO
4-00
65 00
Nil
7-00
Nil
t oo3 O6
53
11
29
f.3
7S
130
12
10
265
3
19
250
Nil
S
5
115
Nil
Gr:AN!i TOTAL
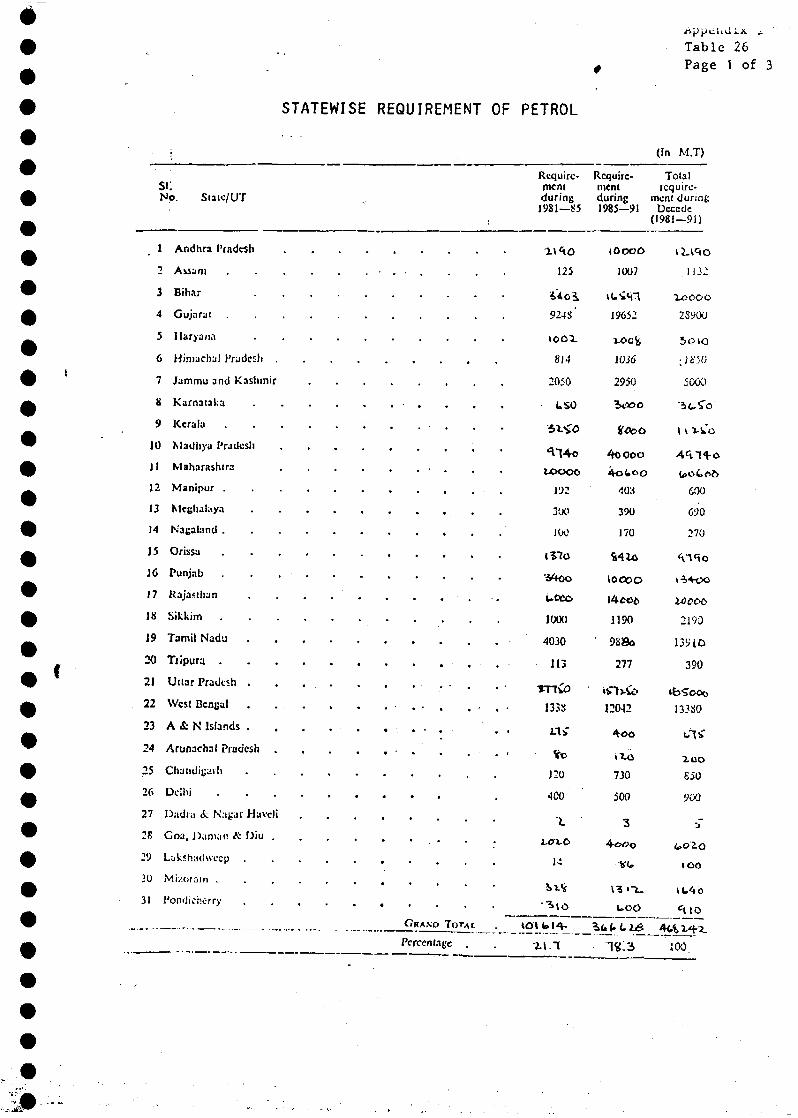
STATEWISE REQUIREMENT OF PETROL
Table 26Page 1 of 3
(In M.T)
si;No. Staw/UT
1 And lira Pradesh
2
3 Bihar
4 Gujarat
5 Haryana
6 Himachul J'radcsh .
7 Jammu and Kashmir
X Karnataka
9 Kerala .
10 Madhya Pradesh
Jl Maharashtra
12 Manipur .
13 Mcehalaya
14 Naealund .
15 Orissa
16 Punjab
17 Kajasihan
IS Sikkim .
19 Tamil Nadu .
20 Tripura .
21 Uttar Pradesh .
22 West Bengal .
23 A & N Islands .
24 Arunach.il Pradesh
25 Clumliuaih
26 Delhi
27 Dadi;i &. N.igar Havc.'i
28 Coa, J)nni;n: &. Diu .
29
30
31 ron<Jici:orry
Require- Require-ment mentdurint; during19S1—S5 1985—91
125
924 S'
8M
2050
UTOOO
192
100
• •
WCCO
100U
4030
113
tnio133»
Vc
120
•100
LOÏ-C
14
Totalrequire-
ment duringDecade
(1981—91)
GWANO TOTAf.
Percentage .
lOocO
1007
19G52
1036
2950
4oooo
403
390
170
ioooo
1190
277
12042
ilo
730
500
VU
LOO
Xcooc.2syoo
5OIO
; J i'50
500C»
I \
coo
270
2190
390
13380
ico£50
900
too
100.
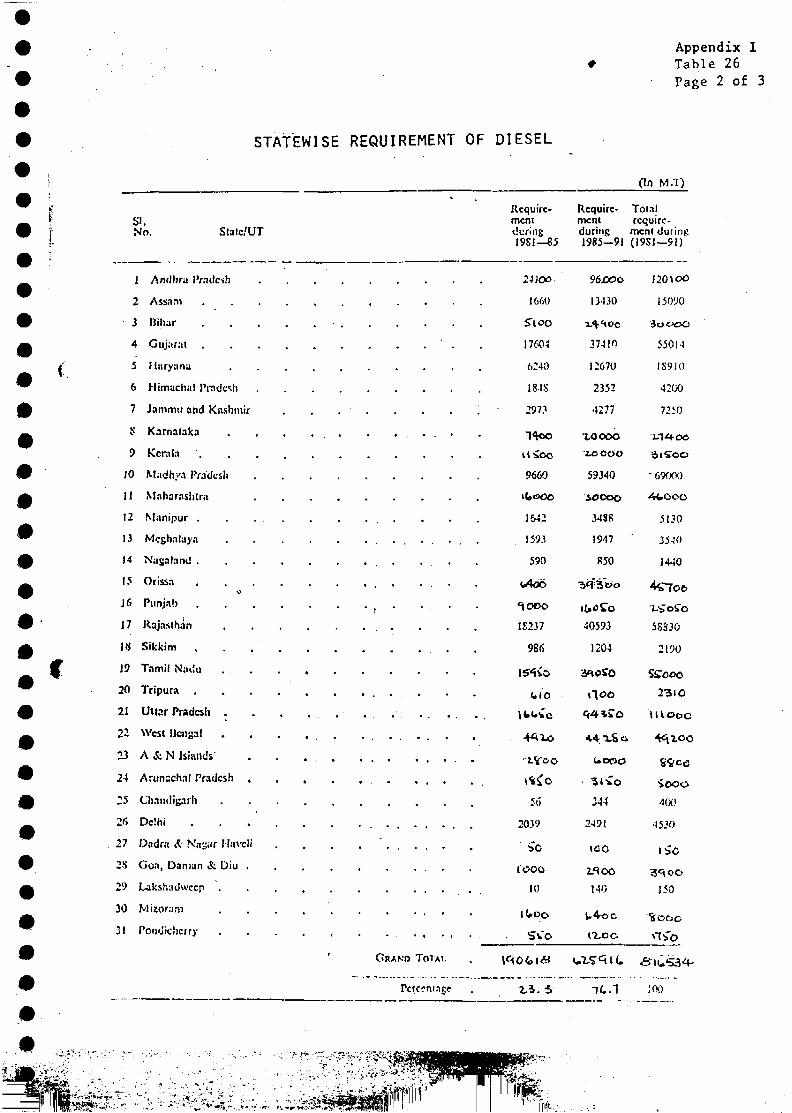
STATEWISE REQUIREMENT OF DIESEL
Appendix ITable 26Page 2 of 3
(in M.T)
SI.No. Statc/UT
1 Andhra Pradesh
2 Assam
3 Hilwr
4 Gujarat
5 Iliiryiinu
6 Hiniuchiil Pradesh
7 Jammu and Kashmir
S Karnataka
9 Kerala .
10 Madhya Pradesh
11 Maharashtra
12 Manipur .
13 Mcghalaya
14 Nagaliind .
15 Orissa . . ' .
J6 Punjab . .
17 Rajaslhan
IH Sikkim
19 Tamil N;u!u
20 Tripura .
21 Uttar Pradesh .
22 West Hcngal .
23 A & N Jsiantls
24 Arun-chal Pradesh .
25 Chsihligarh
26 Dc!hi
27 Diidni A Nngitr Maveli
2S Goa, Danian & Diu .
29 Laksfcadwccp .
30 Mizoram
31 PoniJic'icrry
Require-mentduringI9SI—85
24kx>
1660
17604
6240
181S
2971
9660
1542
1593
590
Require-mentduring1985—91
96.000
13430
12670
2352
4277
ZOOOO
lOOOO
59340
A0OOO
34SR
1947
R50
Totalrequire-
ment during(19S1—91)
I20\oO
.5090
JofOC
550! 4
IS910
42C-0
72ÎO
" ^
" 69OCVJ
-M.OOO
5150
35-ÎO
1S237
(.IO
2039
10
40593
1204
\~\oo
UlSs
51 Co
344
2491
100
2.^00
HO
17.OC
SS33O
2190
23iO
lllooc
iooo400
4530
150
GRAND TOTAL
;oo
' '^ '•vV^
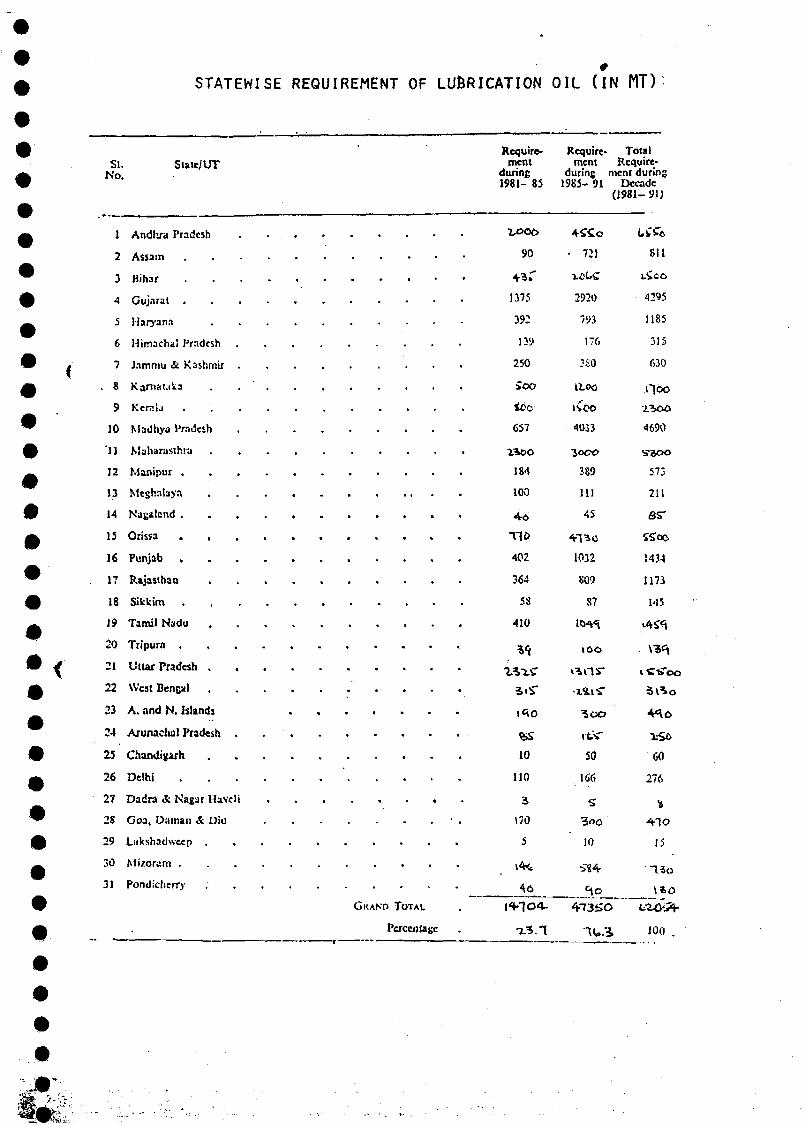
STATEWISE REQUIREMENT OF LUfiRICATION OIL ( I N MT)
si.No.
SiaW/UTRequire- Require* Total
ment ment Require-during during ment during1981- 85 1985- 91 Decade
(1981- 91)
1 Andhra Pradesh
2 Assam
3 Bihar
4 Gujarat
5 Maryan.i
6 Himacha! Pradesh
7 Jammu & Kashmir .
. 8 Karrtcici a
9 Kcraij
10 Madhyd Pradesh
'11 Mjharasthni
12 Manipur .
13 Megh.-.Iaya
14 Nagaland .
15 Orissa
16 Punjab
17 Rajasthsn ,
18 SitUim .
19 Tamil Nadu
20 Tripura .
21 Uttar Pradesh .
22 WesiBenc»!
23 A. and R Islands
24 A/unaclial Pradesh .
25 Cfiamliyarh
26 Delhi
27 Dadra & Nagar Havel i
2S Goa, Unman & Diu
29 Liikshadweep . ,
30 Mizoram .
31 Ponditherry
CKAND TOTAL
Vaccntagc
90
1375
392
]3y
250
ÎOO
ico
657
J8'l
100
402
364
58
410
10
110
3
(70
5
2920
793
176
3S0
ILOO
4033
389
111
45
1032
S09
87
I Û O
rtiT
50
166
10
su
4295
1185
315
630
1690
573
211
BT
SScc
Î434
1173
M5
• W o
1:56
60
lit
%
15
13c
100
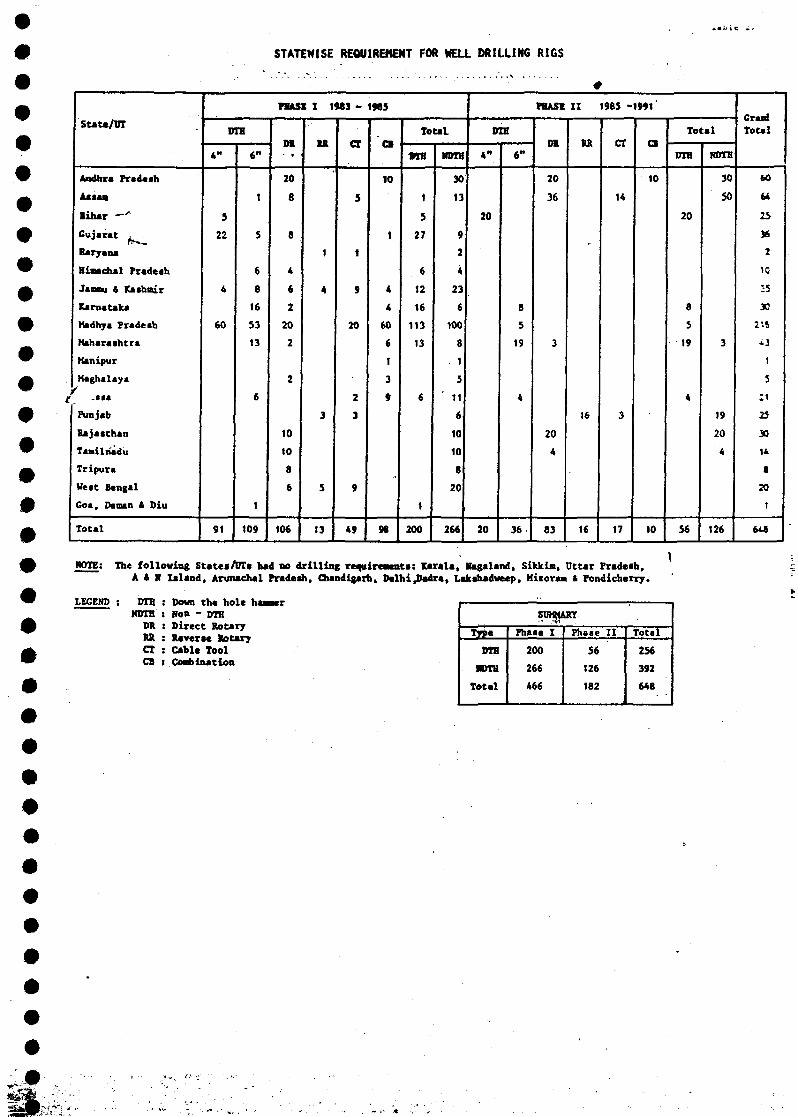
STATEWISE REQUIREMENT FOR WELL DRILLING RI6S
#
0
State/UT
Aadhra Pradaah
Aataa
Bihar - " '
Cujarat ^
Raryana
Riaechal Pr«deth
Janau « Kathwir
Karnataka
Kadhya Pradeih
Kaharaihtra
Kanipur
M«ghalaya
/ ...Punjab
Kajatthan
Taailtiàdu
Tripura
We»t Bengal
Goa, Danan * Diu
Total
DTH
4"
5
22
4
60
91
6"
1
5
6
8
16
53
13
6
1
109
FEME i 19S3 -
Oft
20
8
8
4
6
2
20
2
2
10
10
8
6
106
•ft
1
4
3
5
13
CT
5
1
9
20
2
3
9
49
1983
a
10
1
4
4
60
6
1
3
9
98
Total
«IB
1
5
27
6
12
16
113
13
6
1
200
HDD
30
13
9
2
4
23
6
100
8
1
5
11
6
10
10
8
20
266
DIR
4"
20
20
6"
8
5
19
4
36
PRASE
DR
20
36
3
20
4
83
II
KR
16
16
1985 -1991'
cr
14
3
17
a
to
10
Total
DIB
20
8
5
19
4
36
NDTH
30
50
3
19
20
4
126
Gras!T o t a l
60
64
25
36
2
10
25
30
l'A
*3
t
5
: i
15
30
U
1
10
1
6 i«
MOTE: The fallowing State*AfT« had no drilling requirewenta: Kerala, Kagaland, Sikkim, Uttar Pradeth,A * N Iiland, Arunachal Pradash, Chandigarh, DalhilDadra( Lakahadweep, Mizoran I Pondichsrry.
LEGEND : DTHNDTH
DRRRCTCB
Down th« hole haawrNon - DTHDirect RotaryRevert* RotaryCable ToolCombination
Type
DTH
MDTH
Total
Phate I
200
266
466
LRT
Fhaie II
56
126
182
Total
256
392
648
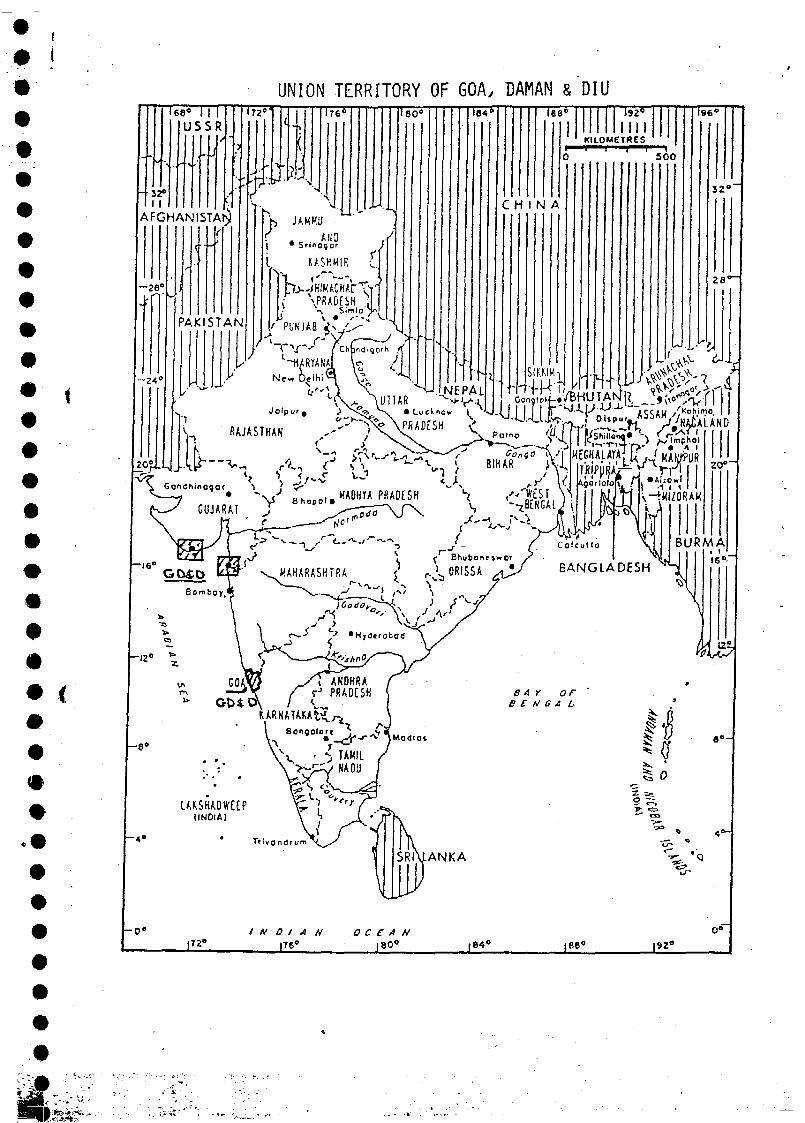
t
UNION TERRITORY OF GOA, DAMAN & DIUT«ï
USSR
J
32*I I
AFGHANISTAN
-24'
T??5
PAKISTAN
T7^
JAHHU
Tëo< TÔT* ~Ï92*"
miKILOMETRES
l96<
5 0 0
C H I N A52°"
2B1
j \PRAOESH j? V S i l "
C o l c u l i o
BANGLADESHEhubansjwOr
ORISSA #
ANDHRAPRADESH BA r or
B E N G A L-
LAKSHAOWEEP(INDIA)
- 4 *
- 0 *
J21D I A O C £ A N
|80" ,64" |92°
9 EXECUTIVE SUMMARY
• OF£ THE DECADE PLAN OF WATER SUPPLY AND» SANITATION DECADE (APRIL 1981 - MARCH 1991)
• F0R
m GOA, DAMAN &.DIU
• Ù INTRODUCTION
• l0 The Union Territory of Goa, Daman and Diu comprises of three
independent land blocks situated on the West Coast of India, each blockW being now a separate district viz. (i) Goa, (ii) Daman, and (iii) Diu,_ separated from one another by distances of over 500 Kms.
& Prior to its liberation in 1961, only a few towns - Panaji, Ponda,Margao and Vasco and a few villages enroute had the privilege of protected
£ water supply. No town in this Territory was provided with sewerage systembefore liberation.
After liberation of Goa, the capacities of the existing waterw supply systems were increased. Besides meeting the increasing demand of^ the towns already covered under this system, the industrial demands were^ also covered. In addition to the above, many villages have been providedA with independent piped water supply schemes and drinking water wells under
Rural Water Supply Schemes.
• r* On the sanitation front, the capital town of Panaji was provided
W; with the sewerage system and was also provided with a Sewage Treatment_ Plant, covering a population of 58,000.
^ The Union Territory of Goa, extending over 3611 Km2 of area, lies. on the West Coast of India. Its capital, Panaji, is situated on the bank
Mk of the river Mandovi, 320 Km south of Bombay.
i0 Bound by the Arabian Sea on the West, the Goa district touchesMaharashtra in the North and Karnataka in the East and South. Its length
W from the extreme North to extreme South measures 105 Kms. and from Ea'st^ to West 60 Kms.
g| Daman is surrounded on all the three land sides by Gujarat Statewhile Diu is an island in the Gulf of Kambay, off the coast of the
£ Saurashtra (Gujarat State) near Veraval Port Town.
0 The areas of the Daman and Diu Districts are 72 Sq. Kms. and40 Sq. Kms. respectively.
• ' . • - * ^ - : -
• - ; - 2 -
The average rainfall of 3530 mm is more representative of coastalplaces than that of interior places like Colem and Dudsagar, where it attainsnearly double of the average.
2. SOCIO-ECONOMIC INDICATORS
As per 1971 Census, the Territory had a total population of 8.56lakhs. The population has increased to 10,82,117 as recorded in the 1981Census. (As per 1981 projection the population is 1161 thousands andas per 1991 projection, it will be 1519 thousands.) The rate of growthwitnessed in the decade 1971-81 is 26.15%.
In 1981 population projection, the number of urban dwellers isA.30 lakhs, accounting for 37% of the total population. The territory has17 towns.
As per the notification of Government of Goa, Daman and Diu, therewere in all 462 revenue villages in the Territory. Of them, 29 wereincluded in 17 towns. The remaining 433 revenue villages areconsidered to be separate rural units for the purpose of census. As per1981 projection, the rural population is 7.31 lakhs, which constitutes63% of the total population.
Per capita income for the year 1970-71 was Rs. 915.70 and hasincreased to Rs. 2011.61 in 1978-79.
The literacy for the population of the Territory is 55.86% basedon 1981 Census; that for the males is slightly higher (64.77%) than for
f the females which is 46.78% as against all India figures of 37.26% for thetotal population, 44.95% for the males and 23.95% for the females.
3. HEALTH ASPECTS
The crude birth rate per 1000 is 21 and death rate is 9.2 and theinfant mortality is 54 ..as in 1981. The territory has a variety ofhealth facilities, consisting of hospitals (both public and private), healthcentres (both urban and rural), Clinics (for special diseases like T.B.and Leprosy) and Family Welfare Institutions.
4. WATER RESOURCES
Part of rain water flows percolate down into the ground, to jointhe ground water. The rainfall run off co-efficient is 0,70 and thus70% of rain water flows on surface. The total surface water resources ofthe Territory can be taken as 8670 million cubic meters.
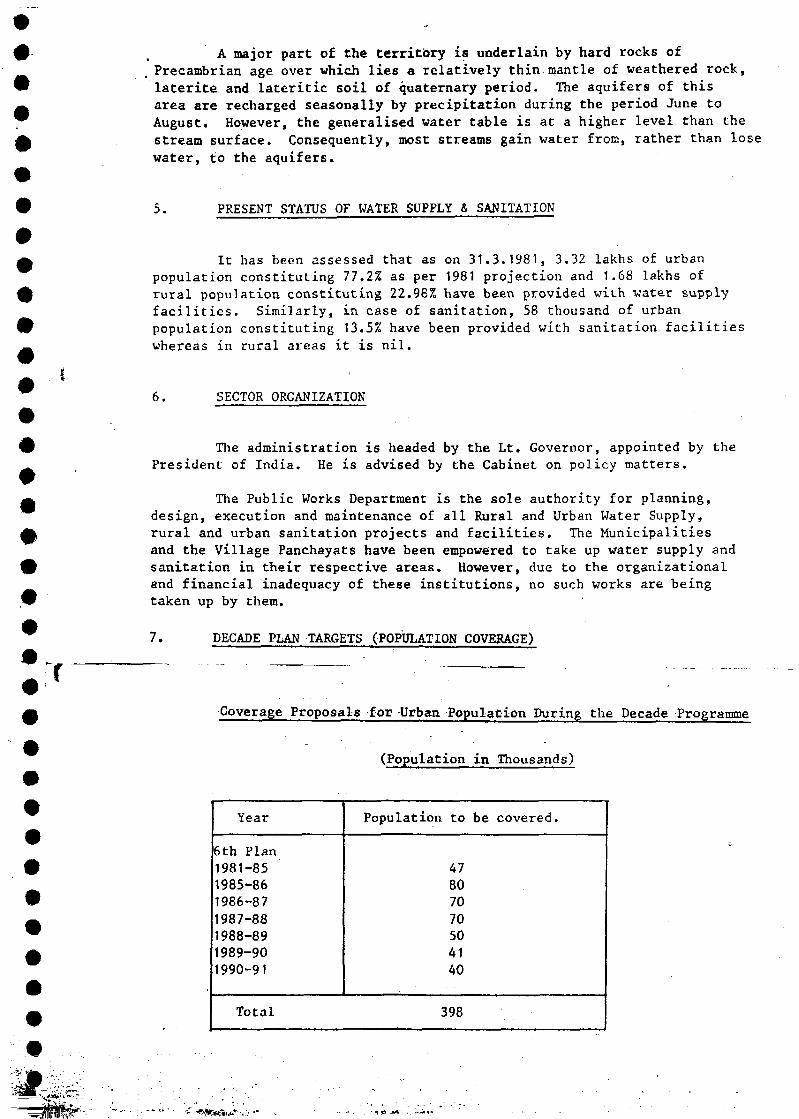
A major part of the territory is underlain by hard rocks ofPrecambrian age over which lies a relatively thin mantle of weathered rock,latérite and lateritic soil of quaternary period. The aquifers of thisarea are recharged seasonally by precipitation during the period June toAugust. However, the generalised water table is at a higher level than thestream surface. Consequently, most streams gain water from, rather than losewater, to the aquifers.
5. PRESENT STATUS OF WATER SUPPLY & SANITATION
It has been assessed that as on 31.3.1981, 3.32 lakhs of urbanpopulation constituting 77.2% as per 1981 projection and 1.68 lakhs ofrural population constituting 22.98% have been provided with water supplyfacilities. Similarly, in case of sanitation, 58 thousand of urbanpopulation constituting 13.5% have been provided with sanitation facilitieswhereas in rural areas it is nil.
6. SECTOR ORGANIZATION
The administration is headed by the Lt. Governor, appointed by thePresident of India. He is advised by the Cabinet on policy matters.
The Public Works Department is the sole authority for planning,design, execution and maintenance of all Rural and Urban Water Supply,rural and urban sanitation projects and facilities. The Municipalitiesand the Village Panchayats have been empowered to take up water supply andsanitation in their respective areas. However, due to the organizationaland financial inadequacy of these institutions, no such works are beingtaken up by them.
7.
rDECADE PLAN TARGETS (POPULATION COVERAGE)
Coverage Proposals for Urban Population During the Decade Programme
(Population in Thousands)
Year
6th Plan1981-851985-861986-871987-881988-891989-901990-91
Total
Population to be covered.
47807070504140
398
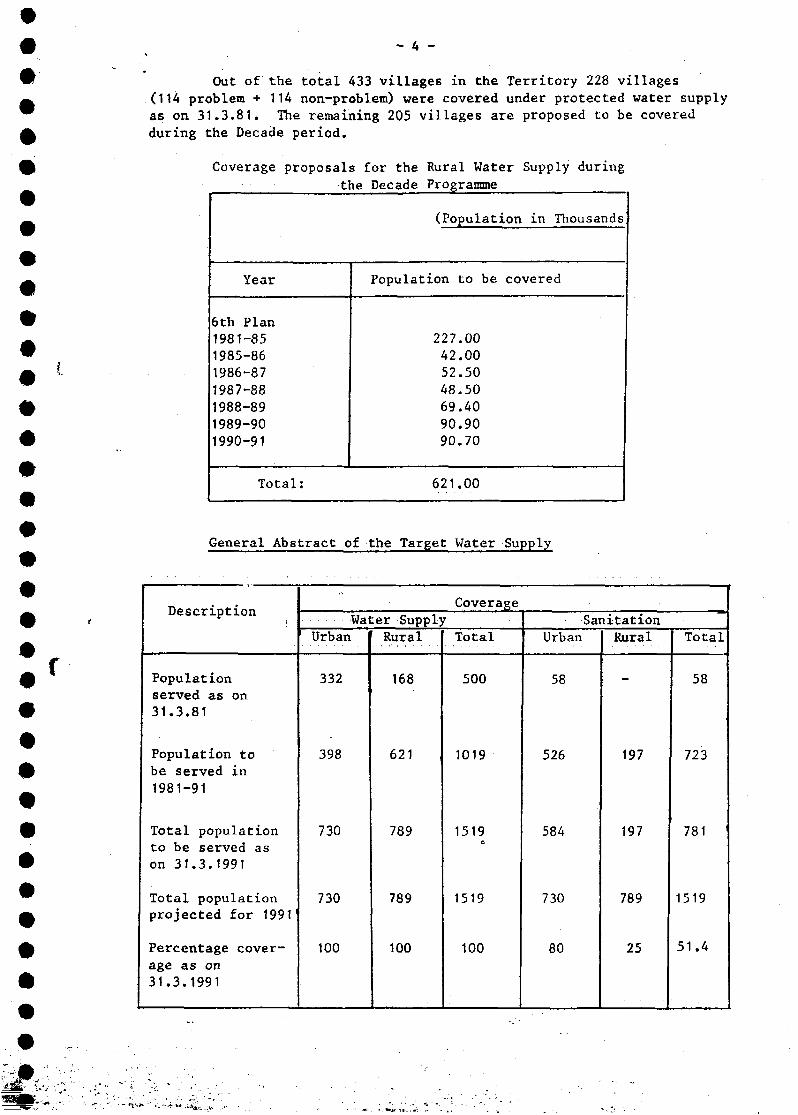
#
#
Out of the total 433 villages in the Territory 228 villages(114 problem + 114 non-problem) were covered under protected water supplyas on 31.3.81. The remaining 205 villages are proposed to be coveredduring the Decade period.
Coverage proposals for the Rural Water Supply during
the Decade Programme
Year
6th Plan1981-851985-861986-871987-881988-891989-90
1990-91
Total:
(Population in Thousands
Population to be covered
227.0042.0052.5048.5069.4090.9090.70
621.00
General Abstract of the Target Water Supply
Description
Populationserved as on31.3.81
Population to
be served in
1981-91
Total populationto be served ason 31.3.1991
Total populationprojected for 199T
Percentage cover-age as on31.3.1991
-Coverage
Water SupplyUrban
332
398
730
730
100
Rural
168
621
789
789
100
Total
500
1019
1519
1519
100
SanitationUrban
58
526
584
730
80
Rural
-
197
197
789
25
Total
58
723
781
1519
51.4
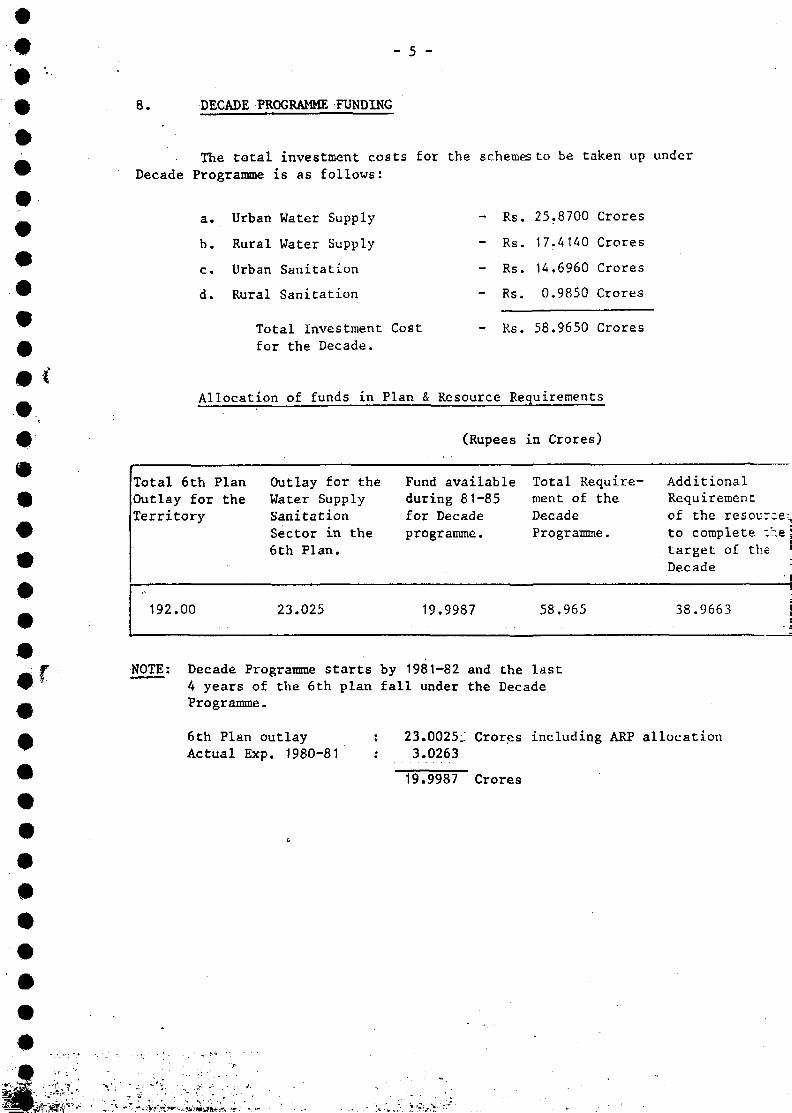
- 5 -
8. DECADE PROGRAMME FUNDING
The total investment costs for the schemes to be taken up under
Decade Programme is as follows:
a. Urban Water Supply
b. Rural Water Supply
c. Urban Sanitation
d. Rural Sanitation
Total Investment Cost
for the Decade.
- Rs. 25.8700 Crores
- Rs. 17.4140 Crores
- Rs. 14.6960 Crores
- Rs. 0.9850 Crores
- Rs. 58.9650 Crores
Allocation of funds in Plan & Resource Requirements
(Rupees in Crores)
Total 6th PlanOutlay for theTerritory
Outlay for theWater SupplySanitationSector in the6th Plan.
Fund availableduring 81-85for Decadeprogramme.
Total Require-ment of theDecadeProgramme.
AdditionalRequirementof the resource;,to complete the jtarget of the !
Decade• I
192.00 23.025 19.9987 58.965 38.9663
NOTE: Decade Programme starts by 1981-82 and the last4 years of the 6th plan fall under the DecadeProgramme.
6th Plan outlayActual Exp. 1980-81
23.0025.: Crores including ARP allocation3.0263
19.9987 Crores
" - . : : i •.;- i-'r-
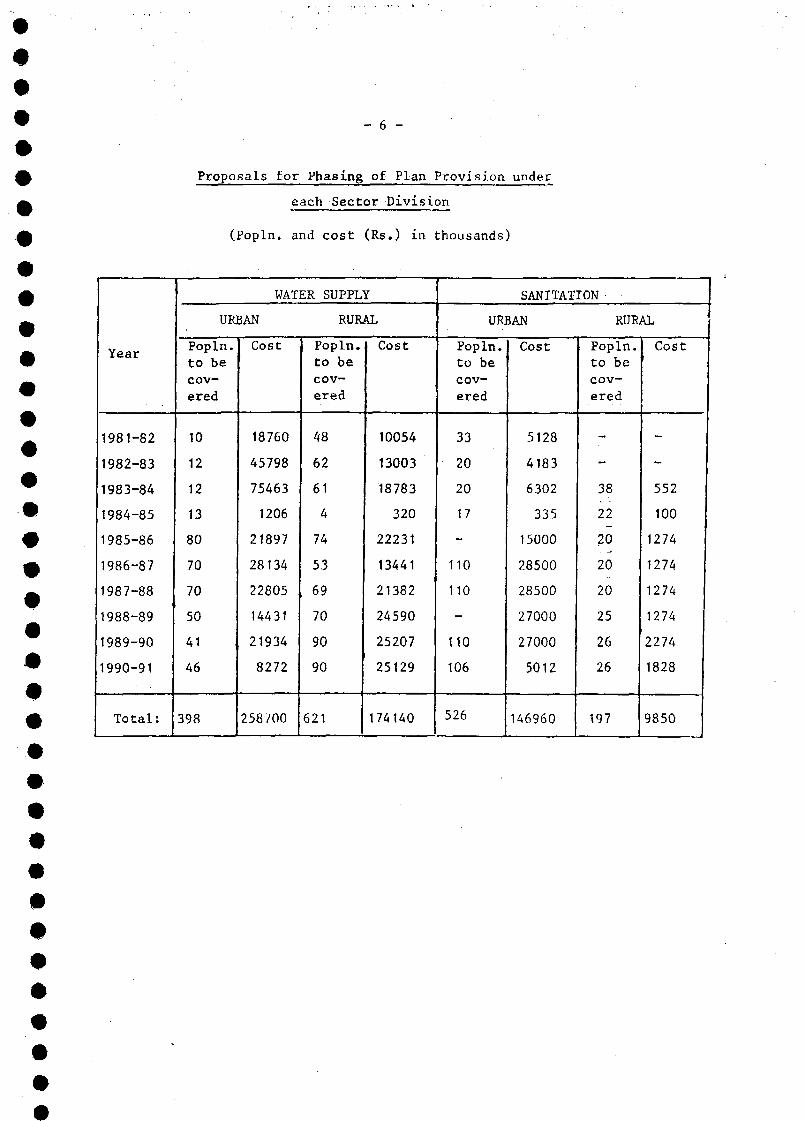
- 6 -
Proposals for Phasing of Plan Provision under
each Sector Division
(Popln. and cost (Rs.) in thousands)
Year
1981-82
1982-83
1983-84
1984-85
1985-86
1986-87
1987-88
1988-89
1989-90
1990-91
Total:
WATER SUPPLY
URBAN
Popln.to becov-ered
10
12
12
13
80
70
70
50
41
46
398
Cost
18760
45798
75463
1206
21897
28134
22805
14431
21934
8272
258700
RURAL
Popln.to becov-ered
48
62
61
4
74
53
69
70
90
90
621
Cost
10054
13003
18783
320
22231
13441
21382
24590
25207
25129
174140
SANITATION |
URBAN
Popln.to becov-ered
33
20
20
17
-
110
110
_
110
106
526
Cost
5128
4183
6302
335
15000
28500
28500
27000
27000
5012
146960
RURAL
Popln,to becov-ered
-
-
38
22
20
20
20
25
26
26
197
Cost
-
-
552
100
1274
1274
1274
1274
2274
1828
9850
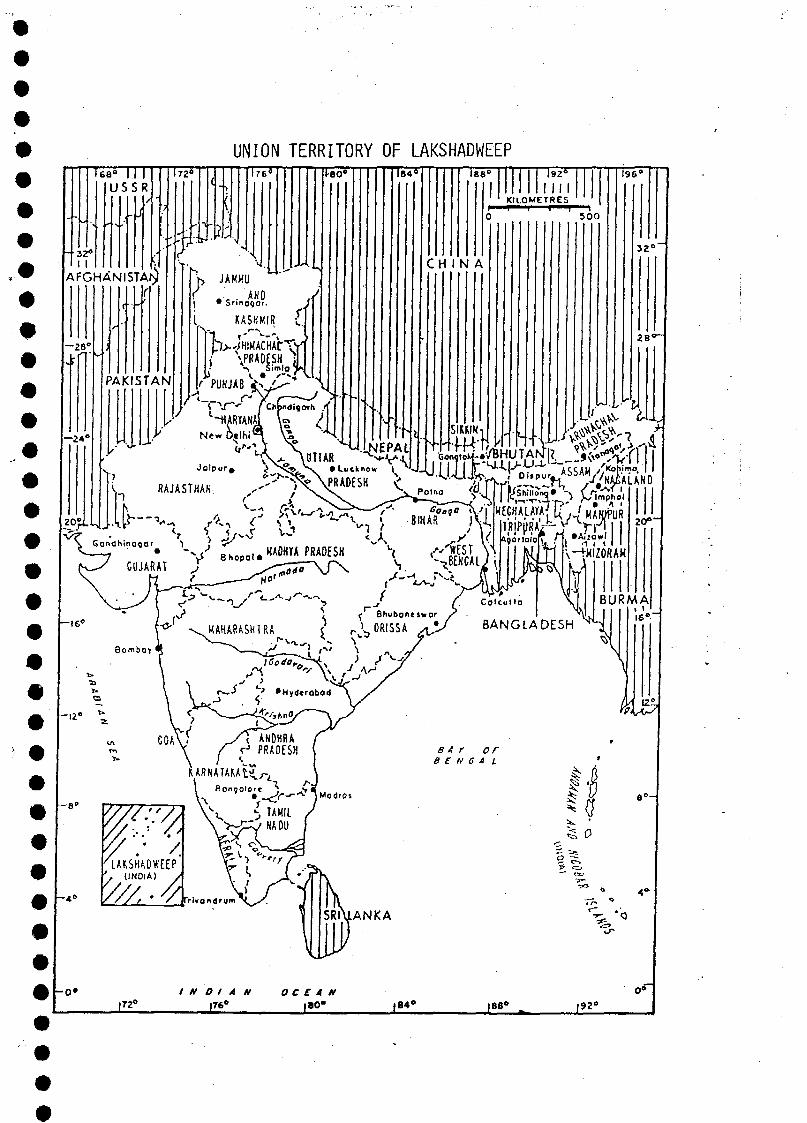
UNION TERRITORY OF LAKSHADWEEP
KASHMIR u
j > \PRAO£SH )
^LAKSHADWEEP' . (INDIA) y
frivondfum
-o«J72»
INDIAN OCEAN|76° (80* ,B4» IBS" |9Z°
EXECUTIVE SUMMARYOF
THE DECADE PLAN OF WATER SUPPLY ANDSANITATION SECTOR (APRIL 1981 - MARCH 1991)
FOR
LAKSHADWEEP
T- INTRODUCTION
There is no separate Sector/Services to take up the Water Supplyand Sanitation Works in this Union Territory of Lakshadweep. The LakshadweepPublic Works Department is however entrusted with this job. Since there isno Public Health wing in the Lakshadweep Public Works Department, the aadvice of Central Public Health Environmental Engineering Organization(CPHEEO), Central Ground Water Board, Geological Survey of India and KeralaPublic Health Engineering Department was sought for. The investigation anddesign of the water supply and sanitation scheme is ultimately entrusted withthe Kerala Public Health Engineering Department. The construction partwill be taken up by the Lakshadweep Public Works Department.
This territory consists of 36 coral islands out of which 10 areinhabited. The biggest of this group viz., Andrott has an area of 4.8 sq.kms. and the smallest inhabited island Bitra has 0.1 sq.kms. These islandsare scattered between 8° and 12"-30' north latitude and between 71° and 74°east longitude. They are lying in the Arabian Sea about 192 to 320 kms. offthe west coast of Kerala State.
2. SOCIO-ECONOMIC INDICATORS
Total population as per
1971 Census 32 000
-do- 1981 Projection 36 000 (*)Projection for 1990 40 000 (*)
(*) As per Decade tables.
The growth rate according to 1981 Census is 26.49Z per decade.There is not much migration. The local population in this territory areall scheduled tribes. All the population is living in rural areas. Thefigures for GNP under preparation.
The main occupation is Agriculture and Fishing.
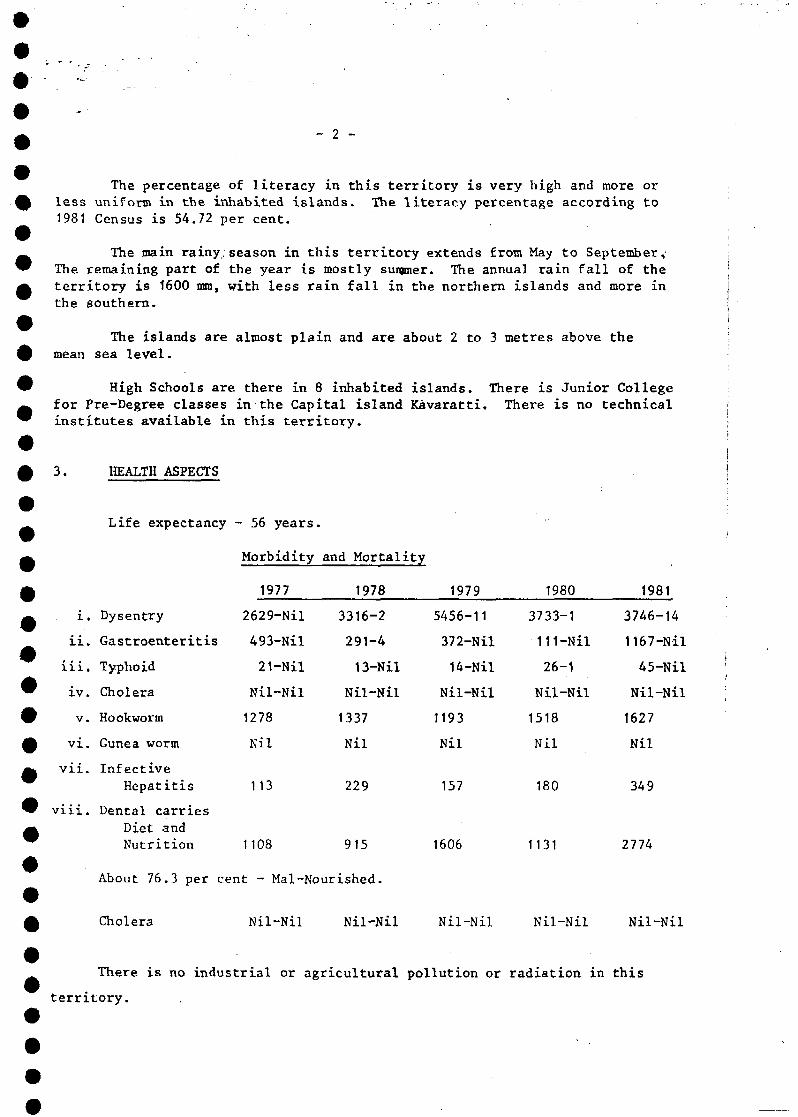
-~ 9 —
The percentage of literacy in this territory is very high and more orless uniform in the inhabited islands. The literacy percentage according to1981 Census is 54.72 per cent.
The main rainy;season in this territory extends from May to September,The remaining part of the year is mostly suiamer. The annual rain fall of theterritory is 1600 mm, with less rain fall in the northern islands and more inthe southern.
The islands are almost plain and are about 2 to 3 metres above themean sea level.
High Schools are there in 8 inhabited islands. There is Junior Collegefor Pre-Degree classes in the Capital island Kâvaratti. There is no technicalinstitutes available in this territory.
3. HEALTH ASPECTS
Life expectancy - 56 years.
Morbidity and Mortality
: i.
ii.
iii.
iv.
V.
vi.
vii.
viii.
Dysentry
Gastroenteritis
Typhoid
Cholera
Hookworm
Gunea worm
InfectiveHepatitis
Dental carriesDiet andNutrition
1977
2629-Nil
493-Nil
21-Nil
Nil-Nil
1278
Nil
113
1108
1978
3316-2
291-4
13-Nil
Nil-Nil
1337
Nil
229
915
1979
5456-11
372-Nil
14-Nil
Nil-Nil
1193
Nil
157
1606
1980
3733-1
111-Nil
26-1
Nil-Nil
1518
Nil
180
1131
1981
3746-14
1167-Nil
45-Nil
Nil-Nil
1627
Nil
349
27/'4
About 76.3 per cent - Mai-Nourished.
Cholera Nil-Nil Nil-Nil Nil-Nil Nil-Nil Nil-Nil
There is no industrial or agricultural pollution or radiation in this
territory.
— *} *-.
4, WATER RESOURCES
The only source of Drinking Water available in this territory is therain water which percolates down through the porous sandy soil and floatingover the sub soil saline water. However the entire water available in thefloating sweet water lens cannot be extracted on account of technicalproblems on continuous pumping. It is estimated that sufficient quantity ofdrinking water is available in the s-b soil taking into account the trans-poration, limitation of extraction of the ground water etc.
5. PRESENT STATUS OF WATER SUPPLY & SANITATION
- It is proposed to cover the entire population spread in the area 329 sq.kms. during the decade.
At present there is no organised water supply and sanitation schemes inA this territory. The general public is utilising wells as the source of drinking
water. There is no special disposal method for the used water. Most of the£ Government residential accommodation has septic tanks with soak pits. Certain
private houses of the locals have also septic tank facilities. Due to theW increasing number of construction of residential accommodation, it has become_ difficult to keep the safe distance between drinking water well and the septic™ tank soak pits. In addition to this problem existence of the burial grounds,A bathing tanks etc., nearer to the drinking water wells also creates pollution
problem to the drinking water.
As on 31.3.81, only about 3000 people in the rural areas have been0 provided with protected water supply which constitute 8.50% of the total
population. As regards sanitation the facility provided is practically nil.
^ The quality of water available in the wells are polluted. People have^ to boil the water and use for their drinking purposes.
A preliminary report has been received from the Kerala Public Health0 Engineering Department on the feasibility of having organised water supply
in this territory. Detailed investigation is being carried out by the# K.P.H.E.D.
^ The studies regarding desalination of water had been already carriedA o û t with the assistance of the Central Salt and Marine Research Institute,
Bhavnagar.
6. SECTOR ORGANIZATION
' So far there is no separate department/agencies exclusively concerned|WÎth Water Supply and Sanitation Sector. The Public Works Department of theLakshadweep Administration is entrusted with this sector.
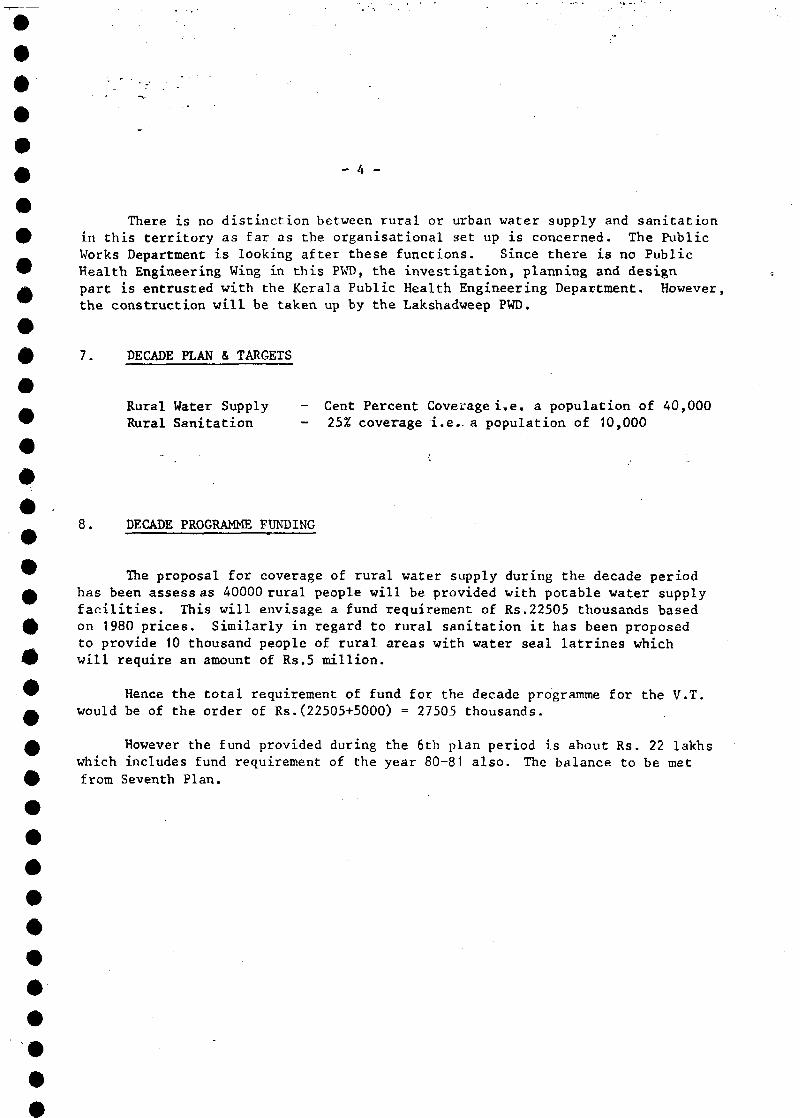
- 4 -
There is no distinction between rural or urban water supply and sanitationin this territory as far as the organisational set up is concerned. The PublicWorks Department is looking after these functions. Since there is no PublicHealth Engineering Wing in this PWD, the investigation, planning and designpart is entrusted with the Kerala Public Health Engineering Department. However,the construction will be taken up by the Lakshadweep PWD.
7. DECADE PLAN & TARGETS
Rural Water Supply - Cent Percent Coverage i.e. a population of 40,000Rural Sanitation - 25% coverage i.e. a population of 10,000
8. DECADE PROGRAMME FUNDING
The proposal for coverage of rural water supply during the decade periodhas been assess as 40000 rural people will be provided with potable water supplyfacilities. This will envisage a fund requirement of Rs.22505 thousands basedon 1980 prices. Similarly in regard to rural sanitation it has been proposedto provide 10 thousand people of rural areas with water seal latrines whichwill require an amount of Rs.5 million.
Hence the total requirement of fund for the decade programme for the V.T.would be of the order of Rs.(22505+5000) = 27505 thousands.
However the fund provided during the 6th plan period is about Rs. 22 lakhswhich includes fund requirement of the year 80-81 also. The balance to be metfrom Seventh Plan.
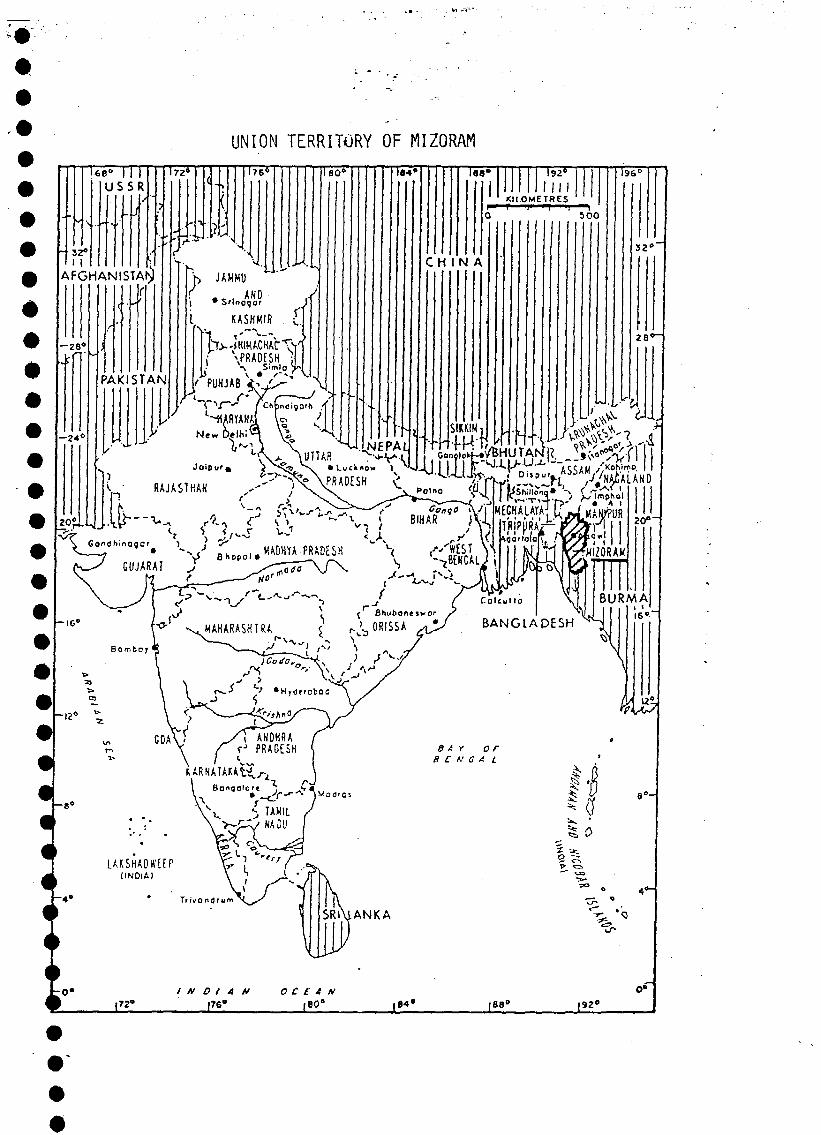
UNION TERRITORY OF MIZORAM
32*II
AFGHANISTAN
T V * ' /'ChfcnaisO'h i<\
iew6«ih;^ \% < !
S '-ÏBEKCAL j |
Bongoiore *) ^
I N D I A N OCEAN
LAKSHADH'EEP(INDIA)
:o*(72»
EXECUTIVE SUMMARYOF
THE DECADE PLAN OF WATER SUPPLY ANDSANITATION SECTOR (APRIL 1981 - MARCH 1991)
FOR
MIZORAM
1. INTRODUCTION.
The Union Territory of Mizoram is located in the North Easternpart of India. In the North it is encircled by the States of Assam andManipur, the western part has Tripura and Bangladesh, the South is boundedby Bangladesh and it has Burma on the Southern border.
Mizoram was one of the districts of Assam till 1972. Union Territorywas granted to Mizoram from January 1972. There are three districts namely;Aizwal district with its headquarters at Aizwal, Lunglei district withheadquarter at Lunglei and Chittuipui district with the headquarters at Saiha.Aizwal is the capital of Mizoram and is situated at a distance of 180 kms. fromSilchar, the district headquarters of Cauchar district of Assam. The nearestrailhead and Airport is Silchar.
Mizoram being hilly terrain is mostly covered with forest. The watersources are mainly from springs, streams and rivers. Underground water ispractically non-existant. Almost all the towns and villages are given gravitywater supply, but most of the towns and villages sources are mostly below them.
The Union Terriroty of Mizoram has an area of 21,082 sq.km. Theterritory is mostly hilly and traversed by hill ranges and rivers running inthe North-south direction. The average altitude of Mizoram hills is about1000 metres above mean sea level. It has a very good moderate climate through-out the whole year. The average annual rainfall of Mizoram is 200 - 250 cms.
2. SOCIO-ECONOMIC INDICATIONS
The population of Mizoram as per 1971 census was 332,390. Theprojected population on 31 March 1981 and 31 March 1991 as per the figurespublished by the Registrar General of Inida are taken as 422,000 and 536,000respectively.
The general economic condition in Mizoram is very poor. The per capitaincome of Mizoram is below the poverty line. The income is mainly derivedfrom Agriculture, trade and commercial, contractor-ship, small scale industriesand government service. There is no industry worth mentioning in Mizoram.Literacy is 59.5%.
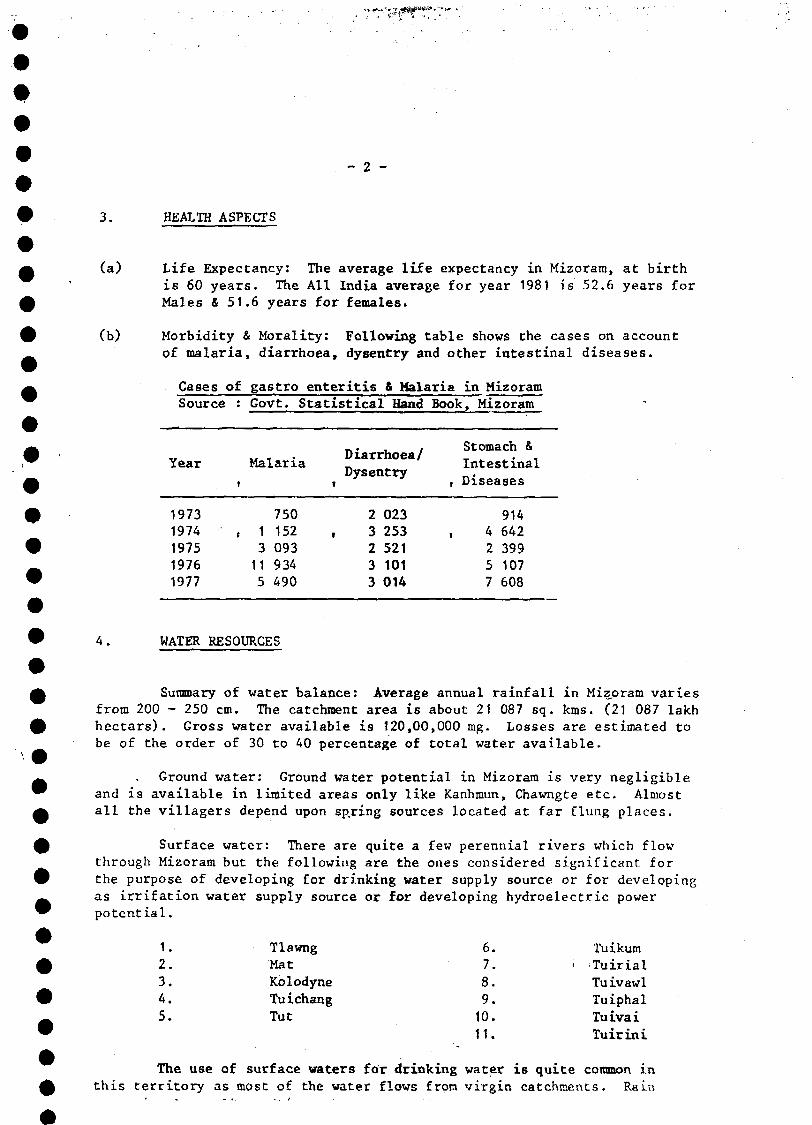
- 2 -
3. HEALTH ASPECTS
(a) Life Expectancy: The average life expectancy in Mizoram, at birthis 60 years. The All India average for year 1981 is 52.6 years forMales & 51.6 years for females*
(b) Morbidity & Morality: Following table shows the cases on accountof malaria, diarrhoea, dysentry and other intestinal diseases.
Cases of gastro enteritis & Malaria in MizoramSource : Govt. Statistical Hand Book, Mizoram
Fear
19731974197519761977
Malariai
750t 1 152
3 09311 9345 490
Diarrhoea/Dysentry
2 023, 3 253
2 5213 1013 014
Stomach &IntestinalDiseases
9144 6422 3995 1077 608
4. WATER RESOURCES
Summary of water balance: Average annual rainfall in Mizoram variesfrom 200 - 250 cm. The catchment area is about 21 087 sq. kms. (21 087 lakhhectars). Gross water available is 120,00,000 mg. Losses are estimated tobe of the order of 30 to 40 percentage of total water available.
Ground water: Ground water potential in Mizoram is very negligibleand is available in limited areas only like Kanhmun, Chawngte etc. Almostall the villagers depend upon spring sources located at far flung places.
Surface water: There are quite a few perennial rivers which flowthrough Mizoram but the following are the ones considered significant forthe purpose of developing for drinking water supply source or for developingas irrifation water supply source or for developing hydroelectric powerpotential.
1.2.3.4.5.
TlawngMatKolodyneTuichangTut
6.7.8.9.10.11.
Tuikum' Tuirial
Tu ivawlTuiphalTuivaiTuirini
The use of surface waters for drinking water is quite common inthis territory as most of the water flows from virgin catchments. Rain
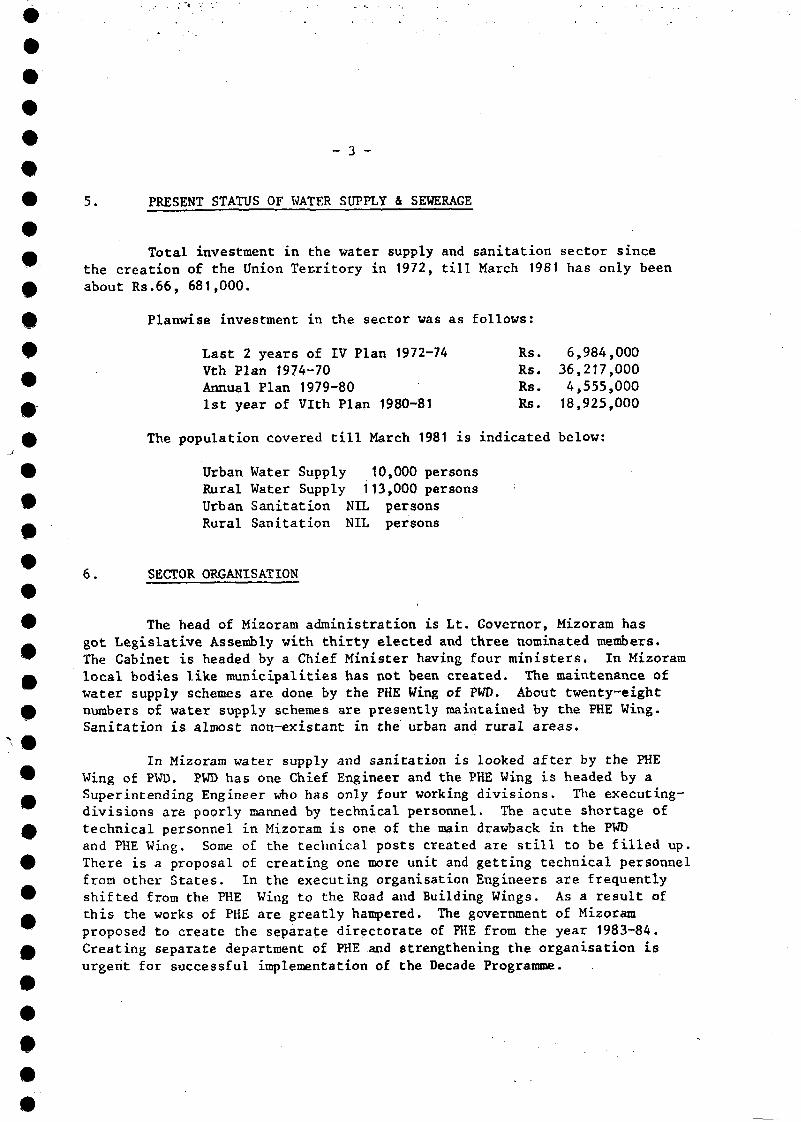
5. PRESENT STATUS OF WATER SUPPLY & SEWERAGE
Total investment in the water supply and sanitation sector sincethe creation of the Union Territory in 1972, till March 1981 has only beenabout Rs.66, 681,000.
Planwise investment in the sector was as follows:
Last 2 years of IV Plan 1972-74 Rs. 6,984,000Vth Plan 1974-70 Rs. 36,217,000Annual Plan 1979-80 Rs. 4,555,0001st year of Vlth Plan 1980-81 Rs. 18,925,000
The population covered till March 1981 is indicated below:
Urban Water Supply 10,000 personsRural Water Supply 113,000 personsUrban Sanitation NIL personsRural Sanitation NIL persons
6. SECTOR ORGANISATION
The head of Mizoram administration is Lt. Governor, Mizoram hasgot Legislative Assembly with thirty elected and three nominated members.The Cabinet is headed by a Chief Minister having four ministers. In Mizoramlocal bodies like municipalities has not been created. The maintenance ofwater supply schemes are done by the PHE Wing of PWD. About twenty-eightnumbers of water supply schemes are presently maintained by the PHE Wing.Sanitation is almost non-existant in the urban and rural areas.
In Mizoram water supply and sanitation is looked after by the PHEWing of PWD. PWD has one Chief Engineer and the PHE Wing is headed by aSuperintending Engineer who has only four working divisions. The executing-divisions are poorly manned by technical personnel. The acute shortage oftechnical personnel in Mizoram is one of the main drawback in the PWDand PHE Wing. Some of the technical posts created are still to be filled up.There is a proposal of creating one more unit and getting technical personnelfrom other States. In the executing organisation Engineers are frequentlyshifted from the PHE Wing to the Road and Building Wings. As a result ofthis the works of PHE are greatly hampered. The government of Mizoramproposed to create the separate directorate of PHE from the year 1983-84.Creating separate department of PHE and strengthening the organisation isurgent for successful implementation of the Decade Programme.
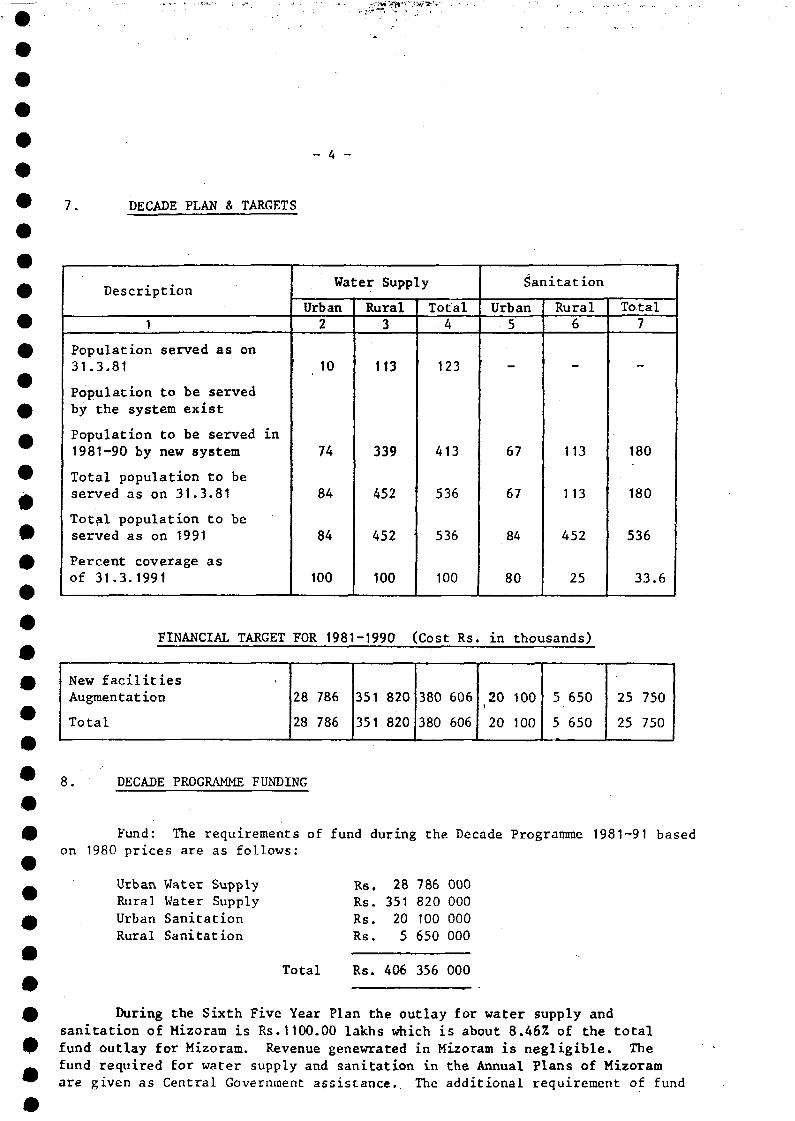
7. DECADE PLAN & TARGETS
Description
1
Population served as on31.3.81
Population to be servedby the system exist
Population to be served in1981-90 by new system
Total population to beserved as on 31.3.81
Total population to beserved as on 1991
Percent coverage asof 31.3.1991
Water Supply
Urban2
10
74
84
84
100
Rural3
113
339
452
452
100
Total4
123
413
536
536
100
Sanitation
Urban5
_
67
67
84
80
Rural6
_
113
113
452
25
Total7
180
180
536
33.6
FINANCIAL TARGET FOR 1981-1990 (Cost Rs. in thousands)
New facilitiesAugmentation
Total
28
28
786
786
351
351
820
820
380
380
606
606
20
20
100
100
5
5
650
650
25
25
750
750
8. DECADE PROGRAMME FUNDING
Fund: The requirements of fund during the Decade Programme 1981-91 basedon 1980 prices are as follows:
Urban Water SupplyRural Water SupplyUrban SanitationRural Sanitation
Rs. 28 786 000Rs. 351 820 000Rs. 20 100 000Rs. 5 650 000
Total Rs. 406 356 000
During the Sixth Five Year Plan the outlay for water supply andsanitation of Mizoram is Rs.1100.00 lakhs which is about 8.46Z of the totalfund outlay for Mizoram. Revenue genewrated in Mizoram is negligible. Thefund required for water supply and sanitation in the Annual Plans of Mizoramare given as Central Government assistance.. The additional requirement of fund
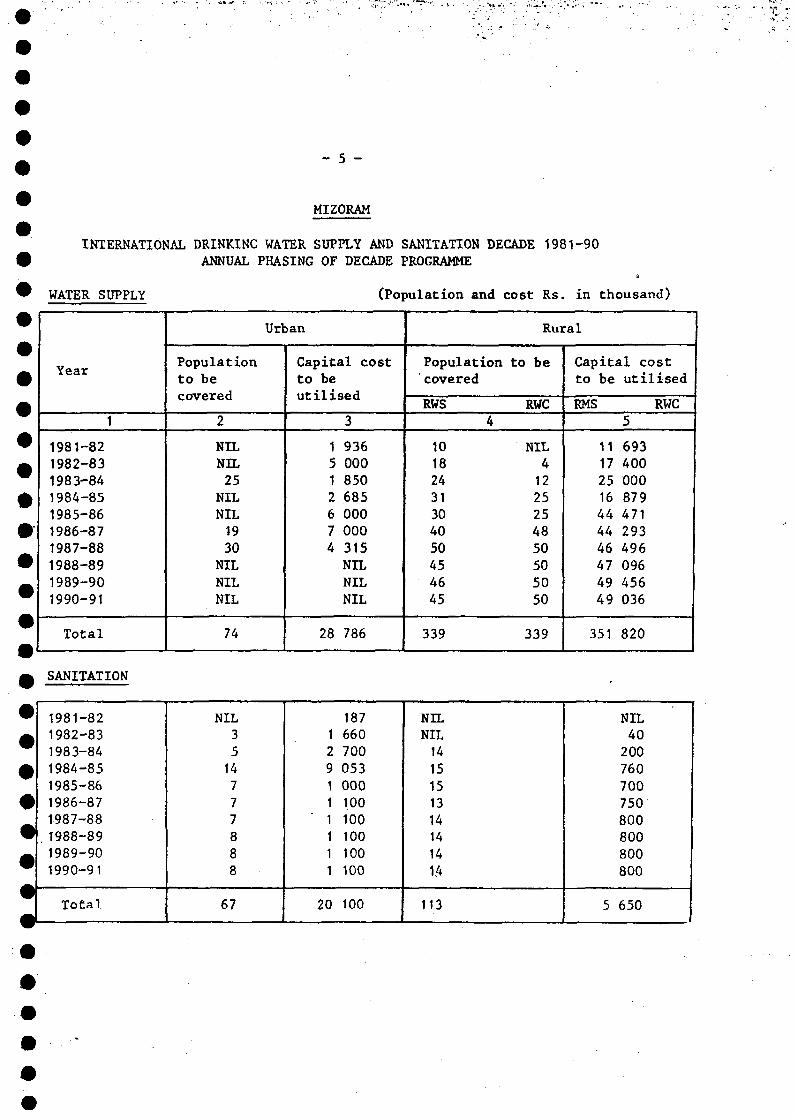
- 5 -
MIZORAM
INTERNATIONAL DRINKING WATER SUPPLY AND SANITATION DECADE 1981-90ANNUAL PHASING OF DECADE PROGRAMME
WATER SUPPLY (Population and cost Rs. in thousand)
lear
1
1981-821982-831983-841984-851985-861986-871987-88
1988-891989-901990-91
Total
Populationto becovered
2
NILNIL25NILNIL1930
NILNILNIL
74
Urban
Capital costto beutilised
3
1 9365 0001 8502 6856 0007 0004 315NILNILNIL
28 786
Populationcovered
RWS4
10182431304050454645
339
Rural
to be
RWC
NIL41225254850505050
339
Capital costto be utilised
RMS RWC
5
11 69317 40025 00016 87944 47144 29346 49647 09649 45649 036
351 820
SANITATION
1981-821982-831983-841984-851985-861986-871987-88. 1988-891989-901990-91
Total
NIL3514777888
67
1871 6602 7009 0531 0001 1001 1001 1001 1001 100
20 100
NILNIL14151513141414
1.4
113
NIL40200760700750800800800800
5 650
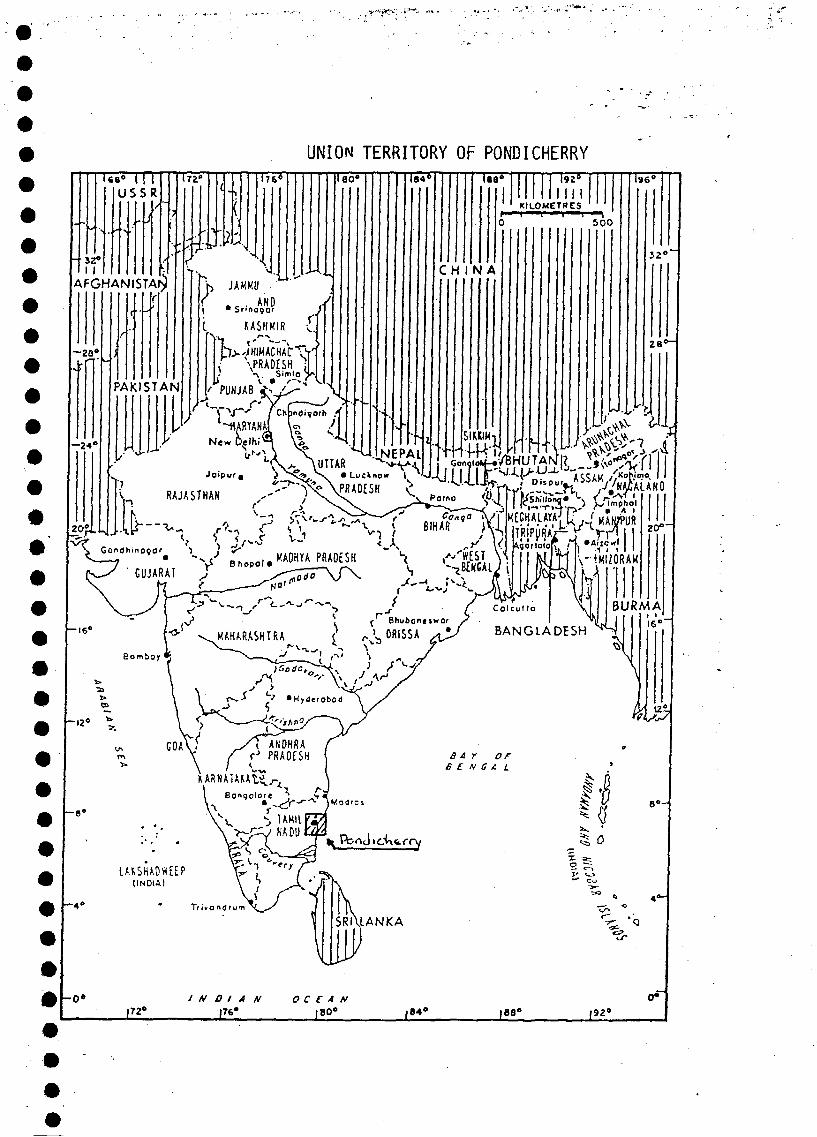
UNION TERRITORY OF PONDICHERRYU8° I
USSR
i
32*
AFGHANISTANr
-28'
-24'
ITZ"
PAKISTAN
176*
>JAMMU
• S'inagor
KASHMIR
P^HIMACHArTyj \PRAOESK -\! \ Simla %
f PUNJAB
180"
i
184 I883 l9Z6
NilKILOMETRES
5 0 0
C H I N A52°"
28 C
.•T.
L .vv iA.
BANGLADESH ^
- 0 * O I AJ76»
OCEAN|B0° ,84» (88° 192°
EXECUTIVE SUMMARYOF
THE DECADE PLAN OF WATER SUPPLY AND
SANITATION SECTOR (APRIL 1981 - MARCH 1991)
FOR
PONDI CHERRY
1. INTRODUCTION
The Union Territory of Pondicherry comprises of the following fourregions:
1. Pondicherry forming an enclave in Tamil Nadu on the eastcoast about 160 km south of Madras,
2. Karaikal also forming an enclave in Tamil Nadu on the eastcoast about 310 km south of Madras.
3. Yanam a small enclave in Andhra Pradesh on the east coastof the estuary of the river Godavari, located at bout 650 kmnorth of Madras and 27 km south of Kakinada.
4. Mahe an enclave in Kerala on the east coast about 160 kmsouth of Mangalore.
Pondicherry forming an enclave in Tamil Nadu on the east coast is theheadquarters of the union territory. The area about 290 sq. kms in extentfalls within North Latitudes 12° 03' and 11° 47' and east Longitudes 79° 36'and 79° 52'. Pondicherry town is located at the centre of the area with apopulation of a little over 90,000 as per 1971 census. It is a minor port160 km south of Madras. It is accessible by rail and road from neighbouringtowns.
Climate: The climate is moderate in all the four regions.
Rainfall: Mahe region lying in the west coast which receive thehighest rainfall of 3754 mm. The south west monsoon from June to Septemberbrings in a very heavy rain to this region. The other three regions lyingin the East coast receives rain from October to December, from North eastmonsoon. The average annual rainfall in Pondicherry is 1199 mm, in Karaikal1123 mm and Yanam 1077 mm. In normal years the rainfall is sufficient forirrigation purposes and for drinking water supply by replanishing the groundwater stroage.
Topography: Mahe lies in the hilly terrains of western ghats.Pondicherry, Karaikal and Yanam are located in the river deltas on theeastern coastal area. Host of the areas of the three regions are plain andlow lying.
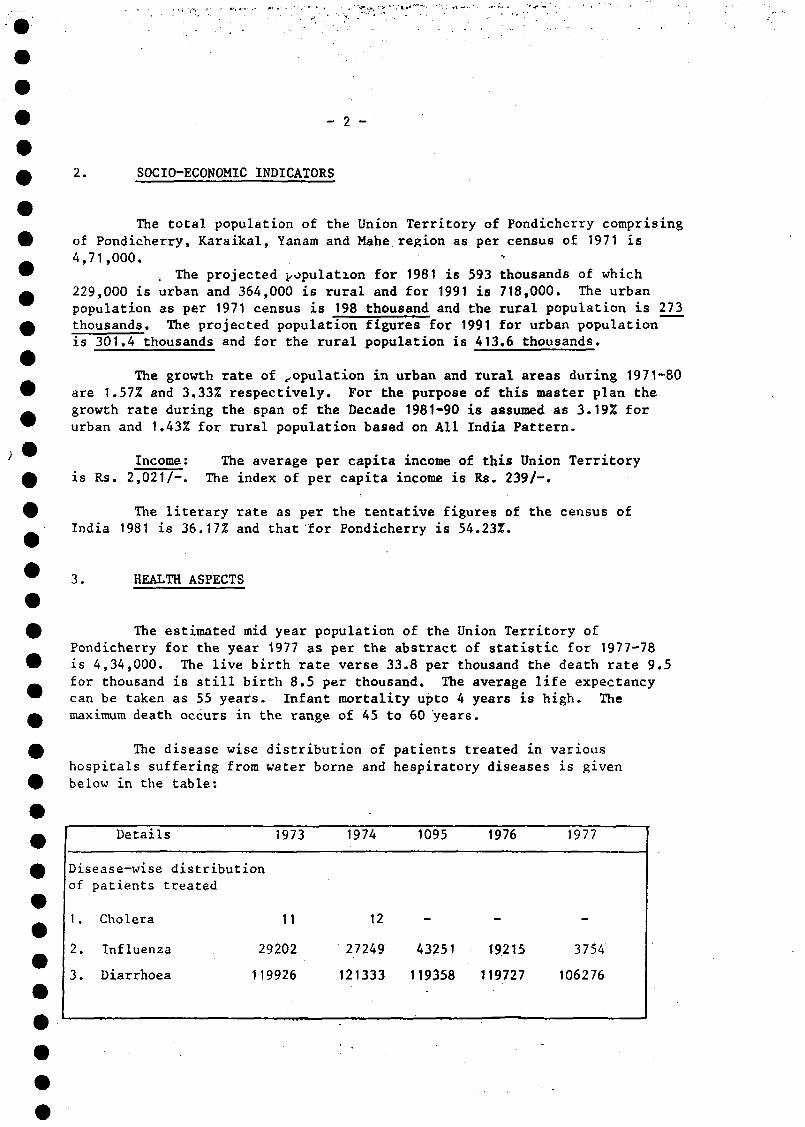
2 -
2. SOCIO-ECONOMIC INDICATORS
The total population of the Union Territory of Pondicherry comprisingof Pondicherry, Karaikal, Yanam and Mahe region as per census of 1971 is4,71,000.
, The projected population for 1981 is 593 thousands of which229,000 is urban and 364,000 is rural and for 1991 is 718,000. The urbanpopulation as per 1971 census is 198 thousand and the rural population is 273thousands. The projected population figures for 1991 for urban populationis 301.4 thousands and for the rural population is 413,6 thousands.
The growth rate of population in urban and rural areas during 1971-80are 1.57% and 3.33% respectively. For the purpose of this master plan thegrowth rate during the span of the Decade 1981-90 is assumed as 3.19% forurban and 1.43% for rural population based on All India Pattern.
Income :is Rs. 2,021/-.
The average per capita income of this Union TerritoryThe index of per capita income is Rs. 239/-.
The literary rate as per the tentative figures of the census ofIndia 1981 is 36.17% and that for Pondicherry is 54.23%.
3. HEALTH ASPECTS
The estimated mid year population of the Union Territory ofPondicherry for the year 1977 as per the abstract of statistic for 1977-78is 4,34,000. The live birth rate verse 33.8 per thousand the death rate 9.5for thousand is still birth 8.5 per thousand. The average life expectancycan be taken as 55 years. Infant mortality upto 4 years is high. Themaximum death occurs in the range of 45 to 60 years.
The disease wise distribution of patients treated in varioushospitals suffering from water borne and hespiratory diseases is givenbelow in the table:
Details 1973
Disease-wise distributionof
1.
2.
3.
patients treated
Cholera
Influenza
Diarrhoea
11
29202
119926
1974
12
27249
121333
1095
-
43251
119358
1976
-
19215
119727
1977
-
3754
106276
- 3 -
Endemic Disease; Cholera cases reported during the summer season,when there is acute scarcity of water, is on the decrease. However, thereare several cases of Diarrhoea and dysentry. The incidence of Malaria isreported to be on the increase. The Medical Department with the assistanceVector Control Research Centre, Public Works Department and civic bodies istrying to control diseases transmitted by cectorm by trying to constraintheir fast breading in open and polluted "water bodies.
4. WATER RESOURCES
The total annual availability of water i.e. the gross potential inthe Union Territory is estimated at 450 M.Cum. Million cubic meters basedon the studies of the ground water cell of the Agriculture Department andbased on the surface water flows available from the annual precipitationand the ground water storage.
Ground water of potable quality is available in good quantities inmost of the parts of Pondicherry region, in Karaikal and Yanam regions.The ground water available is brackish in almost all places and hence wecannot depend on ground water sources. The net utilisable potential ofground water available due to limitation of extraction and economic viabilityis of the order of 310 M.Cum. The area that can be served by ground wateris of the order of 63% and the population that will be served will be 72%.
There are no large rivers traversing the Territory. But the tailreaches of the rivers flowing through Tamil Nadu, Andhra Pradesh and KeralaStates are flowing through these four territories before outfall into thesea. As such these rivers are subject to tidal efforts and the water inthe considerable land is saline.
There are 87 fresh water lakes which are utilised for irrigationpurposes. Many of these tanks receive water through diversion channelsbifercating from anicuts or weirs across rivers in Pondicherry region.The remaining tanks are rain fed. The canals in Pondicherry region serveexclusively the irrigation needs. Canals in Yanam serve both water supplyand irrigation. In Karaikal infiltration galleries constructed at the bedof the deltaio rivers serve the water supply needs. There are practicallyno hills streams as the regions are situated in coastal plains.
The total potential of surface water available is estimated at100 M.Cum. out of which the net utilisable potential will be about60 H. Cum.
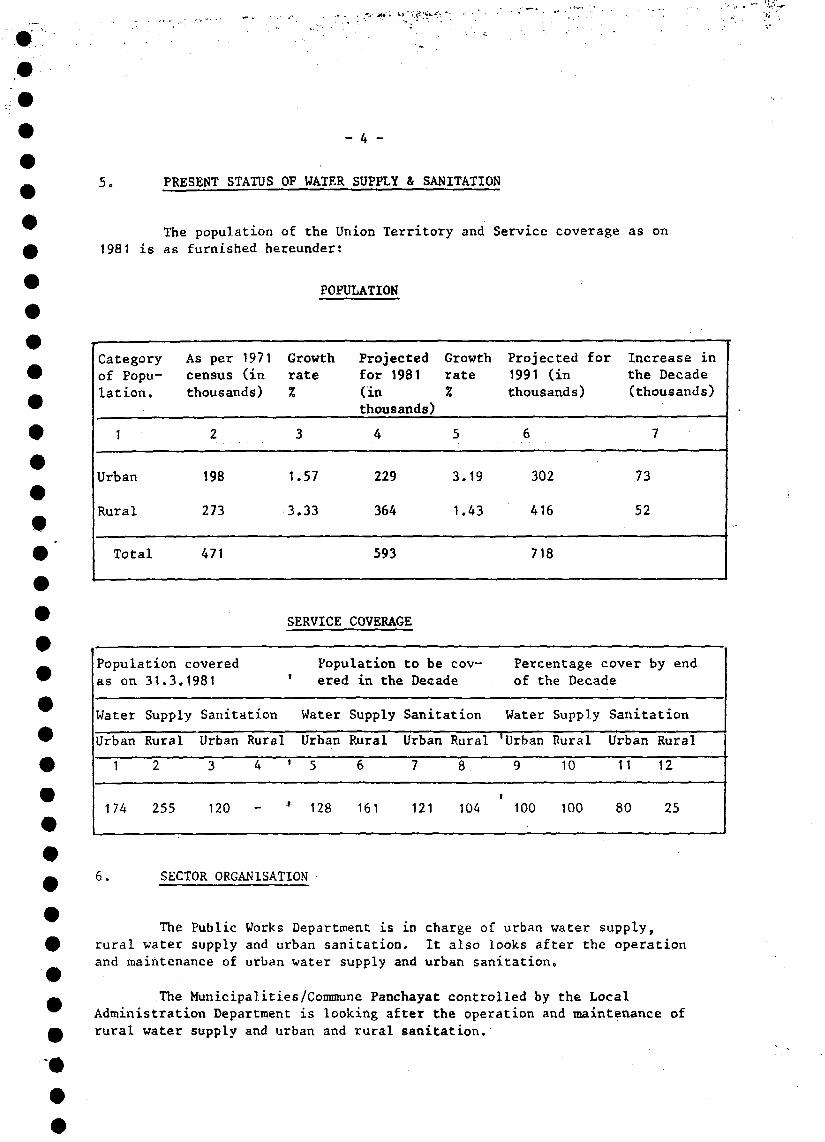
. - " '•&>.«•
- 4 -
5. PRESENT STATUS OF WATER SUPPLY & SANITATION
The population of the Union Territory and Service coverage as on1981 is as furnished hereunder:
POPULATION
Categoryof Popu-lation.
1
Urban
Rural
Total
As per 1971census (inthousands)
2
198
273
471
Growthrate%
3
1.57
3.33
Projectedfor 1981(inthousands)
4
229
364
593
Growthrate%
5
3.19
1.43
Projected for1991 (inthousands)
6
302
416
718
Increase inthe Decade(thousands)
7
73
52
SERVICE COVERAGE
Populationas on 31.3,
Water
Urban
1
174
covered1981 '
Supply Sanitation
Rural
2
255
Urban Rural
3 4 •
120 - *
Populationered in the
Water
Urban
5
128
Supply
Rural
6
161
to be cov-Decade
Sanitation
Urban Rural
7 8
121 104
Percentage cover by endof the Decade
Water Supply
'Urban Rural
9 10
100 100
Sanitation
Urban Rural
11 12
80 25
6. SECTOR ORGANISATION
The Public Works Department is in charge of urban water supply,rural water supply and urban sanitation. It also looks after the operationand maintenance of urban water supply and urban sanitation.
The Municipalities/Commune Panchayat controlled by the LocalAdministration Department is looking after the operation and maintenance ofrural water supply and urban and rural sanitation.
- 5 -
The Public Works Department is to look after the project identification,preparation of project report, execution, monitoring and evaluation of urbanwater supply, rural water supply and urban sewerage systems.
The operation and maintenance of urban water supply and urbansewerage system are taken by the Public Works Department where as the ruralwater supply and urban and rural sanitation is maintained by the Municipalitiesand Commune Panchayat.
7. DECADE PLAN TARGETS(POPULATION COVERAGE PROGRAMME)
^ The Urban Water Supply systems of this Union Territory dates back to^ the Ex-French Regime. The distribution lines laid about 60 years back in
Pondicherry and Kàraikal have outlived with the result of considerable0 reduction in residual pressure. The growth of urban population is abnormally
high thereby posing a challenging problem in the near future if not met with£ adequate planning. The Decade Programme envisage for the laying of the
distribution systems, augmentation of source and implement improvements toW the existing systems. The Yanam water supply system will be developed with— new distribution system and filteration process. The water supply to Mahe^ region will be arranged by extension of Anjarakondy scheme of Kerala Government0 The additional population to be benefitted by this project will be 128
thousands thereby effecting 100% coverage of Urban population by the end of0 the Decade. The probable cost of investment will be Rs. 42804 thousands.
0 Rural Water Supply Projects: The rural population of this Union- Territory in 1981 is estimated to 364 thousands out of which 255 thousands" have been covered by the Rural Water Supply schemes leaving about 109^ thousands yet to be covered. Adding the increase of 52 thousands in the
next ten years with the left over population the additional population of0 161 thousands will also be provided with clean drinking water supply by the
Decade Programmes thereby making 100% coverage at the end of the Decade.
The estimated cost of investment will be Rs. 23540 thousands.
^ Urban Sanitation: At present sewerage system exists only in^ Pondicherry,town covering a population of 120 thousands out of the total0 Urban population of 229 thousands. The Decade Programme envisage for
providing a new sewerage system for karaika town and extending the existing0 sewerage facilities to the urban area of Pondicherry town. The additional
population to be benefitted during the Decade will be about 121 thousandsW resulting in a coverage of 80% by the end of 1990. The estimated cost— of the project is Rs. 39490 thousands.
0 Rural Sanitation: At present there is no proper sanitationarrangements made to the rural population of 364 thousands. The projected
0 rural population in 1990 will be 416 thousands. The Decade Programme willprovide adequate sanitary facilities to 104 thousands covering 25% of the
W rural population at the end of the Decade.
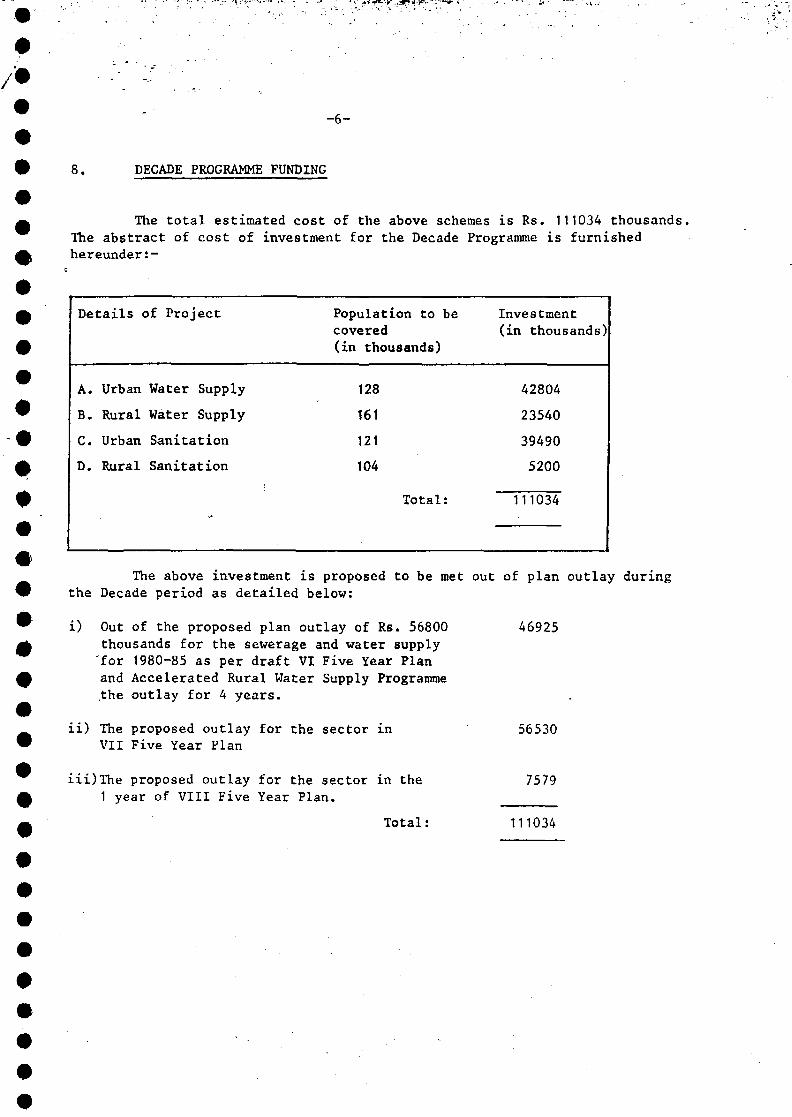
-6-
8. DECADE PROGRAMME FUNDING
The total estimated cost of the above schemes is Rs. 111034 thousands.The abstract of cost of investment for the Decade Programme is furnishedhereunder:-
Details
A.
B.
C.
D.
Urban
Rural
Urban
Rural
of Project
Water Supply
Water Supply
Sanitation
Sanitation
Population to becovered(in thousands)
128
161
121
104
Total:
Investment(in thousands)
42804
23540
39490
5200
111034
The above investment is proposed to be met out of plan outlay duringthe Decade period as detailed below:
i) Out of the proposed plan outlay of Rs. 56800thousands for the sewerage and water supplyfor 1980-85 as per draft VI Five Year Planand Accelerated Rural Water Supply Programmethe outlay for 4 years.
ii) The proposed outlay for the sector inVII Five Year Plan
iii)The proposed outlay for the sector in the1 year of VIII Five Year Plan.
Total :
46925
56530
7579
111034
- 2 -
w 2. SOCIO ECONOMIC INDICATIONS
4 | The total population of the State as per 1981 projection is2.104 millions. Out of these total population the Rural population comprises
W of 87.4 of the total population while Urban population is only 12.6. The^ projected population as on 31.3-1991 which is the target year of completion^ for the Decade programme is 2.751 million and the Rural population comprisesA of 85.13% of the total while Urban population is only 14.87%.
0 As per National Sample Survey 83.8% of total population of thisState are below poverty line. The G.N.P. of the State is Rs.14,642.0 lakhs
9 at current price based on N.S.S. report during 1975-76 which has got atendency of moderate rice comparing to sharp rice in many other States of
w the country. The per capita income is also having a moderate rise as this& State is fully dependent on Central aid,
f The main occupation in rural sector is agriculture and a smallsection is engaged in livestock, forestry, fishing, haunting and plantation,
0 orchard and allied activities. The Urban population is engaged in otheroccupations but this comprises of a very small section of population.
w These occupations are mainly Household industry (manufacturing, processing,^ servicing and repairs) and other small industries construction, trade &^ commerce and transport, storage and communication.
As per 1981 census which has recently been carried out in the Statef the percentage of literacy in the State is 41.58% out of which 51.27% is
amongst the males and 31.77% is amongst the females. The percentage of0 literates have increased considerably from 1971 census. In 1971 percentage
of literate in the State was 30.98%. Percentage of literates in urban areas» of the State as per 1981 census is, 73.34% while that in rural areas is
o 7 Q ^ j / . O/a .
3. HEALTH ASPECTS
The birth rate vas 32.3 per thousand population during 1874-75. Inthe year 1975, 11,347 Nos. of total live births were in the State out of atotal population of 15,56,342. During 1975-76 (Calender yesr 1976) thebirth rate was 29.2 while during 1976-77 it went up to 33.0. Again therewas a decrease in birth rate and during the calender year 1979 it wasrecorded as 34.7.
During the calender year 1973 total death from all
cases in the State was 4434. The death rate during the calender year1979 was 1072 per thousand population but infant death rate was 20.86 perthousand population. During 1975 the infant death was 17.30 per thousand.
Regarding diet and nutrition it may be mentioned that like most of
the Eastern and North Eastern Zone the diet pattern of the people of
- 3 -
Regarding endemic; diseases it may be mentioned here that exceptsome particular pockets the State is no longer affected by any endemicdiseases like cholera, malaria etc.
4. WATER RESOURCES
The State has got considerable ground water potentiality in valleyareas and therefore there is use of ground water for domestic & drinkingwater needs from the ring wells or masonar, wells, shallow or and deeptube wells. As per assessment of Central Ground Water Board on the basisof extensive exploration of Ground water resources the annual renewable dis-charge is 588 million Cubic Meter. The utilisation as on today 31.3.81 byboth water supply & irrigation and also domestic and industrial use is lessthan 20 p.c. of total renewable ground water resources. Taking 70%. of i.available ground water for irrigation, domestic and industrial use leaving30 pc for water supply the available ground water shall be about 140 millioncubic meter which is sufficient for catering 160 thousand urban and 1098thousand rural population at rate of 140 Ipcd and 40 lpcd respectively,supplemented by surface water flow.
There are : 10 Nos. perenial rivers and 72 Nos. perenial streamletsthroughout the Tripura. The annual run off is 0.80 million hectre metre outof which 0.1 million hectre metre flows through 8 Nos through non-monsoon months.But the water becomes tardy during monsoon due to heavy silt load. Allthe 10 Nos. towns of Tripura are situated on the banks of perenial riversand thus can be covered by available surface flow with the help of suitablewater treatment plant.
Most of the hilly villages with 15% population have to be coveredby surface water flow from the nearby perenial streams by lifting andcarrying through pipe with suitable treatment due to absence of undergroundwater bearing strata.
Some of the villages situated on the top of Jampoi Hill rangeadjoining Mizoram State has to be provided by catching and preservingrain water as neither ground water be available nor lifting of surface waterfrom long to distance and to high altitude is feasible for small scatteredpopulation.
- 4 -
d 5, PRESENT STATUS OF WATER SUPPLY AND SANITATION
As on 31.3.1981 safe drinking water facilities have been extendedw to the 105 thousand population of urban population and 741 thousandA . population of Rural population. The remaining 304 thousand population of^ Urban.population by 1991 will be covered with safe drin-ing water supplyA during this decade. Regarding rural water supply remaining 1601 thousand
population by 1991 will be covered with safe drinking water supply in this
9 decade.
As on 31.3.1981 sanitation facilities have been extended to onlyQ two thousand Urban population. The remaining 326 thousand population
by 1991 will be provided with safe sanitation facilities during the decade.W Regarding rural sanitation the coverage is Nil as on 31.3.1981. Rural& sanitation will be taken iip for 586 thousand population of rural sanitation; in between 1981-90 i.e., during the decade.
Out of 4727 Nos. villages drinking water facilities have been^ . extended only in 2472 Nos. of villages upto 1.4.1981 out of which 251 Nos.
villages by piped water supply from deep tubewell and 2221 Nos. villagesW by spot sources such as shallow tube wells, with hand pump, Ring well etc.— The balance 2255 Nos. villages will be covered during this decade out of^ which 1018 Nos. villages by piped water from deep tubewell and 1237 Nos. i.& villages by spot sources.
£ Out of 10 Nos. towns water facilities have been extended partiallyinto 4 towns only (Agartala, Dharmanagar, Udaipur and Kailashahar) on
0 1.4.1981. The balance 6 Nos. towns will be covered and the existing 4 Nos.towns would be augmented.
^ Urban sanitation will be taken in all towns. Rural sanitation will^ be taken up only in about 500 Nos. populated villages. Coverage ofA population under water supply services have been fixed on the projected
population of 1971 considering the standard growth rate. As on 31.3.1981Q a total population of 846 thousand have been benefitted by water supply^ services, out of which 105 thousands are in Urban sector and the balance9 741 thousands are in Rural sector.
6. SECTOR ORGANISATION
Agencies directly involved in the Sector under the Chief Engineercum Secretary of Irrigation & Flood Control Department of Tripura Govern-ment, there are three working divisions dealing with all Public HealthEngineering works in this State. There is also one special Investigation
- 5 -
mm
Unit. All these four Divisions are placed under on Superintending Engineerwho is also looking .ifter the Design of Irrigation works. There is oneMonitoring Cell which is directly placed under the Chief Engineer-cum-Secretary and is involved in Monitoring the progress of works, waterquality and planning materials resources etc.
There is another organisation which is also looking after ruralwater supply works. This Rural Engineering Organisation is placed underCommunity Development Department and which is also looking after ruralwater supply works related to spot sources through Block Officers. ThisOrganisation is responsible for execution and maintenance of theseschemes.
7. DECADE PLAN TARGETS
During the Sixth Five Year Plan which forms a part of the Decadethe total allocation of fund for 1980-85 as agreed by Planning Commissionor Government of India is 17.27 crores, other than the allocation aseparate allocation of Rs.3.195 crores approximately are anticipated asCentral assistance by Government of India on Accelerated rural water supplyprogramme.
The allocation of fund as agreed by Planning Commission forSixth Plan is given below:
Rs.4.22 croresRs.12.00 crores.(This amount does not includeRs.3.195 crores to be provided byGovt. of India as Central assistance),Rs.1.00 croresRs.5.00 lakhs
The requirement of fund for the Decade programme to achieve theabove mentioned goals on the basis of this Unit cost would be about Rs.57crores as under:
(a)(b)
(c)(d)
Total
UrbanRural
UrbanRural
Cost
Water SupplyWater Supply
SanitationSanitation
(a) Urban Water Supply(b) Urban Sewerage and
Sanitation(c) Rural Water Supply(d) Rural Sanitation
Say Rs.57.00 crores
Rs.1 094.40 lacs
Rs.1 395.50 lacsRs.2 917.04 lacsRs. 293.00 lacs
Rs.5 699.94
- 6 -
8. RESOURCE MOBILISATION
The proposed resource mobilisation is as under:
6th Five Year Plan allocation 2 046.50 lacs7th Five Year Plan allocation
(Anticipated 30% increase inthe next Plan) 2 660.40 lacs
1st Year of 8th Five Year Planallocation (Anticipated 40%increase in the next Plan) 593.10 lacs
L.I.C. other Sources & Inter-national donors 400.00 lacs
Rs. 5 700.00 lacs
The phasing of the funds yearwise has to be done after discussionwith the State.
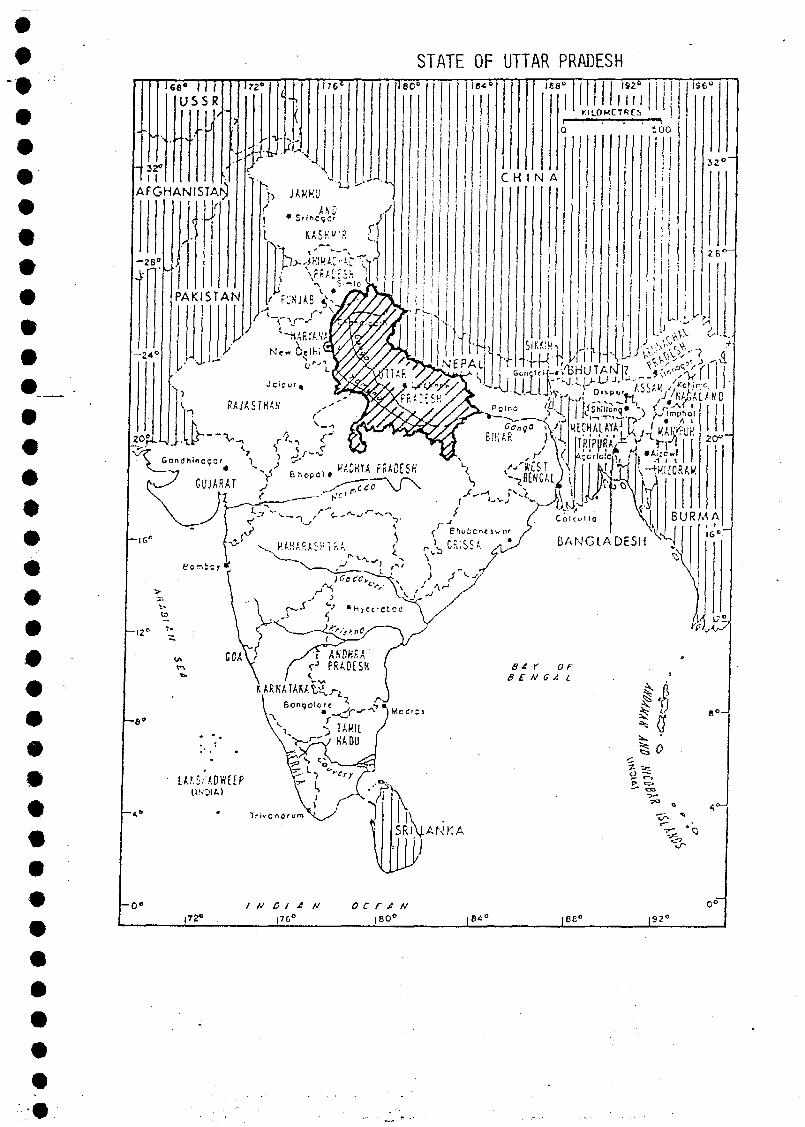
m
#
STATE OF UTTAR PRADESHUe8 1 | /
USSR
LU3?»I I
AFGHANISTAN
- Z B "
-24 '
205
T7"F
PAKISTAN
i?6<
:&
f> JAMMU
I KASHMIR r '
l e c ° 1 ie< ieec 1S2°III
KILOMETRES
C H I N A
5 00
I96C
32 C
2 8 e
h-16
eor-.bcr
- 1 2 "
h-e»
1 J ^ - ^ ^ • N > c c r c t C
LAr.SKADWftF(INDIA)
B E H G A l
SRl\j.AK'KA
I'I 0
V
ho»|72°
I N D I A NJ 70°
O C E A N
|B0° i B ^ c • 86° |92C
EXECUTIVE SUMMARYOF
THE DECADE PLAN OF WATER SUPPLY ANDSANITATION SECTOR (APRIL 1981 - MARCH 1991)
FOR
UTTAR PRADESH
1. INTRODUCTION
The State of Uttar Pradesh is situated in the Northern Region ofIndia. It is bounded by Nepal and Tibbet in the North, parallel tomountains, Bihar in the East; Madhya Pradesh in South; and Rajasthan,Haryana & Himachal Pradesh in the West. The Indo-Gangetic plain coversabout two-third areas of the State and because of easily available suppliesof surface and ground water, it has been the most populated area forcenturies. The plain is watered by the Yamuna, the Ganga and itstributaries, the Ramganga, the Gomti, the Ghaghra and the Gandak rivers. Thewhole area of the plains is alluvial and very fertile.
The region parallel to the Himalayas comprises eight districts withhigh mountains formed of sedimentary rocks, broken by velleys and deepgorges. The perpetual snows in the higher reaches are the source ofperennial rivers and rivulets which criss-cross the terrain and ultimatelyfind their way into the Ganga and the Yamuna rivers.
The southern fringe of the Gangetic Plain is demarcated by theVindhyan hills and Plateau. The Betwa and Ken rivers join the Yamuna fromthe South-West in this region where rainfall is scanty and erratic, resultingin less number of perennial water sources.
2. SOCIO-ECONOMIC INDICATORS
Uttar Pradesh has a population of 88.341 millions (as per 1971census). The projected population figures for the year 1981 and 1991 are105.728 millions and 122.114 millions respectively. The census populationof 1981 is 110.88 millions.
The economy of the State is basically agrarian. People of allfaiths and religions live in the State» The literacy rate in the Stateas per 1971 census has been estimated to 21.70 percent (31.50 percent of maltsand 10.55 percent of females) against the national average of 29.45percent. The per capita income in Uttar Pradesh during the years 1977-78,1978-89 and 1979-80 at current prices have been Rs. 952..00, Rs- 977.00 and
- 2 -
Rs. 995.00 respectively which show a gradual rising trend. According toan assessment of the Planning Commission, Govt. of India, 58% of urban and50.82% of rural population of India is below the poverty line (Based onanalysis of consumer expenditure date for 77-78). In U.P., 49.24% ofurban and 50.23% of rural population falls under this category.
3. HEALTH ASPECTS
#
In Uttar Pradesh, food consumed by the human beings, consists ofcereals, sugar and jaggery in adequate quantities where as intake of otherfoods is below the recommended levels. The consumption of leafy vegetables,fruits, flesh foods and fats & oils is very low.
The average life expectancy in Uttar Pradesh was 61.1 and 59.8 for maand females respectively as per data available for 1978. The birth and deathrates per 1000 population in Uttar Pradesh for 1978 was 29.1 and 10.8respectively. Morbidity and mortality in U.P. because of various diseasesincluding water and faecal born diseases during 1980 are as following:-
Morbidity
Mortality
All type
of dyse-ntary
40585
202
Enceph-alitis
8285
127
Entrimfiver
30024
45
Gastroenter-itis
1678
20
Guineaworm
5337
193
InfectiveHepatit-
les
10145
210
Influe-nza
50115
2.
4. WATER RESOURCES
By for the most important area for the economy of the State is theGangetic Plain which stretches across the entire length of the State fromEast to West. It is watered by the Yamuna, the Gana and its majortributeries, the Ramganga, the Gomti, the Ghagha and the Gandak. The wholeplain is alluvial and fertile.
A survey of the total surface water resources of the Ganga basinis being done by the Central Water Commission, Govt. of India. But theestimate puts them at about 462 lakh hectare metres, of these 330 lakhhectare metres passes through the State.
As per information collected from Ground Water InvestigationOrganisation, U.P., the total gross Recharge and net recoverable rechargeis about 89100 million cum and 62400 million cum respectively. Totaldraft and net draft is 26500 and 18500 million cum respectively.
Average percentage of utilisation is 29.78%. On regional basis, theground water being extracted in Western, Eastern, Central and Bundelkhandregions is about 45%, 25%, 28% and 20% for future development of ground waterstructures.
5. PRESENT STATUS WATER SUPPLY & SEWERAGE
Urban Water Supply: Out of 644 urban areas of the State, 434have been provided with piped water supply benefitting 13990 thousandspopulation (88.8%) upto the end of March 1981 and the work in 92 towns isin progress.
The sruveys conducted by M/s Kirloskar Consultants and the TariffUnits of the Jal Nigam have revealed chat the population served by the houseconnections and the stand posts generally very from 25%, to 50% and 20% to 4C"respectively. The remaining population takes water from captive sources viz.Wells, hand pumps and rivers.
The water supply in most of the towns of the State is intermittentwith supply hours varying from 4 to 20 hours per day depending upon theavailability of power. The service levels very from town to town with adefinite trend that in the bigger towns per capita consumption is higher.The per capita supply in corporation towns ranges between 200 to 270 lpcd.In the medium towns of about 1 lac population per capita supply is in therange of 150 to 175 lpcd. The supply in the small towns is low in the orderof about 70 to 150 lpcd.
Rural Water Supply: Out of 1,12,561 villages in U.P., 11602villages have been covered by the end of March 1981 benefitting a;population6487 thousands (Approx 7.2%). Total No. of problem villages in 35,506covering a population of 26909 thousands, out of which 7913 villages withthe populations of 4200 thousands (15.6%) have been covered by the end ofMarch 1981.
The studies carried out by the Tariff Units of the Jal Nigam, revealthat per capita supply in rural areas in case of persons drawing water from theprivate connections is in the order of 60 to 70 lpcd. While for those who t£>~water from the public stand posts, it ranges between 35 lpcd to 50 lpcd.Except in gravity schemes, where the water is supplied continuously,the supplies are intermittent. The timings of supply of water are in themorning and evening with an average of 6 to 8 hours per day.
Urban Sanitation: Out of 644 towns of the State only 45 townswere provide with partial sewerage facilities benefitting 2562 thousandpopulation (16.26%) till the end of March 1981.
No programme has been taken up by the end of March 1981 regardingconstruction of water seal toilets connected to septic tanks and soak pits.Though some population have provided water seal toilets at their initiative.
Rural Sanitation: In this field, the work done is negligible and
there is no such system existing in the villages which can be termed as
any measure of sanitation outlook.
6. SECTOR ORGANISATIONS
The Urban Development Department (Nagar Vikas Vibhag) is responsiblefor the development of Che urban sector and rural water supply and sanitationfor the State at the level of the Government. The U.P. Jal Nigam (U.P. WaterCorporation, Jal Sansthans (Water Boards), Zila Parishads (District Boards)and Local Bodies (Corporations, M.B., TAC, NAC) are responsible in the fieldfor vater supply and sanitation.
UP Jal Nigam: The UP Jal Nigam is a State organisation constitutedin the year 1975 by Govt. legislation with its headquarters at Lucknow andZonal, Circle and division offices located at different places of the State.Nigam is headed by a full time chairman and consists of two other full timemembers (managing Director and Finance Director), four ex~offico members(Secretaries of Finance & Nagar Vikas, Director, Local Bodies and Director ofMedical & Health Services) and five elected heads of the local bodies nominatedby the State Govt.
Jal Sansthans: According to U.P. Water Supply and Sewerage Act 1975,the State Govt. by a notification can create Jal Sansthan for any particulararea or a town to entrust responsibility of the sectoral functions. As present,there are eight Jal Sansthans viz. Garhwal, Kuraaon, Bundelkhand, Kanpur,Allahabad, Varanasi, Agra and Lucknow. A Jal sansthans is headed by a chairmanwho will be the Mayor of the town in case of urban Jal Sansthan and thecommissioner of the division in case of Regional Jal Sansthan. Executive headof a Jal Sansthan in a General Manager to be appointed by the Jal Nigam withthe approval of State Govt,
Zila Parishad: A Zila Parishad is an elected body for every districtheaded by an elected chairman and in responsible for rural development worksin the district.
Local Bodies: Local Bodies i.e. the Corporations, Municipal Boards,Town Area Committees, Notified Area committees are governed by the UP Munici-palities Act 1976. Every Municipality has an elected body which consists of apresident, 20 to 80 elected members and 4 to 8 co-opted members as prescribed bythe State Government.
The institutional responsibilities of various organisations forproviding water supply and waste disposal services to rural and urban areas havebeen shown in the following table: ;
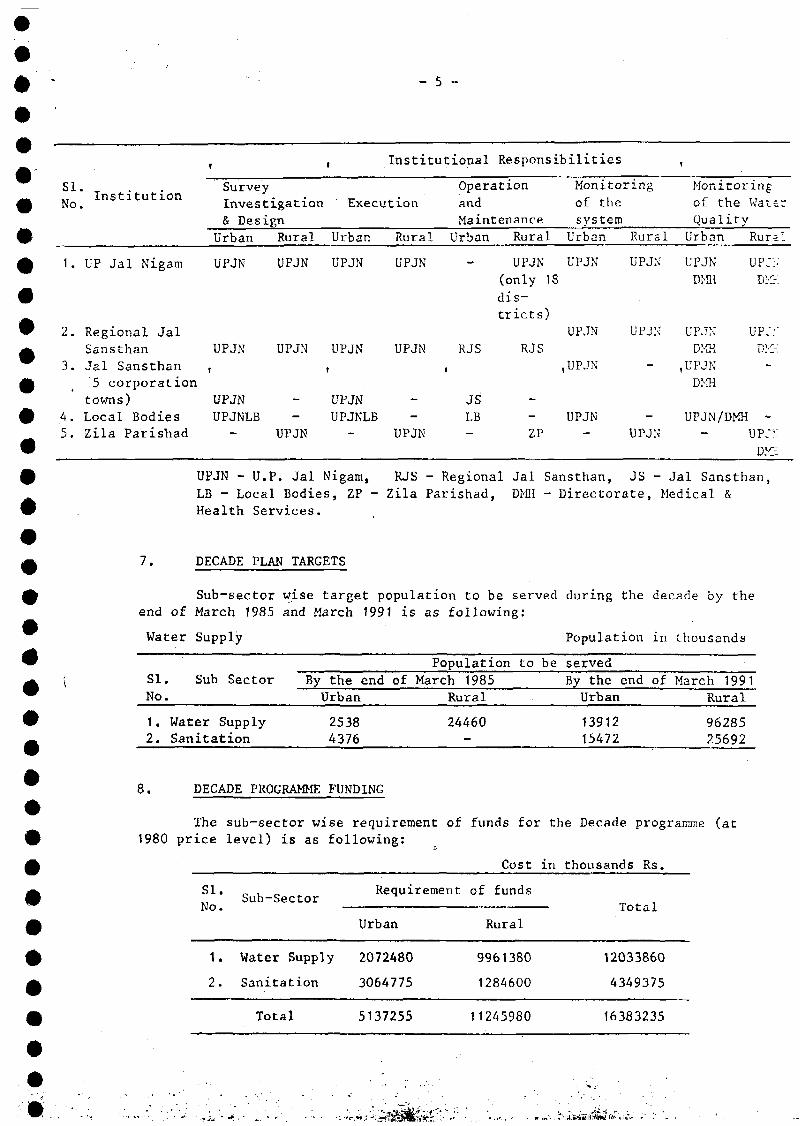
— 5 —
SINo
1.
2.
3.
4.5.
Institution•
UP Jal Nigam
Regional JalSansthanJal Sansthan5 corporation
towns)Local BodiesZila Parishad
SurveyInvestigation& Design
Urban Rural
UPJN UPJN
UPJN UPJN
i
UPJNUPJNLB
UPJN
t Institutional
Execution
Urban
UPJN
UPJN
UPJNUPJNLB-
Rural
UPJN
UPJN
--
UPJN
Responsibilities
Operation
andMaintenance
Urban
-
RJSi
JSLB-
Rural
UPJN(only 18
dis-tricts)
RJS
--ZP
Monitoring
of theSystem
Urban
UPJN
UPJN
,UPJN
UPJN-
Rural
UPJN
UPJN
-
-UPJN
Monitoringof the WaterQuality
Urban Rurîl
UPJN UP::;DMi D:-:-;
UPJN UP::"DMH B:-:-:
,UPJNDMH
UPJN/DMH -UP:?-
DKH
7.
UPJN - U.P. Jal Nigam, RJS - Regional Jal Sansthan, JS - Jal Sansthan,LB - Local Bodies, ZP - Zila Parishad, DMH - Directorate, Medical &Health Services.
DECADE PLAN TARGETS
Sub-sector wise target population to be served during the decade by theend of March 1985 and March 1991 is as following:
Water Supply
SI. Sub SectorNo.
1. Water Supply2. Sanitation
By the endUrban
25384376
Populationof March 1985
Rural
24460
Population
to be servedBy the endUrban
1391215472
in
of
thousands
March 1991Rural
9628525692
8. DECADE PROGRAMME FUNDING
The sub-sector wise requirement of funds for the Decade programme (at1980 price level) is as following:
SI.
1.
2.
Sub-Sector
Water Supply
Sanitation
Total
Requirement
Urban
2072480
3064775
5137255
Cost
of funds
Rural
9961380
1284600
11245980
in thousands Rs.
12033860
4349375
16383235
•
Mobilisation of Resources: Urban water supply & sanitation schemes are£ executed by Jal Kigarn as deposit works on behalf of local bodies. If required
by local bodies, financial assistance is given to them in the shape of loan/grar.:0 by the Jal Nigam, which is financed by State Govt. and L.I.C. of India. Rural
Water Supply schemes are financed by State/Central Govt. as 100% grant or 75%™ grant and 25% loan. Efforts will also be made to get loan from the Housing andA Urban Development Corporation (HUDCO) and other similar organisations also.
0 In the past years, some International Agencies like World Bank, DutchGovt. have given financial assistance to various Water Supply and Sanitation
9 Schemes. In order to meet the targets of the Decade, more efforts shall be maceto obtain financial assistance from the various International Organisations/
9 Bilaterals.
^ The allocation for the sector in the State during the VI five year plan0 (1980-85) is Rs.372.285 crores (including Rs.83.785 crores of central assistance
under ARWSSP). Out of this amount Rs.54.668 crores was spent during 1980-810 which was not covered in the decade programme. Therefore only an amount of
• Rs.317.617 crores is available for the decade programme during 1981-85. Similar*.W an amount of Rs.1320.7065 crores will be needed during the 7th plan and first^ year of the 8th plan to reach the targets.
9. SUPPORT PROGRAMMES
w Financial Resources: To achieve the target set for the Decade Programme,the State requires much more financial allocations. The resources made avail-
™ able for this programme are grossly inadequate in comparison with the ambitious^L targets set under this programme. To overcome this borrowing from financial^ institutions and seeking international and bi-lateral assistance could be aA practical possibility, besides ensuring that the water supply sector is put
into the core sector and given priority over other sectors.
Technical Manpower: Practically all the materials required for urban anc9 rural water supply and sanitation works are manufactured in the country. Further
# increased quantities can be made available in sufficient quantities by increasingthe production capacities of the existing units as also by setting up of new
A units as and when required.
0 Operation and Maintenance: For maintenance and operation, the urban localbodies the°KAVAL Jal Sansthans and the Regional Jal Sansthans have the necessary
£ statutory powers. A large number of systems, even the water supply are not selfsupporting in respect of maintenance and operation as the revenue on present
9 tariffs are not sufficient. Any increase in tariff is usually opposed and^ resented by the public.
£ Inter-sectoral Coordination: The works in the water supply sector haveprimarily to depend upon the co-operation of Irrigation, Public works State
£ Electricity Board and Forest Departments and also the District Administration.The Jal Nigam has no statutory rights over the natural waters like rivers and
£ lakes and therefore permission of Irrigation Department is required for tappinfof water sources. Similarly for laying of water mains and sewers along highways
- 7 -
and roads of villages and towns, permission of the Public Works Departmentand local bodies is required. In rural areas and especially in hills, permissio:of Forest Department is essential for laying of water mains, construction ofreservoirs etc. in forest areas similarly co-operation of State ElectricityBoard is also very essential for obtaining power connections to the water supplyand sewerage systems. No particular bottleneck has been experienced in obtainir.;the required co-operation from these Departments.
Health Education & Community Participation: The population of the State,urban in general and rural in particular is very superstitious and highly inclir.edtowards religion. The State Govt. is taking every possible steps to educatepublic. Health education is being imparted to them through video-media, slidesand radio-transmission etc. Medical Information and other departments have bee-entrusted for the job. Several programmes likes Nutrition Programme, Integrate;Rural/Urban Department Programme, Hygienic & Sanitation Programmes for Schoolsetc. have been taken up by the State Govt. for the betterment of the health ofthe people.
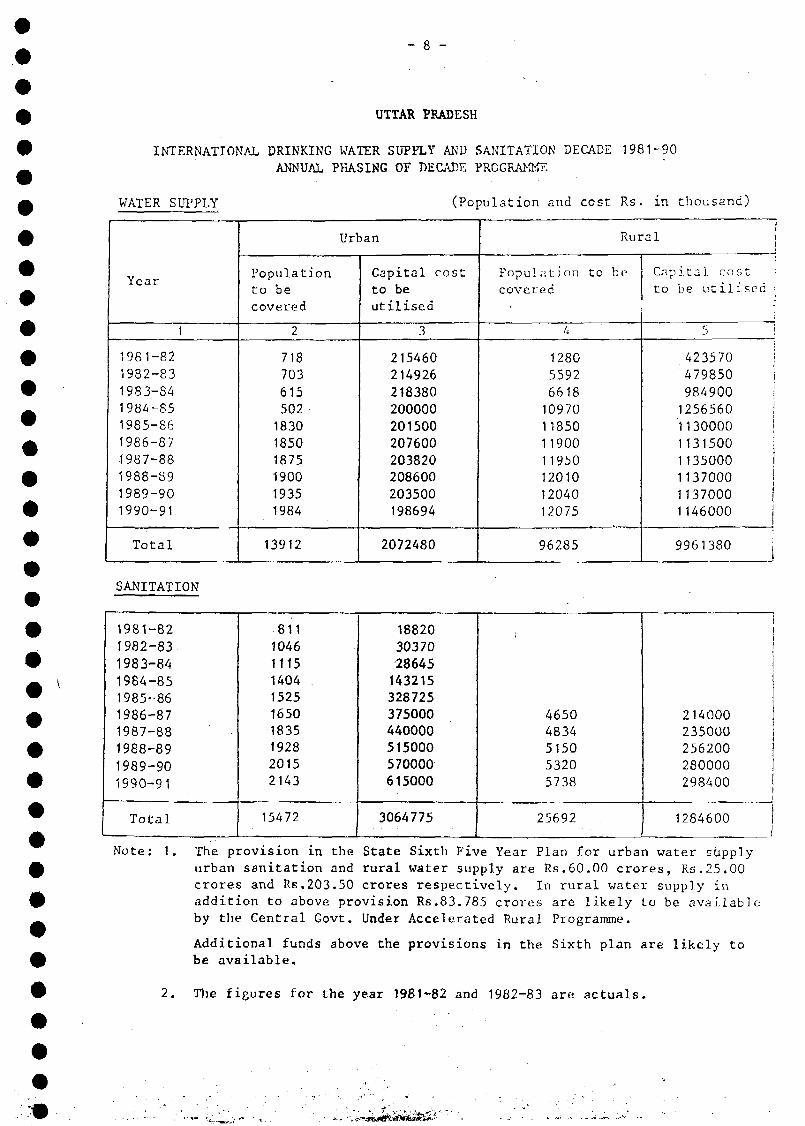
- 8 -
UTTAR PRADESH
INTERNATIONAL DRINKING WATER SUPPLY'AND SANITATION DECADE 1981-90ANNUAL PHASING OF DECADE PROGRAMME
WATER SUPPLY (Population and cost Rs. in thousand)
Year
1
1981-821982-8319S3-S41984-851985-861986-871987-881988-S91989-901990-91
Total
Urban
Populationto becovered
2
718703615502183018501875190019351984
13912
Capital costto beutilised
3
215460214926218380200000201500207600203820208600203500198694
2072480
Rural;
Population to becovered
4
12805592661810970118501190011950UOW1204012075
96285
Capital cost :
to be utilised :
5 I
423570 j479850 i984900 I12565601130000 |1131500 j1135000
11370001146000
9961380 I
SANITATION
1981-821982-831983-841984-851985-861986-871987-88
1988-891989-90
1990-91
Total
811Î04611151404152516501835192820152143
15472
188203037028645
143215328725375000440000515000570000615000
3064775
46504834515053205738
25692
214000235000256200280000298400
1284600 i_ I
Note: 1. The provision in the State Sixth Five Year Plan for urban water supplyurban sanitation and rural water supply are Rs.60.00 crores, Rs.25.00crores and Rs.203.50 crores respectively. In rural water supply inaddition to above provision Rs.83.785 crores are likely to be availableby the Central Govt. Under Accelerated Rural Programme.
Additional funds above the provisions in the Sixth plan are likely tobe available.
2. The figures for the year 1981-82 and 1982-83 are actuals.
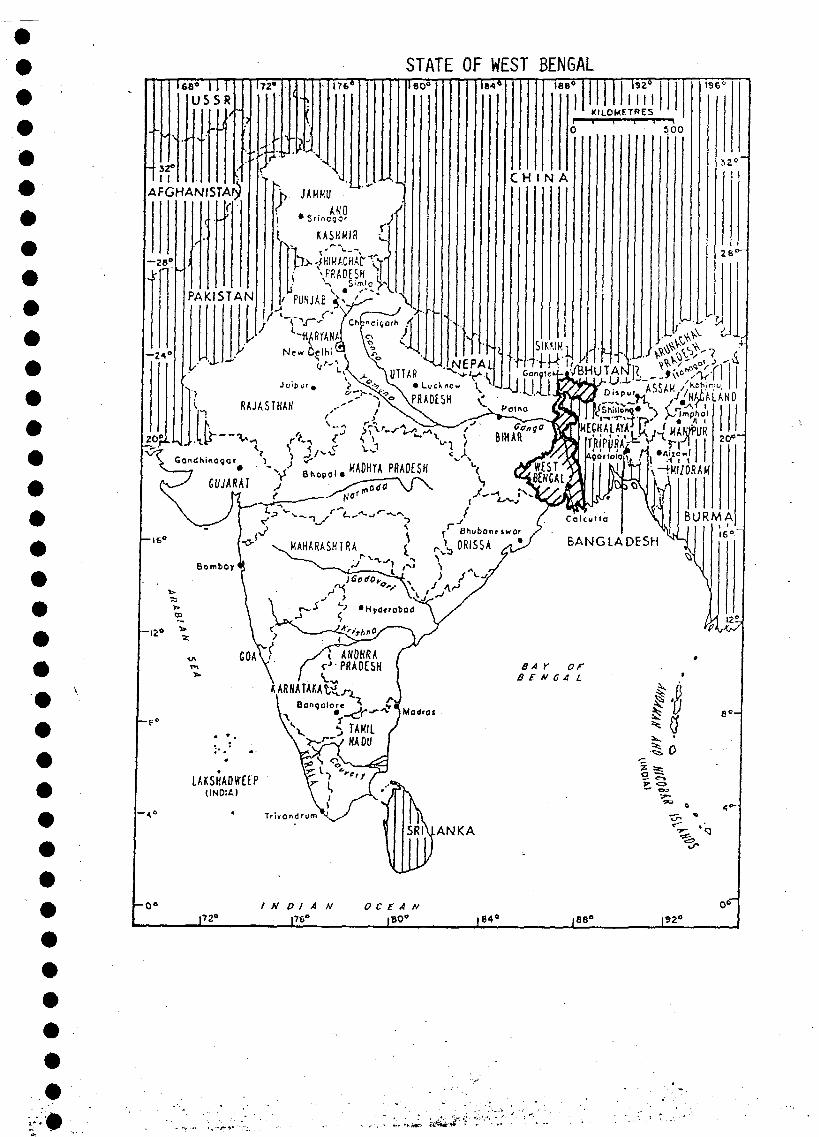
STATE OF WEST BENGAL
IIAFGHANISTAN
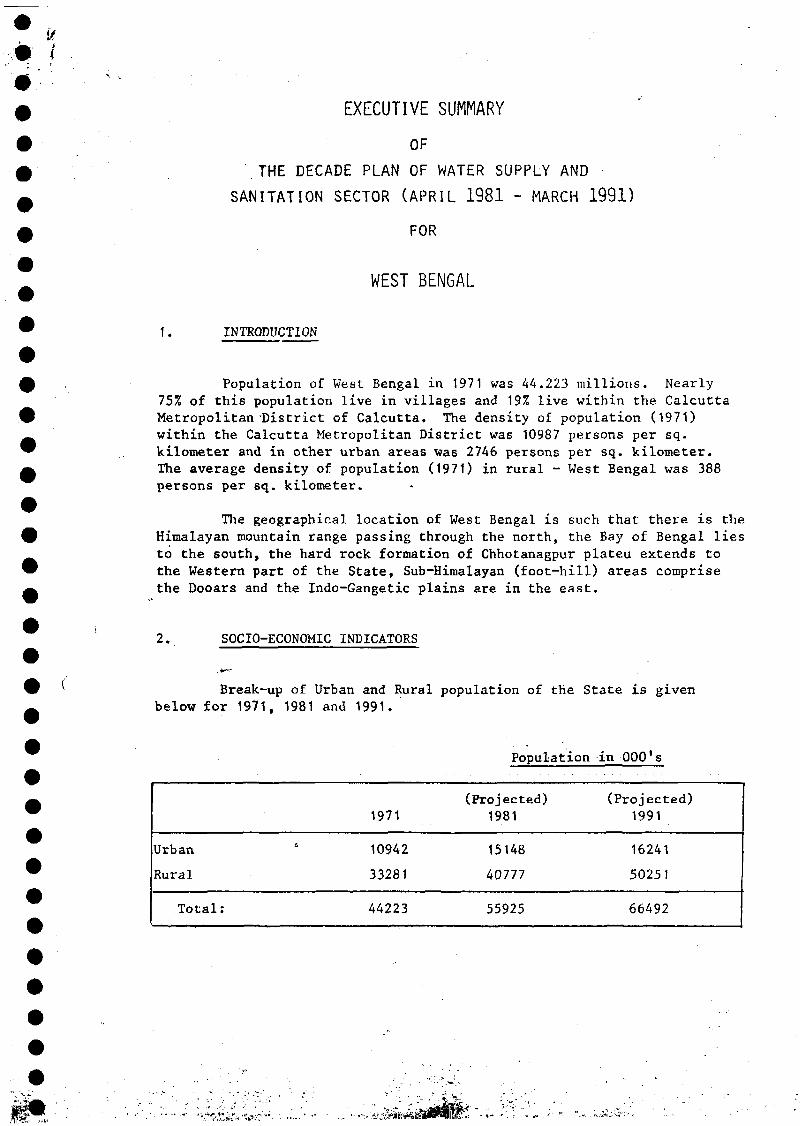
# EXECUTIVE SUMMARY
• OF# THE DECADE PLAN OF WATER SUPPLY AND^ SANITATION SECTOR (APRIL 1981 - MARCH 1991)
0 FOR
WEST BENGAL
• 1. INTRODUCTION
Population of West Bengal in 1971 was 44.223 millions. Nearly75% of this population live in villages and 19% live within the CalcuttaMetropolitan'District of Calcutta, The density of population (1971)within the Calcutta Metropolitan District was 10987 persons per sq.kilometer and in other urban areas was 2746 persons per sq. kilometer.The average density of population (1971) in rural - West Bengal was 388persons per sq. kilometer.
The geographical location of West Bengal is such that there is theHimalayan mountain range passing through the north, the Bay of Bengal liesto the south, the hard rock formation of Chhotanagpur plateu extends tothe Western part of the State, Sub-Himalayan (foot-hill) areas comprisethe Dooars and the Indo-Gangetic plains are in the east.
2, SOCIO-ECONOMIC INDICATORS
Break-up of Urban and Rural population of the State is givenbelow for 1971, 1981 and 1991.
Population in OOP's
Urban
Rural
Total:
1971
10942
33281
44223
(Projected)1981
15148
40777
55925
(Projected)1991
16241
50251
66492
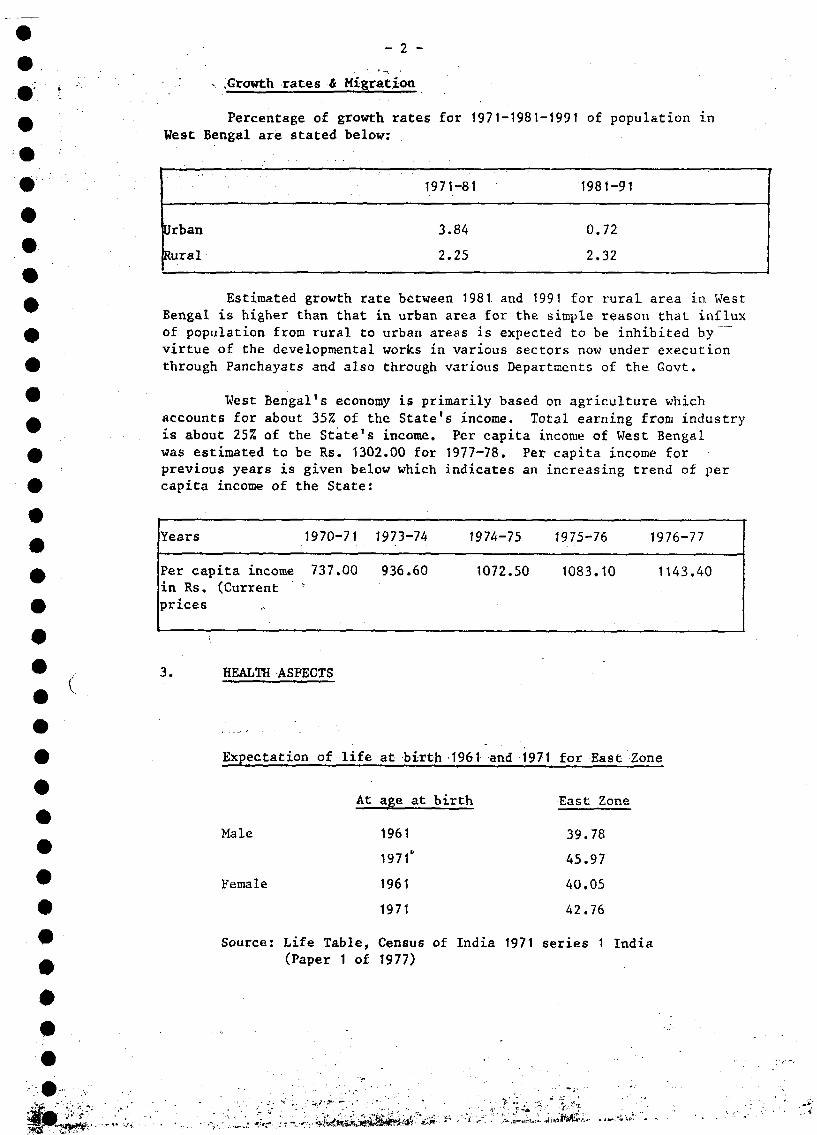
- 2 -
rates & Migration
Percentage of growth rates for 1971-1981-1991 of population inVest Bengal are stated below:
1971-81 1981-91
Urban
Rural
3.84
2.25
0.72
2.32
Estimated growth rate between 1981 and 1991 for rural area in WestBengal is higher than that in urban area for the simple reason that influxof population from rural to urban areas is expected to be inhibited byvirtue of the developmental works in various sectors now under executionthrough Fanchayats and also through various Departments of the Govt.
West Bengal's economy is primarily based on agriculture whichaccounts for about 35% of the State's income. Total earning from industryis about 25% of the State's income. Per capita income of West Bengalwas estimated to be Rs. 1302.00 for 1977-78. Per capita income forprevious years is given below which indicates an increasing trend of percapita income of the State:
Years 1970-71 1973-74 1974-75 1975-76 1976-77
Per capita income 737.00 936.60in Rs. (Current r
prices
1072.50 1083.10 1143.40
3. HEALTH ASPECTS
Expectation of life at birth 1961 and 1971 for East Zone
Male
Female
At age at birth
1961
1971*
1961
1971
East Zone
39.78
45.97
40.05
42.76
Source: Life Table, Census of India 1971 series 1 India(Paper 1 of 1977)
•'W:..:*...'. «7;.«;-!,:-;. ••:-•*•'!•«
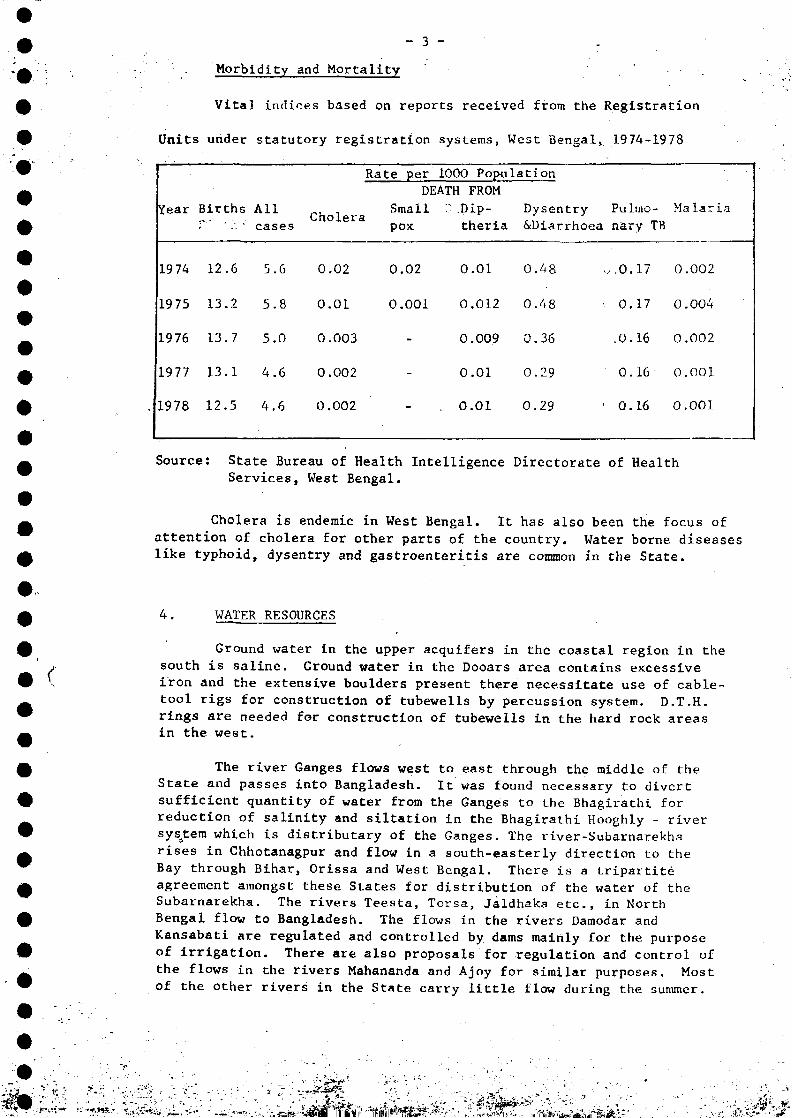
- 3 - •
Morbidity and Mortality
Vital indices based on reports received from the Registration
Units under statutory registration systems, West Bengal, 1974-1978
fear
19 74
1975
1976
1977
1978
Births
12.6
13.2
13.7
13.1
12.5
Allcases
5
5
5
4
4
.6
.8
.0
.6
6
Cholera
0
0
0
0
0
.02
.01
.003
.002
.002
Rate per 1000 PopulationDEATH FROM
Small ": .Dip-pox theria
0.02
0.001
-
-
0.01
0.012
0.009
0.01
0.01
Dysentry&Diarrhoea
0.48
0.48
0.36
0.29
0.29
Pulmo-nary TB
,.0.17
0.17
.0.16
0.16
0.16
Malaria
0.002
0.004
0.002
0.001
0.001
Source: State Bureau of Health Intelligence Directorate of HealthServices, West Bengal.
Cholera is endemic in West Bengal. It has also been the focus ofattention of cholera for other parts of the country. Water borne diseaseslike typhoid, dysentry and gastroenteritis are common in the State.
4. WATER RESOURCES
Ground water in the upper acquifers in the coastal region in thesouth is saline. Ground water in the Dooars area contains excessiveiron and the extensive boulders present there necessitate use of cable-tool rigs for construction of tubewells by percussion system. D.T.H.rings are needed for construction of tubewells in the hard rock areasin the west.
The river Ganges flows west to east through the middle of theState and passes into Bangladesh. It was found necessary to divertsufficient quantity of water from the Ganges to the Bhagirathi forreduction of salinity and siltation in the Bhagirathi Hooghly - riversystem which is distributary of the Ganges. The river-Subarnarekharises in Chhotanagpur and flow in a south-easterly direction to theBay through Bihar, Orissa and West Bengal. There is a tripartiteagreement amongst these States for distribution of the water of theSubarnarekha. The rivers Teesta, Torsa, Jaldhaka etc., in NorthBengal flow to Bangladesh. The flows in the rivers Damodar andKansabati are regulated and controlled by dams mainly for the purposeof irrigation. There are also proposals for regulation and control ofthe flows in the rivers Mahananda and Ajoy for similar purposes. Mostof the other rivers in the State carry little flow during the summer.
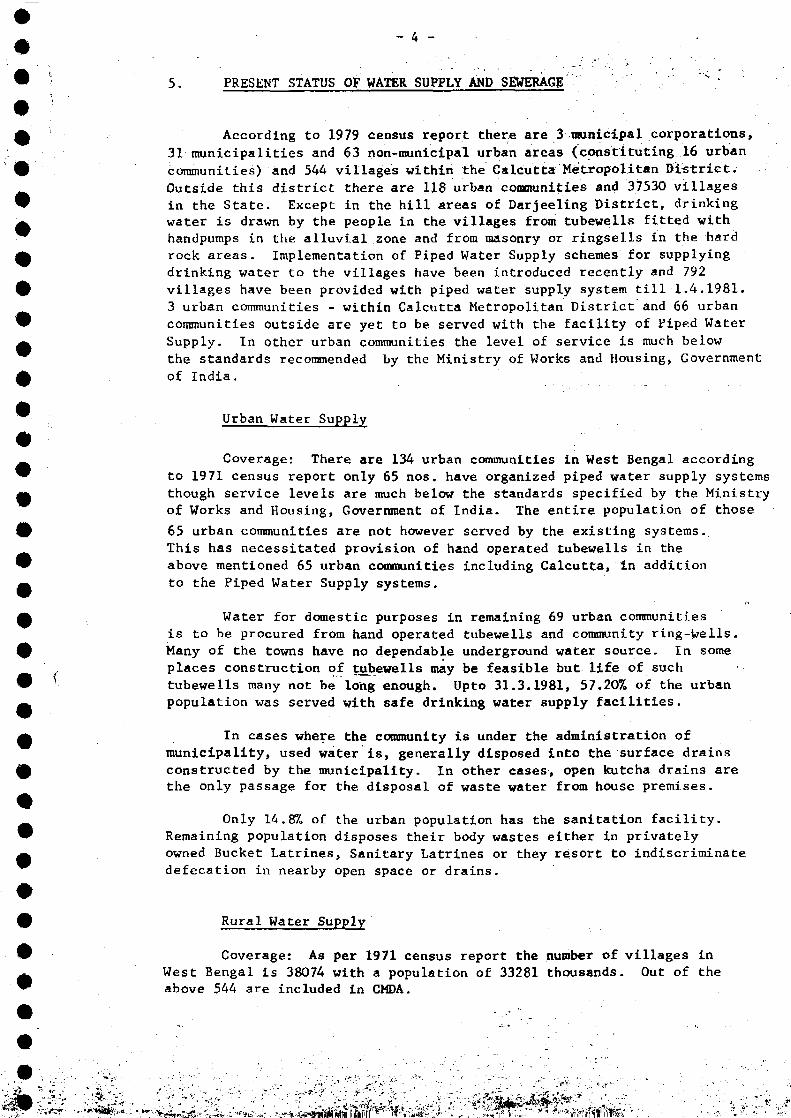
- 4 -
5. PRESENT STATUS OF WATER SUPPLY AND SEWERAGE
According to 1979 census report there are 3 municipal corporations,31 municipalities and 63 non-municipal urban areas (constituting 16 urbancommunities) and 544 villages within the Calcutta Metropolitan District.Outside this district there are 118 urban communities and 37530 villagesin the State. Except in the hill areas of Darjeeling District, drinkingwater is drawn by the people in the villages from tubewells fitted withhandpumps in the alluvial zone and from masonry or ringsells in the hardrock areas. Implementation of Piped Water Supply schemes for supplyingdrinking water to the villages have been introduced recently and 792villages have been provided with piped water supply system till 1.4.1981.3 urban communities - within Calcutta Metropolitan District and 66 urbancommunities outside are yet to be served with the facility of Piped WaterSupply. In other urban communities the level of service is much belowthe standards recommended by the Ministry of Works and Housing, Governmentof India.
Urban Water Supply
. " • ' " ' • • ' . '
Coverage: There are 134 urban communities in West Bengal accordingto 1971 census report only 65 nos. have organized piped water supply systemsthough service levels are much below the standards specified by the Ministryof Works and Housing, Government of India. The entire population of those
65 urban communities are not however served by the existing systems.This has necessitated provision of hand operated tubewells in theabove mentioned 65 urban communities including Calcutta, In additionto the Piped Water Supply systems.
Water for domestic purposes in remaining 69 urban communitiesis to be procured from hand operated tubewells and community ring-Veils.Many of the towns have no dependable underground water source. In someplaces construction of tubewells may be feasible but life of suchtubewells many not be long enough. Upto 31.3.1981, 57.20% of the urbanpopulation was served with safe drinking water supply facilities.
In cases where the community is under the administration ofmunicipality, used water is, generally disposed into the surface drainsconstructed by the municipality. In other cases, open kutcha drains arethe only passage for the disposal of waste water from house premises.
Only 14.8% of the urban population has the sanitation facility.Remaining population disposes their body wastes either in privatelyowned Bucket Latrines, Sanitary Latrines or they resort to indiscriminatedefecation in nearby open space or drains.
Rural Water Supply
Coverage: As per 1971 census report the number of villages inWest Bengal is 38074 with a population of 33281 thousands. Out of theabove 544 are included in CMDA.
%M •••^^.:^hX^&::^. I ^ ^ É Ï ^ 1 ^ ^ :
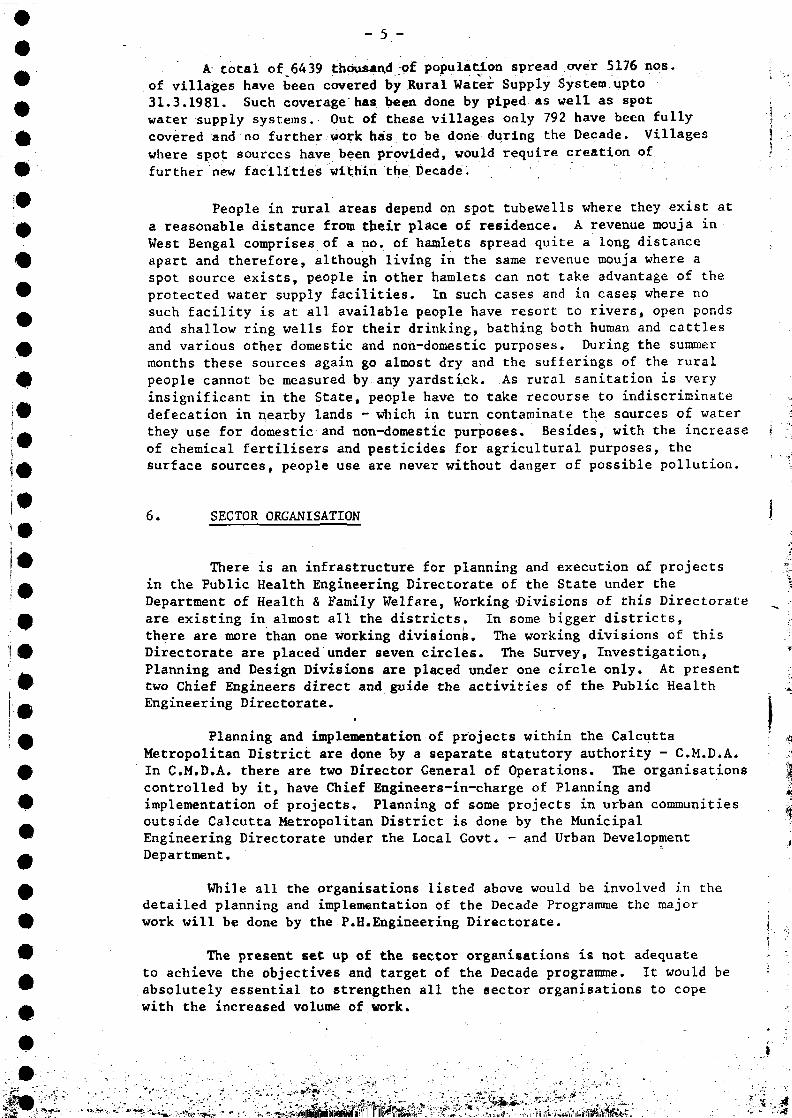
_ s —
A total of 6439 thousand of population spread over 5176 nos.of villages have been covered by Rural Water Supply System upto31.3.1981. Such coverage has been done by piped as well as spotwater supply systems. Out of these villages only 792 have been fullycovered and no further work has to be done during the Decade. Villageswhere spot sources have been provided, would require creation offurther new facilities within the Decade.
People in rural areas depend on spot tubewells where they exist ata reasonable distance from their place of residence. A revenue mouja inWest Bengal comprises of a no. of hamlets spread quite a long distanceapart and therefore, although living in the same revenue mouja where aspot source exists, people in other hamlets can not take advantage of theprotected water supply facilities. In such cases and in cases where nosuch facility is at all available people have resort to rivers, open pondsand shallow ring wells for their drinking, bathing both human and cattiesand various other domestic and non-domestic purposes. During the summermonths these sources again go almost dry and the sufferings of the ruralpeople cannot be measured by any yardstick. As rural sanitation is veryinsignificant in the State, people have to take recourse to indiscriminatedefecation in nearby lands - which in turn contaminate the sources of waterthey use for domestic and non-domestic purposes. Besides, with the increaseof chemical fertilisers and pesticides for agricultural purposes, thesurface sources, people use are never without danger of possible pollution.
6. SECTOR ORGANISATION
There is an infrastructure for planning and execution af projectsin the Public Health Engineering Directorate of the State under theDepartment of Health & Family Welfare, Working «Divisions of this Directorateare existing in almost all the districts. In some bigger districts,there are more than one working divisions. The working divisions of thisDirectorate are placed under seven circles. The Survey, Investigation,Planning and Design Divisions are placed under one circle only. At presenttwo Chief Engineers direct and guide the activities of the Public HealthEngineering Directorate.
Planning and implementation of projects within the CalcuttaMetropolitan District are done by a separate statutory authority - C.M.D.A.In C.M.D.A. there are two Director General of Operations. The organisationscontrolled by it, have Chief Engineers-in-charge of Planning andimplementation of projects. Planning of some projects in urban communitiesoutside Calcutta Metropolitan District is done by the MunicipalEngineering Directorate under the Local Govt. - and Urban DevelopmentDepartment.
While all the organisations listed above would be involved in thedetailed planning and implementation of the Decade Programme the majorwork will be done by the P.H.Engineering Directorate.
The present set up of the sector organisations is not adequateto achieve the objectives and target of the Decade programme. It would beabsolutely essential to strengthen all the sector organisations to copewith the increased volume of work.
: : ! 5 . ^
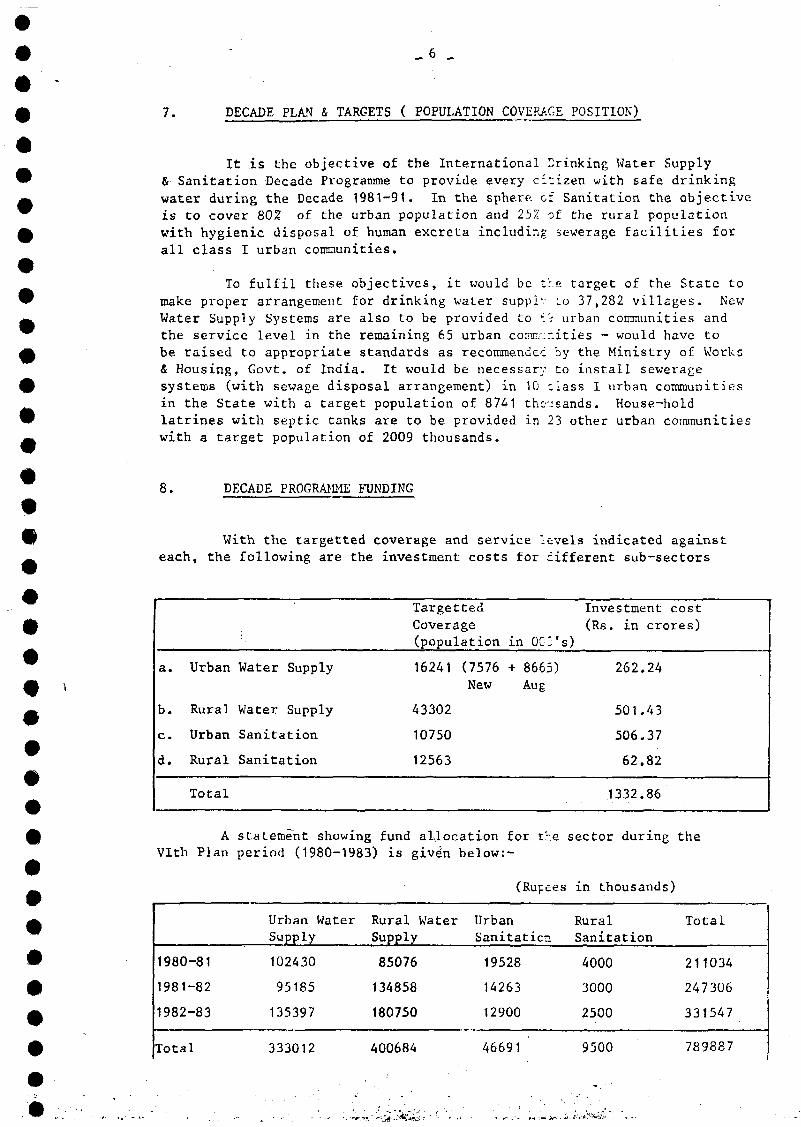
_ 6 _
7. DECADE PLAN & TARGETS ( POPULATION COVERAGE POSITION)
It is the objective of the International Drinking Water Supply& Sanitation Decade Programme to provide every citizen with safe drinkingwater during the Decade 1981-91. In the sphere of Sanitation the objectiveis to cover 80% of the urban population and 25Z of the rural populationwith hygienic disposal of human excreta including sewerage facilities forall class I urban communities.
To fulfil these objectives, it would be tmake proper arrangement for drinking water suppl"-Water Supply Systems are also to be provided to (.the service level in the remaining 65 urban comr/-be raised to appropriate standards as recommendec& Housing, Govt. of India. It would be necessarysystems (with sewage disposal arrangement) in 10in the State with a target population of 8741 thelatrines with septic tanks are to be provided inwith a target population of 2009 thousands.
he target of the State toto 37,282 villages. New
's urban communities andr.ities - would have toby the Ministry of Worksto install sewerage
^lass I urban communitiesjsands. House-hold23 other urban communities
8. DECADE PROGRAMME FUNDING
With the targetted coverage and service levels indicated againsteach, the following are the investment costs for different sub-sectors
a.
b.
c.
d.
Urban
Rural
Urban
Rural
Total
Water Supply
Water Supply
Sanitation
Sanitation
TargettedCoverage(population
16241 (7576New
43302
10750
12563
in OCO's)
+ 8665)Aug
Investment cost
(Rs. in crores)
262.24
501.43
506.37
62.82
1332.86
A statement showing fund allocation for the sector during theVlth Plan period (1980-1983) is given below:-
1980-81
1981-82
1982-83
Total
Urban WaterSupply
102430
95185
135397
333012
Rural WaterSupply
85076
134858
180750
400684
(Rupees
UrbanSanitaticr;
19528
14263
12900
46691
in thousands)
RuralSanitation
4000
3000
2500
9500
Total
211034
247306
331547
789887
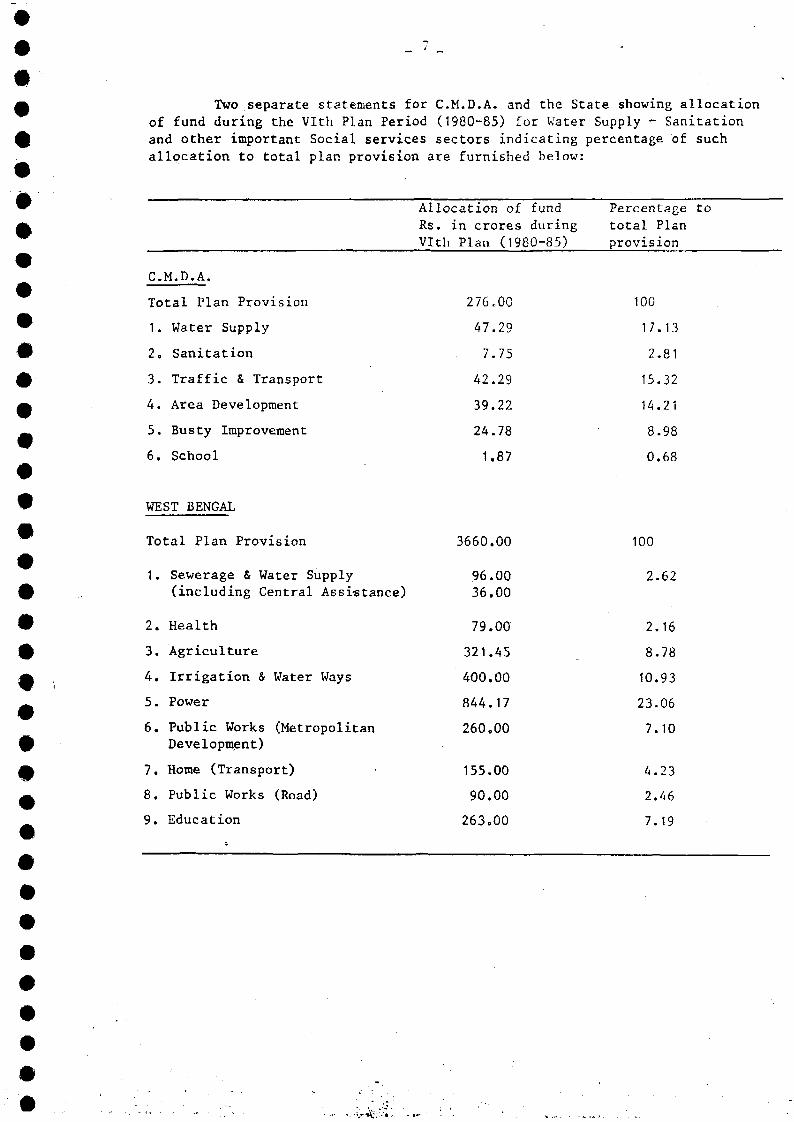
Two separate statements for C.M.D.A. and the State showing allocationof fund during the Vlth Plan Period (1980-85) for Water Supply - Sanitationand other important Social services sectors indicating percentage of suchallocation to total plan provision are furnished below:
C.M.D.A.
Total Plan Provision
1. Water Supply
2» Sanitation
3. Traffic & Transport
4. Area Development
5. Busty Improvement
6. School
Allocation of fundRs. in crores duringVlth Plan
276
47
7
42
39
24
1
(1980-85)
.00
.29
.75
.29
.22
.78
.87
Percentage tototal Planprovision
100
17.13
2.81
15.32
14.21
8.98
0.68
•
WEST BENGAL
Total Plan Provision 3660.00
1. Sewerage & Water Supply 96.00(including Central Assi-stance) 36.00
2. Health 79.00
3. Agriculture 321.45
4. Irrigation & Water Ways 400.00
5. Power 844.17
6. Public Works (Metropolitan 260.00Development)
7. Home (Transport) 155.00
8. Public Works (Road) 90.00
9. Education 263.00
100
2
2
8
10
23
7
4
2
7
.62
.16
.78
.93
.06
.10
.23
.46
.19
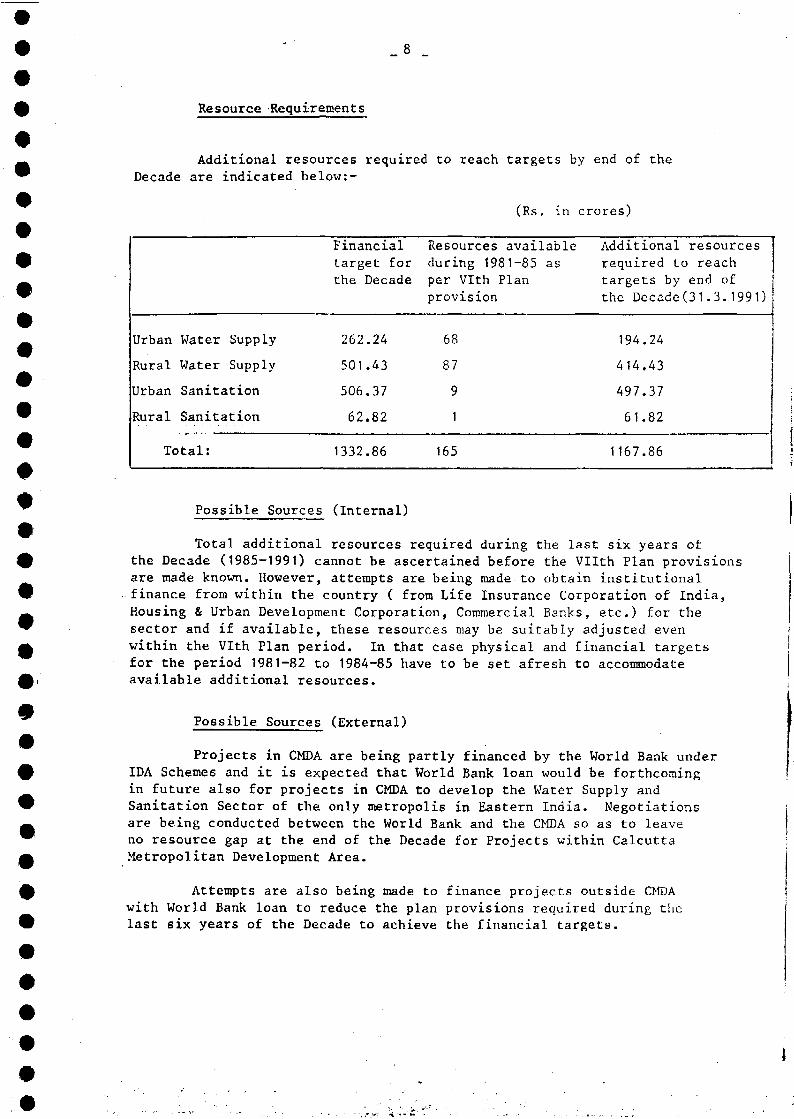
Resource Requirements
Additional resources required to reach targets by end of theDecade are indicated below:-
(Rs. in crores)
Urban Water Supply
Rural Water Supply
Urban Sanitation
Rural Sanitation
Total:
Financialtarget forthe Decade
262.24
501.43
506.37
62.82
1332.86
Resources availableduring 1981-85 asper Vlth Planprovision
68
87
9
1
165
Additional resourcesrequired to reachtargets by end ofthe Decade(31.3.1991)!
194.24
414.43
497.37
61,82
1167.86
Possible Sources (Internal)
Total additional resources required during the last six years ofthe Decade (1985-1991) cannot be ascertained before the Vllth Plan provisionsare made known. However, attempts are being made to obtain institutionalfinance from within the country ( from Life Insurance Corporation of India,Housing & Urban Development Corporation, Commercial Banks, etc.) for thesector and if available, these resources may be suitably adjusted evenwithin the Vlth Plan period. In that case physical and financial targetsfor the period 1981-82 to 1984-85 have to be set afresh to accommodateavailable additional resources.
Possible Sources (External)
Projects in CMDA are being partly financed by the World Bank underIDA Schemes and it is expected that World Bank loan would be forthcomingin future also for projects in CMDA to develop the Water Supply andSanitation Sector of the only metropolis in Eastern India. Negotiationsare being conducted between the World Bank and the CMDA so as to leaveno resource gap at the end of the Decade for Projects within CalcuttaMetropolitan Development Area.
Attempts are also being made to finance projects outside CMDAwith World Bank loan to reduce the plan provisions required during thelast six years of the Decade to achieve the financial targets.
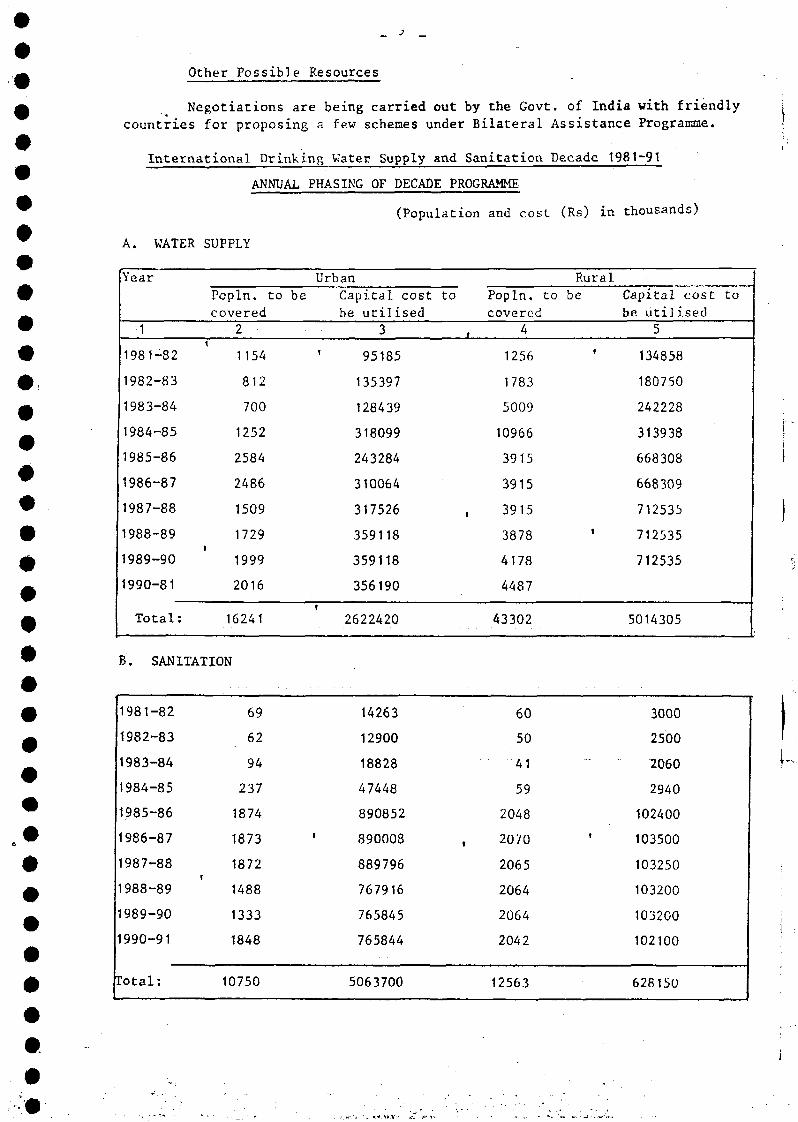
Other Possible Resources
Negotiations are being carried out by the Govt. of India with friendlycountries for proposing a few schemes under Bilateral Assistance Programme.
International Drinking Water Supply and Sanitation Decade 1981—91
ANNUAL PHASING OF DECADE PROGRAMME
(Population and cost (Rs) in thousands)
A. WATER SUPPLY
Year
•1
1981-82
1982-83
1983-84
1984-85
1985-86
1986-87
1987-88
1988-89
1989-90
1990-81
Total:
Popln. to becovered
2
1154
812
700
1252
2584
2486
1509
1729
1999
2016
16241
Urban
Capital cost tobe utilised
3
1 95185
135397
128439
318099
243284
310064
317526 ,
359118
359118
356190
2622420
Popln. tocovered
4
1256
1783
5009
10966
3915
3915
3915
3878
4178
4487
43302
Ruralbe Capital cost to
be utilised
5
' 134858
180750
242228
313938
668308
668309
712535
1 712535
712535
5014305
B. SANITATION
1981-82
1982-83
1983-84
1984-85
1985-86
1986-87
1987-88
1988-89
1989-90
1990-91
Total:
69
62
94
237
1874
1873
1872
1488
1333
1848
10750
14263
12900
18828
47448
890852
1 890008
889796
767916
765845
765844
5063700
60
50
41
59
2048
, 2070
2065
2064
2064
2042
12563
3000
2500
2060
2940
102400
1 103500
103250
103200
103200
102100
628150
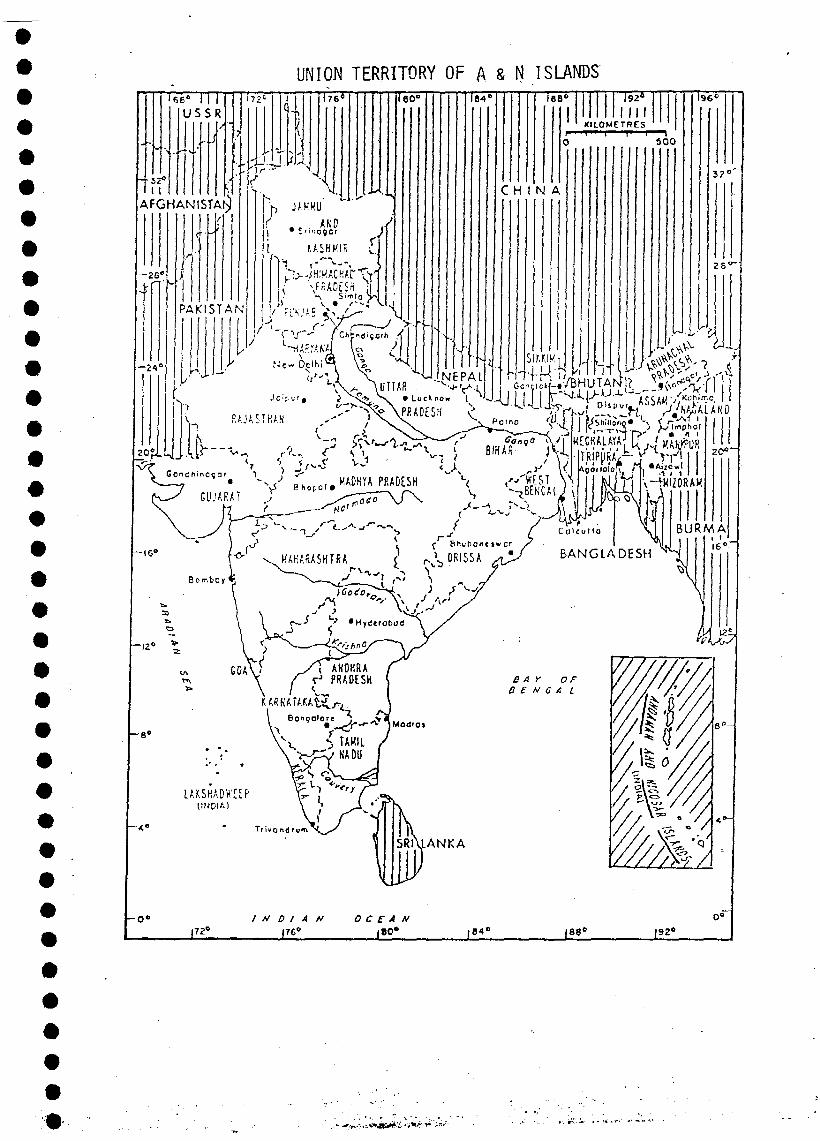
#
UNION TERRITORY OF A & N ISLANDSUs" I I i
USSR
- • 3 Z °
AFGHANISTAN
—28e
- 2 4 "
20»
PAKISTAN
? • "
JI KASHMIR i
Teoc Te-4' 188° 192°INI
KILOMtTRES
l96e
C H I N A
5 0 0
32°'
28 C
.^"V-, A, ^ v \ " ^ \ , B I H A R 1 ; U
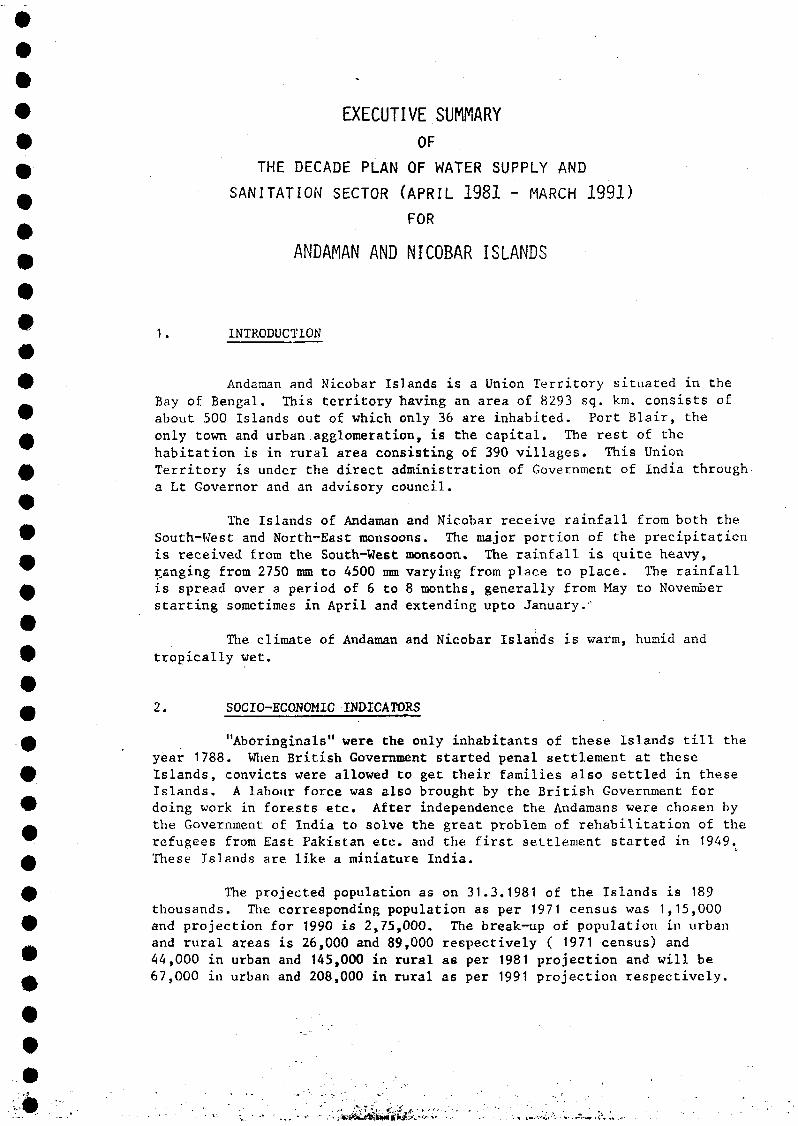
EXECUTIVE SUMMARYOF
THE DECADE PLAN OF WATER SUPPLY ANDSANITATION SECTOR (APRIL 1981 - MARCH 1991)
FOR
ANDAMAN AND NICOBAR ISLANDS
1. INTRODUCTION
Andaman and Nicobar Islands is a Union Territory situated in theBay of Bengal. This territory having an area of 8293 sq. km. consists ofabout 500 Islands out of which only 36 are inhabited. Port Blair, theonly town and urban agglomeration, is the capital. The rest of thehabitation is in rural area consisting of 390 villages. This UnionTerritory is under the direct administration of Government of India througha Lt Governor and an advisory council.
The Islands of Andaman and Nicobar receive rainfall from both theSouth-West and North-East monsoons. The major portion of the precipitationis received from the South-West monsoon. The rainfall is quite heavy,ganging from 2750 mm to 4500 mm varying from place to place. The rainfallis spread over a period of 6 to 8 months, generally from May to Novemberstarting sometimes in April and extending upto January.1
The climate of Andaman and Nicobar Islands is warm, humid andtropically wet.
2* SOCIO-ECONOMIC INDICATORS
"Aboringinals" were the only inhabitants of these Islands till theyear 1788. When British Government started penal settlement at theseIslands, convicts were allowed to get their families also settled in theseIslands, A labour force was also brought by the British Government fordoing work in forests etc. After independence the Andamans were chosen bythe Government of India to solve the great problem of rehabilitation of therefugees from East Pakistan etc. and the first settlement started in 1949.These Islands are like a miniature India.
The projected population as on 31.3.1981 of the Islands is 189thousands. The corresponding population as per 1971 census was 1,15,000and projection for 1990 is 2,75,000. The break-up of population in urbanand rural areas is 26,000 and 89,000 respectively ( 1971 census) and44,000 in urban and 145,000 in rural as per 1981 projection and will be67,000 in urban and 208,000 in rural as per 1991 projection respectively.
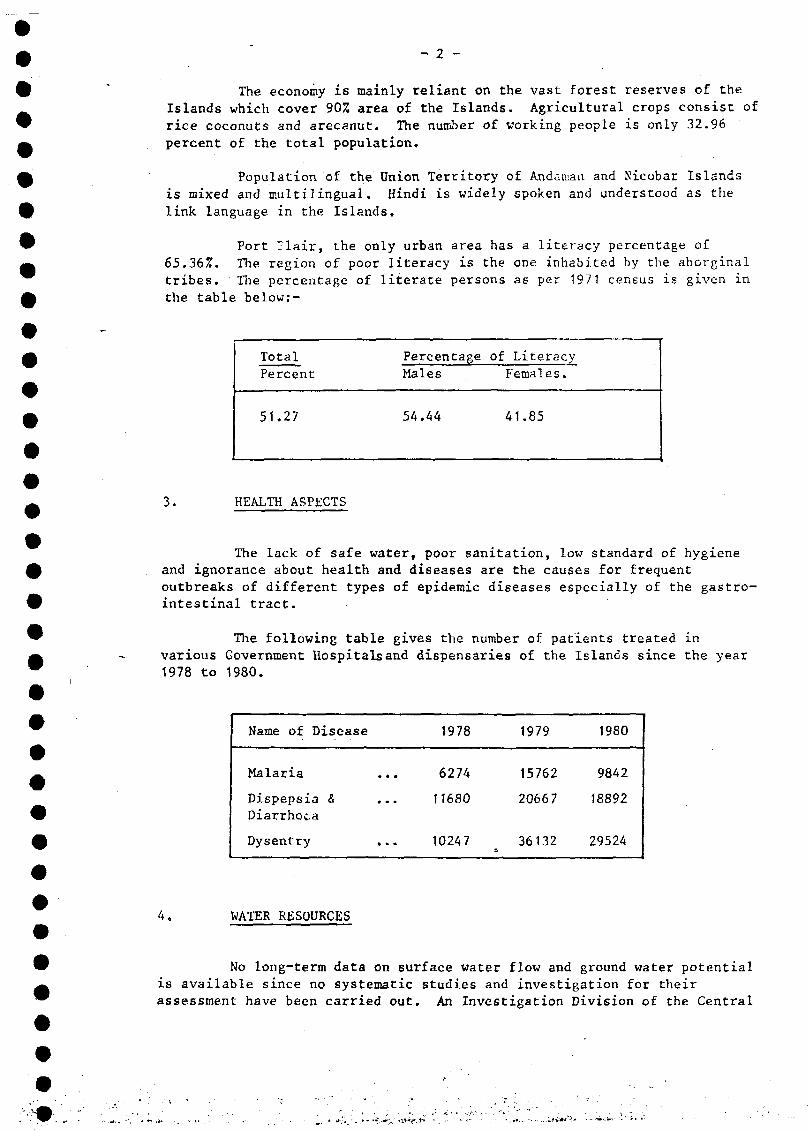
_ 2 -
The economy is mainly reliant on the vast forest reserves of theIslands which cover 90% area of the Islands. Agricultural crops consist ofrice coconuts and arecanut. The number of working people is only 32.96percent of the total population.
Population of the Onion Territory of Andaman and Nicobar Islands
is mixed and multilingual. Hindi is widely spoken and understood as the
link language in the Islands.
Port Tlair, the only urban area has a literacy percentage of65,36%. The region of poor literacy is the one inhabited by the aborginaltribes. The percentage of literate persons as per 1971 census is given inthe table below:-
TotalPercent
51.27
Percentage
Males
54.44
of LiteracyFemales.
41.85
3. HEALTH ASPECTS
The lack of safe water, poor sanitation, low standard of hygieneand ignorance about health and diseases are the causes for frequentoutbreaks of different types of epidemic diseases especially of the gastro-intestinal tract.
The following table gives the number of patients treated invarious Government Hospitals and dispensaries of the Islands since the year1978 to 1980.
Name of Disease
Malaria
Dispepsia & ...Diarrhoea
Dysentry
1978
6274
11680
10247
1979
15762
2066 7
36132
1980
9842
18892
29524
4. WATER RESOURCES
No long-term data on surface water flow and ground water potentialis available since no systematic studies and investigation for theirassessment have been carried out. An Investigation Division of the Central
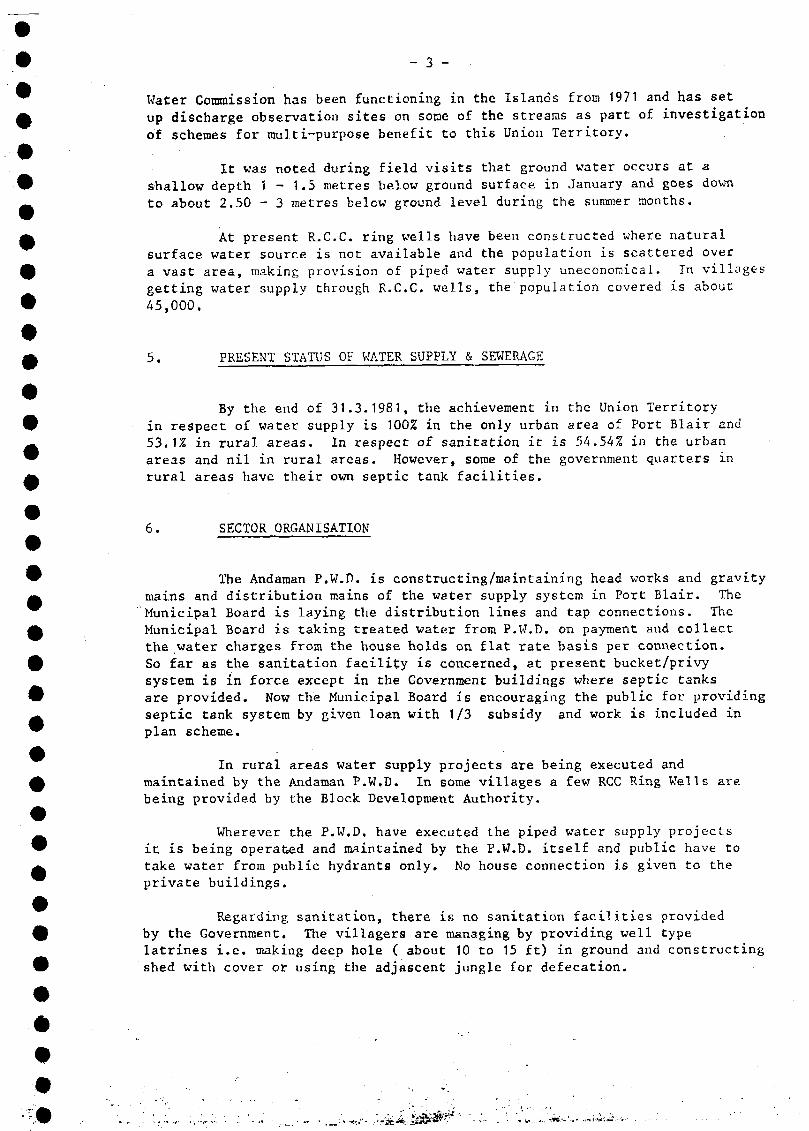
- 3 -
Water Commission has been functioning in the Islands from 1971 and has set
up discharge observation sites on some of the streams as part of investigation
of schemes for multi-purpose benefit to this Union Territory.
It was noted during field visits that ground water occurs at ashallow depth 1 - 1.5 metres below ground surface in January and goes downto about 2.50 - 3 metres below ground level during the summer months.
At present R.C.C. ring wells have been constructed where naturalsurface water source is not available and the population is scattered overa vast area, making provision of piped water supply uneconomical. In villagesgetting water supply through R.C.C. wells, the population covered is about45,000.
5. PRESENT STATUS OF WATER SUPPLY & SEWERAGE
By the end of 31.3.1981, the achievement in the Union Territoryin respect of water supply is 100% in the only urban area of Port Blair and53.1% in rural areas. In respect of sanitation it is 54.54% in the urbanareas and nil in rural areas. However, some of the government quarters inrural areas have their own septic tank facilities.
6. SECTOR ORGANISATION
The Andaman P.W.D. is constructing/maintaining head works and gravitymains and distribution mains of the water supply system in Port Blair. TheMunicipal Board is laying the distribution lines and tap connections. TheMunicipal Board is taking treated water from P.W.D. on payment and collectthe water charges from the house holds on flat rate basis per connection.So far as the sanitation facility is concerned, at present bucket/privysystem is in force except in the Government buildings where septic tanksare provided. Now the Municipal Board is encouraging the public for providingseptic tank system by given loan with 1/3 subsidy and work is included inplan scheme.
In rural areas water supply projects are being executed andmaintained by the Andaman P.W.D. In some villages a few RCC Ring Wells arebeing provided by the Block Development Authority.
Wherever the P.W.D. have executed the piped water supply projectsit is being operated and maintained by the P.W.D. itself and public have totake water from public hydrants only. No house connection is given to theprivate buildings.
Regarding sanitation, there is no sanitation facilities providedby the Government. The villagers are managing by providing well typelatrines i.e. making deep hole ( about 10 to 15 ft) in ground and constructingshed with cover or using the adjascent jungle for defecation.
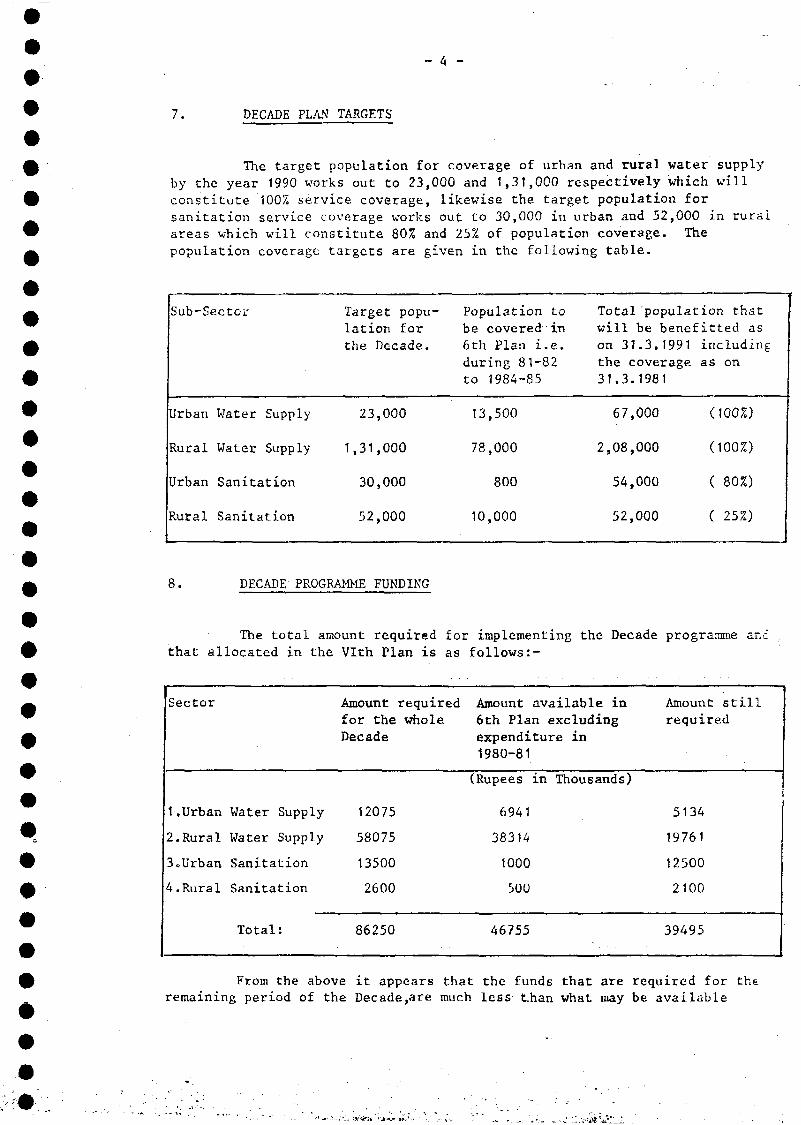
7. DECADE PLAN TARGETS
The target population for coverage of urban and rural water supplyby the year 1990 works out to 23,000 and 1,31,000 respectively which willconstitute 100% service coverage, likewise the target population forsanitation service coverage works out to 30,000 in urban and 52,000 in ruralareas which will constitute 80% and 25% of population coverage. Thepopulation coverage targets are given in the following table.
Sub-Sector
Urban Water Supply
Rural Water Supply
Urban Sanitation
Rural Sanitation
Target popu-lation forthe Decade.
23,000
1,31,000
30,000
52,000
Population tobe covered•in
6th Plan i.e.during 81-82to 1984-85
13,500
78,000
800
10,000
Total population thatwill be benefitted ason 31.3.1991 includingthe coverage as on31.3.1981
67,000 (100%)
2,08,000 (100%)
54,000 ( 80%)
52,000 ( 25%)
8. DECADE PROGRAMME FUNDING
The total amount required for implementing the Decade programme andthat allocated in the Vlth Plan is as follows:-
Sector
1.Urban
2.Rural
3«Urban
4.Rural
Water Supply
Water Supply
Sanitation
Sanitation
Total:
Amount requiredfor the wholeDecade
12075
58075
13500
2600
86250
Amount available in6th Plan excludingexpenditure in1980-81
(Rupees in Thousands)
6941
38314
1000
500
46755
Amount stillrequired
5134
19761
12500
2100
39495
From the above it appears that the funds that are required for the.remaining period of the Decade,are much less t.han what may be available
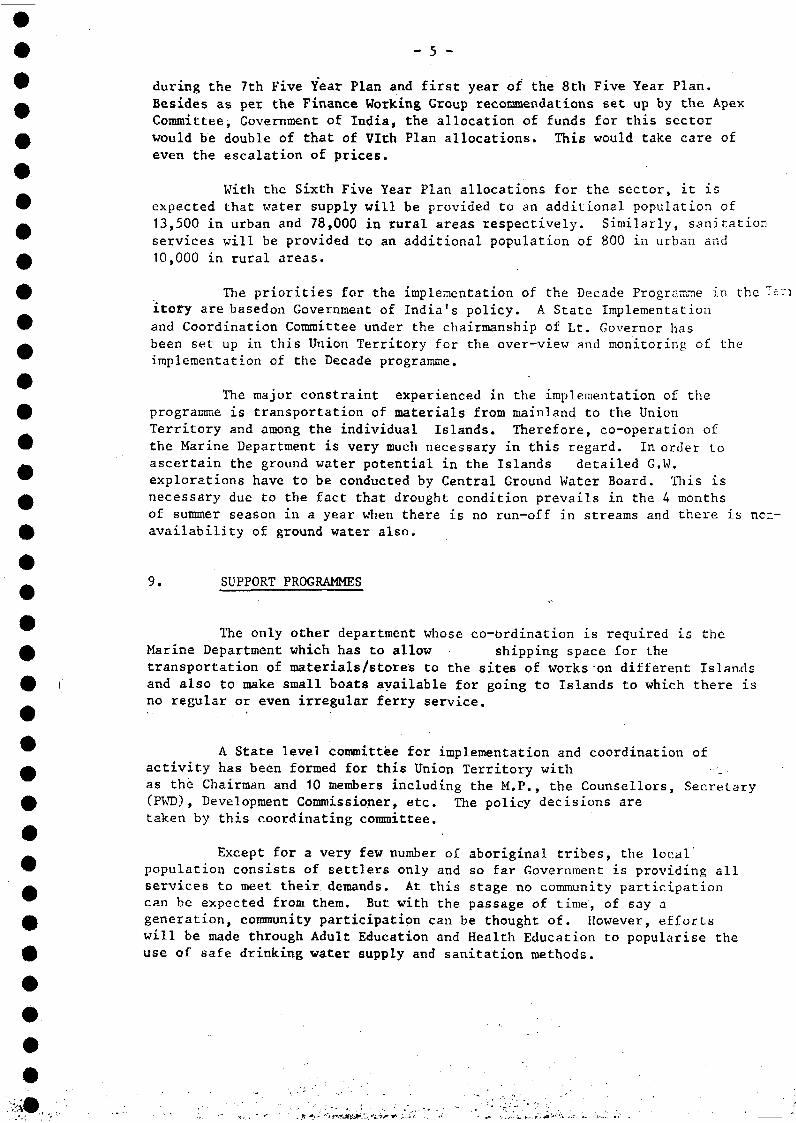
- 5 -
during the 7th Five Year Plan and first year of the 8th Five Year Plan,Besides as per the Finance Working Group recommendations set up by the ApexCommittee, Government of India, the allocation of funds for this sectorwould be double of that of Vlth Plan allocations. This would take care ofeven the escalation of prices.
With the Sixth Five Year Plan allocations for the sector, it isexpected that water supply will be provided to an additional population of13,500 in urban and 78,000 in rural areas respectively. Similarly, sanitationservices will be provided to an additional population of 800 in urban and10,000 in rural areas.
The priorities for the implementation of the Decade Programme in the ~f.riitory are basedon Government of India's policy. A State Implementationand Coordination Committee under the chairmanship of Lt. Governor hasbeen set up in this Union Territory for the over-view and monitoring of theimplementation of the Decade programme.
The major constraint experienced in the implementation of theprogramme is transportation of materials from mainland to the UnionTerritory and among the individual Islands. Therefore, co-operation ofthe Marine Department is very much necessary in this regard. In order toascertain the ground water potential in the Islands detailed G.W.explorations have to be conducted by Central Ground Water Board. This isnecessary due to the fact that drought condition prevails in the A monthsof summer season in a year when there is no run-off in streams and there is non-availability of ground water also.
9. SUPPORT PROGRAMMES
The only other department whose co-ordination is required is theMarine Department which has to allow shipping space for thetransportation of materials/stores to the sites of works on different Islandsand also to make small boats available for going to Islands to which there isno regular or even irregular ferry service.
A State level committee for implementation and coordination ofactivity has been formed for this Union Territory withas the Chairman and 10 members including the M.P., the Counsellors, Secretary(PWD), Development Commissioner, etc. The policy decisions aretaken by this coordinating committee.
Except for a very few number of aboriginal tribes, the localpopulation consists of settlers only and so far Government is providing allservices to meet their demands. At this stage no community participationcan be expected from them. But with the passage of time, of say ageneration, community participation can be thought of. However, effortswill be made through Adult Education and Health Education to popularise theuse of safe drinking water supply and sanitation methods.
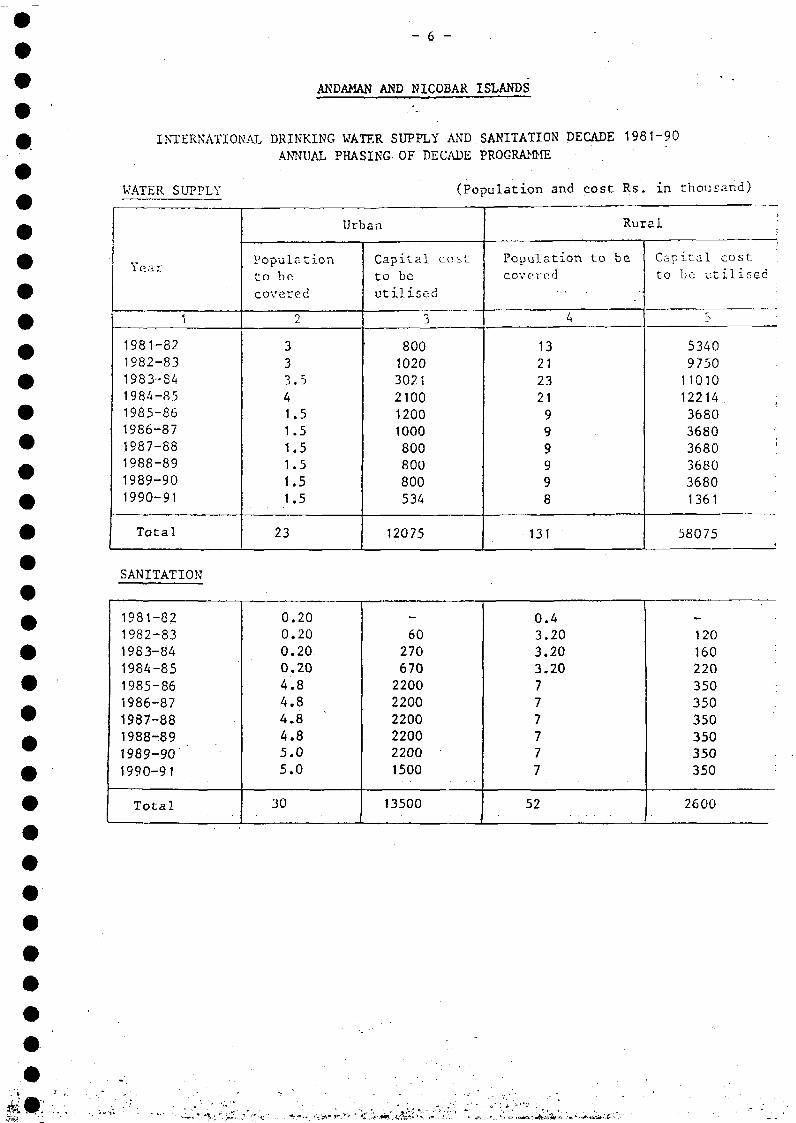
- 6 -
ANDAMAN AND NICOBAR ISLANDS
INTERNATIONAL DRINKING WATER SUPPLY AND SANITATION DECADE 1981-90
ANNUAL PHASING OF DECADE PROGRAMME
WATER SUPPLY (Population and cost Rs. in thousand)
Year
1
1981-821982-831983-841984-851985-861986-871987-881988-891989-901990-91
Total
Urban
Populationto becovered
2
t
3
33.5
1.5.51.5.5.5.5
23
Capital costto beutilised
3
800)0203021210012001000800800800534
12075
Rural
Population to becovered
4
13212321999998
131
Capital costto be utilised
;>
534097501101012214 ;
36803680 :|3680 !368036801361
58075
SANITATION
1981-821982-831983-841984-851985-861986-871987-881988-891989-901990-91
Total
0.200.200.200.20
4.84.84.84.85.05.0
30
_
60270670220022002200220022001500
13500
0.43.203.203.20
777777
52
120160220350350350350350350
2600
• - - • • • • • * . •
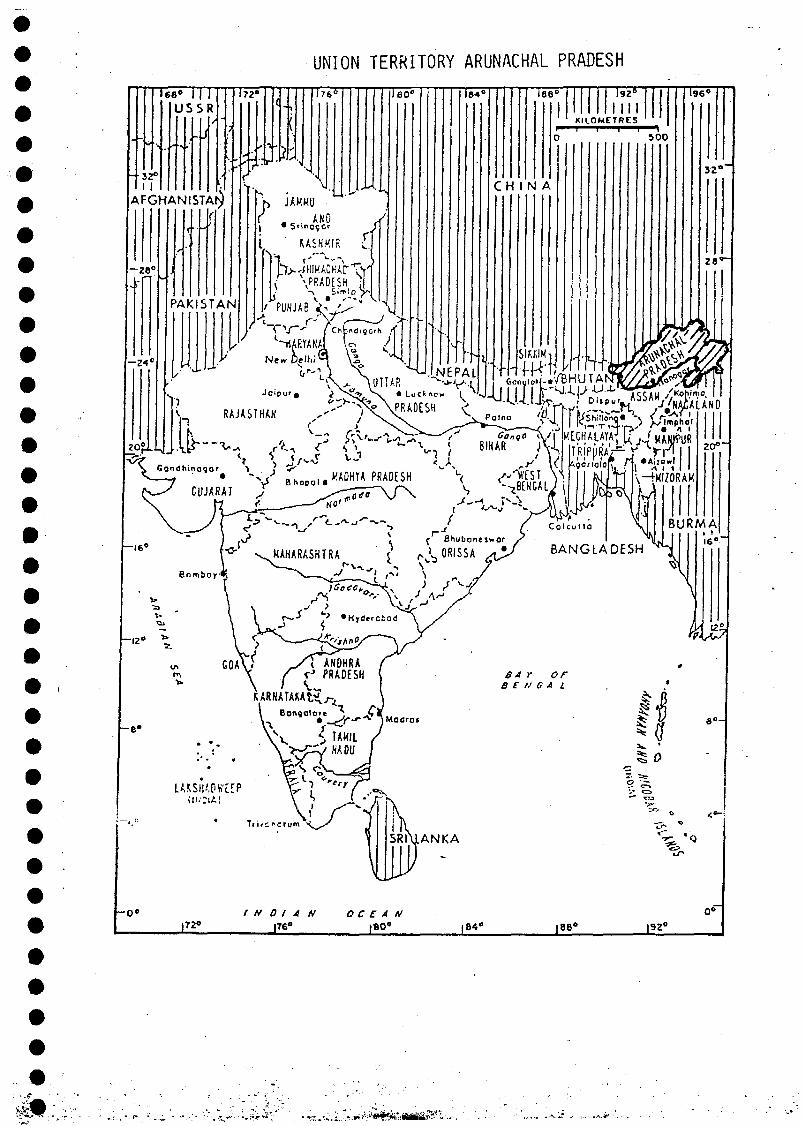
UNION TERRITORY ARUNACHAL PRADESH
1 1 • 1 1 • • • , ,
AFGHANISTAN
t ^ Shubont jwor
I ^ ORISSA *
* ' • • :
" *s;,.*i?;^,,.i..-.1i:-i"
EXECUTIVE SUMMARYOF
THE DECADE PLAN OF WATER SUPPLY ANDSANITATION SECTOR (APRIL 1981 - MARCH 1991)
FOR
ARUNACHAL PRADESH
1. INTRODUCTION
The erstwhile North Eastern Frontier Agency was granted the statusof Union Territory during 1972 under the provisions of North East Areas(re-Organisation) Act 1981 of 1971. The torritory was named as ArunachalPradesh. It is strategically an important territory, having theinternational boundaries of China and Tibet in the north, China and Burmain the East and Bhutan in the West. The Indian states viz. Assam andNagaland are in the South of Arunachal Pradesh.
The geographical area of the territory is 83578 sq. kilometres.Most of it is having hilly and rugged tepography except for a small andnarrow belt along the boundary of Assam state in the foot-hills. It isinhabited by tribal population except for Govt. employees and workerscoming from other parts of the country. The entire territory has beendivided into nine districts.
About 62% area of the territory is under forests. The mainoccupation of the tribal people are agriculture, animal raring and forestbased small scale industries.
The altitude of the land near the plains of Assam is less than300 metres with warm and humid climate upto 600 metres height from MSL. Inthe sub-mountainous region, the climate is moderate upto 1500 metres.Above this, the climate is dry and cold. The complexity of relief, has aprofound effect on the distribution pattern of rainfall. The averageannual rainfall is about 250 cm.
2. SOCIO-ECONOMIC INDICATORS
There are 110 tribes and subtribes, each having different entity,distinctly visible from their costumes, housing pattern, living conditions,cultural habits and the dialect. The people are poor and backward. Thepopulation of the territory as per 1971 census was 466,000 and the actualpopulation from 1981 census records is 628,000. However, projected
8£V-
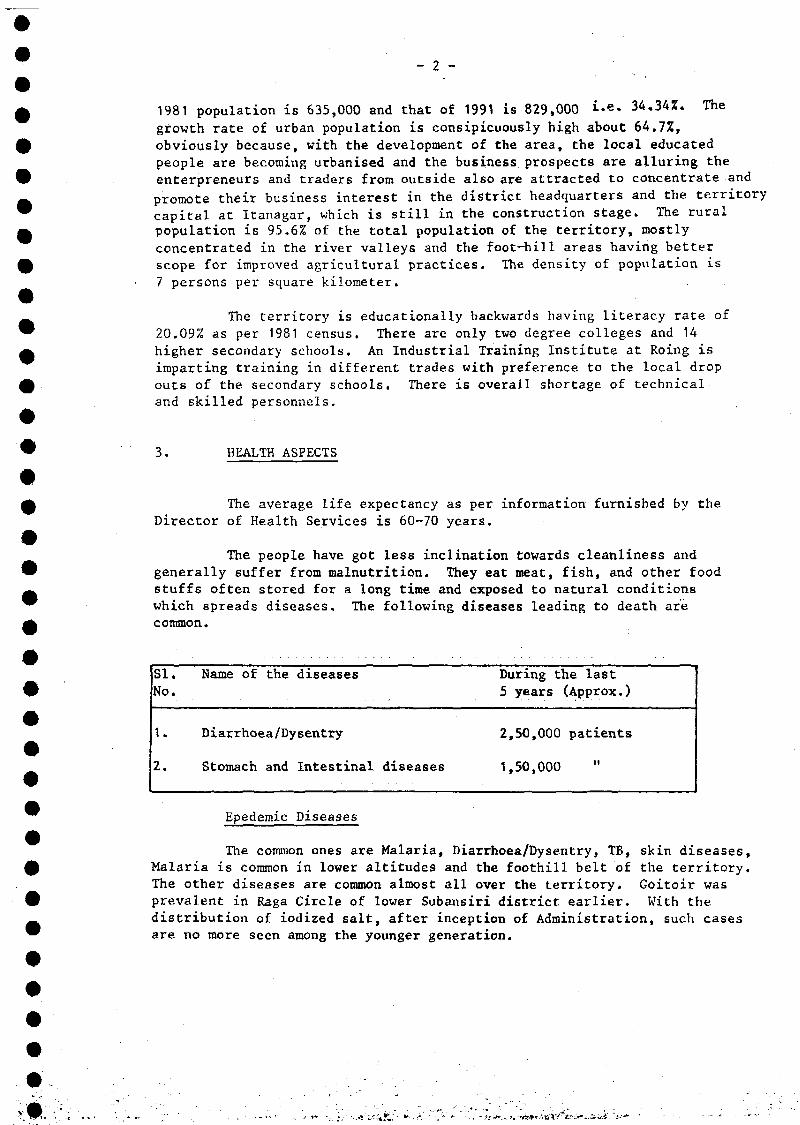
— 2 —
1981 population is 635,000 and that of 1991 is 829,000 i«e- 34.34%. Thegrowth rate of urban population is consipicuously high about 64.7%,obviously because, with the development of the area, the local educatedpeople are becoming urbanised and the business prospects are alluring theenterpreneurs and traders from outside also are attracted to concentrate andpromote their business interest in the district headquarters and the territorycapital at Itanagar, which is still in the construction stage. The ruralpopulation is 95.6% of the total population of the territory, mostlyconcentrated in the river valleys and the foot-hill areas having betterscope for improved agricultural practices. The density of population is7 persons per square kilometer.
The territory is educationally backwards having literacy rate of20.09% as per 1981 census. There are only two degree colleges and 14higher secondary schools. An Industrial Training Institute at Roing isimparting training in different trades with preference to the local dropouts of the secondary schools. There is overall shortage of technicaland skilled personnels.
3. HEALTH ASPECTS
The average life expectancy as per information furnished by theDirector of Health Services is 60-70 years.
The people have got less inclination towards cleanliness andgenerally suffer from malnutrition. They eat meat, fish, and other foodstuffs often stored for a long time and exposed to natural conditionswhich spreads diseases. The following diseases leading to death arecommon.
S I .No.
1.
2 .
Name of the diseases
Diarrhoea/Dysentry
Stomach and Intestinal diseases
During the last5 years (Approx.)
2,50,000 patients
1,50,000 "
Epedemic Diseases
The common ones are Malaria, Diarrhoea/Dysentry, TB, skin diseases,Malaria is common in lower altitudes and the foothill belt of the territory.The other diseases are common almost all over the territory. Goitoir wasprevalent in Raga Circle of lower Subansiri district earlier. With thedistribution of iodized salt, after inception of Administration, such casesare no more seen among the younger generation.
• - 3 - - • •
Other Health Hazards
™ Unhygienic conditions, food commodities exposed to flies and otherA germs, less inclination toward washing and bathing, living with animals
like pigs, dogs, poultry birds in the same house, spread various diseases.£ There is no industrial population but poor sanitation and stagnation of
rainwater in some of the villages, do cause environmental contamination»
4. WATER RESOURCES
0 For estimation of available surface water resources, the wellequipped hydre meterological stations do not exist in the territory at
4P present, as a result the water balance and stream flow data could not beworked out. The Central Water Commission has recently started investigation
™ on few major hydel projects, which are likely to continue for a few yearsH to obtain the reliable data. The Central Ground Water Board had also taken
up the task of survey and estimation of ground water potentials but the0 report is still not available.
5. PRESENT STATUS OF WATER SUPPLY & SEWERAGE
Upto the fourth Plan period, 688 villages were covered with someA kind of water supply, making use of polythene pipes. There existed no
engineering department exclusively for implementing such schemes at that0 time, therefore, the materials were issued to the villagers directly for
lifting upto the site and laying these materials with little know-how9 that they possessed.
™ The Rural Works Department was created during 1978 to implementA such schemes in rural areas and during fifth plan period. 545 villages and
48 townships were provided with drinking water. In the first year of the£ Sixth Plan (1980-81) another 172 villages and 9 townships were covered.
Thus prior the launching of this Decade, total 1405 villages and 57£ townships had already been covered with drinking water supply. The population
served as on 31.3.1981 was 417,000 with drinking water supply ) 25,000• urban and 392,000 rural) and22000 under urban sanitation.
# 6. SECTOR ORGANISATION
It was earlier a centrally administered area under the MinistryW of Home Affairs. During 1972, it was made Union Territory. Subsequently,
the programmes and schemes under different sectors are executed byw different departments. Two engineering organisations viz - PWD and RWD areA in existence with clear demarcation of the responsibilities. The water
supply and sanitation works in urban areas (Admn. centres) are executed£ by the PWD and in rural areas by the Rural Works Department. The Rural
Works Department is responsible for Minor Irrigation, Soil Conservation
t Rural Roads and bridges, fisheries works and agricultural machineries,
in addition to the rural water supply and sanitation schemes. The Public
' Works Department has a Chief Engineer, five Superintending Engineers.
The plan programme are executed by various departments with) functioneries spread over the entire U.T. right upto the village level.
The Concerned head of the department is responsible for survey, planningW and execution of the projects and is answerable to the Secretary of the
^ Department, The Survey, investigation, execution, operation and maintenance
' works are done by the Executive Engineer through his supporting staff in both* the department viz. PWD, RUT). The planning & design cells are attached to
Chief Engineer's Office. The technical sanctions are accorded at each level
0 within their technical powers, which are concurrent tc those of the CPWDOfficers. The Chief Engineer has full powers.
_ The Rural Works Department is responsible for execution of rural™ water supply and sanitation schemes while Public Works Department is» responsible for urban water supply and sanitation programmes throughout
the Union Territory.
• 7. DECADE PLAN AND TARGETS
A Most of the problem villages and urban areas can be covered withdrinking water supply during the Sixth Plan except 55 villages. In addition
£ to this, another 29' non-problem villages would be left uncovered. These340 villages are proposed to be covered with drinking water supply during
W the first two years of the Seventh Five Year Plan. The Seventh Five YearPlan period and the first year of the Eighth Five Year Plan, will also be
^ devoted to augmentation of water supply schemes and a few urban systems
f which were constructed before the Fifth Plan period. Filtration and
treatment in 760 villages and the remaining township will also be provided£ within the Decade period. By population, 412,000 will be provided with
drinking water supply both in urbanand rural areas (18000 + 394000) and# ' 209,000'(12,000 + 197,000) will be covered with sanitation facilities
during the Decade period.
^ 8. DECADE PROGRAMME FUNDING
#
0 The total investment cost, as per the Decade Master Plan would beRs. 174225 thousands for these programmes. The plan-wise phasing for the
W period coinciding with the Decade as as under:-
• 6th Plan (1981-82 to 1984-85) - Rs.140,851 thousands
# 7th Plan (1985-86.to 1989-90) - Rs.154,740 thousands
0 8th Plan (1st year 1990-91) - Rs. 32,000 thousands
Total: Rs.377,211 thousands
- 5 -
Under state sector, grant of Rs. 1277.00 lakhs which is only about6.02% of the total annual plan size of the territory, has been allocatedduring the Sixth plan. Another Rs. 247.50 lakhs were allocated under Centralsector grant. Thus total allocations during Sixth Plan comes to Rs. 1524.50lakhs. The Government of India, has been approached to enhance it, so thatfull targets envisaged for Sixth Plan period of the Decade could be achieved.Out of this Sixth Plan grant, Rs. 115.99 lakhs were spent during 1980-81prior to launching this Decade, and therefore, only Rs. 1408.51 lakhs areavailable for the Decade period in the Sixth Plan.
The main source of funds is the allocations made by the Governmentof India. No other lending agencies and external assistance has been soughtfor, as the rural water supply schemes are of small size. The territoryis inhabited by backward tribal people and no water charges are levied onthem. Therefore repayment of loan if taken from outside would be difficultfrom these non-emunerative schemes. The water supply schemes are taken with f;consent of the Zilla Parishad at different level and approval of StatePlanning Board, chaired by the Chief Minister. The priorities within theavailable resources, are also fixed by the State Planning Board. Theexpenditure sanction is accorded by the Administrator, and the sanctionedprojects are executed by Public Works Department in urban areas and RuralWorks Department in rural areas.
Funds required for the Decade Programme (1980 price level)
i) Urban Water Supply - Rs. 9000,000
ii) Rural Water Supply - Rs.150175,000
iii) Urban Sanitation - Rs. 5200,000
iv) Rural Sanitation - Rs. 9850,000
TOTAL: Rs.174225,000
#
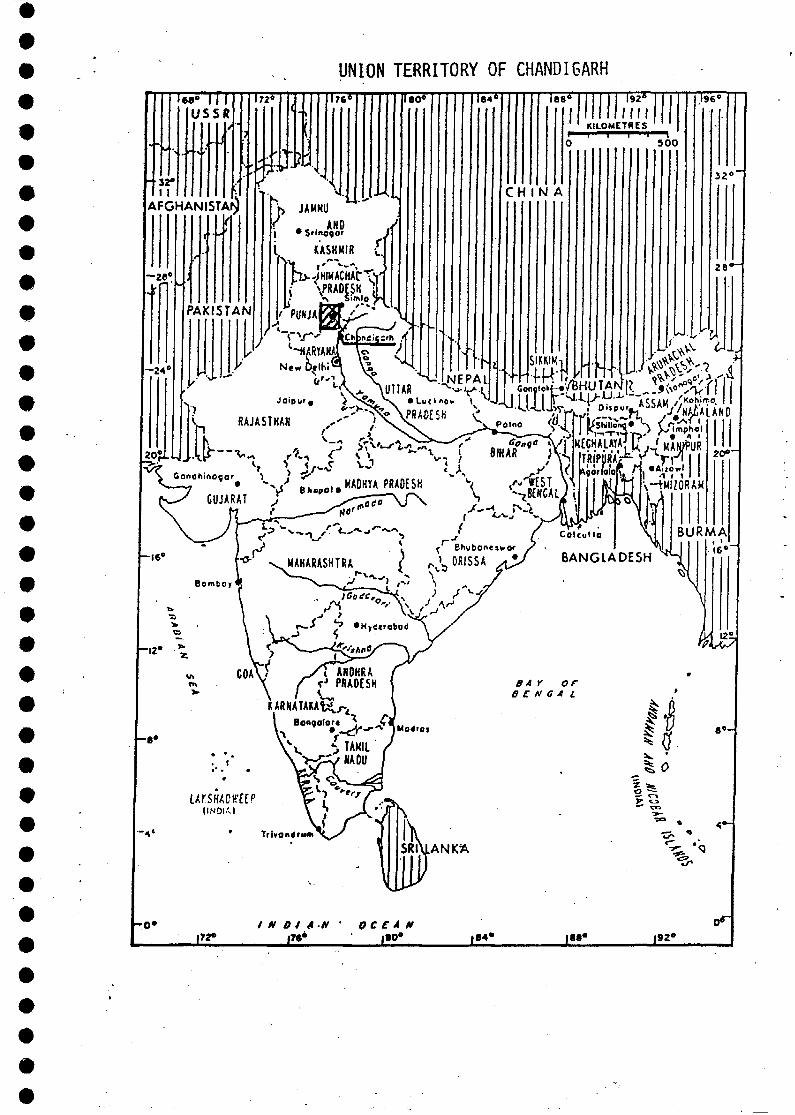
UNION TERRITORY OF CHANDIGARH
USSR
• 32°II :
AFGHANISTAN
- 2 8 °
-24'
Ï72*
PAKISTAN
t
JAMMUAND
KASHMIR I
p^HIMACHAIT^\PRADESH •
180* 164
1 KILOMETRES
C H I N A
SIKKIM>IMUKi
SOO
196'
32°'
28°~
- ^ ^ • u - 1 - 1 ^. ASSAM/"•tt'W.U
^ £ ^ b . ^ i, f MECHALATA7^ U W U R
^ TRIPURA^ ^ > r f I IlAijowl-1 i 1 I
20" '
• Vc-1 r l ..ICADHYA PMDESH L< /^ST. VI
-e»
I N D I A N - OCEANfltà |B0* |88«
0 . EXECUTIVE SUMMARY
» 0F
- THE DECADE PLAN OF WATER SUPPLY ANDSANITATION SECTOR (APRIL 1981 - MARCH 1991)
• FOR
• CHANDIGARH• • " • • • • '
^ 1. INTRODUCTION
The Chandigarh, Union Territory, covers an area of about 114 sq. km.40 It consist of 46 sectors, 1 to 12, 14 to 47 and an Industrial Area. The
area of city is 57.60 sq.km. In addition to this, there are 22 villagesw which fall under the U.T. of Chandigarh out of which 4 villages come under the_ master plan and the remaining 18 villages fall under the rural area. The^ area of these villages is 56.40 sq. km. Development of the city underA master plan is divided into 2 phases. First phase consists of 29 sectors (1 to
12) and 14 - 30, and about 500 acre of Industrial Area. The remaining area£ of master plan fall in the second phase of development.
W Chandigarh is situated in the foot of Shivalik Hills and bounded by_ Punjab and Haryana States on the Ambala-Kalka Railway Line.
Boundaries:
East: Ambala (Haryana)• West: Ropar (Punjab)
South: Patiala (Punjab)™ North: Ropar (Panjab)
#
f 2. SOCIO ECONOMIC
• The projected population of the city on 31.3.1981 was 5.17 lacs andW the rate of growth is 8.6Z per year. It is estimated that the population of^ Chandigarh by 31.3.1991 will be 9.52 lacs.
A The climatic conditions in Chandigarh are hot in Summar, temperaturegoing up to 11°F and cold in Winter, temperature dropping at times to below
0 freezing point. The season here has been divided, during the year as below:
• a) Sunmer season : From April to mid-July, these are_ dry and hot months™ b) Monsoon : From mid-July to mid-Sept enterA c) Winter & Spring season : Fro» mid-September to March.
- 2 -
Chandigarh area experiences annual average rain fall of about 42"(1050 mm). The rain.is mostly confined to the months of July and August.A small part of it occursin the Winter months of December and January.
a) Income per capita Rs.1990/- per year as on 31.3.1981.The"trend is on up ward side.
b) Occupation
The workers have their distribution in four broadoccupation categories:
i) Cultivatorsii) Agricultural Labour
iii) House hold industry;iv) Other workers.
3. HEALTH ASPECTS
a) Life expectancy : 60 years (average)b) Morbidity and Mortality : Infant mortality
65.8/1000Birth rate 27.1/1000Death rate 8.1/1000
There were no water and fecal borne diseases during the past fiveyears.
4. WATER RESOURCES
It has ascertained by the Geological Survey of India that the safeyielding capacity of underground reservoir is only 20,000 cubic meterper day (about 5 mgd) and any other drawal from the under ground reservoiris likely to have deleterious -effects on the water table condition and thatAdministration should think of tapping alternative sources for water supplyto meet the increasing demand of the City Chandigarh.
For this reasons surface water is the only source that can be usedfor the augmentation of water supply of this city.
5. PRESENT STATUS OF WATER SUPPLY AND SEWERAGE
Urban Water Supply and Sewerage
a) Coverage: The total coverage as on 31.3.81, is 93.7% and bythe end of decade i.e. on 31.3.1991 the coverage will be 100Z(both water supply and sewerage).
} - 3 - • •.
> • . ' . ' • "
I b) Information of service level of water supply: The servicelevel as on 31.3.81 is 60 gallons per head per day. It will
^ be 100 gallons per head per day on completion of the Augmentationof water supply scheme based on surface water.
Adequate attention is being paid during the planning and designing of" the water supply system to facilitate good operation and maintenance, access^ roads, measuring devices and communication facilities have been provided.
P The head of the operation is one Executive Engineer, with qualifiedand experienced staff working udner him for proper maintenance.
^ As regards funds, the Water Supply Project at Chandigarh is being™ run on no profit no loss basis and in case of any loss the water rates are£ revised accordingly.
6. SECTOR ORGANISATION
• .
W The water supply and sanitation of the Union Territory of Chandigarh^ is being looked after by the Public Health Wing of the Engineering Department
under the Chief Engineer and Secretary, Engineering Department. The0 organisation set up at present is as under:
9 1. Chief Engineer & Secretary 1 No,Engineering Department
™ (Common to all Engineering-set up)
0 2. Superintending Engineer, 1 No.
Public Health
, 3. Executive Engineers 5 Nos.
^ 4. Sub Divisional Engineers 17 Nos.
The maintenance of the water supply and sanitation (sewerage) is also lookedf after by the Public Health Department.
Functional Responsibilities.
The functional responsibilities of water supply and sanitation bothrural and urban for all the different aspects like investigation, survey,design, execution, operation and maintenance, quality control, lies with theEngineering Department. As regards legislation powers of sanction (admn.financial and technical is as under:
The yearly budget of the expenditure of Union Territory is passedby Parliament.
The Administrative approval upto 5 lacs is accorded by the ChiefEngineer, Engineering Department as regards technical sanction full powers(against which funds are available).
Administrative approval of estimates more than five lacs and upto25 lacs the administrative approval is being accorded by the Finance Secretar(if the budget provision exist), Union Territory, Chandigarh, Beyond thisall the administrative approvals are accorded by Finance Department of Centr=Government. •
7. DECADE PLAN TARGETS
The overall picture of the achievement in water supply and sanitationin urban area till the March 1981 is that 93.7% of the urban population havebeen provided with water supply sanitation facilities.
The target population assessed for provision of water supply/sanitaticr.facilities by end of March 1991 is about 4.72 lacs. In addition the programmeenvisages for augmentation of service to about 4.80 lacs population inrespect of urban water supply and sanitation.
Target population and coverage
Target population is the uncovered population as on 31.3.81 plus theincreases in population during 1-4-81 to 31.3.1991.
Urban water supply (in thousands) : 472Urban sanitation -do- : 472
(Note: In addition to above a population 480 (thousands) needs augmentationfacilities (both water supply & sanitation).
Plan Outlay
Investment Cost Cost in thousands
a) Urban Water Supply Rs.378 400.-b) Urban Sanitation Rs.237 080.-
Total "- Rs.615,480
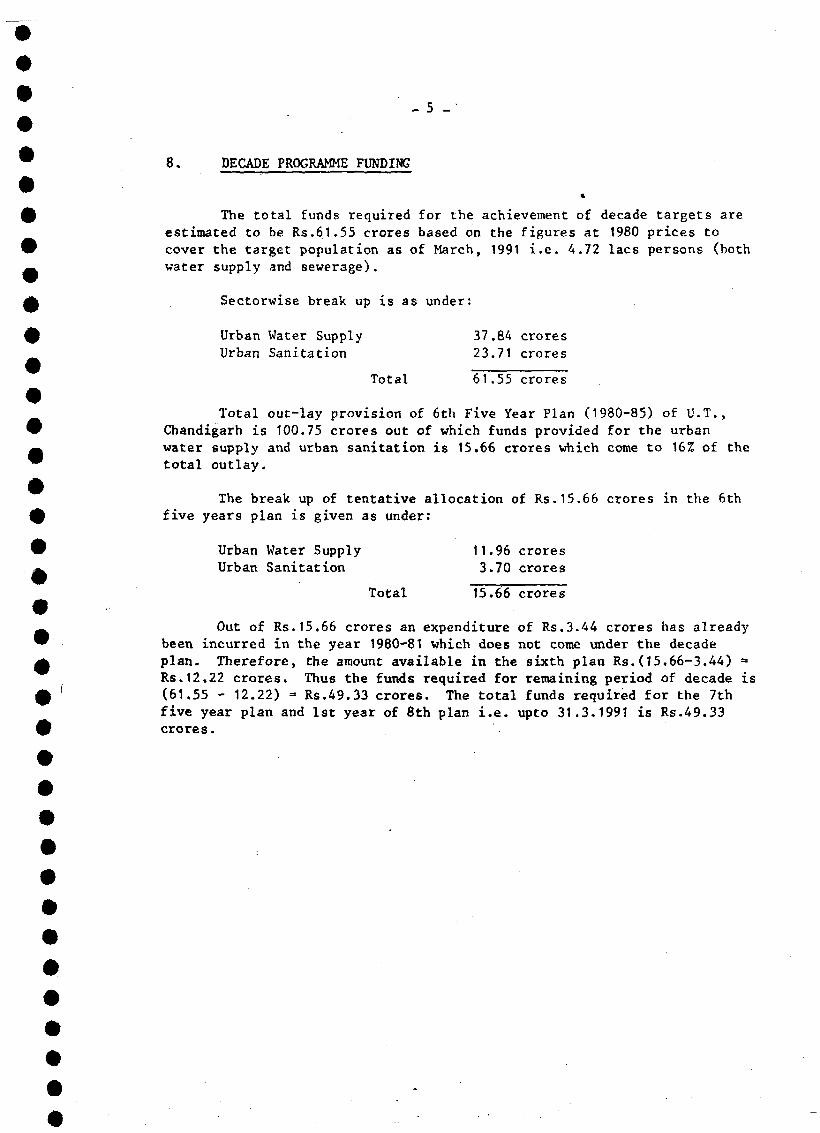
_ 5 -
8. DECADE PROGRAMME FUNDING
The total funds required for the achievement of decade targets areestimated to be Rs.61.55 crores based on the figures at 1980 prices tocover the target population as of March, 1991 i.e. 4.72 lacs persons (bothwater supply and sewerage).
Sectorwise break up is as under:
Urban Water Supply 37.84 croresUrban Sanitation 23.71 crores
Total 61.55 crores
Total out-lay provision of 6th Five Year Plan (1980-85) of U.T.,Chandigarh is 100.75 crores out of which funds provided for the urbanwater supply and urban sanitation is 15.66 crores which come to 16% of thetotal outlay.
The break up of tentative allocation of Rs.15.66 crores in the 6thfive years plan is given as under:
Urban Water Supply 11.96 croresUrban Sanitation 3.70 crores
Total 15.66 crores
Out of Rs.15.66 crores an expenditure of Rs.3.44 crores has alreadybeen incurred in the year 1980-81 which does not come under the decadeplan. Therefore, the amount available in the sixth plan Rs.(15.66-3.44) -Rs.12.22 crores. Thus the funds required for remaining period of decade is(61.55 - 12.22) = Rs.49.33 crores. The total funds required for the 7thfive year plan and 1st year of 8th plan i.e. upto 31.3.1991 is Rs.49.33crores.
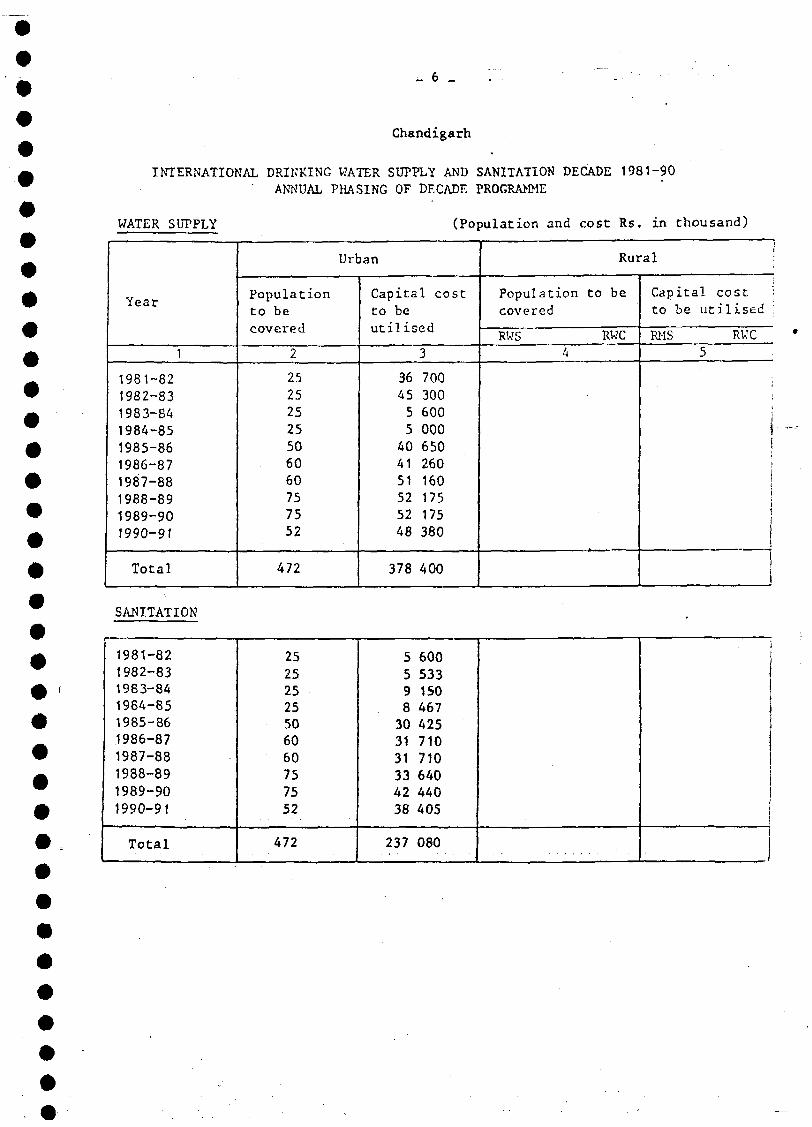
- 6 _
Chandigarh
INTERNATIONAL DRINKING WATER SUPPLY AND SANITATION DECADE 1981-90' ANNUAL PHASING OF DECADE PROGRAMME
WATER SUPPLY
V a a y
1
1981-821982-831983-841984-851985-861986-871987-881988-891989-901990-91
Total
Populationto becovered
2
25252525506060757552
472
(Population and
Urban
Capital costto beutilised
3
36 70045 3005 6005 00040 65041 26051 16052 17552 17548 380
378 400
Populationcovered
RWS4
cost Rs, in thousand)
Rural
to be
RWC
Capital costto be utilised
RMS RWC5
I!i
1
1
SANITATION
1981-821982-831983-841984-851985-861986-871987-881988-891989-901990-91
Total
25252525506060757552
472
5 6005 5339 1508 46730 42531 71031 71033 64042 44038 405
237 080I
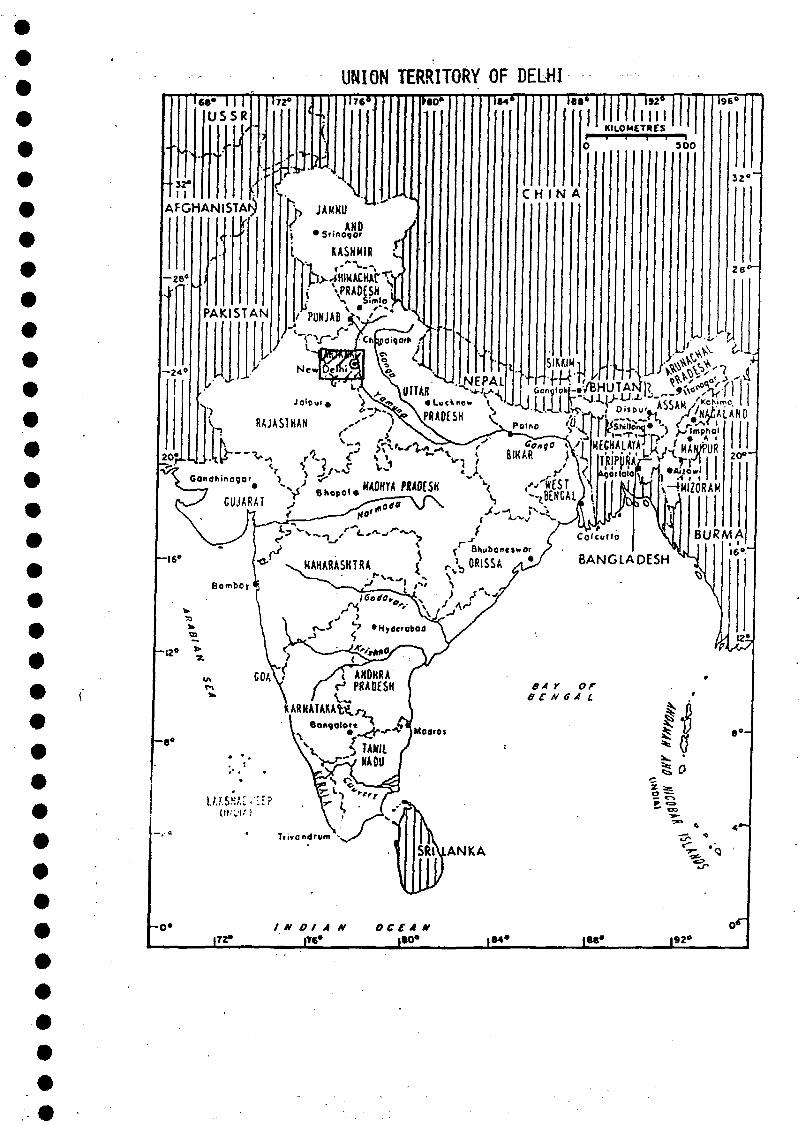
UNION TERRITORY OF DELM
• 32*
AFGHANISTANr
Jaipur
RAJASTHAN
ORlSSA ^ / BANGLADESH
BA r ore £ N e A L
K • ••>
EXECUTIVE SUMMARYOF
THE DECADE PUN OF WATER SUPPLY AND .SANITATION SECTOR (APRIL 1981 - MARCH 1991)
FOR
DELHI
1. INTRODUCTION
The Union Territory of Delhi having an area of 1,485 sq.km. is oneof the smallest States of India as the area of Union Territory forms only0.05% of the total area of India. Delhi has 1038.7 sq.km. of rural area.The present district of Delhi was first constituted in the year 1819.
It is bounded on the North West and South by Haryana and on theEast by Uttar Pradesh. River Yamuna flows by the side of its Easternborder in a North South direction, cutting Shadra area from the main tract.
Delhi has extremes of climate with dry and intensely hot summersstarting from the middle of Harch to June and a very cold winter startingfrom December to the middle of February with rainy season in between. Theaverage rainfall is 662 mm. .
The area of Delhi is generally plain with rocky ridge in the centreextending from near Wazirabad barrage on river Yamuna, on N.N.E. of Delhito S.S.W. of Delhi.
Physically it can be divided into 3 parts viz.
i) Hard rocky area or ridgeii) Alluvial plains either side sloping from ridge,iii) The alluvial plain of the trans-Yamuna area Shadara.
The altitude of Delhi ranges from 213 metre to 305 metre above meansea level.
Monsoonal winds bring rain to Delhi .D There are two such monsooncurrents flowing over the area. They are the South-West monsoon and North-East monsoon currents. The South-West monsoons current is more activethan the North-East one. It brings moderate to heavy rains over Delhi duringthe period from late June to beginning of September.
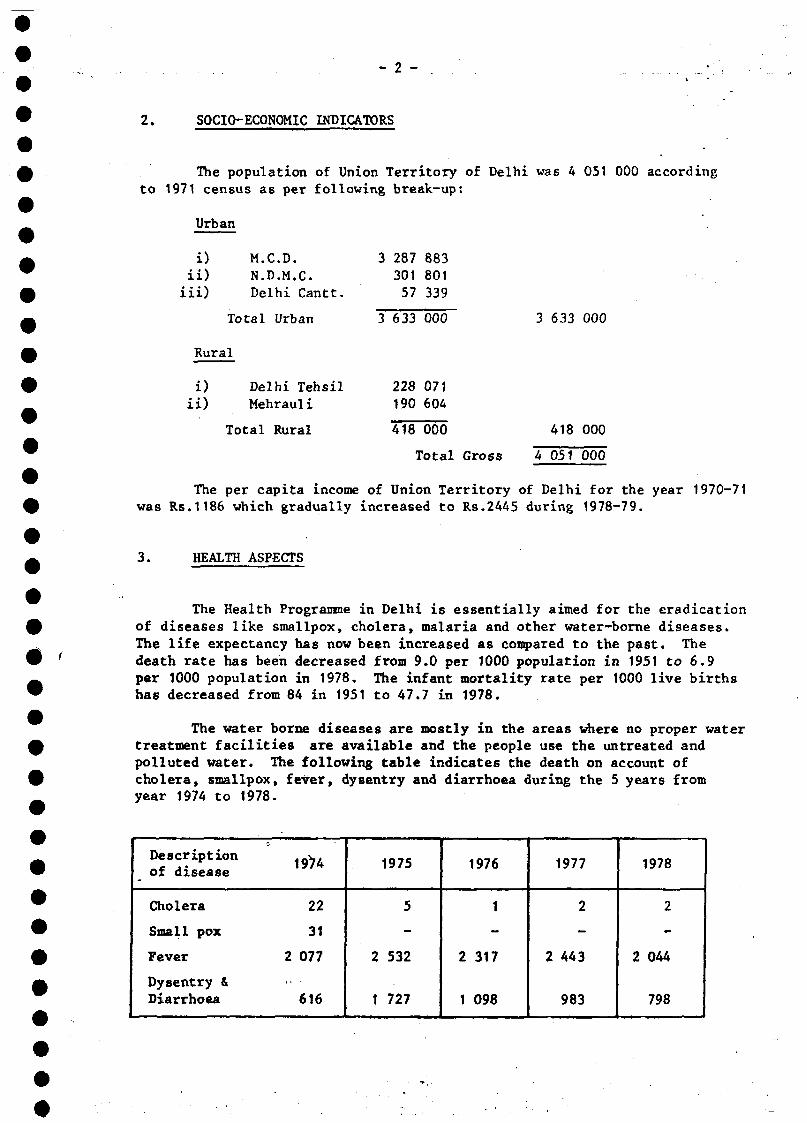
- 2 -
2. SOCIO-ECONOMIC INDICATORS
The population of Union Territory of Delhi was 4 051 000 accordingto 1971 census as per following break-up:
Urban
i)ii)iii)
M.C.D.N.D.M.C.Delhi Cantt.
Total Urban
Rural
i)ii)
Delhi TehsilMehrauli
Total Rural
3 287 883301 80157 339
3 633 000
228 071190 604
418 000
Total Gross
3 633
418
4 051
000
000
000
The per capita income of Union Territory of Delhi for the year 1970-71was Rs.1186 which gradually increased to Rs.2445 during 1978-79.
3. HEALTH ASPECTS
The Health Programme in Delhi is essentially aimed for the eradicationof diseases like smallpox, cholera, malaria and other water-borne diseases.The life expectancy has now been increased as compared to the past. Thedeath rate has been decreased from 9.0 per 1000 population in 1951 to 6.9per 1000 population in 1978. The infant mortality rate per 1000 live birthshas decreased from 84 in 1951 to 47.7 in 1978.
The water borne diseases are mostly in the areas where no proper watertreatment facilities are available and the people use the untreated andpolluted water. The following table indicates the death on account ofcholera, smallpox, fever, dysentry and diarrhoea during the 5 years fromyear 1974 to 1978.
Description ^,of disease 1S/
Cholera 22
Small pox 31
Fever 2 077
Dysentry &Diarrhoea 616
1975
5
-
2 532
1 727
1976
1
2 317
1 098
1977
2
-
2 443
983
1978
2
_
2 044
798
4. WATER RESOURCES
Ground Water: The Union Territory of Delhi, Geo-hydrologicallyseems to have a limited ground water. First of all there is paucity ofgood acquifer within known depth of alluvium and secondly there is widespreadchemical quality problems, both laterally and vertically. Tubewells andRanney wells are the two sources of ground water. Tubewells have beenconstructed in the rural as well as in urban areas where potable groundwater is available. There are 172 tubewells in the urban areas and 60tubewells in the rural areas. The Ranney wells are radial collectors wellsfor tapping the ground water source. Ranney wells have been constructed inthe riverine area of Yamuna along left marginal embankment after carryingdetailed survey and investigation and trial bores upto a depth of 30 metres.8 Nos. Ranney wells each of 2.5 mgd. capacity were constructed earlier andadditional 6 Nos. are under construction between old railway bridge andbarrage near C-Power Station. Further investigation is being carried outfor additional sites and it is proposed to construct 8 Nos. more Ranney wellsduring the period upto 1981-85 and requisite provision of funds has beenmade in the Sixth Five Year Plan.
Surface Water: The Union Territory of Delhi is situated on the bankof River Yamuna which flows through the city from North to South. Theriver Yamuna originates from Yamunotri Glacier of Himalayas in GarhwalDistt. of Uttar Pradesh. Many small hill streams of Uttar Pradesh and Riverstreams of Himachal Pradesh joins the river before it reaches TajewalaHead Works. At Tajewala Head Works, two major Canals viz. Eastern YamunaCanal in Uttar Pradesh and Western Yamuna Canal in Haryana, take-off. Boththe Canals terminate in the Union Territory of Delhi. Tajewala Head Works iscontrolled by the Irrigation Department, Haryana.
The Yamuna River is an inter-state river and its basin covers largerareas in the State of Haryana, Uttar Pradesh, Rajasthan, Union Territory ofDelhi and small area of Himachal Pradesh. The Yamuna waters upto the Tajewalaare at present being used extensively by Haryana and Uttar Pradesh forIrrigation as per agreement reached in 1954 between erstwhile Punjab andUttar Pradesh. The Yamuna water below Tajewala and upto Okhla area is alsobeing used by the Uttar Pradesh and Haryana for irrigation. The UnionTerritory of Delhi and Rajasthan also use Yamuna water for irrigation anddrinking water supply. So far as there has been no comprehensive agreementregarding the sharing of Yamuna water amongst all the basin states. Delhihas been drawing water for drinking from the flow in River Yamuna as itsriparian right and this water is the only main source of raw water for theexisting 90 MGD water treatment plant at Chandrawal and 80 mgd. at Wazirbad100 mgd. Treatment Plant set up at Haiderpur receives 200 cusecs of waterfrom Western Yamuna canal system in addition to the supplies to be releasedfor the existing plant mentioned above.
under an agreement with the Uttar Pradesh Government 0.145 HAF(200 Cusecs of water) of water will be made available from Ram Ganga CanalBystem to Delhi for 100 mgd. water Treatment Plant being set up by theUndertaking at Shahdara.
5. PRESENT STATUS OF WATER SUPPLY & SEWERAGE
The population of Delhi as on March 31, 1981 was 6184 thousands comprisingof 5684 thousands in the urban areas inclusive of N.D.M.C. and Cantt. areasand 500 thousands in the rural areas, Delhi draws its water requirement fromriver Yamuna at Wazirabad Barrage and Okhla and also from Western YamunaCanal and the Ranney wells. The total production of water from varioussources till date is as follows:
1.2.3.4.
ChandrawalaOkhlaRanney wellsHaiderpur
& Wazirabad
& tubewells
Total
(170( 6( 27(100
(303
MGD)MGD)MGD)MGD)
MGD)
77427123455
(1379
MLDMLDMLDMLD
MLD)
Total urban population covered upto 31.3.81 is 4700,000.
As regards the rural areas there are 245 villages in all in therural areas of Delhi and out of these 138 villages have been provided withpotable water supply upto March, 1981. The total rural population coveredis 284 thousands. Rural population consitutes about 8.09% of the totalpopulation of the Union Territory of Delhi.
The total population-.covered with sewerage system as on 1/4/81 was 3695thousands.
6. SECTOR ORGANISATION
Besides the Metropolitan Council, there is an Executive Councilconsisting of four members, one of whom is designated as the Chief ExecutiveCouncillor. The members of the Executive Council have to assist and advisethe administrator.
The New Delhi Municipal Committee is governed by the Pubjab MunicipalAct, 1911. It has a separate municipal body consisting of 11 members, allnominated. It consists of the President and four other official members andsix non-official members. Power of nominations vosts in the Li. Governorof Delhi. He can also give directions to the Committee. The financialallocations for the Committee are made by the Metropolitan Council. TheCommittee has to incur large expenditure to maintain a higher standard ofservices as its population is comprised of Central Govt. employees, foreigndiplomates and their staff, civil servants and ministers.
The administration of the Cantonment area is entrusted to the DelhiCantonment Board, the functions of which are identical with other similarBoards in the country. It consists of seven nominated members and anotherseven elected members, headed by the Officer Commanding Station, it functionsunder the Ministry of Defence. It is charged with the responsibility ofmaintenance of civic administration within the jurisdiction.
The Lt. Governor is overall incharge of the Civil Administration.The Chief Secretary, Finance Commissioner and the Director of Vigilance,Public relation, co-ordination, Executive Council are the Chief Executivedeeds working under him.
The J.W.& S. Board was abolished on the formation of the Corporationand its functions were entrusted to a jiewly created statutory body, calledthe 'Delhi Water Supply and Sewage Disposal Undertaking" under the MunicipalCorporation and the entire system of water supply right from source to theconsumers point, and sewage collection and disposal within the limits ofDelhi Municipal Corporation were brought under its control.
7. DECADE PLAN TARGETS (POPULATION COVERAGE)
The target for the Urban & Rural Water Supply and Urban and RuralSanitation during the decade for the Union Territory are the same asnational target fixed in the country. However, under Urban Sanitation inDelhi, it is proposed to cover 80% of population with the sewerage system(SS) and 20% with conversion of bucket latrines into septic tank systems.The Rural Sanitation coverage proposed is 25% which is in accordance withthe country's targets.
The population proposed to cover year-wise during the decade isas under (Tentative);
Year Population proposed to be covered (in thousand)
1981-821982-831983-841984-851985-861986-87
.. 1987-881988-891989-901990-91
Total
Urban
200600600'200400400400400400273
3873
DECADE PROGRAMME FUNDING
Rural
18680----
-
-
266
Urban
200400400300600600600600600578
4878
Rura
252528182022
138
8.
The investment costs for the decade plan for the targetted coveragewith proposed service level and stated unit cost in respect of both Urbanand Rural Water Supply and Sanitation shall be as under:
a) Urban Water Supply Rs.11,47,995 thousandsb) Rural Water Supply Rs. 47,880 thousandsc) Urban Sanitation Rs.16,24,320 thousandsd) Rural Sanitation Rs. 6,900 thousands
Rs.28,27,095 thousands
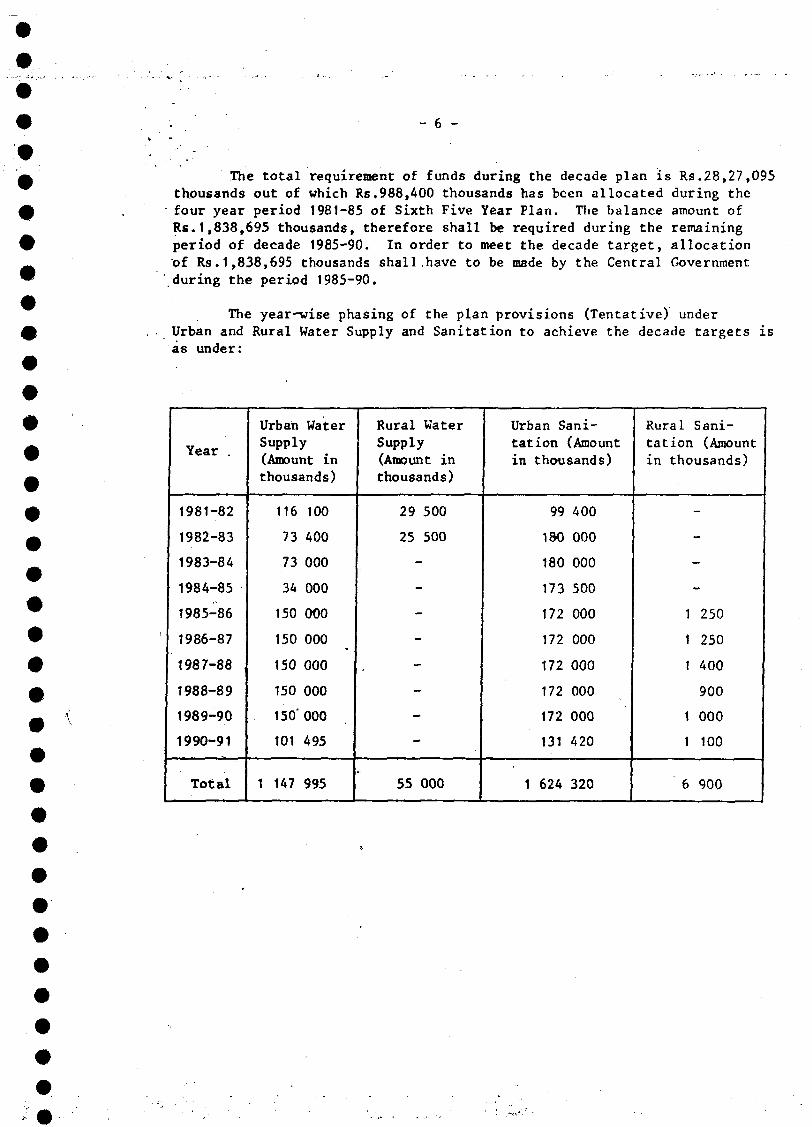
— 6 —
The total requirement of funds during the decade plan is Rs.28,27,095thousands out of which Rs,988,400 thousands has been allocated during thefour year period 1981-85 of Sixth Five Year Plan. The balance amount ofRs.1,838,695 thousands, therefore shall be required during the remainingperiod of decade 1985-90. In order to meet the decade target, allocationof Rs.1,838,695 thousands shall.have to be made by the Central Governmentduring the period 1985-90.
The year-wise phasing of the plan provisions (Tentative) underUrban and Rural Water Supply and Sanitation to achieve the decade targets isas under:
Year .
1981-82
1982-83
1983-8A
1984-85
1985-86
1986-87
1987-88
1988-89
1989-90
1990-91
Total
Urban WaterSupply(Amount inthousands)
116 100
73 400
73 000
34 000
150 000
150 000
150 000
150 000
150' 000
101 495
1 147 995
Rural WaterSupply(Amount inthousands)
29 500
25 500
-
-
-
-
-
55 000
Urban Sani-tation (Amountin thousands)
99 400
180 000
180 000
173 500
172 000
172 000
172 000
172 000
172 000
131 420
1 624 320
Rural Sani-tation (Amountin thousands)
-
-
-
-
1 250
1 250
1 400
900
1 000
1 100
6 900
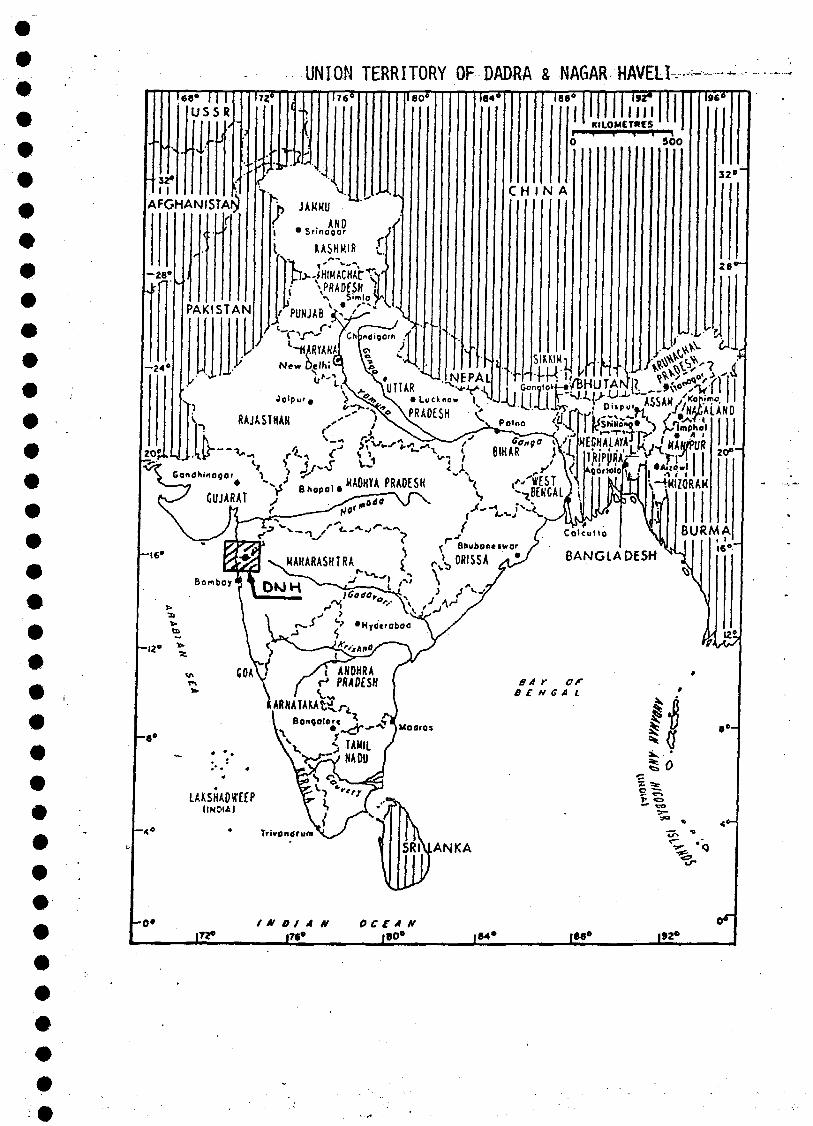
UNION TERRITORY OF-DADRA & NAGAR HAVEL k -
-HARïANAl \ o /
\ Condhinoçor ^ ? &
b-S GUJARAT / ^
|TZ»OCEAN
180" |B4» 188» 192»
# ••• EXECUTIVE SUMMARY " —,-.—-.
• OF .
THE DECADE ,PLAN OF WATER SUPPLY AND• " SANITATION SECTOR (APRIL 1981 - MARCH 1991)• FOR•» DADRA AND NAGAR HAVELI
m1. INTRODUCTION
Before liberation of this Territory i.e., during Portuguese regime£ upto 1954 the conditions on the developmental front were rather stagnant.
Practically no water supply facilities were existing except natural sources9 like rivers, ponds etc. and some open wells. No towns were provided with the
sewerage system.
^ The Union Territory of Dadra and Nagar Haveli is situated between^ the State of Gujarat and Maharashtra covering an area of 491.00 sq. kms.
The Union Territory of Dadra and Nagar Haveli is compeltely Rural.0 According to the estimates based on the available data as on 31.3.1931,
in the Union Territory of Dadra and Nagar Haveli 40,000 rural populationw were provided with safe water supply. While in case of rural population,— the coverage under safe sewage disposal is almost Nil.
2. SOCIO-ECONOMIC INDICATORS
• ' " • . .
W The total population of 0.74 lacs (1971 census) has increased to_ 0.88 lacs as recorded in the \9Q\ census (0.885 lacs according to 1981™ projection), The territory has 72 villages comprising of 516 hamlets. The£ population as per 1991 projection will be 1.042 lacs. The entire population
is tribal.
3. WATER RESOURCES
The Central Ground Water Board, Nagpur and National GeophysicalResearch Institute, Hyderabad have carried out investigations for groundwater from 1976-1980 and recommended open wells and borewells in thisterritory.
Private geologists have also conducted investigation and recommendedopenwells and borewells. Services of private geologist is being utilisedas and when required.
There are three main rivers in this Union Territory which supplywater for irrigation purposes. Many lift irrigation schemes are inoperation .
(Out of 516 hamlets of 72 revenue villages, 77 hamlets of 36 villages(partly) have been identified as "Problem Hamlets" out of which 9 hamletswill be going under submergence of Damanganga Reservoir Project. As suchtotal number of source hamlets will be 68. Remaining hamlets are having watersupply facilities.)
4. PRESENT STATUS OF WATER SUPPLY SANITATION
As on 31.3.81, 40 thousand people in the rural areas have beenprovided with water supply facilities, i.e. about 45% of the rural populationhave been provided with water supply facilities.
As far as rural sanitation is concerned none of the villages havebeen provided with this facility.»
5. SECTOR ORGANISATION
There is no separate set up of Public Health Engineering Divisionin this territory. The Deputy Engineer and Executive Engineer (Building)is the sole authority for planning, design, execution and maintenance ofall rural water supply projects. The major water supply projects areentrusted to the Public Health Department of Government of Gujarat asdeposit works.
The broad policy regarding coverage, service level and priority etc. areformulated by Executive Engineer/Accounts Officer/Administration and arefinalised after discussion with Planning Commission and CFHEEO, Government :of India.
For all water supply and sanitation programmes the responsibilitiesrest with the Public Works Department which looks after the whole territory.
6. DECADE PLAN TARGETS (POPULATION COVERAGE)
Target proposals for the Decade are as follows:
i) 0.64 lacs of rural population will be covered under watersupply at a. cost of Rs. 66.212 lacs.
ii) A rural population of 0.26 lacs is to be covered under ruralsanitation programme at a cost of Rs.13.02 lacs.
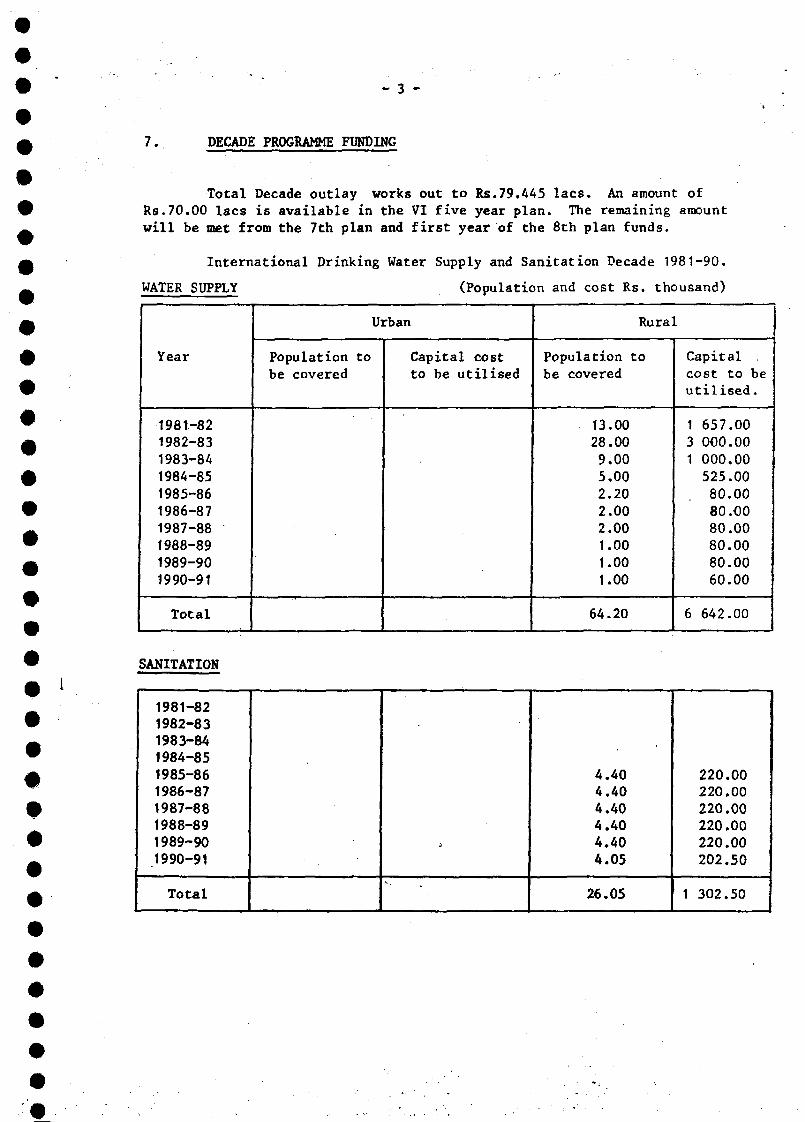
- 3 -
7. DECADE PROGRAMME FUNDING
•
Total Decade outlay works out to Rs.79.445 lacs. An amount ofRs.70.00 lacs is available in the VI five year plan. The remaining amountwill be met from the 7th plan and first year of the 8th plan funds.
International Drinking Water Supply and Sanitation Decade 1981-90.
WATER SUPPLY (Population and cost Rs. thousand)
Year
1981-821982-831983-841984-851985-861986-871987-881988-891989-901990-91
Total
Urban
Population tobe covered
Capital costto be utilised
Rural
Population tobe covered
13.0028.009.005,002.202.002.001.001.001.00
64.20
L
Capitalcost to beutilised.
1 657.003 000.001 000.00525.0080.0080.0080.0080.0080.0060.00
6 642.00
SANITATION
1981-821982-831983-841984-851985-861986-871987-881988-891989-901990-91
Total
4.404.404.404.404.404.05
26.05
220.00220.00220.00220.00220.00202.50
1 302.50
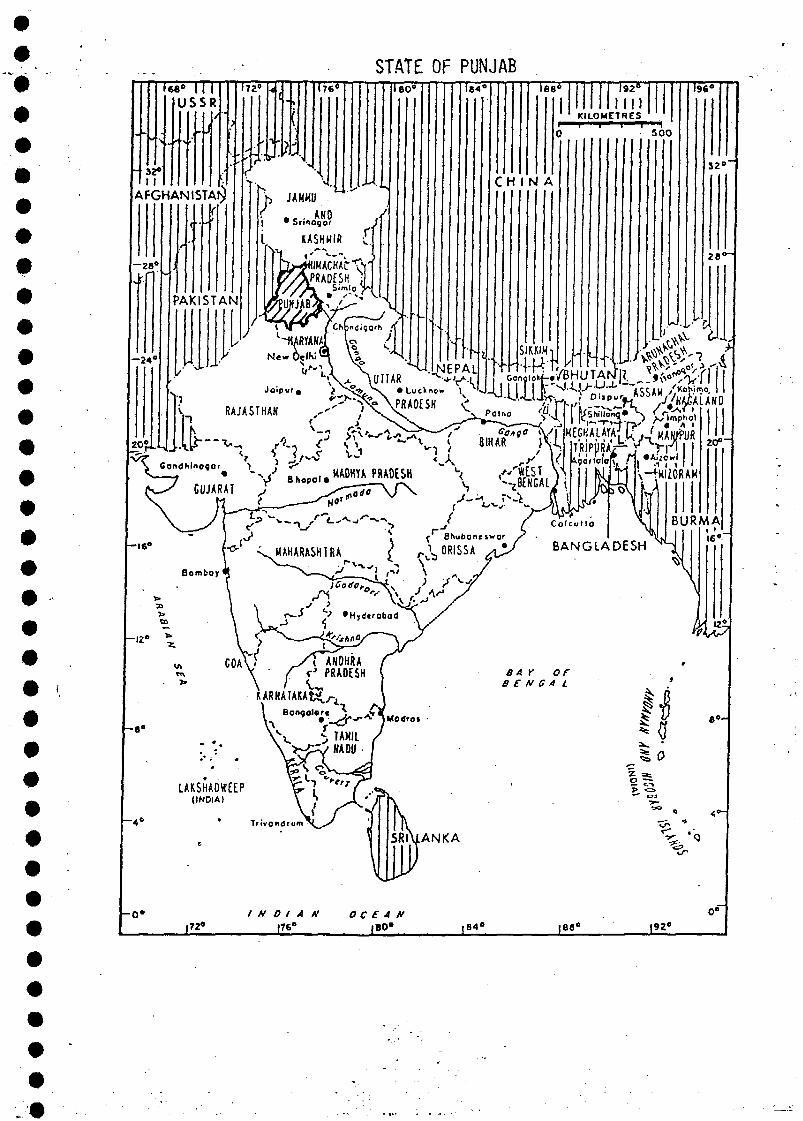
#
STATE OF PUNJAB'68° I I |
USSR
32*II
AFGHANISTANr
-26'
-24°
Ï72"
PAKISTAN
TT61
reo" \ï*1 KILOMETRES
5 0 0
C H I N A
196*
32°"
28«
-16*
Somboy
t.
IS
3L-12"
LAKSHADWfEP(INDIA)
, -
BANGLADESH
8A Y orB £ A' G J) L
ï o j i l J J . ^ - - ^ A , ^ <*\ " - ^ V , ( BIHAR9 M
^ CU AR#AT V B h .pc .« î"OESH < C JEST MN — ' GUJARAT ^ v<^« \ i \ / . . . \ 4 '
- 0 » I N D I A N176°
OCEAN180" iB4B 188° |92C
EXECUTIVE SUMMARYOF
THE DECADE PLAN OF WATER SUPPLY ANDSANITATION SECTIR (APRIL 1981 - MARCH 1991)
FOR
PUNJAB
1. INTRODUCTION
The State of Punjab participated in the National Water Supplyand Sanitation programme from its very inception in the year 1954. In theinitial stages, only those villages were taken up where the undergroundwater was very brackish and saline. Meagre outlays in 1st and 2nd fiveyear plans of only Rs.31.85 and Rs.136.93 lacs respectively could helpcover only 44 villages in the 1st Plan and 43 villages in the 2nd Plan.
A Rural Investigation Division was set up at Patiala in November1962, which collected relevant data and prepared a list of the problemvillages, which are being taken up for the provision of drinking watersupply in the first instance.
Prior to 1976, drinking water supply and sewerage works in urbanareas used to be carried out by the State P.W.D. Public Health Branch asdeposit works out of the funds made available to it from time to time bythe local bodies.
With the idea of facilitating financing and management of thewater and sewerage works, the State Government set up Punjab Water Supplyand Sewerage Board in September 1976. This Board undertakes the formulation,execution, operation and maintenance (in case the local body desires) ofschemes relating to water supply and sewerage within the jurisdiction oflocal bodies.
The State, as it is today, was created as a result of reorganiza-tion of the composite Punjab State on 1st November 1966. It covers an areaof 50,357 sq.kms. It is surrounded on one side'by Pakistan and on the otherby the States of Rajasthan, Haryana, Himachal Pradesh and Jammu & Kashmir.
Climate: The climate of Punjab is hot-temperate. The seasonalvariation in temperature is from a minimum of 2°C in winter to a maximumof 45°C in summer. The average rainfall per year in the State is 24 inchesvarying from 44 inches in Dhar Block of Gurdaspur district to 8 inches inthe south of Bhatinda district - about 70% of the rainfall is concentratedduring the monsoon months (July to September) and 30% during the non-monsoon period of about 9 months.
I l l
135
160
183
.28
.83
.94
: 2 :
Punjab is situated In the plains of the Indus valley and is
a part of the watershed of Rivers Ravi, Beas, Sutlej and Ghaggar and
the foothills of Shivalik. The State has almost a flat terrain.
2. SOCIO-ECONOMIC INDICATORS
The overall increase of population in Punjab has been asfollows:
Census year Population (in lacs)
1961
1971
1981 (Projected)
1990 (projected)
As against a decadal growth rate of 23.01 per cent recorded forthe State as a whole, urban areas returned a growth rate of 43.66 percent and the rural areas 16.59 per cent during 1971-81. If the growthrate of urban population noticed in the 1971-81 decade is projected intothe next decade, the urban population in 1990 will go upto 65 lacs asagainst the projected figures of population of 53.12 lacs worked out onthe basis of growth rate of 3.12%. The fund requirements for the DecadePlan will go up from the estimated Rs.2O6 crores to Rs.35O crores for theurban areas showing a gross under estimation and resultant sharp shortfallin physical achievements.
However, projected growth rate for the Decades 1971-81 and 1981-91 has been taken as per guidelines given by the Ministry of Works andHousing as 3.12% and 2.62% for urban sector and 1.48% and 1.045% forrural sector, respectively and the requirement of funds etc. has beenworked out on the basis of this growth rate.
Income : The average per capita income in Punjab is the highestin the country and for 1979-80, at current prices, it was Rs.2361 as -against an All India average of Rs.1300/-.
On the basis of the adopted yard-stick, Punjab has the minimumproportion of people living below the poverty line as compared to anyother State of the country. As against the all India average of 48.137»,Punjab has about 15.13% people living below this poverty line. It isalso note-worthy that statistically the economic condition of the peopleliving in villages in Punjab is better than that of their counterpartsin the urban areas. The percentage of people living below the povertyline in the rural areas is 11.8% compared to 24.66% in the urban areas.
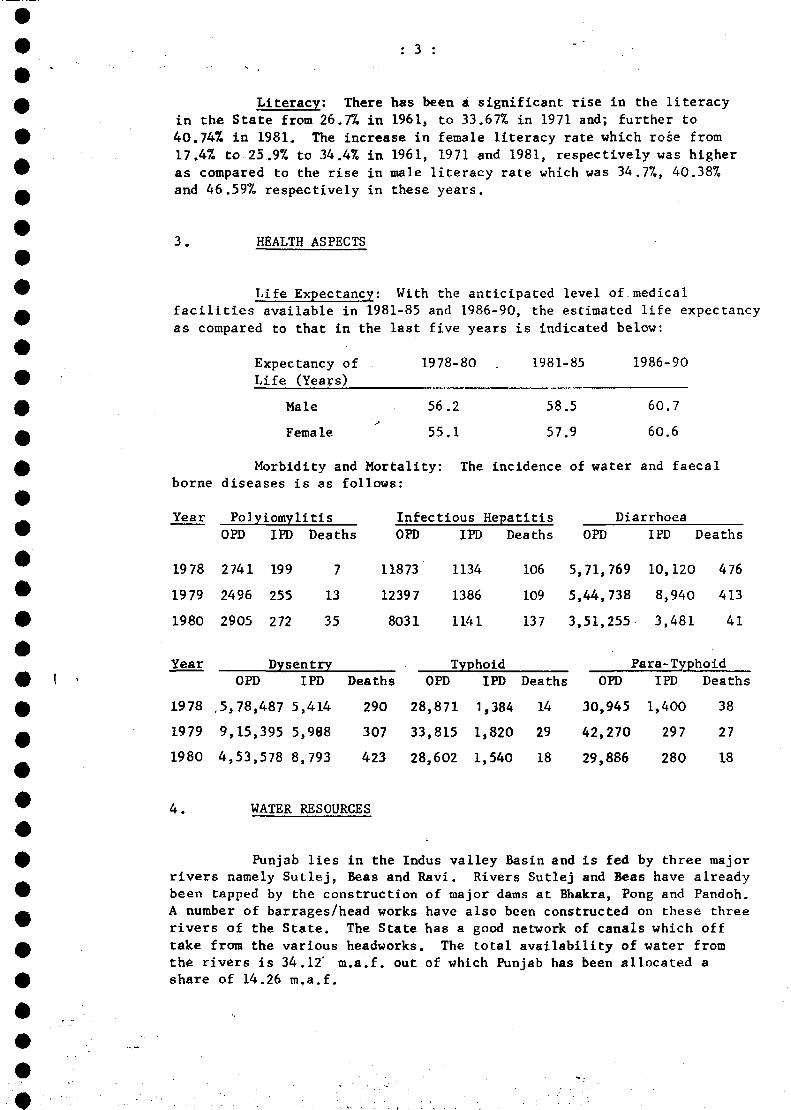
: 3 :
Literacy: There has been a significant rise in the literacyin the State from 26.7% in 1961, to 33.67% in 1971 and; further to40.74% in 1981. The increase in female literacy rate which rose from17.47. to 25.9% to 34.4% in 1961, 1971 and 1981, respectively was higheras compared to the rise in male literacy rate which was 34.7%, 40.38%and 46.59% respectively in these years.
3. HEALTH ASPECTS
Life Expectancy: With the anticipated level of medicalfacilities available in 1981-85 and 1986-90, the estimated life expectancyas compared to that in the last five years is indicated below:
Expectancy ofLife (Years)
1978-80 1981-85 1986-90
Male
Female
56.2
55.1
58.5
57.9
60.7
60.6
Morbidity and Mortality: The incidence of water and faecalborne diseases is as follows:
DiarrhoeaYear
1978
1979
1980
Year
PolyiomylitisOPD
2741
2496
2905
IPD Deaths
199 7
255 13
272 35
Dysentry
Infectious HepatitisOPD
11873
12397
8031
IPD
1134
1386
1141
Typhoid
Deaths
106
109
137
OPD IPD Deaths
5,71,769 10,120 476
5,44,738 8,940 413
3,51,255 3,481 41
Para -Typho id
OPD IPD Deaths OPD IPD Deaths OPD IPD Deaths
1978 ,5,78,487 5,414 290 28,871 1,384 14 30,945 1,400 38
1979 9,15,395 5,988 307 33,815 1,820 29 42,270 297 27
1980 4,53,578 8,793 423 28,602 1,540 18 29,886 280 18
4. WATER RESOURCES
Punjab lies in the Indus valley Basin and is fed by three majorrivers namely Sutlej, Beas and Ravi. Rivers Sutlej and Beas have alreadybeen tapped by the construction of major dams at Bhakra, Pong and Pandoh.A number of barrages/head works have also been constructed on these threerivers of the State. The State has a good network of canals which offtake from the various headworks. The total availability of water fromthe rivers is 34.12' m.a.f. out of which Punjab has been allocated ashare of 14.26 m.a.f.
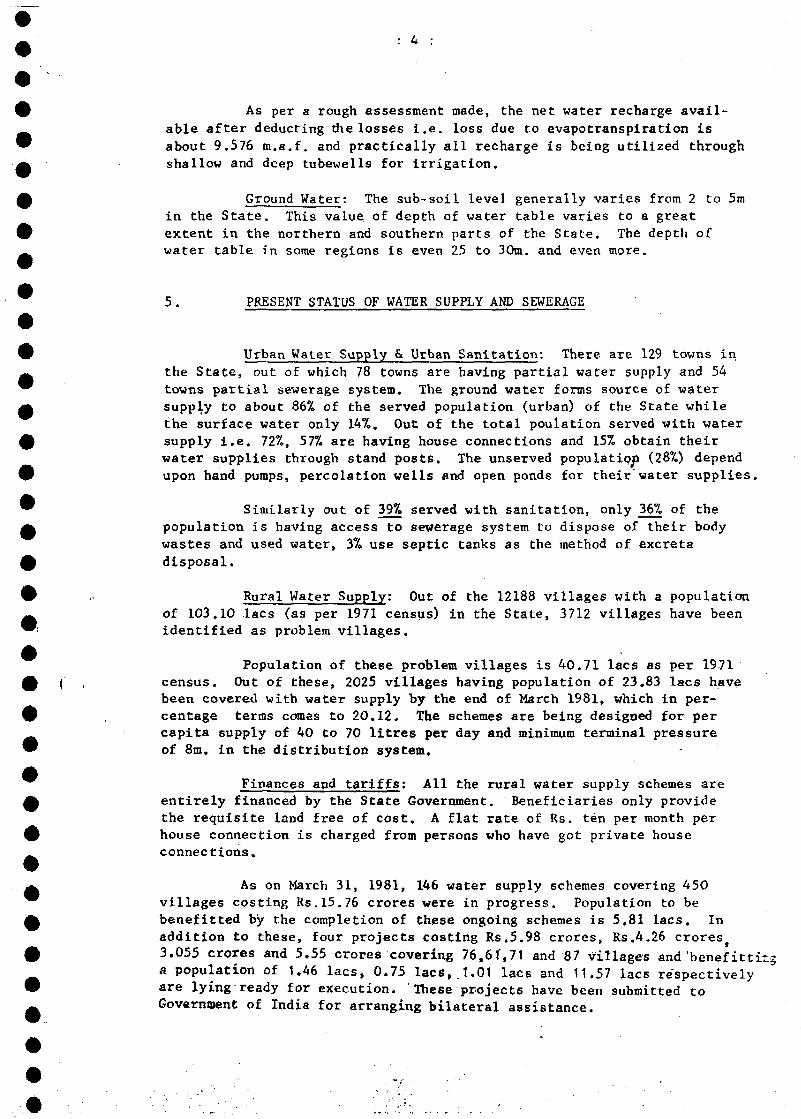
: 4 :
As per a rough assessment made, the net water recharge avail-
able after deducting the losses i.e. loss due to evapotranspiration is
about 9.576 m.a.f. and practically all recharge is being utilized through
shallow and deep tubewells for irrigation.
Ground Water: The sub-soil level generally varies from 2 to 5min the State. This value of depth of water table varies to a greatextent in the northern and southern parts of the State. The depth ofwater table in some regions is even 25 to 30m. and even more.
5. PRESENT STATUS OF WATER SUPPLY AND SEWERAGE
Urban Water Supply & Urban Sanitation: There are 129 towns inthe State, out of which 78 towns are having partial water supply and 54towns partial sewerage system. The ground water forms source of watersupply to about 86% of the served population (urban) of the State whilethe surface water only 14%, Out of the total poulation served with watersupply i.e. 72%, 57% are having house connections and 15% obtain theirwater supplies through stand posts. The unserved population (28%) dependupon hand pumps, percolation wells and open ponds for their water supplies.
Similarly out of 39% served with sanitation, only 36% of thepopulation is having access to sewerage system to dispose of their bodywastes and used water, 3% use septic tanks as the method of excretadisposal.
Rural Water Supply: Out of the 12188 villages with a populationof 103.10 lacs (as per 1971 census) in the State, 3712 villages have beenidentified as problem villages.
Population of these problem villages is 40.71 lacs as per 1971census. Out of these, 2025 villages having population of 23.83 lacs havebeen covered with water supply by the end of March 1981, which in per-centage terms comes to 20.12. The schemes are being designed for percapita supply of 40 to 70 litres per day and minimum terminal pressureof 8m. in the distribution system.
Finances and tariffs: All the rural water supply schemes areentirely financed by the State Government. Beneficiaries only providethe requisite land free of cost. A flat rate of Rs. ten per month perhouse connection is charged from persons who have got private houseconnections.
As on March 31, 1981, 146 water supply schemes covering 450villages costing Rs.15.76 crores were in progress. Population to bebenefitted by the completion of these ongoing schemes is 5.81 lacs. Inaddition to these, four projects costing Rs.5.98 crores, Rs,4.26 crores3.055 crores and 5.55 crores covering 76,61",71 and 87 villages and 'benef ittirga population of 1.46 lacs, 0.75 lacs,.1.01 lacs and 11.57 lacs respectivelyare lying-ready for execution. These projects have been submitted toGovernment of India for arranging bilateral assistance.
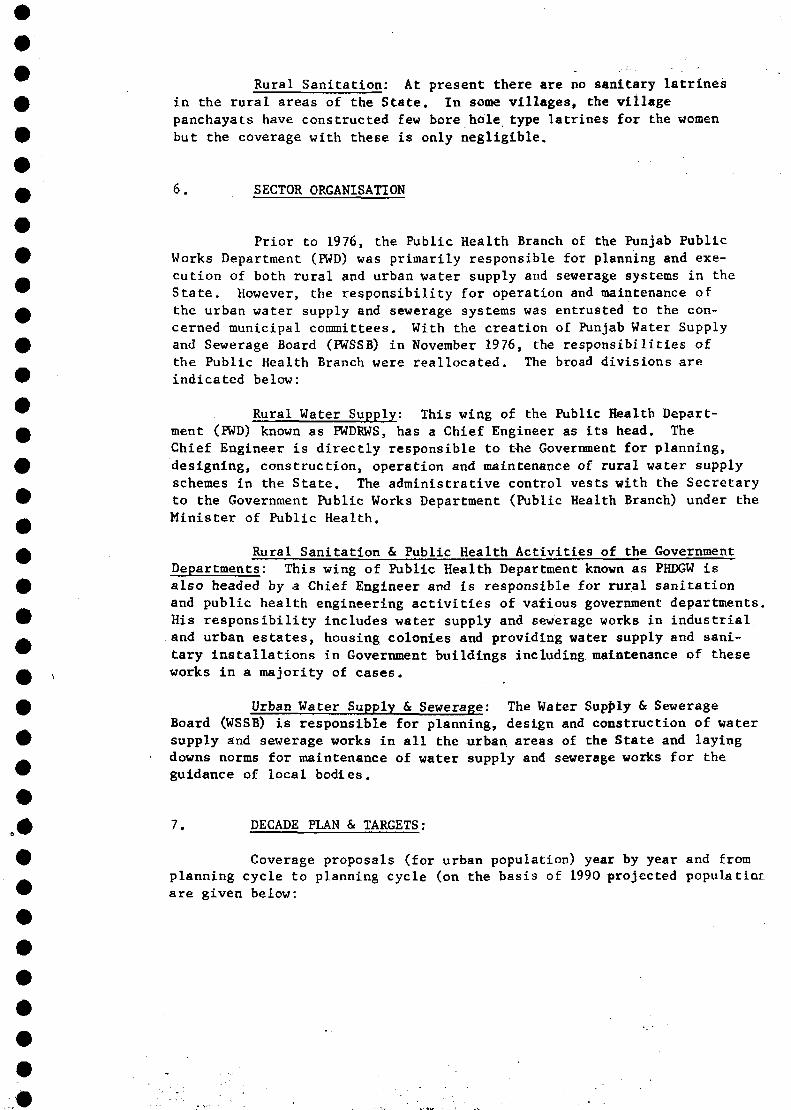
Rural Sanitation: At present there are no sanitary latrines
in the rural areas of the State. In some villages, the village
panchayats have constructed few bore hole type latrines for the women
but the coverage with these is only negligible.
6. SECTOR ORGANISATION
Prior to 1976, the Public Health Branch of the Punjab PublicWorks Department (PWD) was primarily responsible for planning and exe-cution of both rural and urban water supply and sewerage systems in theState. However, the responsibility for operation and maintenance ofthe urban water supply and sewerage systems was entrusted to the con-cerned municipal committees. With the creation of Punjab Water Supplyand Sewerage Board (PWSSB) in November 1976, the responsibilities ofthe Public Health Branch were reallocated. The broad divisions areindicated below:
Rural Water Supply: This wing of the Public Health Depart-ment (PWD) known as PWDFWS, has a Chief Engineer as its head. TheChief Engineer is directly responsible to the Government for planning,designing, construction, operation and maintenance of rural water supplyschemes in the State. The administrative control vests with the Secretaryto the Government Public Works Department (Public Health Branch) under theMinister of Public Health.
Rural Sanitation & Public Health Activities of the GovernmentDepartments: This wing of Public Health Department known as PHDGW isalso headed by .a Chief Engineer and is responsible for rural sanitationand public health engineering activities of various government departments.His responsibility includes water supply and sewerage works in industrialand urban estates, housing colonies and providing water supply and sani-tary installations in Government buildings including maintenance of theseworks in a majority of cases.
Urban Water Supply & Sewerage: The Water Supply & SewerageBoard (WSSB) is responsible for planning, design and construction of watersupply and sewerage works in all the urban areas of the State and layingdowns norms for maintenance of water supply and sewerage works for theguidance of local bodies.
7. DECADE PLAN & TARGETS:
Coverage proposals (for urban population) year by year and fromplanning cycle to planning cycle (on the basis of 1990 projected populationare given below:
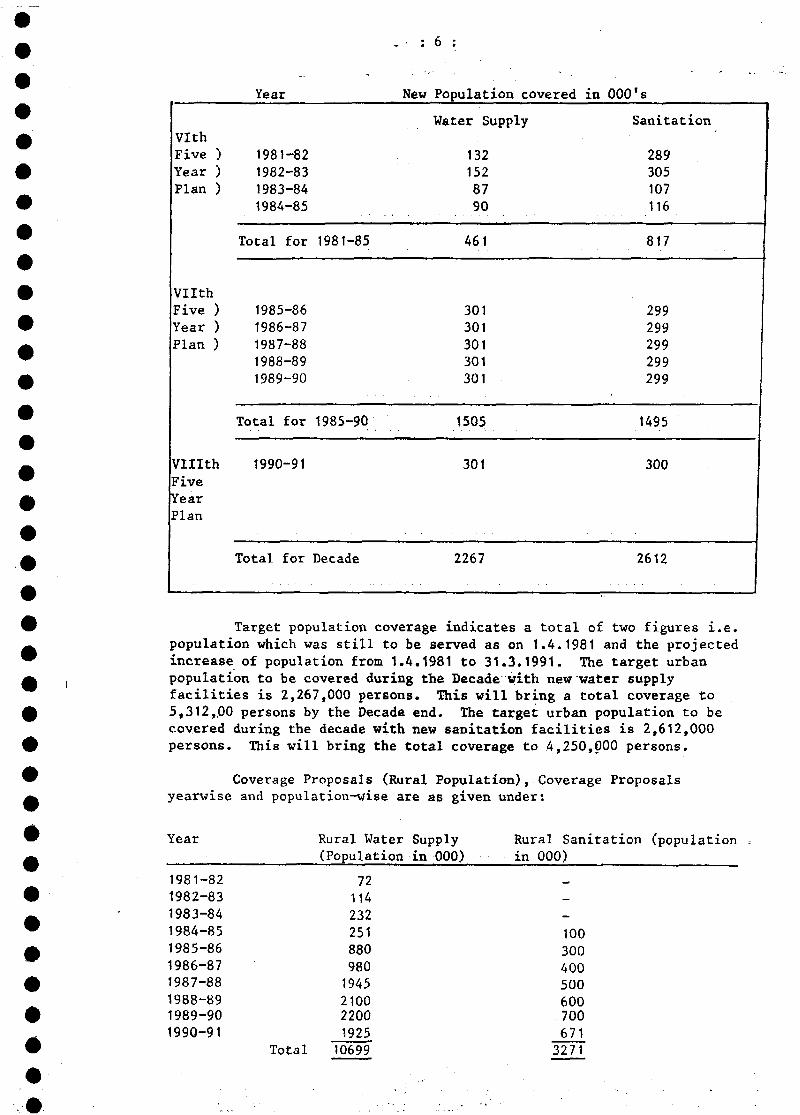
- : 6 :
VIthFive )Year )Plan )
VllthFive )Year )Plan )
VlllthFiveYearPlan
Year
1981-821982-831983-841984-85
Total for 1981-85
1985-861986-871987-881988-891989-90
Total for 1985-90
1990-91
Total for Decade
New Population covered
Water Supply
1321528790
461
301301301301301
1505
301
2267
in 000's
Sanitation
289305107116
817
299299299299299
1495
300
2612
Target population coverage indicates a total of two figures i.e.population which was still to be served as on 1.4.1981 and the projectedincrease of population from 1.4.1981 to 31.3.1991. The target urbanpopulation to be covered during the Decade with new water supplyfacilities is 2,267,000 persons. This will bring a total coverage to5,312,,00 persons by the Decade end. The target urban population to becovered during the decade with new sanitation facilities is 2,612,000persons. This will bring the total coverage to 4,250,000 persons.
Coverage Proposals (Rural Population), Coverage Proposalsyearwise and population-wise are as given under:
Year Rural Water Supply(Population in 000)
Rural Sanitation (populationin 000)
1981-821982-831983-841984-851985-861986-871987-881988-891989-901990-91
Total
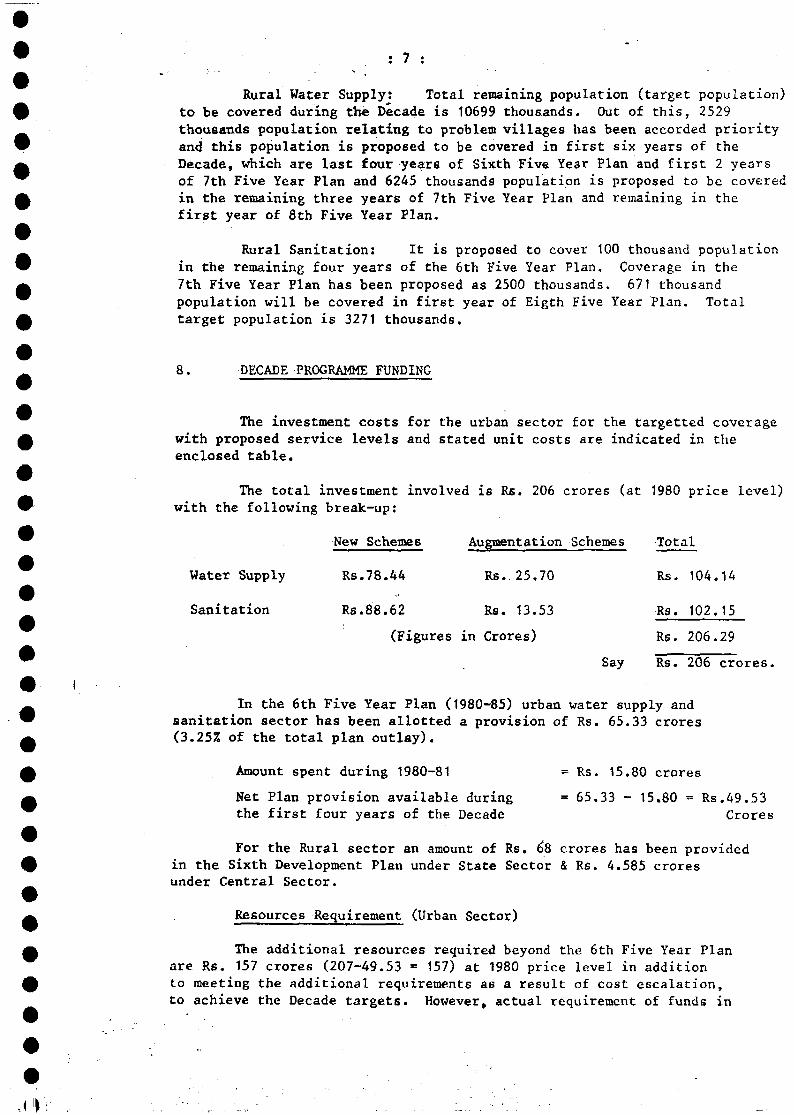
• 7 • " •
Rural Water Supply: Total remaining population (target population)to be covered during the Decade is 10699 thousands. Out of this, 2529thousands population relating to problem villages has been accorded priorityand this population is proposed to be covered in first six years of theDecade, which are last four years of Sixth Five Year Plan and first 2 yearsof 7th Five Year Plan and 6245 thousands population is proposed to be coveredin the remaining three years of 7th Five Year Plan and remaining in thefirst year of 8th Five Year Plan.
Rural Sanitation: It is proposed to cover 100 thousand populationin the remaining four years of the 6th Five Year Plan, Coverage in the7th Five Year Plan has been proposed as 2500 thousands. 671 thousandpopulation will be covered in first year of Eigth Five Year Plan. Totaltarget population is 3271 thousands.
8. DECADE PROGRAMME FUNDING
The investment costs for the urban sector for the targetted coveragewith proposed service levels and stated unit costs are indicated in theenclosed table.
The total investment involved is Rs. 206 crores (at 1980 price level)with the following break-up:
New Schemes Augmentation Schemes
Water Supply Rs.78.44 Rs. 25.70
Sanitation Rs.88.62 Rs. 13.53
(Figures in Crores) Rs. 206.29
Say Rs. 206 crores.
In the 6th Five Year Plan (1980-85) urban water supply andsanitation sector has been allotted a provision of Rs. 65.33 crores(3.25% of the total plan outlay).
Amount spent during 1980-81 = Rs. 15.80 crores
Net Plan provision available during = 65.33 - 15.80 = Rs.49.53the first four years of the Decade Crores
For the Rural sector an amount of Rs. 68 crores has been providedin the Sixth Development Plan under State Sector & Rs. 4.585 croresunder Central Sector.
Resources Requirement (Urban Sector)
The additional resources required beyond the 6th Five Year Planare Rs. 157 crores (207-49.53 = 157) at 1980 price level in additionto meeting the additional requirements as a result of cost escalation,to achieve the Decade targets. However, actual requirement of funds in
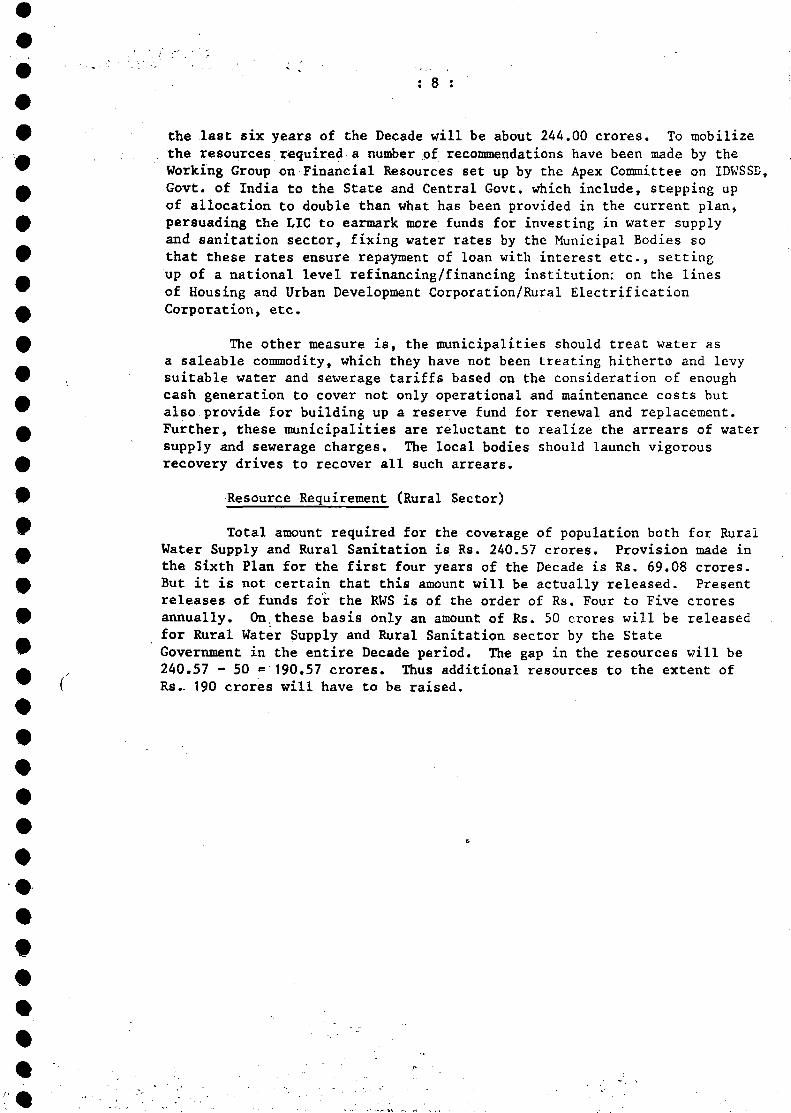
9 the last six years of the Decade will be about 244.00 crores. To mobilize•.« the resources required a number of recommandâtions have been made by the™ Working Group on Financial Resources set up by the Apex Committee on IDWSSE,£ Govt. of India to the State and Central Govt. which include, stepping up
of allocation to double than what has been provided in the current plan,9 persuading the LIC to earmark more funds for investing in water supply
and sanitation sector, fixing water rates by the Municipal Bodies so9 that these rates ensure repayment of loan with interest etc., setting^ up of a national level refinancing/financing institution: on the lines^ of Housing and Urban Development Corporation/Rural Electrificationf Corporation, etc.
9 The other measure is, the municipalities should treat water asa saleable commodity, which they have not been treating hitherto and levy
9 i suitable water and sewerage tariffs based on the consideration of enough» cash generation to cover not only operational and maintenance costs but^ also provide for building up a reserve fund for renewal and replacement.A Further, these municipalities are reluctant to realize the arrears of water
supply and sewerage charges. The local bodies should launch vigorousf recovery drives to recover all such arrears.
9 Resource Requirement (Rural Sector)
™ Total amount required for the coverage of population both for RuralA Water Supply and Rural Sanitation is Rs. 240.57 crores. Provision made in
the Sixth Plan for the first four years of the Decade is Rs. 69.08 crores.0 But it is not certain that this amount will be actually released. Present
releases of funds for the RWS is of the order of Rs. Four to Five crores9 annually. On, these basis only an amount of Rs. 50 crores will be released
for Rural Water Supply and Rural Sanitation sector by the StateW Government in the entire Decade period. The gap in the resources will beA , 240.57 - 50 =190.57 crores. Thus additional resources to the extent of
( Rs.. 190 crores will have to be raised.
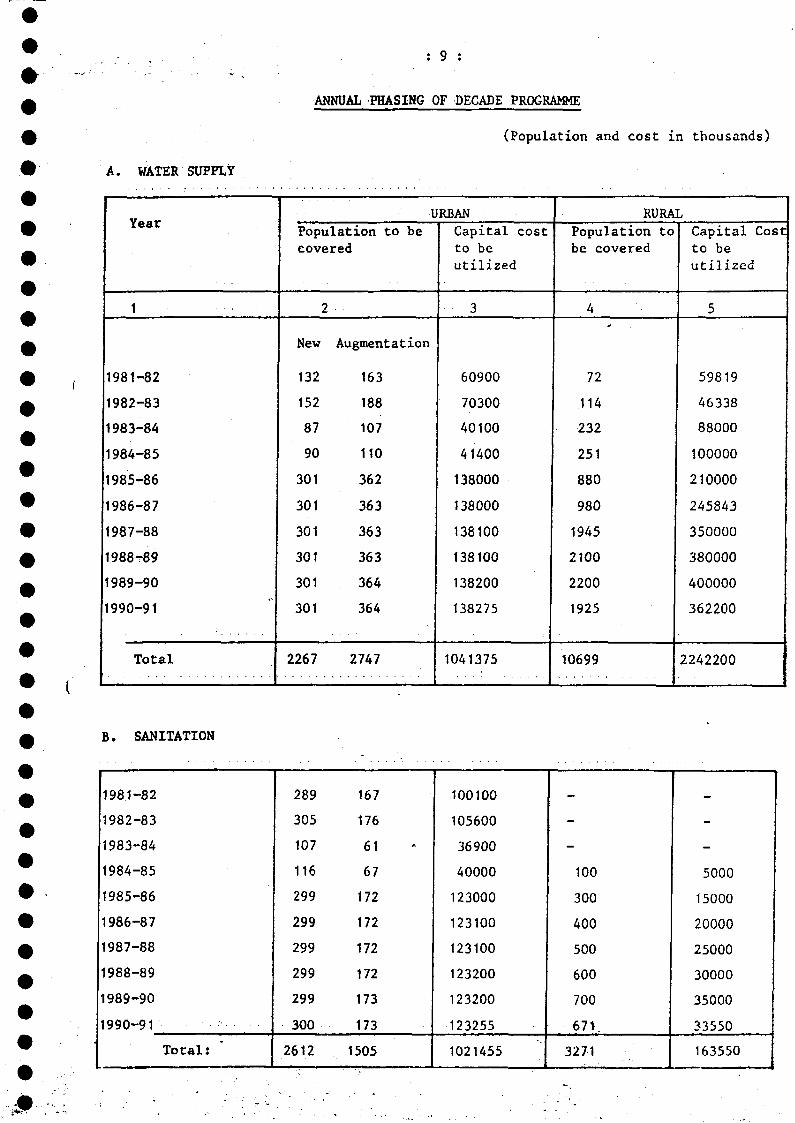
WATER SUPPLY
* 7 *
ANNUAL PHASING OF DECADE PROGRAMME
(Population and cost in thousands)
Year
1
1981-82
1982-83
1983-84
1984-85
1985-86
1986-87
1987-88
1988T89
1989-90
1990-91
Total
URBAN
Population to becovered
2
New Augmentation
132 163
152 188
87 107
90 110
301 362
301 363
301 363
301 363
301 364
301 364
2267 2747
Capital costto beutilized
3
60900
70300
40100
41400
138000
138000
138100
138100
138200
138275
1041375
RURAL
Population tobe covered
4
72
114
232
251
880
980
1945
2100
2200
1925
10699
Capital Costto beutilized
5
59819
46338
88000
100000
210000
245843
350000
380000
400000
362200
2242200
B. SANITATION
1981-82
1982-83
1983-84
1984-85
1985-86
1986-87
1987-88
1988-89
1989-90
1990-91
Total:
289 167
305 176
107 61
116 67
299 172
299 172
299 172
299 172
299 173
300 173
2612 1505
100100
105600
36900
40000
123000
123100
123100
123200
123200
123255
1021455
_
-
-
100
300
400
500
600
700
671.
3271
-
-
5000
15000
20000
25000
30000
35000
33550
163550
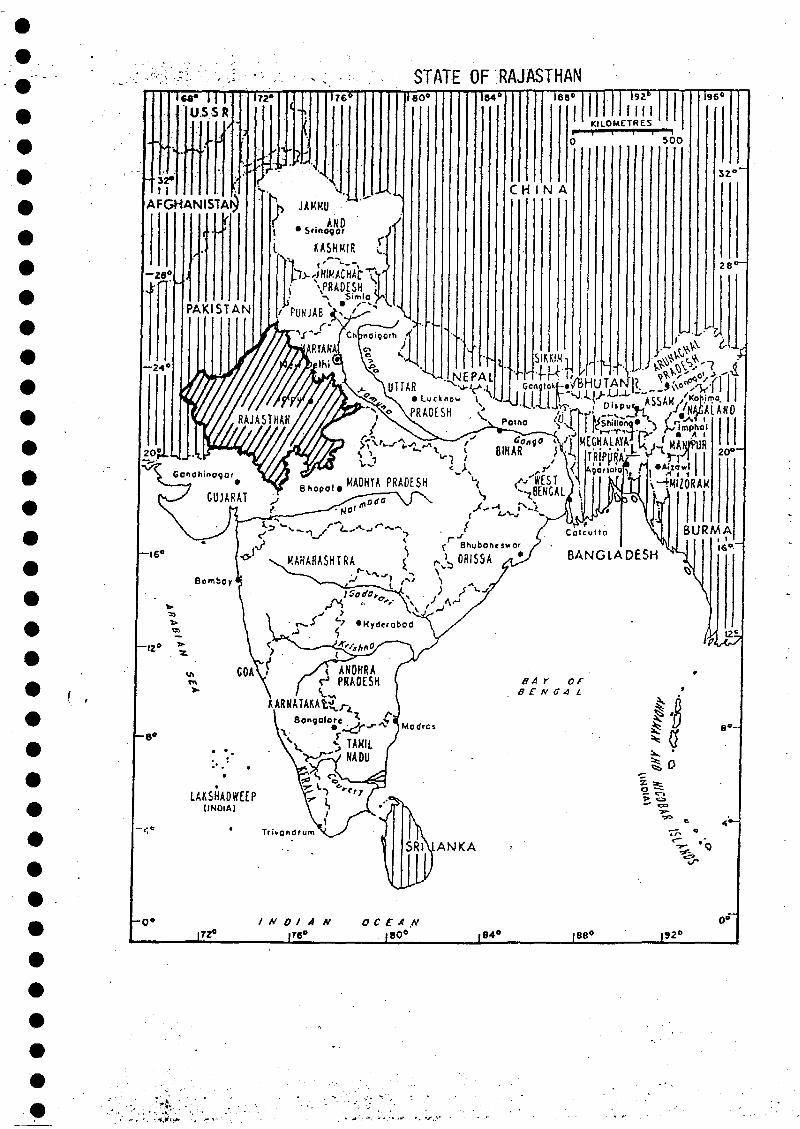
STATE OF RAJASTHAN
f ,
EXECUTIVE SUMMARYOF
THE DECADE PLAN OF WATER SUPPLY ANDSANITATION SECTOR (APRIL 1981 - MARCH 1991)
FOR
RAJASTHAN
1. INTRODUCTION
After independence and formation of Rajasthan State in the year1949, due importance has been given to drinking water supply. The StatePublic Works Department was entrusted with the task of providing drinkingwater supply arrangements for urban towns. Subsequently in the year 1963,the State PHED was created to look after water supply in both urban and ruralsectors.
Rajasthan is the second largest state in India covering as area of3,42,214 sq.km. The State forms part of the Western boarder of Indiawith Pakistan. The Aravali Range running North East to South West dividesthe State into almost two equal halves. The zone west of Aravali is thedesert and the east zone of Arawali is partly hilly and partly semi desert.
Tne average annual rainfall varies from as low as 5 to 8 mm in the cesedistrict of Jaisalmer to 150 mm to 200 mm in hilly areas of Sirohi district. .Similarly, the temperature varies from as low as 4 °C in winter to as highas 50°C in summer. The State is rich in minerals like asbestos gypsum,dolomite, quartz, rock phosphate, sand stone, soap stone, feldspan, mica,zinc, lead, copper and silver.
2. SOCIO-ECONOMIC INDICATORS
The projected population as on 31.3.81 is 33.45 millions. In theyear 1991 the total population will further increase to 41.604 millions.The density of population per sq. km. for the State was 75 (1971 census);only 63 for the rural areas and 1198 for urban areas. A high percentageof 82.37% of the population lives in rural areas.
The average per capita income is Rs.1025. The population belowthe poverty line is 33.7%.
Famine is a regular phenomenon for the state and in general droughtconditions prevail in the Western and Southern districts of the State. ITthe desert areas, water table is extremely low generally between 80 M to130 M deep and in extreme cases upto 200 M. deep.
- 2 -
As per 1971 census average literacy in the State was 19.03 percent,as against 29.46% for All India. Male Literacy was 28.74% and Female8.46%. In the rural area male literacy was 22.87% and female only 4.03%.The percentage of literacy has now reached 24.05%.
3. HEALTH ASPECTS
The vital statistics for public health show that the crude birthrate per 1000 is 35.5 and death rate is 15.6. The infant mortality rateper thousand is 140, i.e. 86 for urban and 153 for rural. These figuresare based on 1981 assessment.
4. WATER RESOURCES
Rajasthan has. hardly 1% of country's total surface water resources.The state can be classified into 4 major basins and the total runoff avail-able from the surface precipitation has been assessed as 10579 millioncubic meter. River chambal is the main perennial river in the state ,othersbeing mainly seasonal.
The south central and eastern part of the state is of igneous &metamorphic rocks and the yield from the dug wells have meagre discharge.The eastern part of the state comprises of shallow water level and the dugwells in these,, area have yield of 2000 to 8000 litre/hr. The tubewells inBarnçr & Jaisalmer have been found to yield 100000 to 200000 litres/hr.
' i
. The ground water potential of the State is about 81000 cu.sec.
5. PRESENT STATUS OF WATER SUPPLY AND SANITATION
By March, 1981, the State Government had provided drinking waterto 65.7% urban population and about 36% rural population. Due to limitedfinancial resources the State Government has been able to pay very limitedattention to the sanitation sector and about 5% of the entire urbanonly is provided sanitation facility.
The service level of various towns on the basis of 1981 populationand quantity of water being supplied at present is as follows:
5% of towns § 25 lpcd, 30% of towns § 50 to 75 Ipcd,25% of towns Ô 75 to 100 lpcd and 10% of towns § 100 lpcdand above.
The water supply schemes are designed for a period of 30 yearsfrom the year of its commissioning.
The total numbers of villages are 37124 vide 1981 census. As on31.1.83, 14550 villages have been commissioned. Only 15% of the ruralpopulation obtained its requirement of drinking needs on House Connectionsand the remaining 85% population obtains water either through publicstand posts or through a centrally located ground water reservoir. Nosewerage system is available in rural areas. The general average servicelevel in rural water supply scheme is 50 to 70 lpcd.
6. SECTOR ORGANISATION
In the State, the projects are being sanctioned by the RajasthanWater Supply and Sewerage Management Board through its various Committees-The sanctioned projects are implemented by the State Public HealthEngineering Department.
The materials for construction are arranged by the State PublicHealth Engineering Department and given to the contractor on rates mentionedin the tender documents. For procurement of the materials, there is aMaterials Management circle in the department headed by a SuperintendingEngineer. Skilled and unskilled man power required for execution of worksis available in abundance in the State.
The work of management of the urban water supply schemes is alsowithin the scope of the State PHED. The operation & maintenance ofpractically all (99%) of urban water supply spot source schemes (handpumps » power pump in nearby well and a ground level reservoir with taps)is done by the local bodies (panchayats) and the 0 & M of bigger ruralschemes (regional schemes covering more than one village & schemes withoverhead reservoir with house connections) is done by State PHED. Forensuring proper quality of water distributed to the consumers sufficientstaff and laboratories are available in PHED.
Preliminary and detailed feasibility studies have been carried outin collaboration with International consultants for IDA assisted watersupply projects for the)four towns (1) Jaipur scheme, (2) Bikaner, (3)Jodhpur and (4) Kota Reorganisation scheme.
Sewerage schemes in five towns viz. Jaipur, Kota, jodhpur, Bikanerand Utaipur were under execution and only part of the population residingin these towns were benefitted by these schemes.
7. DECADE PLAN & TARGETS (POPULATION COVERAGE POSITION)
Under the decade plan the targets for population coverage of thevarious sectors have been laid down as follows:
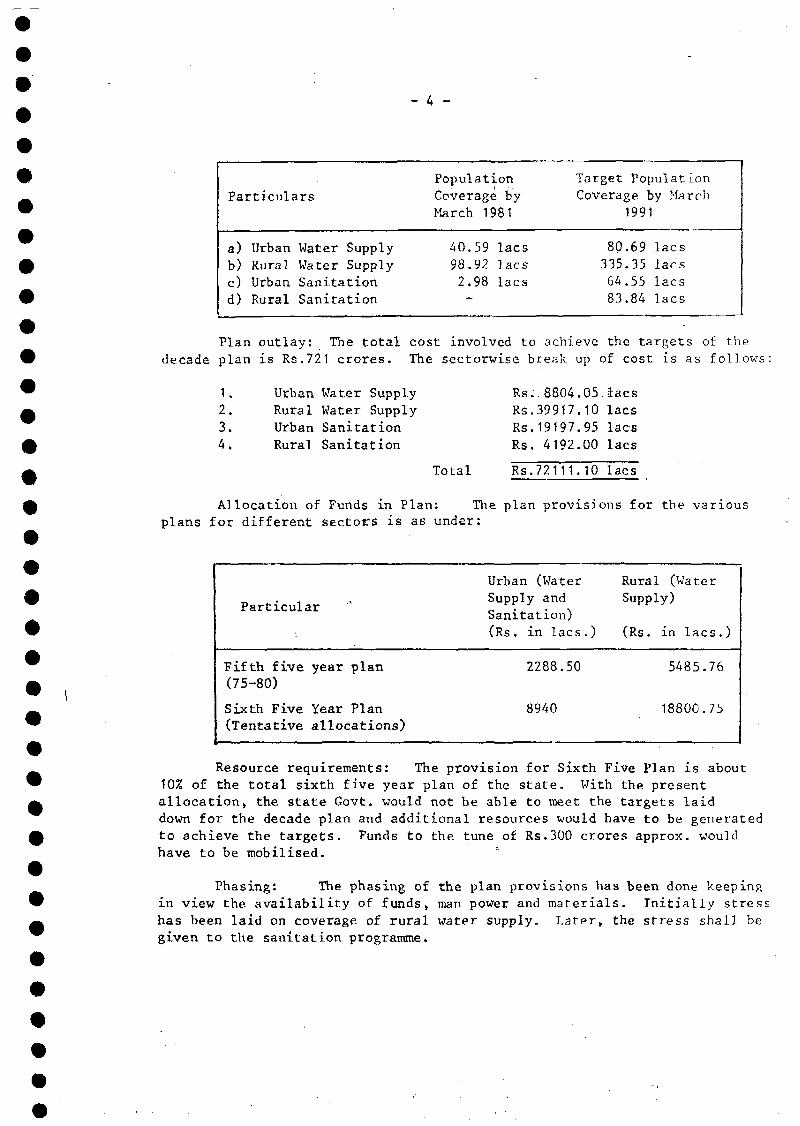
- 4 -
Particulars
a) Urban Water Supplyb) Rural Water Supplyc) Urban Sanitationd) Rural Sanitation
Population
Coverage byMarch 1981
40.59 lacs98.92 lacs2.98 lacs—
Target Population
Coverage by March
1991
80.69 lacs335.35 lacs64.55 lacs83.84 lacs
Plan outlay: The total cost involved to achieve the targets of thedecade plan is Rs.721 crores. The sectorwise break up of cost is as follows
1. Urban Water Supply2. Rural Water Supply
3. Urban Sanitation4. Rural Sanitation
Total
Rs. .8804.05.îacsRs.39917.10 lacsRs. 19197.95 lacsRs. 4192.00 lacs
Rs.72111.10 lacs
Allocation of Funds in Plan: The plan provisions for the variousplans for different sectors is as under:
Particular
Fifth five year plan(75-80)
Sixth Five Year Plan(Tentative allocations)
Urban (WaterSupply andSanitation)
(Rs. in lacs.)
2288.50
8940
Rural (WaterSupply)
(Rs. in lacs.)
5485.76
18800.75
Resource requirements: The provision for Sixth Five Plan is about10% of the total sixth five year plan of the state. With the presentallocation, the state Govt. would not be able to meet the targets laiddown for the decade plan and additional resources would have to be generatedto achieve the targets. Funds to the tune of Rs.300 crores approx. wouldhave to be mobilised.
Phasing: The phasing of the plan provisions has been done keepingin view the availability of funds, man power and materials. Initially stresshas been laid on coverage of rural water supply. Later, the stress shall begiven to the sanitation programme.
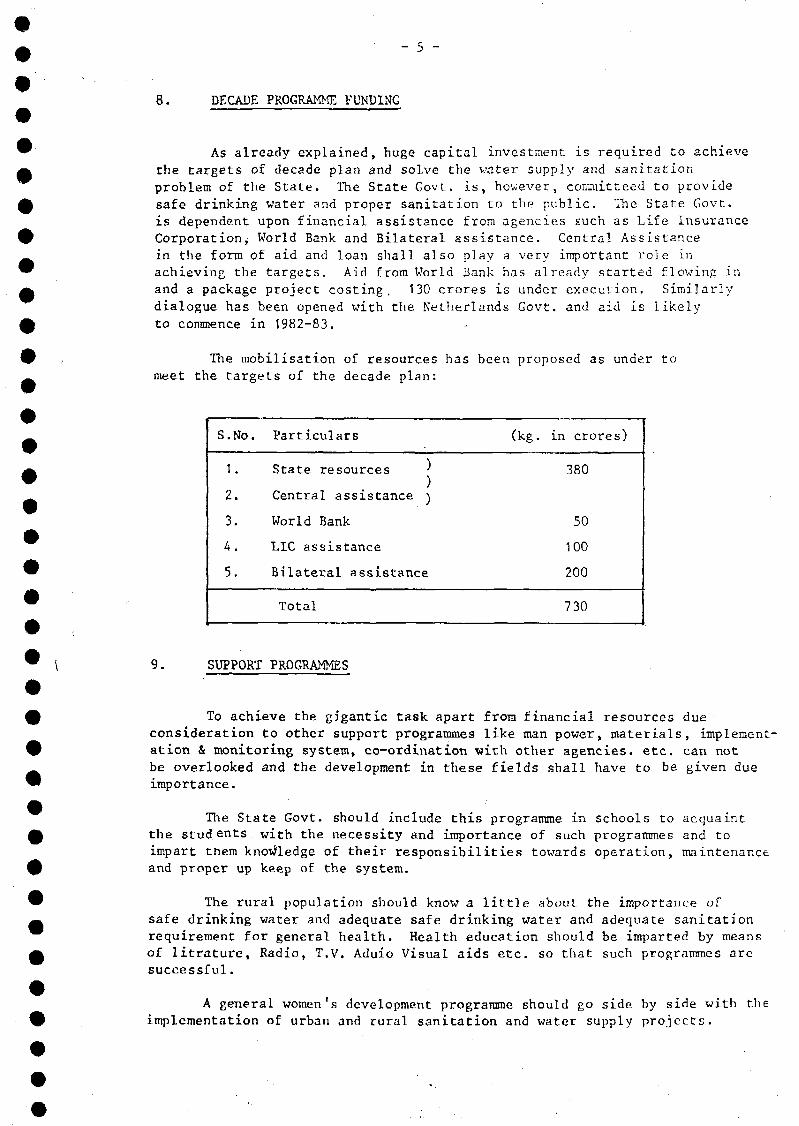
8. DECADE PROGRAMME FUNDING
As already explained, huge capital investment is required to achievethe targets of decade plan and solve the water supply and sanitationproblem of the State. The State Govt. is, however, con^iitteed to providesafe drinking water and proper sanitation to the public. The State Govt.is dependent upon financial assistance from agencies such as Life InsuranceCorporation, World Bank and Bilateral assistance. Central Assistancein the form of aid and loan shall also play a very important role inachieving the targets. Aid from World Bank has already started flowing inand a package project costing, 130 crores is under execution. Similarlydialogue has been opened with the Netherlands Govt. and aid is likelyto commence in 1982-83.
The mobilisation of resources has been proposed as under tomeet the targets of the decade plan:
S. No.
1.
2.
3.
k.
5.
Particulars
State resources ')
Central assistance )
World Bank
LIC assistance
Bilateral assistance
Total
(kg. in crores)
380
50
100
200
730
9. SUPPORT PROGRAMMES
To achieve the gigantic task apart from financial resources dueconsideration to other support programmes like man power, materials, implement-ation & monitoring system, co-ordination with other agencies, etc. can notbe overlooked and the development in these fields shall have to be given dueimportance.
The State Govt. should include this programme in schools to acquaintthe students with the necessity and importance of such programmes and toimpart them knowledge of their responsibilities towards operation, maintenanceand proper up keep of the system.
The rural population should know a little about the importance ofsafe drinking water and adequate safe drinking water and adequate sanitationrequirement for general health. Health education should be imparted by meansof litrature, Radio, T.V. Aduio Visual aids etc. so that such programmes aresuccessful.
A general women's development programme should go side by side with theimplementation of urban and rural sanitation and water supply projects.
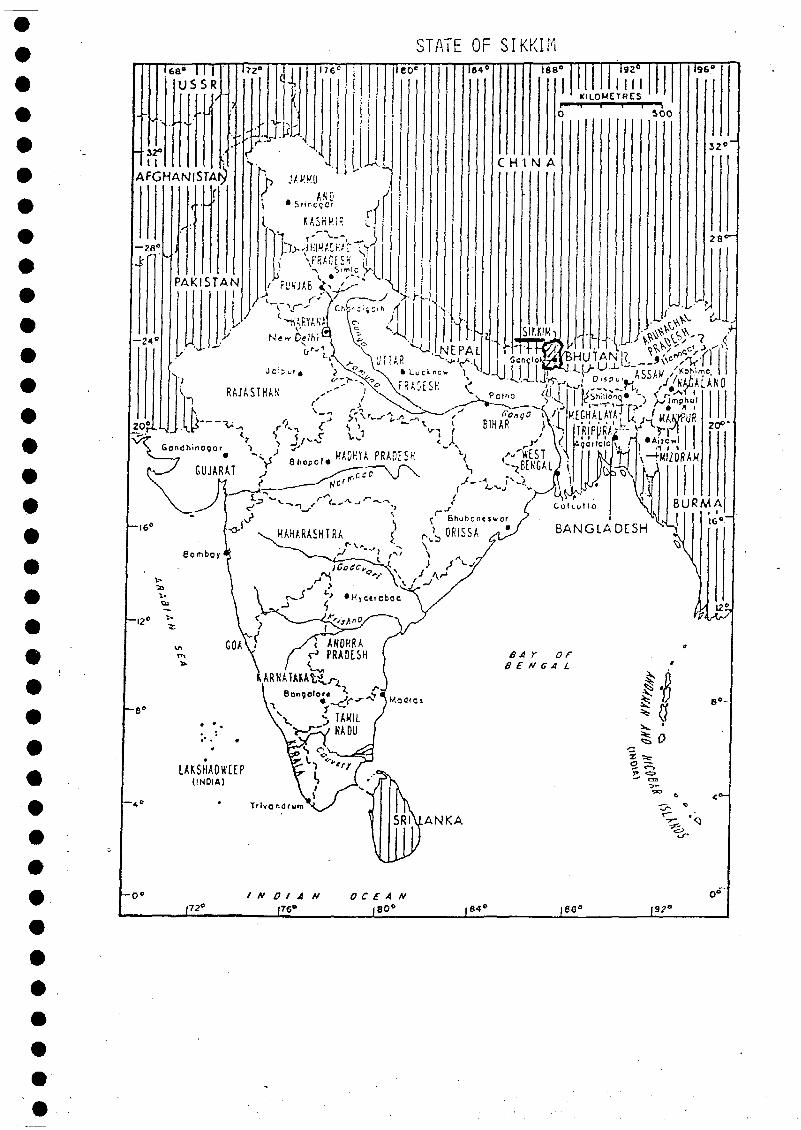
STATE OF SIKKIr
r# Kc-1 It ..HADHYA PRADESH " \ «^ST.M
EXECUTIVE SUMMARYOF
THE DECADE PLAN OF WATER SUPPLY ANDSANITATION SECTOR (APRIL 1981 - MARCH 1991)
FOR
SIKKIM
1. INTRODUCTION
Sikkim is situated at the North Eastern Border of India.
It is land locked, surrounded by Bhutan on East, Nepal on West and
State of Bengal on South.
Area of the State is 730,000 Hactares.
Habitable area is less than 40%. Rest of the area is filled with coldmountain ridges, jungles, slips and sinking areas.
Nearest airport and railhead is Siliguri which is 117 km south
of State capital, Gangtok. It takes about 4 hours to cover this route by
vehicle.
Calcutta is the nearest major city.
Most of the habitable areas of the State falls within the temperate
climatic zone.
On the average temperature ranges from 3° C to 30° C. Rainy seasonlasts for over 6 months, starting from middle of October. Peak monsoonoccurs during July/August.
The intensity of rainfall in most of the area is as high as75-100 Cms./hour and peak intensity can reach within 10 minutes and mayremain sustained for as long as 3 hours at a time.
2. SOCIO-ECONOMIC INDICATORS
The projected population of the State is 3,10,000 people as per 1981projection, achieved with an 4.35% annual growth rate, acceleration in growthrate picking up after 1971.
It is anticipated, the growth rate will be 6.6A& and allow 1991
population to reach 3,97,000.
Sikkim has been divided into 4 districts, viz., North, South,
East and West. The East District is the most populous, having population
density of 145 persons per sq. km. North District has the least density
of 6 persons per sq. km. South and West Districts showed growth rate
32 and 23% respectively.
State of Sikkim comprises of 8 nos. of declared towns, 55 nos. of
RMCs (Rural Marketing Centres) and 403 nos. of villages.
The State average for per capita income estimates during 79-80 was
Rs. 968/- at the current price. There is no survey report available to
ascertain the poverty level in the State.
Entire state has hilly terrain and is circumscribed by greatHimalayas and snow clad mountains, on the Western, Northern and EasternFronts. Along Nepal, Sikkim border, Mt. Kanchanjunga is the highest peak(8586 m). Southern prong of the State has the mountains of lower attitudewhich mainly form terrain of the plains.
The hill slopes are scared with hundred of temporary rivulets andsprings which often occur at the frequency of 10-25 rivalets or ghoras at e3-5,000 ft. of stretch. Added to this, fast flowing rivers contribute tothe errosion of toe of the hill slopes, resulting into mass and destructiveland slides further aggravated by earthquakes.
3. HEALTH ASPECTS
With the beginning of 5th Plan there has been considerable headwaymade in improving themedical facilities in the State. Against only twohospitals in 1954, now there are tolal of 5 hospitals, 15 primary centresand 37 nos. of dispensaries and health centres in State. Doctors/populatiocratio in the state is 1:4,000. There, however, still appears lot of scopeof works to improve the health of the people in general.
There is no statistical data in life expectancy of the people inthe State. Expertised view is to take the National figure for this as57 years.
Experts view on morbidity and mortality on account of water-bornedisease has been quite oranious. It is viewed due to cultural attitude ofthe people which prevent them from going to hospitals and seek remedies,the statistical data on morbidity and mortality may not represent the truefigure and the actual figures are suspected to be quite high. The Directors.:pointed out that mica flakes and lack of chemical balance in the waterhave been the prime reasons for dysentries, goiters, and dental cavities,etc. A survey report has shown 37 nos. of people suffereing from indinedeficiency and goier cases in same areas.
in 1980
-3-
The incidence of major water-borne diseases has been significant
Dysentry
Typhoid
Castro Enteritis-
Infective -Hepatitis
WATER RESOURCES
14357
550
15796
1573
cases
n _
H _
5
-
4
3
deaths
it
M
4.
There is no survey report available with respect to water resourcesavailable in the State. The work in this respect has just begun. Water tothe people is available more or less from the surface water resources in theform of springs, revulets and rivers. The water becomes abundant duringthe heavy precipitation when storm water charges the entire region.
The State is not hydrogeologically mapped and hence the groundwater bearing zones and their potentials are unknown. The geology of thestate is yet to come into stabilized state. The thrust and faults oftenresult into change in topography. The ground water is generally availablein the factured zones. But this phenomena is also of temperary nature,because the water drains out owing to steep slops very quickly at lowerends of the hill slopes. The Rural Development Department had, ending March1981, excavated about 35 number of dug wells having shallow depth of2.4 to 4.2 m with discharge of 0.6 to 2.0 cura/hr from 27 nos. of itssuccessful wells. As the ground water withdrawls are from shallow acquifers,the sources dry up in summer and the results, therefore, cannot be consideredas representative. The State Government is making efforts to developground water sources and proposes to prepare hydrogeological map to identifypotential sites of ground water-storages.
Almost all the water available to the consumers come from thesurface water resources. During the heavy precipitation storm watercharges the entire region and spring sources. However, during winter allthe supplies become less and dry up creating heavy scarcity of water inmany regions.
PRESENT STATUS OF WATER SUPPLY & SANITATION
Status as on 31.3.J981
S.N. Particulars
a.
b.
c.
d.
e.
Nos. of villages (Problem
Nos. of villages covered as on31.3.80
Population covered
Yet to be covered villages
Population to be covered
403 Nos.
107 Nos.
48,000
296
171,000
24 thousand persons in urban areas have been provided with watersupply facilities as on 31.3.81 which is 22.42%. As regards sanitation,there is no appreciable facilities in both urban and rural areas.
In congested towns like Gangtok, the septic tank system is howeverproving ineffective. This is due to close built up sections. Unscientificdesigns of the units, and excessive rainfall„ The affects from tanks have bee:therefore creating neusance in Gangtok and other congested urban towns.
There is only one sewerage system under construction for Gangtok.The first phase of this scheme will cater for 25,000 people. The schemewhen completed to its entirety will cater for the population of 75,000 people.
Sanitation and Sewerage "Programme in the urban towns and RMCsare extremely essential due to very rapid growth of these communities.For 7 nos. of urban towns it is proposed to construct alternate sewersystem with suitable disposal units consisting of community septic tanks,in half tanks or other such units. It is found individual septic tanks ofpublic latrines are not effective for catering the population. It is,therefore, felt sewering of such connected areas and taking the sewage toa single treatment for disposal maint away from population will be moreeffective and economical.
6. SECTOR ORGANISATION
There are two sector organisations relevant to water supply andsanitation and sewerage works in the state as mentioned under:
(a) Building Water Supply and Housing Department
This department is responsible for Urban sector. The department,apart from water supply and sanitation also deals with buildings andhousing schemes. Only at Gangtok a division exclusively looks after thewater and sewerage works, in rest of the districts, all the Divisions arealso responsible for water supply, sanitation as well as Buildingconstruction schemes. Till now this arrangement has been justified due tocomparatively less work load, however, future expansion of the departmentis on the offing to create separate divisions, to deal with water andsanitation works.
(b) Rural Development Department
The Department is responsible for various Rural Schemes e.g. road,bridges, construction as well as water supply and sanitation works.
There are only two Divisions to deal with water supply aswell as other multiferous aspects of Rural works. The Department, needingexpansion is gearing up to decentralize its administration and incorporatemore Divisions/Sub-Divisions to deal with the expanding Rural DevelopmentSchemes.
7. DECADE PROGRAMME TARGETS
With a view to meeting the Decade goals of 100% water supply tourban towns and 80% - 25% sanitation facilities to urban towns and ruralareas respectively. Decade plans for various works are completed/preparedsummarized as follows:
i) Urban Communities : Urban Water Supply and Sanitation.
The numbers of communities to be covered are -
a) Gangtokb) 7 nos. of urban towns; andc) 55 nos. of RMCs.
In all these urban areas with a target population of 154,000 peoplewill be provided with water supply facilities as on 31.3.91.
ii) Gangtok Water Supply
Total population coverage shall be 75,000 people. The Decade Planwill aim at providing full fledged new water supply schemes to cater for the51,000 people. Augmentation schemes shall be taken upto cover remaining14,000 people.
In regard to sanitation, a target population of 43 thousand people ofurban areas will be provided with sanitation facilities by 31.3.91.
8. DECADE PROGRAMME FUNDING
Investment of cost for Decade Programmes has been estimated to beRs. 28.905 crores.
The cost has been calculated on the basis of unit cost, typecommunity and population.
In the 6th Five Year Plan outlay, it is seen that Rural Sectorhas been provided with adequate financial resources, which is 96.43%of the requirement for the Decade period. The plan outlay for urbansector is 18.64% of the Decade requirement. During 6th Plan, Rs. 9.5crores have been provided under State Sector and Rs. 4.0 crores underCentral Sector ARP funds.
The coverage of the population will be as per the norms for theNation. Efforts shall be there to provide water supply, sewerage andsanitation facilities to the public at the maximum level of services,namely, adequate supply of water 24 hours a day cattering the firefighting, industries and commercial needs. Similarly, full fledged sewerage
schemes in Gangtok and other sanitation facilities for other urban andrural communities will be provided. Proposed annual plan outlay for theDecade Programmes including population will be given after discussion.
Internal generation of resources is negligible. So far there hasnot been any work undertaken with loans from any financing agency. Therehave been a few schemes under Rural Sector which were executed from theresources obtained from lending agencies namely UNICEF» The State istherefore fully dependent upon Central Grants and aids.
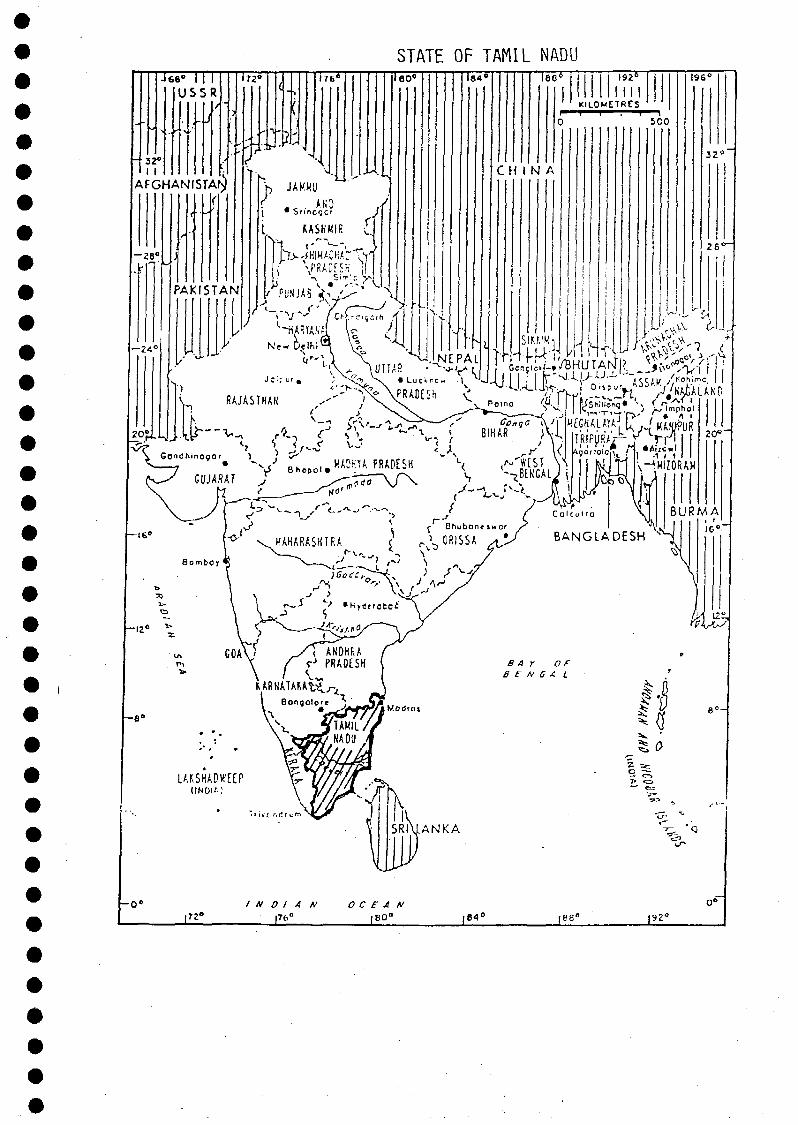
STATE OF TAMIL NADU
- 32°11 s
AFGHANISTANr
EXECUTIVE SUMMARYOF
THE DECADE PLAN OF WATER SUPPLY ANDSANITATION SECTOR (APRIL 1981 - MARCH 1991)
FOR
TAMIL NADU
1. INTRODUCTION
Tamil Nadu is at the South East extremity of the Indian peninsula borderedby the States of Andhra, Karnataka in the North, Kerala in the West, Indian Oceanin South and Bay of Bengal on East. Because of its proximity to the equator, theinfluence of hot sun makes Tamil Nadu Tropical. Tamil Nadu has thelongest coast line. About 75% of the area is Rocky and the rest alluvium.In a year, only about 55 days are rainy and average rainfall in the yearwill be around 950 mm. With the maximum bound of 1750 mm and the minimumbound of 500 mm. Tamil Nadu covers an area of 1300,60 sq.km.
The population of Tamil Nadu as per 1971 census was 411.93 lakhs.The projected population of Tamil Nadu for 1981 is 473.04 lakhs.
The projected population for 1991 is taken as 530.18 lakhs at agrowth rate of 1.208% per annum. The reduction in growth rate in TamilNadu in 3 decades can be attributed to the increase in literacy andconsequential awareness among the people about family planning.
2. SOCIO-ECONOMIC INDICATORS
The distribution of population between urban and rural as per theCensus of India is as follows:
Population in thousands
1971 census 1981 projected 1991 projected
Rural 28686 31,382 33245Urban 12442 15,922 19773Total 41128 47,304 53018
The developmental activities in Tamil Nadu since the first fiveyear plan had substantial and appreciable growth. Particularly thedevelopment in Agriculture, Irrigation Power Generation, Industries andEducation are commendable.
- 2 -
At the current prices, the annual average compound growth rate ofState income from 1970-71 to 1978-79 was 10.3%. But estimated at constant(1970-71) prices. The rate for period 1970-71 to 1978 -79 was 3.6%.
3. HEALTH STATISTICS
Growth of population is generally based on birth and death ratesin an area Infant Mortality rate is a sensitive index of Health statusof a community. In addition incidences and mortality due to variousdiseases also enable assessment of health status of the population.
The birth and death rates and Infant Mortality rate for Tamil
Nadu for 1981 are at follows:
B.R. D.R. IMR
26.1 10.9 81.2
Special central programmes are available for control of malariacholera virus Encephalities and water borne diseases. Expanded programmeof immunisation aims to reduce the mincidence and mortality due towhooping cough tetenus. etc..
4. WATER RESOURCES
In Tamil Nadu the annual average precipitation is 945.7 mm. Thisprecipitation in the total of the South, West and North East monsoon.Monsoon periods of varying precipitation and their vagories control the sur-face water regime and around water recharge. About 750 mm of the yearlyrainfall percolates into the soil. Regarding the potential of surfacewater, almost all the rivers rise from the Western Ghats in Karnataka andKerala. These rivers are rainfed only and hence discharge will be onlyduring monsoon months. Except Cauvery and Tambraparani all the rivers dryup during most part of the year. The following table illustrated the flowsin the rivers.
River
1.a)
b)c)
2.3.4.5.
CauveryMettur
Reservoir
Grand AnicutColeroon
Bhavani
PalarVaigaiTambraparani
Flow
M.Cu.m
10,78511,0024,413
2,274135
1,102821
June to Sept
685743
5372517
Percentage of YieldOct. to Dee. Jan.
242345
29904955
to May
8 |1012;;
18 j32628
» T _
Tamil Nadu is not rich in ground water sources also. Most of theinland rivers of the state have hard rock substratum which can yield onlyvery limited quantities of water. About 70% of the area of the state is ofArchaean formation made up of granite variaities which does not permit waterto percolate easily. About 20%of the area of the State is of creataceousformation which consists of tertiary and alluvium types. This only permitsmoderate to good development of ground water sources. UNDP has conductedextensive studies in selected basins. It has been estimated that the totalannual ground water recharge in the state is 18,500 M.cum in normal year.Out of this present extraction is 12500 M.cum leaving a balance of 6000 M.cumfor irrigation, industrial use etc.,
5. PRESENT SITUATION OF WATER SUPPLY AND SEWERAGE
The 1971 census population of Tamil Nadu was A11.28 lakhs in which124.42 lakhs people live in 439 urban cities and urban agglomeration. Theprojected population for 1981 was 473.04 lakhs of which 159.22 lakhs expectedto live in urban cities and urban agglomeration.
Urban Water Supply: By the end of March 1981, 176 towns have been providedwith.water supply and the population benefittéd was' 128.98 lakhs. The supply mac;available in almost all the towns are not adequate. The shortfall in require-ment is met from private wells, irrigation wells etc.-
Rural Water Supply: The census of India has reported that as per 1971census the rural population was 286.86 lakhs. The projected population for1981 is 313.82 lakhs. In Tamil Nadu the Rural Water Supply was in vaguesince 1895. However till 1980 there was no appreciable performance inproviding water supply in the rural areas. But importance of providingprotected drinking water supply was very much felt from the year 1976—77 andit gained momentum in subsequent years. During the year 1976 the StateGovernment conducted a scientific survey of the rural water supply status whichrevealed that there are 47075 rural habitations in 15735 census villagesavailable in Tamil Nadu. Out of this 18167 habitations falling under types1 to 5 in 7226 census villages are really problem areas for drinking water.Upto March 1980, 577 problem villages having 3465 habitations were providedwith water supply. At the beginning of VI Five Year Plan there were 664 9problem villages having 14702 problem habitations. It is proposed to providewater supply to all the problem habitations before end of the VI Five YearPlan. The State Government provided under Minimum Needs Programme Rs.5000 lakh-and the Government of India under Accelerated Rural Water Supply Programmeprovided Rs.2667 lakhs. To meet the shortfall the Government of Tamil Naduis diverting funds from self sufficiency programme. From 1971-72 to March1983, 18163 habitations were covered and the population benefitted was135.875 lakhs.
Percapita supply provided ranges from 25 to 60 lpcd. The entirerural population so far provided with water supply are covered by PublicStand Posts or hand pumps only. As on 31.3.81, 64.56 lakh people in ruralhave protected drinking water supply facilities.
Urban Sanitation: By the end of March 1981, the organised sanitationfacilities were made available in 13 towns benefitting a population 74.56lakhs. All the above towns are having treatment works. Regarding thetowns served with waterseal toilets connected to septic tanks, authenticatedreports on the existing individual sanitary systems are not readily available.Hence it has been assumed that 18% of population lying in urban areasuncovered by sewered waste water disposal system will have their ownsanitary system of disposal.
Rural Sanitation: Provision of Rural Sanitation in Tamil Nadu isyet to be done. The Directorate of Public Health and Preventive Medicinehave set up a Research-cutn-Action Project at the Health Unit Foonamalle topropagate the adoption low cost sanitary system. This project was originallylimited to few area which are nearer to Madras and now it has been extendedto the entire State. The functioning and performance of this centre islimited to evolve Low Cost technology to the rural population. They instalonly a few units every year for demonstration and continued installationfor all the house is not done.
Therefore practically the rural population benefitted by sanitarysystem is NIL and everything has to be started afresh. At the beginningof the decade programme 56,000 people have sanitation facilities in therural areas.
6. SECTOR ORGANISATION
Capital Investment for water supply and sanitation sector is a partof the overall development plan in India. In Tamilnadu about half a dozenagencies are interested in the affairs of water supply and sanitation programme.They are :
1) Madras Metropolitan Water Supply and Sewerage Board2) Tamil Nadu Water Supply and Drainage Board3) Director of Municipal AdministrationA) Director of Rural Development5) Director of Adi Dravidar and Tribal Welfare6) Tamil Nadu Housing Board7) Director of Town Panchayats
- The Institutional and Functional Responsibilities
1. Madras Metropolitan Water Planning, programming, designing,
Supply & Sewerage Board constructing and operating andmaintaining of water supply andsanitation system is Madras Metro-politan areas.
2. Tamil Nadu Water Supply Planning, programming, designingand Drainage Board and constructing water supply
and sanitation programme in allTamil Nadu other than MM Area.
^ c _
Directorate of RuralDevelopment
Directorate of Municipal Operation and niaintenance of
Administration water supply and sanitation systmsin Municipalities and MunicipalTownships and construction of Minorworks costing not more than aspecified amount based on thegrade of such towns.
Operation and maintenance ofwater supply and sanitation systemin Panchayat Township, TownPanchayats and Village Panchayatsand construction of few minor worksnot exceeding a prefixed monetarylimit.
5. Directorate of Adi Planning, Programming, Designingand constructing water supplysources in Adi-Dravidar 4 Tribalcolonies.
6. Tamil Nadu Housing Board Planning, Programming, Designingand constructing water supplyand sanitation facilities in Housingcolonies constructed by theBoard.
In Tamil Nadu though there are nearly half dozen agencies toimplement the programme on water supply and sanitation, the M Boardand TWAD Board are solely responsible for planning and programming thetotal plan for the State.
Monitoring and surveillance of quality of the services are providedregularly by two organisations namely (1) King Institute, Guindy (2) Directorateof Public Health and Preventive Medicine- During the last 10 years TWAD Boardhas created necessary infrastructures to undertake the services of monitoringand surveillance of water quality.
Directorate of AdiDravidar and TribalWelfare
7. DECADE PLAN TARGETS ( POP. COVERAGE)
Targetted population to be served by 31.3.85 (Phase-I)3.
Urban Water Supply:
NewAugmentation
Rural Water Supply SchemeUrban Sanitation NewExtensionRural Sanitation
1723,000
4661,000
6214,000542,0001014,000800,000
Targetted population to beservedUrban Water Supply New
Augmentât ionRural Water Supply SchemeUrban Sanitation New
AugmentationRural Sanitation
during the 2nd phase4416,0005322,00020316,0006739,0001870,0007455,000
8. DECADE PROGRAMME FUNDING
Funds required during the Decade for implementing water supply andsanitation programme at 1980 price level are furnished below sub sector wise:
1) Urban Water Supply2) Rural Water Supply3) Urban Sanitation4) Rural Sanitation
Total
Rs.383.5190 croresRs.518.3900 croresRs.262.4420 croresRs. 41.2750 crores
Rs.1205.6260 crores
Mobilisation of Resources: Funds available during the Sixth FiveYear Plan is furnished below: Last 4 years of the Sixth Five Year Plan.
1) Urban Water Supply2) Rural Water Supply3) Urban Sanitation4) Rural Sanitation
Total
Rs.123.5763 croresRs.186.1696 croresRs. 31.3378 croresRs. 4.0000 crores
Rs.345.0837 crores
Funds Required during the VII Five Year Plan.
1) Urban Water Supply2) Rural Water Supply3) Urban Sanitation4) Rural Sanitation
Total
Rs.215.4767 croresRs.280.7373 croresRs.188.6704 croresRs. 31.0250 crores
Rs.715.9094 crores
Funds required during the Fist Year of the VIII Five Plan Period.
1) Urban Water Supply2) Rural Water Supply3) Urban Sanitation4) Rural Sanitation
Total
Rs. 44.4660 croresRs. 51.4831 croresRs. 42.4338 croresRs. 6.2500 crores
Rs. 144.6329 crores
At present the State shares maximum burden from its plan allocationand partly by the Government of India, Financing institutions like LICand Donor agencies like DANIDA UNICEF etc., still the resources developed coul:not be sufficient. Hencethe State and Central Government will work out thepossibilities of setting up an independent financial institution and also tapt..".?additional resources from bilateral and International Agencies,
- 7 -
9. SUPPORT PROGRAMMES
To meet the heavy demand within the shortest spare of this decadethe existing administrative and executive personnel have to be suitablystrengthened. For the present programme itself the availability of materialis found to be a hot cake. For increased activities in the decade, materialmanagement have to be geared up to purchase and supply the required materialsat the appropriate time and equally at economical cost.
The existing difficulties and delays in the land acquisition, projectpreparation, maintenance of accounts, auditing the accounts, co-ordinationamong different agencies policy formulation have to be complete. Operationand maintenance is not effective to derive the full benefit the system.
In Sectoral Co-ordination: Water Supply and Sanitation SectorProgramme in Tamil Nadu is mainly implemented by the TWAD Board and M WSSB.The implementation of the projects will require the co-ordination of otherdepartments like Industries, Health and Family Welfare, Tamil Nadu Electri-city Board, Highways Public Works Department, Finance and Revenue.
In order to overcome the difficulties in the initia stage itself,few of the heads of departments are Madras Board of Directors in TWAD Boardand MFWSSB so that the formulation of proposals and the decisions can betaken without any constraints. During implementation the coordination inrespect of the following departments are also essential. Director ofMunicipal Administration, Director of Rural Development, Public Works Depart-ment, Highways Department etc..
Health Education and Community Participation: Water Supply andSanitation is a service sector. The investment for this sector is recurringin nature. The duration and value of recurrence is mainly based on how thesystems are utilised and maintained. For effective maintenance the publicis to be educated about this sector services. The services rendered bythe Health Department are advising on the aspects of effective disposal ofwaste water and water testing by the Industries when approached; facilitiesprovided in respect of chlorination when public approaches etc.. but inrespect of educating the rural mass about the importance of water supplyis yet to be done.
The investment required to implement the programme is massive.The State or Central Government can contribute to provide the basic minimumwith several constraints. So the public has to come forward and contributea little either in the form of cash or service which will relieve the Govern-ment from the heavy burden to invest and maintain the system. Thereforecommunity participation is also essential for this sector services.
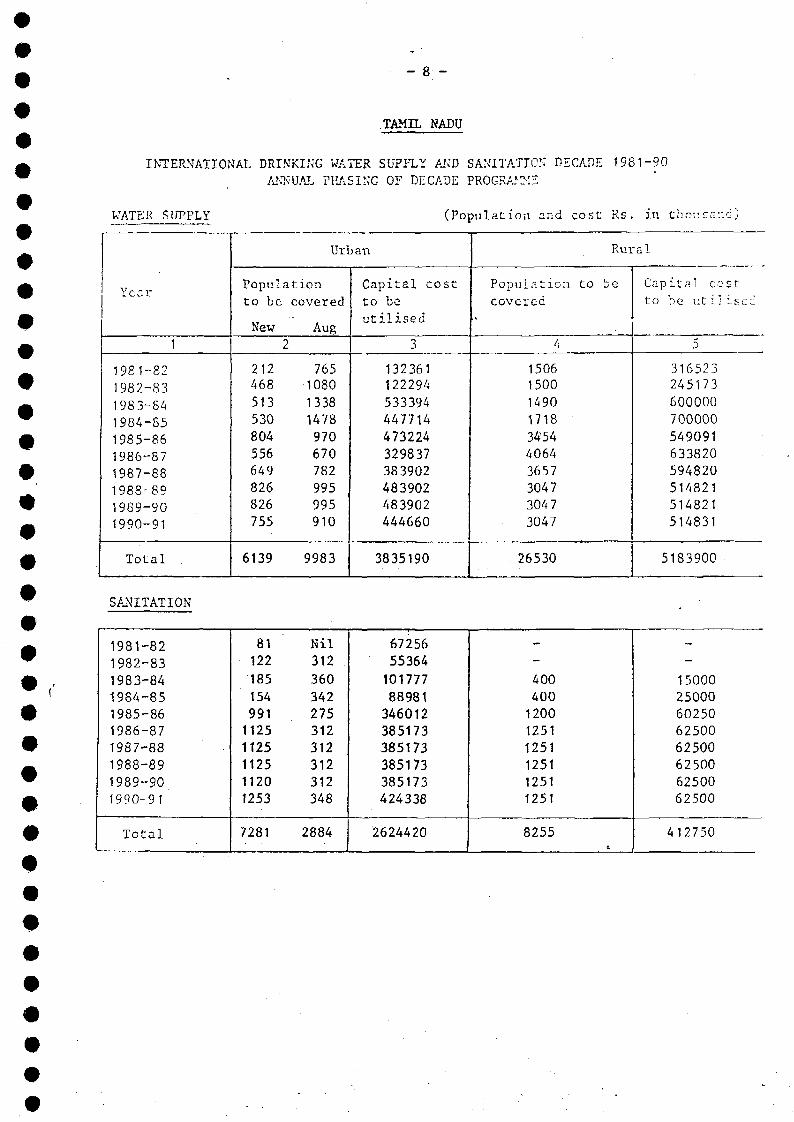
- 8 • -
TAMIL NADU
INTERNATIONAL DRINKING WATER SUPPLY AND SANITATION DECADE 1 9 8 1 - 9 0
ANNUAL PHASING OF DECADE PROGRAMME
WATER SUPPLY
Y r- -3 r
1
1981-821982-831983-841984-851985-861986-871987-881988-891989-901990-91
Total
(Population and
Urban
Populationto be
New2
212468513530804556649826826755
6139
covered
Aug
765108013381478970670782995995910
9983
Capital costto beutilised
3
132361122294533394447714473224329837383902483902483902444660
3835190
Populationcovered
4
15061500149017183454406436573047304 73047
26530
cost R E .in thousand)
Rural
to be Capital costto be ut iIisec
5
316523245173600000700000549091633820594820514821514821514831
5183900
SANITATION
1981-821982-831983-841984-851985-861986-871987-881988-891989-90^99O-9\
Total
81 Nil122 312185 360154 342991 2751125 3121125 3121125 3121120 3121253 348
7281 2884
672565536410177788981346012385173385173385173385173424338
2624420
--
400400120012511251125112511251
8255
-
1500025000602506250062500625006250062500
412750
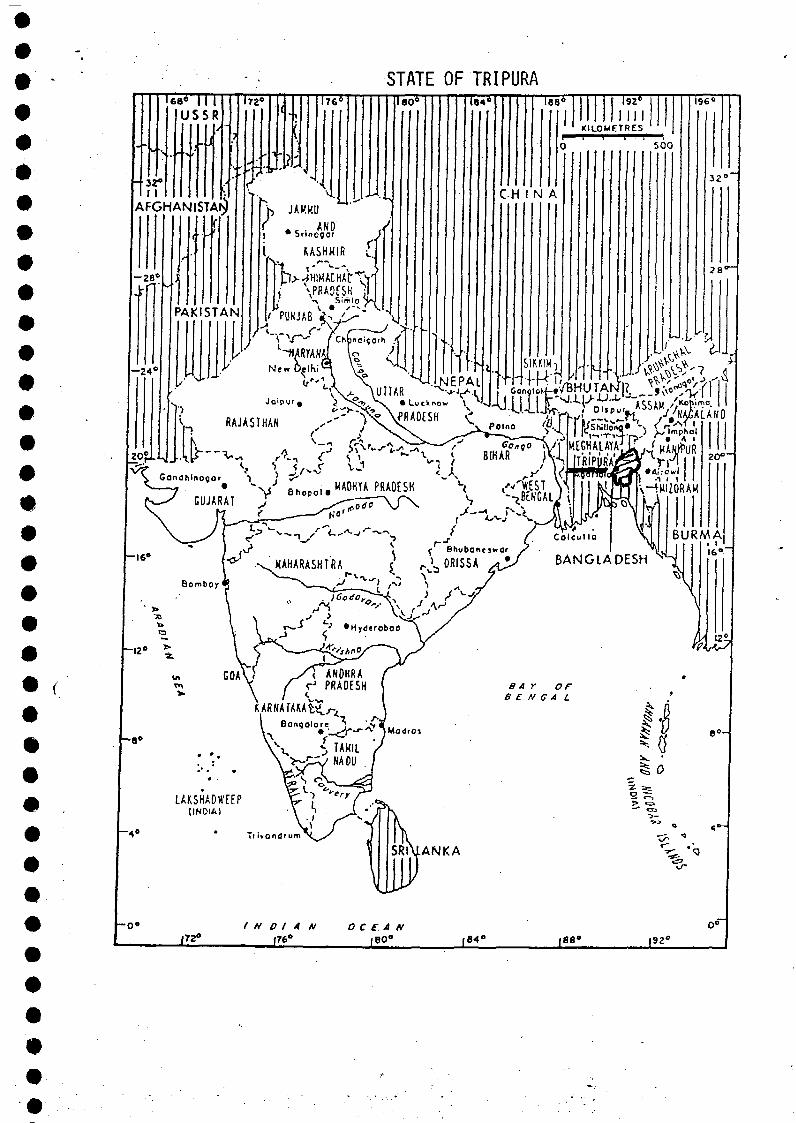
STATE OFTRIPURA
mm»
t-HARrANAl l e >k A \a -À.
Colcutio
BANGLADESH
• EXECUTIVE SUMMARY• OF0 THE DECADE PLAN OF WATER SUPPLY AND^ SANITATION SECTOR (APRIL 1981 - MARCH 1991)
FOR
• TRIPURA
# 1. INTRODUCTION
^ This State having an area of 10 477 sq. km. is land - locked and0 surrounded by Bangladesh border on 3 sides. This is also the second
smallest State in area and the 5th smallest State in population among0 Indian States, In 1971 census population of this State was 1.55 million
which is expected to be 2.75 million by the year 1991. The projectedW population figures as on March, 1981 is estimated to be 2.104 million.— Regarding evolution of water supply and sanitation sector in this State™ and the development of service levels it may be mentioned here that due to0 geographical location of the State the development in this Sector was
very slow comparing to rest of the country. Previously Tripura was a0 princely State which joined Indian Union after independence. Till 1959-60
nothing much could be done in this sector as the top most priority was0 given to develop the communication system within the State and also with_ the rest of the country by way of constructing permanent road net works.
£ The State Tripura falls in between latitude 24"-56'N to latitude• 24"-32'N and longtitude 91"~10'E to longtitude 92"-21'E and surrounded on
0 3 sides by Bangladesh sharing 839 km of international boundary and is alsobordered in the North-East and East by Assam & Mizoram sharing a boundary
ft r of 53 km and 109 km respectively. The total area of the State is 10 477sq.km. being 0.3% of Indian Territory. The extreme length and width are
™ 183.5 km and 112.7 km respectively. The State is divided administratively^ in 3 (three) Districts i.e., West, North & South and among them North^ District is mainly hilly. The West District comprising hills and plains is0 inhabitated by 48.3% of States .population. The State has extremely
difficult Road-cum-rail communication system and the only road-cum-rail0 link with the rest of the country is from Dharmangar, 200 km. in the
North East from the capital Agartala. The Capital Agartala is air-linkedW with West Bengal and Assam.
^ The climate of the State is generally warm and humid. The temperature£ ranges from 10'C in winter to 40'C in summar and the average annual rainfall
is about 2100 mm. The climate is cold and dry during winter - December,0 January and February which is very pleasant. Topographically Tripura is
a hilly terrain with 70% of its area as hills and 30% of its total area asW plain. There are 5 Nos. main hilly ranges in the State running North-
South and are parallel to each other. These ranges are Baramura, Atharamura,9 Longthorai, Sankhantang & Jatnpai covering a major part of West and NorthA District.
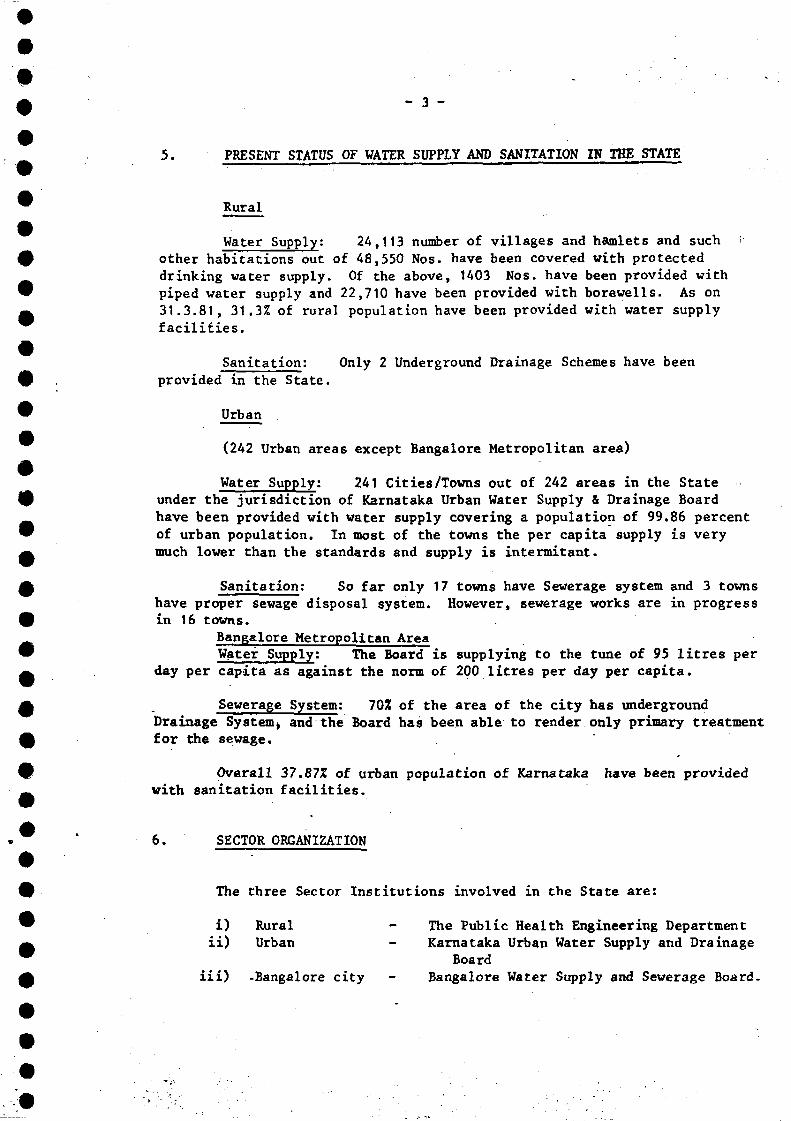
- 3 -
5. PRESENT STATUS OF WATER SUPPLY AND SANITATION IN THE STATE
Rural
Water Supply: 24,113 number of villages and hamlets and such ;other habitations out of 48,550 Nos. have been covered with protecteddrinking water supply. Of the above, 1403 Nos. have been provided withpiped water supply and 22,710 have been provided with borewells. As on31.3.81, 31.3% of rural population have been provided with water supplyfacilities.
Sanitation: Only 2 Underground Drainage Schemes have beenprovided in the State.
Urban
(242 Urban areas except Bangalore Metropolitan area)
Water Supply: 241 Cities/Towns out of 242 areas in the Stateunder the jurisdiction of Karnataka Urban Water Supply & Drainage Boardhave been provided with water supply covering a population of 99.86 percentof urban population. In most of the towns the per capita supply is verymuch lower than the standards and supply is intermitant.
Sanitation: So far only 17 towns have Sewerage system and 3 townshave proper sewage disposal system. However, sewerage works are in progressin 16 towns.
Bangalore Metropolitan AreaWater Supply: The Board is supplying to the tune of 95 litres per
day per capita as against the norm of 200 litres per day per capita.
Sewerage System: 7O3E of the area of the city has undergroundDrainage System, and the Board has been able to render only primary treatmentfor the sewage.
Overall 37.877 of urban population of Karnataka have been providedwith sanitation facilities.
6. SECTOR ORGANIZATION
The three Sector Institutions involved in the State are:
i) Rural - The Public Health Engineering Departmentii) Urban - Karnataka Urban Water Supply and Drainage
Boardiii) -Bangalore city - Bangalore Water Supply and Sewerage Board-
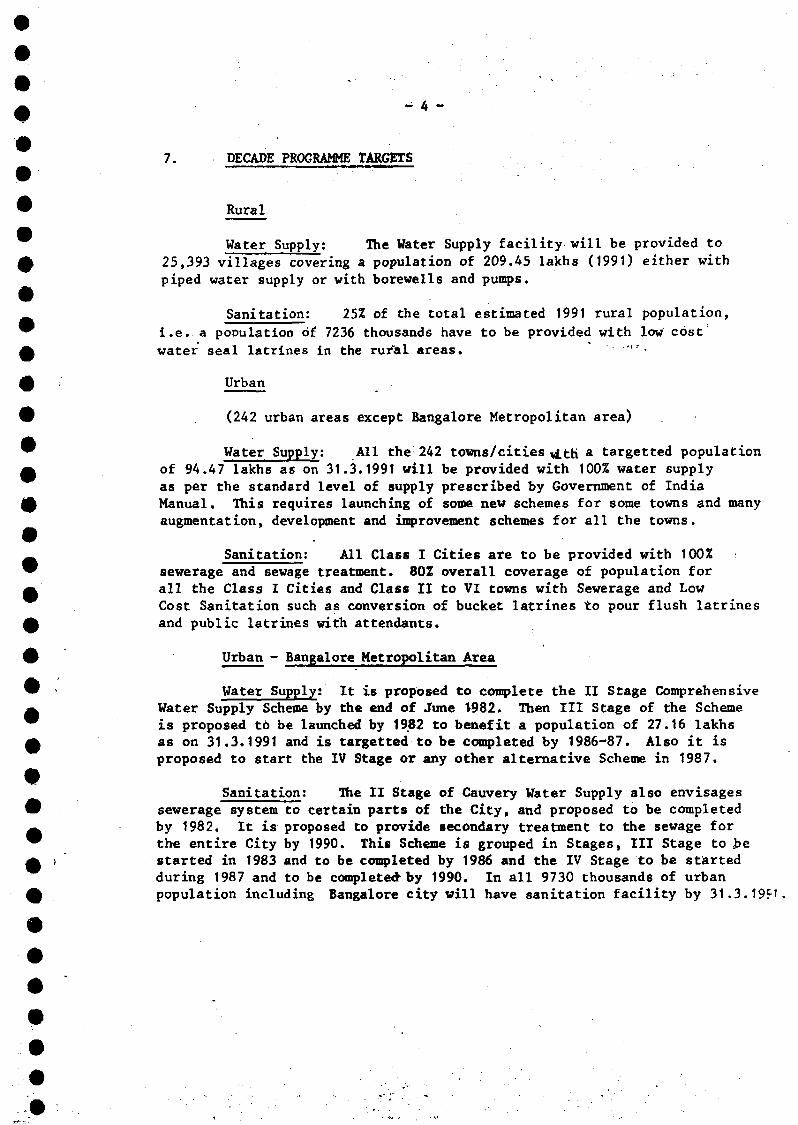
- 4 -
7. DECADE PROGRAMME TARGETS
Rural
Water Supply: The Water Supply facility will be provided to25,393 villages covering a population of 209.45 lakhs (1991) either withpiped water supply or with borewells and pumps.
Sanitation: 25% of the total estimated 1991 rural population,i.e.. a population o£ 7236 thousands have to be provided with low costwater seal latrines in the rur"al areas. * "•'" •
Urban
(242 urban areas except Bangalore Metropolitan area)
Water Supply: All the 242 towns/cities tf.th a targetted populationof 94.47 lakhs as on 31.3.1991 will be provided with 100% water supplyas per the standard level of supply prescribed by Government of IndiaManual. This requires launching of some new schemes for some towns and manyaugmentation, development and improvement schemes for all the towns.
Sanitation: All Class I Cities are to be provided with 100% :sewerage and sewage treatment. 80Z overall coverage of population forall the Class I Cities and Class II to VI towns with Sewerage and LowCost Sanitation such as conversion of bucket latrines to pour flush latrinesand public latrines with attendants.
Urban - Bangalore Metropolitan Area
Water Supply: It is proposed to complete the II Stage ComprehensiveWater Supply Scheme by the end of June 1982. Then III Stage of the Schemeis proposed to be launched by 1982 to benefit a population of 27.16 lakhsas on 31.3.1991 and is targetted to be completed by 1986-87. Also it isproposed to start the IV Stage or any other alternative Scheme in 1987.
Sanitation: The II Stage of Cauvery Water Supply also envisagessewerage system to certain parts of the City, and proposed to be completedby 1982. It is proposed to provide secondary treatment to the sewage forthe entire City by 1990. This Scheme is grouped in Stages, III Stage to bestarted in 1983 and to be completed by 1986 and the IV Stage to be startedduring 1987 and to be completed by 1990. In all 9730 thousands of urbanpopulation including Bangalore city will have sanitation facility by 31.3.19ft
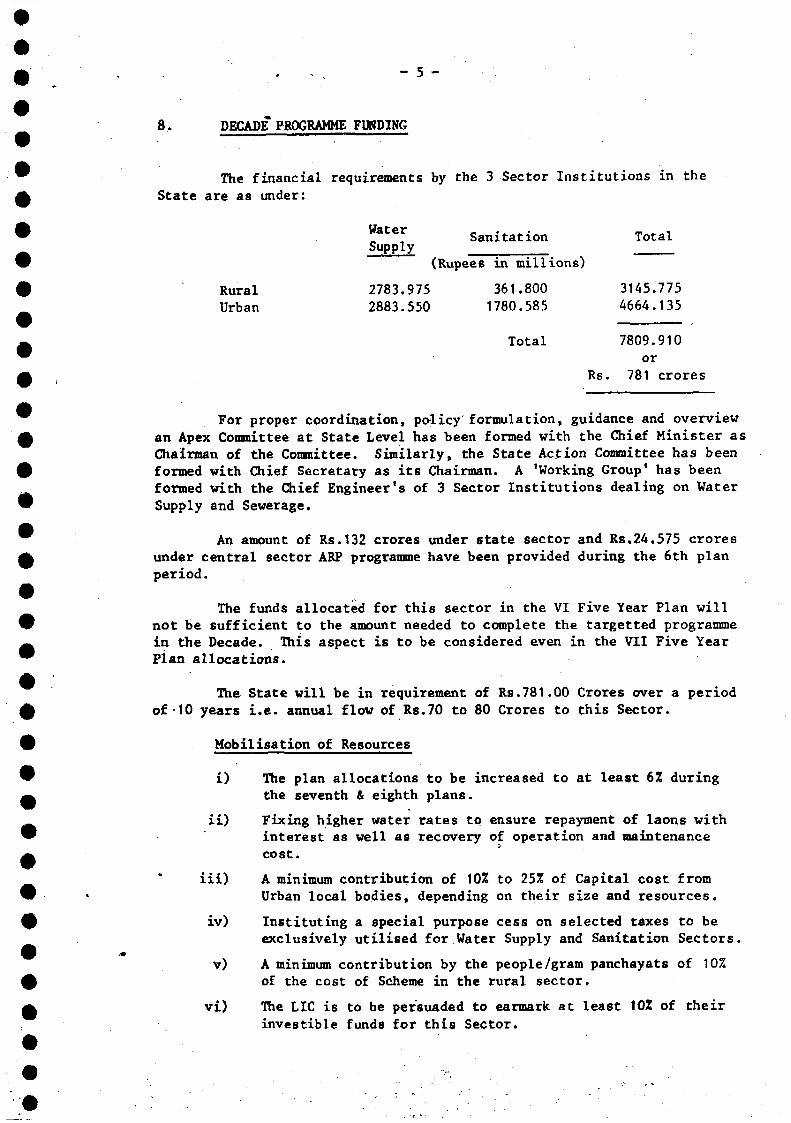
- 5 -
8. DECADE PROGRAMME FUNDING
The financial requirements by the 3 Sector Institutions in theState are as under:
" a t ef Sanitation TotalSupply
(Rupees in millions)
Rural 2783.975 361.800 3145.775Urban 2883.550 1780.585 4664.135
Total 7809.910or
Rs. 781 crores
For proper coordination, policy formulation, guidance and overviewan Apex Committee at State Level has been formed with the Chief Minister asChairman of the Committee. Similarly, the State Action Committee has beenformed with Chief Secretary as its Chairman. A 'Working Group' has beenformed with the Chief Engineer's of 3 Sector Institutions dealing on WaterSupply and Sewerage,
An amount of Rs.132 crores under state sector and Rs.24.575 croresunder central sector ARF programme have been provided during the 6th planperiod.
The funds allocated for this sector in the VI Five Year Plan willnot be sufficient to the amount needed to complete the targetted programmein the Decade. This aspect is to be considered even in the VII Five YearPlan allocations.
The State will be in requirement of Rs.781.00 Crores over a periodof-10 years i.e. annual flow of Rs,70 to 80 Crores to this Sector.
Mobilisation of Resources
i) The plan allocations to be increased to at least 6% duringthe seventh & eighth plans.
ii) Fixing higher water rates to ensure repayment of laons withinterest as well as recovery of operation and maintenancecost.
iii) A minimum contribution of 10% to 25% of Capital cost fromUrban local bodies, depending on their size and resources.
iv) Instituting a special purpose cess on selected taxes to beexclusively utilised for Water Supply and Sanitation Sectors.
v) A minimum contribution by the people/gram panchayats of 10%of the cost of Scheme in the rural sector,
vi) The LIC is to be persuaded to earmark at least 10% of theirinvestible funds for this Sector.
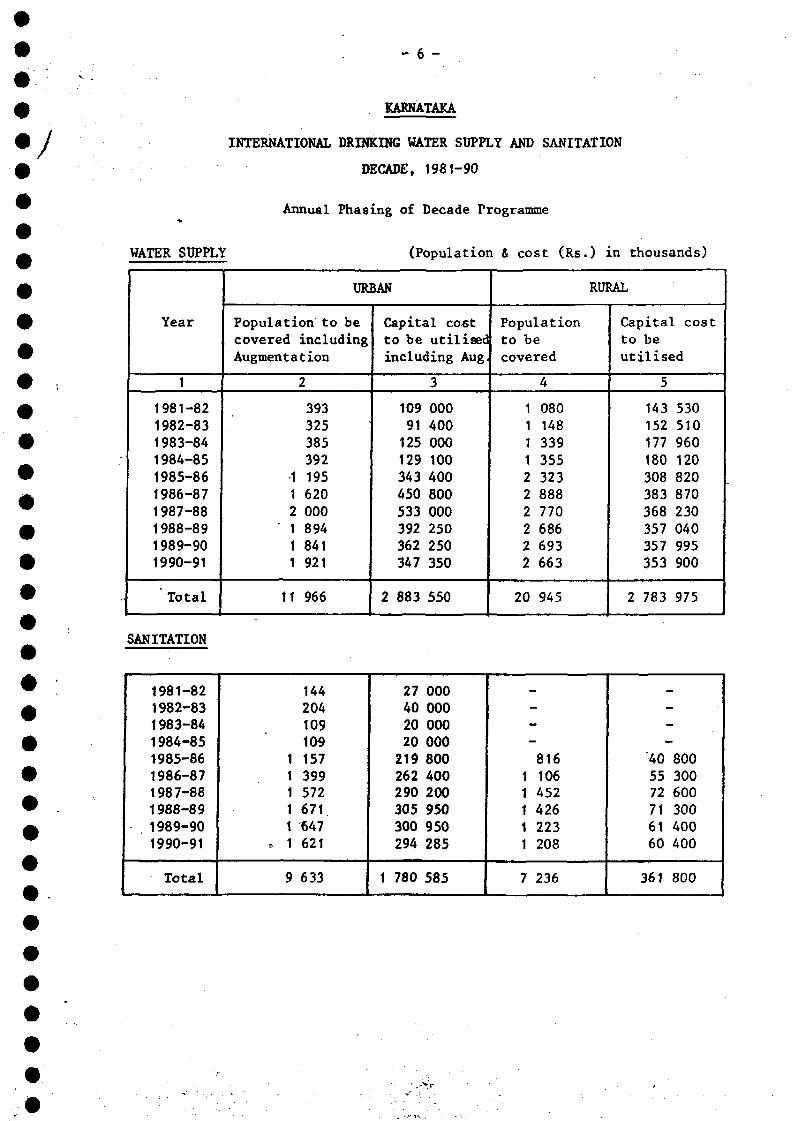
- 6 -
WATER SUPPLY
KARNATAKA
INTERNATIOHAL DRINKING WATER SUPPLY AND SANITATION
DECADE, 1981-90
Annual Phasing of Decade Programme
(Population & cost (Rs.) in thousands)
Year
1
1981-821982-831983-841984-851985-861986-871987-881988-891989-901990-91
Total
URBAN
Population to becovered includingAugmentation
2
393325385392
1 1951 6202 000
' 1 8941 8411 921
11 966
Capital co-stto be utiliséeincluding Aug
3
109 00091 400125 000129 100343 400450 800533 000392 250362 250347 350
2 883 550
RURAL
Populationto becovered
4
1 0801 1481 3391 3552 3232 8882 7702 6862 6932 663
20 945
Capital costto beutilised
5
143 530152 510177 960180 120308 820383 870368 230357 040357 995353 900
2 783 975
SANITATION
1981-821982-831983-841984-85Î985-861986-871987-881988-891989-901990-91
Total
144204109109
1 1571 3991 5721 6711 «47
. 1 621
9 633
27 00040 00020 00020 000219 800262 400290 200305 950300 950294 285
1 780 585
_---816
1 1061 4521 4261 2231 208
7 236
_
--
40 80055 30072 60071 30061 40060 400
361 800
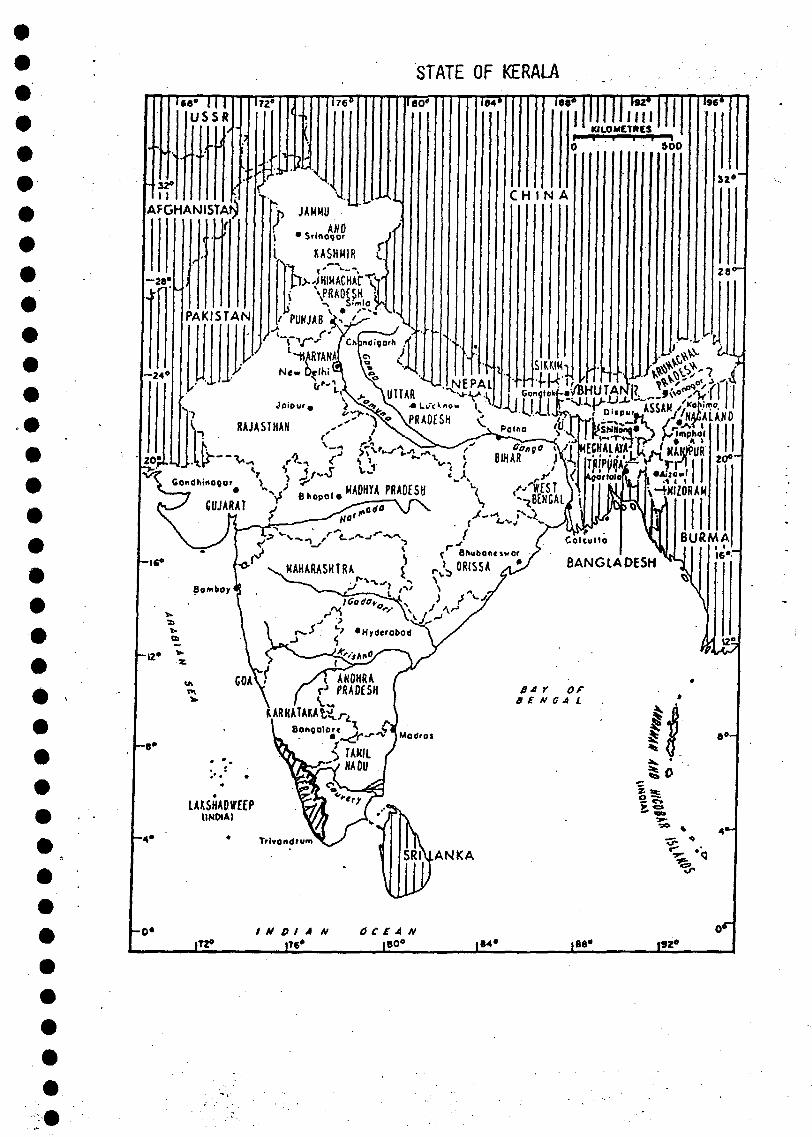
STATE OF KERALA
" 32e
AFGHANISTAN
,R "*"••>-V'-l Conotokf-t'
PflAOfSH C- kJA-UF\" ' ^ V V P R A O E S H
Condhinogor ). •
^ Ghubontswor\ AAirr i ' #

EXECUTIVE SUMMARYOF.
THE DECADE PLAN OF WATER SUPPLY ANDSANITATION SECTOR (APRIL 1981 - MARCH 1991)
FOR
KERALA
1. INTRODUCTION
Most parts of Kerala State are in the grip of acute scarcity fordrinking water especially during the sunnier months. In the coastal areasthere is saline intrusion and the salinity travels up the rivers for longreaches making the availability of drinking water difficult especially in thecoastal areas. In the midland areas the dug wells dry up in summer monthsand in upland areas» water is available only in gorges and valleys and thepeople especially the women folk have to walk great distances to bringwater.
Kerala is geographically a narrow stretch of land lying on theSouth Western coast of India. The area of 38,864 km2 is subdivided intothree zones, the low lands or coastal plains, the midlands, and the uplands.The coast-line is about 580 km in length, while the width of the Statevaries from 11 to 121 km.
2. SOCIO-ECONOMIC INDICATORS
The State's population according to 1981 Census is 25,403,217(project population figure being 25,960,200) with a density of 654 per sq.km. 18.05% of the population resides in the urban areas and the rest inthe rural areas. The population as per 1991 projection will be 30374thousands.
The per capita income in the State is Rs. 1056 against an allIndia average of Rs. 1316. The share of population considered to be livingbelow the poverty line is 47%. The literacy rate in Kerala is the highestin the country namely 69.17% (1981 census).
3. HEALTH ASPECTS
The birth and death rates per thousand (1979) are 25.9 and 6.9respectively. Disease statistics (1976) indicate the reported incidenceof water borne diseases to be about 3.1 per 1000 population, the moreprevalent being dysentry, hepatitis, typhoid and gastro entritis.
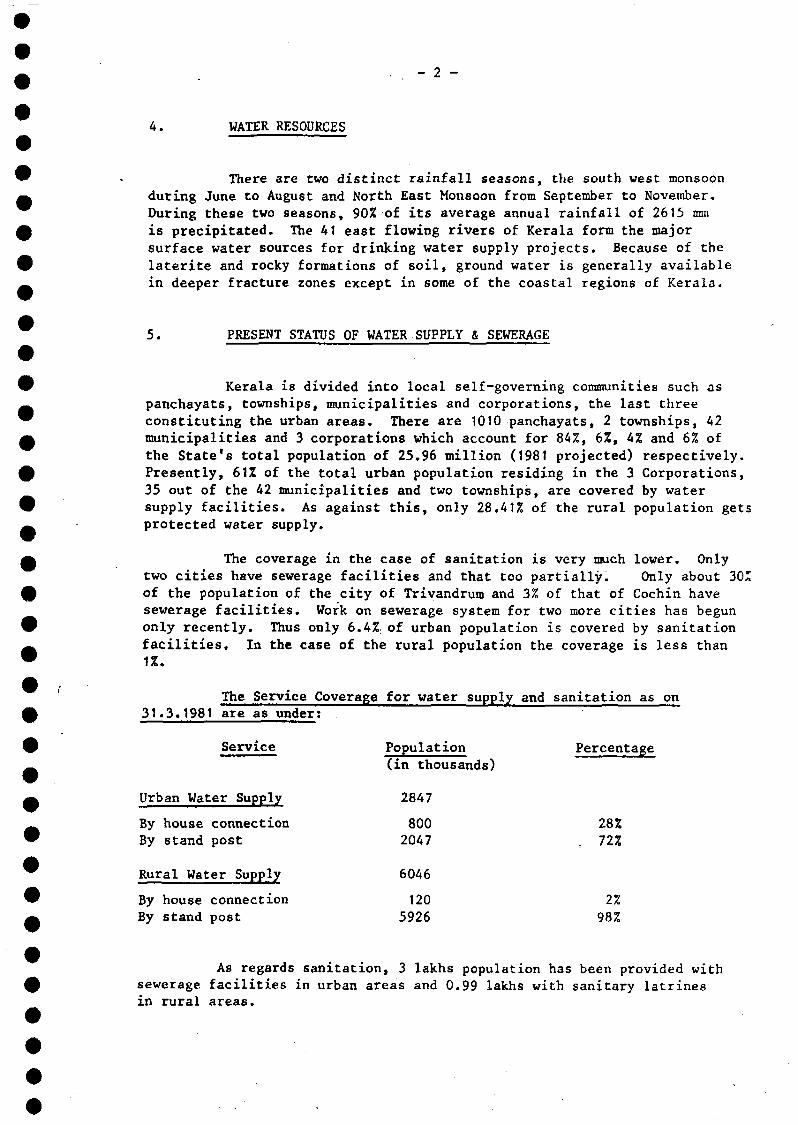
- 2 -
4. WATER RESOURCES
There are two distinct rainfall seasons, the south west monsoonduring June to August and North East Monsoon from September to November.During these two seasons, 90% of its average annual rainfall of 2615 mmis precipitated. The 41 east flowing rivers of Kerala form the majorsurface water sources for drinking water supply projects. Because of thelatérite and rocky formations of soil, ground water is generally availablein deeper fracture zones except in some of the coastal regions of Kerala.
5. PRESENT STATUS OF WATER SUPPLY & SEWERAGE
Kerala is divided into local self-governing communities such aspanchayats, townships, municipalities and corporations, the last threeconstituting the urban areas. There are 1010 panchayats, 2 townships, 42municipalities and 3 corporations which account for 84%, 6%, 4% and 6% ofthe State's total population of 25.96 million (1981 projected) respectively.Presently, 61% of the total urban population residing in the 3 Corporations,35 out of the 42 municipalities and two townships, are covered by watersupply facilities. As against this, only 28.41% of the rural population getsprotected water supply.
The coverage in the case of sanitation is very much lower. Onlytwo cities have sewerage facilities and that too partially. Only about 30'of the population of the city of Trivandrum and 3% of that of Cochin havesewerage facilities. Work on sewerage system for two more cities has begunonly recently. Thus only 6.4% of urban population is covered by sanitationfacilities. In the case of the rural population the coverage is less than1%.
The Service Coverage for water supply and sanitation as on31.3.1981 are as under:
Service
Urban Water Supply
By house connectionBy stand post
Rural Water Supply
By house connectionBy stand post
Population(in thousands)
2847
8002047
6046
1205926
Percentage
28%; 72%
2%98%
As regards sanitation, 3 lakhs population has been provided withsewerage facilities in urban areas and 0.99 lakhs with sanitary latrinesin rural areas.
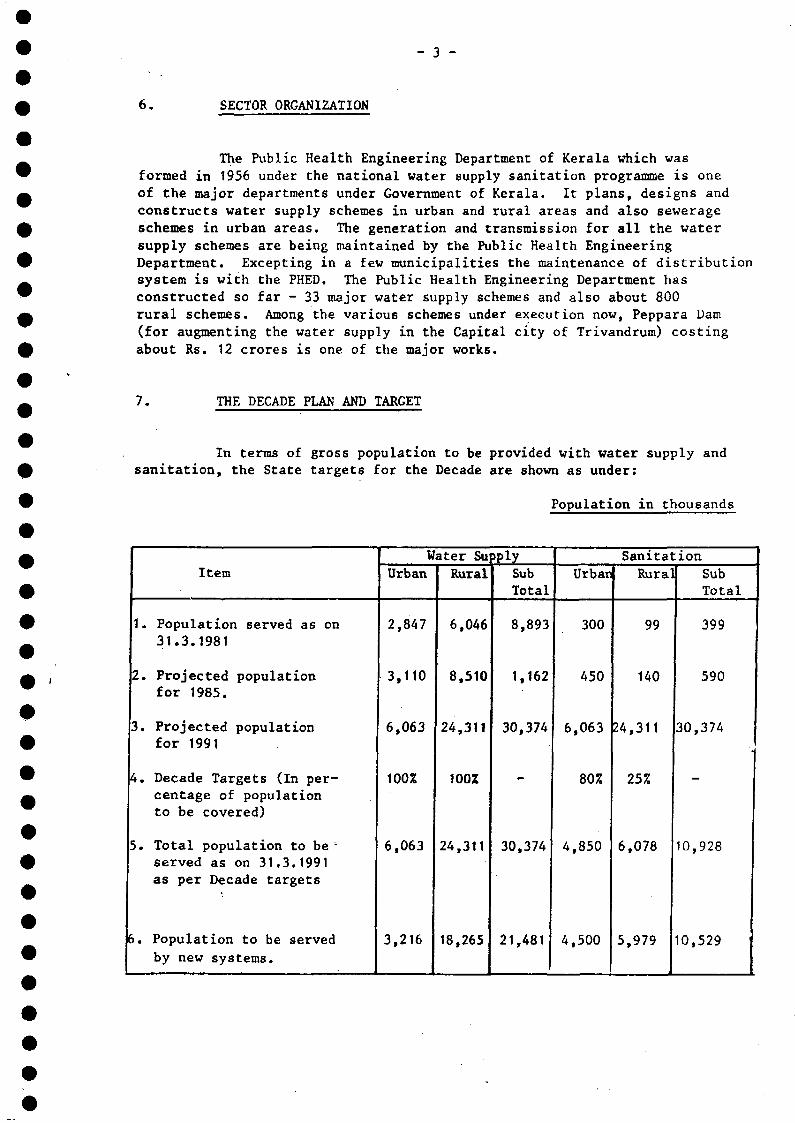
- 3 -
6. SECTOR ORGANIZATION
The Public Health Engineering Department of Kerala which wasformed in 1956 under the national water supply sanitation programme is oneof the major departments under Government of Kerala. It plans, designs andconstructs water supply schemes in urban and rural areas and also sewerageschemes in urban areas. The generation and transmission for all the watersupply schemes are being maintained by the Public Health EngineeringDepartment. Excepting in a few municipalities the maintenance of distributionsystem is with the PHED. The Public Health Engineering Department hasconstructed so far - 33 major water supply schemes and also about 800rural schemes. Among the various schemes under execution now, Peppara Dam(for augmenting the water supply in the Capital city of Trivandrum) costingabout Rs. 12 crores is one of the major works.
THE DECADE PLAN AND TARGET
In terms of gross population to be provided with water supply andsanitation, the State targets for the Decade are shown as under:
Population in thousands
Item
1. Population served as on31.3.1981
2. Projected populationfor 1985.
3. Projected populationfor 1991
4. Decade Targets (In per-centage of populationto be covered)
5. Total population to be -served as on 31.3.1991as per Decade targets
6. Population to be servedby new systems.
Water SuUrban
2,847
3,110
6,063
100%
6,063
3,216
Rural
6,046
8,510
24,311
100Z
24,311
18,265
pplySubTotal
8,893
1,162
30,374
—
30,374
21,481
SanitationUrban
300
450
6,063
80%
4,850
4,500
Rura
99
140
24,311
25%
6,078
5,979
SubTotal
399
590
30,374
—
10,928
0,529
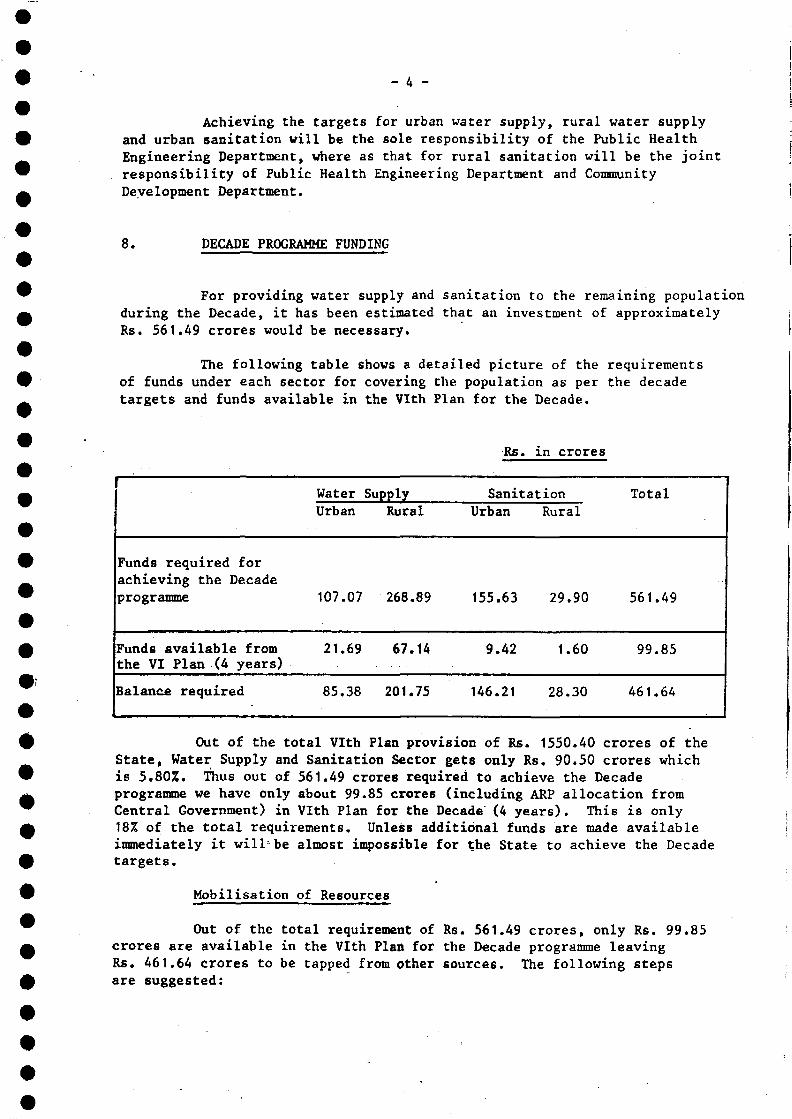
_ 4 -
Achieving the targets for urban water supply, rural water supplyand urban sanitation will be the sole responsibility of the Public HealthEngineering Department, where as that for rural sanitation will be the jointresponsibility of Public Health Engineering Department and CommunityDevelopment Department.
8. DECADE PROGRAMME FUNDING
For providing water supply and sanitation to the remaining populationduring the Decade, it has been estimated that an investment of approximatelyRs. 561.49 crores would be necessary.
The following table shows a detailed picture of the requirementsof funds under each sector for covering the population as per the decadetargets and funds available in the Vlth Plan for the Decade.
Rs. in crores
Funds required forachieving the Decadeprogramme
Funds available fromthe VI Plan (4 years)
Balance required
WaterUrban
107.07
21.69
85.38
SupplyRural
268.89
67.14
201.75
SanitationUrban
155.63
9.42
146.21
Rural
29.90
1.60
28.30
Total
561.49
99.85
461.64
Out of the total Vlth Plan provision of Rs. 1550.40 crores of theState, Water Supply and Sanitation Sector gets only Rs. 90.50 crores whichis 5.80%. Thus out of 561.49 crores required to achieve the Decadeprogramme we have only about 99.85 crores (including ARP allocation fromCentral Government) in Vlth Plan for the Decade (4 years). This is only18% of the total requirements. Unless additional funds are made availableimmediately it will2 be almost impossible for the State to achieve the Decadetargets.
Mobilisation of Resources
Out of the total requirement of Rs. 561.49 crores, only Rs. 99.85crores are available in the Vlth Plan for the Decade programme leavingRs. 461.64 crores to be tapped from other sources. The following stepsare suggested:
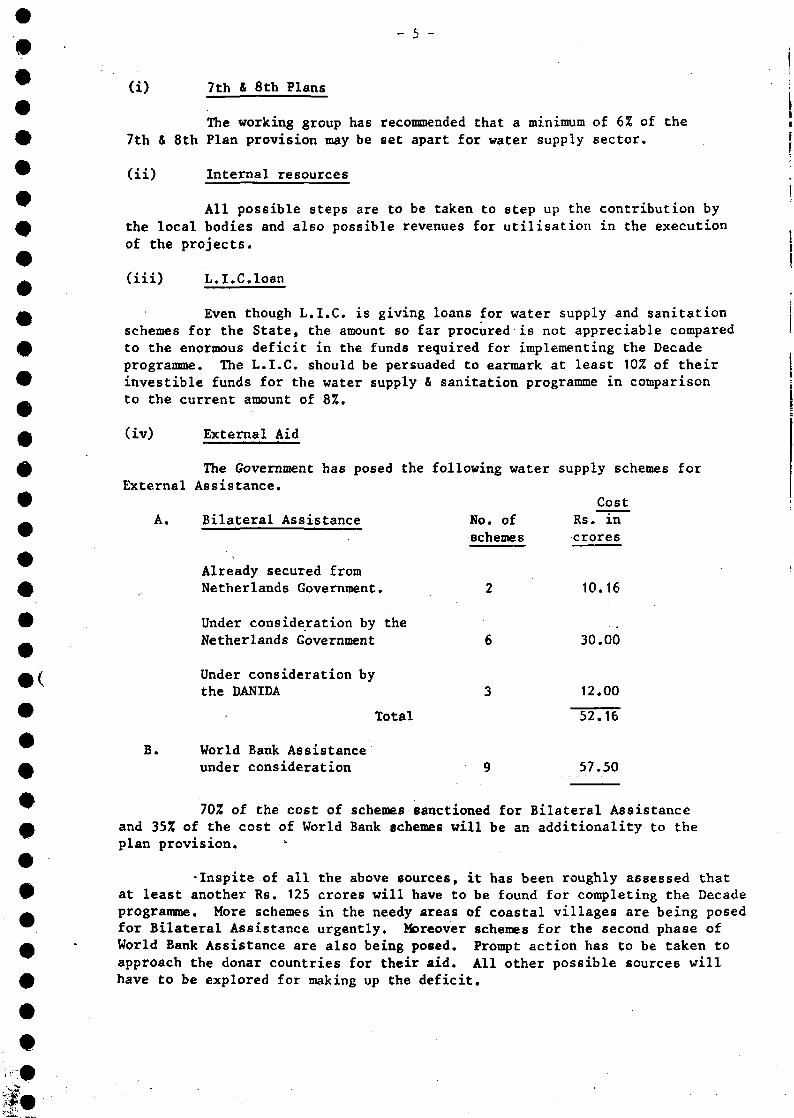
(i) 7th & 8th Plans
The working group has recommended that a minimum of 6% of the7th & 8th Plan provision may be set apart for water supply sector.
(ii) Internal resources
All possible steps are to be taken to step up the contribution bythe local bodies and also possible revenues for utilisation in the executionof the projects.
(iii) L.I.C.loan
Even though L.I.C. is giving loans for water supply and sanitationschemes for the State, the amount so far procured is not appreciable comparedto the enormous deficit in the funds required for implementing the Decadeprogramme. The L.I.C. should be persuaded to earmark at least 10% of theirinvestible funds for the water supply & sanitation programme in comparisonto the current amount of 8%.
(*-v) External Aid
The Government has posed the following water supply schemes forExternal Assistance.
CostA. Bilateral Assistance No. of Rs. in
schemes crores
Already secured fromNetherlands Government. 2 10.16
Under consideration by theNetherlands Government 6 30.00
Under consideration bythe DANIDA 3 12.00
Total 52.16
B. World Bank Assistanceunder consideration 9 57.50
70% of the cost of schemes sanctioned for Bilateral Assistanceand 35% of the cost of World Bank schemes will be an additionality to theplan provision.
-Inspite of all the above sources, it has been roughly assessed thatat least another Rs. 125 crores will have to be found for completing the Decadeprogramme. More schemes in the needy areas of coastal villages are being posedfor Bilateral Assistance urgently. Moreover schemes for the second phase ofWorld Bank Assistance are also being posed. Prompt action has to be taken toapproach the donar countries for their aid. All other possible sources willhave to be explored for making up the deficit.
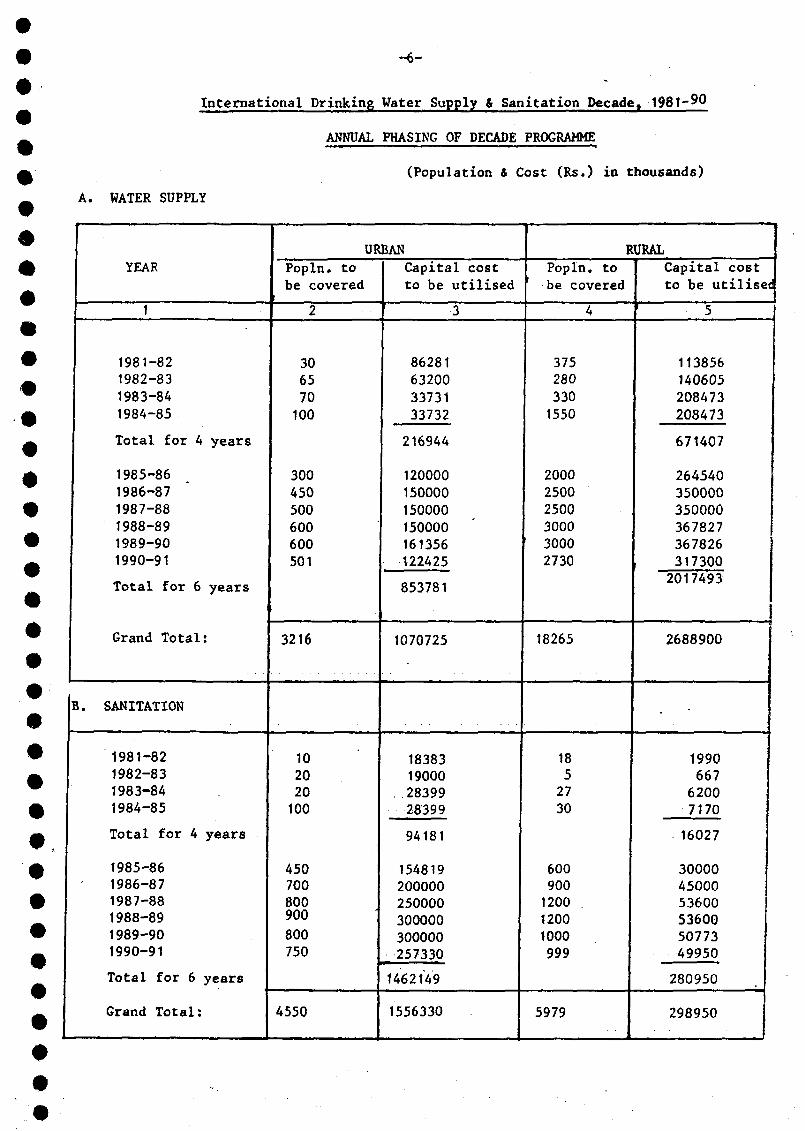
-6-
Interaational Drinking Water Supply & Sanitation Decade, 1981^90
ANNUAL PHASING OF DECADE PROGRAMME
A. WATER SUPPLY
(Population 4 Cost (Rs.) in thousands)
YEARURBAN
PopIn. tobe covered
Capital costto be utilised
RURALPopIn. tobe covered
Capital costto be utilisée
#
1981-821982-831983-841984-85
Total for 4 years
1985-861986-871987-881988-891989-901990-91
Total for 6 years
Grand Total:
306570100
300450500600600501
3216
86281632003373133732
216944
120000150000150000150000161356122425
853781
1070725
3752803301550
200025002500300030002730
18265
113856140605208473208473
671407
2645403500003500003678273678263173002017493
2688900
B. SANITATION
1981-821982-831983-841984-85
Total for 4 years
1985-861986-871987-881988-891989-901990-91
Total for 6 years
Grand Total:
102020100
450700800900800750
4550
18383190002839928399
94181
154819200000250000300000300000257330
1462149
1556330
1852730
600900120012001000999
5979
1990667
62007170
16027
300004500053600536005077349950
280950
298950
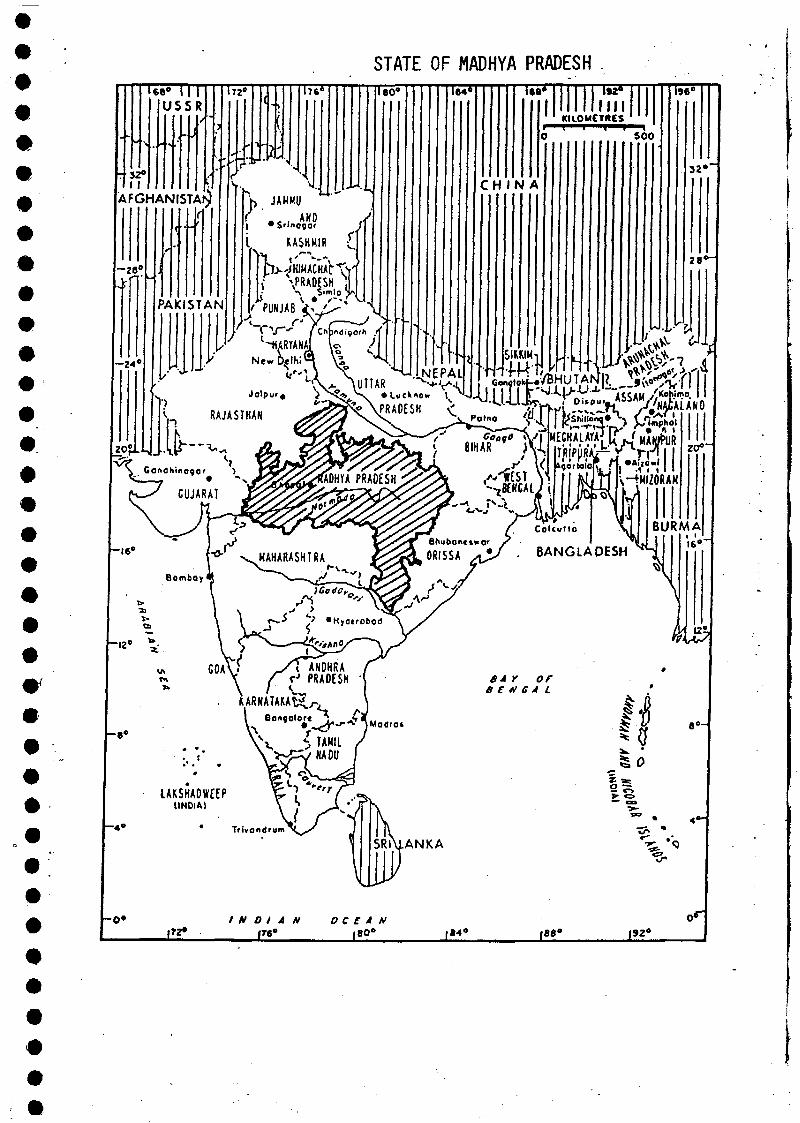
STATE OF MADHYA PRADESH
m •+3Z-' " s
AFGHANISTAN
Cb-jHWACHAbTi \PRADESH S
\-tHIZORAH
r> PRADESH '
Bangalore *; > ï
192»
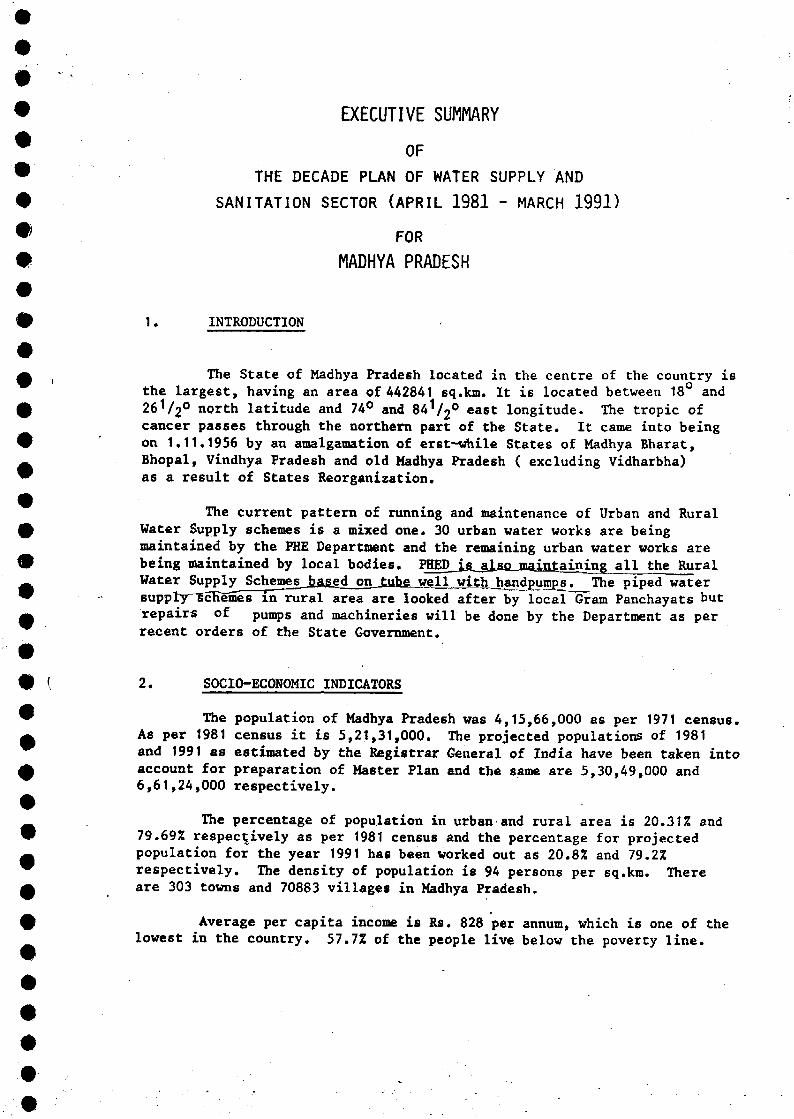
EXECUTIVE SUMMARYOF
THE DECADE PLAN OF WATER SUPPLY AND
SANITATION SECTOR (APRIL 1981 - MARCH 1991)
FORMADHYA PRADESH
1. INTRODUCTION
The State of Madhya Pradesh located in the centre of the country isthe largest, having an area of 442841 sq.km. It is located between 18° and2 6 V 2 0 north latitude and 74° and 841/2° east longitude. The tropic ofcancer passes through the northern part of the State. It came into beingon 1.11.1956 by an amalgamation of erst-while States of Madhya Bharat,Bhopal, Vindhya Pradesh and old Madhya Pradesh ( excluding Vidharbha)as a result of States Reorganization.
The current pattern of running and maintenance of Urban and RuralWater Supply schemes is a mixed one. 30 urban water works are beingmaintained by the PHE Department and the remaining urban water works arebeing maintained by local bodies. PHED js_ alsjLjnaintaining all the RuralWater Supply Schemes_jjajged on_^ibe__well_with handpumps. The piped watersupply~gcK€mès in rural area are looked after by local~Gram Panchayats butrepairs of pumps and machineries will be done by the Department as perrecent orders of the State Government.
2. SOCIO-ECONOMIC INDICATORS
The population of Madhya Pradesh was 4,15,66,000 as per 1971 census.As per 1981 census it is 5,21,31,000. The projected populations of 1981and 1991 as estimated by the Registrar General of India have been taken intoaccount for preparation of Master Plan and the same are 5,30,49,000 and6,61,24,000 respectively.
The percentage of population in urban and rural area is 20.31% and79.69% respectively as per 1981 census and the percentage for projectedpopulation for the year 1991 has been worked out as 20.8% and 79.2%respectively. The density of population is 94 persons per sq.km. Thereare 303 towns and 70883 villages in Madhya Pradesh.
Average per capita income is Rs. 828 per annum, which is one of thelowest in the country. 57.7% of the people live below the poverty line.
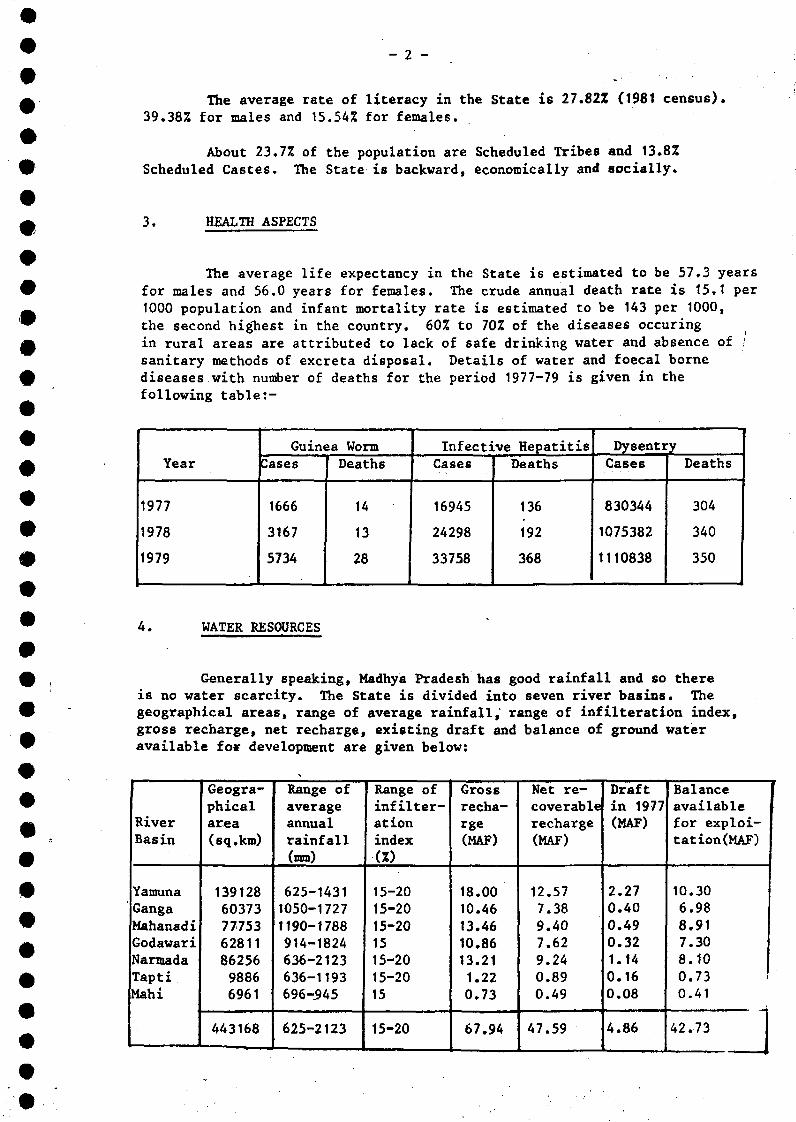
- 2 -
The average rate of literacy in the State is 27.82Z (1981 census),39.38% for males and 15.54% for females.
About 23.7% of the population are Scheduled Tribes and 13.8%Scheduled Castes. The State is backward, economically and socially.
3. HEALTH ASPECTS
The average life expectancy in the State is estimated to be 57.3 yearsfor males and 56.0 years for females. The crude annual death rate is 15.1 per1000 population and infant mortality rate is estimated to be 143 per 1000,the second highest in the country. 60% to 70% of the diseases occuringin rural areas are attributed to lack of safe drinking water and absence of /sanitary methods of excreta disposal. Details of water and foecal bornediseases with number of deaths for the period 1977-79 is given in thefollowing table:-
Year
1977
1978
1979
Guinea WormCases
1666
3167
5734
Deaths
1 4 •
13
28
Infective HepatitisCases
16945
24298
33758
Deaths
136
192
368
DysentryCases
830344
1075382
1110838
Deaths
304
340
350
4. WATER RESOURCES
Generally speaking, Madhya Pradesh has good rainfall and so thereis no water scarcity. The State is divided into seven river basins. Thegeographical areas, range of average rainfall, range of infilteration index,gross recharge, net recharge, existing draft and balance of ground wateravailable for development are given below:
RiverBasin
•
YamunaGangaMahanadiGodawariNarmadaTaptiMahi
Geogra-phicalarea(sq.kra)
1391286037377753628118625698866961
443168
Range ofaverageannualrainfall(mm)
625-14311050-17271190-1788914-1824636-2123636-1193696-545
625-2123
Range ofinfilter-ationindex(%)
15-2015-2015-201515-2015-2015
15-20
Grossrecha-rge(MAF)
18.0010.4613.4610.8613.211.220.73
67.94
Net re-coverablerecharge(MAF)
12.577.389.407.629.240.890.49
47.59
Draftin 1977(MAF)
2.270.400.490.321.140.160.08
4.86
Balanceavailablefor exploi-tât ion (MAF)
10.306.988.917.308.100.730.41
«.„ 1
The gross recharge in all the river basins of Madhya Pradesh is0 of the order of 67.94 MAF/Year. The present rate of ground water exploitation
in all the river basins (based on the figure for year 1977) is of the order9 of 4.86 MAF/Year. Thus a balance of 42.73 MAF of exploitable ground water^ is available for future development as the recoverable net recharge is worked f• • . out at 47.59 MAF/Year. j
9 fm 5. STATUS OF WATER SUPPLY AND SANITATION AS ON 31.3.1981 [
9M Water Supply Coverage (Urban)
A There are 303 urban towns out of which 186 towns had been coveredwith water supply facilities, benefitting a population of 70.94 lacs. Now
9 as on 31.3.8.1 protected water supply systems have been extended to 230 townsbenefitting 72.3% of the urban population.
& Water Supply Coverage (Rural)
0 There are 70,883 villages in Madhya Pradesh out of which 27,238problem villages and 195 non-problem villages had been provided with protected
9 water supply upto 31.3.1981, covering rural population of 130.36 lacs.. About 38,000 hand pumps have been installed on tube wells in problem
9 villages uptô~~3T73~T8T; 30.4Z rural population has benefitted from water^ supply facilities.
0 Under the K.F.W. Programme aided by the Government of Germany, 1,625villages will be provided with protected water supply systems, in 3 phases
9 at., a cost of Rs. 60 crores upto June 1985. 483 villages have been taken upin Phase-I costing Rs. 19.07 crores. Agreement to this effect has been
9 : executed with the Government of Germany in December 1981.
Sanitation Coverage (Urban)AI
12 towns have been partially covered with sanitation (partly sewered)9 facilities, benefitting a population of 5.38 lacs upto 31.3.1983. The work
of sanitation in 3 towns has been taken up in Raipur, Bilaspur and Bhopal9 (augmentation).
^ Sanitation Coverage (Rural)
No significant work has been done so far in Rural Sanitation Sector.
9 6. SECTOR ORGANISATION
9£ The Public Health Engineering Department is responsible for execution
of all urban and rural water supply and sanitation schemes in the State.0 However, the current system of operation and maintenance is a mixed one, some
water supply schemes are maintained by local municipal bodies and several by
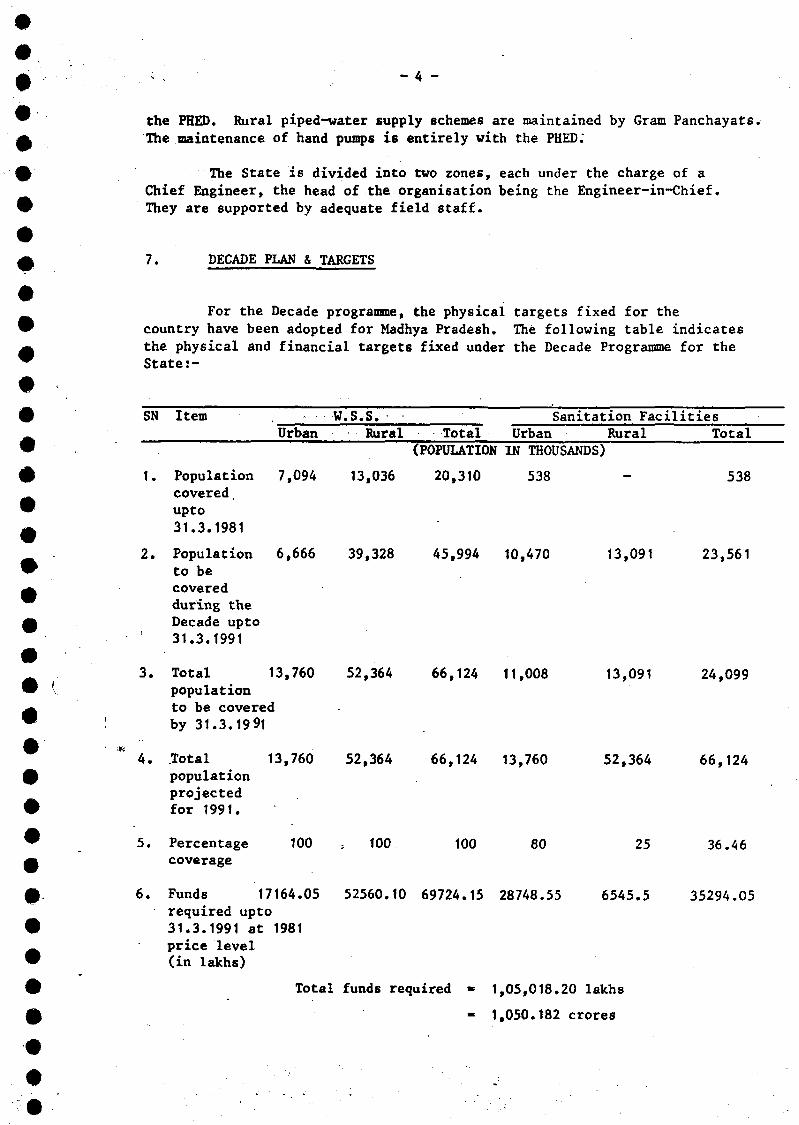
- 4 -
the PHED. Rural piped-water supply schemes are maintained by Gram Panchayats.The maintenance of hand pumps is entirely with the PHED.
The State is divided into two zones, each under the charge of aChief Engineer, the head of the organisation being the Engineer-in-Chief.They are supported by adequate field staff.
7. DECADE PLAN & TARGETS
For the Decade programme, the physical targets fixed for thecountry have been adopted for Madhya Pradesh. The following table indicatesthe physical and financial targets fixed under the Decade Programme for theState:-
SN Item W.S.S. Sanitation FacilitiesUrban Rural Total Urban Rural Total
1. Population 7,094 13,036 20,310covered,upto31.3.1981
(POPULATION IN THOUSANDS)
538
2. Population 6,666 39,328to becoveredduring theDecade upto31.3.1991
3. Total 13,760 52,364populationto be coveredby 31.3.1991
4. Total 13,760 52,364populationprojectedfor 1991.
5. Percentagecoverage
100 100
45,994 10,470
66,124 11,008
66,124 13,760
100 80
13,091
13,091
52,364
25
6545.56. Funds 17164.05 52560.10 69724.15 28748.55required upto31.3.1991 at 1981price level(in lakhs)
Total funds required - 1,05,018.20 lakhs
- 1,050.182 crores
538
23,561
24,099
66,124
36.46
35294.05
8. DECADE PROGRAMME FUNDING
In the Vlth Plan there is a provision of only Rs. 191.32 croresincluding Rs. 44.82 crores in the Central Sector. During the first year ofthe plan which ended before the beginning of Decade Programme i.e. 1980-81.Rs. 49.69 crores were spent and we are left with only Rs. 141.63 croresfor Phase-I of the Decade Plan.
Looking to this meagre provision in the Vlth Plan, a large amountwill be required in Vllth Plan period amounting to Rs.822.082 crores andin the first year of the VHIth Plan, Rs. 86.47 crores. This will requirea large mobilisation effort. The village community and urban populationshould be involved in the implementation as well as in operation andmaintenance of the schemes. In this way some people's participation in theshape of labour, money or materials, may be taken.
Maximum utilization of internal aiding agencies like HUDCO, LIC orSocial Organizations will be done.
External aiding agencies like KFW, DANIDA, SIDA, JAPAN, UNICEF andWORLD BANK will also be approached for giving aid.
9. SUPPORT PROGRAMMES
Operation and Maintenance
The State is facing great difficulty in operation and maintenance- of Urbanand Rural Water Supply Schemes. Budgetary jupport from non-plan sources isinadequate. Local bodies have to~raise adequate~ïë1îoîiïa§s~~ror~ô~peration andrtailieehahce. Gram Panchayats should similarly take up maintenance byraising revenues.
Higher delegation to lower administrative levels should be done toensure quicker decisions.
It is proposed to have some refresher and training courses intechnical institutions like Polytechnics and Industrial Training Institutesfor the staff required in operation and maintenance of Water Supply andSanitation Schemes.
There is generally shortage of certain essential materials, like pipes,specially C.I. Pipes, cement, steel, quality hand pumps (India Mark II).These will have to be arranged as per requirements of the Decade programmealongwith railway wagons and road transport.
Intersectoral coordination
. Coordination has to be ensured with other Departments which arealso doing some development works in rural areas under Rural DevelopmentProg-ammes. Government have already taken a decision that whenever anyirrigation project is prepared, a provision for the requirement of drinkingwater should also be made with the consultation of Public Health
Engineering Department,
- 6 -
Health Education and Community Participation
Health education will be done by means of cinema shows, slideprojectors, hand bills and posters, etc. so that people will know theimportance of protected water supply. The motivation of the community is alsonecessary so that the community is involved from planning stage tomaintenance stage. Peoples1 participation will also be encouraged duringDecade Plan.
Control & Monitoring of Decade Programme
Monitoring Cell has already been opened in the Head Office ofthe PHED ^~and onè superintendirig"jËngïneer has been made incharge of thisCeTTT""This Cell will control and keep watch on the Decade Programme.Apart from this, high level committees have been formed. Decade Committeehas been formed with Chief Minister of the State as the Chairman. ApexCommittee has also been formed at State level for controlling the Decadeprogramme.
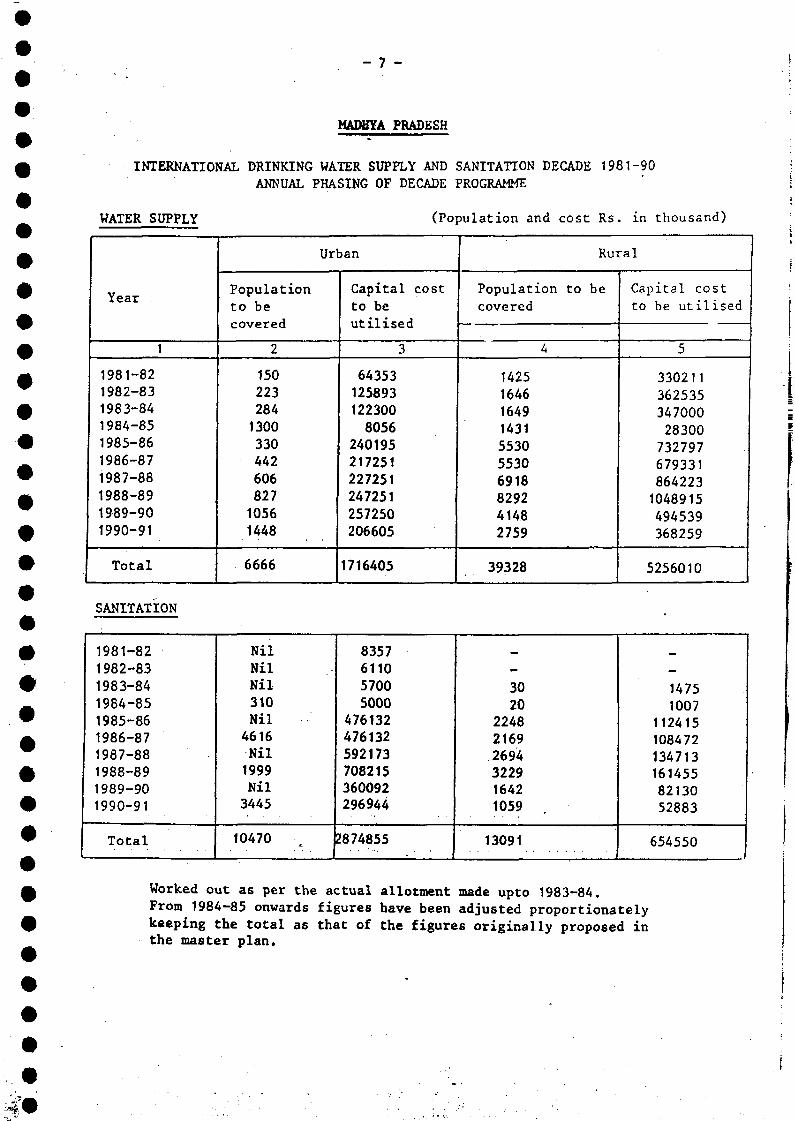
- 7 -
MADHÏA PRADESH
INTERNATIONAL DRINKING WATER SUPPLY AND SANITATION DECADE 1581-90
ANNUAL PHASING OF DECADE PROGRAMME
WATER SUPPLY
i ear
1
1981-821982-831983-841984-851985-861986-87
1987-88
1988-891989-90
1990-91
Total
Populationto becovered
2
1502232841300
33044260682710561448
6666
Urban
Capitalto beutilised
3
643531258931223008056
240195217251227251247251257250206605
1716405
(Population and
cost Populationcovered
A
142516461649
143155305530
69188292
41482759
39328
cost Rs . in thousand)
Rural
to be Capital costto be utilised
5
330211
36253534700028300
7327976793318642231048915494539368259
5256010
SANITATION
1981-82
1982-831983-841984-851985-861986-871987-88
1988-891989-901990-91
Total
NilNilNil310Nil
4616
Nil1999
Nil3445
10470
8357611057005000
476132476132
592173708215360092296944
2874855
—
3020
224821692694
322916421059
13091
14751007
112415108472
1347131614558213052883
654550
Worked out as per the actual allotment made upto 1983-84.From 1984-85 onwards figures have been adjusted proportionatelykeeping the total as that of the figures originally proposed inthe master plan.
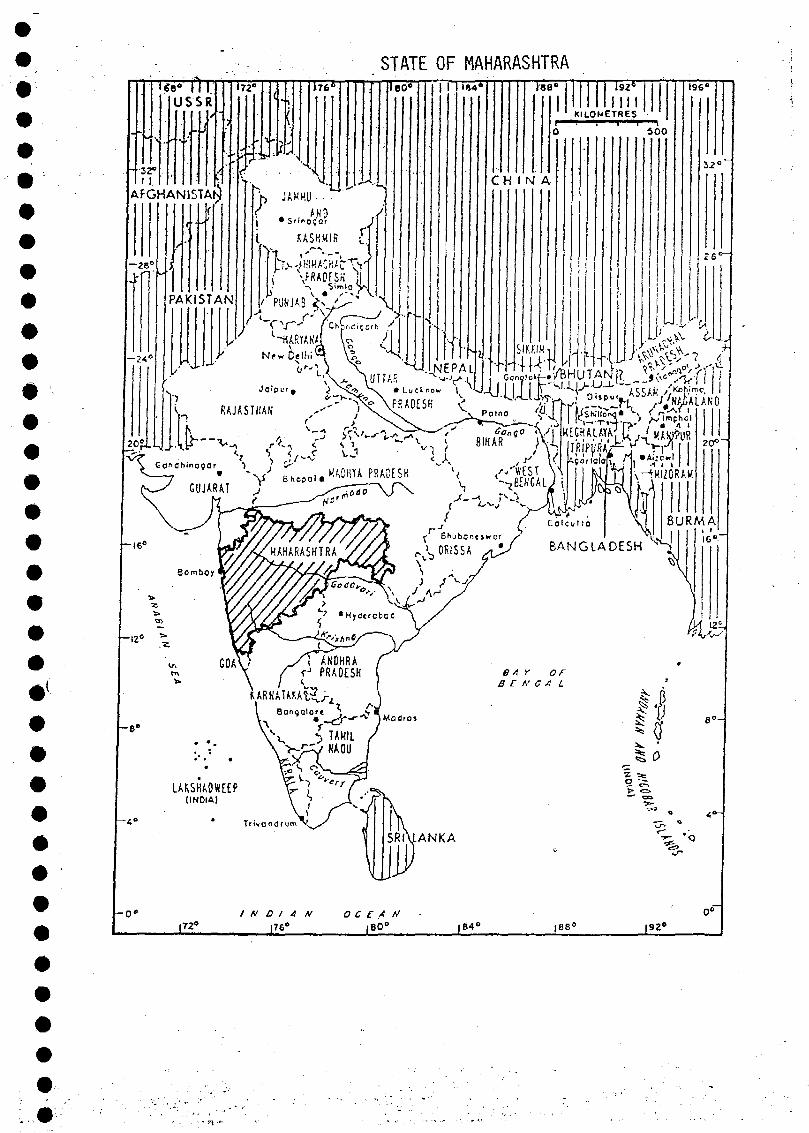
STATE OF MAHARASHTRA'««" M l .
- 32»
AFGHANISTAN
-z&'
-24'
20
172e
PAKISTAN
176 û
VfiADfSKSimla
loo«
\
1 I >«4 108 s 192°III!
KILOMETRES
C H I N A
6 0 0
196e
3-Z°
2 6 *
V SAfirAKfl o / V jLUvv eld
, p J> N«W .M4 % s^.j 1 «... w J L ^ - , UJk^-7 iV • J0ie. : r# V ^ S v .Ludno» I ^ J J l I I ] I P ^ M > ^ ^ AISAX ^ ™ « . ' '
j ^"^^XoXpRADESK C" "^•UV.r!->,-.' O l i |""H 'JjKt-hUKd
. y RAJA S THAN ^ y \ S L ^ N ^ l ^ - J > > lf<shill0"4' S Jvt^oi
^""•". V.C.«•"««««s. A /''ÉLÏÏiiraî-i™B'«
Bomboy «
MAHARASHTRA rvb OfilSSA BANGLADESHVI
./,/ w /
<' ' «Hytfcrctiai:
\
GOA\ /KDHRAPRAOESH
URNATAKAt?
8A r orB E N G A L
^-ri.Bançolort
. V TAHIL
--V TMcflros
LAKSHAOWEEP{INDIA)
' s v ^ ;•> - - * r /
.•>>
Trivo nd rvm
SRIUANKA
-o«Jl!l
I N D I A N
[76°OCEAN
|80° f 84" 188° IS28
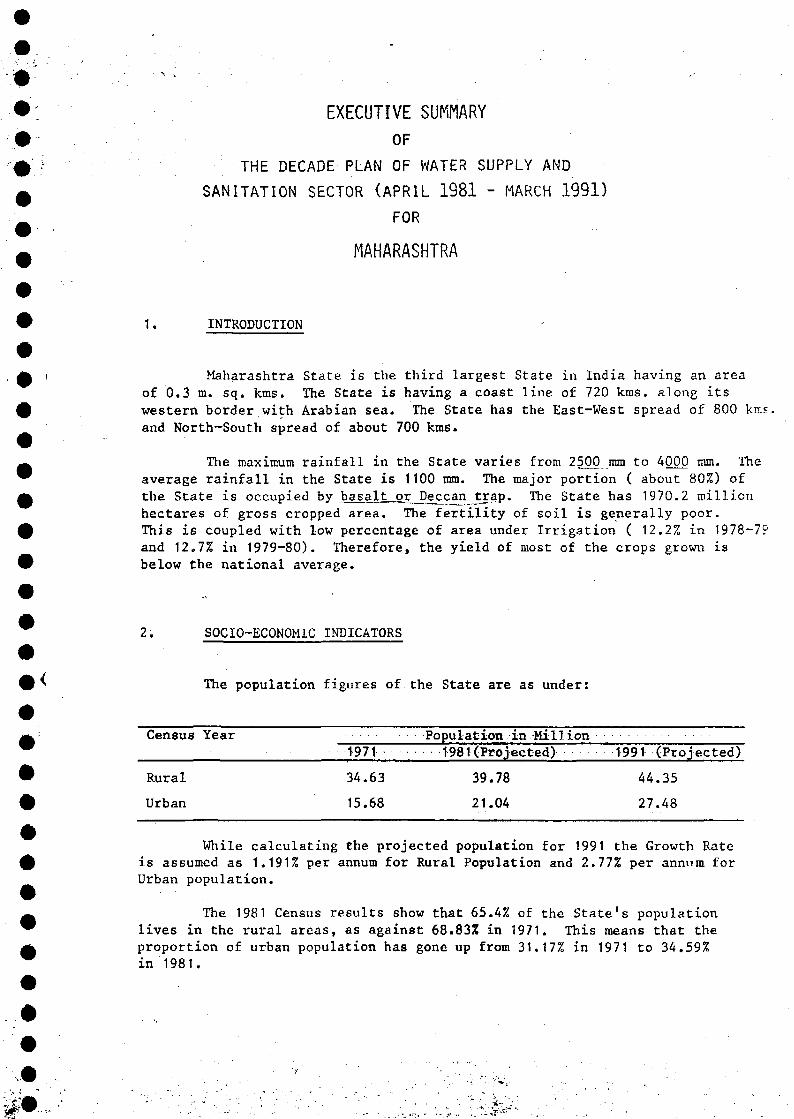
EXECUTIVE SUMMARYOF
THE DECADE PLAN OF WATER SUPPLY ANDSANITATION SECTOR {APRIL 1981 - MARCH 1991)
FOR
MAHARASHTRA
1. INTRODUCTION
Maharashtra State is the third largest State in India having an areaof 0.3 m. sq. kms. The State is having a coast line of 720 kms. along itswestern border with Arabian sea. The State has the East-West spread of 800 krcs.and North-South spread of about 700 kms.
The maximum rainfall in the State varies from 2§00 mm to 4000 mm. Theaverage rainfall in the State is 1100 mm. The major portion ( about 80%) ofthe State is occupied by basalt or_Deccan tjrap. The State has 1970.2 millionhectares of gross cropped area. The fertility of soil is generally poor.This is coupled with low percentage of area under Irrigation ( 12.2% in 1978-7?and 12.7% in 1979-80). Therefore, the yield of most of the crops grown isbelow the national average.
Z. SOCIO-ECONOMIC INDICATORS
The population figures of the State are as under:
Census Year Population in Million
- 1971 1981(Projected) 1991 (Projected)
Rural 34.63 39.78 44.35
Urban 15.68 21.04 27.48
While calculating the projected population for 1991 the Growth Rateis assumed as 1.191% per annum for Rural Population and 2.77% per annum forUrban population.
The 1981 Census results show that 65.4% of the State's populationlives in the rural areas, as against 68.83% in 1971. This means that theproportion of urban population has gone up from 31.17% in 1971 to 34.59%in 1981.
*-:
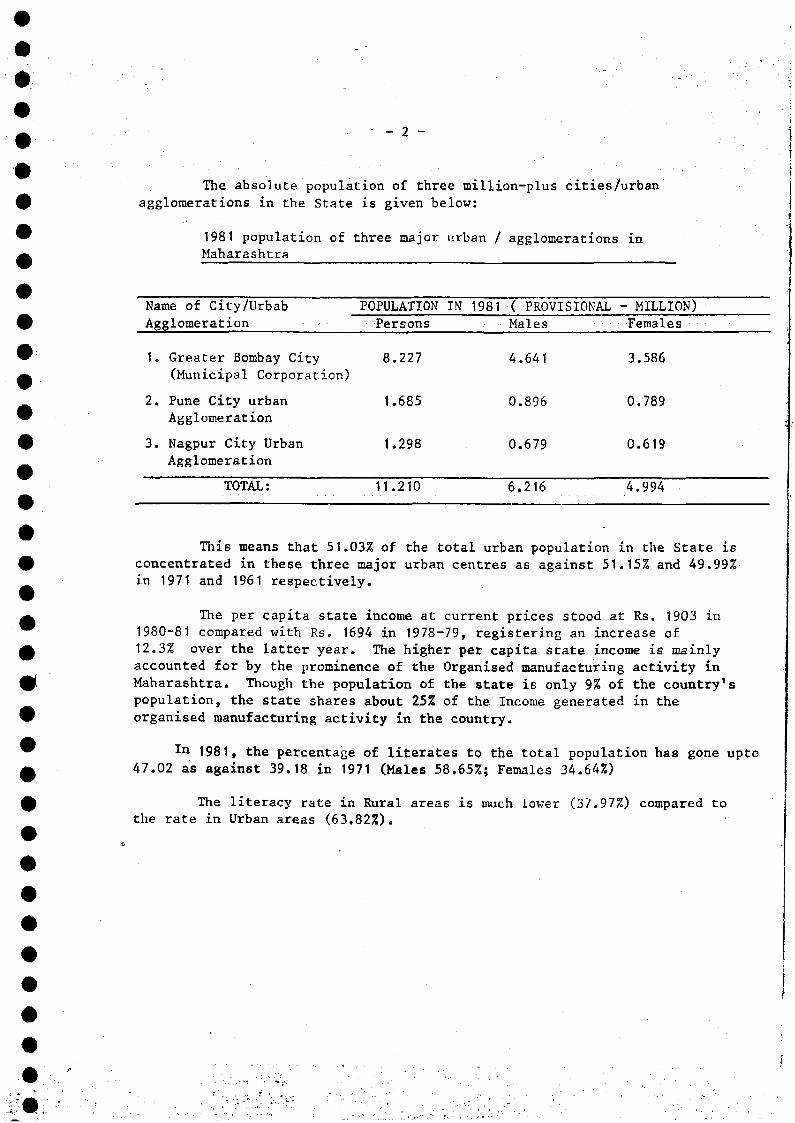
Males
4.641
0.896
0.679
Females
3.586
0.789
0.619
•• - 2 -
The absolute population of three million-plus cities/urbanagglomerations in the State is given below:
1981 population of three major urban / agglomerations inMaharashtra
Name of City/Urbab POPULATION IN 1981 •(• PROVISIONAL - MILLION)Agglomeration - Persons
1. Greater Bombay City 8.227(Municipal Corporation)
2. Pune City urban 1.685Agglomeration
3. Nagpur City Urban 1.298Agglomeration
~~ TOTAL: 11.210 "67216 4.994
This means that 51.03% of the total urban population in the State isconcentrated in these three major urban centres as against 51.15% and 49.99%in 1971 and 1961 respectively.
The per capita state income at current prices stood at Rs. 1903 in1980-81 compared with Rs. 1694 in 1978-79, registering an increase of12.3% over the latter year. The higher per capita state income is mainlyaccounted for by the prominence of the Organised manufacturing activity inMaharashtra. Though the population of the state is only 9% of the country'spopulation, the state shares about 25% of the Income generated in theorganised manufacturing activity in the country.
In 1981, the percentage of literates to the total population has gone upto47.02 as against 39.18 in 1971 (Males 58.65%; Females 34.64%)
The literacy rate in Rural areas is much lower (37.97%) compared tothe rate in Urban areas (63.82%).
- 3 -
3. HEALTH ASPECTS
The life expectancy in the State has increased from 51 years in 1966to about 58 years in 1979 as against the Ali India figure of 52.1. Thebirth rate in the State was 28.70 per 1000 population and death rate due toall causes was 9.60 per 1000 population in the year 1980.
The incidence of water borne diseases is given in the following table:-
1978
1979
1980
Cholera
1674
3711
1758
Gastro-Entritis
16,174
26,505
18,580
Infective Hepatitis Guinea worir.
43,087
40,465
34,865
N.A.
1951
2737
The infant mortality rate in the State has fallen from 100 per 1000live births in 1966 to 81 in 1980.
4. WATER RESOURCES
The total surface water potential of the State at 95% dependabilityworks out to about 67.77 TMC. The total supply requirement of domestic andnon-domestic, including industrial, uses for the State has been estimatedat 8.08 TMC for the projected population in 2011.
As per the 3rd Assessment of Ground Water Potential in the Statecarried out by the Ground Water Survey and Development Agency, the NetGround Water Recharge in the State is about 1 TMcum. Out of this 0.2 T Mcumis withdrawn and 0.8 T Mcum is in balance. From this balance quantity ofGround Water Potential, it is anticipated that 1851920 Nos. of irrigationWells are feasible.
On the question of Ground Water Potential, opinions differ. Althoughthe Ground Water Potential indicated as above appears to be encouraging, theexperience on the basis of tube wells drilled under rural drinking watersupply programme shows that out of 26427 wells drilled the successful tubewells are reported to be of the order 15787 (supply more than 1000 lph) . Thepercentage of successful wells works out to be around 64.5 only. Therefore,a more critical examination of Ground Water Source would be necessary fromtime to time.
5. PRESENT STATUS OF WATER SUPPLY & SEWERAGE
Urban Water Supply: There are 225 municipal towns in MaharashtraState with 1981 projected population of 21.04 millions. Out of these, nine
- 4 -
towns have municipal corporations, while the rest 216 towns have municipalcouncils of different grades to look after the civic affairs. All the ninecorporations and 200 Municipal Councils (out of 216) had piped water supplysc hemes as on 3.1st March 1981. The average rate of water supply wasobserved to be 135 litres per capita per day. Population served, as on31st March 1981, is 20.87 millions and thus the coverage of urban drinkingwater facility is 99.19%.
During the Decade an additional population of 6,614 million would becovered by new schemes under this sector. In addition 10.90 million wouldbe covered by augmentation schemes.
Rural Water Supply: The details of villages in Maharashtra Stateand their water supply position as on 31st March 1981 is as under:
Total No. Popul- No. of Problem/Difficultof inha- ation Villagesbited (lacs) G.0.1.norms/G.P.M.normsvillages No. Pop. No. Pop.
Total DifficultVillages
No. Pop.(lacs)
1971 32926(Census)
1981(Projected)
Covered upto 392631.3.1981
To be covered 29000as oh 31.3.1991
1990 (projected 32926population tobe covered)
346.32 14025 167.56 4177 42.54 18202 216.10
397.83
76.34
(19.19%) 1090 9.9
321.49 12935 157.66 4177 48.54 17112 l 206.20
367.14
The physical target for rural water supply is 100% coverage of ruralpopulation (7.634 +32.149 +4.565) = 44;340 millions.
Urban Sanitation: Out of 225 municipal towns in Maharashtra State,only 14 towns have full/partial facilities of sanitation as on 31st March 81.Schemes are in progress in other 6 towns. The population served as on 31stMarch 1981 with sanitation facilities was 8.414 million and the percentage ofpopulation coverage is about 40%.
w • . _ 5 - . . .
• • • : ' . . - : : " • . • • • • • : . . • • ' • ; • • :
A The physical target for the new and augmentation sanitation schemesis as under:
a) New Schemes - Urban sanitation for 137 towns is proposed to0! be taken up during the -Decade programme having_j a population of 13.572 millions.
A b) Augmentation - 90% of benefitted population (projected 1981) as. Schemes on 31st March 1981 i.e. 7.5-73 millions.
Rural Sanitation: None of the villages is provided with adequate0 sanitation facilities as on 31st March 1981.
9 The physical target for rural sanitation is 25% of the projected 1990A rural population i.e. 11.087 millions. In villages only low cost water seal
latrines will be constructed.
# 6. SECTOR ORGANISATION
•
A At the State level, the work under the sector is controlled jointly™ by the Urban Development and Rural Development Departments with the assistancef of the Departments of Planning and Finance. The following agencies are
entrusted with the implementation of this programme in the field:
a) Urban: (Under the control of Urban Development Department)9 Maharashtra Water Supply and Sewerage Board.
9 b) Rural:
9 (i) Ground Water Survey and[ Development Agency
. (ii) Zilla Parishads, Panchayat Samities and VillageAt Panchayat s.
0 Each one of these agencies have organisation to deal with the works
entrusted to it.
^ 7# DECAPE TARGET POPULATION COVERAGE
A Urban Water Supply:
0 (a) New: The population to be covered for new Schemes during the Decac;is 6.614 millions.
& (b) Augmentation: The population proposed to be covered for~ Augmentation Schemes during the Decade is 10.9 millions. The coverage isA 50% of benefitted population. The details are as under:
- 6 -
5 Corporation
20 A Class Towns
34 B Class Towns
33 C Class Towns
7.7 Millions
2.0 Millions
1.0 Millions
0.2 Millions
92 TOTAL 10.9 Millions
Rural Water Supply:
The villages proposed to be covered during the Decade are 31852having a total population of 36.714 Millions in 25 district. The prioritieswould be observed as described elsewhere in the report.
Urban Sanitation:
New: The Urban Sanitation that will be covered during the Decade willbe as under:
Sewerave Schemes: 29 Towns having population of 11.48 Millionswill be provided with Sewerage and Sewage Treatment facilities. The remaining108 towns having a population of 2.092 Millions will be provided with low costSanitation facilities.
Augmentation Schemes: Augmentation Schemes of sanitation will beprovided for each town having a population iliore than 0.1 Million and this willbe provided for 25 towns having a population of 7.573 Millions.
Rural Sanitation:
Low cost sanitation facilities will be provided to 16137 villageshaving a population of 11.087 Millions.
8. DECADE PROGRAMME FUNDING
An estimation (at 1980-81 cost) of the requirements of funds, duringthe Decade for achieving the desired target has been made as under:-
a. Urban Water Supplyb. Urban Sanitationc. Rural Water Supplyd. Rural Sanitation
Total:
Rs. 3856 MillionsRs. 5565 MillionsRs. 6327 MillionsRs. 554 Millions
Rs. 16302 Millions
,'•"?••-.•;
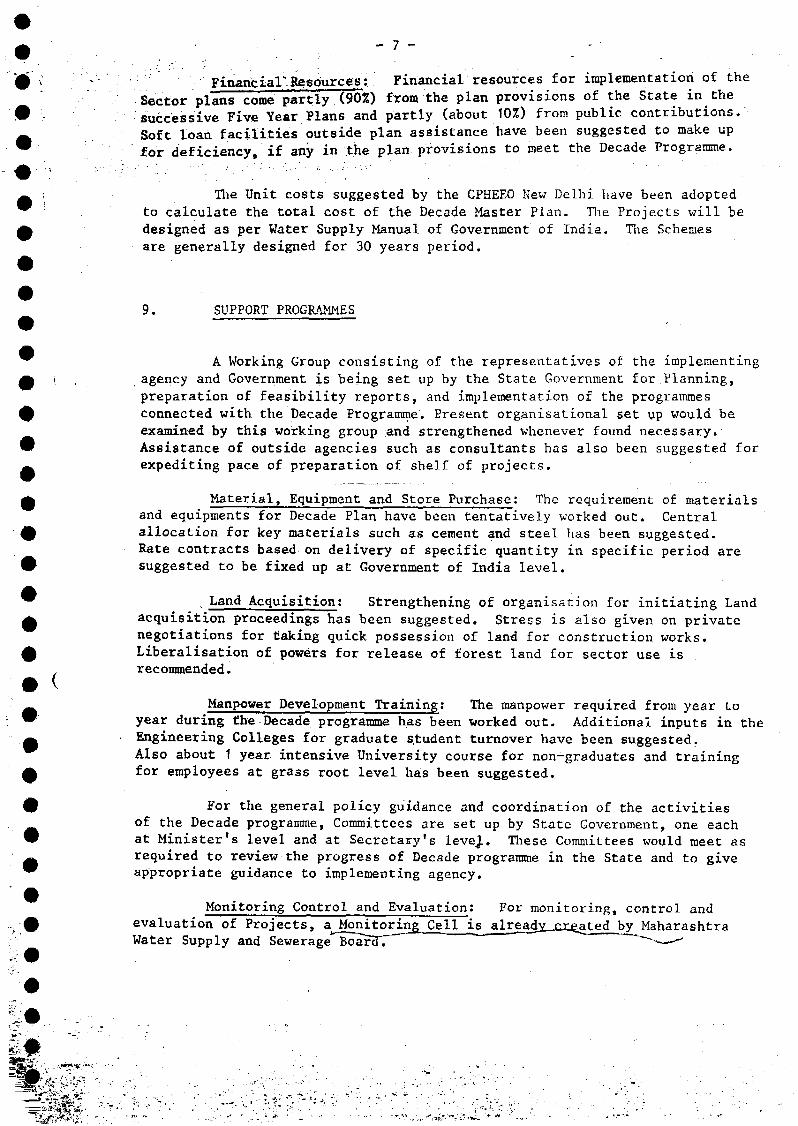
_ 7 — -
; Financial Resources: Financial resources for implementation of theSector plans come partly (90Z) from the plan provisions of the State in thesuccessive Five Year Plans and partly (about 10%) from public contributions.Soft loan facilities outside plan assistance have been suggested to make upfor deficiency, if any in the plan provisions to meet the Decade Programme.
The Unit costs suggested by the CPHEEO New Delhi have been adoptedto calculate the total cost of the Decade Master Plan. The Projects will bedesigned as per Water Supply Manual of Government of India. The Schemesare generally designed for 30 years period.
9. SUPPORT PROGRAMMES
^ A Working Group consisting of the representatives of the implementing
A i , agency and Government is being set up by the State Government for Planning,
preparation of feasibility reports, and implementation of the programmes£ connected with the Decade Programme. Present organisational set up would be
examined by this working group and strengthened whenever found necessary.w Assistance of outside agencies such as consultants has also been suggested for_ expediting pace of preparation of shelf of projects.
f Material, Equipment and Store Purchase: The requirement of materialsand equipments for Decade Plan have been tentatively worked out. Central
0 allocation for key materials such as cement and steel has been suggested.Rate contracts based on delivery of specific quantity in specific period are
0 suggested to be fixed up at Government of India level.
^ . Land Acquisition: Strengthening of organisation for initiating Land£ acquisition proceedings has been suggested. Stress is also given on private
negotiations for taking quick possession of land for construction works.0 Liberalisation of powers for release of forest land for sector use is
, recommended.
• (
_ Manpower Development Training: The manpower required from year to™ year during the Decade programme has been worked out. Additional inputs in the^ Engineering Colleges for graduate student turnover have been suggested.
Also about 1 year intensive University course for non-graduates and training0 for employees at grass root level has been suggested.
£ For the general policy guidance and coordination of the activitiesof the Decade programme, Committees are set up by State Government, one each
W at Minister's level and at Secretary's level. These Committees would meet as_ required to review the progress of Decade programme in the State and to give^ appropriate guidance to implementing agency.
Monitoring Control and Evaluation: For monitoring, control and
0 evaluation of Projects, a Monitoring^ Cell is alreadv_xxeated by MaharashtraWater Supply and Sewerage*~Boarcn ~~"-—-"
Information system: The Maharashtra Water Supply and SewerageBoard has already opened 4 Investigation Units, one Monitoring Cell and 7Project Divisions to collect information on progress of planning andimplementation of Urban and Rural Water Supply and Sewerave Schemes in theS t a t e . " "''•''•-' ' ' . ' ' ' . ' " " . ' ; ' '. ' . ' • • . ' • •
c
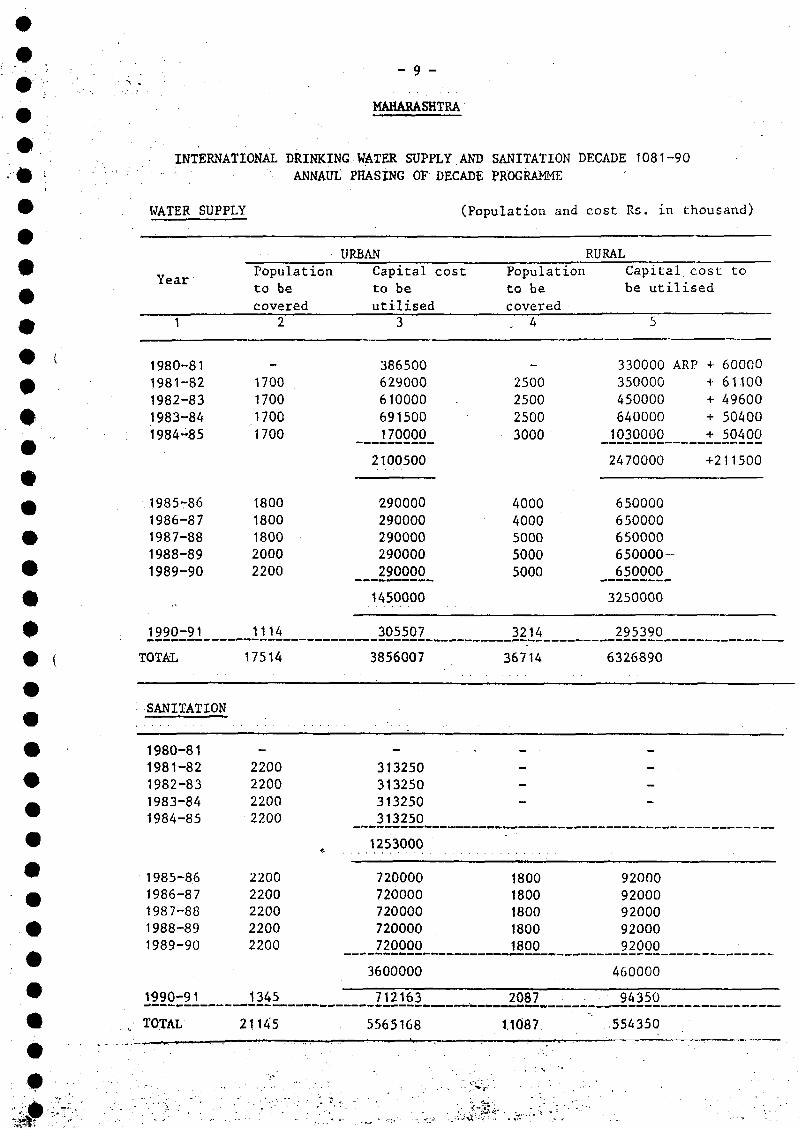
- 9 -
MAHARASHTRA
INTERNATIONAL DRINKING WATER SUPPLY AND SANITATION DECADE 1081-90ANNAUt PHASING OF DECADE PROGRAMME
WATER SUPPLY
V s 3 rI63.IT
1
1980-811981-821982-831983-841984-85
.1985-861986-871987-881988-891989-90
1990-91
TOTAL
SANITATIOK
1980-811981-821982-831983-841984-85
1985-861986-871987-881988-891989-90
1990-91
TOTAL
Populationto becovered
2
1700170017001700
18001800180020002200
1114
17514
I
—
2200220022002200
22002200220022002200
1345
21145
URBANCapitalto beutilised
3
386500629000610000691500170000
2100500
29000029000029000029000029OOOO_
1450000
305507
3856007
_
313250313250313250313250
1253000
720000720000720000720000720000
3600000
712163
5565168
(Population and
cost Populationto becovered, 4
.
2500250025003000
40004000500050005000
3214
36714
--_
18001800180018001800
2087
1.1087
cost Rs. in thousand)
RURALCapital cost tobe utilised
5
330000 ARP + 60000350000 + 61100450000 + 49600640000 + 504001030000 + 50400
2470000 +211500
650000650000650000650000-
__6500O0_
3250000
295390
6326890
—--
9200092000920009200092000
460000
94350
""..554350
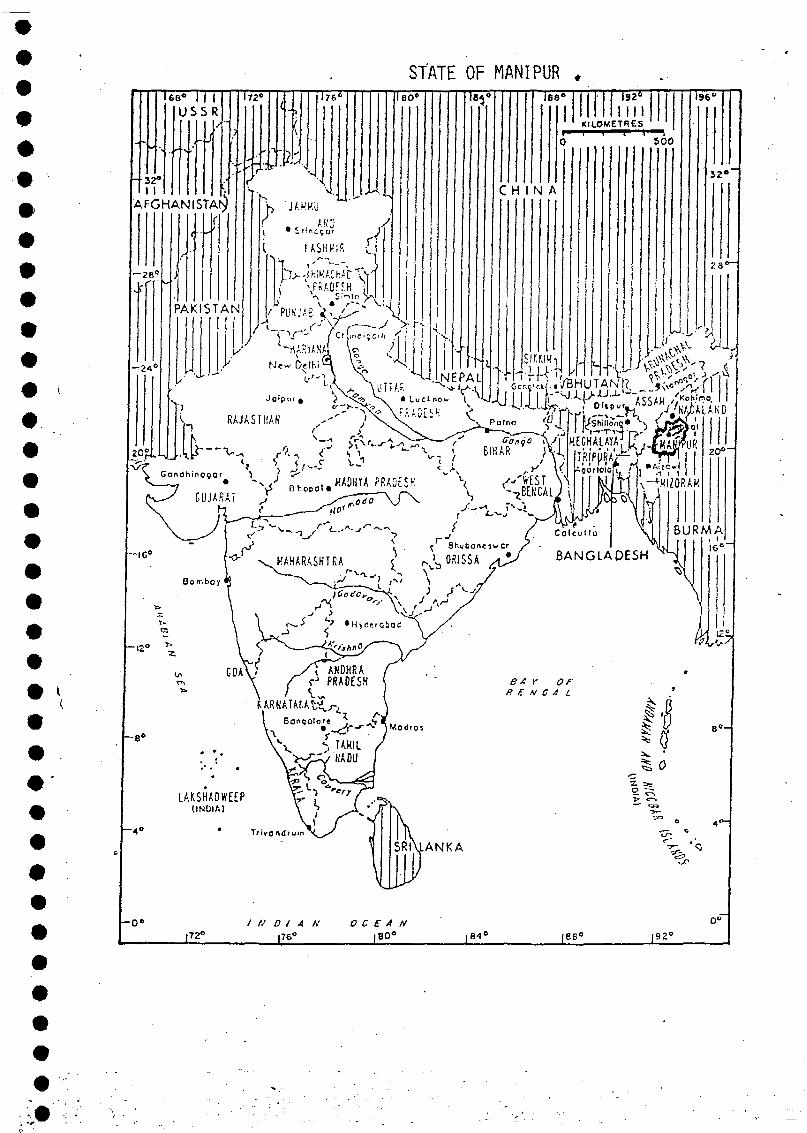
STATE OF MANIPUR •
EXECUTIVE SUMMARYOF
THE DECADE PLAN OF WATER SUPPLY ANDSANITATION SECTOR (APRIL 1981 - MARCH 1991)
FOR
MANI PUR
1. INTRODUCTION
The State of Manipur is located in the eastern most corner cf Indiaand is a completely land-locked State having an area of 22356 sq.km.
Prior to the out-break of Cholera in the State sometime in 1901, thepeople of the state depended on river water, community ponds and privateponds. The loss of life in that epidemic compelled the State Government toinstall a water supply scheme for Imphal Town in 1913 for a population of40000 heads at 5 gpcd and supply was limited a few priveledged people and afew public standposts. This scheme continued to cater drinking water to theTown until commissioning of 3.2 mgd plant in 1965. This schemes is stillcontinuing to supply water to the town populace and during the Vth & VlthFive Year Plans this has been gradually augmented to 6.2 mgd as in March 83 ,a 4 mgd augmentation scheme is in progress at the moment.
As for Rural, upto the end of the IVth plan, no attention was givento take up rural schemes and only in the Vth Plan, a beginning was made.Thus, out of 1280 problem villages only 68 villages could be covered duringthe Vth Plan and as on 3/83, as many as 512 villages have been covered.
Manipur borders with Burma over a stretch of 352 km. in the east,Nagaland in the North, Assam in the West and Mizoram in the South. Rows ofrolling hills cover 90% of the area of this State surrounding in the heartland. In fact, for years together the sole life-line communication for theState has been National Highway 39 connecting Imphal the capital city withthe rail-head at Dimapur in Nagaland. It continues to be so though a newlink road connects Silchar in Assam by the new Kutcha Road.
Summer is hot and dry in the Central Plain and comparatively coolin the hilly regions; winters are cold in the Central Plain and severely coldin the hill regions. Temperature varies from 0°C to 35CC. The averageannual rainfall in 1500 mm. with more concentration in the hills There isplenty of water during the monsoon but very little during dry season asmost of our schemes depend on river sources which normally either dry upor dwindle down to the minimum. Thus, Rural water supply problem is verydifficult in nature and there are very little ground water sources.
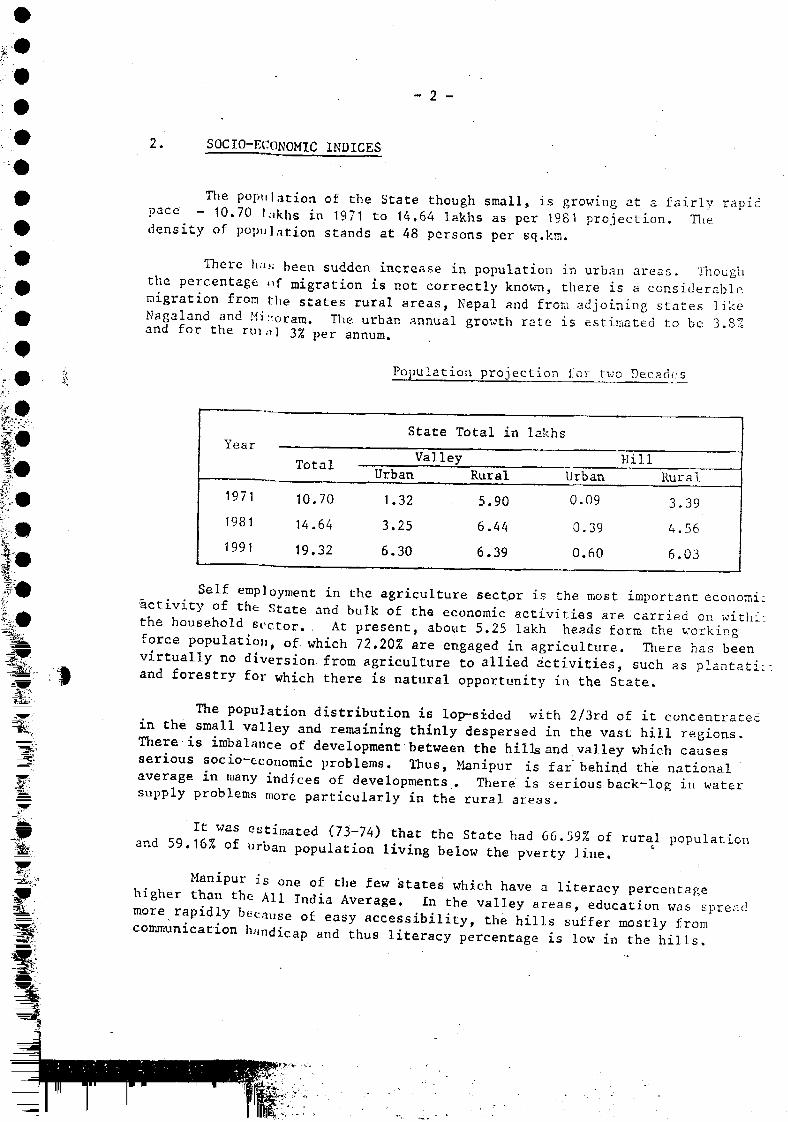
- 2 -
2. SOCIO-ECONOMIC INDICES
The population of the State though small, is growing at a fairly rspi;pace _ 10.70 l;)khs in 1971 to 14.64 lakhs as per 1981 projection. Thedensity of population stands at 48 persons per sq.kra.
There h;u; been sudden increase in population in urban areas. Thoughthe percentage .if migration is not correctly known, there is a considerablemigration from the states rural areas, Nepal and from adjoining states likeNagaland and Mi .-oram. The urban annual growth rate is estimated to be 3.8%and for the rur.il 3% p e r annum.
Population projection for tv;o Decades
1I
Year
1971
1981
1991
Tof al
10
14
19.
.70
,64
32
State Total in
ValleyUrban Rural
1.32 5.90
3.25 6.44
6.30 6.39
lakhs
Urban
0.09
0.39
0.60
HillRural
3
4
6.
.39
56
03
Self employment in the agriculture sect.pr is the most important economic:y of the State and bulk of the economic activities are carried on with-
—. household sector. At present, about 5.25 lakh heads form the working.orce population, of which 72.20% are engaged in agriculture. There has beenvirtually no diversion from agriculture to allied activities, such as plantât-:-and forestry for which there is natural opportunity in the State.
The population distribution is lop-sided with 2/3rd of it concentratedin the small valley and remaining thinly despersed in the vast hill regions.There is imbalance of development between the hills and valley which causesserious socio-economic problems. Thus, Manipur is far behind the nationalaverage m many indices of developments . There is serious back-log in watersupply problems more particularly in the rural areas.
It wasand 59.16% of p 3 T 7 4 ) t h a t t h e S t ^ e had 66.59% of rural population
population living below the pverty Une.
° n e ° f the f Ê W S t a t e s w h i c h h a v e a literacy percentage
^fa AVeraêe I th U L'T ^ a c c e s s i b i l i t y , the hills suffer mostly from
handicap and thus literacy percentage is low in the hills.
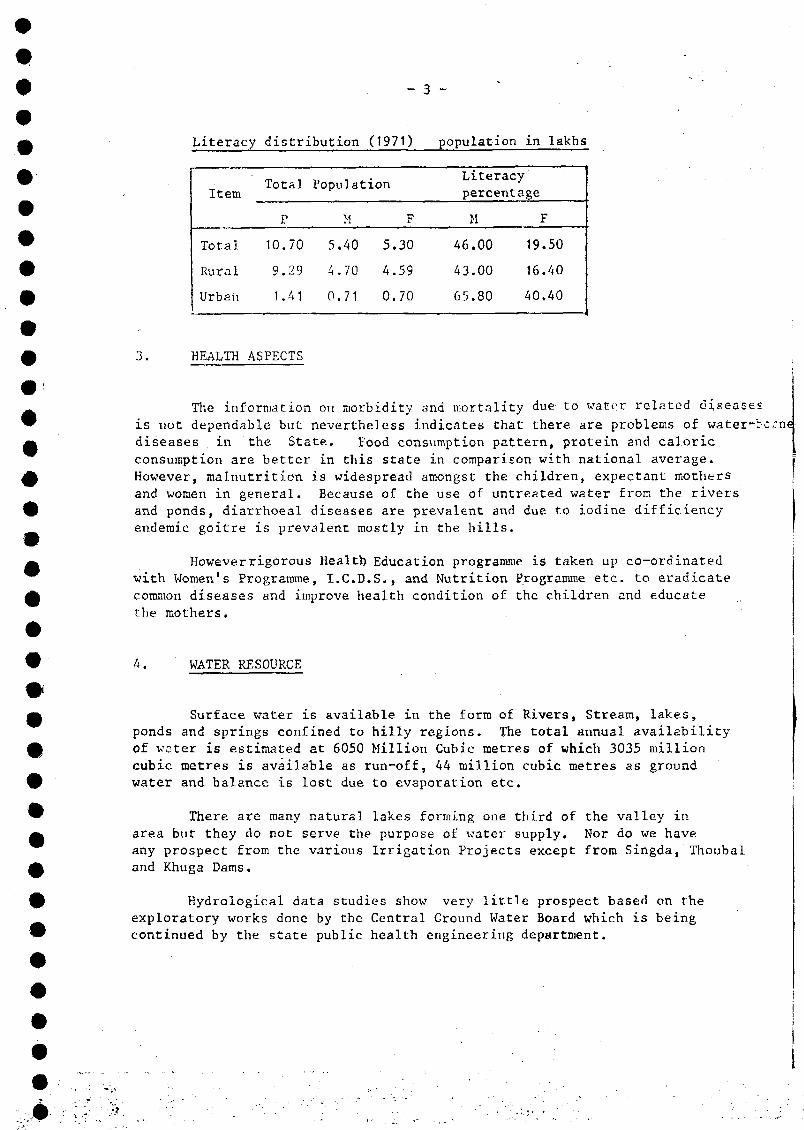
*_ o t*
Literacy distribution (1971) population in lakhs
Item
Total
Rural
Urban
Total
10
9
1
P
.70
.29
.41
Population
5
4
0
M
.40
.70
71
5.
4.
0.
F
30
59
70
Literacypercentage
M
46.00 19
43.00 16
65.80 40
F
.50
.40
.40
3. HEALTH ASPECTS
The information on morbidity and mortality due to water related diseasesis not dependable but nevertheless indicates that there are problems of water-bcrnediseases in the State. Food consumption pattern, protein and caloricconsumption are better in this state in comparison with national average.However, malnutrition is widespread amongst the children, expectant mothersand women in general. Because of the use of untreated water from the riversand ponds, diarrhoeal diseases are prevalent and due to iodine difficiencyendemic goitre is prevalent mostly in the hills.
However rigorous .Health Education programme is taken up co-ordinatedwith Women's Programme, I.C.D.S., and Nutrition Programme etc. to eradicatecommon diseases and improve health condition of the children and educatethe mothers.
4. WATER RESOURCE
Surface water is available in the form of Rivers, Stream, lakes,ponds and springs confined to hilly regions. The total annual availabilityof water is estimated at 6050 Million Cubic metres of which 3035 millioncubic metres is available as run-off, 44 million cubic metres as groundwater and balance is lost due to evaporation etc.
There are many natural lakes forming one third of the valley inarea but they do not serve the purpose of water supply. Nor do we haveany prospect from the various Irrigation Projects except from Singda, Thoubaland Khuga Dams.
Hydrological data studies show very little prospect based on theexploratory works done by the Central Ground Water Board which is beingcontinued by the state public health engineering department.
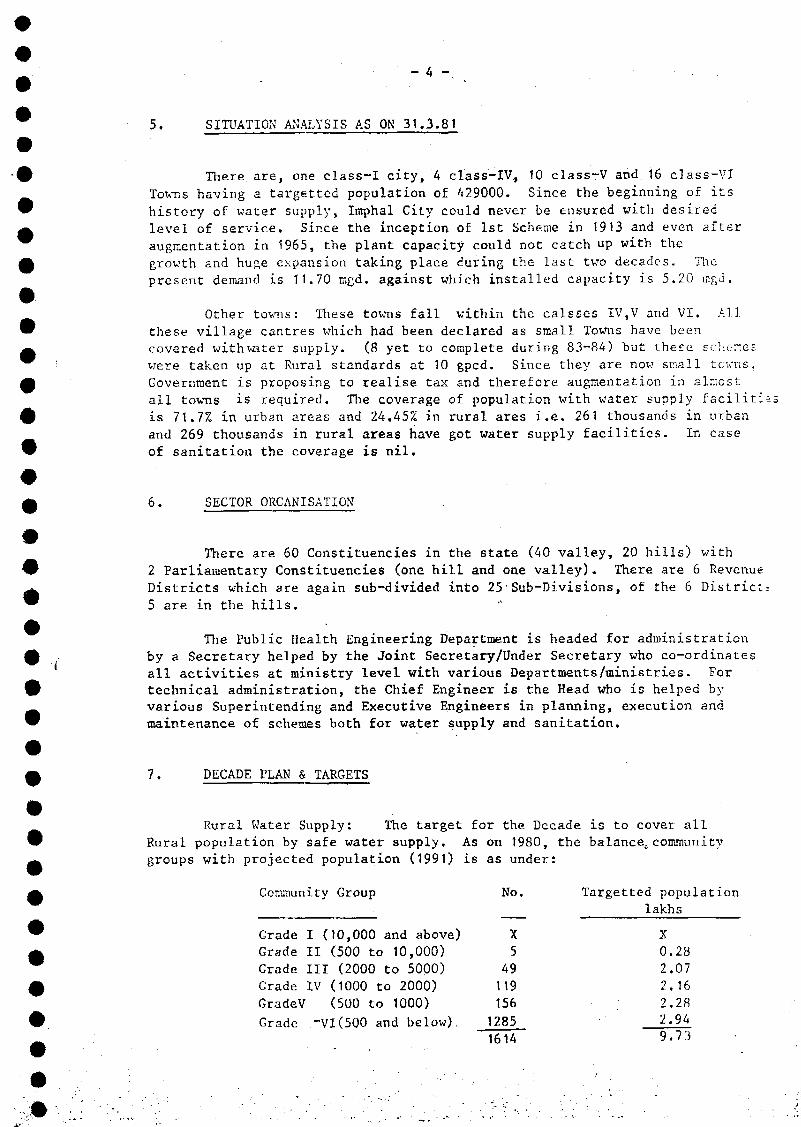
5. SITUATION ANALYSIS AS OK 31.3.81
There are, one class-I city, 4 class-IV, 10 class-V and 16 class-VITowns having a targetted population of 429000. Since the beginning of itshistory of water supply, Imphal City could never be ensured with desiredlevel of service. Since the inception of 1st Scheme in 1913 and even afteraugmentation in 1965, the plant capacity could not catch up with thegrowth and huge expansion taking place during the last two decades. Thepresent demand is 11.70 mgd. against which installed capacity is 5.20 mgd.
Other towns: These towns fall within the caisses IV,V and VI. Allthese village cantres which had been declared as small Towns have beencovered withwater supply. (8 yet to complete during 83-84) but these schemes.were taken up at Rural standards at 10 gpcd. Since they are now small towns.Government is proposing to realise tax and therefore augmentation in almostall towns is required. The coverage of population with water supply facilitiesis 71.7% in urban areas and 24.45% in rural ares i.e. 261 thousands in urbanand 269 thousands in rural areas have got water supply facilities. In caseof sanitation the coverage is nil.
6. SECTOR ORGANISATION
There are 60 Constituencies in the state (40 valley, 20 hills) with2 Parliamentary Constituencies (one hill and one valley). There are 6 RevenueDistricts which are again sub-divided into 25'Sub-Divisions, of the 6 District;5 are in the hills.
The Public Health Engineering Department is headed for administrationby a Secretary helped by the Joint Secretary/Under Secretary who co-ordinatesall activities at ministry level with various Departments/ministries. Fortechnical administration, the Chief Engineer is the Head who is helped byvarious Superintending and Executive Engineers in planning, execution andmaintenance of schemes both for water supply and sanitation.
7. DECADE PLAN & TARGETS
Rural Water Supply: The target for the Decade is to cover allRural population by safe water supply. As on 1980, the balance^communitygroups with projected population (1991) is as under:
Community Group
Grade I (10,000 and above)Grade II (500 to 10,000)Grade III (2000 to 5000)Grade IV (1000 to 2000)GradeV (500 to 1000)Grade "VI(500 and below),,
1614 9.7.-1
No.
X549119156
1285
Targetted populationlakhs
X0.282.072.162.282.94
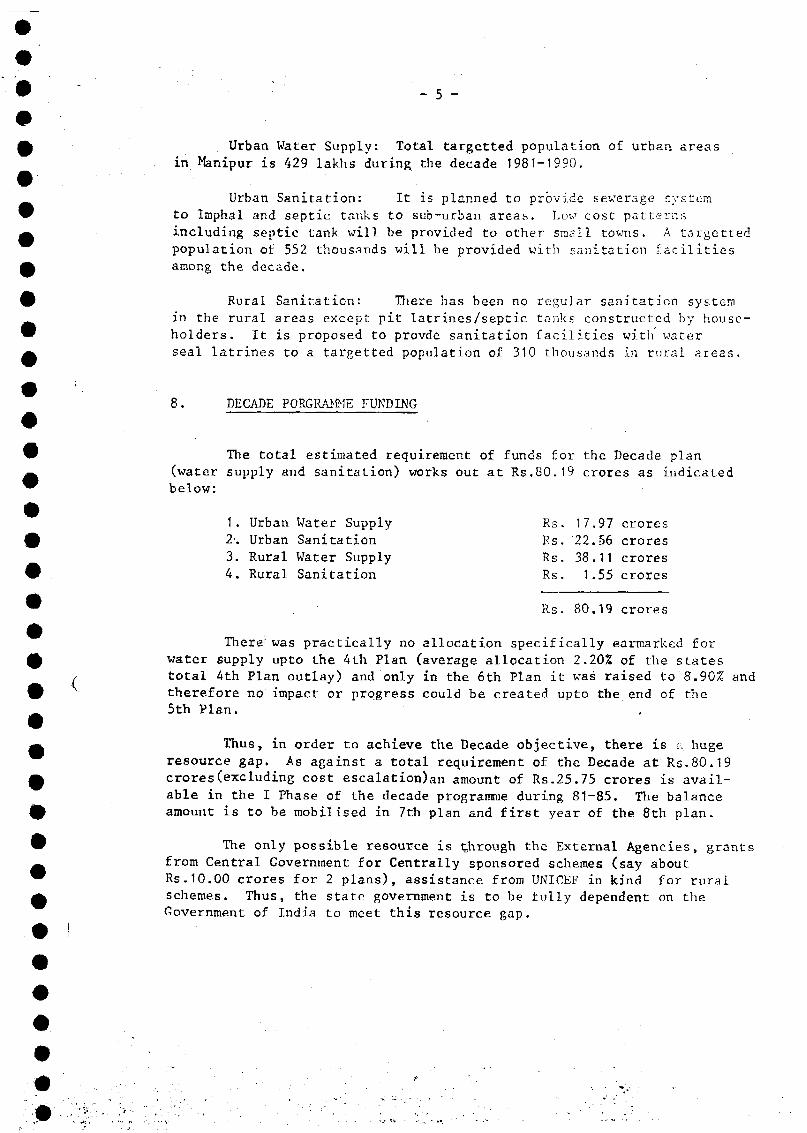
- 5 -
Urban Water Supply: Total targetted population of urban areasin Hanipur is 429 lakhs during the decade 1981-1990.
Urban Sanitation: It is planned to provide sewerage systemto Imph3l and septic tanks to sub-urban areas. Low cost patternsincluding septic tank will be provided to other snail towns. A targettedpopulation of 552 thousands will be provided with sanitation facilitiesamong the decade.
Rural Sanitation: There has been no regular sanitation systemin the rural areas except pit latrines/septic tanks constructed by house-holders. It is proposed to provde sanitation facilities with waterseal latrines to a targetted population of 310 thousands in rural areas.
8. DECADE PORGRAMME FUNDING
The total estimated requirement of funds for the Decade plan(water supply and sanitation) works out at Rs.80.19 crores as indicatedbelow:
1. Urban Water Supply Rs. 17.97 crores2-, Urban Sanitation Rs. 22.56 crores3. Rural Water Supply Rs. 38.11 crores4. Rural Sanitation Rs. 1.55 crores
Rs. 80.19 crores
There' was practically no allocation specifically earmarked forwater supply upto the 4th Plan (average allocation 2.20% of the statestotal 4th Plan outlay) and only in the 6th Plan it was raised to 8.90% andtherefore no impact or progress could be created upto the end of the5th Plan.
Thus, in order to achieve the Decade objective, there is ;; hugeresource gap. As against a total requirement of the Decade at Rs.80.19crores(excluding cost escalation)an amount of Rs.25.75 crores is avail-able in the I Phase of the decade programme during 81-85. The balanceamount is to be mobilised in 7th plan and first year of the 8th plan.
The only possible resource is through the External Agencies, grantsfrom Central Government for Centrally sponsored schemes (say aboutRs.10.00 crores for 2 plans), assistance from UNICEF in kind, for ruralschemes. Thus, the state government is to be fully dependent on theGovernment of India to meet this resource gap.
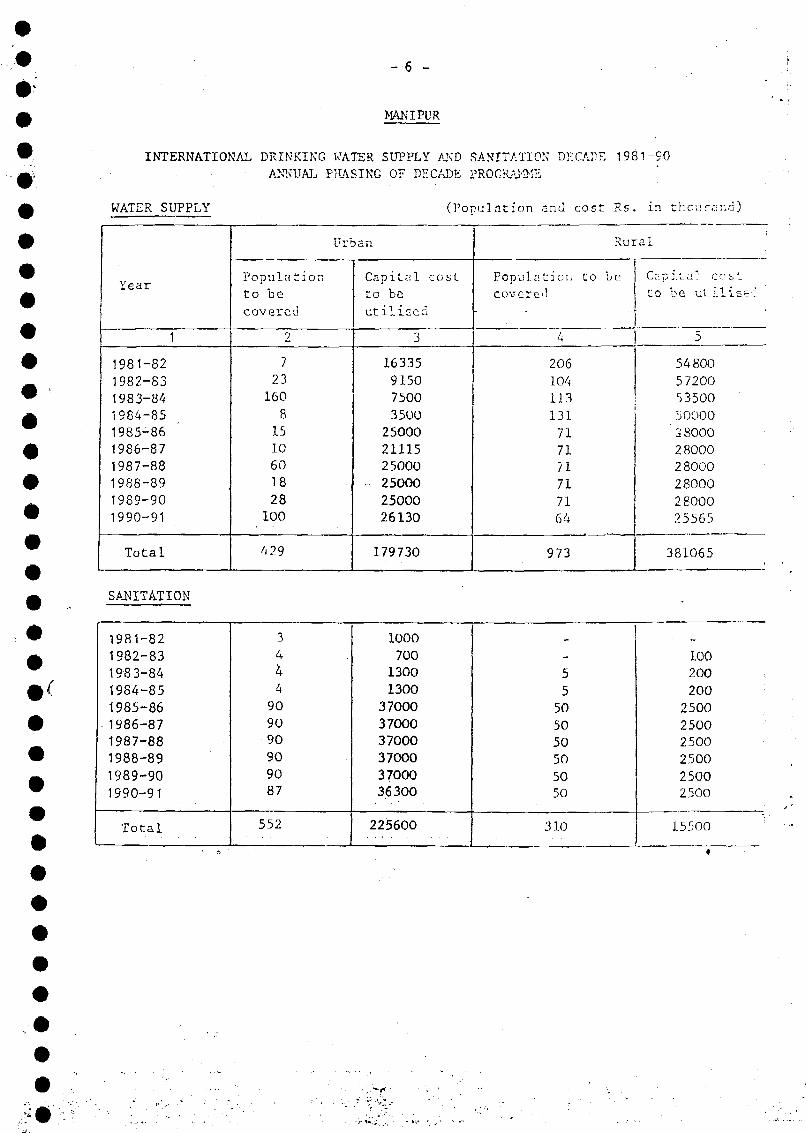
- 6 -
MANIPUR
INTERNATIONAL DRINKING WATER SUPPLY AND SANITATION DECADE 1981-CO
ANNUAL PHASING OF DECADE PROGRAKM2
WATER SUPPLY (Population snd cost Rs. in the;: ranci)
SANITATION
Year
1
1981-821982-831983-841984-851985-861986-871987-881988-891989-90
1990-91
Total
Popula"ionto bocovered
2
723160815106018
28100
429
Urban
Capital costto beut il iced
3
16335915075003500
250002111525000250002500026130
179730
Population to
covered
4
206104
113131717171717164
973
Rural
be Cap if. a] cost
to be utilise;
548005 720053500500002 80002800028000
280002800025565
381065
1981-821982-831983-84
1984-851985-861986-871987-881988-891989-901990-91
Total
3444
909090909087
552
1000700
13001300
370003700037000370003700036300
225600
-55505050505050
310
100200200
250025002500250025002500
15500
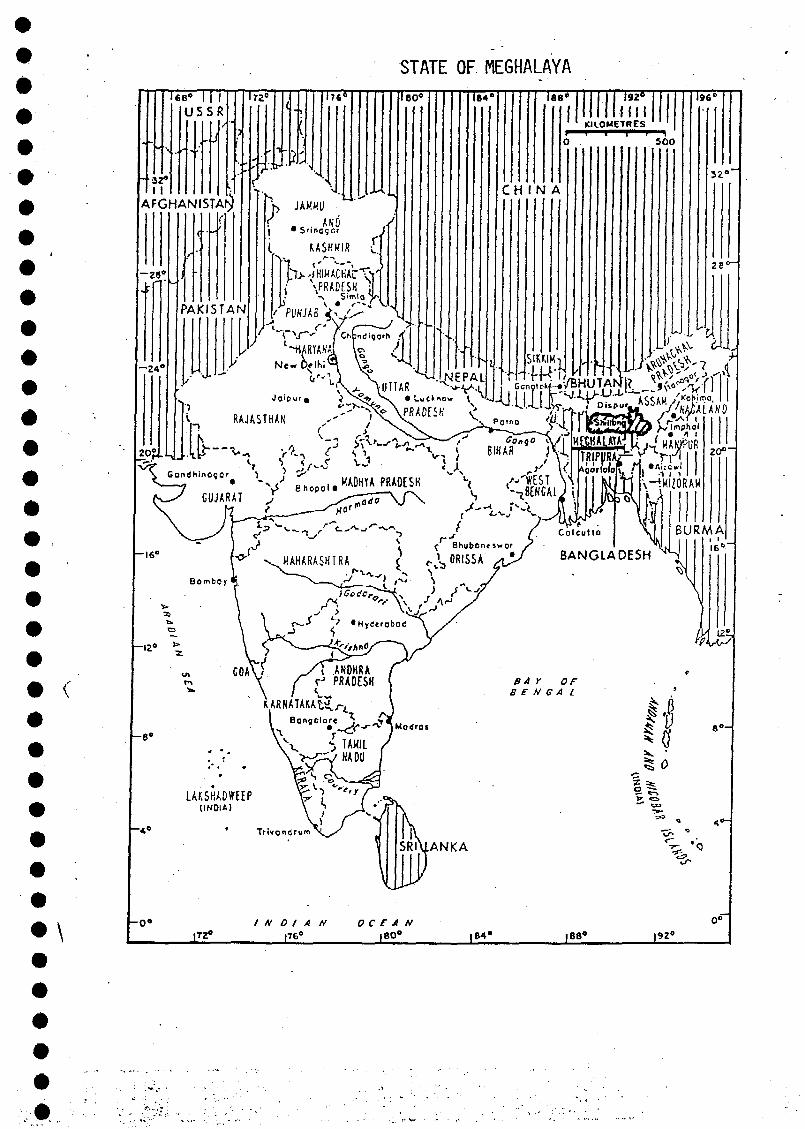
STATE OF MEGHALAYA
192
aKILOMETRES
''I . ,iA F G H A N I S T A N
V , ) 8IHAR - JW
B A N G L A D E S H
AKOHRAPRADESH * OF
B £ N G A L
tAKSKADWEEF(INDIA)
|T2° ,84» 188* 192°
EXECUTIVE SUMMARYOF
THE DECADE PLAN OF WATER SUPPLY ANDSANITATION SECTOR (APRIL 1981 - MARCH 1991)
FOR
MEGHALAYA
1. INTRODUCTION
Meghalaya was formed under the North-Eastern Re-organization Acton 2nd April 1970. Before the creation of the State it was a part of thecomposite State of Assam. During those days, there were very few watersupply schemes. The people.used to get water from the spring sourcesthrough Bamboo pipes etc. Most of the female population used to carrywater from the long distance, thus wasting their valuable time. The yieldof spring sources either used to be insufficient of the springs used todry up altogether during dry period. The Public Health Engineering Wingwas created in Assam in 1954 under Director of Health Services Assam.After the formation of State of Meghalaya with two Districts of Assam, thePublic Health Engineering Wing headed by a Chief Public Health Engineerwas created in Meghalaya on 2nd April 1970. The Public Health EngineeringDepartment was bifureated from PWD in 1972 with the appointment of ChiefPublic Health Engineer.
Since the formation of the State„ Public Health EngineeringDepartment is handling all the water supply and sanitation schemes.The Shillong Municipality is looking after the work of water supply toShillong town.
Meghalaya has a very salibrious climate the Maximum temperaturerarely exceeds 27°C in most of the areas. Mean July temperature ofShillong is 21.18°C. In January the Mean temperature is 9.6°C.
In the Garo Hills Dist. of Meghalaya due to less elevation thesummer temperatures are higher than the Shillong plateau while wintersare not as cold as Jaintia and Khasi.
2. SOCIO-ECONOMIC INDICATORS
The population of Meghalaya in 1971 was 1 011 699 and in 1981was 1 321 000. The decadal variation from 1971-1981 in absolute termswas 309 301.
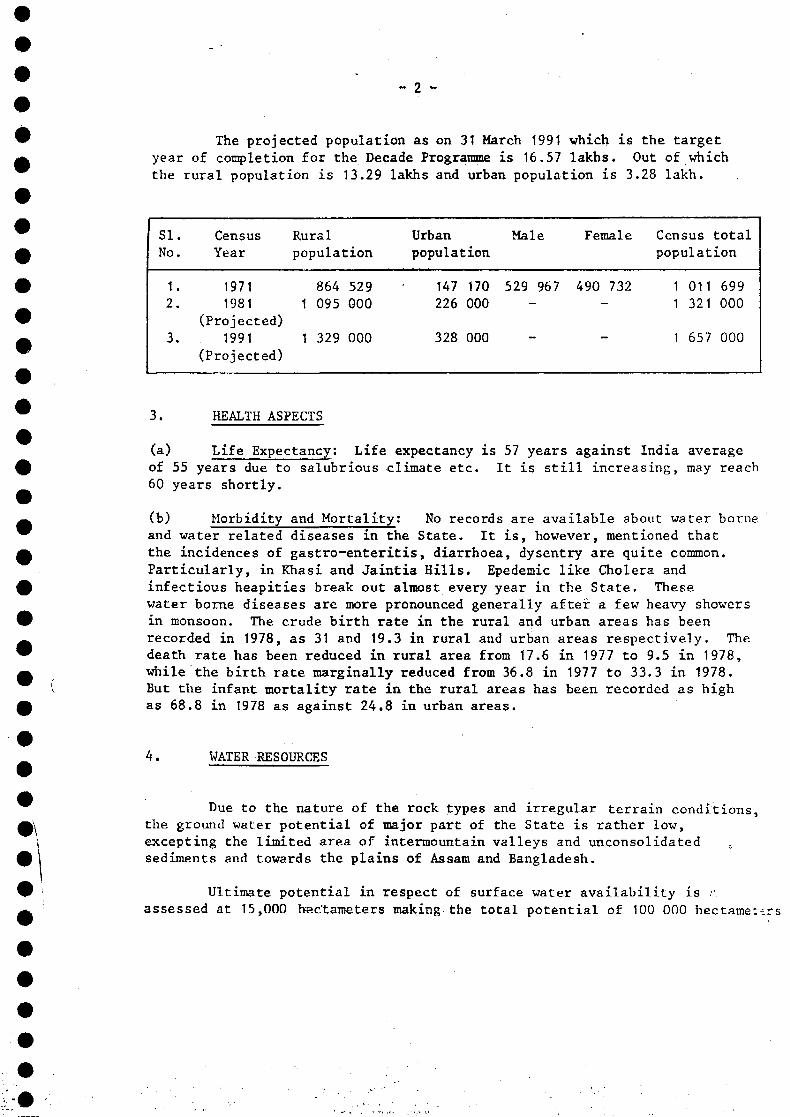
- 2 -
The projected population as on 31 March 1991 which is the targetyear of completion for the Decade Programme is 16.57 lakhs. Out of whichthe rural population is 13.29 lakhs and urban population is 3.28 lakh.
SI.No.
1.2.
3.
CensusYear
19711981
(Projected)
1991(Projected)
Rural
population
8641 095
1 329
529GOO
000
Urbanpopulation
147226
328
170000
000
Male
529 967-
-
Female
490 732-
Census totalpopulation
1 0111 321
1 657
699000
000
3. HEALTH ASPECTS
(a) Life Expectancy: Life expectancy is 57 years against India averageof 55 years due to salubrious climate etc. It is still increasing, may reach60 years shortly.
(b) Morbidity and Mortality: No records are available about water borneand water related diseases in the State. It is, however, mentioned that
the incidences of gastro-enteritis, diarrhoea, dysentry are quite common.Particularly, in Khasi and Jaintia Hills. Epedemic like Cholera andinfectious heapities break out almost every year in the State. Thesewater borne diseases are more pronounced generally after a few heavy showersin monsoon. The crude birth rate in the rural and urban areas has beenrecorded in 1978, as 31 and 19.3 in rural and urban areas respectively. Thedeath rate has been reduced in rural area from 17.6 in 1977 to 9.5 in 1978,while the birth rate marginally reduced from 36.8 in 1977 to 33.3 in 1978.But the infant mortality rate in the rural areas has been recorded as highas 68.8 in 1978 as against 24.8 in urban areas.
4. WATER RESOURCES
Due to the nature of the rock types and irregular terrain conditions,the ground water potential of major part of the State is rather low,excepting the limited area of intermountain valleys and unconsolidatedsediments and towards the plains of Assam and Bangladesh.
Ultimate potential in respect of surface water availability is iassessed at 15,000 hec'tameters making the total potential of 100 000 hectameiirs
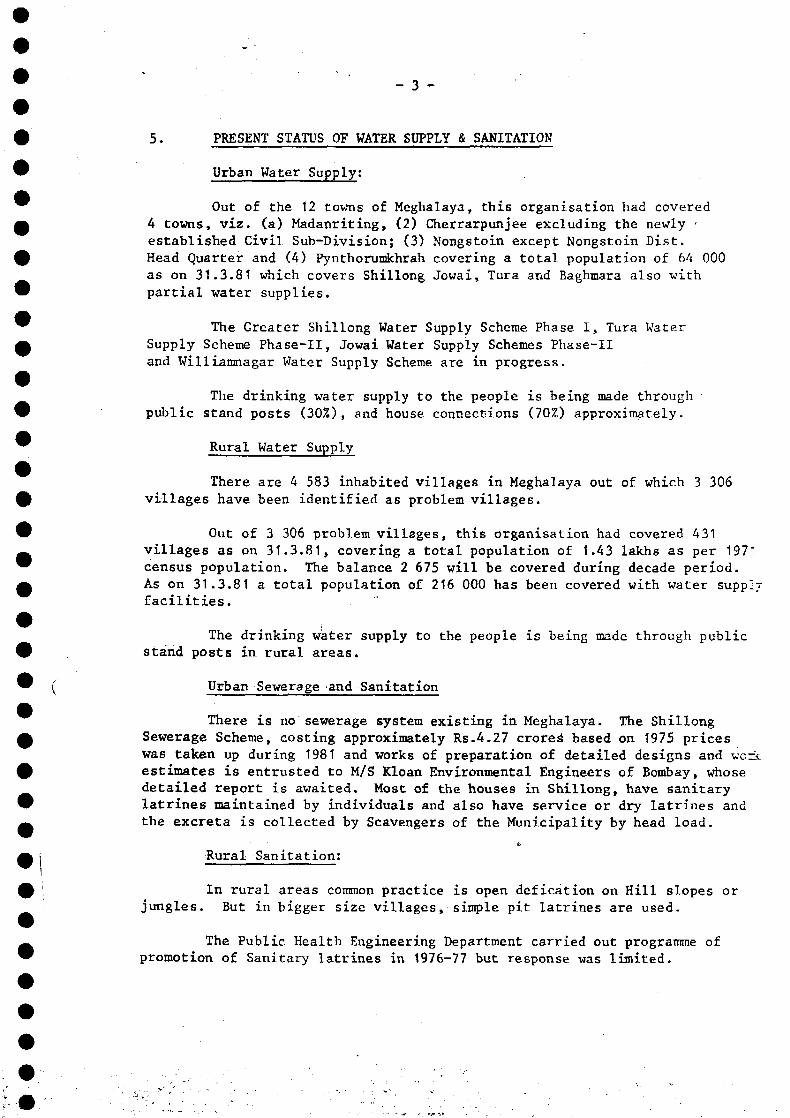
- 3 -
5. PRESENT STATUS OF WATER SUPPLY & SANITATION
Urban Water Supply:
Out of the 12 towns of Meghalaya, this organisation had covered4 towns, viz. (a) Madanriting, (2) Cherrarpunjee excluding the newly 'established Civil Sub-Division; (3) Nongstoin except Nongstoin Dist.Head Quarter and (4) Pynthorumkhrah covering a total population of 64 000as on 31.3.81 which covers Shillong Jowai, Tura and Baghmara also withpartial water supplies.
The Greater Shillong Water Supply Scheme Phase I, Tura WaterSupply Scheme Phase-II, Jowai Water Supply Schemes Phase-IIand Williamnagar Water Supply Scheme are in progress.
The drinking water supply to the people is being made throughpublic stand posts (30%), and house connections (70%) approximately.
Rural Water Supply
There are 4 583 inhabited villages in Meghalaya out of which 3 306villages have been identified as problem villages.
Out of 3 306 problem villages, this organisation had covered 431villages as on 31.3.81, covering a total population of 1.43 lakhs as per 197"census population. The balance 2 675 will be covered during decade period.As on 31.3.81 a total population of 216 000 has been covered with water suppl-facilities.
The drinking water supply to the people is being made through publicstand posts in rural areas.
Urban Sewerage and Sanitation
There is no sewerage system existing in Meghalaya. The ShillongSewerage Scheme, costing approximately Rs.4.27 crores based on 1975 priceswas taken up during 1981 and works of preparation of detailed designs and workestimates is entrusted to M/S Kloan Environmental Engineers of Bombay, whosedetailed report is awaited. Most of the houses in Shillong, have sanitarylatrines maintained by individuals and also have service or dry latrines andthe excreta is collected by Scavengers of the Municipality by head load.
Rural Sanitation:
In rural areas common practice is open defication on Hill slopes orjungles. But in bigger size villages, simple pit latrines are used.
The Public Health Engineering Department carried out programme ofpromotion of Sanitary latrines in 1976-77 but response was limited.
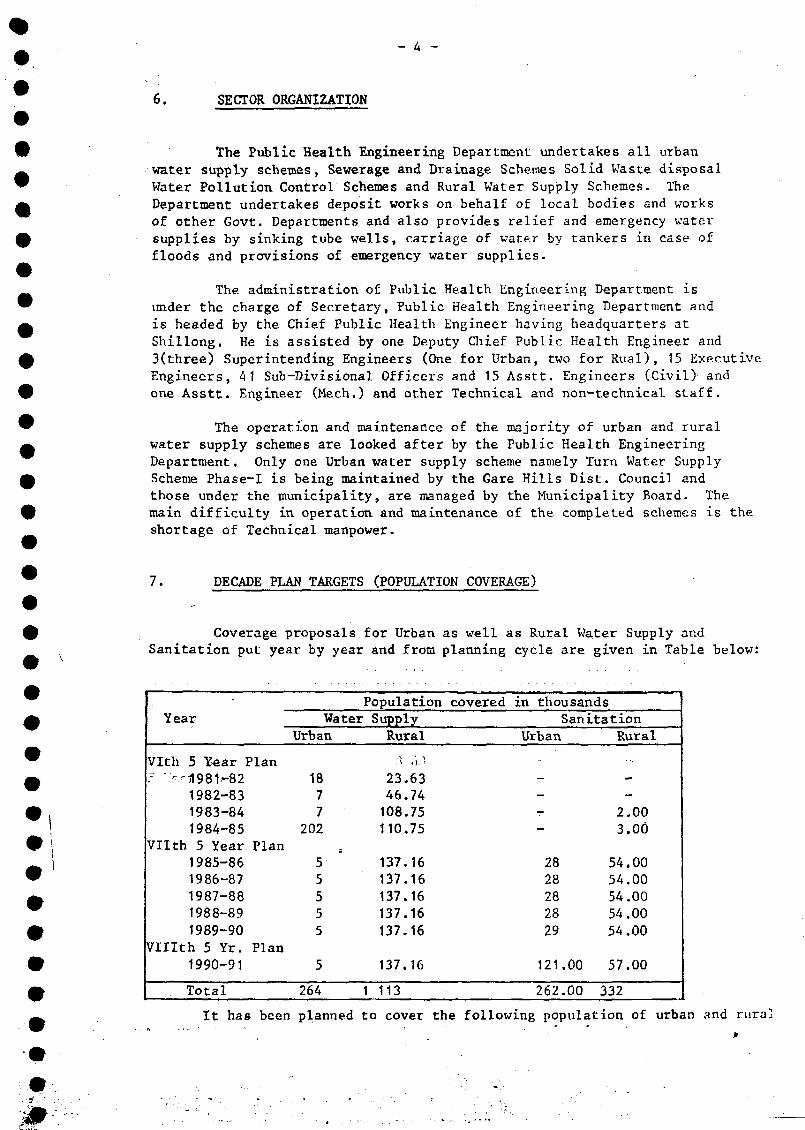
- 4 -
6. SECTOR ORGANIZATION
The Public Health Engineering Department undertakes all urbanwater supply schemes, Sewerage and Drainage Schemes Solid Waste disposalWater Pollution Control Schemes and Rural Water Supply Schemes. TheDepartment undertakes deposit works on behalf of local bodies and worksof other Govt. Departments and also provides relief and emergency vatersupplies by sinking tube wells, carriage of water by tankers in case offloods and provisions of emergency water supplies.
The administration of Public Health Engineering Department isunder the charge of Secretary, Public Health Engineering Department andis headed by the Chief Public Health Engineer having headquarters atShillong. He is assisted by one Deputy Chief Public Health Engineer and3(three) Superintending Engineers (One for Urban, two for Rual), 15 ExecutiveEngineers, 41 Sub-Divisional Officers and 15 Asstt, Engineers (Civil) andone Asstt. Engineer (Mech.) and other Technical and non-technical staff.
The operation and maintenance of the majority of urban and ruralwater supply schemes are looked after by the Public Health EngineeringDepartment. Only one Urban water supply scheme namely Turn Water SupplyScheme Phase-I is being maintained by the Gare Hills Dist. Council andthose under the municipality, are managed by the Municipality Board. Themain difficulty in operation and maintenance of the completed schemes is theshortage of Technical manpower.
7. DECADE PLAN TARGETS (POPULATION COVERAGE)
Coverage proposals for Urban as well as Rural Water Supply andSanitation put year by year and from planning cycle are given in Table below:
Year
Vlth 5 Year Plan.- > -51981-82
1982-831983-841984-85
Vllth 5 Year Plan1985-861986-871987-881988-891989-90
Vlllth 5 Yr. Plan1990-91
Total
WaterUrban
1877
202
55555
5
264
Population coveredSupplyRural
23.6346.74108.75110.75
137.16137.16137.16137.16
137.16
137.16
1 113
in thousands
Urban
----
2828282829
121
262
SanitationRural
--2.003.0Ô
54.0054.0054.0054.0054.00
00 57.00
00 332
It has been planned to cover the following population of urban and
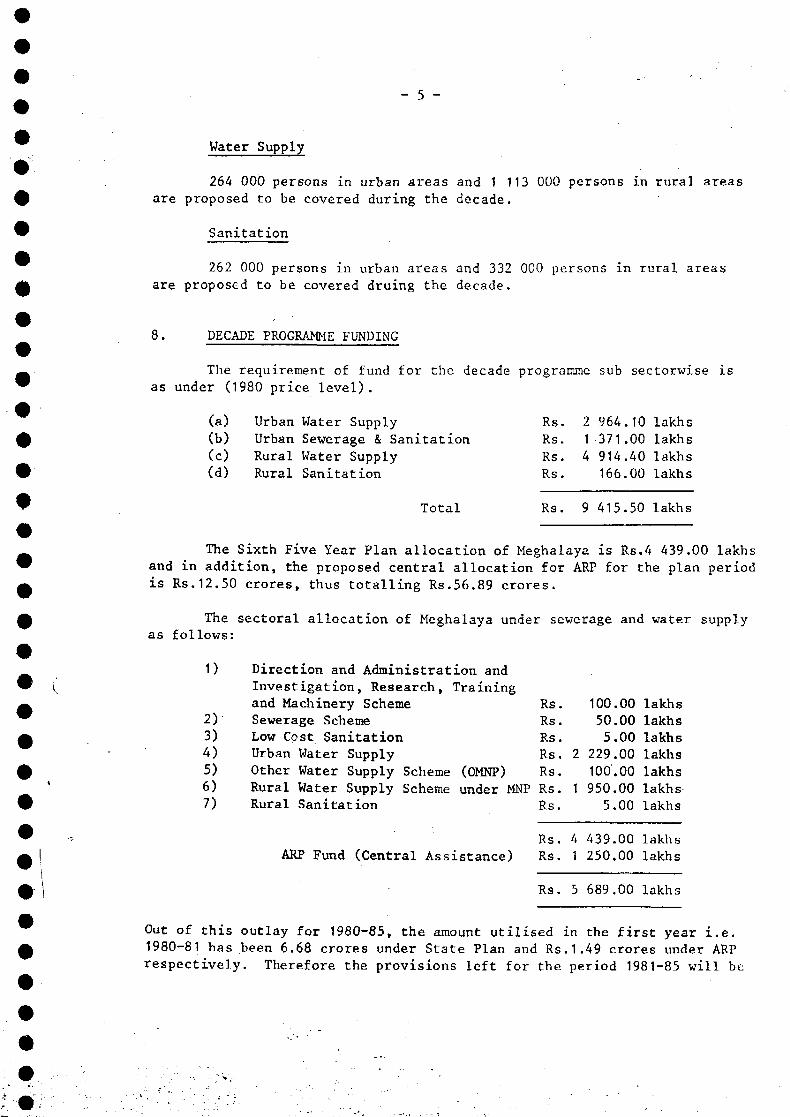
«_ Ç ~~
Water Supply
264 000 persons in urban areas and 1 113 000 persons in rural areas
are proposed to be covered during the decade.
Sanitation
262 000 persons in urban areas and 332 000 persons in rural areas
are proposed to be covered druing the decade.
8. DECADE PROGRAMME FUNDING
The requirement of fund for the decade programme sub sectorwise isas under (1980 price level).
(a)(b)(c)Cd)
UrbanUrbanRuralRural
Water SupplySewerage & SanitationWater SupplySanitation
Rs.Rs.Rs.Rs.
214
964371914166
.10
.00
.40
.00
lakhslakhslakhslakhs
Total Rs. 9 415.50 lakhs
The Sixth Five Year Plan allocation of Meghalaya is Rs.4 439.00 lakhsand in addition, the proposed central allocation for ARP for the plan periodis Rs.12.50 crores, thus totalling Rs.56.89 crores-
The sectoral allocation of Meghalaya under sewerage and water supplyas follows:
1)
2)3)4)5)6)7)
Direction and Administration andInvestigation, Research, Trainingand Machinery Scheme Rs .Sewerage Scheme Rs.Low Cost Sanitation Rs.Urban Water Supply Rs.Other Water Supply Scheme (OMNP) Rs.Rural Water Supply Scheme under MNP Rs.Rural Sanitation Rs.
100.00 lakhs50.00 lakhs5.00 lakhs
229.00 lakhs100.00 lakhs950.00 lakhs
5.00 lakhs
Rs. 4 439.00 lakhsARP Fund (Central Assistance) Rs. 1 250.00 lakhs
Rs. 5 689.00 lakhs
Out of this outlay for 1980-85, the amount utilised in the first year i.e.1980-81 has been 6.68 crores under State Plan and Rs.1.49 crores under ARPrespectively. Therefore the provisions left for the period 1981-85 will be
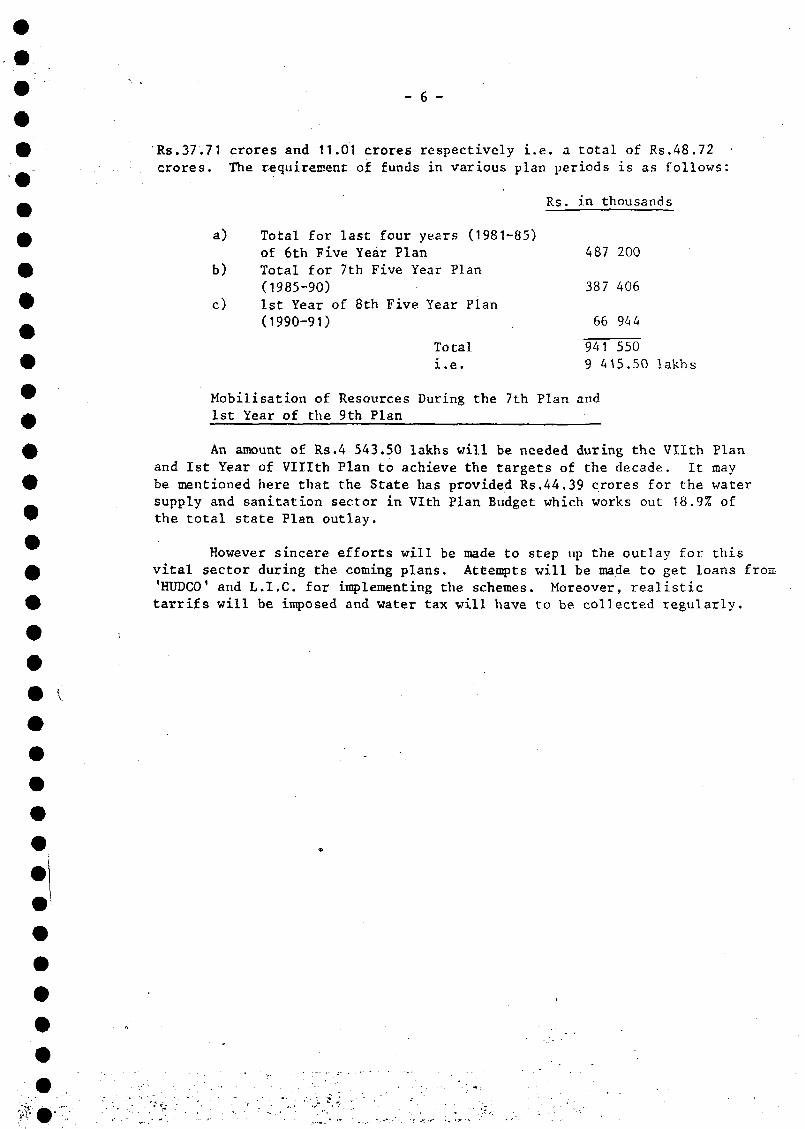
- 6 -
Rs.37.71 crores and 11.01 crores respectively i.e. a total of Rs.48.72crores. The requirement of funds in various plan periods is as follows:
Rs. in thousands
a) Total for last four years (1981-85)of 6th Five Year Plan
b) Total for 7th Five Year Plan(1985-90)
c) 1st Year of 8th Five Year Plan(1990-91)
Totali.e.
Mobilisation of Resources During the 7th Plan and1st Year of the 9th Plan
An amount of Rs.4 543.50 lakhs will be needed during the Vllth Planand 1st Year of VHIth Plan to achieve the targets of the decade. It maybe mentioned here that the State has provided Rs.44,39 crores for the watersupply and sanitation sector in Vlth Plan Budget which works out 18.9% ofthe total state Plan outlay.
However sincere efforts will be made to step up the outlay for thisvital sector during the coining plans. Attempts will be made to get loans fron'HUDCO' and L.I.C. for implementing the schemes. Moreover, realistictarrifs will be imposed and water tax will have to be collected regularly.
487
387
66
941
200
406
944
5509 415.50 lakhs
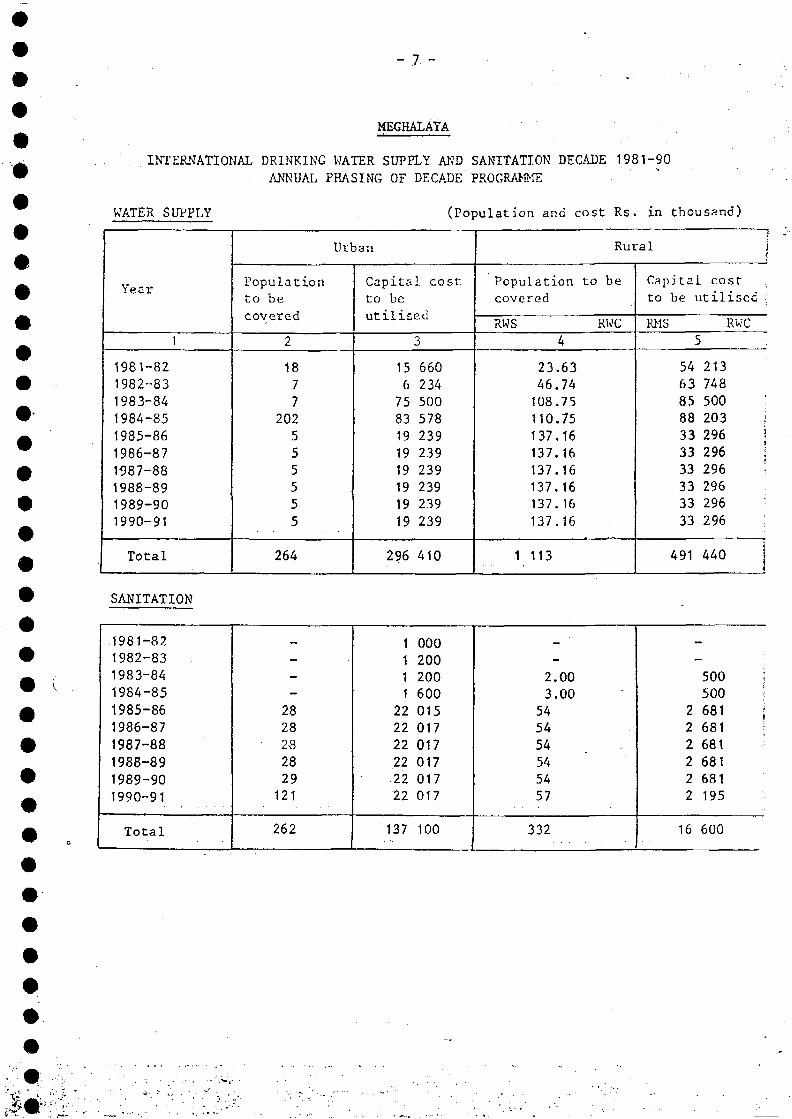
- .7. ~
#
MEGHALÂYA
INTERNATIONAL DRINKING WATER SUPPLY AND SANITATION DECADE 1981-90ANNUAL PHASING OF DECADE PROGRAMME
WATER SUPPLY
Y P P r
1
1981-821982-831983-841984-851985-861986-871987-881988-891989-901990-91
Total
Populationto becovered
2
1877
202555555
264
(Population and cost Rs.
Urban
Capital costto beutilised
3
15 6606 234
75 50083 57819 23919 23919 23919 23919 23919 239
296 410
Population tccovered
RWS4
23.6346.74108.75110.75137.16137.16137.16137.16137.16137.16
1 113
in thousand)
Rural i
> be
RWC
Capital costto be utilised ;
RMS RWC5
54 21363 74885 50088 203 i33 296 j33 296 ;33 296 I33 29633 296 :33 296 :
491 440 j
SANITATION
1981-821982-831983-841984-851985-861986-871987-881988-891989-901990-91
Total
——-
2828
• 2-8
2829121
262
1 0001 2001 2001 600
22 01522 01722 01722 01722 01722 017
137 100
• —
2.003.00545454545457
332
-
500 •?
500 •
2 681 [2 681 I2 6812 6812 6812 195
16 600
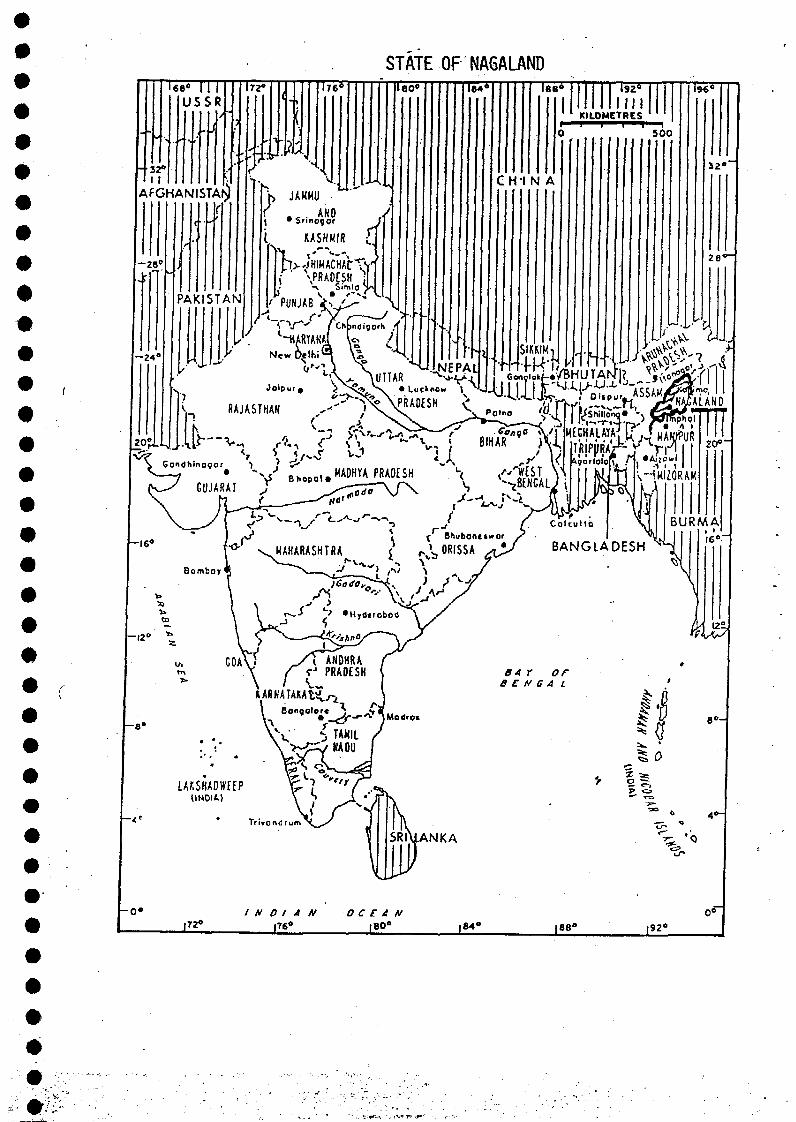
STATE OF NA6ALAND"SB* II I
USSR172» lee*
KILOMETRES
C H I N A
500
2BC
LAKSHADWEP(INDIA)
Trivond rum
IT211I N D I A N O C € A N
|80" |B8° |92"
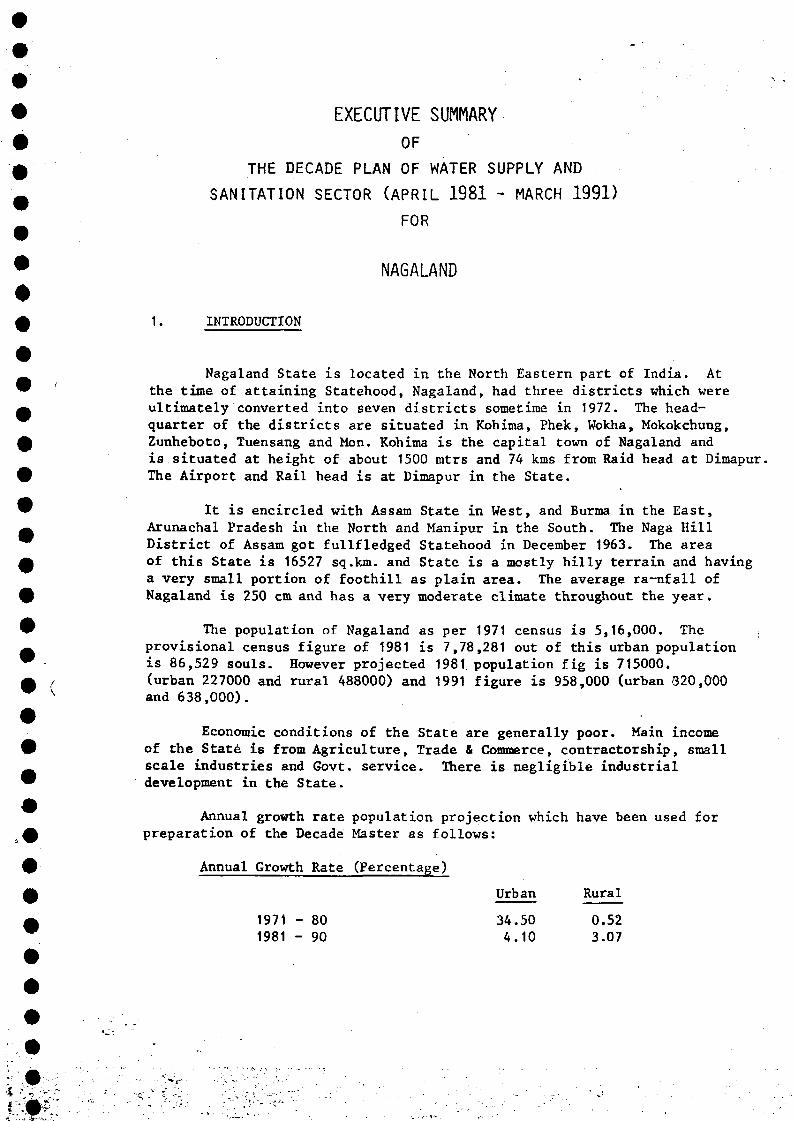
EXECUTIVE SUMMARYOF
THE DECADE PLAN OF WATER SUPPLY ANDSANITATION SECTOR (APRIL 1981 - MARCH 1991)
FOR
NAGALAND
1. INTRODUCTION
Nagaland State is located in the North Eastern part of India. Atthe time of attaining Statehood, Nagaland, had three districts which wereultimately converted into seven districts sometime in 1972. The head-quarter of the districts are situated in Kohima, Phek, Wokha, Mokokchung,Zunheboto, Tuensang and Mon. Kohima is the capital town of Nagaland andis situated at height of about 1500 mtrs and 74 kms from Raid head at Dimapur.The Airport and Rail head is at Dimapur in the State.
It is encircled with Assam State in West, and Burma in the East,Arunachal Pradesh in the North and Manipur in the South. The Naga HillDistrict of Assam got fullfledged Statehood in December 1963. The areaof this State is 16527 sq.km. and State is a mostly hilly terrain and havinga very small portion of foothill as plain area. The average ra-nfall ofNagaland is 250 cm and has a very moderate climate throughout the year.
The population of Nagaland as per 1971 census is 5,16,000. The ,provisional census figure of 1981 is 7,78,281 out of this urban populationis 86,529 souls. However projected 1981 population fig is 715000.(urban 227000 and rural 488000) and 1991 figure is 958,000 (urban 320,000and 638,000).
Economic conditions of the State are generally poor. Main incomeof the State is from Agriculture, Trade & Commerce, contractorship, smallscale industries and Govt. service. There is negligible industrialdevelopment in the State.
Annual growth rate population projection which have been used forpreparation of the Decade Master as follows:
Annual Growth Rate (Percentage)
Urban Rural
1971 - 80 34.50 0.521981 - 90 4.10 3.07
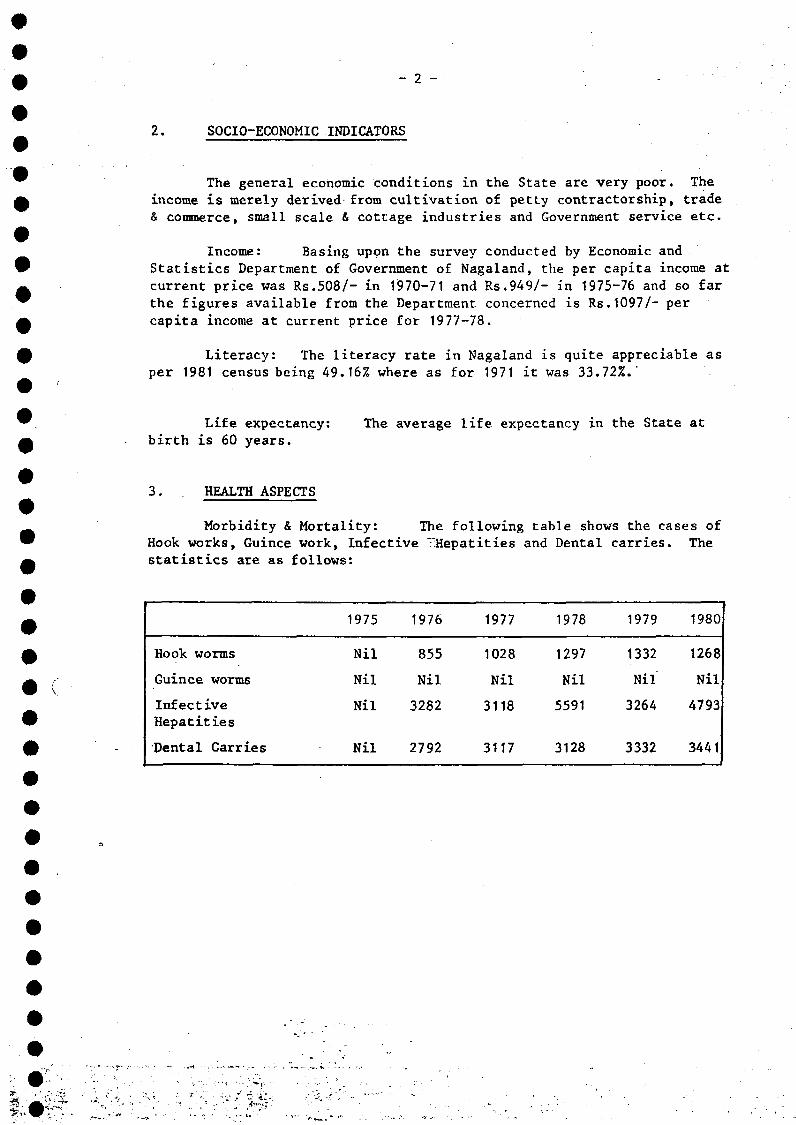
- 2 -
2. SOCIO-ECONOMIC INDICATORS
The general economic conditions in the State are very poor. Theincome is merely derived'from cultivation of petty contractorship, trade& commerce, small scale & cottage industries and Government service etc.
Income: Basing upon the survey conducted by Economic andStatistics Department of Government of Nagaland, the per capita income atcurrent price was Rs.508/- in 1970-71 and Rs.949/- in 1975-76 and so farthe figures available from the Department concerned is Rs.1097/- percapita income at current price for 1977-78.
Literacy: The literacy rate in Nagaland is quite appreciable asper 1981 census being 49.16% where as for 1971 it was 33.72%.'
Life expectancy:birth is 60 years.
The average life expectancy in the State at
3. HEALTH ASPECTS
Morbidity & Mortality: The following table shows the cases ofHook works, Guince work, Infective TîHepatities and Dental carries. Thestatistics are as follows:
Hook worms
Guince worms
InfectiveHepatities
Dental Carries
1975
Nil
Nil
Nil
Nil
1976
855
Nil
3282
2792
1977
1028
Nil
3118
3117
1978
1297
Nil
5591
3128
1979
1332
Nil
3264
3332
1980
1268
Nil
4793
3441
"••.*#£";•.•
- 3 -
5. PRESENT STATUS OF WATER SUPPLY & SEWERAGE
397 villages with population of 3,28,000 have been covered withwater supply in rural areas and 3 Urban Towns with population of 66,000have been provided partial water supply. Sanitation is almost non existentin the Urban and Rural areas. Though a very little development insanitation by providing sanitary latrines with septic tanks has been madein Government buildings, but still is quite negligible.
Urban Water Supply: As per 1971 census the Urban population ofNagaland was 51,000 and the 1981 projected urban population is 227,000.In fact there are 3 (three) Urban units with class III Town namely -Kohiraa, the Capital of the State, Mokokchung the District Headquarter andDimapur. Partial Water Supply has been provided to these 3 (three) townswith coverage of 66,000 Souls, which works out to be about 29% of thetotal Urban population as per 1981 projected population.
PHED is the only agency providing drinking water to 66,000 populationof Urban units. The drinking water is supplied through house connectionto about 60% of the covered population and remaining 40% is served throughPublic Stand Posts.
Rural Water Supply: As per 1971 census the rural population was 464thousand. However, 1981 census the population in rural areas in Nagalandhas gone upto 686 thousand where as the projected population for 1981 censuswas shown as 488 thousands. The total no. of villages in this State asper 1971 census is 1045. All these villages have been classified as problemvillages, as per the norms laid down by Government of India. Most of theidentified problem villages fall under the first category viz. "No sourceof dependable drinking water supply available within a distance of 1.6 km."
As in 31.3.1981, out of the 1045 villages 397 villages have beenprovided with drinking water supply facilities. The total population coveredwith drinking water facility has been estimated to be 328 thousands.Majority of the rural population has been served with drinking water supplyfacility through public stand posts. Being the hilly terrain only surfacesources are tapped at present in this State.
Urban Sanitation: Practically the coverage of urban populationwith sanitary facilities is nil. A negligible percentage of populationhas got water seal toilets followed by Septic tank system. But majorityof the population has got dry latrines for disposal excreta and thispracticular system is unhygenic. Open surface drains are generally usedfor disposal of sullage and other waste water of the community. There areno community toilets for public use in the three urban towns of Nagaland.
Rural Sanitation: At present there is no organised sanitationprogramme in rural areas. Very few people in rural areas use the pitlatrine for disposal of excreta. Introduction of safe excreta disposalthrough household sanitary toilets is very much promising and will beaccepted to the rural community without much hesitation. .
•„ ••.«:••*-•. - • .
6. SECTOR ORGANIZATION
In Nagaland Water Supply and Sanitation is looked after by theonly Public Health Engineering Department. The PHE Department is headedby a Superintending Engineer with 4 working divisions. The acute shortageof technical personnel in the department is one of the main drawbacks.Some of the technical posts are still to be filled up or are manned bythe députâtionist from the sister department. The transfer of these depu-tationists back to their parent department frequently creates set back inefficient functioning of this department. It is under the activeconsideration of the Government to up-grade the head of the Department tothe status of Chief Engineer with more divisions which is very muchessential for successful implementation of Decade programme.
7. DECADE PLAN & TARGETS (POPULATION COVERAGE)
The detailed list of projects to be taken up during the Decadewith reference to approved annual and Five Year Plan targets and provisionsincluding the proposed targets and for the 7th Five Year Plan. i.e. from1985-1990 and the first year of the 8th Plan i.e. 1990-91 are shown in thetable 13-1. In Urban Water Supply Sector the provisions for first 4 yearsi.e. 1981-85 is 3.396 crores which will cover 20100 people. A provisionof Rs.11.024 crores is provided for the year 19S5-1991 to cover anadditional population of 23390.
In the Rural Water Supply Sector, there is a provision of Rs.11.00crores for the first 4 years of the decade to provide water to 266,000souls. A provision of Rs.4.5245 crores is made for the remaining 6 yearsof the decade to cover 44,000 population.
In the Urban Sanitation sector, it is proposed to cover the entireUrban towns with low cost sanitation facilities in the form of pour flushsystem latrines as adopted by UNDP. House hold survey and collection ofdates are being done. It is proposed to cover 2,56,000 population withan estimated expenditure of Rs.9.864 crores within the decade.
In the Rural Sanitation sector, a provision of Rs.80.00 lakhs ismade to cover 1,60,000 people in Rural areas in the form of simple =.sanitary water seal latrines.
8. DECADE PROGRAMME FUNDING
The requirement of funds during the programme 1981-1991 based on1980 prices are as follows:
- 5 -•
Urban Water SupplyRural Water SupplyUrban SanitationRural Sanitation
Rs. 14,42,00,000/-Rs.15,52,45,000/-Rs. 9,86,40,000/-Rs. 80,00,000/-
Rs.40,60,85,000/-
During the 6th Five Year Plan the outlay for water supply andsanitation of Nagaland is Rs.24 crores which is about 15% of the totalfund outlay for Nagaland. The revenue collection in the State is negligble.To meet the additional requirement for achieving Decade targets morecentral assistance has to be obtained and loans from International andInternal financing agencies will have to be sought.
c
• • • ; • . ' • - ' . n : * ':
~ • • - ; " * ? • » • , . • * - . . • • .
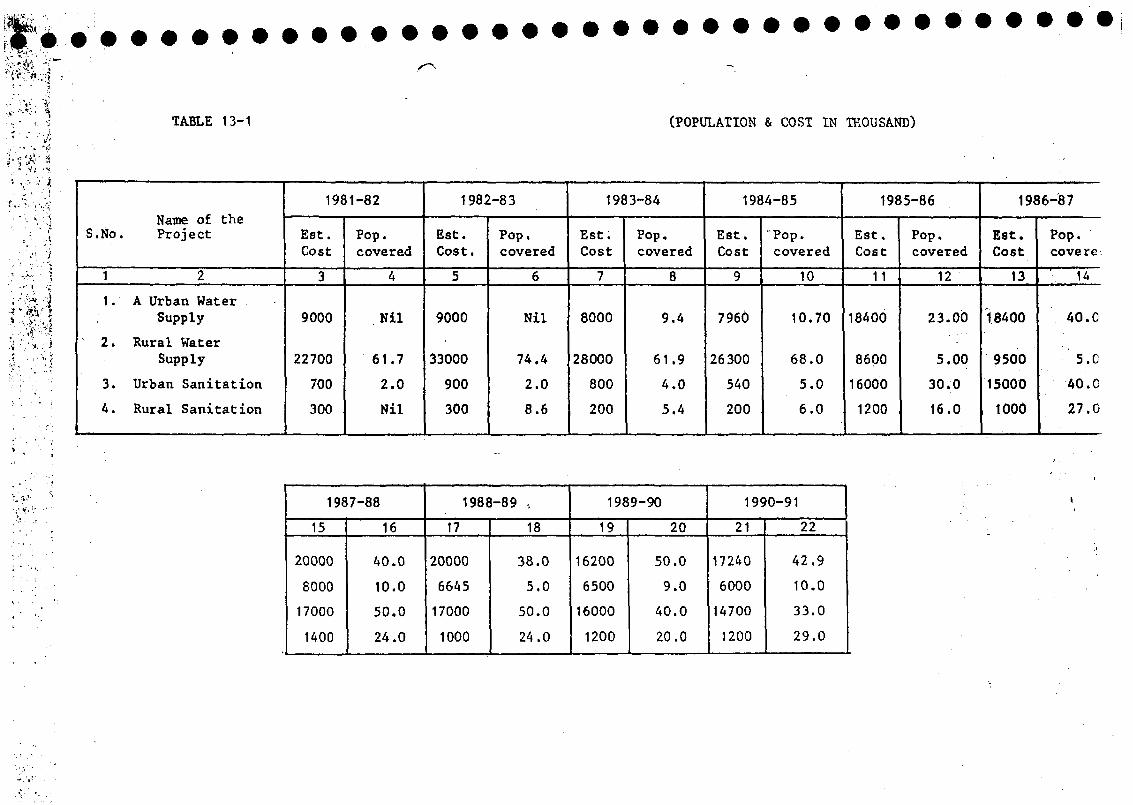
TABLE 13-1 (POPULATION & COST IN THOUSAND)
V ; •'<
• "'"• 'i
Name of theS.No. Project
1 2
1. A Urban WaterSupply
2. Rural WaterSupply
3. Urban Sanitation
4. Rural Sanitation
1981-82
Est.Cost
3
9000
22700
700
300
Pop.covered
4
Nil
61.7
2.0
Nil
1982-83
Est.Cost.
5
9000
33000
900
300
Pop.covered
6
Nil
74.4
2.0
8.6
1983-84
Est.Cost
7
8000
28000
800
200
Pop.covered
8
9.4
61.9
4.0
5.4
1984-85
Est.Cost
9
7960
26300
540
200
"Pop.covered
10
10.70
68.0
5.0
6.0
1985-86
Est.Cost
11
18400
8600
16000
1200
Pop.covered
12
23.00
5.00
30.0
16.0
1986-87
Est.Cost
13
Î8400
9500
15000
1000
Pop.covere
' 14
40.0
' 5.0
40.0
27.0
1987-88 1988-89 , 1989-90 1990-91
15 16 17 18 19 20 21 22
20000
8000
17000
1400
40.0
10.0
50.0
24.0
20000
6645
17000
1000
38.0
5.0
50.0
24.0
16200
6500
16000
1200
50.0
9.0
40.0
20.0
17240
6000
14700
1200
42.9
10.0
33.0
29.0
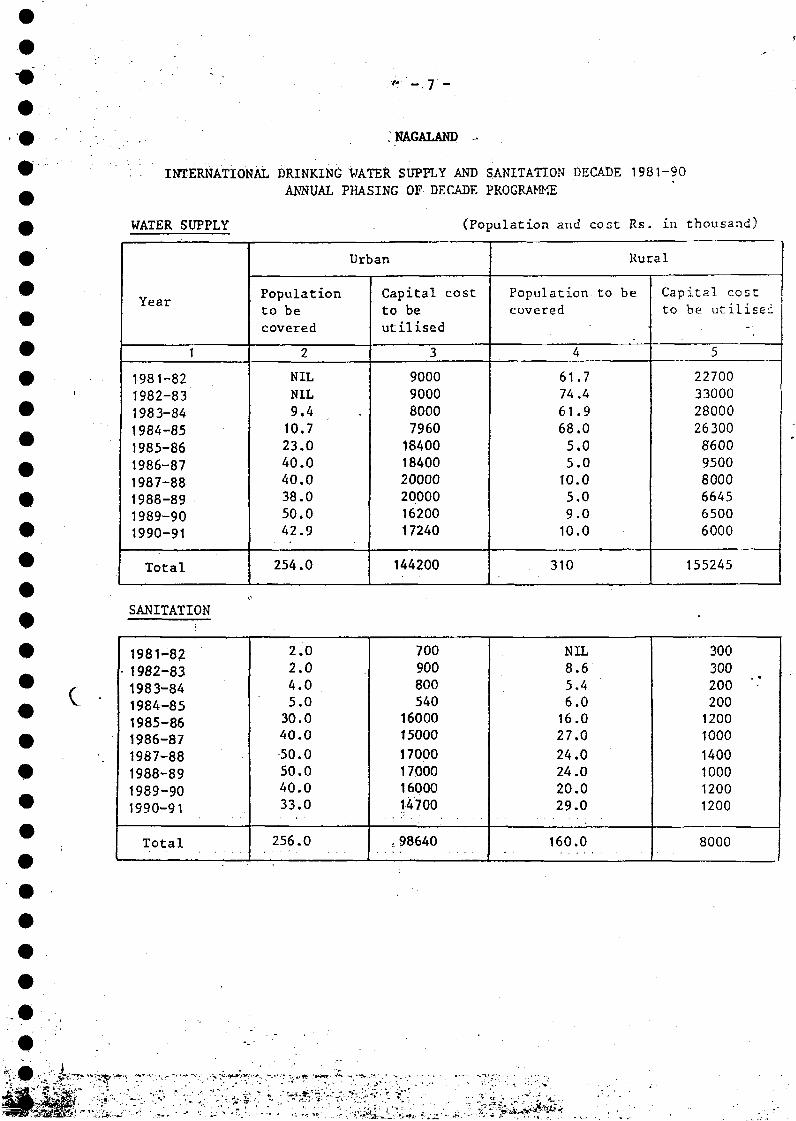
- 7 •"-
C
NAGALAND - . .
INTERNATIONAL DRINKING WATER SUPPLY AND SANITATION DECADE 1981-90
ANNUAL PHASING OF DECADE PROGRAMME
WATER SUPPLY
1
1981-821982-831983-841984-851985-86
1986-871987-881988-891989-901990-91
Total
Populationto becovered
2
NILNIL9.410.723.040.040.038.050.042.9
254.0
Urban
Capitalto beutilised
3
9000900080007960184001840020000200001620017240
144200
(Population and cost
cost Population tocovered
4
61.774.4
61.968.05.05.010.0
5.09.010.0
310
Rs. in thousand)
Rural
be
•
Capital cost
to be utilised
.--
5
22700330002800026300860095008000664565006000
155245
SANITATION
1981-82
- 1982-831983-84
1984-851985-861986-871987-881988-891989-901990-91
Total
2.02.04.05.030.040.0
50.050.040.033.0
256.0
700900800540
1600015000
17000170001600014700
o98640
NIL8.65.46.016.027,0
24.024.020.029.0
160.0
300300200 •-'20012001000
1400100012001200
8000
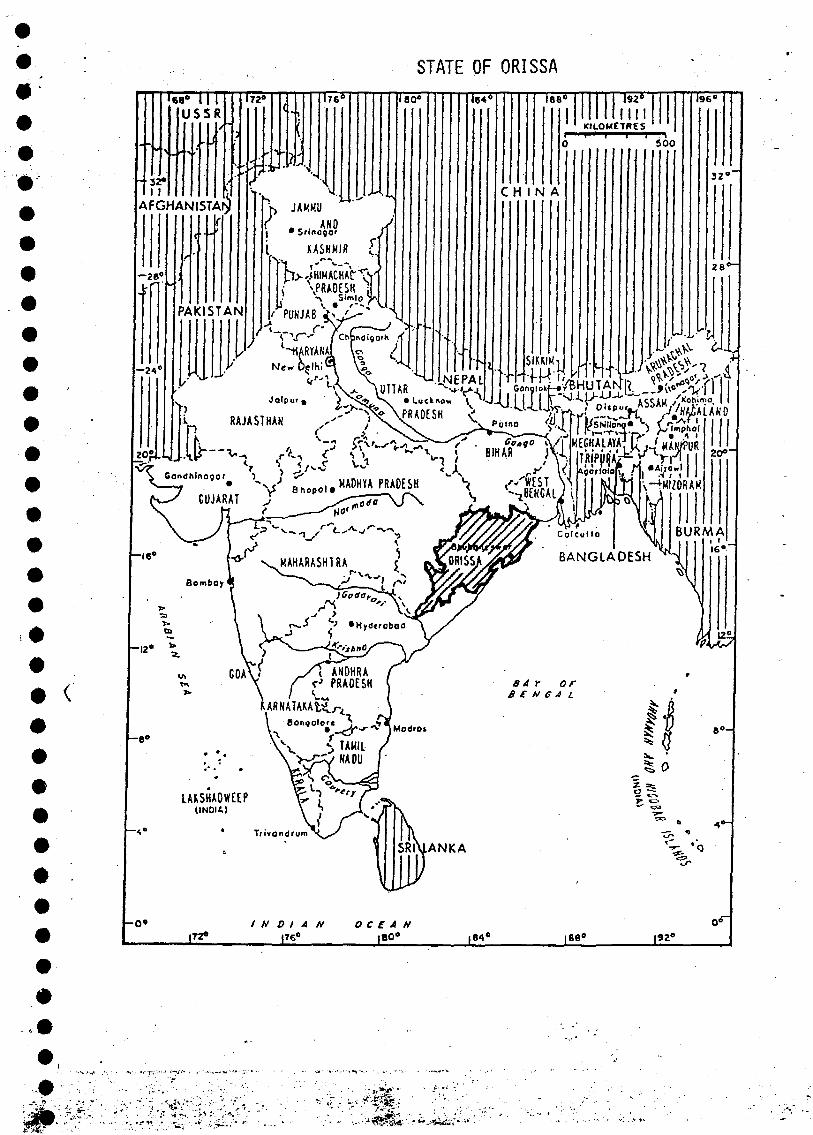
STATE OF ORISSA
<
U l \ ^ \UTTAR '^^y^ . " ! I j Gonoiikf./BHUTANI? 1jfro'*V,.r I
RAJASTHAN ^ ' ' YVVfiADESH < ' ^ 1 1 ^ ^ " % < &
^^v^/t,^^
INDIAN OCEAN176°
* " ^ > # ^ | ; ' : ; . : • ; . ;
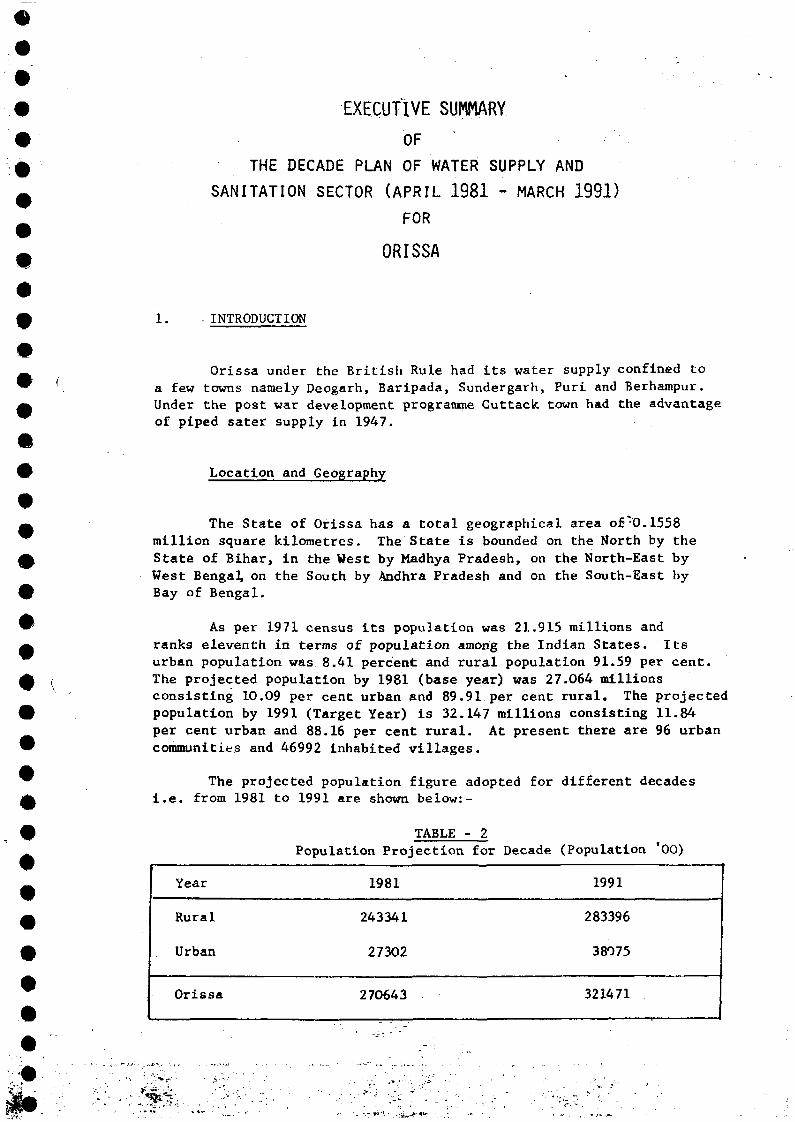
EXECUTIVE SUMMARYOF
THE DECADE PLAN OF WATER SUPPLY ANDSANITATION SECTOR (APRIL 1981 - MARCH 1991)
FOR
ORISSA
9 1- - INTRODUCTION
#Orissa under the British Rule had its water supply confined to
a few towns namely Deogarh, Baripada, Sundergarh, Puri and Berhampur.Under the post war development programme Cuttack town had the advantageof piped sater supply in 1947.
Location and Geography
The State of Orissa has a total geographical area of'0.1558million square kilometres. The State is bounded on the North by theState of Bihar, in the West by Madhya Pradesh, on the North-East byWest Bengal, on the South by Andhra Pradesh and on the South-East byBay of Bengal.
As per 1971 census its population was 21.915 millions andranks eleventh in terms of population among the Indian States. Itsurban population was 8.41 percent and rural population 91.59 per cent.The projected population by 1981 (base year) was 27.064 millionsconsisting 10.09 per cent urban and 89.91 per cent rural. The projectedpopulation by 1991 (Target Year) is 32.147 millions consisting 11.84per cent urban and 88.16 per cent rural. At present there are 96 urbancommunities and 46992 inhabited villages.
The projected population figure adopted for different decadesi.e. from 1981 to 1991 are shown below:-
TABLE - 2
Year
Rural
Urban
Orissa
Population Projection
1981
243341
27302
270643
for Decade (Population 00)
1991
283396
38075
321471
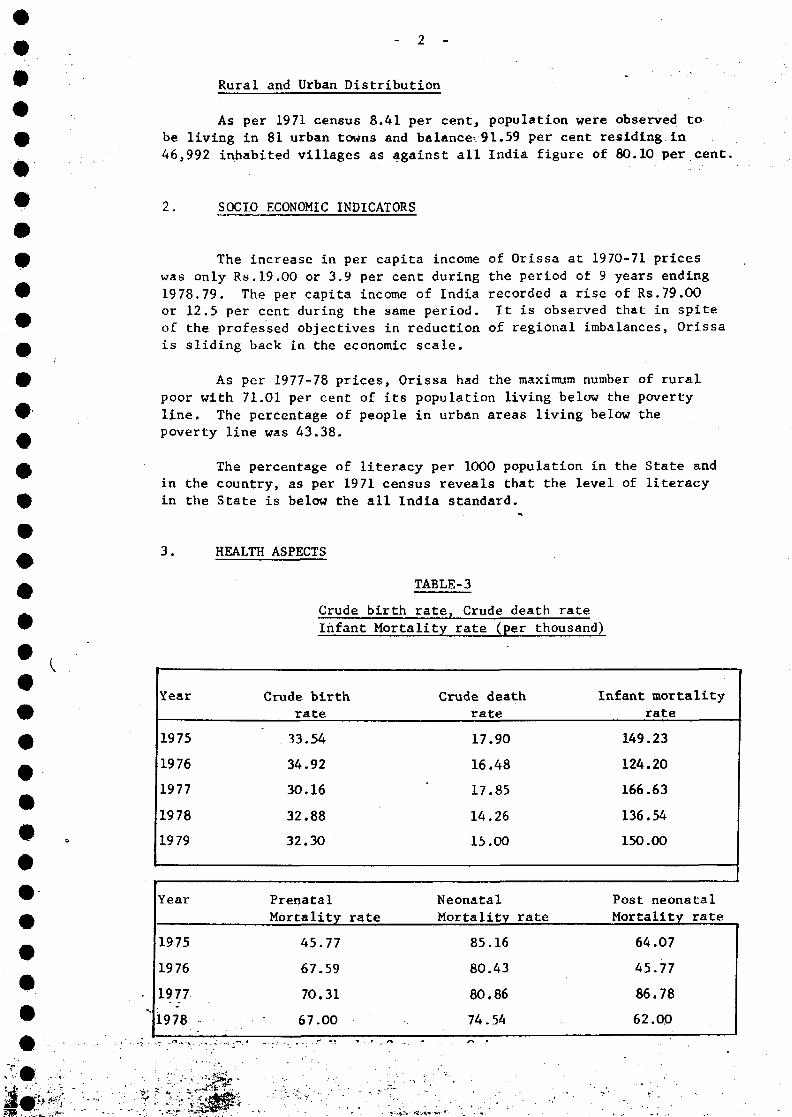
Rural and Urban Distribution
As per 1971 census 8.41 per cent, population were observed tobe living in 81 urban towns and balance.91.59 per cent residing in46,992 inhabited villages as against all India figure of 80.10 per cent.
2. SOCIO ECONOMIC INDICATORS
The increase in per capita income of Orissa at 1970-71 priceswas only Rs.19.00 or 3.9 per cent during the period of 9 years ending1978.79. The per capita income of India recorded a rise of Rs.79.OOor 12.5 per cent during the same period. It is observed that in spiteof the professed objectives in reduction of regional imbalances, Orissais sliding back in the economic scale.
As per 1977-78 prices, Orissa had the maximum number of rural
poor with 71.01 per cent of its population living below the poverty
line. The percentage of people in urban areas living below the
poverty line was 43.38.
The percentage of literacy per 1000 population in the State andin the country, as per 1971 census reveals that the level of literacyin the State is below the all India standard.
3. HEALTH ASPECTS
TABLE-3
Crude birth rate, Crude death rate
Infant Mortality rate (per thousand)
Year
1975
1976
1977
1978
1979
Year
1975
1976
1977
1978 -
Crude birthrate
33.54
34.92
30.16
32.88
32.30
Prenatal
Mortality rate
45.77
67.59
70.31
67.00
Crude deathrate
17.90
16.48
17.85
14.26
15.00
Neonatal
Mortality rate
85.16
80.43
80.86
74.54
Infant mortalityrate
149.23
124.20
166.63
136.54
150.00
Post neonatal
Mortality rate
64.07
45.77
86.78
62.00
3 -
The expectation of life at birth in 70-72 in the State was48.20 years and at age 10 it was observed to be 52.57 years. Theexpectation of life in India for 1971-76 for males and females asper projection was found to be 50.10 and 48.80 respectively whichwas almost in par with the State's studied figure.
4. WATER RESOURCES
Summary of Water balance
A Orissa is rich in water resources but for the most partremains under developed. The State is well covered with a net
A work of rivers, streams and drainage ways which annually dischargeabout 95,000 million cubic metre into the Bay of Bengal. Besides
4) the State has considerable ground water potential particularly inthe delta areas.
A The State of Orissa receives average annual rainfall of^ 234300 millions of cubic metre out of which the quantity lostf as surface run off to the sea through the net work of river
system has been estimated as 95,000 millions of cubic metre. The9 Balance quantity of 139300 million is partly last through evaporation
and transpiration^ and partly enter into the soil. Assuming the» losses due to evaporation and transpiration as 25 per cent of the^ balance quantity the amount of rainfall penetration into the soil as
gravitational water is 104475 million cubic metre. Allowing 50 per centA of the quantity to be lost through slow downward movement of the
ground water towards the sea and a part held up in undeterminable0 sub-surface reservoir or as capillary moisture in clay zone, the
quantity of utilisable ground water is roughly estimated to beW • 52180 million cubic metre.
• c •
• 5. PRESENT SITUATION OF WATER SUPPLY AND SEWERAGE
Urban Water Supply
Out of 96 urban communities 75 have piped water supplies serving1.072 millions or 39.27 per cent of the urban population by 31.3.1981.Among 75 urban water supplies, 38 have piped water supplies in ruralpattern designed to enter at the rate of 45 lpcd approximately. Inorder to achieve the Decade targets by 1991 a balance of urban
population of 2.735 millions have to be served by piped water supply.
Rural Water Supplies
• • • • • ' : • • . ' : : - . . - " •' • • • ' • •
£ Among 46,992 rural inhabited villages as per 1971 census 27,077villages are so far identified as problem villages according to criteria
0 prescribed by Government of India. Till 31.3.1981, there exist 67rural piped water supplies serving 0.19 millions. In other villages,
^ mostly identified problem villages 5.592 millions are served partlyA or fully by tubewells fitted with hand pumps and 2.08 millions are
served partly or fully by dug wells. Summing up, 7-862 millions formingA 32.31 -per cent of the rural population had drinking water supply by the
end of 31.3.1981.
^ By and large, studies reveal that 2200 rural villages qualify^ ' for full coverage with respect to 1991 projected population. StatisticsA also indicate that 5340 identified problem villages are fully covered^ and 9629 identified problem villages partly covered as per 1971 census0 population by tubewells.
*£ Rural Water Supplies are entirely met out of State and Central^ grants as a social obligation. In order to achieve the Decade targets* by 31.3.1991, 20,478 millions of unserved population have to be providedA 'with drinking water supply..
# . -Rural Sanitation
™ The coverage in this sub-sector is nil. As per Decade programme^ 7.085 millions are to be provided with rural sanitation facilities.
v 6. SECTOR ORGANISATION
W Mainly all the activities in the field of water supply and
•sanitation are managed by the P.H.E.O. headed by a Chief Engineerunder the administrative control of Housing and Urban Development
A programme, Government of Orissa. Construction of Dug wells fordrinking water supply is managed by the Community Development and
0 Rural Reconstruction Department. Surveillance is looked by theP.H.E.D. and State Health and Family Welfare Department. The
w Planning and Coordination Department formulates the State's Plan.
^ Among the Urban Local Bodies, only local bodies of Berhampur
A and Deogarh are operating and maintaining water supply schemes.Likewise, water supply and sanitation of Rourkela Steel Township
£ and Sunabeda (H.A.L.) Township is maintained by Steel Authority ofIndia Ltd.
W "
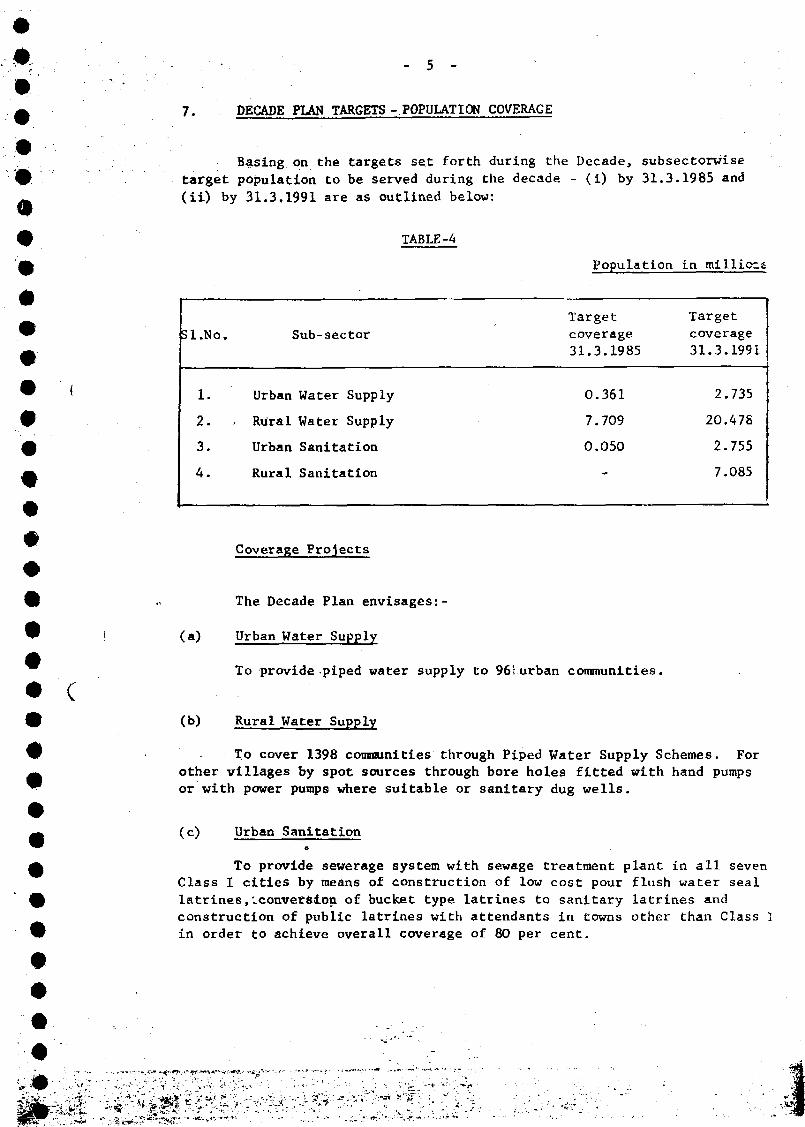
- 5 -
7. DECADE PLAN TARGETS - POPULATION COVERAGE
c
Basing on the targets set forth during the Decade, subsectorwise
target population to be served during the decade - (i) by 31.3.1985 and
(ii) by 31.3.1991 are as outlined below:
(b)
TABLE-4
Population in millions
Îl.No.
1.
2.
3.
4.
Sub-sector
Urban Water Supply
Rural Water Supply
Urban Sanitation
Rural Sanitation
Targetcoverage31.3.1985
0.361
7.709
0.050
-
Targetcoverage31.3.1991
2.735
20.478
2.755
7.085
Coverage Projects
The Decade Plan envisages:-
(a) Urban Water Supply
To provide-piped water supply to 96; urban communities.
Rural Water Supply
To cover 1398 communities through Piped Water Supply Schemes. Forother villages by spot sources through bore holes fitted with hand pumpsor with power pumps where suitable or sanitary dug wells.
(c) Urban Sanitation
To provide sewerage system with sewage treatment plant in all sevenClass I cities by means of construction of low cost pour flush water seallatrines, '-conversion of bucket type latrines to sanitary latrines andconstruction of public latrines with attendants in towns other than Class Iin order to achieve overall coverage of 80 per cent.
. . . • • . '-, , • * ' ' • • > . - * : ' • • , - ^ p
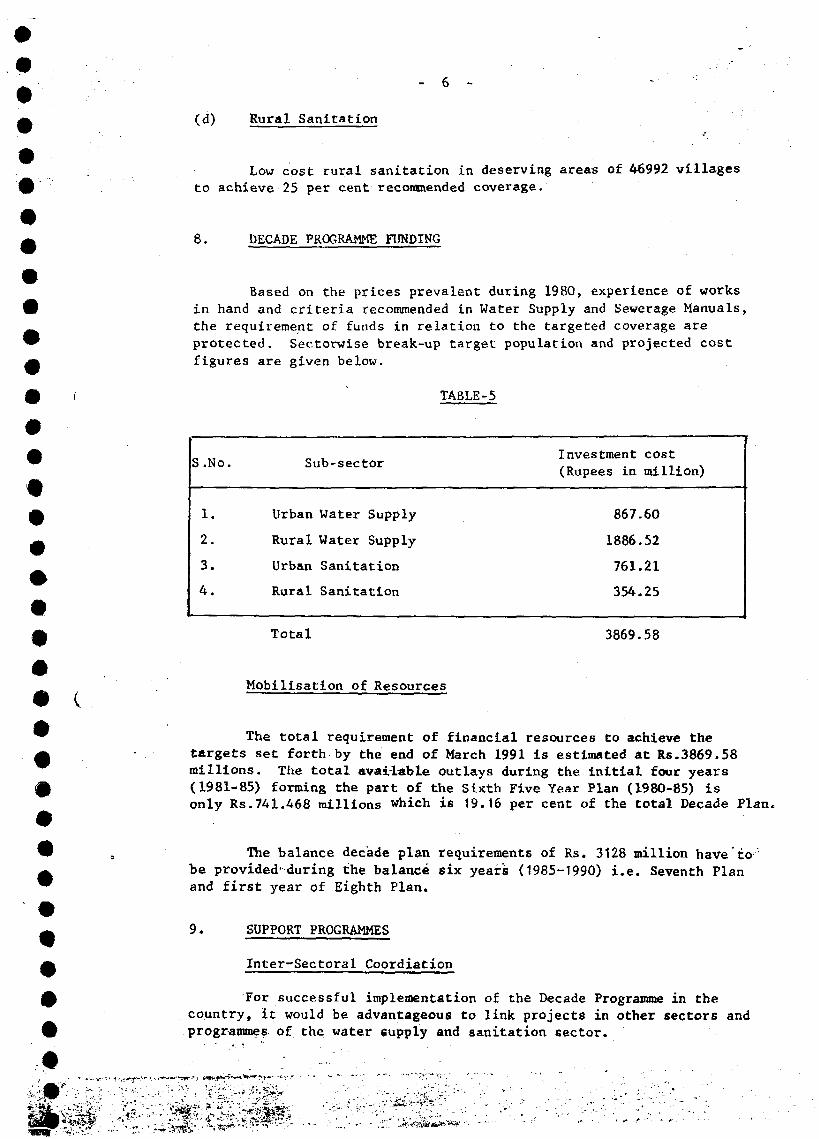
6 -
(d) Rural Sanitation
Low cost rural sanitation in deserving areas of 46992 villages
to achieve 25 per cent recommended coverage.
8. DECADE PROGRAMME FUNDING
Based on the prices prevalent during 1980, experience of worksin hand and criteria recommended in Water Supply and Sewerage Manuals,the requirement of funds in relation to the targeted coverage areprotected. Sectorwise break-up target population and projected costfigures are given below.
TABLE-5
S.No.
1.
2.
3.
4.
Sub-sector
Urban Water Supply
Rural Water Supply
Urban Sanitation
Rural Sanitation
Investment cost(Rupees in million)
867.60
1886.52
761.21
354.25
Total 3869.58
Mobilisation of Resources
The total requirement of financial resources to achieve thetargets set forth by the end of March 1991 is estimated at Rs.3869.58millions. The total available outlays during the initial four years(1981-85) forming the part of the Sixth Five Year Plan (1980-85) isonly Rs.741.468 millions which is 19.16 per cent of the total Decade Plan.
The balance decade plan requirements of Rs. 3128 million have tobe provided-during the balancé six years (1985-1990) i.e. Seventh Planand first year of Eighth Plan.
9. SUPPORT PROGRAMMES
Inter-Sectoral Coordiation
For successful implementation of the Decade Programme in thecountry, it would be advantageous to link projects in other sectors andprogrammes of the water supply and sanitation sector.
iâi'• ' * • & • •
7 -
For instance under the major and minor irrigation projects, manyreservoirs canal systems and tube wells are being constructed. Thoughthese resources are basically meant for irrigation purposes, looking tothe inadequacy of resources for drinking water supply schemes theresources could also be utilised for drinking water supply schemeswhereever feasible from the point of view of location of beneficiaryvillages.
To link up the Decade Programme with those in related sectorslike Rural Development, Health, Industries, Education and Social Welfarecould contribute in a great measure to the achievement of Decade goals.The conference of the State Secretaries, Chief Engineers and Heads ofImplementing Agencies held on 3 February 1982 had recognized this andresolved that the State level Apex Committee be requested to ensuresuch coordination at the high policy making level..
Health Education and Community Participation
The community may be educated on the health benefits of safedrinking water and hygienic sanitation facilities through the HealthGuide Scheme, Without such education there will be no impact on _•:. ,community health despite investment on water supply and sanitationfacilities. Mass media like Radio, Television, Films etc. may bemade use in this effort.
Community involvement in water supply and sanitation, particularlyin rural areas, may be encouraged. The beneficiaries may be associatedin all stages from planning to operation and maintenance as far as possible.
mm
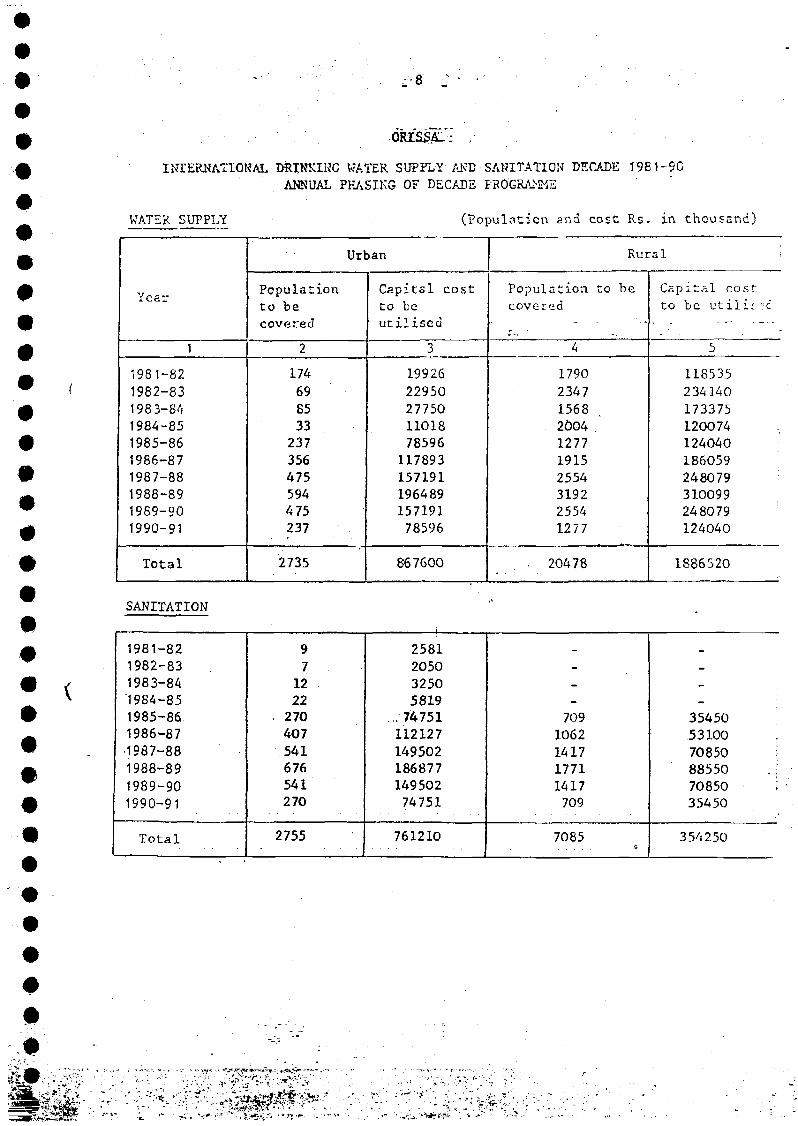
•
I.NTERNATlON/iL DRINKING WATER SUPPLY AND SANITATION DECADE 1961-90ANNUAL PHASIKG OF DECADE PROGRAMME
WATER SUPPLY (Population and cost Rs. in thousand)
1
1981-821982-831983-841984-851985-861986-871987-881988-891989-901990-91
Total
Populationto becovered
2
174698533
237356475594475237
2735
Urban
Capital costto beutilised
3
1992622950277501101878596
11789315719119648915719178596
867600
Populationcovered
4
1790234715682004127719152554319225541277
. 20478
Rural
to be
•
Capital costto be ut i l i se
... _- . - . .
5
118535234140173375120074 ;124040186059248079310099248079124040
1886520
SANITATION
1981-821982-831983-841984-851985-861986-871987-881988-891989-901990-91
Total
97
1222
270407541676541270
2755
2581205032505819
. 7 4 7 5 111212714950218687714950274751
761210
___
7091062141717711417
709
7085
_
354505310070850 !88550 _ Î70850 I35450
354250
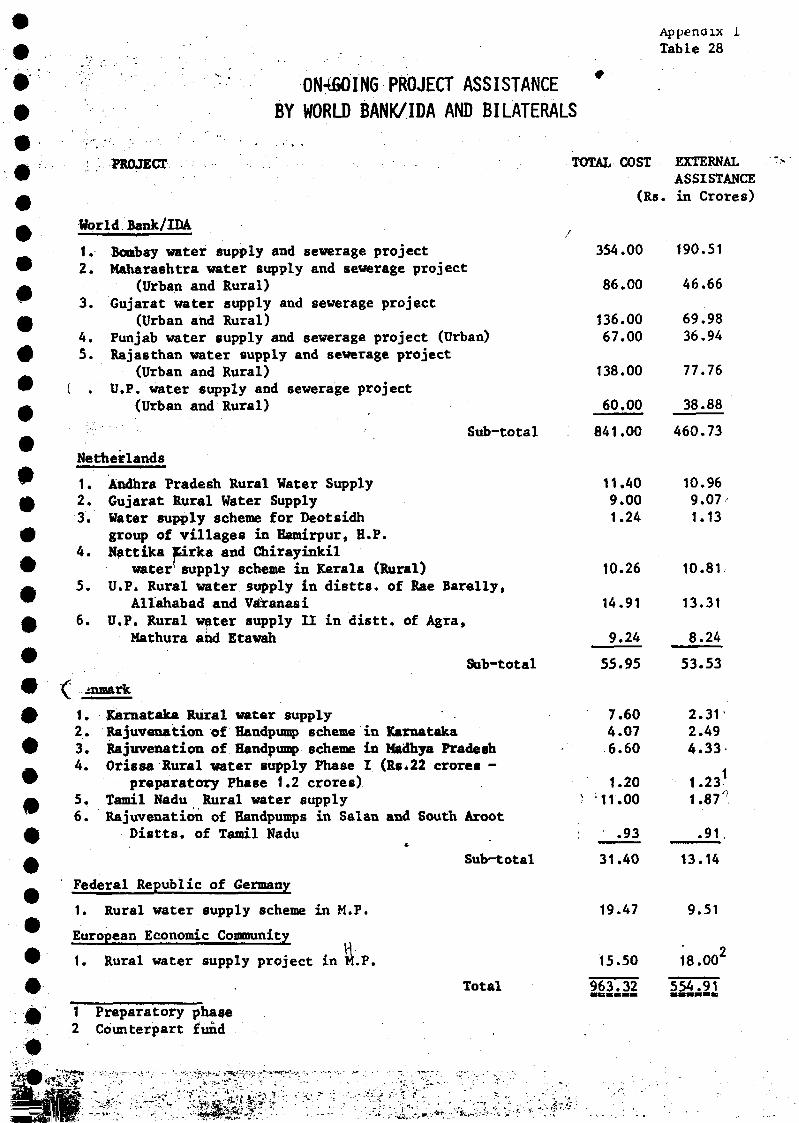
Appendix iTable 28
GN-ÙSOING PROJECT ASSISTANCEBY WORLD BANK/IDA AND BI LATERALS
PROJECT
World Bank/IDA
1. Bombay water supply and sewerage project2. Maharashtra water supply and sewerage project
(Urban and Rural)3. Gujarat water supply and sewerage project
(Urban and Rural)4. Punjab water supply and sewerage project (Urban)5. Rajaethan water supply and sewerage project
(Urban and Rural). U.P. water supply and sewerage project
(Urban and Rural)
Sub-total
Netherlands
1. Andhra Pradesh Rural Water Supply2. Gujarat Rural Water Supply3. Water supply scheme for Deotsidh
group of villages in Hamirpur, R.P.4. Nattika Kirka and Chirayinkil
water' supply scheme in Kerala (Rural)5. U.P. Rural water supply in distts. of Rae Barelly,
Allahabad and Vatanasi6. U.P. Rural water supply II in distt. of Agra,
Mathura and Etawah
TOTAL COST EXTERNAL ">ASSISTANCE
(Rs. in Crores)
354.00
86.00
136.0067.00
138.00
60.00
Sub-total
11.409.001.24
10.26
14.91
9.24
55.95
190.51
46.66
69.9836.94
77.76
38.88
841.00 460.73
10.969.071.13
10.81
13.31
8.24
53.53
1. Karnataka Rural water supply2. Rejuvenation of Handpurap scheme in Karnataka3. Rejuvenation of Handpump scheme in Madhya Pradesh4. Orissa Rural water supply Phase I (Rs.22 crores -
preparatory Phase 1.2 crores)5. Tamil Nadu Rural water supply6. Rejuvenation of Handpumps in Salan and South Aroot
Distts. of Tamil Nadu
Federal Republic of Germany
1. Rural water supply scheme in M.F.
European Economic Community
1. Rural water supply project in M.P.
1 Preparatory phase2 Counterpart fund
Sub-total
Total
7.604.076.60
1.20x 11.00
: .93
31.40
19.47
15.50
963.32
2.312.494.33
1.231.87
1
.91.
13.14
9.51
18.00'
554.91«BOMB*
•• •• " •** .' 7' '-^LS^. ••*^*^:I'J'''^^|' ' t * ^ ' i ' i i ' " ' ^ V1 -'.
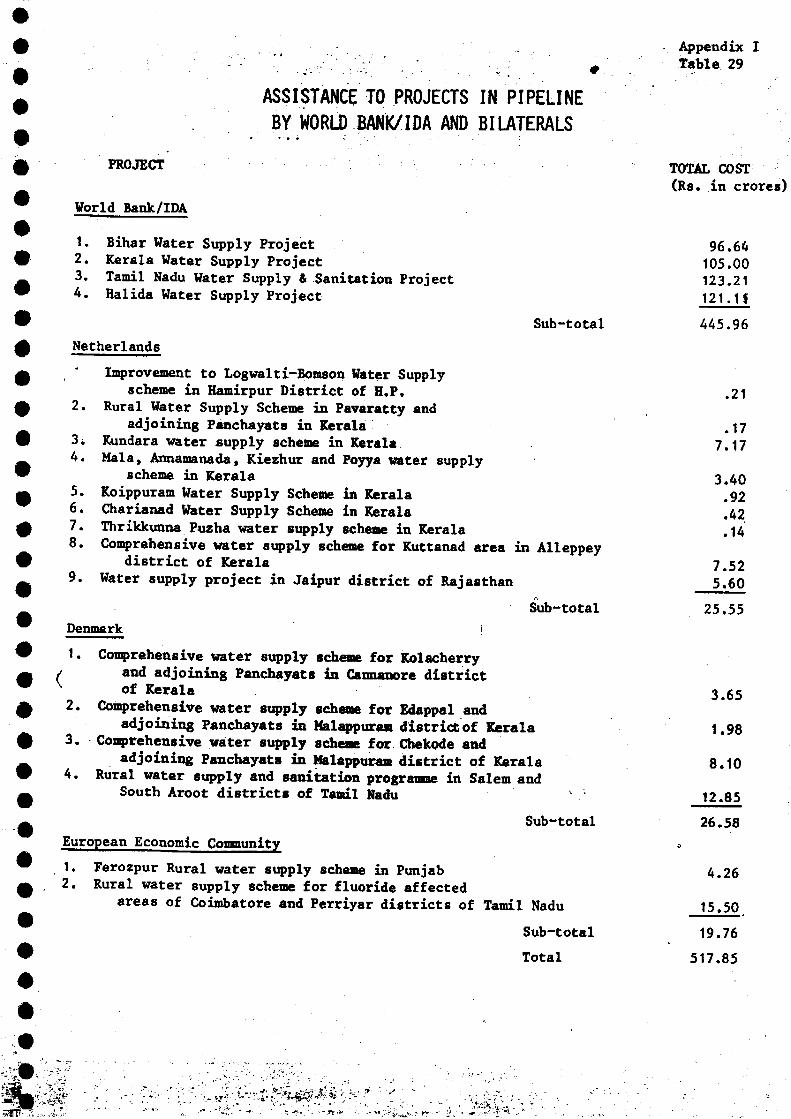
. Appendix I. : ." -"•• ; ' , ' . . , , - • ' ' • ' • ' . ' ] : - ; : ' . ' — • # " ' : . T a b l e . 2 9
ASSISTANCE TO PROJECTS IN PIPELINEBY WORLD BANK/IDA AND BILATERALS
' • • . . . . . - . - . - ; • • • . • • • • • . • • • ; • . . . .
PROJECT TOTAL COST
(Rs. in crores)
World Bank/IDA
1. Bihar Water Supply Project 96.642. Kerala Water Supply Project 105.003. Tamil Nadu Water Supply & Sanitation Project 123.214. Halida Water Supply Project 121.1$
Sub-total 445.96
Netherlands
' Improvement to Logwalti-Bomson Water Supplyscheme in Hamirpur District of H.P. .21
2. Rural Water Supply Scheme in Pavaratty andadjoining Panchayats in Kerala .17
3. Kundara water supply scheme in Kerala 7.174. Mala, Annamanada, Kiezhur and Poyya vater supply
scheme in Kerala 3.405. Koippuram Water Supply Scheme in Kerala !926. Charianad Water Supply Scheme in Kerala 427. Thrikkunna Puzha water supply scheme in Kerala .148. Comprehensive water supply scheme for Kuttanad area in Alleppey
district of Kerala 7.529. Water supply project in Jaipur district of Rajasthan 5.60
Sub-total 25.55
Denmark j
1. Comprehensive water supply scheme for Kolacherryj and adjoining Panchayats in Cannanore districtv of Kerala2. Comprehensive water supply scheme for Edappal and
adjoining Panchayats in Halappuram district of Kerala3. Comprehensive water supply scheme for Chekode and
adjoining Panchayats in Halappuram district of Kerala4. Rural water supply and sanitation programme in Salem and
South Aroot districts of Tamil Nadu l
Sub-total
European Economic Conwnttnjty =
1. Ferozpur Rural water supply scheme in Punjab 4.262. Rural water supply scheme for fluoride affected
areas of Coimbatore and Perriyar districts of Tamil Nadu
Sub-total
Total
. . . . . . . . . . . . . . , . • • ' •> • • • , " • " • . ' - , ' •'- ' . • • + ^ M;
: ' .l r
'
• i y v ' • " " • . ' " • . • • ; _ • • • . • * * ,-r ' " • • T i . , 1 ! ; , , - 1 , r.
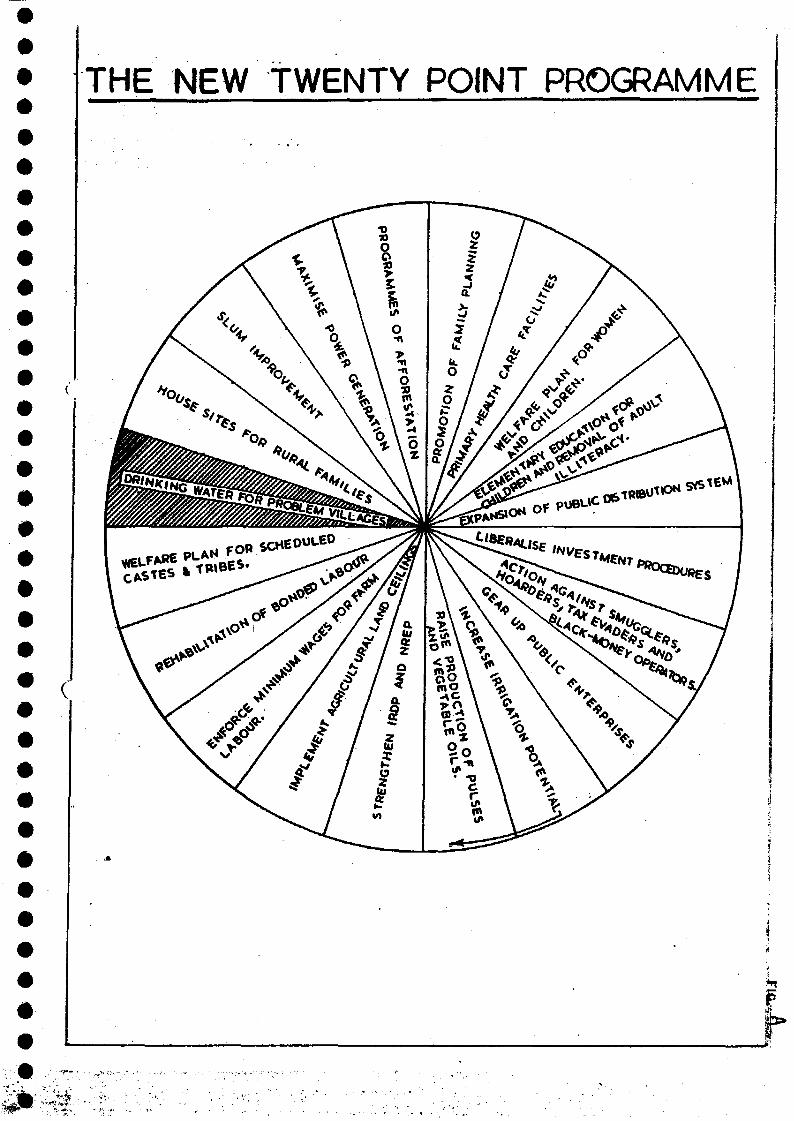
THE NEW TWENTY POINT PROGRAMME
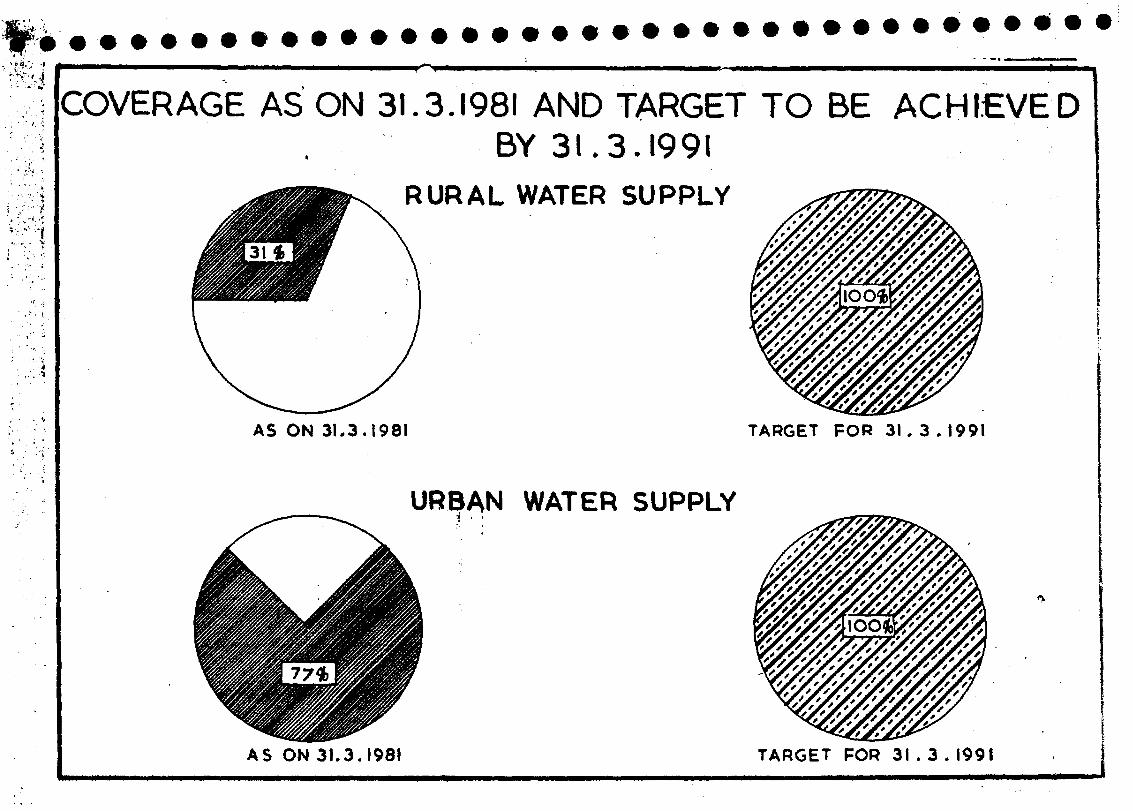
è • •
COVERAGE AS ON 31.3.1981 AND TARGET TO BE ACHIEVED, BY 31.3.1991
RURAL WATER SUPPLY
AS ON 31.3.1981 TARGET FOR 3 1 . 3 . 1991
URBAN WATER SUPPLY
AS ON 31.3.1981 TARGET POR 3 1 . 3 . 199!
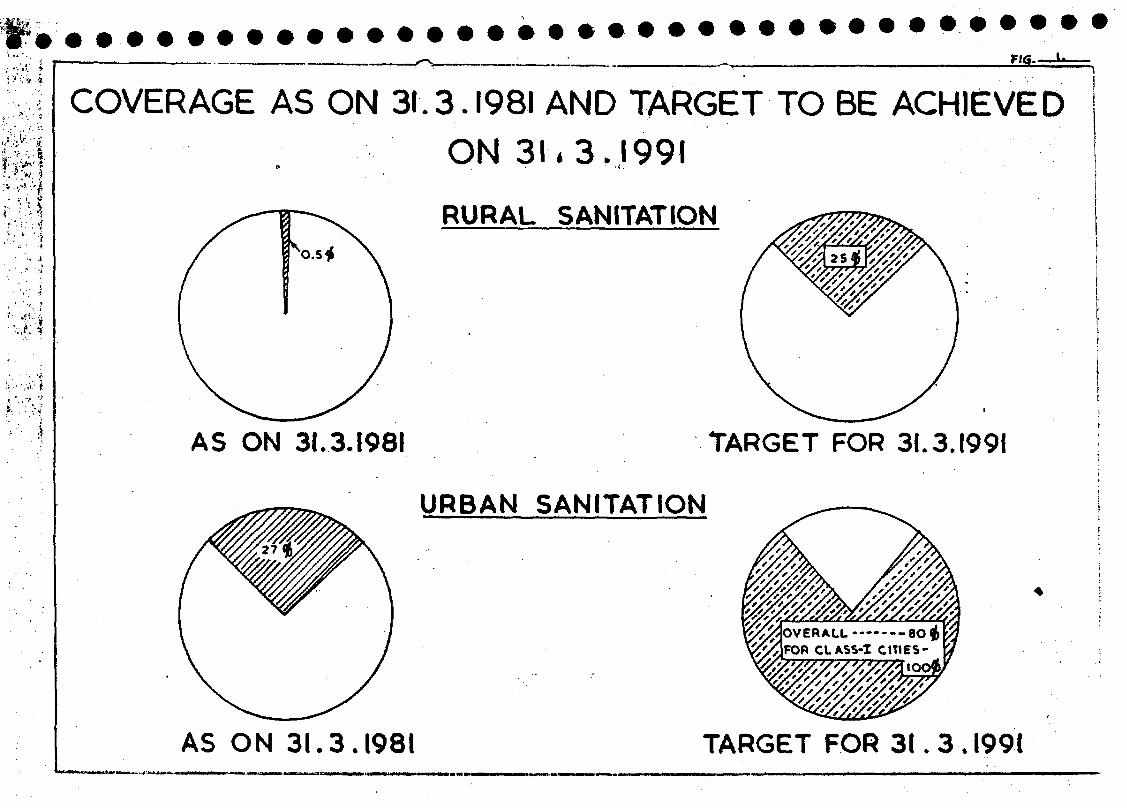
» ; • • • • • '
• ;: Ù':
COVERAGE AS ON 31.3.1981 AND TARGET TO BE ACHIEVEDON 31,3.1991
RURAL SANITATION
* f \ '<. .''•?'
AS ON 31.3.1981 TARGET FOR 31.3.1991
URBAN SANITATION
AS ON 31.3.1981 TARGET FOR 31.3.1991
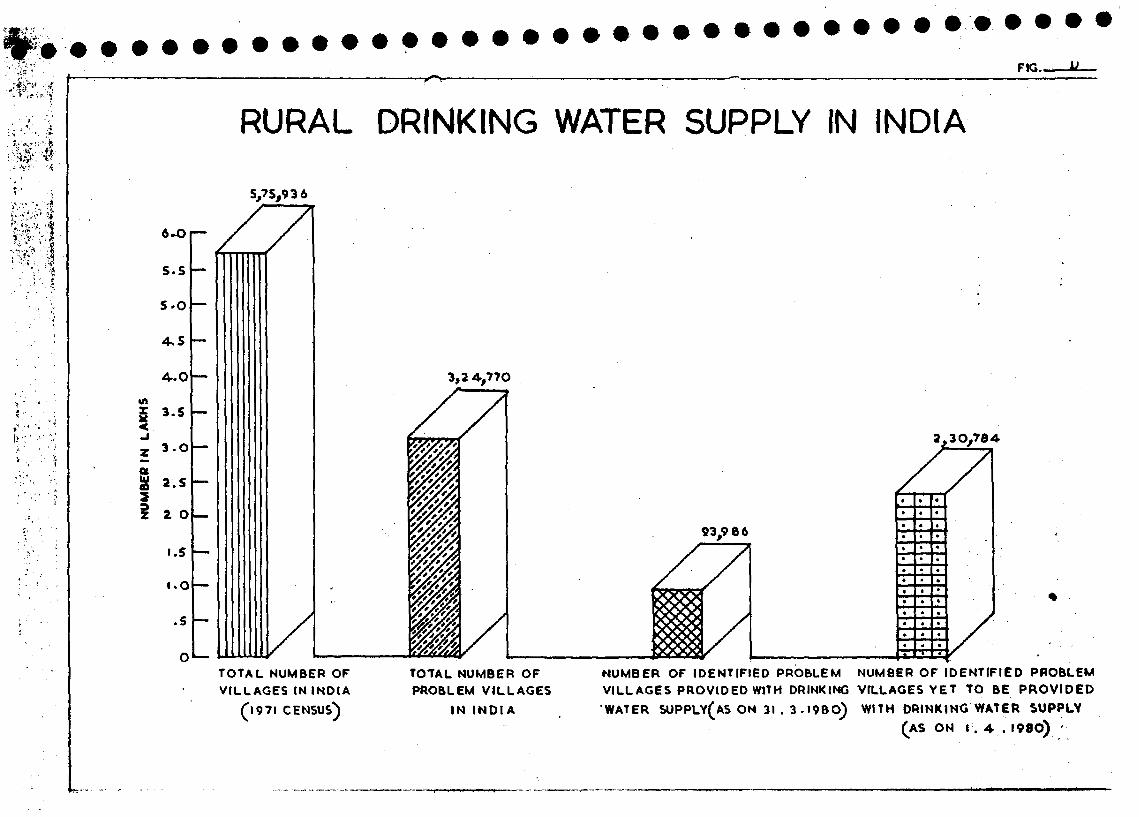
FIG LL
RURAL DRINKING WATER SUPPLY IN INDIA
5,75,936
2,30,784-
93,9 86
TOTAL NUMBER OF
VILLAGES IN INDIA
19 71 CENSUS)
TOTAL NUMBER OF
PROBLEM VILLAGES
IN INDIA
NUMBER OF IDENTIFIED PROBLEM NUMBER OF IDENTIFIED PROBLEM
VILLAGES PROVIDED WITH DRINKING VILLAGES YET TO BE PROVIDED
WATER SUPPLY(AS ON 31. 3-I9BO) WITH DRINKING WATER SUPPLY
(AS ON I . 4 . I98O) '
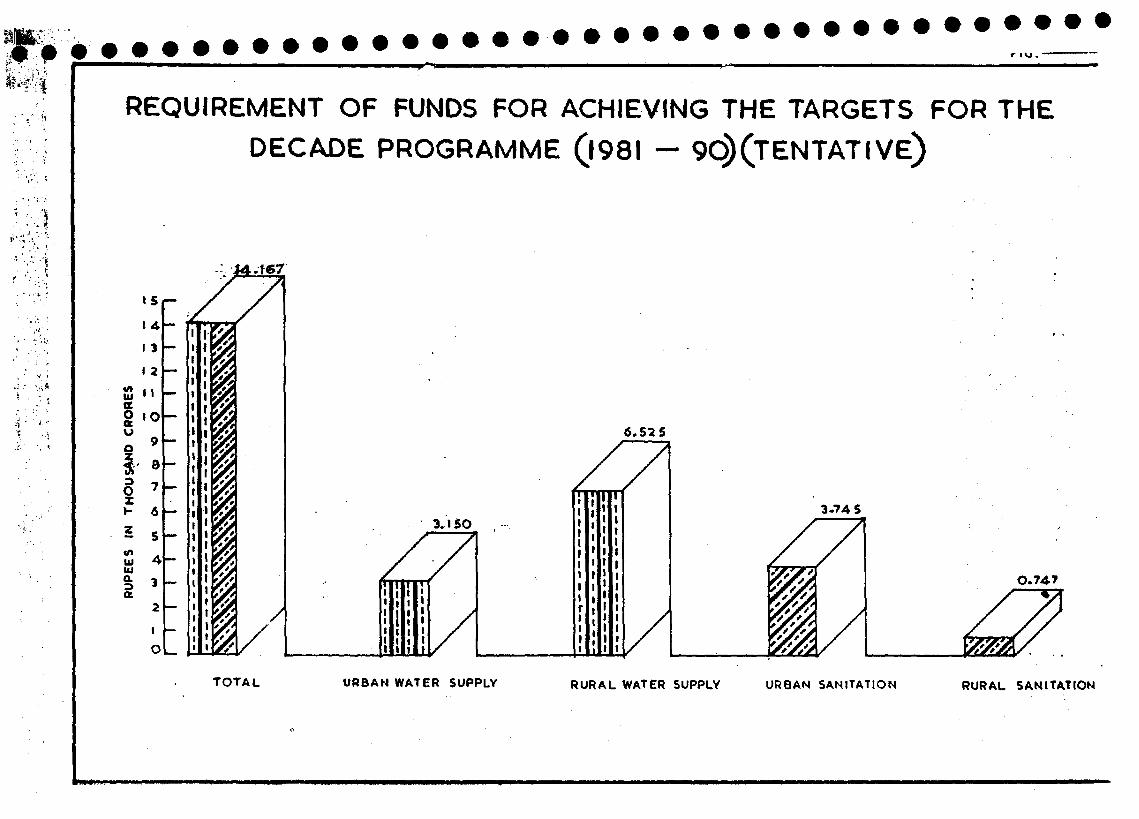
REQUIREMENT OF FUNDS FOR ACHIEVING THE TARGETS FOR THEDECADE PROGRAMME (|98I — ^ (TENTATIVE)
J4-.f67
«AUl
§
«AUUJ
aa.
s4
32I
O
9
a
6
S
4
3
2
I
O
TOTAL URBAN WATER SUPPLY RURAL WATER SUPPLY URBAN SANITATION RURAL SANITATION
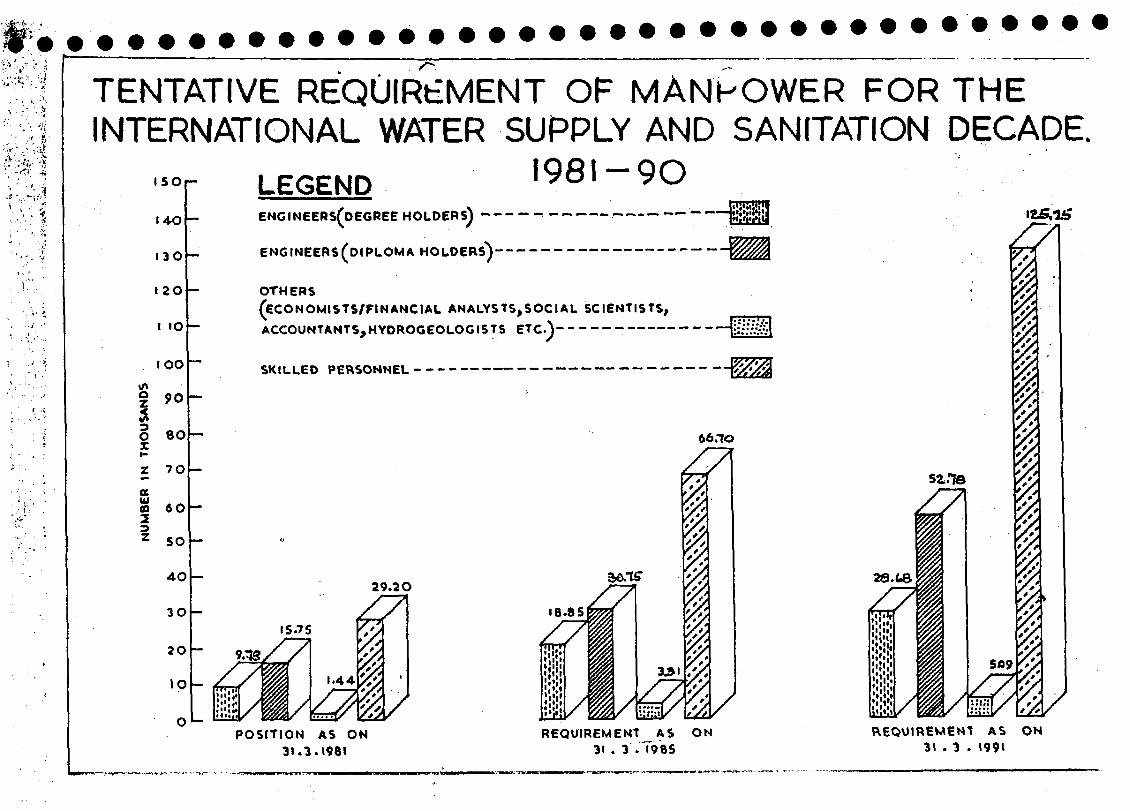
TENTATIVE REQUIREMENT OF MANPOWER FOR THEINTERNATIONAL WATER SUPPLY AND SANITATION DECADE.
15Or-
I4O -
I3O
120
t 10
too
§ 90
O 6OzZ 70aa 60
z SO
40
3O
2O
\O
O
LEGENDENGINEERS^OEGREE HOLDERS) - -
ENG(NEERS(D(PLOMA HOLDERS)-
I98I-9O
OTHERS(ECONOMISTS/FINANCIAL ANALYSTS,SOCIAL SCIENTISTS,
ACCOUNTANTS^HYDROGEOLOGISTS ETC.) •
SKILLED PERSONNEL-
#
^
29.2O
Z7\IS.7S
1.44É
S7\
2d.ceII
rri
Ii
POSITION AS ON31.3.1981
REQUIREMENT AS ON31 . 3 . 1985
REQUIREMENT AS ON31 . 3 . 1991
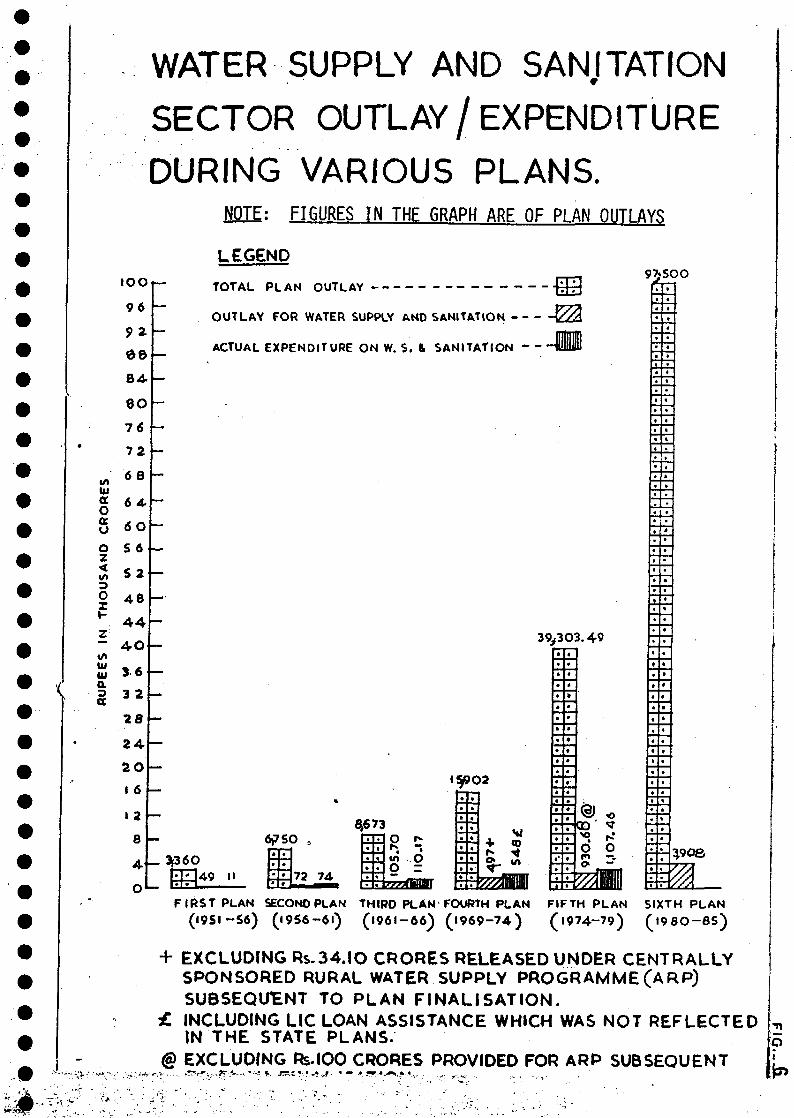
WATER SUPPLY AND SANJTATION
SECTOR OUTLAY/EXPENDITURE
DURING VARIOUS PLANS.: FIGURES IN THE GRAPH ARE OF PLAN OUTLAYS
too
96
92
1/1111aOauoz
oX
UJ11*aa
LEGEND
TOTAL PLAN OUTLAY
OUTLAY FOR WATER SUPPLY AND SANITATION
ACTUAL EXPENDITURE ON W. S. & SANITATION - -
84
8O
16
72
6 8
64
6O
S 6
S 2
48
444O
3 6
3 2
24
2O
I 6
i 2
8
4-^0
o l _
39,303.49
• 9902
6? SO8,573
72 74
*• 28 ?O O
95SOO
n
I
• / / /
FIRST PLAN SECOND PLAN THIRD PLAN-FOURTH PLAN FIFTH PLAN SIXTH PLAN(I9SI-S6) ( I9S6-6I) (1961-66) (1969-74) ( l974~79) («98O-8S)
+ EXCLUDING Rs.34.lO CRORES RELEASED UNDER CENTRALLYSPONSORED RURAL WATER SUPPLY PROGRAMME (ARP)SUBSEQUENT TO PLAN FINALISATION.
£ INCLUDING LIC LOAN ASSISTANCE WHICH WAS NOT REFLECTEDIN THE STATE PLANS-
@ EXCLUDING Rs-100 CRORES PROVIDED FOR ARP SUBSEQUENT
Tl
5
v > •-
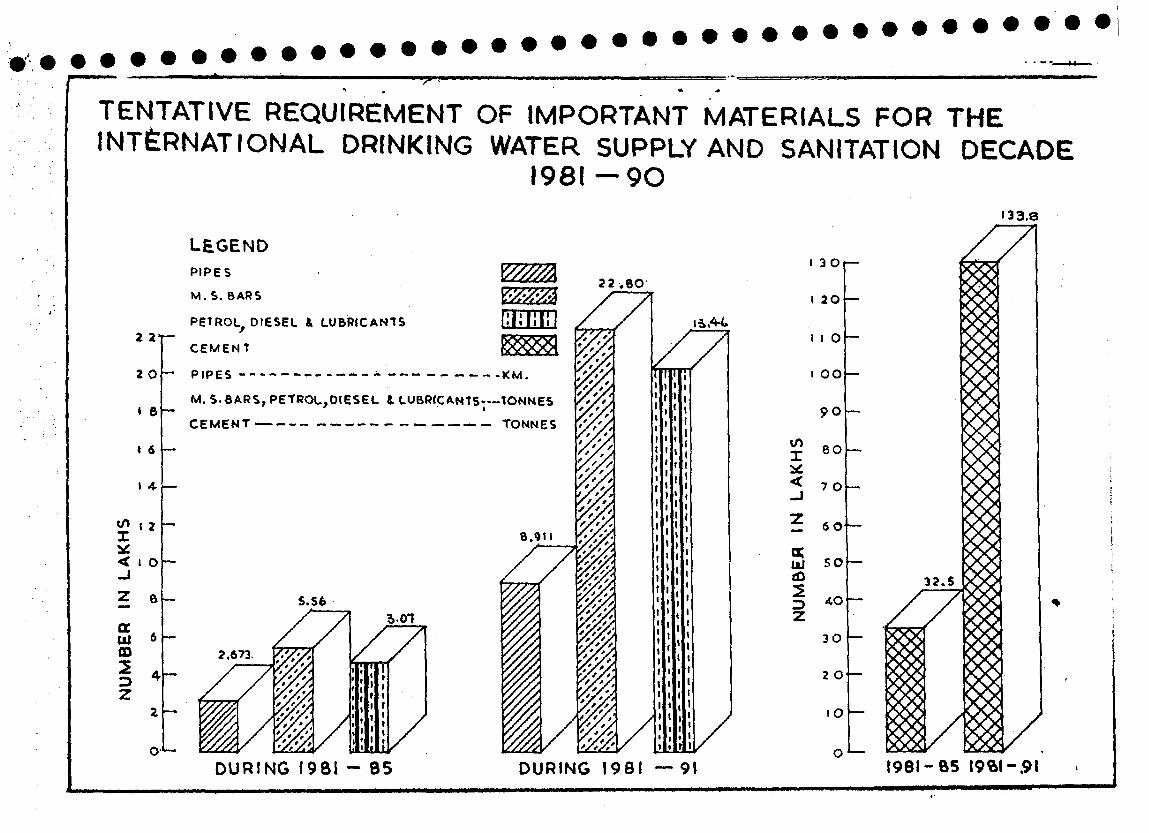
Z2
JO
( 6
t 6
I 4
ceUJmi
LEGENDPIPES
M.S. BARS
PETROL, DIESEL & LUBRtCANtS
CEMENT
PIPES- - - K M .
M. S.6ARS, PETROL,D,ESEL 1 LUBP(CANTS..-.tONNESCEMENT '
TONNES
22 .8O '
S.S63.01
DURING I9B1 - 85
I33.Q
I 3O
I 2O
I I O
i OO
£ 8O
< ,0
? «e
Ul 50(Û
3 40Z
3O
2 O
10
O
DURING I98I —
VOLUME I
PART I
APPENDIX II
NATIONAL WATER RESOURCES
I PART I
) '• Appendix II
I| NATIONAL WATER RESOURCES
1. PHYSIOGRAPHICAL DIVISIONS
India has seven physiographical divisions consisting of the NorthernP Mountains, Great Plains, Central Highlands, Peninsular Plateau, East-coast^ and West-coast belts and the Islands.
* 2. RIVER SYSTEMS
f) The river systems of India are classified in two groups, theperennial rivers of Himalayan region and the rivers of peninsular India.
9 The former which are fed by the melting snows and glaciers of the great_ / Himalayan range are often uncertain and conspicuous in their behaviour. Some^ ' of the rivers in the Himalayan range meander and are subject to drastic£ changes of course, particularly following landslides and earthquakes caused
by seismic activity. The dry weather flows are significantly enhanced by0 water from melting snow and glaciers, which dry period is in the winter.
W The rivers of peninsular India originate at much lower elevations and^ flow through areas which are geologically more stable. They are more^ predictable in their behaviour and their flows are characterised by heavyA discharges during monsoons followed by low discharges during rainless months.
f 3. RAINFALL
W The total volume of water source replenishment by preciptation is ofmajor significance, Precipitationn varies greatly, however, not only in
™ distribution but in extent and in timing, depending on metereological and& atmospheric conditions and on physical conditions which prevail on the land
. surface.
There are tracts where the rainfall is heavy with the highest annual0 rainfall in the world occurring in Assam. The maximum annual rainfall ever
recorded of 1,042 inches occurred in this State. In some areas, there is• a scarcity of rainfall, less than five inches with an average annual rainfall_ of about 45 inches. Map 1 shows the distribution of rainfall throughout the™ country. There are two distinct monsoons, the Southwest monsoon startingA at the southern most point in Kerala in May and sweeping across the entire
country during June to September, and the Northeast monsoon occurring in0 October to March with reduced precipitation and confined to Kerala, Tamil
Nadu and a few showers in the Northern States of Punjab, Uttar Pradesh and0 Bihar. Due to deep deposits of alluvium in the Gangetic basin and some
coastal regions and fault zones in river basins like Narmada, there are9 large areas of exploitable ground water in storage available as potential& water supply sources.
9 4. SURFACE WATER RESOURCES
O In 1945-46 the Central Water 4 Power Commission was established andstarted the scientific assessment of the country's water resources. The
W Commission has collected statistical data from different agencies and StatesA and conducted investigations and compiled measurements from several gauging^ stations on river basins.
- 2 -
It has been estimated that the total annual flow of all river systemsin India is approximately 1,672,600 million cubic meters (1,357 million acre-feet). Table 1 shows details of river system-flows and Table 2 basin reservoirstorage. Map 2 shows India's rivers and drainage basins.
5. GROUND WATER RESOURCES
5.1 Ground Water Potential
Estimation of ground water resource potential and extent of itsutilisation in various parts of the country is, by and large, based ondifferent empirical methods adopted from time to time. Significant stepswere taken only in the last decade when extensive and intensive scientificstudies through multi-disciplinary ground water projects were undertaken bythe Central Ground Water Board (CGWB) and some State ground water organisationsto evaluate the ground water resource available for development. Most ofthe country still remains to be subjected to such detailed studies, and untilthen, ground water resource estimates for various parts of the country willcontinue to vary greatly in both accuracy and orders of magnitude.
5.2 Effective Use of Ground Water
The unused ground water potential is one of the principal assets ofa Nation that is demanding more water each passing year. When properly used,this water will help assure an adequate supply of drinking waterand other domestic needs, provide the needs of growing industry and ensurestable sources for irrigation demands and other water requirements.At present approximately 50 per cent of the irrigation demands in Indiaare being met from ground water sources.
There are three important soil and rock formations in the country,which have a bearing on ground water yields. A very large portion of thenation, nearly 1.2 million sq km consists of consolidated hard rock formationscomprised of either trap bassalts or other types of rocks, such as slates,granites and gneisses. As these rocks have little pore space, ground wateroccurs only in the weathered porous mantle or in physical openings of joints,fractures and shear planes in the rock mass. In inter-trappean formations,water is sometimes found between layers and these areas are generally consideredto support only dug wells, but in some cases, however, borewells have yieldedfrom 10,000 to 30,000 gallons per day.
In the semi-consolidated formation, which cover about50,000 sq km,sedimentary rock formations of sandstone, limestone andconglomerates occur. They generally have characteristics of excellentporosity. These formations occur in Rajasthan, Gujarat and Tamil Nadu. Tube-wells and deep dug wells are feasible in these formations and can yield goodamounts of water.
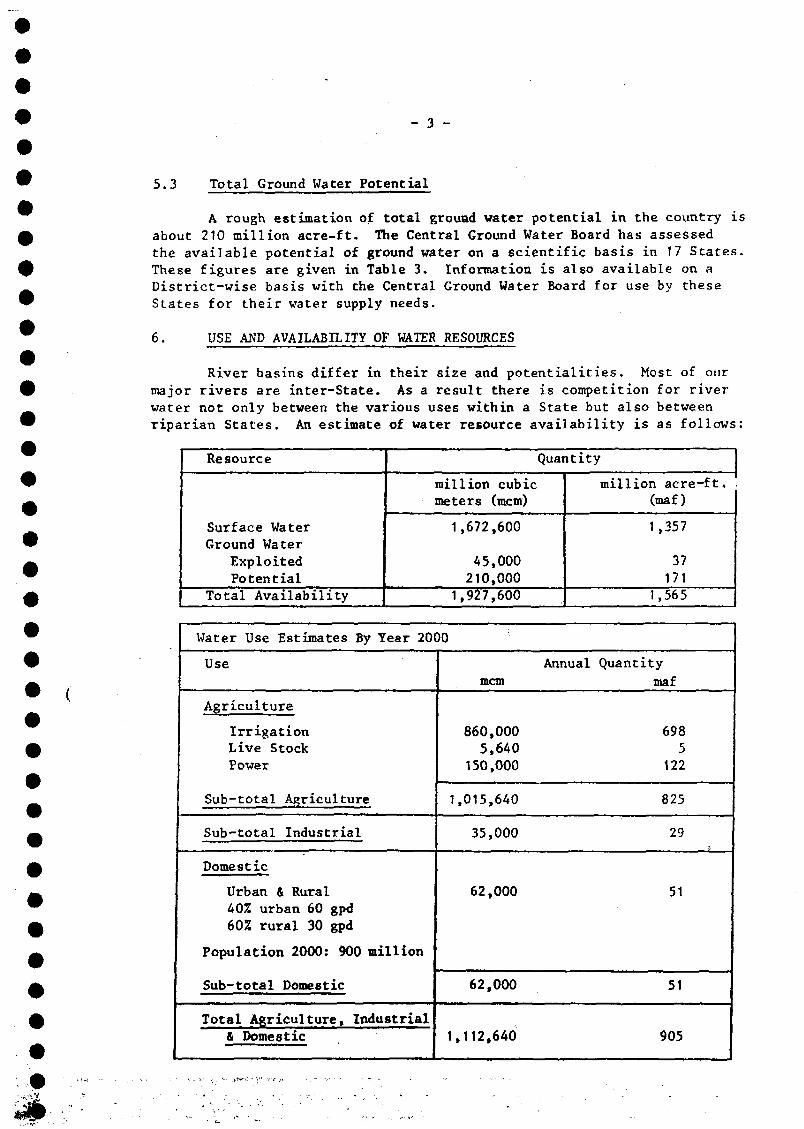
- 3 -
5.3 Total Ground Water Potential
A rough estimation of total ground water potential in the country isabout 210 million acre-ft. The Central Ground Water Board has assessedthe available potential of ground water on a scientific basis in 17 States.These figures are given in Table 3. Information is also available on aDistrict-wise basis with the Central Ground Water Board for use by theseStates for their water supply needs.
6. USE AND AVAILABILITY OF WATER RESOURCES
River basins differ in their size and potentialities. Most of ourmajor rivers are inter-State. As a result there is competition for riverwater not only between the various uses within a State but also betweenriparian States. An estimate of water resource availability is as follows;
Resource
Surface WaterGround Water
ExploitedPotential
Total Availability
Quantity
million cubicmeters (mem)
1,672,600
45,000210,000
1,927,600
million acre-ft.(maf)
1,357
37171
1,565
Water Use Estimates By Year 2000
Use
Agriculture
IrrigationLive StockPower
Sub-total Agriculture
Sub-total Industrial
Domestic
Urban & Rural40% urban 60 gpd60Z rural 30 gpd
Population 2000: 900 million
Sub-total Domestic
Total Agriculture, Industrial
& Domestic
1
1
mem
860,0005,640
150,000
,015,640
35,000
62,000
62,000
,112,640
Annual Quantity
maf
6985
122
825
29
51
51
905
- 4 -
Though there is an adequate amount of water, there are a number ofdifficulties and constraints in the availability and uses of the water bythe entire nation.
There are serious hydrological limitations in the availability ofwater resources in different regions of the country and for planning its
maximum utilization.
While the major use of water resources has been and will continue to befor irrigation because of the large demands in comparison to other needs, themost important use of water resources relative to the health and welfare ofthe people is for drinking water supplies for cities, towns and villages. Inthe years ahead more water will be needed for industries, river conservancy,stream pollution abatement, ground water sullage, reclamation of land,recreation and the preservation of wild life.
To meet the various long term requirements in an orderly manner, thereshould be an established priority for water use. The priority accorded toany particular requirement vis-a-vis others should depend upon its economiccontribution and its significance to the well being of people. Drinking watersupplies and other domestic requirements must be given the highest priority.Industries and commerce, major contributors to the nations economy, userelatively small quantities of water but their requirements are essential tocontinued operation and should receive a high priority.
Water pollution control should intensified as the discharge of existingand future industrial waste effluents into the nation's streams will affectwater quality and create serious problems for the towns and villages thatuse these rivers and streams as their water sources.
Long term planning for the development of water resources should notonly take into account quantitative water requirements, but also should beconcerned with source determination, surface or ground, and the selection ofsources best suited to;the particular requirements of both quality and quantity.Unless water resources are marked for specific purposes, unbalances may occurwith less expensive sources committed to those purposes that can affordhigher costs, while the more expensive sources remain committed to thosepurposes Instable to afford them, which may prove to be unreasonably burdenscre,
May 3 shows difficult and problem .areas in respect of drinking watersources.
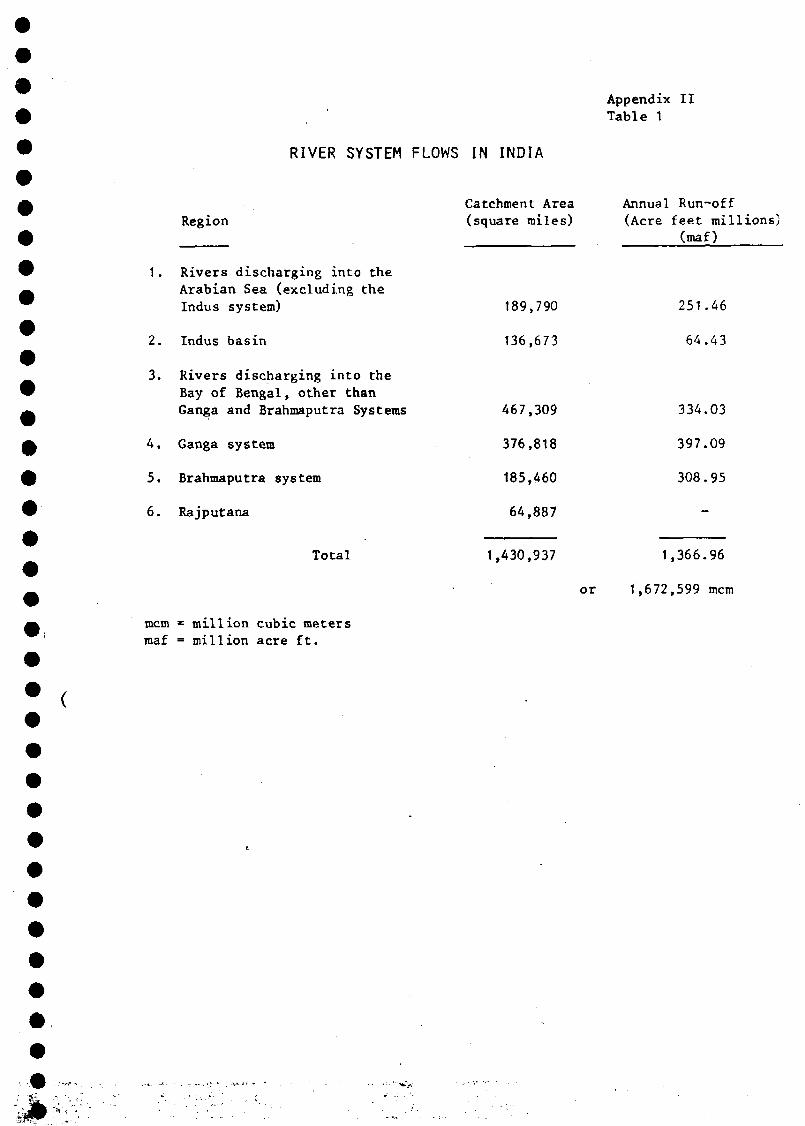
RIVER SYSTEM FLOWS IN INDIA
Appendix I ITable 1
Region
1. Rivers discharging into theArabian Sea (excluding theIndus system)
2. Indus basin
3. Rivers discharging into theBay of Bengal, other thanGanga and Brahmaputra Systems
4. Ganga system
5. Brahmapu tra sys tern
6. Rajputana
Total
Catchment Area(square miles)
189
136
467
376
185
64
,790
,673
,309
,818
,460
,887
Annual(Acre
Run-offfeet millions)(maf)
251
64,
334,
397.
308.
.46
.43
.03
,09
.95
1,430,937 1,366.96
or 1,672,599 mem
mem * million cubic metersmaf = million acre ft.
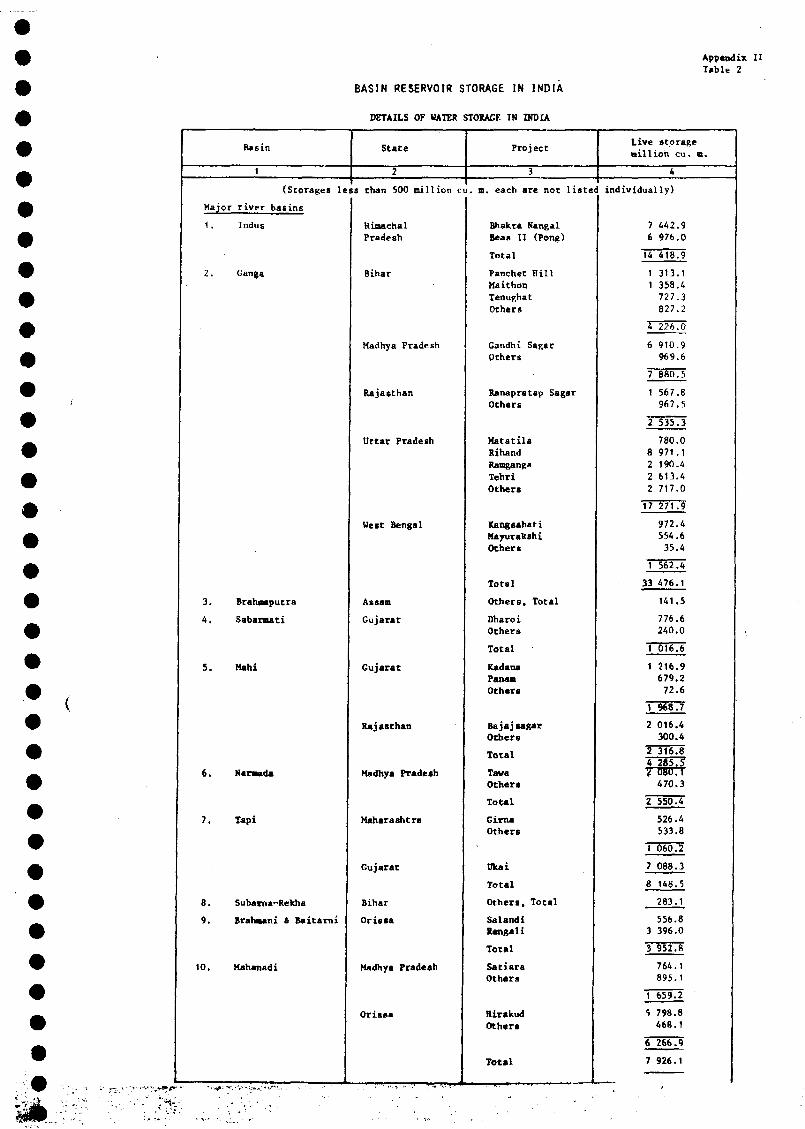
Appendix IITable 2
BASIN RESERVOIR STORAGE IN INDIA
DETAILS OF HATER STORAGE IN INDIA
Basin State ProjectLive storagemillion cu. n
(Storages less than 500 million cu
Major r iver bating
each are not l i s ted individually)
1. Indus
2. Ganga
3.
4.
5.
Brahmaputra
Sabarmati
Mahi
6. Namada
Tapi
8. Subaroa-Rekha
9, Brahnani & Bai tami
10. Mahanadi
HimachalPradesh
Bihar
Madhya Pradesh
Rajatthan
Utear Pradesh
West Bengal
Assam
Gujarat
Gujarat
Hajasthan
Madhya Pradech
Maharashtra
Gujarat
Bihar
Orissa
Madhya Pradesh
Oris>a
Bhakra NangalBean II (Pong)
Total
Panchet HillMaithonTenughatOthers
Gandhi SagarOthers
Ranapratap SagarOthers
MatatilaRihandRamganga
TehriOthers
KangaabatiMayurakshiOther*
Total
Others, Total
Dharo iOthers
Total
Kadana
PanamOthers
Bajaj «agar
Others
Total
TawaOther*
Total
GirnaOthers
Dkai
Total
Others, Total
SalandiRengali
Total
SatiaraOthers
HirakudOthers
Total
7 442.96 976.0
U 418.9
6 910.9969.6
2 535.3
776,6240.0
1 968.7
556.83 396.0
3 952.8
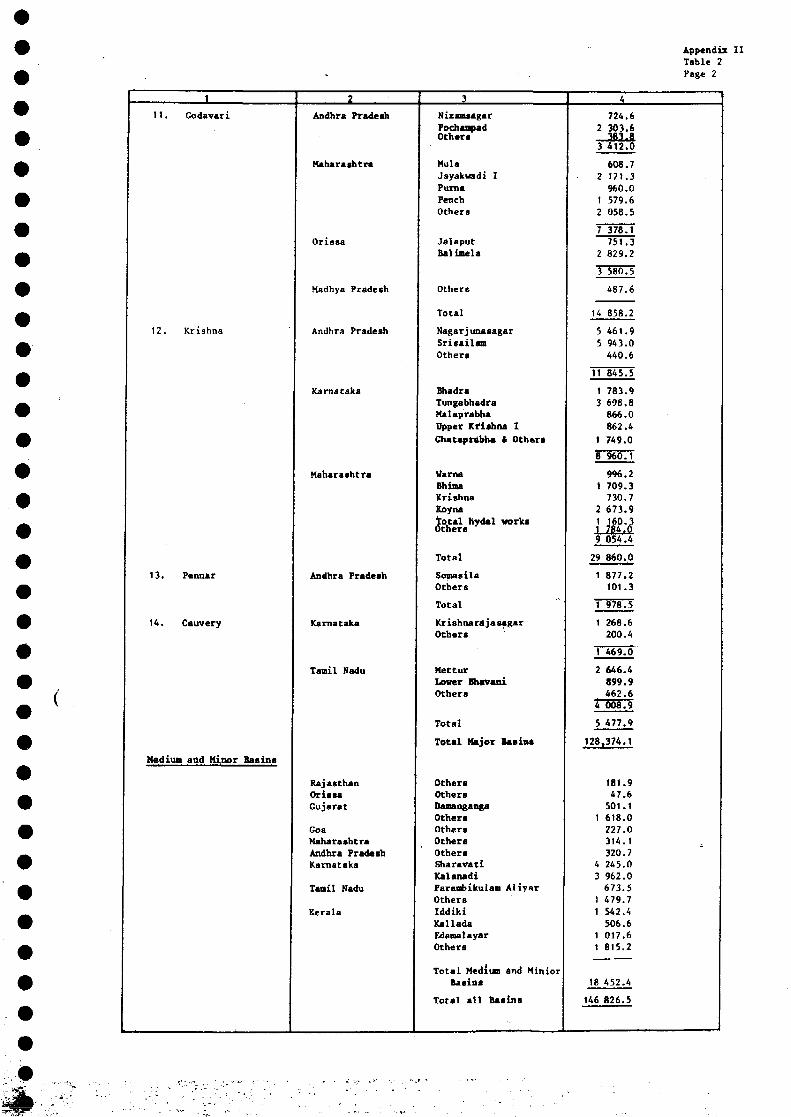
Appendix IITable 2Page 2
1
11. Godavari
12. Krishna
13. Pcnnar
14. Cauvery
Medium and Minor Basins
2
Andhra Pradesh
Maharashtra
Orissa
Madhya Pradesh
Andhra Pradesh
Karnataka
Maharashtra
Andhra Pradesh
Karnataka
Tamil Nadu
RajasthanOrisuGujarat
GoaMaharashtraAndhra PradeshKarnataka
Tamil Nadu
Kerala
3
NizamsagarPochanpadOthers
MulaJayakvadi IPumaPenchOthers
JalaputBalimela
Others
Total
NagarjunasagarSrisailamOthers
Bhadr*TungabhadraMalaprabhaDipper Krishna IGhataprabha t Others
WarnaBhimaKrishnaKoynato ta l hydel worksOthers
Total
SomasilaOthers
Total
KrishnarajasagarOthers
MetturLower BhavaniOthers
Total
Total Major Basin*
OthersOthersDamangangaOthersOthersOthersOthersSharavatiXalanadiParaubikulam AliyarOthersIddikiKalladaEdanalayarOthers
Total Méditas and MiniorBasins
Total a l l Basins
4
724.62 303.6
3 412.0
608.72 171.3
960.01 579.62 058.5
7 378.1751.3
2 829.2
3 580.5
487.6
14 858.2
5 461.95 943.0
440.6
11 845.5
1 783.93 698.8
866.0862.4
1 749.0
6 960.T
996.21 709.3
730.72 673.9
UË19 054.4
29 860.0
1 877.2101.3
1 978.5
1 268.6200.4
1 &69.Ô
2 646.4899.9462.6
i 008.9
5 477.9
128,374.1
181.947.6
501.11 618.0
227.0314.1320.7
4 245.03 962.0
673.51 479.71 542.4
506.61 017.61 815.2
18 452.4
146 826.5
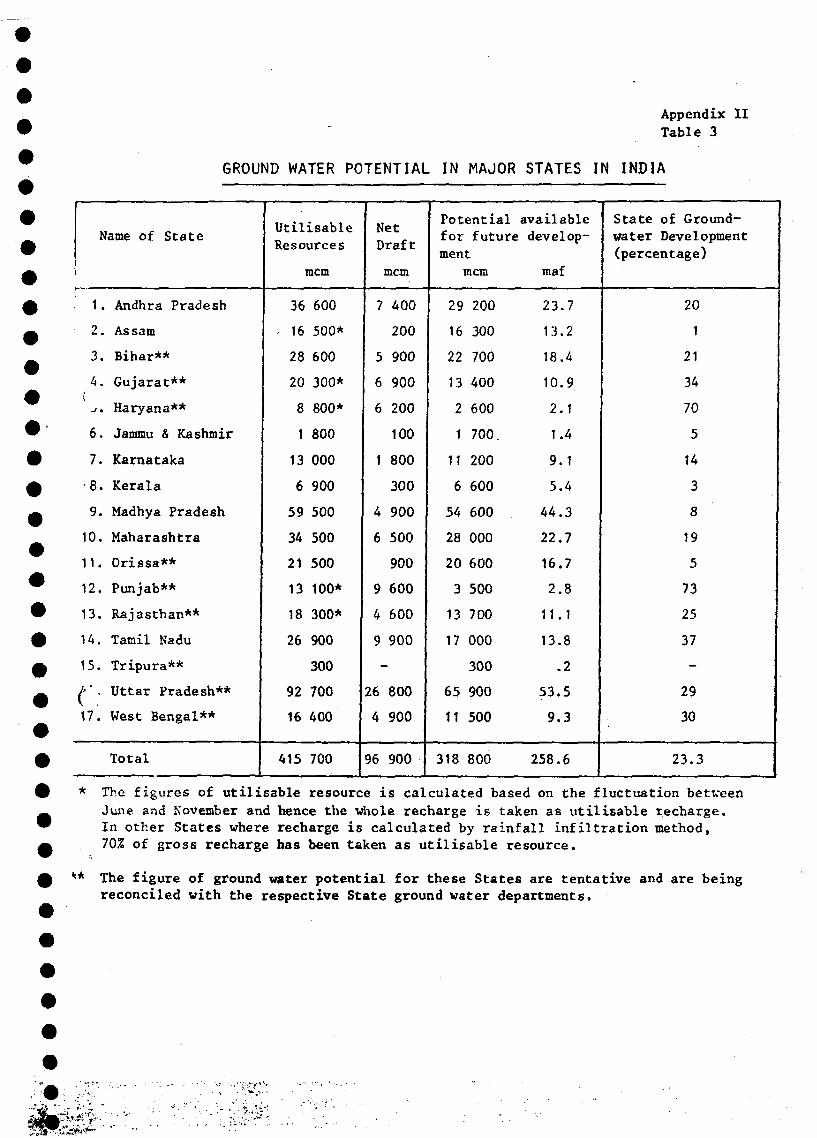
Appendix IITable 3
GROUND WATER POTENTIAL IN MAJOR STATES IN INDIA
1; 12
3
4
(
6
7
•8
9
10
11
12
13
14
15
('17
Name of State
. Andhra Pradesh
. As sam
. Bihar**
. Gujarat**
. Haryana**
. Jamrau & Kashmir
. Karnataka
. Kerala
. Madhya Pradesh
. Maharashtra
. Orissa**
. Punjab**
. Rajasthan**
Tamil Nadu
Tripura**
Uttar Pradesh**
West Bengal**
Total
UtilisableResources
mem
36 600
16 500*
28 600
20 300*
8 800*
1 800
13 000
6 900
59 500
34 500
21 500
13 100*
18 300*
26 900
300
92 700
16 400
415 700
NetDraft
mem
7 400
200
5 900
6 900
6 200
100
1 800
300
4 900
6 500
900
9 600
4 600
9 900
-
26 800
4 900
96 900
Potentialfor futurement
mem
29 200
16 300
22 700
13 400
2 600
1 700
11 200
6 600
54 600
28 000
20 600
3 500
13 700
17 000
300
65 900
H 500
318 800
availabledevelop-
maf
23.7
13.2
18.4
10.9
2.1
1.4
9.1
5.4
44.3
22.7
16.7
2.8
11.1
13.8
.2
53.5
9.3
258.6
State of Ground-water Development(percentage)
20
1
21
34
70
5
14
3
8
19
5
73
25
37
-
29
30
23.3
* The figures of utilisable resource is calculated based on the fluctuation betweenJune and November and hence the whole recharge is taken as utilisable recharge.In other States where recharge is calculated by rainfall infiltration method,70% of gross recharge has been taken as utilisable resource.
** The figure of ground water potential for these States are tentative and are beingreconciled with the respective State ground water departments.
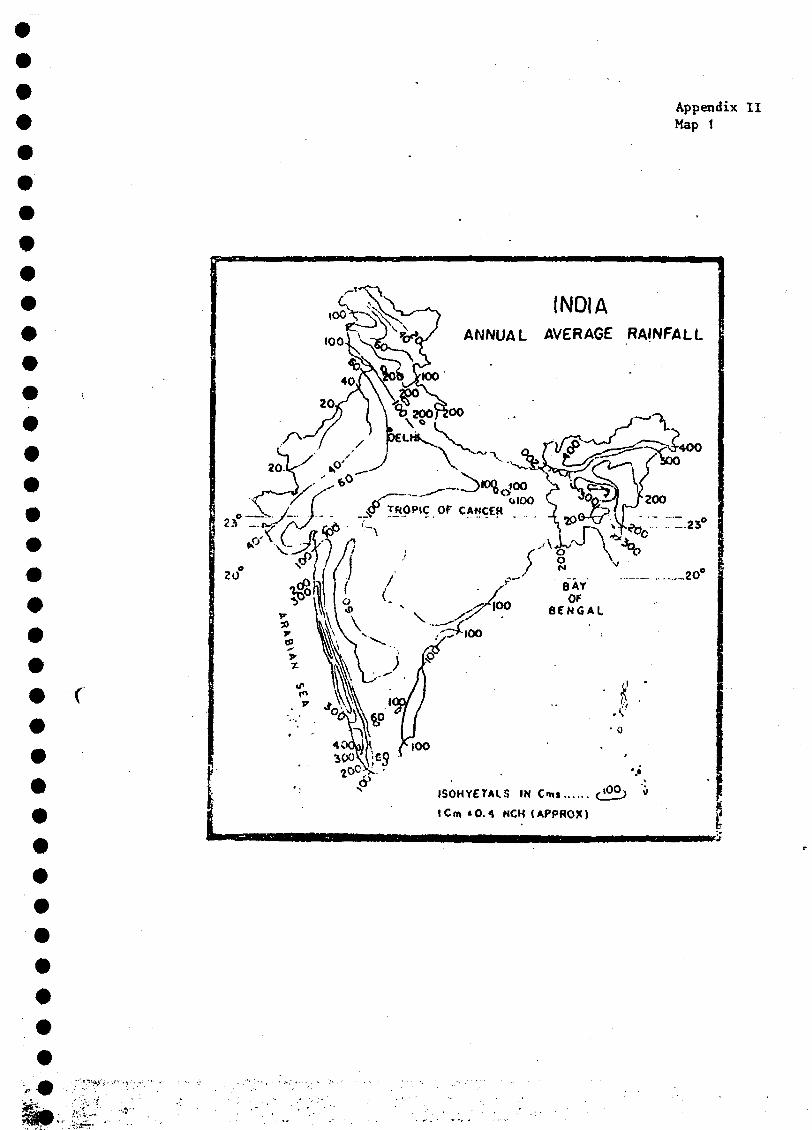
Appendix I IMap 1
r
INDIAANNUAL AVERAGE RAINFALL
ISOHYETAIS IN
I Cm «0.4 NCM (APPROX)
" . • ' * * ? : •
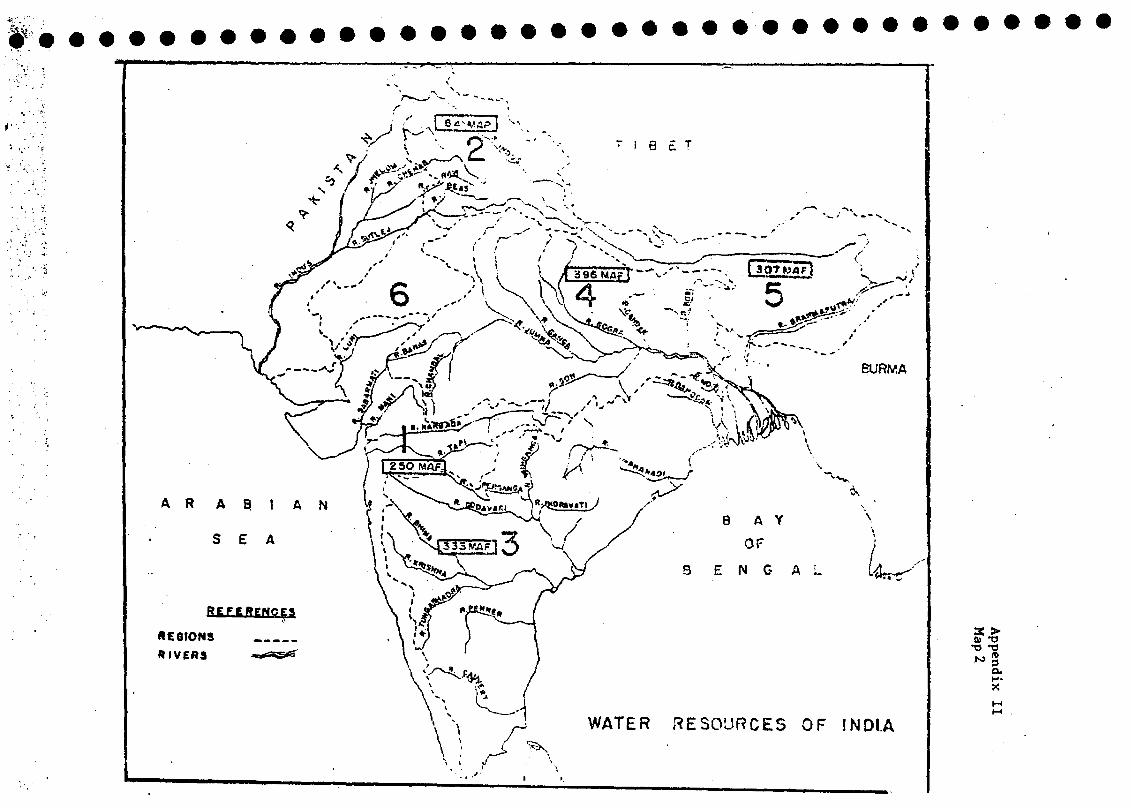
/ V - '
4 — -
I 2SOMAf3
9 E N G A L
REGIONSHIVERS
WATER RESOURCES OF INDIA
•O 13
H-
X
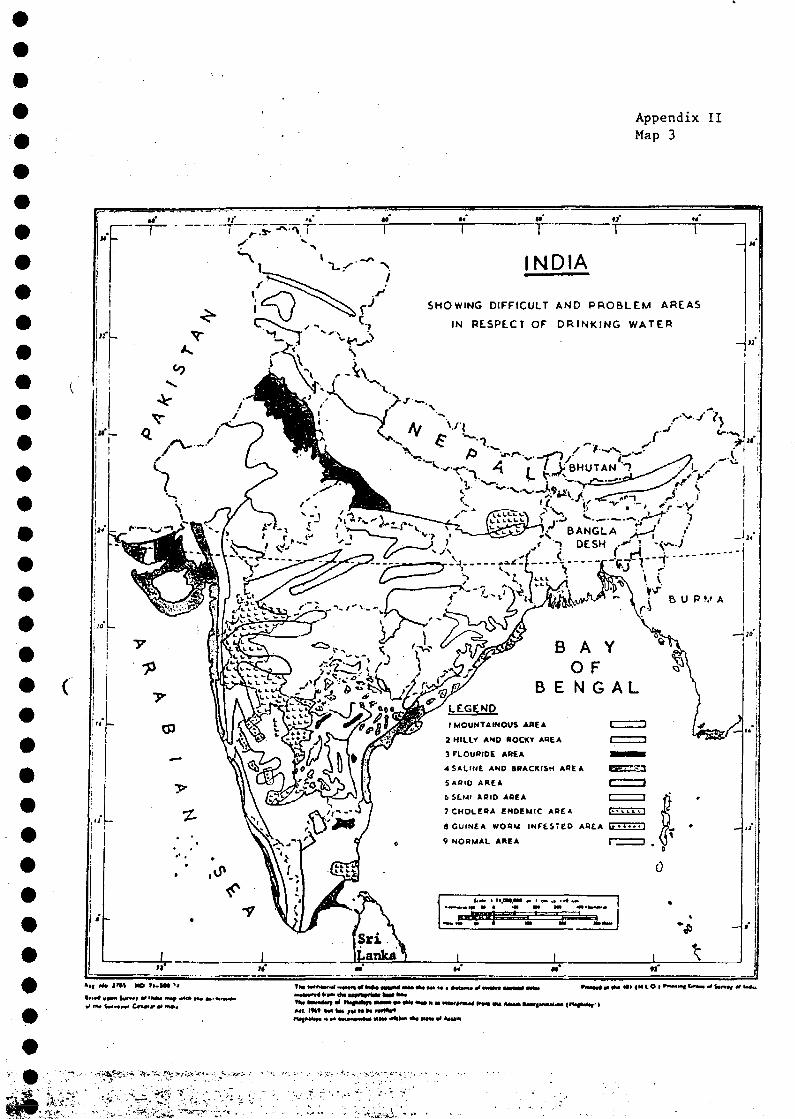
Appendix IIMap 3
SHOWING DIFFICULT AND PROBLEM AREAS
IN RESPECT OF DRINKING WATER
LEGEND(MOUNTAINOUS AR£A
2HILLV AND «OCKÏ AREA
3 FLOUBIDE AREA
4 SALINE AND BRACKISH AREA
SARIO AREA
6 SEMI ABID AOEA
7CMOLEOA ENDEMIC AREA
«GUINEA WORM INFESTED AREA
« NORMAL AREA
•I M* I'll Mtl-t*» J imrttf * M i
VOLUME I
PART II
A P P E N D I X III
EXECUTIVE SUMMARIES OF DECADE PLANS IN WATERSUPPLY AND SANITATION FOR STATES AND UNION TERRITORIES
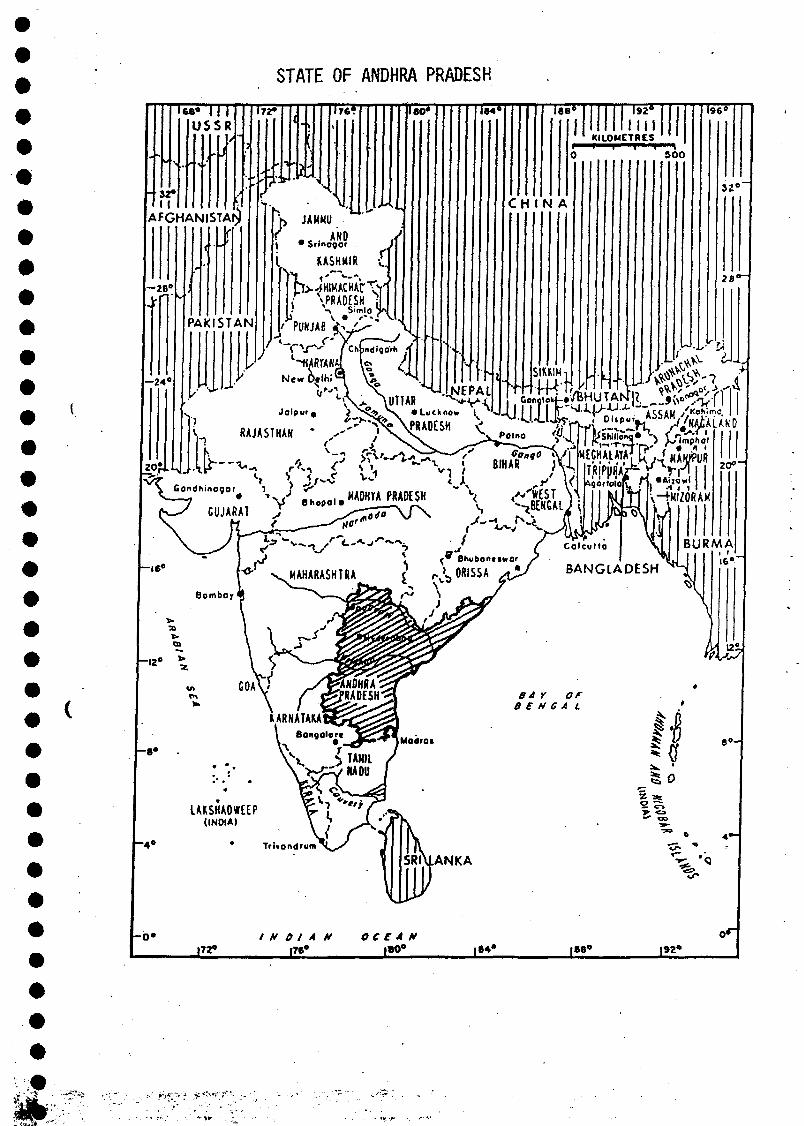
STATE OF ANDHRA PRADESH
v RAJASTHAN * e*'' j
dhmoaor 1 ? C>
BÂ Y OFB £ N G J> L
EXECUTIVE SUMMARYOF
THE DECADE PLAN OF WATER SUPPLY ANDSANITATION SECTOR (APRIL 1981 - MARCH 1991)
FOR
ANDHRA PRADESH
1. INTRODUCTION
The State of Andhra Pradesh with an area of 277,000 Square Kilo-metres and population of 51.40 Million is the fifth largest State in Indiaand also the fifth in rank in population accounting for 8.4% of the areaand 7.9 per cent of the population of the country. It is situated in thesouth-eastern part of India. The State was formed on 1st November, 1956by merging Telangana area of the erstwhile Hyderabad State with the thenAndhra State. Hyderabad is the capital of the State and the state capitalis also popularly referred to as Twin Cities (Metropolitan Hyderabad) .During the first Five Year Plan (1951-56) provision for water supply andsanitation was included under 'Health' in the category of 'SOCIAL SERVICES'In subsequent plans, however, separate provision is being made for 'WATERSUPPLY AND SANITATION', but it is continued under the category of 'SOCIALSERVICES'.
• The State of Andhra Pradesh is boynded on the
north by Orissa and Madhya Pradesh States and on the south by Tamilnadu.Karnataka and Maharashtra states about the Western boundaries of the Stateand the Bay of Bengal is on the east.
The climate is generally tropical monsoon and is characterised byhot-summers and mild winters. A greater part of the state falls under'Tropical Savannah A.W.'. While the humid coastal belt and comparativelydry districts are classified as 'Moist tropical' and the 'Dry Steppe'physiography as per Kooppens classification.
The state receives about two thirds of its rainfall from south-west monsoon from June to September and about one fourths from North-east monsoons between October and December. The mean rainfall is 894mm.
Three distinct physiographic regions exist in the State - l)CoastalPlain with elevation ranging upto 200 meters above the mean sea level,sloping from west and east, li) Eastern Ghats which range in the northeast and south-west direction with an elevation of 610 to 1220 M abovethe mean sea level, lii) Western Pene Plain which forms part of DeccanPlateau and is characterised by gentle slopes and rolling topography withflat undulating tracts interspersed by valleys.
*•>..£
: 2
2. SOCIO-ECONOMIC INDICATORS
In Andhra Pradesh, 47.IX of the stat's area of 2,76,814 K.K.is considered to be chronically drought affected. Another 42.3% of thearea of the State comprises of backward areas which also include tribalareas. Thus about 89.4 per cent of the area of the State is eitherchronically drought affected or economically backward. The per capitaincome of the State is also among the lowest in India. Andhra Pradeshstate deserves highest priority consideration in the InternationalDrinking Water Supply and Sanitation programme as such.
There are 23 districts in the state which are broadly groupedinto three regions (i) Coastal Andhra (area 93,000 Sq.K.M.), (ii) Rayala-seema (area 69,000 Sq.K.M.) and (iii) Telengana (area 115,000 Sq.K.M.).The three regions differ considerably from each other in their social andeconomic conditions. The Coastal Andhra Region is dominated by fertiledelta of Krishna and Godavari rivers but ending in the north in aneconomically backward and prédominently tribal strip. Rayalaseema is achronic drought-prone area with limited potential for agriculture develop-ment . Telangana is rich in natural resources and has been lagging behincin economic development due to historical factors. Thus it may be seenthat a major portion of the State is underdeveloped. The population ofthe state as per 1971 census was 43,432 thousands. As per 1981 projectionthe population was assessed as 51,410 thousands of which 11,045 thousandsurban and 40,365 rural as per 1991 projection, the population works outto 59,992 thousands of which 14,270 thousands in urban and 45, 727thousands in rural.
As per 1971 census the number of literate is 7.3 million whichworks out to 24.57%. The rate of literacy among the females is 15.75%and that among males 33.18%. The rate of literacy in urban areas whichis 47.08% is higher when compared to that in rural areas which is only19.19%. 57.3% of urban males and 36.31% of Urban females are literate.In the rural areas, the percentage of literacy among males and femalesis 27.3 and 10.92% respectively. The literacy rate as per 1981 assess-ment works out to 29.94%. (The State income of the Andhra Pradesh atcurrent prices increased from Rs.5842.8 million in 1955-56 to Rs.53012.8million by 1978-79 recording nearly six fold increase. However, atconstant prices (1960-61), the State income increased from Rs.8727.9million in 1955-56 to Rs.18003.3 million in 1978-79 and the per capitaincome from Rs.259.60 to Rs.348.65 against the All India Adverage ofRs.AOO. According to the estimates of Planning Commission, 48.13% livebelow poverty line in the country and the corresponding percentage inthe Andhra Pradesh is 42.18% based on projected census figures in 1977-78.
;7*$% :
: 3 :
3. HEALTH ASPECTS
The vital statistics indicate the quality of achievements ofvarious Health Programmes taken up by the Government.
The life span of males increased to 51.5 during 1976-80 from37.8 in the Decade 1951-60. Similarly, the life span of females in-creased to 51.0 from 36.
The birth rate decreased from 39.7 in the Decade 1951-60 to 33.Ain 1978 and as per 1981 it is 33.6. The death rate declined rapidly incomparison to birth rate. The death rate decreased from 25.2 in theDecade 1951-60 to 13.2 in 1978 and also as per 1981, Infant mortalityrate has come down to 113.3 per thousand live births in 1978 from 23 7in 1951-60. The infant mortality rate as per 1981 assessment is 117.
In the beginning years of the formation of Andhra Pradesh theincidence of small-pox was very high. During the year 1957-58 alone,14,059attacks and 8,736 deaths were reported. Even though the Statehas achieved the target of Zero incidence of Small-pox, the vaccinationprogramme is continued.
Malaria Control Measures were adopted in Andhra Pradesh in 1925and in Telengana in 1939.
National Malaria Control Programme was launched in April 1953.The Malaria Eradication Programme, which was launched in 1958-59, broughtdown the number of positives to 22,866 in 1970 from over 70 lakhs priorto the inception of the programme. However, the incidence of Malariawas on the increase after 1970 which reached a maximum of 2.17 lakhs in1976. The revised strategy implemented resulted in downing the numberto 55,575 cases in 1979.
There are 13 districts in the State endemic to Cholera besidesHyderabad City i.e. 1> Srikakulam, 2) East Godavari, 3) West Godavari,4) Krishna, 5) Guntur, 6) Prakasam, 7) Nellore, 8) Ananthapur, 9) Kurnool,10) Guddaph, 11) Mahaboobnagar, 12) Nizamabad, and 13) Nalgonda. In orderto check the disease Cholera control programme has been implemented duringthe IV Five Year Plan period and it has been continued.
National Filaria Control Programme was started in 1955-56 with2 control units at Mandapeta and Nizamabad and one survey unit at Hydera-bad. There was pilot projects covering a population of 3.0 lakhs.
In certain parts of the State in Nalgonda, Prakasham and Anantpurdistricts high flourine content in ground water is present.
: 4 :
4. WATER RESOURCES
The total annual availability of water in Andhra Pradesh isestimated at 110820 million cubic metres out of which 77720 millioncubic metres are from surface water and 33,100 million cubic metresfrom ground water. However, the quantity available for exploitationstill out of the above is 45,427 million cubic metres comprising of22,327 million cubic metres of surface water and 23,100 million cubicmetres of ground water.
Ground water is one of the most important and widely distributedsources in the state and its potential in the state has been estimatedas 33,100 million cubic metres, out of which the present exploitation isof the order of 10,600 million cubic metres through mostly dug well andfilter point wells leaving a balance of 23,100 million cubic metres as
' additional exploitable potentia on still. There are over 77,600 wells
of various description in the state.
The ground water is not always potable and presence of fluoridesbeyond the permissible limits is one of the problems faced in the State.Nalgonda, Prakasham, Ananthapur and parts of other districts containfluorides upto 20.5 milli grams per litre.
The two major river systems going through the state are the Godavariand Krishna which are accountable for about 84 per cent of the utilizationsurface water in the state. The recorded peak discbarge of river Godavariat Dhowleshwaram in East Godavari district, before entering into sea is85,000 cumecs and that of Krishna at Vijayawada is 45,300. The rivernext important is the Penna river which contributes about 3*/2% of thesurface water potential.
The Godavari which is the largest of the rivers in the state( drains in the northern part and flows for about 720 K.M. in the state.
The Godavari water is being intensively used for irrigation only in thedelta below Rajahmundry.
In the case of Krishna river basin in the allocation available inAndhra Pradesh for usage including power generation water is 22972M.cum.A quantity of 110.45 M.cum only has been allocated for the water supplyrequirements of the Twin Cities of Hyderabad and Secunderabad.
The Kolleru lake occupying-3.87. of the State area is the biggest. fresh water lake in the state. It has gradually become brackish due tomany streams like Budameru, Tammileru, Ramileru and Gunderu drain andother delatic drains like Pedapadu drain, Monadikodu drain, Thodapallidrain, Venkaiah drain and Sidhapuram drain. It covers an area of about518 Sq.Km.
The other lakes in the state are Ramappa, Paka Cumbum , Kaniglri,Hlmayatsagar, Osmansagar Pocharam and Dindi. Some of the large canals arcJawahar canal, Lai Bahadur Sastry canal, K.C.Canal, Pennar and Nizamsagar
: 5 :
canal, Sriramsagar canal, Tungabhadra canals etc. Surface water reservoirsconstructed exclusively for the purpose of drinking water supply are theTatipudi Reservoir, and Mehadrigadda reservoir in Visakhapatnam Water SupplyScheme and Kalyani Reservoir scheme for Tirupathi. Osmansagar and Himayat-sagar reservoirs which are sources of drinking water supply for the statecapital are originally conceived as flood prevention measures also.
5. PRESENT STATUS OF WATER SUPPLY AND SANITATION
During the 5-year period, preceding the International DrinkingWater Supply and Sanitation Decade, i.e. from 1975-76 to 1979-80, the totaloutlay for the water supply and sanitation sector was 731.329 Million, outof which Rs.372.815 Million was invested on Rural water supply and Rs.318.514
( Million on urban water supply. The population benefitted was 4.782 Millionin urban areas and 8.729 million in Rural areas. However, no sewerage schemecould be taken up during this period for want of adequate funds.
A population of 23.648 million (6.908 million in urban area and 16.71million in rural area) are provided with drinking water supply facilities ason 31.3.81. But only 1.4 million are provided with sanitation, and there areno sanitation schemes in rural areas. During the decade, it is proposed tocover 100 per cent of the population of the state with protection water supplyfacilities and if this objective is to be achieved, protected water supplyfacilities have to be provided to 7.362 Million urban population and 28.982Million rural population. The cost of providing protected drinking watersupply schemes schemes to the population of 36.344 Million by new facilitiesis estimated at Rs.6,285.535 Million. In addition it will be necessary toaugment the rate of supply in several Municipalities as the present watersupply would be inadequate. It is estimated that an amount of Rs.995.065Million will be required for augmentation of water supply systems and the
f total outlay on water supply during the decade will be Rs.7281.600 millionV at 1979-80 prices.
62.51 per cent of the urban population and 41.5 per cent of ruralpopulation are provided with protected water supply as on 31.3.81 which workout to 46 per cent of the total population of the state. A population(27.732 million) do not have any water supply facilities as on 1.4.81. Inaddition, water supply to 5.433 million has to be augmented if the healthof the community is to be safeguarded by provision of adequate protectedwater supply.
Only 2.72 per cent of the population of the state is served bysanitation facilities as on 31.3.81 and 9.615 million urban population andthe entire rural population do not have any sanitary facilities as on 1.4.81.In order to achieve the targets of the decade 10.016 million of urban popu-lation and 11.43 million of rural population have to be provided with sani-tary oilets with suitable disposal facilities including sewerage.
• • • • " . # • • ' .
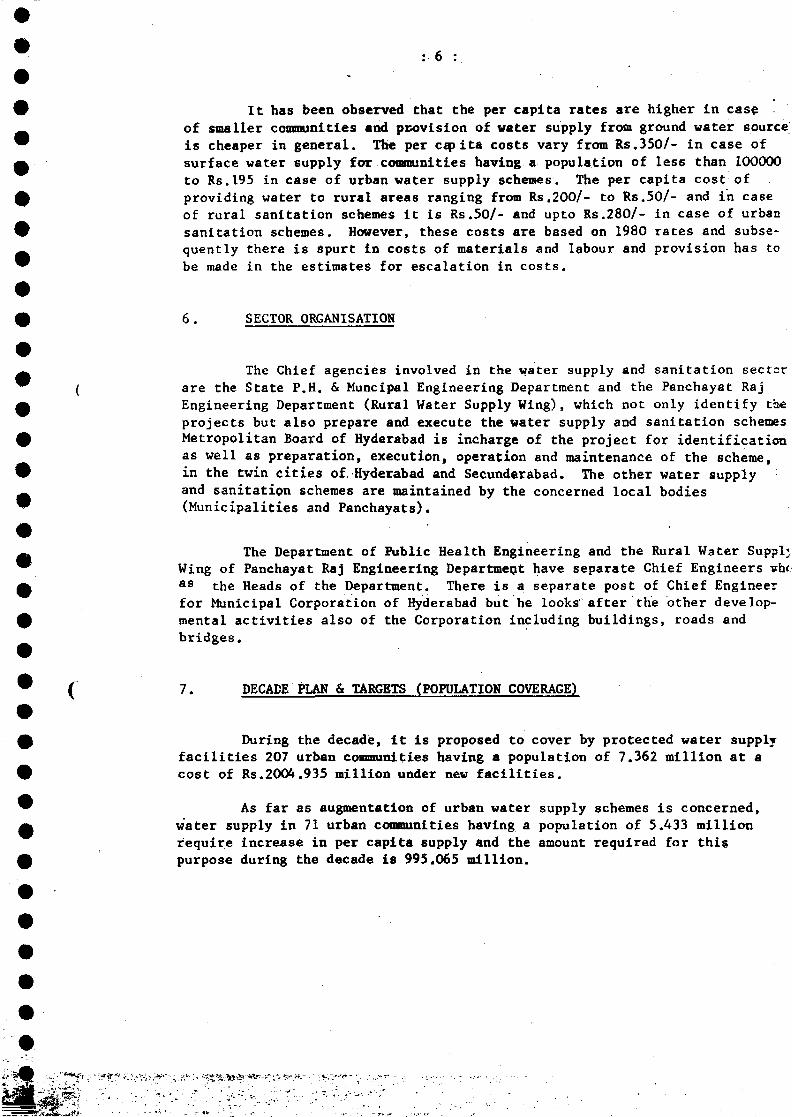
: 6 :
It has been observed that the per capita rates are higher in caseof smaller communities and provision of water supply from ground water sourceis cheaper in general. The per capita costs vary from Rs.35O/- in case ofsurface water supply for communities having a population of less than 100000to Rs.195 in case of urban water supply schemes. The per capita cost ofproviding water to rural areas ranging from Rs.200/- to Rs.50/- and in caseof rural sanitation schemes it is Rs.50/- and upto Rs.28O/- in case of urbansanitation schemes. However, these costs are based on 1980 rates and subse-quently there is Spurt in costs of materials and labour and provision has tobe made in the estimates for escalation in costs.
6. SECTOR ORGANISATION
The Chief agencies involved in the water supply and sanitation sectcrare the State P.H. & Muncipal Engineering Department and the Panchayat RajEngineering Department (Rural Water Supply Wing), which not only identify tfoeprojects but also prepare and execute the water supply and sanitation schemesMetropolitan Board of Hyderabad is incharge of the project for identificationas well as preparation, execution, operation and maintenance of the scheme,in the twin cities of. Hyderabad and Secunderabad. The other water supplyand sanitation schemes are maintained by the concerned local bodies(Municipalities and Panchayats).
The Department of Public Health Engineering and the Rural Water SupplyWing of Panchayat Raj Engineering Department have separate Chief Engineers sheas the Heads of the Department. There is a separate post of Chief Engineerfor Municipal Corporation of Hyderabad but he looks' after the other develop-mental activities also of the Corporation including buildings, roads andbridges.
7. DECADE PLAN & TARGETS (POPULATION COVERAGE)
During the decade, it is proposed to cover by protected water supplyfacilities 207 urban communities having a population of 7.362 million at acost of Rs.2004.935 million under new facilities.
As far as augmentation of urban water supply schemes is concerned,water supply in 71 urban communities having a population of 5.433 millionrequire increase in per capita supply and the amount required for thispurpose during the decade is 995.065 million.
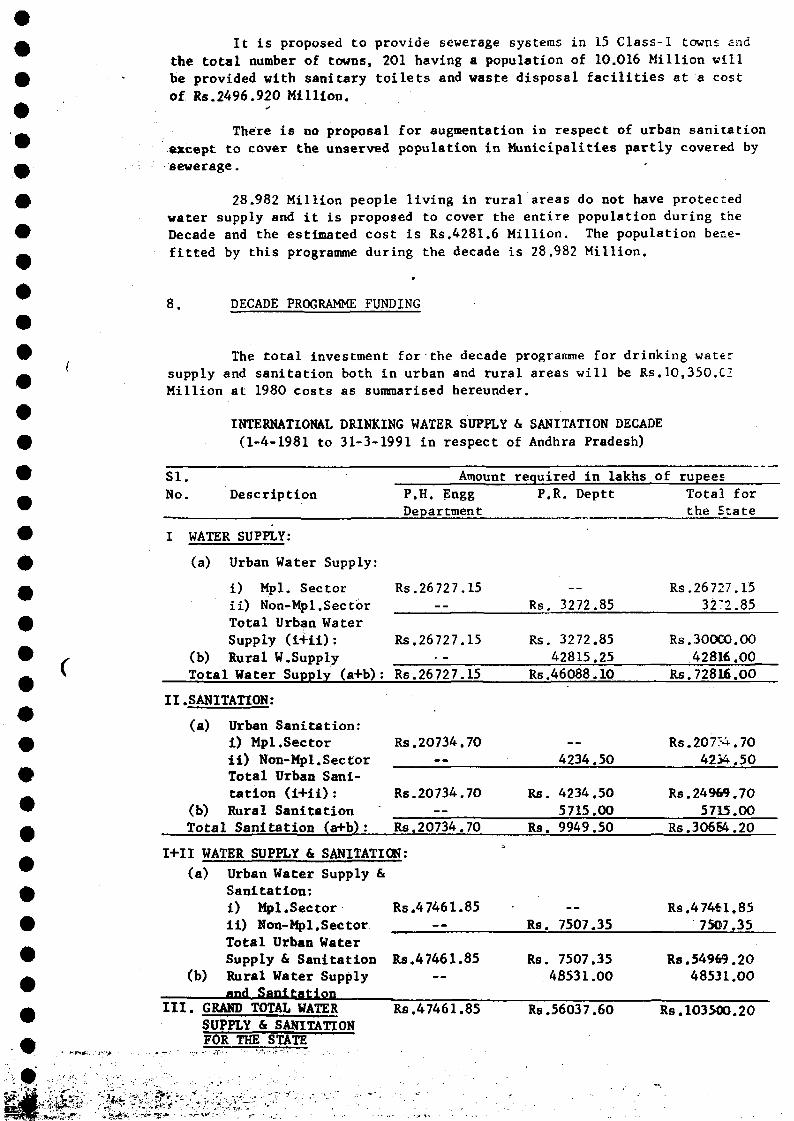
It is proposed to provide sewerage systems in 15 Class-1 towns end
the total number of towns, 201 having a population of 10.016 Million will
be provided with sanitary toilets and waste disposal facilities at a cost
of Rs.2496.920 Million.
There is no proposal for augmentation in respect of urban sanitation
except to cover the unserved population in Municipalities partly covered by
sewerage.
28.982 Million people living in rural areas do not have protectedwater supply and it is proposed to cover the entire population during theDecade and the estimated cost is Rs.4281.6 Million. The population bene-fitted by this programme during the decade is 28.982 Million.
8. DECADE PROGRAMME FUNDING
c
The total investment for the decade programme for drinking watersupply and sanitation both in urban and rural areas will be Rs.lO,35O.C2Million at 1980 costs as summarised hereunder.
INTERNATIONAL DRINKING WATER SUPPLY & SANITATION DECADE
(1-4-1981 to 31-3-1991 in respect of Andhra Pradesh)
SI .No. Description
I WATER SUPPLY:
(a) Urban Water Supply:
i ) Mpl. Sectori i ) Non-Mpl.Sec torTotal Urban WaterSupply ( i + i i ) :
(b) Rural W.SupplyTotal Water Supply (a+b):
II.SANITATION:
(a) Urban Sanitation:i ) Mpl.Sectori i ) Non-Mpl.SectorTotal Urban Sani-tation (i+ii):
(b) Rural SanitationTotal Sanitation (a+b):
AmountP.H. EnggDepartment
Rs.26727.15
Rs.26727.15
Rs.26727.15
Rs.20734.70
Rs. 20734.70
Rs. 20734.70
I+II WATER SUPPLY & SANITATION:(a) Urban Water Supply &
Sanitation:i ) Mpl.Sectori i ) Non-Mpl.SectorTotal Urban WaterSupply & Sanitation
(b) Rural Water Supplyand Sanitation
I I I . GRAND TOTAL WATERSUPPLY & SANITATIONFOR THE STAXti
Rs.47461.85
Rs.47461.85
Rs.47461.85
required in lakhsP.R. Deptt
Rs. 3272.85
Rs. 3272.8542815.25
Rs.46088.10
4234.50
Rs. 4234.505715.00
Rs. 9949.50
Rs. 7507.35
Rs. 7507.354B531.OO
Rs.56037.60
of rupeesTotal forthe State
Rs.26727.153272.85
Rs.30000.004281É.O0
Rs.72816.00
Rs. 207^4.704254.50
Rs.24969.705715.00
Rs.30664.20
Rs.474ei.857507.35
Rs.54969.2048531.00
Rs.103500.20
: 8 :
The strategy for implementation of the decade programme is to stepup the outlay progressively from year to year. Thus it is proposed toinvest Rs.271 Million on water supply during the first year of the Decade(1981-1982) and the outlay will increase to Rs.973.90 million during 1990-91which means a 4-fold increase in the investment. Similarly, in the case cfsanitation an investment of Rs.22.0 million only is proposed during 1981-62and it will be progressively increased to Rs.A8O.862 million in 1990-91.The investment for the decade programme will spread over to U years of 6thFive Year Plan, the entire 7th Five Year Plan and first year of 8th FiveYear Plan.
Out of the provision of Rs,2219.1 million for this sector duringVlth Five Year Plan including central sector allocation, Rs.1963.77 ttiillicr.are for implementation of Decade programme during 1981-85, Rs.1826.17million for water supply and Rs.137.60 million for sanitation.
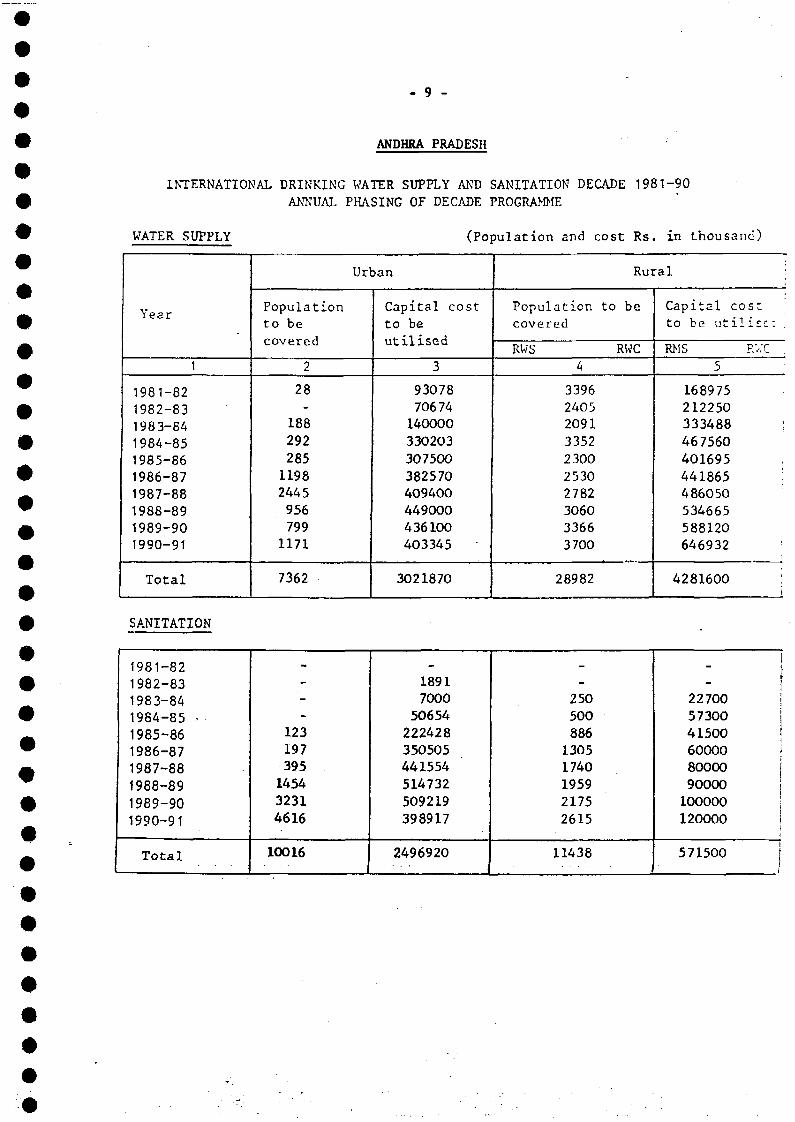
- 9 -
ANDHRA PRADESH
INTERNATIONAL DRINKING WATER SUPPLY AND SANITATION DECADE 1981-90
ANNUAL PHASING OF DECADE PROGRAMME
WATER SUPPLY
1
1981-82
1982-831983-841984-851985-861986-871987-881988-891989-901990-91
Total
Populationto becovered
2
28-
18829228511982445956799
1171
7362
(Population and cost Rs
Urban
Capital cost
to beutilised
3
9307870674140000330203
307500382570409400449000436100
403345
3021870
Population tccovered
RWS4
3396240520913352
230025302782306033663700
28982
in thousand)
Rural
be
RWC
Capital costto be utilise:
RMS P.V.'C5
168975212250333488 ;467560 ;
401695 ;
441865486050
534665588120
646932
4281600 'i
SANITATION
1981-821982-831983-841984-85 •1985-861986-871987-88
1988-891989-90
1990-91
Total
---
12319739514543231
4616
10016
_
18917000
50654
222428350505441554514732
509219398917
2496920
_-250500886130517401959
21752615
11438
if
|
22700 |573004150060000
80000 j90000 |100000 !120000
571500 |
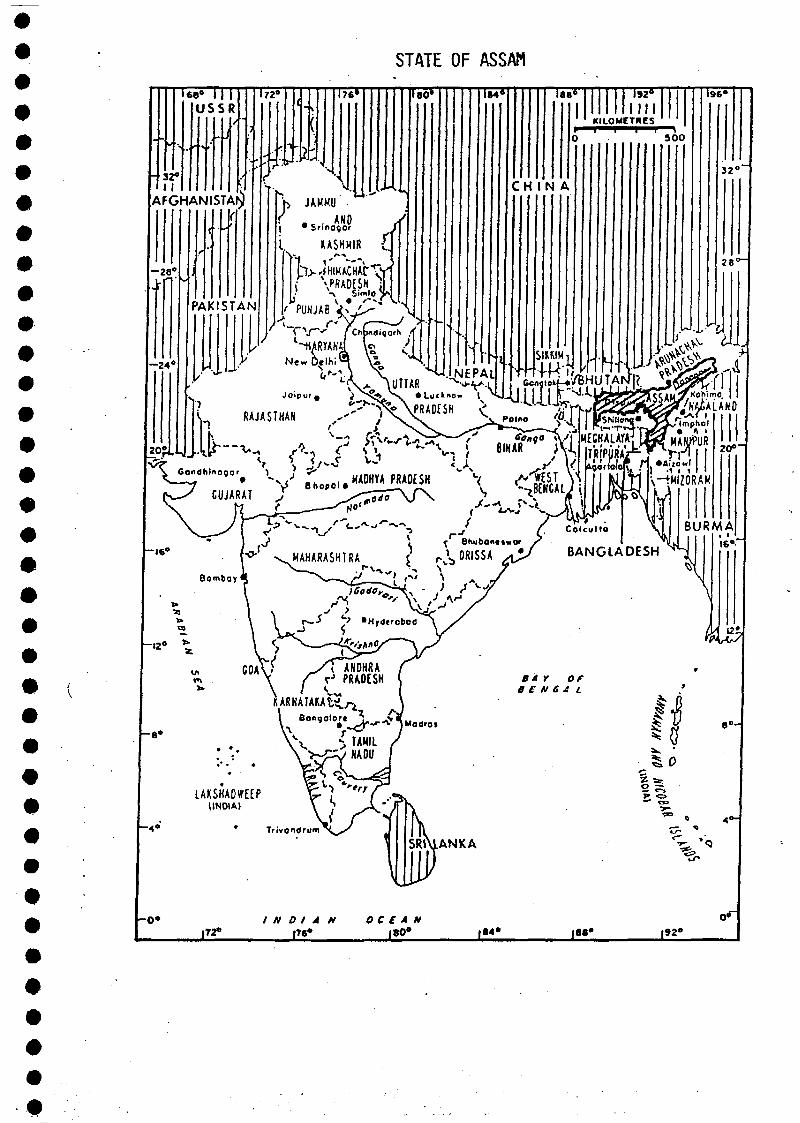
STATE OF ASSAM
•+32-I
e» H IUSSR
AFGHAN I STAt)
- 2 8 "
172° T76»
JAHMU'
Teô* Î841 188° 192°till
KILOMETRES
l9G«
C H I N A
3 0 0
32«
28C
he»
LAKSHADWEEP(INDIA)
ho»|T2»
I N D I A NJ76°
EXECUTIVE SUMMARYOF
THE DECADE PLAN OF WATER SUPPLY ANDSANITATION SECTOR (APRIL 1981 - MARCH 1991)
FOR
ASSAM
1. INTRODUCTION
Assam is one of the esternmost States of India with an area of78,253 sq.kms. (2.4% of India's territory) and population of 14.58 millions(1971 Census). It has 10 districts and the minimum average and highestdensities are found to be below 150, 200 and 300 respectively per sq. km.The urban and rural population is 8.85% and 91.15% of the total populationrespectively (1971) and the growth rate is more than 3% per annum includingboth urban and rural.
50% of the area of the State is hilly; the temperature variesbetween 8°C to 35°C and the rainfall is high (average annual rainfall1900 mm). The mighty river Brahamputra, the river Barak and their tributoriescris-cross the State and most of the plane areas are floow prone with highwater table. Assam is in sismic Zone VI.
70% of the working population are employed in agriculture and alliedprofessions. Irrigation facilities are inadequate. Industrially, Assamis still a backward State. The per capita income in 1975-76 is Rs.2.27per day which is 75% of All India average. Literacy is 28.7Z against allIndia average of 29.5%.
The cases of deaths due to various water born gastro-intestinal,endemic diseases are much higher in the state in comparison to all Indiaaverage.
2. SOCIO-ECONOMIC INDICATORS
Total population of Assam as per 1971 Census is 14.587 millions.It is expected that the population will increase to 19.969 millions by theend of March 1981 and 26.820 millions by the end of 31.3-1991.
The economy of Assam is primarily based on agriculture whichaccounted for 56% of the State's income in 1976/77. Industry is lessdeveloped and is slowly increasing. The number of factories rose from1484 in 1970-71 to only 1603 in 1975-76. The main industrial sectors aretea, oil, paper and food production. The population employed in industryaccounted for 6% in 1970-71 and 7% in 1975-76. The net per capita incomeof Assam's population was Rs.1.75 per day in 1973-74 and Rs.2.27 per day(or Rs.816 per year) in 1976-77. This is only 75% of the All Indiaaverage of Rs.1081 per year for the same period. The area devoted toagriculture covers about 32,000 sq. km. which is 40.5% of Assam's surfacearea (India 43%). Irrigation of agricultural land has recently beenintroduced, the irrigated area being negligible so far. The major agri-cultural crops are rice, jute and tea.
No authentic study is available based on which specific locationsof urban and rural poverty groups can be identified.
About 70% of the working population are employed in agriculture andagriculture-allied subjects such as livestock, forestry, fishing, plantationetc.
3. HEALTH ASPECTS
a. Life expectancy: As per family welfare year book lifeexpectancy at birth of Assam assessed for 61-70 is forMale 53.6 and Female 49.01.
b. Morbidity and mortality: The morbidity figures for theState for the year 1975-76 and 1976-77 are shown below:
Year Total indoor and Estimated Ratio ofoutdoor patients population morbidity to
^ ^ ^ treated* of the State population
1975-76 13,658,029 16,672,763 0.819:11976-77 13,689,417 . 17,072,673 0.802:1
The mortality rate per 1000 persons per annum in the last five yearperiod (1977-1982)(averages) are as follows:
RuralUrbanCombined
13.78.0
13.2
Nutrition programmes run by the State for school children expectingand convalescing mothers etc. .
- 3 -
Endemic diseases: Although Cholera is controlled other gastro-intestinal diseases, dysentery, new forms of Malaria and typhoid andvarious worm infecstations like hookworm, guinea worms are still prevelentin various parts of the state. The cases and deaths due to Malaria alonein 1978, 1979 and 1980 are 80,073 and 30,297 and 58 and 44,308 and 40.
4. WATER RESOURCES
The estimated maximum surface runoff, economically and technicallyexploitable, is about 48,000 million m3 per year. This is about 7% of thetotal surface runoff. The present utilisation is about 1.5% of the totalsurface runoff.
The ground water potential is estimated as 14,000 million m3 peryear and only about 0.02% of the total ground water potential has so farbeen utilised. Nearly in the 80% of the area of the State have beenproposed for ground water study. Hydrological studies of about 60% of thearea have been completed so far. The areas lying on the foot hill regionsof different hill ranges of Assam are hot easily exploitable for under-ground water. Elsewhere water is available at depths varying from 5 m to200 m and beyond with yields ranging from 8m3/h to 240m3/h. The under-ground water contains excess iron and therefore not suitable for directuse in areas of the state. There is no single agency in the state whichis responsible for the total control and management of the available raterresources of the State." Number of agencies viz., Public Health EngineeringOrganisation, Municipal Administration Deptt., Municipal Corporation,Irrigation etc., are associated in various stages of implementation anamaintenance. There is no legal and administrative arrangement forcontrolling the water use and extraction of ground water. It may be necessaryto impose control on water use by sector and by services in the near fmture.
The geographical area of Assam falls under two river basins.Brahmaputra river basin is very vast. The specific yield of theBrahmaputra is highest in the world, being 0.033 Cum/sec per sq. km.However, as no scientific assessment has been made of the future regionalwnter needs on a sufficiently long perspective, it is difficult to assertthat the economically exploitable quantum of water of Brahamputra basin:,specially during the lean period, would remain sufficient to meet all futureintrabasin needs in terms of irrigation for multi-cropping, municipal,rural and industrial water needs etc. and to maintain the minimum flovrequired in streams for dilution of pollutants.
Based on study by CGWB in 1977, 62,800 sq.kms. out of the totalarea of 78,323 sq.kms. of the State (i.e. about 80% area of the state iscoverable for ground water study. An area of 43,120 sq.kms. have beencovered by hydrological studies and the ground water potential have beenestimated to be 13.959 million m3.
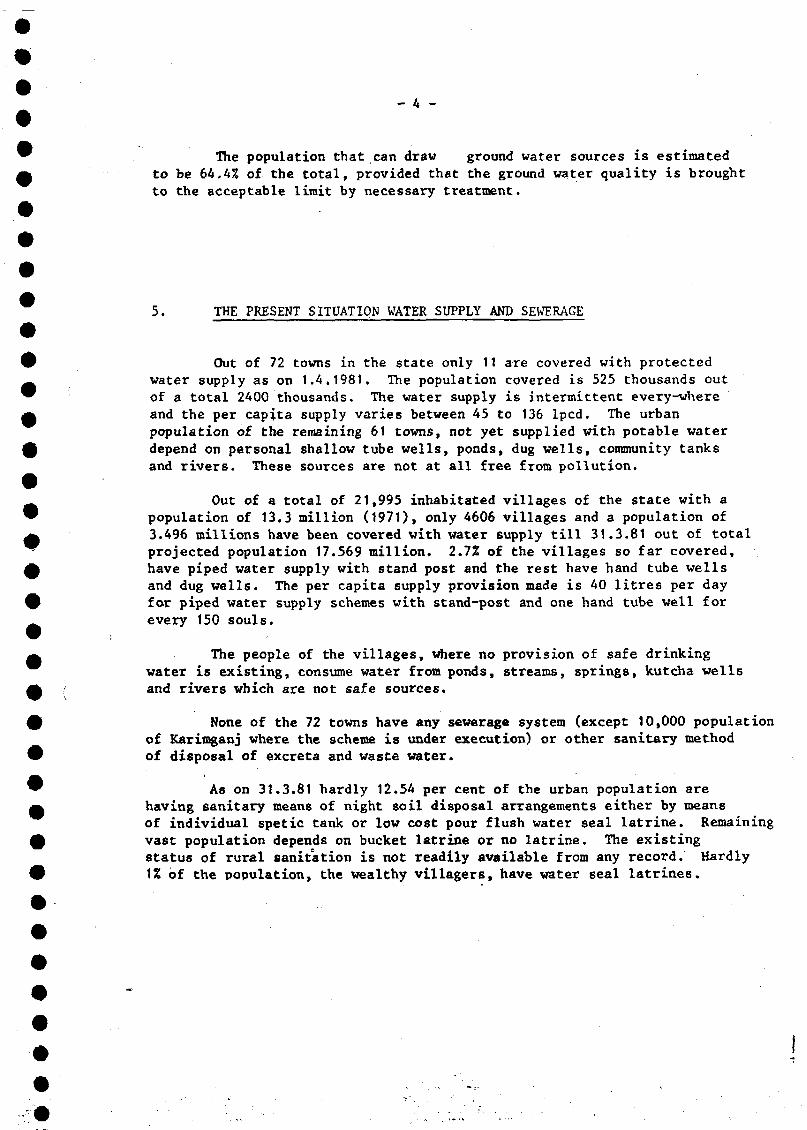
- 4 -
The population that can draw ground water sources is estimatedto be 64.4% of the total, provided that the ground water quality is broughtto the acceptable limit by necessary treatment.
5. THE PRESENT SITUATION WATER SUPPLY AND SEWERAGE
Out of 72 towns in the state only 11 are covered with protectedwater supply as on 1.4.1981. The population covered is 525 thousands outof a total 2400 thousands. The water supply is intermittent everywhereand the per capita supply varies between 45 to 136 lpcd. The urbanpopulation of the remaining 61 towns, not yet supplied with potable waterdepend on personal shallow tube wells, ponds, dug wells, community tanksand rivers. These sources are not at all free from pollution.
Out of a total of 21,995 inhabitated villages of the state with apopulation of 13.3 million (1971), only 4606 villages and a population of3.496 millions have been covered with water supply till 31.3.81 out of totalprojected population 17.569 million. 2.7% of the villages so far covered,have piped water supply with stand post and the rest have hand tube wellsand dug wells. The per capita supply provision made is 40 litres per dayfar piped water supply schemes with stand-post and one hand tube well forevery 150 souls.
The people of the villages, where no provision of safe drinkingwater is existing, consume water from ponds, streams, springs, kutcha wellsand rivers which are not safe sources.
None of the 72 towns have any sewerage system (except 10,000 populationof Karimganj where the scheme is under execution) or other sanitary methodof disposal of excreta and waste water.
As on 31.3.81 hardly 12.54 per cent of the urban population arehaving sanitary means of night soil disposal arrangements either by meansof individual spetic tank or low cost pour flush water seal latrine. Remainingvast population depends on bucket latrine or no latrine. The existingstatus of rural sanitation is not readily available from any record. Hardly1% of the population, the wealthy villagers, have water seal latrines.
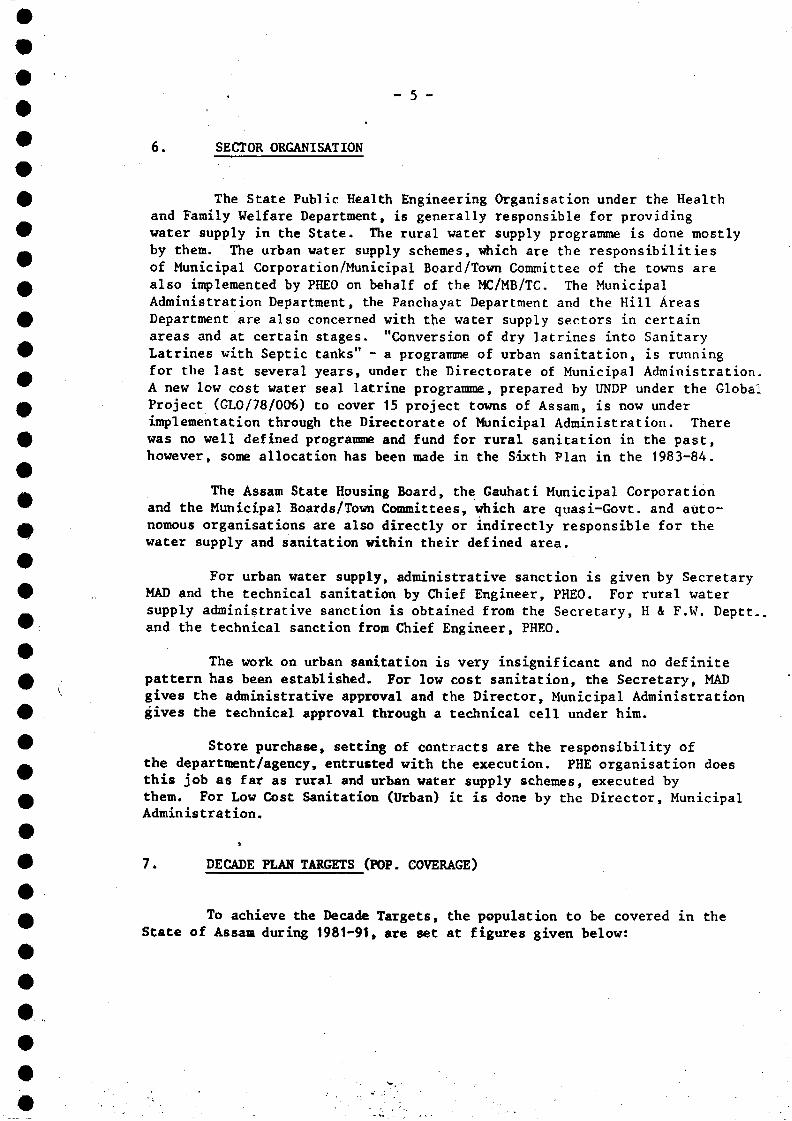
- 5 -
6. SECTOR ORGANISATION
The State Public Health Engineering Organisation under the Healthand Family Welfare Department, is generally responsible for providingwater supply in the State. The rural water supply programme is done mostlyby them. The urban water supply schemes, trtiich are the responsibilitiesof Municipal Corporation/Municipal Board/Town Committee of the towns arealso implemented by PHEO on behalf of the MC/MB/TC. The MunicipalAdministration Department, the Panchayat Department and the Hill AreasDepartment are also concerned with the water supply sectors in certainareas and at certain stages. "Conversion of dry latrines into SanitaryLatrines with Septic tanks" - a programme of urban sanitation, is runningfor the last several years, under the Directorate of Municipal Administration.A new low cost water seal latrine programme, prepared by UNDP under the GlobalProject (GLO/78/0O6) to cover 15 project towns of Assam, is now underimplementation through the Directorate of Municipal Administration. Therewas no well defined programme and fund for rural sanitation in the past,however, some allocation has been made in the Sixth Plan in the 1983-84.
The Assam State Housing Board, the Gauhati Municipal Corporationand the Municipal Boards/Town Committees, which are quasi-Govt. and auto-nomous organisations are also directly or indirectly responsible for thewater supply and sanitation within their defined area.
For urban water supply, administrative sanction is given by SecretaryMAD and the technical sanitation by Chief Engineer, PHEO. For rural watersupply administrative sanction is obtained from the Secretary, H & F.W. Deptt.and the technical sanction from Chief Engineer, PHEO.
The work on urban sanitation is very insignificant and no definitepattern has been established. For low cost sanitation, the Secretary, MADgives the administrative approval and the Director, Municipal Administrationgives the technical approval through a technical cell under him.
Store purchase, setting of contracts are the responsibility ofthe department /agency, entrusted with the execution. PHE organisation doesthis job as far as rural and urban water supply schemes, executed bythem. For Low Cost Sanitation (Urban) it is done by the Director, MunicipalAdmin is trat ion.
7. DECADE PLAN TARGETS (POP. COVERAGE)
To achieve the Decade Targets, the population to be covered in theState of Assam during 1981-91» are set at figures given below:
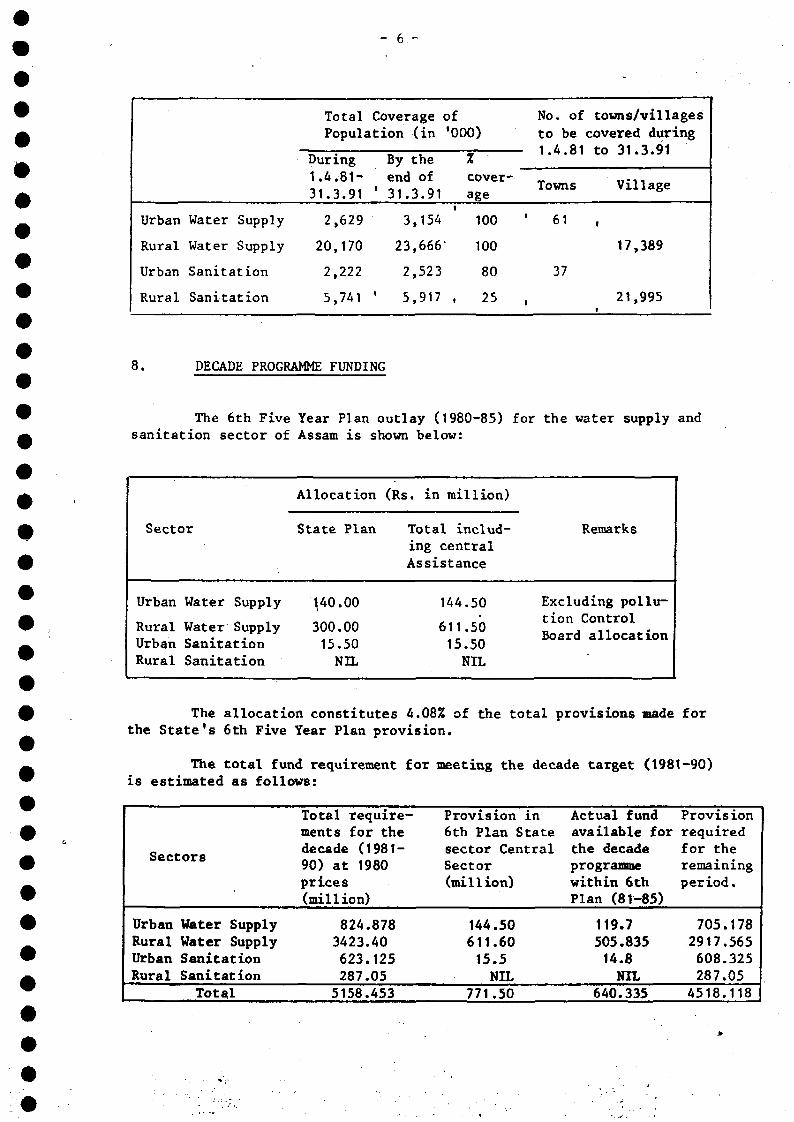
- 6.-
Urban
Rural
Urban
Rural
Water Supply
Water Supply
Sanitation
Sanitation
Total Coverage
Population (in
During1.4.81-
31.3.91
2,629
20,170
2,222
5,741
By the
end of1 31.3.91
3,154
23,666
2,523
5,917
of•000)
%cover-age
100
100
80
t 25
No. ofto be
- 1.4.81
Towns
1 61
37
i
towns/villages
covered during
to 31.3.91
Village
»
17,389
21,995
8. DECADE PROGRAMME FUNDING
The 6th Five Year Plan outlay (1980-85) for the water supply andsanitation sector of Assam is shown below:
Sector
Urban Water Supply
Rural Water SupplyUrban SanitationRural Sanitation
Allocation
State Plan
140.00
300.0015.50NIL
(Rs. in million)
Total includ-ing centralAssistance
144.50
611.5015.50NIL
Remarks
Excluding pollu-tion ControlBoard allocation
The allocation constitutes 4.08% of the total provisions made forthe State's 6th Five Year Plan provision.
The total fund requirement for meeting the decade target (1981-90)is estimated as follows:
ssccors
Urban Water SupplyRural Water SupplyUrban SanitationRural Sanitation
Total
Total require-ments for thedecade (1981-90) at 1980prices(million)
824.8783423.40623.125287.05
5158.453
Provision in6th Plan Statesector CentralSector(million)
144.50611.6015.5NIL
771.50
Actual fundavailable forthe decadeprogrammewithin 6thPlan (81-85)
119.7
505.83514.8NIL
640.335
Provisionrequiredfor theremainingperiod.
705.1782917.565608.325287.05
4518.118
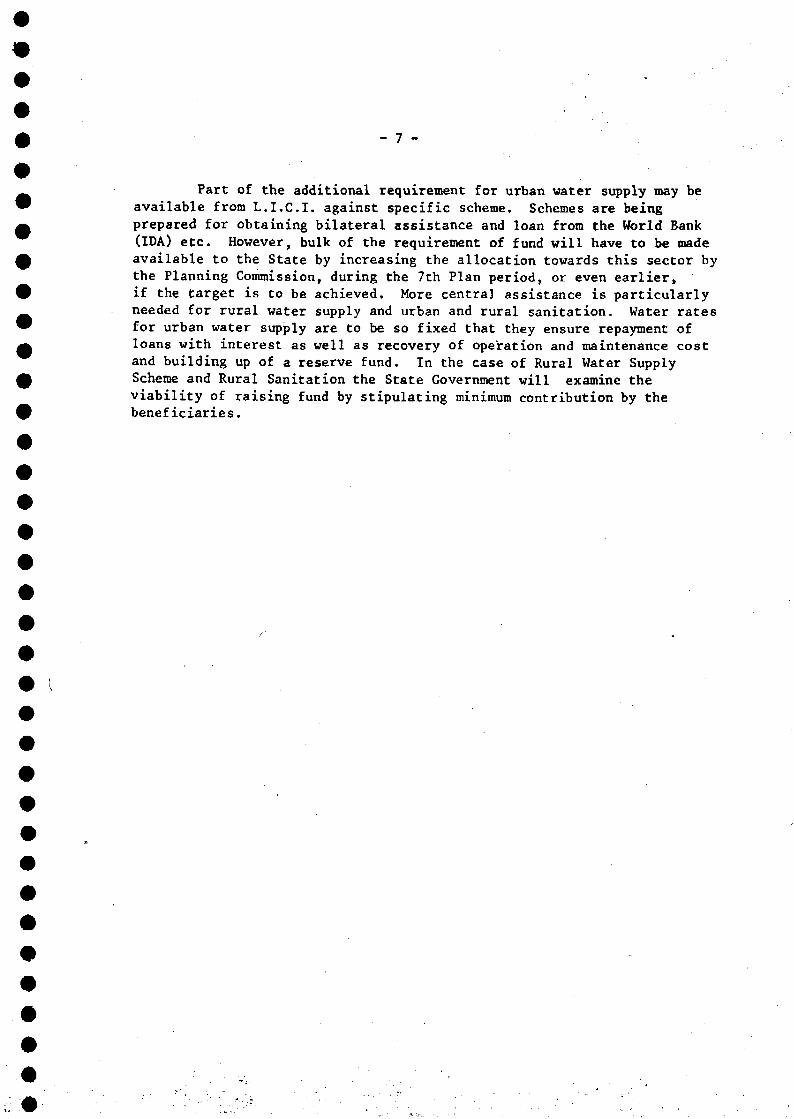
- 7 -
Part of the additional requirement for urban water supply may beavailable from L.I.C.I. against specific scheme. Schemes are beingprepared for obtaining bilateral assistance and loan from the World Bank(IDA) etc. However, bulk of the requirement of fund will have to be madeavailable to the State by increasing the allocation towards this sector bythe Planning Commission, during the 7th Plan period, or even earlier,if the target is to be achieved. More central assistance is particularlyneeded for rural water supply and urban and rural sanitation. Water ratesfor urban water supply are to be so fixed that they ensure repayment ofloans with interest as well as recovery of operation and maintenance costand building up of a reserve fund. In the case of Rural Water SupplyScheme and Rural Sanitation the State Government will examine theviability of raising fund by stipulating minimum contribution by thebeneficiaries.
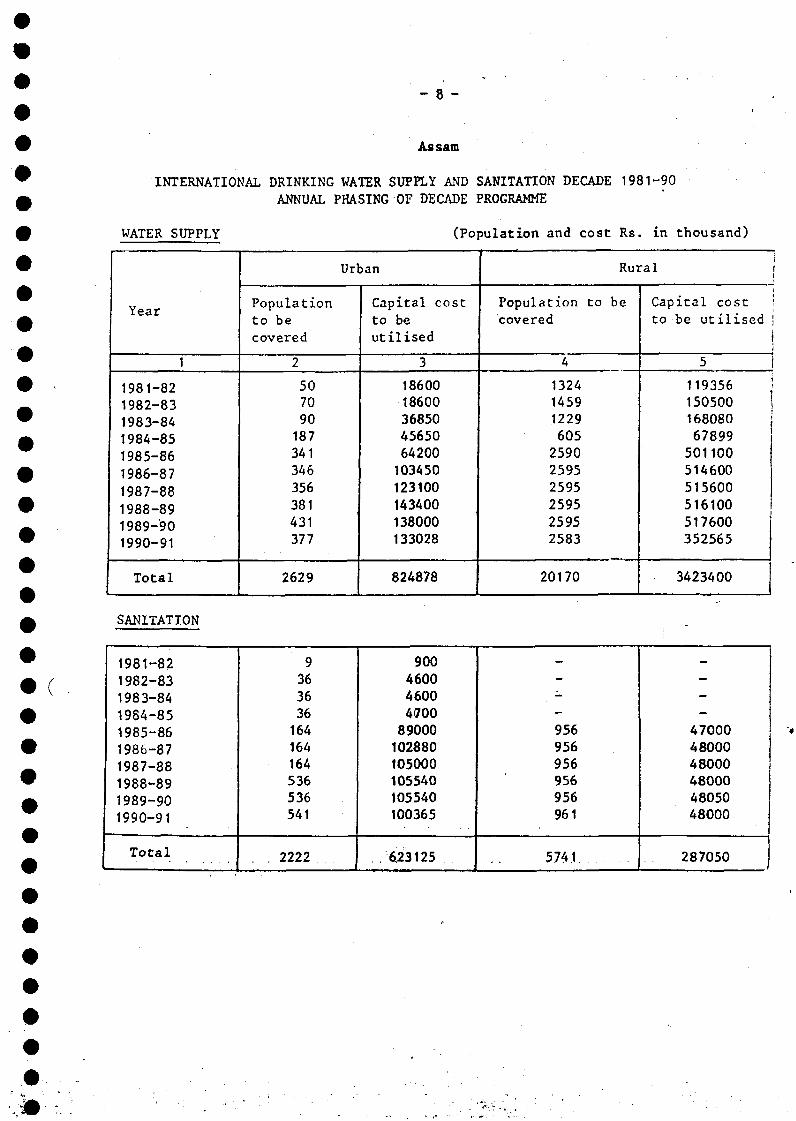
- 8 -
( •
Assam
INTERNATIONAL DRINKING WATER SUPPLY AND SANITATION DECADE 1981-90
ANNUAL PHASING OF DECADE PROGRAMME
WATER SUPPLY
Year
1
1981-821982-831983-84
1984-851985-86
1986-87
1987-88
1988-891989-901990-91
Total
Populationto becovered
2
507090187341346356381431377
2629
(Population and cost
Urban
Capital cost
to beutilised
3
1860018600368504565064200103450123100143400138000133028
824878
Population tocovered
4
132414591229
605259025952595259525952583
20170
Rs in thousand)
Rural ;
bei
Capital cost :to be utilised
ii
5
119356 ]150500 |16808067899
501100514600515600516100517600352565
3423400
SANITATION
1981-82
1982-831983-84
1984-851985-861986-871987-881988-891989-90
1990-91
Total
9363636164164164536536541
. 2222
90046004600470089000102880105000105540105540100365
.6.23125
—
---956956956956956961
5741
—---470004800048000480004805048000
287050
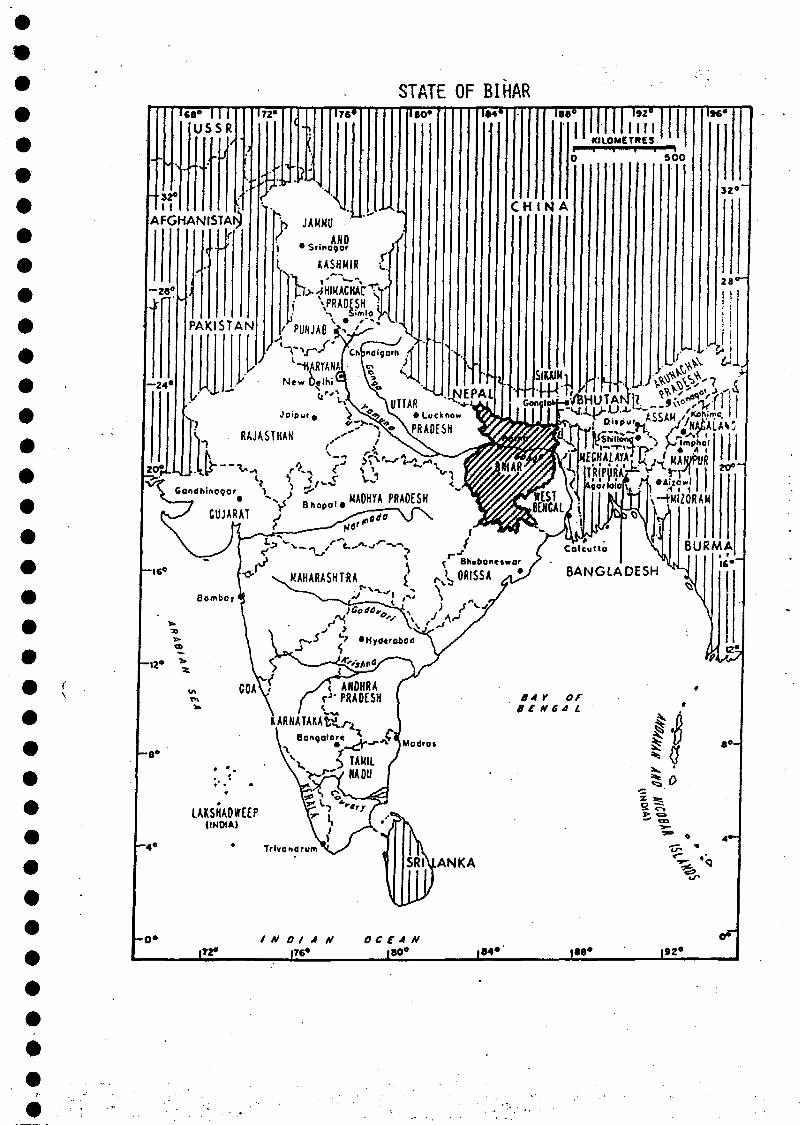
STATE OF BIHARUe« H I
USSR172» Trt* IÏÔ» 188* 192°
IlllKILOMETRES
C H I N A
5 0 0
32»
C RAJASTHAN , ' )XX^ tbH
Alh ^ ^ j ^ v
|72«INDIAN
176*OCEAN
180° I9Z»
EXECUTIVE SUMMARYOF
THE DECADE PLAN OF WATER SUPPLY ANDSANITATION SECTOR (APRIL 1981 - MARCH 1991)
FOR -
BIHAR
1. INTRODUCTION
Bihar state is bounded by Nepal in North, Orissa in South, West- Bengalin the East and Uttar Pradesh and Madhya Pradesh, in the West. The State iscovering an area of 1,73,700 square kilometers which is about 5.30 percentof the Indian territory.
2. SOCIO-ECONOMIC INDICATORS
According to 1971 census, the population of Bihar was 56.35 Millionand the 1981 Census provisional figure since available is 69.8 Million. Theprojected population of the State as on 1,4.81 and 1.4.91 has been takento be 68.25 and 79.99 millions as projected by the Registrar General ofIndia. The average density of population in the.,State in 1971 was 324 personsper square kilometer which has increased to 402 in 1981 (Provisional) againstthe national average of 178 persons per square kilometer. The ratio of urbanto rural population in 1971 census, was 10 to 90. 1971 Census listed 202towns with a total urban population of 5.60 Millions. The rural populationof 50.75 Millions lived in 67,566 villages of the State. Each village issub-divided into several hamlets on socio-economic-cultural considerationsand sometimes are quite apart from each other. Per capita incomein the State in 1974-75 was Rs.687.00 which has gone up to Rs.737 in 1980Which is about the lowest in the country.
According to the latest assessment by the Planning- Commission,Government of India, the percentage of population below poverty line is46.07% in urban and 58.91% in rui 4. areas. Bihar is over-whelminglyagricultural with more than 80% of its workers employed on the land. Lessthan 3% of the work force is engaged in manufacturing industry, 7.11%working population of Bihar was engaged in secondary sector.
1981 Census has indicated the literacy rate of 26 percent against anall India average of 34.80 percent. ' * • • • • " • .
- 2 -
3 . HEALTH ASPECTS
Vital statistics indicate birth and death rates of 31.3/1000 and12.5/1000 and an infant mortability rate of 169. Life expectancy atbirth increased from 38.2 in 1941-51 to 48.8 in 1980.
4. WATER RESOURCES
Bihar has most of the rainfall from the South West monsoon whichsets in the first half of June and lasts till September. The general rainfallis 1200-1600 mm. The rainfall (90%) is concentrated during the monsoonmonths with a direct bearing on the discharge of most of the riverswhich increases manifold during the wet season.
The State is blessed with abundant groundwater in the plains regionranging in depths from 30 metres to 2500 metres. The hard rock formationsin the Chhotanagpur Plateau are compact and the potential for tubewellssystem development is very limited. Open wells with substantial percolationareas and infiltration surfaces have produced good yields in the area.Drilled tubewells for small community water supply are considered to besatisfactory.
5. PRESENT STATUS OF WATER SUPPLY AND SEWERAGE
Urban: By the end of March, 1981, 70.38 percent of the urbanpopulation (5.53 Million) was served with piped water supply. About 40%of the served population have house connection? and the rest is served bypublic stand posts-. Out of 202 listed towns (1971 Census), 158 have organisedpiped water supply and the remaining cater to their needs through open dugwells and handpump tubewells. In all the towns, the supply is intermittentand Is made for 4-16 hours per day depending upon the various constraintsin each of the towns. The existing pattern of Government contribution forWater Supply Projects is 25% of the estimated cost as grants-in-aid and thebalance 75% as loan.
Rural : On 31.3.1981, 69.40% of the rural population of the Statehad access to drinking water supply. Only about 2% of the rural populationhas been covered with piped water supply mostly through standposts supplysystem. On the last day of March, 1981, out of 67,566 inhabit at ed villagesin the State, there were 12,534 problem villages which were to be providedwith dependable drinking water sources.
The entire capital costs of all works in rural areas are borne bythe State Government as grant. All the completed works are operated andmaintained by the P.H.E.D. out of revenue budgets of the State Government asgrant.
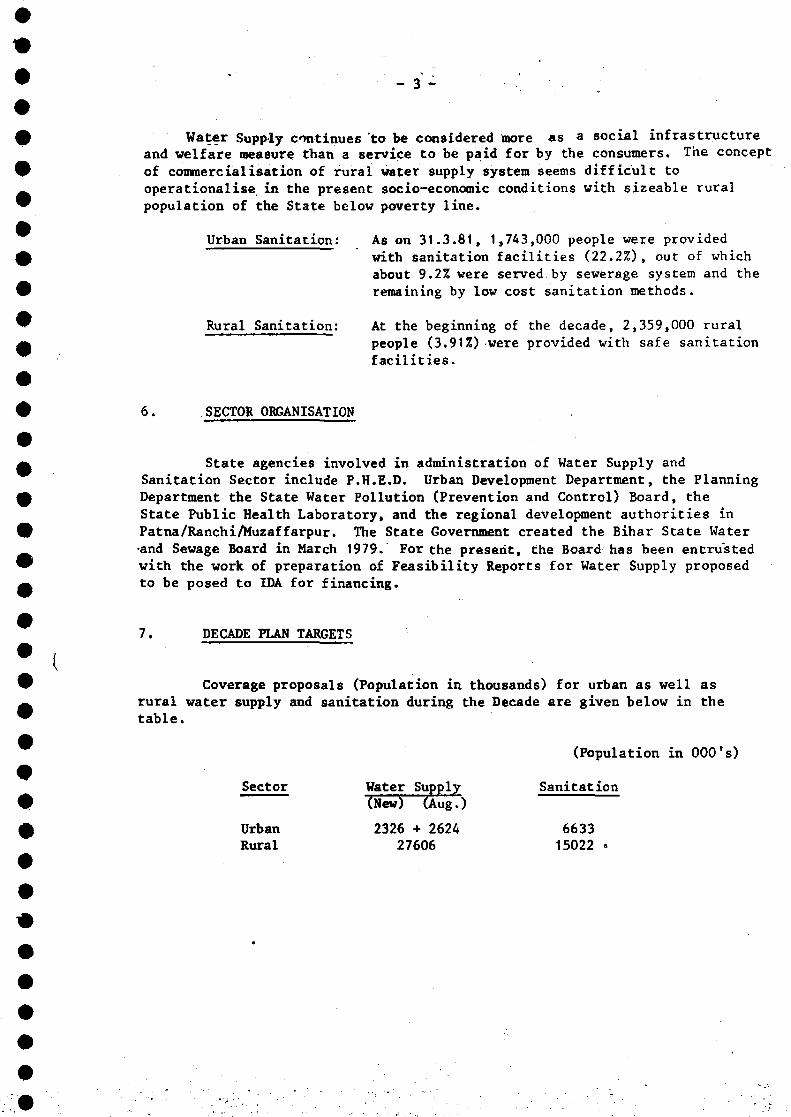
- 3 -
Water Supply continues to be considered more as a social infrastructureand velfare measure than a service to be paid for by the consumers. The conceptof commercialisation of rural water supply system seems difficult tooperationalise in the present socio-economic conditions with sizeable ruralpopulation of the State below poverty line.
Urban Sanitation: As on 31.3.81, 1,743,000 people were providedwith sanitation facilities (22.2%), out of whichabout 9.2% were served by sewerage system and theremaining by low cost sanitation methods.
Rural Sanitation: At the beginning of the decade, 2,359,000 ruralpeople (3.91%) were provided with safe sanitationfacilities.
6. SECTOR ORGANISATION
State agencies involved in administration of Water Supply andSanitation Sector include P.H.E.D. Urban Development Department, the PlanningDepartment the State Water Pollution (Prevention and Control) Board, theState Public Health Laboratory, and the regional development authorities inPatna/Ranchi/Muzaffarpur. The State Government created the Bihar State Water•and Sewage Board in March 1979." For the present, the Board has been entrustedwith the work of preparation of Feasibility Reports for Water Supply proposedto be posed to IDA for financing.
7. DECADE PLAN TARGETS
Coverage proposals (Population in thousands) for urban as well asrural water supply and sanitation during the Decade are given below in thetable.
Sector
UrbanRural
Water Supply(New) (Aug.)
2326 + 262427606
(Population in 000
Sanitation
663315022 •
fs)
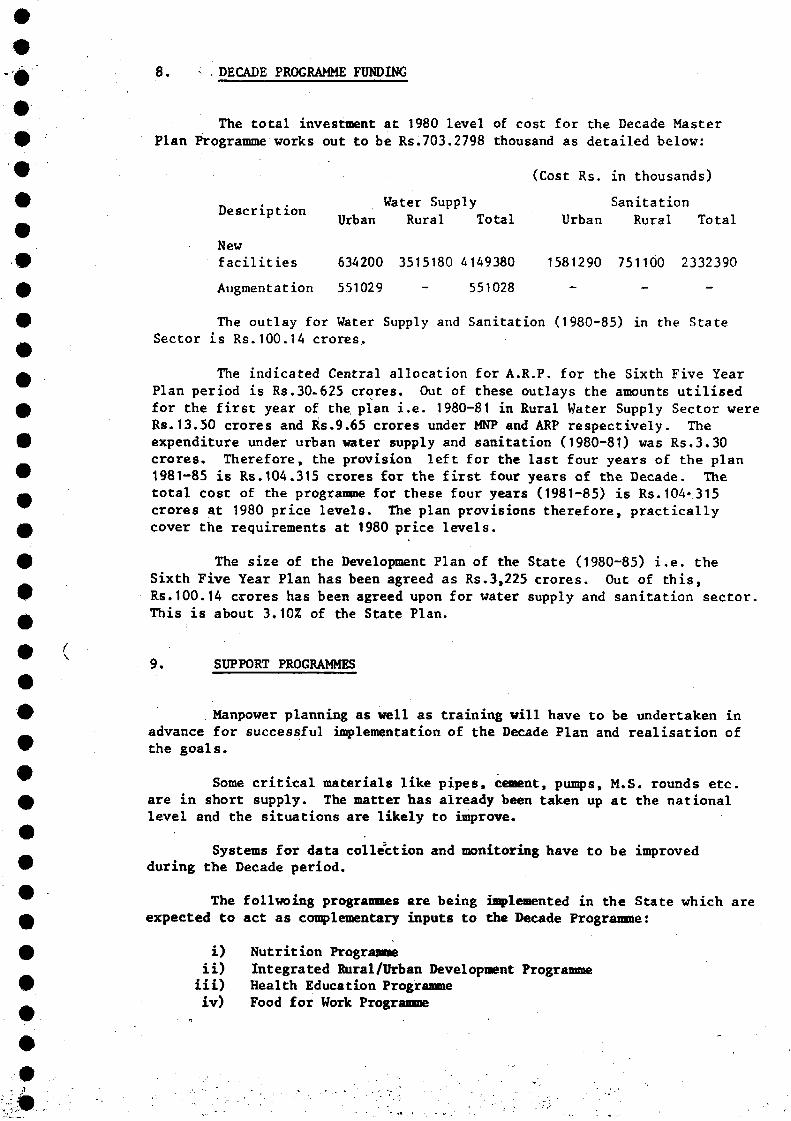
8. * - DECADE PROGRAMME FUNDING
The total investment at 1980 level of cost for the Decade MasterFlan Programme works out to be Rs.703.2798 thousand as detailed below:
(Cost Rs. in thousands)
_. Water Supply SanitationD e s c r i p t i o n . • „ , - . , • „ . „ -
r Urban Rural Total Urban Rural TotalNewfacilities 634200 3515180 4149380 1581290 751100 2332390Augmentation 551029 551028
The outlay for Water Supply and Sanitation (1980-85) in the StateSector is Rs.100.14 crores.
The indicated Central allocation for A.R.P. for the Sixth Five YearPlan period is Rs.30-625 crores. Out of these outlays the amounts utilisedfor the first year of the, plan i.e. 1980-81 in Rural Water Supply Sector wereRs.13.50 crores and Rs.9.65 crores under MNP and ARP respectively. Theexpenditure under urban water supply and sanitation (1980-81) was Rs.3.30crores. Therefore, the provision left for the last four years of the plan1981-85 is Rs.104.315 crores for the first four years of the Decade. Thetotal cost of the programne for these four years (1981-85) is Rs.104*315crores at 1980 price levels. The plan provisions therefore, practicallycover the requirements at 1980 price levels.
The size of the Development Plan of the State (1980-85) i.e. theSixth Five Year Plan has been agreed as Rs.3,225 crores. Out of this,Rs.100.14 crores has been agreed upon for water supply and sanitation sector.This is about 3.10% of the State Plan.
9. SUPPORT PROGRAMMES
Manpower planning as well as training will have to be undertaken inadvance for successful implementation of the Decade Plan and realisation ofthe goals.
Some critical materials like pipes, cement, pumps, M.S. rounds etc.are in short supply. The matter has already been taken up at the nationallevel and the situations are likely to improve.
Systems for data collection and monitoring have to be improvedduring the Decade period.
The follwoing programmes are being implemented in the State which areexpected to act as complementary inputs to the Decade Programne:
i) Nutrition Prograsii) Integrated Rural/Urban Development Programme
iii) Health Education Programmeiv) Food for Work Programme
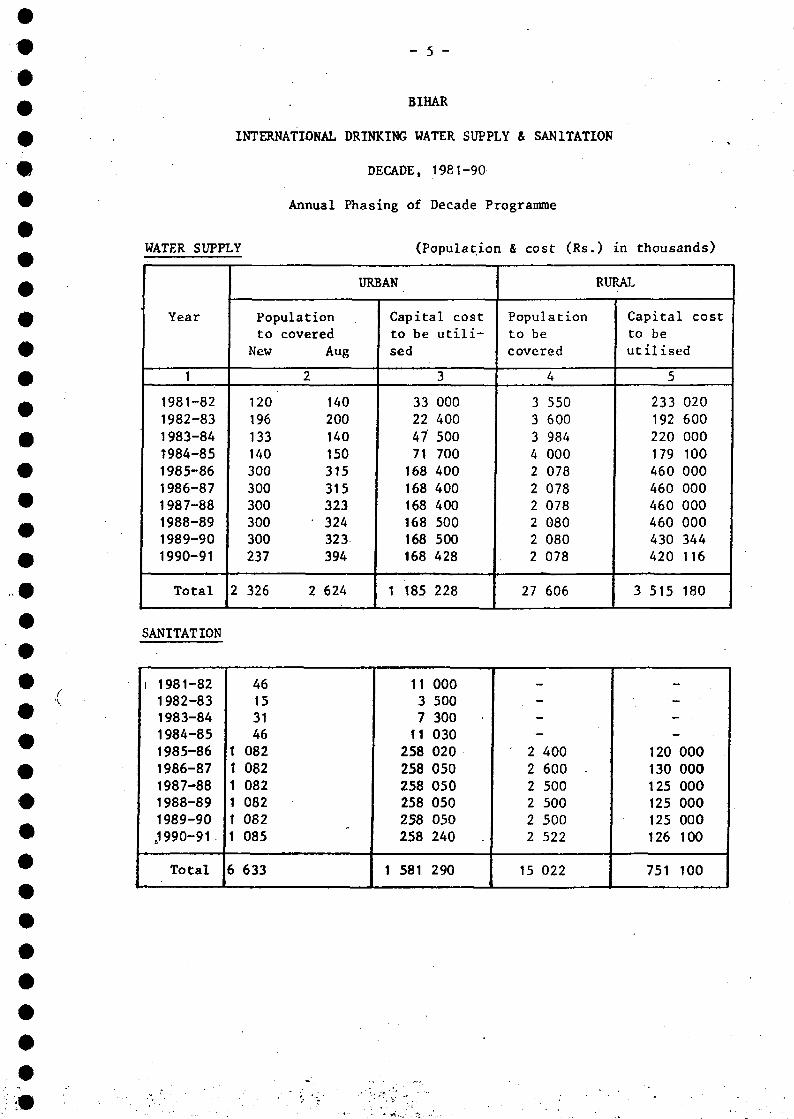
f\
_ 5 -
BIHAR
INTERNATIONAL DRINKING WATER SUPPLY & SANITATION
DECADE, 1981-90
Annual Phasing of Decade Programme
WATER SUPPLY
Year
1
1981-821982-831983-841984-851985-861986-871987-881988-891989-901990-91
Total 2
Populationto covered
New
120196133140300300300300300237
326
Aug
2
140200140150315315323
• 324323394
2 624
(Population & cost (Rs
URBAN
Capital costto be utili-sed
3
33 00022 40047 50071 700168 400168 400168 400168 500168 500168 428
1 185 228
Populationto becovered
4
3 5503 6003 9844 0002 0782 0782 0782 0802 0802 078
27 606
in thousands)
RURAL
Capital costto beutilised
5
233 020192 600220 000179 100460 000460 000460 000460 000430 344420 116
3 515 180
SANITATION
i 1981-821982-831983-841984-851985-861986-871987-881988-891989-90S1990-91
Total
46153146
1 0821 0821 0821 0821 0821 085
6 633
11 0003 5007 30011 030
258 020258 050258 050258 050258 050258 240
1 581 290
--
• -
2 4002 600 -2 5002 5002 5002 522
15 022
--_
120 000130 000125 000125 000125 000126 100
751 100
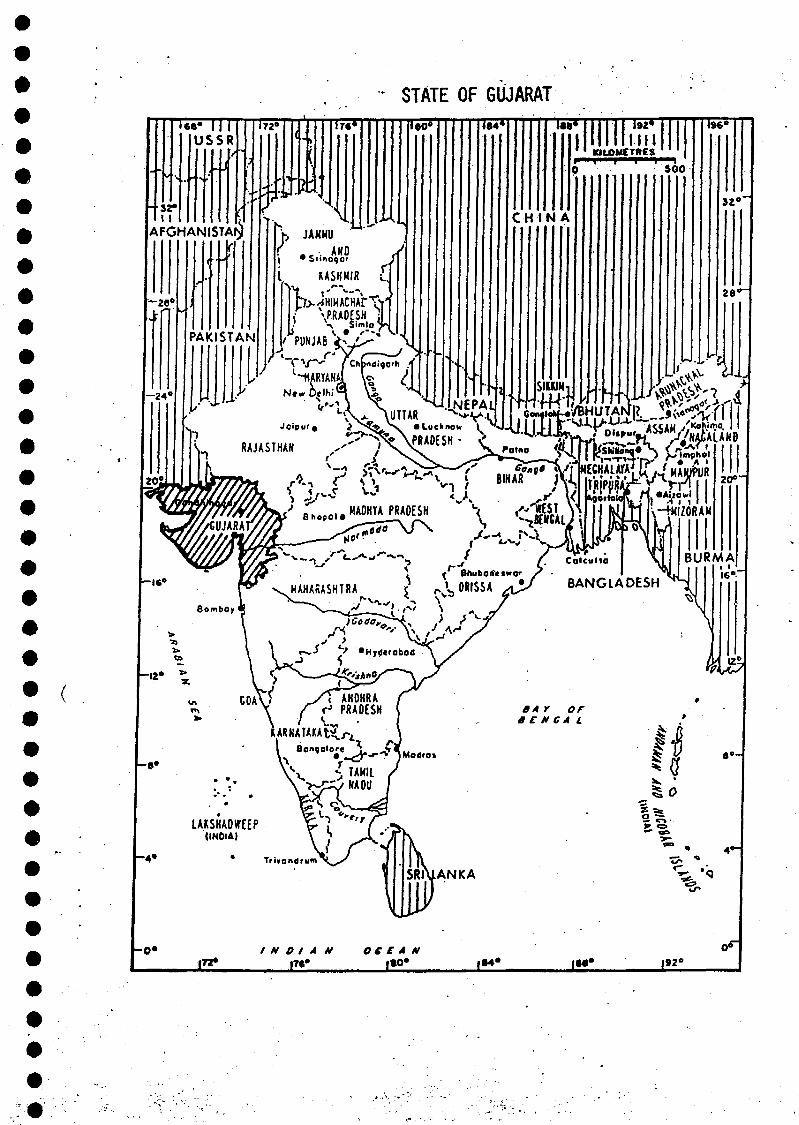
STATE OF GUJARAT
32*I I
e« \| |USSR
AFGHANISTAN JAHHU
ÏÏÔ* "illliilm.llll
C H I N A
SIMM)IMUN<]
500
32°"
28"
awjrtEu-si^wipec «Jfte^jSEgi
•AiiewlI - 1 ( 1\-+HIZOfiAM
20°-
BURMAis*-"
-12»
- • •
LAKSKAOWCEP(INDIA)
- 4» Trivondrum
/ N D I À M OC £ * N| M *
EXECUTIVE SUMMARYOF
THE DECADE PUN OF WATER SUPPLY ANDSANITATION SECTOR (APRIL 1981 - MARCH 1991)
FOR
GUJARAT
1. INTRODUCTION
Gujarat State is situation on the west coast of India.The boundaries of the State are Arabian Sea on the west,Pakistan on the north, Rajasthan on the north east, Madhya Pradesh inthe east and south east and Maharashtra in the south. It covers anarea of 187091 square kilometres which is 5.7% of the Indian territory.
The climate of Gujarat is sub-humid to arid with maximum tempe-rature of 46* C and minimum temperature of 40* C. The average annualrainfall in the past 20 years is in the range from. 33 inn in the Districtof Kutch to 1520 mm in the District of Dangs. However, extreme years canreduce the rainfall to 20% of the above figures as in 1972 or can doubleit as in 1976.
The State of Gujarat can be divided into three major physiographicalgroups as follows:-
1) Alluvial saline tract extending from Kutch and Banaskantha in thenorth to deep Black Cotton soil at Bulsar in the South.
2) Hilly and rocky tract covering eastern parts of the Gujarat Stateand major parts of Saurashtra and a portion of Kutch.
3) Semi-arid and arid saline regions in the North and North west,including parts of Kutch and Saurashtra. *
The State divides naturally into three geographical units. TheGujarat mainland, Saurashtra Pennlnsula and Kutch. The Gujarat mainlandcomprises alluvial plains flanked by hilly terrain in the east and ArabianSea in west. The land slopes gently towards the west and south west andIs traversed by the State's five rivers. (Tapl, Narraada, Mahl, Sabarmatiand Banas) and numerous small streams, and a long sea coast:.
The Kutch district is an arid zone and occupies about 25% area of
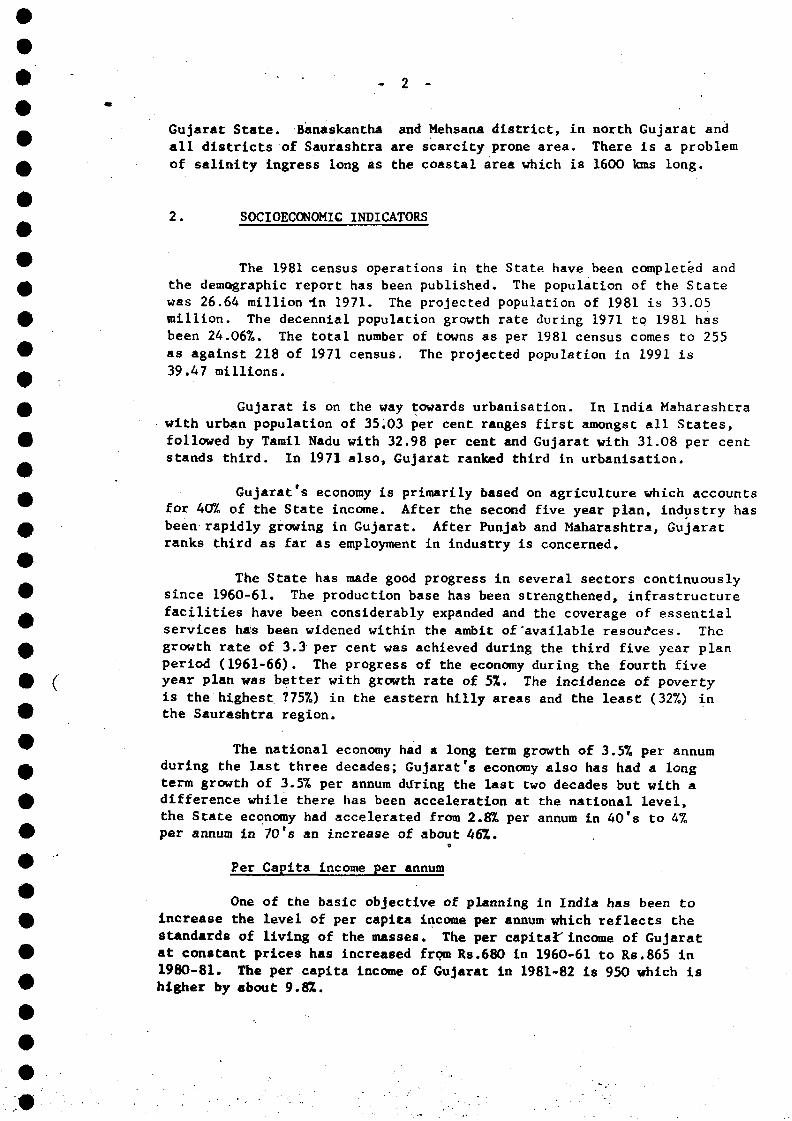
Gujarat State. Banaskantha and Mehsana district, in north Gujarat and
all districts of Saurashtra are scarcity prone area. There is a problem
of salinity ingress long as the coastal area which is 1600 kms long.
2. SOCIOECONOMIC INDICATORS
The 1981 census operations in the State have been completed andthe demographic report has been published. The population of the Statewas 26.64 million -in 1971. The projected population of 1981 is 33.05million. The decennial population growth rate during 1971 to 1981 hasbeen 24.06%. The total number of towns as per 1981 census comes to 255as against 218 of 1971 census. The projected population in 1991 is39.47 millions.
Gujarat is on the way towards urbanisation. In India Maharashtrawith urban population of 35.03 per cent ranges first amongst all States,followed by Tamil Nadu with 32.98 per cent and Gujarat with 31.08 per centstands third. In 1971 also, Gujarat ranked third in urbanisation.
Gujarat's economy is primarily based on agriculture which accountsfor 40% of the State income. After the second five year plan, industry hasbeen rapidly growing in Gujarat. After Punjab and Maharashtra, Gujaratranks third as far as employment in industry is concerned.
The State has made good progress in several sectors continuouslysince 1960-61. The production base has been strengthened, infrastructurefacilities have been considerably expanded and the coverage of essentialservices has been widened within the ambit of'available resources. Thegrowth rate of 3.3 per cent was achieved during the third five year planperiod (1961-66). The progress of the economy during the fourth fiveyear plan was better with growth rate of 5%. The incidence of povertyis the highest ?75%) in the eastern hilly areas and the least (32%) inthe Saurashtra region.
The national economy had a long term growth of 3.5% per annumduring the last three decades; Gujarat's economy also has had a longterm growth of 3.5% per annum daring the last two decades but with adifference while there has been acceleration at the national level,the State economy had accelerated from 2.8% per annum in 40's to 4%per annum In 70*s an increase of about 46%.
Per Capita income per annum
One of the basic objective of planning in India has been toincrease the level of per capita income per annum which reflects thestandards of living of the masses. The per capital''income of Gujaratat constant prices has increased from Rs.680 in 1960-61 to Rs.865 in1980-81. The per capita income of Gujarat in 1981-82 is 950 which ishigher by about 9.8%.
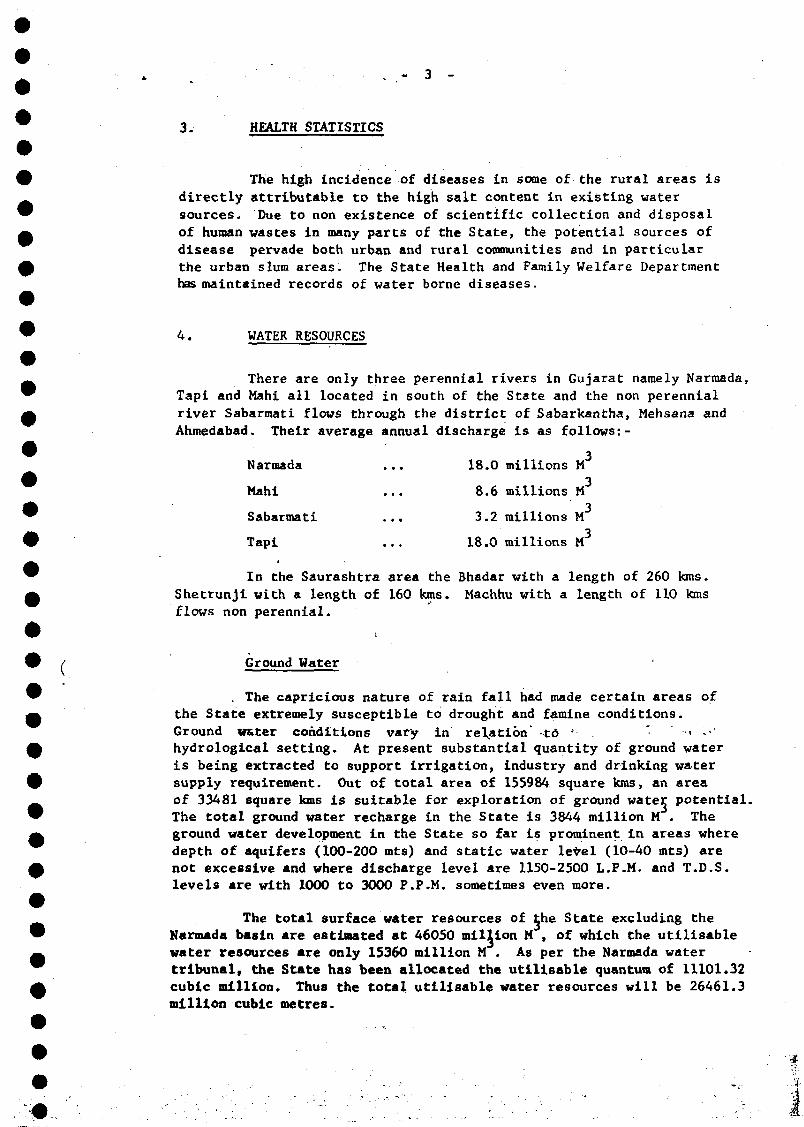
- 3 -
3. HEALTH STATISTICS
The high incidence of diseases in some of the rural areas isdirectly attributable to the high salt content in existing watersources. Due to non existence of scientific collection and disposalof human wastes in many parts of the State, the potential sources ofdisease pervade both urban and rural communities and in particularthe urban slum areas. The State Health and Family Welfare Departmenthas maintained records of water borne diseases.
4. WATER RESOURCES
There are only three perennial rivers in Gujarat namely Narmada,Tapi and Mahi all located in south of the State and the non perennialriver Sabarmati flows through the district of Sabarkantha, Mehsana andAhmedabad. Their average annual discharge is as follows:-
Narmada ... 18.0 millions M
Mahi ... 8.6 millions M
Sabarmati ... 3.2 millions M
Tapi ... 18.0 millions M3
In the Saurashtra area the Ehadar with a length of 260 kms.Shetrunji with a length of 160 kms. Machhu with a length of 110 kmsflows non perennial.
Ground Water
. The capricious nature of rain fall had made certain areas ofthe State extremely susceptible to drought and famine conditions.Ground w&ter conditions vary in relation' to '•• . • : • -••'hydrological setting. At present substantial quantity of ground wateris being extracted to support irrigation, industry and drinking watersupply requirement. Out of total area of 155984 square kms, an areaof 33481 square kms is suitable for exploration of ground water potential.The total ground water recharge in the State is 3844 million M . Theground water development in the State so far is prominent in areas wheredepth of aquifers (100-200 mts) and static water level (10-40 mts) arenot excessive and where discharge level are 1150-2500 L.P.M. and T.D.S.levels are with 1000 to 3000 P.P.M. sometimes even more.
The total surface water resources of the State excluding theNarmada basin are estimated at 46050 million M , of which the utilisablewater resources are only 15360 million M . As per the Narmada watertribunal, the State has been allocated the utilisable quantum of 11101.32cubic million. Thus the total utilisable water resources will be 26461.3million cubic metres.
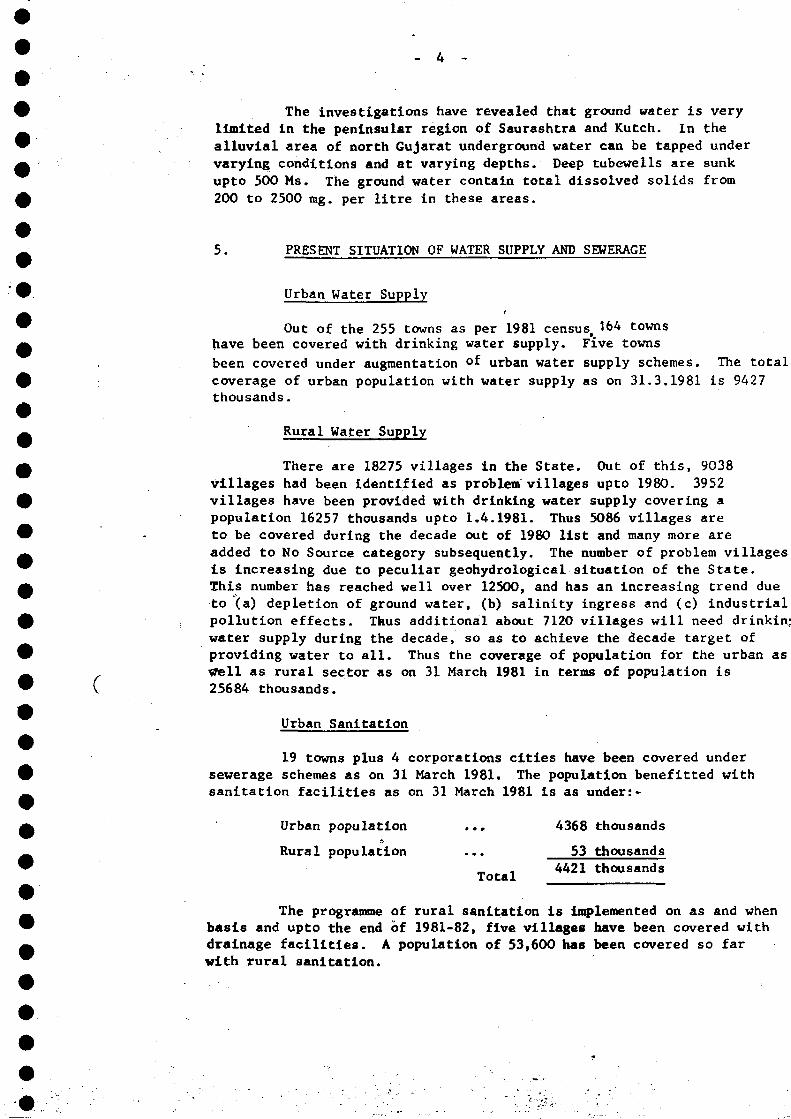
- 4
The investigations have revealed that ground water is verylimited in the peninsular region of Saurashtra and Kutch. In thealluvial area of north Gujarat underground water can be tapped undervarying conditions and at varying depths. Deep tubewells are sunkupto 500 Ms. The ground water contain total dissolved solids from200 to 2500 mg. per litre in these areas.
5. PRESENT SITUATION OF WATER SUPPLY AND SEWERAGE
Urban Water Supply
Out of the 255 towns as per 1981 census, 164 townshave been covered with drinking water supply. Five townsbeen covered under augmentation of urban water supply schemes. The totalcoverage of urban population with water supply as on 31.3.1981 is 9427thousands.
Rural Water Supply
There are 18275 villages in the State. Out of this, 9038villages had been identified as problem villages upto 1980. 3952villages have been provided with drinking water supply covering apopulation 16257 thousands upto 1.4.1981. Thus 5086 villages areto be covered during the decade out of 1980 list and many more areadded to No Source category subsequently. The number of problem villagesis increasing due to peculiar geohydrological situation of the State.This number has reached well over 12500, and has an increasing trend dueto (a) depletion of ground water, (b) salinity ingress and (c) industrialpollution effects. Thus additional about 7120 villages will need drinkin.'water supply during the decade, so as to achieve the decade target ofproviding water to all. Thus the coverage of population for the urban aswell as rural sector as on 31 March 1981 in terms of population is25684 thousands.
Urban Sanitation
19 towns plus 4 corporations cities have been covered undersewerage schemes as on 31 March 1981. The population benefitted withsanitation facilities as on 31 March 1981 is as under:-
Urban population ... 4368 thousands
Rural population ... 53 thousands4421 thousands
Total
The programme of rural sanitation is implemented on as and whenbasis and upto the end of 1981-82, five villages have been covered withdrainage facilities. A population of 53,600 has been covered so farwith rural sanitation.
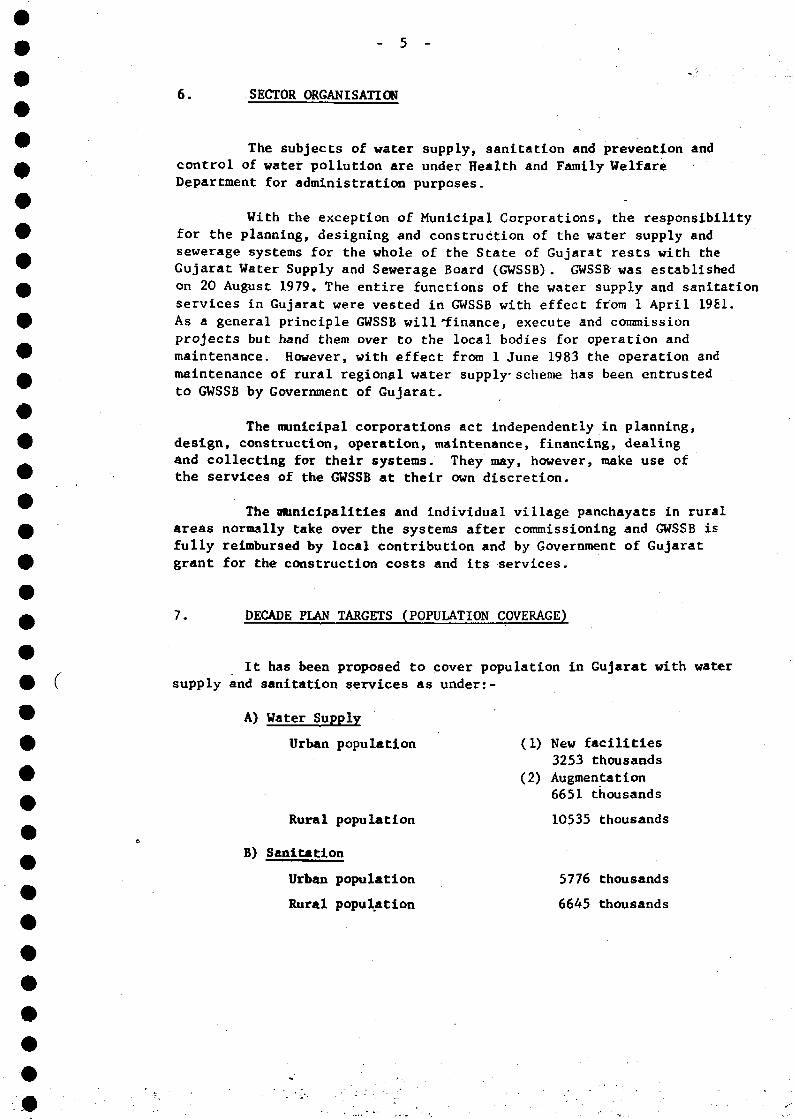
5 -
6. SECTOR ORGANISATION
The subjects of water supply, sanitation and prevention andcontrol of water pollution are under Health and Family WelfareDepartment for administration purposes.
With the exception of Municipal Corporations, the responsibilityfor the planning, designing and construction of the water supply andsewerage systems for the whole of the State of Gujarat rests with theGujarat Water Supply and Sewerage Board (GWSSB). GWSSB was establishedon 20 August 1979. The entire functions of the water supply and sanitationservices in Gujarat were vested in GWSSB with effect from 1 April 1981.As a general principle GWSSB will'finance, execute and commissionprojects but hand them over to the local bodies for operation andmaintenance. However, with effect from 1 June 1983 the operation andmaintenance of rural regional water supply- scheme has been entrustedto GWSSB by Government of Gujarat.
The municipal corporations act independently in planning,design, construction, operation, maintenance, financing, dealingand collecting for their systems. They may, however, make use ofthe services of the GWSSB at their own discretion.
The ntmicipalities and individual village panchayats in ruralareas normally take over the systems after commissioning and GWSSB isfully reimbursed by local contribution and by Government of Gujaratgrant for the- construction costs and its services.
7. DECADE PLAN TARGETS (POPULATION COVERAGE)
It has been proposed to cover population in Gujarat with watersupply and sanitation services as under:-
A) Water Supply
Urban population (1) New facilities3253 thousands
(2) Augmentation6651 thousands
Rural population 10535 thousands
B) Sanitation
Urban population 5776 thousands
Rural population 6645 thousands
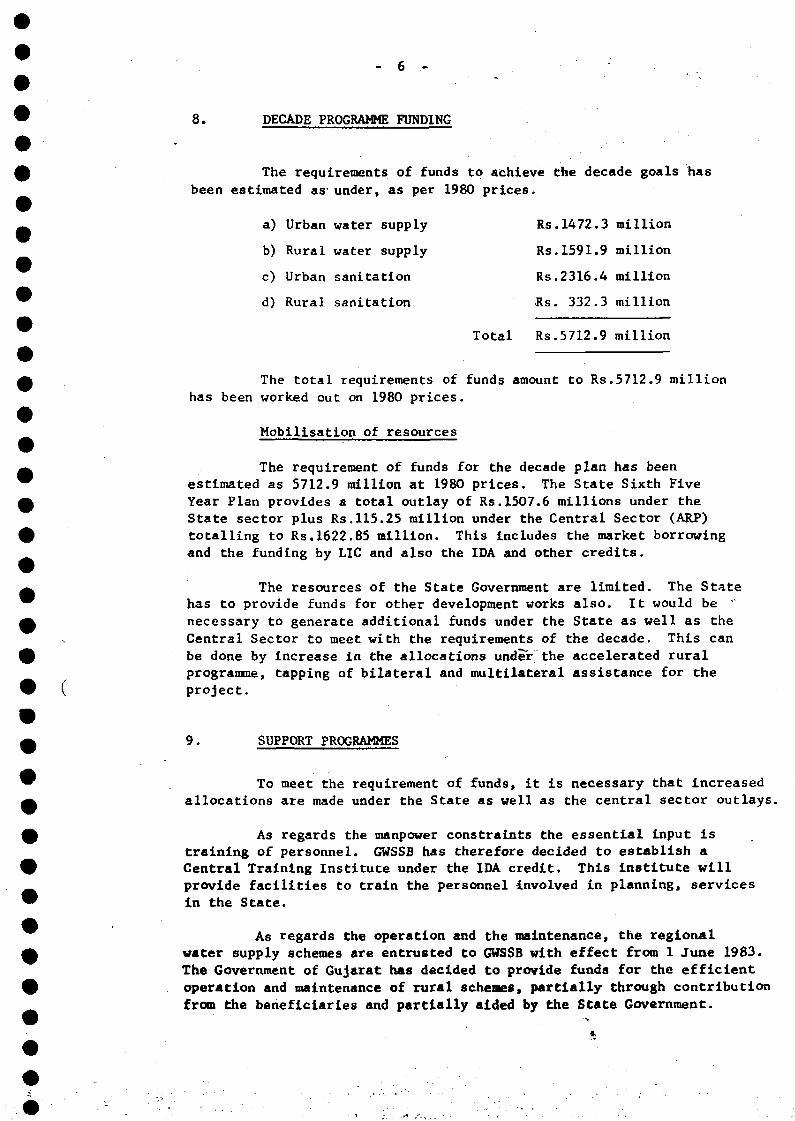
- 6 ..-
8. DECADE PROGRAMME FUNDING
The requirements of funds to achieve the decade goals hasbeen estimated as under, as per 1980 prices.
a) Urban water supply Rs.1472.3 million
b) Rural water supply Rs.1591.9 million
c) Urban sanitation Rs.2316.4 million
d) Rural sanitation Rs. 332.3 million
Total Rs.5712.9 million
The total requirements of funds amount to Rs.5712.9 millionhas been worked out on 1980 prices.
Mobilisation of resources
The requirement of funds for the decade plan has beenestimated as 5712.9 million at 1980 prices. The State Sixth FiveYear Plan provides a total outlay of Rs.1507.6 millions under theState sector plus Rs.115.25 million under the Central Sector (ARP)totalling to Rs.1622.85 million. This includes the market borrowingand the funding by LIC and also the IDA and other credits.
The resources of the State Government are limited. The Statehas to provide funds for other development works also. It would be "necessary to generate additional funds under the State as well as theCentral Sector to meet with the requirements of the decade. This canbe done by increase in the allocations under the accelerated ruralprogramme, tapping of bilateral and multilateral assistance for theproject.
9. SUPPORT PROGRAMMES
To meet the requirement of funds, it is necessary that increasedallocations are made under the State as well as the central sector outlays.
As regards the manpower constraints the essential input istraining of personnel. GWSSB has therefore decided to establish aCentral Training Institute under the IDA credit. This institute willprovide facilities to train the personnel involved in planning, servicesIn the State.
As regards the operation and the maintenance, the regionalwater supply schemes are entrusted to GWSSB with effect from 1 June 1963.The Government of Gujarat has decided to provide funds for the efficientoperation and maintenance of rural schemes, partially through contributionfrom the beneficiaries and partially aided by the State Government.
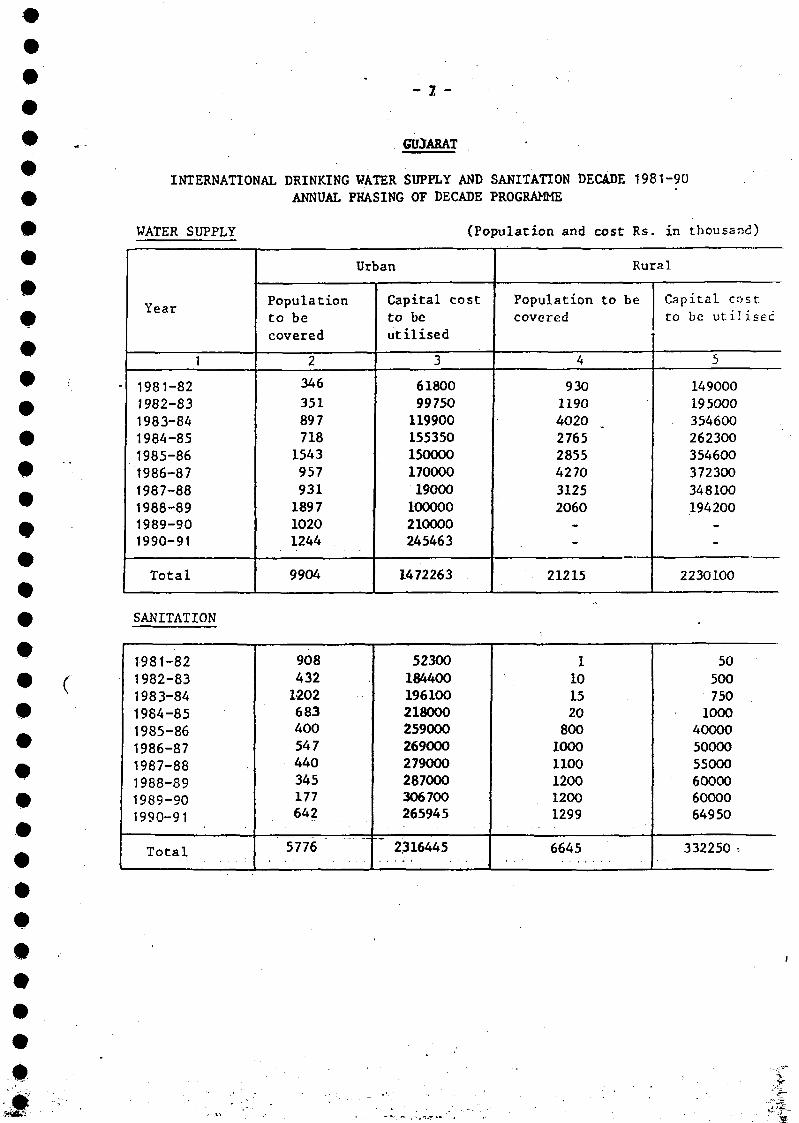
- 2 -
GUJARAT
INTERNATIONAL DRINKING WATER SUPPLY AND SANITATION DECADE 1981-90
ANNUAL PHASING OF DECADE PROGRAMME
WATER SUPPLY (Population and cost Rs. in thousand)
Vpar
1
1981-821982-831983-841984-851985-86
1986-871987-88
1988-891989-901990-91
Total
Populationto be
covered
2
346
351897718
1543
957931189710201244
9904
Urban
Capital cost
to beutilised
3
618009975011990015535015000017000019000
100000210000245463
1472263
Population
covered
4
93011904020
276528554270
31252060-
21215
Rural
to be Capital cost
to be utilised
5
149000195000354600262300
354600372300
348100194200
_-
2230100
SANITATION
1981-82
1982-831983-84
1984-851985-861986-871987-88
1988-891989-901990-91
Total
9084321202683400547440345177642
5776
52300
184400196100218000259000269000279000287000306700265945
2316445
1101520800
10001100120012001299
6645
50500750
1000400005000055000600006000064950
332250 s
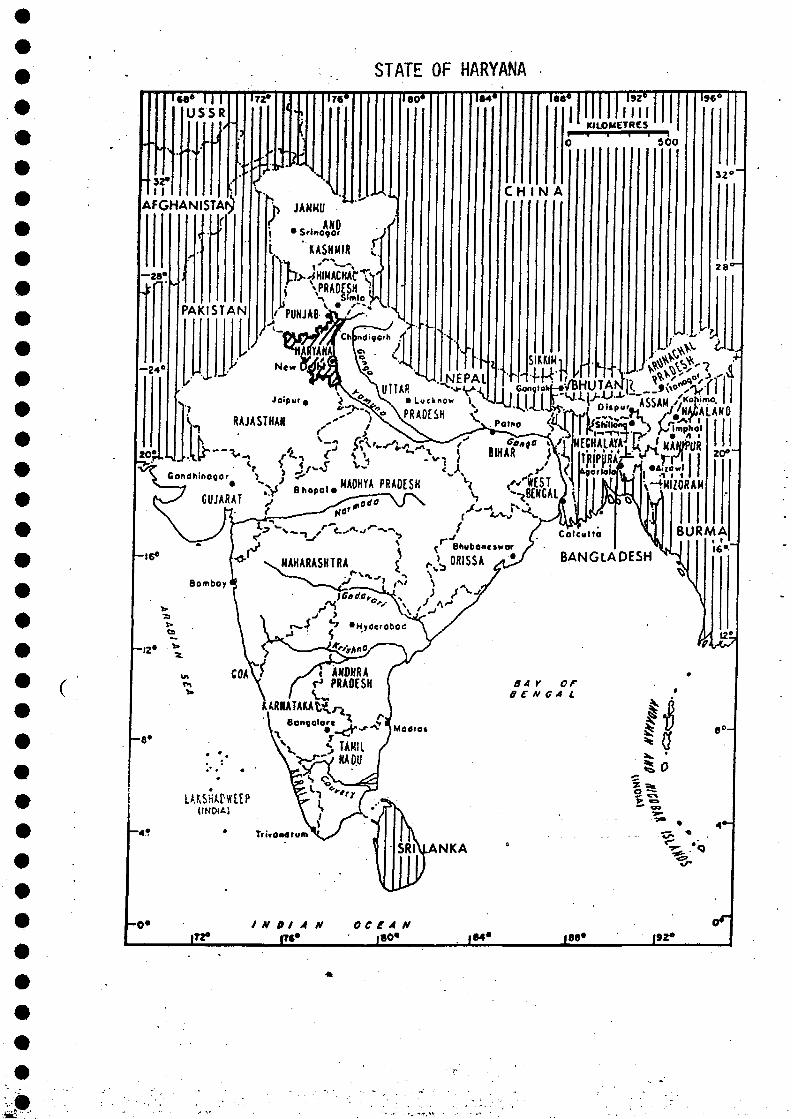
STATE OF HARYANA •'«e» I I |
USSR
3ZM
AFGHANISTAN
- 2 8 °
mTTÏ1
> JAMMU
• SrinOOOr JKASHMIR •£.
Cb-JHIMACHArTV
» ^ A 0 I L H . a i' PUNJAB w '
ISO* I Ï 4 Tê«< 192°l l l l
KltOMCTRCS
5 0 0
C H I N A
196"
32**
2 8 °
BANGLADESH
<•' PRADESH
Bongalort j L j .
EXECUTIVE SUMMARYOF
THE DECADE PLAN OF WATER SUPPLY ANDSANITATION SECTOR (APRIL 1981 - MARCH 1991)
FOR
HARYANA
1. INTRODUCTION
Haryana State came into existence only in 1966. It was a part ofcomposite Punjab State previously. Prior to 1947, the water supply &sanitation was not given any importance. Regular piped water supply existedonly in 3 towns and sewerage facilities did not exist in any of the townsnow situated in Haryana State. In 1954 with the help of Govt. of India, aNational water supply and sanitation programme was launched under whichloans on liberal terms were arranged for Municipalities in Urban Areas andin some deserving cases grant-in-aid was also given to them. Later on, theLife Insurance Corporation of India came in to advance loans for drinkingwater supply schemes to the local bodies. In Rural Areas the Panchayatwhich were the counterparts of Local Bodies in towns, could raise no resourcesof their own. They were given subsidy by the Central Government andgrant-in-aid by the State Govt.
Haryana has an area of 44,212 sq.kms. It lies in the Indo-Gangeticplain with an elevation of 200 to 350 M above MSL except for some hills ofShiwalik system in the North and of Aravalli system in the South.
Population of the state as per 1971 census was 100.37 lacs (urban17.73 and rural 82.64). The projected figures of 1981 population are124.82 lacs (urban 23.92 & rural 100.90). However, the provisional figuresof 1981 census is 128.51 lacs. The projected population figures of 1991are 150.97 lacs (urban 31.40 and rural 119.57)
As per 1971 census, there were 65 towns and 6731 villages in thestate.
As per 1971 census, percentage of literacy in Haryana was 26.89.This has improved to 35.84% according to the provisional figures of 1981census. Literacy among the males (47.8%) and in urban areas is higher thanamong females (22.21) and in rural areas.
Average annual per capita income in the state is Rs. 1867, beingthe third highest in the country, the first being Punjab (Rs. 2361/-) andthe second Maharashtra (Rs. 1903/-)
„•'•'" •'•"
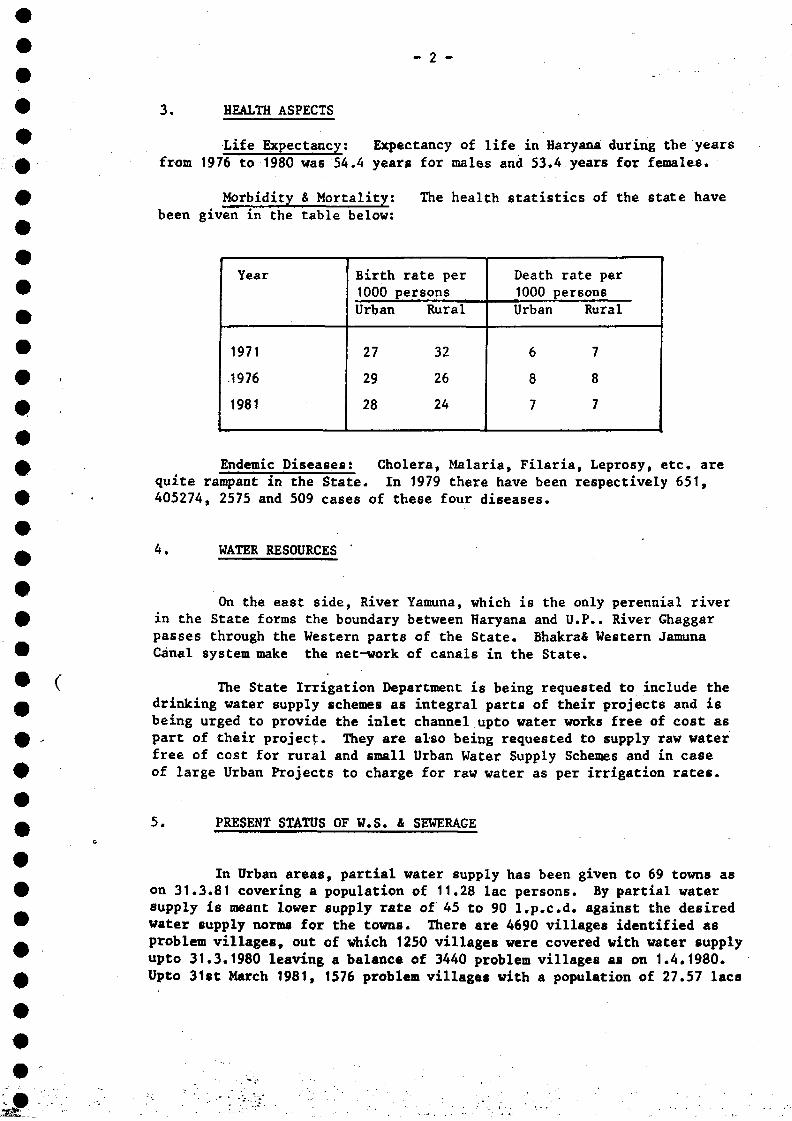
- 2 -
3. HEALTH ASPECTS
Life Expectancy: Expectancy of life in Haryana during the yearsfrom 1976 to 1980 was 54.A years for males and 53.A years for females.
Morbidity & Mortality: The health statistics of the state havebeen given in the table below:
Year
1971
1976
1981
Birth1000Urban
27
29
28
rate perpersons
Rural
32
26
24
Death1000Urban
6
8
7
rate perpersons
Rural
7
8
7
Endemic Diseases: Cholera, Malaria, Filaria, Leprosy, etc. arequite rampant in the State. In 1979 there have been respectively 651,405274, 2575 and 509 cases of these four diseases.
4. WATER RESOURCES
On the east side, River Yamuna, which is the only perennial riverin the State forms the boundary between Haryana and U.P.. River Ghaggarpasses through the Western parts of the State. Bhakra& Western JamunaCanal system make the net-work of canals in the State.
The State Irrigation Department is being requested to include thedrinking water supply schemes as integral parts of their projects and isbeing urged to provide the inlet channel upto water works free of cost aspart of their project. They are also being requested to supply raw waterfree of cost for rural and small Urban Water Supply Schemes and in caseof large Urban Projects to charge for raw water as per irrigation rates.
5. PRESENT STATUS OF W.S. & SEWERAGE
In Urban areas, partial water supply has been given to 69 towns ason 31.3.81 covering a population of 11.28 lac persons. By partial watersupply is meant lower supply rate of 45 to 90 l.p.c.d. against the desiredwater supply norms for the towns. There are 4690 villages identified asproblem villages, out of which 1250 villages were covered with water supplyupto 31.3.1980 leaving a balance of 3440 problem villages as on 1.4.1980.Upto 31st March 1981, 1576 problem villages with a population of 27.57 lacs
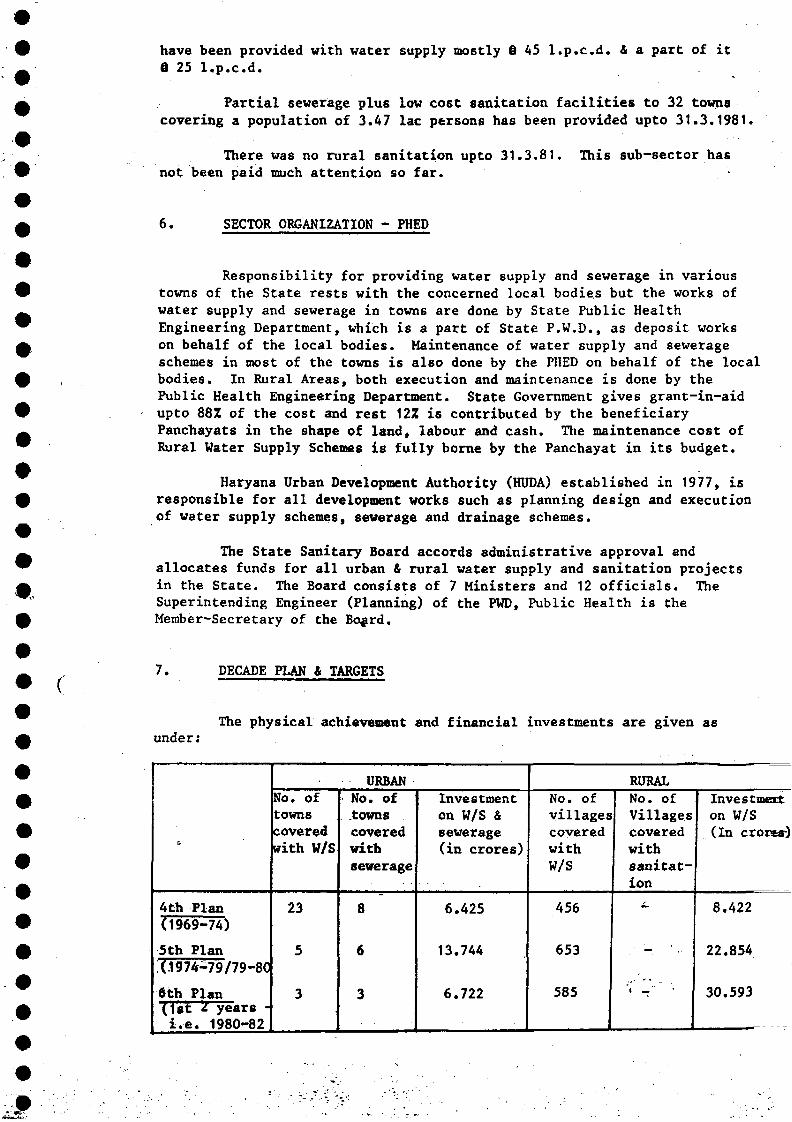
have been provided with water supply mostly § 45 l.p.c.d. & a part of itâ 25 l.p.c.d. .
Partial sewerage plus low cost sanitation facilities to 32 townscovering a population of 3.47 lac persons has been provided upto 31.3.1981.
There was no rural sanitation upto 31.3.81. This sub-sector hasnot been paid much attention so far.
6. SECTOR ORGANIZATION - PHED
Responsibility for providing water supply and sewerage in varioustowns of the State rests with the concerned local bodies but the works ofwater supply and sewerage in towns are done by State Public HealthEngineering Department, which is a part of State P.W.D., as deposit workson behalf of the local bodies. Maintenance of water supply and sewerageschemes in most of the towns is also done by the PHED on behalf of the localbodies. In Rural Areas, both execution and maintenance is done by thePublic Health Engineering Department. State Government gives grant-in-aidupto 88Z of the cost and rest 12% is contributed by the beneficiaryPanchayats in the shape of land, labour and cash. The maintenance cost ofRural Water Supply Schemes is fully borne by the Panchayat in its budget.
Haryana Urban Development Authority (HUDA) established in 1977, isresponsible for all development works such as planning design and executionof water supply schemes, sewerage and drainage schemes.
The State Sanitary Board accords administrative approval andallocates funds for all urban & rural water supply and sanitation projectsin the State. The Board consists of 7 Ministers and 12 officials. TheSuperintending Engineer (Planning) of the PWD, Public Health is theMember-Secretary of the Board.
7. DECADE PLAN & TARGETS
under:The physical achievement and financial investments are given as
4th Plan(1969-74)
5th Plan(1974-79/79-80
6th Plan(let Ii years -i.e. 1980-82
No. oftownscoveredwith W/S
23
5
3
URBANNo. oftownscoveredwithsewerage
8
6
3
Investmenton W/S 4sewerage(in crores)
6.425
13.744
6.722
RURALNo. ofvillagescoveredwithW/S
456
653
585
No. ofVillagescoveredwithsanitat-ion
Investmenton W/S(In croras)
8.422
22.854
30.593
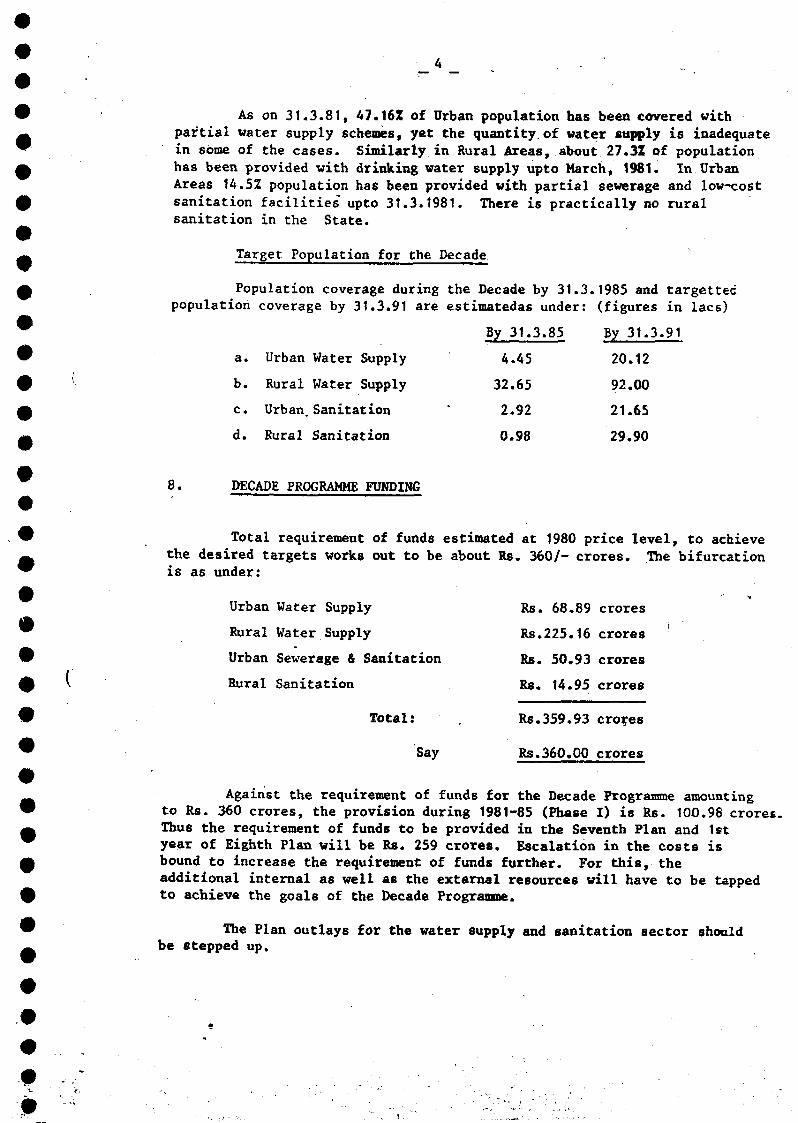
*
As on 31.3.81, 47.16Z of Urban population has been covered withpartial water supply schemes, yet the quantity of water supply is inadequatein some of the cases. Similarly in Rural Areas, about 27.3Z of populationhas been provided with drinking water supply upto March, 1981. In UrbanAreas 14.5% population has been provided with partial sewerage and low-costsanitation facilities upto 31.3.1981. There is practically no ruralsanitation in the State.
Target Population for the Decade
Population coverage during the Decade by 31.3.1985 and targettecpopulation coverage by 31.3.91 are estimatedas under: (figures in lacs)
a. Urban Water Supply
b. Rural Water Supply
c. Urban. Sanitation
d. Rural Sanitation
DECADE PROGRAMME FUNDING
By 31.3.85
4.45
32.65
2.92
0.98
By 31.3.91
20.12
92.00
21.65
29.90
Total requirement of funds estimated at 1980 price level, to achievethe desired targets works out to be about Rs. 360/- crores. The bifurcationis as under:
Urban Water Supply Rs. 68.89 crores
Rural Water Supply Rs.225.16 crores
Urban Sewerage & Sanitation Rs. 50.93 crores
Rural Sanitation Rs. 14.95 crores
Total: , Rs.359.93 crores
Say Rs.36O.OQ crores
Against the requirement of funds for the Decade Programme amountingto Rs. 360 crores, the provision during 1981-85 (Phase I) is Rs. 100.98 croree.Thus the requirement of funds to be provided in the Seventh Plan and 1styear of Eighth Plan will be Rs. 259 crores. Escalation in the costs isbound to increase the requirement of funds further. For this, theadditional internal as well as the external resources will have to be tappedto achieve the goals of the Decade Programme.
The Plan outlays for the water supply and sanitation sector shouldbe stepped up.
- 5 -
The State Govt. is examining the issue to see that water rates areso fixed that these ensure the repayment of loans with interest as well asrecovery of operation and maintenance cost and provision for building up ofa reserve fund. Surpluses from Urban Water Supply Schemes or from suppliesmade for industrial and commercial purposes shall be utilised as crosssubsidy to sewerage schemes and rural water supply schemes.
Active participation of the Urban Local Bodies shall be ensured.At present the Local Bodies are contributing 5% of the costs of the projectfrom their own resources. Efforts shall be made to enhance this contributic-upto 10 to 15Z after examining the financial position of the Urban Bodies.
Similarly in case of rural water supply schemes, the Panchayêtsare urged to contribute at least the 0 & M cost and enhance their cashcomponent to 10%. At present, it is 7% in shape of land and labour and 5%in cash.
The State Government shall examine the possibility of raising theadditional resources for water supply and sewerage schemes during theDecade Programme by imposing a special purpose-cess as a surcharge onselected taxes like land revenue, Sales Tax, Passenger tax, Motor VehicleTax, etc. which shall be exclusively utilised for water supply and sanitationschemes. The matter is under consideration and shall be examined by theState Apex Committee.
9. The annual phasing of the programme during the Decade period isindicated in the enclosed table.
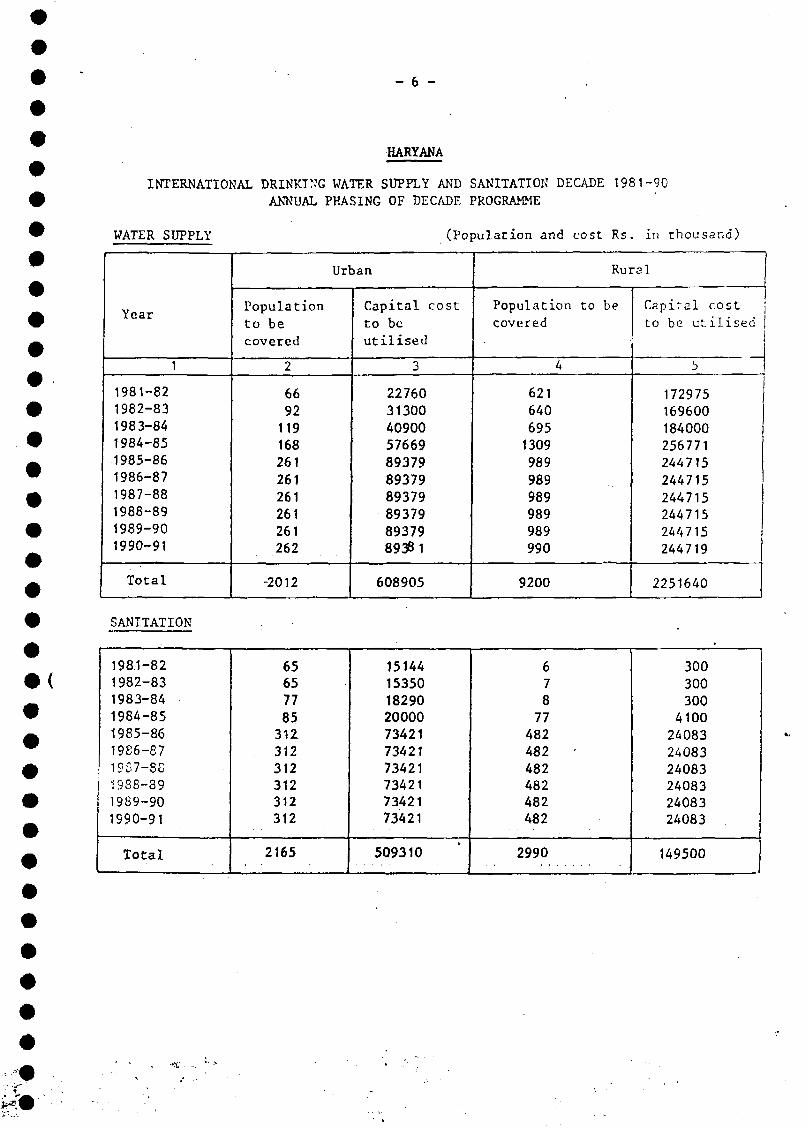
- 6 -
HARYANA
INTERNATIONAL DRINKING WATER SUPPLY AND SANITATION DECADE 1981-90ANNUAL PHASING OF DECADE PROGRAMME
WATER SUPPLY
I ear
1
1981-821982-831983-841984-851985-861986-87
1987-881988-891989-90
1990-91
Total
Population
to becovered
2
6692119168261261261261261262
-2012
Urban
Capital
to beutilised
3
2276031300409005766989379893798937989379893798938 1
608905
(Population and
cost Population
covered
4
6216406951309989989989989989990
9200
cost Rs in thousand)
Rural.
to be Capital cost
to be utilised
5
172975169600184000256771
244715
244715244715244715244715
244719
2251640
SANITATION
198.1-821982-831983-841984-851985-861986-8719S7-88
1988-891989-90
1990-91
Total
65657785312312312312312312
2165
15144153501829020000734217342173421734217342173421
509310
67877482482482482482482
2990
300300300
4100
240832408324083240832408324083
149500
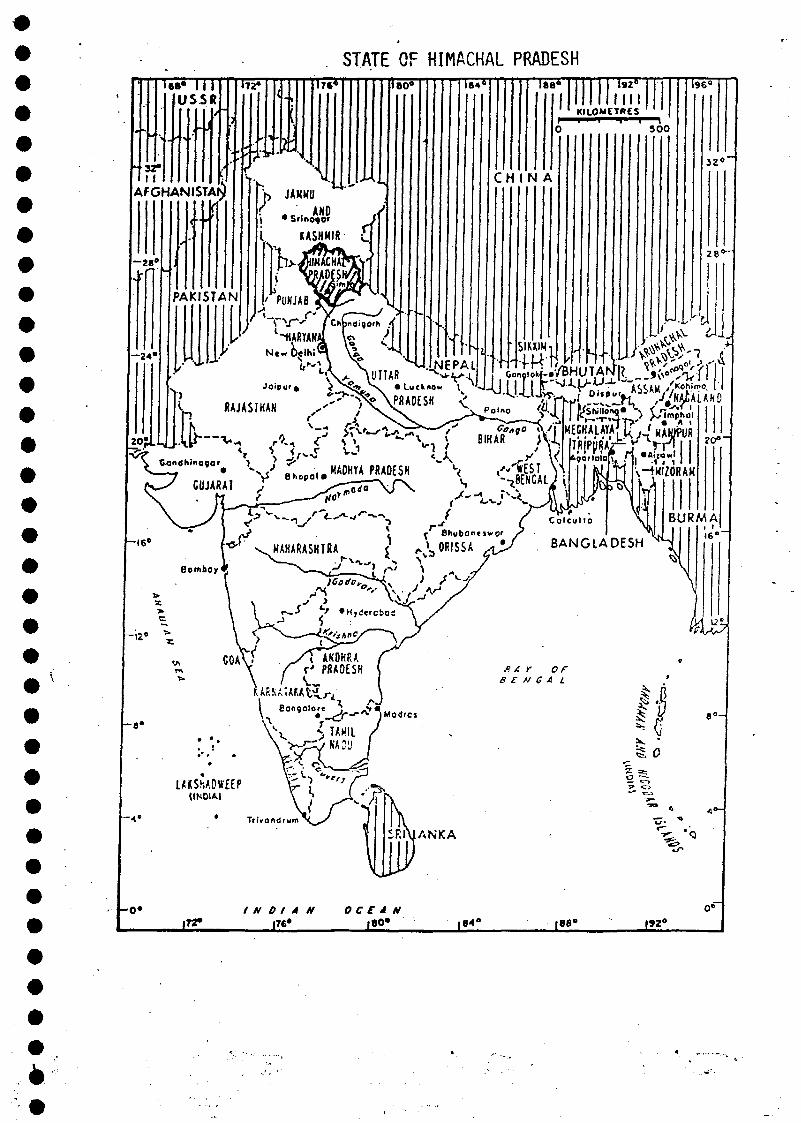
. STATE OF HIMACHAL PRADESH
y ...Ta ï <U
B A r orB £ H S A L
V \ _i"w«ii
. : EXECUTIVE SUMMARYOF
THE DECADE PLAN OF WATER SUPPLY ANDSANITATION SECTOR (APRIL 1981 - MARCH 1991)
FOR
HIMACHAL PRADESH
1. INTRODUCTION
Provision of safe drinking water to rural and urban populationhas been going on since beginning of Five Year Plans but the progresswas slow due to inadequate financial provisions. Practically all thesurface water sources which did not require costly treatment weretapped and sources which are quite far away and down below the villageshave been left.
Himachal Pradesh is a hilly state having an area of 55673 sqarekilometres and altitude varying from 400 to 4500 metres above MSL. It isbounded by Tibet in the East; Jamrau and Kashmir in the North, Punjaband Haryana in the west and U.P. in the South.
2. SOCIO-ECONOMIC INDICATORS
Population
Total Population ... 34.54 lacs (1971 census)
Population of 1981 ,o o o ,, ,. ... 42.28 lacs(projected)
Projected population ^ ^ ^
Out of the state total population of 42.28 lacs 38.92 lacs or 92.05%
is rural residing in remote and hilly areas. The urban population in
the State is only 3.36 lacs or 7.95% residing in 36 small towns.
Income
Per capita annual income in the State is Rs.1317. Agricultureis the main occupation of the rural people and provides direct employmentto about 70.64% of the total working population. Population below thepoverty line is 27.3%, the maximum being scheduled castes and peopleresiding in the tribal areas of Kinnaur, Lahaul and Spiti and Pangi and
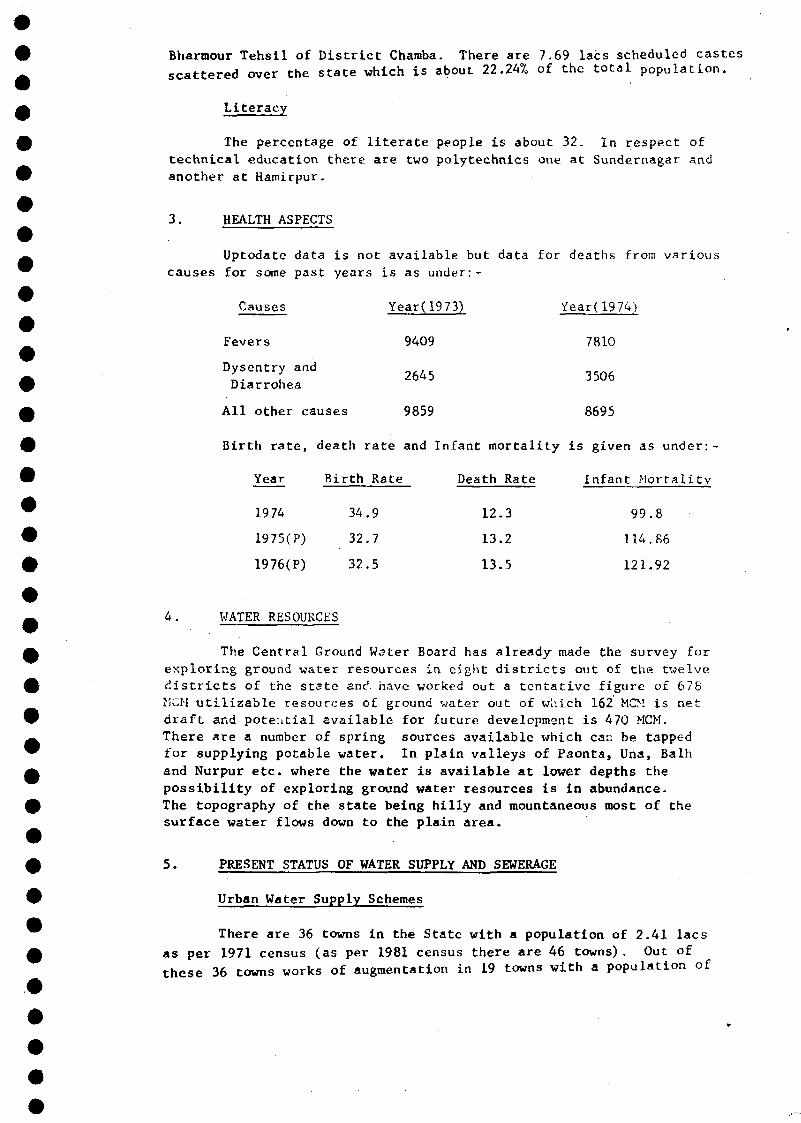
Bharraour Tehsil of District Chamba. There are 7.69 lacs scheduled castesscattered over the state which is about 22.24% of the total population.
Literacy
The percentage of literate people is about 32. In respect oftechnical education there are two polytechnics one at Sundernagar andanother at Hamirpur.
3. HEALTH ASPECTS
Uptodate data is not available but data for deaths from variouscauses for some past years is as under:-
Causes
Fevers
Diarrohea
All other causes
Year(1973)
9409
2645
9859
Year(1974)
7810
3506
8695
Birth rate, death rate and Infant mortality is given as under:-
Year Birth Rate Death Rate Infant Mortality
1974
1975(P)
1976(P)
34.9
32.7
32.5
12.3
13.2
13.5
99.8
114.86
121.92
4. WATER RESOURCES
The Central Ground W^ter Board has already- made the survey forexploring ground water resources in eight districts out of the twelvedistricts of the state and have worked out a tentative figure of 678I'iCH utilizable resources of ground water out of which 162 MO! is netdraft and potential available for future development is 470 MCM.There are a number of spring sources available which can be tappedfor supplying potable water. In plain valleys of Paonta, Una, Balhand Nurpur etc. where the water is available at lower depths thepossibility of exploring ground water resources is in abundance.The topography of the state being hilly and mountaneous most of thesurface water flows down to the plain area.
5. PRESENT STATUS OF WATER SUPPLY AND SEWERAGE
Urban Water Supply Schemes
There are 36 towns in the State with a population of 2.41 lacsas per 1971 census (as per 1981 census there are 46 towns). Out ofthese 36 towns works of augmentation in 19 towns with a population of
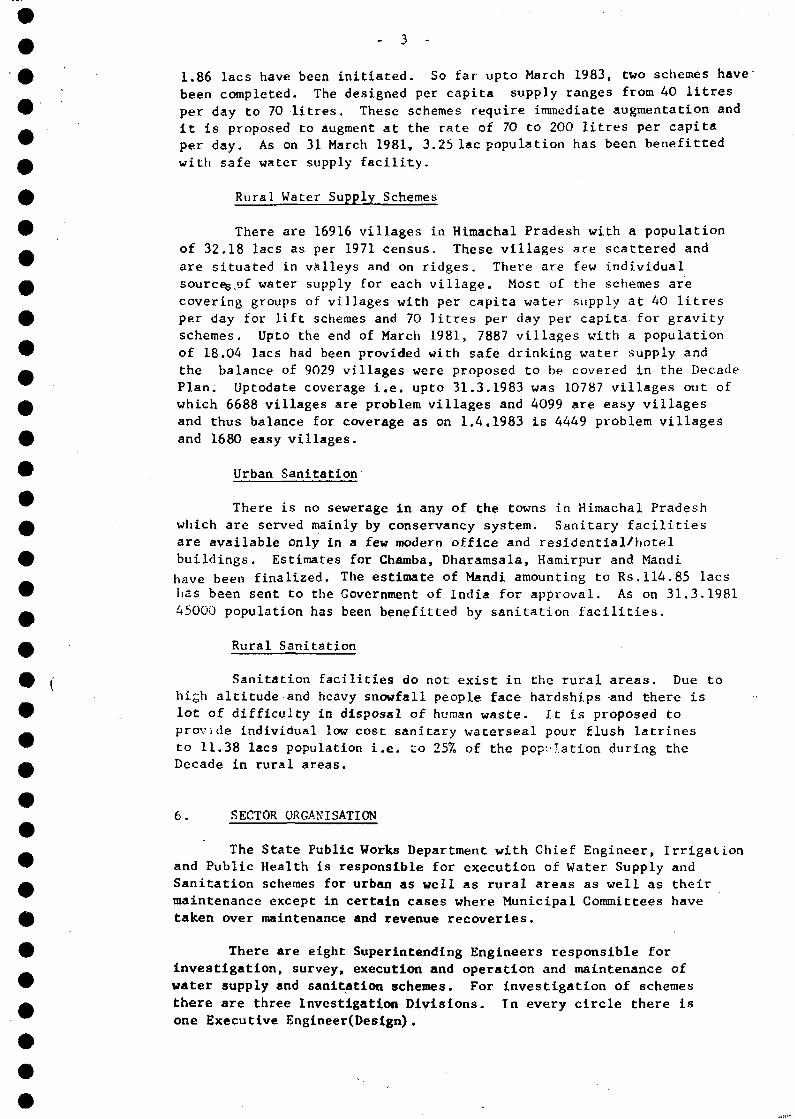
1.86 lacs have been initiated. So far upto March 1983, two schemes havebeen completed. The designed per capita supply ranges from 40 litresper day to 70 litres. These schemes require immediate augmentation andit is proposed to augment at the rate of 70 to 200 litres per capitaper day. As on 31 March 1981, 3.25 lac population has been benefittedwith safe water supply facility.
Rural Water Supply Schemes
There are 16916 villages in Himachal Pradesh with a populationof 32.18 lacs as per 1971 census. These villages are scattered andare situated in valleys and on ridges. There are few individualsources.of water supply for each village. Most of the schemes arecovering groups of villages with per capita water supply at 40 litresper day for lift schemes and 70 litres per day per capita for gravityschemes. Upto the end of March 1981, 7887 villages with a populationof 18.04 lacs had been provided with safe drinking water supply andthe balance of 9029 villages were proposed to be covered in the DecadePlan. Uptodate coverage i.e. upto 31.3.1983 was 10787 villages out ofwhich 6688 villages are problem villages and 4099 are easy villagesand thus balance for coverage as on 1.4.1983 is 4449 problem villagesand 1680 easy villages.
Urban Sanitation
There is no sewerage in any of the towns in Himachal Pradeshwhich are served mainly by conservancy system. Sanitary facilitiesare available only in a few modern office and residential/hotelbuildings. Estimates for Charoba, Dharamsala, Hamirpur and Mandihave been finalized. The estimate of Mandi amounting to Rs.114.85 lacshas been sent to the Government of India for approval. As on 31.3.198145000 population has been benefitted by sanitation facilities.
Rural Sanitation
Sanitation facilities do not exist in the rural areas. Due tohigh altitude and heavy snowfall people face hardships and there islot of difficulty in disposal of human waste. It is proposed toprovi.de Individual low cost sanitary waterseal pour flush latrinesto 11.38 lacs population i.e. to 257= of the population during theDecade in rural areas.
6. SECTOR ORGANISATION
The State Public Works Department with Chief Engineer, Irrigationand Public Health is responsible for execution of Water Supply andSanitation schemes for urban as well as rural areas as well as theirmaintenance except in certain cases where Municipal Committees havetaken over maintenance and revenue recoveries.
There are eight Superintending Engineers responsible forinvestigation, survey, execution and operation and maintenance ofwater supply and sanitation schemes. For investigation of schemesthere are three Investigation Divisions. In every circle there isone Executive Engineer(Design) .
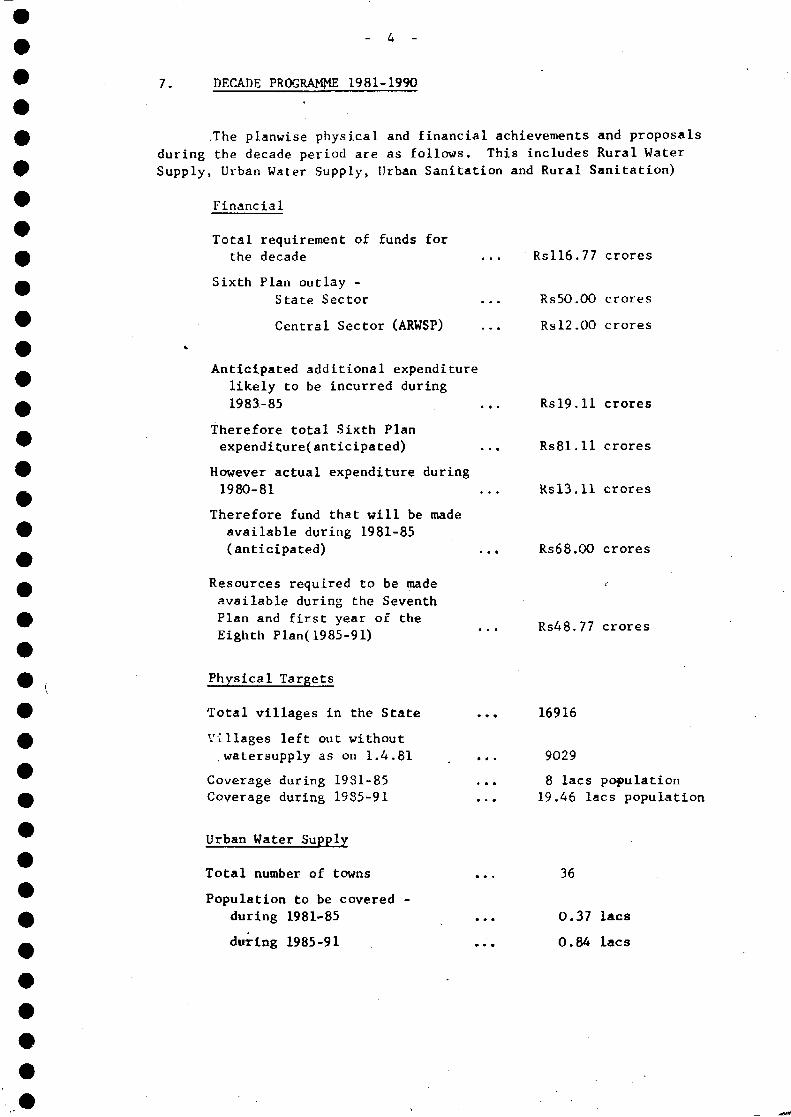
7. DECADE PROGRAMS 1981-1990
The planwise physical and financial achievements and proposals
during the decade period are as follows. This includes Rural Water
Supply, Urban Water Supply, Urban Sanitation and Rural Sanitation)
Financial
Total requirement of funds forthe decade
Sixth Flan outlay -
State Sector
Central Sector (ARWSP)
Rsll6.77 crores
Rs50.00 crores
Rsl2.00 crores
Anticipated additional expenditure
likely to be incurred during
1983-85
Therefore total Sixth Planexpenditure(anticipated)
However actual expenditure during
1980-81
Therefore fund that will be madeavailable during 1981-85(anticipated)
Resources required to be madeavailable during the SeventhPlan and first year of theEighth Plan( 1985-91)
Rsl9.11 crores
Rs81.11 crores
Rsl3.11 crores
Rs68.OO crores
r
Rs48.77 crores
Physical Targets
Total villages in the State
Villages left out withoutwatersupply as on 1.4.81
Coverage during 19S1-85Coverage during 1935-91
16916
9029
8 lacs population19.46 lacs population
Urban Water Supply
Total number of towns
Population to be covered -during 1981-85
during 1985-91
36
0.37 lacs
0.84 lacs
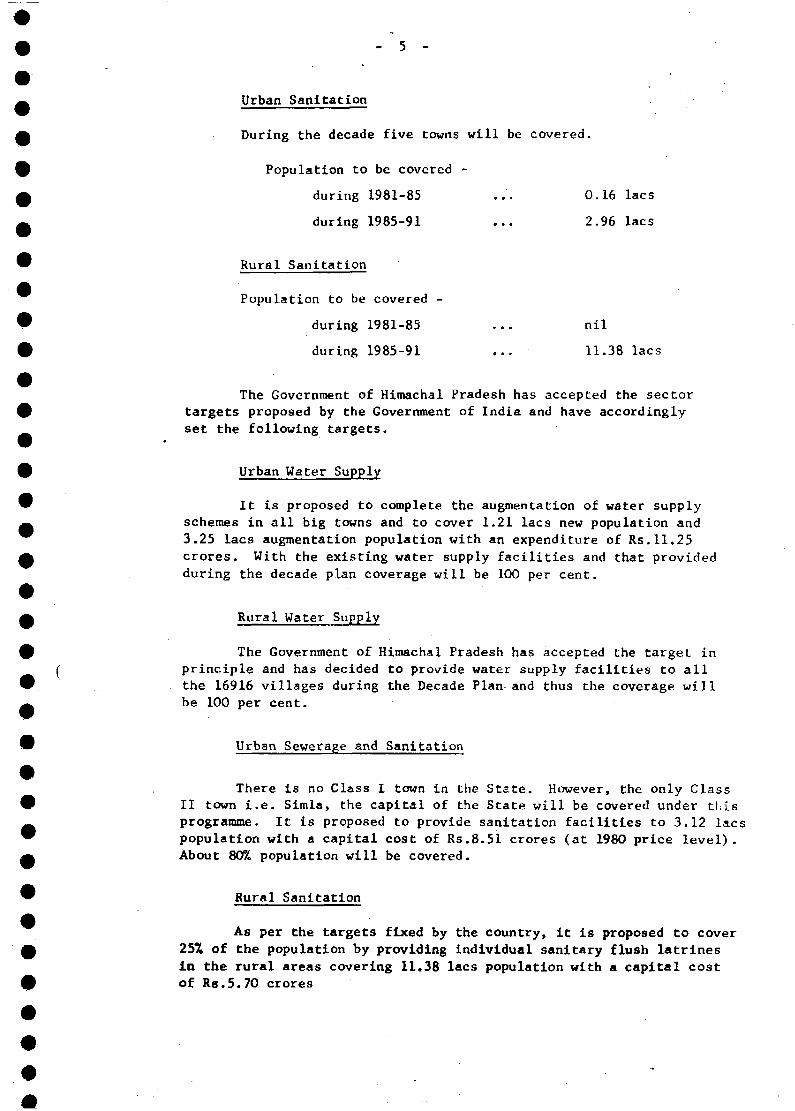
- 5 -
Urban Sanitation
During the decade five towns will be covered.
Population to be covered -
during 1981-85 ... 0.16 lacs
during 1985-91 ... 2.96 lacs
Rural Sanitation
Population to be covered -
during 1981-85 ... nil
during 1985-91 ... 11.38 lacs
The Government of Himachal Pradesh has accepted the sectortargets proposed by the Government of India and have accordinglyset the following targets.
Urban Water Supply
It is proposed to complete the augmentation of water supplyschemes in all big towns and to cover 1.21 lacs new population and3.25 lacs augmentation population with an expenditure of Rs.11.25crores. With the existing water supply facilities and that providedduring the decade plan coverage will be 100 per cent.
Rural Water Supply
The Government of Himachal Pradesh has accepted the target inprinciple and has decided to provide water supply facilities to allthe 16916 villages during the Decade Plan and thus the coverage willbe 100 per cent.
Urban Sewerage and Sanitation
There is no Class I town in the State. However, the only ClassII town i.e. Simla, the capital of the State will be covered under thisprogramme. It is proposed to provide sanitation facilities to 3.12 lacspopulation with a capital cost of Rs.8.51 crores (at 1980 price level).About 80% population will be covered.
Rural Sanitation
As per the targets fixed by the country, it is proposed to cover25% of the population by providing individual sanitary flush latrinesin the rural areas covering 11.38 lacs population with a capital costof Rs.5.70 crores
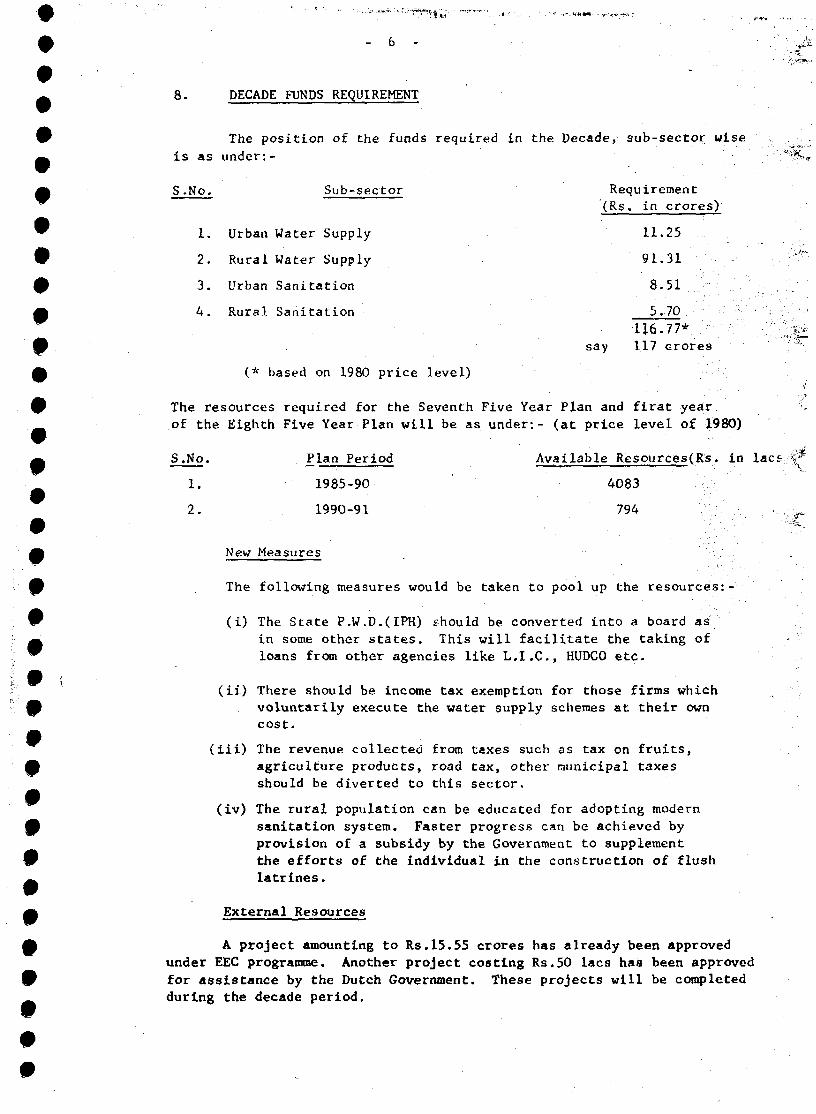
• - 6 -
8 . DECADE FUNDS REQUIREMENTA
The position of the funds required in the Decade, sub-sector wiseis as under:-
A S.No. Sub-sector Requirement
(Rs. in crores)
^ 1. Urban Water Supply 11.25
# 2. Rural Water Supply 91.310 3. Urban Sanitation 8.51
m 4. Rural Sanitation 5.70
116.77* '.•.."I:?£) say 1.17 Grores
0 • (* based on 1980 price level)
9 The resources required for the Seventh Five Year Plan and firat yearof the Eighth Five Year Plan will be as under:- (at price level of 1980)
t S.No. Plan Period Available Resources(Rs. in lacs*%
1. 1985-90 4083
2. 1990-91 794 • • • -\i*"
New Measures
The following measures would be taken to pool up the resources:-
(i) The State P.W.D.(IPH) should be converted into a board asin some other states. This will facilitate the taking ofloans from other agencies like L.I.C., HUDCO etc.
(ii) There should be income tax exemption for those firms whichvoluntarily execute the water supply schemes at their owncost.
(iii) The revenue collected from taxes such as tax on fruits,agriculture products, road tax, other municipal taxesshould be diverted to this sector,
(iv) The rural population can be educated for adopting modernsanitation system. Faster progress can be achieved byprovision of a subsidy by the Government to supplementthe efforts of the individual in the construction of flushlatrines.
External Resources
A project amounting to Rs.15.55 crores has already been approvedunder EEC programme. Another project costing Rs.50 lacs has been approvedfor assistance by the Dutch Government. These projects will be completedduring the decade period.
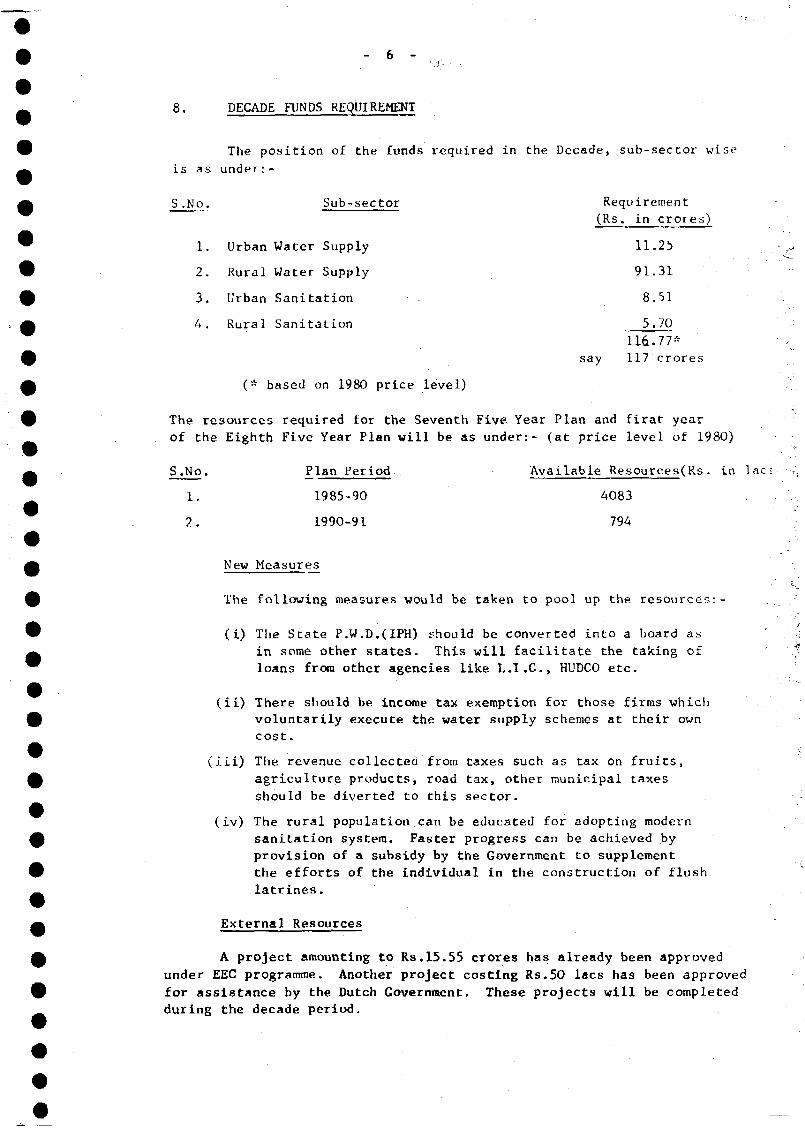
6 -
8. DECADE FUNDS REQUIREMENT
The position of the funds required in the Decade, sub-seccor wise
is as under:-
S.No. Sub-sector Requirement(Rs. in crores)
1. Urban Water Supply 11.25
2. Rural Water Supply 91.31
3. Urban Sanitation . 8.51
4. Rural Sanitation 5.70116.77*
say 117 crores
(* based on 1980 price level)
The resources required for the Seventh Five Year Plan and firat yearof the Eighth Five Year Plan will be as under:- (at price level of 1980)
Available Resources(Rs. in lac
4083
794
S.No.
1 .
2 .
Plan Period
1985-90
1990-91
New Measures
The following measures would be taken to pool up the resources:-
( i) The State P.W.D.(IPH) should be converted into a board asin some other states. This will facilitate the taking ofloans from other agencies like L.I.C., HUDCO etc.
(ii) There should be income tax exemption for those firms whichvoluntarily execute the water supply schemes at their owncost.
(iii) The revenue collected from taxes such as tax on fruits,agriculture products, road tax, other municipal taxesshould be diverted to this sector.
( iv) The rural population can be educated for adopting modernsanitation system. Faster progress can be achieved byprovision of a subsidy by the Government to supplementthe efforts of the individual in the construction of flushlatrines.
External Resources
A project amounting to Rs.15.55 crores has already been approvedunder EEC programme. Another project costing Rs.50 lacs has been approvedfor assistance by the Dutch Government. These projects will be completedduring the decade period-
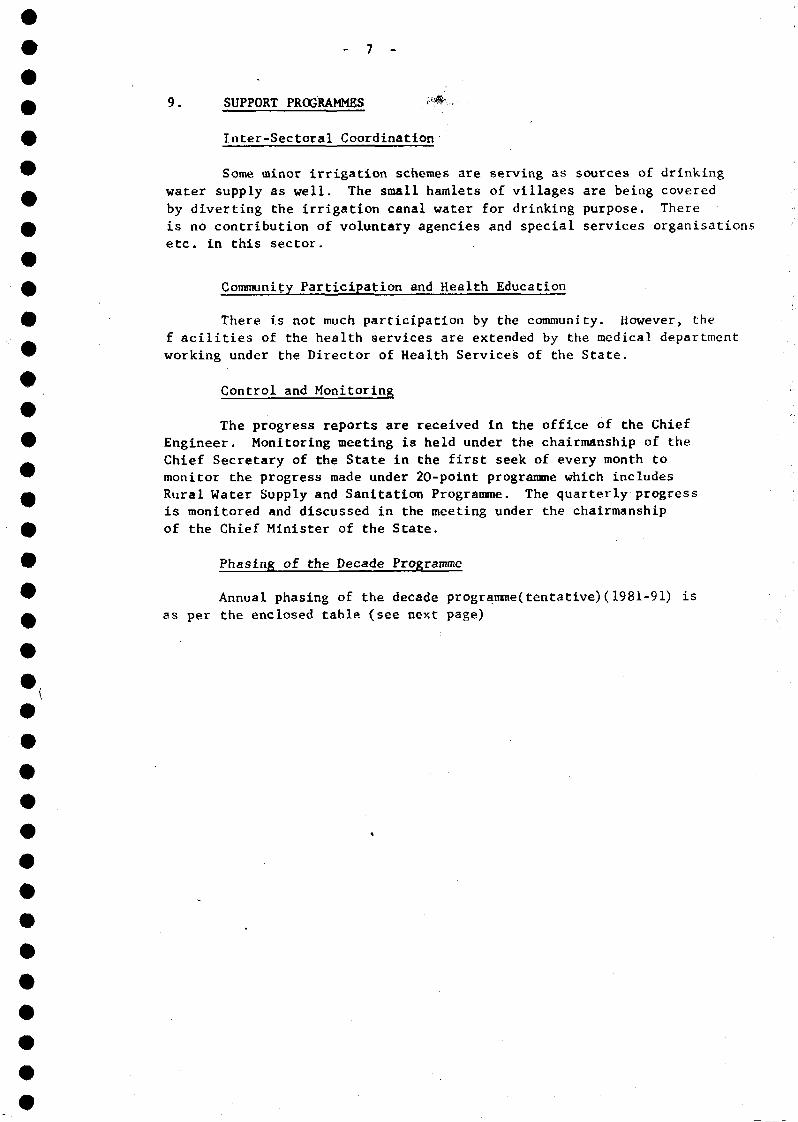
7 -
9. SUPPORT PROGRAMMES > *
Inter-Sectoral Coordination
Some minor irrigation schemes are serving as sources of drinking
water supply as well. The small hamlets of villages are being covered
by diverting the irrigation canal water for drinking purpose. There
is no contribution of voluntary agencies and special services organisations
etc. in this sector.
Community Participation and Health Education
There is not much participation by the community. However, the
f acilities of the health services are extended by the medical department
working under the Director of Health Services of the State.
Control and Monitoring
The progress reports are received in the office of the ChiefEngineer. Monitoring meeting is held under the chairmanship of theChief Secretary of the State in the first seek of every month tomonitor the progress made under 20-point programme which includesRural Water Supply and Sanitation Programme. The quarterly progressis monitored and discussed in the meeting under the chairmanshipof the Chief Minister of the State.
Phasing of the Decade Programme
Annual phasing of the decade programme(tentative)(1981-91) is
as per the enclosed table (see next page)
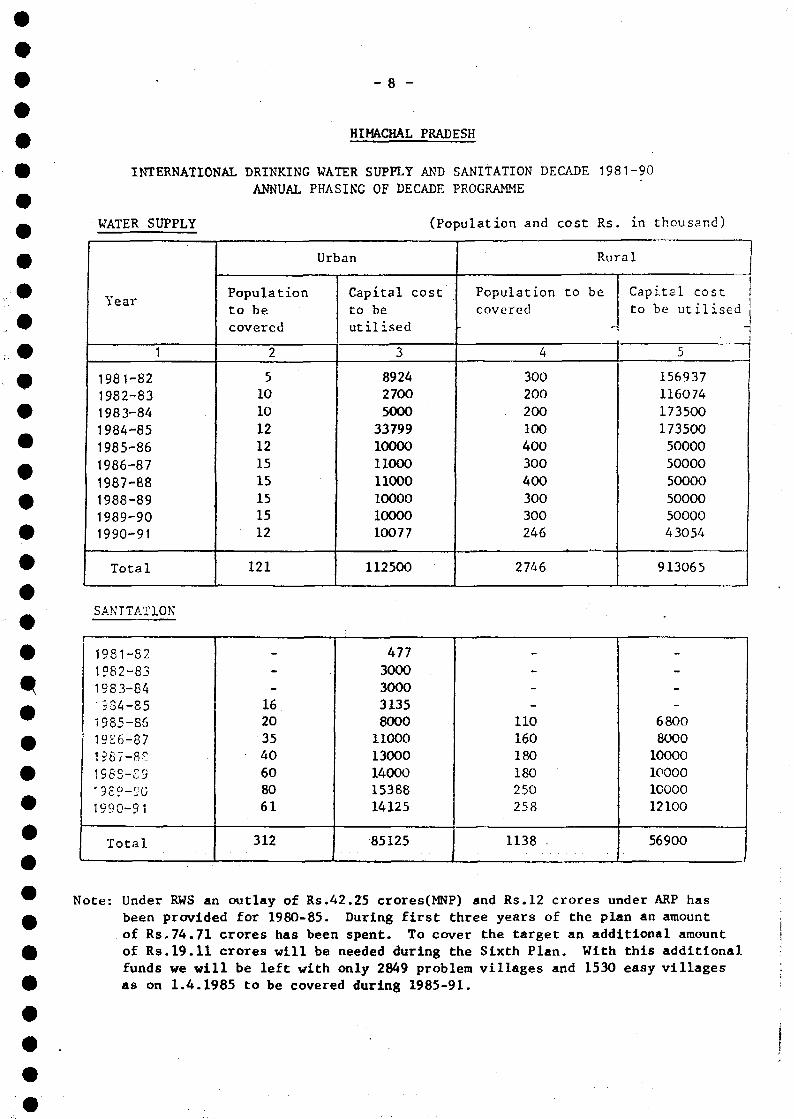
- 8 -
HIMACHAL PRADESH
INTERNATIONAL DRINKING WATER SUPPLY AND SANITATION DECADE 1981-90
ANNUAL PHASING OF DECADE PROGRAMME
WATER SUPPLY
Vu 3 1-
1
1981-821982-831983-84
1984-851985-86
1986-871987-88
1988-891989-901990-91
Total
Populationto becovered
2
5101012121515151512
121
(Population and
Urban
Capital cost
to beutilised
3
892427005000
33799100001100011000100001000010077
112500
Populationcovered
•
4
300200200100400300400300300246
2746
cost Rs in thousand)
Rural
to be
-
Capital costto be utilised
5
156937116074
173500173500500005000050000
500005000043054
913065
SANITATION
1
1981-521982-831983-84934-851985-851956-871967-8?
19SS-E9'9S9-9G1990-91
Total
_--16203540608061
312
47730003000
313580001100013000140001538814125
85125
---
110160180180250258
1138 ,
_---
6800800010000100001C00012100
56900
Note: Under RWS an outlay of Rs.42.25 crores(MNP) and Rs.12 crores under ARP hasbeen provided for 1980-85. During first three years of the plan an amountof Rs.74.71 crores has been spent. To cover the target an additional amountof Rs.19.11 crores will be needed during the Sixth Plan. With this additionalfunds we will be left with only 2849 problem villages and 1530 easy villagesas on 1.4.1985 to be covered during 1985-91.
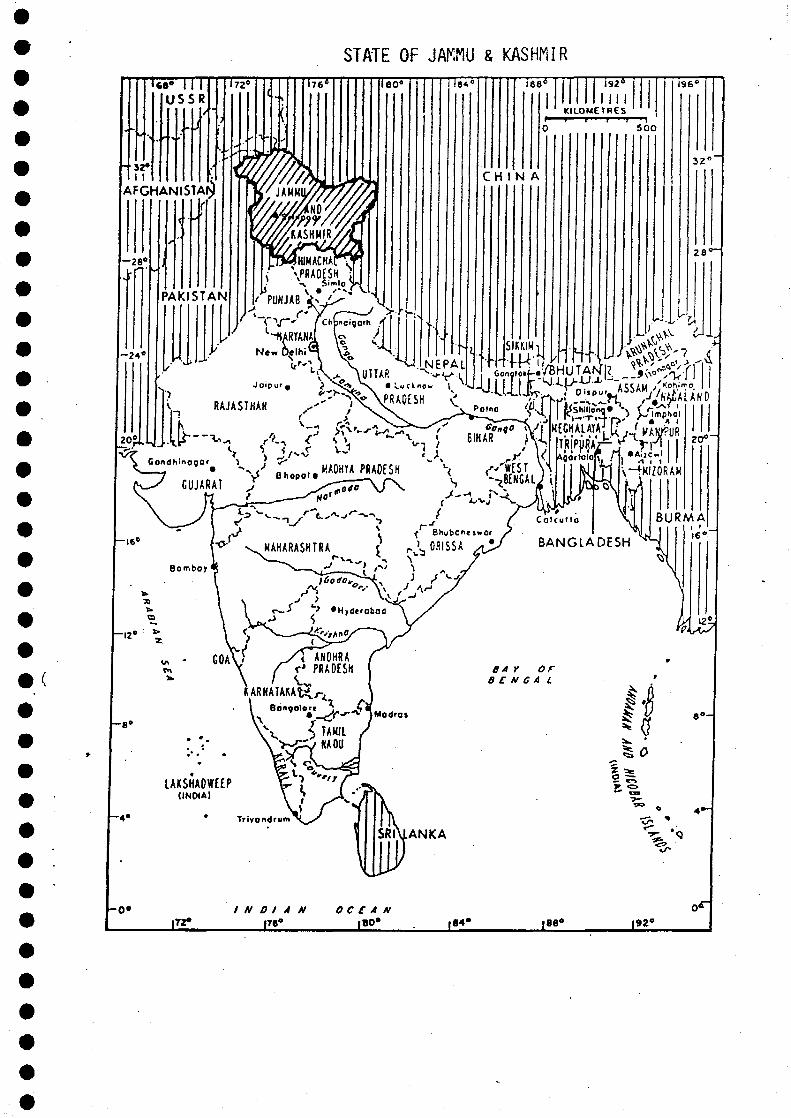
STATE OF JAMMU & KASHMIR
- 32*II , ;
AFGHANISTAN
BANGLADESH ^
-î "~> •HjOtrotoO
—7Bongolorc ,_
LAKSHAOWEEP(INDIA)
Trivondrum
OCEAN| BO»
EXECUTIVE SUMMARYOF
THE DECADE PLAN OF WATER SUPPLY ANDSANITATION SECTOR (APRIL 1981 - MARCH 1991)
FOR
JAMKU & KASHMIR
1. INTRODUCTION
Provision of drinking water supply facilities in the State hadalmost remained a completely neglected sphere of development prior toIndependence. Till then, such facilities were extended in a skeletonform only to the capital cities of Srinagar and Jammu apart from sometowns of tourist and religious importance. It was only with thebeginning of the Fifth Five Year Plan i.e., 1974-75 onwards» that theDrinking Water Supply was recognised as a priority sector of developmentin the State and received considerable impetus and emphasis. Sanitationhas remained neglected till date due to serious financial constraints.
Jammu & Kashmir State is the northern-most border State of Indiasituated in the Western Himalayas with the following distinct physicalregions:-
Ladakh: Ladakh region, the largest of the three regions, is arugged mountaneous terrain characterised by towering peaks, steep valleysand wide stone and dust deserts with a drainage basin called the Indus.The highest mountain peaks rise to 7500 Metres above mean sea-level(MSL).Average annual rainfall in Leh is 115 mms.
Kashmir : The region has an average altitude of 1700 Metresabove MSL and is bordered in the south and west by the Pirpanchal range and tothe north and east, by the Great Himalayan foothills. River Jhelumtraverses through the valley including the city of Srinagar, the summercapital of the State. The region has an average annual rainfall of664 mms.
Jammu: The Jaromu region lies to the south of the Himalayanbelt with the Punjab plains in its south extending into it at an averageelevation of 365 metres above MSL. The average annual rainfall in theregion is 1148 mms.
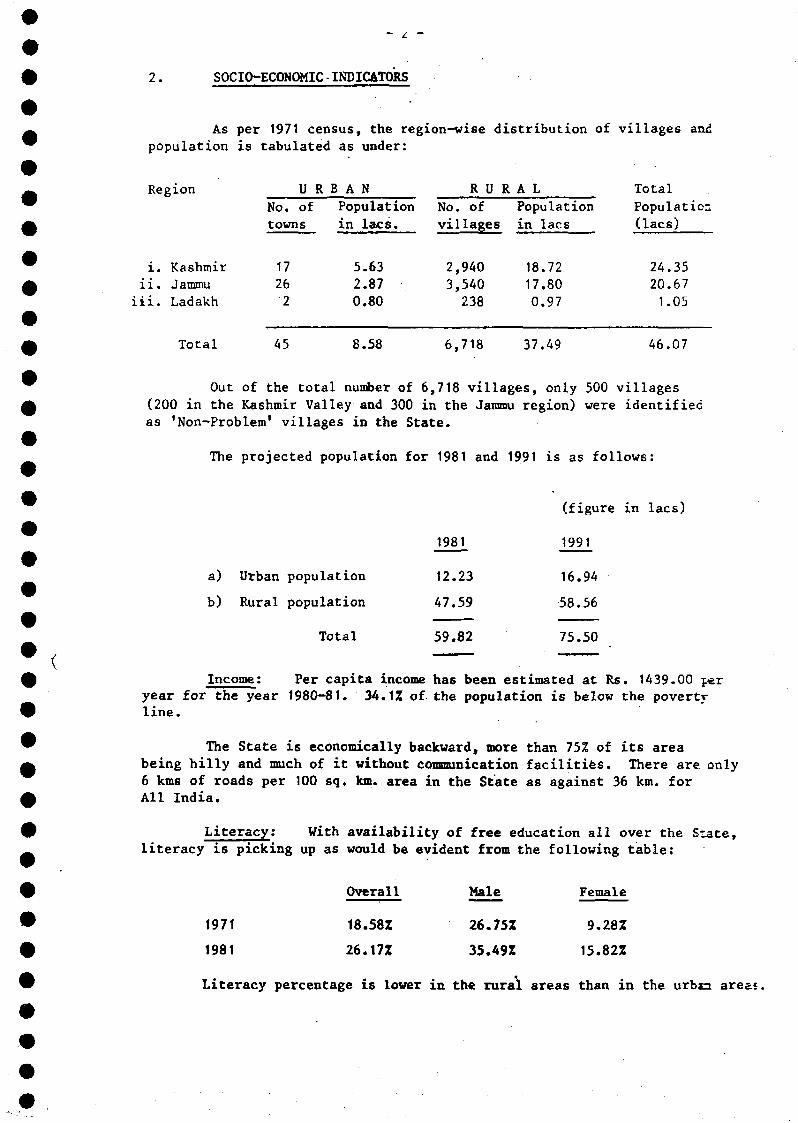
2. SOCIO-ECONOMIC-INDICATORS
As per 1971 census, the region-wise distribution of villages andpopulation is tabulated as under:
Region
i. Kashmirii. Jammu
iii. Ladakh
U RNo. oftowns
17262
B A NPopulation
in lacs.
5.632.870.80
R U RNo. ofvillages
2,9403,540238
A LPopulation
in lacs
18.7217.800.97
TotalPopulation
(lacs)
24.3520.671.05
Total 45 8.58 6,718 37.49 46.07
Out of the total number of 6,718 villages, only 500 villages(200 in the Kashmir Valley and 300 in the Jammu region) were identifiedas 'Non-Problem' villages in the State.
The projected population for 1981 and 1991 is as follows:
a)
b)
Urban
Rural
population
population
1981
12.23
47.59
(figure
1991
16.94
58.56
in lacs)
Total 59.82 75.50
Income : Per capita income has been estimated at Rs. 1439.00 peryear for the year 1980-81. 34.1Z of the population is below the povertyline.
The State is economically backward, more than 75% of its areabeing hilly and much of it without communication facilities. There are only6 kms of roads per 100 sq. km. area in the State as against 36 km. forAll India.
Literacy: With availability of free education all over the State,literacy is picking up as would be evident from the following table:
Overall Male Female
1971 18.58Z 26.75Z 9.28Z
1981 26.17Z 35.49Z 15.82Z
Literacy percentage is lower in the rural areas than in the urbm areas.
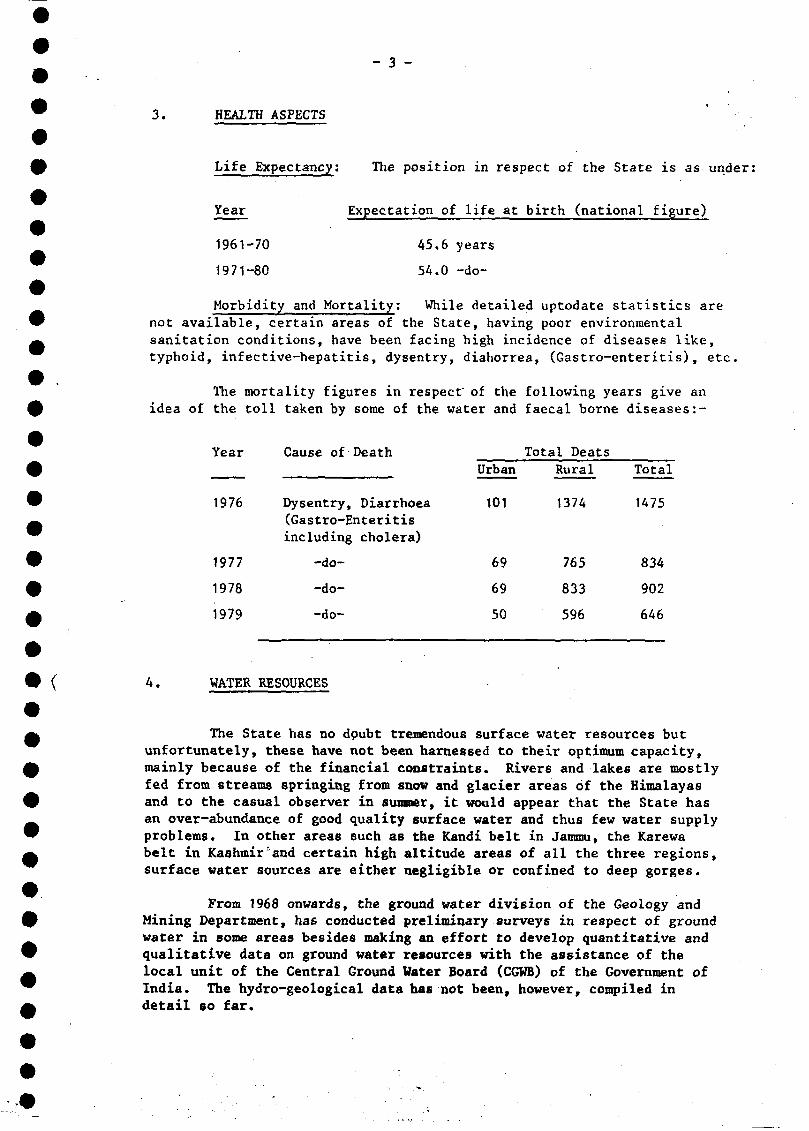
- 3 -
3. HEALTH ASPECTS
Life Expectancy: The position in respect of the State is as under:
Year Expectation of life at birth (national figure)
1961-70 45.6 years
1971-80 5A.0 -do-
Morbidity and Mortality: While detailed uptodate statistics arenot available, certain areas of the State, having poor environmentalsanitation conditions, have been facing high incidence of diseases like,typhoid, infective-hepatitis, dysentry, diahorrea, (Gastro-enteritis), etc.
The mortality figures in respect of the following years give anidea of the toll taken by some of the water and faecal borne diseases:-
Year
1976
1977
1978
1979
WATER
Cause of Death
Dysentry, Diarrhoea(Gastro-Enteritisincluding cholera)
-do-
-do-
-do-
RESOURCES
Urban
101
69
69
50
Total DeatsRural
1374
765
833
596
Total
1475
834
902
646
4.
The State has no dpubt tremendous surface water resources butunfortunately, these have not been harnessed to their optimum capacity,mainly because of the financial constraints. Rivers and lakes are mostlyfed from streams springing from snow and glacier areas of the Himalayasand to the casual observer in summer, it would appear that the State hasan over-abundance of good quality surface water and thus few water supplyproblems. In other areas such as the Kandi belt in Jammu, the Karewabelt in Kashmir "and certain high altitude areas of all the three regions,surface water sources are either negligible or confined to deep gorges.
From 1968 onwards, the ground water division of the Geology andMining Department, has conducted preliminary surveys in respect of groundwater in some areas besides making an effort to develop quantitative andqualitative data on ground water resources with the assistance of thelocal unit of the Central Ground Water Board (CGWB) of the Government ofIndia. The hydro-geological data has not been, however, compiled indetail so far.
SI.No.
1.
2.
3.
Region
Kashmir
Jammu
Ladakh
- 4 -
Our past experience has shown that ground water available in theJammu region is of good quality as the same is obtained from boulderacquifer. In contrast, the hydro-geological formations in most parts ofthe Kashmir valley comprise of peaty and marshy matter which, in turn,impart taste and odour problems to ground water besides its associationwith high degree of methane gas and iron content.
As on 1.4.1981, the region-wise break-up of the tubewellsconstructed in the State is as under:
Total No. of productive/exploratory wells drilled
61
175
2
Total: 238
5. PRESENT STATUS OF WATER SUPPLY AND SEWERAGE
The position of coverage as on 1.4.1981 is summarised as under:
Urban Water Supply
While water supply facilities have been extended to all the 45towns many of our urban communities hardly get satisfactory and adequatedrinking water supply which varies from 40 litres to 100 litres per capitaper day. Even in the city of Srinagar, there are a number of shortagezones where the water is being presently supplied through tankers. Largeincrease in urban population has imposed a serious strain on the existingsystems, which accordingly need constant and extensive upgrading,improvement, augmentation and extension during the Decade period. As on31.3.1981, 1,223,000 urban population benefitted from safe water supply,65% of which were served by house connections.
Rural Water Supply
i) In terms of number of villages 1903 out of 6,718covered ending 3/81 or 28.32%
ii) In terms of population benefitted 36.4% or 1,733,000ending 3/81
(Many of our existing rural water supply systems are also inneed of upgrading/improvements/augmentation).
The per capita supply ranges from 40 to 70 litres per day. 95Zof the rural areae are served through public stand posts while hardly SZpopulation have house connections.
- 5 -
Urban Sanitation
There is no centralised sewerage system in any city including thetwo capital class I cities of Srinagar and Jananu. Sewage of all typesfinds direct access into the surface drains and low lying areas, thuspolluting our water bodies and posing a serious health hazard to thecommunity.
There are, however, some house-holds especially in the newlydeveloped urban areas which have sanitary latrines connected to septictanks with or without soakage pits. Such households hardly constitute 8Zof our urban population.
Rural Sanitation
Nothing has been done in this regard in the State so far.
6. SECTOR ORGANISATION
The Secretary, Public Works Department of the State Governmentis incharge of engineering departments including Public Health Engineeringin which there are two Chief Engineers, one for Jammu Province and anotherfor Kashmir and Ladakh. They are responsible for project formulation,construction, operation and maintenance as also revenue recovery in the UrbanWater Supply and Rural Water Supply & Sanitation sectors. The sub-sectorof Urban Sanitation is looked after by the Urban Environmental EngineeringDepartment created in 1979, which will give due priority and emphasis tosewerage schemes for the cities of Srinagar and Jammu.
7. DECADE PLAN A TARGETS
The sub-sectorwise target population, to be served during theDecade, is given hereunder:
Sub-Sector Target populationby 31.3.1985(Phase I)
Target Population byending 31.3.1991
(i) Urban Water 100Supply
(ii) Rural Water Supply 1 131
(iii)Urban Sanitation 100
(iv) Rural Sanitation 100
(Figures in thousands)
471
4 123
1 257
1 464
- 6 -
8. DECADE PROGRAMffi FUNDING
The estimated investments, based on 1980 price index for the targettedcoverage with proposed service levels and stated unit costs, are summed upas under:-
Rs. in crores
Water Supply SanitationUrban Rural Sub-Total Urban Rural Sub-Total Zzt&l
Decade Plan 64.66 167.97 232.63Requirements(1981-90)
Allocationfor SixthDevelopmentPlan(1980-85)
29.90 43.40 73.30
84.99 7.32 92.31
8.00 1.60 9.60
324.9^
82.90
Out of this, an amount of Rs. 17.80 crores has already been speziduring the first year (1980-81) of the Sixth Five Year Plan leaving Rs. 65.1Ccrores ( Rs. 82.90 crores minus Rs. 17,80 crores) for the remaining fouryears of the Plan which coincide with Phase I of the Decade Programme.
Apart from this Rs. 33.75 crores have been promised by theof India under their Accelerated Rural Water Supply Programme (ARWSP)during the plan period, of which Rs. 3.13 crores stand expended during.theyear 1980-81.
The possible sources for bridging the gap in resources would bc:~
Say Rs. 32.00 daresi) By enhancement of 6th Plan allocations
adequately say at least by 40%
ii) Earmarking substantial allocationsduring the 7th Five Year Plan (say 100%increase over the 6th Plan figures)
iii) Supplementing grant6 under theAccelerated Rural Water SupplyProgramme.
Say Rs.166.00 ciares
Say Rs. 31.22 crsres.
The State Government would also sponsor schemes for bilateraland multilateral assistance to augment available resources.
- 7 -
9. SUPPORT PROGRAMMES
Apart from the financial constraints that may be expected inimplementing the Decade Programme, the following constraints arevisualised:-
Manpower Development and Training
There is an imperative need to build up a cadre of trained personnelin the field of Public Health Engineering right from the grass root leveland a separate cadre for Public Health Engineers.
Operation and Maintenance
Since all the water supply systems are being operated andmaintained by the Government, regular training for the operational staffwill be arranged for effective maintenance.
Management and Administration
In order to have a unified control on the sector services, thereis need for setting up a "Water Supply and Sewerage Board". This would alsofacilitate obtaining and tunneling of financial assistance from internaland external funding agencies.
A draft bill for the purpose is presently under the considerationof the State Government.
Materials and Equipment
While there is not much problem towards procurement of materials atpresent, regular supplies of key materials like cement and steel and criticalstores will have to be ensured as the Decade Progresses.
Monitoring
For effective implementation of the Decade Programme, two statelevel committees are proposed to be set up: (i) An Apex Committee headedby Chief Minister or Minister of Works and Housing and (ii) An ActionCommittee under the chairmanship of the Commis sioner-cim-Secretary ofPublic Works Department.
The following further supportive projects have been identifiée:
i) Tariff studies for water and waste water
ii) Provision for laboratory services
iii) Quality control measures including water testing andmonitoring facilities
iv) Health Education Inputs
v) Establishment of effective Information systems.
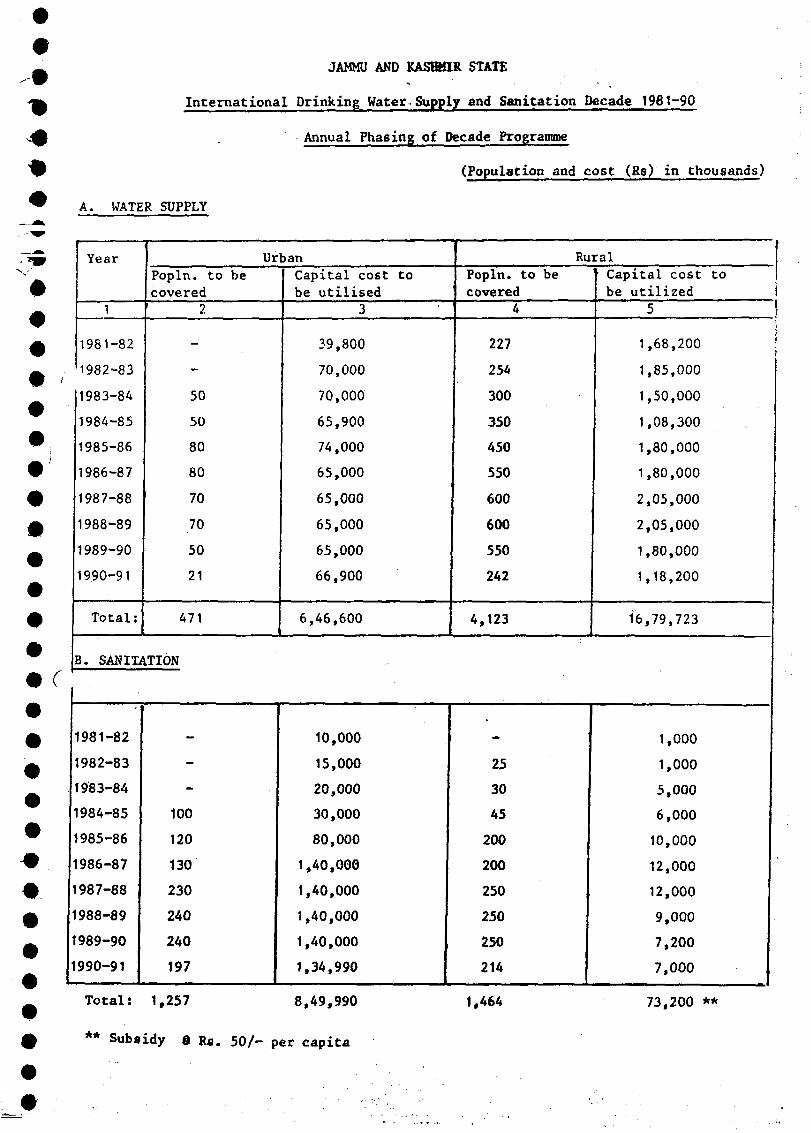
JAMMU AND KASHMIR STATE
International Drinking Water Supply and Sanitation Decade 1981-90
Annual Phasing of Decade Programme
(Population and cost (Rs) in thousands)
A. WATER SUPPLY
Total: 1,257
** Subsidy S R8. 50/
8,49,990 1,464 73,200 **
Year
1
1981-82
1982-83
1983-84
1984-85
1985-86
1986-87
1987-88
1988-89
1989-90
1990-91
Total:
Popln. to becovered
2
-
50
50
80
80
70
70
50
21
471
B. SANITATION
1981-82
1982-83
1983-84
1984-85
1985-86
1986-87
1987-88
1988-89
1989-90
1990-91
-
-
100
120
130
230
240
240
197
UrbanCapital cost tobe utilised
3
39,800
70,000
70,000
65,900
74,000
65,000
65,000
65,000
65,000
66,900
6,46,600
10,000
15,000
20,000
30,000
80,000
1,40,000
1,40,000
1,40,000
1,40,000
1,34,990
Fopln. to becovered
4
227
254
300
350
450
550
600
600
550
242
4,123
25
30
45
200
200
250
250
250
214
RuralCapital cost tobe utilized
5 *
1,68,200
1,85,000
1,50,000
1,08,300
1,80,000
1,80,000
2,05,000
2,05,000
1,80,000
1,18,200
16,79,723
1,000
1,000
5,000
6,000
10,000
12,000
12,000
9,000
7,200
7,000
- per capita
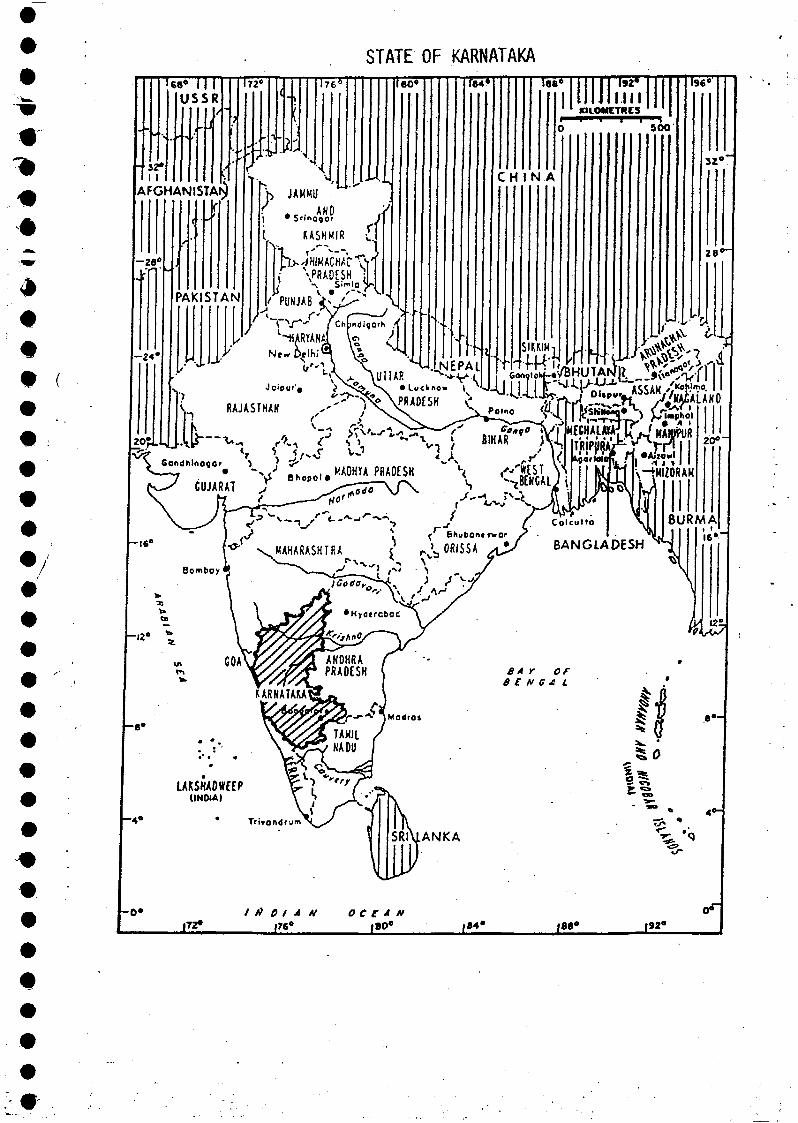
STATE OF KARNATAKA
ê#
7
« M » I I IUSSR
32°I I
AFGHANISTAN
-26
-24»
172"
PAKISTAN
b JAMMU< . c . AND , / ,
\ KASHMIR i.
\PRAOESH iM
i PUNJAB
ISO»
/<-.-
lee» 192'HIM
KILOMCTRES
C H I N A
500
II961
32»-
ZB*
ho*|T2»
INDIAN OCEAN
• M- iee« 192-
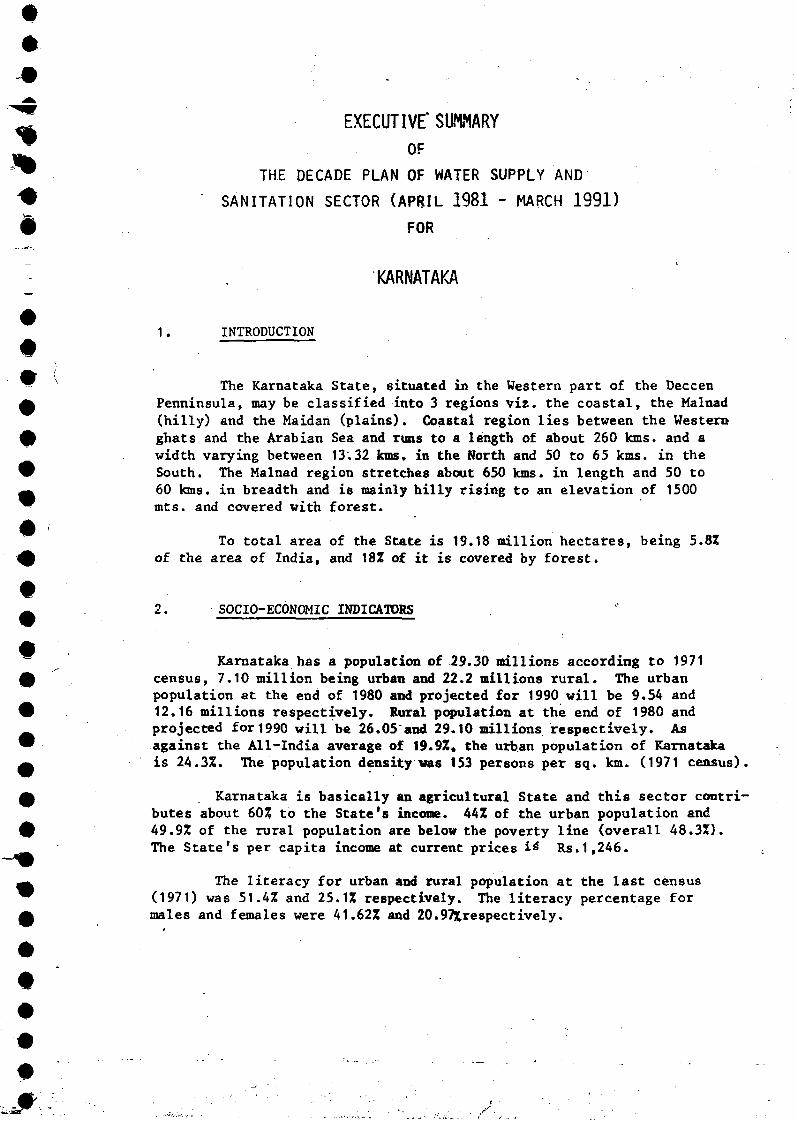
EXECUTIVE" SUMMARYOF
THE DECADE PLAN OF WATER SUPPLY ANDSANITATION SECTOR (APRIL 1981 - MARCH 1991)
FOR
KARNATAKA
1. INTRODUCTION
W ' The Karnataka State, situated in the Western part of the DeccenA Penninsula, may be classified into 3 regions viz. the coastal, the Malnad
(hilly) and the Maidan (plains). Coastal region lies between the Western0 ghats and the Arabian Sea and runs to a length of about 260 kms. and a
width varying between 13.32 kms. in the North and 50 to 65 kms. in the# South. The Malnad region stretches about 650 kms. in length and 50 to— 60 kms. in breadth and i s mainly h i l l y r i s ing to an e leva t ion of 1500™ mts. and covered with f o r e s t .
To t o t a l area of the State is 19.18 mil l ion h e c t a r e s , being 5.8Z4 of the area of India, and 18% of i t i s covered by f o r e s t .
^ , 2 . SOCIO-ECONOMIC INDICATORS
^ Karnataka has a population of 29.30 mil l ions according to 1971£ ' census, 7.10 mi l l ion being urban and 22.2 mil l ions r u r a l . The urban
population a t the end of 1980 and projected for 1990 wi l l be 9.54 and# 12.16 mi l l ions respec t ive ly . Rural population a t the end of 1980 and
projected for 1990 w i l l be 26.05 and 29.10 mil l ions r e s p e c t i v e l y . AsW agains t the Al l - India average of 19.9%, the urban populat ion of Karnataka^ i s 24.3%. The population density vas 153 persons per sq. km. (1971 census).
A Karnataka i s bas ica l ly an agr icul tura l State and t h i s sec tor c o n t r i -butes about 60% to the S t a t e ' s income. 44% of the urban populat ion and
0 49.9% of the rura l population are below the poverty l i ne (overa l l 48 .3 Ï ) .The S t a t e ' s per capi ta income at current pr ices is" Rs. 1,246.
— The l i t e r a c y for urban and rural population a t the l a s t census^ (1971) was 51.4% and 25.1% respectively. The l i t e r a c y percentage for^ males and females were 41.62% and 20.97Xrespectively.