Embed Size (px)
Citation preview
AD-762 718
FATIGUE LIFE PREDICTION FOR AIRCRAFTSTRUCTURES AND MATERIALS
Advisory Group for Aerospace Research andDevelopmentParis, France
May 1973
DISTRIBUTED BY:
Natonal Technical Information ServiceU. S. DEPARTMENT OF COMMERCE5285 Port Royal Road, Springfield Va. 22151
I I[ VIAGARD-LS-62
4A
cc
AGARD LECTURE SERIES No. 62
on
Fatigue Life Predictionfor Aircraft Structures and
Materials
DI!TRIBlJTION AND AVAILABILITYON S1ACX COVER
AGARD-LS-62
NORTH ATLANTIC TREATY ORGANIZATION
ADVISORY GROUP FOR AEROSPACE RESEARCH AND DEVELOPMENT
(ORGANISATION DU TRAITE DE L'ATLANTIQUE NORD)
AGARD Lecture Series No.62
FATIGUE LIFE PREDICTION FOR AIRCRAFT STRUCTURES
AND MATERIALS
The material in this book has been assembled to support a Lecture Seri'.s under(fie sponsorship of the Stroicttures and Materials P'anel and the Consultant
and Exchange Program of AGARD.
THE MISSION OF AGARD
[he mission of AGARD is to bring together the leading pcrsonalitie• of the NATO natio'is in the fields ofscience and technology relating to aerospoce for the following purposes:
-- Exchanging of szientific and technical information;
t j - Continuously stimulating advances in the aerospace sciences relevant to strengthening the common defenceposture;
m- Iproving the co-.opcration among member na,jons in aerospace research and development;
- Providing scientific anti technical advice and assistance to the North Atlantic Military Committee in thefield of aerospace research and development;
- Rendering scientifi, .nd technical assistance, as requested, to other NATO bodies and to meraoer nationsin conection with research and development problems in the aerospace field;
- Providing assistance to member nations for th" purpose of increasing their scientific and technical potential;
- Recommending effective ways for the member nations to use their research and development capabilitiesfor the common benefit of the NATO community.
The highest authority within AGARD is the National Delegates Board consisting of officially appointed seniorrepresentatives from each member nation. The mission of AGARD is carried out through the Par.els which arecomposed of experts appointed by the National Delegates, the Consultant and Exchange Program a1od the AerospaceApplications Studies Program. The results of AGARD work are reported to the member nations and the NATOAudtorities tLrough the AGARD series of publicatons of which this is one.
Participation in AGAPD activities is by invitation only and is normally limited to citizens of the NATO nations.
"The material in this publication has been reproducedPr directly trom copy supplied by AGARD or the author.
'Ptb!;shed May 1973
629.73.02:539.43
'Printed by Technical Editing and Reproduction Lidilarford llouse, 7-9 Charlotte St, London. WII D 1i1).
PREFACE
Considerable progress ha,; been made in the last few years in the possibilities of predictingU the fatigue :fe of aircraft structures. It may suffice here to mention the use of complex flight-
by-flight seqtzences in full scale fatigue tests and the use of fracture mechanics for materialsselection, crack propagation and residual static strength calculations as well as the steadilygrowing ,mnount of service load data.
If all these new methods and data are brought together one can be reasonably sure thatS~the unexpected and costly service failures which Occur in older aircraft will nct come about.
The Lecture Series will mainly concentrate on overviews of the complex problem ofI fatigue life prediction, and individual methods which Jl.w for predicting fatigue life. It willbe of special interest to engineers-from aircraft and othr- industries interested in structuresand materials problems and to government representatives who are concerned with thedesign, stress analysis and airworthiness aspects of fatigue. The Lecture Series will also beof interest to laboratory scientists woiking in applied rese,:.ch.
The participants should have a basic knowhldge of fatigue problems in order to benefitfully from the presentation of the latest Qtate-of-the-art by internationally known experts inthis field.
g i
g[
?44
a _
" t~ll
LIST OF SPEAKER~$
Lecture Series IDirecqor Dr Ing.W,Schj(itzinutiznaei[Jtibgslshf8012 Ottobrunp, bej MifnchenEinsteinstrasscGerwany
Mr WV.E.A'yjrsonB~attelle Pacific Northwest LpboratoriesStructure and MechanicsIBatteile BoulevardRichland. Washington~ 99352USA
Dr lvg.O.13uxb.,mmLaboratoriuin for ;ýefriebsfestigkeit61 D)armstadtliartningstrasse 47Germany
Mr W.J.Crichlow4. Evginec.:in-n Adviso~r
4946B Kirtgsgate CourtLhayfu'i, (Thio 45431USA
Mr .A. 13 !..ambrtAssisiant Cb~fr Stressman(General Fa-ijue)llawker-SidI ,'ey Aviation Ltdllaffield. &-I'England
Profe~cr .S;.,h2jiveNatioi-.al ke-rospaicc LaboratorySloter,,eg 1,;Amster&-n, 17Netheria;0ii
Acrospa~t. T.zkn~efr, FflkAir Force rii"Id-t DYnamics Liboartoxy (AFSC)Wriglit-Pat tersuni Air rc-ý N~s!Ohio 454331LISA
S..CONTENTS
PREFACE ii'
SPEAKERS *,'
Refesence
I ASPECTS OF AERONAUTICAL FATIGUEby J.Schijve
METHODS OF STRESS-MEASUREMENT ANALMS!S FOR FATIGUE LIFEi EVA LUATION
by 'o.Buxbau 2
THE USE OF COUNTING ACCELEROMETER DATA IN FATIGUE LIFE PREDICTIONS-OR AIRCRAFT FLYING IN COMPLEX ROLES
IJ !.A.U.Lamb.rt 3
TIlE USE OF FRACTURE MECHANICS PRINCIPLES IN THE DESIGN AND ANALYSISOF DAMAGE TOLERANT AM.RCRAFT STRUCTURES
by H.A.Wood 4
I OCRROSION FATIGUE - OR - HOW TO REPLACE THE FIJLL-SC4 LE FATIGUE TESTkby W.E.Andergon 5
ON F/JIGUE ANALYSIS A1D TFSTING IOR TME DESIGN OF THE AIRFRAMEby W.J.Crichlow 6
I • A RATIONAL ANALYT!C THEORY OF FATIGUE - REVISITEDby W.E.Anderson 7
S I A SUMMARY OF CRACK GROWTH PREDICTION TECHNIQUESby H.A.Wood 8
THE R.Ae.S. - ESDU CUlIULATIVE DAMAGE HYPOTHESISby J.A.B.Lambert 9
FATIGUE LIFE PREDICTION - SOMMEWHAT OPTIMIS.fIC V101 OF T'h? PROWLEMtby W.SchOu t0
AI
j
gI
i-5
kI
S!I-1
A4PECTS OF LARONPATICAL FATIGUE
J. Schijve
r ~Nationzo Aeroapafce Labor-atory NLP
SSloterweg 145, Asterdam (17), The letherlands
S~SMARY
SThG vaiuation of the fýtigue quality of an air.raft
involves scveral steps, such as (1) detý.rminaaion of theS~fatigue ioad cnv:ronmenrt, (2) respon~e of the air ;rt;".'
4tructura, ,31 Itiernai load distributions and (4) estima-Sti0on of' ';)he €. propertie•. The fatigue propertiesA
o . ..a.gue poet~.. a 6
cormpzee fatigue life, crack propagation and residual
strungth. The latter two items together with inspect i,.)
prooedurc-s vare qu:.lIfying the fail-safety. The above
aspects art discussed in the paper with reference to the
contributione of design efforts, calculations. testing,i inspections and fatigue load monitoring.
Fatigue of aircr.at stru-tures is a serious problem for several reasons. At -he bej;.nnirg rf this
introductor; paper it appears useful to list the more imVortant ones:
% a In the past and up t.Il recent yeara catastrophic fatigue failures in several aircrait and hellcol ters
did occur.
b Several aircraft now in service have met with the n.cessity of costly moiiflcat--ons or ropairs r to
the occur'enco of fatigjue cracks. Fatal accidents could be prevented because fatigue cracku vere detected
before they became critical.
c Several Lircr•ft nowadays are u.ilized up to vury long servici lives, much longer than in the past.
t'-neue.itly the rs&k c ftigue cracks in service is inorea.,,ng.
d Deopitc *he fail-safety of an aircraft structure the occurrence of cracks, including bo-called nuisance
oracks, is undesirable economically.
e Piomrsis.la new Materia'l (titanium alloys, high strength steel) in manky eases exhibit a high "cracksensl4 .iv~tyf.
_1 Operators prefer long inspection periods.
Thesn argusento ill istrate that the fatigue p•roblem is rpa-t of the delicate balance between safety and
economics. in the present paper it will ba shown that many completely different aspects are involved in
fatigue of op. aircraft struct•ure. As a aonsequence an unbalanced approach to solving the problem may easily
be made.F The ra~er startc with a survs• of thu v,.wious- topics that will contribute to the fatigue quality of an
aircraft, Secondly the problem areas are discussed in more detail and some recommendations are made.
Finally it will be tried to evalate the present state of the art.
pet2. SVEv OF VIEi AIRn iraT FATIGUE PROBiEe
"• ~~For l.-e Mluetr4',0,)n )r zho large va,-":•y ol aspects involved in aircraft, fatigue it •a useful to
•i~~~r diviu. the history of a certain aircraft type into phases; -: :'•• -
- planning, layout and design
- bufldi.ng and testing the first aircraftI- - experience of a fleet of aircraft in rervice
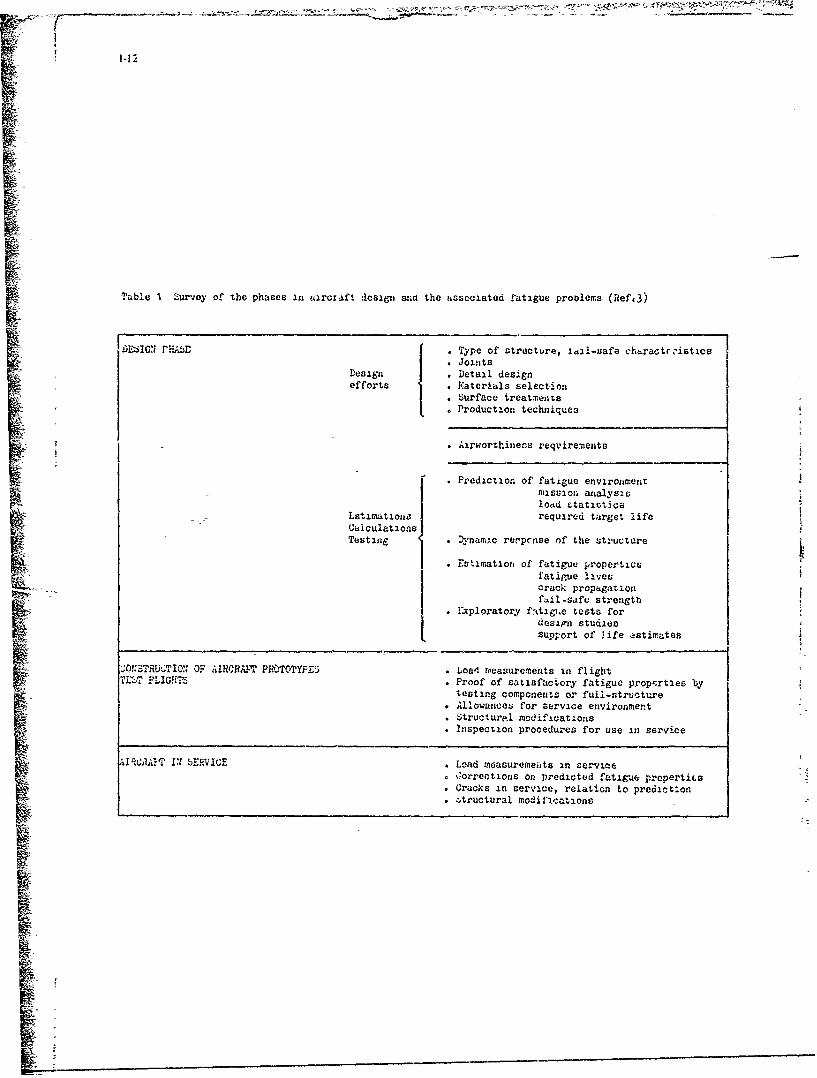
Thsee three major phases can again be subdivided int' a number of smaller phases, as Indicated in tablc. 1
(RWO.1), whi 1L clearly illustrates the great variety of aspects :.nvolved. It cannot be the purpose o37 th~oo paper t; deal exhaustively with all the topics mentioned in the table. However, it wil) be attempted to
deal with the major problems involved "n estimatiag the fatigue quality of a new design.The fiz-t steps in the approach to a aes design will involve the gp6c-f-cation of the required performvicep
ai;d the rission of the new aircraft. One might expect that fatigue considerations are -not so important atI this stage. :evertheleea, it will be clear that the required seriice life is already an item of majorconcern for fatigue life estimates to be made later on. As an example the larger civil t;,qnsport aircraftare now designed for a 20-years service life (Ref.2), whereas some 20 years ago a 10-years period appeared
to be sufficient. For budgetary reasons military aircraft also exhibit a tendency to require a longerservxce hfeý In both cases we simply have to make a better fatigue resistant etru-ture i. we do not want
to run into &Ifficul-ies.
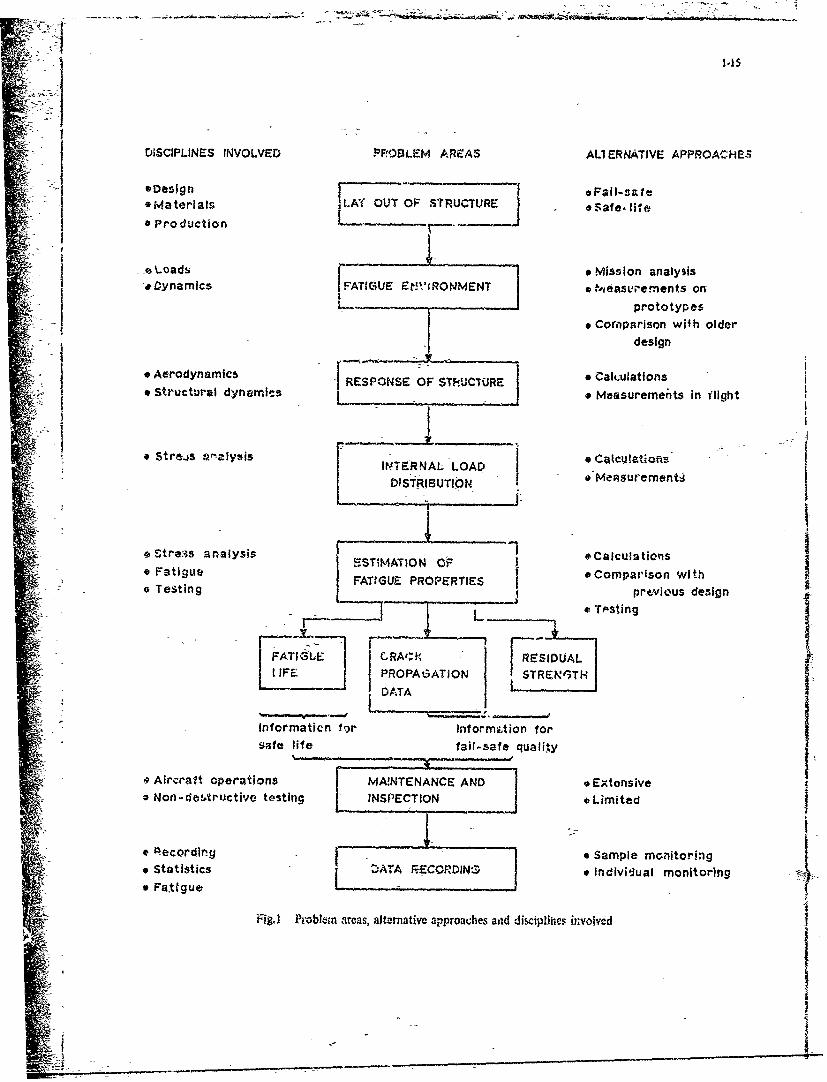
The aspe'.ts hsted in table I are shown in a different way in figure 1. ior each probl!m more than onesolu~l-on mey be adopted and .ome alternative approdehes are indicated in the right part of figure 1. Inohe left part tne various uisciplir.es involved in tre.ttaeg the problems are mentioied and this illustratesthat aercnautical fatigue to ats full extent 2s of a truly interdisciplinary nature.
-- I A--:roblem of major cooncern is the quantitative dccuracy of flhi fat-igue properties. -it is -well Known that
very precice predict;,ons of these propert i es are beyond the present state of knoaiedge. For that rear.onone of the steps in fi•gre 1 is lauelled as the estimation of .atigue properties rather than the determina-ttion of these propcrties. Sin:ce the significance of such estimaces is affc.:ted by the accuracies of allpreceding steps as well as the subsequent steps (maintenance and data recording) they all will contribute-t. the accuracy and the reliability of the estimations made. An unbalances approach would be to acquirevery accurate information cn the fatigue behaviour of the structure, but having inaccurate data about the
load environme,.t and the d.wic response. Another unbalancea p;-!',re arises when highly detailed work onenvironment. response of structure and fatigue estimates is combined with uncontrolled maintenance ania
iispection .ma the absence of data r4 -rding.The stepr ' 1 .. ll no" be discussed tn more detaii.
Aspects listed iG table I are:
- type of structure, latl-esafa chazaotcristics
- joints
-deta.! de.zign-matera&ls selection
z- •r.face treatr.entL
-prg.'"tion tv,..hniquesAll these aspects have :ome bearing on the fatig--, life !ntil -i'ackt occur and on the subsequenft crackpropagation and recidual, strength (fail-safe quality). 'naeiats will be made on a fei topics only.
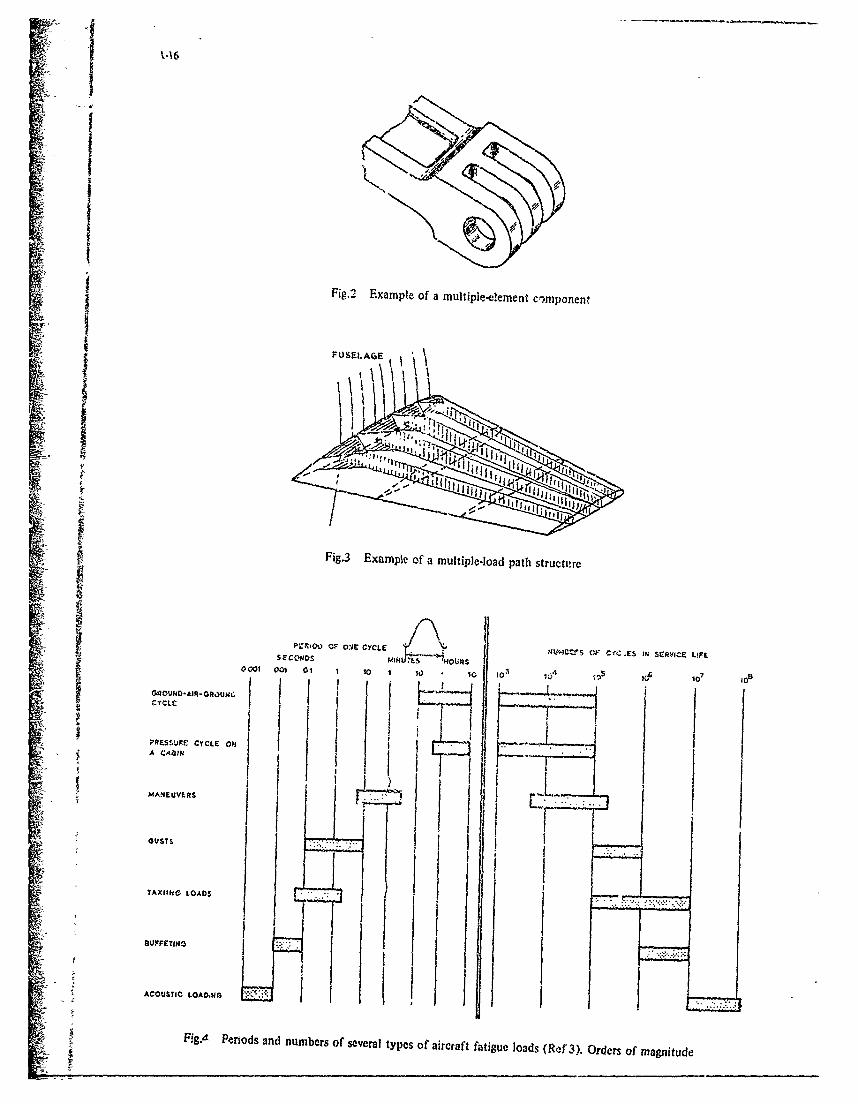
An important problem is how to acbhive good fail-safe prop.drties -nd how to avoid structural designfeatcres that =V in-pair these properties- Sometimes there as some mi'surnderLtanding when zomparing multiple
load path structures and multiple element compo,.entM. The xilea of tno ri•tiple-clement component is thatfailu-e of -. te elezren; will leave enough strength for the ot).er elements until the forthcoming inspection.Until that time tho remaining elements have to ot -ry a larger load. Instead of' a eingle lug-fork ,oint amultiple fork joirt may be used. A lug has a poor fatigue reitatien ana one may hope that failure of a
single lul in figure 2 will reduce thG strength until 2/3 c! itr. o-iginal value. However, a few conemntshave to be mace now. If one of the lugs cOtaans a cr&ck, *tS stiffness will be redu!!ca and the other lugswill carry mo•e load. It is likely that cracks in the other lb'& will start before the first crack it large
* �n�vugh for w, eauj iteG.ioo. eo.dly, -i• a craW is growing an the W.ddle Ldg the dettectability will terather poor. In other words in thin oncs inspection is an inherent acpect of the fail-safe quality.
1-3
A similar cx3mple is the back-to-back struct..re, such as splitting up an 1-beam along the web into two
s"ums. The same remarks cn mutual , f-rence can be made as before.
A multi-lhad path structure is a ,', dunJant structure. If a crack occurs in one of the componerts its
stiff.ess si.... hardly be affected znd as a consequence the load distribution in the structure will remain
the same. The load distribut2on will only be chanCed after complete failure of a component and tne other
components will then carry more load. An example is the multispar wing with a multiple connection to the
fuselage frames (Fig.3). Instead of a single spar or two spars a number of spars is used. If one spar or
its connection to the fuselage fails the other ones will maintain sufficient residual strength if they are
uncracked. This o.ertainly will apply if ,he crack is a premature fa:lure. However, if the crack is sympto-
"matic for either a marginal fatigue life or a severe fatigue load environment the other spars may also be
cracked and a high residual strength may be illusory. This should be kept in mind when planning inspection
proýedurub.
Anotner example is a stiffened akin wbich can be made by integrally machining (single element) or by
bonding or riveting separate stringers to the skin. This topic as wel' as the application of straps to stop
crack growth in fuselages has been the subject of many papers in the literature (Refs 2, 4 and 5) and will
not be discussed any further here. it may be emphasized. ho-wever, that inspectability is an inherent part
of the problem.
The selection of materials may be a difficult question, since many different requirements have to be
satis'ied, fatigue being just one of them. Unfortunately the stronger Al-alloyc, Ti-alloys and steeln have
a tendency towards increased notch and crack sensitivity and A'wer fracture toughness values an, stress
j corrosion resistance. A most noteworthy compromise is the use ,: over-aged .Al-Zn ailoys (T7 condition).
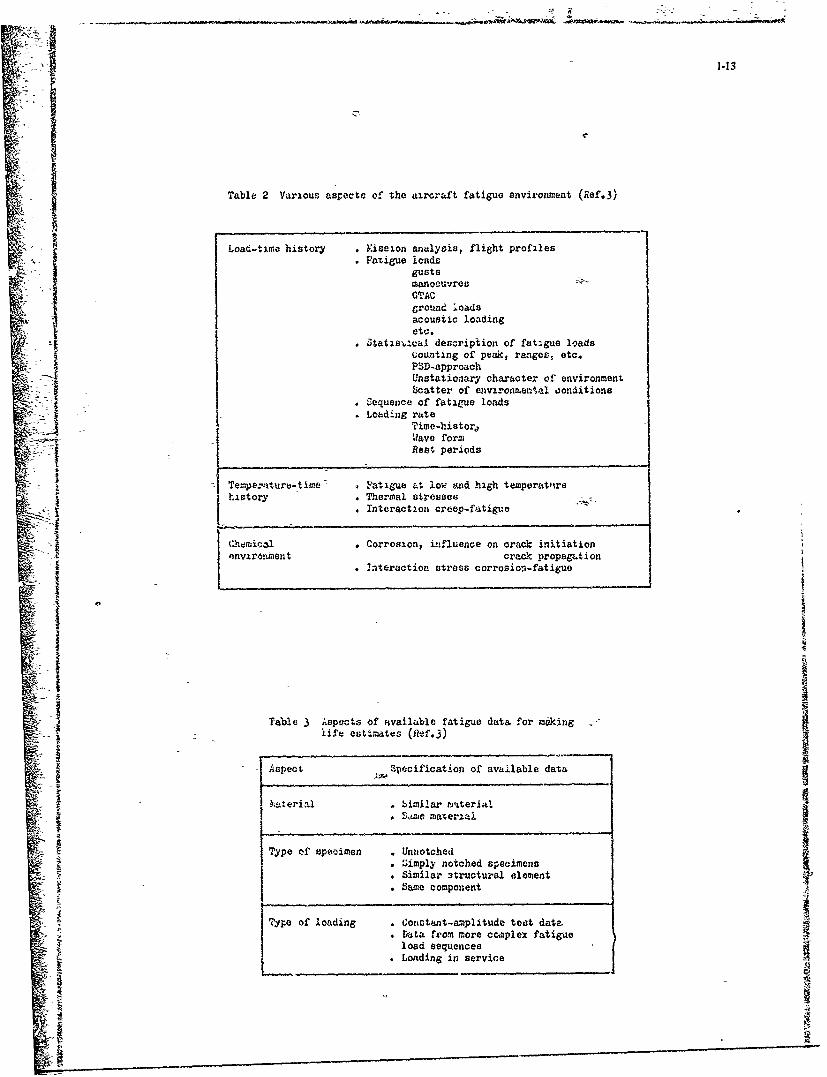
4. FATIGUE E:VIONM;ir Ai:D )J:A1JV•iEPO.;E
The description of the fatigue environment is a complex problem, not only because it involves a good
ceal of guessing but also in view of the large variety of aspects. This is illustrated by table 2. The
typeL of fatigue load.; that may be encountered by an aircraft inay largely differ in nature. Moreover, the
envi- .,ment wrill be h:ghly dependent on the type o.^ aircraft ano the way in which it is ured. An illustra-
j tion of the variety of fatigue loads Is given in figure 4. This figure shows orders of magnitude for the
duratiou of a single cycle and the numbers of -ycles that nay occur in an aircraft life time. The figure
also suggests that loading rate effects should be considered.
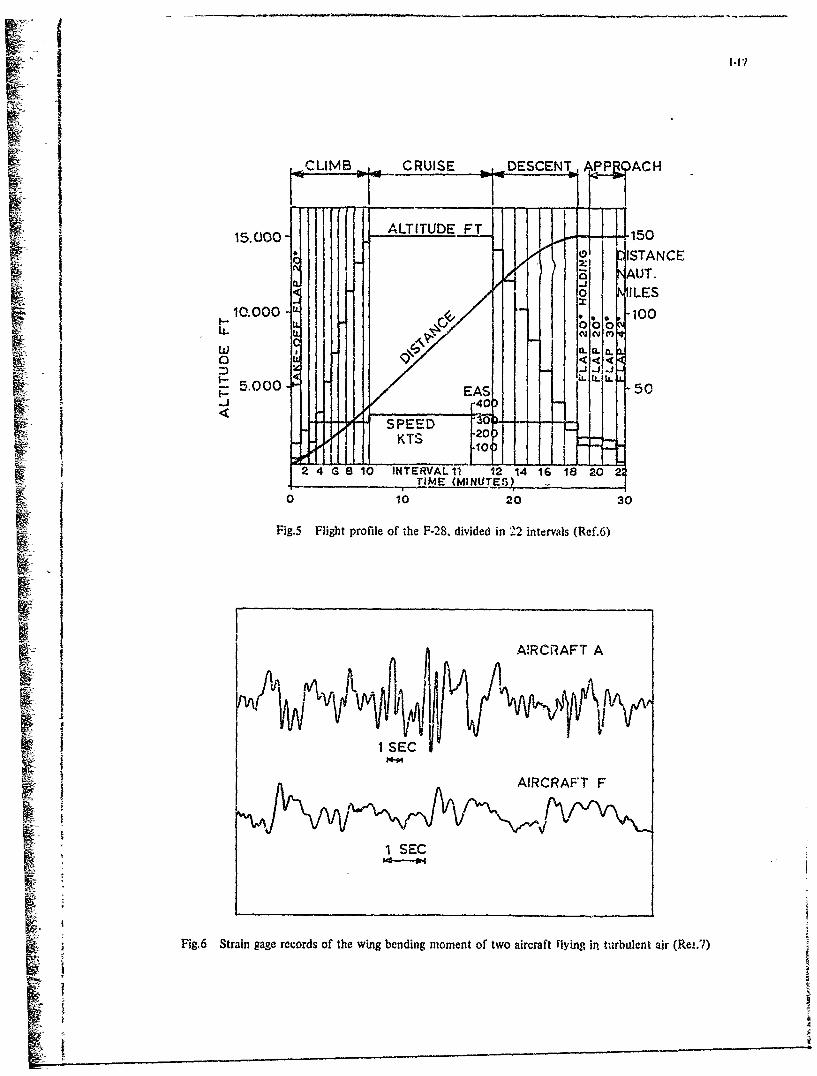
In order to evaluate the load-time history of an aircraft structure a mission analysis has to be made. A
flight profile should be establ.shod giving information on fl3ing altitude, speed and loading condition.
Ar. example has bee!, given i.n fiCure 5, From this type of ýnformation we may calculate the loads cor'-es1.on-
ding to the ground-air-ground cy'cle. ThO next step 2t , insert the necessary nanoeuvres 4n the flight. It
-may be thought that the loads induced by th2 manocuvres can also be calculated. We then have to consider4 {the types of loading that have a real statistical nature such as gusts and taxa:ng loads.
In the technical literature, the description of the gust environment has become •!nist a problem of its own.
There are two approaches to it. The claaslca! one iu to consider gust loads is ia•olatvd occurrencees
Statistical data of gust loads based on this concept have been collected all over the world by employing
& counting accelercmeters. The accelerations have to be translated -nto gust velocitieu for which the
characteristics o: *he specific type of aircraft have to be used. This approach is not a very sound one
physically, becaase it is known -hat gusts, or better, air turbulence, constitute a continuono phenomenon.
This is illustratodby strain gauge records of the win.g bending moment of two differe,ýt types of aircraft
(Oig.6). Aircraft type A hud a large flexible w:ng and the first wing bending mode is easily recognized,
which is less clear for aircraft type F.
The modern approach is that air turbulence can be deucribed am a stochastic prccess which,under the assump-
tion that it is a Gaussian process, can be fully described by a power spectral density function. Thil '.nc-
tion is dependent on the rliing altitude and the type of weather and many data of this nature are :,ow
available. The power spectral density approach allows us to include the dynamic response of he Atructure
into the calculation of the loads in the structure in a more rtionil way thnn with the claseic-method.
The overshoot - a wino loaded 1, gnuatn cai thus be more rationally accounted for. This promisirg approach
is still under development.
For taxiing loads as a fatigue load for the usideroarriage, the problem is difficult because ther% are three
more or less independent loading directions; moroover, the response of the undercarriage is generai,, .,on-
linear. Under such conditions it may be that lead measurements on a prototype providc the only reali~tic
solution for obtaining relevant information on the fatigue loadings. This may also apply to various
manoeuvres for which the aerodynamic calculations or thi wndttnne! measurements ave not sufficiently
accurate.
In summary, it asy be said that the description of the fatigue environment for a new aircraft design is a
fairly comprehcnsive .nd certainly not an easy task. It requires that predictions on the aircraft use be
made and that available information from other aircraft be translated and interpreted for the new design.
The response of the aiWcraft including aeroelastic effects is an inherent complexity of the latter problem.
5. INTEWNAL LOAD DISTRIBUTIONS
Apparently the calculation of the load distribution in an aircraft structure is more or less a Patter
of routine in the stress office. Nevertheless, it may be pointed )ut that computer techniques (fin~te-
element analysis) have added a new dimension to potential refinements of the structure. That means that
more extensive calculations can be made in order to optimize the structure. On the other hand, locnl stress
Sdjitibu%,aons can oe predicta wi-h greater accuraey. This is of utmost importan'e for indicating .a-igue
prone areas in a structure and critical locations in joints. In order to have a full and well balanced
advantage of the potentialities an intimate consultation between the fatigue department ard the st.-eesK; dei..rtm.at is most desirable.
The usefulness of calculations for the estimation of the residual strength of a cracked struoture was
already shown (Refs 4, 8 and 9), but further developments may be expected. A future goal cay be to determine
with sufficient accuracy the residual strength by detailed calculations. 74:v aount of testing r( .ired
may thus be minimized.
=. TIMATEIC FATIGUE PWOPERTIZ AS A DMIGN PROBLFM
6.1 Fat:pue livesI In the desi0i pnase of a. aircraft it is certainly Lseful to make estImates of the anticipate,, fatigue
lifc in order to be sure that a satisfactory life will be obtainable. At a later stage such est:ma~es can
be beckon up by additional tests to Improve the quality of the estimates.
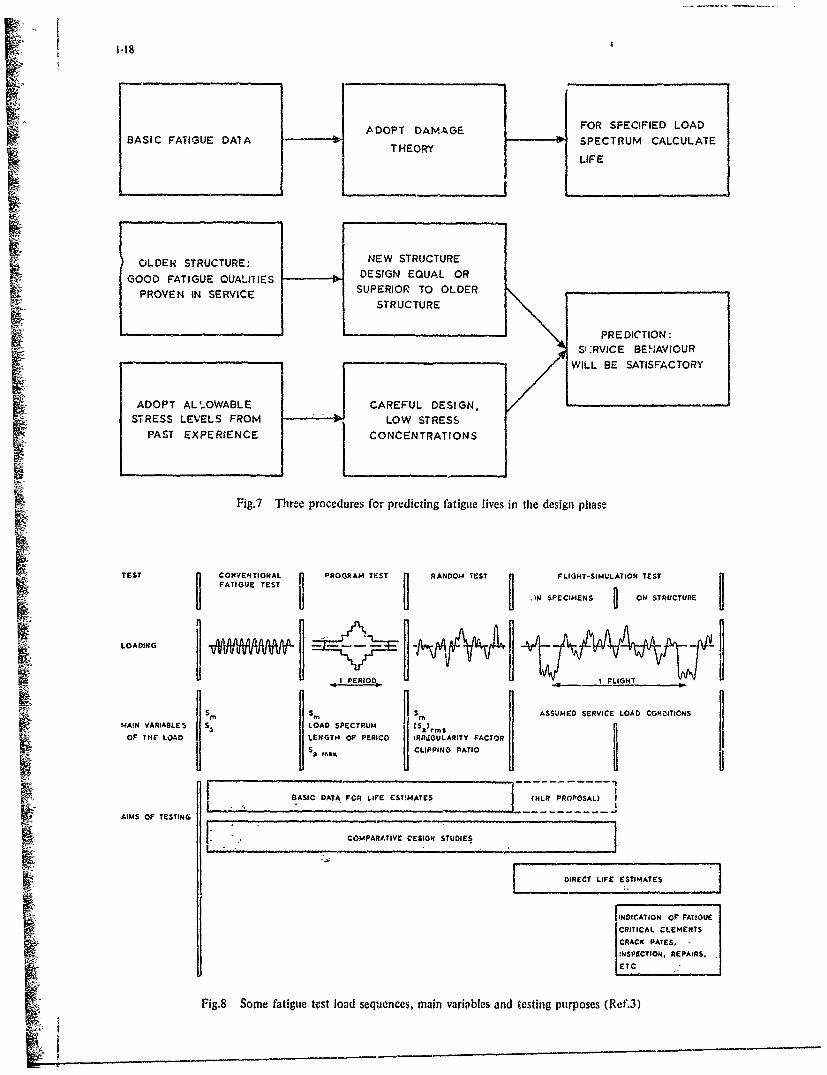
Some procedures for predicting fatigue lives are outlined in figure 7. Some co~iments on the three ýethods
of this f.gure will now be made.
.Method I
Three steps have been indicated in figure 7 and for each step a question can be formulated.
1. What are basic fatigue data?
2. Which damage theory should be adopted?
3. In which form should the ;pectrun of fatigue loads be specified ii order to be incluaea in the fatigue
life calculations?
- Basic fatigue data
Various aspects of basic fatigue data are listed in table 3. For obvious reasons the relevance of the data
is improved if they arc applicable to the same material, the saiae type oz component and flight-simulation
loading.
With respect to the type of specimen it uhould be noted that mort fatigue cracks in se iice are starting
at rivet hoics or bolt holes. In both cases fretting corrosion will contribute to the nucleation of the
crack. Under ouch conditions data of ttnotehod or simply notched specimens cannot be considere4 as being
salistic. There should be 3. least some similarity between the specimen and the new component. If suchdata are not available some testing is mandatory.
In this respect it is noteworthy that methods developed to predict the fatigue :strength of a lug
(Heywiood, Ref.1C, later improved by Larsson, iRef.11) ors- entirely based onl existing d.kta for lugs.
7Z Despite the lug joint being the most simple joint the approach starting from unnotched material data was
not feasible.
Considering now the type of loading, we meet a seco:.v difficult issue. Ionstant-amplitude testiiug is highly
dissimilar to thu loading in service. However, such data are easily employed for life calculations. kore-
over, it is the most simple te.3t and older fatigue machin~es cannot apply any other lhype of loading. An.
improvement was the introduction of the prograsut~e test by Cassner, see figure 8 for ~i surveý of loadi Cg
types, and many data were collectec in. his laboratory. such data canl be employed for life calculatioi.3
(HIef.12>- A similar approach was suge~sted by Kirkby (Pef.13) for random load testa.
The possibilities for cariyinp out fAtigue tests were drastically thqe y the r.'rotluctiona ol the
closed-loop aliectrohy:Lra~ulic :;ýaterr to fati~ue maichiineu. Flight-simut.±_tion loaji'.g cal. rnow be performec
on comm~ercial availible fatig~ue maghines. '-or that reacof. lhf- preben~t authLor (.,ef.14)1 has aavocated to
perform fl,1ght-simulatio:. iests whenever ponssblu. .~nethu .,uat'er of var~atleb of L test ,-- increaci-g
gointg from left to richt in figure 3 some recormmenliatior-c have to Le taue-. ,,c returrn to this poin:t later or..
- amag C~eories
The best know!. theory as the Palmgren.-Xiner rule, the atttractive feature being ita simplicity. The dis-
aacvajita~C, is also well' krow;,, the rule does n.ot givce accurate life predictaons. Depenaing on the load
spectrumn, ~ /;may deviate largely from , It is somewhat poor comfort to knlow that the rule in Cene~ral
wall1 be o:. tne safe aide 1f positive n.ea:. atresres apply (df1.Aiyho,;, prelimin~ary estimates can, be
made with the Paingze-Finner rule if one as fully aware of its i.ma tatlolls.
1iany altert.ative theories were proposed 71. the literAture. Al. x~tensivu survey asrecen~tly ga,.er. in,
reference 3. It turns otut that improvements of the Palmeren-I..iner rul'ý are attempts to accoant for residual
stresses at the notch root as origanating from the varxkarle loaa pattern. zasme success has been obtained,
also because the present computers allow the calcu~lation of incremenital daanae cycle *. ycle. ;.everthele:;5,
more rezeaztch as still1 thought' to be necessary before a ge:.eral purpose tool :sa obtazlied.
Followin~g the author-c oern proposal (hýef.14. a variety of fl lght-sir.ula t ion test data 2hý,uid be collectea
for several types Of 3peCi'-.e.1S ,,a various load spect.,a. This ýwouldk then allice i~fe estimates to be m.eb
interpclat.,on. The attrcctive featu~re is that questionable darage calculations are el.minated by this
procedure.
-Load spectra
In section 4 it was briefly indicated how a service load-time hi.-~y- rwi estimated. Before this can be
i.ntroduced into a damage calculation it has to be reduced to load cycles. This problem is sometimes referred
to as the load coutnting problem. -t can be illustrated by such questions an: should we count peak loads,
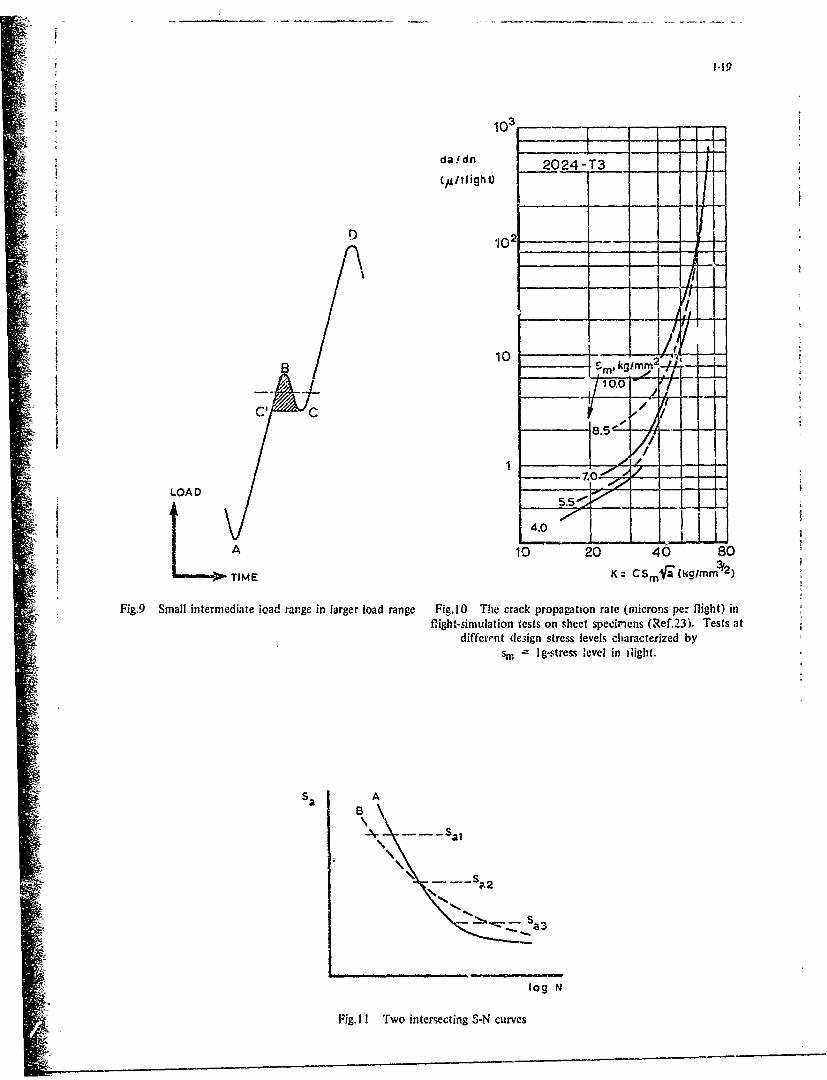
level crossings, or load ranges, or still something else. For instance in fig-are 9: Should we consider
this to be three load ranges (AB, BC, 'I'D) or is the more relevant feature the load range AD with a such
smaller interimesiate cycle (c'Bc). Various counting methods were developed (Iefs 7,16) and this matter is
still sublect of further development. The problem will not be discussed here, but it is an importin* issue,
for instance when cons'derinE the dam,.ge contributions of grou-nd-to-air cycles.
IYethods 2and 3
These MethL18s Will certainly baý utilized to some extent by firms that have a good tradition in -_ruciura
design. Starting from an older structure with a good service fatigut record one may be able to design a new
structure at least to the same standard of quality. In the third method allowable stress levels are adopted
based on pa~st experience that has shown them to be allowable from, the fatigue point of view, provided the
st.ucoture is'properly esaigned. This method is in fact not Loo different from thec second one.
The designer using the second or thanl method may have more confidence in his ettimates since, to some
extent, he also eliminates environm'ental and frequency effects.
T1he conf~dence of the two methods may be further increased by additional tecting. As a mattor of fact the
increased confidence (or in other worea the improved capability to cope with fatigue) is reflected in
slightly increasing ig-stress levels (flef.M7.
6.2 Crack propagation
I Problems of eanating crack propagation -are partl, s3milar to those involved in maKing lit• estimates.
So-e specific features will be :3naidered. Inforzation about fatigue crack growth is desirdble in view of
judging the safety of the aircraft. This informaticn is indispensable for aesessing the fail-safe quality
of the structure. Surpriesngly enough there is still a lack of requirements in official airworthiness
regulations.
The amount of available data f.om constant-aiplitude tests is steadily increasing and such data can very
well be correlated by the stress intenzity factor:
da f- (AK)
It was stimulating to see that the same function was applicable to tests with increasing K-values (panels
with end loading) and tests with decreasing K-values (panels w;th wedge force loading) (Ref.18). in both
cases, however, K-variatxoxs from cycle to cycle were very small. It wus also stimalating that rrack growth
in stiffened panels and unst)ffened panels could satisfactorily be correlated by equation (1), again under
constant-a•pitude loading (Ref.19).
If high peak loads are applied, subsequent crack growth is delayed considerably (_nteraction effects).Unfortunately this delay effect cannot be reconciled with eclaation (1), unless further refinements are
intro4 ,'iced. It was therefore stimulating once again that crack propagation unde3r random lading coula be
correla.ed, if ar-s was substituted into K (Refe 20-22)
XK- C S 5 C_ M2
"rack propagation in aluminum alloy sheet -aterials under flight-simulation loadln& was extensively studied
by the NLR (Refs I and 23). This was also done for different design stress levels, cha, cterized b.- the
Ig-stre.- level in flight. It was hope.; that
K -
could correlate the data from different terts. Unfortunately this .,xs not true as shown by figure 10.
Analysing the problem (Ref.23) it becamc :lear that similtr K-values are net a sufficient requiremant for
eoaining similar crack rates. A second requirement is that similar dK/da values should apply also. The
tw- requirements are ge.erally incompatible, but apptrently the second requirement is unimportant as long
as interactions effects are small. Unfortunately they could be shown to be large unaer fl~ght-sanulation
loading.
If interactioi effects are ignored, crack growth for vnriable-amplatude loading can be calculated by
integrating Aa values derived from equation (1) (Miner approach). dance interaction effects are predoma,.ant-
ly favourable (that means delaying crack growth) safe estimates wili gýnerally be obtained. The estamatec
may even be highly conservative. More realstic informataon requires data from flight-uimulation tests.
7. FArTCUE TESTING PROCEDURES
In the previous secticns at has been o-tlined how provastanal estinates ca. be obtained. It wasemphasiied that more realistic estimates require additional testingý Let us r-ow see which types of tests
can be performod and which testing purposes may be pursuid. A survey is given: in figure 8.
The problem of employing data for making life estimates was already discussed in ch.apter 6. The
present discussion will therefore be restraOted to the other purposes indicated in figure •.
- Comparative design atudias
YanyV People still fee! t-ht constait-amplitude tests are a good means for comparing alternative designs,different production techniques. et_. However, the possibility of internecting or of nooparallel ý-11czPrvca is making this very dubious. In figure 11 comparative teats at stress level z-aI would ineicate
deqign A to be superior to des4i. B. A*, strese level b-3 the reverse would apply, whereas at aa2 beth
1-7
designis wo'Aii be approximataly equivalent, Fretting corrosion its just one aupa-c4 wity conutet-8ah~litudo
tents m*' give mileading anfors~ation about ite effect in service (IRef.24).
The numerous test series with program loading carried out by (laezier and his cc-workers suggest the risk ofa miudg~on' ~obe Maler if program loatging were adopted for comparative testing. This will apply also
to rPaodoai loading. In view f Jiucrepancies souastimea founa ibetweer, the resuilts of program loading. and
rivdom, lohdiing (Refs 2?ý and 25) the laitter one should be prefer-red. However, if flight-simulation loading
aan be adopt-Rd i-c appears that it is the most prefurable n d1ution. Real problbms uliould be tac'zled with
*Omlistic testing methodsif porsible. Ronay (Pof.27) L~Iopttd random flight-3.mulation lo~idint; for exploring
thfi frtigue behavioucr of a higlizstreagth steel. Imig ;ý.d llug (Ref.28) adopted this test method for study.
it:g the offe , f teinper:,tu2, oas the vadurazv'e of notchzsd titanium alloy specimens. Schlitz and Liowat. (Re f.29)
studied the effect of plastic hole exýiudsiot. on *,he fat-gue life of an open hole 2024 alloy specimen by
ermploying flight-simulation lo_,d)%g. At !i ~at ptart i~f an ad-hoc problem, we c(.mpared two alterr.at~ve
types of jcints a:th random f tiuaioloa~dinig. ý.ono aircraft firms have already started comparative
te.ting for design purposes t-siy.~a Un.i of "I ight-smuln1taton Ie'aiixn..
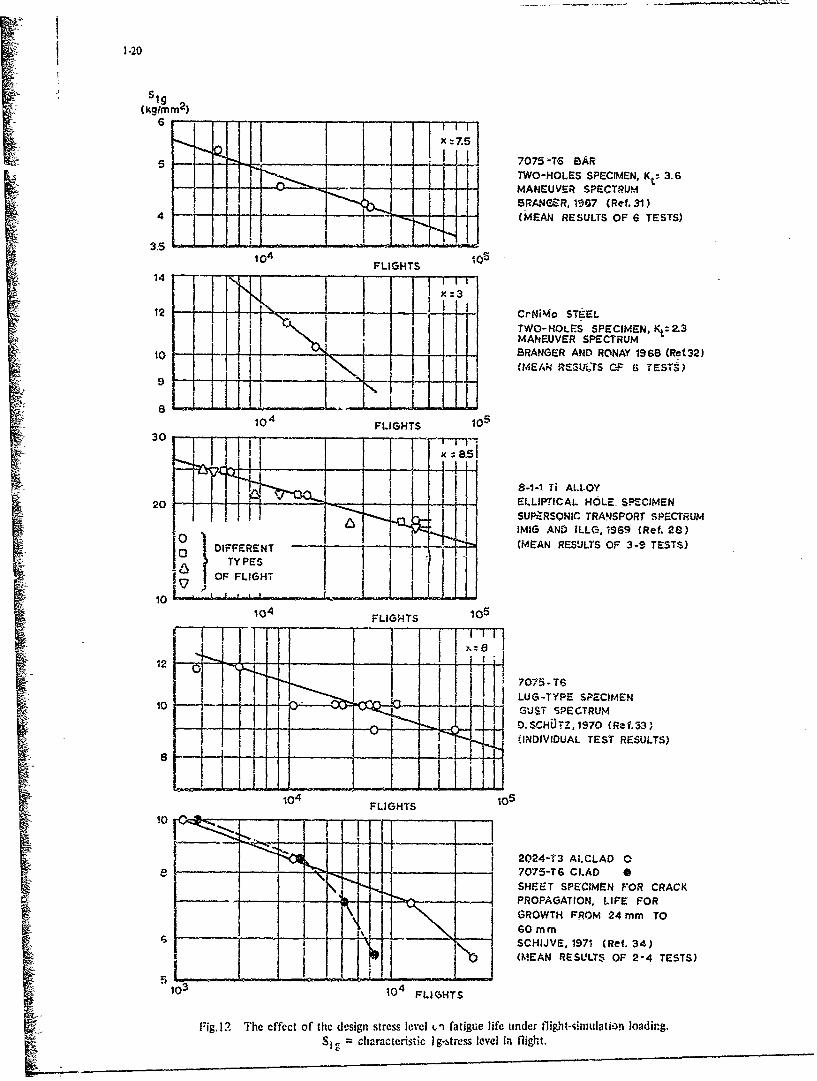
As au. illustratio-i cf diffe~'ent- tunc)ero t-2 the j~ae qvtestion, a Tccei,t i,!veertigaltion (te..23) indicattod
th:it the c'-.ck propi~gaticr in, 7075-T76 we., rrjuý timneu fnzter than ir 2024-TI3 accrzý-iang to cons-tant-
amnlitude loaditig. Hehcts~r# vscer loat-i~ai~niding thu ratioý va~ied from I to 3 (seeý the lower
gra,1b in ftb&ý.e
-Dis .,ct (rer:inatio:. of -tigue life and crack propa,-ation by flight-sim-lation tests.
Xa~king direv lifa e..imatze. impliie cha& data -dith a -ýuantitative meaniog are lookedI for, rather than
com~parative informatica.. ly. xhid Wi-ation the specimet; arc the load-time history applied should be
a7P,*zdýs rea-ILsticzall as possihile. It :u thek n wxusL'lanced solution to test a "ealist'o full-ecale
atz-a'ciure with eicplifited load aoquancee. 'the ci,,osite unb-idaitced colutioý us to tobt a- simplified test
irtivK-e 'u~imi- -. :a zs~ srvicu loadingf putt-rv. Both uolutzo-:- shoeu a it. avoided.
if only part of a fall-3cale zl-rvctu.:e ist;red "or xnxttnnce -. lcrge componetat, extremae care should be
takers t'hat t::c loadi tranamizm&)on to the structure tn rep-esen,1ti.ve for thit* tituotio:. in the full structure.
With respect Vo the fat-ý!u4 load ar exact zii-auataon of tile load-timc histo-y in servxz- Wculd be the
rroforabiv volption. it. c-.se that it v&Ln be meaau:'cd tefiror the fatigue teet, it is the b&tst starting
potint ars aao~atcd ýig Branger 1u.0.,L gý.veral uch a tecord w~ii :iot be available and a load-time
his-)ry his to tv zesanutz on t!1% t,4i~ss -1' am-s.,Yr rLna1,,SiL )n ad etatiistics obtatned with other aircraft.
Zishour.t -oh possibi, to C0.1pose ri!1res1,:at4_zvc loae-t-me histories fromi available dat. , As W1
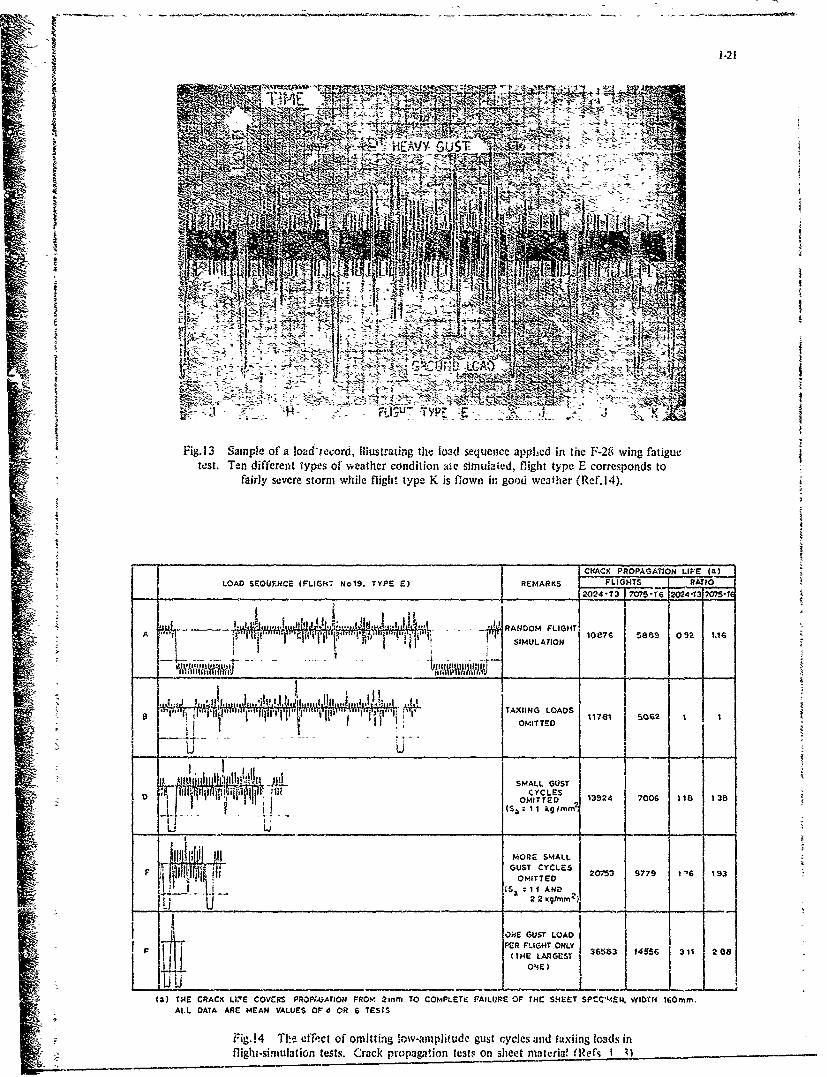
xllusti'ation, firure 13 ishows ::seple Of a loall rocori' from the test on. the 1-23 wnui. Duf.'erent types tf
we~tfter Comdit.10on w :re simulated in iccardance with- st-4t.8tical -informatiorn. -,be sequence of the G-ust
okas In each flieýi: wau rwndorm.
z ~~It will be clear bat thicr- aie neveral var'abieca ch?-arcierisiag the flig~ht-sirmilatiop test. The mor
a Tha nseonco of che loads; ~ithi:, karý flight.. nv r.~lrnidoe svquesncer aref posa~ible.
b i'sasnauca streas at~litude, ~am a'till to be applied. Awnxig, tkM- ntmerous cycles iits, a low
~i~.ar ~~awl ae V~kch tf$ % 1.1 time,
Th ~ tte~.ml~d .1 mean' utill to b,1 ailo ad in the test. 11be inffrequently otcuri-ing
M# bt aii. arplitudu maý? he~ve i. zredom~nar~t affect on the fatigue life.
tk Th iazznilu:! CI' the KPound.-tn-dir e(qolo ?.)C of the GTA!J ztnd the applea t on oi taxii. loads
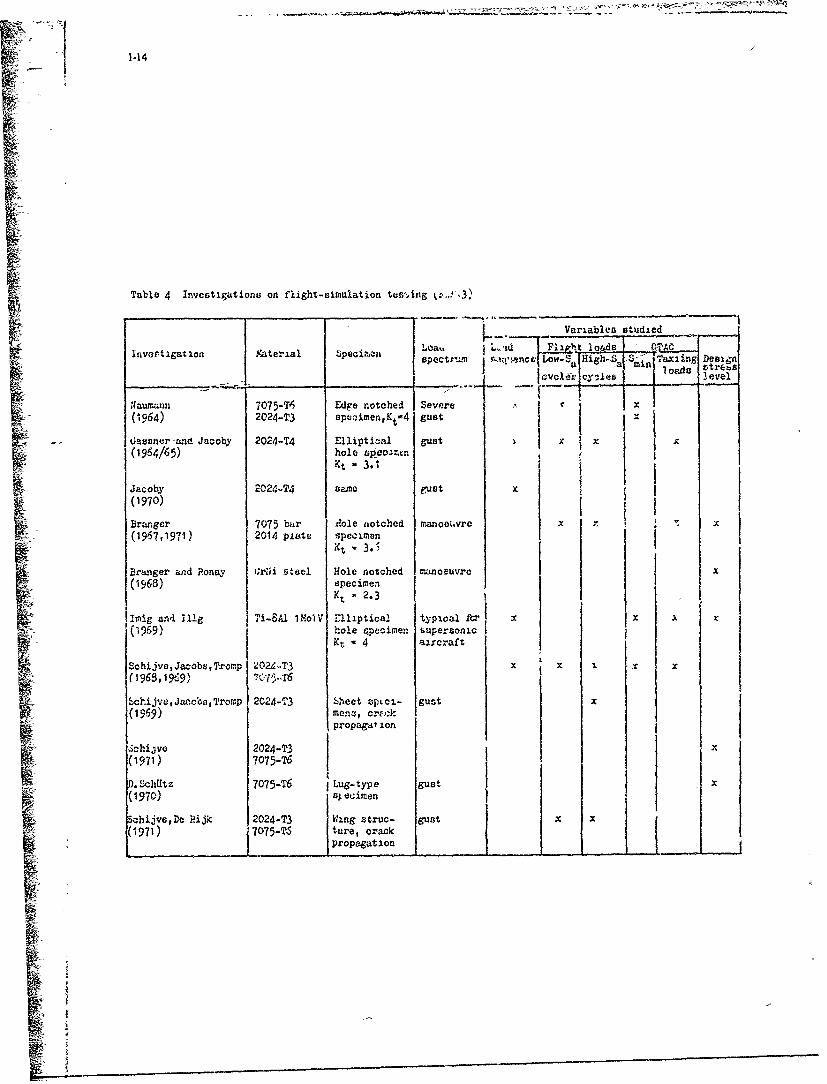
In~ r.±~ .rvco(v Cfý la-vet*gatie:.a wtu given. Tablo givue vai im$resslon of the ettent of availubtEe
dal~a: WhI414 the r.ir-1,ltr .4"l he Uu"aar;.zted below.
Th.~'~Lnf ;h se,4ucene withta a flicht uppecared to be i.iaot-. loma-ritious were usd0 betweer. different
tpaof W'bdo* n~p~uasd ace
Tile ori 4lwrof' l-aq-14itudc cyole h-ad a szaall erffoa t- in ome iaovs, bt~t the effect war largcr it)
other i~e;, oeely uri-ap orsek pzopac~ation. An il lnntratior. of the liiiter rionult ii; shown in
flgura Mc VMA, fig,,re aiisa shown thiat omitt.;ng ;110 taxllng liioSo dfid not affect *,hc t-rack proj agtxtion, but0111 Conclunicil u lid enil' if the nerorn.omýcmon.'i-qprezssive u-iteG
'the -ffect. of Ibigh-cspir.Itude loiaea is a delicaite heacse irsu aorbe
4res~idual ;)tressvr. one thus iaicrease the life. in: orcer ci'iý-1.efct we May 'o-t
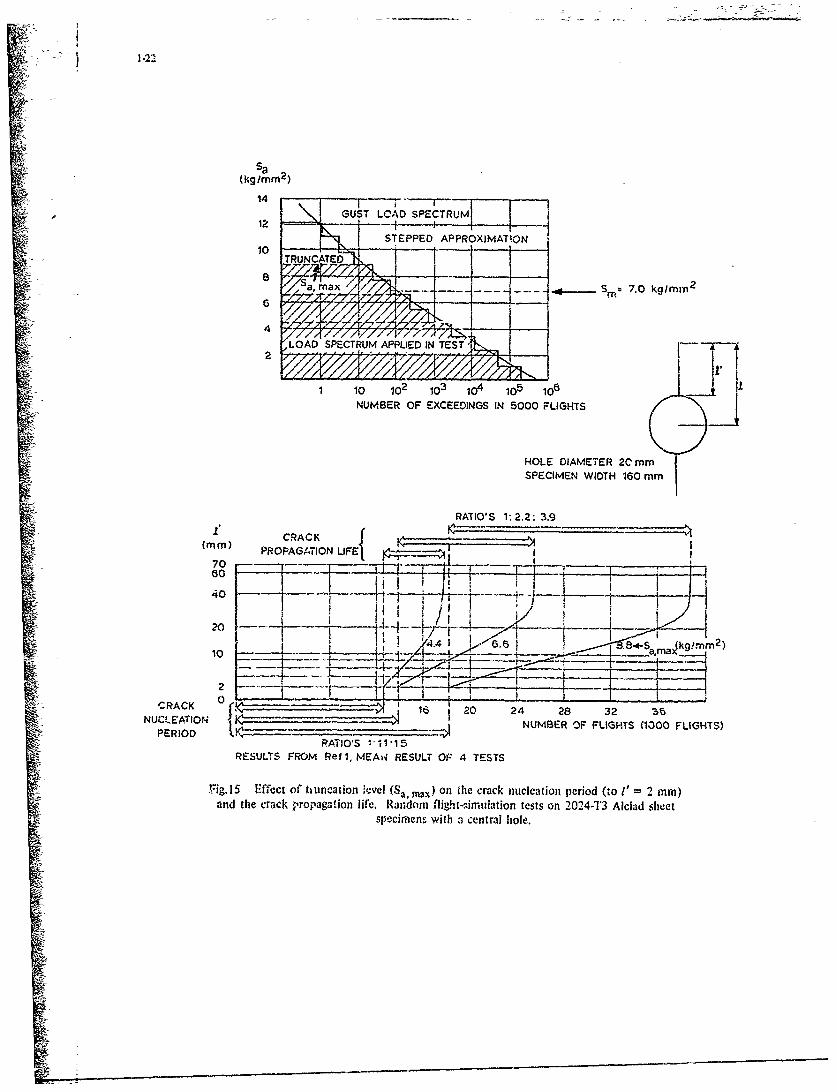
hi~-ml~d ~lsto a connon lav~ii, tbe ua~nlevel SU Th f-ct0 di soa ferant
*levels is lllutatrated nf figure 15. The "igztre Phows thgt both the pe-orack life wid the crack% propagation
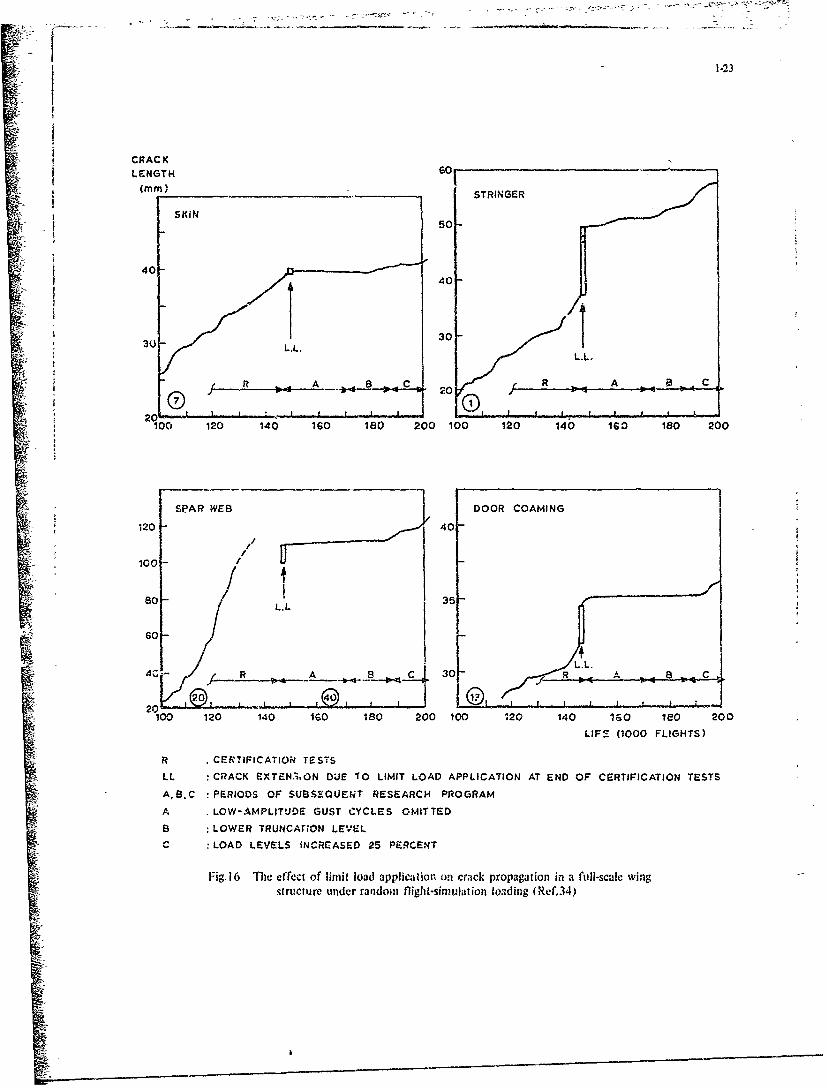
life increase if cycles with hiGhur womplituoes are apptlee. Zl'Amilmr results wore obtaxned for 7075-T6. Amost dramatic effect of a high load on snbsequcnt crack grovth 7.s sho.:n in Ifigvure 16. A hLmit load ci a
wing structure almost c'ysplotely stoppod !Ell c-ubs-e-Z-eat crack :Z'Owth'.
Wdith respect to th'e truncation l.evel i:r a flight-oimui.Ltion toot con a fukl-acale Ctruc-cure i. was recommiended
(Ref,35) to truncate the lead spectrum ut the l.evel that :u equa~lecl or exceedea 10 times in the anticipated
service life, Although hixghoýr loads wili be met bv svto cir:r-aft of a fleet o-thers will pnt mizt and thus
benefit from *..eze higher-loads. Obh ounly' therv is come arta~esIA setting a truncation If-vel.
Ths effect of the desiri strPSs level ý'z chovan ~fligure 112. T1he aenlgtk streiss level in this figure is
characteri ~ed by the ig-stress Itiel in, firgh~t.
Apparently there 14~ a nend for st ~arcaizin. load eequýýnces for fligiht-cxmi=e-tion tout!Na bavlhig a nore
general pufjcs4,, that means for fituctying problems no~t rt-la'd to a specotficý atraraft. At thzi moment there
i.s a co-operation Ijetween tv-i Cernman lb-:ratoixie wid NL.. in o~rder to arr4,ve at sasndarcixced cec'enveo 'or
a gust dominated speotrum and a manoeuvre cominatcd epectrwa-
* -Indic&.ion of fatitue cr-,"ical elementz tazfu laaemjr~e
*in reference 3 a aurvey wir given I'oitest ceriati on ;rntani; wings, Comcanwdo war.~sf Dakota wIngs, a swept
bacx wine, F-27 center section vings and Voeom. winet. Clio general v~end emerging~ fro.4 the available evidence-.
was that tý%e picture of fatigue-critifoal e2oeontr tin an aiforalt ntructurv In sgnitic:,nily dependiag on,
tne loam-time hiatory applied. Thic e.-zhaz;I-ccs ths2 rcod for rerlietic icad-tiamg historles for 5appllcat:ýon
to f4l-ecoale te-Utizig.
At the same time this cuclus'.ot, in streecirig th- sxgnificar.',e -!f %:.e triujcaazion level. Axppicat.11M of
l-,mit load5,4ar:..g a fUll-5,:alf. 'atigue t:ýt ilzý Pffectivel~y ohexnge tho picture of' czitic~l elements. It
should thurefore be avoided, if Itlie occurrence of linit load 1r. a, ms~t rare evz n the life of the air-
craft (civil aircraft).. The% results of figure 16 show thaz a limi,-t load may well* stop and mrsk all craoko
undetected so fa~r.
Yaintenwice 4,nd ~nspect-Ion 32'e two im'notciut aspects of tho saxfety and the econcow of oporating
ai~roraft. In z. recent paper (Ref.36) Hr~ lhouser and 'Kayner have giver. some most. 11lustrztive examples
which will be briefl.- -tntioned below.
nHelicopter main riotor spindle.
This part was naide from, 4340 steel. A fatigue failure in a fillet causeo a fatal accident. investigationof the failure revealed among other, things:- crack growth hau veer :;Aow .mnz the crack was prob~biy present during the last magnetic particleinsppction 2 mc:nthc before the a~cicrnt,
-the crack nucleus rtarted it- at, arez, with very arrAll shallow pits. Noreover the RockwellC atnsinz that area was well below 23 as compared to the specified minirmum of 34 RI.;- the filiet area had :,ot been properly shat. peened.
b 4ine of u transport aircraft.
The 7075-Tl' winr a- ructurc completely failca. d~iring severe to extreme clesr..aix' tu'rb-alence. -theaccident investigation revealed;
- the failure started from 2 fatigue cr~aku at either side of an access door, crack 3tr.qths tiring3.25 " and 2.5 "respectively;
- the critical 1locat:,o..: was covereki bx X-ray inspections, since it w~as known that ar~asck i.Aghtv orig~nateie that area, Three sets of X-r~.y pictures from previous inspections indicated the two- crac.ks and theaircraft had flown with the cracks for more than onn year, The naintena~nce records did -not indicato thatthe cracks had~ been detoctea.
1-9
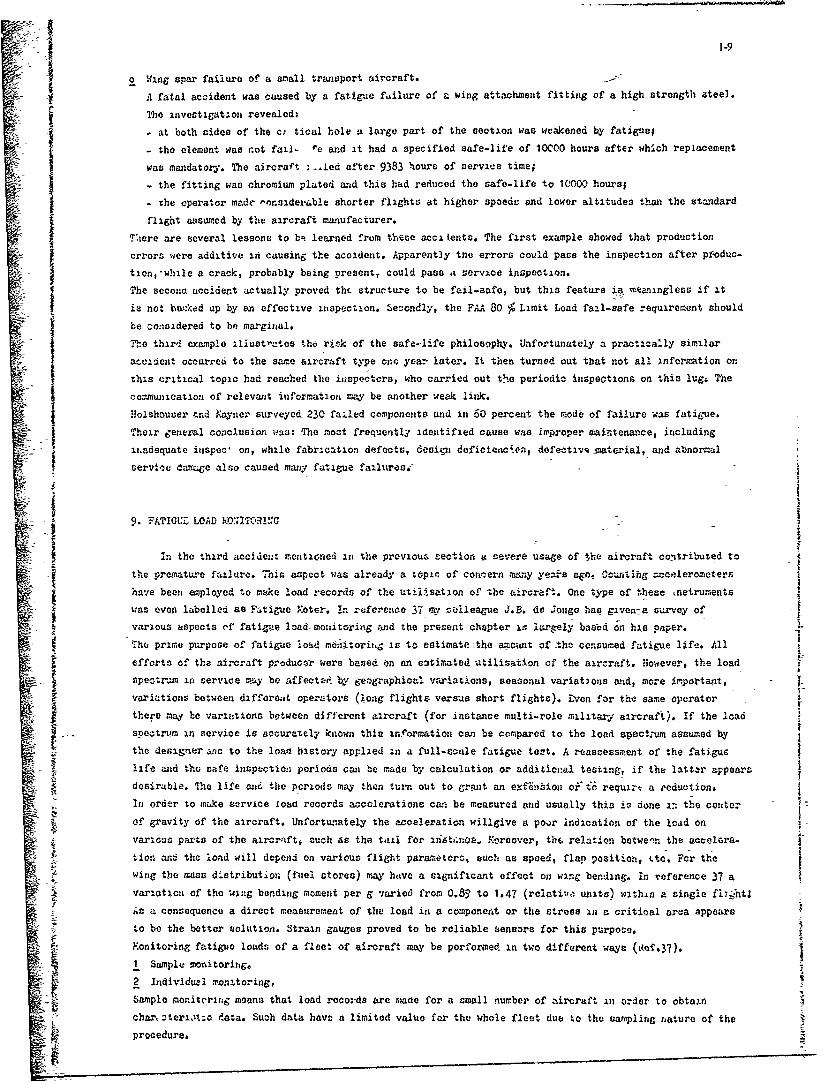
e Wing spar failure of a small transport aircraft.
It fatal accident was caused by a fatigue fasilure of v. wing attachment fitting of a high strength ateel.
The investigation revealed-
- at both sides of the c; tical hole a large part of the section wee- weakened by fatirie;
- the element was not fail- "o and it had a specified safe-life of 10000 hours after which repLacement
was nandatory. The aircraft : -ed after 9383 hours of serviee time;
-the fitting was chromium plated and this had reduced the safe-lire to 1C00 nors> 1 - the operator made "nnsidei'able shorter flights at higher spoede and lower altitudes than the standardflight assumed by the aircraft manufacturer.
Th4ere are several lessona to bp learned from tneze acca tents. The first example showed that production
errors were additive ini causing the accident. Apparently the errors covld pass the inspection after pfoduc-
tion,'whxle a crack, probably being present, could pass a service inspection.
The secona accident actually proved the structure to be fail-.safe, but this feature ismaeningless if it
is not bw.-Xed up by an effective inspection. Secondly, the FAA 80 %. Limit Load fail-safe requirement should
he considered to be marginal.S IThe third example iliuatra-tes the& risk of the safe-life philosophy. Unfortunately a practi-cally similarascadent occurred to the same aircraft type onc year later. It then turned out tbat not all- information on.
this critical topic had reached the inispectors, who carried out th~e periodic inspections on this lugz The
oorapunication of relevant information may be another weak link.
Itolshouser and linyner surveyed 230 failed componento and in 60 percent the mode of failjure *was fatigue.
"Their gener-al conc.]lusion was: The moat frequently identified cause was improper mainitenaace, including
ii.adequate irispec, on, while fabra~cation defects, design defioienc~pa, defect ivq--material, and abnormal
servic.e damge also caused many fatigue failures.--
2 9. FATICUL LOAD KINTORING
In the third accident mentioned in the previoua section a severe usage of the aircraft conitributed to
the premature failure. This aspect was already a topic of connern P.s.ny yea-re agoc ocuniting- =ccelerometers
have been employed to make load records of the util~sation of -the aircraft. One type of these Instruments
was even labelled as Fatigue Xeter. in reference 37 isv slleague j.B. de jongo has given-a survey of
various 4spects of' fatirgue load- moaitorizng ,Ind the present chtapter is- largely basod on his paper.
The prime purpose of fatigue load m6nttoritn, is toestimalte -the amountz of 'the consumed fatigue life. All
P efforts of tha aircraft producor were based- ien an estimated utilisation of the aircraft. However, the load
spectr-m in service -ay be iaffeatea4 bt geographical variations, seaaonal variations and, more ir-porta~it,
varia'tions between differo~st operators (long flights- versus short flights). L-Ven for the same operator -
there myb arieutiona between different aircraft (for iastance multi-role military aircraft), if the load;P spectrvm in service is accurately known thin information can be compared to the load spectrum assumed by
the designier 3flc to the loaci history applied :n a full-scale fatigue tont. A reassessment of the fatigue
life and tho safe inspection periods can be made by calculation or additional testing, if the lat tar appearsdesirable. The life anr. the periods many then turn out to grfuit an exteinsion orF to,' requirt a reduction.
In order to make service loaa records accelerations can be measured and usually this i* done a:: the conterof gravity of the aircraft. Unfortunately the acceleration willgive a po,)r indication of the load on
various parts of the aircr.ift, such as the tail for i ris t;ýrvE-,-Fre over, thc relation bstwecn. the accelora-
tion a=d the load will depend on various flight parameters, such as speed, flap positiort, itc. For the
wine the mass df-stribution (fuel stores) may have a significant effect on wirng berding. In reference 37 a
variation of the wing bending moment per g varied from 0.8-,' to 1.47 (rclativ'ý units) within a single fl7_ht1
Az a consequence a direct measurement of the load in a component or the stress in a critical area appears
to be the better solution. Strain gauges proved to be reliable aenszrs for this purpose.
1.onitoring fatigue loads of a fleet of aircraft may be performed in two different ways (ttef.37).
1 Sample monitoring.
2 Individuzel monitorinlg,
Sample mnonitoring means that load records are mante for a small number of zircraft in order to obtam,.
char, zteri~tt:c data. Such data have a limited value far the whole fleet due to the sampling nature of the
procedure.
-.10
Individual monitoring means that load records are made for each Individual aircraft. To make this a
fe.Aoablu sosutlon a simple mid amall device for recordinp, the load and an automatic proceusing aind evulue-
tion of the data are required. The ::L.? has developed a system for individual load monitorit*o. It in bausd
on strain Cuuge meusuremernt- and magnetic tape recording. Proceueing, ieduction ad evaluation are parts
of the syutem. An important problem is the utatiutical reduction of the loads experienced by the aircraft.
A special counting method was developed for thin purpose and preliminary results have been given in
reference 16. In addition to producing data for comparison with the predictions of the aircraft designer,
the individual load monitoring also enables a comparicon to be made between the fatigue load experiences
of aircraft of the same fleet, but having different miasions.
V). DISCUBL;I0:
In the present paper the various aspects involved in a-curing the fatigue quality mf fir. aircraft
structure have been surveyed. Uncertainties are attached to all thefie aspects and this makes accurate
predictions rather difficult. The queution may to rained where the designer should put his major efrorts.
This car, best be a,;!.sared in a negative uense: r.on cf these aspects can be ignored. It in up to the
designer to arrive , t well balanced coillttoru.
-,oae aspects were emphasized in this pc.per:
1 realistic tenting methods
2 load measurements in service
• reliable inspection procedures.
.ealiotic testi!'L' includes both realistic tenst articlet and realistic load secn•ences. The latter implies
flight-.imulation loading.
Lead measurements in nervice are the nnce-sary link to all 6;ie p,eceding efforts of the designer. It should
preferably be done by Ltrain gauge measurements rather than acceleration measurements.
Obviously reliable inspection proccdaros are mandatory. It chould be recognized, howe;ver, that the human
foctor, communication and information may be weak links of vital im, portance.
1. "chiGve, J. 'tuwulative damage problems in aircraft structures and materials. The Aero. J.,V0l.74, p.517, 199.'.
2. l•ardratht H.F. Ad,,nnced approaches to fatigue evaluation. Proc. 6th CAF ýSymposium, lKiumi Beach
Da'/idson, J.R.(eds.) XaY 1-971. . r-309, 1972.
3.- Zchiave, J. The accumulation of fatiLr:' damage in aircraft materials and stiuctures.AGAitDograph :,o. 157, 1972.
4. Damage tolerance In aircraft structures. Am. Soc. Test. Mats., ASTI4 STP 486, 1071.5. Orichlow, .. J. Utable crack propglation - Fail-safe design criteriA - Analytical method. and
test procedures. 1.IA/s Paper ;o. 69-215, 1969.4. 'Ian Beok, E.J. Fatigue testing of the F-28 Fellowship.
7. 1SmhiJve, J. The analysnii of random-load-timo histories with relation to fatigue tests andli±e calculations. Fatigue of Aircraft Structures. I/F Zymp., Paris 1961,ed., by W. Pflrrois and E.L. Ripley, Pergamon 1963, p.115.
3. Vllieger, it. Residual ctrongth of cracked stiffened panels. 14LR TP! 71004, 1971.'. dang, D.Y. An investigation on fatigue crack propagation and fail-safe design of stiffened
large aluminum alloy panels with various crack stoppers. Proc. iOth ASkE/AIAA
btructuros, Sitructural Dynamics and Vaterials Conf., April 1969, p.330.
16.1eywood, R.B. The strength of lugs in fatigue. Roy. Alcr. Est., Report Structures 182, Jan.1956.
11.Larseon, 1S.. The development of a calculation method for the fatigue strength of lu's and astudy of test results for lugs of aluminium alloys. Fatigue Design Procedures,4th IUAF Symp., Punich 1965. d. by E. Gasoner and 'W. SchUtz, Pergamon 1969,p;, 109-339.
12.assner, E. Agseeamqnt of the allowable design stresses and the corresponding fatigue life.:.ohutz, W. ICF Symp., Minich 1965, Fatigue Doeign Procedures, ed. by E. Cassner and
W. SchUtz, Pergamon 1969, pp 291-307.
13oKirkby, W.T. Constant-amplitude or vartable-amplitude teats as a busis for dertign studies.IOAF Oymp., Munich 1965. Fatigue Design Procedures, ed. by E. Grtsner andW. ZchUtz, Pergamon 1969, pp 253-290.
14.ohijva, J. Load sequenoes for ..tigue tenting of components and full-s.cr.e aircraftstructures. IOAB Congress Rome 1970, Paper :10. 70-32. Also IJLR 14P 70012,Amsterdam 1970.
15. rngineering Baiences Data. Fatigue Sub-series, Vol.2, Cumulative Damage,Item flo. 69024, ESDU Ltd., 1969.
16. -Vývi Dip., 0. Statist3cal load data procecsing. Paper in Rof.2, 5 ,1•7. Stone, -. Fatigu s n• fa !-safe- design features of the D.-10i iirlane. Paper in Ref.2, p. 179.
S- 18. Figge, I.0. Fatigue crack propagation in structures with simulated rivet forces. Symp. FatigueNovman: ,J•C. Crack Propagation, Am. Soc. Test. M4ats., STP 415, 1967, re 71-93.
9. Poe,C.C. Fatigue crack propagation in stiffened panels. Paper Ref.4, p.79.20. Paris, P.C. Tho Fracture mechanics approach to fatigue. Fatigue, an Interdisiplinery Approach,
A -e d. J.J. Burke, N.L. Reed and-V. Weica, Syracusc Un. Press, 1,64, p.10-7.21. Smith, J.H. Fatigue crack growth under axial niarrcw and broad band randor loading. Acoustical
Fatigue in Aerospace Structures, ed. W.J, Trapp and D.M. Forney, Syracuse Un.Press,196•5, p.331.
22. Swanson, S.R. Crack propagation in Clad 7079-T6 aluminum alloy sheet under constant and randomCicci, P. amplitude fatigue loading. Symp. Fatigue Crack Propagation, Am. Soc. Test. Vats.,Hoppe, W. STP 415, 1967, pp 312-360.
23. Schijje. J. Fatigue crack growth in aluminium alloy sheet material under flight-simulationJacobs, F.A. loading. Effects of design stress level and loading frequency. NLR TR 72018, 1972.Tromp, P.J.
24. Oassner. E. On the influence of fretting corrosion on the fatigue life of notched specimens ofan AlCuMg2 alloy. Fatigue of Aircraft Structures, ICAF Sy'up., Paris 1961, ed. byIi. Barrois and EL. Ripley, Pergamon 1963, P.87-1 1 25. Jacoby, G. Comparison of fatigue lives tnder con-entional program loading ani digital randomloading. Effects of environment and complex load history on fatigue life.ASTM STP 462, 1970, p-184.J•. _• 26. S.hijvi. J. The effect of load sequeuce on fatigue crack propga-ion under random loading antprogram loading. NLR TR 71014, Amsterdam 1971.
27. Ronay. Maria Study of a heterogeneous 18 Ni (300) Maraging Steel. Columblai Un., Int.StudyFatigue and Reliability, TR No. 64, 1969.
28. Imig, L.A. Fatigue of notched Ti-SAl-I o-1V titanium alloy at room temperature and 550 F (560°K)6Ills " with flight-by-flight loading representative of a supersonic transport.
H-ASA V.; D-5294, 1969.29. SchUtz, D. Einzelflugverouche an gekerbten FlachstUben aus AiCut-.2 (3-.154.5), mat plast.scher
Lowak,- H. Aufweltung doe verbgrundes. LBF TI 54/70, Darmstadt 1971.30. •ranger, J. UeconO. seminar on fatigue deni6n. Oolumbia Un., Instituvye for the stiuzd of
Fatigue and RHllabilityi TR No. 5, 1964.31. Branger, J. A reviet -of Swiss inýostigationa on aeronautical fatigue during the period
June 1965 to April 1967. EidgcnbUsisoh~s Flugzeugwerk, Frnmen, F+W, 196'4, p.196.32, Brangcrf j. - Invyesti•gatien of high strength steels under hiatory program fatigue. Co'umbia Un•,
Ronay, V.^ lnstil.ae 'fc r tho study of Fatigue and He'.iabil3ty, TR No,-56, 1968.33.--S33. o z, D. E'inselflu•:fir~ache ud_':inatufernersuche an Augenst ben aus AlZnMguAg (3.4354.7)
zur-Ucbe.prUffug ddr linearen Sch.ntedan unmulation. LBF TM 53/70, Darmstadt 1970.34, Schijve, J. Fatigue tests with random flight-cimulation loading. laper in Ref.2, p.253.•: I Also :IJ MT 71008, 1971. - •"
35. Schijve, J. Fatigue teats with random and programIksd load sequences with and without groundto..-Breek, D. air oycles. A comparative study on, full-.3ale wing canter dections. NLR ReportDe Rijk, P. S.613, Ansoerdam t.65. Also AFFDL-TR-66-143, Ct. 1966.Nedervcen- A.Seve.huijsen, P2J.
34. Holshoumer, W.L. Fatigue faiiu-o of metal components as a factor zn -%vil a-ircraft accidents.Mayner, R.J. Paper in Ref.2, page 611.
37. De Jonge, J.B. The monitoring of fatigue loads, ICAS Paper :1o. 70-31, i970. Also NLR IKP 70010, 1970.
I1i
- ;-
-- : :•_..•_ • __ • • ItL -_L -•- • : -.• . - -• • - -.. ° . .- - -- ..-
Table A Survey of the phases in airczaft design ana the associated fatigue proolems (Ref,3)
DESIGN RAbSrj Type of structure, lail-safe chbractc.,istics* Joints
Design . Detail designefforts . XateriaIs selection
. Surface treatments
- Production techniques
. Airworthiness requirements
Prediction of fatigue environmentmission analysisload Etatiet•os
Lstimations required target lifeCaiculations
TestinE j • >jnamxc rerpcnse of the structure
Zstimation of fatigue propertics
-~ fatirue livesf- crack propagation•- ~fail-safe strength
E xploratory fatig,e tests for• desi~n studies
support of life estimates
=O:STRUH'JTIa OF AIRCHRAF PROTCTYPE!; Load roeasurements in flightS? IGT FLIG•l Proof of satisfactory fatigue proprrties by
testing components or full-structureAllowances for service environment
•Structural modificationsl nspection procedures for use in service
AiqCRAIT VZ SEERIVICE •Load measurements in servicea Correntions on predicted fatigue propertifs. Cracks in service, relation to predict'.on. ztructural modifications
iF_
V
iii !-13
Table 2 Various aspecto of the aircraft fatigue environment (Ref.3)
Load-txme history . VYise~on analysis, flight profiles. Fatigue leads
gustsmanoeuvresGTACground loadsacoustic loadingetc.
. Statis--:cal description of fatigue loadscounting of peak, ranges, etc.PSD-approachUnstationary character of environment;Scatter of environmental conditions
, Sequence of fatigue loads*Lcý-d.ing ratexl, Time-history
Wave formRest periods
Tempezaturv-time - . Fatigue at low and high temperat'trehListorv . Thermal stresses
. Interaction creep-fatigue
Chbemic.l . Corrosion, influence on crack initiationnnvironment cracik propagation. Interaction stress corrosioni-fatigue
g--ii
>1 Table 3 Aspucts of available fatigue data for m*aking
- Aspect •Specification of available data
LNaterial bimilar ajterialS, Same ma~eril;:
SType of Opeoimen * Unnotched. Simply notched specimens* Similar 3tructural element. Same component
IType of loading . tonstant-amplitude teat date. Data from more complex fatigue
load sequencesLoading in service
_ __
1-14
Table 4 Investigations on flight-simulation teBýing -..',3t
S| Variables studied
Invest lga 0on .6aterial Speciaet Lo- Hig--• n taxiing eliod
I j ~'loads level
Nau.ann 7075-TA Edge notched Severe x(1964) 2024-T3 specimenKt.4 gust x
Oasuner-and Jacoby 2024-T4 Elliptical gust x x(1964/65) hole spacanX3 t - 3. 1
_Jacoby 2024-T4 same gust x(1970) 1Branger 7075 Inr dole notched manoewvre x ,
(1967,971) 2014 plate specimen( 9 7 1 7K t - 3I
Branger and Ponay CrNi steel Hole notched manoeuvre x(1968) specimen
Kt - 2.3
Ilmig and IiMg Ti-BLI S IMoiIV Elliptical typical fr x(1969) hole pecimen , upersonic
-t K- 4 aircraft
SchijveJacobsTomp 2024-T3 x(1963 ) ,075,T6
Schijve,JacobsTromp 2024-T3 Sheet epucl- gust x(1979) mten, crack
N propagationZchijve 2024-T3(1971) 7075-T6
D. S¢hutz 7075-T6 Lug-type gust("1970) al ecimen
, cij•,D •jk 2024-T3 Wizng struc- us x
(:1971 ) 7075-TS ture, crack-propagati•on
- ------ i-1-1
D;SCIPLINES INVOLVED PR¢OB•LEM AREA4S AL1ERNATIVE APPROACHES•
* Materials• LAY OUT OF STRUCTURE eSafe- filh,
SProduction
.e %.oads Mission analysisa4 1Dynamics [FATIGUE ENVIRONMENT 1,ieasur'erents on
"• I -_ .... - I eCorparison wifh olderS•.- • .-- • - - pro otype
* Aerodynamics "RESPO3NS OFSRCIR Calculations*;t Structural dynarnics * Measurements In flight
DITRBTII o Measurement~s
•-•* S tre.,is analysis o SIAINO Calculations
e Fatgue &Comparitson withTes Ftinge FATIGUE PROPERTIES 'Nu " 'i
S--T - -T --,* Test ing
I
I IIFVO E" PROPAGATION AIl STRENATH i
I. J [~DATAI
Information for" Information forsafe life fail-safe quality
Aircrafter peral tioAnT MAONTENANCETURxteniveSNon-Sdru tracti testing I"eINSPECTION 4h r Limited
0 Statistics _ A7 FECORD * Individual monitoring1# FatIgue
SFig. I Pblemareas, alternative approaches adid discipgns involved
, ftn
1-16
I
f Fig.2 Example of a multipie-element c,)mponenq
FUSELA4"E
Fig.3 Example of a multiple-load path structture
PCgiVoo OF" 03E CYCLE NUM'.5 OF CfC .•ES IN SCRVICE LIFESECONOS PMINtIr'FS HOURS00 O ral 01 1 10 1 ,0 10 10o 1& ) 10 DoGI~UDARG3N I II I
CYCLPESSURE~ CYCLE ONlL
A CAafl ' jMANEUVERS ~i
GUSTS
TAXIINO LOADS I"I
ACOUSTIC LOADOI
Fig.A Periods and numbers of several types of aircraft fatigue loads (Ref 3). Orders of magnitude
I
S15.000 j ALTITUDE FT .150
1000 ISTANCEIAUT.
0 AILES10.000 N-100
I __ 50
SPEED -I- I-IT ,
0 4_G_8_10_INTERVALl'~ 12 14 16182 2TIME (MINUTE, r)) _
010 20 30
Fig.5 Flight profile of the F-28. divided in 22 intervals (Ref.6)
I A!RCRAFT A~ I
LI
i SfAiRCRAFT
S~1 SEC
S~~Fig,6 Strain sage records of the wing bending moment of two aircraft flying in turbulent air (Re,.') •
I
ADOPT DAMAGE FOR SFECIFIED LOADBASIC FATIGUE DAIA THEO SPECTRUM CALCULATE
LIFE
OLDER STRUCTURE: NEW STRUCTURE
GOOD FATIGUE QUALI7IES - -- DESIGN EQUAL ORPROVEN IN SERVICE SUPERIOR TO OLDERP E ISTRUCTURE
PREDICTION:
S' :RVICE BEHAVIOUR
WILL BE SATISFACTORY
ADOPT ALLOWABLE CAREFUL DESIGN,STRESS LEVELS FROM LOW STRESS
PAST EXPERIENCE CONCENTRATIONS
Fig.7 Three procedures for predicting fatigue lives in the design phase
TEST CONVENTIONAL PROGRAM TEST RANDOM TEST FLIGHT-SIMULATION TESTITG IN SPECIMENS ON STRUCTURE
ILOADING 4 fiwrm ~ -=-< *v 4"1I I PERIOD I FLIGHT
fS St Sn ASSUMED SERVICE LOAD CONDIVIONS
MA!N VARIABLE5 $ LOAD SPECTRUM
OF TNF LOAD OLENGTH O PERICD IRR6EGULARITY FACTOR
S2I M& CLIPPING PATIO
U uL. O ASIC DATA FOR LIFE EST!MATES (NLR PROPOSAL) I
I I
AIMS OF TESTING ___.__
-~COMPARt1TIVE £'ESIGN STUDIES
DIRECT LIFE ESTIMATES
iINDICATION OF FATIGUE
CRITICAL CLEMENTS
CRACK PATES, -
I:NSPCCTION, REPAIRS,
ETC
Fig.8 Some fatigue tcst load sequences, main variables and testing purposes (Ref.3)
1.19
o03
da!dn 2024-T3 _t(uItligh t)
0 ~~~~102 L __ - -
B Sm, 2
1 0.
CllLOAD 5
I ~4.0
4A 10 20 0 80
_T_-ME { K: CSm J'a (kgnmm32)
Fig.9 Small intermediate ioad range in larger load range Fig.10 The crack propagation rate (microns per flight) inflight-simulation tests on sheet specimens (Ref,23). Tests at
different design stress levels characterized bysr -= Ig-stress level in flight.
Sa A
S S3
log N
Fig.l I Two intersecting S-N curves
| 1-20
(Ikgfmm 2 )
6 | . ... ' i I I' F6 :X7.5
5 II I I.7075 T6 BAR
TWI I O-HOLES SPECIMEN, K t 3.6
MANEUVSR SPECTRUM5-RANeER, 1967 (Ret. 31)4 (MEAN RESULTS OF G TESTS)
3.5
104 FLIGHTS 105
14 -I -12 CrNikfo STEELSl TWO-HOLS SPECIMEN, Kt:2.3ii MANEUVER SPECTRUM10 - BRANGER AND RONAY 1968 (Ret32)
(MEA/ RS,3th;TS cO 6 TESTS,)
9 '• I l__________._.. _illl
8 -
30 '1.-r 4 -FLIGHTS 10
B-1-1 Ti ALLOY
20 ELLIPTICAL HOLE- SPECIMEN
SUPiRSONIC TRANSPORT SPECTRUM
0 IMIG AND ILLG. 1969 (Ref. 28)DI FE (MEAN RESULTS OF 3-9 TESTS)
10 T-a I OFLILITS
104 FLIGHTS 105
10
7075-T6LUG-TYPE SPECIMEN10 • GUST SPECTRUM
_ D.SCHiTEZ. 1970 (Ref.33)
(IEAN TESLT O 4ESTS)0 FLIGHTS
r art 2024-g3 ALCLAD 0
S. .... •'= :PROPAGATION, LIFE FOR
G ~SCHIJVE, 1971 (Ref. 34,)
; (MEAN RESULTS OF 2-4 TESTS)
103 t04 FLIG.HTS
•!Fig. 12 The effect of the dt~sign stress level i,,n fatigue life tinder flight-simulation loading.
•;.... S ,ý = characteristic I g-stress le~vel la flight.
-WE~J~ R- It
41f ---Z -5 X
>L -AVY GUST
-W -
Jk J" -X~
Fig. 13 Sample of a load-iccora illustratin~g the load sequence applied in tue F-28 wing fatiguetest. Ten different types of weather condition ase simulated, flight type E corresponds to
fairly severe storm while flighit type K is flown in good weather (Ref.14).
'C CK PROPAGATION LPLOAD SEOUFNCE (FLIGHT N0119. TYPE E) REMARKS FLIGHTS PATIO{ ________________________________________2024-T3 7075--TG 202413 7075-TE
A p i 1 ;d~~~4 RANDOM FLIGHT 07 se S2 1IA II~~II~~I.I. ~SIMULATION
~I.WN4i-1~ ~ M1
TAXIING LOADS"aI N - i' Il 'ý r1 1 56n~ r~ "~1~h~ ~ II) -OMITTED I5G
UU
Il., jul- SMALL GUST11 ' lliOMITTED Ii 13924 7006 Il8 138
MORE SM4ALL
F T II. 101GUST, CYCLES 2M35 9779 I'S 1,93OMITTED
IS I I AND2 2 K9mm> -)
ONE GUST LOAD
FPER FLIGH4T ONLY 365 14556 311 2 881(THE LARIGEST
(a) tIE CRACK LI.-E COVERS PROPWMM:N FRM2 TO POPE AILURE OF THE SHEET SPCC:1EI4 WID'fh 160~mm.ALL DATA ARE MEAN VALUES 0P6 OR 6 TESTS
•--• • .. ... 1.22
Sa(kglmm 2 )
14 ~1GUST LOAD SPECTRUM
121STEPPED APPROXIMATION
10 1 --- --- ITRUNCATEDI
Sa. max S S 7.0 kglmm 2
.,LOAD SPECTRUM APPLIED IN TEST'
1 10 102 103 104 105 106
NUMBER OF EXCEEDINGS IN 5000 FLIGHTS
HOLE DIAMETER 2C mmSPECIMEN WIDTH 160 mm
RATIO'S 1;2.2: 3.9i ~~CRACK .
( mm) PROPAGATION LIFEM
70 ___r ~60 1 _
t t /i iI
'644 1 .. 8-4-S kg!mm 2 )
1 0 4-
2-- NUCLEATION_ _ __ _ _ _
CRACERIOD 20 24.28.32.N NUMBER OF FLIGHTS (1300 FLIGHTS)
RATIO'S I.15RESULTS FROM Ref 1, MEANJ RESULT OP 4 TESTS
Fig.15 Effect of huncation !evel (Sa, max) on the crack nucleation period (to 1' = 2 ram)and the crack propagation life. Random flight-imulation tests on 2024-13 Alclad sheet
specimens with a central hole.
1-23
CRACK3 LENGTH 60-
(mm) STRINGER
SKi0N
411 50
4040 I I,130
30 ~L.L. LL
L.L.
It j A .. 8 C 20 R A a C
100 120 140 160 180 200 100 120 140 1S 180 200
SPAR WEB DOOR COAMING
120 40
•-100 /
80 / 35S80- L.L
GO-
4-r R A 8 C 30LRb 4BC20 I•..L~.L........L..L.
100 120 140 1GO 180 200 100 120 140 IG0 leO 200
LIF" (1000 FLIGHTS)
R CERTIFICATION TESTS
LL CRACK EXTEN.ON DUJE TO LIMIT LOAD APPLICATION AT END OF CERTIFICATION TESTS
A,BC :PERIODS OF SUBSEQUENT RESEARCH PROGRAM
A LOW-AMPLITUDE GUST CYCLES OMITTED
B LOWER TRUNCAriON LEVEL
C LOAD LEVELS INCREASED 25 PERCENT
Fig. 16 The effect of limit load application on crack propagation in a full-scale wingstructure under random flight-simulation loading (Ref.34)
2-1
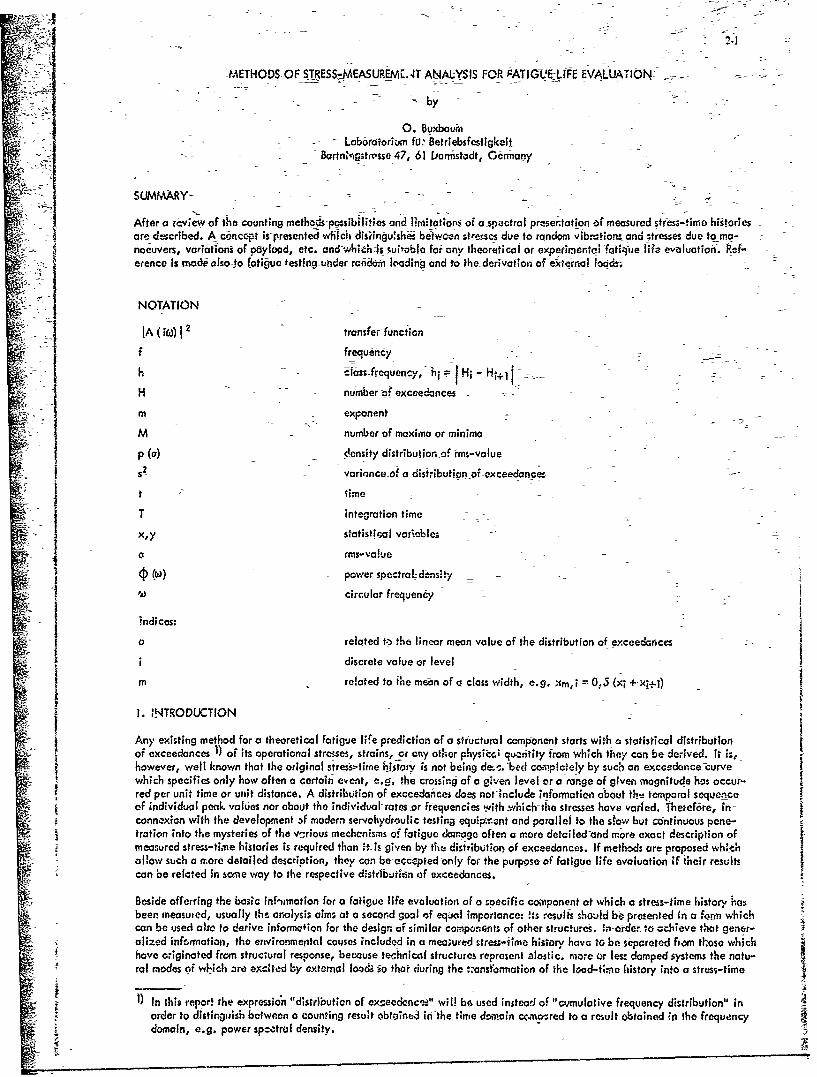
-METHODS- OF STRESS-JAEASUREME. 4T ANALYSIS FOR-OATIGLOE-LIFE EVALUATION-
-'by
0. Buxbauni
1.La6ratoriom fo:- Betriebsfcstigkoit
BortnhngstrcsseV4, 61 D'armstazdt, Genrmany
SUMMARY-
After a rcvkew of the-counting mehd-osblte and ~lmttinof a-sp~uctral przsertation, of mieasured striess-timo historiesare described. A concet-F is-presented which disiinqu~shii betwoon stre~sss due to random vibrotfons and tiresses due to ma-
noeuers -suitable,:: foranythn thoeiclo xperimentda~i flque Iifz evaluationý. IRef-
NOTATION
JAia 2 tronsfer-functiton
f frequency
h - Clans-frequency,_ h, =- Hi H-+i -1
H numdber -of exceedances -
re exponent
M number of maxima or minima
p (a) -density distribution-of lint-value
S2 variance-of a distribution of-exceedances-
t time-fT integration time
x~y statistical vapie'oles
a rms-value
power spectraL-density-
W circular frequency
0nics related to the linear mean value of the distribution of exceedances
discrete value or level
mn related to the mean of a class width, e.g 9, m, i = 0..3 (xi +-iq...)
1. INTRODUCTION
Any existing method for a theoretical fatigue life prediction of a structural component starts with a statistical distributionof exceedances 1) of its operational stresses, strains,_or ary oth~er physicc.; qvzrntity from which th~ey can be derived. It' Is,however, well known that the original stress--tirne Wistay is not being de~s. 'bed completely by such an eXCoedence -urve
t w~hich specifies only how often a certain event, e~g. the crossing of a given level or a range of given magnitude has occur-red per unit time or unit distance. A distribution of exceed~ances does not-include informatioei about tht! temporal sequenceof indivi -dual peak values nor about the individual- rates -or frequencies with -which-the stresses have varied. Thekef~re, inconnexion with the development 3f modern servahy droulic testing equlipr.ant and parallel to the stow but continuous pene-tration into the mysteries of the v-:rious mechcnisms of fatigue damoge often a more detailed-and m~ore exact description ofmeasured stress-time histories is required than "H s given by the distdibut-or, of exceedancesi If methods are proposed whicha1ov/ such a more detailed description, they can be-cccepted only for the purpose of fatigue life evaluation if -their resultscon be related in some way to the respective distributitien of exceedances.
Beside offerring the ba3ic inf-rnnation for a fatigue life evaluation of a -poecific comlponent at which a stres-time history 'hasbeen fneosuied, usually the analysis aims at a second gocil of eqiual importance: its results should biý prestented in' a iprn~ whichcan be used also to derive information for the design of similar components ?f other structures. In ri-der to achieve that gener-alized iniftrmation, the environmen~tal causes included in a meo~urtd stresz-time history hovoG to be ,Oacreted from ftIse which
fhave originated from struct.ural response, beceause technical structures represent alostic. more or less- damped systems the natu-ral modes of wl'ch zre excited by external 1=4& io that during the t-onsfoniiation of the load-6nne history into a stress-time
DIn this report the expression "distribution of exreadane-jt" wilI! b6 used instead of "cumulative frequency distribution" inorder to distinguish bctween a counting resu,'t obtained ih-the time domain c<omnosred to a result obtained in the frequencydomain, e. g. power spectro I density.
history, both amplitud-and fiequencies may be distorted, an occurrence which commonly is called dynamic response. As anexceedance curve of measured stresses doe% not contain information about frequencies, as it has been mentioned above, ex-ternoal loads can be derived from it only under restricfed canditions.
SIt is- tried to pre~ent I'n this pap -er a -survey about the-status of met'lods for the anatysis of measured stress-firne histories a., it-is nee .ssary ior both fatigue life evaluation and design. First some recent developmen,1s and considerations about the usage
of counting methods wilIlbe r;,,iewed. Then a classification oF measured random data will be proposed, from which the ad-Svantages ai•d !imltatis .r power spbctral techniques w•ill be derived as it recommended e.g. tor stresses due to atmospheric
• - turbulence and runway •bughnes;et. After a discussion about the treatment of stresses due to mangeuvers finally some com-ments will be made about-rilations bItween stre_.es r.eakired at different points of a structure.
2.-SOME REMARKS ABOUT COUNTING METHODS
Statistical counting methods became usual'in the field of fatigue for the analysis of measured str&ss-tlime histories during thethirties of this century. Since at that time the Wohlen test wi;h its sinum;zal loading history was the common procedure foran experimental fatigue investigotion, itwas obvious, that any m-asured random stresses were interpreted as a sequence of
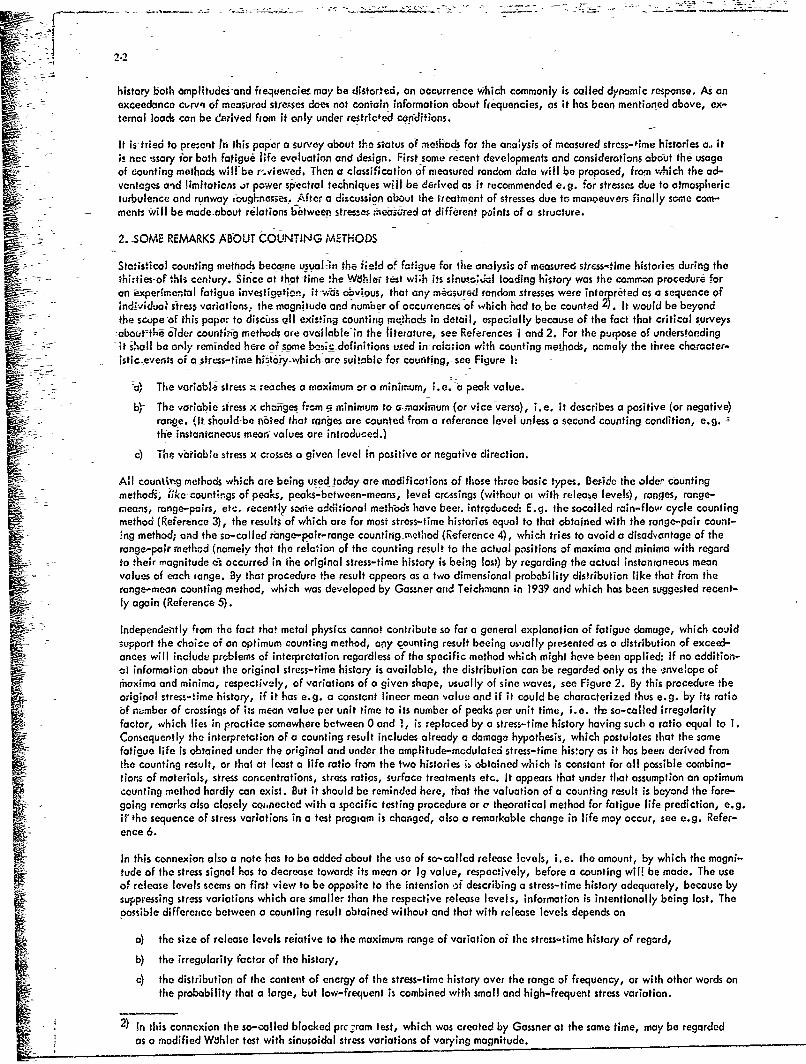
•-•--- -individuao stres5 variations, the magnitude and number of occurrences of which had to, be counted 2). It would be beyondthe scope -f this paper to discuss all existing counting me~hods in detail, especially because of the fact that critical surveysabout thi older counting methods are available in the literature, see References I and 2. For the purpose of understandingit shall be ornly reminded here or some bat.:,c definitions used in relation with counting methods, namely the three character-Sistic events of a •tr�s-time hintory-which are suitable for counting, see Figure 1:
a, The variable stress x reaches a maximum or a minimum, i.e. a peak value.
bl, The variable stress x changes from 9 minimum to a'!naximrum (or vice versa), i.e. it describes a positive (or negative)range. (It should be noted that ranges are counted from a reference level unless a second counting condition, e.g,the instantaneous mean- values are introduced.)
c) The variable stress x crosses a given level in positive or negative direction.
All counting methods which are being used today are modifications of those three basic types. Be.side the older countingmethods; like countings of peaks, peaks-between-means, level crcssings (without or with release levels), ranges, range-means, ronge-pairs, etc. recently sonie additional methods have beer. introduced: E.g. the socalled rain-floay cycle countingmethod (Reference 3), the results of which are for most stress-time histories equal to that obtained with the range-pair count-ing method; and the so-called range-pair-range count rig method (Reference 4), which tries to avoid a disadvantage of therange-pair method (namely that the relation of the counting result to the actual positions of maxima and minima with regardto their magnitude as occurred in the original stress-time history is being lost) by regarding the actual instantaneous meanvalues of each range. By that procedure the result appears as a two dimensional probability distribution like that from therange-mean counting method, which was developed by Gassner arid Teichmann in 1939 and which has been suggested recent--ly again (Reference 5).
Independently from the fact that metal physics cannot contribute so far a general explanation of fatigue damage, which couldsupport the choice of an optimum counting method, any counting result beeing us.•ally presented as a distribution of exceed-ances will include problems of interpretation regardless of the specific method which might have been applied: If no addition-al information about the original stress-time history is available, the distribution can be regarded only as the envelope ofmaxima and minima, respectively, of variations of a given shape, usually of sine waves, see Figure 2. By this procedure theornginal stress-tlime history, if it has e.g. a constant linear mean value and if it could be characterized thus e.g. by its ratioof number of crossings of its mean value per unit time to its number of peaks per unit time, i.e. the so-called irregularityfactor, which lies in practice somewhere between 0 and 1, is replaced by a stress-time history having such a ratio equal to 1.Consequently the interpretation of a counting result includes already a damage hypothesis, which postulates that the somefatigue life is obtained under the original and under the amplitude-modulated stress-time history as it has been derived fromthe counting result, or thai at least a lifo ratio from the two histories it obtained which is constant for all possible combina-tions of materials, stress concentrations, stress ratios, surface treatments etc. It appears that under that assumption an optimumcounting method hardly can exist. But it should be reminded here, that the valuation of a counting result is beyond the fore-going remarks also closely cor.nected with a specific testing procedure or a theoretical method for fatigue life prediction, e.g.if the sequence of stress variations in a test program is changed, also a remarkable change in life may occur, see e.g. Refer-ence 6.
In this connexion also a note has to be added about the use of so-called release levels, i.e. the amount, by which the magni-tude of the stress signal has to decrease towards its mean or Ig value, respectively, before a counting will be made. The useof release levels seems on first view to be opposite to the intension of describing a stress-time history adequately, because bysuppressing stress variations which are smaller than the respective release level s, information is intentionally being lost. Theposiible difference between a counting result obtained without and that with release levels depends on
a) the size of release levels rejative to the maximum range of variation of the stressotime history of regard,
b) the irregularity factor of the history,
c) the distribution of the content of energy of the stress-time history over the range of frequency, or with other words onthe probability that a large, but low-frequent is combined with small and high-frequent stress variation.
2) In this connexion the so-called blocked prc. ram test, which was created by Gassner at the same time, may be regarded
as a modified Wbhler test with sinusoidal stress variations of varying magnitude.
2;3
There are several reasons forihe introduction of-release levels, e,g. the protection of elecir,-mechanical countes (likbS-those of the well known Fatigue-Meter, which is on acceleration czounting system being used in many airplan) )from noiseor high-frequent vibrations which might-be superimpesedto the accelerations due toinanoeuvers-and/or gusts. In this case
the release levels are a less expensive and approximative alternative to a-frequency filter. There-may, on the-other-hoad,also be the-attempt to correctLthe accuracy-of the fatigue life prediction. If this is done, it should be always kept-in riindthat a-distribution of exceedances which wos-obtained by the use of release i~vels can only lead to an agreeable fatigue-lifeestimation- n combination with the specific method of damage calculation or testing procedure, wAth which the experienceshave been gained. As soon as these methods ore changed, it-has to be proved what-effect on the fatigue life might result
_ - - -irom this change. An investigation about the affect of the magnitude of release levels on the-respective distribution of ex-ceedances is being perforInied in these days ait the Laborctorium fur Betriebsfestigkeit. itis planned that the results will beused for flight-by-flight fatigue tests in order to define the effect on life time to failure.
As far as distributions of exceedances of measured operational stresses are gerierally concerned, one more important attributehas to be mentioned here, i.e. thepossibility of extrapolating !hem under certain conditions'beyond the'peried of measure-ijient. This can often become necessary, as it is impossible to-extend what is called a flight-load survey to the life time ofthe respective structure. The so-called extreme value distribution, i.e. thedistribution of positive (and negative) stress incre-mears which have occurred once per flight or flight segment, has proved to be an excellent tool for such an extrapolation ofa distribution of exceedances.~oreover, it is possible to attribute to the distribution of exceedances by means of the respec-tive extreme value distribution a~probability with which it is reached or exceededsee References 7 and 8.
3; A CLASSIFICATION- OF STRESS-TIME HISTORIES
-Frornview of the historibl de,'lopment of the field of fatigue it is easily comprehended that for the-first attempt to classify- - measured stress-time hiitorios~syit-taticaliy, the shape of the distribution of exceedanceshias.been chosen (Reference 9).
As the distributions of -exceeddrnces-of two stress;time histories being different with repect-to their origins and io their temp-oral seuence of k vhlui I£d have the sama shape, such a classification is insufficient, if tie aptitude of a specialmathematical model for the-descriiflon of stress-time histo'es is to be investigated. Because of that reason other criteria
-have to be ir--;itedued.
3.1 Voe PossibilIties of a Mdthematicll-Description
The theory for the treatment-of random physicaldata offers the following classification (Reference 10), see Figure 3:
Z Any observed data representing otphysical phenomenon can be broadly classified as being either deterministic, if they canbe described by ai explicit mathematical relationship, or stochastic, If such a defined relation between magnitude and timeis no longer possible, in the latter case is any record of any length unique, i.e. it is not reproducible in the same way. There-
fore, the explicit mathematical relation, which allows to predict .the magnitude of the iignal with certainty, has to be re-placed for .tochosiic data by statistical functions giving only a probability for the occurrence of a defined rragnitude.
For a further ciassificction of stochastic data theory uses the definition of what is called a random process being defined suchthat a series of sample records (also called an ensemble) is available which can be described by so-called ensemble averages,i.e. the statistical moments taken from the respective random process-at Some time t. If the statistical moments vary withtime, the process it called nonstationary, if they are invariant with time, it is called stationary. For the case that one samplerecord-of o random process is statistically equivalent-to any other of the same ensemble, the insemble-averages may be re-placed by time-averages and the respective process is called ergodic.
In the literature perferably as examples for random processes either the Brownian mot'on of a molecule or the emis;,%n of elec-trons at the cathode of a tube are chosen, where the latter is used e.g. in so-called noise generators in order to produce arandom process, see Figure 4 a. This kind of random processes differs more or less from other technical phenomena like thepositions of an on-off switch, see Figure 4 b, or the normal acceleration% of a military airplane due to mnanoeuvers, see Figeure 4 c.
In the case of the output voltage from a noise generator fluctuations of variable magnitude are occurring continuously abouta constant mean value, where the mean value either is crossed by the signal in positive and negative direction alternatelyor is being touched by the signal for very short periods of time. It has been shown by Rice that the average number of meancrossings per unit time as well as that of peaks per unit time obey relationships which can be described by means of statistics(Reference 11).
Opposite to this example of a random process, tihe two other phenomena as shown in Figure 4 b and c represent what is coiled
here random sequences of individunl events. A characteristic of these sequences is .. g. that the signal is returning after adeviation normally to its reference or resting vaoie, where it can remain for any period of time until the next deviation w1;loccur. Thus th(. continvity of fluctuations as it is typ*ical for random processes does not exist for random sequences of individ-ual events. The main distinctive mark may be obtainea b/:'nvestigating their origins: Random sequences will usually occur,when men generate control or steering actions, where a randw:n process originates from a physical source and "proceeds' un-affected by men.
These considerations let some doubts arise, whether the classification of stochastic data according to the possibility of theirmathematio-I treatment wili be sufficient for solving all problems existing today in combination with the description of opera-tional stress-time histories. Before it will be demonstrated, how the solutions available for some staticary random processescan be transferred to stress-time histories and how random sequences of individual events could be described, first a proposalwill be made for a classification depending on the origins of the data.
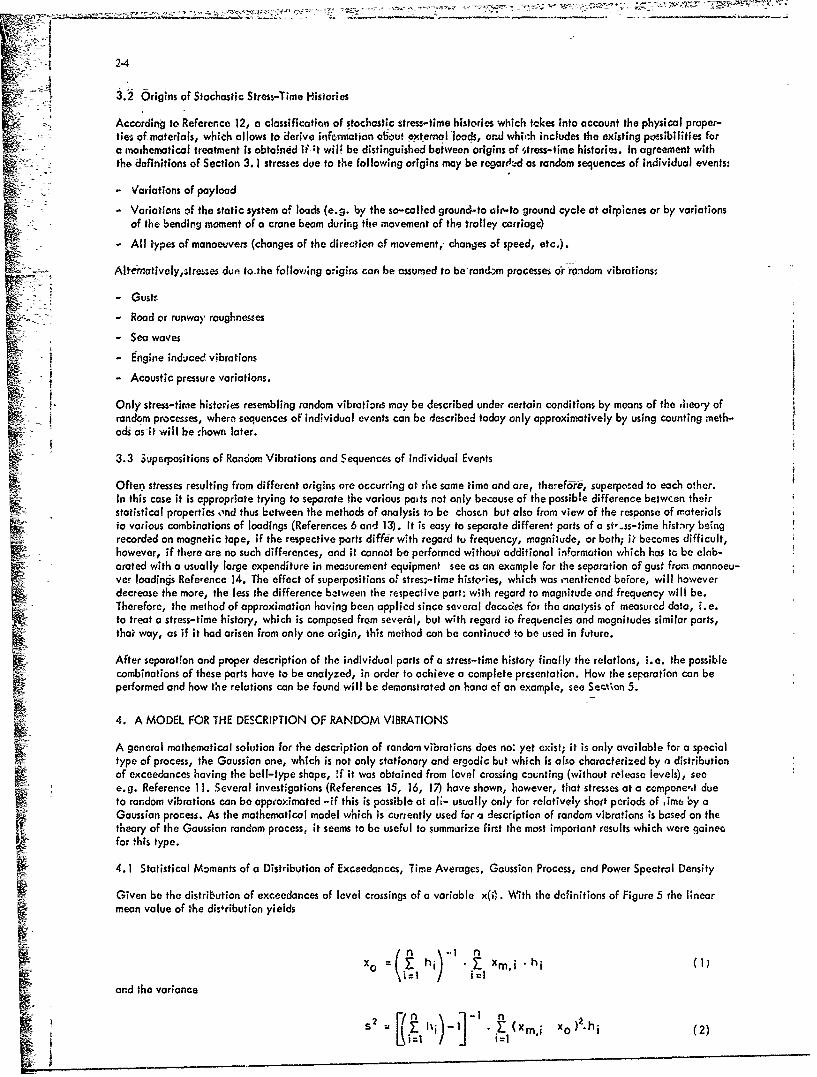
2.4
3.2 Origins of Stochastic Stress-Time Histories
"According to Reference 12, a classification of stochastic stress-time histories which tckes into account the physical proper-tie; of materials, which allows to derive itfe-motion about external 'loaods, and whic:h includes the existing possibilities fora marhematical treatment is obtained if-t will be distinguished between origins of ,,tress-time histories. In agreement withth6 definitions of Section 3. 1 stresses due to the following origins may be regar-t4d as random sequences of individual events:
- Variations of payload
- Variations of the static system of loads (e.g. by the so-called grounde-to air-to ground cycle at airplcnes or by variationsof the bending moment of a crane beam during the movement of the trolley carriage)
- All types of manoeuvers (changes of the direction of movement, changes of speed, etc.).
Altermatively,atre~ses duet toethe following owgins can be assumed to be random processes o6r rondom vibrations:
-. Gustt- Road or runway roughnesses
- Sea waves
- Engine induced vibrations
S- Acoustic pressure variations.
Only stress-time histories resembling random vibrations may be described under c.ertain conditions by means of the ,heoy ofrandom processes, where sequences oF individual events can be described today only approximatively by using counting meth-oads asit will be chown later.
3.3 .uperpositions of Random Vibrations and Sequences of Individual Events
Often stresses resulting from different origins ore occurring at the same time and are, therefor'e, superpcvsed to each other.In this case it is appropriate trying to separate the various poats not only because of the possible difference betwcen theirstatistical properties o'nd thus between the methods of analysis to be chosen but also from view of the response of materialsio various combinations of loadings (References 6 and 13). It is easy to separate different parts of a st,.ss-time histIry beingrecorded on magnetic tape, if the respective parts differ with regard tu frequency, magnitude, or both; i? becomes difficult,however, if there are no such differences, and it cannot be performed without additional information which has to be elnb-
orated with a usually large expenditure in measurement equipment see as an example for the separation of gust from mannoeu-vet loadings Refeence 14. The effect of superpositions oa. stres:-time histoies, which was ,,entioned before, will howeverdecrease the more, the less the difference between the respective part* with regard to magnitude and frequency will be.
Therefore, the method of approximation having been applied since several decoaes for the analysis of measured data, i.e.•< to treat a stress-time history, which is composed from sever6l, but w~th regard io frequencies and magnitudes similar parts,
thai way, as if it had arisen from only one origin, this method can be continucd to be used in future.
After separation and proper description of the individual parts of a stress-time history finally the relations, i.e. the possiblecombinations of these parts have to be analyzed, in order to achieve a complete presentation. How the separation can beperformed and how the relations can be found will be demonstrated on hona of an example, see See.k*on 5.
4. A MODEL FOR THE DESCRIPTION OF RANDOM VIBRATIONS
A general mathematical solution for the description of random vibrations does no: yet exist; it is only available for a specialtype of process, the Gaussian one, which is not only stationary and ergodic but which is also characterized by a distribution
of exceedances having the bell-type shape, ,f it was obtained from level crossing counting (without release levels), seee.g. Reference 11. Several investigations (References 15, 16, 17) have shown, however, that stresses at a ccmpone-,t dueto random vbrations can be appoximatted -if this is possible at aN- usually only for relatively short periods of ime by aGaussian process. As the mathematical model which is currently used for a description of random vibrations ;s based on the
theory of the Gaussian random process, it seems to be useful to summarize first the most important results which were gainee
for this type.
4.1 Statistical Moments of a Distribution of Exceedances, Time Averages, Gaussian Process, and Power Spectral Density
Given be the distribution of exceedances of level crossings of a variable x(i,. With the definitions of Figure 5 the linearmean value of the disfribution yields
x 0 n hi) XM .hi(
and the variance
S s•= i - "(xm i xo) 'hi (2)
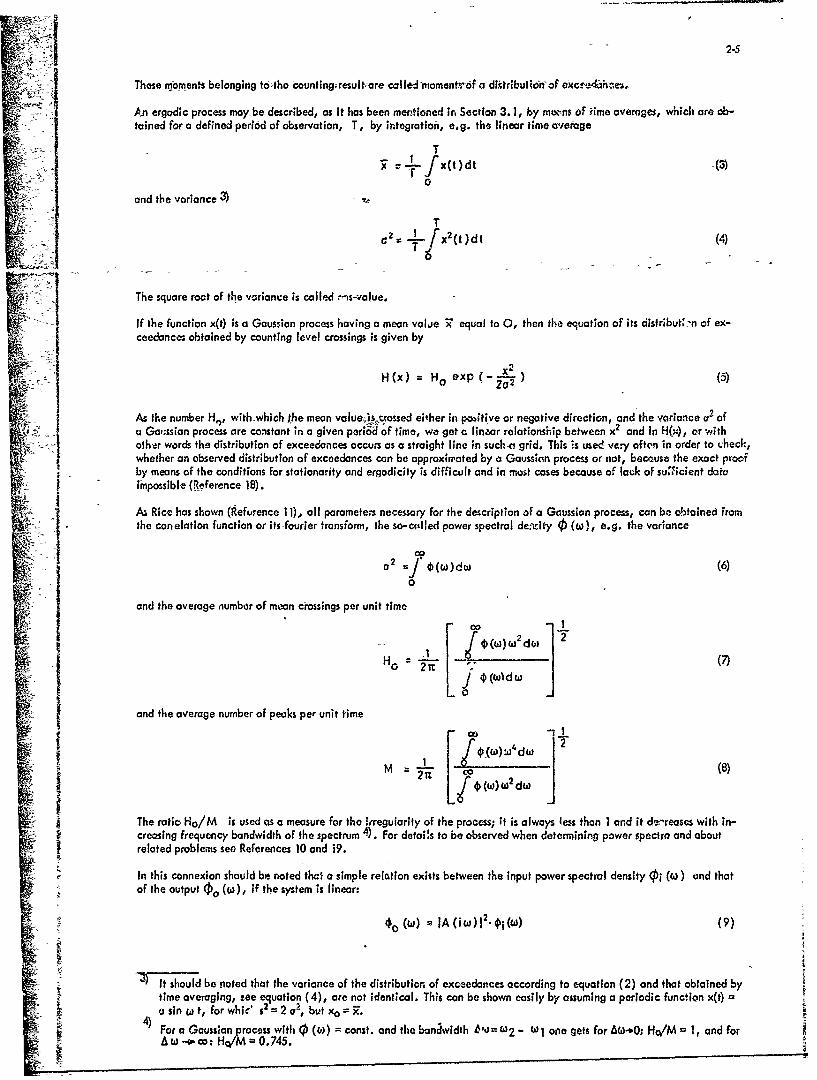
These moments belonging-to;tho counting;result-are-cal led ryoment.r of ai distribution- of ec.
An ergodic process may-be described, as it has been meotioned in Section 3. 1, by mwtxns of rime overages, which are ob-tained for a defined period of observation, T, by integration, e.g. the linear time average
T
and the variance 3 -
Tc2 = .L x2(, )dt (4)
T
The square root of the variance is caIled rms-value.If the function x(t) is a Gaussian process having a mean volae 3 equal to 0, then the equation of its distributL'n of ex-ceedance; obtained by counting level crossings is given by
2
H(x) = HO exp(-2)1
As the number HW, with-which the mean value;is~cxossed either in pobitive or negative direction, and the variance ar ofa Ga,;ssian process are constant in a given period of time, we get c linzar relationship between x2 and In H(g, or -with
other words the distribution of exceedances occurs as a straight line in such-a grid. This is used very often in order to tuhecF,whether an observed distribution of exceedances can be approximated by a Gaussian process or not, becouse the exact proofby means of the conditions for stationarity and ergodicity is difficult and in most cases because of lack of suTicient data
impossible (Reference 18).
As Rice has shown (Refurence 11), all parameters necessary for the description of a Gaussion process, can b* obtained from•I the conelation function or its-fourier transform, the so-clled power spectral de:-.ity t) (w), e.g. the variance
a.2 o2 -- ¢(c)dw (6)0
and the average number of mean crossings per unit time
(W()d w 2
H 0 j jfw1dw
and the average number of peaks per unit time
M CO :~w d (81
The ratio Ho/M is used as a measure for the "'regularity of the process; it is always less than I and it deý'reases with in-creasing frequency bandwidth of the spectrum 4). For detoi!s to be observed when determining power spectra and about
k ~ related problems see References 10 and 19.
In this connexion should be noted that' a simple relation exists between the input power spectral density (Pi (j) and thatof the output 00 (w), if the system is linear:
40 = IA(iW)1 2. i(W) (9)
- It should be noted that the variance of the distribution of exceedances according to equation (2) and that obtained bytime averaging, teo equation (4), are not identical. This can be shown easily by assuming a periodic function x(t) =
) sin w t, for whia' s2 = 2 a2, but Xo = boa
A w --o .o: Ho/M = 0.745.
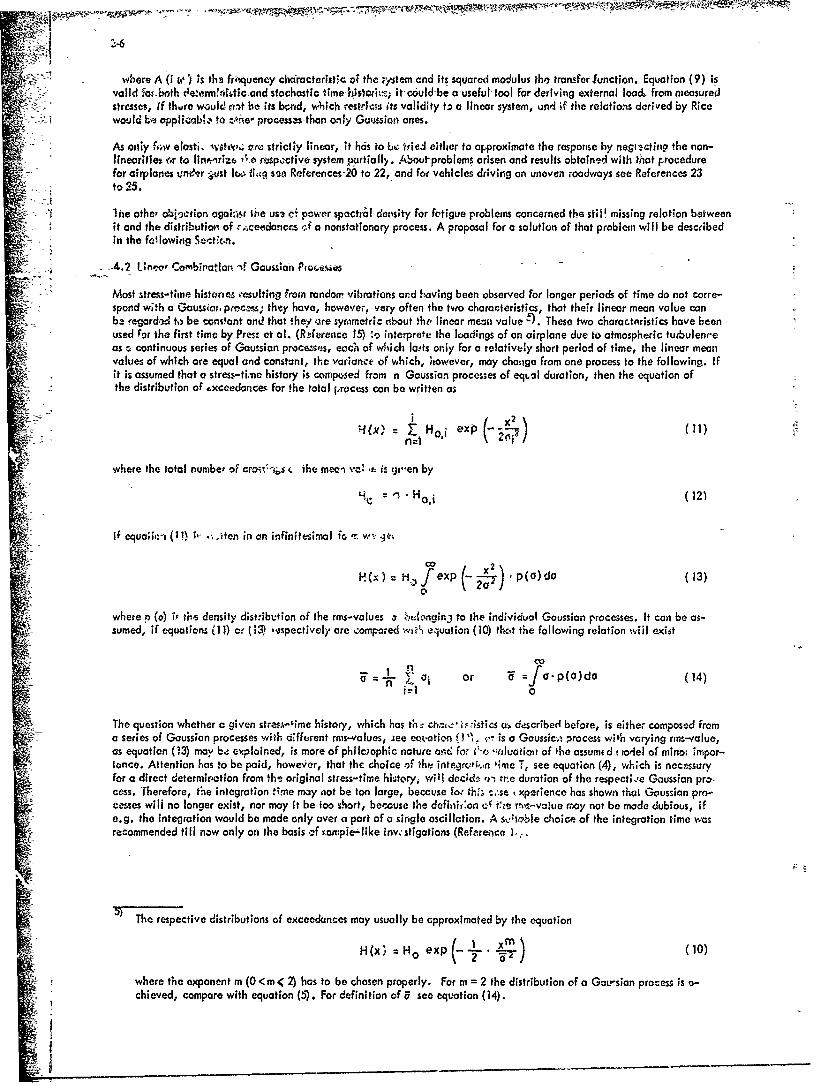
where A _(I W~ is the frequency characterWi;t~ of the ýystern and its squared modulus the transfer function. Equation (9) isvald ft bth ~e~~miticandstohasic imestoi~:~ i-could-be a-useful, tool for deriving external- loa& from measured
stresses, if thure would ri-)t be its bend, w~tich restrlc'Ps its validity ti a linear system, und i~ h eaii eie yRcwould be opplicab%,, to :.,ýeý Processas-than on1ly Gaussian ones.
As oaiy fi~w elost'. wsltv,". zoz strictly linear, it has to bet trieS1 either to approximate the response by negiicting the non-linearities or to lin#,trizf, 'e riýspecctive system partially>. Aboutrproblems arisen and results obtained with ?hat procedurefor airplanes under ý&vst lc i,&q smei References 20 to 22, and for vehicles driving on uneven roadways see References 23to 25.
IThe other obinction against sbe usa. c4 power spectral density for fa'tigue problems concerned this stilV missing relotion betweenit and the distribution, of -4ceadaniccs r.f a nonstationary process. A proposal forea solution of that problerci will be describedin the faollowing Sectkcri.
-4.2 Linev' Combination -'f-Gaussian Pwres~es
Most stress- time histories resulting fromn random vibrations and baving been observed for longer periods of time do not corre-spond with a Gaussiai. p~enc=; they-have, however, very often the two characteristics, that their linear mean value canbe regardad to be constant and that they .ire symmetric nbout the linear mean value -). These two characteristics have beenused For the first time by Press et ot. (Rzference 15) ,, interprote the loadings of an airplane due to atmospheric tutbulenreas o continuous series of Gaussian proce~ses, each of wlhich lads oniy for a relatively short period of time, the linear meanvalues of which are equal and constant, the variance of which, however, may chasige from one process to the followingl. Ifit is assumed that a stress-ti'ne history is composed from n Gaussian processes of eqtal duration, then the equation ofthe distribution of ~xceedonces for !he total process con be written as
where the total number of tr~~' the maci vc! ýre it Ui-en by
He Ho (12)
If equoli-i (III ýý_ittn in an infinitesimal ir, r. wiý4'-
00
where n (a) ir the, density dist:ibution of the rms-values ir ?tA,%n'rinj to the individual Gaussian processes. It can be as-sumed, if equations ('11) o- (i1~) -'spectively are comporad wa&$ equation (10) thot the following relation will exist
'C or = 1J -P1OuO (14)inl 0
The question whether c: given stress-~ime history, which has tht! mh t~sis described before, is either composed froma series of Gaussian processes with d~fferent mis-values, 3ee eototion f3 11, <- is a Goussic.i process wi*ýh varying rms-value,as equation (113 macy b4~ explained, is more of phi leyophic nature arm: for 7a ~luatioit of )he assumed t to'el of minok impor-lance. Attention has to be paid, however, that the choice .7f the intejrvP;,.n time T, see equation (4), which is necessaryfor a direct determ~iration from the original stress-time hijtory, will deckd.2 )-t rva duration of the respecti.'e Gaussian pro~-cess. Therefore, t6e integration time may not be ton large, because to-fh.' t c,,.se ixperiance has shown that Gaussian pro-cesses will no longer exist, nor may it be too short, berouse the defini~on L4 t.'e vinx-valua may not be made dubious, ife.g. the integration would be made only over a port of a single oscillation. A sviol ctloice of the integration time %'Vasrecommended till now only on the basis -2f roample---like inwstigations (Refereoca L..
The respective distributions of exceedances may usually be approximated by the equation
Hexp aH 0 e ( . 4X. (10)
where the exponent mn (0 <m in 2) has to be chosen properly. For m = 2 the distribution of a Gau-sian process is a-chieved, compare with equation (5). For definition of E see equation (14).
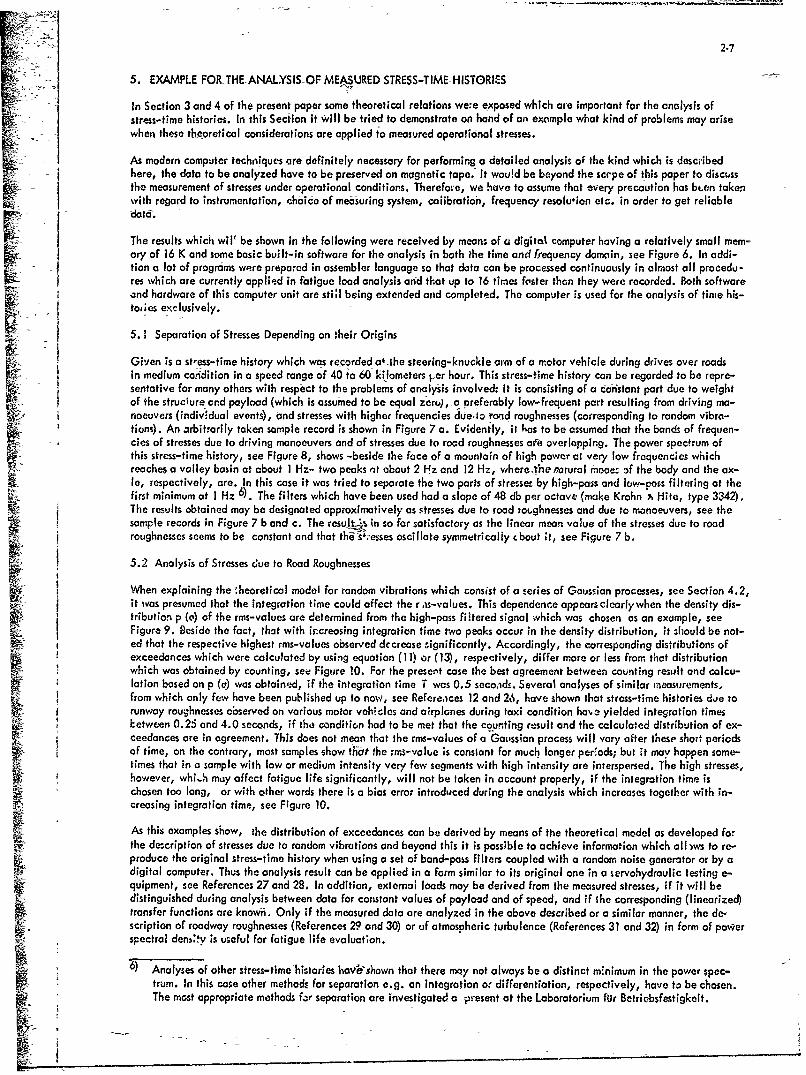
2-7
5. EXAMPLE FOR THE-ANALYSIS OF MEASURED STRESS-TIME HISTORIESIn Section 3 and 4 of the present paper some theoretical relations we:e exposed which are important for the analysis of
stress-time histories. In this Section it will be tried to demonstrate on hand of an example what kind of problems may arisewhen these theoretical considerations are applied to measured operational stresses.
As modern computer techniques are definitely necessary for performing a detailed analysis of the kind which is descibedhere, the data to be analyzed have to be preserved on magnetic tape. It wou!d be beyond the scspe of this paper to discossthe measurement of stresses under-operational conditions. Therefore, we have to assume that every, precaution has bten takenwith regard to instrumentation, choice of measuring system, calibratio6, frequency resolution etc. in order to get reliableoodatd.F ' The results which wil' be shown in the following were received by means of a digitak computer having a relatively small mem-ory of 16 K and some basic built-in software for the analysis in both ihe time and frequency domain, see Figure 6. In addi-tion a lot of programs were prepared in assembler language so that data con be processed continuously in almost all procedu-res which are currently applied in fatigue load analysis and that up to 16 times foster than they were recorded. Both softwareand hardware of this computer unit are stilI being extended and completed. The computer is used for the analysis of time his-tooies exclusively.H 5. 1 Separation of Stresses Depending on their Origins
Given is a st-ess-time history which was recorded ai the steering-knuckle arm of a motor vehicle during drives over roadsin medium condition in a speed range of 40 to 60 kilometers ler hour. This stress-time history can be regarded to be repre-sentative for many others with respect to the problems of anclysis involved: It is consisting of a coristant part due to weightof the struciure ond payload (which is assumed to be equal zero), a Preferably low-frequent part resulting from driving ma-"noeuvers (individual events), and stresses with higher frequencies dUe-to ro1d roughnesses (corresponding to random vibra-"tions). An 3rbitrarily taken sample record is shown in Figure 7 a. Evidently, it has to be assumed that the bands of frequen-cies of stresses due to driving manoeuvers and of stresses due to road roughnesses are overlapping. The power spectrum ofthis stress-time history, see Figure 8, shows -beside the face of a mountain of high power at very low frequencies whichreaches a volley basin at about I Hz- two peaks ,it about 2 Hz and 12 Hz, where~the narural moae. of the body and the ax-le, respectively, are. In this case it was tried to separate the two parts of stresses by high-pass and low-pass filtering at thefirst minimum at I Hz 6). The filters which have been used had a slope of 48 db per octave (make Krohn A Hite, type 3342).The results obtained may be designated approximatively as stresses due to road :otghnesses and due to manoeuvers, see thesample records in Figure 7 b and c. The resuit_. in so far satisfactory as the linear mean value of the stresses due to roadroughnesses seems to be constant and that the si;esses oscillate symmetrically tbout ;t, see Figure 7 b.
5.2 Analysis of Stresses due to Road Roughnesses
When explaining the 'heoretical model for random vibrations which consist of a series of Gaussian processes, see Section 4.2,it was presumed that the integration time could affect the r.is-values. This dependence appears clearly when the density dis-tribution p (e) of the rms-values are determined from the high-pass filtered signal which was chosen as an example, seeFigure 9. Beside the fact, that with increasing integration time two peaks occur in the density distribution, it should be not-
F• •ed that the respective highest rms-values observed decrease significcntly. Accordingly, the corresponding distributions ofexceedances which were calculated by using equation (11) or (13), respectively, differ more or less from that distributionwhich was obtained by counting, see Figure 10. For the present case the best agreement between counting result and calcu-lotion based on p (a) was obtained, if the integration time T was 0.5 seco.ids. Several analyses of similar ineasurements,from which only few have been published up to now, see Refere.aces 12 and 26, have shown that stress-time histories due torunway roughnesses observed on various motor vehicles and airplanes during taxi condition haw yielded intecgration timesLetween 0.25 and 4.0 seconds, if the condition had to be met that the counting r-sult and the calculated distribution of ex-ceedances are in agreement. This does not mean that the rms-values of a Gaussian process will vary after these short periodsof time, on the contrary, most samples show tha't the rmn-volue is constant for much longer per.ods; but it may happen some-times that in a sample with low or medium intensity very few segments with high intensity are interspersed. The high stresses,however, whiIh moy affect fatigue life significantly, will not be token in account properly, if the integration time ischosen too long, or with other words there is a bias error introduced during the analysis which increases together with in-creasing integration time, see Figure 10.
As this examples show, the distribution of exceedances can be derived by means of the theoretical model as developed forthe de.cription of stresses due to random vibrations and beyond this it is possible to achieve information which all ýws to re-produce the original stress-time history when using a set of band-pass filters coupled with a random noise generator or by adigital computer. Thus the analysis result can be applied in a form similar to its original one in a tervohydraulic testing e-quipment, see References 27 and 28. In addition, external loads may be derived from the measured stresses, if it will bedistinguished during analysis between data for constant values of payload and of speed, and if the corresponding (linearized)transfer functions are known. Only if the measured data are analyzed in the above described or a similar manner, the de-scription of roadway roughnesses (References 29 and 30) or uf atmospheric turbulence (References 31 and 32) in form of powerspectral dens:ty is useful for fatigue life evaluct*on.
• 6 ) Analyses of other stress-timehistories havo shown that there mny not always be a distinct m'nimum in the power spec-trum. In this case other methods for separation e.g. an integration o. differentiation, respectively, have to be chosen.The most appropriate methods f-r separation are investigated a present at the Laboratorium fur Betriobsfestigkeit.
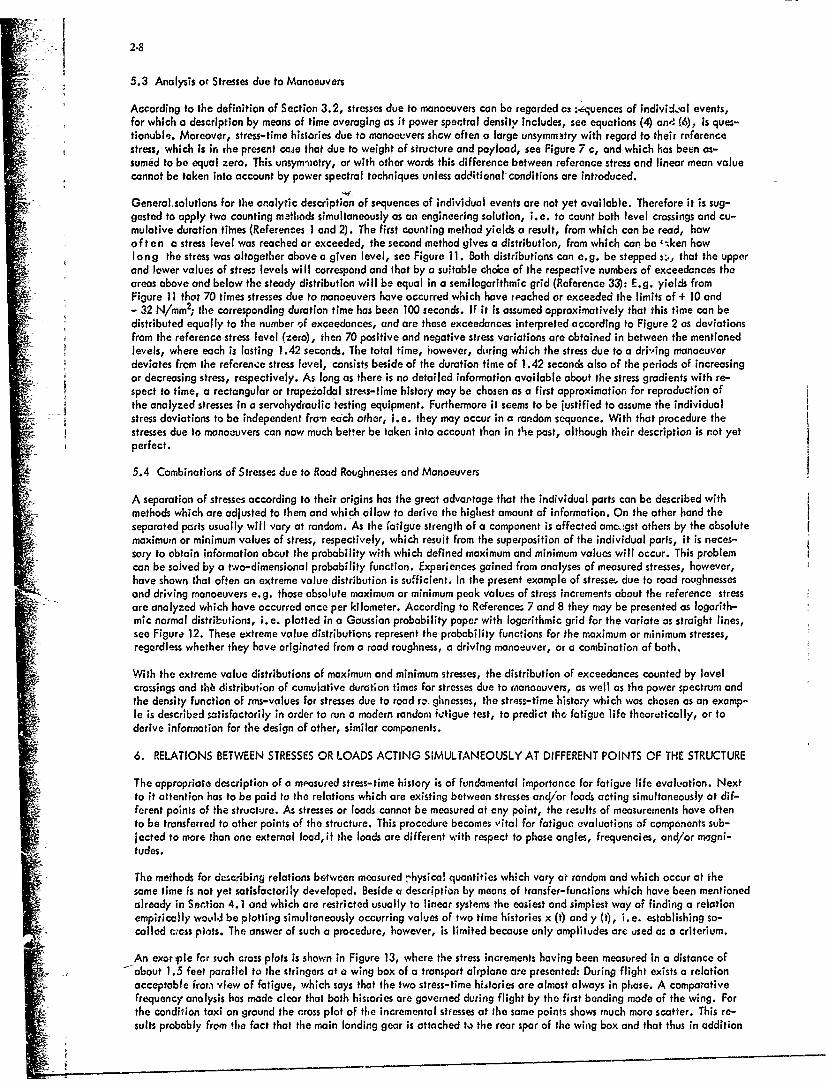
2-8
5.3 Analysis or Stresses due to Manoeuvers
According to the definition of Section 3.2, stresses due to manoeuvers can be regarded cs ---quences of individkLal events,for which a description by means of time averaging as it power spectral density includes, see equations (4) an?( 6), is ques-tionuble. Moreover, stress-time histories due to manoeevers show often a large unsymmstry with regard to their referencestress, which is in the present caje that due to weight of structure and payload, see Figure 7 c, and which has been as-sumed to be equal zero. This unsym-netry, or with other words this difference between reference stress and linear mean valuecannot be taken into account by power spectral techniques unless additional conditions are introduced.
General.solutions for the analytic description of sequences of individual events are not yet available. Therefore it is sug-gested to apply two counting methrods simultaneously as an engineering solution, i.e. to count both level crossings and cu-mulative duration times (References I and 2). The first counting method yields a result, from which can be read, howoften a stress level was reached or exceeded, the second method gives a distribution, from which can be -,ken howl ong the stress was altogether above a given level, see Figure 11. Both distributions can e.g. be stepped st,, that the upperand lower values of stress levels will correspond and Ihat by a suitable cho-e of the respective numbers of exceedances theareas above and below the steady distribution will be equal in a sernilogarithmic grid (Reference 33): E.g. yields fromFigure 11 that 70 times stresses due to manoeuvers have occurred which have reached or exceeded the limits of + 10 and- 32 N/mm2; the corresponding duration time has been 100 seconds. If it is assumed opproximatively that this time can bedistributed equally to the number of exceedances, and are these exceedances interpreted according to Figure 2 as deviationsfrom the reference stress level (zero), then 70 positive and negative stress variations are obtained in between the mentionedlevels, where each is lasting 1.42 seconds. The total time, however, dtiring which the stress due to a dri'ing manoeuverdeviates from the reference stress level, consists beside of the duration time of 1.42 seconds also of the periods of increasingor decreasing stress, respectively. As long as there is no detailed information available about the stress gradients with re-spect to time, a rectangular or trapezoidal stress-time history may be chosen as a first approximation for reproduction ofthe analyzed stresses in a servohydraulic testing equipment. Furthermore it seems to be justified to assume the individualstress deviations to be independent fro-n edob other, i.e. they may occur in a random sequence. With that procedure thestresses due to manocuvers can now much better be taken into account than in tie paost, although their description is rot yetperfect.
5.4 Combinations of Stresses due to Road Roughnesses and Manoeuvers
A separation of stresses according to their origins has the great advarntage that the individual parts can be described withmethods which are adjusted to them and which allow to derive the highest amount of information. On the other hand theseparated parts usually will vary at random. As the fatigue strength of a component is affected amncgst others by the absolutemaximum or minimum values of stress, respectively, which resuit from the superposition of the individual parts, it is neces-sary to obtain information about the probability with which defined maximum and minimum values will occur. This problemcan be solved by a two-dimensional probability function. Experiences gained from analyses of measured stresses, however,have shown that often an extreme value distribution is sufficient. In the present example of stresse. due to road roughnessesand driving manoeuvers e.g. those absolute maximum or minimum peak values of stress increments about the reference stressare analyzed which have occurred once per kilometer. According to References 7 and 8 they may be presented as logarith-mic normal distributions, i.e. plotted in a Gaussian probability paper with logarithmic grid for the variate as straight lines,see Figure 12. These extreme value distributions represent the probability functions for the maximum or minimum stresses,regardless whether they have originated from a road roughness, a driving manoeuver, or a combination of both.
With the extreme value distributions of maximum and minimum stresses, the distribution of exceedances counted by levelcrossings and thb distribution of cumulative duration times for stresses due to ranoeuvers, as well as the power spectrum andthe density function of rms-values for stresses due to road ro. ghnesses, the stress-time history which was chosen as an examp-le is described satisfactorily in order to run a modem random fctigue test, to predict the fatigue life theoretically, or toderive information for the design of other, similar components.
6. RELATIONS BETWEEN STRESSES OR LOADS ACTING SIMULTANEOUSLY AT DIFFERENT POINTS OF THE STRUCTURE
The appropriate description of a measured stress-time history is of fundamental importance for fatigue life evaluation. Nextto it attention has to be paid to the relations which are existing between stresses and/or loads acting simultaneously at dif-ferent points of the structure. As stresses or loads cannot be measured at any point, the results of measurements have oftento be transferred to other points of the structure. This procedure becomes vital for fatigue evaluations of components sub-jected to more than one external load, it the loads are different with respect to phase angles, frequencies, and/or magni-tudes.
The methods for dcscribing relations between measured 'hysical quantities which vary at random and which occur at thesame time is not yet satisfactorily developed. Beside a description by means of transfer-functions which have been mentionedalready in Sec.tion 4. 1 and which are restricted usually to linear systems the easiest and simplest way of finding a relation
empirically would be plotting simultaneously occurring values of two time histories x (t) and y (t), i.e. establishing so-called cr•oss plots. The answer of such a procedure, however, is limited because only amplitudes are used as a criterium.
-An exoriple for such cross plots is shown in Figure 13, where the stress increments having been measured in a distance ofabout 1.5 feet parallel to the stringers at a wing box of a transport airplane are presented: During flight exists a relationacceptable frormr view of fatigue, which says that the two stress-time histories are almost always in phase. A comparativefrequency analysis has made clear that both hisrories are governed during flight by the first bending mode of the wing. Forthe condition taxi on ground the cross plot of the incremental stfesses at the same points shows much more scatter. This re-suIts probably from !he fact that the main landing gear is attached to the rear spar of the wing box and that thus in addition
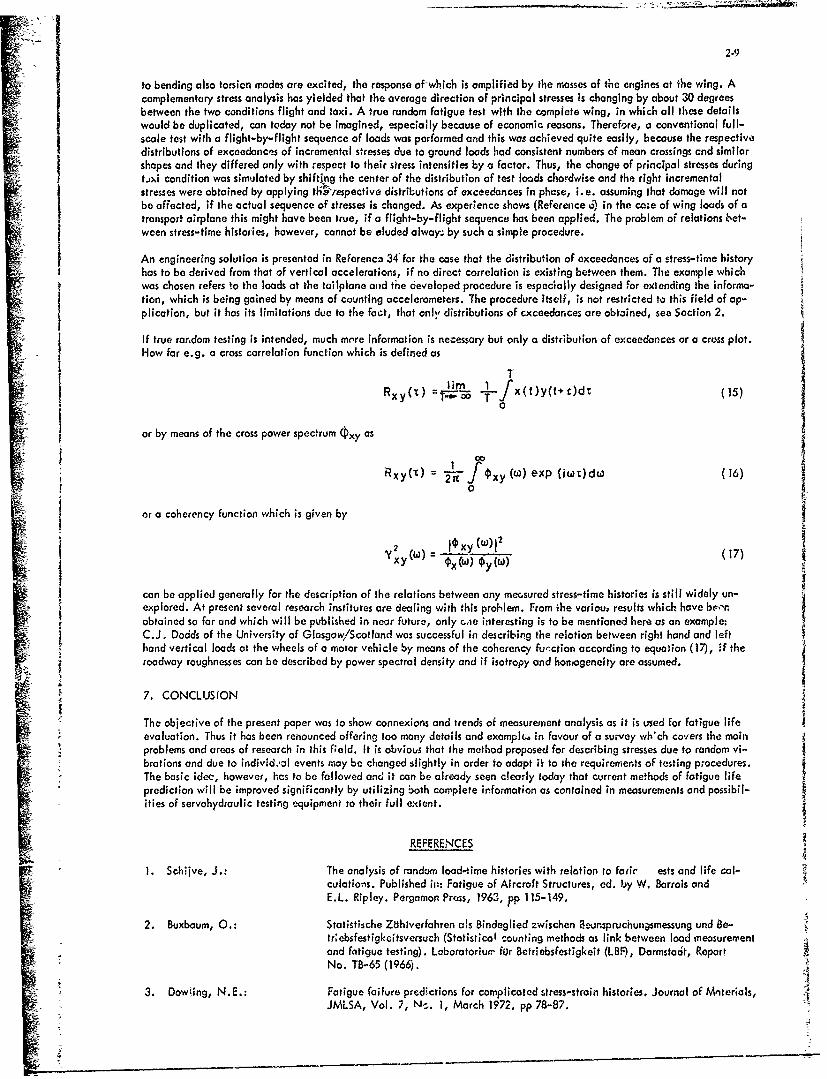
2-9
to bending-also torsion modes are excited, the response of which is amplified by the masses of the engines at the wing. Acomplementary stress analysis has yielded that the average direction of principal stresses is changing by about 30 degreesbetween the two conditions flight and taxi. A true random fatigue test with the complete wing, in which all these detailswould be duplicated, can today not be imagined, especially because of economic reasons. Therefore, a conventional full-scale test with a flight-by-flight sequence of loads was performed and this was achieved quite easily, because the respectivedistributions of exceedances of incremental stresses due to ground loads had consistent numbers of mean crossings and similarshapes and they differed only with respect to their stress intensities by a factor, Thus, the change of principal stresses duringt.ixi condition was simulated by shifting the center of the distribution of test foods chordwise and the right incrementalstresses were obtained by applying thv respective distributions of exceedonces in phase, i.e. assuming that damage will notbe affected, if the actual sequence of stresses is changed. As experience shows (Reference 6) in the case of wing loads of atransport airplane this might have been true, if a flight-by-flight sequence has been applied. The problem of relations bet-ween stress-time histories, however, cannot be eluded alway; by such a simple procedure.
An engineering solution is presented in Reference 34 for the case that the distribution of exceedances of a stress-time historyhas to be derived from that of vertical accelerations, if no direct correlation is existing between them. The example whichwas chosen refers to the loads at the tailplane and the developed procedure is especially designed for extending the informa-tion, which is being gained by means of counting accelerometers. The procedure itself, is not restricted to this field of ap-plication, but it has its limitations due to the fact, that only distributions of cxceedarces are obtained, see Section 2.
If true random testing is intended, much mo're information is necessary but only a distribution of exceedances or a cross plot.How far e.g. a cross correlation function which is defined as
Rxy(x) x(ty(t+T)dT (15)
or by means of the cross power spectrum (-Oxy as
co
0
or a coherency function which is given by
'xy(W ox () oA W) 17
can be applied generally for the description of the relations between any memsured stress-time histories is still widely un-explored. At present several research institutes are dealing with this problem. From ihe variou, results which have be,-nobtained so far and which will be published in near future, only c..ie interesting is to be mentioned here as an example:C.J. Dodds of the University of Glasgow/Scotland was successful in describing the relation between right hand and lefthand vertical loads at the wheels of a motor vehicle by means of the coherency function according to equation (17), if theroadway roughnesses can be described by power spectral density and if isotropy and honrogeneity are assumed.
7. CONCLUSION
The objective of the present paper was to show connexions and trends of measurement analysis as it is used for fatigue life 4evaluation. Thus it has been renounced offering too many details and exampl(. in favour of a survey wh'ch covers the mainS~problems and areas of research in this field. it is obvious that the method proposed for describing stresses due to random vi-
brations and due to individ.pal events may be changed slighty in order to adapt it to the requirements of testing procedures.The basic idec, however, has to be followed and it can be already seen clearly today that current methods of fatigue lifeprediction will be improved significantly by utilizing both complete information as contained in measurements and possibil-ities of servohydraulic testing equipment to their full extent.
REFERENCES
1. Schiive, J.: The analysis of random load-time histories with relation to fadic ests and life cal-culations. Published in: Fatigue of Aircraft Structures, ed. by W. Barrois andE.L. Ripley. Pergamon Press, 1963, pp 115-149.
2. Buxbaum, 0.: Statistische Zbhiverfahren als Bindeglied zwischen Zfeunspruchungsmessung und Be-tr*ebsfestigkeitsversuch (Statistical counting methods as link between load measurementand fatigue testing). Laborotoriun' for Betriebsfestigkeit (LBF), Darmstadt, ReportNo. TB-65 (1966).
3. Dowling, N.E.: Fatigue failure predictions for complicated stress-strain histories. Journal of Mriterials,JMLSA, Vol. 7, Ms,. 1, March 1972, pp 78-87.
2-10
4. Von Dijk, G.M.. Statistical-load ata processing. Published in: Advancea approaches to fatigue eva-luation. NASA Special Publication 309, 1972, pp 71-87.
5. Sherott, F., Extracting farigve testing and desigr. data from service 1Voding records. Paper pre-Fisher, B.C.: sented at the Conference of the Joint British Commi~te for Stress Analysis, held in
Landon on April 15-7, 1972.
6. Schijve, J.: The accumulation of fatigue dairage in aircraft mat ,rials and structures. AC-ARDogrophNo. 157, January 1972.
7. Buxbaum, 0.: Bestimmung von Bemessungslfasten schwingbruchgefuhrdleter Bauteile ous Extremwertenvon Hdufigkeitsverteilungen (Determination of maxim.um loads of fatigue crolicul corrpo-nents by means of extreme values taken from measured distributions of exceedances).Loborotorium fort Betriebsfestigkeit, Darmstadt, Report No. FB-75 (1967).
8. Buxbaum, 0.: Extreme value analysi! and its application to c.g. verticri acc-derotioris me~asured attransport airplar-es or type C- 130. AGARD Report No. 579 (1971).
9. Gassnor, E., Ertrogbare Spannungen und Lebensdauer einer Schweil3%erbindung aus Stahl St 37 beiGrIese, F. W., verschiedenen Formen des Beanspruchungskollektivs (Endurable stresses ond fatig-je lifeHaiboch, of a welded joint from steel St 37 under different d,-tribut~ons of voxceedances). Arciiiv
fur dos FPsenhuttenwesen, Vol. 335 (1964), Heft 3, pp 255-267.
10. Bendot, J.S. , Measurement and analysis of random dlata. Wiley anu Sons, New York, 1966.Piersol, A.G.:
11. Rice,. 5.0.: Mo.'hematical analysis of random noise. Bell Systems Technical Journal, Voils. 23 and24, t?45. 'leprinted in: Selected papers on noise and i~ochastic proceses, ed. byN. Wax, Dover Publications, New York, 1954, pp 133-294.
12. Buxbaum, 0., Zur Beschreihung von Betriebsbeanspruchungen mit Hilfe 4totisrischer Keningr~sfen (De-Svenson, 0.: scriptior. of operational stress-time histories by means of statistical parc-neters). T' be
published in Automobill-Technische Zeits.ckrift (ATZ), 1973.
13. Gassner, E.: Ziele einer prcxisorientierten Schwingfestigkeitsiorschung (Goals of fadigue strengthresearch oriented to practical application). Schrietonreihe der 1-raunhofer-Gesel lschaft,Munchen, Heft 5, 1968.
14. Thomasset, G.: Suppression des effets du pilotage lors de Ponalyse des accelerations induit par iaturbulence. ONERA, Chatillon, Repcrt T.P. No. 603 (1969).
15. Press, H., A re-evaluation of datc: on atmospheric turb~ulence ana airplane gust load~s far appli-Meadows, M.T., cation in spectral calculations. NACA Report 11272 (1956).Hadlack, J.:
16. Sj~Sstrdtm, S.;, On randum load analysis. Tf...s. Roy. In-.t. Tachn., Stockholm, Sweden, Nr. 18.(1961).
17. Svenson, 0.: Messen an schwingbeanspruchten Cauteilen unter Betriobsbedingungen (Measuring fatigueloadings of components under operational condidionz). VDI-Berichte Nr. 113 i1967),pp 47-52,
18. 8endat, J.S.: Principles and applirations of random noise theory. Wiley and Son., New (ark, 1958.
19. Blackman, R. B., The measurement of power spectra. Dover Publications, I,-ew York, 1958.Tukey, i.W.:
20. Houbolt, J.C., Dynamic response of airplane toaotnyospheric turbulence including flight data inputSteiner, R., and response. NASA TR 199, 1964.
21. iloubolt, J.C.: The art of determining gust frequency response functions. Poper presented at the 31st4 ~Structu.res and Materials Panel Meeting of AGARD, Tonsberg.Norwoy, November 1970.
22. Coupry, G, - Critical analysis of the methods used for predicting the response of large flexible air-craft to continuous atmospheric lurbulenco. Paper presented at the 12th Structures,Structural Dynamics anid Materials Conference, Anaheim, Calif. , April1 19-21, 1971.
$ AIMA Paper No. 71-342.
23. Mitschke, M.: Be;.rag zur Untersuchung der Fohrzeugschwingungen (Contribution to the investigationof vehicle vibration~s), Deutsche Kiriftfuhrtforschung und St'a~enverkehrstachnik,Heft 157, 1962.
24. Fiala, E., Untersuchungen an dern linearisierten Schwingungsmodell eines Strat~enfohrzeugesChenchenno, P.: (investigations about the lineatized model of a motor vehicle). Auiomobihlechnische
Zeitschrift (ATZ) 69, 1967, pp 23D-235.
25. Theisen, J.G.: Methods for analyzing flight vjehicles during the tax; condition. ASO Technical Report61-177, January 1962.
26. Buxbaurrp, 0.: Beschreibung einer Im Fahrbetrieb gemessenen Beanspruchungs-Zeit-Funktion mit H-ilfeder spektrcilen Letstungsschichte (Analysis of a stress-time history measured under opera-tional conditions by means of power spectral density). Laboratorium fUr Betriebsfestig.-kelt, Darmstadt, Report No. TB-102 (1972).
27. joeckel, H.R., Random load spectrum tests to determine durabilIity of -tructuralI components of auto-.Swanson, .SR.: motive vehicles. SAE Journal, Vol. 7, November 1969.
28. Laudert, H., Einige Mbgl~chkeiteri der ErmUdungsprofung bei Random- Beanspru chungen (Some possi-Jacoby, G., bilities of fatigue testing uinder random stresses). Fcrtschrittberichre VDI, Peihe 5,Nowack, H., No. 7, April1 1969, pp 2 9 -6 3 .Weber, H.D.:
29. Braun, H.: Unter-suchungen von Fahrbahnunebenheiten und Anwendungen der Ergebnisse (Investiga-tior- of roadway roughiesses and applications of results).- Thesis, Technisehe Un~lversitatBraunschweig, Germany, 1969.
30. Wignot, i.E. The development of dynamic taxi design procedures. Federal Aviation Administroaion,et alii: Washington, D.C., Report -No. DS-68-.11, June 1,968.
31. Hoblit, F. M. Development of a power-spectral gus? design pi~oredure for civil aircraft. Federal Avia-et alii: tion Administration, Washington, D.C., Repqrt No. ADS-53, January 1966.
32. Peckham, C.G.: A surnmary of atmospheric turbulence recorded by NATO aircraft. AGARD ReportNo. 586, Septemnber 19'ý1.
33. Gcussner, E.- Betidebsfestigkeit - Eine Serne-sungsgrund lag e fUr Konstrukt~onsteiie mit statistisch wech-seinden Betriebsbc-anspruchungen (Betrieb-sfestigkeit - A basic procedure for dimensioningstructural componorts subjected to ope.'ational stresses alteaot~ng at random). Kcaistruk-tion 6(1954) , No. 3, pp 97-104.
34. Buxbourn, 0.: A relation belween measured c.q. vertical accelerctions and tf~e loads at the T-tailof o rnilitarl airplane. AGARDt Report No. 597, Se~ptember 1972.
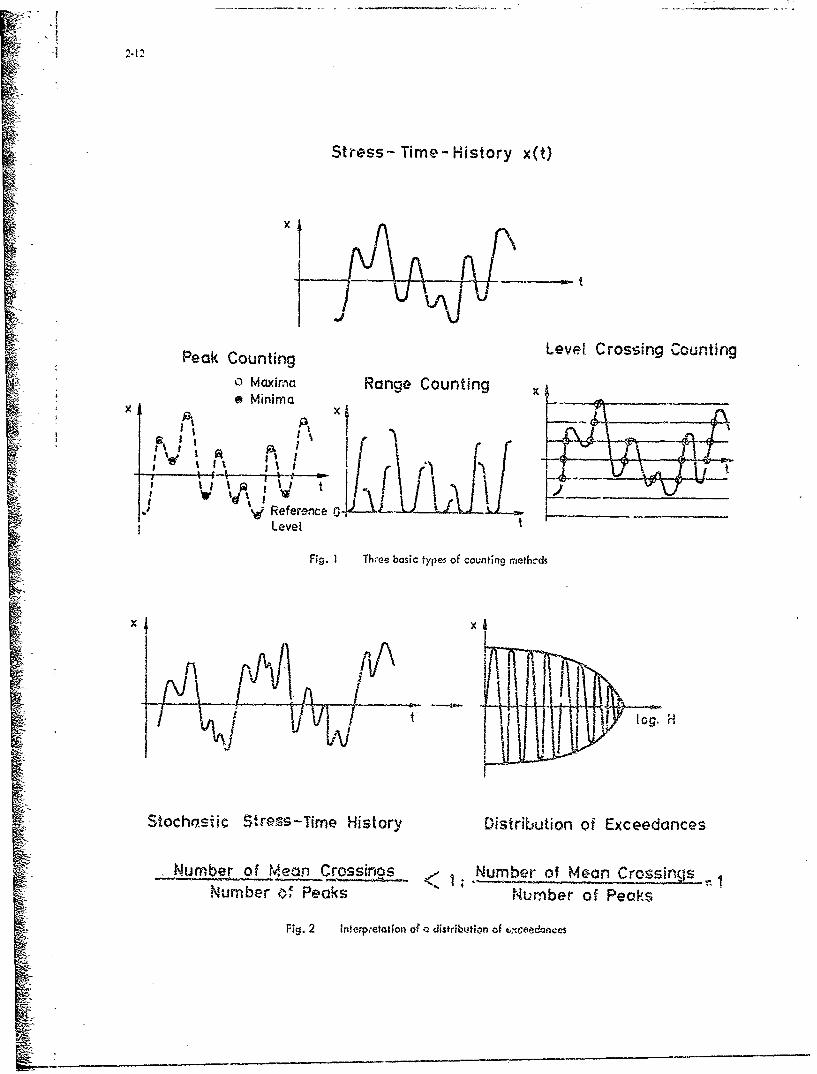
2.1
Stress- Time- History x(t)
X[1
Peak Counting Level Crossing Counting
0 Maximca Range Counting xs Minima
I' x- ii I
J •,•Reference - -L
Level' e Fig. I Three basic types of counting n.etbcds
x x j
lg H
Stocho.-iic Stress-Time History Distribution of Exceedances
SNumber of Meain Crossinosr< 1Number of Mean Cross2
Number of, Peaks Number of Peaks
Fig. 2 Interpretation of c distribution of c~eedances
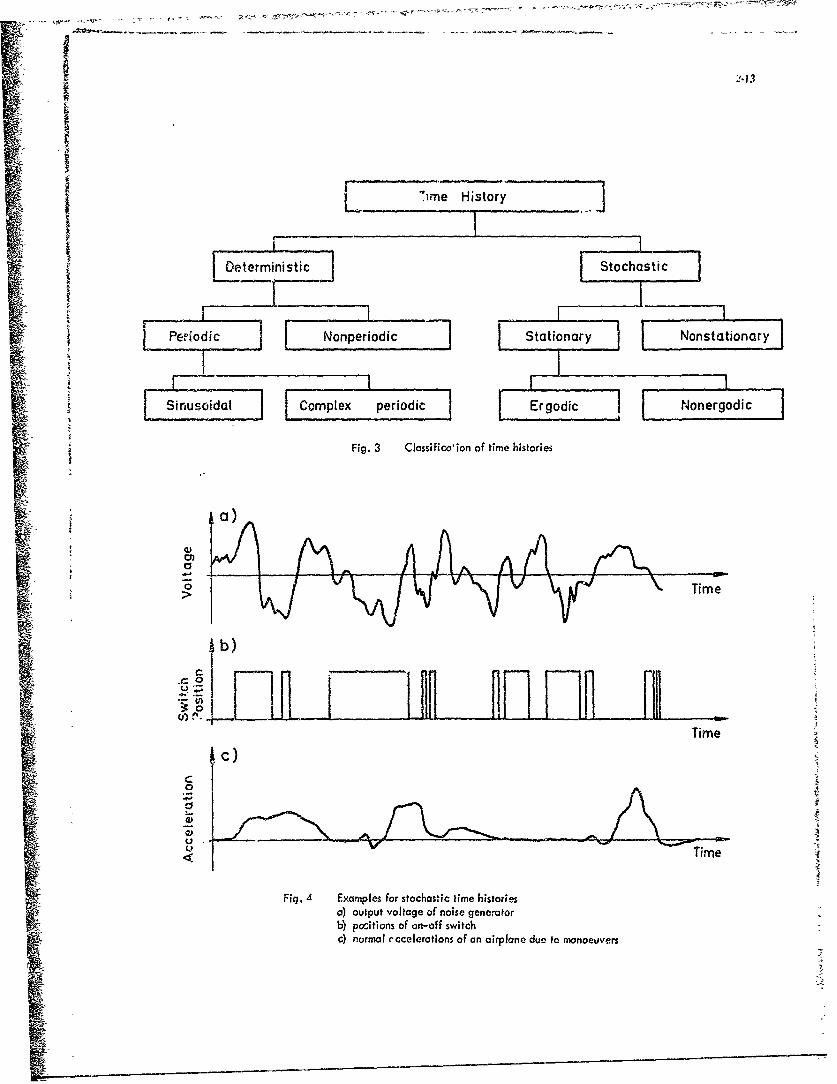
i me History
•. [ teteministic J[ °h•tic
Peiodic Nonperiodic Stationary i Notion aryi
Si flusia Complex periodic Ergodic Nonergadic
Fig. 3 Classifico'ion of time histories
a)
) -)
> kj jrwTime
dV
C)
U .... II
a tnTime
Fig. A Examples for stochastic time historiesa) output voltage of noise generatorb) poitions of on-off switchc) normal -ccelerations of an airplane due to mrnoeuvers
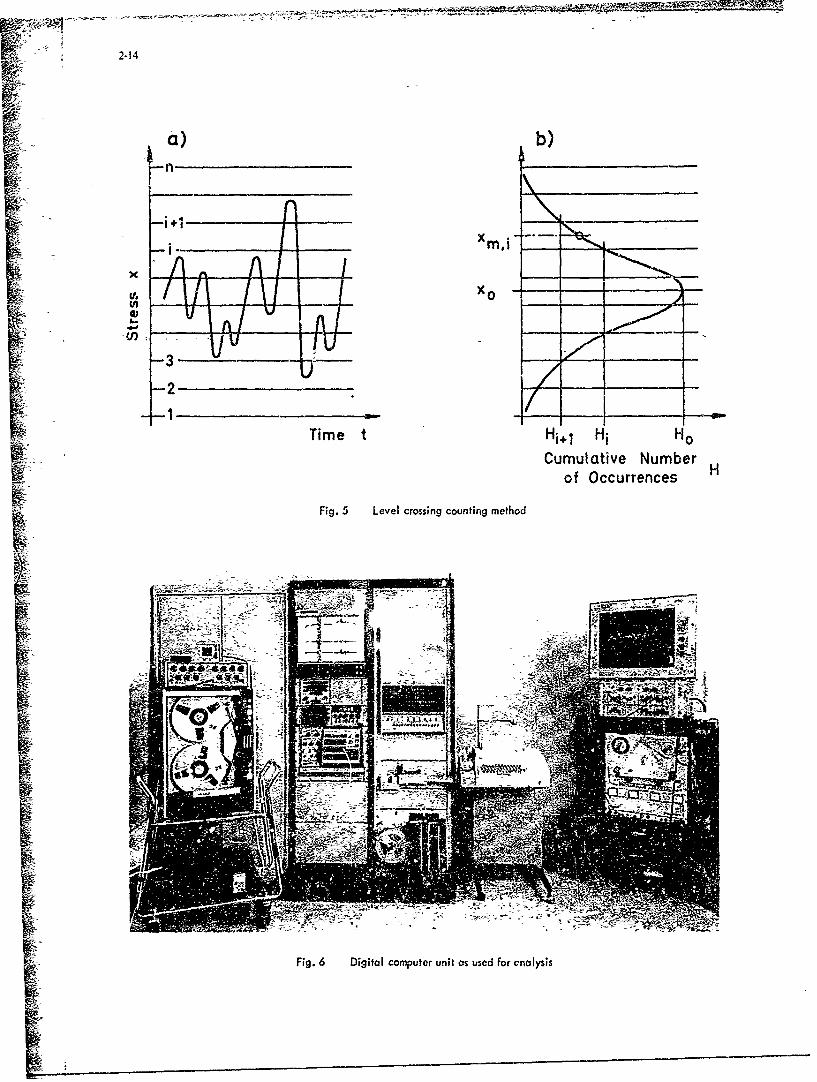
2-14
xA
U)4,
A A
-3 -2
Time t H~ iHCumulative NumberH
of Occurrences H
Fig. 5 Level crossing counting method
Fig. 6 Digital computer unit as used for cnalysis
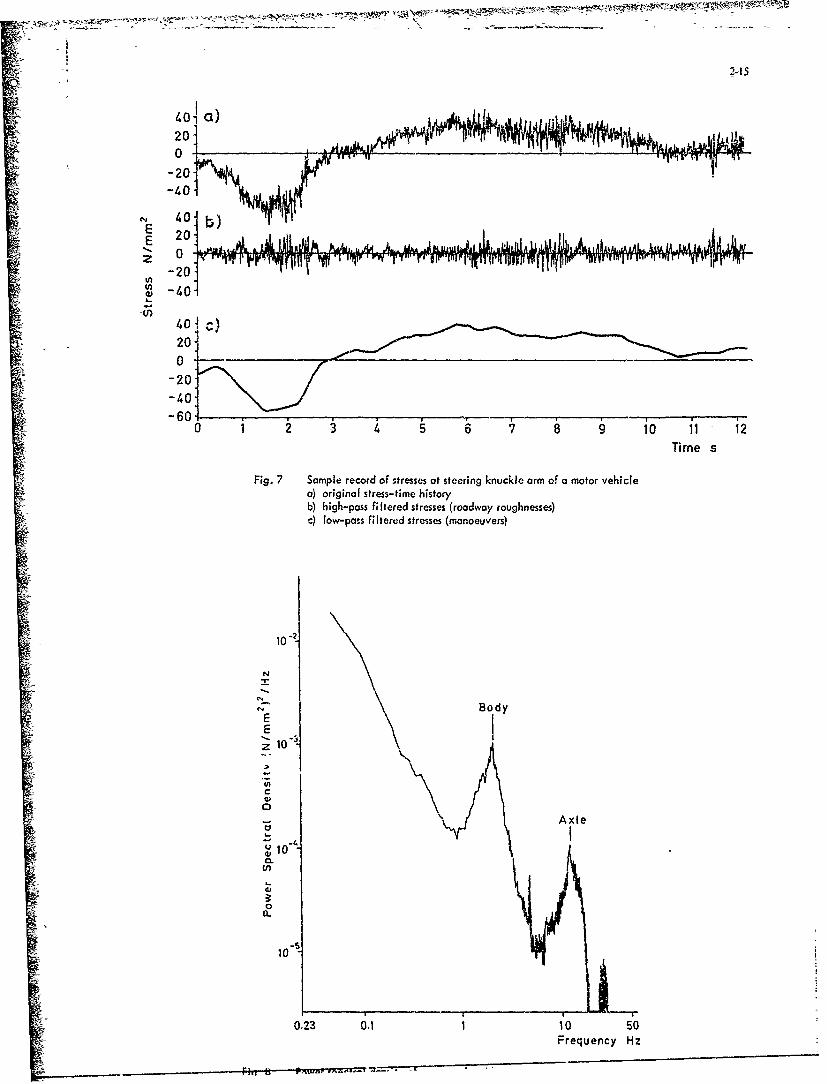
20ý
-20:-40
S 20-
-20-
~ 40
-20-/0-60-
60 0 1 ' 6 7 8 9 10 i 1 2Time s
Fig. 7 Sample record of stresses at steering knuckle arm of a motor vehiclea) original stress-time historyb) high-pass filtered stresses (roadway roughnesses)c) low-pass filtered stresses (monoeuvers)
Body
0
_6 Axle
~ 0
a_
0.23 0.1 1 500sFrequency Hz
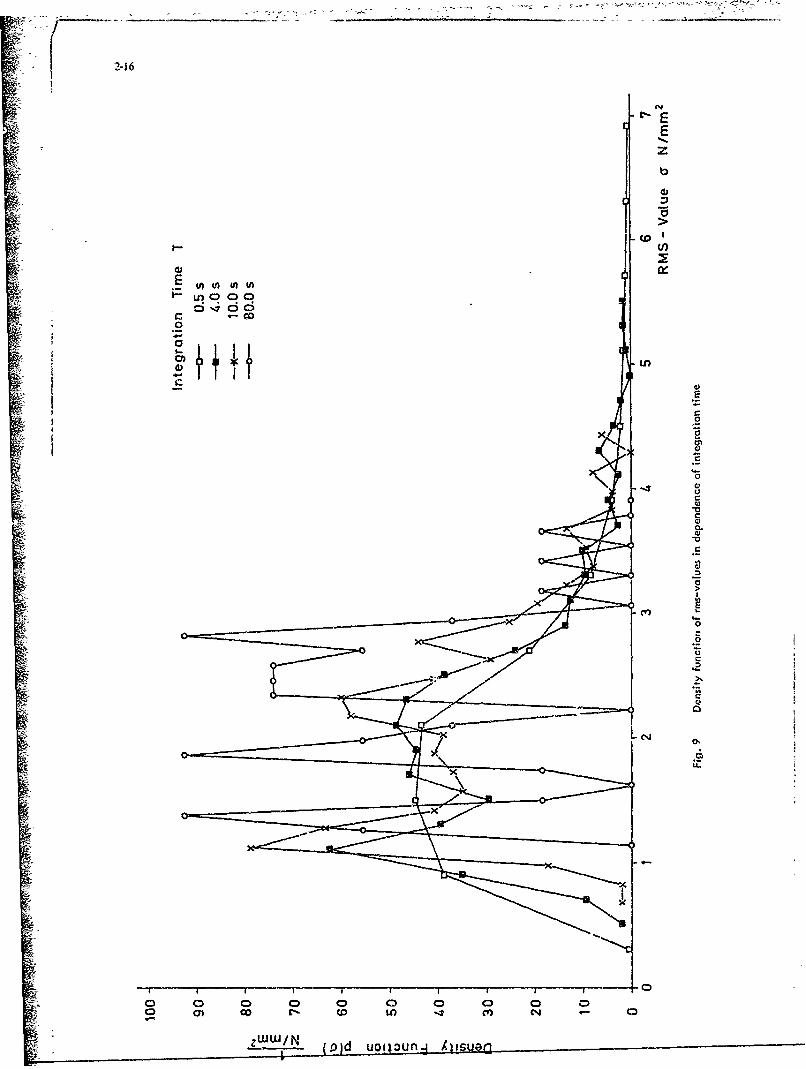
2-16
C4
E
(D1
.2
cl
CL
02
CD 0 ) D0 Dc) n 4 c 1
DidTTITou
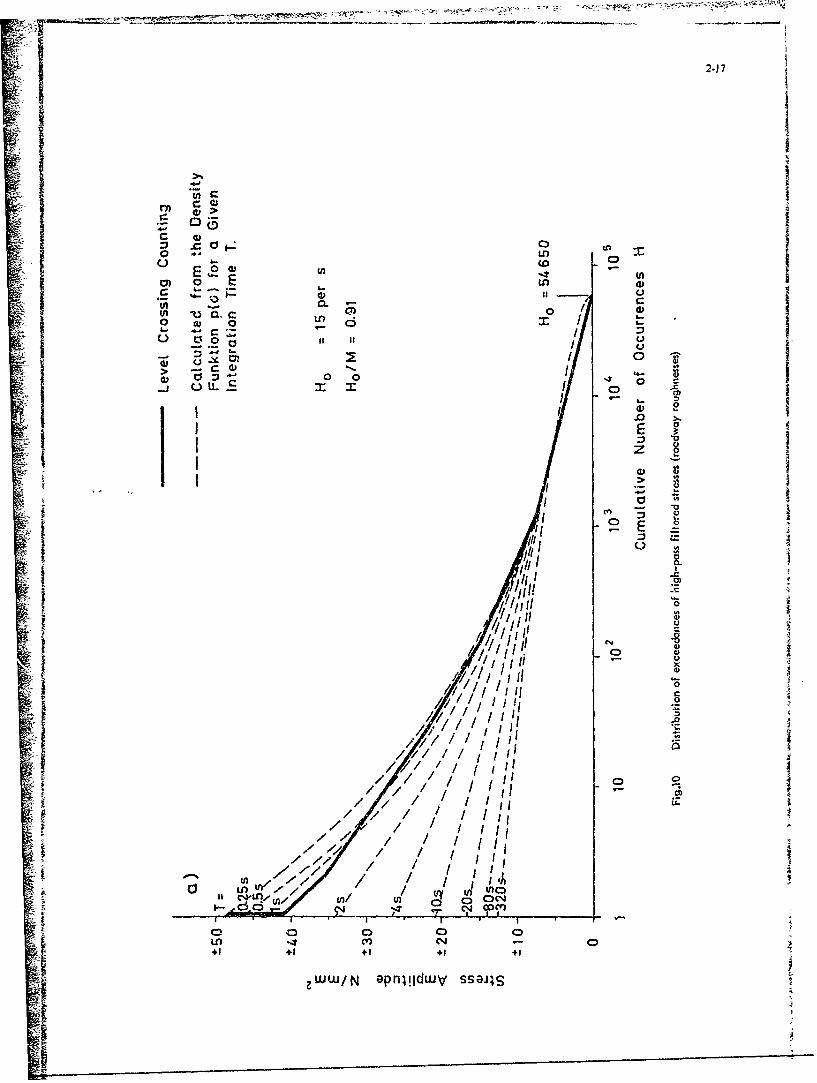
2-)7
Lj CD
B CO
0 0>I i
0 CL)
0C 0 CU
-l 0 -0C-) uLc C ~ 0
-~-0
E
7,5
S S2I I~4II'C-
Lf) -4 C*+1+1+
zww/N apnlldwV sail
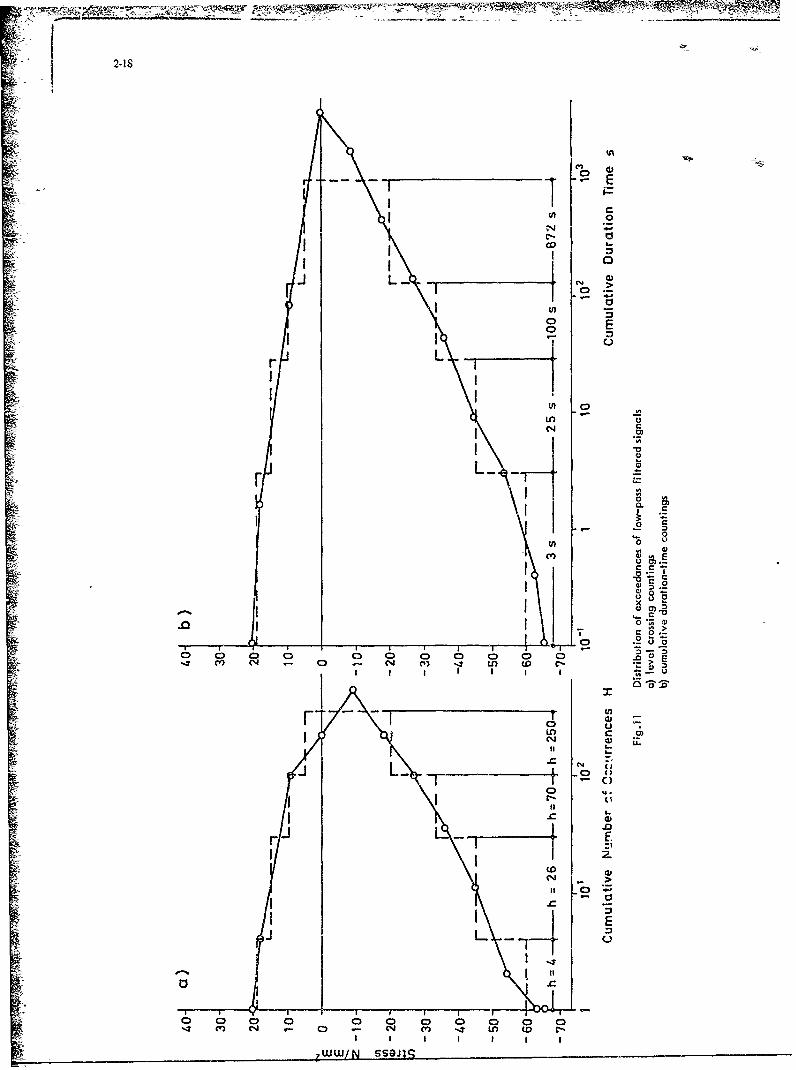
I 0
C)
0
00
m~~U 040 L)E
tn
CVC
I XI
co 4)("I 0.0
0 ~ ~~~ 0 0).-. a a14I .- l N V I ' o r
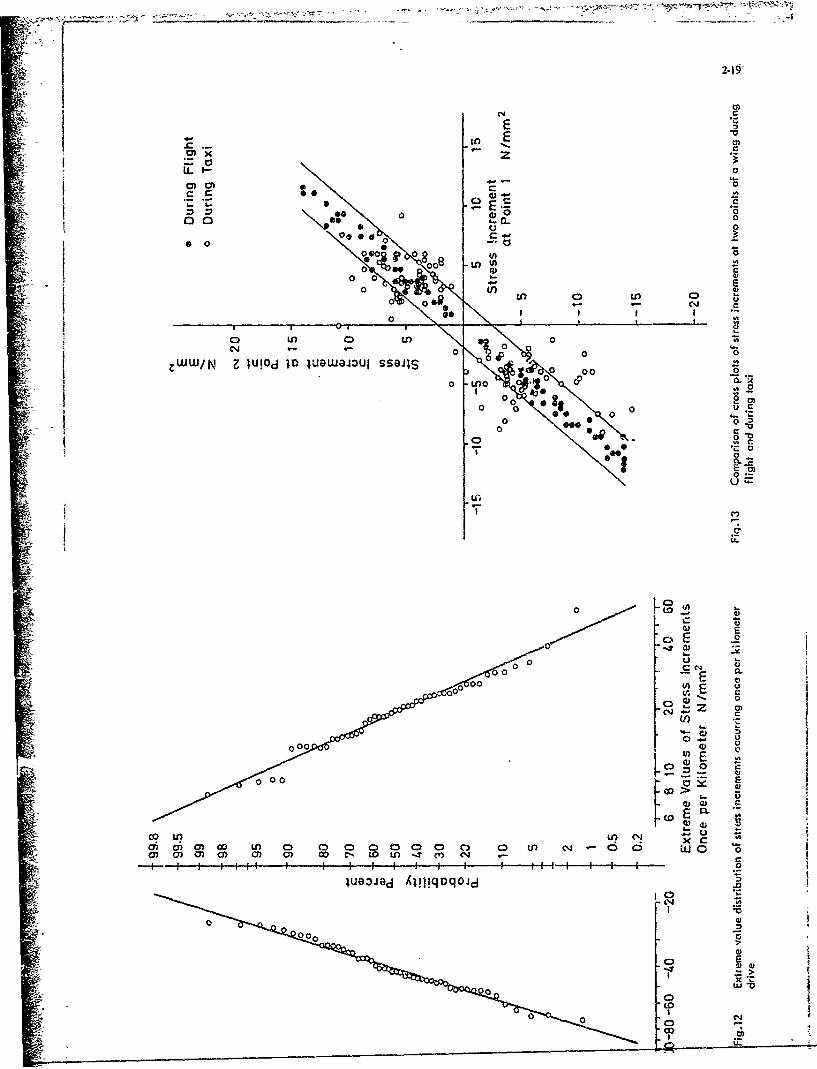
W x
00
00 0 0
00 0.0000 of 00
0 'n
0 -n
00
C*4 00 0 E 0
o" o0~ 00
00 0 0
000
L n 0
00
CCD00
00
00
00 0
(00CD z
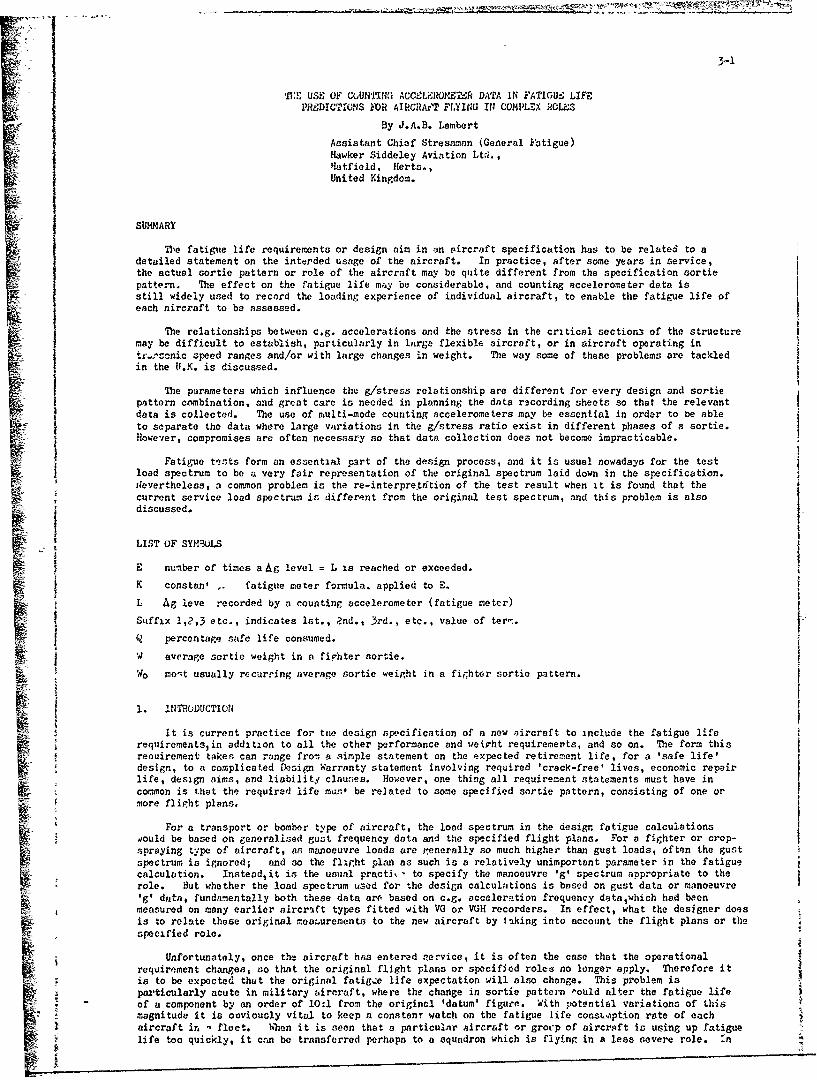
5-1
Vie, USE OF COUTIVI', ACCIF.I•ROM•E• DATA IN FATIGU,; LIFEPRMDICTIUNS FOR AIRCRAr-T FLYINCG IN COMPLEX RCLkS
By J.A.B. Lambert
Assistant Chief Stressman (General Fatigue)Hawker Siddeley Aviation Lt!.,Hatfield, Harta.,
United Kingdom.
SUMMARY
The fatigue life requirements or design aim in an Pircraft specification has to be related to adetailed statement on the interded usage of the aircraft. In practice, after some years in service,the actual sortie pattern or role of the aircraft may be quite different from the specification sortiepattern. The effect on the fatigue life may be considerable, and counting accelerometer data isstill widely used to record the loading experience of individual aircraft, to enable the fatigue life ofeach aircraft to be assessed.
The relationships between e.g. accelerations and the stress in the critical section3 of the structuremay be difficult to establish, particularly in large flexible aircraft, or in aircraft operating intr_.'sonic speed ranges and/or with large changes in weight. The way some of these problems are tackledin the U.K. is discussed.
ie parameters which influence the g/stress relationship are different for every design and sortie
pattern combination, and great care is needed in planning the data recording sheets so that the relevantdata is collected. The use of multi-mode counting accelerometers may be essential in order to be able
to separate the data where large variations in the g/stress ratio exist in different phases of a sortie.However, compromises are often necessary so that data collection does not become impracticable.
Fatigue tests form an essential part of the design process, and it is usual nowadays for the test
load spectrum to be a very fair representation of the original spectrum laid down in the specification.ilevertheless, a common problem is the re-interpreptftion of the test result when it is found that thecurrent service load spectrum is different from the original test spectrum, and this problem is alsodiscussed.
LIST OF SYMUOLS
E nueber of times a Ag level = L is reached or exceeded.
K constan' fatigue meter formula, applied to E.
L Ag !eve recorded by a counting accelerometer (fatigue meter)
Suffix 1,2,3 etc., indicates 1st., 2nd., 3rd., etc., value of ter,-.Q percentage safe life consumed.
XF " average sortie weight in a fiphter sortie.
'Wo mo-t usually recurring average sortie weight in a fighter sortie pattern.
i i. JTMUDUCTiON•
i. t is current practice for tne design specification of a new aircraft to include the fatigue life
requirements~in addition to all the other performance and weieght requirements, and so on. The form thisreouirement takes can range froe, a simple statement on the expected retirement life, for a 'safe life'design, to a complicated Desi=i Warranty statement involving required 'crack-free' lives, economic repairlife, design aims, and liability clauses. However, one thing all requirement statements must have incommon is that the required life muse be related to some specified sortie pattern, consisting of one ori_ • more flight plans,
For a transport or bomber type of aircraft, the load spectrum in the design fatigue calculationsdould be based on generalised gust frequency data and the specified flight plans. For a fighter or crop-spraying type of aircraft, as, manoeuvre loads are i-enerally so much higher than gust loads, often the gust
is ignored; and so the flirht plani as such is a relatively unimportant parameter in the fatiguecalculation. Insteadit is the usual practj," to specify the manoeuvre 'g' spectrum appropriate to therole. But whether the load spectrum uzed for the design calculations is based on gust data or manoeuvre
g' ditta, fundamentally both these data arp based on e.g, acceleration frequency datawhich had beenmeasured on many earlier aircraft types fitted with VG or VGH recorders. In effect, what the designer doesis to relate these original meozurements to the new aircraft by taking into account the flight plans or thespecified role.
Unfortunately, once the aircraft has entered rzervice, it is often the case that the operationalrequirement changes, so that the original flight plans or specified roles no longer apply. Therefore itis to be expected that the original fatig.:e life expectation will also change. This problem isparticularly acute in military aircraft, where the change in sortie pattern rould alter the fatigue life
"- of a component by an order of 10:1 from the original 'datum' figure. With potential variations of thismagnitude it is ooviously vital to keep a constant watch on the fatigue life consr..ption rate of eachaircraft in - fleet. 'When it is aeen that a particular aircraft or grovp of aircraft is using up fatiguelife too quickly, it can be transferred perhaps to a squadron which is flying in a less severe role. -n
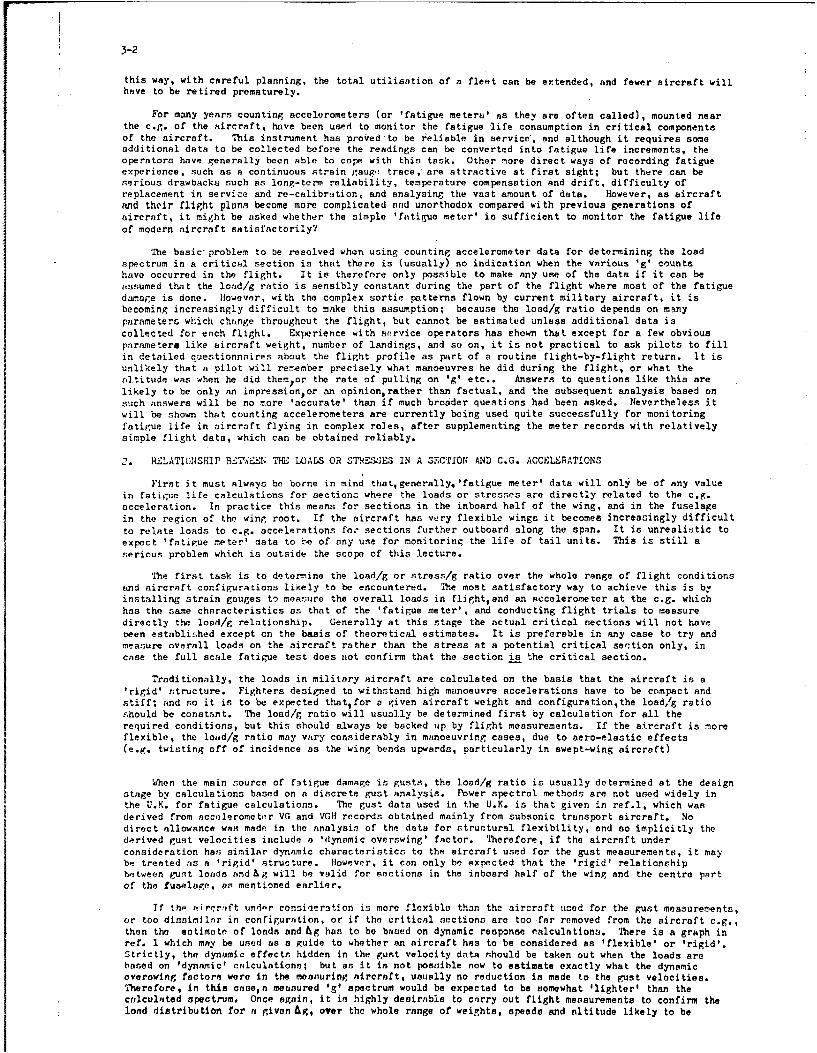
3-2
this way, with careful planning, the total utilisation of a fleet can be extended, and fewer aircraft willhave to be retired prematurely.
For many years counting accelerometers (or 'fatigue meters' as they are often called), mounted nearthe c.r. of the aircraft, have been used to monitor the fatigue life consumption in critical componentsof the aircraft. This instrument has proved to be reliable in service, and although it requires someadditional data to be collected before the readings can be converted into fatigue life increments, theoperators have generally been able to cope with this task. Other more direct ways of recording fatigueexperience, such as a continuous strain gaug.. trace, are attractive at first sight; but there can beserious drawbacks such as long-term reliability, temperature compensation and drift, difficulty ofreplacement in service and re-calibration, and analysing the vast amount of data. However, as aircraftand their flight plans become more complicated and unorthodox compared with previous generations ofaircraft, it might be asked whether the simple 'fatigue meter' is sufficient to monitor the fatigue lifeof modern aircraft satisfactorily?
The basic problem to be resolved when using counting accelerometer data for determining the loadspectrum in a critical section is that there is (usually) no indication when the various 'g' countshave occurred in the flight. It is therefore only possible to make any use of the data if it can beassumed that the load/g ratio is sensibly constant during the part of the flight where most of the fatiguedamage is done. However, with the complex sortie patterns flown by current military aircraft, it isbecoming increasingly difficult to make this assumption; because the load/g ratio depends on manyparameters which change throughout the flight, but cannot be estimated unless additional data iscollected for each flight. Experience with sorvice operators has shown that except for a few obviousparameters like aircraft weight, number of landings, and so on, it is not practical to ask pilots to fillin detailed questionnaires about the flight profile as part of a routine flight-by-flight return. It isunlikely that a pilot will remember precisely what manoeuvres he did during the flight, or what thealtitude was when he did themor the rate of pulling on 'g' etc.. Answers to questions like this are
lkh will be no ore ' tccurate' thnf muchinbronde questioshdbenakd..vrheesilikely to be only an impressionor an opinion, rather than factual, and the subsequent analysis based onsuch answers will be no more 'accurate' than if much broader questions had been asked. Nevertheless it
will be shown that counting accelerometers are currently being used quite successfully for monitoringfatigue life in aircraft flying in complex roles, after supplementing the meter records with relativelysimple flight data, which can be obtained reliably.
2. RELATIUNSHIP B THiEN W LOADS OR ST4-S'IES IN A SECTION AND C.G. ACCELSRATIONS
First it must always be borne in mind that,generally,'fatigue meter' data will only be of any valuein fatigue life calculations for sectiono where the loads or stresses are directly related to the c.g.acceleration. In practice this means for sections in the inboard half of the wing, and in the fuselagein the region of the wing root. If the aircraft has very flexible wings it becomes increasingly difficultto relate loads to e.g. accelerations for sections further outboard olong the span. It is unrealistic toexpect 'fatigue meter' data to be of tny use for monitoring the life of tail units. This is still aserious problem which is outside the scope of this lecture.
I he first task is to determine the load/g or stress/g ratio over the whole range of flight conditionsand aircraft configurations likely to be encountered. The most satisfactory way to achieve this is byinstalling strain gauges tm mearsure the overall loads in flirhttand an accelerometer at the c.g. whichhas the same characteristics as that of the 'fatigue meter', and conducting flight trials to measuredirectly the load/g relationship. Generally at this stage the actual critical sections will not havebeen established except on the basis of theoretical estimates. It is preferable in any case to try andmeasure overall loads on the aircraft rather than the stress at a potential critical section only, incase the full scale fatigue test does not confirm that the section is the critical section.
Traditionally, the loads in military aircraft are calculated on the basis that the aircraft is a'rigid' structure. Fighters designed to withstand high manoeuvre accelerations have to be compact andstiff; and so it is to be expected thatfor a given aircraft weight and configuration,the loadg ratioshould be constant. The load/g ratio will usually be determined first by calculation for all therequired conditions, but this should always be backed up by flight measurements. If the aircraft is moreflexible, the loaod/g ratio may vary considerably in manoeuvring cases, due to aero-elastic effects(e.g. twisting off of incidence as the wing bends upwards, particularly in swept-wing aircraft)
When the main source of fntigue damage is gusts, the load/g ratio is usually determined at the designstage by calculations based on a discrete gust analysis. Power spectral methods are not used widely inthe U.K. for fatigue calculations. The gust data used in the U.K. is that given in ref.l, which wasderived from accelerometer VG and VGH records obtained mainly from subsonic transport aircraft. Nodirect allowance was made in the analysis of the data for structural flexibility, end so implicitly thederived gust velocities include a 'dynamic overswing' factor. Therefore, if the aircraft underconsideration has similar dynamic characteristics to the aircraft used for the gust measurements, it msaybe treated as a 'rigid' structure. However, it can only be expected that the 'rigid' relationshipbetween gunt loads and &g will be valid for sections in the inboard half of the wing and the centre partof the fuselage, as mentioned earlier.
If th- aircraft und-r consiqerntion is more flexible than the aircraft u.od for the gust measurements,or too dinnimilar in configuration, or if the critical sections are too far removed from the aircraft c.g.,then the eotimate of loads and fg has to be based on dynamic response calculations. T'here is a graph inref. 1 which may be used as a guide to whether an aircraft has to be considered as 'flexible' or 'rigid'.Strictly, the dynamic effects hidden in the gust velocity data should be taken out when the loads arebased on 'dynamic' calculations; but as it is not possible now to estimate exactly what the dynamicoverawing factors were in the measuring aircraft, usually no reduction in made to the gust velocities.'Therefore, in this canaen measured 'g' spectrum would be expected to be somewhat 'lighter' than thecolculated spectrum. Once again, it in highly desirable to carry out flight measurements to confirm thelond distribution for a given Ag, over the whole range of weights, speeds and altitude likely to be
3-3
encountered. Thif d often not an easy matter, because it is not always possible to find enoughturbulence at all altitudes during the test flying to provide a worthwhile record trace. The Flight Testdepartment must therefore be persuaded to persevere in their efforts to provide samples from the wholeflight envelope.
The usual nrocedure for analysing the flight measurement data is to derive A(stress) frequencycurves for each strain gauge 1-sition and the Ag frequency curve from the same period of recording time.The- period should be as lcng as possible provided the aircraft condition remains approximately constantduring the period. Usually though, the period is limited by the capacity of oither the recordingequipment and/or the data reduction facilities. Then by dividingtl(stress) st a given frequency byAgI at the same frequency, a number of stress/g ratios aid obtained, over , :.ngu of fiequencies (see Fig.1)Ideally the stress/g ratio for each strain gauge position should be constant for all frequencisa; but afair amount of experimental scatter can be expected. Therefore, an 'average' value is drawn througheach set of points, which may have to be slightly 'adjusted' when the final overall stress or loaddistribution is being drawn out. It is usual at this stage to convert the stress pattern into overallloads/g, unleas the strain gauges have been applied to known critical sections; the strain gaugeshaving been calibrated previously by applying a known load distributioa to the .omponent.
If the stress/g (or load/g) ratio is obviouuly nat conn+ant over the ranga of frequencies needed,evenafte.- making allowance for scatter, it wilL probably be found that the L(stress) 0 and g = 0frequencies are significantly different. If this 'zero crossing' frequency ratio is taken into accountwhen calculating the load/g ratios fir several frequencies,, then a more cons'ant set of values should beobtained. Note that if this procedure is adopted, the resulting load/g ratio for that strain gaugeposition will be lower than if an attempt had been mac'a to draw an 'average' value through th- 'unadjusted'load/g values; but also that a corresponding 'frequ'rncy factor' has to be included in the fatigue:alculations, for critic.al sections arot'n! that position.
3. PLANNING TIC FATIGUEM JETrR DATA SIDELT (FMDS)
Having determined by calculation and/or flight test measurements how the various flight parameters(weight, altitude, Mach no. etc) affect the load/g ratio for all the critical sections, the nextobjective is to plan the FMDS so as to make provision for all the data that has to be recorded inaddition to the actual accelerometer counts. Before the 'g' counts can be converted into increments offatigue damage or life, each line of readings must be assigned to its appropriate 'block', for which theload/g ratio for each critical section is reasonably constant. 'Te success of the whole fatigue meterapproach to fatkgue life monitoring depends mainly on how little variation in the load/g ratio can beachieved within each 'blqck', whilst still making the widest possible definition of a 'block'.
It will be assumed that, for military aircraft anyhow, the fatigue meter will be read after everysortie, so that at least there is no difficulty in c llecting the 'g' records into 'blocks' of similarflight types. So the first task is to determine the range over which each flight parameter car varywithout the load/g ratio altering by more than an acceptabht amouný. Gbviously, the narrower the 'block'band width for a given parameter, the more constant the loadg ratio will be for that block, and hence themore accurate the fatigue damage estimate will be. However, the over-riding consideration in determiningthe 'block' band widths is the complexity of th, parameter required qnn whether the operator can (or will)supply the data. If the parameter required is simple (!.g. take-off wmight, fuel weight etc.) then thereis generally no problem in getting the precise flight-oy-flight values, and the choice of 'block' bandwidth is with the designer, and only involves making a compromise between the calculation accuracyrequired and the extra analysis involved. But if the ruling parameter affecting load/g is less precise(e.g. the height/Mach no. at which an exercise was carried out) the FMDS returns•in response to questionsof this kind,are likely to be less reliable, and the preferable course is for the designer to accept abroader line of questionning and a broader 'block' band width, and try to estimate the effect of the morevariable load/g ratio within the 'block'.
In the (usual) event that the 'block' band width has to be wider than 'he designer would choose,because of the limitations in getting some flight parameter do a, Oien the :,tigue damage calculationswill have to be based on an 'average' load/g ratio for the'block ' Tbis can be determined in a varietyof ways. The simplest is just to use the maximum load/g value for the 'block', which is aWright if aconservative life estimate is acceptable. Howel -r, if the var~ation of load/g within t? 'block' islarge, and the 'block' band width cannot be reduced, then the only puecedure left is to calculate a'weighted average' figure. It is necessary to estimate, by whatevur means are available, the proportionof the total flying covered by the 'block' which occurs .n each part of the 'blcck. lbenby assumingthat the 'g' counts relevant to that 'block' ar- distributed to each part of the 'block' in the sameproportions, the fatigue dage can be calculated; and from this the 'weighted average' load/g which doesthe same damage when applied to the total 'g' counts for the 'block' is calculated.
If too much reliance has to be placed on estimating 'weiphted average' load/g values, because extherthe load/g ratio varies so much for the particular aircraft typeor it is impracticable to ask fornarrower 'block' band widths, then the relir.ility of the hife estamates must be reduced. But anothervital ingredient in the procedure is to win the support of the operato7,at the source of the data. Allpersonnel involved in making the FMDS returns should be instructed in the purpose of all this endlessform-filling and recording of operation'l statistics, in order to maintain i high level of accuracythroughout the whole service life of the aircraft. For the designer's part, he must do everythingpossible to make the operator's tank easier, by not trying to achieve more 'accuracy' by demanding toomany 'blocks'.
It is not possible to go into any more detail about planning the FMDS in this section, because eachaircraft has its own peculiar problems. In section 6 of this lecture some examples of the auoveprocedure will be presented, which will illustrate tne way some ot these problems are tackled in the U.K.
3-4
4l, FATIGUE METER FORMULAE
Having (ho ,zullyl) determincd a number of a/erage load/g values that apply to a correspondingnumber of 'blocks' in the complete flight envelope, and having ustablished a ky of identifying toe 'g'records with the various 'olocks', the designer can then =roduce a formula for converting the 'g'records into fatigue damageor its equivalent, it must be said strairht away that the development offormulae in the U.K. has been influenced by the need to provide formulae in the simplest possible form,because the current practice is for the opera• ' to analyse the FMDS's and then 'update' tne fatigue lifeby a 'hand' calculation. In the-'e circumstances it tb c&%viously necessary that each calculation shall beable to be done simply..
Bearing this in mind, 'fatigue meter formulae' are often based on the metd developed at the RAEby Phillips (ref 2). For those not familiar with this method, a brief description will be givea. Thetotal 'g' spectrim for a 'block' is divided into 2 parts 1) a turbulence component, conaca ting of thetotal negative Igt spectrum and a corresponding equal 'mirror im2ge' positive 'g' spectrumi; tniat is, aspectrum symmetrical about 1g. 2) a manoeuvre component, consisting of the remaining positive 'g'spectrum, zssociated with an arbitrary negeti.. g' spectrum in which the negative 'g' levels are (ray)- ,15 x the positive 'I' levels. This is done to allow for some 'overawing' when recovering theaircraft from a high positive 'g' manoeuvre. A typical spectrum is shown in Ftg.2.
The turbulence component frequency curve is idoalisod as a straight line AB in Fig; 2, and byassumling tile 3.41 curve for the secti'on can be written in the form if r. f0 + Nol/JN, It is shnown that thefatigue damage due to the turbulenca component can be written in the form
qT = l El + c2 E2 (1)The manoeuvre component fatigue damage is estimated simply by assuming all the 'g' counts between eachpair of 'g' levels:- L- to L4, L4 to "S 9and L5 to L6 occur at the mid-interval 'g' value. This leads
to an expression for fatigue damage in the form :-
QM = c4 [(E3 - 82 ) - (E4 - E(+ 05 C(l El) -E5] + c7 E6
The total fatigue damage due to turbulence and manoeuvres, or,with suitable factors in tr.e constants, thepercentage of fatigue life used is therefore estimated from the very simple formula
Q (KI E 1 + K2 E2 + K3 E3 ) (3)
The same principle can be extended to any number of Ag measurement :evels (usually not more than 8)
Ground-to-rir damage, when significant, is included as a separate iaon in Eq (3), and in mostinstances is simply a functicn at Take Off Weight and the number of landings.
Sor.,etimes a slightly refined version of Phillips' method is used, in which the fatipue damage dueto the 'g' counts between each pair of adjacent g' levels is estimated by dividing the L interval intoa number of small 'steps' and summing the incremental damage for each 'step'. Also it is not necessaryto assume that the S-N equation is in the form used by PbiV,•s; any conventional set of S-N datawill give e damage formula in the same form as Eq (3). Where another S-N curve shape is used, then theprocedure for calculating the fatigue damage in the interval LI to L2 for example would be to draw aseries of load spectrawith unit E1 (say), for ratios at E2/8i and calculate the damage AQ for eachspectrum. When AQ is plotted against E2 /!E, the result is a very flat curve (passing through Q = 0,E/ w, not O),but a straight line can be fitted to the curve which will result in very little errorSin AQ over the useful range at E2 /E 1 (see Fig.3)
i.e. &Q/E 1 = c2 (E 2 /E 1 ) + cI (4)
which is the same as Eq (1).
The damage calculations are,of coursebased on the appropriate S-N curve(s) and load/stress ratiofor the section, together with the load/g ratio for each 'block' i.e. there is a separate damagecalculation for each 'block' and each critical section. Thl S-N curves are 'adjusted' to pass throughany test result points obtained from the full scale fatigue test, and all the necessary safety factorsare also included. This means that the safe fatigue life is reached when the percentage l-fe consimed,ap calculated by the formula, reaches 130%. However, sometimes the formula is issued to the operatorbefore any test result is availvble. If eventually the full scale test result indicates that the lifeis longer than originally predicted, it would be safe for the aircraft to continue in service after thepercentage life consumted •,s reached 100%, based on the originl formula, Rather than change all theco-efficients in the formula, which would involve the operator in havirig to recalculate all his'update' totals, the concept of calling Q the 'Fatigue Index' (F.I.) was introduced. Thus thedesigner is able to simply issue an instruction to t- operator that he may fly the aircraft 'up to anF.I. of 170' for example, without haiing to explain how it is possible to asch.ave 170% of the safe life.
As will be shown in the examplesthis basic formula form. is often modified in other ways also, tosuit the particular problem. The usual practice is to acco'unt for the difference in 'damage' done byone 'block' and another by applying an overall faetor to one formularather than quoting separateformulae for each 'block'.
If a comouter is used for all the analysis work, then there is no real need to make approximationsin the damage c..culaxion in order to achieve a simple formula, because the computer can obviouslyhandle more ccmplicetod expressions and still do all the analysis in an .- ceptable titne. The use of acomputer w~ould enable much tighter control to be kept over a large fleet, because the 'updrl" could be
done much .aore frequently. Also narrower 'block' band widths could be used, provided the a,,a wasavailable. A typical more refined mthod, which was used recently in the U.K. in a computer analysis ofa large amount of fatigue meter data, ia given in Appendix i.
-p - Vm -1 *ýý W
3-5
5. THE? F'UU SCALS F'ATIGUE TEST
Int the U.K. i~t is regarded at; desirable to -Prry out a full scale fatigue teat, as a fin-ildemonstration of the fatigue life of the aircraft. In my opinion, D- is preferable tc dela; this testuntil enough service experience has been gaitied to be able to measure the flight load spectruim thatought to be simulated on test, rather than base the test loads on a theoretical flight rlan anidc alculated loads, Trho consequences of setting up the test based on calculated ( 'rigid' aircraft)
rloads before any flight measurement trials have buen Conducted is illustrated in Fig.4. It was foundfor this aircraft that the dynamic overswing effects at mid-span were considerable, so that althoughthe test load spectrum wits a block programme representK~ng the meacured Ig' spectrum, the fatigue damagebeing achieved on test ait mid-span was less than in ;.nu airorat' i- ser-4 ce. The case for delaying thýtest is possibly stronger for military aircy-aft than for civil aircraft. The utilisation rate of civilaircraft is often so nigli that the fatigue test must start before the aircraft goes into servirel~inorder that the test shall get sufficiently 'far ahead' of the lead aircraft before the tim:ý that the firstcracks eight apreAr in service. Also~ ti-. flipght plan (initially anyhow) flown in service by a iivilaircraft is more likely to bear a close resemblance to the fligat plan in the npecification, But formilitary aircraft the opposite trends are ms~re usual. Theore is usually ample tim? to get the 'test hours'ahead of the lead aircraft even if the start of the, test is delayed for some y--ars, before the critical
Sfatigue life is reached. Also the actur~l flight plaýns ax-a wtoie likely to be significantly differentfrom those used in the design calculations and the oriainal specification.
Strain gauges should be fixq'; on the full scale test specimen in the spume positions as on theflight trials aircraft, s~o that the test lcsds may "e compared with the flight loads. Trhe aim should beto achieve the smre load/eg values on teat as ott the aircraft at all the likely criticel .ections, althoughoften compromises will have to be made ins order to arrive at a practical tent lo'Žding aostriiL'ation. Inpractice the load~nF pr,,Sramme is adjusted within small limits until the fati 'ie damgettace& on thetest load spectrium~equals the damage L..ued on the neasured aircraft spectrum,at the most critical section.For all other sections it will be necessary to apply a factor to the test result, to convert it into theequivalent life achieved. The comparative fatigue damage calculations on which such factors are basedmusat be based o. ~he same S- curw nnd l~oad/stress ratios as used in the fatigue meter formulae
* ~calculations, of course. Yowever, care must be taken wt.'en interprsting a test result wsien the 'ezt stiassspectrum at a particular section is different fror' the aircraft in service' spectrum. Kirkby in ref.)warniq of the risk of over-e-7timating the actual servi-ce l-,fe on the basis of comparative damagecalculations if the tetsrI ~etrmi oesvr thar..the service S;RctrUM. For example, salpposea test carr~ed out under a certain spectrum resulted in a test life equivalent to 3U800 hnurs; out it isfound tý%at, although the test and service spectra are the same sshaR, the service stresses are all 30%loder. Based on a cocpanritive da~aj-z calculation, the estimated service life would be 77000 hours; butthe actual service was only 71000 hours. Thus, the Life achieved in, ,ervice war. only 90% of tt'atpredicted. Also comparatively small changes in spectrum snape car. produc'ý a dr-tmatic effect on the i~fee:.itamat'. In particular if the test soectrum contains even a few high stresses which a(, not occur 'ittnt., -irvice spe-tramn, th'ere is a very real 1`13K tnaC the comparitti-e damare calculation-, will result inunhafe service life estirates.
1. the strain gauges are po.-itioned i'entic__lly on the~ flirqnt test aircraft and full-scale testr specimen, and the load in th:' critical s;ection car. be related direct-y to a strain gauge reading, it is
t ~not really necessary/ to know the actu-J sar-s, i., that section. Once a test result has bzen acnievc!,a damage calculation can be made, brA~d on the -ý- curve .)pprn~pria :e to the section, to find tae valueof the lo-ad/ztres.r, raotio thut will result in a dwmag.? equal to unity for the tesit ^eault. Thus theordinate of the S-14 curve is now xdie p. octct of hoactual turkitown) load/stress retio end the test rasult
a ,factc- (on stress). Alterr.-tively, the S-1 -7,:ve (an be converted into a 'Load-N' curve, or even intoa 'g-11' curve, i: this w*Ill at .e the fatigue f'ansul, calculations easier.
6. E;4LsOF CURRE:NT AlRRUAFT FU'C<ULA DERIV.VPICN
Lt is proa.-ied n w to -oara from, the general discuss-,on on the, probler, of howr to analyse fatiguemeter data to some erismples of Ieprocedure in action.
The examples -,e chosen from both categories oi the problem.-
A.. Fighter t.ype nir~raft, loaded maintly by manoenv,-e loads.
3. Tran~sport or bomber ~ircraft, 2-ided mainly by gusts, or msjaoeuvros which are treated in thesamp way as gusta.
A. Loal/ rtio in fighter type aircraft
In a conventional fighter type of aircraft there is generally no g-eat P~oblem in calculating 'hieload/g ratio for the critical sections. The aircraft is usually treated as ta 'rigi.d' structure, and sothe load/g ratio is constant ova" the who.e range of 'g' required. The rate of appI' tng the 'g' loads,whiich affects the wing loads because the tail loads needed varj with rate, i, not ý,iten inteo account, asit usually ham ortly a small eai'ect on the ]Luad/g ratio.
It is fortunate that nea 'ly Fall sortie pal Lerns for this type of aircxaft' consist of a straight-forward '.r..nsit phase to the combat or training area, the operational xerciae, and a transit phase backto ýassa. To simplify the caltculations it is assumed that all the manoeu',*re load!3 which wili causes~ignificant fatigue damage occur in the operational exarcime pa-t of the sorti .Gust aer' mono' .vrel.oads that occur duvring the transit phares are aeýserad to be negligible by comparison, Aore often thannot, the GTAC L, ulso negligible by comparison -with the mnanoeuvring loads, ard is ,Iso ignored Theimportant point of thin assumption is that the variation "in load ', due to ctange in aircraft weight asrtel is use6 up can be avoided, simply by assuming that all the 'g' cotants occur "4t the operationalexercise mean weight. 0enerally this will be the average of the take off and landing weights, but thisis not alwayra so in heav aircraft.
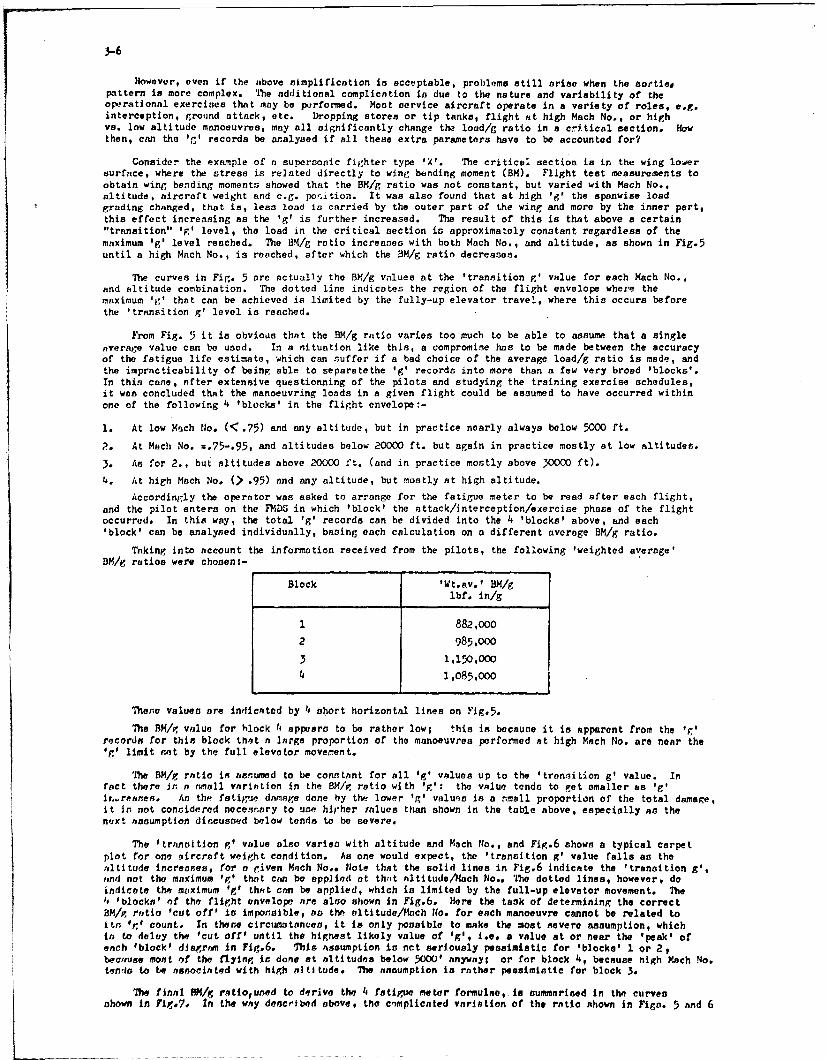
3-6
However, even if the above simplification in acceptable, problems still arise when the sortie,pattern is more complex. The additional complication is due to the nature and variability of theoperational exercises that may be performed. Hoot service aircraft operate in a variety of roles, e.g.interception, ground attack, etc. Dropping stores or tip tanks, flight at high Mach No., or highvs. low altitude manoeuvres, may all significantly change the lo-d/g ratio in a critical section. Howthen, can the 'g' records be analysed if all these extra parameters have to be accounted for?
Consider the example of n supersonic fighter type 'X'. The critics: section is in the wing lowersurface, where the streas is related directly to wing bending moment (BM). Flight test measurements toobtain wing bending moments showed that the BM/g ratio was not constant, but varied with Mach No.,altitude, aircraft weight and c.g. position. It was also found that at high 'g' the spanwise load"grading changed, that is, less load is carried by the outer part of the wing and more by the inner part,this effect increasing as the 'g' is further increased. The result of this is that above a certain"transition" 'g' level, the load in the critical section is approximately constant regardless of themaximum 'g' level reached. The 13M/g ratio increases with both Mach No., and altitude, as shown in Fig.5until a high Mach No., is reached, after which the BM/g ratio decreases.
The curves in Fig. 5 are actually the BN/g values at the 'transition g' value for each Mach No.,and altitude combination. The dotted line indicates the region of the flight envelope where themaximum 'g' that can be achieved is limited by the fully-up elevator travel, where this occurs beforethe 'transition g' level is reached.
From Fig. 5 it is obvious that the BM/g ratio varies too much to be able to assume that a singlenverage value can be used. In a situation like this, a compromise has to be made between the accuracyof the fatigue life estimate, which can suffer if a bad choice of the average load/g ratio is made, andthe impracticability of being able to separatethe 'g' records into more than a few very broad 'blocks'.In thin cane, after extensive questionning of the pilots and studying the training exercise schedules,it was concluded that the manoeuvring loads in a given flight could be assumed to have occurred withinone of the following 4 'blocks' in the flight envelope:-
1. At low MYich No. (<•.75) and any altitude, but in practice nearly always below 5000 ft.
2. At Mach No. =.75-.95, and altitudes below 20000 ft. but again in practice mostly at low altitudes.
3. As for 2., but altitudes above 20000 ft. (and in practice mostly above 30000 ft).
4. At high Mach No. (> .95) and any altitude, but mostly at high altitude.
Accordingly the operator was asked to arrange for the fatigue meter to be read after each flight,and the pilot enters on the FMDD in which 'block' the attack/interception/exercise phase of the flightoccurred. In this way, the total 'g' records can be divided into the 4 'blocks' above, and each'block' can be analysed individually, basing each calculation on a different average BM/g ratio.
Taking into account the information received from the pilots, the following 'weighted average'DM/g ratios were chosen:-
Block 'Wt.av.' BM/glbf. in/g
1 882,000
2 985,00W
3 1,150,000
4 1,085,000
These values are indicated by 4 short horizontal lines on Fig.5.
The M/rg value for hlock t4 appears to be rather lowl this in because it is apparent from the 'F'records for this block that a large proportion of the manoeuvres performed at high Mach No. are near the'I' limit set by the full elevator movement.
The BM/g ratio in assumad to be constant for all 'g' values up to the 'transition g' value. Infact there is n asall variation in the BM/g ratio with 'g': the value tends to get smaller as 'I'i r..resaes. As the fatig'ue damage done by the lower 'p,' valuna is a small proportion of the total damage,it in not considered necessary to use hither ialues than shown in the table above, especially as thenext assumption discussed below tends to be severe.
The ftranoition g' value also varies with altitude and Mach No., and Fig.6 shows a typical carpetplot for one aircraft weight condition. As one would expect, the 'transition g' value falls as thealtitude increases, for a Fiven Mach No.. Note that the solid lines in Fig.6 indicate the 'transition g',rend not the maximum 'g' that can be applied at that altitude/Mach No.. The dotted lines, however, doindicate the maximum 'gO that can be applied, which ia limited by the full-up elevator movement. The4 'blocks' of the flirht envelope are also shown in Fig.6. Here the task of determining the correctBM/g ratio 'cut off' is impossible, no. the altitude/Mach No. for each manoeuvre cannot be related toitr. fjt count. In these circumatances, it is only possible to make the most severe assumption, whichit to delay the 'cut off' until the higest likely value of 'g'q i.e. a value at or near the 'peak' ofeach 'block' diserrm in Fig.6. This Assumption is net seriously pessimistic for 'blocks' 1 or 2,because most of the flying is done at altitudes below 5000' anywayl or for block 4, because high Yach No.tonria to be aamorinted with high altitude. The nnaumption is rather pessimistic for block 3.
The final HM/•g retiouned to derive the Is fatigue meter formulae, is summarised in the curvesshown in FiP..7 In the way described above, the cimplicnted variation of the rntio shown in Figo. 5 and 6
3-7
have been reduced to 4 very sir '-1 relationships. Note that Fig.? only applies to one aircraft weight.SThe final adjustnenr is to vnre the 'trsnsition g' cut-off in proportion to I/ (average sortie w.eight),because the spanwise load grading is a function of the wing incidence (i.e. total lift).
For this aircraft, as the BM/g ratio for each 'blockt is constant above the 'transition g', the 'g'frequency curves are effectively truncated at tne 'transition g' value, and so the formulae in section 6have to be modified accordingly. As the truncation level varies with the average sortie weight,the F.I. also depends on the weight. Snmple calculationasdone for a variety of spectrum shapes,irlicated that the variation in F.I. with average sortie weight was approximately linear over the rangeof weights needea. Therefore it was considered sufficiently accurate to base the formulae on the'transition g' levels for W0 , and account for variations in weight by including another term in theformula. The final foxymulae were iii the form :-
F.I. = (1 + a (W-We)) (K1 Fl -- K2 E2 K3 E3 + (5)
where a = constant
The whole analysis is, therefore, reduced to
1) identifying the broad sortie type, and assigning each flight to a 'block' number
2) recording the take-off and landing weights for each flight, from which W is obtained.
3) summing up all the 'g' counts in each 'block' type and W band sub-groups.
4) applying the data to the formulae and evaluating F.I. for the period of flying, whichis then added to the previous accumulative total of Fol.
This analysis is performed by the operator unil the F.I. = 80% of the permitted maximum F.I,Vhen this value is reached, the standard procedure in the U.K. is for the manufacturer to becontracted to carry out a complete re-as.sessent of the fatigue life calculations. Blis involveschecking the sortie pattern, to see if any changes in cperational pattern have occurred in service whichhave not already been accounted for; checking the mete- ,.ecords and reviewing any Joubtful data;reviewing any new test data etc.. 'The remainder of the service life is then kept under very oosescrutiny as the final part of the safe life is ased up.
B. Load/g ratio in bomber/transport type aircraft
As discussed in examrple A, althoughi the conplex verion of load/g during the combat/exercise phaseof a fighter sortie may be a lifficult problem to simplify, at least it can usually be assumed that allthe 'g' counts will occur during this phase. However, the problem in te large bomber or transport typeaircraft is the other way about. Generally there is no great variation in the type of flyingperformed over the whole flight, but the fatigue damage is now done by load cycles which occur allthrough the flight and not especially in cne phase. The load/g ratio is probably not constantutroughout the flight, and certainly aircraft weight will again be an important parameter. The basicproblem described earlier still exists; that is, how to determine a constant load/g value for use witha given 'block' of counting accelerometer data.
Provided the flying contains no abnormal manoeuvres for this t-pe of airciaft, the generalpractice in the U.K. is to assume that the dirtribition of counting accelerometer 'counts' will be inaccordance with the theroetical distribution, based on the flight profile and the standard gust data.The standard gust data used is obtained from ref. 1, which (for wings) is assumed to _nclud- the effectof normal manoeuvring in a uransport type of aircraft. No distinction is made, when analysing thecounting ac-elorometer data which forms the basis of the standard 'gust' data, between 'gI counts dueto gusts o- due to manoeuvres; therefore the total 'gust' frequency includes both types of loading.However, it haa to be assumed that there is not a great deal of difference between the load in acritical seactor due to a 'ilg gust' and a Ig manoeuvre, if the calculation is to be based aclely on thestandard 'gust' data.
'!he general procedure is, therefore, as follows
'. Defin- the flight profile, dividing it into a number of stages (usually by height band). Derivedistances flown, average LeiCght, speeds, weights etc., for each stage.
2. Calculate for each flight stage the incremental load ii, each critical section and the Ag at thec.g. for a i0fps.gust, and the ig steady flight ioad.
3. Calculate the theoretical fatigue damage at each critical section, using the appropriate load/stressrelationships, S-11 curves, and results from test apecimtns.
4. Knowing the Ag for a 1Ofps gust in each stage, calculate the total theoretical 'g' frequency forthe flight profile.
5. Derive a 'weighted average' lg load- 'weighted' in proportion to the time spent in each flightstaga. for the purpose of taking this as a constant ig value in the equivalent damage calculation, basedon the theoretical 'g' frequency curve obtained in 4).
6. For etch .ritical section, calculate the fatigue damage based on 4) and 5), the same strers/loadrelationship as used in 3), for various load/g ratios; until,by interpolationthe load/g ratio ieobtained which results in a fatigue damt,,e equal to the theoretical damage calculated in 3).
As it is usual in this type of aircraft for the speeds throughout any flight to follow a pre-determined pattern, then 'Moadly sWeaking, both the ig and gust incremental loads will be related mainlyto take off weight (MOW), zero fuel weight (ZFV), cruising altitude and flight duration. If the flightplanning results im about the same amount of fuel remaining at the end of each flight, then flightduration is related to TOW and ZFW. Small -ariations in speed from the normal operational pattern will
not affect the load/g ratio significantly, because both the loads and the &g due to a gust tend tochange by the same amount due to a change of speed alone. Therefore, the average load/g ratio for agiven flight profile, calculated in the way described above, will be dependant mainly on flightprofile, TOW and ZFW.
Sometimes the load/g ratio is dependant on even fewer parameters than the three above. In sweptwing aircraft, in order that the e.g. of the aircraft shall not shift forward or aft too much as fuel isused up, the fuel usage drill is arranged so that the c.g. of the fuel does not alter too much as fuelis consumed. If the spanwise position of the fuel e.g. is near the spanwise centre of lift for the wing,this can result in the load/g ratio for wing sections near the wing root being fairly constant over auseful range of fuel weights, provided there are no large dynamic overswing effect.s to be taken intoaccount. Take the Comet 2 for example. The fuel is carried in 3 tanks in each wing, plus a centresection tank. Fig 8 shows how the load/g varies with aircraft weight. Note how the whole diagram isdisplaced as the ZFW changes, but the load/ g ratio was considered to be sufficiently constant, over theisual range of operating weight, to use a value which was simply a function of ZFW. Therefore, it wasunnecessary to worry abo't the flight profiles, because wherever the 'g' counts occurred during aflight, the resulting load in the critical wihg section was proportioned to Ag. In this instance, itwas fortuitous that there was this easy solution to the problem of obtaining constant load/g ratios,and so the additional data required on the YVDS was simply Take Off Weight and fuel load at T.O.From these the ZFW was obtained (for some reason the operator finds i. difficult to record ZFW directly:)and the records were grouped into 4 'blocks' aucording to ZFW, for which 4 formulae were providedjbasedagain on Phillips' method.
However, the solution is rot often as easy as this. Take the example of a bomber type aircraft'Y'. The flight profile requirement laid down in the design specification is shown in Fig. 9 (a),whichwas 'or just a straightforward long-range high level mission,
Having entered service, the strategical requirement for the aircraft changed radically, as is sooften the cece, so that after a few years the actual sortie pattern could be described as falling into3 distinct types of flight profile:-
i) The original High level flight profile (see Fig.9 (a))
ii) A High-Low-High flight profile, as showr in Fig. 9 (b)
iii) An OCU role flight profile, consisting of a high level part, followed by a long sessionof circuits and approach exercises, as shown in Fig. 9 (c).
For these widely different types of sortie, the BM/g ratio for one type of sortie bears no relationat all to the ratio for another type, as is illustrated by the two curves given in Fig. 10. The uppercurve shows that the ratio varies during a high level flight by nearly 1.5:1 which can hardly beregarded as constant. The lower curve varies a little less. For other Take Off Weights and ZY-4's thecurves were different again. It was, therefore, neceesary to derive average valies for the DM/g ratiofor every variation of flight profile and weight, using the procedure described above. The average valuesthus calculated are snown by dotted lines in Fig. 10. Note how the average values ax* biased towards thelow altitude part of the flight BM/g values, which is where most of tho 'g' counts would be expected tooccur. It is an unfortunate coincidence that the 2 average values shown are so close together; forother weights the average values are differentl
Once again, as was the case for the fighter type aircraft 'X, it was necessary to conduct athorough survey of the whole sortie pattern for the aircraft, tv establish how many :blocks' the fatiguemeter records would nave to be divi"'d into. Finally it was decided to use 28 'blocks' as follows
,. High level sortie with 4 different TOW's, at a light ZFW wnhich is taken as being constant (ontraining exercises the bomb bay load is negligible, so there is litt•e change in ZF', even if anypractice stores are released).
2. As for 1) with heavy ZFW (generally a heavy bomb bay load which is not released in peacetime).
A. High-Low sortie with 4 different TOW's, &ach TOW -ssociated with 3 different values for fuelweight used at the start of the low level phase of the sortie, all at the light ZMI.4. As for 3) taking the middle value of fuel weight used at the start of the low level phase, for each'TOW, Lut with heavy ZFW.
5. CCU sortie with 4 different TOW's and the light ?ZF.28 separate average BM/g ratios were worked out for 4 critical sections in the wing and, therefore,
potentially there could have been 28 different fatigue meter formulae for each critical section! Putthis was considered ar the time to be too complicated for the operator to apply, and so thepresentation was simplified in the following mn.ner:-
1. The 16 'blocks' with the light ZFW (i.e. blocks of type 1 and 3) were all related by a factor C1to a 'datum' block, which was selected as the most frequently occurring block from this group of 16.ffnen 16 fatigue lives were calculated for each critical section, based on the 16 average SM/g ratiosand the measured 'g' spectrum for the 'datum' block. (The fatit.e meter formulae were not preparedinil the aircraft type had been in service for several years, and a -. siderable amount of fatigueneter data was available). Based on these livcs, the factor C1 is defined as
C1 for sortie p = fatigue life for sortie 'Op (6)
fatigue life for 'datum' sortie
2. A single fttigue meter formula (for each critical section) was obtained using Phillips, methodand the 'datem' sortie BK/g ratio.
3-9
3. Because there were so few sorties flown with heavier ZFr'sthe extra complicatioz. of providingseparate formulae for these sorties (i.e. blocks of type 2) and 4))was not justified. Instead thesesorties were allowed for by first considering them as though they were 'light ZFW' sorties, and thenfactoring the formula up by a factor Ca, For each sortie type the theoretical fatigue damage hadS~already been worked out in order to derive the average BM/g ratios, both for" 11ight' IF4 and 'heavy'
ZF4 cases. Using these results, the factor C2 was defined as -02 for sortie •,q, = theoretical damage for sortie 'q' (heavy ZFW)
theoretical dmame for sortie 't' (light ZF)"
In the event that a heavy store is released during a sortie, the value of C2 used is taken anthe average value of C2 for the ZF4 b-fore and after dropping the store (N.B: the Z;W after dropptngthe store is not necessarily the 'light' ZFe value).
4. Separate formulae were provided for the OCU sorties, as the flight profile was so different fromthe others.
h•erefore, 2# out of the 28 sortie types could be dealt with by using one formula, of the formF.I. = C1 x C2 (K 1i 1 x K2 E 2 + K3 E3 --- )8)
where the values for C1 and C2 are supplied in tables for varioussortie descriptions and ZN values.
It should be mentioned finally that the 'datum' formula (inside the bracket of Sq (8)) includesa GTAC term, and the C2 factor also contains an allowance for GTAC damage. The GTAC contributes between3% - 15% to the F.I., according to the sortie type flown.
7. FURTHER DEVELOWIENT IN THE USE OF FATIGUE k ETERS
The fact that the fatigue meter does not record when the variou 'g' counts occurrad during aflight leads, to the fatigue calculations having to be based on assumed distributions of the 'g' counts,and 'weighted average' load/g values. If the load/g ratio varies throughout the flight by a largeamount, then the estimate of an average value for the flight can be unreliable, to say the least; but'if the maximum load/g value is used, the F.I. may be badly over-estimated, which is not altogetherdesirable either. However, there are special situations in which the load/g ratio is known to varysuddenly at some identifiable point during the flight. For example, in a 'swing-wing' aircraft itwould be expected that the load/g ratio for a wing section would vary greatly in the swept and un-sweptconfigurations. An ordinary FMDS return could not possibly be expected to give any reliable data onthe amount of manoeuvring that took place before and after the wing was moved, nor even exactly whenin the flight it was moved. Yet without this data, it is very difficult to make any reliable estimateof an average load/g value to apply to the whole flight.
To meet this problem, the feasability of a 'multi-mode' fatigue meter could be considered. Thisinstrument would contain two sets of 'g' counters, one of which is switched on when the ving is in theun-swept position, whilst the other set is switched off. When the wing is swept back past a given angle,the first set is switched off and the second set is switched on. In this way the 'g' counts for rechpart of the flight, with the wing un-swept or swept back, would be recorded separately. Thus eachpart of the flight could be related to its own average lcad/g value, which would be b,ced only on the(presumably) much smaller variations in load/g occurring in that part. As a result, the confidencein the life estimate would be higher than if no separation of the 'g' counts had been possible.
Other examples of situations where a multi-node meter might be useful are if heavy stores arereleased regularly, but not necessarily at the mid-point of the flight; or if manoeuvres at nigh Ig'-,re performed with the wing flaps lowered to illcrease the q. In both these examples the BH/g near theSwing root could alter by a large amount after the stores are released, or the flaps are loweed. Inthese cases the meter switch would be wired into the release mechanism or flap position indicatorcircuits respectively.
8. CONCLUDING REMARKS[ The counting accelerometer (or fatigue meter) has been used successfully for many years to monitorthe fatigue life consumption of fleets of aircraft, mostly of a military type. However, the initial..-- at that the 'g' readings could be directly related? to stress cycles, on the basis of a single
value of the load/g or stress/g ratio, has graduo!i' developed irto a sometimes complicatedassessment of the 'average# value, as aircraft %,d roles have become more complex.
Past experiencs has shown that generally the overall utilisation of a fleet can be extended as aresult of the analysis of all the f,.'tigue meter data, if every aircraft is fitted with a fatigue meter.Searing in mind that part of any life extension will be due to the reduction in safety margin which isallowedtbecause the loading history of every aircraft is individually recorded, this can essily benullified if it becomes necessary to make an over-conservative estimate of the load/g value. Therefore,the effectiveness of the fatigue meter is directly rplated to the ability of the designer and operatortogether beihg able to make a realistic analysis of the flight and load/g patterns. In my opinion,the examples for aircraft 'X' and 'Y' presented in this lecture represent about the limit in rolecomplexity that can still be monitored realisticelly by a simple fatigue meter. For more complexapplications the next possibility for dovelopment could be the use of the multi-mode meter, whichwold improve the accurscy of the F.I. estimate without much additional complication.
3-10
ReFERCES
1. Average gust frequencies - Suvsonic transport aircraft.tngineerSn2 Sciencos Data Item 69023 published byEiSDU 251-9 Regent Street, London WIR 7AD
2. Phillips, J. Formulae for use with the fatigue load meter in theassessment of wing fatigue life.R.A.E. Farnborough Tech.Note Structures 279 1960
3. Kirkbý, W.T. Some effects of change in spectrum severity andspectrum shane on fatigue behaviour under random loading.R.A.E. Farnborough Tech.Report 72150 1972
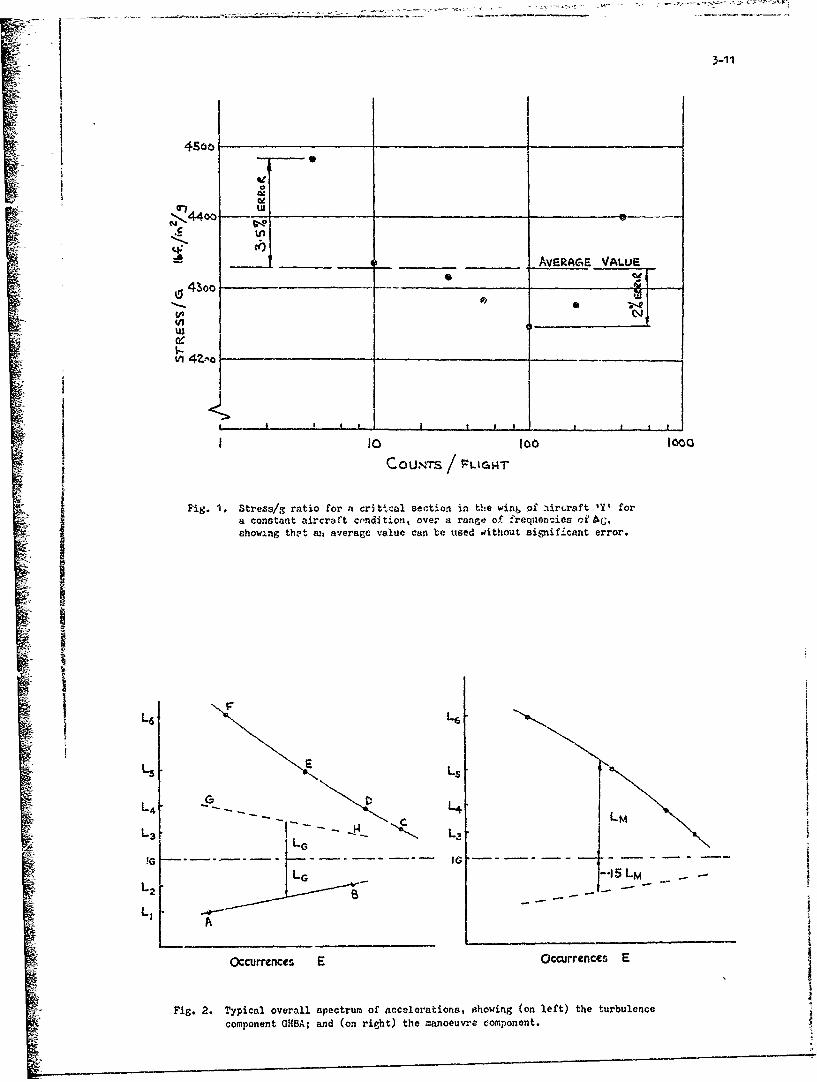
3-11
N4Sjoo
4400 a
S,,b AVERP•E . VAL.UE
S430o .-w-
0400 10-1
4 I ____________ ____________
SC .UTS / FPLkGHT
- Fig. 1. Stress/S ratio for a crit-cal section in the win& of :%ir.raft 'Y' fora constant aircralt condiZion, over a ranne of frequen,:ies tf•,
j showng thet si, average value can be used dithout significant error.
S! IL6 L6
L4 L
L3 L
!GIG - ~ - 1LG - 1 LM
L2
Occurrenccs E Occurrences E
Fig. 2. Typical overall spectrum of accelerations, ahowing (on left) the turbulence
component GHBA; and (on right) the manoeuvre component.
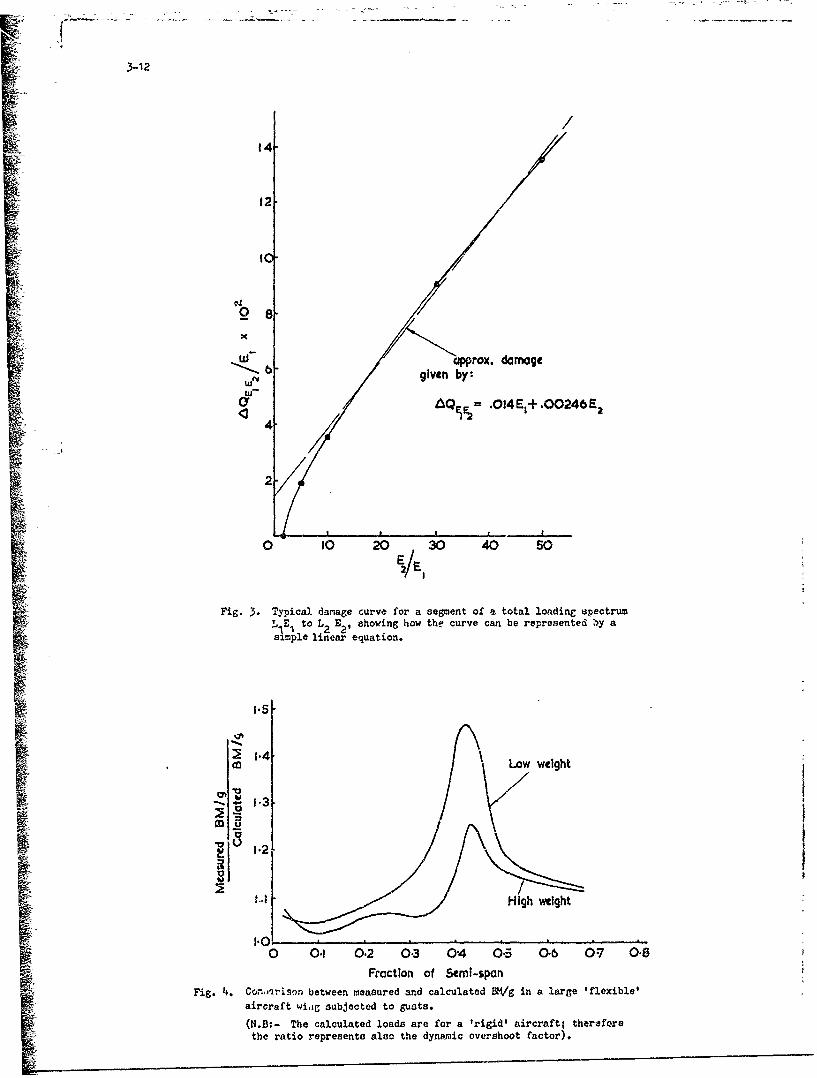
3-12
/
14.
12
X/
a capprox. damage"6b given by:
LU'o aQE .01 4 E,+ .00246E 2
4
2-
0 10 20 30 40 50
Fig. 3. Typical damage curve for a segment of a total loading spectrum!AE to L2 E , showing how the curve can be represented by asimple linear equation.
1"5-
1~~4 L.ow weight
V_ 1.2
High wight
1.0 1 . ., . .. -
0 0., 0.2 0.3 04 0.3 0-6 07 0.8Fraction of Semi-span
Fig. 4. Cononrlsyn between measured and calculated */£g in a large 'flexible'aircraft wi.g subjected to gusts.
(N.B:- The calculated loads are for a 'rigid' aircraft; thereforethe ratio represents also the dynamic overshoot factor).
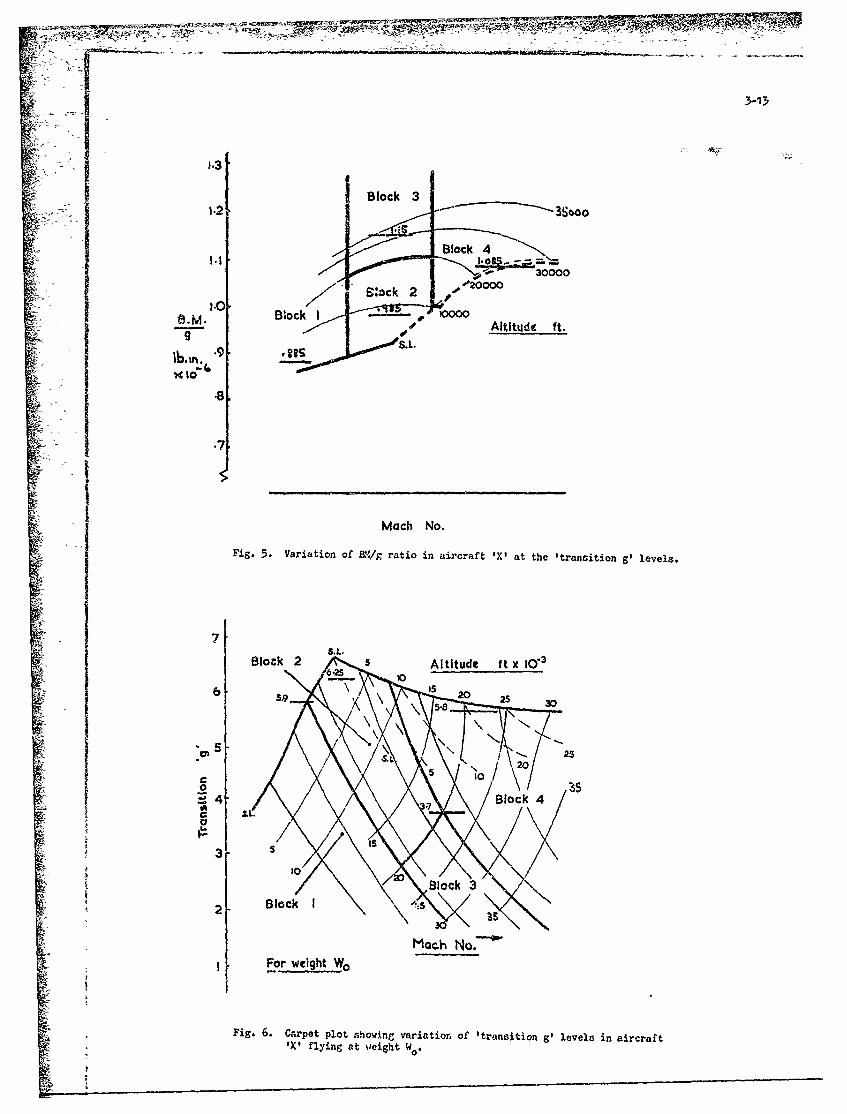
3-13
1.0~oc 47£oc
Blo c 1 0 0 0 0 0 A ltitu d e ft.
.9A
1 .7,
Z Mach No.
jFig. 5. Variation of B:-,/g ratio in aircraft 'X' at the 'tasto g' levels.
Block 2 5 Altitude f t X 1073
22- Mach N 20
Fo5 w10ht/
Fig 6.oc 4~ptpo hvn aitono 'lv narrf'X' ly~n at 'eigt W7
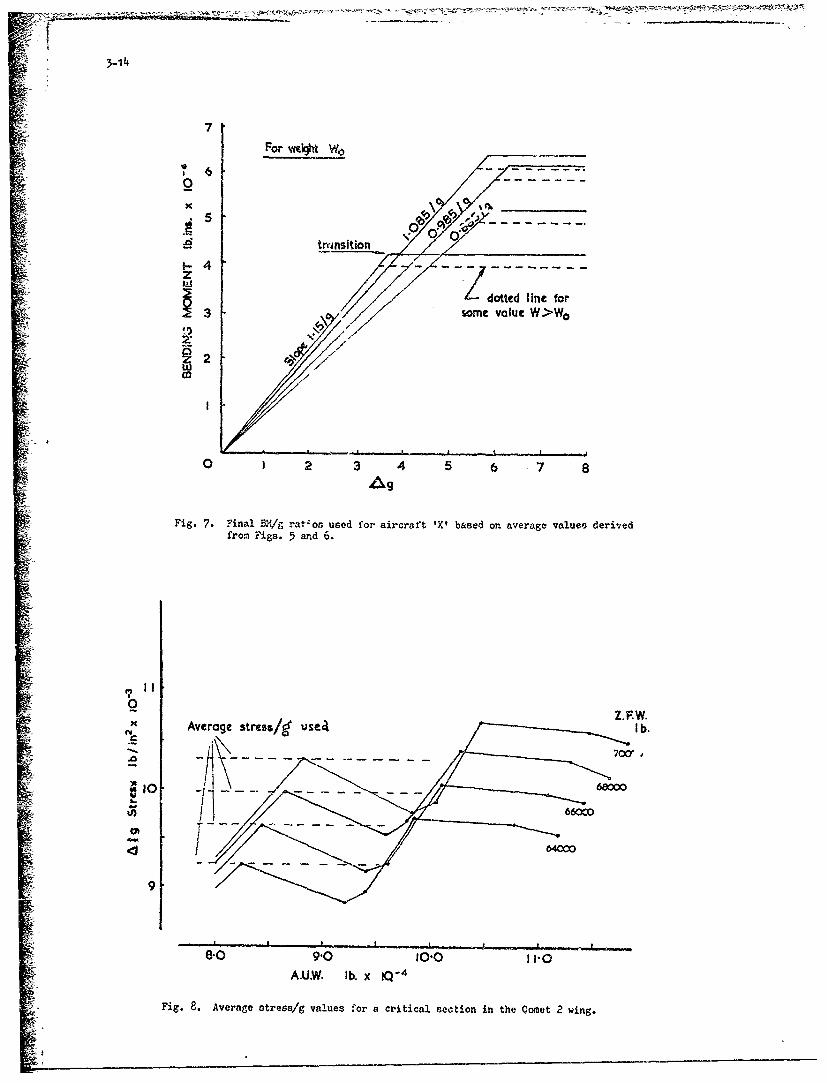
3-14
For vsefvu WO
0. 5
transition
4
1 -dotted line for3 some value W>W0
2:
0 2 3 4 6 7 8
Fig. 7. Final B:Vg rat-os used for aircraft 'X' based on. average values derivedfrom Figs. 5 and 6.
0
- Z .F .W .r Average stress/ uselb.
1I0 68=cE
4 60 9.0 10.0 3110A.UI.W. 1b. X 1-
Fig. 8. Average stress/g values for a critical section in the Comet 2 wing.
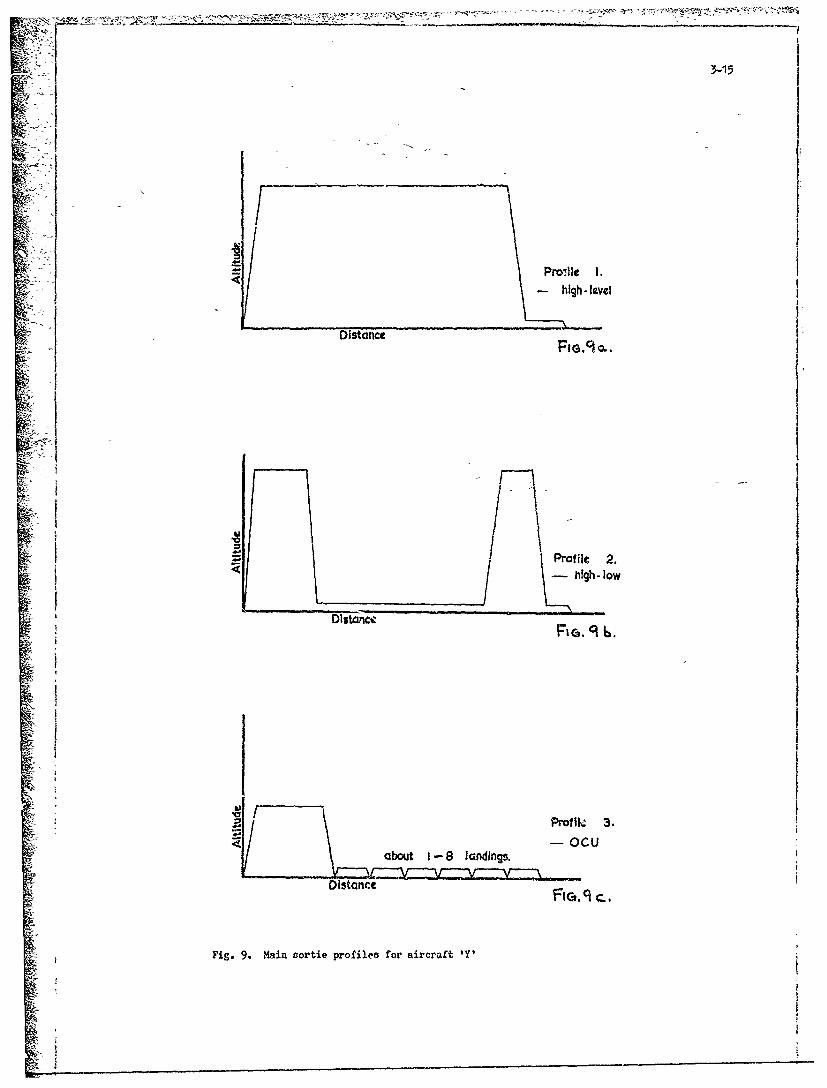
3-15
Pr Ie I
high - lvel
DistanceFIG.9 0.-
I i
filc 2.
-high -low
F C, q ' 6.:1
I! *• "Profile 3.
-OCUI!--\ about I -8 lcndings.
Distance
Fig. 9. Main sortie profiles for aircraft Y'V
4i
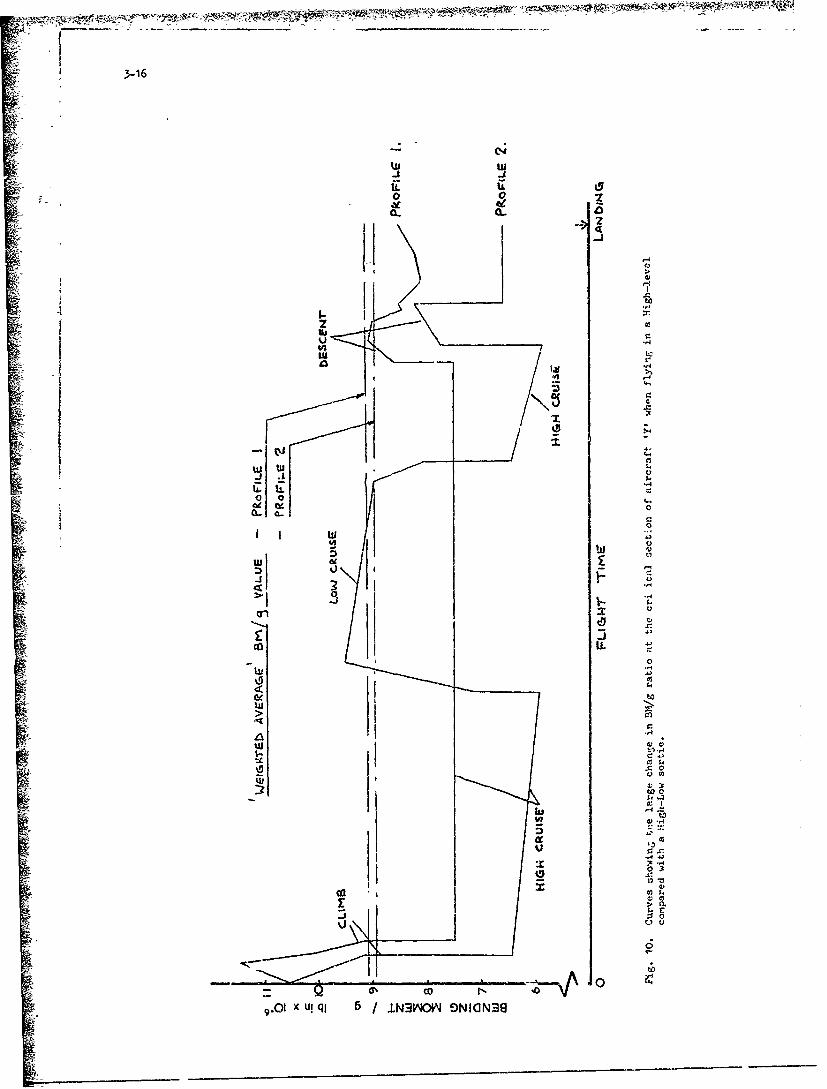
3-16
lu hi
44
cC5via
'-4
43-
ww
C0
lu14)
0)
CD Z-1
9.0 x~ ulq I3MONG3
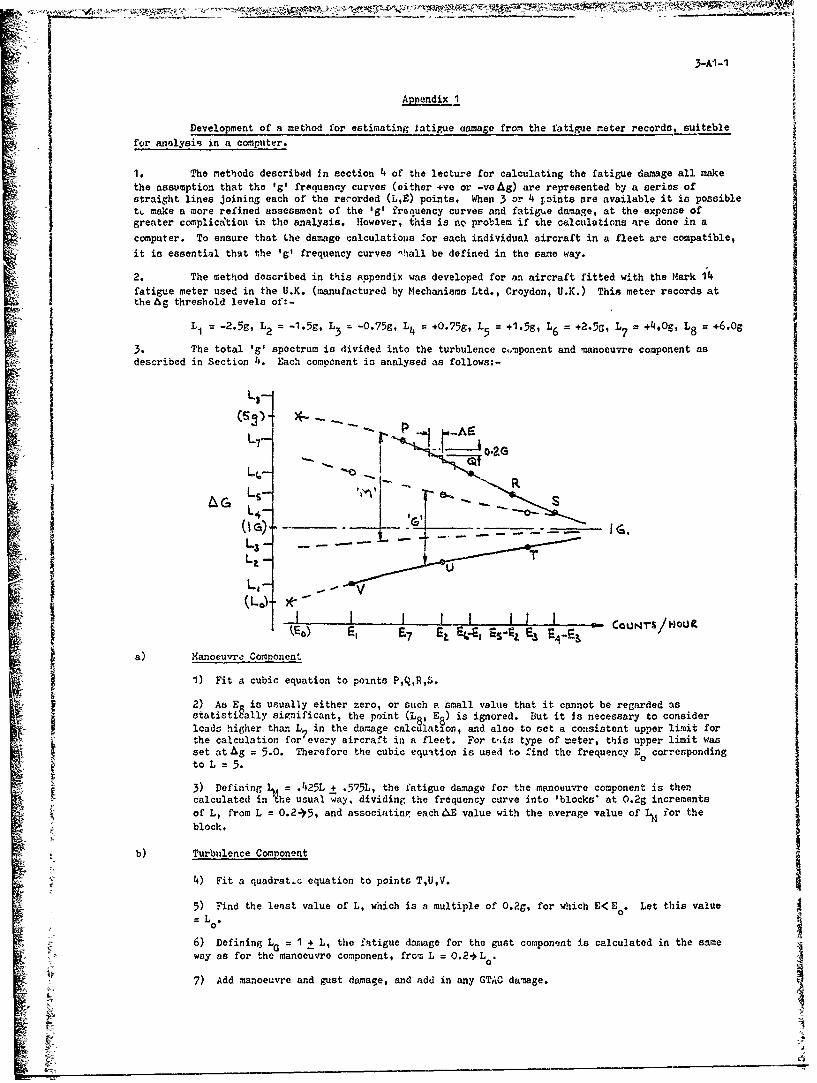
3-Al-I
Appendix.I
Development of a method for estimating latigue aamage from the fatigue meter records, suitable
for analysis in a computer.
I0 The methods described in section 4 of the lecture for calculating the fatigue damage all makethe assumption that the 'g' frequency curves (either +ve or -veAg) are represented by a series ofstraight lines joining each of the rerorded (L,E) points. When 3 or 4 f.eints are available it is possibletL make a more refined assessment of the Ig' frequency curves and fatigue damage, at the expense ofgreater complicaition in the analysis. However, this is no problem if the calculations are done in a
computer. To ensure that the damage calculations for each individual aircraft in a fleet are compatible,
it is essential that the tg' frequency curves 'hall be defined in the same way.
2. The method described in this appendix was developed for an aircraft fitted with the Mark 14
fatigue meter used in the U.K. (manufactured by Mechanisms Ltd., Croydon, U.K.) This meter records atthe &g threshold levels of:-
LI = -2.5g, L2 = -1.5g, L3 = -0.75g, L4 = +0.75g, L5 = +1.5g, L6 = +2.5g, 7 = L8 = +6.0g
3. The total 'g' spectrum is divided into the turbulence ct.mponent and manoeuvre component asdescribed in Section 4. Each component is analysed as follows:-
LI--
(7- O-ar.
L,- L ---
(L %0 E. )(
I•o E, E7 E I.• IS• F...rS/E)_EJ
a) Manoeuvre Component
1) Fit a cubic equation to points P,Q,R,S.
2) As E is usually either zero, or such a small value that it cannot be regarded asstatistigally silnificant, the point (L8, E8) is ignored. But it is necessary to considerlcads higher than L7 in the damage calculation, and also to set a consistent upper limit forthe calculation for every aircraft in a fleet. For t-,iu type of meter, this upper limit wasset atAg = 5.0. Therefore the cubic equqtion is used to find the frequency E correspondingtoeL =55. 0
3) Defining L. = .425L + .5?5L, the fatigue damage for the manoeuvre component is thencalculated in The usual way, dividing the frequency curve into 'blocks* at O.2g incrementsof L, from L = 0.2-)5, and associating each &.E value with the average value of f| ?or theblock.
b) Turbulence Component
4) Fit a quadratic equation to points T,U,V.
5) Find the least value of L, which is a multiple of O.2g, for which E< E.. Let this value=Lo
6) Defining LG = 1 ±+ L, the fatigue damage for the gust component is calculated in the sameway as for the manoeuvre component, from L = 0.2+, .
7) Add manoeuvre and gust damage, and add in any GTAC damage.
gI
3-AI-2
This method for defining the Ag frequency curves inside the computer, and then extrapolatl-.gthem to cover the low frequency end of the spectrum, may create problems if E1 Pnd/or 1; is sbnormallyhigh or low, or zero, Provision has to be made in the programm3 to allow for this data.T
In the event that El or E is abnormally high relative to the other values of E ,the computedcurve may curl right over at hirh vwlues of L so that AE becomes negative. If no steps are taken toidentify this condition, an incorrect damage estimate will result, or the programme •ay fail. In orderto prevent either of these results occurring, tVe programme must be written a) to accept n n.~ativeAEwithout failingb) so that when a negative lE occurs, a warning marker is output instead of a damage orF.I. value. In this w,,y a whole batch of records can be processed without interruption, and then the"failures" can be identified afterwards and investigated to see what was wrong with the 'g' counts.
In the event t iat E, or E7 is zero, the prograr.me should be written to accept the remainingor 3 points (as appropriatel, and fit those to either a linear equation instead of a quadratic(if E o), or a quadratic equation instead of a cubic (if E_. a).
[
I-
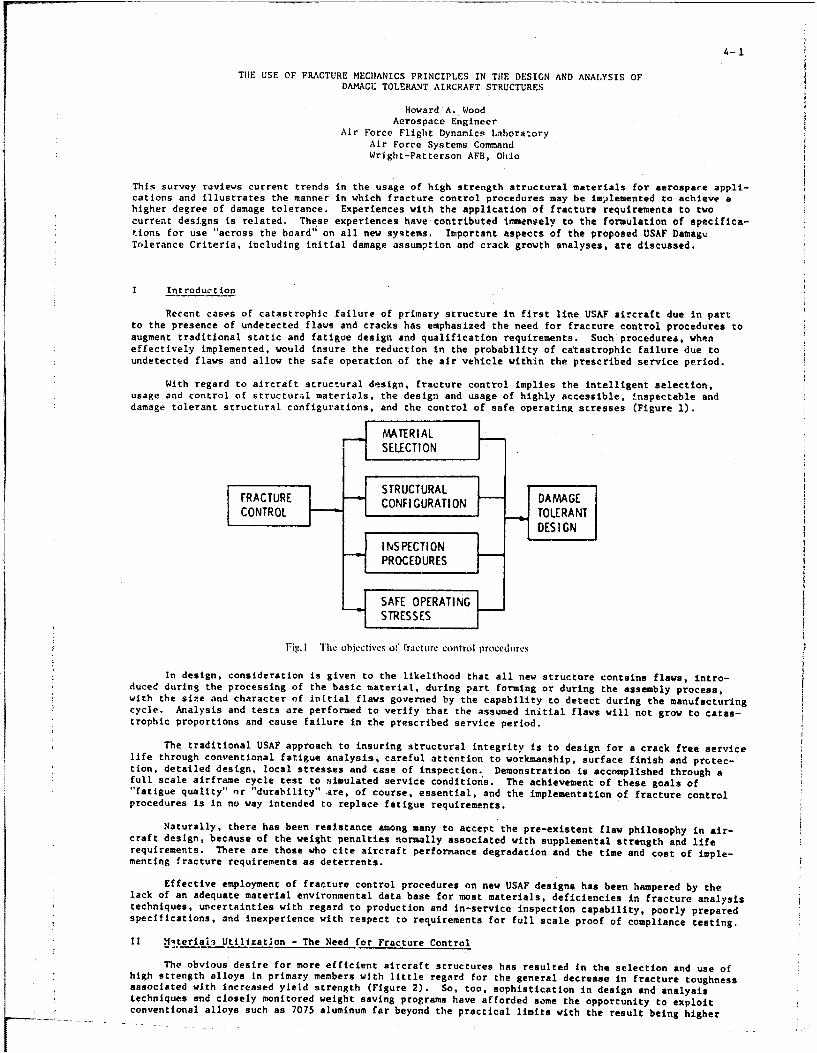
4-I
THE USE OF FRACTURE MECHANICS PRINCIPLES IN TIHE DESIGN AND ANALYSIS OFDAMAGE TOLERANT AIRCRAFT STRUCTURES
Howard A. WoodAerospace Engineer
Air Force Flight Dynamics LaboratoryAir Force Systems CommandWright-Patterson AFB, Ohio
This survey reviews current trends in the usage of high strength structural materials for aerospace appli-cations and illustrates the manner in which fracture control procedures may be imlemented to achieve ahigher degree of damage tolerance. Experiences with the application of fracture requirements to twocurrent designs is related. These experiences have contributed immensely to the formulation of specifics-tions for use "across the board" on all new systems. Important aspects of the proposed USAF Damag.Tolerance Criteria, including initial damage assumption and crack growth analyses, are discussed.
I Introduction
Recent cases of catastrophic failure of primary structure in first line USAF aircraft due in partto the presence of undetected flaws and cracks has emphasized the need for fracture control procedures toaugment traditional static and fatigue design and qualification requirements. Such procedures, wheneffectively implemented, would insure the reduction in the probability of catastrophic failure due toundetected flaws and allow the safe operation of the air vehicle within the prescribed service period.
With regard to aircraft structural design, fracture control implies the intelligent selection,usage and control of structural materials, the design and usage of highly accessible, inspectable anddamage tolerant structural configurations, and the control of safe operating stresses (Figure 1).
I• MATERIAL •
F [SELECTION
FRACT:URE CONFI GURATI ON DAMAGECONITROL TOLERANT
DES IGN_ INSPECTI ON F-
POEDURES
.• SAFE OPERATING
STRESSES
Fig. I The objcctivcs of fracture control procedures
In design, consideration is given to the likelihood that all new structure contains flaws, intro-duced during the processing of the basic material, during part forming or during the assembly process,with the size and character of initial flaws governed by the capability to detect during the manufacturingcycle. Analysis and tests are performed to verify that the assumed initial flaws will not grow to catas-trophic proportions and cause failure in the prescribed service period.
The traditional USAF approach to insuring structural integrity is to design for a crack free servicelife through conventional fatigue analysis, careful attention to workmanship, surface finish and protec-tion, detailed design, local stresses and case of inspection. Demonstration is accomplished through afull scale airframe cycle test to simulated service conditiors. The achievement of these goals of"fatigue quality" or "durability" are, of course, essential, and the implementation of fracture controlprocedures is in no way intended to replace fatigue requirements.
Naturally, there has been resistance among many to accert the pre-existent flaw philosophy in air-craft design, because of the weight penalties normally associated with supplemental strength and liferequirements. There are those who cite aircraft performance degradation and the time and cost of imple-menting fracture requirements as deterrents.
Effective employment of fracture control procedures on new USAF designs has been hampered by thelack of an adequate material environmental data base for most materials, deficiencies in fracture analysistechniques, uncertainties with regard to production and in-service inspection capability, poorly preparedspecifications, and inexperience with respect to requirements for full scale proof of compliance testing.
II HAteriaii Utilization - The Need for Fracture Control
The obvious desire for more efficient aircraft structures has resulted in the selection and use ofhigh strength alloys in primary members with little regard for the general decrease in fracture toughnessassociated with increased yield strength (Figure 2). So, too, sophistication in design and analysistechniques atnd closely monitored weight saving programs have afforded some the opportunity to exploitconventional alloys such as 7075 aluminum far beyond the practical limits with the result being higher
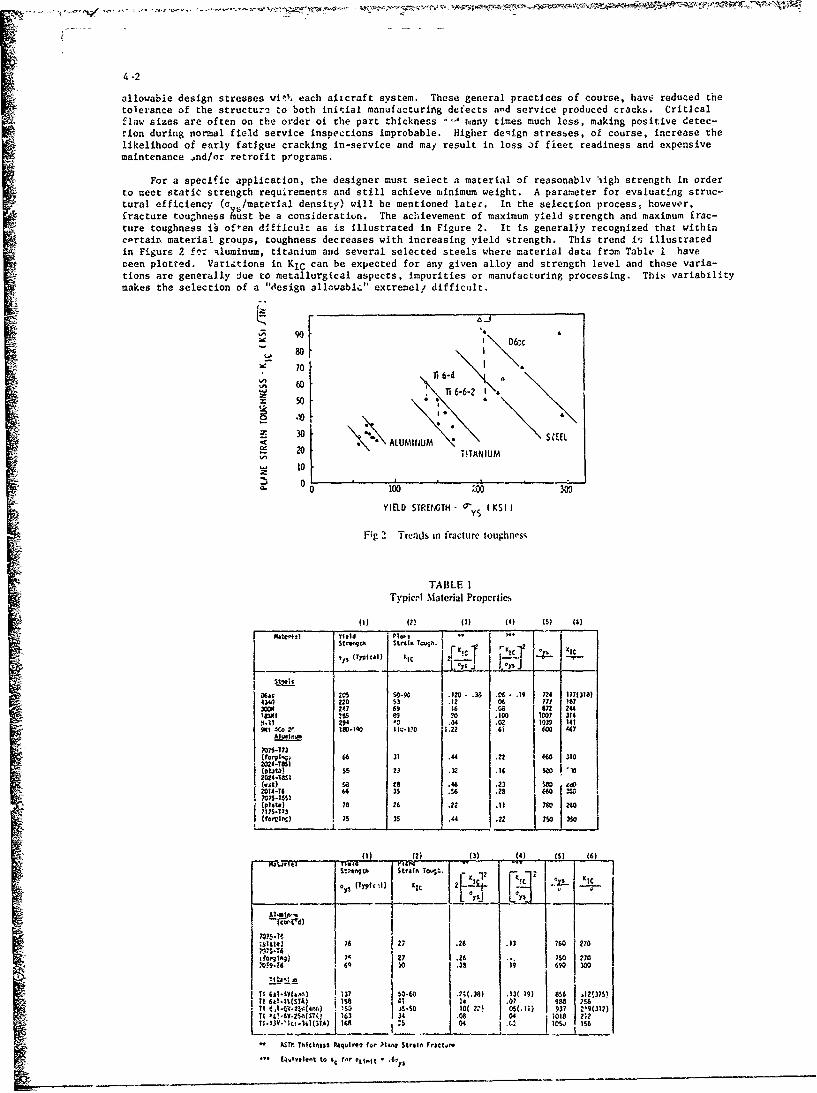
4-2
allowable design stresses wit. each aircraft system. These general practices of course, have reduced thetolerance of the structure to both initial manufacturing defects and service produced cracks. Criticalflaw sizes are often on the order ot the part thickness -4 many times much less, making positive eetec-rion during normal field service inspections improbable. Higher deqign stresbes, of course, increase thelikelihood of early fatigue cracking in-service and may result in loss 3f fleet readiness and expensivemaintenance .nd/or retrofit programs.
For a specific application, the designer must select a material of reasonably iigh strength in orderto meet static strength requirements and still achieve minimum weight. A parameter for evaluating struc-tural efficiency (o.a/material density) will be mentioned latec. In the selection process, however,fracture toughness must be a consideration. The achievement of maximum yield strength and maximum frac-ture toughness iý often dlfticult as is Illustrated in Figure 2. It is generally recognized that withincprtairn material groups, toughness decreases with increasing yield strength. This trend i-, illustratedin Figure 2 f--z qluminum, titanium and several selected steels where material data from Table i haveoeen plotted. Varlztions in KIC can be expected for any given alloy and strength level and these varia-tions are generally due to metallurgical aspects, impurities or manufacturing processing. This variabilitymakes the selection of a "design allowable" extremell difficult.
.4j
S90"
t I-
S 70~Ti 6-4
~ WI * \ 6-6-2\ 1
YIELD STRENGTH- 'Y (K
Fig 2 Tr20ds n fracture 1oughnes•
TABLE I
Typicr•l Material Properties
0 100.1 "DO,. 300*T
Sriogri STrensin fractu.re toughness
TABLE?
__ 247 69 I 16 '.66 872 6
{o |, 66 31 .44 .22 4 4'..0 310
2 y4-Tield(vzt) 0"4 z .46 .23 | e .
201490 4. 3 . 36 .28 .9 74 ;33
{pla1e) 78 26 .22 .11 17 314(N. 11 ) 2s 3- .04 .02 0 141
(r¶i)- () { JY) V 4 OW ! (•
1 D- I1-?1 __
7075473I
lit)) 76 27 2 .26 .1 3 760 S70
(wit)6 $a t 6 23 M
27 27 .26 750 .70
707846m ;5 30 .38 1 60 0
,4 6t1-35(STA) 716 2726 .07 08 2•05
T1 it--'-m,:(6'.(• s 2, (-SO 8) .1( 19) i 037 2'9(.12)
•t ** [!4Y- l|¢ j t 16 34 .00604 1018 2r12L= I
AMf. YhiCI66,1 Req4.lr.1 for P14rq Stralot frsct~r.4E,.,.olet to 4. r 'L1i4t '6 i
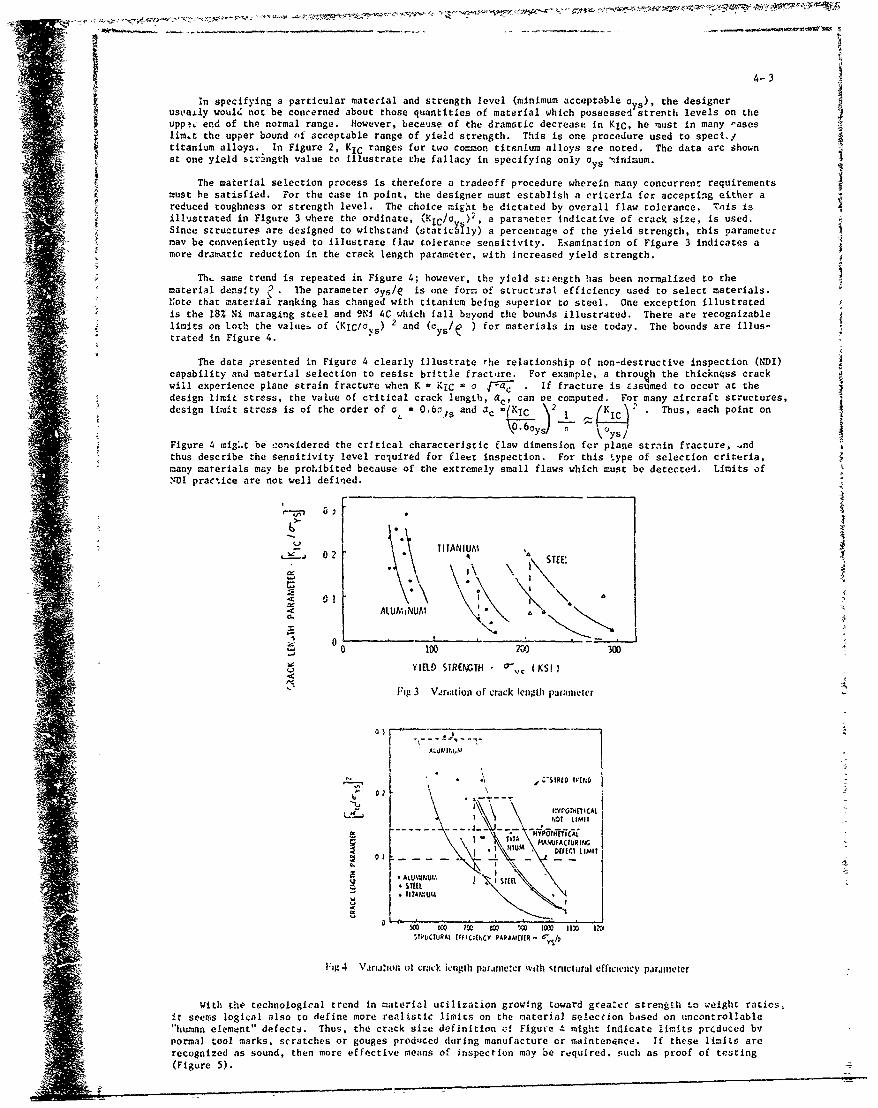
4- 3
In specifying a particular material and strength level (minimum acceptable oys), the designerustaily would not be concerned about those quantities of material which possessed strenth levels on theupped end of the normal range. However, because of the dramatic decrease in KIC, he must in many "aseslimt the upper bound of acceptable range of yield strength. This is one procedure used to speceta .titanium alloys. In Figure 2, KIC ranges for two commion titanium alloys ace noted. The data are shownat one yield sv.angth value to illustrate the fallacy in specifying only Oy, "lnimum.
The material selection process is therefore a tradeoff p'ocedure wherein many concurrent requirementsmust he satisfied. For the case in point, the designer must establish a criteria fcr accepting either areduced toughness or strength level. The choice might be dictated by overall flaw tolerance. Tnis isillustrated in Figure 3 where the ordinate, (Kic/ow), a para':eter indicative of crack size, is used.Since structures are designed to withstand (staticHly) a percentage of the yield strength, this parametermay be conveniently used to illustrate flaw tolerance sensitivity. Examination of Figure 3 indicates amore dramatic reduction in the crack length parameter, with increased yield strength.
Th. same trend is repeated in Figure 4; however, the yield stength has been normalized to thematerial density h. Te parameter Oys/e is one form of structzrat efficiency used to select materials.Note that material ranking has changed with titanium being superior to steel. One exception illustratedis the 18% Ni maraging steel and 9Ni 4C which fall beyond the bounds illustrated. There are recognizable.limits on toth the values of (KIc/o. 5 ) 2 and (y ) for materials in use today. The bounds are illus-trated in Figure 4. y
The data presented in Figure 4 clearly illustrate rhe relationship of non-destructive inspection (NDI)capability and material selection to resist brittle fracture. For example, a throujh the thicknqss crackwill experience plane strain fracture when K - KIC - 0 !•c If fracture is assumed to occur at thedesign limit stress, the value of critical crack length, a., can oe computed. For many aircraft structures,design limit stress is of the order of a - 0.6o,, and ac (KIC \2 KIC . Thus, each point on
TO 6cys)~T \ ~5Figure 4 mig,.t be -.onqidered the crItical characteristic flaw dimension for plane strain fracture, .ndthus describe the sensitivity level required for fleet inspection. For this type of selection criteria,many marerials may be prohibited because of the extremely small flaws which must be detected. Limits ofYDI practice are not well defined.
" -- ~T ITANI UM
S0 2 TIAIMSTEE'
* \
ALUM; NUM•t .. cZi I I•2 01 4 C"' "'0.j
0 100 2Ow 300
YIELD STRENGTH I (KSI!
Fig 3 Variation of crack length parameter
, . . . _ _* tsiw (~.4.. - - yron.H CAL
F- - * HYPOrMnICAL (1 A -•TUA - - -A"VS
N r eh offt l LIMIT
normaltoo! mrks, sraiche o ar g ouge podrck eddrngh manuactuerewt otdra effiinenncy.I prmtherelm r
4 recognized as sound, then more effective means of inspection may be required. .sueh as proof of testing(Figure 5).
OfZ
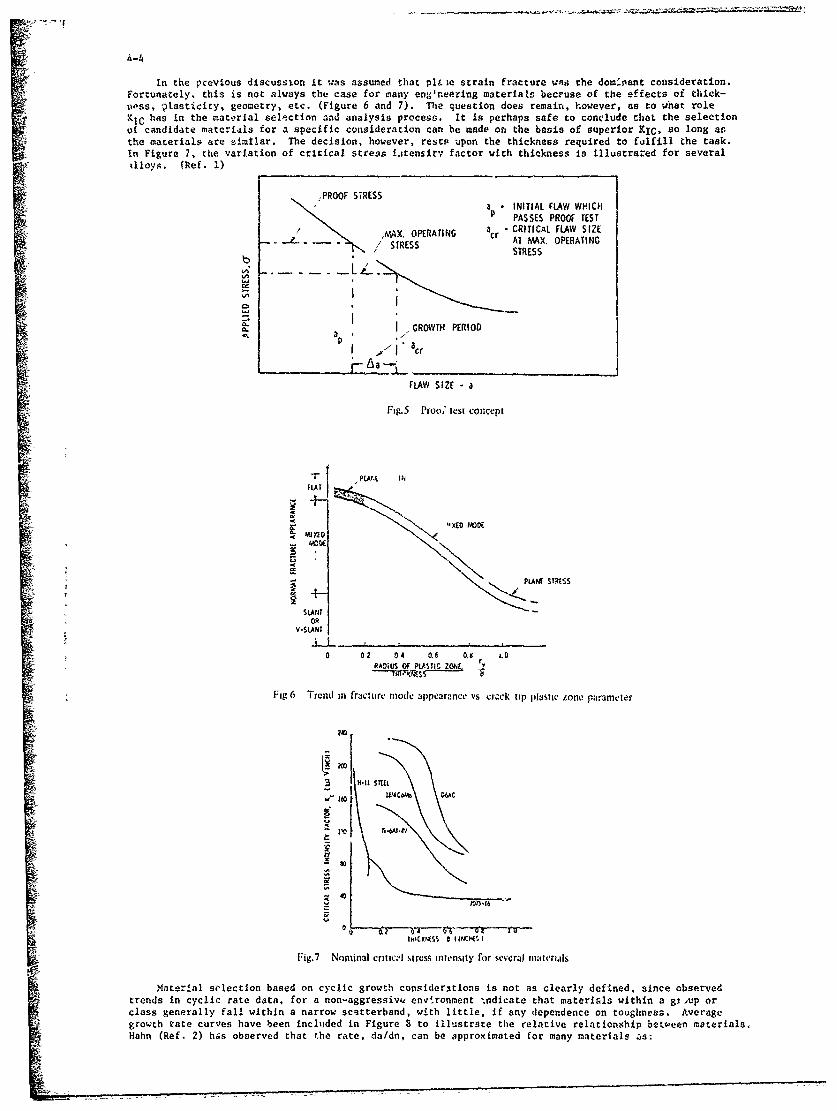
in the previous discussion it was assumed that plLie strain fracture was the domisant consideration.Fortunately. this is not always the case for many engrneering materials becruse of the effects of thick-ness, ?tasticity, geometry, etc. (Figure 6 and 7). The question does remain, however, as to whar roleKiC has in the material selection and analysis process. It is perhaps safe to conclude that the selectionof candidate materials for a specific consideration can be made on the basis of superior KIC, so long as.the materialst are simflar. The decision, however, rests upon the thickness required to fulfill the task.In Figure 7, the variation of critical stress i.stensitv factor with thickness is illustrated for severalAlloys. (Ref. 1)
' ~PROOF STRESSa S INITIAL FLAW WHICH
PASSES PROOF TEST
/• ,X, OPERATING "ir CRITICAL FLAW SIZE.. ,/ STRESS AT MAX. OPERATING
STRESSb
-..
- J ,GROWTH PERIODSap ,/ .
raar
FLAW SIZE - a
Fig.5 Proo," test concept
FLAT
I-E MI)5
FLAW STRE$S
SLA 11OR
0 02 04 0.6 0.s LORANOUS OF PLASTIC ZONE !
Fig 6 Trend in fracture mode appearance vs cr,.,k tip plastic zone paraniet•r
3 H-.! SITIL
.-
SI"0 n t l
40
Fig.7 Noninal critrc' %tress intensity for several inaIteri'Ils
Mater.al selection based on cyclic growth consider3tions is not as clearly defined, since observedtrends in cyclic rate data, for a non-aggressivv envtronment ".ndicate that materials within a gTrup orclass generally fall within a narrow scatterband, with little, if any dependence on toughness, Averagegrowth rate curves have been incltuded in Figure 3 to illustrate the relative relationship between materials,Hahn (Ref. 2) hbs observed that the rate, da/dn, can be approximated for many materials zs:
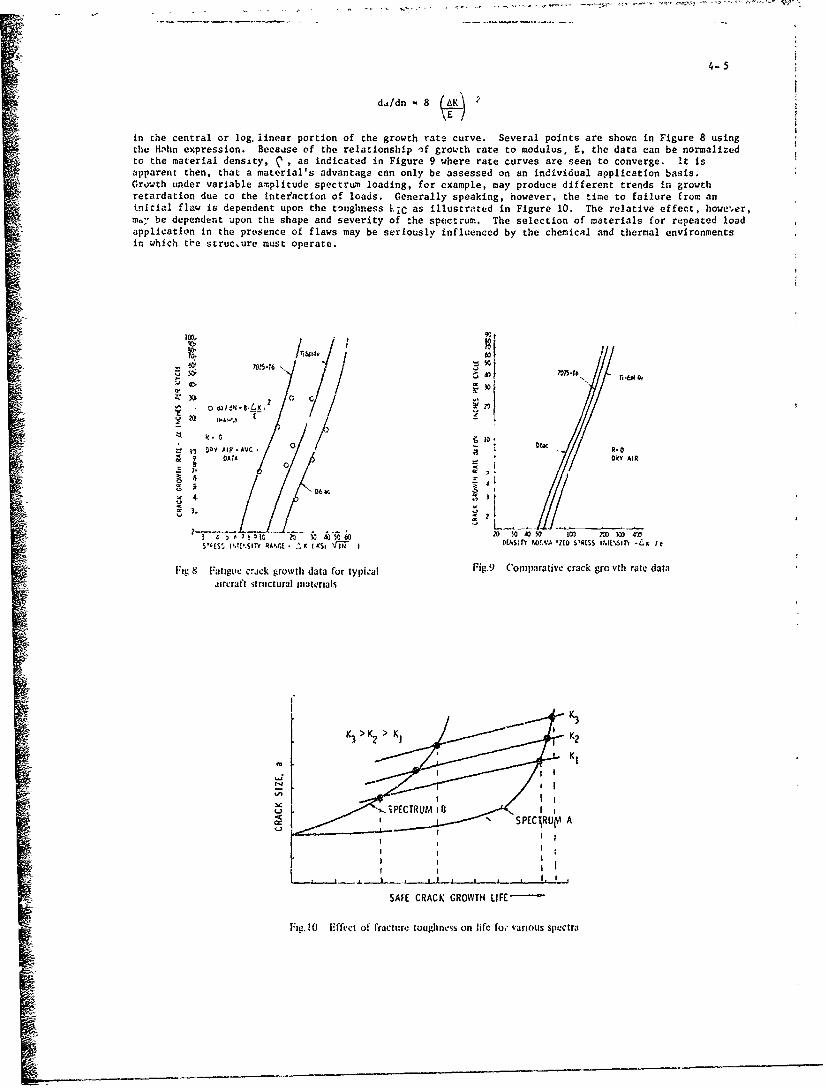
4-5
dd/dn ,8 (__
YE--
in the central or log, linear portion of the growth rate curve. Several points are shown in Figure 8 usingthe HMThn expression. Becaase of the relationship if growth rate to modulus. E, the data can be normalizedto the material density, ? , as indicated in Figure 9 where rate curves are seen to converge. It isapparent then, that a material's advantage can only be assessed on an individual application basis.Growth under variable amplitude spectrum loading, for example, may produce different trends in growthretardation due to the inter'action of loads. Generally speaking, however, the time to failure from aninitial flaw is dependent upon the toughness 1,1C as illustrated in Figure 10. The relative effect, howe,ýer,m.:, be dependent upon the shape and severity of the spectrum. The selection of materials for repeated loadapplication in the presence of flaws may be seriously 'nfluenced by the chemical and thermal environmentsin which t0e struc~ure must operate.
-- /L. ..
Alis SP lP0G .1so
-4 4
DPYa AI AGR
"3.I
S'•(S$, I.T[.SI r'Y E,.Gt - K,1 i 'KS N D~hS~fn WN Z10 sIrSS INIE'6INh -L*K It
Fig 8 Fatngve crack growth data for typical Fig.9 Comparative crack gro vth rate dataaircraft structural materials
K 3K 3>K > K, K2
K?
*' SPECIRUP A
'--L-c I_ I Ioo v sSAFE CRACK GROWTH LIFE"-'-'
Fi•g. 10 i-ffcc! of fracttur,; toughness on life fo," various spe:ctra
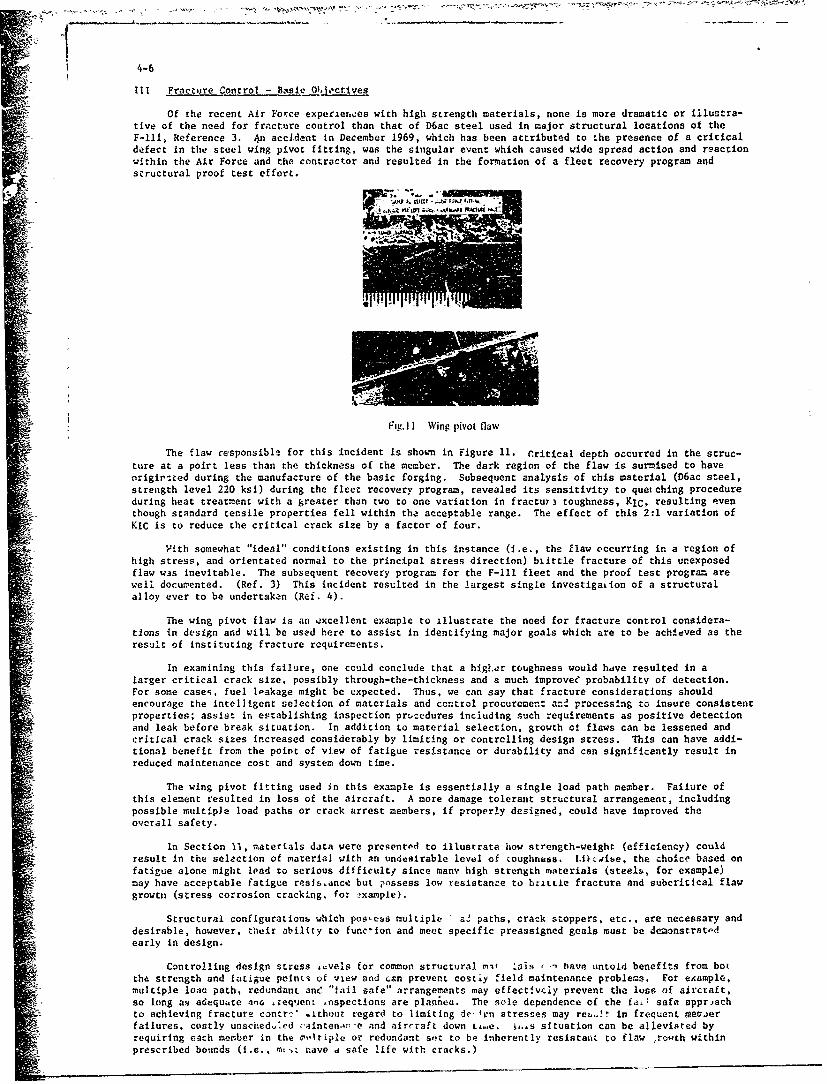
4-6
III Fracture Control Basic O1,jectives
Of the recent Air Force experxet,"es with high strength materials, none is more dramatic or illustra-tive of the need for fracture control than that of D6ac steel used in major structural locations of theF-Ill, Reference 3. 4n accident in December 1969, which has been attributed to the presence of a criticaldefect In the steel wing pivot fitting, was the singular event which caused wide spread action and reactionwithin the Air Force and the contractor and resulted in the formation of a fleet recovery program andstructural proof test effort.
Fig. I I Wing pivot flaw
The flaw responsible for this incident is shown in Figure II. Critical depth occurred in the struc-ture at a poirt less than the thickness of the member. The dark region of the flaw is surmised to haveorigirted during the manufacture of the basic forging. Subsequent analysis of this material (D6ac steel,strength level 220 ksi) during the fleet recovery program, revealed its sensitivity to quetching procedureduring heat treatment with a greater than two to one variation in fractuy) toughness, KIC, resulting eventhough standard tensile properties fell within the acceptable range. The effect of this 2:1 variation of
-' KIC is to reduce the critical crack size by a factor of four.
Vith somewhat "ideal" conditions existing in this instance (i.e., the flaw occurring in a region ofhigh stress, and orientated normal to the principal stress direction) bilttle fracture of this unexposedflaw was inevitable. The subsequent recovery program for the F-Ill fleet and the proof test program arewell documented. (Ref. 3) This incident resulted in the largest single investigation of a structuralalloy ever to be undertaken (Ref. 4).
The wing pivot flaw is an excellent example to illustrate the need for fracture control considera-tions in design and will be used here to assist in identifying major goals which are to be achieved as theresult of instituting fracture requirements.
In examining this failure, one could conclude that a higi.4r toughness would hdve resulted in alarger critical crack size, possibly through-the-thickness and a much improvee probability of detection.For some cases, fuel lpakage might be expected. Thus, we can say that fracture considerations shouldencourage the intelligent selection of materials and control procurement and processlng to insure consistentproperties; assist in establishing inspection prccedures including such requirements as positive detectionand leak before break situation. In addition to material selection, growth of flaws can be lessened andcritical crack sizes increased considerably by limiting or contrclling design stress. This can have addi-tional benefit from the point of view of fatigue resistance or durability and can significantly result inreduced maintenance cost and system down time.
The wing pivot fitting used in this example is essentially a single load path member. Failure ofthis element resulted in loss of the aircraft. A more damage tolerant structural arrangement, includingpossible multiple load paths or crack arrest members, if properly designed, could have improved theoverall safety.
In Section 1l, materials data were presented to illustrate how strength-weight (efficiency) couldresult in the selection of material with an undesirable level of coughnuss. Liblse, the choice based onfatigue alone might lead to serious difficult/ since many high strength materials (steels, for example)may have acceptable fatigue resistance but possess low resistance to brittle fracture and subcritical flawgrowtsi (stress corrosion cracking. for example).
Structural configuratiorib which pos'-CSS Multiple - a. paths, crack stoppers, etc., are necessary anddesirable, however, their ability to function and meet specific preassigned goals must be demonstratedearly in design.
Controlling design stress .vels for cormmon structural n, lals - have untold benefits from botthe strength and fatigue points of view and can prevent costiy field maintenance problems. For eAample,multiple luau path, redundant ane "tail safe" arrangements may effectwvcly prevent the luss of aircraft,so long as adequate and ýrequenL onspections are plannea. The sole dependence of the fail safe approachto achieving fracture contre" ,itho•ut regard to limiting de.f•!n stresses may reb!t in frequent Metraerfailures, costly unsched.:.ed ,ainten'-:e and aircraft down t&,e. ,..s situation can be alleviated byrequiring each menber in the m,'ltiple or redundant sct to be inherently resistant to flaw ,ro'ch withinprescribed bounds (i.e., n ave a safe life with cracks.)
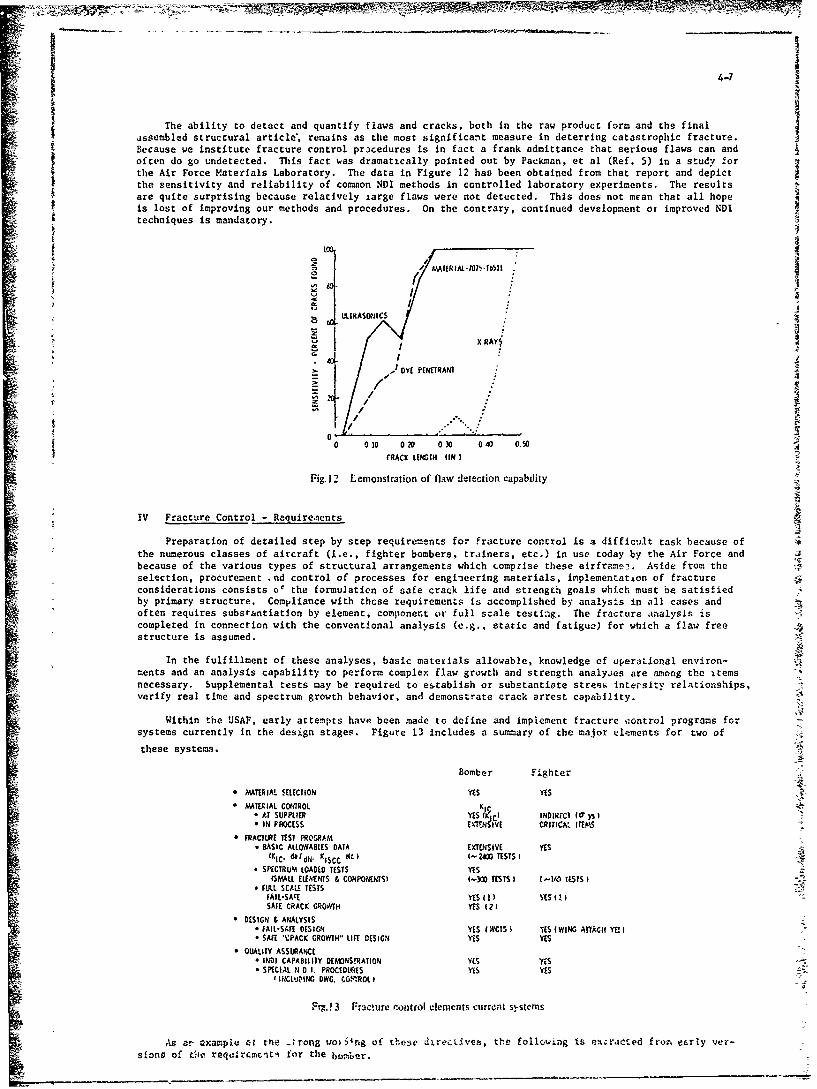
The ability to detect and quantify flaws and cracks, both in the raw product form and the finalassembled structural article*, remains as the most significant measure in deterring catastrophic fracture.Because we institute fracture control procedures is in fact a frank admittance that serious flaws can andoften do go undetected. This fact ias dramatically pointed out by Packkman, et al (Ref. 5) in a study forthe Air Force Materials Laboratory. The data in Figure 12 has been obtained from that report and depictthe sensitivity and reliability of common NDI methods in controlled laboratory experiments. The resultsare quite surprising because relatively iarge flaws were not detected. This does not mean that all hopeis lost of improving our methods and procedures. On the contrary, continued development or improved NDItechniques is mandatory.
t /
SM A TER IAL .10 15- 165 1 .1
a- //.'D(.E€,• .
S0 00 020 030 0 40 0.50StRACK S EH (IN
Fig.12 Eemonstration of Ilaw detection capability
AIV Fracture Control - Requirenents
~~~Preparation odealdstep by step requirements frratecotlisa ifc'ttask because of
the numerous classes of aircraft (i.e., fighter bombers, traiiners, etc.) in use today by the Air Force andbecause of the various types of structural arrangements which comprise these airfreamr•. Aside from theselection, procurement ,rid control of processes for engineering materials, irnplement~at~on of fractureconsiderations consists c€ the formulatien of safe crack life and strength goals which must be satisfiedby primary structure. Compliance with these requirements is accomplished by analysis in all cases andoften requires substantiation by element, component or" full scale testing. The fracture analysis iscompleted in connection with the conventional analysis (e.g., static and fatigue) for which a flaw freestructure is assumed.
ln the fulfillment of these analyses, basic materials allowable, knowledge of operational environ-ments and an analysis capability to perform complex flaw growth and strength analyses are among the itemsnecessary, Supplemental tests may be required to es.tablish or substantiate stre'sg intersi~y relationships,verify real time and spectrum growth behavior, and demonstrate crack arrest capability.
Within the EISAF, early attempts have been made to define and implement fracture control programs forsystems currently in the design stages. Figure 13 includes a summary of the major elements for two of
these systems.
Bomber Fighter*• •A1TERIAL SEtECTION 115 YES
* MAITEIAL CONTROL RIr,* AT SUPPLIER YtST'I~CI INDIRI'CTI (o"3I* IN PROCESS EX'TENIlVE CRITICA,. IITEMS
* FR1ACTURE TEST PROGRAM* BASIC ALLOWABEES DATA EXTE.NSIVE YESS(KIC. •/dN' gI 5tc dC I 1-2C)O TETS I* SPECTRuM LOADLO TESTS YES
(SMALL ELU4.NTS & CONPO•NETSI (-• TESTS I ( -TAO, ITSTS)* FULL SCALE TESTS
t•AIL-SATE YES(l1 I VE[SIT1SATE CRACK GROCTH YEG (2(
* DESIGN & ANA•LYSIS* FAIL-SATE DESIGN YES (WCTS YE¥S (WING ATnAlf Yti I* SATE t•PACK GROWTH'" LIIE DESIGN YES YES
* QuALITY ASSURANCE* INDI CAPABILITY DEMONSTRATION YES "YES* SPECIAL N. D I. PROCEDL•CES YES YE.S
#INCLJt'ING DWG. (h.?JTROL I
TVg.!3 FracFrurc tontrol elements currhE sy.stens
As at •xampiu cE the ..Trang l•ou~rg of these dr,-reLivcs, the following is ex~rac~ed fro, e~riy vet-s Poni of deaie reqosrymsrti for the bc l d taer.

4-8
". . .Primary structures which are not fail safe shall be designed so that initialflaws or cracks will not propagate to critical crack length during the lifetimeof the aircraft. Tfirough fracture data tests and analysis, the characteristicsand dimensions of the smallest initial defect that could grow to critical sizeduring the service life shall be determined. Once these Initial flaws sizeshave been identified, quality control procedures shall be developed such thatparts containing initial flaws of these dimensions will not be accepted. Inthe event that the identified initial flaws sizes are smaller than the qualitycontrol detection capability, changes shall be made in the materials and/orstress levels so that initial flaws compatible with quality control capabilitycan be tolerated."
rhe requirements were further modified to require that the service life analysis be made with specificr ~Initial c.rack size assurcptians. In other words, the initial crack size Is to be treated as a design
allowable. For example:
".. .These initial defect limits are as follows, (a) In the absence of clpecialNOI procedures as inuicated below, the minimumn allowable defect size shall be0.150" in its critical dimension, i.e., 0.150" deep for a surface flaw... (b)Defects smaller than 0.150" will be allowed if special NDI procedures arefollowed with a demonstrated ability to detect flaws of the required size witha95% prvbabilit7 at a 5O0. confidence level.. ." (This was later amended to95% conf-dence that at least 90% of flaws greater than critical size are found.
The analysis of each parr was to be perform~ed as follows:
"...The analysio shall assume the presence of a crack like defect, placed inthe most unfavor-ole orientation with resprcc to the applied stress andmaterial pzoperties and sliall pree'ict the growth :;e:avior in the chemical,thermal and sustained end cy.:lic stress environment to tznich the componentis eubject."
With regard tc materi~al selection, risagt:-and control, ;icasures were to b'e instituted to insure ade-quate toughness in production. The early version of the requi~rzments Stated
.... Specificatio::6 snail be prepared to Insure inaterial:5 having minimumguarantztc: KIC are used in msanufacture."
While 'he Intent vas certainly sincere, the wording was revised to Lte more direct and more nearly defini-tive.
"..The materialra from which the structures are to be fabricated shall be coft-t~,clIed by a sy~tem of proccdures andi/or specifications which are sufficientto precitzde t61. ~ t~' in fracture critical arcas; of materials ý;ocsessingstatic fracture properties significantly inferior to those aesumed in design."
To those famliar with aircrait struc-ural dttsign ar.d analysis, these requiremnLe~iC seemed profound innature, and Wnen zirculattd among the major airframe manufacturers in 1970, ccrtainly cauced a mild furor.Nevertheless, the basic: meaning of these requirementps is still with uis, both as contra',tual obllgetionso.1 the b~omber program and requiremernts for future syatems.
Because oZ Inexperience, several ittems of the early requirementa needed strengthening, or at least
First. the early requirements laacked sufficient s-rength regarding the safe creck grow-th goels ofnulriple load path or fail safe structure.
rho second point concerns tiie statement regardia-& the c.-r~trol and assutrance of materl.al propertyc!ýnt~scency. This simply means that pt~operties must be guaranteed by tht -ietal producer~s, or thatscreening of otock and aegregation must be performed with the selection of only the superior material forproduction, 3 costly procedure in any case. The qvestion of what properties to control Is often tisked,KIC is the logical ctoicc since it ib tli.e only property for which standards exist, The rate of fatigaecrack growth daWin is perhaps -note significant on life but doe- no, -)pear to be as sensitive to basicmaterial processing procedu7'ss as does the toughness, KIC.I!The third item concerns the idtnr~ficatA7n of fracture ritic -parts. Since the reqtirements stipu-late that all primary members be designed for s&.fe crack growth, a tremendcus bookkeeping task is involved,
to say nothing of the costs incurred in tracing materials, processes and parts through the manufacturingstato and the establi'shment of btandards for field maintenance. 'What will most probably evolve in aspeo'ific design are sensitivity analyses ~or certain parts to examine eftects on life due to materialproperty variation. :nitiai fla'w size, et;. . Whtere applicable, parts will bV further classified as to
* ~function. safety. etc., qo as to lessen Cite string~nt requirements fur traceability and material propertycontrcol on tciose parts where these controls are unwarranted.IV Soameary of New Requirements
The lessons learned in applying fracture nechaniks to these two systems ftns been beneticialin the formulation of general "across the board" udamage tolerant or fracture requirements for future1VSAF aircraft. The nvcrall scheme cujrc-ntly defining these requir~ments is shown in Figure 14 and includen
as majoi documentation, Military Standard 1530, the description of the Air Force Aircraft Structuval
I -rcgram (AMJP). and the detaiiled requirements (IMilitary Specificatlcas) which provide the specific wording
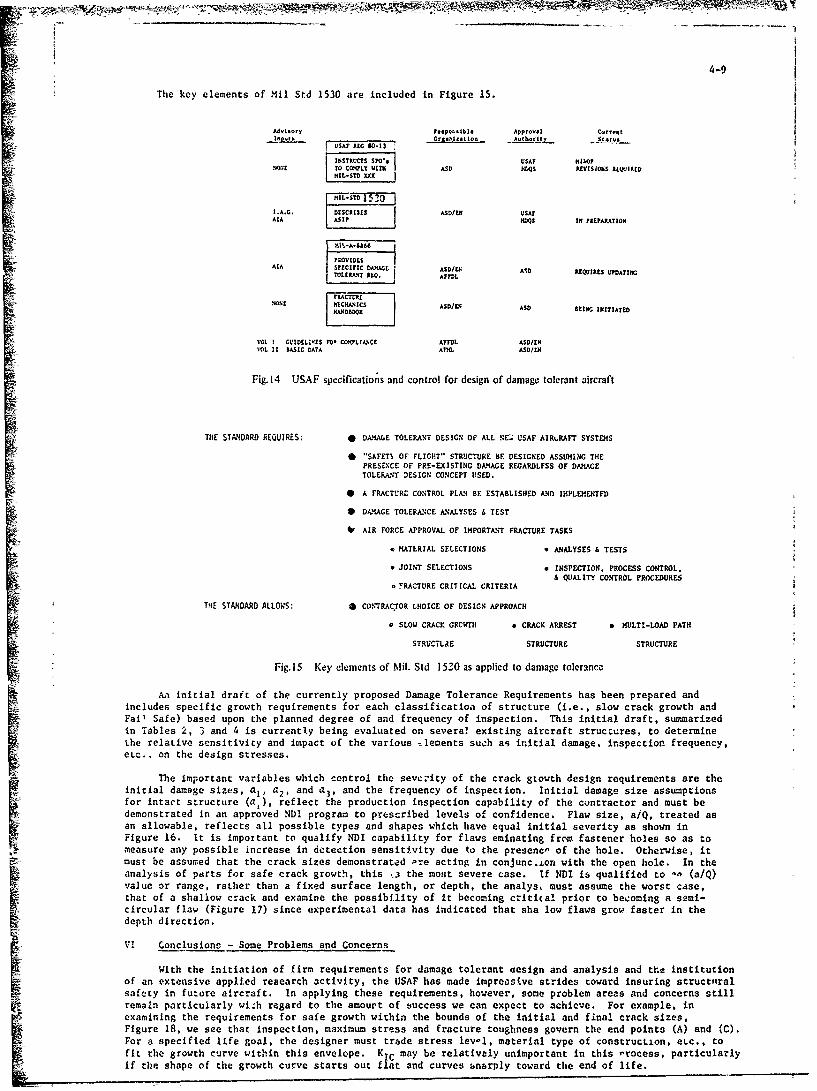
4-9
The key elements of Mil Std 1530 are included in Figure 15.
Adisryle|po.,slbl. Approval C•rr'ntOIt _ _ _s t Ion. Authorlt Stags
7USA" JG 10-13
$ I'$ USAF h11.0?,051 I TO .OQLy UITI ASD Jl"$ ZrVISIONS kl.QVIBU
NIL-STD XKX
I.A.. AS DZSCI UNS ASD/ USAFA A MSQS IN PREEPARATION
P2OvIDrS-AIA SFUCIFIG S •PA • ASD/N ASD IEQUI RES UPDATItO
ITO.,BANT FQ. ArISI.
.40s. IN UC "4 AICS I ASD/UN ASD f2lk INITIATE D
VOL C GVIDILIKE$ Fo' COMILI AWC AFFDL ASD/£N1OL I 9ASIC DATA AM1., ASD/UN
Fig. 14 USAF specificationis and control for design of damage tolerant aircraft
THE STANDARD REQUIRES: * DAMAGE TOLERANT DESIGN OF ALL NEý. USAF AIRLRAFT SYSTEMS
"SAFET1 OF FLIGHT" STRUCTURE BE DESIGNED ASSUMING THEPRESENCE OF PRE-EXISTING DAMAGE REGARDLFSS OF DAMAGETOLERANT DESIGN CONCEPT USED.
• A FRACTURE CONTROL PLAN BE ESTABLISHED AND IHPLEMENTFD
* DA.MAGE TOLERANCE ANALYSES 6 TEST
4W AIR FORCE APPROVAL OF IMPORTANT FRACTURE TASKS
MATERIAL SELECTIONS 9 ANALYSES & TESTS
* JOINhr SELECTIONS * INSPECTION. PROCESS CONTROL.
& QUALITY CONTROL PROCEDURESF YRACTURE CRITICAL CRITERIA
THE STANDARD ALLOWS; * CONTRACTOR LHOICE OF DESIGN APPROACH
9 SLOW CRACK GROWTH * CRACK ARREST K MULTI-LOAD PATH
STRUCTILE STRUCTURE STRUCTURE
Fig. 15 Key elements of Mil. Std 1530 as applied to damage tolerance
Aa initial draft of the currently proposed Damage Tolerance Requirements has been prepared andincludes specific growth requirements for each classificatioa of structure (i.e., slow crack growth andFail Safe) based upon the planned degree of and frequency of inspection. This initial draft, summarizedin Tables 2, 3 and 4 is currently being evaluated on several existing aircraft structures, to determinethe relative sensitivicy and impact of the various -lenents such as initial damage, inspection frequency,etc., on the design stresses.
The important variables which control the severity of the crack giowth design requirements are theinitial damage sizes, a,, a 2 , and a3, and the frequency of inspection. Initial damage size assumptionsfor intact structure (a,), reflect the production inspection capability of the contractor and must bedemonstrated in an approved NDI program to prescribed levels of confidence. Flaw size, a/Q, treated asan allowable, reflects all possible types and shapes which have equal initial severity as shown inFigure 16. It is important to qualify NDI capability for flaws eminating from fastener holes so as tomeasure any possible increase in detection sensitivity due to the presence, of the hole. Otherwise, itmust be assumed that the crack sizes demonstrated Pre acting in conjunc.,on with the open hole. In theanalysis of parts for safe crack growth, this ý.: the most severe case. If NDI is qualified to -- (a/Q)value or range, rather than a fixed surface length, or depth, the analys, must assume the worst case,that of a shallow crack and examine the possibility of it becoming critical prior to becoming a semi-circular flaw (Figure 17) since experimental data has indicated that sha low flaws grow faster in thedepth direction.
V. Conclusions - Some Problems and Concerns
With the initiation of firm requirements for damage tolerant oesign and analysis and the- institutionof an extensive applied research activity, the USAF has made impreasive strides toward insuring structuralsafety in future aircraft. In applying these requirements, however, some problem areas and concerns stillremain particularly wizh regard to the amourt of success we can expect to achieve. For example, inexamining the requirements for safe growth within the bounds of the initial and final crack sizes,Figure 18, we see that inspection, maximum stress and fracture toughness govern the end points (A) and (C).For a specified life goal, the designer must trade stress levw1, material type of construction, esc., tofit the growth curve within this envelope. KIC may be relatively unimportant In this "rocess, particularlyif the shape of the growth curve starts out flat and curves snarply toward the end of life.
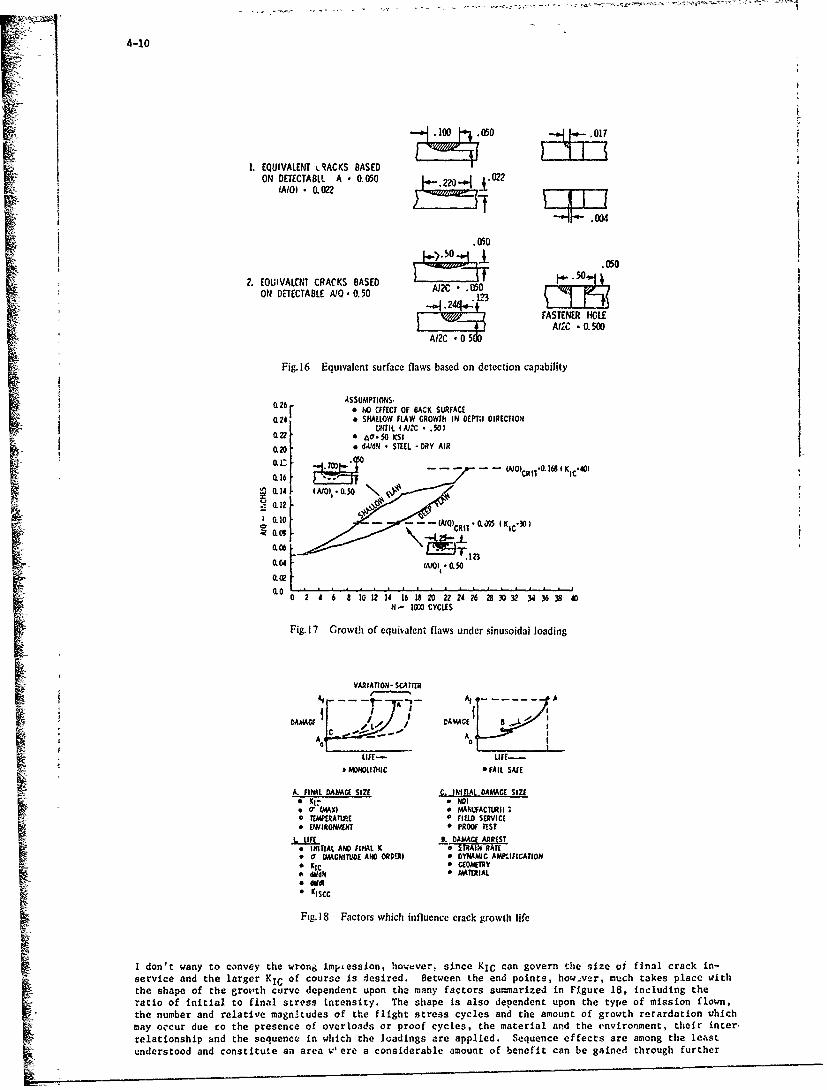
4-10
-. 100 11.050 .017
1. EQUIVALENT LRACKS BASED ION DETECTABLL A 0.050 . 022
(AID)~ FrT?02
.050
.050
2. EQUIVALENT CRACKS BASED 14. C50.11ON DETECTABLE AIQ. 0.50 1,• 3
FASTENER HOLEAI2C 0. 500
FA62C • o0 s
SFig.16 Equivalent surface flaws based on detection capability
a 26 ASSUMPTIONS.I 0.r6 NO (FFECT OF BACK SURFACEI 0,24 * SHALLOW FLAW GROWTh IN DE'PTH DIRECTION
0.2 UTIL (A/2C - .%)O.Z• ~ a 5 0-0 KSI
0.20 dAldN. STEEL -DRY AIR I"0,0]1 jý ?° - W_ • . .UO)•,H,.O. 166 K.^.4DJn
0.14 ),. - •L ,50
0.1S0.10 oQCR • ( K C-*
0.04 (A/I0I 0. " 10
' 246 S 10 12 14 16 18 20 22 24 26 28 30 32 3 36 38 AN ,- 100 CYCLES
Fig. 17 Growth of equivalent flaws under sinusoidal loading
VARIATION- SCATT l•
t -- - - A
A
A
LIFE- LIFE-..MONODLITHIC * FAIL SAFl
A. FIML DAM.E SIZE C. INITIAL OAMACE SIZEC l~•NDI
O" UMAX) * MANACT1cII RSTEMPERAI1•ME FIELD SERVICE
* EINIRONA PROOF TEST_L ME Ii. DIMCE ARREST
* INItIAl. AND FINAL. K - 7TAIN RATEOr U MAGNITLIDE AND ORM)I a DYNMMIC AW.PIFICATIONKIC e CEONA'IY
4 dldN * MATERIAL
•KISCC
Fig. 18 Factors which influence crack growth life
I don't wany to convey the wrong impiession, however, since KIC can govern the size of final crack in-service and the larger KIC of course is desired. Between the end points, how.ver, much takes place withthe shape of the grovith curve dependent upon the many factors summarized in Figure 18, including theratio of initial to final stress intensity. The shape is also dependent upon the type of mission flown,the number and relative magnitudes of the flight stress cycles and the amount of growth retardation uhichmay occur due to the presence of overloads or proof cycles, the material and the c.nvironment, their inter.relationship and the sequence in which the loadings are applied. Sequence effects are among the leastunderstood and constitute an area v'ere a considerable amount of benefit can be gained through further
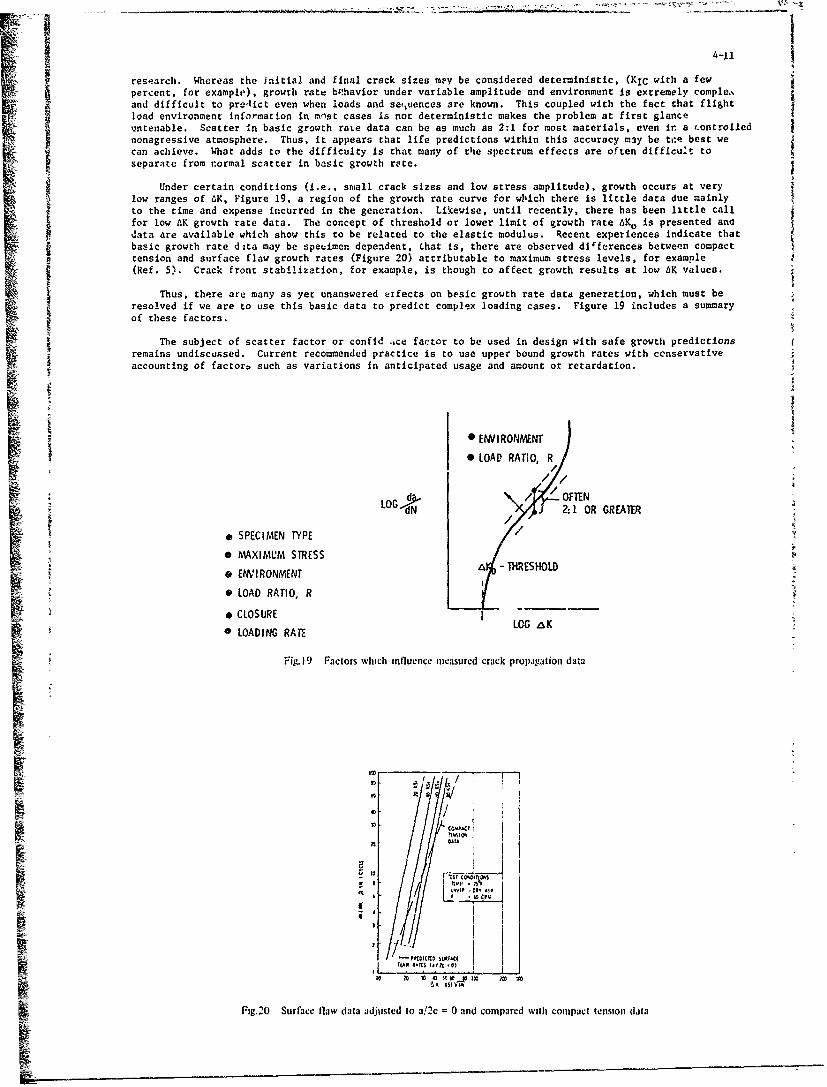
4-11
research. Whereas the initial and final crack sizes mey be considered deterministic, (KIC with a fewpercent, for example), growth rate behavior under variable amplitude and environment is extremely comple.and difficult to predlct even when loads and seuences are known. This coupled with the fact chat flightload environment information in mi)st cases is nor deterministic makes the problem at first glanceuntenable. Scatter In basic growth rate data can be as much as 2:1 for most materials, even in a controllednonagressive atmosphere. Thus, it appears that life predictions within this accuracy may be tn-e best wecan achieve. What adds to the difficulty is that many of the spectrum effects are often difficult toseparate from normal scatter in basic growth rate.
Under certain conditions (i.e., small crack sizes and low stress amplitude), growth occurs at verylow ranges of AK, Figure 19, a region of the growth rate curve for wlich there is little data due mainlyto the time and expense incurred in the generation. Likewise, until recently, there has been little callfor low AK growth rate data. The concept of threshold or lower limit of growth rate AKo is presented anddata are available which show this to be related to the elastic modulus. Recent experiences indicate thatbasic growth rate dita may be specimen dependent, that is, there are observed differences between compacttension and surface flaw growth rates (Figure 20) attributable to maximum stress levels, for example(Ref. 5). Crack front stabilization, for example, is though to affect growth results at low AK values.
Thus, there are many as yet unanswered etfects on besic growth rate data generation, which must beresolved if we are to use this basic data to predict complex loading cases. Figure 19 includes a summaryof these factors.
The subject of scatter factor or confid ..ce factor to be used in design with safe growth predictionsremains undiscussed. Current recommended practice is to use upper bound growth rates with conservativeaccounting of factor., such as variations in anticipated usage and amount ot retardation.
"I i * ENVIRONMENT
LOAD RATIO, R/
LO~p / OFTENdN
2:1 OR GREATER
SSPECIMEN TYPE
* MAXIMUM STRESS': • -T H R E S H4 0 L D,
* ENVIRONMENT
0 LOAD RATIO, R
o CLOSURE L
* LOADING RATE
Fig.19 Factors which influence measured crack propagation data
a,, 51,,iga Fig.20 Surfac flaw iota ajllstc to a/ c= 0andc om ae ih c m ac sold t
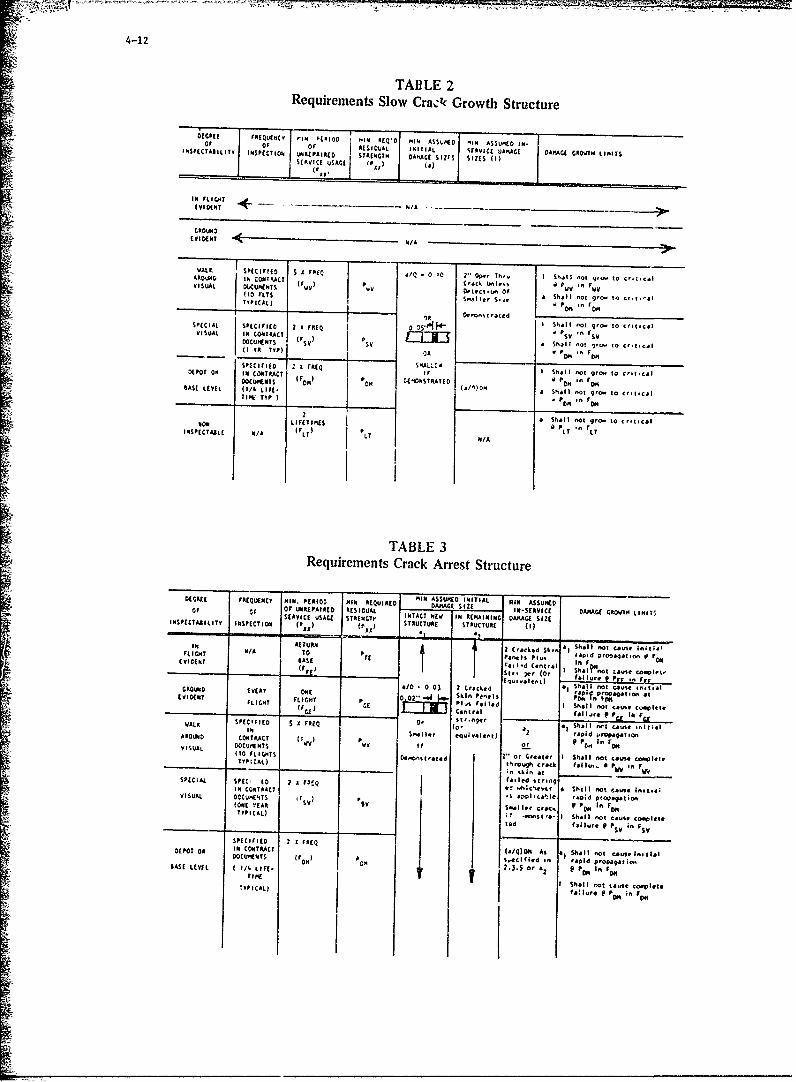
4-12
TABLE 2Requirements Slow Cra:ck Growth Structure
or*E OFrJIn ofI DEIC 'II ".O ASSUME D -III ASSUMED IN.*INPCFA1L INPCFIO U14REPSIUAL JONITIAL %EIVICE OAMACE DAMAGE GROWTHI LIMITSIIIPECAILIT IISPCIV LIIPAIED STRENGTH DAMAGE SIZFS SIZES (I)
SCVVICE USAGE I,'
IVFIDENT N -/A
(V IDENET Nl/A
WAK SPECIFIED 5 FREQ i/Q -0 to 2" Op., Tn,.. ISl o g. orCcV ISUA L D(XCVIIETS ~A~Crack zwlsI., F P In VAVOLAI
II U"VEOfCT(10 rLTS a~I. Shall flOt 9'00 to cr~,t-i
_________TYPICAL) I -AIP I F
0V 1n'ue II DIVI noII tSPECIAL SPECIFIED 2 x FERIO4-01Q'01 CSsiVISVAL INI COhIAA&CT IF ) ~jI -F I iDOCUPI[NTS V A~ Shall not 7,- to cr.t,c.I
YI T TVPlt) ON -oFI
Si ~~~~SPECIFIED 2 1 FAEQ SKASil olAL*0c',g.DEPOT 09 INI CONTRACT IF 1 hl otgr oV .. ,
DOCUiMENITS OnII on D"OITATCA nBASE LEVEL (I/& LIFE. I (/C n* ShallI not grý to c,,l,C.iTIMEC T P
P ONM IFOR
ON LIEIE Shall not groý to cr~tsc.1IEtI)E.1AP *nFlNSPECTAILE Il/A FLT
5 PLT I/A LT LT
TABLE 3Requirements Crack Arrest Structure
-7RX FEQENY IN PRI D h EQIRD IN~ ASSVMED INITIAL AI ASSE
or CF F LIIKEPAIREC RESIDUAL OM 1.ASIESERVICE USAGE STAkEVGTr INTACT NEW INI REMAINING DAMAGE SIZEIIISPIECTABILITV INSPECTI~ON (Fxx 5xx T. ( S CTURE STRUCTURE (I)
IN RTURNShall not CaOt, Initi..FLIGHIT IlATO P1n P Fl.. II- rai pu'o:,,atloV #EIDEN BAETR Fa,i:A Central In FII
SASE FE, (orI 1 coIR "
Eqosniltnt) al..PsGROUNDS EVER, LINE 4/0 - 0 03 2 Cracked &I $ail nlot CASIW 10.1141EVIDENT Ski. P,.l,*I - pcstc,
FLIGHT FLCImT p GE 02 P-W FoI on IC~l(F______ Coo'lpteaISallor"~eC~l
WALK SPECIFIED 5 x FREQ 0, GE.0V ShlEon0.- -t *,.M* InitiaAROUNID CONITRACT (7 II SI0li eV.0A0I 'Pi gFoCMT,VISUAL DOCUMENTS WV WV if or 9p I
(10fIC LGHTS 2"-tftd . or Greater I shall not cause coIwleVeINPCAL)" mgh crack Fall.., a p V F
SPECIAL SPIC, ED 2 A F3CQ I'll"~s~fi
INI CONTRACTIt h 0 he
VISUAL DCIE'T F * AClhCcitle '"id vtUopaI (onCOVE "CARl SV Cv j ller C'ac. v I n .rDTYICL)i
- sI~t ra- I SshallI not K..,. coamleta,YYPCAL faIl..,. 9 P in F
SPECIFIED 2 x FnES jSVSDEPOT OR IN CONILEACT WO)DOI As It shall not cairs. In-tislDOCUMENITS CF CN V ION Soric In rapd InpaatoRA~ L~L C /h LIFE. DO
PO on InclI~ Fn r DM roaIvTY IC EAL) She, I not L&.am co v iet*
V YIA)Ifaillrep P PR in F P
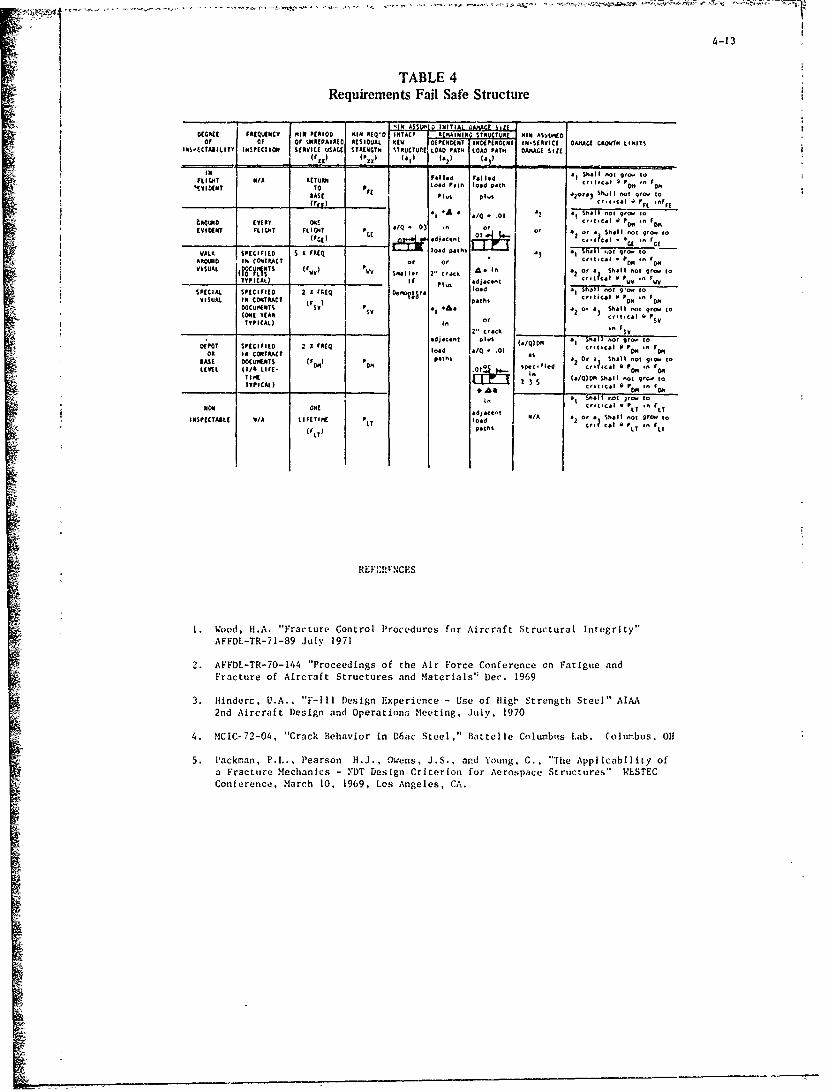
4-133
TABLE 4Requirements Fail Safe Structure
1 "IN A ,NSS)- 3 INITIAL 3.J,,CE IZI4(G101E FAIQUENCY "IN PIE IOD {KIN NIQ'0 INTACT RNEAININ STRUCTURE MINI A• •WOor or or UN REPAIA.." A!"SIOUAL NEW OfPENDENT INDEPENDENT IN-SEAVICE 0AMA&[ GROWTH LIMITS
IN-tC1CTAIILITY INSPIC7ION SERVICE USAGE STRENGTN %TRUCTURE LOAD PATH LOAD PATH ODAMAG SIZE|r(F 1 X)" { (PUx 141 (a•) (*a ______________
-, Sh=ae - g-ow tO
FLIGHT N/A RETURIN r•Ind FFl led I ShplII,• !YIO[NT TO P•€ LOad Pith' Ioad pah rti1KgP 0" FDV
4BASEENT TI. djO7I3 ShiII not g- tOIIASE 0ls pu
a, - &A .Q- .01 3 ;, Shall ,o, g:,o In
LAOUID E(YNY ON! cr't*¢' • P0
.1
,KEVIDENT FLICM T FLIGHT P C a/Q 03 of 4K or . Shall not qr- io
(iG( a* djacenta1
WALK SPECIFIED S A FREQ load Paths * -9- toARNTI.O IN CONTPARCT or or Ci't. cI K PW " FD.VISUAL SCyIMTS (FW Sea 1. 2" track -oo
_ _ TYPICAL it PFlue djancat crITcal P V Vload 41 Shm|l not 9"-- to
SPECUIAL. SPECIFIED 2 X FREQ ~Id* hl O 0 tVISU•A IN CONTP,.T (F P O rths crtical 0 POM n F.
DOCUMENTS (K a, -A. A 2 or a Shal I not Vro' to(ONE V EANt SV Irtclr
TYPICAL) In Or CinICIl K PSV2' crack Fn _Sy
Of .jacent ,l$ (/Q)D•I I Shall not gr I toDEPOT SPACIF'IEC 2 V F'EQ 'Ktca FD n
ON IN CONTRACT load */Q - .In
WAE DOCUMETS (Fon P 2N OP a1t S.ha1 hot 'SKI to
LEVEL $I/4 LIFE- I) O 0" $ efclWPolI *N F OMTIME (./Q)MI Shall not Krc- to
TYPICAl) CIt1011Sall P SON FIO
In 1 Shell Io 5in0 13
NON ONE a .CI K PLT Fn rLT
INSPECTAILE I/A LIFETIME P load a2 M/A Shall noK 2nO to
(FLT) LT Path% LT ' FL.
REF::!I'NCES
1. Wood, H.A. "Fracture Control Procedures for Aircraft Structural Integrity"AFFDL-TR-71-89 July 1971
2. AFFDL-TR-70-144 "Proceedings of the Air Force Conference on Fatigue andFracture of Aircraft Structures and Materials": Dec. 1969
3. flinderc, U.A., "F-ill Design Experience - Use of Iligi, Strength Steel" AIAA2nd Aircraft Design and Operations Meeting, July. 1970
4. MCIC-72-04, "Crack Behavior in D6ac Steel," Battelle Columrbus Lab. Columbus, O|l
5. Packman, P.1,., Pearson t.J., Owens, J.S., and Young. C., "The Applicability ofa Fracture Mechanics - FDT Design Criterion for Aerospace Structures" WSTECConference, March 10, 1969, Los Angeles, CA.
./
-• 5-1
CORROSION FATIGUE - OR - HOW TO REPLACETHE FULL-SCALE FATIGUE TEST
•.• byattW.E. Anderson
Staff EngineerBattelle-NorthwestBattelle Boulevard
Richland, Washington 99352U.S.A.
SUMMARY
ccigiIn-service structural fatigue seems to be influenced by environ,,ent and stress-cycling in zeal-time. This paper examines the problem by comparative calculations ofcracking from a fastener hole. The influences of real-time, moisture and temperature areincluded. These influences are based on deduced reaction kinetics of environmentallyaggravated fatigue cracking, one aspect of corrosion fatigue. The reýalts suggest thatdifferent locations on the lower wing skin, which experience the same stress spectrum butdifferent environmental exposures, may behave either better or worse than under laboratorytesting without the environment.
Difficulties ,ith relevance credibility of full-scale fatigue tests are expressedin several literature sources. This paper proposes a scheme to overcome these difficulties.It includes sacrificial examination of selected portions of lead-ship airframes of a fleetand testing of the structural materials under several environmental and stress histories.Results may permit calculation of scheduled repair times for individual airframes based
•- -on their respective flight experiences.
INTRODUCTION
The full-scale fatigue tc:f- of just one airframe out of a fleet has, in itself,proven so useful it is justified on economic grounds alone. (I) Nonetheless, the full-scale test has its shortcomings, one of which relates to corrosion fatigue.
Corrosion fatigue is not reported in results from ordinary laboratory testingof airframe structures, yet it is often identified with operational service cracking.Repeated exposure to wide ranges of temperature and relative humidity is cne of the dis-tinct differences between laboratory fatigue tests and service experience.
"Considering these aspects, it may prove instructive to hypothesize that corrosionfatigue rather than incorrect loads representation is the principal cause of scatter
* factor. On this basis a new approach to fleet performance predictions might be developedwhich would not require a full-scale fatigue test.BACKGROUND
Fatigue cracking and corrosion fatigue generally occur at or near joints, fas-tener connections, or other stress concentrations. Fastener connections cause stress con-centrations by their very geomet'y and this concentration may be increased by fastenertransfer of load from one member to another. Since load causes strain, the joint under-goes fluctuating strains from its fatigue exper.iences.
Cyclic joint straining causes cwo important conditions: relative movementbetween its component parts--often leading to fretting of one member or another--, andalternating displacement of the joint components which thereby alteinately exposes anystructural crevices to the media in which the joint is immersed. In this way the loc-1media may penetrate a joint and contact interior surfaces of the joint components. Reac-tion of the media with fresh metal surfaces exposed by fretting or crack expansion canreadily be imagined.
Airframes are composed of many and varied joints. Fatigue performance willclearly depend on which joint frets, or permits ingress of tne surrounding media or acombination of both. If the media reacts with exposed surfaces in joint components, thencorrelation of test and service fatigue performance will depend on rationalizing thosedifferences in corrosion fatiguc brought about by differences in time, temperature, andenvironment sequencing as well as the loads sequencing.
Corrosion fatigue can include crack expansion under environmental influencesas wpll as the process which develops the crack. Surface protection measures can beeffective in suppressing crack development, but in even a small fleet of aircraft thereare literally millions of locations to protect and at least a few of these may becomesusceptible to cor'-sion fatigue.
In this paper the crack expansion aspects of corrosion fatigue -e explored;an interpretation of the very meager data on temperature and humidity Lrfects is presented.Their influence on crack expansion under an assumed flight spectrum is calculated. Theseresults are taken together with views expressed in the literature about shortcomings cffull-scale fatigue tests. A plan is suggested for multiple, "lead-ship" operations of
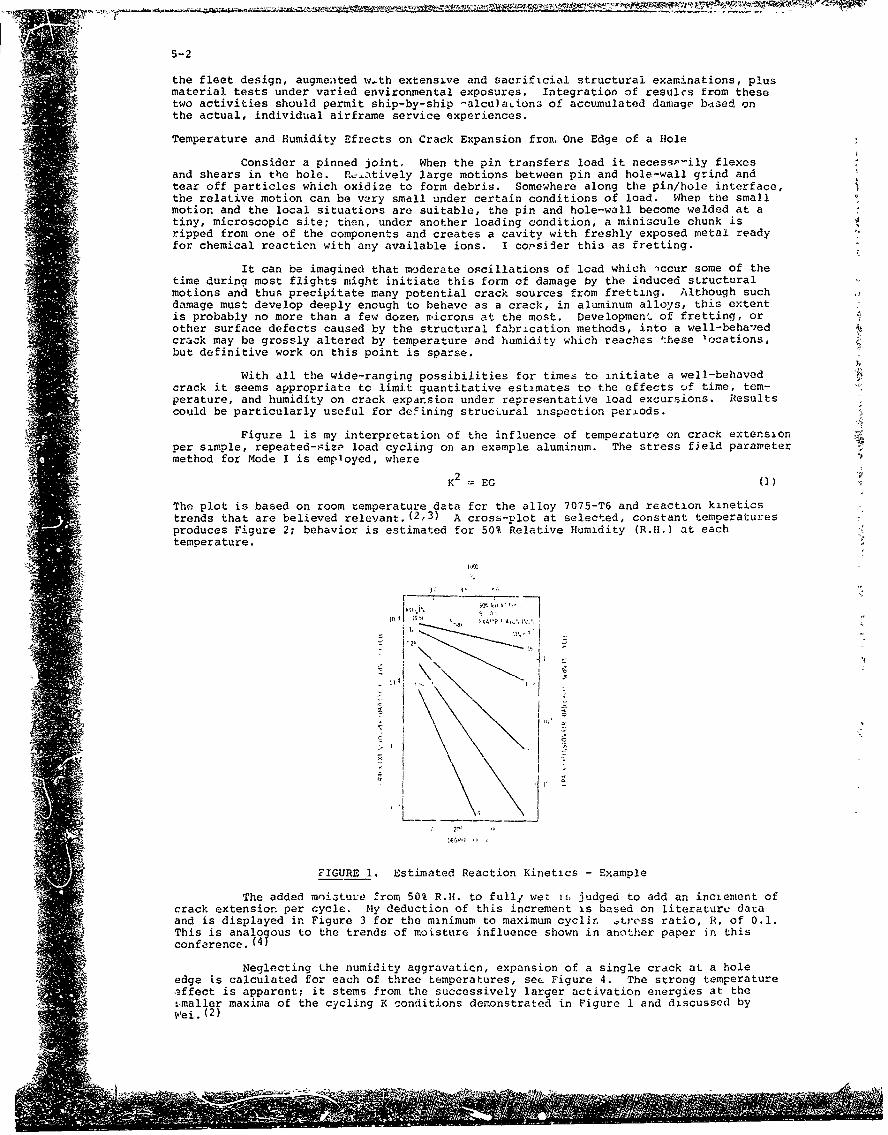
5-2
the fleet design, augmented w.th extensive and sacrificial structural examinations, plusmaterial tests under varied environmental exposures. Integration of resulcs from thesetwo activities should permit ship-by-ship -alcula.ions of accumulated damage based onthe actual, individual airframe service experiences.
Temperature and Humidity Efrects on Crack Expansion fron. One Edge of a Hole
Consider a pinned joint. When the pin transfers load it necessarily flexesand shears in the hole. R-atively large motions between pin and hole-wall grind andtear off particles which oxidize to form debris. Somewhere along the pin/hole interface,the relative motion can be very small under certain conditions of load. When the smallmotion and the local situatiors are suitable, the pin and hole-wall become welded at atiny, microscopic site; then, under another loading condition, a miniscule chunk isripped from one of the components and creates a cavity with freshly exposed metal readyfor chemical reaction with any available ions. I cor'siler this as fretting.
It can be imagined that moderate oscillations of load which 1ccur some of thetime during most flights might initiate this form of damage by the induced structuralmotions and thus precipitate many potential crack sources from fretting. Although suchdamage must develop deeply enough to behave as a crack, in aluminum alloys, this extentis probably no more than a few dozen microns at the most. Development of fretting, orother surface defects caused by the structural fabrication methods, into a well-behaledcrack may be grossly altered by temperature and humidity which reaches these locations,but definitive work on this point is sparse.
With all the wide-ranging possibilities for times to initiate a well-behavedcrack it seems appropriate to limit quantitative estimates to the effects of time, tem-perature, and humidity on crack expansion under representative load excursions. Resultscould be particularly useful for defining structural inspection peri.ods.
Figure 1 is my interpretation of the influence of temperature on crack extensionper simple, repeated-size load cycling on an example aluminum. The stress field parametermethod for Mode I is employed, where
K2= EG (1)=
The plot is based on room temperature data for the alloy 7075-T6 and reaction kineticstrends that are believed relevant. (2,3) A cross-plot at selected, constant temperaturesproduces Figure 2; behavior is estimated for 50% Relative Humidity (R.H.) at eachtemperature.
S 1
- I
FIGURE 1. Estimated Reaction Kinetics - Example
The added moiatuve from 50% R.H. to fully wet I judged to add an inciement ofcrack extension per cycle. My deduction of this increment is based on literaturv dataand is displayed in Figure 3 for the minimum to maximum cyclir. .tr'ss ratio, R, of 0.1.This is analogous to the trends of moisture influence shown in another paper in thisconference. (4
Neglecting the numidity aggravation, expansion of a single crack at a holeedge is calculated for each of three temperatures, sec Figure 4. The strong temperatureaffect is apparent; it stems from the successively larger activation energies at thei-maller maxima of the cycling K conditions demonstrated in Figure 1 and discussed byWei. (2)
4MA,
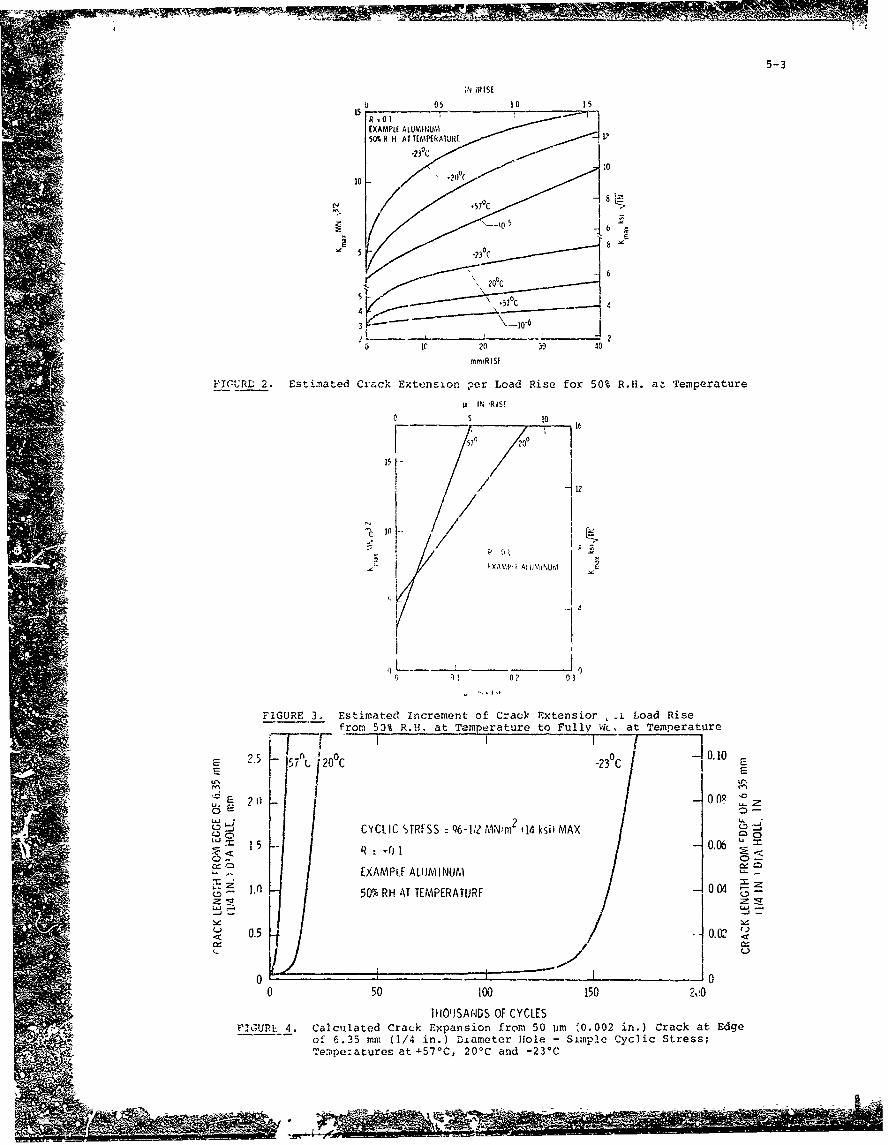
5-3
;N 1RISE
U 05 10 I1
R .01EXAMPLE ALUMINUM50% R 1 AT TEMPERATURE
100
.57 C
A6
5 IC 20 3 0 40
FI(-URLE 2. Esti,.nated Crack Exton~cion per Load Rise for 50% R.H. a• Temperature
• ~u IN ,RISEC S 10
16\? 200C
0
Sl ~~XAr?,P F Al IMNU~hUl!
I1
-4
31o 0? 03
FIGURE 3. Estimated increment of Crack Extensior 2e_ Load Rise
from 53% R.!H. at Temperature to Fully W•. at Temperature0-- - I ' 0 16
570-
CYLCSTRFrSS Q %-1/2 MNm 14 ksil MAXLU 5 R : . 1- o:- I .06 _ o
C-5
EXAMPLEi ALlJMINLJ
>Z lf V 50% RHATITEMPERATURE 004 •Z
0 3
0-5 0 - I -I IE 2.5 /7 20 0 2 -23 -23°C
0 0- OR00
0 50 55 0.06
1HO'JMt'D OFLCYCLESz~R 4zCluae rc xaso rm 0~ 002i. rc tEg
ofn 6.50 RH (1/ in.)RAUR 00mtrhoe-S4n~ li tes*eipzauo atE +5 0C 20C nd-
0.5 0.0-2- -
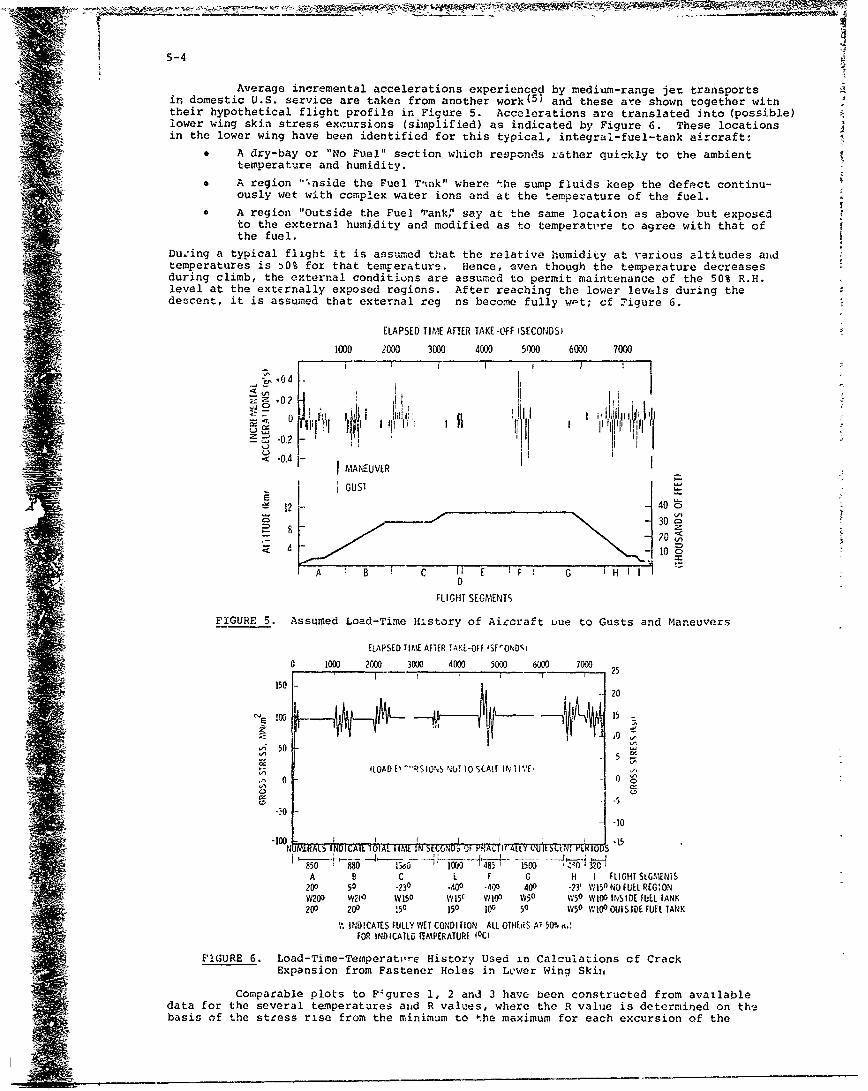
iw0M~r.. -I- _ -MV- u
5-4 '4
Average incremental accelerations experienced by medium-range jet transportsin domestic U.S. service are taken from another work( 5 " and these are shown together withtheir hypothetical flight profile in Figure 5. Accelerations are translated into (possible)lower wing skin stress excursions (simplified) as indicated by Figure 6. These locationsin the lower wing have been identified for this typical, integral-fuel-tank aircraft:
* A dry-bay or "No Fuel" section which reoponds rather quickly to the ambienttemperature and humidity.
• A region "'nside the Fuel Thnk" where the sump fluids keep the defect continu-ously wet with complex water ions and at the temperature of the fuel.
0 A region "Outside the Fuel 'ank;' say at the same location as above but exposedto the external humidity and modified as to temperatrre to agree with that ofthe fuel.
Duý'ing a typical flight it is assumed that the relative humidity at various altitudes azdtemperatures is 50% for that temperature. Hence, even though the temperature decreasesduring climb, the external conditions are assumed to permit maintenance of the 50% R.H.level at the externally exposed regions. After reaching the lower levels during thedes-cent, it is assumed that external reg ns become fully wet; cf ?igure 6.
ELAPSED TIME AFTER TAKE-OFF (SECONDS)
i000 2000 3000 4000 5000 6000 7000[ I I I '
§to -, I Lz Z -0? "
S2
-0.< 04 M0U
GUSTH SEMETELii A PSD I IAIR AK-li;S'OD
0 ~ ~ ~ ~ ~ ~ ~ 4 -5020 00 400 50 00 70
S20 0
70 'VCI
I 400 C
,• 0
*-?0
FLIGHT SEGMENTS
FIGURE 5. Assumed Load-Time History of Aincraft uue to Gusts and Maneuvers
ELAPSED TIME~ AF ER 'AKE-OFF ISF'ONDS
0 1000 20W0 3000 4000 5000 6000 7000 25150
2
CV= 100 1
'0
1D0 -15
A B C E F G H I FLIGHT StGMENTS200 50 .230 -400 .400 400 -23' W150 NO FUEL REG:ONW20D 'V14' W 150 WI150 W100 VW30 W50 WIV10 INS IDE FUEL TANK200 !00 50 i 100 50 W50 WI00OUISIDE FURF TANK
ItOIN CATES FULLY WET CONDITION' ALE OTHER~S AT 50% , K,FOR INDICATED TEMPERATURE 00)
FIGURE 6. Load-Tine-Temperatiure History Used in Calculations cf CrackExpansion from Fastener Holes in Lower Wing Skin,
Comparable plots to F4gures 1, 2 and 3 have been constructed from availabledata for the several temperatures anid R values, where the R value is determined on thebasis of the stress rise from the minimum to the maximum for each excursion of the
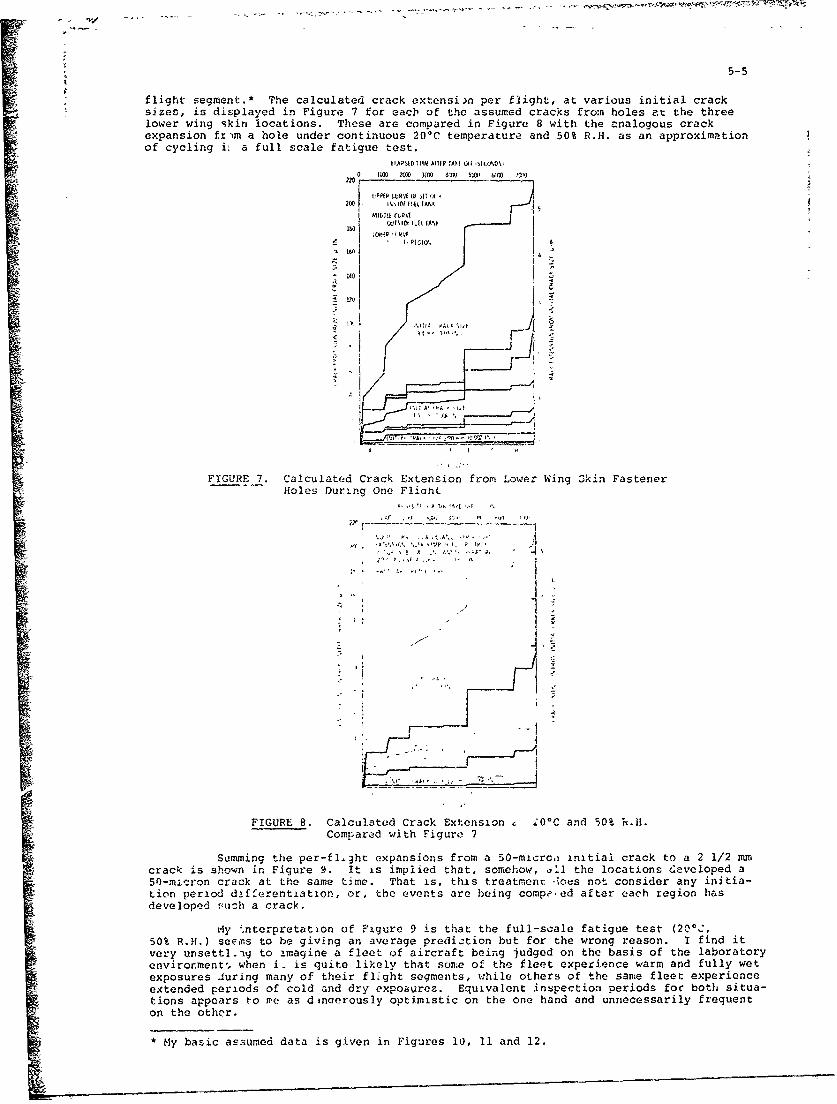
5-5
flight segment.* The calculated crack extension per flight, at various initial cracksizes, is displayed in Figure 7 for eaci' of the assumed cracks fro:m holes at the threelower wing skin locations. These are compared in Figure 8 with the analogous crackexpansion frxm a hole under continuous 204C temperature and 50% R.H. as an approximationof cycling i. a full scale fatigue test.
0 =~l 52M 301 Wj 40U M UM W
2Ci ' O1T2IDE IM TANK
MA'O0k C("V -IWIWId2 f-k TA-
0m. '((PO'
'431
' 22
_PA _- 1.
FIGURE 7. Calculated Crack Extension from Lower Wing 3kin FastenerHoles Duri-ng One Fliaht
P. AA "./ ,' 4
* _ - -1
FIGURE 8. Calculated Crack Extension 20°C and 50% R.I3.Compared with Figure 7
Summing the per-fl-ht expansions from a 50-micrc, initial crack to a 2 1/2 mmcrack is shown in Figure :. It is implied that, somehow, all the locations developed a50-micron crack at the same time. That is, this treatment .coes not consider any initia-tion period differentiation, or, the events are being compi-ed after each region hasdeveloped fuich a crack.
My 2.nterpretation of Figure 9 is that the full-scale fatigue test (20o0,50% R.H.) seems to be giving an average prediction but for the wrong reason. I find itvery unsettl.ig to imagine a fleet of aircraft being judged on the basis of the laboratoryenvironment, when i. is quite likely that some of the fleet experience warm and fully wetexposures during many of their flight segments, while others of the same fleet experienceextended periods of cold and dry expoaures. Equivalent inspection periods foc both situa-tions appears to ne as dtnaerously optimistic on the one hand and unnecessarily frequenton the other.
* My basic assumed data is given in Figures I0, 11 and 12.
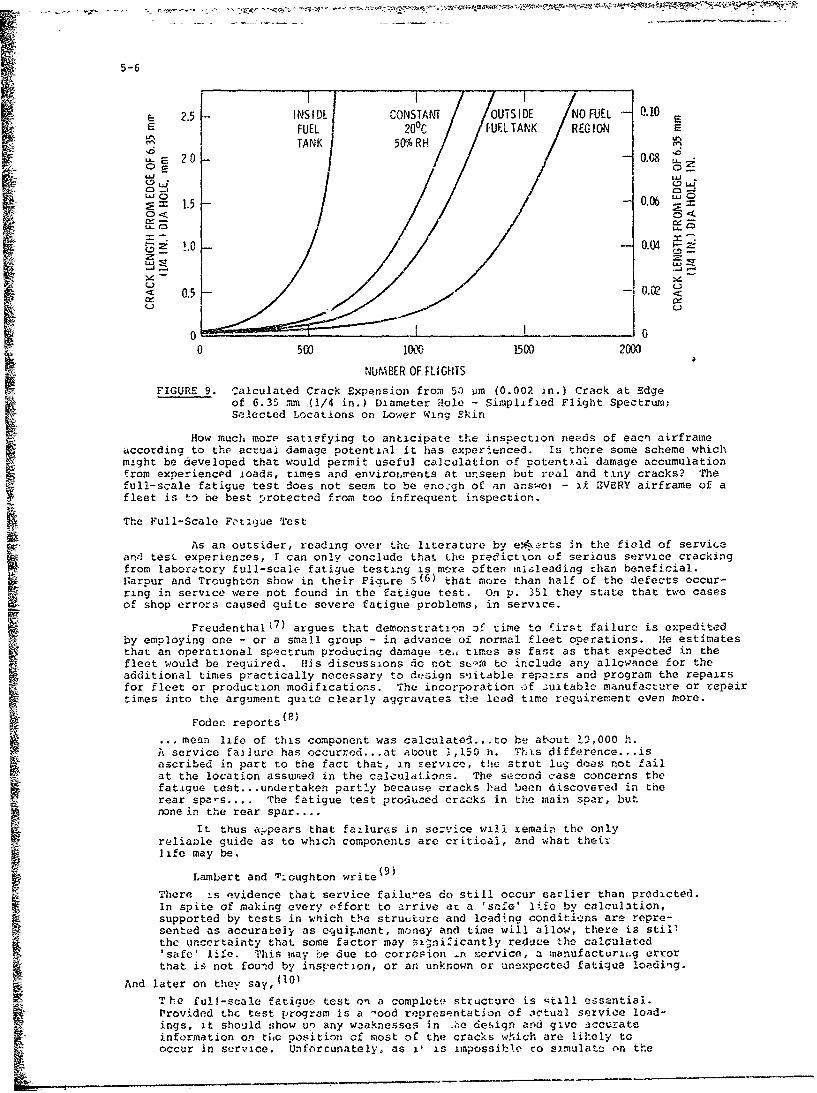
5-6
2.5 -INSIDE CONSTANT OUTS IDE NO FUEL 01FE20,FULTANK REGION ITUEL 5r/6 FU. TN EGO
UF_20 10.08u0 E
~= 1.5 0.0
_ . 0.04z
0 500) loco 1500 2000
NUMBER OF FLIGHTSFIGURE 9. Calculated Crack Expansion fro~m 50 irn (0.002 in.) crack at Edge
of 6.35 :nm (1/4 inl.) Diameter Hole - Simplified Flight Spectrum;I Selected Locations on Lower Wing SkinaccodingHow much more satisfying to anticipate the inspection needs of eacn airframeaccrdngto thce actual damage potential it has exper~enced. is there some scheme which
might be developed that would permit useful calculatio~n of potential damage accumulationfrom experienced ioads, times and envirol.irerets at un-seen but real and tiny cracks? Thefull-scale fatigue test does not seem to be eno:gh of an an~swer - it~ BVERY airframe of afleet is to be best ,jrotected from too infrequent inspection.
The Full-Scale Fc-tique Test
As an outside~r, reading over the literature by e*,arts in the field of serviceand tlest experiences, I can only conclude that the prediction uf serious service crackingfrom laboratory full-scale- fatigue testing is mclý.re often? minleading then beneficial.I~arpur and Troughton show in their Finmtre 5(6) t1hat more than half of the defects occur-ring in service were not found in the fatigue test. On p. 351 they state that two casesof shop errors caused quite severe fatigue problems, in service.
FreudenthalM7 argues that demonstrati'in _)f time to first failure is expeditedby employing one - or a small group - in advance of normal fleet operations. He estimatesthat 'an operational spectrum producing damage teai timnes as fant as that expected in thefleet would be required. His discussions do not sLom to include any allowa.,Pnce for theadditional times practically necessary to desGign s~jitable repa._,rs and program the repairsfor fleet or production modifications. The incorporation of ziuitable manufacture or repairtimes into the argument quite clearly aggravatea the lead time requirement even more.
Foden reports (8 )
.. mean life of this component was calculatod.,.to he about 19,000 h.A1 service failure has occurred.. at alsout 1,150 ii. Thts difference... .isascribed in part to the fact that, in zervice, thme Strut lug, does not failat the location assumed in the calculations. The second c-ass concerns thefatigue test .., undertaken partly because cracks had been d~iscovered in therear spars .... The fatigue test produced cracks in the main spar, butnonein the rear spar ....
It thus appears that failures in service will xemain the onlyreliamle guide as to which components are critioal, and -what theirlife may be,
(9)Lamnbert and "r:oughtonwrt
There i.s evidence that service failur-es do still occur earlier than predicted.In spite of making every effort to arrive at a lsafce' li~fa by calculation,supported by tests in which the struuture and Icading conditi-os are repre-sented as accurately as eq.uipm1ent, mo,.ney and time will allow,., there is stillthe uincertainty that some factor may aigni.'icantly redace the calculatedI safe' life. 'This mnay be due to corr",ion ýn Fervice, a inanufacturismg errorthat ii not found by inspection, or ant unknown or unexpected fatique loading.
And later on thev soy,The full-scale fatigue test on a complette structure is qtill essential.
kk Provided the test program is a -ood representation of zmctual service load-ings, it should show un any weaknesses in .edesign and g,.ve accurateinformation on t;,c positin of most of the cracks wh-ich are Likely tooccur in service. Unforrunately, as il is impossible, to simulatte on the
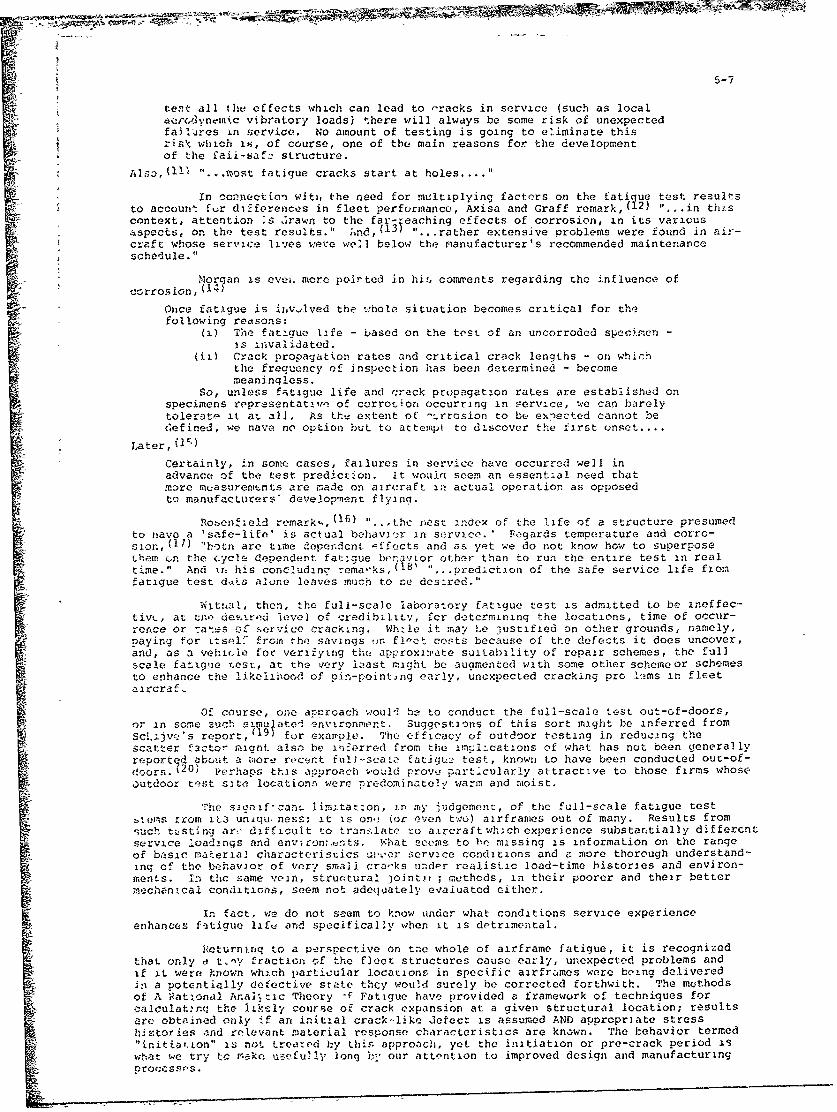
test all the effects which can lead to '-racks in service (such as localdercdvnezaic vibratory loads) there will always be some risk of unexpectedfailures in service. No amount of testing is going to eliminate thisris'( which is, of course, one of the main reasons for the developmentof the faii-safa structure.
Also, (11st fatique cracks start at holes...."
in ccnnection witi, the need for multiplying factrrs on the fatigue tlest resultsto account fur difEforenoes in fleet performance, Axisa and Graff remarkii 2 ) "...in thiscontext, attention is dIrawn ýto the far- ahn fet fcroin in its variousaspects, on the test results." i~nd~ ( ".rather extensive problems were found in air-cr-aft whose service lives werie we.l below the manufacturer's recommended maintenanceýschedule."
Moanis evei. more poih ted in hit. coimments regarding the influence of
Once fatigue is inv,vved the .-.hole situation becomes critical for the
Ci)t The ftatlie-based on the test of an uncorroded specimren -is ivldtd
(it) Crack propagation rates and critical crack lengths - on whic-hthe frequency of inspection has been de term ined - become-meaninqless.
So, unless f;:-tiaue life and crack propagation rates are established, or,specimens rppresentativcQ of corrosior, occurring in service., we can barelytolerate it at all, As thv extent of -ý.rrcsion to be eixiected cannot be4efined, we nave no option but to attempt to discover the first unset....
Later,.~~
Certainly, in some cases, failures in service have occurred well inadvance of the test prediction. it wou-Ie seem an essential need thatmore measuremtýnts are made on aircraft in actual operation as opposedto manufacturer&,, developml:nt flyini.
Rosenfield rcmark',,(16) ".. tu.c oest index of the life of a structure presumedto nave a sf-lf'is act-ual behavi:Qr in service. ' Fogards tempterature and corro-
si 117) 'boýtn are time "opendcnt effects and as yet we do not know how to superposeLhet n the (.7clce dependent fat-.gjue beravtor othery than to run the entire test in realtime." And in hi s concludine- rema-lks, (18' ". . prediction of the safe service life fxomfatigue test ddat alone leaves much to cc' desired."
Wit:~al, then, the full-scale laboratory fatigue test is admitted to be ineffec-tivtc, at cne! le~edievel of cre::dibilitt, fcr d-otermining the locations, time of occur-rence or Tat-,s oC s~ervice cracking. Whzle it may Le jlustified 'on other grounds, namnely.paying for Ltsel' from the- savings un fl-et costs because of the defects it does uncover,and, as a vehicle foc verifying the approximate s~iitability of repair schemes, the fullscale fatigque test, at the very loast night be auamented with some other schemeoor schemesto enhance the likelihood of pin-point~ng early, unoxpected cracking pro linms in fleetaircraf-
Of course, one approach woul-.i be to conduct the full-scale test out-of-doors,or in some such Im tenvironmor.ot. Suggestions of this sort might be inferred fromScli.jvzr's report, (19) for exml.The efficacy of outdoor testing in reducang thescatter factor nacnt also he ainfeýrred from the impl~cations of what has not been generallyreported abcut -a z~iort- receýnt fuli'-sca~lc fatigu:a test, known to have been conducted out-of-doors. (20) Perhaps this approach would prove p.articularly attractive to those firms whose'.,utdoor teýst sate location5 were z.redominatel-y warm and mioist.
The sivnif-canf_ liiintat:on, in my J-udgementc, of the full-scale fatigue tests.tems rrom iL3 uniqu ness; it ts o~n.! (or oven two) airframes out of many. Results froms3uch t-_sting arc difficult to tran~.-lato :o aircraftwhich experience substantially differentservice loadangs and envi-ron-,.ents. What seenis to hemissing is information on the rangeof basic material characteristics uI~r%,r servace conditions arnd a more thorough understand-inq of the behavior of very small cra'-ks under realistic load-time histories and environ-mernts. In thc same vein, structural Joint~ij methods, in their poorer and their bettermechanical con-litions, seem not adeqoatlely evaluated either.
in fact, we do not seem to know tinder what conditions service experienceenhances fqtigue life anid specifically when it is detrimental.
Rcturntriq to a pirgpecctive on tne whole of airframe fatigue, it is recognizedthat only ai t~ny fraction cof the fleet structures cause early, unexpected problems andif it were known which particular locations in specific airfr.cmes were being deliveredin a potentialIly defective srtate they would surely be corrected forthwith. The muthodsof A !Pat iýonal Arna],t~ic Thee ry -F Fatigue have provided a framework of techniques foroaloulatzrnq the lik-Ily course of crack expansion at a given structural location; resultsarec obtained only 4f an initial crack--like Jefect is assumed AND appropriate stresshiztories and relevant material response characteristics are known. "he behavior termed"initiatiton" is not. trearod 1,y thir- approach, yet the initiation or pro-crack period iswhat we try to r-ake uiiefully long by- our attention to improved design and manufacturingprorcesses.
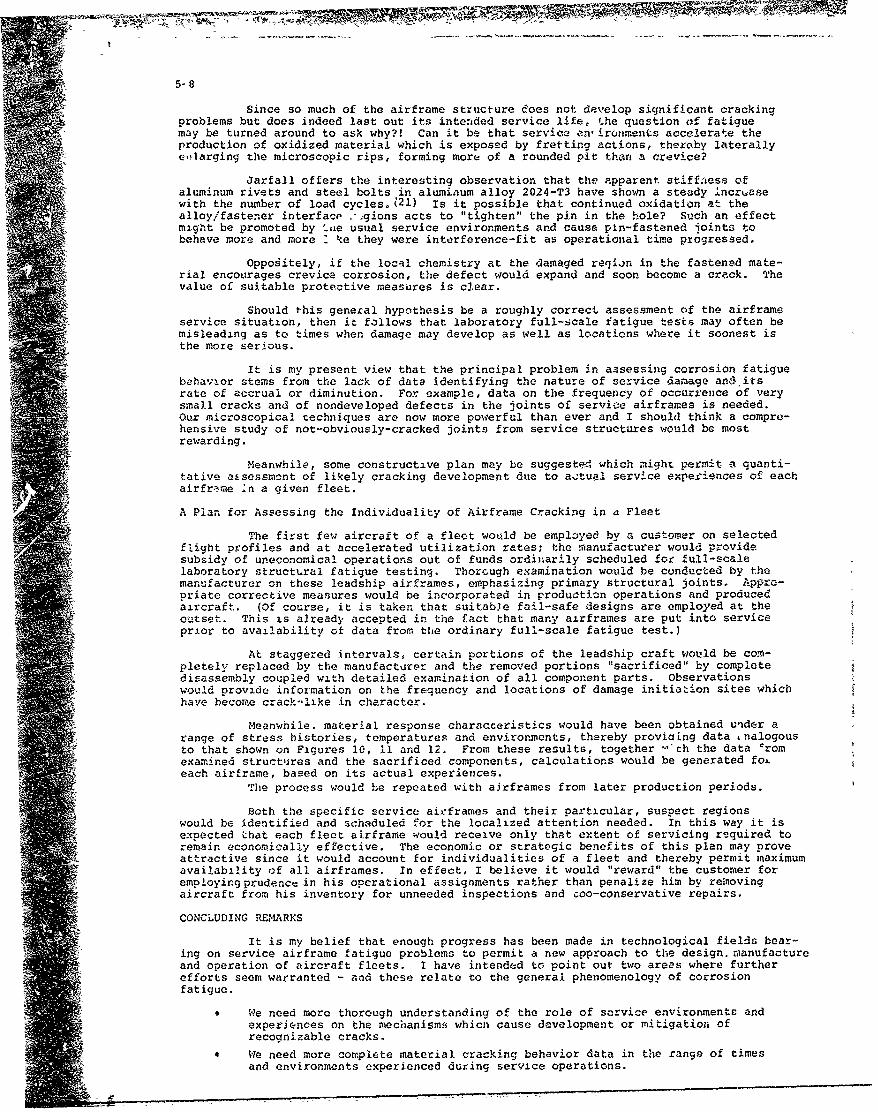
Since so much of the airframe structure does not develop significant crackingproblems but does indeed last out its intended service life, the question of fatiguemay be turned around to ask why?! Can it be that service en' ironments accelerate theproduction of oxidized material which is exposed by fretting actions, thereby laterallyeq|arging the microscopic rips, forming more of a rounded pit than a crevice?
Jarfall offers the interesting observation that the apparent stiffniess ofaluminum rivets and steel bolts in aluminum alloy 2024-T3 have shown a steady Incrbasewith the number of load cycles.o2l) Is it possible that continued oxidation at thealloy/fastener interfacp J.- gions acts to "tighten" the pin in the hole? Such an effectmiqht be promoted by 'ate usual service environments and cause pin-fastened ioints tobehave more and more " ke they were interference-fit as operational time progressed.
Oppoditely, if the local chemistry at the damaged region in the fastened mate-
encourages crevice corrosion, the defect would expand and soon become a crack. Thevalue of suitable protective measures is clear.
Should this general hypothesis be a roughly correct assessment of the airframeservice situation, then it follows that laboratory full-scale fatigue tests may often bemisleading as to times when damage may develop as well as locations where it soonest isthe more serious.
It is my present view that the principal problem in assessing corrosion fatiguebehavior stems from the lack of date identifying the nature of service damage an1 i4 srate of accrual or diminution. For example, data on the frequency of occurrence of verysmall cracks and of nondeveloped defects in the joints of service airframes is needed.Our microscopical techniques are now more powerful than ever and I should think a compre-hensive study of not-obviously-cracked joints from service structures would be mostrewarding.
Meanwhile, some constructive plan may be suggeste-•i which might permit a quanti-tative a~sessmcnt of likely cracking development due to actuel service experiences of eachairfrmne in a given fleet.
A Plan for Assessing the Individuality of Airframe Cracking in a Fleet
The first few aircraft of a fleet would be employed by a customer on selectedflight profiles and at accelerated utilization rates; the manufacturer would providesubsidy of uneconomical operations out of funds ordinarily scheduled for full-scalelaboratory structLral fatigue testing. Thorcugh examination would be conducted by themanufacturer on these leadship airframes, emphasizing primary structural joints. Appro-priate corrective measures would be incorporated in production operations and producedaircraft. (Of course, it is taken that suitable fail-safe designs are employed at theoutset. This is already accepted in the fact that many airframes are put into serviceprior to availability of data from the ordinary full-scale fatigue test.)
At staggered intervals, certain portions of the leadship craft would be cots-pletely replaced by the manufactorer and the removed portions "sacrificed" by completedisassembly coupled with detailed examination of all component parts. Observationswould provide information on the frequency and locations of damage initiation sites whichhave become crack-like in character.
Meanwhile. material response characteristics would have been obtained under arange of stress histories, temperatures and environments, thereby proviaing data Lnalogousto that shown on Figures 10, 11 and 12. From these results, together "*.ch the data Cromexamined structures and the sacrificed components, calculations would be generated foi.each airframe, based on its actual experiences.
The process would be repeated with airframes from later production periods.
Both the specific service airframes and their particular, suspect regionswould be identified and scheduled for the localized attention needed. In this way it isexpected that each fleet airframe would receive only that extent of servicing required toremain economically effective. The economic or strategic benefits of this plan may proveattractive since it would account for individualities of a fleet and thereby permit maximumavailability of all airframes. In effect, I believe it would "reward" the customer foremployirgprudence in his operational assignments rather than penalize him by removingaircraft from his inventory for unneeded inspections and coo-conservative repairs.
CONCLUDING REMARXS
It is my belief that enough progress has been made in technological fields bear-ing on service airframe fatigue problems to permit a new approach to the design, manufactureand operation of aircraft fleets. I have intended to point out two areas where furtherefforts seem warranted - and these relate to the general phenomenology of corrosionfatigue.
0 We need more thorough understanding of the role of service environments andexperiences on the mechanisms whict cause development or mitigation ofrecognizable cracks.
0 We need more complete material cracking behavior data in the range of timesand environments experienced during service operations.
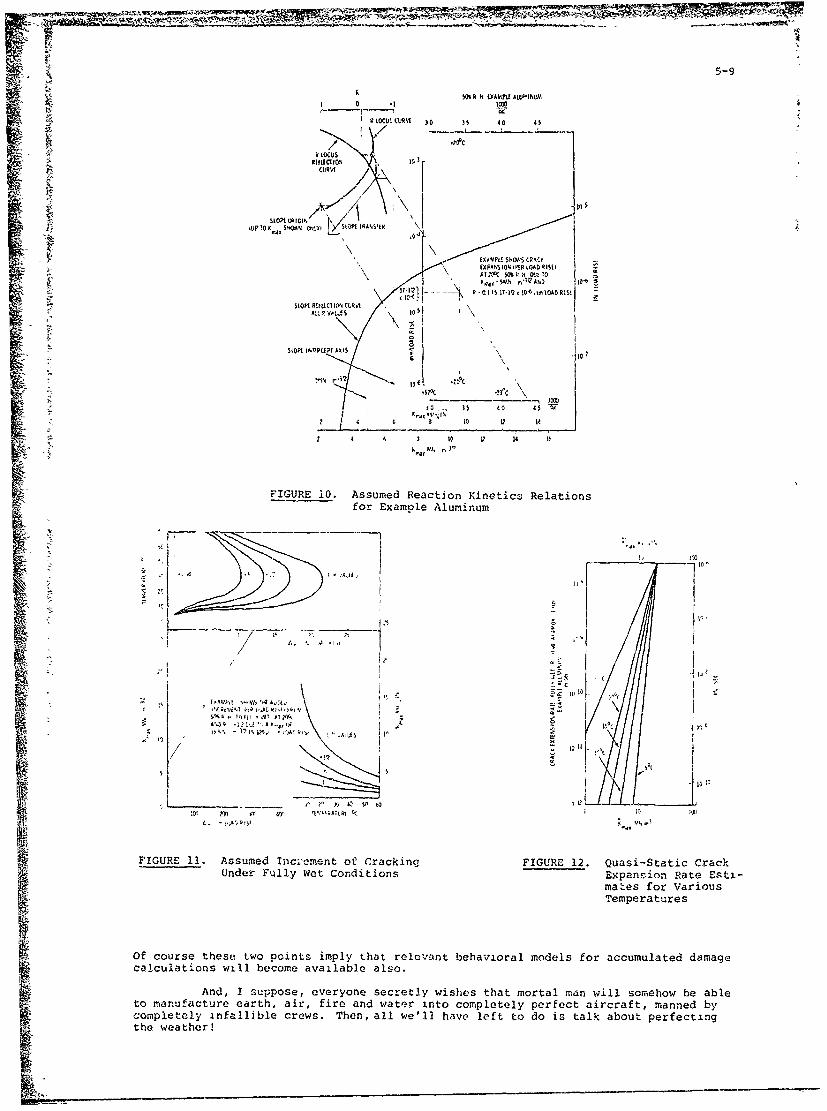
5-9
1 0 1lo
I 9LWWRY )0 5 4 AW~40
77p
CURVE
~KQ)W ol"AN jaýO* ~'N
0 1 IS 17-12, l0'6.imOAD RIS.
SLOPE IW CIPUPT AXIS to
2 4 1 0 LS 2 It
27 4 S 1 VS 12 I it
mi0. 3,3
FIGURE 10. Assumed Reaction Kinetics Relations
Io~
A'.3 IZ f ` 00A 'i NL h0 I 0 1
alFIGURE 11. Assumed Tnci~cment oe? Cracking FIGURE 12. Quasi-Static CrackUnder Fully Wet Conditions Expansrion Rate Esti-
mates for VariousTemperatures
Of course these two points imply that relevant behavioral models for accumulated damagecalculations will become available also.
And, I suppose, everyone secretly wishes that mortal man will somehow be ableto manufacture earth, air, fire and water into completely perfect aircraft, mandbycompletely in~fallible crews. Then, all we'll have left to do is talk about perfectingthe weather!
- ____________ - . • • • • ••• •• • • - :
5-10
REFERENCES
1. N. F. Harpur and A. J. Troughton, in "Fatigue Design Procedur.s," 'E. Gassner and
W. Schitz, Editors), London, Pergamon Press, 1969, p. 367.
2. R. P. Wei, Int. J. Fract. Mech., vol. 4, no. 2, June 1968, pp. 159-170.
3. R. E. Jones, "Fracture Toughness and Fatigue Crack Growth Properties of 7175-T736Aluminum Alloy Forging at Several Temperatures," AFML-TR-72-1 AFSC, Wright-PattersonAir Force Base, Ohio, February 1972, p. 19.
4. cf References 25, 27 and 28 of Paper No. 7, this conference.
5. W. E. Anderson, International Metallurgical Review, vol. 17, no. 170, December 1972,p. 240.
6. Ref. 1, p. 342.
7. A. M. Freudenthal, in "Aircraft Fatigue - Design, Operational and Economic Aspects,"(J. Y. Mann and I. S. Milligan, Editors), Australia, Pcegamon Press, 1972, p. 41, 42.
8. P. J. Foden, Ref. 7, p. 239.
9. J. A. B. Lambert .nd A. J. Troughton, Ref. 7, p. 367.
10. Ibid., p. 387.
11. ibid., p. 393.
12. R. Axisa and D. Graff, Ref. 7, p. 512
13. Ibid., p. 513.
14. R. C. Morgan, Ref. 7, p. 518-519.
15. Ibid., p. 522.
16. M. S. Rosenfeld, in "Testing for Prediction of Material Performance ii Structuresand Components," (STO 515), Philadelphia, ASTM, 1972, p. 305.
17. Ibid., p. 308.
18. Ibid., p. 313.
19. J. Schijve, in "Current Aeronautical Fatigue Problems," (J. Schijve, J. R. Heath-Smithand E. R. Welbourne, Editors), London, Pergamon Press, 1965, p. 406.
20. Personal Communication from The Boeing Company.
21. L. E. .arfall, Ref. 7, p. 58.
ACKNOWLEDGEMENTS
The excellent support in technical writing and graphics provided byBattelle-Northwest staff members is warmly appreciated.
"I
I
S~6-1
ON FATIGUE ANALYSIS AND TESTING FOR THE DESIGN OF THE AIRFRAME
By
Walter J. Crichlow*
Engineering Advisor/FatigueAeronautical Systems Division
Wright-Patterson Air Force Base, Ohio 45433
SUMMARY
The experimental and analytical techniques for controlling time to fatigue crack initiation in designof aircraft structure are reviewed to define improvements that may be gained from available research know-ledge. Modern servo-controi test technology perm;ts experimental application of the realistic flight-by-flight sequence of var~able amplitude loading as is experienced and measurea in service. Discrepancies amongsimple theory, experiment, and service are being better explained by accountability for residual stresssystems created by higher than ave-age loading peaks recurring randomly throughout the service load spectrum.EAperimental accountability i- the basis for the flight-by-flight sequence of testing. Analytical 3ccountingfor the generation, decay, and recreation of residual stress spectra is an essential adjunct to the experi-mental approach, for not all parts can be critically tested, and not all load spectra variations can beaccommodated in test. Recent advances in residual stress analyses ar.- reviewed and directions for future workare indicated. Failure theory, interaction matrix, chemical (corrosion), and mechanical (fre:ting) environ-mental aspects are briefly explored. Variability of results are discussea in terms of design life reductionfactors.
I. LIST OF SYMBOLS
D Damage in Fatigue Analysis, Eqn (20). Rx Fatigue life reduction factor for subscript xdefined in Eqn (27).
e Nominal, local strain, non-dimensional. Also,mathmatical exponential = 2.71828 R ,RT Normalized stress ratios.
E Young's elastic modulus, consistent units. S Nominal, local stress, consistent units.
f Function of ( ), SSF Stress Severity Factor by Ref (4).
FQI Fatigue Quality Index t Applied tinme - consistent units.
F Tensile yield strength - consistent units. T EP Natural period-time to decay from initial to aty TEp percentage of the initial value.
Flu Tensile ultimate s'rength - consistent units. SUBSCRIPTS AND SUPERSCRIPTS
G-A-G Ground-to-air-to-ground transition cycle per thflI1ight. b,f,j Beginning and final values at ends of j line
segment.K Fatigue Quality Index defined by Eqn (I).
e Elastic comoonent of stress-strain. AlsoKf Fatigue equivalent stress ratio at a given endurance 1;mit strcss.
number of cycles.eo Equivalent value.
KI Empirical coefficient in Impellizzeri's Eqn(18) (Moditied by Rotvel) M Mean stress.
K, K' Reference stress level for monotonic stress- Max Maximum value.strain curve. Prime for cyclic stress-strain curve. M-M Mean-ground to mean-air transition GAG cycle
per flignt.KR Empirical coefficient in Rotvel's Eqn (17).
o Initial value.Kr Geometric elastic stress concentration factor.
p Plastic component of stress-strain.M Slope of S-N curve on Log S - Log N plot.
P-P Peak-ground to peak-air transition GAG cycle
Mh Cyclic hardening coefficient (Table I). per flight.
Mr Cyclic relaxatior .uefficient (Table I). R Residual stress, strain.
n, n' Number of cycles at a given stress level. REQ Equilibrium-Non-translent component of res'dualAlso, monotonic strain hardening exponent. stress.Prime for cyciic stress-strain curve.
Rt Transient-Non-equilibrium component of residualN Allowable number of cycles at a given stress stress.
level.lt Total stress, strain.
NEP Natural period-number of cycles to decay frominitial to a percentage of the i-ltial value. e, c Strain - in/in -
pth Cyclic relaxation threshold (Table l).
* Formerly with the Lockheed-California Company, a division of the Lockheed Aircraft Corporation,Burbank, California.
6-2
A( ) Increment or parameter ( ). a Normal stress - consistent units.
* Stress ratio parameter defined In Eqn (17), (18)T Shear stress - consistent units,
II. INTRODUCTION
Fatigue as cyclic load damage In airframe structural materials Is a physical process likely to be amajor engineering problem for many years in the future. Damage tolerance as a specific engineering designdiscipline has in recent years provided necessary safety of flight for unexpected damage from numerous sourcesas well as fatigue. However, commercial and military demands for fleet readiness* the economics of large-scale capital investment per aircraft and Increasing fleet life-cycle maintenance costs demand a betterengineering solution than has been achieved in the past. Flight loads recording Instrumentation and datareduction, along with recent development of highly versatile laboratory test equipment for the applicatiknof realistic load spectrum In natural random sequences has Introduced a much needed capability for realismin laboratory experiments. Research with these sophisticated tools is providing insights into the physicallimitations of past approaches to fatigue analysis and design procedures. These insights are leading to abetter understanding of some of the sources of variability and lack of correlation with fleet experience,and thereby to more sophisticated testing and analyses.
It is the purpose of this paper to discuss some particular fatigue design procedures aimed at improvingtechniques and quality of design results when programmed into the early engineering development tasks of anew airplane project.
An important concept I,i engineering, too often overlooked, is the importance of specific testing andthe technique by which specific test results are incorporated Into design and analyses. I shall define:
a. Open loop analyses are predictions from basics without benefit of specific testing, These maybe based on fundamental and general test data.
b. Closed loop analyses are predictionj from basics with specific test results forming the core(or corrective) system for extrapolations,
If a sufficiently precise open loop system is available, considerable time and money may be saved.This objective is most desirable. Fatigue, unfortunately, cannot claim sufficient precision and reliabilityfor open loop predictions and, for important structure, we must rely on specific tests and cosd looanalyses. I shall discuss applications of this fundamental concept In the design analysis oTalrcraftstructures.
August Wthler (1) in 1852-1870 conducted a scientifically brilliant series of experiments in fatigueof metals by isolating and holding constant each of many variables affecting the problem, By this meat.s, theconstant stress experiment and the S-N diagram of the results were invented. What has now to be done is toput the pieces back together again and determine whether the recombined results match nature. Palmgren (2)in 192 4 and miner (3) independently in 1945 propounded the simple concepts of the linear cumulative damagehypotheses in attempts to accommodate variable load amplitude environments. These intuitive and simplenotions have generated little comfort or confidence in their capability to predict time to fatigue crackingin real structures in realistic environments. We need to explore why this Is so.
It is becoming increasingly clear that the constant-amplitude S-N type data, by virtue of the experi-mental technique, does not contain the material fatigue response to the sequential effects of variable loadamplitude spectra found in real life. In the constant amplitude experiment, a different volume of materialis used at each stress level and no single volume of material feels the changing residual stress pattern northe work hardening (or softening) of varying stress levels different from the single level experimentallyimposed on each specimen. Thus, information on the sequential effects of variable loading simply does notexist in the constant amplitude experimental data. Therefore, application of analyses such as the linearcumulative damage hypothesis, in attempting to abstract non-existent Information, are expedients at best.Two main lines of attack are described to solve this problem.
The first approach relegates the material fatigue response under the complex variable amplitudespectrum to the laboratory. Experimental determination of the fatigue allowable is made from specificspectrum loading realistically applied to coupons, parts, joints, panels, components, and to full-scaleairframe fatigue tests. Availability of versatile variable load spectrum test machines through a wide rangeof capacities at a reasonable cost has engendered considerable interest in this approach despite the obviousdisadvantage of limited generality from dependence on spectrum load content (shape). A scheme of analysisof specific spectrum test results devised some years ago at the Lockheed-California Company is described todefine the specific S-N curves (interpolated on the Kt scale) which makes the linear cumulative damagesummation identically equal to unity for that spectrum test result. This stress concentration factor isdefined to be the Fatigue Quality Index for that coupon, joint, part, panel or location in full-scale air-frame fatigue test. Spectrum tests of field failures (and successes) permit establishment of acceptableand unacceptable Fatigue Quality Index levels from comparative tests. This permits projection of good fleetperformance into new design. Establishment of Fatigue Quality Index acceptance standards also permitsfatigue analysis and design to proceed early in preliminary design of a new project followed by design veri-fication testing as soon as sufficient detail design is accomplished. Constant amplitude S-N curves in thisscheme become simple transfer finctions between tested and modest variations on load spectra rather than anexplicit base for analysis In the normal application of linear cumulative damage. Several examples of thisapproach are described demonstrating its use in design comparisons, and comparing results of analytic Kt'sby elastic analyses, Boeing/Jarfall finite element analyses (4 ) and other experience with the system indesign.
A fundamental (ault of the usual application of linear cumulative damage analyses Is failure torecognize and account for fatigue significant residual stresses in the full spectrum. In the second, theanalytic approach is basically a refined stress analysis, not a new fatigue theory, The sequential lifehistory is developed of the residual stresses created by plastic yielding at the point of maximum stress
6-3concentration under peak loadings In the externally applied load spectrum. Relaxation or creep decay ofresidual and other steady stresses follows until new residuals are created by a succeeding peak load In the
spectrum. Pioneering work of Smith (5), Neuber (6), morrow (7), and application and experimental work ofImpellizzeri (8). Wetzel (9). Rotvei(1O), and Potter (II) and many others exemplify this approach, Correctaccounting for residual stresses entails a detailed stress analysis utilizing complete material cyclicstress-strain hysteresis loops, and If needed, stress relaxation and creep decay models, Superposed straincum non-linear residual stresses with the external strains and stresses reduces the fatigue failure theoryback to the use of unnotched coupon constant amplitude allowable S-N data In the linear cumulative damageratio form. Llmitdtions of the methods for application to Joints revolve around the problem of fretting forwhich no comparable analytic approach is yet available. Resort to an experimental approach is the onlycurrent recourse. Some concepts and data from work at Lockheed Rye Canyon Research Laboratories will bebriefly reviewed.
These approaches (analytical, experimental) attempt to improve the mean value of life predictions,A statistical analysis of a large body of fatigue results may provide a basis for a mean error correctionto the analysis. However, a wide variability remains about the mean and requires assessment, The vari-ability of the fatigue process is explored In subject areas Immediately sensitive to design, qualificationand fleet performance monitoring. Several elements or Increments of reduction factors are defined whichcombine to make a total life reduction factor. The objective is to provide a more rigorous basis for fleetperformance predictions, incentives for improving analysis, testing, material performance, environmental Fprotection, and mission element and load tracking. The proposed variability factor is graded to particularsof a given system of analysis, load spectrum, material, laboratory test technique, operating environmentalexposure and protective systems, mission element and loads spectrum definition, and field monitoring tech-niques. It is hoped by these means to improve the design and the translation of test results Into betterfleet performance, and to focus corrective attention on the major contributors to fatigue variability.
III. LABORATORY TESTING
SA. A History of Testing
The earliest record of engineering fatigue tests were those conducted by Albert In 1829 onScyclic testing of welded chain for mine hoists. Tests were conducted at I0 cycles per minute for as manySas 100,000 cycles. In 1843 W. J. M. Rankine (12) tested wrought iron railway axles and concluded that
fatigue cracking did not initiate by "crystalization" but was caused by structural weakness at the junctionof the journal with the shoulder without a transition radius.
From 1852 to 1870, August WOhler (I) conducted his classical and comprehensive study of fatigueresponse to torsion, tension, and rotating bending. The effects of abrupt changes In cross-section, heat-treatment, and time element of applying stress were systematically investigated. As mentioned In the intro-duction he was responsible for the so called S-N diagram, the basis for the presentation of constant ampli-
tude fatigue test data currently so widely used,
In 1864 the first fatigue test of built up structure was conducted by Fairborn (13). A wroughtiron beam 22 feet long by 16 inches deep stiffened by angles was loaded by a lever pickup and droppingweight system. Rotating beam material coupon test machines were introduced by Lehr (14) In Germany andR. R. Moore (15) in USA in 1925.
The first resonant fatigue test system is believed to have been introduced in 1938 by the Good-year-Zepplin Corp, (16) to test built up girders for airship construction. Also In 1938 W. Bleakney appliedthe resonant method to aircraft box beam structures (17). In May 1939 Lockheed tested a ;eries of wing boxstructures by the resonant system utilizing motor driven adjustable eccentric weights on a cantilever jigwhich was weighted additionally to apply the required mean or steady load. During 1941-42 H. W. Foster atLockheed, developed the resonant loading system to a high efficiency test machine which was duplicated bya number of other companies and government agencies including NACA. Many of these machines are still inuse today.
Multiple hydraulic loading jacks were applied to fatigue test early Constellation wing ribs in1940-41. In 1943 the first Lockheed variable load spectrum fatigue test was applied to Constellation winglower surface in a 50,000 lb resonant machine. In 1946 the first Neptune-XP2V-I Navy patrol landing gearwas fatigue tested with hydraulic jacks programmed to cycle the wheel spin-up and spring-back load vectorsby phasing the sequence of the vertical and horizontal component force jacks attached to the axes.
A 500,000 pound capacity resonant fatigue machine was designed by Foster in 1951 (18). Flexurepivots eliminated bearing wear and reduced friction. Mean load was applied through a soft spring while oscil-lating forces were generated by two opposing tuned pendulums operating through a leverage system onto the
test specimen. Wing surface panels and complex joints up to 3 feet wide x 10 feet long with dihedral andsweep angles and component ribs could be accommodated. Many other companies built these type machinesfrom Lockheed designs.
Lockheed's first application of a ground-air-ground cycle occurred in 1955 in step spectrum testsof the model 1649 Super Constellation wing centerline joint. This test was conducted in the 500,000 lbresonant test machine. The first flight-by-flight spectrum test was applied in 1956 to the F-104 wing-fuselage joint. To accommodate rapid chordwise shift of center of pressure between subsonic and supersonicflight, chordwise loading frames loaded by two vertical hydraulic jacks were programmed to give the desiredforce vector and C.P. location.
The Lockheed-Georgia company in 1956-59 conducted the first submerged (swimming pool) fuselagepressure cycling test In the USA. The USAF C-130 cargo fuselage was the specimen.
In March 1959, Lockheed-California company set-up their first closed loop servo controlledfatigue machine for spectrum testing. A potentiometer bank and associated electronic circuitry was used toperform thermal and load cyclic testing of titanium and steel matarials for supersonic transport design data.
6-4
B. Servo Controlled Fatigue Testing
A major break-thru in test versatility came through the successful development of electro-hydraulic servo valve systems for aircraft powered controls. In 1959-60 the Lockheed-California Companyinitiated development of a fatigue testing system subsequently sponsored by the AF FI'ght Dynamics Laboratory(AFFDL) based on this techrology (19). A magnetic tape recorded signal from a strain gage mounted on thewing spar of a USAF B-47 bomber was Furnished by the AFFOL. A 90 minute flight through high activity RockyMountain turbulence provided the basic loading history for use in testing. A number of counting methodswere applied to the taped signal and variations in block spectrum test parametc.'s of the same loid contentwcre prepared. The fatigue significance of these test block representations were determined experimentallyand compared to baseline fatigue response data '-om flight-by-flight sequences utilizing the original tur-bulence signal in flight portions and modified versions for ground taxi loading portions. Notched couponsand bolted joint specimens were tested (20).
Utilizing the basic spectru,, data furnished by Lockheed through the AFFDL and partially sponsoredby the USAF European Research )ffice, J. Schijve at the Netherlands National Laboratory for Aeronautics (NLR)repeated many of these same e;p'riments on a d..i. or more full-scale structures of the Fokker F-27 winglower surface. These complete structures fabricated of 7075-T6 were providentially available from an earlydecision by Fokker to change to 2024-T3 material on production aircraft. The NLR full-scale structure testresults confirmed in all respects the main conclusions drawn from the earlier research on coupons and jointsat Lockheed (21).
In the intervening years, the flight-by-flignt tape controlled test technology has been applied.o the US Navy P3V series engine nacelle (13 cont.'ol channels) and P3V wing with carry-thru box (54 channels)(22) the Lockheed CL-286 helicopter, one of the first helicopters certified by FAA on flight-by-flight vari-able load spectrum test techniques, (23), and to the US Army AH-56 Cheyenne helicopter fatigue qualificationtesting (24). ConsideraLle supersonic transport research under combined cyclic tharm.! and fatigue loadingwas accomplished (25). The Lockheed L-loll transport is currently undergoing random ordered flight-by-flighttesting (200 load control channels) (26). It Is planned that the USAF B-I bomber will undergo its full-scale airframe fatigue qualificntion test program in these same facilities (approx. 250 load control channels).Figure I illustrates a !arge universal cyclic fatigue test machine (Bi-axial in-p'ane panel loading withnormal pressure) and cyclic heating facilities. Normally serviced by 18 control channels, any necessarynumber of load and thermal control systems may be provided. One ma:hire of a mi lion pounds in-planecapacitj and two machines of 1.5 million pounds capacity are now ava~lable in the Lockheed Rye CanyonRe'eerch Laboratories.
Other -iAjor aircraft companies and government agencies both in Europe and USA are procuring similarciosed loop servo-4'-,trotleld equipment for it is almost universally accepted that the more realistic flight-by-flight variable load amplitude rest sequence is required, especially for full-scale airframe qualificationtesting. Howe~er, this type of testing for engineering design a'lowables, joint and cimponent development-esting is unfortunately not so unisr'aily accepted. Considerable reliance is still being placed on con-stent amplitude testina and the simplistic linear cumulative damage aralyses, in spite of :ts recognized
deficiencies and iide variaoility of results. A part of the difficulty is, no doubt, inhelenc in theadditional comolexity and increased number of variables required in the defrnition of load#.g spectra, andin the concept rf a consistent aLceptdble engineering procedure for transformation among different spectra.I shall now describe a simple aoproach developed for this purpose a' Lockheed about 1956.
ME C. Analytic Interpretation of Spectrum Tests
The basis for the analysis of variable spectrum test results was the linear cumulative damage rule.A full set of notched rouoon material constant amplitude S-N data was $'aired, cross-plotted, consistently
E smoothed and 5tandard;zed, i.e., fixed. The total applied "est specruy accumulated up to failure wasanalyzed for In/N at each of a number of Kt values . Cross-plotting 7nTN vs Kt and inte-'polation derivedthe rique KT value from the standard set of S-N curves wh,ch ýade the cumulative damage ratio identical toone:
I- 1 i.00 (M)
This spectrum test derived effective stress concen ration number was define- to be the "Fatigue QualityIndex". The FQI was desigmated "K" dropping the su)script "t' to differ-ntiate from the elastic geometricstress concentration factor. By maintaining the set of S-N curves invariant, the Fatigue Quality Ind'cesof different structures tested under different spec ra are more direct / comp -able on a quality sczle thatcontains explicitly spectrum stress levels, life in cities or number ', flights etc., integrated into asingle number, K, and avoided cumbersome graphical ijrve comparisonr.
By the consistent analysis of a large number of full-sze joint and component test -ec-mens
(I x 6 ft to 3 x 10 ft) a statistical distribution of Fatigue Quality Indices emerged as shown on Figure 2.Separation of poor detail from good design was accomplished by examining FQI for structures which failedearly in service compared with FQI for successful structure in service. Invariably successful Iong-li.'r'dstructure showed a low number for FQI (high quality) and a high number was shown for Fni (poor quality) forearly service failures. Application of these data permitted the engineering sequence of design to proceed:
(I) An acceptance standard of Fatigue Quality Index wis established for design ani analysis:
It was required that joints and details be designed to be equal or better 111,1a: say
K = 4..0 (shell structure)
"3.2 (machine parts)3.0 (helicopter parts)
"" (2) The acceptance standard was assumed ;nd fatigue allowable stresses dete-mined inilyt,"Illy
for factored life requlrements, for example see figufe 3. Weiqht/cost/perf,,rnancP tridestudies and detail design proceeded with confidence on the premise th.it the 1•,-tvd K value,"would later be demonstrated by fatigue tests of critical areas,
6-5
(3) As early as possible, specific load spectra were made available to the laboratory and arange of notched coupon tests (at several Kt's) were conducted at several reference stresslevels (constant ratio amplifications of all stress levels in the spectrum). Spectrumderived fatigue design allowables were developed containing experimentally the residualstress spectrum history at the differing notch factors Kt. These data wpre used to up-datestructural sizing previously based on open loop analytical predictions.
(4) Spectrum tests of fatigue critical joint and component designs were then conductad each toits own design spectrum. At failure in the test, the FI'tigue Quality Index was determinedas above. If the test life was sufficient, i.e., the Quality Index was equal or better thanthe acceptance standard, the joint or component qualif~ed for product;on. Poor quality indexand/or insufficient life required redesign until the part was acceptaule. The follow-upverification testing and development of necessary changes is a most important element in thesuccess of the system.
(5) Where captial investments justified the costs, full-' ale airframe fatigue tests are scheduledfor verification of the total structure. Realistic randc. ordered flight-by-flight sequenceloading ha, become the accepted norm for this final design iteration. The pattern of stagedtest escalations, and multi. design iterations each on improved experimental data base isnow visible to assure design or durable airframe structure for any required operational life-time.
The statistical derivation of the FQI acceptance standard comparatively translates succestfulservice experience on older models into the new dcoigns. The fixed standardized set of S-N curves isessential to consistently maintain the comparative ease. The recognized deficiencies of constant amplitudetest results were minimized by using the set of S-N curves as an arbitrary damage surface and thus as atransformation function between oifferent spectra. So long as the spectra are similar, transformationswould be less subject to error than predictions from constant amolitude datd wthout spectrum loaa inform-ation. By this f,,eans it was expected that at least moderate changes in opere.ing conditions and loadspectra could be analyzed on a spectrum test based system in which residual stress effects would be auto-aatically integrated exoerimentally into the (analysis) results at a higher confidence. A few exampleswill be discussed.
D. Fatigue Quality index
Applications of the theory of elasticity to notch geometries have derived a large body of elasticstress concentration factor data, utilized in design and stress analyses for many years. Also for many years,it has been recognized that most fatigue results d' relate only superficially to the theoretical geometricstress concentration factors. In constant load ariplitude environment, the effective fatigue factor, Kf, isdefined by the ratio of unnotched to notched value of net area stress at a given number of cycles:
K = [ Kt 1.001 (2)XKt J f(N)
is a complex fur zion of material, the life "N" Pt which the ratio is taken (which means really the nominalgross or net are stress level at which "N" was derived in the experiment) and also with the severity of thenotch. Figure ; illustrates a typical variation for 2024-T3 aluminun alloy.
A number of notched coupon tests of 7075-T76 aluminum were conducted under transport type loadspectra at several levels of reference gross area stress severity. Analysed by the Fatigue Quality Indexmethod, the relation of fatigue effective K vs geometric elastic stress concentration factor Kt was derivedas indicated on Figure 4. Within the raige of d-ta, a linear relation was indicated.
A few complex joint specimens nave been analysed by the finite element technique, modeling attach-ment load transfer among the varioLs pieces of the joint. Some of these joints are ill'mstrated on Figure 5.The Stress Severity Factor (SSF) is defined by Jarfal1 (4 ) to be the maximum stress from the analysisnormalized by the average gross area qtress in relatively uniform structure outside the joint. For thesejoint specimens, th3 relation of the cest derived Fatigue Quality Index to the Stress Severity Factor isindicated b% the test points. Within -he scatter band, a linear relation is also shown for these data onFigure 4.
Examples of open loop predict-ons compared to fleet crack ex'erience can range from factors of2 to 40 or m-re unconservative. One example of closed loop predictions compared with a cargo fleet crackexperience (27) is illustrated on Figure 6A. Prediction, were based on a Fatigue Quality Index vaije der:vedfrom test unoer a design lodding spectrum. A mean error correction factor of about 2.5 is indicated.Figure 69 is a 'orrelation of crack initiation on the right and left side of the wing of individual aircraft.Scatter is seen to be within ±25% on life which represents about a 2.5% increment on stress. Presuminglike exposure to service loads, these data indicate residual variability is small if mean error correctionscan be successfully defined. Figure 6C illustrates an improved assessment of operational mission defirition,redefining sert ;,- ,"ge by fleet segment, and as wail modifying the average damage assessment f-om the meanvalues within a eita )lock to the damage determined by averaging that at the corners of a data block. Thesetwo .orrections resulmsd in tle "latest" damage predictio- curve compared with the 'early" correlationcurve. It is observed that tne mean predictor at 50% of tLe fleet has improved from a ratio just undera factor of 4. to a factor just uder Z. A remaining factor not yet included is the fatque differencebetween a block test with meet ,o-a-eav. qr,-.nd-air-ground cycles compared with flight-by-flight tests. Theseare of about the o-der" of magnitude to -over tne remaining mean error correction ina'cated on Fioure 6C.
Another example of the difficulti s that may be encountered deri.ed fro• a -cert attempt toanalyse full-scale air'rame test results on yet a '*fýerent carqo type aircraft obtained by block •pectrumtost!;nq conducted some time ago with a definition of the ground-sir-ground cycle based o- ý,ean-ground tomean-air transition. These were determined by direct co,-oarativo spertrum tests to be -- c-o<-ervalt,- by
-MWS
6-6
life ratios from 2.3 to about 3.2G. Figure 60 illustrates the transformation procedure devised along withsome specific comparative spectrum tests conducted to guide the transformation to an equivalent once per
flight peak-to-peak definition of the G-A-G cycle. FQI K values from mean-ro-mean tests analysed by mean-
to-mean G-A-G definition were available. Analysis of other flight-by-flight spectrum test data by bothmean and peak G-A-G definitions provided a parametric relationship of cumulative damage values both computed
for the FQI K-mean-to-meean basis and the ratio of test derived' Ap.p/KM-M~
~~P-PK 1 LNHp IKpK = (3)SNE f KM_ M
Data points are shown on Figure 6D. The exercise to derive a consistent FQI K- value to be used with a
peak-to-peak definitior, of ground-air-ground cycle in analysing missions other th:n those tested was con-
sidered only marginally stLccessful. Transfer to load spectra other than tested must be considered to be
extrapolations z, best and approached with due caution.
Reviewing these results from •he design point of view, large changeb in time to crack initiationare gained by relatively modest stress increments, and qui'c '-equently little or no weight or performance
penalties ensue from common-sense solutions to fatigue problems. When the closed loop analysis, design and
testing scheme is conscientiously and consistently aprlied, we, ouite literally, have had no fatigue troihles
from design deficiencies in full-scale testing or in service. However, when full-scale test or service
problems have appeared, invariably either through oversight, uirecognized stressing systems, or lack of
early testing, poor detail design did slip through the screening cystem. While qkiite successful as a desk9"i
tool, its success in predicting life to initial cracking ;n the fleet is less than desired.
E. Limitations
Basic limitations of the tatigue Quality Index closed loop approach revolve around the ,nape ofthe transfer function, i.e., the set of S-N curves. fhere are two ends of the problem:
(I) The HIGH STRESS END of the S-N curves eortain residual stress history of only that one stresslevel, the specific data point, inden~ident of all others. The spectrum test contains thecomplete residual stress history for its one specific spectrLm. There is no fundamentalreason to believe the transfer function capable of oroviding ;rare than nominal siccess for
transforming to unrelated spect,-a, with different residual stress history.
(2) The LOW STRESS END of thC S-N curves contains the potential of an endurance limit. In thespectrum environment threshold Stress levels cf fatigue significanse have bten detectedoften at 50 to 80 of the constant amol tude endurance level (jt say the 10 -1O7 cyclepoints) (28), and some unpurlished Lockheed data indicates threshold levels could be as lowas 30% of the constant amplitude level.
F. The Truncation Dilemima
Economic limitations prevent multiple specimens for fatigue testirg large scale structures. Inthese circumstances only one test spectrum is applied, oerhups of initially random ordered flight-by-flightsequence. Highly significant decisions (for the test life result) must be made early in the •chedule to pre-pare this test spectrum. Three parts of the problen are apparent:
(I) LOW STRESS/IJIGH C ^LE TRUNCATION involves the direct omission of those multitudes of timeconsuming low stress levels simply from the necessary economics of extended test schedulespans. Constant amnl;tude endurance limits or normally aoplie' linear cumulative damage
analyses are not satisfactory criteria for decisions on deletio,, of low level loads in D
spectrum environment. Expeiiments at Lockneed indicate, for a titanium and a stainlesssteel, that truncation of low stress leve&ý below a threshold level of fatique sigi ificanceresults in no change in fatigue life when measured in number o, flights: even though severalmillion cycles were omitted. However, omitting Stress levels above the threshold level of
significance resulted in increased life measure., in number of fl:ghts. I, these experiments,te threshold level of significance from flight-by-flight variable load amolitude spectrumtests were from 50% to 80 of the constant load amplitude endurance lirit for these materials.Other evidence shows this threshola level of significance may be as low as 30' fcr someci-cumstance- of material and 'oad spectra. The concept is illustrated schemat:cally in
Figure 7 on which truncation levels A, B, C, & D proJucea the characteristic bani of results"*ndicated on the lower Branch I in the diagram. Similar results are expected for aluminumalloys although sufficient experimental results are not yet available to snecif;cally definethe threshold level (which may be spectru,- dependent). C-ack growth data indicatu a similarresult to a more sensitive degree, probably related to the very high stress concentration
factor at the crack tip compared with zhe usual notch factor for fatigue crack ,nitiation
experiments (2 to 8).
(2) HIGH STRESS/LOW CYCLE TRUNCATION involves the asses- ant of the ,nfluencc o-f the relaLivelyfewer occurrences of high streqs "spike" loads in the spectrum and their contribution toretarding or acc-lerating the time or number of flight, to initiatior of the fatigue crack.The fundamental mechanism of acceleration and retaidation is the creation, decay and regener-ation of residual stresses during the repeated application of service ttest) loads. The
upper Branches II and IlIl f the fatigue life results are illustrated schematicallý in
Figure 7. Two possible cases are shown:
j16-7
a. BENEFICIAL residual stresses are created at stress concentration points by plasticyielding under the highest spectrum loads resulting, for example, in compressive residualI stresses in a predominately tension loaded part. Omisslo. of the highest loads whichcreate beneficial residuals in this case (levels E F, G, H) will causn a reduction iffatigue life (Branch 11) in far greater proportion than can be related by normal fatiguedamage calculations which ignore the residual stress spectrum.
h. DETR.IMENTAL residual stresses, oi the other hand, are created by compressive overloadsI I ge7.eratin tensile residual stresses which add to the externally applied tension stressspectrum. Om~ission of the peak loads which cause detris~enral residual stresses can onlyincrease li~e measured in number of flights as indicated by Branch IIl on the d.agrarn."Coaxing" or extending of fatigue life'by periodic overloads has been observed in numer-o.-s experiments. Two cases of cracking of fightcr wing opper surfaces have been attrlibuted to hIgh positive !oad% crea*Irng tensile residuai stresses which cycled subsequentlyto initiate early cracking in thc fleet, Laboratory tests confirmed the source and
tic-e to crack initiation.L . (3) There is a limiting concentrated stress level (" proportional limit) below wr~ich spectrumloads will not product: significant residual stressces. Omission of fatigue seýnsitive loadsbel~w this level from the test wpctrum will tend to increase life in numb~er of flights asindicated along Branch IV.
For a given critical point location, the various branches interact with each other dependingcomplexly on the relation of the positive (tension) and negative branches of the extetnal load spe,ýtrum I(syssnetry vs unsyirgetry) and with the proportional limits of the material in tension and cormiression asrelated to both the external load spectrum and to the threshold level of significance. For example, Branch Imay slide along the horizontal life axis depending rin which maximum load level oas re2tained in the testspectrum.
The fundamental truncation dilemmia is now visible: Within one piece of structure, the level andsequence relation of maximum tension to comnpress ica spike loads in the Spectrum under difterent truncationdecisions may change residuals from beneficial Z^ detrimental. Ft~rther the airframe is an assembly of manyparri so)me of which are benefitted by perioeically repeated high loads and others tdegraded. The one testtherefore cannot ce expectedl to repre'sent even average ileet experience no: always to generate the failureI location% possible within widely varying experience ol individual aircraft. These discussions fray helpexplain some of the physical reasons some aircraft nay fall much sooner and in different locations thanothers in ri-e fleet which expericniced more sev,:re ('tigher) loading experienc~e. Truncating the %pectrum toomit the highest !sa% ten (or a hurndred) peak loads per unit block as proposed by some is no rei-ablesolution.
The questions oosf-d bly the truncation dileanea can only be resolved by speocifics of F-3ch program.To investigate specifics, knowledge of the probabi~ity distribution of load expectancies (exceedancies) mustbe determine6 acrcss the fleet, i.e., the least loaded aircraft (10th oercentilic) the tr'ean (50th percentile,and the highest lesded aircr;ft (90th percentile) of the fleet. Work is being initiated to define thesestatistical disiributions from a large awount of data available fror. fleet Ic-ads recorder programs. Fatiguednalyses accounting fnot tlie Dand of loads severity by mean-* Qf non-linear residual stress history analysesof the several Pote~itiaily critical locations Is necessavy to help resolve the truncation dileimma. Comoara-tiv,ý testireg with loads spectra at several different truncation levels for a number of iocations in thestructure -ýould soon bercsse excessive in costs. fowever, final de..isions on truneatton levels should becomparatively tested with 0o~ full spectrum to confirm the interpretation of full-scale tests results.
Louici-tg ea. the scale of predfction of t;me to crack initiation for the pu-rpose of managing fleetoperations, Iti aetthat prdcin r esthan stfaor.Tecnptof damage tolerant design
wil rvie aer~icof gra in, ndsreslcvels whc wl suefiitsft rmthe hazard
ghtsafty ~deconomic maintenance are vitally dependent on realistic predictions of critical loca-wlrsidt-nst rc itiidation. For this purpose, open loop analytli.c faiuprdcon are of littleu tiity an to o~enclosed loop design 3nd testing has not had the consistent data base to provide the
confi-dence Pnd asst'rnca of reliable results. A major improvement in predictability of fatigue crack initi-ation is becly needed. f should now like to turn attelition to some improvements emerging from intensivetresearch mm te, 0-,echznirs .of material response to the variable amplitude loading environment.L l1Y. THE ANALYTiC AiPPROACX
An incrtasin4 interest aril attention ;5 lately b,-trg given the subject of residual stress historyresuvIsr.l fronm arbitr-cry vari&:-* load s.pectre, 2nd its use in calzulating fatigue damage vnider complexloadfng srviron'rent51. Since the aork of Heywcod (29) ;and inany others, it has beenr recognized for someyea"S thit periodic o,,erlcads could r.~oduca fa'- greater increate in time to failure (from the regeneration-if beneficial retidual strr-saes) thin one or a fri o~erloads at the beginning of loading. Deleteriouseffects were ?'kewi~c far fg7eater for per~odic re:)ecitiin of l1fe shortonin~g overloads prodeicing detrimentalres-'(ijals than oae or a few.. at, one begi7ývong of edg As we liscussed in the truncation dilemmsa, therangie of "coaxing" (le-ngtheninV life) or -shorteninn" caný be quite disconcertingly large, sometimes coveringseveral decades in scope. When found in fl-cieFluetests or irn fleet service, the wide potential%%.s espe-cially upsetting. We %,Ill return~ to thii aspecr !in laecr Cistcurssons.
A. Tho impellizzazri Metlnd
Residual stress Is a !-' ndamrernt~l rsJtof the nzin-lir'ejt stress response of a material strainedbeyond a prteport;.cnal .e elastc limit. ~The simolost ,,ncept prv-posed for fatigue analysis biý Smith )Is,.
a (4
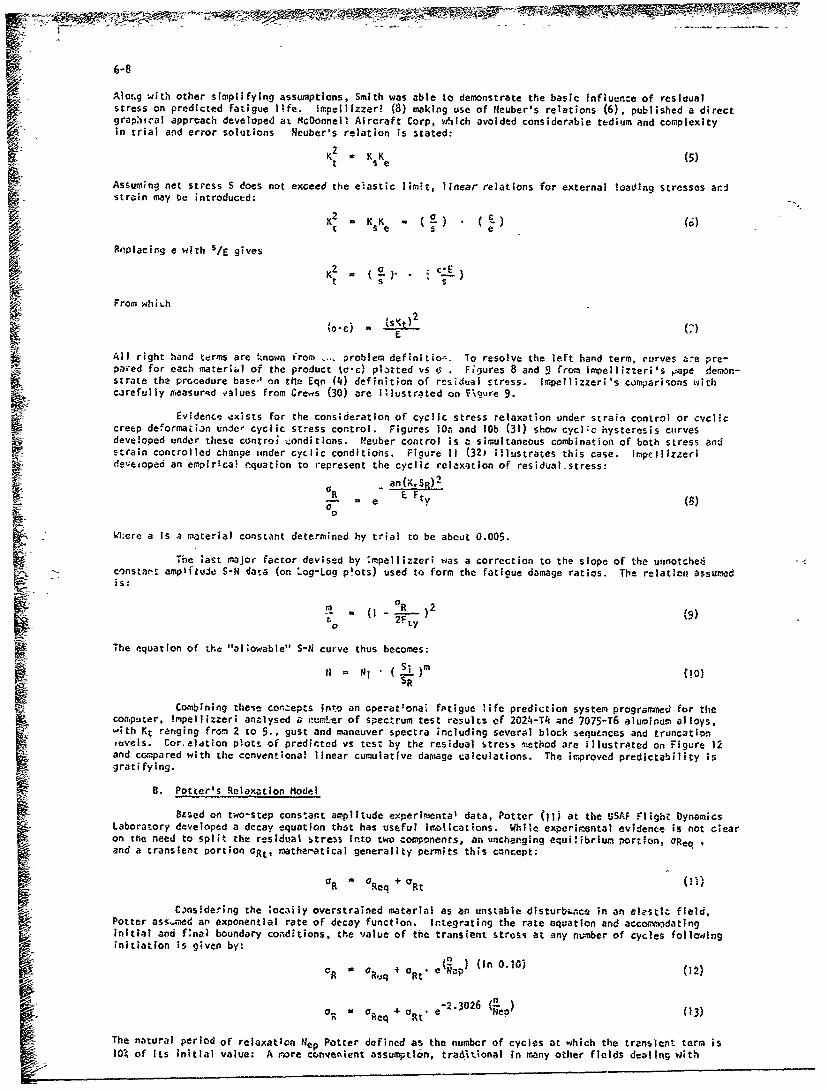
Alor.g with other simplifying assumptions, Smith was able to demonstrate the basic Influence of resiauaistress on predicted fatigue l-fe. 1iapellizzer! (8) making use of Neuber's relations (6), Published a directgrap'ilcal approach developed at MtcDonnell Aircraft Corp, which avoided considerable tedium and complexityin trial and error solutions Neuber's relation is stated:
Kt,2 KsK e(5)
Assuming net stress S does not exceed the elastic limit, linear relations for external loading stresses arcisrain may be introduced:
K2= K K -() .(.
t S e 5 e
PRnpiacing e with s/E gives
4 2 ( . , cEKt S s
From whiI
All right hand terms are known from oroblen defintio To resolve the left hand term, curves are pre-pared for cach materzbl of the product Itc)c pl.)rted vs 6 . Figures 8 and 9 from Impellizzeri's ,pape demoin-strate the procedure baso-'~ on Ole Eqn (4) definition of residual stress. Impellizzeri's conparisons withcarefully ateasurild values from Crewvs (30) are iMustroited on) V\jure 9.
Evidence exists for the consideration of cyclic stress relaxation under strain control or Cycliccreep deformain under cyciic stress control. Figures 10a and l0b (31) show cycl~c hysteresis ctirvesdeveloped under these controt ;ondit ions. Neuber control is z siutnoscmiaino both stress and
Stai cntole cane inercclc oniton.Figure 1](32)ilutae thscs.Impellizzeridevttoped an empirical cnquation to represent the cyclic relaxation of residual.stress:
MI.zre a is a material constant determined hy trial to be about 0.005.
The last major factor devised by :mpellizzeri was a correction to the slope of the urinotched
m OI R 2)I9
The equation of the "allowable" S-N curve thus becomes:
N -Nj' Si )m00SR (0
Com',ining thene conzepts into an Gperat~onai. fAtigue life prediction systen progranned for thecomputer, Impellizzeri analysed a rumLer of spectrum test results of 2024-Th and 7075-T6 aluminu'm alloys.'4th Kt ranging from 2 to 5., gust and maneuver spectra including several block sequences and truncationIrevels. Car elation plots of predirted vs test by the residual stress mathod are illustrilted on Figure 12
and compared with the conventional linear cumulative damage calculations. The improved predictability is
B. Potter's Relaxation Model
8zsed on two-step constar~t amplitude experimental data, Potter (11) at the USAF Flight DynamicsLaboratory developed a decay equation that has useful imolications. While experimn-rtal evidence is not ;:learon the need to spliti1 the res idal -,tress into two components, an unchanging equi 1 brium portion, OReqI and a transient portion aRt, itther-atical generality permits this concept:
OR aReq + 0 Rt(l
Cinsidering the bociiiy overstrained material as an unstable disturbL~nce in an e6450C field,Potter assýmed an exponential rate of decay function. Integrating the rate equation and accolmmodatinginitial and f~na) boundary conditions, the value of the transient stresi at any ntmber of cycles followinginitiation is given by:
,R00R-iq +aRt' gp n01)(2
-2-3026 (2 1O e + a t* e 'kep' (3)
The natural period of relaxation Nep Potter defined as the numbcr of cycles at w~hich the transient term, is10% of its Initial value: A more cc.nvenient assumption, tra6-1tioral in many other fields dealing with
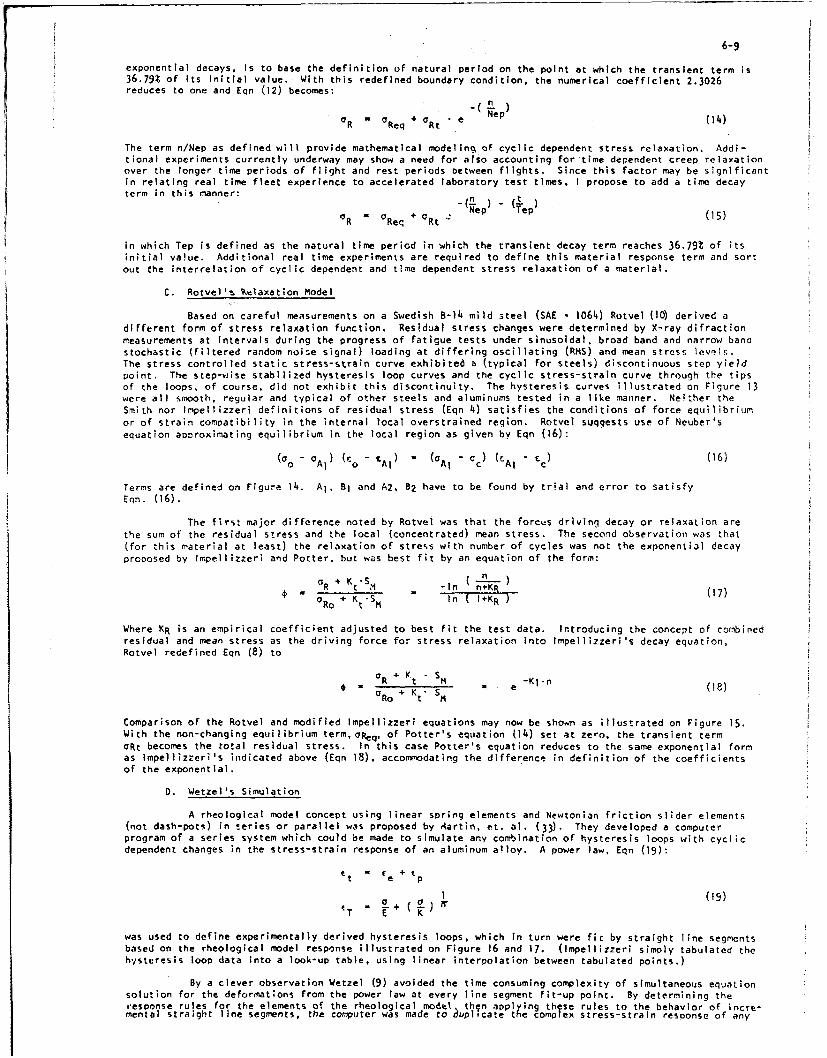
6-9
exponential decays, Is to base the definition of natural period on the point at which the transient term is36.79% of Its initial value. With this redefined boundary condition, the numerical coefficient 2.3026reduces to one and Eqn (12) becomes:
a a +0 a e - (14)R Req Rt
The term n/Nep as defined will provide mathematical modelint of cyclic dependent stress relaxation. Addi-tional experiments currently underway may show a need for also accounting for time dependent creep relaxationover the longer time periods of flight and rest periods oetween flights. Since this factor may be significantin relating real time fleet experience to accelerated laboratory test times, I propose to add a time decayterm in this manner:
Nep -Tep)
R 0 Req Rt (15)
in which Tep is defined as the natural time period in which the transient decay term reaches 36.79% of itsinitial value. Additional real time experiments are required to define this material response term and sortout the interrelation of cyclic dependent and time dependent stress relaxation of a material.
C. Rotvel's Welaxation Model
Based on careful measurements on a Swedish B-14 mild steel (SAE - 1064) Rotvel (10) derived adifferent form of stress relaxation function. Residual stress changes were determined by X-ray difractionmeasurements at intervals during the progress of fatigue tests under sinusoidal, broad band and narrow bandstochastic (filtered random noise signal) loading at differing oscillating (RMS) and mean stress levels.The stress controlled static stress-strain curve exhibited a (typical for steels) discontinuous step yieldpoint. The step-wise stabilized hysteresis loop curves and the cyclic stress-strain curve through the tipsof the loops, of course, did not exhibit this discontinuity. The hysteresis curves illustrated on Figure 13were all smooth, regular and typical of other steels and aluminums tested in a like manner. Nei:her theSmith nor Impellizzeri definitions of residual stress (Eqn 4) satisfies the conditions of force equilibriumor of strain compatibility in the internal local overstrained region. Rotvel suggests use of Neuber'sequation apcroximating equilibrium in the local region as given by Eqn (16):
(aO " Al) (Co - CAl) ( Al - oc) (CAl - Cc) (16)
Terms are defined on Figure 14. Al, BI and A2, B2 have to be found by trial and error to satisfyEqn. (16).
The first major difference noted by Rotvel was that the forces driving decay or relaxation arethe sum of the residual stress and the local (concentrated) mean stress. The second observation was that(for this material at least) the relaxation of stress with number of cycles was not the exponential decayproposed by Impellizzeri and Potter, but was best fit by an equation of the form:
°R M ts -In ( • )S= - (17)ORo + Kt-SM in (I+KR (
Where KR is an empirical coefficient adjusted to best fit the test data. Introducing the concept of combinedresidual and mean stress as the driving force for stress relaxation into Impeilizzeri's decay equation,Rotvel redefined Eqn (8) to
aR t K SK -S - e (18)
UR + Kt SMRo t M
Comparison of the Rotvel and modified Impellizzeri equations may now be shown as illustrated on Figure 15.With the non-changing equilibrium term, oReq, of Potter's equation (14) set at zero, the transient termaRt becomes the total residual stress. In this case Potter's equation reduces to the same exponential formas Impellizzeri's indicated above (Eqn 18), accommodating the difference in definition of the coefficientsof the exponential.
0. Wetzel's Simulation
A rheological model concept using linear spring elements and Newtonian friction slider elements(not dash-pots) in series or parallel was proposed by Aartin, et. al. (33). They developed a computerprogram of a series system which could be made to simulate any combination of hysteresis loops with cyclicdependent changes in the stress-strain response of an aluminum alloy. A power law, Eqn (19):
et fe + tp
1 (19)+ Pr
T E K
was used to define experimentally derived hysteresis loops, which in turn were fic by straight line segmentsbased on the rheological model response illustrated on Figure 16 and 17. (Impellizzeri simply tabulated thehysteresis loop data into a look-up table, using linear interpolation between tabulated points.)
By a clever observation Wetzel (9) avoided the time consuming complexity of simultaneous equationsolution for the deformations from the power law at every line segment fit-up point. By determining theresponse rules for the elements of the rheological .mod,. thqn applying these rules to the behavior of incre-mental straight line segments, the computer was made to doplicate the compl ex stress-strain response of any
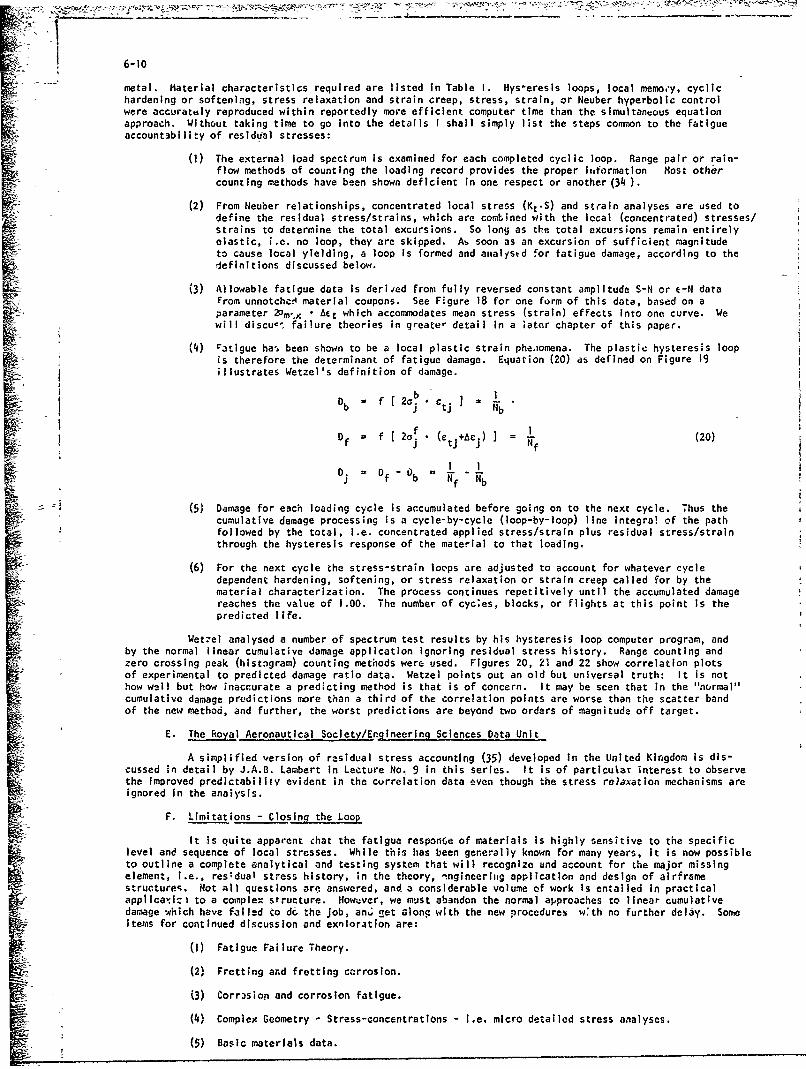
I 6-10
[ metal. Material characteristics required are listed in Table I. Hysleresis Ioops, local memo.'y, cyclichardening or softening, stress relaxation and strain creep, stress, strain, or Neuber hyperbolic controlwere accurately reproduced within reportedly more efficient computer time than the simultaneous equationapproach. Without taking time to go into the details I shall simply list the steps common to the fatigueaccountability of residual stresses:
(1) The external load spectrum is examined for each completed cyclic loop. Range pair or rain-flow methods of counting the loading record provides the proper itformation Most othercounting methods have been shown deficient in one respect or another (34).
(2) From Neuber relationships, concentrated local stress (Kt.S) and strain analyses are used todefine the residual stress/strains, whlch are combined with the local (concentrated) stresses/strains to determine the total excursions. So long as the total excursions remain entirelyelastic, i.e. no loop, they are skipped. At soon as an excursion of sufficient magnitudeto cause local yielding, a loop is formed and analysed for fatigue damage, according to thedefinitions discussed below.
(3) Allowable fatigue data is derived from fully reversed constant amplitude S-N or e-N dataFrom unnotchc! material coupons. See Figure 18 for one form of this data, based on aparameter 20mx • Act which accommodates mean stress (strain) effects into one curve. Wewill discu-' failure theories in greate, detail in a iater chapter of this paper.
(4) ratigue ha, been shown to be a local plastic strain phe.nomena. The plastic hysteresis loopis therefore the determinant of fatigue damage. Equation (20) as defined on Figure 19
L I illustrates Wetzel's definition of damage.
Db = f[20..ct. ) = Nb
j tj j b
f I
D j 0 f Nf Nb
(5) Damage for each loading cycle is accumulated before going on to the next cycle. Thus thecumulative damage processing is a cycle-by-cycle (loop-by-loop) line integral of the pathfollowed by the total, i.e. concentrated applied stress/strain plus residual stress/strainthrough the hysteresis response of the material to that loading.
(6) For the next cycle the stress-strain loops are adjusted to account for whatever cycledependent hardening, softening, or stress relaxation or strain creep called for by thematerial characterization. The process continues repetitively until the accumulated damagereaches the value of 1.00. The number of cyc~es, blocks, or flights at this point Is thepredicted life.
Wetzel analysed a number of spectrum test results by his hysteresis loop computer Drogram, andby the normal linear cumulative damage application ignoring residual stress history. Range counting andzero crossing peak (histogram) counting methods were used. Figures 20, 21 and 22 show correlation plotsof experimental to predicted damage ratio data. Wetzel points out an old but universal truth: It Is nothow well but how inaccurate a predicting method is that is of concern. It may be seen that in the "normal"cumulative damage predictions more than a third of the correlation points are worse than the scatter bandof the new method, and further, the worst predictions are beyond two orders of magnitude off target.
E. The Royal Aeronautical Society/Enrgineering Sciences Data Unit
A simplified version of rasidual stress accounting (35) developed in the United Kingdom Is dis-cussed in detail by J.A.B. Lambert in Lecture No. 9 in this series. It is of particular interest to observethe improved predictability evident in the correlation data even though the stress relaxation mechanisms areignored In the analysis.
F. Limitations - Closing the Loop
It is quite apparent chat the fatigue responrGe of materials Is highly sensitive to the specificlevel and sequence of local stresses. While this has been generally known for many years, it is now possibleto outline a complete analytical and testing system that will recognize and account for Lhe major missingelement, i.e., res~dual stress history, ;n the theory, nngineerioig application and design of airframestructure,. Not all questions are answered, and a considerable volume of work Is entailed in practical"applicaniz to a complex structure. Howuver, we must abandon the normal approaches to linear cumulativedamage -which have failed to dc, the Job, an, get alone with the new procedures w~th no further delay. SomeItems for continued discussion and exnloration are:
(I) Fatigue Failure Theory.
(2) Fretting and fretting corrosion.
(3) Corrosion and corrosion fatigue.
(4) Complex Geometry - Stress-concentrations - i.e. micro detailed stress analyses.
(5) Basic materials data.
a(6) Substantiation for complex structure and Joints.i ~~(7) Revised design and test variability factors. ''
With only these few of many unresolved problems, with the greatest difficulty residing In the stressanalysis area, it is apparent that we will be dependent on specific testing for yet some time to come. Thus,it will be essential to mainta~n a closed loop analysis policy and I suggest essentially the same FatigueQuality Index scheme we discussed earlier:
(I) Specific spectrum test results will be analyzed with several incremented stress concentrationfactors,
(2) The one (literpolated) stress concentration factor which makes the analysis exactly predict
the test results is the Fatigue Quality Index of that part under Its test spectrum,
(3) The Fatigue Quality Index so derived may be used with much higher dngree of confidence tocompare structures, relate to acceptance standards, and to analyze thi part for other thanthe tested load spectra, i.e. fleet tracking analysis. It automatically resolves thefatigue effective stress concentration factor for the complex geometry and combined stressstate.
V. FATIGUE FAILURE THEORIES
A. Allowables for Residual Stress Analysis Systems
With the mechanics of residual stress accountability fully contained within the analytical process,
the fatigue failure theory is now related directly'to the significant events which the procedure analyses. A
strain (stress) excursion around one and only one complete plastic hysteresis loop is defined to be thissingular event. The damage created by this single event is therefore assumed to be related to the experi-mentally determined total life with only this magnitude of significant events. All possible (?) material
responses are defined in the experimentally derived cyclic stress-strain hysteresis loops, includingmemory, cyclic work-hardening and softening, cyclic and time dependent relaxation, strain (creep) rela~ation,relaxation threshold- etc. - the allowable for this set of events is assumed to be the constant amplitudeS-N data at different strain (stress) levels on smooth (unnotched) bars. This assumes that all possibleinteractive elements are fully accounted for in the sequence with which the applied loading spectrum istraced around the hysteresis loops. Biased or unsymmetric loops involve a mean stress (strain) effectwhich is real and must be reflected in the S-N data. This may be done by analyzing the local mean of eachloop and relating to the proper S-N curve at that mean level. Either stress or strain plots of the datamay be used. Alternative approaches are available for accounting for the means:
(I) Wetzel's Approach.
Based on a parameter defined by Smith, et al, (36) Wetzel defined his allowable S-N curvesin the form:
(2oa AC vs Nf (21)
Figure 18 represents allowable failure data for a number of different mean stress levels.Wetzel's definition of damage by Eqn (20) utilizing this parametric form constitutes thefailure criteria necessary for prediction of number of cycles, blocks, or flights to crackinitiation i.e. failure of the S-N specimens, or to cracks of a specific size, or whatevercriteria was used to define Figure 18. We will take up this subject of failure criterialater.
(2) Walker's Parametric Form.
Walker (37) devised an expression based on an equivalent or effective stress defined asfollows:
l-m ,Am (22)max
in which Smax is the maximum strets,AS is the stress range In the excursion from minimum tomaximum level and m is a slope determined from log S - log N plots of the data. Figure 23indicates a wide range of constant amplitude data for 7075-T6 and 2024-T3 aluminum alloysindicating good fit for stress ratios from R - +0.6 to -2.5 for notched specimens (KT - 5.)and mean stresses from 0 to +30 ksi for unnotched specimens. Slope factors m - 0.50 for2024-T3 and m - 0.425 for 7075-T6 yield the following equations of best fit:
2024-T3 T - (Smax.AS) 0 . 5
(23)7075-T6 T - s'575.As"425
max
Either the Smith-Wetzel's or Walker's parametric form would appear to be a satisfactory
representation of allowable failure data for lnltial fatigue damage caltulations.
(3) Crack Growth Regression Analysis,
Crack growth models from fracture mechanics concepts have been used to determine Initial flawsize, which If used to start a crock growth process would result In failure curves corres-
6-12
sponaing to the S-N curve as shown 3n Figure 24i. Initial flaw sizes, of about l.0~ X 0-appear to achfeve best fit for the NASA data in the study (38). One advantage of thisprocess Is the ease at which allowable curves for specific and consisteort crack sizes lessthan the critical size could be generated. This concept has led tc a refined propisal dis-cussed next.
(4) Dual Mlode Conzept
A dual mode concept has often been suggested in which a crack initi,~tion period, Phase 1,woulo be, defined by fatlg.,e principles independently from a crack g~owth period, iFase 11,gove,-rcc entirely by fracture mechafllct pr-inci-,les and data. The difficulty with t1.lbapproach lies in the ey'perimcntal problem of measuring specificalty the point in tiroe (or*iumber of cycles) before which no physic~al zrick existed, and after which one could betollowed up Its growth path. This ,.pprowh is elso companion and competitive with the crackgrowth regression approach just discussed, That concept implys real flaws exist 'An "new"material at the bieginn~ig of Its life as a part, which means Phase I very likely does no.,exist in purt form. This is prchbably closer to truth than is comfortalble. The question t.hanis "-what is the population of initiai flaw sizes we must deal with?" These ideas obviouslyheed further development to become practical analytical tools.
(5) Combined Stresses
The majority of fati-yue data and anal-'ses are based on s.imple uniaxial stress systemrs. Hlcow-ever, the majority of real problems are m'ostly multi-,tress in form. The coii~bined stresstheory most successful in representing rwj.' -strtss I tique data appears to be the Von Misesequivalent ortabedral shear s*,ress criteria For ductile polycrystalline materials:
Ci .I [(a 0)2 . to2-(T3 + (or - U1)1 (24)
where op0,£03 are maximum Prinicipal stresses and c -60- represents the nijrrpricalcoefiiet fr tri-axiiol stress state. The equi*ealent stress state for uniaxiali,, loaded
specimen would be represetnted with c -V27 f31 For L'i-axially loaded plane sheet thenormalized form is: ((,'3 01
R = L1 pI + R 2 + (25eq I0 0P y a 3R1(5
For sharp notches, in which restraint of Poisson deformstions approicoes the tri-axial tensionstress states, ductility is inhibited and brittle tjpe behavior is approachti. For t~ese axtreme conditions,the maximum~ principal stress criterion predominati-
0ý y7 + 21max 2 (T~ xy
or in normalized form:
Rr., [ (k-R.+R)+2 + 41 (26)
Limi ted data correlation supporting the octahedtr, ~ear strscitio ishoionige25roSnsand Walsman, (40). Comparison of the maxim-aa- prig., *.)al ,tress ratios and the octahedral shear str-ss ratiosfor two dimensional (flat sheet) bi-axial rFl- ý. cherr st~eý,s (oý - 0) is shcwns on Figure 26. Each formula isnirm, iized on the maximum normal stress conipo,.ept ..,. plotteq in stress rat;^ form as indicated. Shadedregions indicate the range of values in. which the eqvivelent riwximum pnincipil itress ratio exceeds theequivalent octahedr-al shear stress. In all other P.-eas t~v ottahedral shear criterioni exceeds the principalstress ratios by substantial factors. Since fatigue iý; peaoosnated by p'lastic /lelding along slip planesin tihe micro-scale, the predominance of a shear criteria seenzý. ~t-irali wherever thvctIity is nr:t inhibitedby tri-ax.ieit stress state either from applied ctress system or by virtoic of 9eQomdtrIc;,-restraints.
5. Failure Crrjte.1a for Fatigue Test Airframe end Fleet Aircraft.
Definition of fatigue damage found by 1 iaspcction! In full-scale tests and In fleet~ a'rcraft bfearsspecial consideration. Fracture of laboratory coupons is ussjally the criteria foi the data points of 3-0curves and much of material coupon spectrum :,.it data. Component and joint tes- specimens ma-r sustain crac'.sizes from barely detectable to complete fracture at test termination. Except for isolated special is.-tions, there may be a wide range of crack sizes at various locations. The question is by what criteria atwe ludge "failure", "conformance or compliance to requirements" especially when requirements ha,,e been nomore specific thdn the expression "fatigue failure"? i.e., What constitutes fatigue faiture? The questik*is now more important nince imposition of damage tolerance requirerients does provide good ductile, fracturd~
- r`zSta-maell _ihl~ oeai stress levels resulting in a very considerable long period of slowcraci,-9rorwth-t -This 'means crack- minitoaL0Qo aY-sicur fdry 'early ye~t not be "unsafe" i-f suificient I!te andattention to inspection Is invested to ensure flinding a-nd fixing the crack before It reaches critical pro-portions. Such a situation, however, could soon become an economic burden ;f cracking occurred too early,too often, -and In miassive irreplaceable structure. Also, If cracking becomes, wide sprea 'i- numerous loca-tions, the maintenance of flight safety is jeopardized by mu',tipl2 cracks exceeding dam je colerance limits.
It has allso becorre quite obvious that a few isolated crackc even in irrportaiii structure does notneocessartly constitute disaster and cause for retirement of a vital and eXpensive fleet provided the struc-ture is fail-safe and the locations and time to look, find, and fix cracks are within reasonab%: c,;sts andsafet-ylimlts. Therefore, it appears important that a definition of operational limits (I e. failure) shouldcontain the elements of safery as well as economics:
6-13UDEFINITION,- Tht limilting operack.aal life of a fleet sha-ll be that ti-ie at which tho, crack sizepopulation In individual alircraft 's suct. that (11 flight 5efety cat, no longe; he eonootically ii.tlntalnea,or (21 when maintenance, inspection aJnd repair are ,.oj longer cos. c-fiective elativ'e to the iost of a majormodification or retireto-ant of the fleet.
A number of implicsitions are contained within this defirlition-
__(11 Flight safety cannot be maintained if crack population in any cne aircraft can~ exceed th-ttolerable by 'he fatW-saft: unezracteristics of the structure. T is -.eans that non-dsru5vinsve,-tion techniques must be -apable of finc:ng sub-critical flaw sizes with a high Prob-ability anc. conf~dence level o-' success, and that materials and stress levels be such thatcriticai flew s~zes are well above the threshold of tIDI capability. This also mean-, thatinspectilr. intervals and repair ia.-tiods required to maintain safety of flighz, must be within'Practicable operatitig limits fcr frequency and duritzion 7down time and w~ithin reasonablecosts,
`(2) Total lif~e-cycle maintenance and repair costs may thecome excessive ~ihen similar cracks45 develop over large areas of structure, when the number of individual critical locations
becomes large, a.nd/or whert cracks appeer in massive structure which cannot be repairedexcept by r~ajor reconstruction. Cost criteria may be extressed in acceptable percentageof :;ie replacement cost of the major compottent involvei What percentage is accegtablemost be indivilually determined based on need for the aircraft, bbdgets available, andava:'lability of a replacement unit or design. The objetelive for fatigue design sttAIojd bethat feet retirement should be fromn performance obso~tv-erc~e rather thao~ structurai fatigue.
(3) Crac, size population inpl\e% tati!:tical assessroent for Individual aircraft of the lo-ations,distributian of sizes with repct to repair --thods. and of the reliability of insp-ictionmethvds. For the full-scale faticum test article, periodic inspections in situ art, rtquiredduring the test and by complete d ýasý.enilv z.nd laboratory type lnspe'-ýticn .'fter the test.Inspections for the fleet aircraft ýinclude operaring base ;nspections, depot levei maintenanceinspections, both periodic and special, and for designated high time aircraftlaboratorytype inspection after complete disas-em~biy.
(4) Inspection effectiveness ha& be"n measured. in a few cases with uncorrtortable results (41)Inspection of parts on the aircraft f~llowe~d by disassembly and laboratory inspection prodL'cest'ao bodies of data. Within a number of cracl; .ize interva!s, the ratio of the number ofcracks foumd in situ to the number foantf in 'lie laboratory type inspection is taken to lie theprobability of deiection in that size nterval. This as',umes a) cracks in existence in, thestructure were found by iabor-ýtory inspectio.'. igure 2' indicates schematically typicalresuits. Crack size distribution found on inspection of fleet aircraft divided by the prob-abil.ty of detection in each s'ze intr.rval is aen estimated populaition of crack sizes assumedtr. exist in that aircraft. T-t-se &uare Important to thi determination of repair methods,
4t:i- "intervals to inspect cr..n,istent with repairable sizes, potenitia' of mul Ale adjacentcracks beyond damage toleranc! lirrits, anrd potential lr,_palr costs. Ftsr exan'ri]2, the simpleream to the next O've-size 3trtschmenc will generally limit permissible crack size for coet-biStent clcan-up to ibout 0.03 in. rt~s size is on the bound~ries of 111 cettection thresholdand, for more than d few specific locations, does not carry a very comforting probability ofdetection.
The data base for decision on the operational) Mnrit for major modification or retiretrent of afleet can therefore be qu~te extensive. The decisior, should n-t be ba5s-d on reaching an arbitrart analyt-icallf predicted cumulative damage ratio, even though derived from a test. I'leet crack history is a vital
i part of the decision data base.
VI. FRETT I N FAT I QUF
Considerable re- arch attentionr is beine, given the mechani!sm z'nd results of fretting fatigue insliding surfaces of joints, bushes, iFnd lugs. The accepted standard specimen approaech is to pply cýirttrol ledpressiure to pads of sici~la~r or Jifferernt maiterl.ls bearing oin 0,q surfacf-s of fatigue specimens d-uring c~clicloading. Hoepner (42) as have many others, reported typically l,,rge reductions from bawelioe (Kt - 1.0)material fat~gue strengths for 7075-T6 end titanium (AI-tiV, maill annealed mate,!als. At, exaimple comparisonis shown on Fit-ure 28 for pressure pad bearing str~sses of 3.0 and 6.0 ksi, under Linusoidal loading. Inter-t ptling the fiatting periods at various p~ercentage, of ftatting fitigue life, a 4amage threshald limit isit.1lL&ted oa Figure, 29 at about 20% of the fretting fatigue life for the titanium alloys. Kirkby (35)re.,rted ,iinllor results for aluminum alloys witri a threshold from "10% to 30V". However, foi taiivom loading,Kirk~ir ndicated the damage threshold dropped tp the level of about 5t of the fretting fatigue ]lfe.
Using ai notc-ela~tl%. tec#.&itque, Rollins a~id Sandorff (43) at the Lockheco Rje Canyon ResearchLaborator~es Inve~tlgated the st-ecss environment in the contact areas of uniformly c'.. oped and bolt clampedla- joints. Vieý have observed a slip front mechanism, moving alono the edges of the contact surFaces asload is lnc-rcasei, which they describe as follows:
(1)1 The maainiea~k of the joint under highest contact ;7earing stresses hias -no rela ive moodon andload transfer is by friction.
(2) The slip front itself is a band which transfers shear effectllely but undergoes unusually large. 7ý relat~ve shear displacemenits resulting in bifurcation of axial stresses on opposite interfaces- at the forwcrd (bolt side% of ths slip band. Axial stresses are locally amptified. Peak shear
and peAk axial stresses are ;.hased somewhat apart.
(3) Ths- reqllon irvn.ediately bethitd the slip front (away from t~he bolt) has abso,-bed gross relativemotion wfth the associated reduction in sh~ear transfer.
6-14
Figure 30 shows the distribution of axial and shearing stresses in each surface of a double lap shearjoint under 1200 lbs bolt clamp load. These stresses are transformed from photoelastic measurements to anequivalent aluminum prototype joint. Figure 31 indicates relatively little change in extent of bearing areawith increase of boll clamp-up load over a wide range of values.
The position of the slip front was observed to move progressively closer to thu bolt as axial stres.was increased and upon removal of load a residual stress system remained involving both shear and axialstresses. Reversal of loading would no doubt follow a hysteresis pattern as to the position and residualstresses in the active zone.
Rollins and Sandorff also observed that the moving slip band with its magnified strain incompatibil-ities and stress concentrations is located in the region of maximum fretting damage associated with frettingfatigue failures.
The mechanics of fretting operates on a micro-macro scale in the contact of asperities of surfaces.Sliding motions, inevitable in slip strains in any deforming faying joint, will crer.e bending stresses atthe roots of asperities which interact with surface stresses in the plane, through a stress concentrationof unknown (but high) value. Sliding shears tear asperities and may project tears into the surfaces. Debristorn loose oxidizes and forms grinding powders which in turn scratch, groove and tear the faying surfaces.Sliding shears in moving slip bends carry a v'ake of surface tensile stresses (behind) and compressive stresses(ahead) of the edges of the contact pad superposed on cyclic stresses in the body, developing surface residual
stresses. Asperities imbed into the surface of the body sheets and develop localized residual stress fields.
Developing a tractable analytical approach in the presence of the multitude of these complexities iscertainly an intellectual challenge and, in the nature of understanding the phenomena to eventually controlit, should bear considerable research attention. However, from a practical engineering sense Prevention ofFrettin2 is the only viable solution. The reduction in permissible design limits is so drastic that it isunacceptable to design for any appreciable degree of fretting. Some examples may be cited:
A. Titanium faying surface fretting was encountered in a helicopter rotor mast to hub joint. Silver-
plated stainless steel shims cured the fretting. Rotor hub lug bushing materials were chonged to an aluminumbronze allo/ to prevent fretting in these critical elements. (24)
B. Epoxy adhesive bonded joints are used in the longitudinal seams of the L-1011 transport fuselageto prevent fretting and reduce stress concentrations in the rivet holes (used anyway for fail-safe back-up).These bonded single lap joints were so successful that some design difficulty was encountered in achievinga like quality level in the four quadrant splices left for final assembly by mechanical joining techniques.The final solution was a symmetrical double butt splice with the outer plate protruding into the slip stream.(26)
C. Epoxy resin impregnated with molybdenum disulphide solid lubricant and cured at 150C is reportedto solve fretting problems at elevated temperatures in aluminum structure of the Mach 2.2 Concorde (44).
The solutions to fretting problems therefore are evidently along the two fundamental paths:
(a) Fix the joint -- i.e., permit no relative motion, or
(b) Permanently lubricate the joint.
For we cannot afford to design FOR fretting.
VII. CORROSION AND CORROSION FATIGUE
It has been said that metals came from the earth and spend the rest of their life trying to get backinto the earth. Our colleague W. E. Anderson, in Lecture No. 5 of this series has just misplaced the full-
scale fatigue test by corroding the structure awayl Seriously, corrosion is an insidious and ever pervasiveproblem, probably equally costly in fleet maintenance as is fatigue. While much food for thought exists in
what our learned colleague has propounded, I would add a few thoughts from the structures side:
A. Stress corrosion which has a measurable threshold stress level of significance is controllable bydesigning to stress limits. Selection of materials, tempers, limiting fit-up and shimming tolerances and In-terference fits, designing to stress limits and the like have become routine handbook procedures in mostdesign offices for years.
S. While corrosive environments do accelerate the initiation of fatigue cracking, the addition ofmaterial to reduce stress levels is not a satisfactory solution per se. The types of corrosion non-sensitive
to stress level must be controlled by material selection, providing protective and inhibiting barriers,inspection, and preventive maintenance. Life reductions of two or more have been observed outside thelaboratory wall compared with Inside. However, before these reductions and attendent weights are accepted.primary means of protection and maintenance systems should be exploited.
C. Growth of c-icks after initiation of corrosion damage is an entirely different ,atter. If, due tothe failure of prevention measures, corrosion cracks are formLd, the protective barrier is breached. Thephysical principles of fracture mechanics are fully operative. Operating .tress levels are one of the mostsensitive means available to control chemically accelerated crack growth. Should these considerations becometoo severe in design, one avenue, seldom explored, may prove helpful:
D. Quantitative statistical definition of the corrosive elements existing In the environment hasnot been accomplished. Outdoor exposure racks and fleet trials are In the nature of observing the responsewithout really knowing the stimulus, This has led to a few cases of laboratory alarms which proved non-existent In real life, Due to the large number of potentially corrosive elements involved, this Is a form-idable task But, corrosion prevention will remain more of a black art than a science until laboratory,;m,,lnflIfn eý;Yn b a.hý d on r-nI world environment,
6-15
VIii. FATIGUE LIFE REDUCTION FACTORS
It is well known that fatigue is a wiaely variable process. What is nre always recognized is thediversity and scope of the contributing sources to variaHlity. It has been general practice for a numberof years to recogniza variability in fatigue by applic, tion of a life reduction "scatter factor". For thesingle purpose of establishing a legally acceptabe' definition of contractual compliance with fatigue require-ment, a "scatter' factur of four (4) was established by the USAF from a statistical analysis of a substantialamount o' experim&ntal fatigue data. For this limited function the factot of four has been sing-larly useful.Unfortunately, past practice has extended the isage of this single-valued scatter factcr to the prediction offleet service life performance and into extensive individual aircraft tracking and fleet monitoring proqramswith generally somewhat less success. While simple in concept ano easy to administrate, •he single-valued"scatter" factor falls short of representing the physics of the fatigue process. It is, therefore, ourpurpose now to explore a scheme of a variable fzeigue life reduction factor in a form that recognizes andprovides visibility to some of the major source: of scatter. Contractual needs will, of necessity, continueto require def~aition of a single number for the purpase of de..•nstratinq compliance to fatigue designrequirements, although the number need not always be four (4).I, The objective of this scheme is to improve the product in each of the sensitive areas; and to provide
4 the incentive and rationale for the exoenditure of rianpower and efFo t in areas of highest pay-off to achievethis improvement at acceptable increments cf weight, performance, and costs ane to provide a measure of thepenalties inherent in necessary compromises. The areas are:
E,igineering Analysis/Data OaseMaierial Performance/TestingEiivirormental Protectionmanufacturing and InspectionI� 4 ission Element and Loads Tracking
Each major contributing source is defined, variability is assessed, and inc'ementai cunLributions tovAriab;lity are combined into a weighted total fatigue iife reduction factor. The fundamental basis for thedefinition of the Fatigue Life Reductioi. Factor is to achieve an equal degree of reliability or probability ofsuccess, regardless of the deqree of scatter. Where data :s available, statistical values are used. Wheresuch data is not available, considered engineering judgement is applied to establish relative values. Inthese perhaps .-ontroversial areas, acceptable data will be most welcome from anyons who wishes to contribute.
The tcal fatigue life reduction factor is therefore defined:
A E T MI) (
R RA - Contribution from Analysis/Data (Table II)
R E - Contribution from EFvironment (Table Il1)
Rt = Contribution 4rom Materia, Performance/Testing (Table IV)
R , R! Contribution from Manufacturing/Inspection (Table V)
RL - Contribution from Loads and Mission E:ements (Table VI)
Each table is a matrix of values of R as a function of the indepencert variables for each particulararea.
SA. nalysis and Des in Data Base
Variability contrFbu:ed by th- engineering design and analysis procedures for t!"'s-, parts notdirectly tested and for the analysis of loads arnd mission spectrum cflanges ;or tested points will vary withthe qua'ity of the experimental data base and with the specific cethods and procedures of analysis. Table IIp'esents factors RA depending on the type of aralysis, open loop anzilytical oredictions or closed loopspecific analysis of a test result, and on the experimental data base, ie. graduattd structural complexityfrom material coupons, to joints and components, and to the full-scale airframe (and eventually fleet crackhistory) along with the type .; test,ls. ,constant load amplitude S-N and variable =mplitude spectrum typetests. With the exception of cabin pressure hoop tension joints, constant amplitude type testing is nolonger considered a viable method for joints and components and full-scale airframe tests. Flight-by-flightspectrum testing is both fea it le, more represent.;ive and is now the required mode fer full-scale airframecompliance tests in USAF. (4j)
The conventional linear .umuiative edmage analysis based on constant amplitude S-N data frommaterial coupons or joints and components - witt-out directly accounting for residual stress history is mostineffective. Variable amolitude spectrum tests, preferaLly randon: ordered flight-by-flight sequence, providesa direct expprimental accountability of i gnificant residual strcss history, fretting in Joints and compon-ents, etc. Many of the deficiencies of constant amplitude testing are therefore accounted for experimentally.Analysis of soecific spectrum fatigue test resultt by a Fatigue Quality Index or an equivalent orocedureprovides a more satisfactory base for anaiyL.n. modest spectrum changes. The set of constant amplitude S-Ndata curves tlhen becomes a transfer function betwel.i a tested spectrum and a related or changed spectrum withs-cw1,t better -ofid,.nae I-,n applicat"- ort conventional cumulative dmaage analysis without benefit ofthat Integrativ.y spectrumti st result. Smaller reduction factors are therefore projected for this techniquethan for conveýAtional damage analysis milhods. Because the S-N curves do not recognize order cr sequentialeffects, as we have discussed, their shape It not useful for more than modest spectrum differences.
6-16
Analytical accountability for residual stress history by the cyclic stress-strain hysteresis loopanalysis, previously discussed, is considered a major improvement in fatigue analysi3 methods. A minimumfactor of 1.25 on life for the best available analysis technique represents approximately 2.5% increment instress; thus this preci.ion factor on stress analysis Is not considered overly conservative.
B. Environment
Anti-:orrosion protective systems are reqs;red for all structural materialý T,,ese systems areall sensitive to quality control in application and especially to maintenance quality in service. Once theprotective systems are breached, both the crack initiation time and growth rates accelerate considerably.Basic philosophy ', to design and size structure for the presence and co,,tinued maintenance of an effectiveanti-corroslve barrier. If this is effcttively achieved, then RE-1.O0 could be satisfactory. However, indifficult maintenance environments, for example, faced by military operations, this is not always possiblet" achieve. In this case, the values of Table III may be applied. Cost benefit/performance trade studiesshould determine the cost effectiveness of flying the weight as opposed to paying the price of inspectionand maintenance.
Environment.; exposure is graded into three levels of iicreasing severity:
(I) Benign - Interior structure unexposed to external atmosphere.
(2) Norrral - External structure exposed to medium active (sea coast or jungle) atmosphere.
(3) Active Environment - Including structures directly exposed to engine exhaust gases, fuelsump water (chloride concentrates), food and human waste products,potential bittery spillage areas and others more active than normalsea coast atmosphere.
Early initiation of "corrosion-fatigue" cracks are to be inhibited by choice of more corrosionresistant materials, heat-treatments, and reliable protective systems. This example list is to be expandedin material choicoi to recognize differences in corrosion resistance, for examiple between 7075-T6 vs T73 vsT76 forms. Alternatively, if fatigue design allowables are directly determined experimentally in satis-factorily simulated environments with reasonable exposure (breached corrosion prevention systems), thenRE - 1.00 may be acceptable. !n this case RT shiould be evaluatea to ensure adequate assessment of thecombined factors, (RT'RE).
C. Material Performance/Testing
Almost all variability data used in the past is derived from this source which represents thecombined effects of experimental variations and inherent variability of material response. A large body ofdata exists, some of which has been analyzed by various statistical approaches. Table IV presents some ofthese results fnr different manrials, test methods (variations in techniques of variable load spectrumtesting), and structural complex;ty (23). Much of the data on alumin~n and steels is taken from reference(23), some titanium data is from reference (28). The current USAFML program on development of reliabilitymethods is to provide confirmation and modifications of these factors (as necessary).
Additional refinement of the variability factor as a function of numbe; of specimens and therelative stress renge severity in the test spectrum was fout-d statistically significsnt ind exponentialcorrections are given in Tables IVA an' '18.
The Titanium Problem. Of pa:;cular note is the relatively h'gh variability of titanium productr,being about three times that of steel and nickel alloys and 2 t~mes thit of a;uminjms. A closed loop designand analysis system which recognized this difference in variabil'ty would te.nd to place titanium in a non-competitive position. To avoid the loss of this excellent material, for f'tigue critical parts, special stepsare neressary to control variability in the production of titanilim products. The USAFML has embarked on aprogram to develop a procurement specification for premium giade titaMum materials. This specificationrroposes to increase fatigue and fracture mechanics properties and reduce variability by tighter control ofhydrogen, oxygen, and other detrimental Interstitial trace elements, and to correlate these properties withm~cro-grain size and structure. Trade-offs of static propertics with fracture toughness, fatigue level andthe variability are major considerations. Assuming success, this AFML program demonstrates the objective ofthis scheme and the importance of visibility of the sources mf variability in profi.ing incentive for signi-ficant improvement in the airframe product.
0. Manufacturing and Inspection
It is the function of Engineering to establish the design drawings and requirements for theproduction of parts and assemblies of the airframe.
It is the function of Manufacturing to produce parts and assemblies to the drpwing tolerancesand specification requirements.
It is the function of Inspection (quality assurance) to ensure that each and all production andprocessing steps and requirements are achieved within specified tolerances oa. each part and assembly.
It has been our unfortunate experience that critical flaw s;zes can be below the detectablelimits of the best available NDI techniques. It is, therefore, the purpose of the new Damage Toleranne
requirements (45) to ensure safety of flight In the presence of detectable f!dVS or larger, assumed toexist in the most critical orientation in the most critical stress fle'd. Inspection capability has thercfnrp for the first tlre ento;'ed quantitatively into the design process, s. lection of materials, allowablestress levels and sizIn4 of structure for flight safety. Even tU. ugh damage tolerance provides requis!te"safety, it is equally important from an economic and from fleet availability standpoints that flaws fromcorrosion or early fatigue crack initiation be prevented or delayed for the duration of fleet usefulness,
6-17
currently for much longer times than In the past. Coupled with improved engineering analyses and testingtechniques, the capability exists to successfully design and test for more stringent requirem-nts. Table Vpresents the concept of graduated mai.ufacturing re'uirements for the control of fatigue qualit, and graduatedinspection requirements to ensure meeting fatigue and fracture requirements.
Parts designed (i.e. sized) for static strength, stiffness and other than fatioue requirementsmay successfully pass fatigue requirements with a large life factor. If so, no more than normal manufacturinjand inboaction levels ar- required or desired. Howeve,', if sma~ler factors are required to pass fatiguerequiraments, then justificatirn exis~s to incorporate sp-ecial manufacturing operations, (i.e. smoothersurfaces, blending radii, sktot-peening, interference fit attachments or cold worked holes; anti-frettingcoatings or shims, etc, etc.). Justification for special manufacturing and inspection requirements is thusavailable.
Those fracture critical parts that would be fatigue csitical without damage tolerance requirementswill benefit from material controls and special fracture -iechanics NDI inspections. Recognition of thisbenefit is included in t0e lower fatigue life reduction fpctors in Table V for apolication to specificallydesignated areas.
Other equivalent rational cr:teria may be devised.
E. Mission Element and Loads Variability
Two ends of the design validation and fleet operating orogram require different considcrations:(I) Initial design and development, (2) Fleet tracking.
1.) ,,;ial Design and De.,Iopment
)ission element definition and operating statistics and loading dynamics analyses initially
involve assumptions for operating fleet utilization and analytical assumptions or predictirnsof operational parameters (weights, speeds, altitudes, etc.) ant! predictions of dynamicresponse of the structure. Statistical definitions of the physical operating environment:turbulence, manuever, taxi, landing, lodd exceedancies involve a oroad band of expectancies.Simplifyinq assumpt ins in the combination and reduction of these statistical data into thespecific design and analysis spectra, and the further truncation of design spectra to testspectra involve decisions known to have a widely varying imoact on the fatigue results. A.discussed previously the most generally used linear cumulative damage analysis techniques(without residual stresý soectre consideration) are considered inadequate to assess the re.)fatigue significance of these various simplifying assumptions and averaging to so-calledequivalent (fewer) missions. Table VI (A), therefore gives a (probably inadequate) scaleof variability of fatigue response from these sources. The variability of fatigue respons.due to truncation and fore-shortening of design spectra to test spectra is potentially sobroad, cannot be assessed with confidence by normal cumulative damage analyses, (witho;otresidual stress sprecta), that comparative tests should be run to determine correctivefactors.
(2) Fleet Tracking
STwo basic phases of fleet operational trackinq programs are planned: (45)
a. A limited program of instrumented mission element and loads tracking during early fleetoperations is established to verify the assumptions and decisions made to initiate desgn,development, and fatigue verification and qualification testing and acceptance of thebasic design.
b. A less sophisticated but lifetime duration tracking program for individual aircraft isestablished for ihe purpose of detecting major changes in missions and to monitor andmanage f;eet inspection, mainter.ance and repair (modification) programs.
The effectiveness of these programs is highly dependent on the degree and calibration ofinstrumentation for recording fleet operational parameters (VGH), loading history, (multi-plex load recorders and acceleration counters) or point stress recorders. Table VI(B)indisates a scale of graduated factors reflecting precision of knowledge of these operationalparameters, It i3 clear from past resuitt that load experience within a fleet is widelyvariable, and since the fatigue response of materials and structures is so highly dependenton actual loading history, it is quite evident this factor R, is a major contributor toadequate fleet management. Rationale and incentives are made visible to justify fleettracking programs, as well as penalties which may be required for necessary economic or
operational compromises.
F. Sample Trial
Sample data for three structural materials ore presented in Table VII. In each case, the firstcolumn represents the optimistic selection of the best elements of the life reduction factors from each con-tributing aia. These co;umns indicate that when all elements are under the best of available procedures andcontrols, ;,fe reduction factors could be substantially less than some currently used "scatter" factors.
The first column for titanium showq that in spite of a factor of six for material variability,supoort from the best of all other elements results in an overall factor of not more than *4.O. Premiumprocurement specification work described earlier should perm., confident reduclion of the factor of six and,where cost effective, titanium will remain competitive with other st-uctural materials for fatigue criticalapplications.
v N
6-18
Where fatigue requirements can be met with larger factors, the cost of premium work must be saved.Where smaller facto-s ,-c %,cessary to meet fatigue requirements, highest payoff areas are visible to achieverequirements at least cost.
A system of variable fatigue life reduction factors is proposed to replace the fixed "scatter"factors now almost universally applied to prediction and tracking of fleet fatigue performance. Contributingsources of variability are identified and conditions are defined to achieve only the necessary level offatigue quality control with only the necessary expenditure of effort in design, manufacture, inspection,fleet tracking and maintenance, repair and modification. Incentives to improve the product and penaltiesare made visible for necessary compromises. It is expected that refined versions of this scheme (or anequivalent concept) may become the basis for fatigue control.
Several steps are necessary to implement this scheme into the process of engineering design,evaloation and control of fatigue.
Substantiation and refinement of' the content (ntmbers) is required and work on several areas hasalready been initiated by some organizations. the aid. judgement and support of the fat~gue coam'nunity issolicited to fuither refine and develop this concept for practical application to new and at appropriatetimes to existing programs. Specific and constructive commeents, data, and sugge.:ions are encouraged.
IX. THE STATISTICAL NATURE or FATIGUE AND NON-LINEAR COMMUNICATIONS TAEORY
We have observed the non-linear cyclic and time dependency of stress and strains in measurements ofrepetitive stressstrain charcteristics of mater:als. We have observed the statistical nature of thephysical environment, gusts, ground surfaces, ,aneuvering load factors (biased but none-the-less statistical)and operating parameters w' :h govern the load input to otr structure. Indeed, the structure may be con-sidered a signal processor in comnnunications theory concepts. The broad oand frequency content of thephysical environment is processed into narrow banded load signals by the tuned frequency dependent filteringaction of the dynamic response of the gross structure, attenuating and amplifying the external load compon-eats according to the dynamic rcsponse characteristics. Figure 32 depicts such a signal processing systemfor the airframe structure. The external load spectrum is in turn processed by (usually linear) transforma-
tion into local internal structural element force sign.l. We have discussed in other sections oa this paperthe highly non-linear transformationc of the structural element force spectra through the localized formfactor (stress concentrator) and the mechanica;/matcrial cyclk streý,/strain hysteresis response completewith local me-nory of past events, work hardening-softening, periodir generation, decay and recreation ofresidufl (tr. nsient) stress systems proven so important to fatigue predictions. 7hrough a capacitivecapability of .he material, accumulation of a cycle/time integral qJantity of the processed signal reachesa breakdown threshold at which time a physical crack is initiateu. The local circuit switches to a drasti-cally different form factor (tip stris- concentration factor) and a step discontinuous action in crackopening and closing mechanics. The resulting ,ignal processor is, of coarse, the crack growth process.'his process may continue toward another climactic e',ent in which a local signal peak load may exceed abreakdown strength and either catastrophic failure takes place or other circuit elements shire too burdenand the signal processinq continues, albeit, with a local escalation of the amplification factors, and
further acceleration toward add;tional element breakdowns.
To maintain FLIGHT SAFETY, human intervention is essential to inspect, find, and fix damage b, fo-it becomes catastrophic. Inspection capability livides the crack population into two parts:
POPULATION I: Those cracks successfully found and fixed, and
POPULATION Ii: rnose cracks missed.
For a successful aircraft, the costs of finding an- fixing cracks in the fleet may not exceed anecononic limit within a given time fneriod. Damane tolerance criteria are in being to achieve flicht safetyin the presence of missed cracks and other damage sources. These criteria require ouantitative account-ab;lity for non-destructive inspection capability in material selection and 3rocurement control, establishconsistent operating stress levels and repetitive inspection intervals to ensure crack's are found and fixedwith a high probability and confidence level before flight safety is jeopardized. More stringent fatiguedesign a d test conformance criteria are being developed to provide the necessary durability for longerfleet life and to control fleet maintenance costs. Design feed-back loops are ava;lable to achieve theserequirements within the limits of development costs. The engineering and economic deminds f'r improvedanalytic prediction capability are therefore upon us. Some new analytic tools are av," !able frorm theresearch conmmunity to achieve a major improvement in fatigue predictability. They now nesd to be applied.Speciali7ed data most be provided.
My purr'se ;- this :Implisti,. JesGription, huwever, is to point out a direction In which rtottre workis needed to remove a basic inconsistency, and perhaps reduce the work ane time to analyze. The statisticalnature of the environment, operating parameters, and material response i's well recognized. The analyticflow on thz other hand is a (slow) discrete form of cycle-by-cycle analysis. i would propose a deener lookinto modern developments in Non-Linear communicat;ons theory and techtniques to find a consistently continuouspathway through the signal processing circuit analogy I have descilbed. Analysit of the loading and stressspectra for their frequency and time integral contents related directly tc natural periods of cyclic andtime dependent properties of the materials should provide a fruitful avenue. The cumulative statisticalbuild-up needs to carry through che statistical models intact to define upper, median, and lower bounds offleet crack population, accounting for variations from normal Inputs of all important data. This approachwould account for (at least most of) the variability now lumped onto arbitrary scatter factors. This is aformidable zaskl
X. REFERENCES
1. Wdlhiler, A., "Uber die Festiekeitsversuche mit Elsen und Stahl" Zeitschrift For Bauinesen, Vol 8, 1858,
Also English Ab.tract: Engineering (London), Vol II, 1871.
6-15~
2. PalIrngren, A "Die I ebef - Jat:.er von KugelI;agern," Zel tschri ft des Vereines D-.etct'r I rigertievre, Vol 68,No. 14, 1924.
3. Hiner, .4. A. "Curr'ulative Damage in Fatigue" Iransactions iof the ASHE Journal of Applied Mechanius,
VolI. 12, No. 1, Sept. !945. Pp AX-159 - 1614.
4. Jarfall, L. E., "Optimum Design of Joints; The Stress Severity Con'-.apt,' Aircraft Fatigue Design,Operational and Economic Aspe;ts, proceedings of the 5th Symposium, ICAF, Melbourne, 1967, ed. by'J. Y. Hann and 1. S. Milligan -- Pergamon Press Australia, Pty, Ltd., 1972, op '*9-63.
5. Smith, C. R. "Small ',pecimen Date for Predictirg Fatigue Life of Full-Sc-le Structures," ASTM Speci&lTechnical Publications No. 338, 1962.
6. Nesiber, 4, "Theory of Stress Concentration for Shear Strained Prism.-ticai Btidles with Arbl,.rarv, Non-LinearStress-$train Lav,," Transactions of the ASME Journal oIAoidMcais a 8 e 91 p5450
7 Morrow, J. "Cyclic Plastic Strain Energy and Fatigue of Metals" ASýT'i STP 37,4, 1965, pp 45-87.
8. Impeiiizzeri, L, T., "Cumulative Damrage Analy!,is irn Structural Fatigue," Efffecis of Enviranim,7,c and~~COn]x Load History onFetique ýLife,' ASTM STP No 462, 1970, pp 40-68.--
9. Wetzel, R. M, "A Method of Fatigue Damage," Doctoral Thesis, Universit; oi' Water'',o, Ontario, Cancoa.Also at Scientific Research Staff, Ford Motor Co. Dearborn, ~IIchigan, Sept 1971.
10. Rotyel, F. "On Residual Strcsses During% Random Load ~raigve." Symp~osiumi or Ranzi'xi Load F~tigue. ASARDConferei ;e rProceedings AGARD CP-118, October 1972.
11. Potter, J. M. "The EfFect of Load Interaction and Sequence on zhe Fatigue Behaviof of Notchie: CouDons,"Cyclic Stress-Strain Behavior - Analysis Experimentation and Fa~lure Prediction, ASTM STP No. 515,Mar 1973. Pp 109-132.
12. Rankine, W. J. M4., Proceedings institute of Civil Engineers, Vol 2, ný, 105-108, 1843.
13. Fairborn, W., Pnil. Trans. Royal Soc., p. 311, !864.
14. Lehr, E. "Die Abkurzungs,/erfaher, Bur Ermitlluný, Der S'chwi *gungsfezstigkelt von, Materialien," Dr. IngDissertation Th., li'tvttqart, 1925.
15. Oberg, T. T., and Johnson, j. B., "Fatigue Propertiet; of Metals Used in Aircraft Construction at 3450and 10,600 Cycles," Proc. Amer. Soc. Test. Mater., 37, Pt. 2, pp 195-205, 1937' (Discussion of R. R. MooreMachine).
16. Goodyear-Zeppelin Corp., "Preiiminary Fatigue Studies oi.i Aluminum Alloy A',cra~t Girjerý,," NACA Tu 637,
1938.
17. Bleakney, W. M., "Fatigue Tes.'A'ng of Beams bý the Resonairce Mietl'd," NACA Th 660, Aug c1938.
*18. Foster, H. W., "Fatigue Testing of Ai',frame 5cruczurai Comcionents," ASTPI STP 2,3, 3957.
!9. McCulloch. A. J., lelcon, h. A., Crichlow, W. J.. Fostei. Hi. Vi., Ret~man, j.. "lrnvestigstion of theRepresentation of Aircraf. Service Loadings ir' Fatigue Tests," VUSAF ASD-T.-6'-435, Jan 19b2,
20. Crichlow. W. J., McCullorh, A. J., Young L. and Melcon,. N. A_, "An Enginc~rinq Z-valuation of.9trrfor the Predict ion of Fatigue Life in Airframe Structures," 11541 ASO-4R-6z-h3'4, Mari.h 1963.
21. Schi'vc., J., Prock~, i , De Rijk, P., Nederveer.. A., Sevenhuysen, P. J., "Fatigue Testc with- Random ard'Progriase~d Lujd Sequences, wirii a d without GroundtýO-Air Cycles -- A Lmpa-ati-;r Study on Full-ScaleWing Ceater Sections." USAF-Ff' -TR-66-143, October 1966.
22. Ketola, R. "., "A Full-Scale Structural Fatigte Test Program." AIMA Journa, of Airc.-aft, Vol 2, No. 5,Sept-Oct 1965.
23. CrichlCsi, W. J., Buzzetti. C. J., and F~rirchi Id, j. "The Fatigue and Fail-Safe Drogrim for tne Lertlfica-tion of the Lc'c3heed Model 286 Rigid Rotor Helicopter." Aircraft Fatique DeLiun Operational anuEconomic Aspects, Proc. 5th Symposium ICAF, Melbourne. 9Ya.J .Nr and '. S. Milligan-Perga,,Yron Press Australia, Pty, Ltd., pp 171-220, 1972.
24. Cowgilt, L C., "Structural Testing, Testing Philosophy. and Looc½ Prc.dction for Rotar-, Wing kVe,`icleCo~nponents." AeronautiCa! Journal of the RAE, Vol. 74, July, Aug. 1970.
25. mcCufloch, A j., et. al. "Fatigue Behavior of Sheet Material for the Super Sonic TrAnsp-('rt,I' USA F HL-TR-64-399 I ano 11. Jan 1965.
26. Mack'ey. D. - Simons. F., "Structural DeveloDMInt (if the L1011 Tri-Star,." AIM Paper L-o 72-?76AIMA 40h- Aircraft Design Flight-Test, and Operatioins Meeting, Los Angeles, C-0it, At.; 14,172.-
27. Shewma~ker. A. P. , arnd Wagner, J. A., "The Develop Ment ,Nd ,itivlgentat~on of a Fatigue rmr. ; ofing Prrg' sfar a Trai~sport Aircraft"' Proceedinin of the Air Force Coniference o- Fatigue and Fracl.'e Cof Avr.4-13t.Structur'-s and Materials., AFFOL-TA-70-iJ*4, Sept. 1970, -pp 3-5.-
28. Crichlow, W. J., and LxUPe, T. J., "Hi9 ti tIycie Fatigue l'rapiwries of Titanit;i, in Aircrtft Applitation,"Titanium Scienc-i and TechnoLoy.; R. [ Jaffe and H. m. Bt'rte, eds., The Mettslu,'oical Society Of vhoRIME Piroceedings, Plenu~m Press, New -ak 141 1973.
2~~~~~~.~p Hewo, .B,'T' l ct f i 135 on-Fatigue," Colglmo aticlur, Sprlnger-Varlaq, 1956,0092-102.
30. Crews5, J. F., "Loca? P last Ic Stresses ',I -Sheet Al~t-m~ri AllJoy Specimens w, th Stress Concentrat ionFactor 0; Tw.. V1-er Canstant Arnplit-ide Loading," NASA Tlq-D-ý152, 1965.31. Landgraf, R. W., "rho eaicstancce e Metals to Cycl!c ileformation," Acieemn o5 t-anei zaý)dAl ASTIA STO 467, Amertcan S*.ciety for Teýsting a:,a mat rials hlae P
!2Z Wtel. "mWh Sp~ec;",?, stm !atio0; of the Fatique Rehavlor of h'orch(-s," Journal -)f Materials,Vol 3,_ No. 3, AS~Th, ZSept. 196a. pA 6"46-657.
ý3. 32rtlr., J3. F., 7upper, T. S. and ;*crG. H., "Computer ý,ased Simulation of Cyclic Stress-strain-Cehavior vilth Aipplicat7 nns to Fatiql,1,j, Materia71 Rejearco and Standards, Vol I, Ito. 2, Feb 1971,pp 23-28.
34.4 . E.. (F~iq - ue ir'lure Predictions ýur Cý.mpilcatcrl Stress-Strain Histories," ,,ourn5ýi1Fater~als, Vo! 7,JO 1, ASIK4, Krc~i 1972, Pp 71-17.'~.~35. virvby, V!. T.. "ScrKe -ffects of Ciianoe in Spec~trumr Sevitrity and SpecLru-n Shave on Fatigue Behavlofurv'er i nedom ~d,, Svrit, MnRrom Loading 7atigue, AGAKD Conference Proceedings, AGARD-CP-1118
OctIT,!. ee lsoRoif Aerciauticaf - 57 SoleyEruer-ing' Sciences Datro Unit Data Sheet 71028.36. Smith, Y. V:., i1atnin, 71., and Topper, T- H4., "A Stress-Stra.in Function for the ratique of Meta-Is,"Jc.:.zrn.a of Iar:s.Vol 5, No- 4, Dec 1970, pD 767-716.
3~. d~a, t.K.,"~heEffct f StessRati DuingCrack Propagation and Fatigut for 2024-T3 ý,nd 7075-TAluminum," Effa~t of'vrn~eadCorrplax Lo;d H.~stnry on Patigue Life. AST*I STP 4:62,17.J&. B9.tler, J3 ?, *'The VaterW~ Seieccior- an.ý Structura' Develop.;-ne't Prccess for A.*rcraft Structural'n~rit Une -geCndtos'?oeedi,')Qs of tlie Air ?oc Confierence oi Fatigue and Fractureof A',rceaft St uctures and Materia:ýi, USVFtT;-C 4 Set 19-71.I, pil"394. Stnes, G. "Y'cidir~g and Plast;ý instability .1inder Stress In Design cf hetoi Pressure tre~sels," Journalof Mtiterials, jXLS-A, V-,l 4, No. 2 ,)duse 1)6--- pp 377-332,
V ~ 40. S~net, G., ano Waisti, J. L., (ed.) "Mieta! Fatigue" McGrew-qiM, 1959.
0.akci'man, P. F., Pearton 14. 5,, Harch,!se, G. 6.. Owens, J3. S., "The Aoptlzability of a Fracturettrnic-Mr..esn, lyie T:!-sring D~i~ rtra"US AFNL~-TR-68-32, Say 1968.42. lioei~ne., C.,* and Coss, (;. I_. "Researc-h -on the Nechanism of Fretting Fctigue,', F-rst internationalConfercncr oi Corrosion rFeLuqu,, Univ. of Cotinecticut, Storrs, Coan., June 1971. (TO ba published).4j. Rollirns. C. T., ::PCI Sandoffr, ?. E., "Slip Front Mechanism in M~chanical Ji.It~it Journal of Aircraft,Voi A,~. ,,ug 1972. pp cl5~1-4.
4'. Herris W. *j., 7The lnfitin~cc of frettinj aoi Fatigue"l 28th Meating of the "Strurturetand4 tfsterialsPanel" '.)f 4AZAO at Dayton, Ohio, April 1969.
4ýi. Anon, "Aircr--fi Structural Integrtty Program, Airp!.ne Renulreerxrts." HIlL-STD-1530-(USAF), i Sept. 1972.ýI CXNOWLEr'S2EITS
Tht dutho.- * gva:%ful~f appreciative to the many wh~o have in any way develaped and contributed toVieS& cencecots ond especil!,/y to t'~e Lockheead-California Compa~ny and thr, U.S. Air Force for their kindparctission to use dz~a Zent h,~rja backg4round materiel for this paper. Opinions ýrnd pollcle! expressedr.ý-eln ere o~ccrly tile r.-%Wnslbility of tho, author and ;n woo way '.atlect official poli-ýy of tht U.S. Air'orte6 or of Zhe L~oclheod Aircraft exK.acept as soeciflcally -k%2.d.
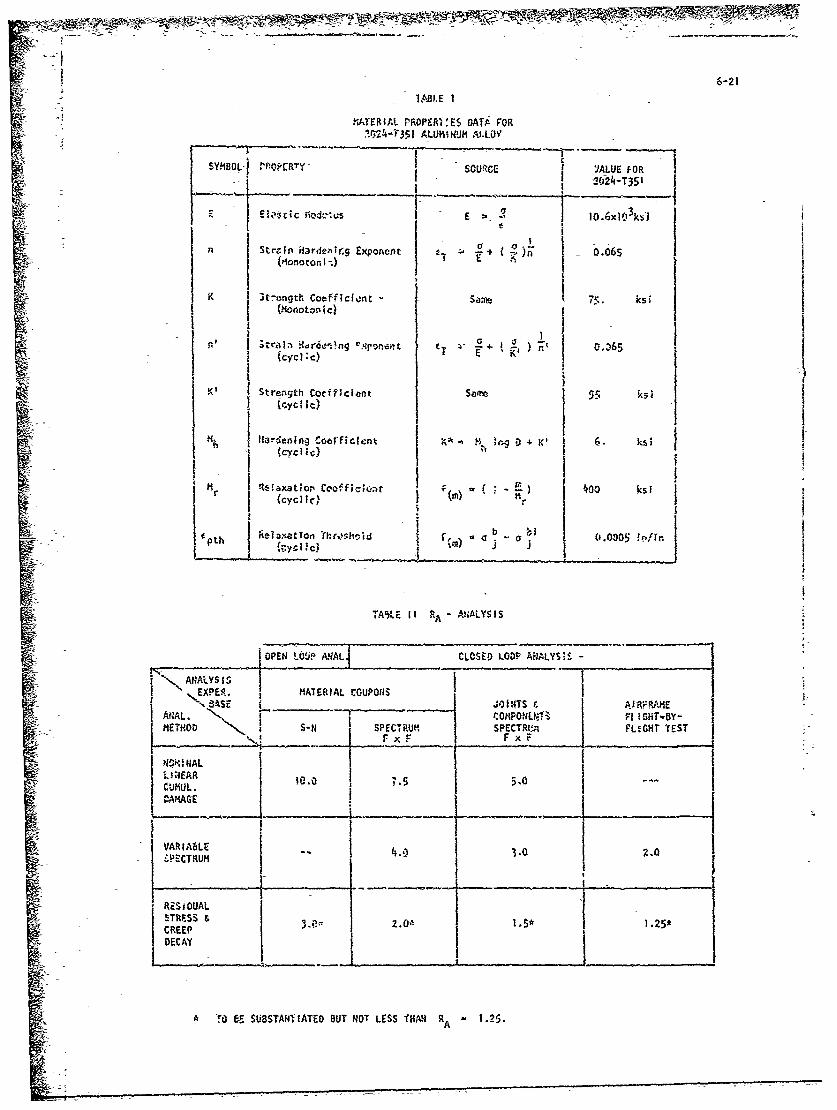
6-211,12L E I
MtATERIfAL PFOI`911ýES DATA FOR-~~ '.O24-7351 ALUHmtUii ALL.OY
SYMBOL-f .PPERTY SOUR~CE JALIE FOR
S 104-T351
E71cic rNod,ýus - Exi
n Strzisn Hrdvilirg Exponent
Strength Coofficiont Sam 7. s
Ow*axtiop tcfic) ;t)k
KI Stent Coflcat ae
rAY~ - -ainCofi~ ,-\~X(cyclic)EiA rOPN I~SI IRN
ReamatIonc SPECTRIhoj rLGN b TlESTp%pS Ijj fCH-Y
$AS 1 O I1T IRRMEPOCT UO S-- 1 1PCT U SPECT_(__________TESr , FxI R41NAL
TRESIDA & zo0 .5 1.25*DECAY
'T V SUBSTAN~ fATED BUT NOT LESS UAHA R A 1.25.
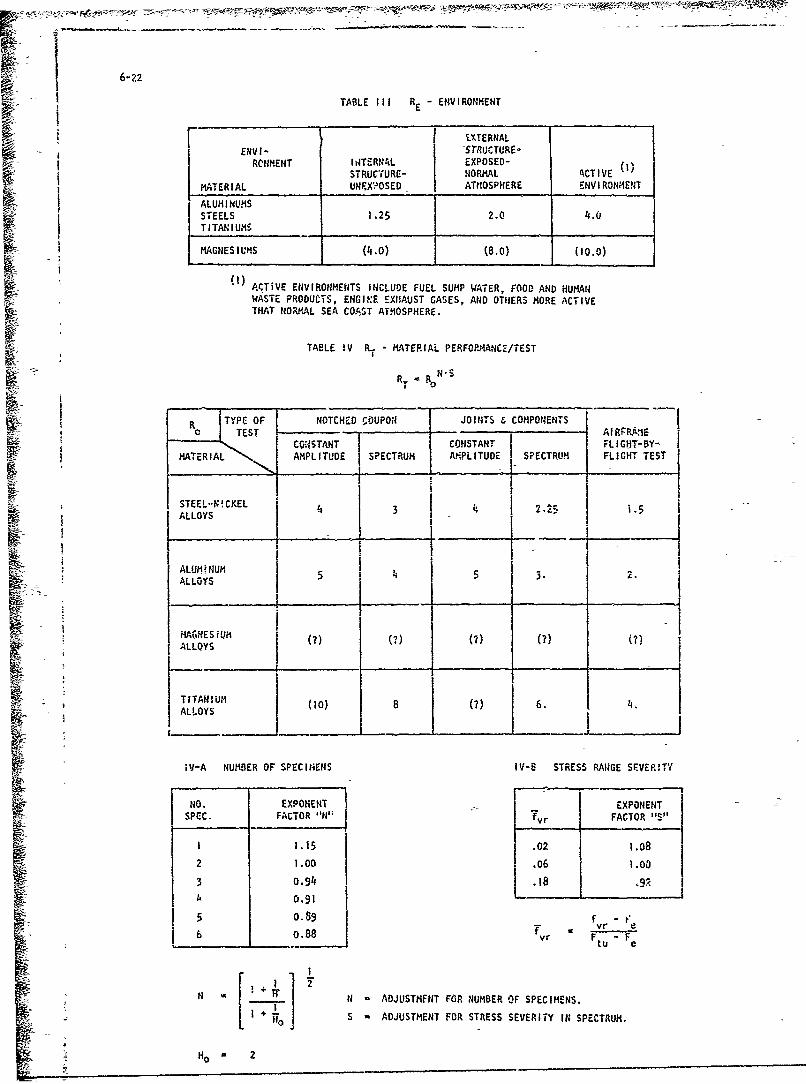
Ii 6-22
TABLE III RE - ENVIRONMENT
•ii XTERNALSENVI- -STRUCTURE-
f - RCNMENT I0TERNAL EXPOSED-STRUCTURE- NORMAL ACTIVE
MATERIAL UNFX?OSED j ATlfOSPHERE ENVIRONMENT
ii ALUMINUMS II STEELS 1.25 2.0 4.0TITANIUMS ... .......
rMMAGNESI UHS (4.0) (8.0) (10.0)K-.
IATVE ENVIRONMENTSINCLUDE FUEL SUMP WATER, FOOD AND HUMANWASTE PRODUCTS, ENGI?.E EXHAUST GASES, AND OTHERS MORE ACTIVETHAT NORMAL SEA CO.ST ATMOSPHERE.
TABLE 1V R - MATEPIAL PERFOPMANC2/TEST
R-. RN-S
TYPE OF NOTCHED SOUPOR JOINTS £ COMPONENTSR0 TEST CONSTANT CONSTANT FLIG-T-BY-
IA APLITUDE SPECTRUM ASPLITUDE SPECTRUM FLIGHT TEST
STEEL-NOCKEL 1 I I g 2.25 1.5
ALLOYS 4,3___ _5
ALOHINUM 5 " - 5. 1.
S•~~~~MGESIUM 7 7 ? 7 ?i• •ALLOYS01()
TITANIU E : IO ) (N)__.__.SjALLOYS008()6.4
SiV-A NUMBER OF SPECIMENS IV-a STRESS RANGE SEVER!TY
No. EXPONENT -EXPONENTSPEC. FACTOR "N" 7 FACTOR "S"
S1.15 .02 1.08
2 1.00 .06 1.00
3 0.94 .18 '92 2
0.91S5 0.89
lb 088 vr eS! o.88
yr Ftu -Fe
•, I
N N = ADJUSTMFNT FOR NUMBER OF SPECIMENS.
1' Hol j S ADJUSTMENT FOR STRESS SEVERITY It SPECTRUM.
Ho 2
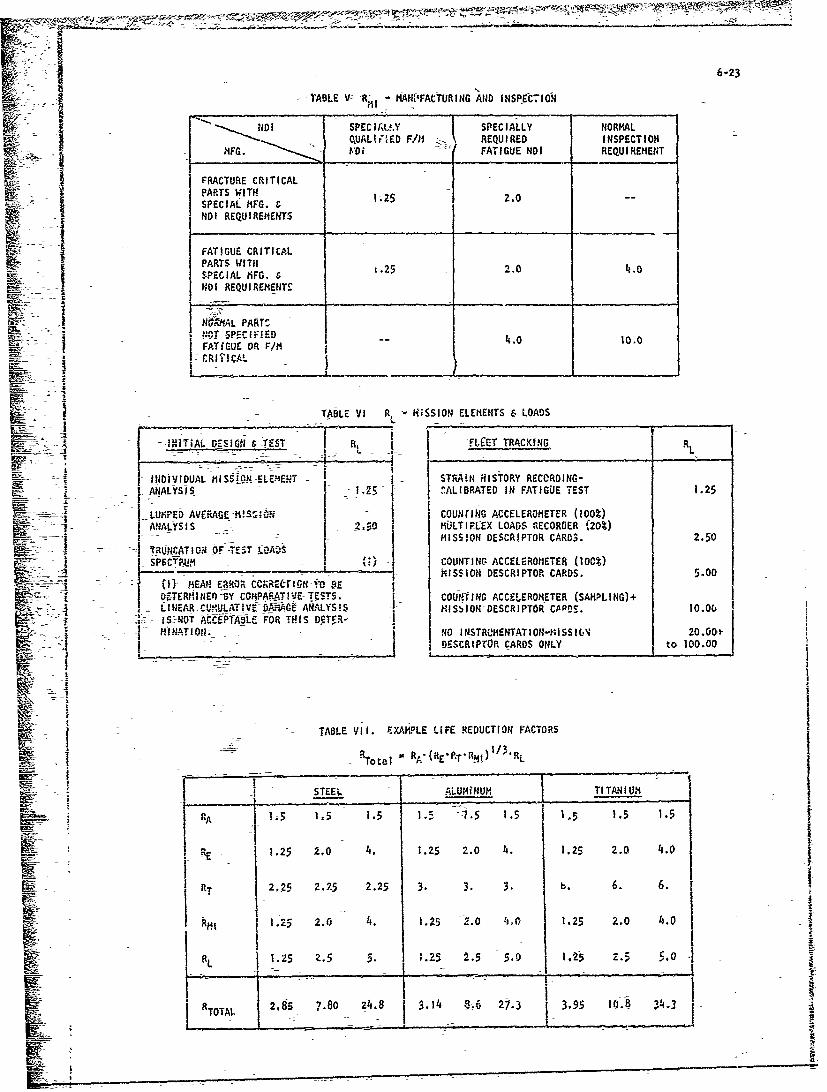
6-23
-TABLE Vý- Rj- MANI-FACTURING A14D TNPC7
IISPECIALV.y SPECIALLY NORMAL
QAI IEDF/M REQUIRED INSPECTION
FRACTURE CRITICALPARTS WITH 2.0 .SPECIAL MFG. &j DI REQUIREl4EkTE
FATIGUE ORITI/Li
SPCRIA MFG.
TABL RIEQUIRESONELEENS NLAD
I r!FAIU OR2 FI 4.0BRTE IN1TI0.0S 12
ez -TABLD AVI R LEHSSSIOIEL CCENSLEOAEERDS 0%
'SIGN TEST RCOUFIXNG RCKN
RIN~V A MISSION--LMN DET fHSRITORY RCARDI.N2.5
LUMPEDcT VRAG-IS i; -ONIGACCELEROMiETER (100%)
(I) EAN ~~RISSION DESCRIPTOR CARDS. 25.00TRUNATIO CCF- ES T I --ADE
0ETERIIJE~SY Ct-iPRATIV-T~SS. I COUNTING ACCELEROMETER (SA00%N)+. LNEA C~iUAT1EDMAG? AALSIS I ISSION DESCRIPTOR CARDS. io-0o
.I. lNOT -ACEPTALE FOR TP IS DKT5R-lIINATIONO INSTRUMENT. lO-YISSILýV 20.00+
DECITRCARDS ONLY to 100.00
TABLE VII. E.XAMPLE LIFE REDUCTION FACTORS
FTotal RA(RET'R141)1 1 RL
STEEL. ALUNTNUM I TI TPNI UM
1, 1.5 1.5 1.5 1. --1.5 1_.5 1.5 1.5 1.5
LE RE.25 2.0 4. 1.25 2.0 4. 1.25 2.0 4.o JRIF 2.25 2.25 2.25 3. 3. 3. b. 6. 6.
I m 1._25 2.0 4. j1.25 2.0 -1)1 C 1.25 2.0 4.0
IRL 11.25 Z.5 5. ;.25 .5 5,0 1.5 .5
TOTAL 2,8 .7.80 74.8 3.14 - ,. 2 3.95 10-4 34.3
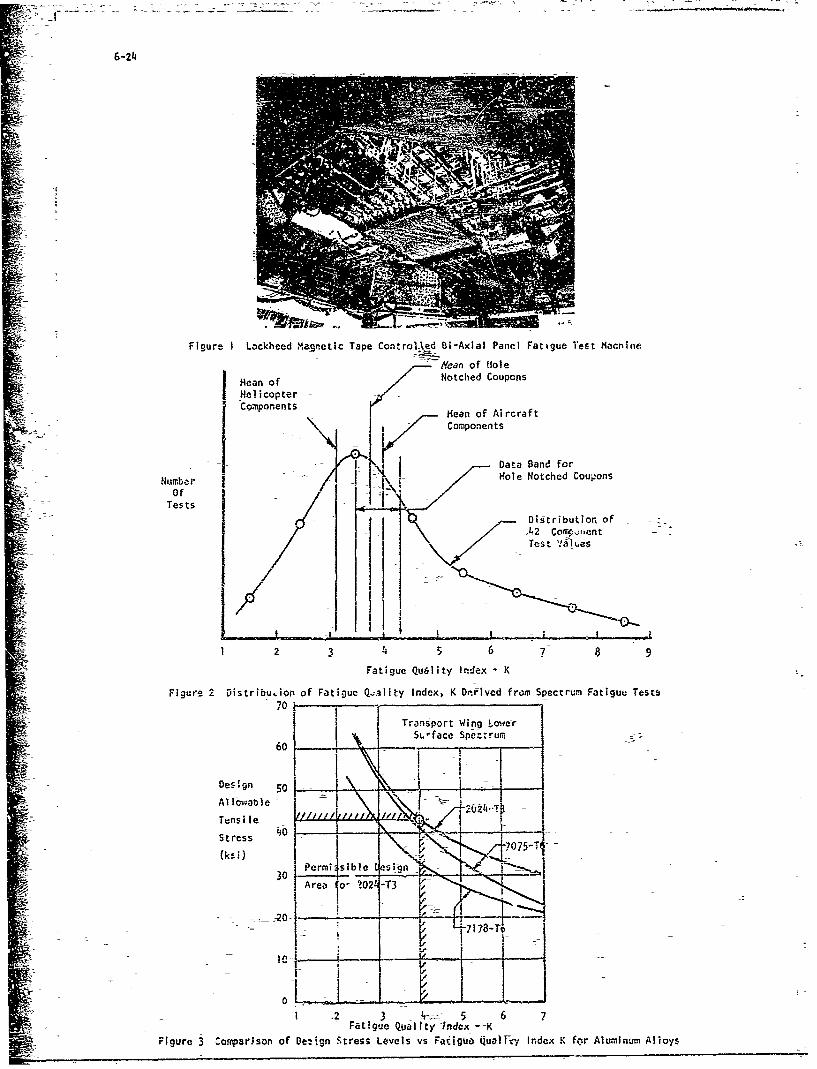
6-214
Figure I Lockheed Magnetic Tape ControlAed Bi-Axial Panel Fatigue Test Macnine
, Hean of 'oleIMean of Notched Coupons-HelicopterComiponents Mean of Aircraft
I ~Componen~ts
fI- f 1 IData Band for
Number I --I [ [ Hole Notched Coupons
Tests Distribution of
At2 Compor, ent -Test '1S1Les
S2 4 6 7 B 9
Fatigue Quality Index - K
Figure 2 Distribuion of Fatigue Q•,ality Index, K Dnf.rved from Spectrum Fatigue TestsS70 k-j--'- I
70+ i Transport Wing /c.:-eri Siface Spoc.rum I
Design t 10.:6-•0 - ! , \ \ L_ i-
= ~ ~~~I I' ""07-Al lowable - 262-Tensile
Stress 4o_(k-i O i Pc rmiusible esin _i
2020Area i o-22 -T
1. -2 5 -• 6 7Fatigue Quality -Index --K
Figure 3 ^omparVrson of De.2ign %tress Levels vs Faflgue Qualfcy Index K fCtr Aluminum Alloys
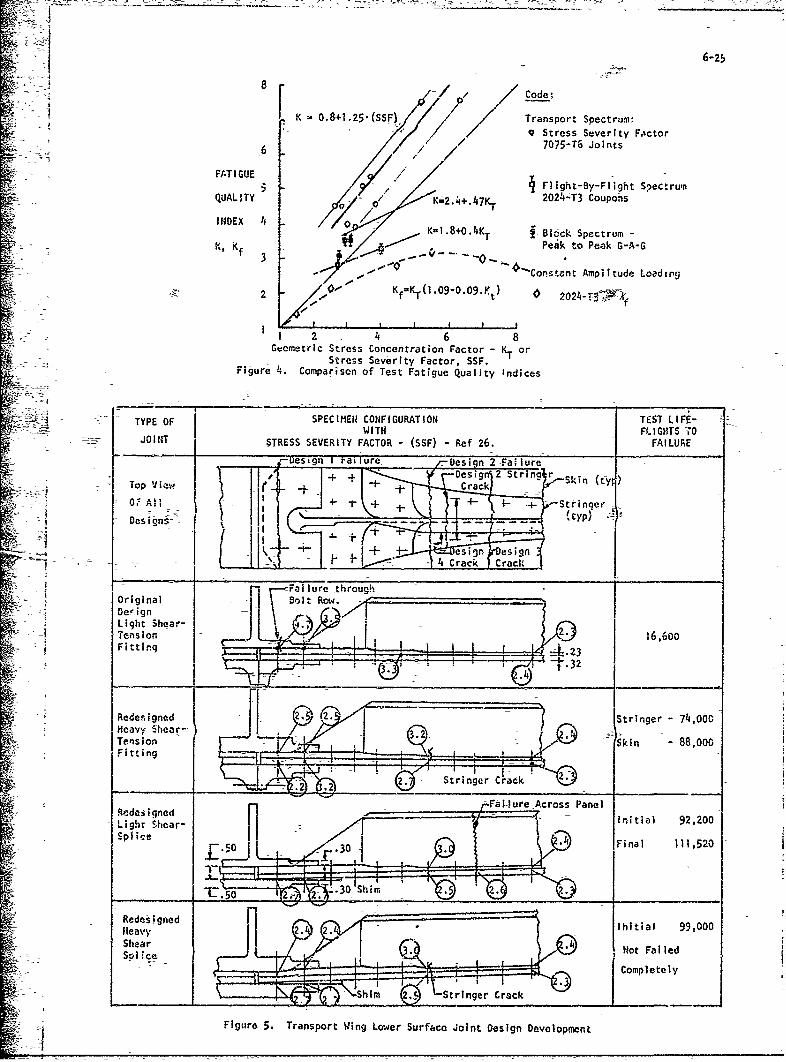
8 Code;I K 0.8+l.25*(SSF) / Transport Spectrum:
9 Stress Severity F.%ctor
/ / 7075-T6 Joints
FATIGUJE pQULT / night-By-Flight Spectru'
QUALITY - 0 / K 2024-43 Coupons
INE If 0 K=.8+O.41T -Block Spectrum -K, K I - Peak to Peak G-A-G
v"Constant Amplitude Loading2 ,-Kf-KT(I.09-O.O9.Ktj 2024-T-P IfA
1 2 6 8Geometric Stress Concentration Factor - KT1 or
Stress Severity Factor, 5SF.Figure 4. Comparison-of Test Fatigue Quality Indices
TPOFSPECIMiEN CONFIGURATION TEST L IFE-TYPETO FLIGHTS MO
--- JOINT TRS VRIY FACTOR -(SSF) - Ref 26. FAILURE
-Vesign I ýai lure /---Design 2 -Failure
To Vie -Design 2 Striniltr Si tt
Top Vi i.2. Ai Crack rc
Des i gn7
Light Shear-Tension 26.0Fitting-A 2
Redesigned 2 2.Stringer -74,000
Heavy Shear-�Tension '~" Skin -88,000
Fi t ting
Fi'Mlure Across PanelRedes igned initia 92,200Light Shear- IiiSplicee.
Final 111,520
Redesigned Ihitial 99,000Heavy 2Shear NtFie
Figure 5. Transport Wing Lower Surface Joint Design Development
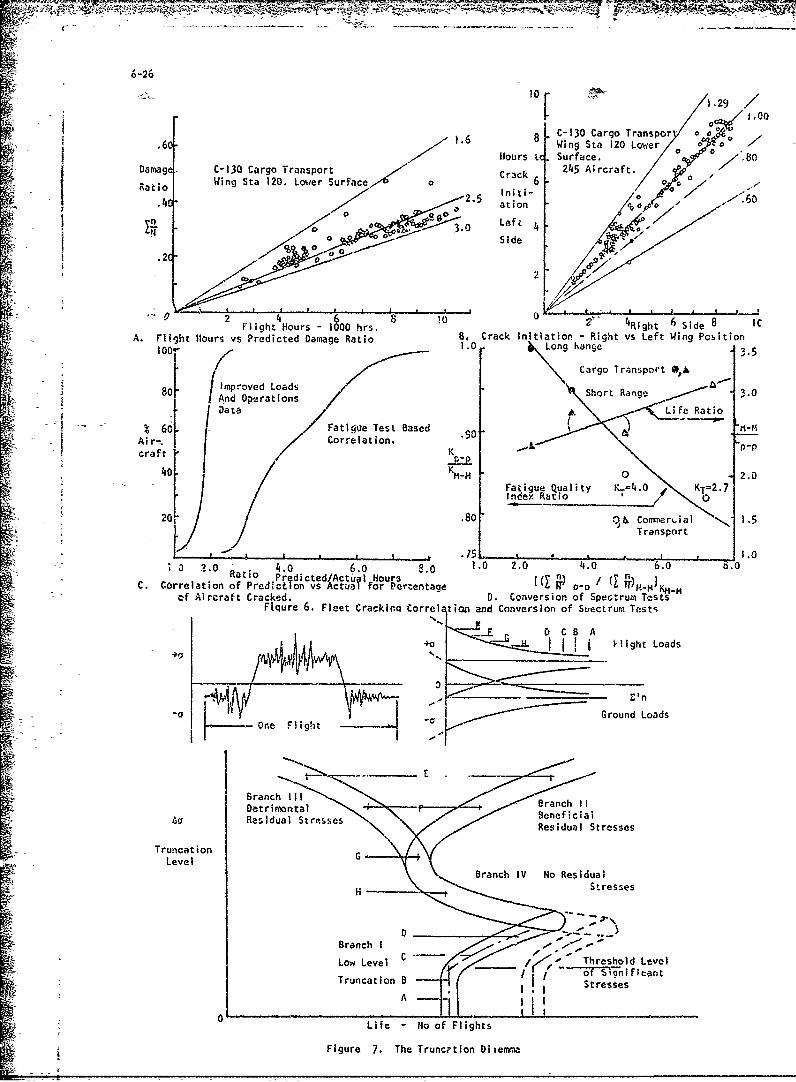
6-261011 1.29
1 .6 8 -C-130 Cargo Transpor.6% Wing Sta 120 Lower 0 0
[fours tc Surface. 08
Damage C-130 Cargo Transport Crack 245 Aircraft.ato Wing Sta 120. Lower Surface a 6 C
age, ation
I ~~~ 1.0 hne3
And gh Oprtonrs Shortrs Ranght 6- 3.0eA. flh or sPeitdDmg ai . CakIiito Rih vat -Left Rag ostion
crafo Trnpr K,.
8o Short Rag 2.0
Fatnu Qualtrationsy'2.Datade Ratioti
608Fatioe TesrBased 90 1.5
:0af K. 6. . .TasprP.
4.0 2.0M . 02.
Ratio~~In~e Ratioed/ct 0 or ( ) /~
C. , Soreato of Prdcinv cu~frPretg Too L1 t~HK
CCorltooflquredito 6. FletuCara for Przel tie an oveso f ucruMet
+0 Hght Loads
.. f.IAAA ___ ___ _ __ ____ ___ n
-One Flighit Ground Loads
ResiualStresesResidual Stresses
TruncationLevel
Branch IV No Residual
CLow Level /, Threshold Level
Trnato of S19niMeantStresses
_______________________________________A_
A0'Life - No of Flights
Figure 7. The Trunc;-tion Diiem~a
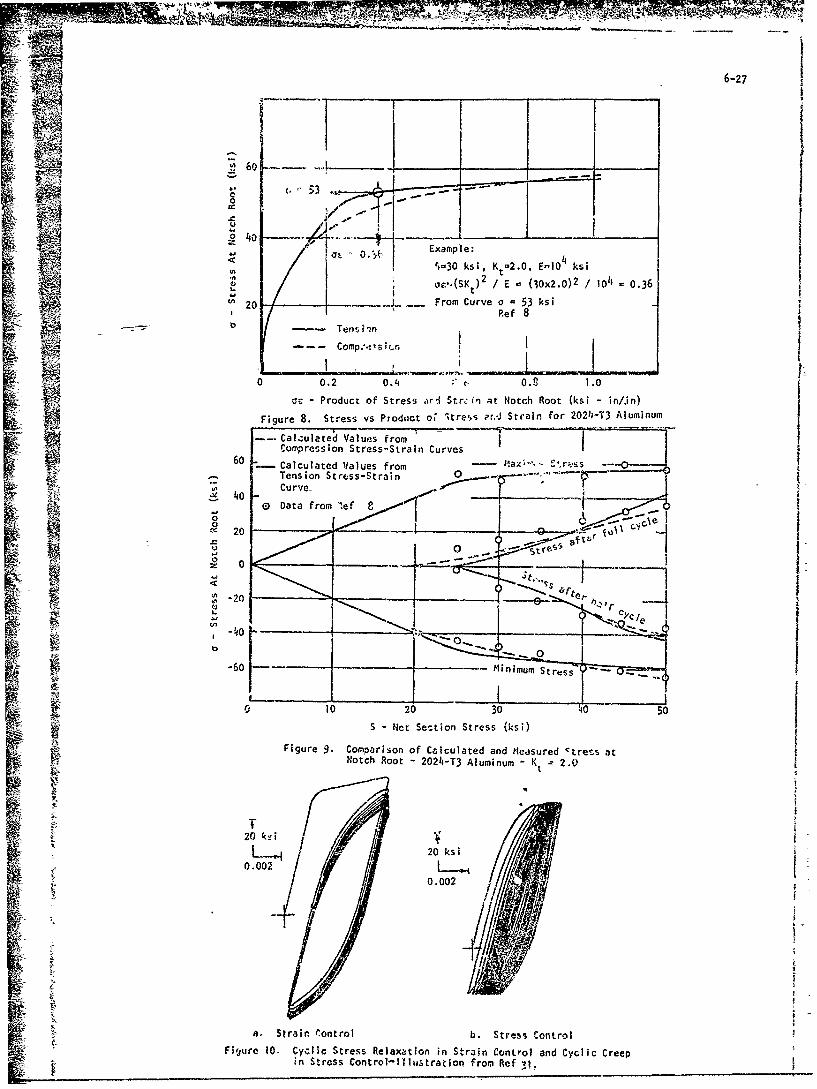
6-
602
0 40
2: Example:< 'I3 ksl, Kt=2.0, E-'10h s
1~CoF'. (SK) /E (30x2.O)2 / 0 0.36
S2C0 ~ ... . From Curve a 53 ksiR~ef 8
Comp:. t;'Gk
0 0.2 0.4 1.0
cc Product of Stress ilrd Strzin at Notch Root (ksi - in/,in)
Figure 8. Stress vs Prodoct oi' itre,,s -r.-J Strain for 202'h-T3 Aluminum
-- Calzulatcd Values from A- -
Compression Stress-Strain Curves60 -Calculated Values from - 1,rl' s
Tension Stress-Strain 02.--~*~40 Curve-_____
0 Data from 1e~ 0
_____ 20 __ _ __I
>4010. - __
-20 2 3
S -Net Section Stress (ksi)
Figure 9. Comparison of Calculated and Measured ctrets atNotch Root -2024-T3 Aluminum -Kt 2.0
20 kt'Ai
20 ksi
0.002/0.002
a. Strain 'ontrol b. Stress Control
Figure tO- Cyclic Stress Relaxation in Strain Control and Cyclic Creepin Stress Controlhlllijstratjon from Ref it.
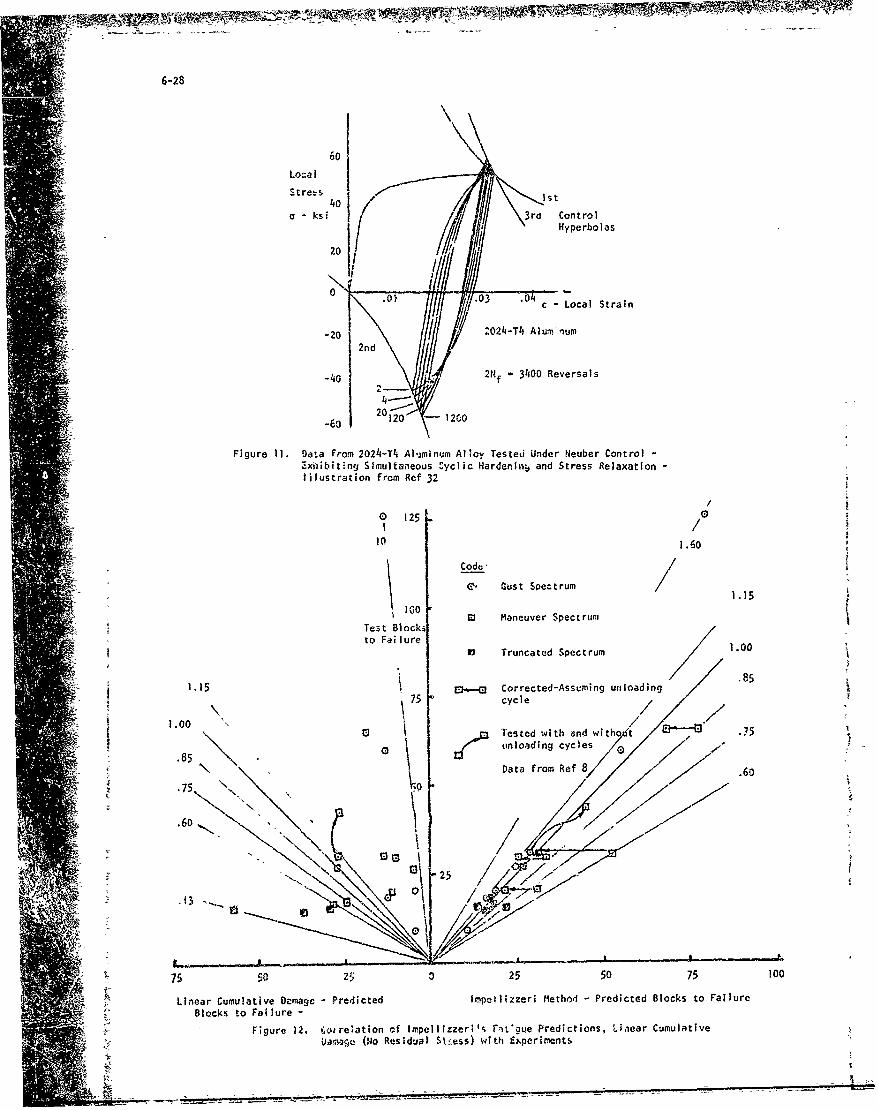
06-28
Loca I
Stres IS- ksi 3ra Control•i 20 IHyperbolas
0 .0% .0303c - Local Strain
-20 202/-T4 AiumhumS - 2nd
-40 2nd2f - 3400 Reversals
120-60 1 1200
Figure 11. Data from 2024-T4 A-ijminum Alloy Tested Under tleuber Control -Zxiiibiting Simultaneous Cyclic Hardenino and Stress Relaxation -
lilustration from Ref 32
/
0 125 0
10 1.60
Code'
. Gust SpectrumS~1.15
I Maneuver Spectrum
Test Blocksto Failure
23 Truncated Spectrum 1.00
1.15 E Corrected-Assuming unloading75 cycle
Si ! ~~~.00 "10 z Tested with and witho t .75
.85 0 unloading cycles
*85 Data from Ref .60•7 5
.6o.
75 50 25 25 50 75 100
Linear Cumulative Demage Predicted Impellizzeri Method - Predicted Blocks to FailureBlocks to Failure -
Figure 12. wiretation of Irnpellizzerl% Fr.Wgue Predictions, Lilear CumulativeD.rvba~ c (No Residual Stress) with Experimcnt6
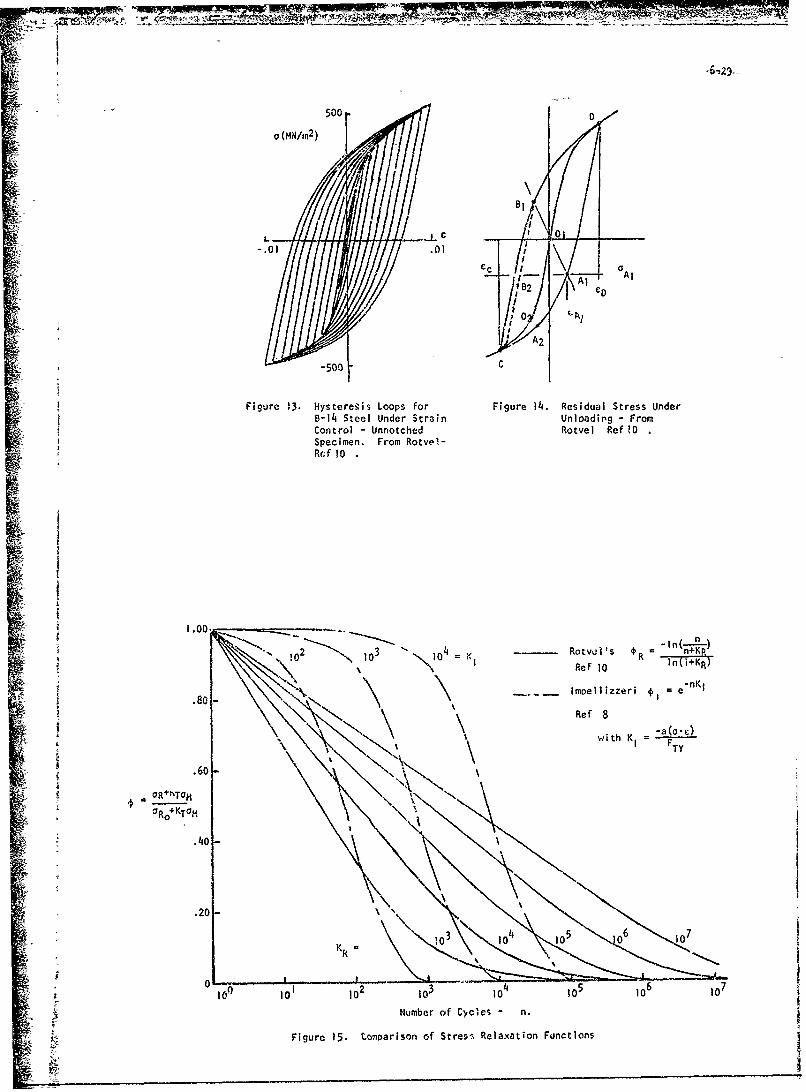
+� �w.. _______________�- .--. �-- - - ----
500?. o
a (MN/rn2)
I' /4
L �j�C ' 0 _____
-.01 .01 / \% A� £0
/ 7* A2
-500 C
'SFigure 13. Hystere&is Loops for Figure 14. Residual Stress Under
6-14 Steel Under Strain Unloadii�g - FromControl - Unnotched Rotvel Ref 10Specimen. From Rotvel-Rd 10
1.00.102 N 10 N�O 4 -I� Rotv�l's =
N Ref 10
.80- �N Imoellizzeri = -nK1N, Ref 8
.60 N' with K1 = FTY
'N0R0+KTOM \\ \
.40
f K.20
1o� l0� l0� 06 l0�
KR
100 10 102 lQ� l0� l0� 106 lo�
Number of Cycles - n.
Figure 15. V.o�oarison of Stres� Relaxation FunctIons
N
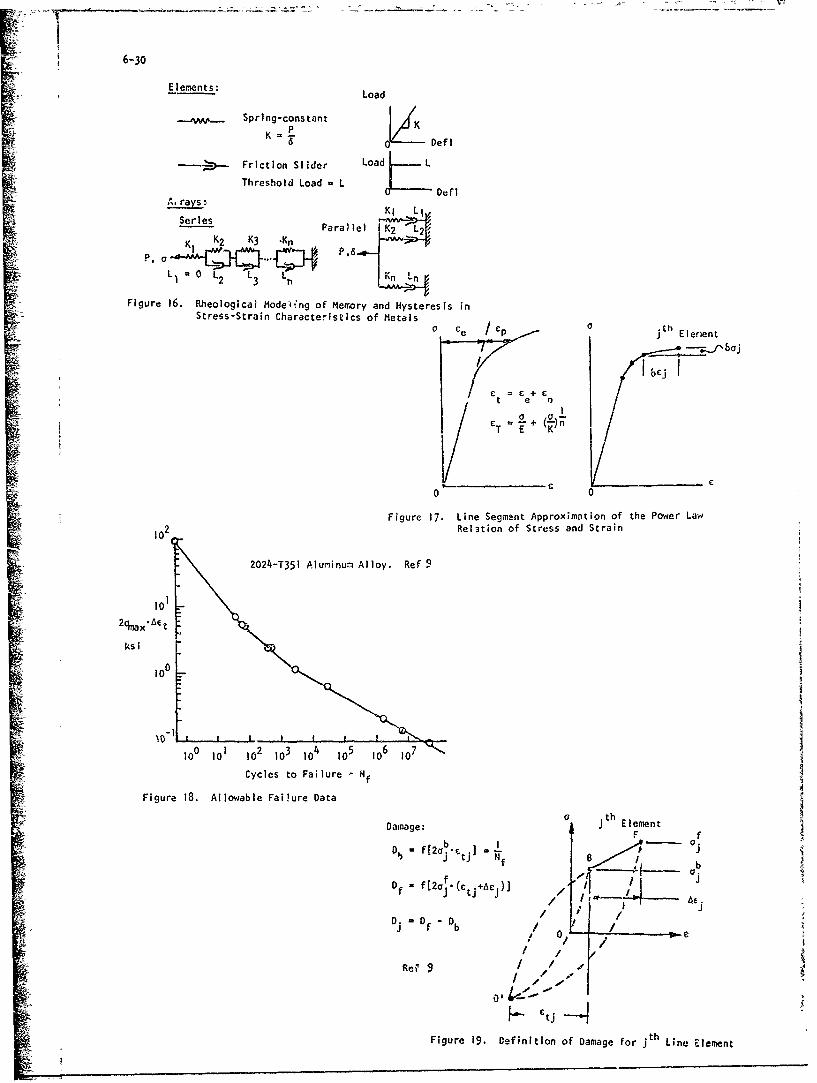
- 6-30
Elements: Load
OV-0 . Spring-constantp
Def]
>- Friction Slider Load
Threshold Load -L
a, ras: Kl Li
"Series',=- •Parallel ! K2 -L2•
K K2 K3 •Kn "
L1 0 2 L3
Figure 16. Rheological Mode';ng of Merrmory and Hysteresis inStress-Strain Characteristics of Metals 0aE0 Ce / t~h E len~ent
S€ ------- I--/ IhcjcC + C+t e 0
C -+ a-)nT E K
-C 00 0
Figure 17. Line Segment ApproXimation of the Power Law102 Rel3tion of Stress and Strain
2024-T351 Aluminum Alloy. Ref 9
101
ks i
100
100 101 I02 I03 104 105 IO6 1O7
Cycles to Failure - Nf
Figure 18. Allowable Fai!ure Data
ai thDamage: j Element
F f
Of - f [2b C Iit f b
Df = Df2 J - / // o I /
D/-D/ /j f b / b0i0
/ // /t
Figue1 .D n- or-LFigure 19. Definition of Damage for j th Line Element
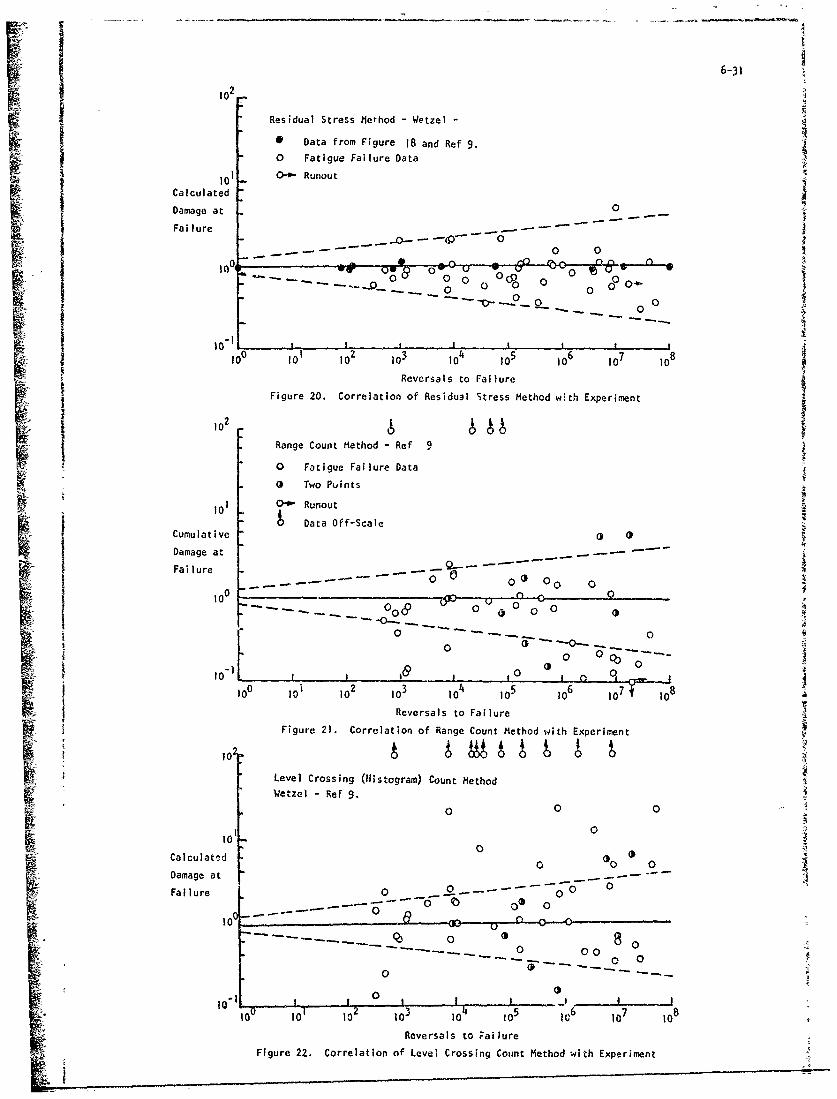
6-31
102
Residual Stress Method = Wetzel -
* Data from Figure 18 and Ref 9.
0 Fatigue Failure Data
0 01 0- Runout• Calculated
r•-Damage at 0
Failure .- • -+ -m •_ _ _ _ _ _ _ _ _ _ _ o _ _ _ _ _ _ _ _ _
001 0o o 8
100
0• -- 0 0 0 00 4
• • -•.0 00
1 i0 10 10z 103 10• 105 106 107 108
•_ • Reversals to Failure
SFigure 20. Correlation of Residual Stress Method with Experiment
Range Count Method - Ref 9
0 Fatigue Failure Data
- 0 Two Puints
i01 - 0- Runout
SData Off-ScaleCumulative o 0
Damage at - ,--
Failure _-_0- -0
to- o- 0 oo0 0 0 0 0
10 0
Wetze Ref9.0 0 0
101
Calculatý,d 0 0Damage at-----
-
0 ... .~~ 0 ,=-1,
Failure 0 0t0 - 0 0 0
0
0 00
0
0
10a 100 1 100 to t0 10Reversals to Failure
Figure 22. Correlation of Level Crossing Count Method with Experiment
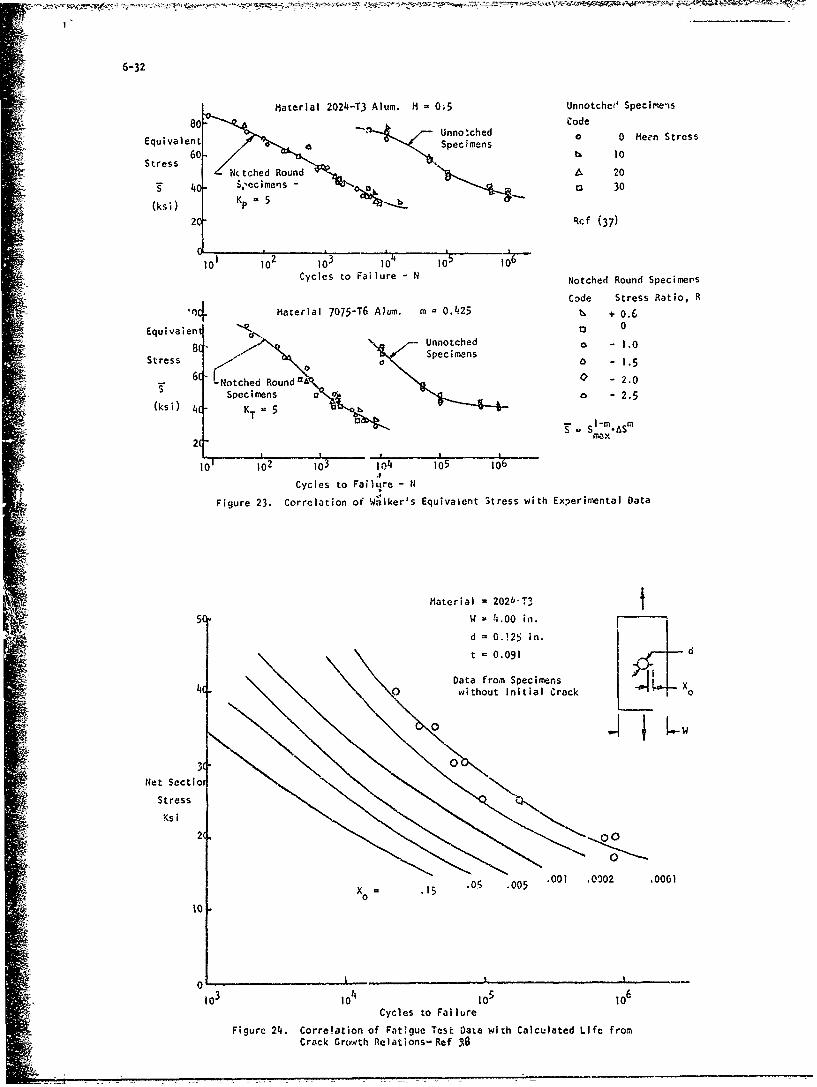
6-32
Miaterial 2024-T3 Alum. Mi 0•5 Unnotchet' Specimens80 Code
Equivlent/-- Unno'ched 0 0 Mezn Stress
Equvaen / Specimens
Stress 60 b 10NCchd o~ndA 20
4- S,'ecime'ns - a 30(ks;) Kp = 5 0140_-t
20* Rcf (37)
101 102 I03 10L 105 106
Cycles to Failure -N Notched Round Specimers
Code Stress Ratio, R114 Material 7075-T6 Alum. m = 0.425 , + 0.6
Equivalent 0 0
SUnnotched o - 1.0
Stress 8'Specimens 0 - 1.5
-6- Notched Round-n10 .8 Specimens o 6 -e2.5
i(ksi) 4C KT = 5Ssl-m .-As m
2(
101 102 0 10'31't4 I05 1'06
Cycles to Failure - N
Figure 23. Correlation of Walker's Equivalent 3tress with Experimental Data
Material = 202b-T3 t5(, W -14.00 in.
d = 0.125 In.
t = 0.091 d
Data from Specimens Li4. without Initial Crack o
Net Sectioi
Stress
Ksi
2(,0
"X0 .15 .05 .005 .001 .0302 .0001
10
0 -o
} 103 104 105 10 6
Cycles to Failure
Figure 24. Corre!ation of Fatigue Test Data with Calculated Life fromCrack Griwth Relations-Ref '8
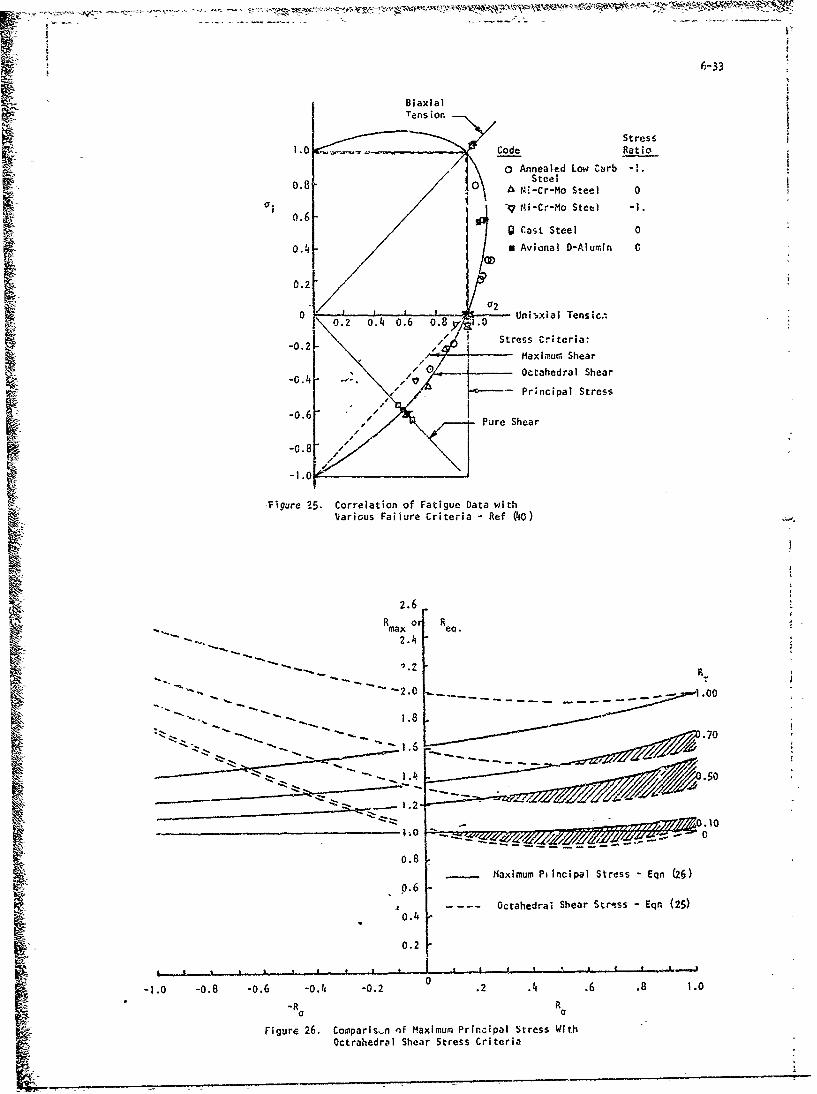
6-33
BiaxialTenls ior.
Stress1.0 Code Ratio
o Annealed Low Carb -I.0.8 0 S teelrM See
A StrssCr-M t eria0
-qPrnCipal Streel -1
o.66
o.4ma xeci.lD-lml
00.8
-0lxiu Pnhia TncipAl tes-En(
OctahedsaCrSherar:tes- n(5
-0.0.2
F~~~~~gure ~ ~ ~ ~ Mxiu 2. Cmain Maiu Prnia Ste SWiheaOctrahedOctaedra SharSresartei
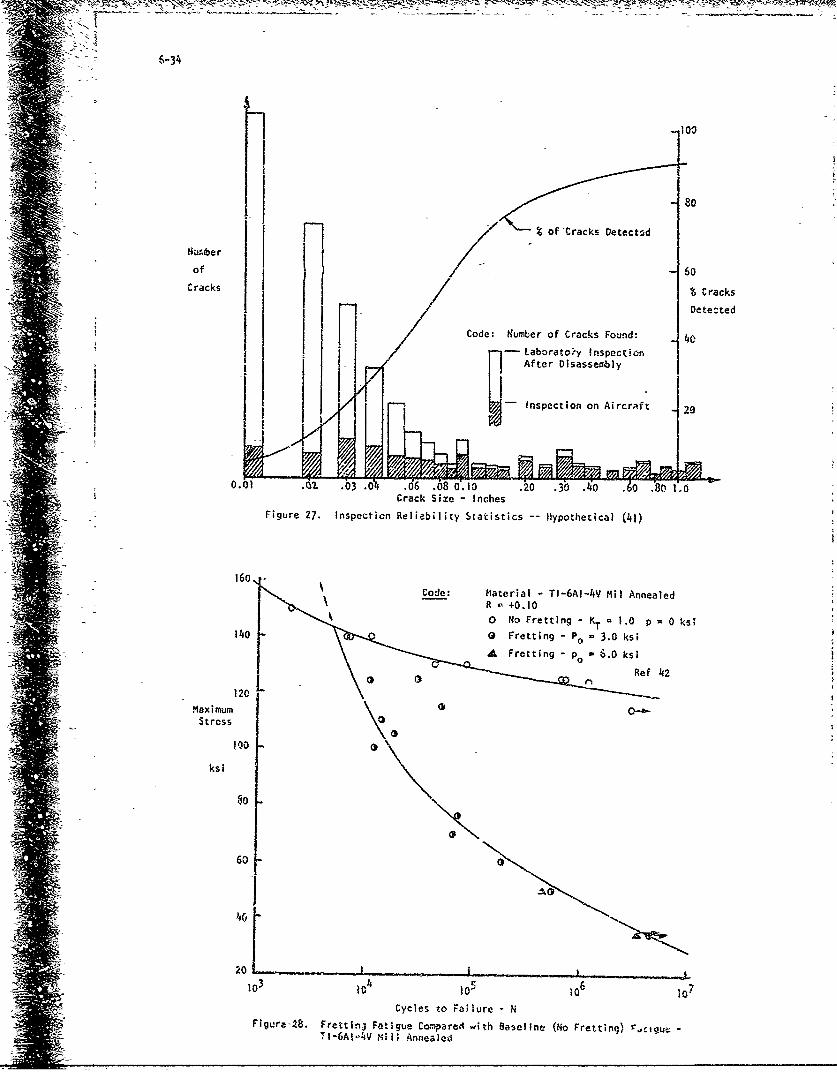
6-34
S-,100
•i • 80
~F j% of Cracks DetectsdNa~mber
of 6oCrk C racks
"-/ Detezted
f Code: Number of Cracks Found: - 4
Laborator y InspectionAtrDisassembly
S "-Inspection on Aircraft
.03 . 06 .08 0 .20 .0 ., ,0Crack Size = Inches
Figure 27. Inspection Reliability Statistics Hypothetical (41)
Code: Material - TI-6AI-4V Hil AnnealedS- R+0.100 No Fretting - KT - 1.0 p = 0 ksl
14•0 0 Fretting - Po - 3.0 ksiA Fretting - po - 6.0 ksi
Ref 142
1 L20
Maximum CStress
•'3 100 3
ksi
60 '
2o
103 10 10, 06 1O7
Cycles to Fa;iure - NF;gura-28. Fre.tlnj Fatigue Co•,pared with Baseline (No Fretting) rcigut -
TI-6AlWWV Mil; Annealed
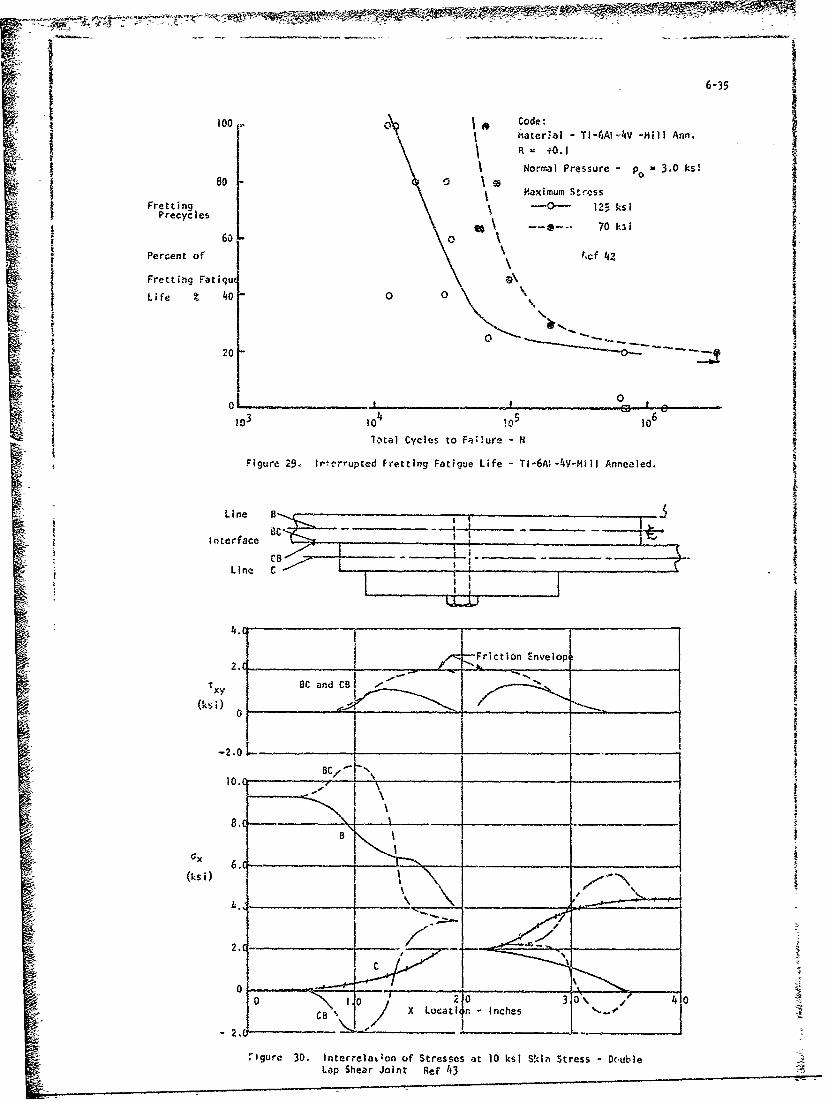
-- . .•-. --. .- •• • • - 4
S~100 O••• Code:
m yAater..al - -Mill Ann.a
~R - 40. 1i NIormral Pressure - Po 3.0 ks!
Frettina IPrecyc 1es 0 3
60 o 1Percent of
Fretting Fatiqu( '\
Life % ~40 0 0
20O
I03 )0k 1°5 106lotal Cycles to Failure - N
Figure 29ý lrt-rrupted Fretting Fatigue Life - TI--A--Mlll Annealed. I
"a ~ ~~Line a •I,,•
CFriction Envelope
txy n
(ksi) _
-20
0 1
.X Locat n -•Inches
SFigure 30. lnterre~aLaon of Stresses at 10 ksi Sk!in Stress - D(ubteLap Shear Joint Ref 43
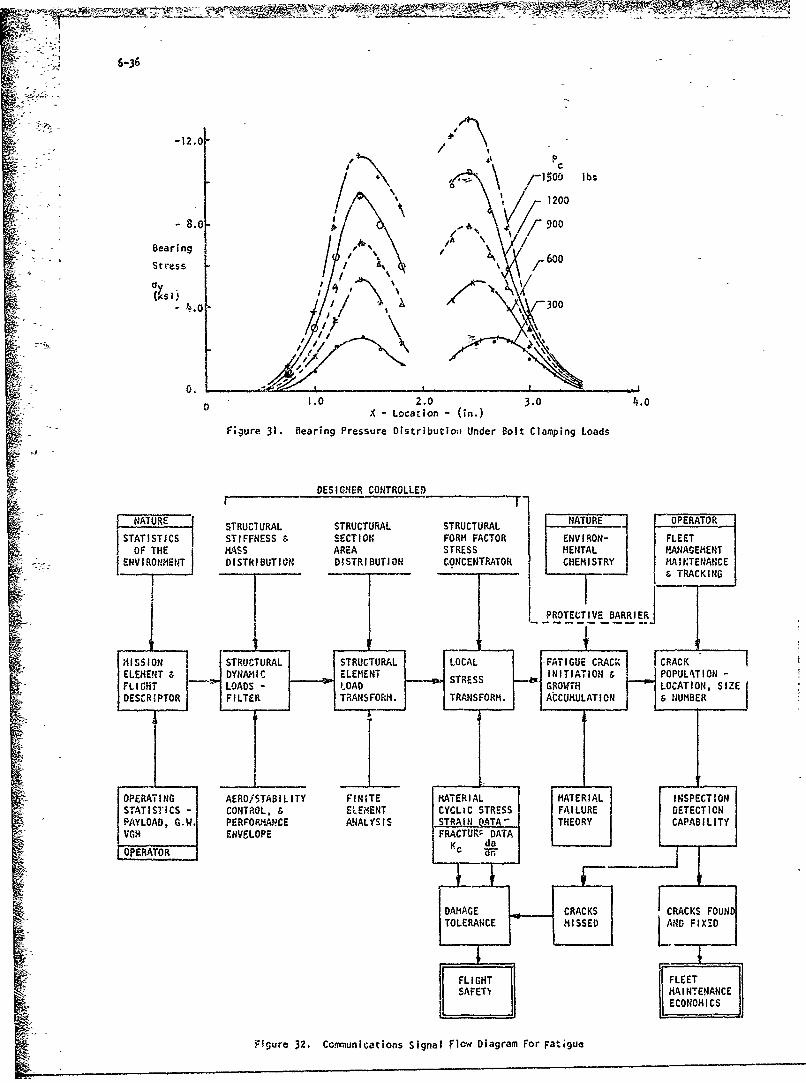
6-36
I 4' P
1200
Bearing/ A
Stress A\ 600
4. Ale 300
X- Location - (in.)
Figure 31. Bearing Pressure Distributioni Under Bolt Clamping Loads
NATURE ~ ~~DESIGNER CONTROLLEDNAUEO RTR
STRUCTURAL STRUCTURAL STRUCTURALNTUEPRAOISTATISTICSI STIFFNESS s SECTION FORM FACTOR ENVIRON- FLEET
OF THE MASS AREA STRESS I MENTAL- MANAGEMENTENVIRONMENT DISTRIBUTION DISTRIBUTION CONCENTRATOR f CHEMISTRY MAINTE14ANCE
-I TRACKING
PROTECTIVE BARRIER
ELEMENT &DYNAMIC ELMNTESI NITIATION &POPUL4TION -FLIGHT LOADS - LA OVHLOCATION, SIZEDESCRIPTOR FILTER ;TRANSFORM. TRANSFORM. ACCUMULATION &NUMBER
OPERAING AER015TABILITY FINITE MATERIAL MATERIAL INSPECTIONSTATISTICS - CONTROL, & ELEmENT CYCLIC STRESS FAILURE DETECTIONPAYLOAD, G.W. PERFORMANCE ANALYSIS STRA I NATA -THEORY CAPABILITY
VGH ENVELOPE FRACTURv: DATA
OPERATOR '~
DAMAGE CRACKS CRACKS FOUND
Figure 32, Commnunications Signal Flow Diagram For Fatigue
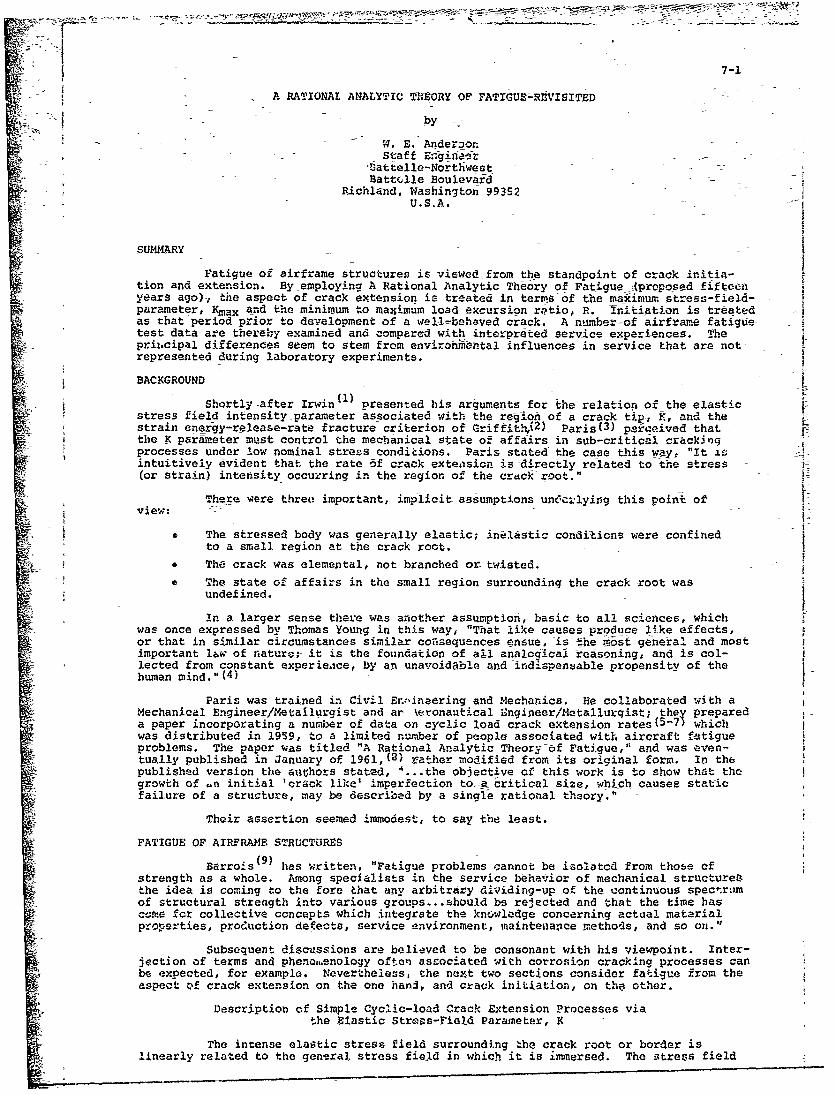
7-1
A RATIONAL ANAJLYT-IC THEORY OF FATIGUE-R0VISITED
by
W. E. AnderzonStaff Enginaft
-°attelle-Northwest -
Battclle BoulevardRichland, Washington 99352
U.S.A.
SUMMARY
Fatigue of airframe structures is viewed from the standpoint of crack initia-tion and extension. By employing A Rational Analytic Theory of Fatigue .(proposed fifteenyears ago)v the aspect of crack extension is treated in terms of the maximum, stress-field-parameter, Kmax and the minimum to manimum load excursion ratio, R. Initiation is treatedas that period prior to development of a wellýbehaved crack. A number-of airframe fatigue-test data are thereby examined and compared with interpreted service experiences. Thepri.cipal differences seem to stem from environmbntal influences in service that are notrepresented during laboratory experiments.
BACKGROUND
Shortly -after Irwin(l) presented his arguments for the relation of the elasticstress field intensity parameter associated-with the region of a crack tip-, R, and thestrain energy-release-rate fracture criterion of Griffith,( 2 ) Paris( 3 ) perceived thatthe X parameter must control the mechanical state of affairs in sub-criticail crackingprocesses under low nominal stress conditions. Paris stated' the case this way, "It isintuitively evident that the rate of crack extension is-directly related to the stress(or strain) intensity occurring in the region of the crdck root."
There vere three important, implicit- assumptions unce'ilying this point ofview: -
, The stressed body was generally elastic; inElastic conditions were confinedto a small region at the crack root.
* The crack was elemental, not branched or twisted.
SThe state of affairs in the small region surrounding the crack -root wasundefined.
in a larger sense there was another assumption,- basic to all sciences, whichwas once expressed by Thomas Young in this way, "That like causes produce like effects,or that in similar circumstances similar consequences ensue, is the most general and mostimportant lzw of naturc; it is the foundation of all analocical reasoning, and is col-lected from constant experience, by ap unavoidable and indispensable propensity of thehuman mind."( 4 ) b
Paris was trained in Civil Er.:,ineering and Mechanics. He collaborated with aMechanical Engineer/Metailurgist and ar \kronautical Bngineer/Metallurqist; they prepareda paper incorporating a number of data on cyclic load crack extension rates(5-7 whichwas distributed in 1959, to a limited n"umber of people associated with aircraft f!tigueproblems. The paper was titled "A Rational Analytic Theory cf Fatigue," and was even-tually published in January of 1961,0() rather modified from its original form. In thepublished version the authors stated, I...the objective of this work is to show that thegrowth of ,n initial 'crack like' imperfection to-a -critical size, which causes staticfailure of a structure, may be described by a single rational theory."
Their assertion seemed immodest, to say the least.
FATIGUE OF AIRFRAME STRUCTURES
Barrois(9) has written, "Fatigue problems cannot be isolatod from those ofstrength as a whole. Among specialists in the service behavior of mechanical structuresthe idea is coming to the fore that any arbitrary dividing-up of the continuous spectrimof structural strength into various groups...&hould bs rejected and that the time hascPte for collective concepts which integrate the knowledge concerning actual matarialproperties, production defects, service environment, maintenance methods, and so on."
Subsequent discussions are believed to be consonant with his viewpoint. Inter-jection of terms and phenoa.enology often associated with corrosion cracking processes canbe expected, for example. Nevertheless, the next two sections consider fatigue from theaspect 'f crack extension on the one hand, and ctack initiation, on the other.
Description of Simple Cyclic-load Crack Extension Processes viathe Elastic Stress-Vield Parameter, K
The intense elastic stress field surrounding .he crack root or border islinearly related to the general stress field in which it is immersed. The stress field
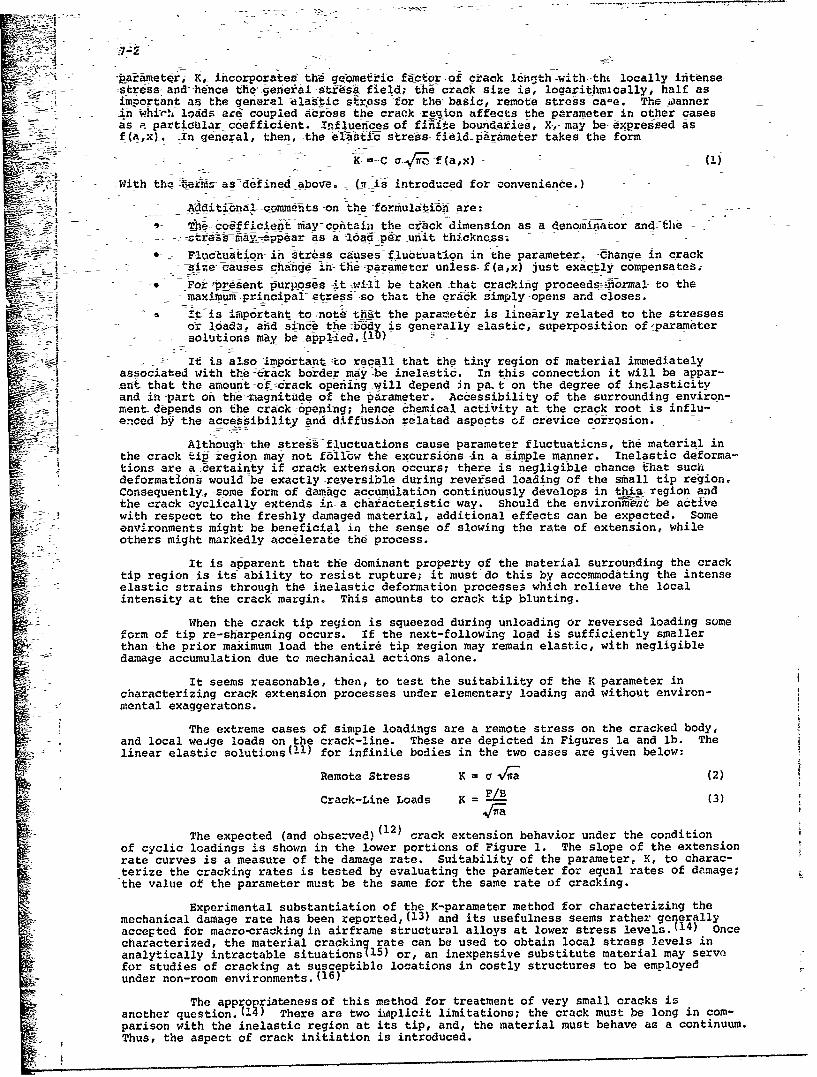
_\-a:ieter, K, incorporate" thie gq-ometi-i factor-of crack l5ntth -with thi locally intense
-stress and- hence the-general stres& field; the crack size is, logarithmically, half asimportant as the general elastic s rpe.ss for the-basic, remote stress ca-e. The oanner-in v.hirh loads--are coupled adrbss the crack region affects the p-rameter in other cases---as a partiClar coefficient. nfluences of finite boundaries, X, may be- expressed as
f(a,x). -in general, then,-the eliifth stress fi~ildparameter takes the form
- K-=-Cc~-ff(a,x)- 1
-With tha ierms- as-defined above. ii is introduced for convenience.)
Additiona' comm--nts on-the formulai.n -are: -S-J TJ coeffic~eit may-coitain the c ick-dimension as a denomirator arid-the
- ~ ~ ~ ~ la --- _ta a-per~pdr _unit th~ickness.
6 - Flucluation in stress causes fluctuation in the parameter. -Change in crack- - s-ie causes Vc-nge ii-the- parameter unless f(a,x) just exactly compensates:-
--. Fo kpesent .urposes ,it w~ll be taken that cracking proceeds---orma. to the
- -maximum -principal -stres-s- o that the cra-k simply-opens and closes.
i t-is -umportant to:note that the parameter is linearly related to the stressesor load•; arid since the -body is generally elastic, superposition of'parameter
solutions may be appied.-4I) _
It is also impirtant -to recall that the tiny region of material immediatelyassociated with the bcrack-border may be inelastic. In this connection it will be appar-:ent that the amount-of crack 0pening will depend in pa.t on the degree of inelasticity"and in part on the- ragnitude of the parameter. Accessibility of the surrounding environ-ment depends on the crack opening; hence chemical activity at the crack root is influ-} enced by the accessibility and related aspects of crevice corrosion.
Although the stress-fluctuations cause parameter fluctuations, the material inthe crack tip:-region may not follow the excursions in a simple manner. Inelastic deforma-tions are a certainty if crack extension occurs; there is negligible chance that suchdeformations would be exactly reversible during rev-ersed loading of the small tip region.Consequently, some form of damagc accumulation continuously develops in this- Tegion andthe crack cyclically extends in-a characteristic way. should the enviroum -t be activewith respect to the freshly damaged material, additional effects can be expected. Some-nvironments might be beneficial in the sense of slowing the rate of extension, whileothers might markedly accelerate the process.
It is apparent that the dominant property of the material surrounding the cracktip region is its ability to resist rupture; it must do this by accommodating the intenseelastic strains through the inelastic deformation processes which relieve the localintensity at the crack margin. This amounts to crack tip blunting.
When the crack tip region is squeezed during unloading or reversed loading someform of tip re-sharpening occurs. If the next-following load is sufficiently smallerthan -the prior maximum load the entire tip region may remain elastic, with negligibledamage accumulation due tc mechanical actions alone.
It seems reasonable, then, to test the suitability of the K parameter incharacterizing crack extension processes under elementary loading and without environ-mental exaggeratons.
The extreme cases of simple loadings are a remote stress on the cracked body,and local wedge loads on the crack-line. These are depicted in Figures la and lb. Thelinear elastic so!utions( 1 1 ) for infinite bodies in the two cases are given below:
Remote Stress K = a (2)
Crack-Line Loads K = F/ (3)
The expected (and observed) (12) crack extension behavior under the conditionof cyclic loadings is shown in the lower portions of Figure 1. The slope of the extensionrate curves is a measure of the damage rate. Suitability of the parameter, K, to charac-terize the cracking rates is tested by evaluating the parameter for equal rates of damage;"the value of the parameter must be the same for the same rate of cracking.
Experimental substantiation of the K-parameter method for characterizing themechanical damage rate has been reported, (13) and its usefulness seems rather generallyaccepted for macro-cracking in airframe structural alloys at lower stress levels. (1 4 ) Oncecharacterized, the material cracking rate can be used to obtain local stress levels inanalytically intractable situations115) or, an inexpensive substitute material may servefor studies of cracking at susceptible locations in costly structures to be employedunder non-room environments. (16)
The appropriateness of this method for treatment of very small cracks isanother question. (14) There are two i~iplicit limitations; the crack must be long in com-parison with the inelastic region at its tip, and, the material must behave as a continuum.Thus, the aspect of crack initiation is introduced.
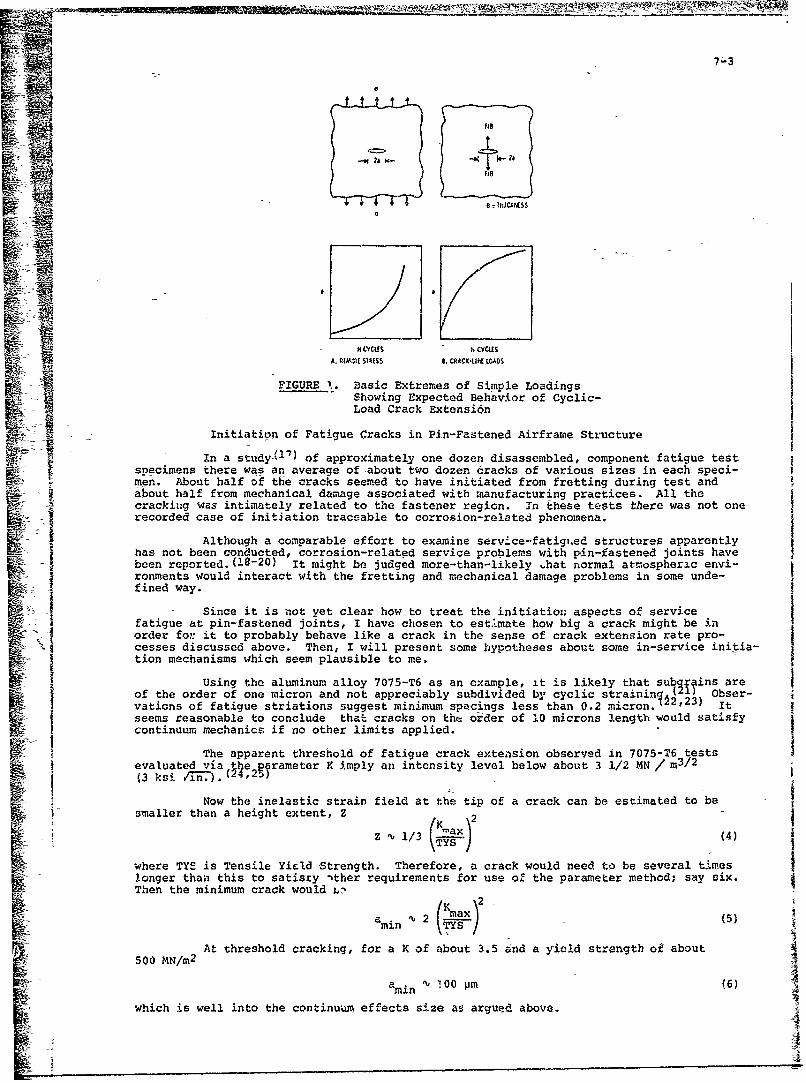
7"3
0
FIB
a aHMS
N CYCLFS % CYCLE
A. A[MOK SIMS$ 8. CRACK-iffL LOADS
FIGURE 1. Basic Extremes of Simple LoadingsShowing Expected Behavior of- Cyclic-Load Crack Extension
Initiation of Fatigue Cracks in Pin-Fastened Airframe Structure
In a study-(1I) of approximately one dozen disassembled, component fatigue testspecimens there was an average of-about two dozen cracks of various sizes in each speci-men. About half of the cracks seemed to have initiated from fretting during test andabout half from mechanical damage associated with manufacturing practices. All thecracking-was intimately related to the fastener region. in these tests there was not onerecorded case of initiation traceable to corrosion-related phenomena.
Although a comparable effort, to examine serv'ce-.fatigued structures apparentlyhas not been conducted, corrosion-related service problems with pin-fastened joints havebeen reported.(18-20) It might be judged more-than-likely .hat normal atmospheric envi-ronments would interact with the fretting and mechanical damage problems in some unde-fined way.
fi Since it is not yet clear how to treat the initiation aspects of service• fatigue at pin-fastened joints, I have chosen to estimate how big a crack might be in7 •order for it to probably behave like a crack in the sense of crack extension rate pro-cesses discussed above. Then, I will present some hypotheses about some in-service initia-tion mechanisms which seem plausible to me.
Using the aluminum alloy 7075-T6 as an example, it is likely that subgrains areof the order of one micron and not appreciably subdivided by cyclic strainin (21) Obser-vations of fatigue striations suggest minimum spacings less than 0.2 micron.ý22,23) Itseems reasonable to conclude that cracks on the- order of I0 microns length would satisfycontinuum mechanics if no other limits applied.
The apparent threshold of fatigue crack extension observed in 7075-T6 testsSevaluated via the prameter K imply an intensity level below about 3 1/2 MN/m3/2(3 ksi =1n.). (2ý,2)
Now the inelastic strain field at the tip of a crack can be estimated to beSsmaller than a height extent, Z .
SIV 1/3 \•-a-. (4)
where TYS is Tensile Yield Strength. Therefore, a crack would need to be several timeslonger thaa this to satisfy ither requirements for use of the parameter method; say six.Then the minimum crack would L-
(Kmax2 (2 a(5V
At threshold cracking, for a K of about 3.5 and a yield strength of about500 MN/m 2
.amin 00 pm (6)
which is well into the continuum effects size as argued aboven.
'3
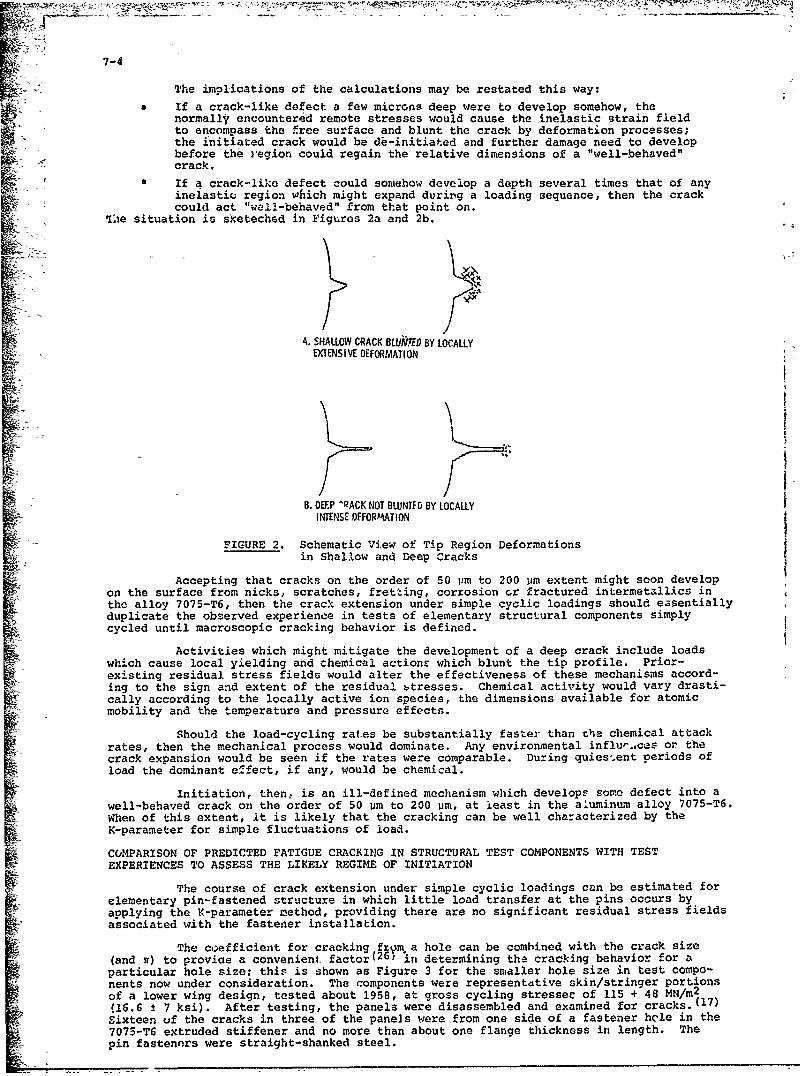
7-4
The implications of the calculations may be restated this way:
o If a crack-like defect a few microns deep were to develop somehow, thenormally encountered remote stresses would cause the inelastic strain fieldto encompass the free surface and blunt the crack by deformation processes;the initiated crack would be de-initiated and further damage need to developbefore the region could regain the relative dimensions of a "well-behaved"crack.
* If a crack-like defect could somehow develop a depth several times that of anyinelastic region which might expand during a loading sequence, then the crackcould act "well-behaved" from that point on.
•the situation is sketeched in Figures 2a and 2b.
r:X
A. SHALLOW CRACK BLUOWED BY LOCALLYEXTENSIVE DEFORMATION
B. DEEP -ACK NOT BLUNTED BY LOCALLYINTENSE OEFORMATION
FIGURE 2. Schematic View of Tip Region Deformationsin Shallow and Deep Cracks
Accepting that cracks on the order of 50 im to 200 pm extent might soon developon the surface from nicks, scratches, fretting, corrosion cr fractured intermetallics in
the alloy 7075-T6, then the crack extension under simple cyclic loadings should easentiallyduplicate the observed experience in tests of elementary structural components simplycycled until macroscopic cracking behavior is defined.
Activities which might mitigate the development of a deep crack include loadsSwhich cause local yielding and chemical actionE which blunt the tip profile. Prior-existing residual stress fields would alter the effectiveness of these mechanisms accord-ing to the sign and extent of the residual btresses. Chemical activity would vary drasti-cally according to the locally active ion species, the dimensions available for atomicSmobility and the temperature and pressure effects.
Should the load-cycling rates be substantially faster than the chemical attackrates, then the mechanical process would dominate. Any environmental influr.,ces or thecrack expansion would be seen if the rates were comparable. During quies-.ent periods ofload the dominant effect, if any, would be chemical.
Initiation, then, is an ill-defined mechanism which develops some defect into awell-behaved crack on the order of 50 um to 200 Um, at least in the aluminum alloy 7075-T6.When of this extent, it is likely that the cracking can be well characterized by theK-parameter for simple fluctuations of load.
COMPARISON OF PREDICTED FATIGUE CRACKING IN STRUCTURAL TEST COMPONENTS WITH TESTEXPERIENCES TO ASSESS THE LIKELY REGIME OF INITIATION
The course of crack extension under simple cyclic loadings can be estimated forelementary pin-fastened structure in which little load transfer at the pins occurs byapplying the K-parameter method, providing there are no significant residual stress fieldsassociated with the fastener installation.
The coefficient for cracking from a hole can be combined with the crack size(and s) to proviae a convenient factor( 2 6 ) in determining the cracking behavior for aparticular hole size; this is shown as Figure 3 for the smaller hole size in test compo-nents now under consideration. The components were representative skin/stringer portionsof a lower wing design, tested about 1958, at gross cycling stressee of 115 + 48 MN/i 2
(16.6 ± 7 ksi). After testing, the panels were disassembled and examined for cracks.(17)Sixteen uf the cracks in three of the panels were from one side of a fastener hCle in the7075-T6 extruded stiffener and no more than about one flange thickness in length. Thepin fastenors were straight-shanked steel.

7-5 _
7-5-CRACK LE.,GIH f ROM EDGE OF HOLE, me
0 1 2 3 4 5
1 -0 UNIAXIAL STRESS, CRACKED ONE SIDEFUR 6.35 mm VIA HOLE (!14 IN.)
_________________________________0.10
"AFTER BOWIE, FROM REF 26
I 3- iAPERE a IS REMOTE STRESS. INFINITE SHEET 00
K2: EG "
i I 3 ]
0 0.05 0.10 0.15 0.20
CRACK LENGTH FROM EDGE OF HOLE, IN.
FIGURE 3. Crack Length Factor for Remotely Stressed Hole
My interpretation of the expected value for cyclic crack extension in extrusionsof aluminum alloy 7075-T6 under cy• ing frequercies near one per second and ambient env.our-ments is shown in Figure 4. This interpreta't.Lon in terms of various minimum to maximunstress ratios (R-values) can be used to construct simple loadings crack extension ratecdTrves for a given R-value 6nd a given environment.
K2 : Eb ESTIMATED BEHAVIOR: 70175-6 EXTRUSIONS - LAB AiR NEAR 50% RH
LONGITUDINAL GRAIN: SECTIONS -3-10 mm IH!CKCONSTANT AMPLITUDE CYCLING NEAR 1. CPS
dafdN INCHESiCYCLE10-1 10-6 10-5 10-4 10-3
4 6 8 12 16-0-.-----s• IN.•" • , KM a x
'0.5
-0.5 Kqx
MN- 3.3 4.4 6.6 11. 15.4 19.8 24
10-6 10 10-4 10-3 10-2
-IMdN mmICYCLE
FIGURE 4. Assumed Ambient Cracking Rates-7075-T6 Extrusions
The most favorable behavior for the product 7075-T6 is taken from the literaturesummary( 2 5' and is plotted with my interpretation of the expected value in Figure 5. Assum-ing an initial crack of 50 pm (0.002 in.), we can obtain the calculated extension underthe cyclic loadings for cracking from one side of the hole and the result is plotted inFigure 6. Also shown in this figure are the approximate crack sizes observed after dis-assembly and the number observed per size. The test component lifetimes may be seen as anorder of magnitude longer than the calculated stiffener cracking up to the sizes observedafter the test was concluded. A typical crack from Ref. 17 is shown in Figure 7.
Although the total information on number and size of cracks found in the disassem-blp components is not available, it seems safe to conclude that sixteen cracks in three
coi,2onents did not develop an effective length of 50 pm until most of the component test lifewas completed.
If the cycling loads on these panels relate in any practical way to the behavior| of similarly constructed airframes in actual service, then the cracking in a fleet of air-craft of this type ;ill be relatively extensive at some later period of the fleet lifetime.
t wouldappear very desirable to have more exhaustive studies of both test and service!• crack initiation distributions.
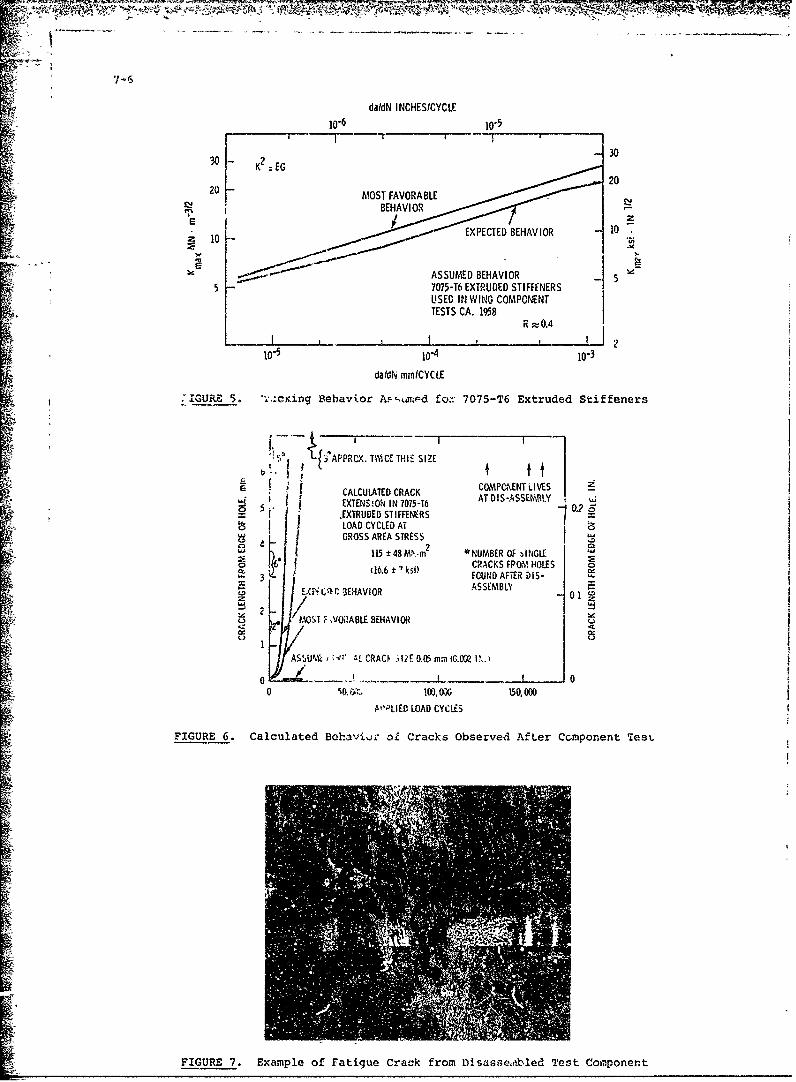
da/dN INCHESICYCLE10-6 10-5
K' EG30.•- •0 - K2 =:EG
20 20MOST FAVORABLE
"BEHAVIORE _zEXPECTED BEHAVIOR 1 07
ASSUMED BEHAVIOR - 55 7075-T6 EXTRUDED STIFFENERS
"USED IN WING COMPONENTTESTS CA. 1958
R ;0.4
10-5 10-4 10-3
rdadN mr,11CYCLE
IGURE 5. '•.Xcing Behavior A.zd for 7075-T6 Extruded Stiffeners
{ý'APPRCX. ThICE 7HIS SIZE
COMPC%.ENT LIVESjE l CALCULATED CRACK
EXTENS!ON IN 7075-T6 AT DIS-ASSEMBLY10.2.EXTRUDED STIFFENERS
LOAD CYCLED ATGROSS AREA STRESS
115 148 Whm2 *NUMBER OF •INGLECRACKS FPOM HOLES
06. FOUND AFTER DIS-SBEHAVIOR ASSEMBLY
z z"•OST F ,VORABLE BEHAVIOR
ASbUV, , At CRACI, .R!E 0.05 mm (G.002 I%.)
0 00. rol., _00,036 150000
A';1LIED LOAD CYCLES
FIGURE 6. Calculated Bohavi.-w oL Cracks Observed After Ccmponent TesL
FIGURE 7. Example of Fatigue Crack from D-sassteobled Test Component
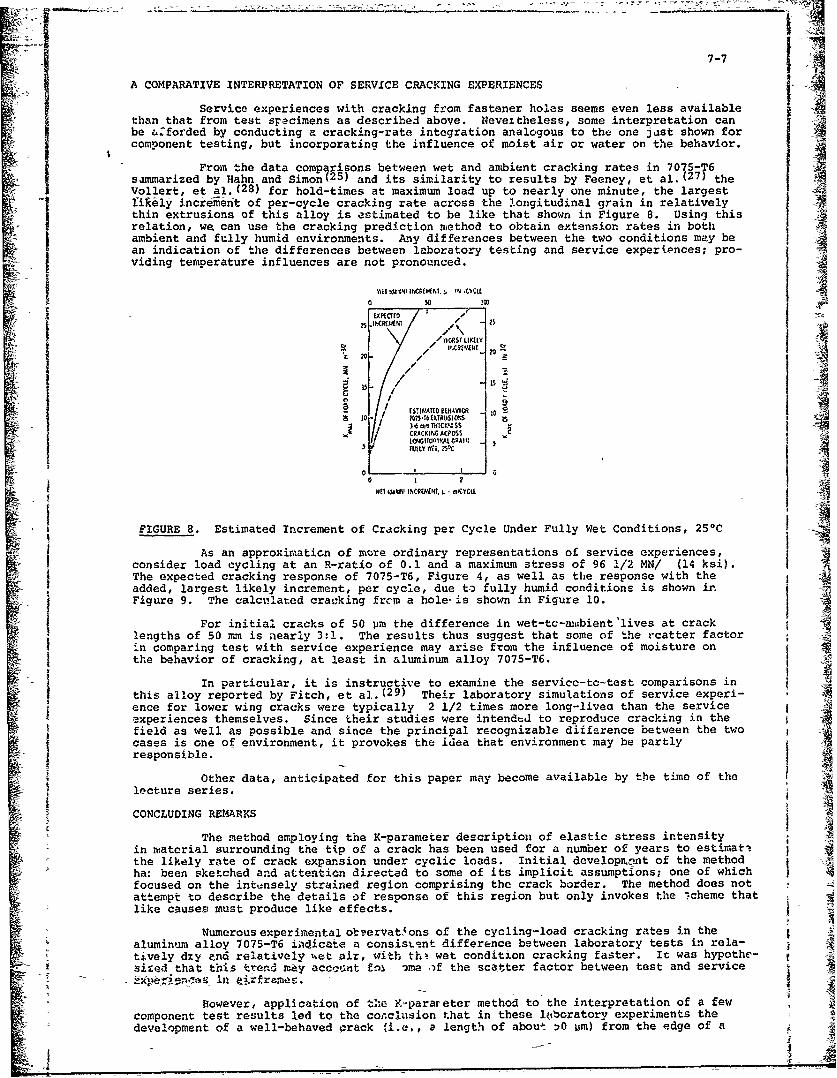
7-7Srs
A COMPARATIVE INTERPRETATION OF SERVICE CRACKING EXPERIENCES A
Service experiences with cracking from fastener holes seems even less availablethan that from test specimens as described above. Nevertheless, some interpretation canbe a&forded by conducting a cracking-rate integration analogous to the one just shown forcomponent testing, but incorporating the influence of moist air or water on the behavior.
From the data comparisons between wet and ambient cracking rates in 7075-T6summarized by Hahn and Simon(25) and its similarity to results by Feeney, et al.( 2 7 ) theVollert, et al.(28) for hold-times at maximum load up to nearly one minute, the largestlikely incereent of per-cycle cracking rate across the longitudinal grain in relativelythin extrusions of this alloy is estimated to be like that shown in Figure 8. Using thisrelation, we can use the cracking prediction method to obtain extension rates in bothambient and fully humid environments. Any differences between the two conditions may bean indication of the differences between laboratory testing and service experiences; pro-viding temperature influences are not pronounced.
AI; 14%)~ MCKAU. u IN ;C('WQ
0 1 00
II / I'* -
-5 I =, !
If E ]A TE BEAVO
WEIi Nh INCREWLNI. I. VI.CYCaL
FIGURE 8. Estimated Increment of Cracking per Cycle Under Fully Wet Conditions, 25*C
As an approximaticn of more ordinary representations of service experiences,consider load cycling at an R-ratio of 0.1 and a maximum stress of 96 1/2 MN/ (14 ksi).The expected cracking response of 7075-T6, Figure 4, as well as the response with theadded, largest likely increment, per cycle, due t' fully humid conditions is shown ir.Figure 9. The calculated cracking frcm a hole is shown in Figure 10.
For initial cracks of 50 um the difference in wet-to-awabient'lives at cracklengths of 50 mm is aearly 3:1. The results thus suggest that some of the a-catter factorin comparing test with service experience may arise from the influence of moisture on
Sthe behavior of cracking, at least in aluminum alloy 7075-T6.
In particular, it is instructive to examine the service-to-test comparisons inI this alloy reported by Fitch, et al.(29) Their laboratory simulations of service experi-ence for lower wing cracks were typically 2 1/2 times more long-livea than the servicesxperiences themselves. Since their studies were intended to reproduce cracking in thefield as well as possible and since the principal recognizable difference between the twocases is one of environment, it provokes the idea that environment may be partlya responsible.
Other data, anticipated for this paper may become available by the time of thelecture series.
CONCLUDING REMARKS
The method employing the K-parameter description of elastic stress intensityin material surrounding the ttp of a crack has been used for a number of years to estimat-ithe likely rate of crack expansion under cyclic loads. Initial developen.~t of the methodha: been sketched and attention directed to some of its implicit assumptions; one of whichfocused on the intonsely strained region comprising the crack border. The method does notattempt to describe the details of response of this region but only invokes the •cheme thatlike causes must produce like effects. 2
"Numerous experimental otervatons of the cycling-load cracking rates in the Naluminum alloy 7075-T6 indicate a consistent difference between laboratory tests in rela-tively dzy and relatively %et air, with thý wet condition cracking faster. It was hypothe-sized that this trend may acoount fol ine of the scaiter factor between test and service-:ki ..l in airframes.
However, application of the Y-parareter method to the interpretation of a fewcomponent test results led to the conclusion that in these loboratory experiments thedevelopment of a well-behaved crack (i.e,, a length of about ,)0 Um) from the edge of a
I A
I1
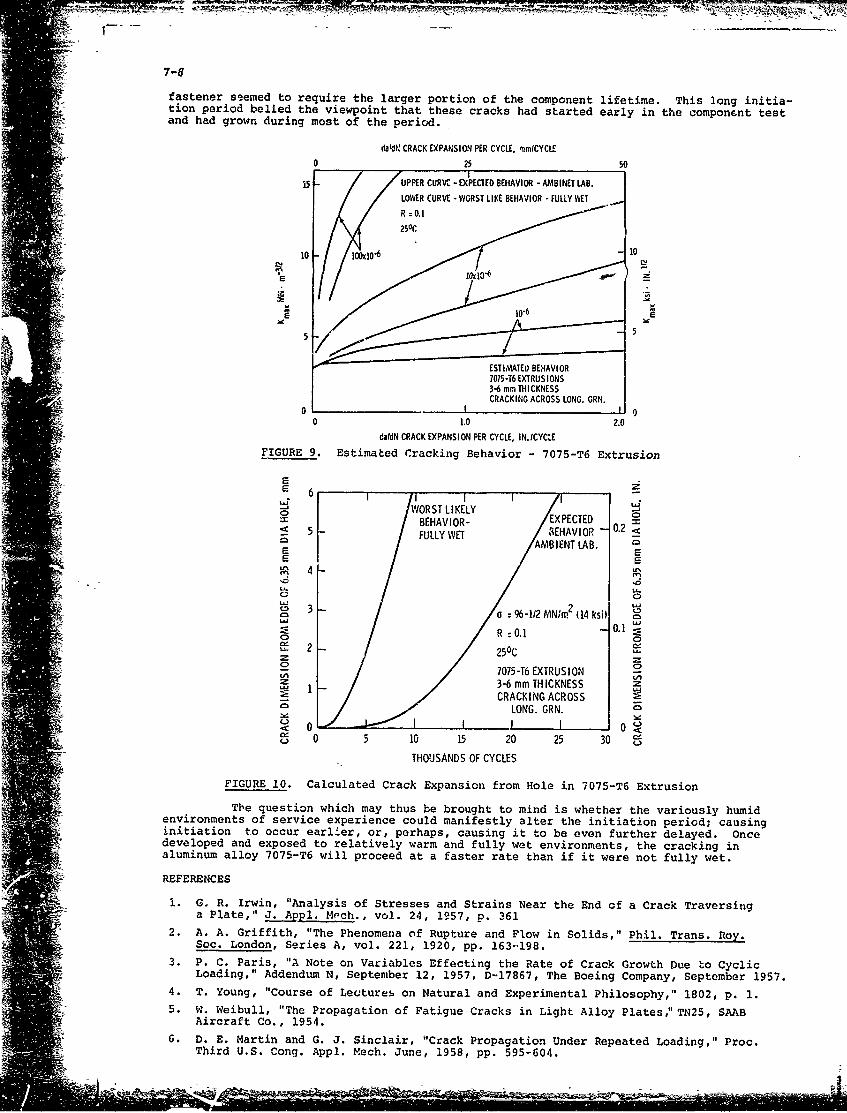
- 7-8
fastener se.emed to require the larger portion of the component lifetime. This long initia-tion period belied the viewpoint that these cracks had started early in the component test
• • and had grown during most of the period.
. •tWdl' CRACK EXPANSION PER CYCLE, ,mmlCYCI.E
0 25 50
S1,5UPPER CURVE - EXPECTED BEHAVIOR - AMBINET LAB.
LOWER CURVE - WORST LIKE BEHAVIOR -FULLY E
ESTI" MATEt BEXAVI OR7075-16 EXTRUSIONS3-6 mm THICKNESSCRACKING ACROSS LONG. RN..
i=0 1.0 2.0
dJIdN CRACK EXPANSION PER CYCLE, IN.ICYCLE
FIGURE 9. Estimated Cracking Behavior - 7075-T6 Extrusion
'-'.4 f WORST LIKELY .
"o BEHAVIOR- EPECTED- - FULLY WET / EHAVIOR -0.2 <
S 4-
U'- /4o=% UNm'1 si -
o / 0.
S•o 0 .
o,,i 0 2 301 - HOUSNDS FHCC KNES
FIGURE 10. Calculated Crack Expansion from Hole in 7075-T6 Extrusion
S~The question which may thus be brought to mind is whether the variously humidenvironments of service experience could manifestly alter the initiation period; causinginitiation to occur earlier, or, perhaps, causing it to be even further delayed. Once)• developed and exposed to relatively warm and fully wet environments, the cracking inaluminum alloy 7075-T6 will proceed at a faster rate than if it were not fully wet.
• REFERENCES
Si. G. R. Irwin, "Analysis of Stresses and Strains Near the End of a Crack Traversing•: a Plate," J. Appl. Mech., vol. 24, 1957, p. 361
2. A. A. Griffith, "The Phenomena of Rupture and Flow in Solids," Phil. Trans. Roy.•: Soc. London, Series A, vol. 221, 1920, pp. 163-.198.
S3. P. C. Paris, "A Note on Variables Effecting the Rate of Crack Growth Due ho CyclicLoading," Addendum N, September 12, 1957, D-17867, The Boeing Company, September 1957.
4. T. Young, "Course of ,euturei. on Natural and Experimental Philosophy," 1802, p. 1.
•=5. W. Weibull, "The Propagation of Fatigue Cracks in Light Alloy Plates," TN25, SAAB• Aircraft Co., 1954.
.••6. D. E. Martin and G. 3. Sinclair, "Crack Propagation Under Repeated Loading," Proc.i Third U.S. Cong. Appl. Mech. June, 1958, pp. 595-604.
4- - .. L
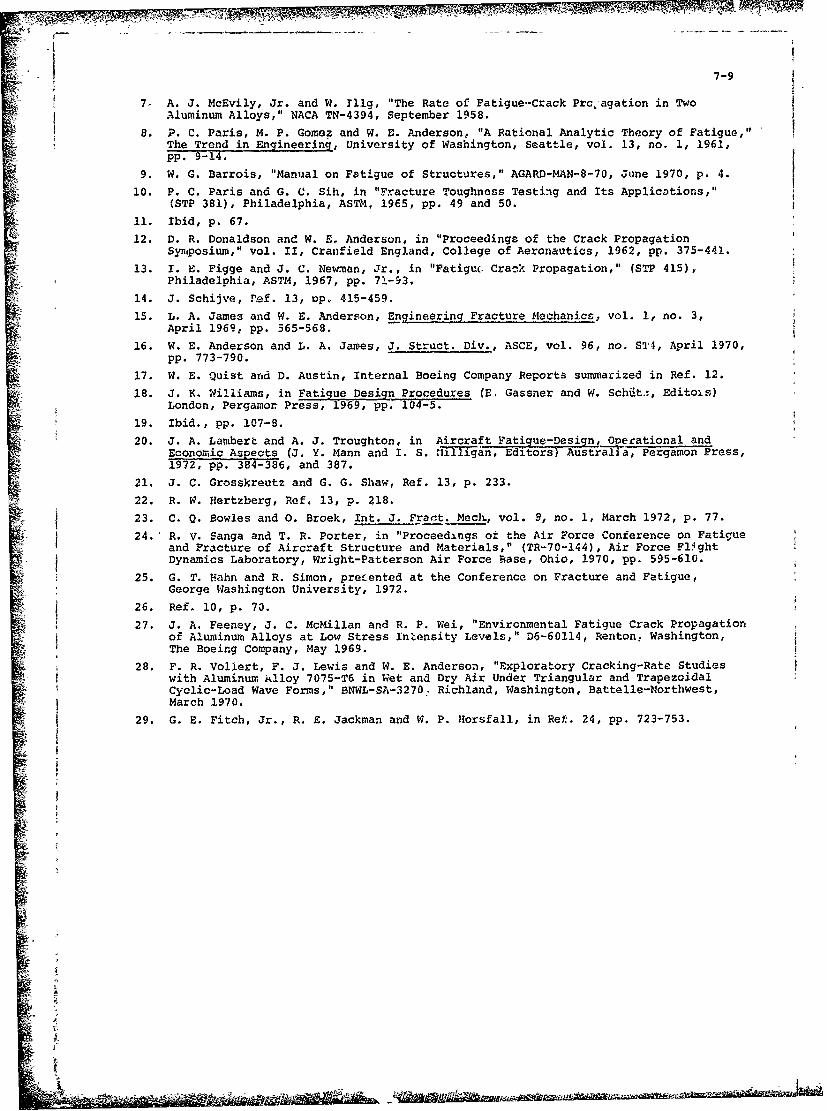
- .~-.
7-9
7- A. J. McEvily, Jr. and W. l11g, "The Rate of Fatigue-Crack Prc,,agation in Two8.Aluminum Alloys," NACA TN-4394, September 1958.8.P. C. Paris, M. P. Gomez and W. E. Anderson, "A Rational Analytic Theory of Fatigue,1
The Trend in Engineering, University of Washington, Seattle, vol. 13, no. 1, 1961,pp. 9-14.
9. W. G. Barrois, "Manu~al on Fatigue of Structures," AGARD-MAN-8-70, June 1970, p. 4.
10. P. C. Paris and G. C. Sih, in "Fracture Toughness Testing and Its Applications,'(STP 381), Philadelphia, ASTM, 1965, pp. 49 and 50.
11. Ibid, p. 67.
12. D. R. Donaldson and W. E. Anderson, in "Proceedings of the Crack PropagationSym~posium," vol. 11, Cranfield England, College of Aeronautics, 1962, pp. 375-441.
13. I. E. Figge and J. C. Newman, Jr., in "Fatiguc* Cra-:: Propagation," (STP 415),Philadelphia, ASTM, 1967, pp. 71-53,
14. 3. Schijve, Pef. 13, op. 415-459.
15. L. A. James and W. E. Anderson, Engineering Fracture Mechanics, vol. 1, no. 3,April 1969, pp. 565-568.
16. W. E. Anderson and L. A. James, 3. Struct. Div., ASCE, vol. 96, no. S11-4, April 1970,pp. 773-790.
17. W. E. Quist and D. Austin, Internal Boeing Company Reports summarized in Ref. 12.
18. J. K. Williams, in Fatigue Design Procedures (E, Gassner and W. Schiit.:, Editoils)I ~London, Pergamoir Press, 1969, pp. 104-5.
19. Ibid., pp. 107-8.
20. J. A. Lambert and A. J. Troughton, in Aircraft Fatigue-Design, Ooerational andEconomic Aspects (3. Y. Mann and I. S. HiTi n, Ed itors) Australia, Pergamon Press,1972, -pp. 384-386, and 387.
21. J. C. Grosskreutz and G. G. Shaw, Ref. 13, p. 233.
22. R. W. Hertzberg, Ref, 13, p. 218.
23. C. Q. Bowles and 0. Broek, Int. J. Fra'nt. Nech., vol. 9, no. 1, March 1972, p. 77.
24.* R. V. Sanga and T. R. Porter, in "Proceed3ings of the Air Force Conierence on Fatigueand Fracture of Aircraft Structure and Materials," (TR-70-144), Air Force Fl~ghtDynamics Laboratory, Wright-Patterson Air Force Biase, Ohio, 1970, pp. 595-610.
25. G. T. Hahn and R. Simon, precent~ed at the Conference on Fracture and Fatigue,George Washington University, 1972.
26. Ref. 10, p. 70.a27. J. A. Feeney, J. C. McMillan and R. P. Wei, "Environmental Fatigue Crack Propagation
of Aluminum Alloys at Low Stress In~ensity Levels," D6-60114, Renton: Washington,The Boein~g Company, May 1969.
28. F. R. Vollert, F. J. Lewis and W. E. Anderson, "Explorat~ory Cracking-Rate Studieswith Aluminum, Alloy 7075-T6 in Wet and Dry Air Under Triangular and TrapezoidalCyclic-Load Wave Forms," BNWL-SA-3270., Richland, Washington, Battelle-Northwest,March 1970.
29. G. E. Fitch, Jr., R. E. Jackman and W. P. Horsfall, in Ret. 24, pp. 723-753.
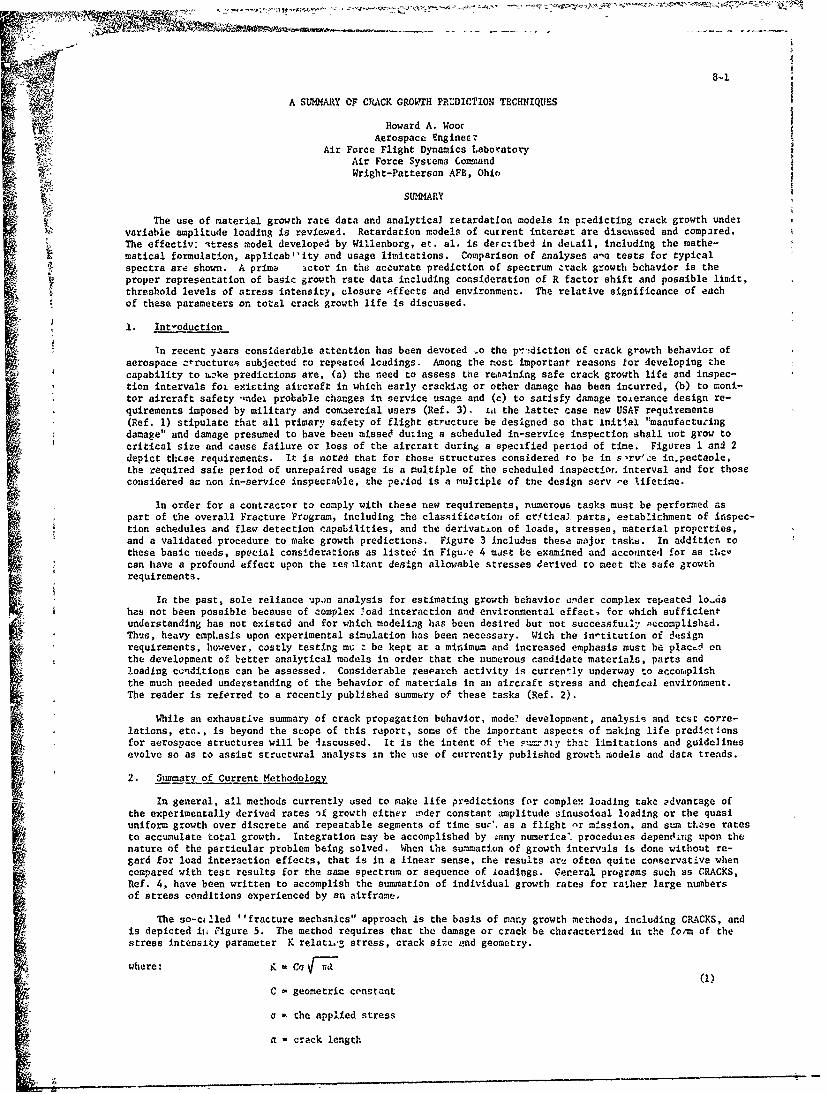
8-1
Mp A SUMMARY OF CRACK GROWTH PRUDICTION TECHNIQUES
Howard A. WoocAerospace Engineer
Air Force Flight Dynamics LaboratoryAir Force Systems CommandWright-Patterson AFB, Ohio
SUMMARY
The use of material growth rate data and analytical retardation models in predicting crack growth undervariable amplitude loading is reviewed. Retardation models of current interest are discussed and compared.The effectiv: itress model developed by Willenborg, et. al. is deFctibed in detail, including the mathe-matical formulation, applicab''ity and usage limitations. Comparison of analyses a-a tests for typicalspectra are shown. A prima actor in the accurate prediction of spectrum crack growth bchavior is theproper representation of basic growth rate data including consideration of R factor shift and possible limit,threshold levels of stress intensity, closure •,ffects and environment. The relative significance of eachof these parameters on total crack growth life is discussed.
1. Int-oduction
In recent yaars considerable attention has been devoted •o the p'ediction of crack growth behavior ofaerospace :cructure. subjected to repeated Icadings. Among the most important reasons for developing thecapability to Lzke predictions are, (a) the need to assess the renaining safe crack growth life and inspec-tion intervals foi existing aircraft in which early crackiag or other damage has been incurred, (b) to moni-tor aircraft safety 'nder probable changes in service usage and (c) to satisfy damage tolerance design re-quirements imposed by military and comaercial users (Ref. 3). L, the latter case new USAF requirements(Ref. 1) stipulate that all primary safety of flight structure be designed so that initial '"manufactutingdamage" and damage presumed to have been missed ducing a scheduled in-service inspection shall not grow tocritical size and cause failure or loss of the aircrart during a specified period of time. Figures 1 and 2depict thcse requirements. It is noted that for those structures considered to be in s'rv'ze in.pectable,the required safe period of unrepaired usage is a multiple of the scheduled inspectior. interval and for thoseconsidered as non in-service inspectable, the pe.:iod is a nulriple of tne design serv -e lifetime.
In order for a contractor to comply with these new requirements, numerous tasks must be performed aspart of the overall Fracture Program, including the classification of cr!tical parts, establichment of inspec-tion schedules and flaw detection capabilities, and the derivation of loads, stresses, material properties,and a validated procedure to make growth predictions. Figure 3 includes these major tasks. In additicn tothese basic needs, special cons±derations as listed in Figu.'e 4 must be examined and accounted for as :tic-can have a profound effect upon the tes itant design allowable stresses derived to meet the safe growthrequirements.
In the past, sole reliance up.on analysis for estimating growth behavior ander complex repeated loushas not been possible because of complex load interaction and environmental effect, for which sufficientunderstanding has not existed and for which modeling has been desired but not successfuily occomplishad.Thus, heavy empLasis upon experimental simulation has been necessary. With the in-titution of designrequirements, however, costly testing mu z be kept at a minimum and increased emphasis must bh plac.' onthe development of better analytical models in order that the numerous candidate materials, parts andloading ccnditions can be assessed. Considerable research activity is currently underway to accoraplishthe much needed understanding of the behavior of materials in an aircraft stress and chemical environment.The reader is referred to a recently published stumary of these tasks (Ref. 2).
While an exhaustive summary of crack propagation behavior, mode' development, analysis and tcst corre-lations, etc., is beyond the scope of this report, some of the important aspects of making life predictionsfor aerospace structures will be iiscussed. It is the intent of the Fm'•.niy that limitations and guidelinesevolve so as to assist structural analysts in the use of currently published growth models and data trends.
2. iummary of Current Methodology
In general, all methods currently used to make life predictions for complex loading take advantage ofthe experimentally derived rates if growth either -nder constant amplitude sinusoioal loading or the quasiuniform growth over discrete and repeatable segments of rime sur'. as a flight -r mission, and sum thease ratesto accumulate total growth. Integration may be accomplished by zany numerical procedures depending upon thenature of the particular problem being solved. When the smmmation of growth intervals is done without re-gard for load interaction effects, that is in a linear sense, the results aru often quite conservative whencompared with test results for the same spectrum or sequence of ioadings. General programs such as CRACKS,Ref. 4, have been written to accomplish the summation of individual growth rates for rather large numbersof stress conditions experienced by an airframe.
The so-ci !led ''fracture mechanics" approach is the basis of marny growth methods, including CRACKS, andis depicted iiL kligure 5. The method requires that the damage or crack be characterized in the form of thestress intensity parameter K relati.ý! stress, crack size end geometry.
where: K C- ar 7IC - geometric constant
a the applIed stress
a crack length
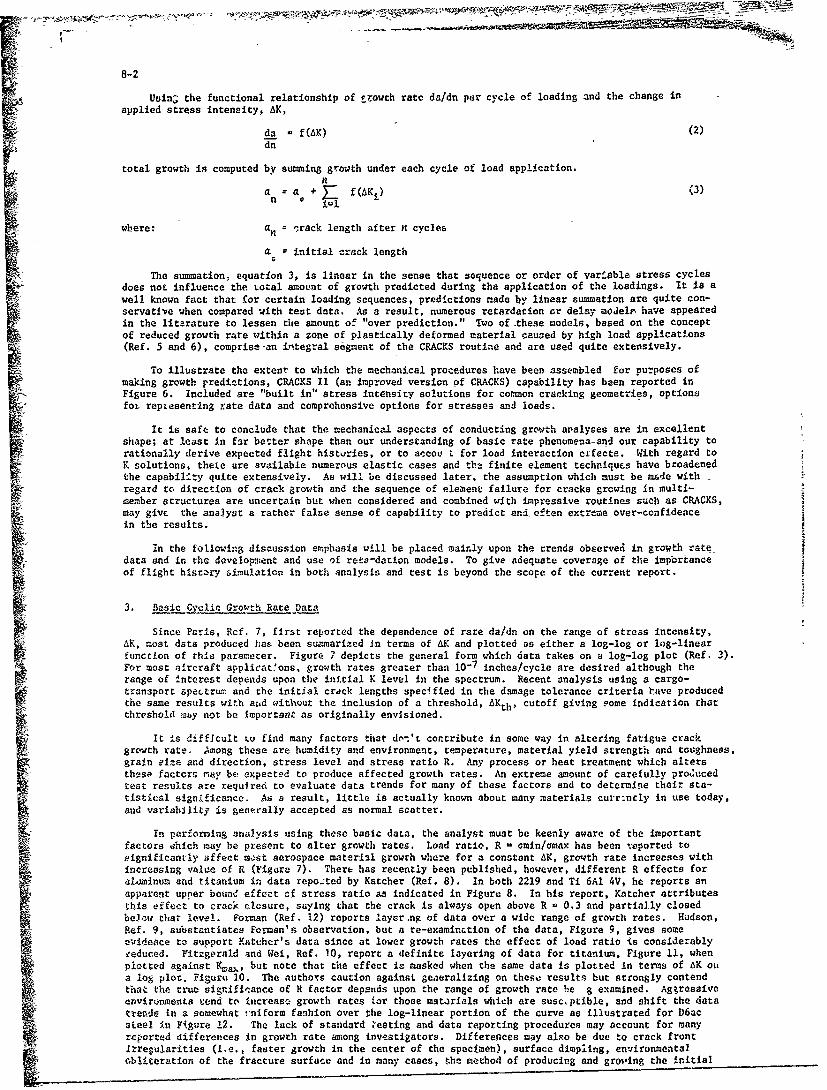
8-2
Uuni; the functional relationship of rrowrh rate da/dn per cycle of loading and the change inapplied stress intensity, AK,
da -f(tiK) (2)dn
total growth is computed by summing growth under each cycle of load application,
an = a. + f(AKi) (3)
where: an = orack length after it cycles
a initial crack length
The summation, equation 3, is linear in the sense that sequence or order of variable stress cyclesdoes not influence the total amount of growth predicted during the application of the loadings. It is awell known fact that for certain loading sequences, predictions made by linear summation are quite con-servative when compared with test data. As a result, numerous retardation or delay modelt have appearedin the literature to lessen the amount of "over prediction." Two of -these models, based on the conceptof reduced growth rate within a zone of plastically deformed material caused by high load applications(Ref. 5 and 6), comprise-an integral segment of the CRACKS routine and are used quite extensively.
To illustrate the extent to which the mechanical procedures have been assembled for purposes-ofmaking growth predictions, CRACKS 1l (an improved version of CRACKS) capability has been reported inFigure 6. Included are "built in" stress intensity solutions for common cracking geometries, optionsfov repiesenting rate data and comprehensive options for stresses and loads.
It is safe to conclude that the mechanical aspects of conducting growth apalyses are in excellentshape; at least in far better shape than our understanding of basic rate phenomena-and our capability torationally derive expected flight histuries, or to accou L for load interaction erfects. With regard toK solutions, thete are available numerous elastic cases and th2 finite element technrques have broadenedthe capabillry quite extensively. As will be discussed later, the assumption which must be made with-regard to direction of crack growth and the sequence of element failure for cracks growing in multi-member structures are uncertain but when considered and combined with impressive routines such as CRACKS,may give the analyst a rather false sense of capability to predict and often extre-me over-confidencein the results.
in the following discussion emphasis will be placed mairly upon the trends observed in growth ratedata and in the development and use of reta-dation models. To give adequate coverage of the importanceof flight hisae•y simulation in both analysis and test is beyond the scope of the current report.
3. Basic Cyclic Growth Rate Data
Since Paris, Rcf. 7, first reported the dependence of rare da/dn on the range of stress intensity,AK, most data produced has been summarized in terms of AK and plotted as either a log-log or log-linearfunction of this parameter. Figure 7 depicts the general form which data takes on a log-log plot (Ref. 3).For most aircraft applicat'ons, growth rates greater than 10-7 inches/cycle are desired although therange of interest depends upon the' initial K level in the spectrum. Recent analysis using a cargo-transport spectrum and the initial crick lengths specified in the damage tolerance criteria have producedthe same results with and without the inclusion of a threshold, AKth, cutoff giving some indication thatthreshold may not be Important as originally envisioned.
It Is difficult to find many factors that don't contribute in some way in altering fatigue crackgrowth rate. Among these are humidity and environment, temperature, material yield strength and toughness,grain eiza and direction, stress level and stress ratio R. Any process or heat treatment which altersthese factors may be expected to produce affected growth rates. An extreme amount of carefully producedteat results are required to evaluate data trends for many of these factors and to determine their sta-tistical significance. As a result, little is actually known about many materials currintly in use today,and variability is generally accepted as normal scatter.
In performing analysis using these basic data, the analyst must be keenly aware of the importantfactors ,-hich may be present to alter growth rates. Load ratio, R - omin/omax has been reported tosignificantly affect most aerospace materi~l growth where for a constant AK, growth rate increases withincreasing value of R (Figare 7). There has recently been published, however, different R effects foraltminum and titanium in data repo.ted by Katcher (Ref. 8). In both 2219 and Ti 6A1 4V, he reports anapparent upper boune effect cf stress ratio as indicated in Figure 8. In his report, Katcher attributesthis effect to crack closure, saying that the crack is always open above R = 0.3 and partially closedbelow t|har level. Forman (Ref. 12) reports layer.ng of data over a wide range of growth rates. Hudson,Ref. 9, substantiates Forman's observation, but a re-examinction of the data, Figure 9, gives some
cwidence to support Katcher's data since at lower growth rates the effect of load ratio Is considerablyeeduced. Fitzgerald and Wei, Ref. 10, report a diefinite layering of data for titanium, Figure 11, whenplotted against Kmm,, but note that the effect is masked when the same data is plotted in terms of AK oua log plot. Figure 10. The authors caution against geaeralizing on these results but strongly contendthat the true significance of R factor depends upon the range of growth rate be g examined. AggressivOenvirunments tend to increasa growth rates tor those mat.rials which are susc ptible, and shift the datatrends in a somewhat ,-niform fashion over the log-linear portion of the curve as illustrated for D6acsteel In Figure 12. The lack of standard Zesting and data reporting procedures may account for manyreported differences in growth rate among investigators. Differences may alxo be due to crack frontIrregularities (i.e., faster growth in the center of the spectmen), surface dimpling, environmentalobliteration of the fracture surface and in many cases, the method of producing and growing the initial
8-3cracks (Ref. 10). Scatter, or variability in rates for otherwise similar conditrons can be expected from
;tb heat to hea' in a given material.
Wha'ever the reason, variation, scatter, etp.. in cyclic growth rate data is expected and should beaccountea for by the analyst.
Numerous attempts ha:e been made to postulate the behavior of growth rate mathematically. i ena0 - paper by Pelloux, Ref. 11, a chronniogy of growth rate "laws" has been sumnmarized. Because of the easeof integrating simple expressions for growth rates and the need to account for rate variation within thecurrent computer routines, the empirical equation format appears to he the most universally used method.
Paris, Ref. 7, found that the primary behavior could be described by the power law relationshipSda/dn - Ci W1 (4)
and found that for many materials, n - 4.0 agreed with reported test data. Forman Ref. 12, accounted forU ~~~load ratio effects and the tendency of the upper -.ýgion of the rate curve to approach Kciia and!t developed the following expression:
da/dn C2LgI
(1-R)K-K(5)Both Fornman and Hudson (Ref. 9) reported excellent correlation of this expression for aluminum. Walker(Ref. 11) reported a three parameter empirical equation:
da/dn fC3 (I-R)tymax 1I (6)"which accounts for the effect of R and provides a better fit for many materials and is preferred over theForman expression by some analysts.
There is obviously no single "empirical law" which is superior in representing data and it is notnecessary to rank or recommend one for universal use. T s use should deperd upon the individual analystand the confidence which he Pas either acquired through experience or from other reported sources. TheForman expression may be used more successfully to describe data trends over the mid-growth range if allthree constants, m, Kc and C2 , are allowed to be empirical fitting parameters. In general, however, K^is intended to be equal to the critical fracture parameter so that the singularity in the equation ismaintained. Threshold. AKth, can be input as a cutoff value either constant or as a function of loadratio, R.
There are of course cases where equations may not be adequate to describe data and for this reason,the option of inputing actual data points or segmented straight lines with an interpolation criteria maybe more desirable. This procedure, however, doesn't allow for data extrapolation.
In umu.mary, eztensive data ia required to establish definite trends of cyclic crack growth and caremust be exercised to accurately describe the data in the region of interest. The importance In being ableto use an empirical law is that extrapolation to include regions where data is lacking nay be possible.
4. Methods of AccountinR for the Effects of Variable n1!pitude LoadingSThe need to be able "o account for variab½e amplitude loading has evolved because of tr-ends observedin experimental studies of single and multiple overload behavior and spectrum tests and because toneglect growth rate delay can be conservative and costly when designing for safe crack growth requirements.Retardation or delay can be characterized by a period of reduced growth rate following the application ofa load or loads higher than those which occur subsequent. Figure 13 depicts this phenomena schematicallyfor the case of a single overload occurring in a constant load cyclic test.
4.1 Historical DivalopmenL of Retardation Models,Until quite recently, only limited systematic studies of simple variable amplitude luaditugs on crackgrowth have been reported and thus limit2d the data base upon which to develop delay models. The need fora model became evident about eight years ago nnJ was urgently needed during the F-1ll recovery programwhen inspection intervals based upon crack gruwth predictions were required for the proof tested aircraft.Duriing this time, Wheeler, Ref. 6, first nublished a model concept based on the theory that delay ingrowth subsequsat to the application of an ovetload was proportional to the ratio of the sizes of thecurrent yield zone. that is at the load level subsequent to the overload, and the zone produced by theoverload. AS stimmarized in Figure 14, the model required that results of tests be fit to produce anempirically derived value for the exponent M. The uniqueness of a particular '"'to one material and/orto one Spectrum limits the usefulness of the model in prediction of growth behavior of a particularstructure under an entirely different spectrun shape. la Ref. 13, the variation of predicted lite with"W" was examined for the baeic 5.Og fighter spectrum, anr led to the establishment of a conservative valuefor '1," to use in determining safe inspection intervals. Because of thn spectrum dependence of m, itsIndiscriminant use with spectra radically different in form from that for which it was derived can leadto inaccurate and unconservative results. Development of models has progressed since that time period as
summarized in Figure 15 (Ref. 3)
4.2 Elbers Crack-Closure
The phenomenon known as closure first reported by Elber (Ref. 14), is receiving considerable attentionin current research efforts in an attempt to develop a working delay model.
In his early experiments, Elber noted and explained the non-.linear behavior of measured load dis-placement records (Figure 16) as physical contact or interference of the zone of plastically deformedmaterial imlediately behind an advancing fatigue crack. Ile further thought that cyclic growth onlyoccurred when the crack was fully open and developed a relationship between applied and actual 6tressIntensity range AK, as follows:
Aa/ - C(AKeff)n - c(UtK)' (7)
where:
U - p - 4ej_ - (.5 + 4R) for 2024-T3
Ko: - the value of stress intensity at onset of crack opening.
Using this relationship, growth rate data for 2024-T3 reported by Hudson for various load ratios.R was replotted using AKeff, and convincingly explained the layering of data reported. All data fellnearly on a single curve of AKeff versua da/dn.
Numerous investigators, subsequent to Elher, have reported closure measurements (Ref. 15, 16, 8)often with discrepancies in reported closure loads. While Elber reported limited data at relatively highnet section stresses, Shih and Wei (Ref. 16) have indicated that closure, U, and opening stress, cop, aredependent upon maximum K as well as R as reported by Elber.
One of the prcblems in measuring ard reporting closure, is that so far only surface indications havebeen used in quantifying the amount of .losure present. Most investigators have noted variations inclosure measurements, depending upon the location of instrumentation relative to the crack tip. InTable 1 are reported results from several sources isr Ti 6A1I 4V. About the only measurement consistentwith all was that crack opening was present at or above R - 0.3 for all reported load levels, K levels,etc.. In contrast to Katcher's argument (Ref. 8) for closure producing R ratio effects, Wei and Shih(Ref. 15) in reporting full R factor layering up to R - 0.90, Figure 10 and 11, suggest that these trendsin growth rate data may not be fully explained by closure.
The use of a closure model to predict spectrum behavior has been reported by Elber (Ref. 14) andin preliminary studies for the USAF, Ref. 2. Figure 18 includes a schematic of a simple spectrum inwhich the opening stress is seen to vary. The success In using a closure model for the'prediction ofdelay following an overload depends upon the assumptions made regarding the stabilization of closureload following the overlvad and the number of cycles of load required to accomplish "equilibrium". Fore::ample, following one or a fe, overloads (Figure 19), closure (i.e., opening) load of the subsequentseries of cycles would be effected by the presence of the overload. If the overload would cause the•: opening load of the subsequent cycles to be increased, under these assumptions, crack growth could be
completely arrested for some conditions. Assuming growth of a retarded nature did occur following theoverload, some assumptions would have to be made as to the length of crack or zone over which the retarda-tion would apply. As a first approximation, the yield zone produced by the overload might be tried.
Ic is interesting to note that the Willenborg model (Ref. 5) and Elber (at R - 0), indicate thatcomplete stoppage of growth is possible for 100% overloads (see Section 4.3). The signifi-cance of this fact iu not known. however, and will only be determined through proper experimentation.
Shih and Wei (Ref. 15) have reported evidence to refute closure as the only phenomenon responsiblefor retcrdatlon. Recall that in data from Ref. 8, all cracks loaded above R - .3 were open and no delaybased solely on closure should be noted for the condition of AKmin - 12Ksi Wi (see Figure 20). Sig-nificanL delay is reported however.
In s •mafry, slosire appears to be a real phenomena, which can be rather readily observed, measuredand qvantified. It apparently is not the only phenomena which causes delay. Results from past studiesha-e differed becase of (a) specimen type, (b) thickness, (c) precracklng procedure, (d) notch geometryand (0) _nstrumenratiou.
4.3 The Willenborg Model (Ref. 5)
Early in the recovery prograr for the F-211 it became apparent that an improvement wal neaded tothe Wheeler modetl, hopefully a mode] which would not rely on any empirically derived_ parameters exceptthe growti. rate constants used to describe cyclic data. In addition to thisgoal, ease of automation into th,. CýACKS computer routine was esacntial. Using as the basis the yieldzone concepts proposed oy Wheeler, the model was developed under the foilowing ass uptions:
1. Retarded growth occurs when the maximum cyclic str'es is redcced.
2. Retardation is proportionai cý the amount rhat th, Lanimua sttoss i reduced.
3. The length of retarded growth is thnt 2one of plastlcisy caused by the overload,
4. A new condition of retardation is produced each time s load is applied which is larger thfn theoriginal 'r¢orlo.d,
To illustrat. tiae oathematical development and the operatloic of Zth model, the cbse of a singleoverliad is considered. Figure 21, 22 and 23 Aý=arizd th0 deva6pmaent steps of the model.
Following thc sizgle overlord, the crr-k continues to grow under cyc3ic loaýing, 6o . The grwz%.rate, however, 1. retaraed as long Ds n, subocquent milmum stresas greater than cA(•rv if applle4 and
8-5
as long as growth remains within the zone of plasticity caused by the overload, 01 (max). For the lattercondition, it is presumed that the "current" crack length, a., plus the length of "current" yield zone,y c.is less than the value of ap, that is the extent of the yield zone caused by the overload, Irwin'syield zone model Is used in the model where
Ry= yield zone size - K2 (8)77, 2
C = 2n for plane stress conditions
C - 4 for plane strain conditions
In the example (Figure 21) the plane stress assumption is illustrated. Although a single two levelstress spectrum is considered here, assume that a third stress level a3 - ap (less than a,) occurs fol-lowing the last cycle of 02, and assume also that growth has not completely progressed through the yieldzone caused by the overload, a,. For the previously established conditions of retardation, it can bepresumed that retardation will be terminated when the value of ca_ is large enough (cap < a,), and thecurrent crack length, ac, is of such extent that the condition ex sts:
ac+ Ryap =pi (Q)
where: 'yap - yield zone caused by general stress aap at crack length ac
- (Kap)2 0ap
2na(a )2 )2\° ( -'Y
y Y material yield strength
Therefore, the value of general stress cap is as follows:
0ap = ry /2(ap - cS(plane stress)
(10)ac
Further illustration of Oap is indicated in Figure 22 where It is plotted against the incrementof Crack growth following the overload, 0l . Note that a is bounded by values cap - aland ap 0over the increment ai - a' In a physical sense, 0a may ge thought of as the effective portion of 01remaining following the application of al which is capable of causing retardation for stress 02 < Gat a crack length still within the zone caused by the overload, al. Because it Is assumed that retNda-tion is proportional to the differences in applied stresses, the amount that 02 is retarded should be thedifference cap - 02, . at any crack length. (Note that 0aP -02 (max) - al(max) - a2 (max) immediatelyfollowing the overlo.
Ored - the amount of "residual stress" caused by the overload available toretard a2
cap - 0 2 (max) (11)
The relationship between ored and oap is Illustrated in Figure 22 for the example.
In the computation of reduced growth due to 02 loading, both o 2 (max) and o 2 (min) are reduced bythe amount ared as illustrated in Figure 22. Negative values are set equal to zero. Effective values ofAK2 , R2 are computed with R2 always being equal to or greater than zero. The effective AK and R are thenused to compute a new and reduced growth rate.
There are three distinct modes of retardation possible with the model (Figure 23).
a. Retardation is due to both a reduced AK and R - 0
b. Retardation is due to the reduction of R only, R>0, AKeff ' AK
c. Maximum retardation occurs when both AKeff and R are equal to zero.
Note that condition "c" occurs at R - 0 for the case when (Ol/o2)mnx > 2.0.
The model and procedure has been programmed for ease of computation into the program CRACKS (Ref. 4).Schematically, the rate of growth versus the increment of crack growth for the single overload case isIllustrated in Figure 22. Maximum retardation is seen to occur immediately following overload and recoveryto normal or ,,.retarded rate occurs within the yield zone as shown.
51 Correlation of Analysis and Test Using the Willenbor
5,1 Linle end n ultple Periodic Overloads
In one of the early attempts to compare the Willenborg model predictions with test results, datafrom Porter (Ref, 11) was obtained for 7075-T6 and 2024-T6 aluminum panels. The results of these correln-tiot attempts are illustrated in Figures 24 through 29. In general the trends noted durif, testing arepredictable using thz analytical model, In attempting this correlation, average growth rate data taken
8-6
from the literature was used and thus, it is not surprising-thar analysis and test w.uld notimatch exactly.Although not indicated here, the analyses were re-run with constant amplitude data derived from similarspecimens and the quantitative correlation was closer for many of the tests.
5.2 Blocked Spectrum Loading
The second set of test results for which correlation was performed included surface flaw growthexperiments using a 200 flight hour blocked version of the F-ill spectra which included in each block58 discrete layers of constant amplitude stress arranged in a random qequence (Ref. 13). The 200 hourblock was repeated until failure of the specimen occurred. The 5g full spectrum was the basic version,
* • used however in an attempt to obtain test data for reduced severity flying, the maximum stress levelswere truncated in several of the tests. In addition, the basic 5.6g spectrum was tested with stresslayers in each block arranged in ascending and descending fashion (based on maximum stress) to assesspossible sequence effects. The test results shown are representative of measured crack depth obtained'fron the fracture surface after completion of the test (see Figure 36 for example). Analytical correla-tion was only possible to a depth of approximately 0.25 inches or approximately 80% of the thicknesssincs back surface effects and shape change altered the stress intensity factor and were not consideredin the analysis.
Test results indicated that truncation produced faster growth for the random block version, (Figure
30). An increase of stress by 10% increased growth (Figure 30). Both trends were modeled by the analysisas is indicated in Figure 30. The ordered results were not accounted for by the analysis as illustratedin Figures 31 and 32. As might be expected, the low-high order would produce the most amount of growthaccording to the :odel since the last load in each block would retard many of the subsequent low loadsat the beginning of the subsequent block. Conversely, high-low would indicate a lesser amount of retar-dation bince the magnitude of stresses aifected by the highest stress in each block would be larger.
5.3 Flight by Flit _ar o Transport Spectra
Most recently, the model was used to successfully predict the test growth results of cracksemanating from fastener holes under blocked and flight by flight versions of a cargo-transport spectra
(Ref. 3, 17), Two versions of the flight by flight spectra were analyzed representing e&fference missionusage.
First, a bloc,.ed version of th,, spectrum was modeled for the case of an open hole with a singlethrough crack ez.anating from it. Basic growth rate data for the material (7075-T6511) was obtained fromseveral literature sources and a band of scatter for as many load ratios as possible were constructedabout the data. The results of prediction and test are included in Figure 33. Test results.fell withinthe predicted lives for the anticipated range of growth rate data. A comparative "no retardation" runwas made and it is noted that for this spectrum, little difference exists.
Similar analyses were conducted to match tests of a random flight by flight version of the sametransport spectrum utilizing both a 14 mission and a 15 mission usage definition (Figures 34 and 35).For these cases, open hole tests were modeled using the cases of partially through and through cracksemanating frnm the hole. Once again, da/dn data was modeled using the Forman expression, with a 2:1scatterband defined to account for variability. Correlation between test and analysis was good as thetest results fell within the anticipated band using the "upper and lower bands" of data. Note that moreretardation was present in the 14 mission than in the 15 misslon case. It should be pointed out that allcycles defined in the analysis were derived by performing a range pair counting technique to the testspec. i. The method cf range pair counting is described in Ref. 18. It is interesting to note thatlittle eifference in predictions was noted, between the "counted and not counted" spectra. It should benoted that quite inaccurate correlation was obtained for the growth of very small cracks in these tests.This may be due to either the K solution used in the analysis (Bowie and modified Bowie) or due to thedifficulty in measuring actual cracks during the test. The recorded test values represent measuredsurface lengths taken curing the cest.
In the foregoing discussions, the degree of correlation was judged according to the exactness withwhich the actual test results and the analysis matched. When trends are correlated and when test resultsfall within the expected lives predicted by the range of da/dn data, it is difficult to blame the retardatiodmodel solely for exact lack of correlation.
In summary, the model has been fairly successful in predicting growth behavior trends for typicalsimulated flight loads for some aluminums and a high strength steel alloy. Trends in peiiodic overloadtests in 7075-T6 and 2024-T3 were closely modeled with accuracy well within the range of basic growthrate data scatter.
6. Model Limitations - Recommended Usage
Although previous discussions have indicated fairly good correlatlon between analysis and testsusing the Willenborg delay model, the obvious inadequacy of the model to account for all loading sequenceeffects prohibits its unlimited and indiscriminant usage. To illustrate this point, four cases that arenot modeled but which connonly occur in the make up of a complete flight stress history will be discussed,Figure 37. First, the model cannot account for compressive loading and simply ignores all portions ofthe stress level that is less than zero. Compression has ,een reported to have a variable effect,depending upon the magnitude of the underload, the frequeacy of occurrence and the sequence of occurrence.Secondly, overload effects can be completely negative it the compressive load is applied following an overload.(Ref. 19). Thirdly, the retardation effect predicted by the model is immediately a rximum where as somematerials have exhibited so-called "delayed retardation" (Ref. 16). Fourthly, the nodel does not predicta difference between singlc and multiple overload as euperimentally observed by several investigators(Ref. 11 and 16).
8-7
It may be possible to use experimental results to "adjust" the range of effective stress and loadratio R in the model to account for the effects of compression, however, there is currently only a"limited amount of test data upon which to base such adjustments.
In using current delay models in design analysis, it is strongly urged that verification tests beperformed to validate the range of model applicability for the particular spectra being used. This isparticularly true for blocked type spectra where the occurrence of a few layers of load can profoundlyoverestimate the amount of retardation actually present. The use with spectra arbitrarily ordered inascending and descending fashion should also be avoided.
Conclusions
It has been shown that reasonable life predictions for craCk propagation can be made bing currentlyavailable methods if analysis and good engineering judgment, provided that there is an ambitious attevpt
2• to validate methodology prior to extending model usage beyon~d the range of applicability. The currentIi methods of accounting for delay are crude, to say the least, and considerable improvement is cerral-lywarranted. There are considerable rer'ereh programs currently underway to provide the necessary experi-mental data to assist in the developiaent and validation of improved models (Ref. 2). In other areas,sincere effort is lacking. These include:
a. Standardization of test and reporting methods for basic da/dn and environmental crack growth data.
b. Study of the effect of combined environment sad variable stress ampl!tude on crack growth.
c. The geometric and crack shape influences on crack propagation life (see Figure 4).
REFERENCES
1. Proposed USAF Damage Tolerance Requirements - August 1972
2. Wood, H.A., Trapp, W., "Research and Application Problems in Fracture of Materials and Structures inthe USAF," presented to the Symposium on Fracture and Fatigue, George Washington University, May 3-5,1972.
3. Wood, H.A., "The Analysis of Crack Propagation Under Aircraft Spectrum Loading," presentation toASTM Committee E-24, March 6, 1973, Williamsburg, VA.
1. Eagle, R.M., Jr., "CRACKS: A FORTRAN IV Digital Lomputer Program for Crack Propagation Analysis,"Air Force Flight Dynamics Laboratory TR-70-107, October 1970.
5. Willenborg, J.D., Eagle, R.M., Wood, H.A., "A Crack Crowth Retardation Model Using an EffectiveStress Concept," Air Force Flight Dynamics Laboratory, TM-FBR-71-1, January 1971.
6 Wheeler, O.E., "Spectrum Loading and Crack C owth," ASME paper No. 71-met x January 1972.
7. Paris, P., "The Growth of Cracks Due to Variation in Load," Ph.D. dissertation, Lehigh University,September 1962.
8. Katcher, M., "The Effect of R Factor and Crack Closure on Aluminum and Titanium Alloys," presentedat the Symposium on Fracture and Fatigue, George Washington University, May 3-5, 1972.
'. Hudson, C.M., "Effect of Stress Ratio on Fatigue Crack Growth in 7075-T6 and 2024-TI Aluminum AlloySpecimens," NASA TND 5390, August 1969.
1 0. Fitzgerald, R., and Wei, R., Lehigh University, presentation to ASTM E-24, March 5, 1973, Williamsburg,VA.
11. "Proceedings of the Air Force Conference on Fatigue and Fracture of Aircraft Structures and Materials,"Miami Beach, Florida, December 1969, AFFDL-TR-70-144.
12. Forman, R.C., Kearney, V.E., and Engle, R.M., "Numerical Ana'ysis of Crack Propagation in CyclicLoaded Structures," ASME Paper No. 66-WA/Met-4, 1967.
13. Wood, H.A., Engle, R.M., and Haglage, T.L., "The Analy.-is of Crack Propagation Under VariableE Amplitude Loading in Support of the F-Ill Recovery Prog-am," AFFDL TM-71-3-FBR, Air Force Flight
Dynamics Laboratory, December 1971.
14. Elber, W., "The Significance of Fatigue Crack Closure," presented to ASTM Committee E-9, Toronto,r Canada, June 1970.
15. "A Study of Crack Closure on Fatigue," T.T. Shih and R.P. Wel, Lehigh University, IFSM 72-5 NASAGrant. NGL 39-007-040.
16. "The Effect of Multiple Overloads on Fatigue Crack Propagation in 2024-T3 Aluminum Alloy," V.W.Trebules, R. Roberts, R.W. Hertzberg, presented at 6th National Fracture Symposium, Philadelphia, PA,August 1972.
17. Wood, R.A., Eagle, R.M., Bader, R.M., "Prediction of Spectrum Crack Growth for C-5A Wing LocationsUsing CRACKS and the Willenborg Retardation Model," AFFDL TM-72-3-PBR, November 1972.
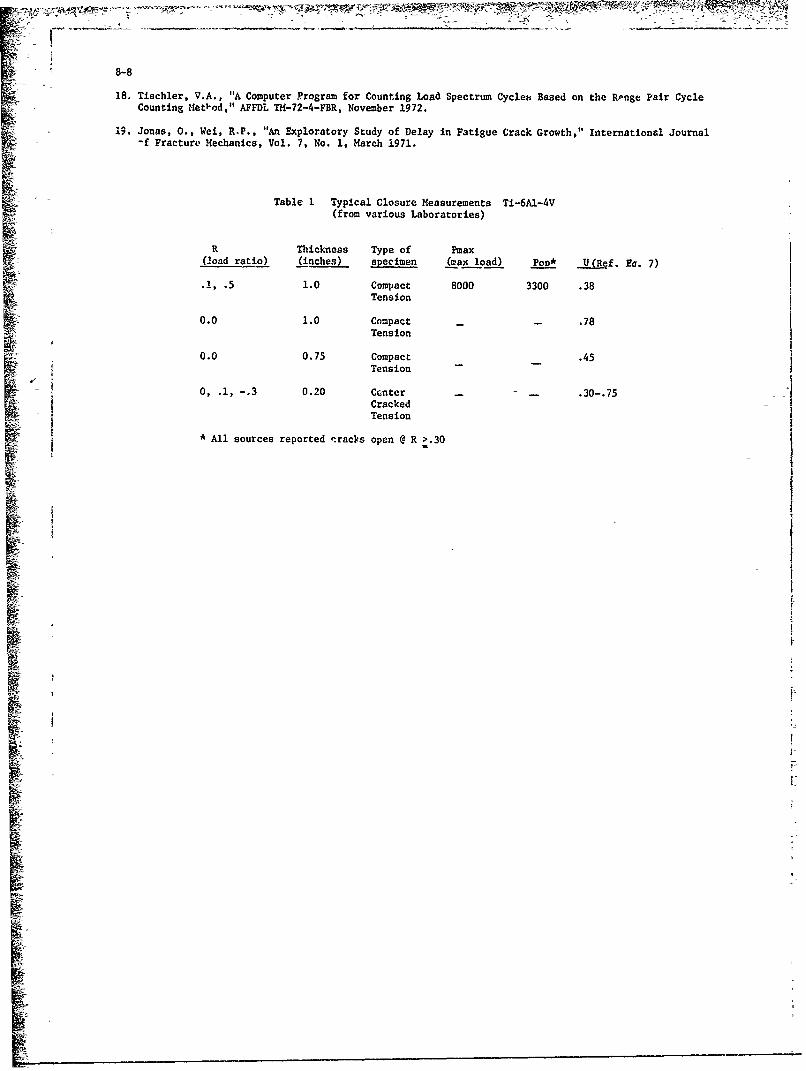
8-8
18. Tischler, V.A., "A Computer Program for Counting Load Spectrum Cyclezs Based on the Rpnge Pair CycleCounting Metl-od," AFFDL TM-72-4-FBR, November 1972.
19. Jonas, 0., Wei, R.P., "An Exploratory Study of Delay in Fatigue Crack Growth," International Journal-f Fracture Mechanics, Vol. 7, No. 1, March 1971.
Table 1 Typical Closure Measurements Ti-6Al-4V(from various Laboratories)
R Thickness Type of Paax(load ratio) (inches) seci-men •ax load) Poo* U-Ref. Fa. 7)
.1, .5 1.0 Compact 8000 3300 .38Tension
0.0 1.0 Compact - - .78Tension
0.0 0.75 Compact .45Tension -
0, .1, -. 3 0.20 Center .30-.75 ICracked !Tension
l* Al sources reported qracks open @ R >.30
Iii I
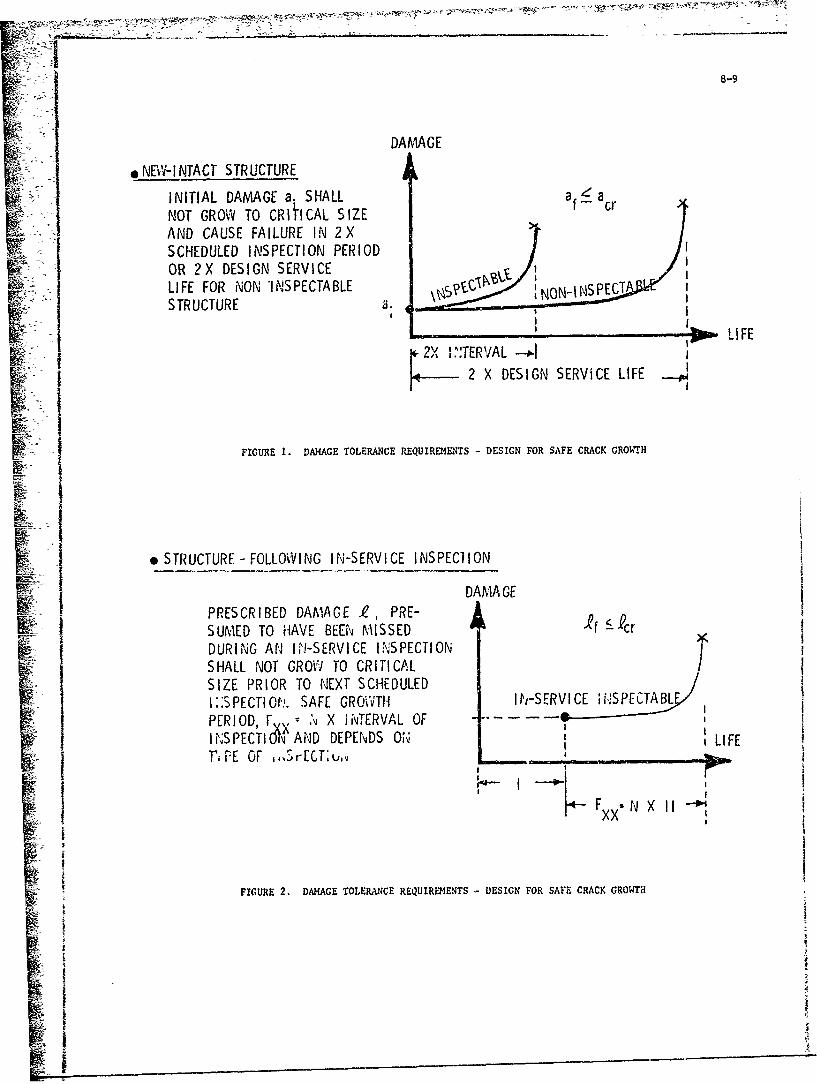
8-9
DAMAGE
o NEW-INTACT STRUCTURE
INITIAL DAMAGE a. SHALL aaNOT GROWv TO CRITICAL SIZE f cr
I SCHEDULED INSPECTION PERIODS..OR 2X DESIGN SERVICE
LIFE FOR NON INSPECTABLE SONcISPECTSTRUCTURE a.
. ,-- LIFE
2X .,TERVAL -- I2 X DESIGN SERVICE LIFE I
FIGURE 1. DAMAGE TOLERANCE REQUIREMENTS - DESIGN FOR SAFE CRACK GROWTH
- STRUCTURE - FOLLOWING IN-SERVICE INSPECOION
I DANA GEI PRESCRIBED DAMAGE e, PRE-
•- SUMED TO HAVE BEEN MISSED If A-cr
DURING AN IfN-SERVICE INSPECTIONSHALL NOT GRO'W TO CRITICALSIZE PRIOR TO NEXT SCHEDULEDI:. 2SPECTION,. SAFE GROWTH I i'-SERVICE i,!SPECTABL
PERIOD r ;, X I NTERVAL OFIN'SPECTI AND DEPENDS O•, LIFEST'PE OF ,,#rECTu,y____._,__ -_____-_
SI - ' - w -
FX N X IIXX
FIGURE 2. DAMAGE TOLERANCE REQUIREMENTS - DESIGN FOR SAFE CRACK GROWTH
!Ii-
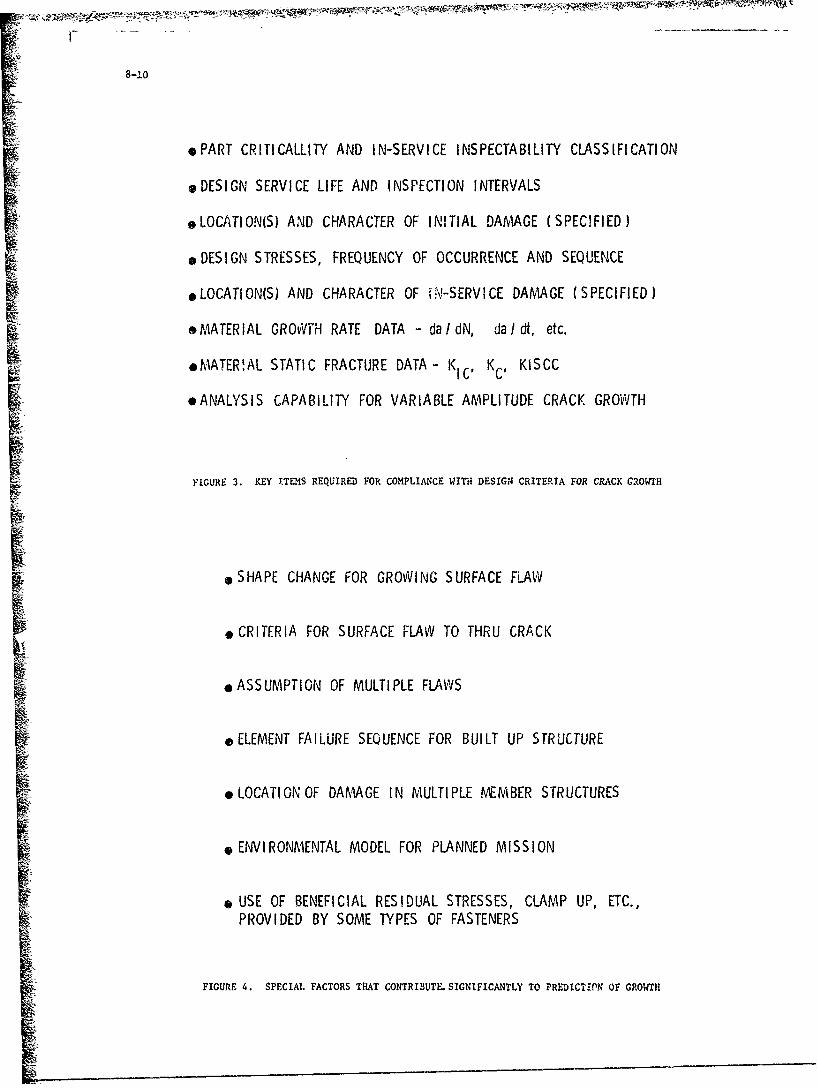
8-10
*PART CRITICALLITY AND IN-SERVICE INSPECTABILITY CLASSIFICATION
*DESIGN SERVICE LIFE AND INSPECTION INTERVALS
t , LOCATION(S) AND CHARACTER OF INITIAL DAMAGE (SPECIFIED)
*DESIGN STRESSES, FREQUENCY OF OCCURRENCE AND SEQUENCE
*LOCATION(S) AND CHARACTER OF 1N-SERVICE DAMAGE (SPECIFIED)
&MATERIAL GROWTH RATE DATA - daldN, da / dt, etc.
&MATER!AL STATIC FRACTURE DATA- KIC, K, KISCC
"*ANALYSIS CAPABILITY FOR VARIABLE AMPLITUDE CRACK GROWTH
FIGURE 3. KEY ITEMS REQUIRED FOR COMPLIANCE WITH DESIGN CRITERIA FOR CRACK GaOWTll
K
* SHAPE CHANGE FOR GROWING SURFACE FLAW
*CRITERIA FOR SURFACE FLAW TO THRU CRACK
*ASSUMPTION OF MULTIPLE FLAWS
-ELEMENT FAILURE SEQUENCE FOR BUILT UP STRUCTURE
eLOCATIONOF DAMAGE IN MULTIPLE MEMBER STRUCTURES
* ENVIRONMENTAL MODEL FOR PLANNED MISSION
o USE OF BENEFICIAL RESIDUAL STRESSES, CLAMP UP, ETC.,PROVIDED BY SOME TYPES OF FASTENERS
FIGURE 4. SPECIAL FACTORS THAT CONTRIBUTE SIGNIFICANTLY TO PREDICTI.PN OF GROWTH
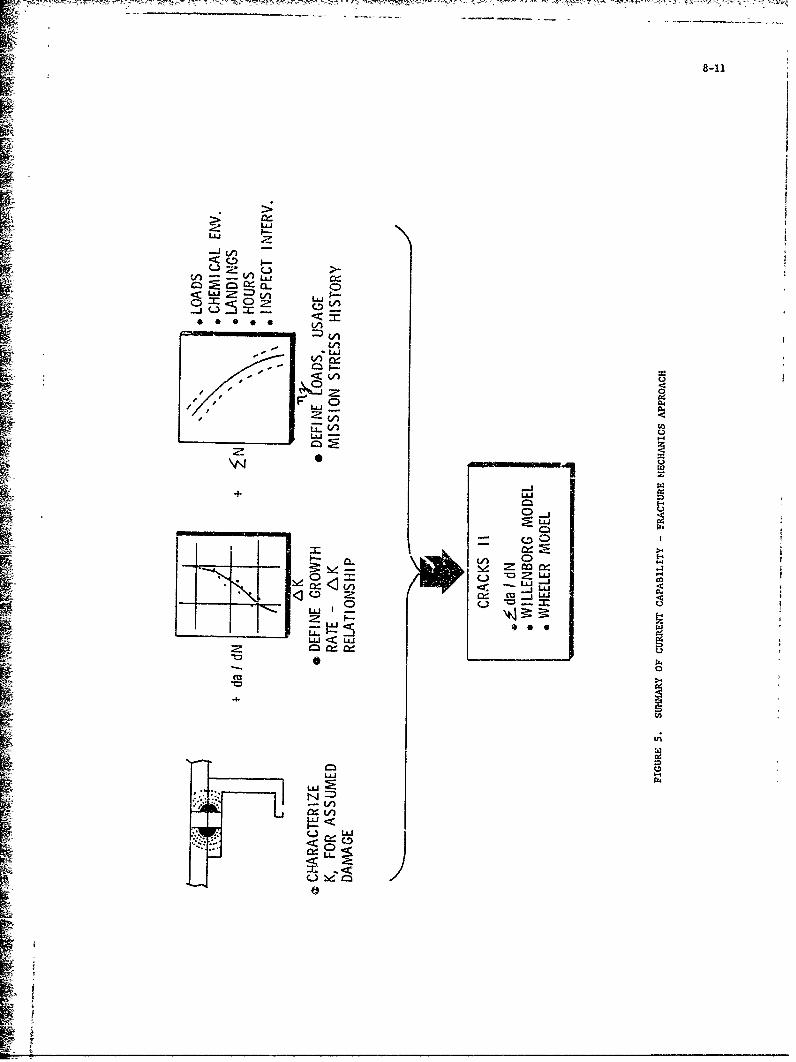
I L
nCe
UJLU
uI i
EDD
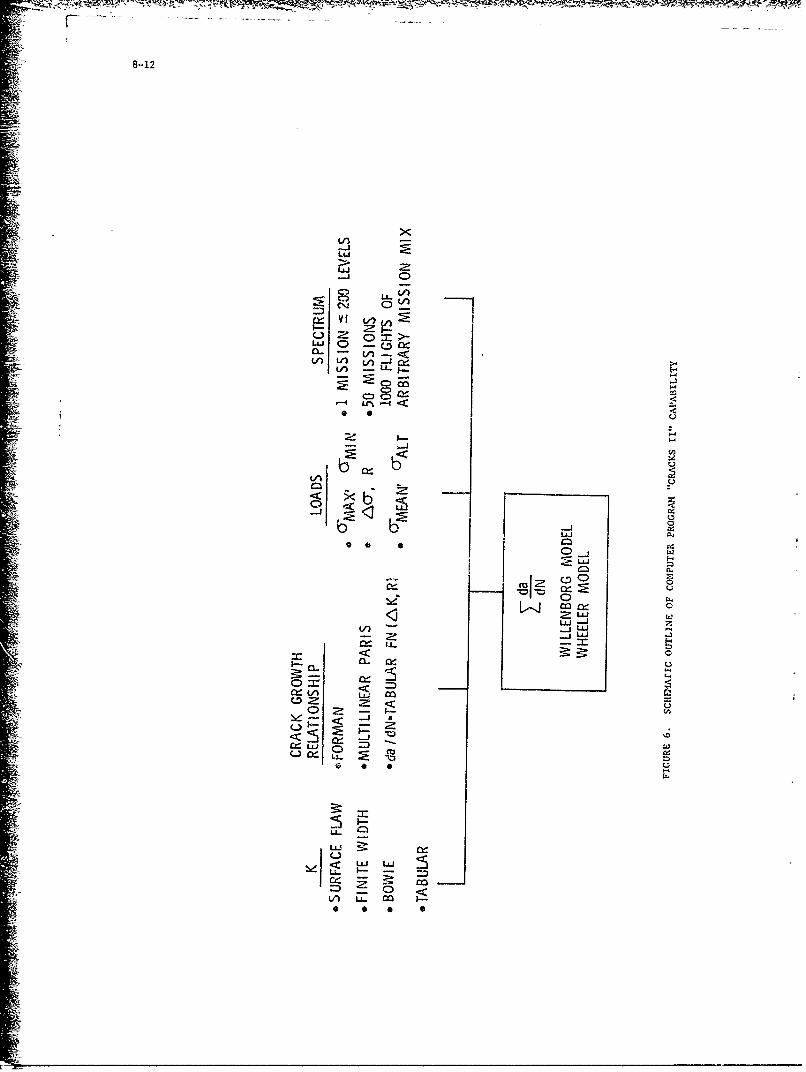
8-12
-JJ 0
- 1-
LL.4
0 0
Ln)
*0
-
I ~ZLU(A - .L&j
-~ jLLJ
< 0
0=Q::(A llý c
cg::LU. LL0 0 U
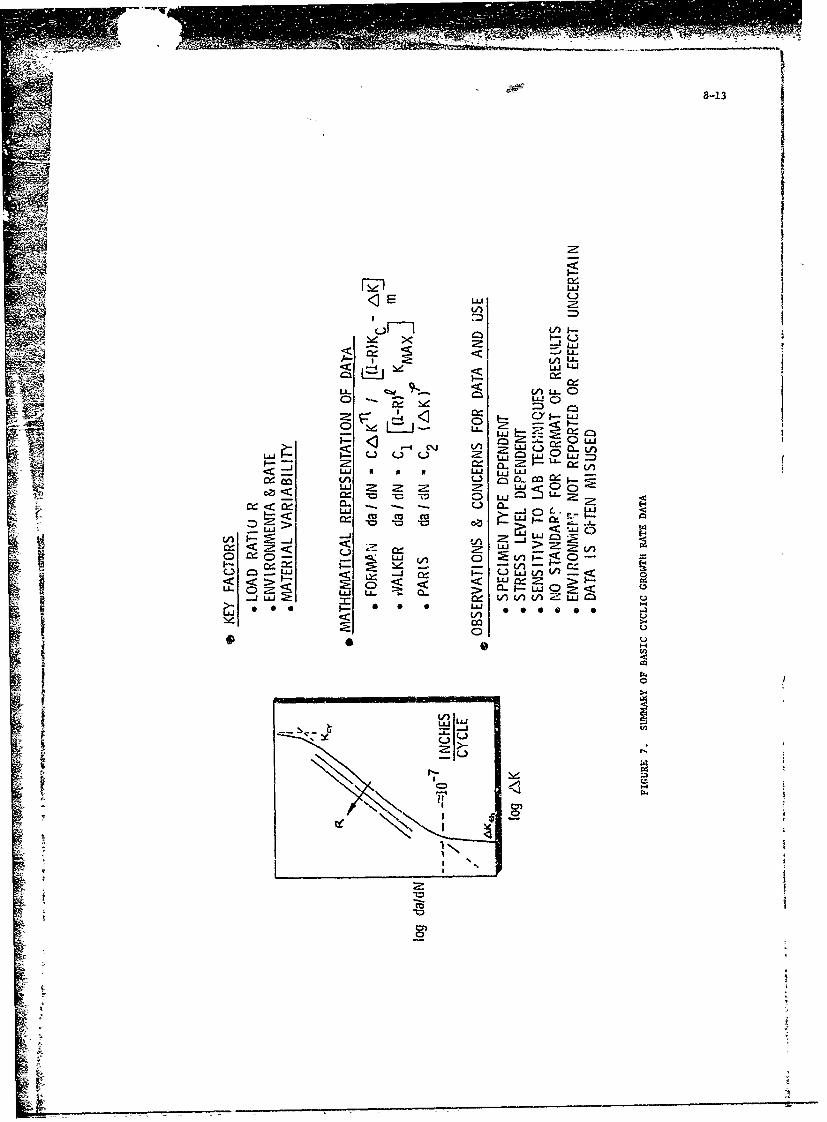
8-13
z
LiiU
< 1U. 1-
A =C.YI-
UJI Lii
CO t4 L.(:3ýc<a~ W z z Li .LLJ :0, u( Cl LL
LLJZ -
t- <ii m cLi LZ. > -- uj
LU < M&J
II - -S*Z > z 4
<~ < LJVUN L
t.- P7-Z3_V'_,__V__
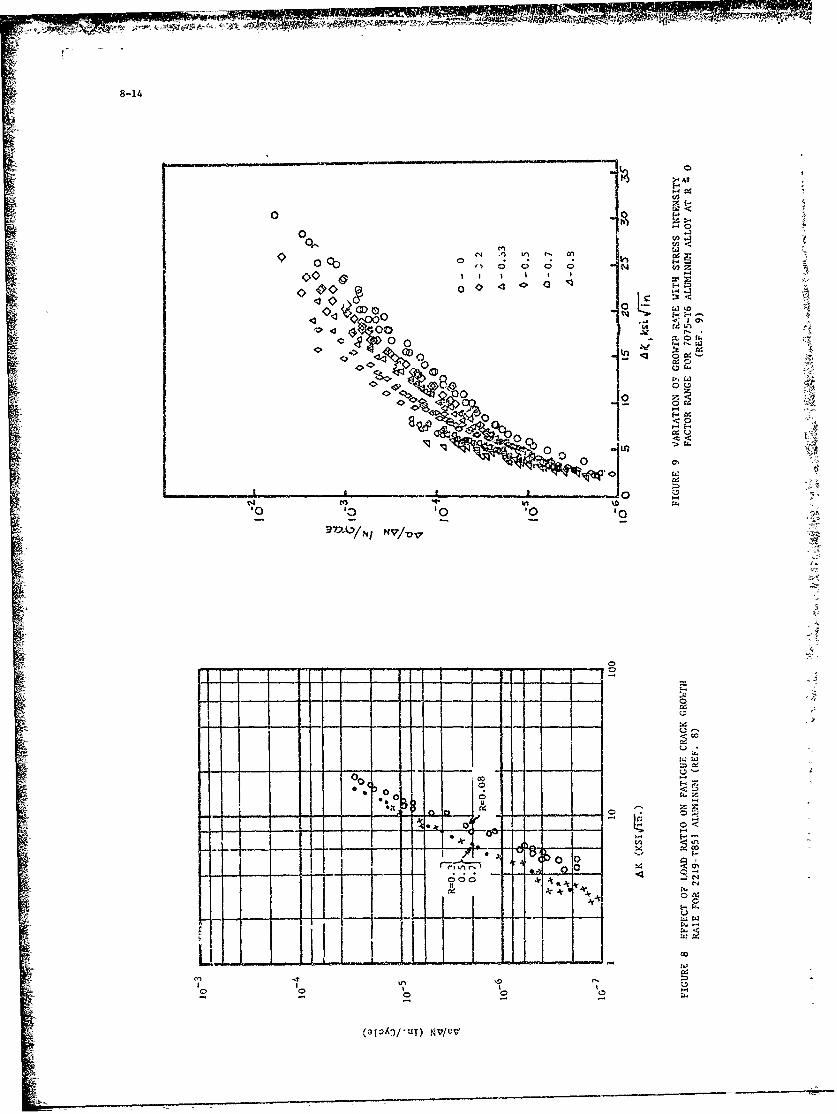
8-14
~ANto
0
0.
'0 0
0 0so
0
'0 to 10 to
00
AA' - I:ý
100
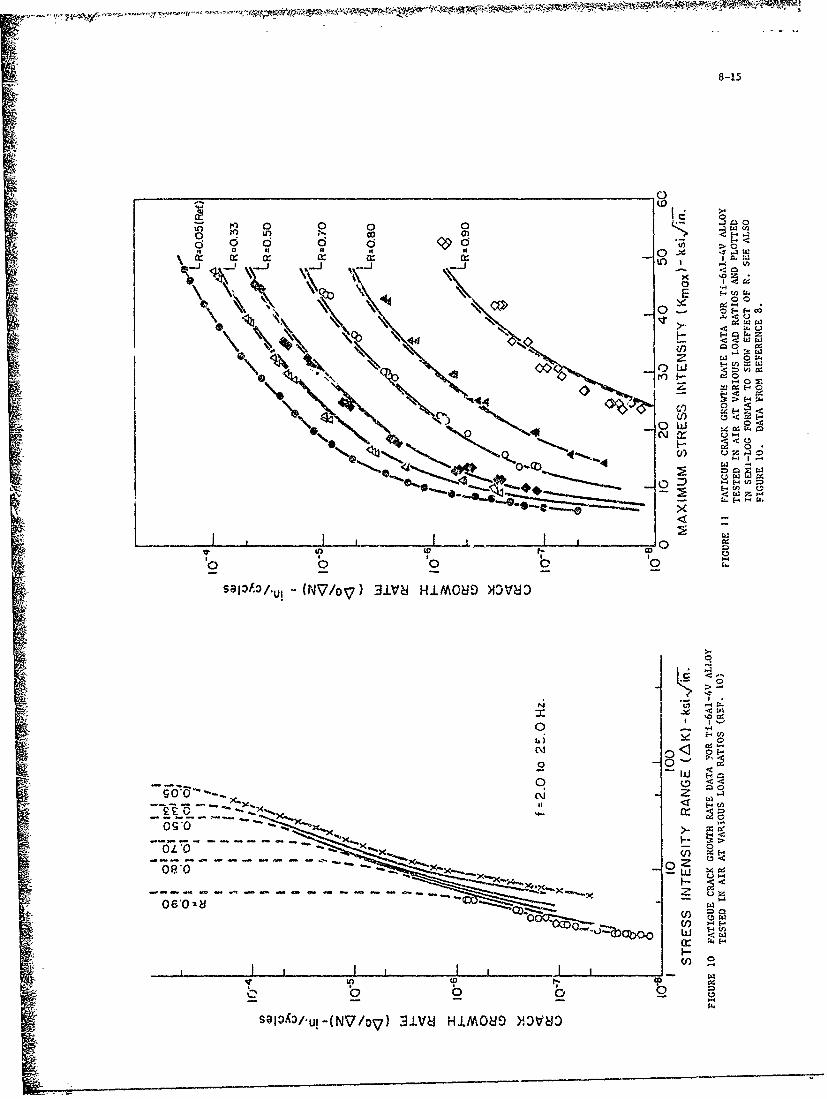
8-15
-2Q
ul co aQ 0 0 0 0 O>0
to 1 0I . ILI
iC a u) wWo0
X 11X E *i~u'4
~E
\Q_0 <4.AL0a
c'Jtz
c4 - 4
M5 11
'f. on~4-._0
w <-
00
6ý z
---
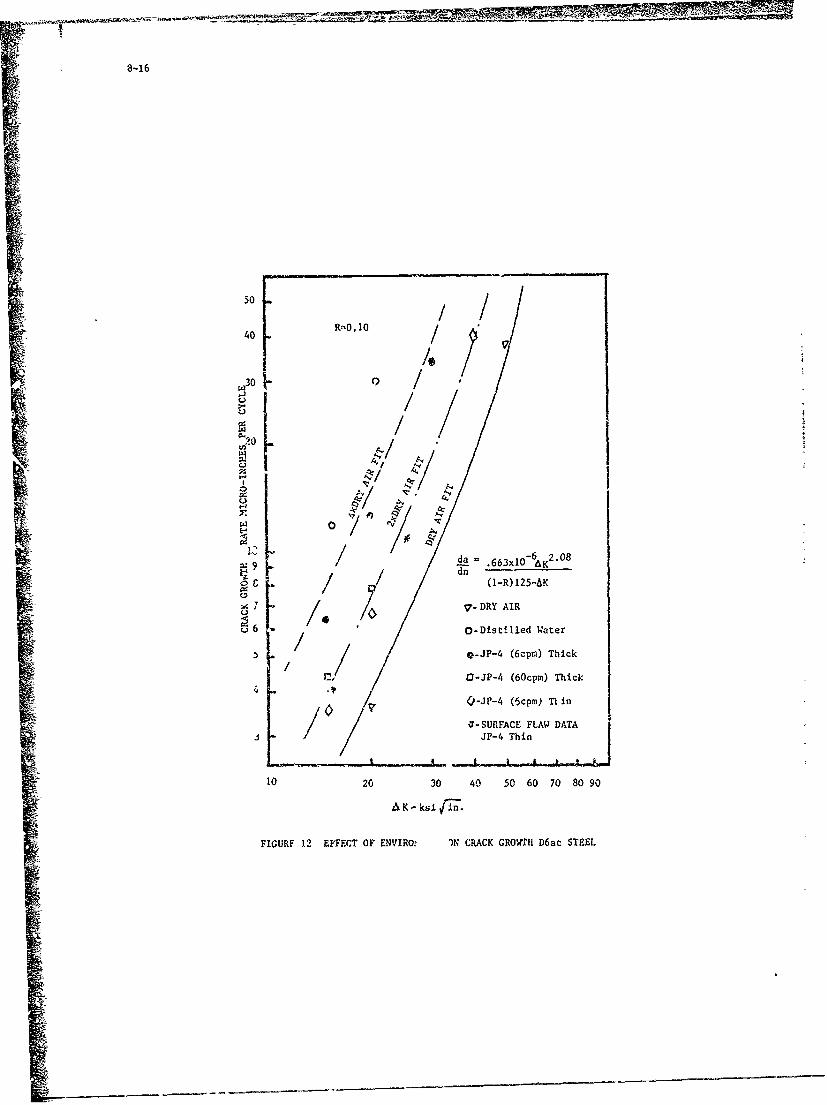
B-16
so-40 R-',1O 10/
.1
~ 3 Oj 00
da. -620/&Id /IR15A
7 DR I
6 O-istiled ate
0-P- (6pm Thc
/-P- (6c-R) T25-
/ *-~~JP-4 Thipn)hc
10 20 30 40 50 60 70 80 90
AK"- ksi [Th.-
FIGURF 12 EFFECT OF ENVIROr IN CRACK GR0~tHl DMac STEEL
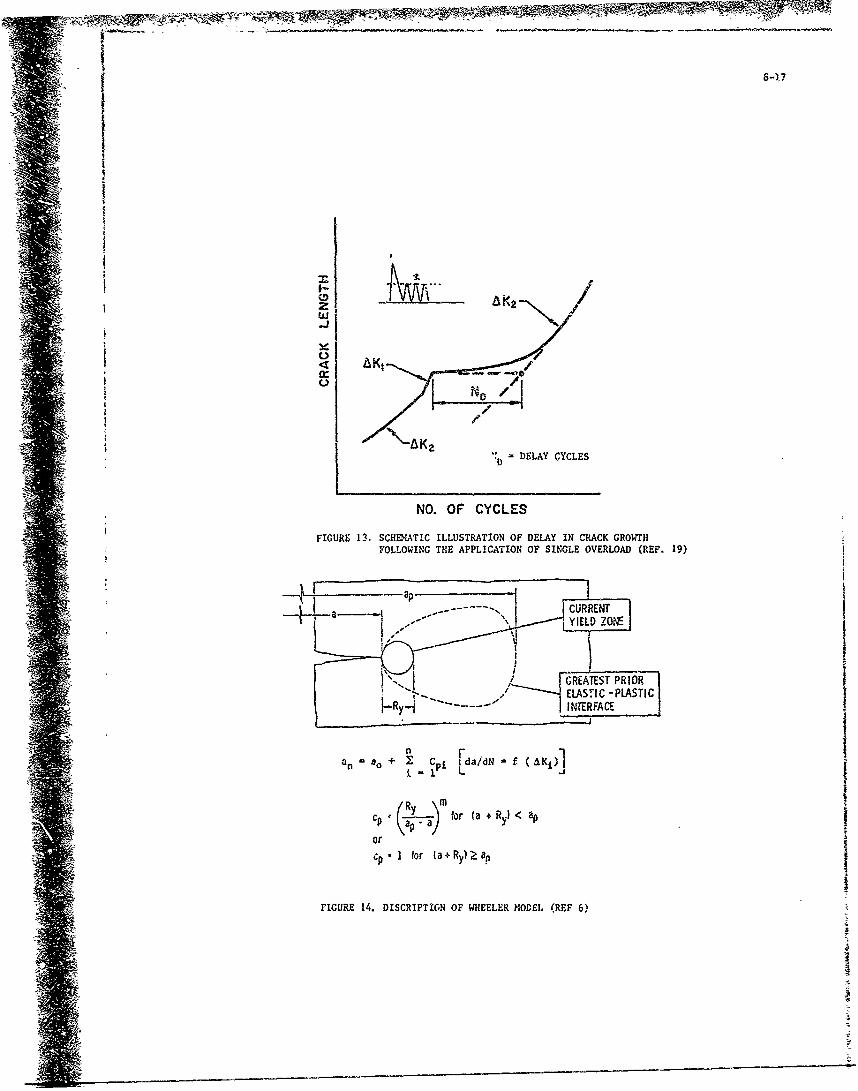
!* I 8-4.7
U) 2
< KI
""D DELAY CYCLES
NO. OF CYCLES
FIGURE 13. SCI•ILATIC ILLUSTRATION OF DELAY IN CRACK GROWTHFOLLOWING THE APPLICATION OF SINGLE OVERLOAD (REF. 19)
I -'
UELASZONE-PLSI
GREATEST PRIOR| ! "L / "'"'--•ELASTIC - PLASTIC
n r"" -- o + Cpj ida/dN h
LI
cp tfamfor (a + Ry)<
or
Cp, 1 for (a+Ry)-aan
FIGURE 14. DISCRIPTIGN OF WHEELER MODEL (REF 6)
I
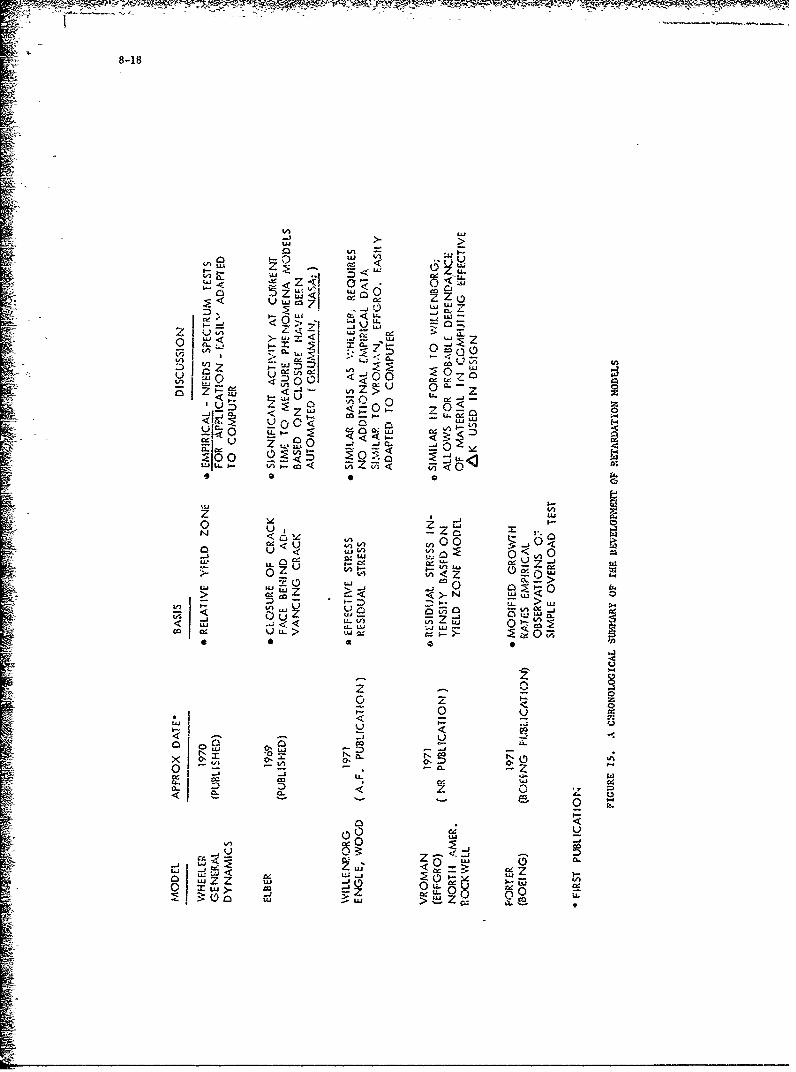
LiW-JnU4J
z 0
Z ui ! r ZULLU< -
U,
Vn CL.JJ w ~ -o.
4 0 0 -Z
LLLi
0 Z LiI--S
tz Vj o~< ( 0u-j 0za:LJV
wIAJu > .j
Lo Z I-J
.1 J -j 0 ujc-f-J W -Ls-
_o _r -.u 0:
-j-
< .0
60 LUU,< 0
w j C.4: cc Zo iaLa < c U - L
0 jZZ w -j 2LL 8 )o U3: 0 ULu
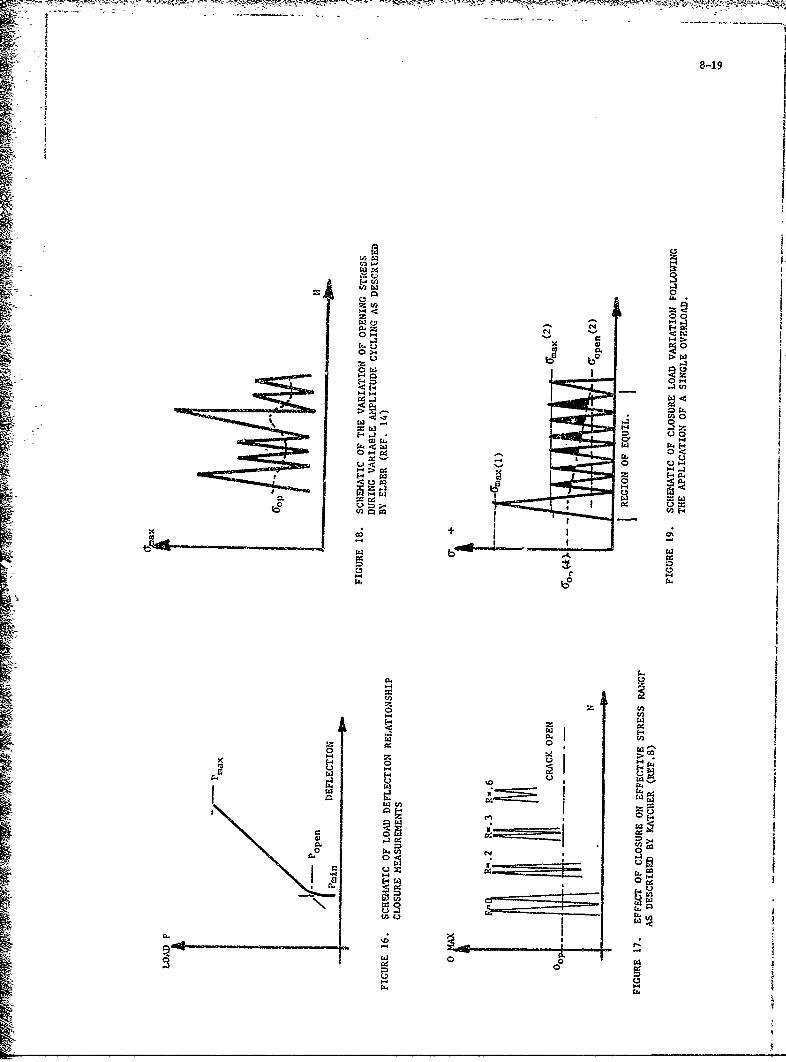
8-1
00
0~
0 w
zt 00
Hd 0
= U .2 zE4j 00
0sm<H 4
0~ 0C-
0 Cd 0
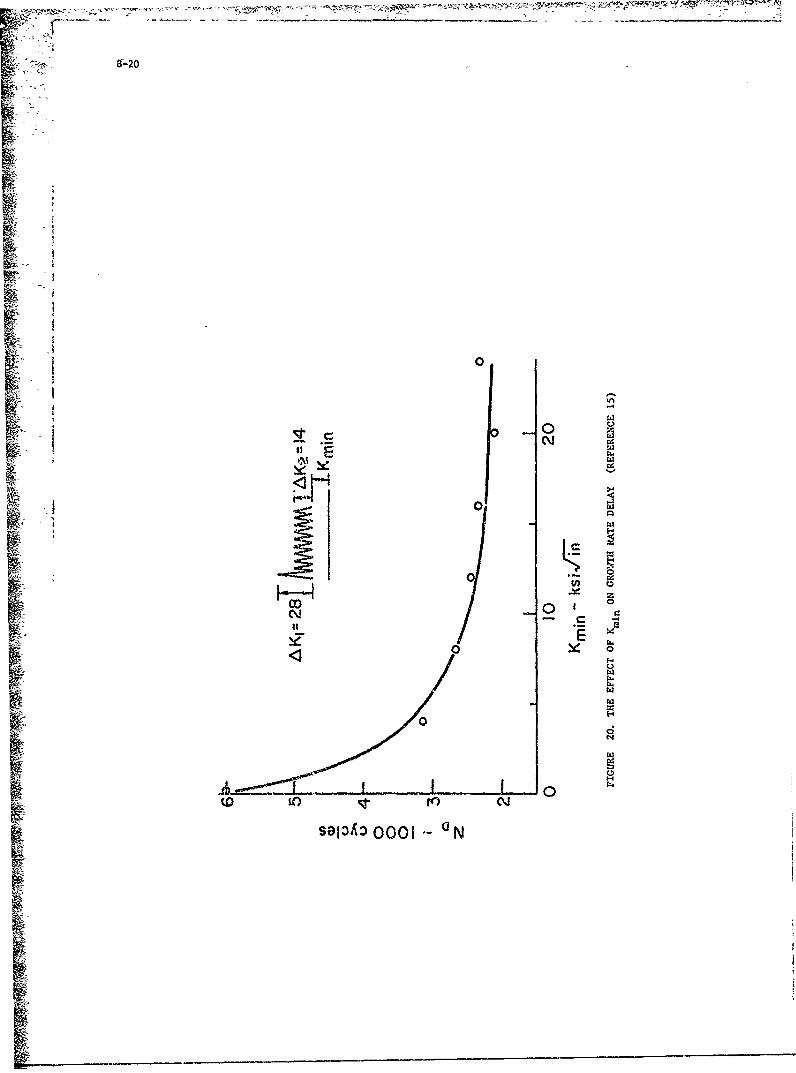
8--20
RIn
41
t 1 0
It
00
l 10 0l
S83300
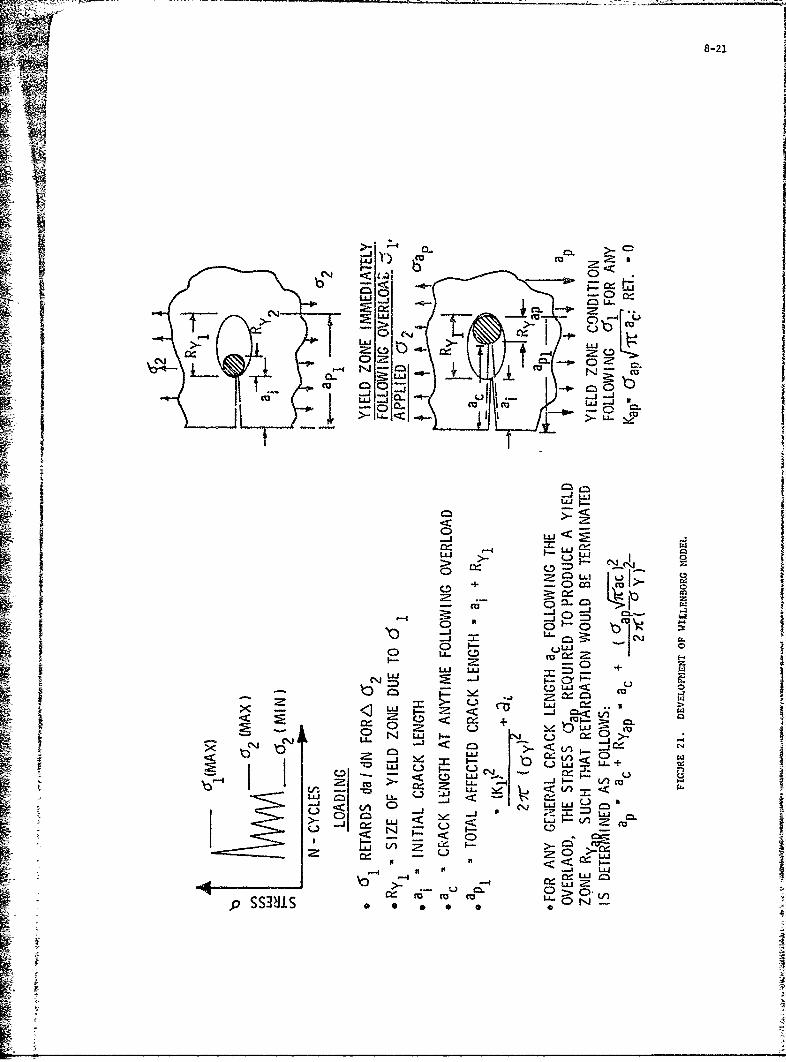
8-21
-UL
LU => -)b
1= 0 I-
-U <
U(j~
-o-
U..
0 Id-'J cL&I
pSS3~I.L L, _
**
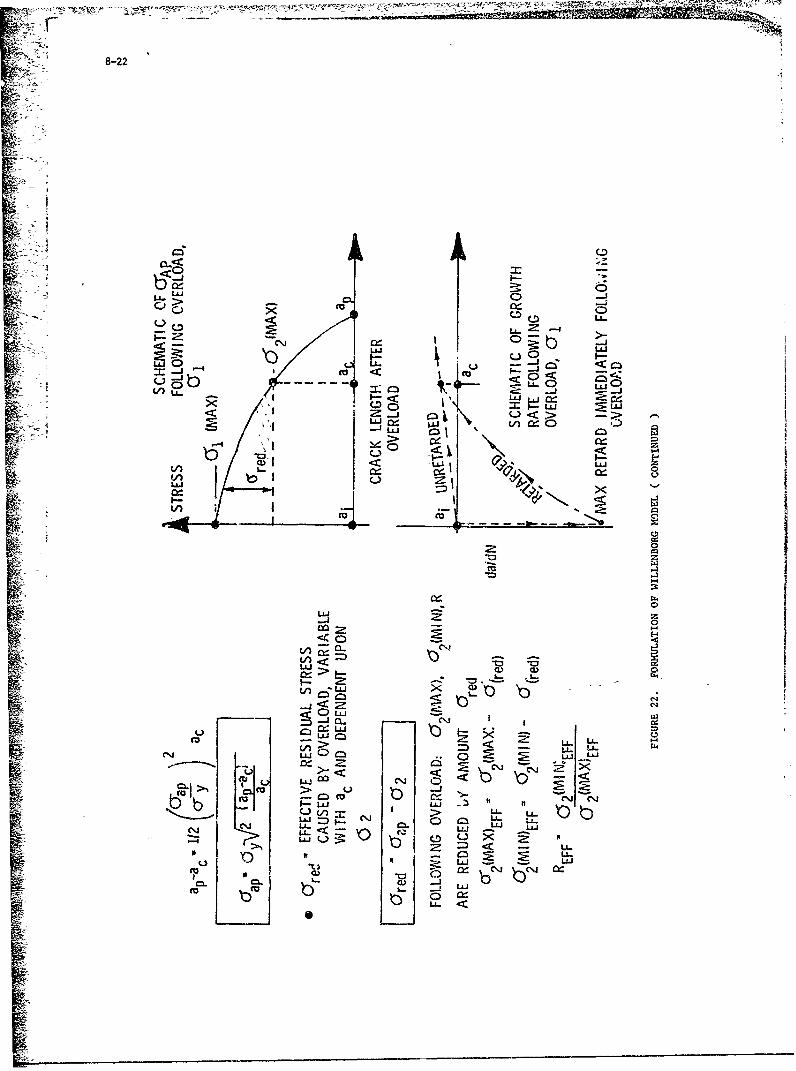
~~T
8-22
0 -
'0~ 0 i t
LAuJ4: CS,
_j cc < 0U- Il
I --
4ma
-JD~ JILz4:2
~LL_A
m0 '
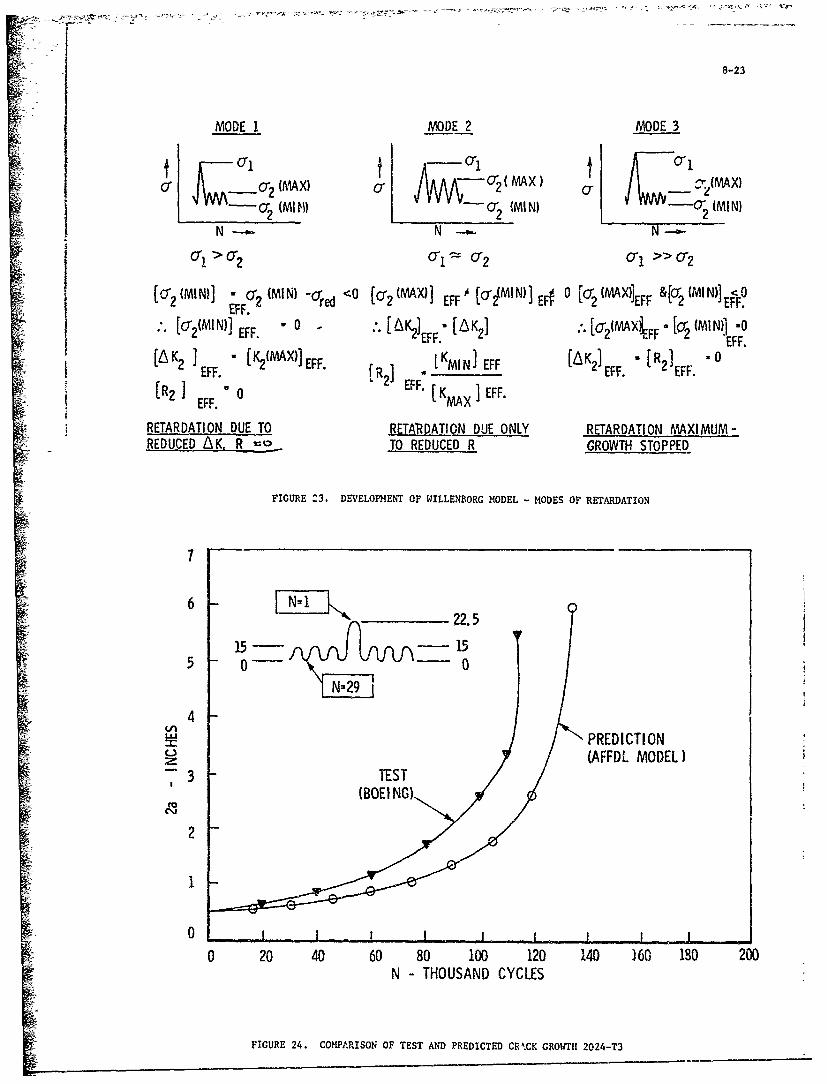
8-23
MODE I MODE 2 MODE 3
-- (MAX) - -2(MAX e (MAX)Sc .... 0-2 (MlN) L(MIN)
o2(Ml t) 2 "a"'2
N--- N -,- ' --,l 0
'a2(MIN)] -a-,2 (MIN) -Gr <0 (MAX)] EFF [cr2MIN)] [c§ (MAX)]EFF &(02 (MI N)]EFF
[O2(IN)l EFF. - 0 [K2FF.- [AK 2i '[2(MAXkFF- [a2 (MIN)I -0S[K2 ] N2 EFF [KFF 2 [OEFF.
AK 2 3 [K 2 (AX))]EFF. A [R . 0EFF. F [R [ KMN IEFF 2) EFF. 2 EFF.
[ EFF. 2 I
RETARDATION DUE TO RETARDATION DUE ONLY RETARDATION MAXIMUM-REDUCED AK. R ,_ TO REDUCED R GROWTH STOPPED
FIGURE 23. DEVELOPMENT OF WILLENBORG MODEL - MODES OF RETARDATION
7-
6N122.5
150- 155 0- 0
N=29
4
PREDICTION(AFFDL MODEL)
3 "TEST(BOEING)
2
1
0 J
0 20 40 60 80 100 120 140 160 180 200N - THOUSAND CYCLES
FIGURE 24. COMPARISON OF TEST AND PREDICTED CR.CK GROWTH 2024-T3
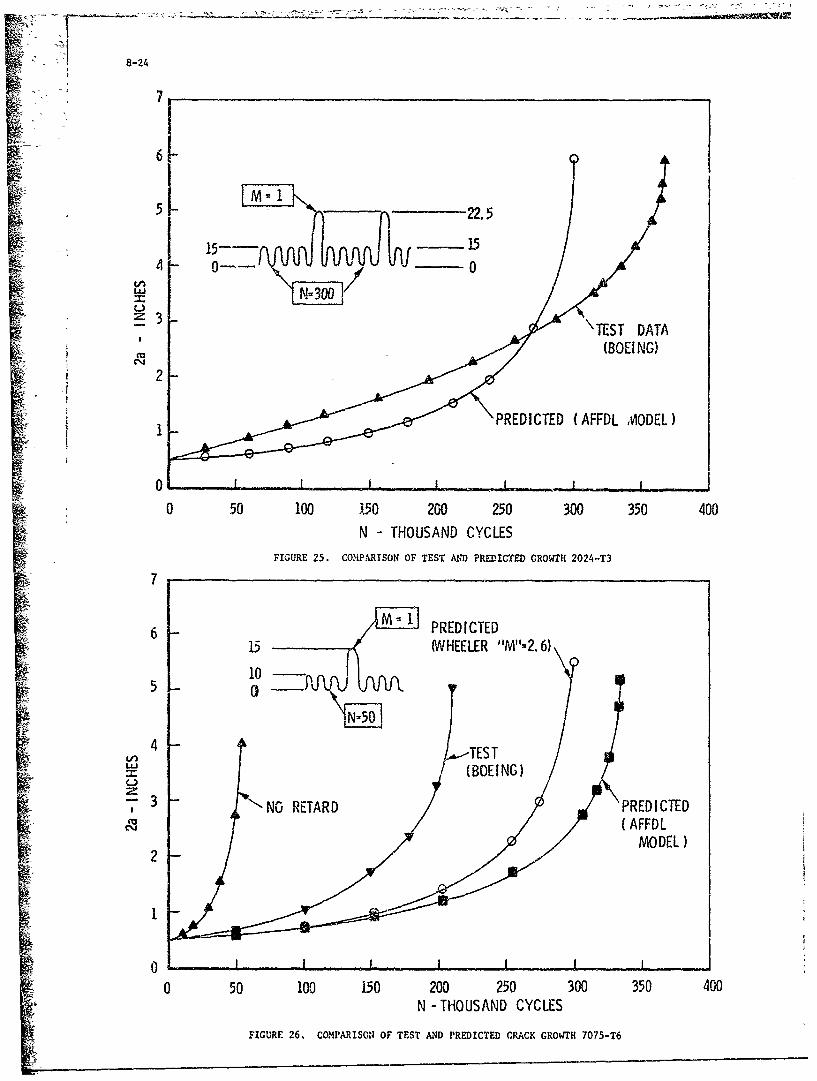
8-24
7,
6
5 -22.0
15- - 14 0-- 0
N-300w
3 -TEST DATA
(BOEING)
2
PREDICTED (AFFDL MODEL1
0 50 100 150 200 250 300 350 400N - THOUSAND CYCLES
FIGURE 25. COMPARISON OF TEST AND PREDICTED GROWTH 2024-T3
7
6 m 1 PRED ICTED15 (WHEELER "M"-2. 6)
10-
5 0N-540M
k 4 - !TEST"(BOEING)
" 3 -NO RETARD PREDICTED(AFFDL
MODEL)2
1
0 50 100 150 200 250 300 350 400N -THOUSAND CYCLES
FIGURE 26. COMPARISON OF TEST AND PREDICTED CRACK GROWTH 7075-T6
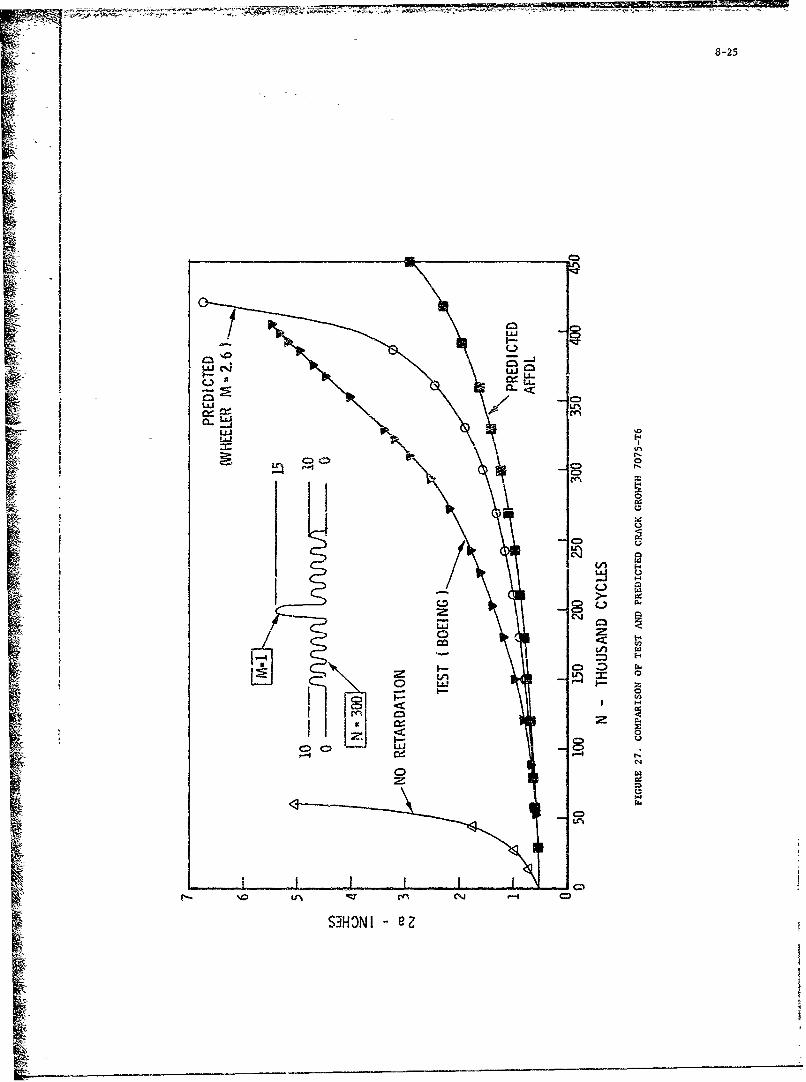
1 8-25
ILLLJ C~ Lu i
iU
'1Lt.<
LLJ
I UJ
LU z0<
- 0)
I- CI
LrN CD
S3H ONI e eZ
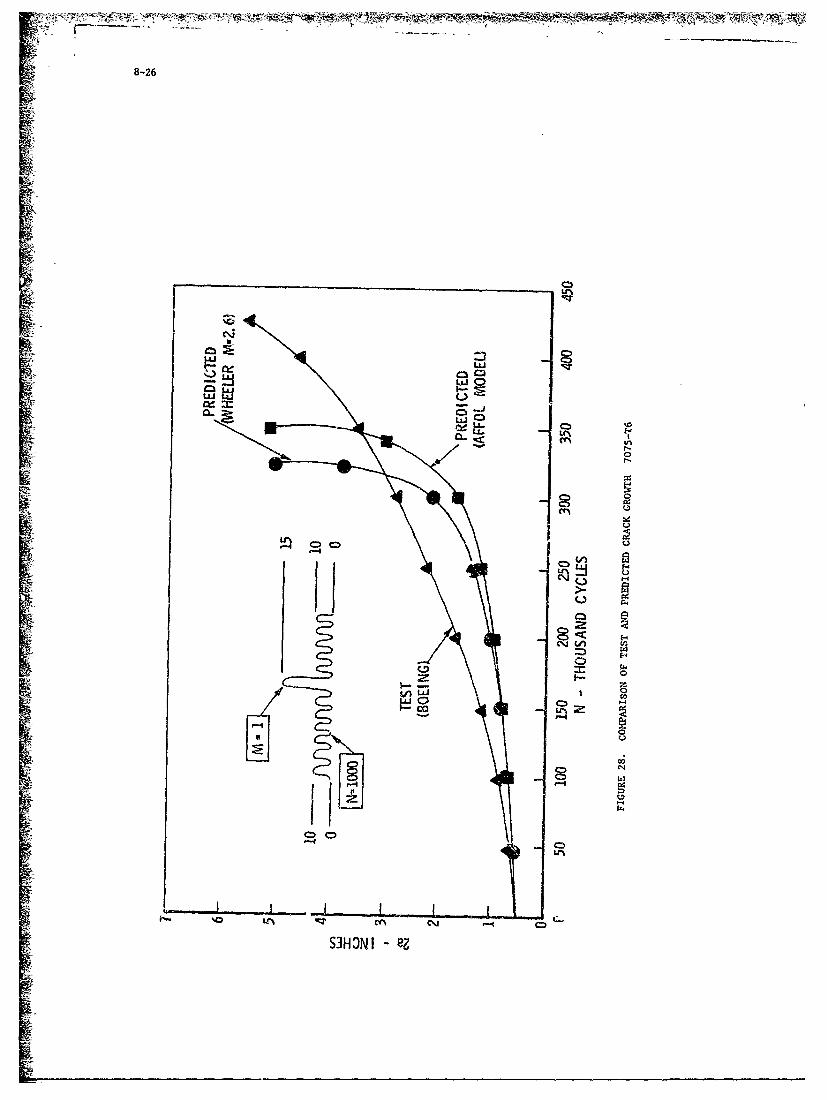
* _ ~ _WWI
8-26
cli
CL..
tnQ
I-It: C- CU
S3HONI - 0
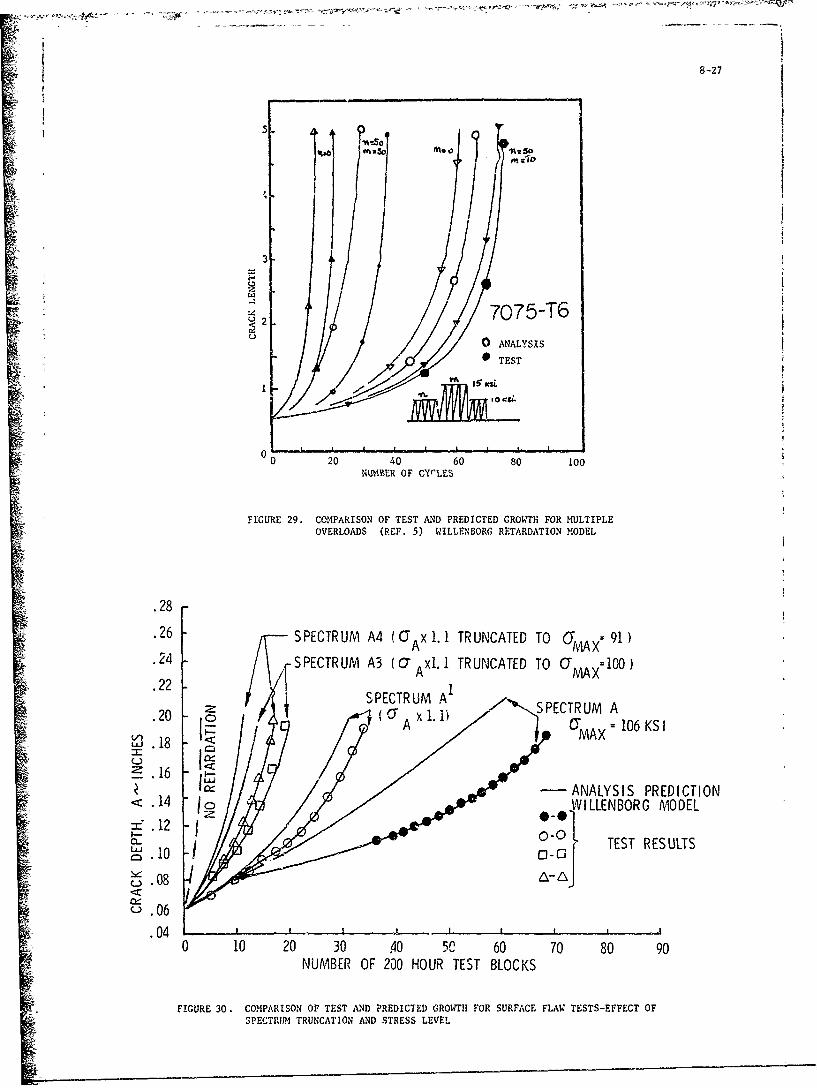
8B-27
~~.O~ TEST0 ~5
IS K
t mtiDmm
!0
.282
.22 _ SPECTRUM A I S, ECRM,.200 x 1ALS)
VMA
NUIQBER OF CYCLES
FIGURE 29. COPARISON OF TEST AND PREDICTED GROWT - N FOR MULTIPLEOVERLOADS (REF. 5) WILLENBORG RETARDATION MODEL
.28,•.26 -SPECTRUM A4 (OAI lI TRUNCATED TO OMAX 91)
.242 / IPCTRUMSEC uA3 (O" A xl. 1A TRUNCATED TO 'AX 400 )
.20 SPETRU Al li /'- SPECTRUM A•£ ,Vl .8 •A A = 106KS I
•+ ",- - AINALYSIS PREDICTION
. 106
0 10 20 30 .40 50 60 70 80 90NUMBER OF 200 HOUR TEST BLOCKS
FIGURE 30. COMPARISON OF TEST AND PREDICTED GROWTH FOR SURFACE FLAW TESTS-EFFECT OFSPECTRNUM TRUNCATION AND STRESS LEVEL
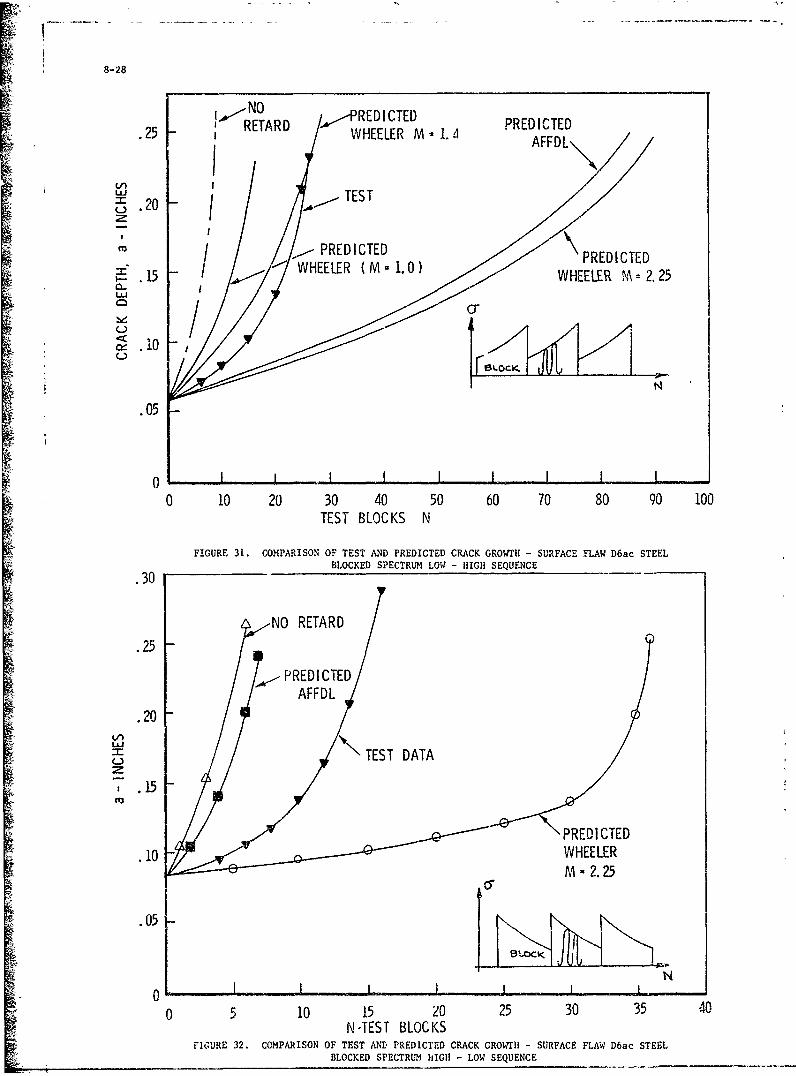
8-28
RETARD REDICTED PREDICED.25 WHEELER M 1. 4 PRE DI TS"I AFFDL
c.,.20 ~...TEST
SPREDICTED PREDICTED-•WHEELER (M-.)PRDCE
-..1.5 WHE R MWHEELER M ;2.25Lu.
.05
0 , I I I0 10 20 30 40 50 60 70 80 90 100
TEST BLOCKS N
FIGURE 31. COMPARISON OF TEST AND PREDICTED CRACK GROWTH - SURFACE FLAW D6ac STEELBLOCKED SPECTRUM LOW - HIGH SEQUENCE.30
ý-NO RETARD
.25
PREDICTED
AFFDL
.20
-'- TEST DATA
,.15
PREDICTED.10 WHEELER
All- 2. 25
.05
4-
0 I I • . _I, I I
0 5 10 15 20 25 30 35 40N-TEST BLOCKS
FICURE 32. COMPARISON OF TEST AND, PREDICTED CRACK GROWTH - SURFACE FLAW D6ac STEELBLOCKED SPECTRUM HIGHI - LOW SEQUENCE
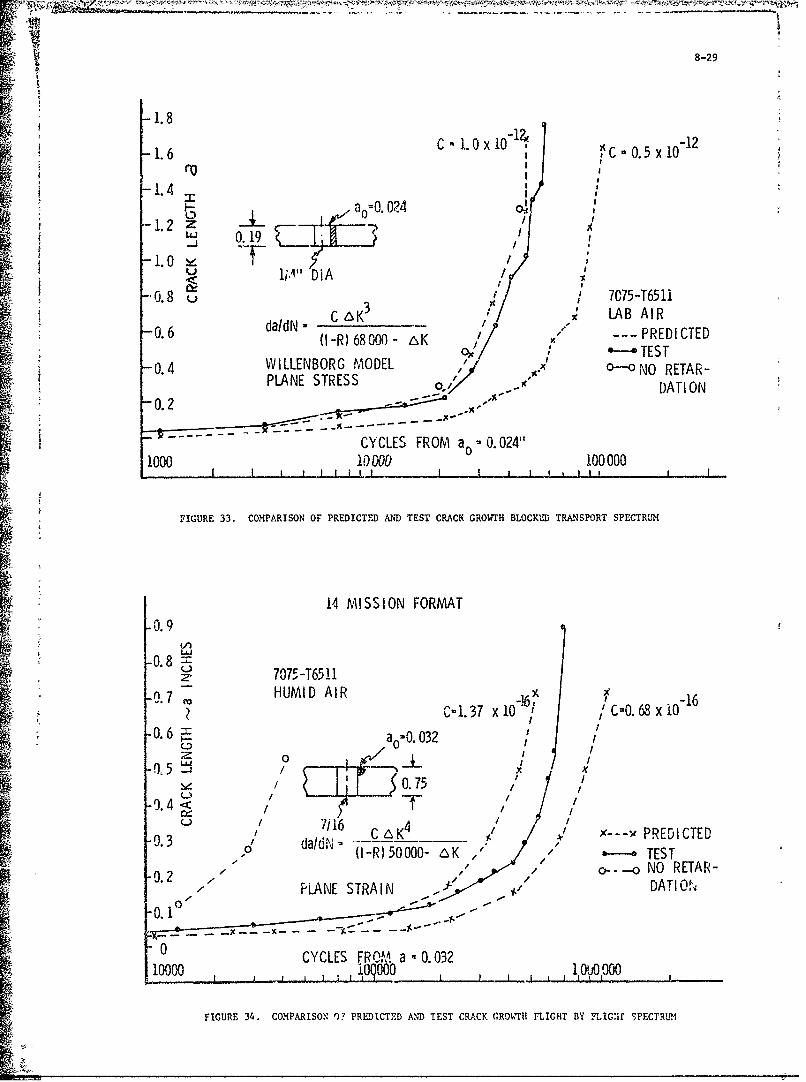
8-29
-1.8
C 10 x 10"I2S- 1.6 C -.C 0. 5 x 10⁻²
1.40; 004
i -1.2 Z
L J 0 19I -Lo /
-0.8 u 7075-T6511C 6K -LAB AIR-0. 6 ~daldN -,
-. .... PREDI CTED
-04WILLENBORG MODEL 0-,NOREAR"(I-R)08004-AK o---PNOREDITED-
PLANE STRESS ORETAR: ~ ~-0. 2 ""DAIO
-CYCLES FROM a.= 0.024'
1000 100 100000I I I t I I l I,• t
FIGURE 33. COMPARISON OF PREDICTED AND TEST CRACK GROWTH BLOCKID TRANSPORT SPECTRUM
14 MISSION FORMAT
-0.9
-0.87075-T6511
0.7 HUMID AIR-. 7-16, -16
C-1.37 x10 ,/C-0. 68 x 10
-0.6-- aoO. 0320/-0°5 I
I ~0.75 ,
-9.4 / T"-0.3 76C•. - - V x---x PREDICTED
0". . (I-R) 50000- AK 7 / /," • TESTo---o NO RETAR-
PLANE STRAIN . DATIO 1
0.0~~~CYCLES FROM• 0. 032
10 ,oqooo 0ioo00o
FIGURE 34. COMPARISON W PREDICTED AND TEST CRACK CROWTU FLIGHT BY FLIG:ir SPECTRUM
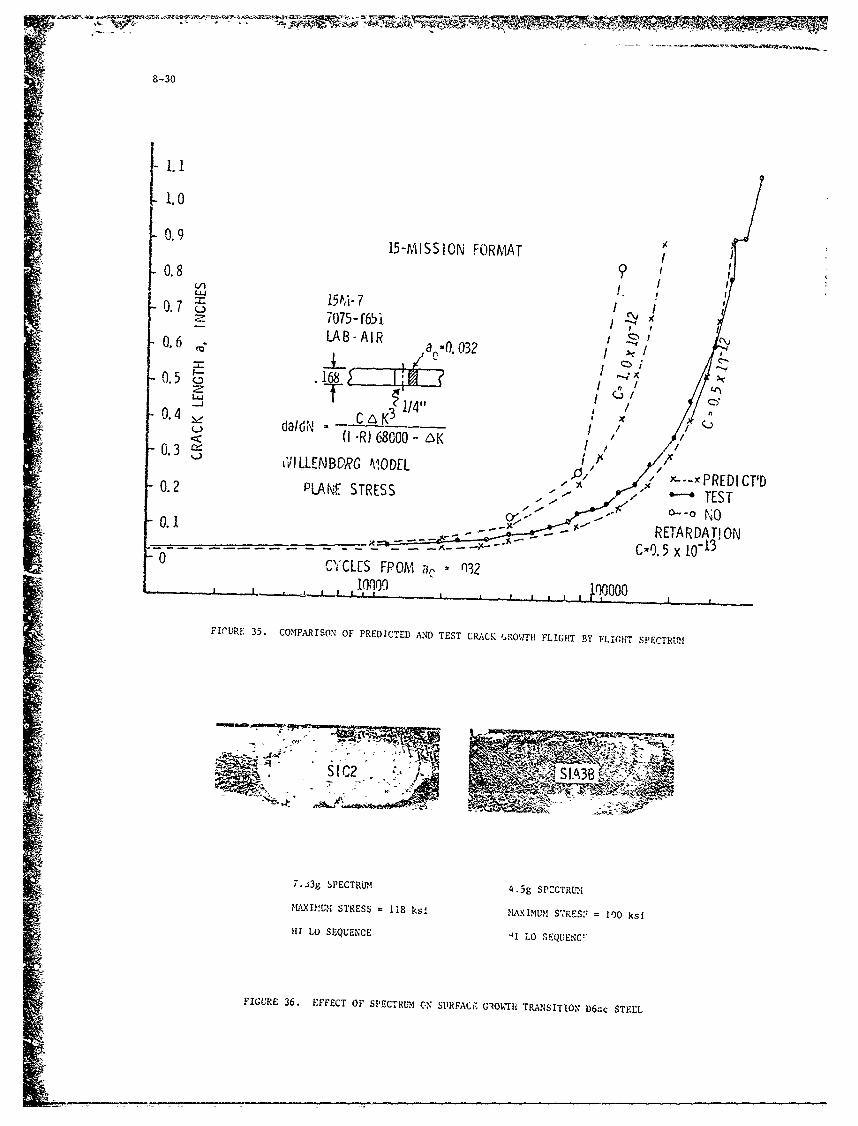
M9
8-30
0I.9
0.80. 151ki - 7i "
0.57 8 .
T/0.2 P"LANE-STRES a-- 3 1- ' ES
0.-4
da/ d'.. NRED CT\,0.31 'P i'd' LLENBORG MODEL I v•X
pl A•.• c~o~ • , x J -- PREDI CTID0 .2 P LA N E S T R ES S X.• , / " • • T S
•0.1 R _•- • ETA RDA T!ON
0.. •' - C -0. .5 x 10 -13 '0 -- CYCLES FPOMI a, 032
FIrURE 35. COMPARISON OF PREDICTED AND TEST CRACK fROWIt! FL!tIT BY FLIGHfT SPECTRU.M
SlC2 - !~ S IA3B AMR,
7.43g SPECTRUM 4.5g SPZCTRL-,-
AXIMUM STRESS , 118 ksi MAXIMUM STRES, 1= 00 ksl
III LO SEQUENCE 41 LO ,EQUEgC"l
FIGURE 36. EFFECT OF St1ECTRUM ON SURFACE GIOW1tH TRANSITION D6ac STEEL
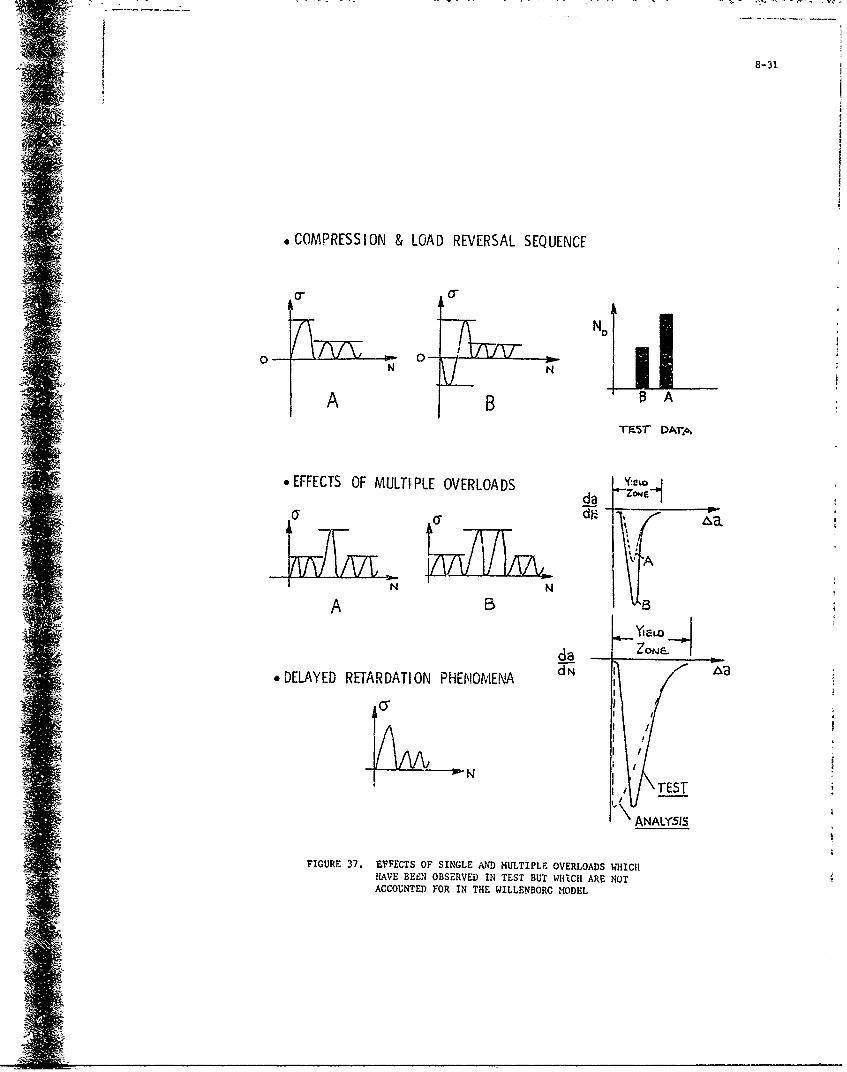
8-31
*COMPRESSION & LOAD REVERSAL SEQUENCE
o- 0 "
c AAND LI
0- 0-N N
A B 0T7-57 DArp^
*EFFECTS OF MULTI PLE OVERLOADS
da Zow"-__ --
,DELAYED RETARDATION PHENOMENA ,•:
• I 'I" -
S~ANALYSIS
S~FIGURE 37. EFFECTS OF SINGLE AND MULTIPLE OVERLOADS WHICHHAVE BEI£N OBSERVED IN TEST BUT WH!CH ARE NOTS~ACCOUNTED FOR IN THE WILLENBORG MODEL
it 1
9-1
THE R.Ae.S. - ESDU CUMULATIVE DA4AGE HYPOTHESIS
J.A.B. L.MBERT
Hawker Siddeley Aviation Limited,Hatfield, Herts.
United Kingdom.
SUMMARY
In spite of its ]lmitations, the very simple Palmgren-Miner cumulative damage hypothesis(otherwise known as Miner's Rule) continues to be widely accepted throughout all aircraft designoffices, Fatigun life estimates, based solely on Miner's Rule, are often inaccurate becaus :heyneglect a major source of error; that Is, the rodistribution of stresses that occurs when the partyields at a stress concentration.
The Engineering Sciences Data Unit (ESDU) in London, in conjunction with the RoyalAeronautical Society, has recently published a Data Itpj which presents a simple method for taking thislocalised yielding into account. The method involves estimating the change in the actual mean stressof subsequent stress cycles after yielding has occurred.
The lecture is devoted to making a presentation of this Data Item, and illustrating the applica-tion of it by working through two examples. Wdhilst the method certainly improves the life estimatesin applications when MW ,r's Rule would have badly under-estimated the life, there is a tendency to"over-correct" the Mi' a Rule estimate in many of the examples studied. A proposal for a. simplemodification to the ES.. method is presented, which reduces this over-correction.
LIST OF SYMBOLS
D damt, ge done by first programme
° Dp2 damage done by each subsequent programme
E strain at root of notch
f 0.2 per cent proof strength of materialP
f PC stabilised cyclic maximum stress for a given strain ringe, ac~hievedafter a period of cycling at that strain range.
fco initial value of f at the beginning of a programme block
ft tensile strength of materialP S act-S el
H value of H at the start of a programme block0value of H after the 'peak' in a stress cycle until local yielding ovcura again
If2 value of H after the 'trough' in a stress cycle, until local yielding occurs
again.
KIt stress concentration factor
m parameter characterising shape of semi-range/mean stress diagram(see Item No.Fat A.O0.O)
N endurance in cycles under constant amplitude loadirg
n number of stress cycles in programme block
S stress at stress concentration
S alternating stress at stress concentrationa
SS mean stress at stress concentration
Additional Suffixes for S, S and Sa m
act actual
ca under constant amplitude testing
el theoretical elasti~c (i.e. Sel is the theoretical elastic stress at the stressc.tcetrativan, it is K' e times the average stress distributed over thecross section.
max maximum
min minimum
0 at zero mean stress
prog under programme loading
Sign convention:- Tensile stress positive. Alternating stresses are taken as positive.
9-2
1. INTRODUCTION
From the earliest days of aircraft fatigue calculations the designer or stressman has reliedalmost exclusively on the well known and very simple Palmgren - Miner cumulative damage hypothesis(otherwise known as 'Minerb Rule') when making his fatigue life estimates. However, in many instancesestimates based on this Rule have proved to be inaccurate. Based on the results of a large numbevof teqts, it is evident that the application of occasional high tensile stresses will increase thelife or endurance. Similarly, occasional high compressive stresses generally decrease the life,compared with results from tests in which no such high stresses have occurred. Until fairly recentlythe designer paid most attention to the wing lower surface (and pressure cabins) when considcring
* the fatigue-critical parts of the structure. As these parts were more likely to be overloaded intension than compression, the use of Miner's Rule did not generally lead to unsafe life estimates.
Here recent developments in fatigue calculation methods have laid great emphasis on theimportance of the correct definition of the ground-to-air cyclein order to make a more realisticallowance for this cycle in the damage calculation. Also much more attention is being paid to the wingtop surface, following reports of cracks occurring in service in various large transport type aircraft.In some instances it was found that the life estimates (often made retrospectively, with the advantageof hindsight) for wing tckz -urface critical areas were considerably optimistic. Whilst accepting thatthe loading spectra may have been too'light'in some estimates, even making quite severe assumptionsIn this respect in the calculations failed to get the calculation to "agree" with the service failures.Could s factor that was being ignored in the use of Miner's Rule for wing top skin calculationx beleading to gross over-estimates of the fatigue life? The very loads that might produce beneficialeffects in the wing bottom surface could be producing an adverse effect in the top surface. In a largewide-bodied transport aircraft, for example, the downward bending loads in the wing 4hilst taxying may"be about a third of the magnitude of the upward bending loads in flight. So if the tensile stressesin the wing top surf-ce occurring during the 'ground' phase of a flight are large enough to causefatigue problems, then the compressive stresses1 which are three times greatercould conceivably havesome adverse effect on the fatigue damage.
As it is suite usual for fatigue critical sections in a structure to contain a stress con-centration with a of 2.5-3.5, it follows that localised yielding of the material will occur wheneverthe nominal stresses exceed 30-40% of the yield stress, or 20-30% of the ultimate tensile or compressivestress. In a typical transport aircraft the steady Ig stress in flight may be already 15-20% ofultimate stress, so that even a modest 'gust' will cause some localised yielding at stress concentrations.Similarly, stress concentrations in the wing top skin may yield in compression. Estimates of -ndurance,based solely on Miner's Rule, are often inaccurate because they neglect a major source of error; that is,the redistribution of stresses that occurs when the part yields at a stress concentration.
2. A METHOD FOR INCLUDINIG xHE EFFECT OF YIELDING AT A STRESS CONCENTRATION IN TH& DAMAGE CALCULATION
The Engii.eering Sciences Data Unit (ESDU) in London, which is a private company owned by theRoyal Aeronautical Society, has recently published a data item (ref.1) which sets out a simple methodfor taking this lo'alised yielding into account in the cumulative damage sum. The rest of this lecturewill be devoted t making a presentation of this data item, and illustrating the application of it byworking through two examples. The sensitivity of some of the assumptions used, and the limitations ofthe method will also be discussed.
In view of the uncertainty of the data which often has to be used, and all the other assumptionsand simplifications that surround fatigue life calculations, a cumulative dw method which is toocomplicated, or which' requires a lot of additional test work to evaluate sore %ew parameter, is unlikelyto gain much popular support with design engineers. The advantage of this LSD13-,(AeS modification to theMiner's Rule is that it requiren no new data. The me':hod has been kept delibera~ely simple, but iscapable of refinement if the need arises.
Under cyclic loading, yielding is usually so localised that the resulting redistribution ofstresses does not affect the bulk of the material, which is assumed to always work in the fully elasticstress range. After a high load has caused local yielding, a residual stress will exist when the loadis released in the previously yielded material, which will change the mean stress of all subsequentatrczz cycles. This change should be taken into account in the cumulative damage sum. Its consequencesmay be appreciated most readily by considering what happens at a stress concentration under blockprugranmi loading. The task is not arduous because each readjustment of mean stress may be taken tjcover the whole period of a block, and because a uniform pattern for each block is set up when aprogramme is repeated. In principle the calculation procedure applies equally well to any complicated"form of variable amplitude loading, provided the order of occurrence of the cycles is known.
The following basic assemptions have been made in order to simplify the calculations, althoughsome of them are not e6sential to the procedure.
(W) The material behaves perfectly elastically below the yield stress and perfectlyplastically above it. The yield stress has been taken hs the 0.2 per cent proof stress.
(ii) The stress-strain characteristics of the material are the same in tension andcompreosion.
(iii) The stre~is concentration is constant for all nominal stresses.
(iv) Yielding is localised to stress concentrations and therefore doob not significantlyaffect stresses in the rest of the sember.
9-3
(v) The semi-range/mean stress relationship for endurance is as given in RAeS fatiguedata item A.oo.o1. i.e. S3/Sa = (1-S/ft)m
(vi) The crack propagation phase is much shorter than the crack initiation phase (or,alternatively, that "failure" is defined am life to crack initiation only as was?inur'a original intention),
(vii) A constant amplitude S-N curve for the member is available.
(viii) Strosses are imposed in sots of blocks of identical stress cyolesý
Assumptions (0i, (A), (iii), (v) and (viii) could be eliminated or modified at the coat ofgreater coisplexity.
3. BASIC PRINCIPLES - ESTIMATING Tlil CHANGE IN ACTUAL %Q=• STRESS
The basic principle of the calculation procedure is very simple. At the stress concentratinaethe theoretical elastic stress (Sel) is K' times the nominal stress in the comronent away from thet Iconcentration, or to Le more realistic, it is assumed that the strain at the stress concentration is Kttimes the nnminal strain. Based on assumptions (i) to (iv0, the actual stresses at the stress con-centration can nov be established for the four basic loading variatiins shown in U'igs. I-. It isassumed for the moment that there is no initial residual atresa at the stress c(.ncntration due toprevious stress cycling.
TYPE 1 load cycles. Sma elx fp and S e _ f (See ?ig.1)
The whole stress cycle is uithin the elastic range and so no local yielding takes place atthe stress concentration. Therefore Sect= Sl.
TYPE 2 load cycles Sa .l< fp but Smin el< -fP (See Fig.2)
The stress Sact reaches its lowest possible %alue -f at time A, after which conpressiveyielding takes place at the stress concentration. 'qus ,ihen Scd reaches its lowist valu• attime B, a difference exists between Seland Sact, denoted by H in the figure. "t the componentis assumed to be perfectly elasto-plastic, this residual etress N = -fp -Smin el (which wil1 betensile) will persist unaltered until yielding occurs again. 1. trill be hoted that:-
Smax act S max el + H.2S f < + f at time C
a el p P p5min act =Smin 01 + It
-9 at time Dp
and H ill rem;i,• unaltered.
Therefore yielding does not occur again until there is sufficienc change in the loading range,S x el-OSmin el*
Also note that it is only the mean atress of the cycle which changes due to the local yielding;the alternating stress Sa act is still the marie an Sa el"
TPIM 3 load cycles Sa .3< fP but Smx el>+fP (See :-g.3)
A similar argument av 'or Fig. 2 is followed. Tensile yielding takes place at the stressconcentration, resulting in a residual stress H = -Smax 11 + f p (which will be compressive).
Smax act - msx el it+ fp &t time D
qmin act S 5mz. el + 1
-2ael - fn> -p
Ae for Type Z load cycles, ao furthqr yielding takes place and H remains unalterel, althoughin thir cas, the effect of H is to reauce the mea,, stress.
TYPE 4 loqd cy-.ief. 8 el "pfPfor any value of S m el. seFg
Zn this ex&sple, tensile yieldiug occurs before the first -3ak at time A, wh~ch razh' itW;maximu'r extent at time B, when a difference HI exists between Sel and Saut, This value of ll1persists until time C is reaches, • the co.qressive proof stress is reachad. After timeC compressivo yielding cccura :nd tWhe mximtum difference between Sel id Sct oucc#es t2 , whi.chvill "• of nppoSlte sign to HI. In this typu of loading, it io seen that H changea at everyhalf cycle, and the actual mean atetss Sm act = 0 at the atress concentration. Howaver, althoughthe actual alternating stress i - tP, the aliDrnutina "3tress" in the damagi nalculations isstill taker as + Sa el, n-auoe t1. fixtxgu proceea is primarily a functiou of zhe strair range
2E.a
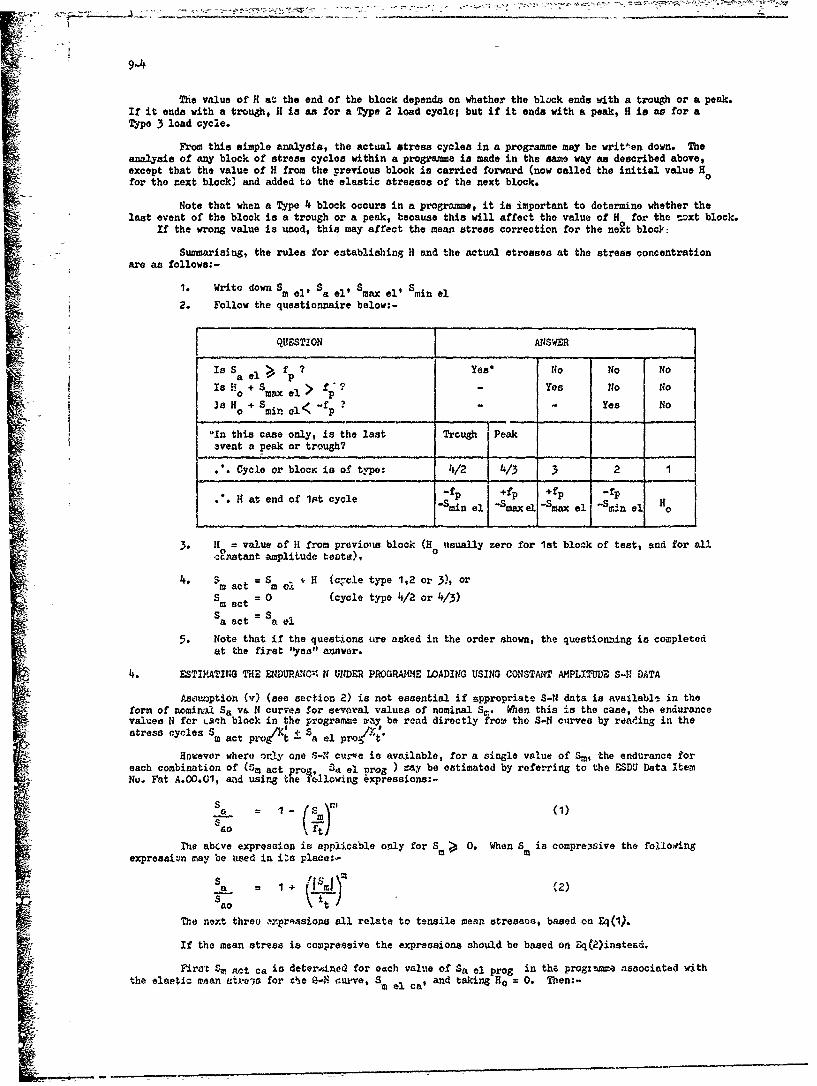
1 9
9-4
The value of H at the end of the block depends on whether the block ends with a trough or a peak.If it ends with a trough, H is as for a Type 2 load cycle; but if it ends with a peak, H is an for aType 3 load cycle.
From this simple analysis, the actual stress cycles in a programme may be writ'en down. Theanalysis of any block of stress cycles within a programme is made in the same way as described above,except that the value of H from the previous block is carried forward (now called the initial value H 0for the next block' and added to the elastic stresses of the next block. o
Note that when a Type 4 block occurs in a programme, it is important to determine whether thelast event of the block is a trough or a peak, because this will affect the value of H for the toxt block.
If the wrong value is used, this may affect the mean stress correction for the next block;
Summariming, the rules for establishing H and the actual stresses at the stress concentrationare as follows:-
1. Write down Sm ell Sa ell Smax ell Sin el
2. Follow the questionnaire below:-
QUESTION ANSWER
Is 5 a el , fp ? Yesa No No No
Is H + Snax e> f"? - Yes No Nop
H 0 + S - - Yes No
"In this case only, is the last Trough Peak.vent a peak or trough?
.. Cycle or blocK is of type: 4/2 4/3 3 2 1
' at end of 1st cycle 4fp +fp -fp
LI "Stmin el "Smaxel "Smax el "ain el H o
3- HIf= value of H from previons block (HN nsually zero for 1st block of test, and for all,.Fnwtant amplit~ude teats),
4. sm act S m *I i H (cucle type 1,2 or 3), orS act 0 (cycle type 4/2 or 4/3)
S a act = Sa el
5. Note that if the questions ure asked in the order shown, the questionning ic completedat the first ýyeal" answer.
4. ESTIMATING THE ENDURANC' N UNDER PROGRAMME WADING USING CONSTANT AMPLITUDE S-N DATA
Asaumption (v) (see section 2) is not essential if appropriate S-N data is available in theform of nomin'a Sa v&. N curvre for several values of nominal Sm. When this is the case, the endurancevalues IT for L.sh block in the programme way be read directly from the S-N curves by reading in thejLmcrstress cycles S ........ :t Sa el pros t.
However where ircy one S-," curve is available, for a single value of Sm, the endurance foreach combination of (Sm act prfg, ' el nrog ) ray be estimated by referring to the ESDU Data ItemNo. Fat A.OO.01, and using the followins ixpressions:-
La = (1) S0
sft
The abcve expression is applicable only for Sm >, 0. When S is compressive the folloingexpresaizn may be used in i~s place:- m
(1 (I 2)
ao
The nezt threo ,rpr~asions all relate to tensile mean stressas, based on Eq(1).
If the mean str-es is compressive the expressions should be based on Zq(2)instead.
First 5 a act ca in deter.4ned for each value of Sa el prog in the progx•mae associated withthe elaetic mehan etreis for the 0-n curve, Sm el ca' and taking Ho = 0. Then:-
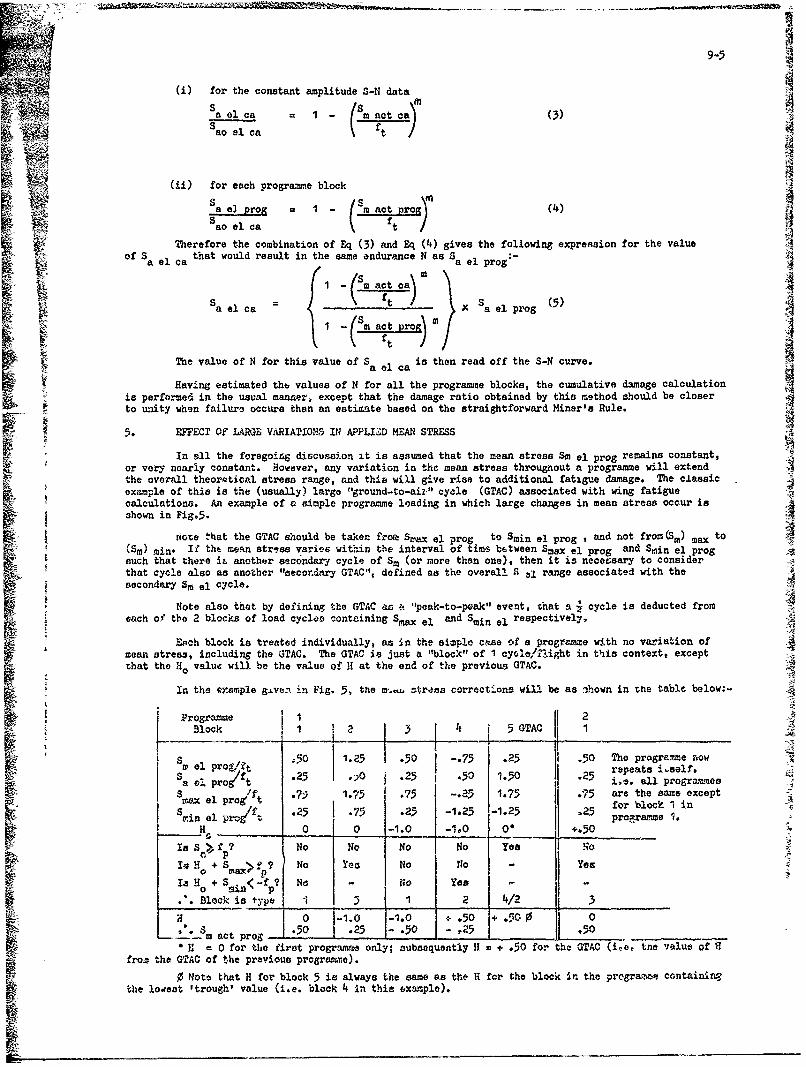
9-5
(i) for the constant amplitude S-N data
Sao el ca f1tSael ca = -Imat cI
(ii) for each programme block
S a (Sm act pro (4)
ao el ca ft
"Therefore the combination of Eq (3) and Eq (4) gives the following expreasion for the valueof S that would result in the same endurance N as S e -
Sa el ca = a el prog ()
S[1 (Sm ) ac S 1ý (5
The value of N for this value of S is then read off the S-N curve._•a el caip oHaving estimated the values of N for all the programme blocks, the cumulative damage calculation
is performed in the usual manner, except that the damage ratio obtained by this method should be closerto unity when failure occurs than an estimate based on the straightforward Miner's Rule.
5. EFFEU OF LkGF VARIATIO14 IN APPLIED M STRESS
In all the foregoing discussion it is assumed that the mean stress Sm el prog remains constant,or very nearly constant. However, any variation in the mean stress throughout a programme will extendthe overall theoretical stress range, and this will give rise to additional fatigue damage. The classicexample of this is the (usually) large "ground-to-aiz" cycle (GTAC) associated with wing fatiguecalculations. An example of a simple programme loading in which large changes in mean stress occur isshown in Fig.5.
Note that the GTAC should be taken froe Swax el prog to Smin el prog , and not from(Sm) max to(Sm) sin. If ttht mean stress varier, within the interval of tims between Smax el prog and Ssin el progsuch that there ia another secondar-y cycle of Sm (or more than one), then it is neceosary to considerthat cycle also as another "secondary GTAC", defined as the overall S el range associated with thesecondary Sm el cycle.
Note also that by defining the GTAC as t. "peak-to-peak" event, chat a • cycle is deducted fromeach of' the 2 blocks of load cycles containing Smax el and Smin el respectively,
.4Epch block is treated individually, as in the simple case of a programme with no variation of
mean stress, including the GTAC. The GTAC is just a "block" of I cysle/,Light in this context, exceptthat the H. value will be the value of It at the end of the previous GTAC.
In the vrample given in Fig. 5, the m.,. ztraas corrections will be as :hown in rne table below:-
Programme IfBlock ,3 5 GTAC 1
1 pr5.f 50 1.25 .50 -. 75 .25 .50 The progra~ume noww el pro t .25 . .25 .50 1.5 .2 repeats i.self.a el pro/ft . .ie. all programmes5rl/x el pro7 t 579 1.75 .75 -. 25 1.75 .75 are the same except
MUM l prg tfor block I inS HS.i prj -t 25 -7ý .25 -1.25 -1.25 .25 f lok1nmnel poprc yrao 10• 0 o 1.0 -1.0 o" +.50
Is s f N•o No No Noos-
Io1 + 5 ? No Yea No 1o - Yea0 .N> fp IH 0o + S'in<-f ? No - No Yes -
Blockistype , 5 1 2 4/2 3
... 0 j-, -. 00 e.50 +."G 0__'-".$ act prog; - I _..25 - - 25 .50"B a 0 for the first programme only; subsequently I = + .50 for the GTAC (Fie. tne value of 9
frox the GTAC of the previous program-e).
0 Note that H for block 5 is always the same as the I! for the block in the programaw containinethe lowtest 'trough' value (i.e. block 4 in this example).
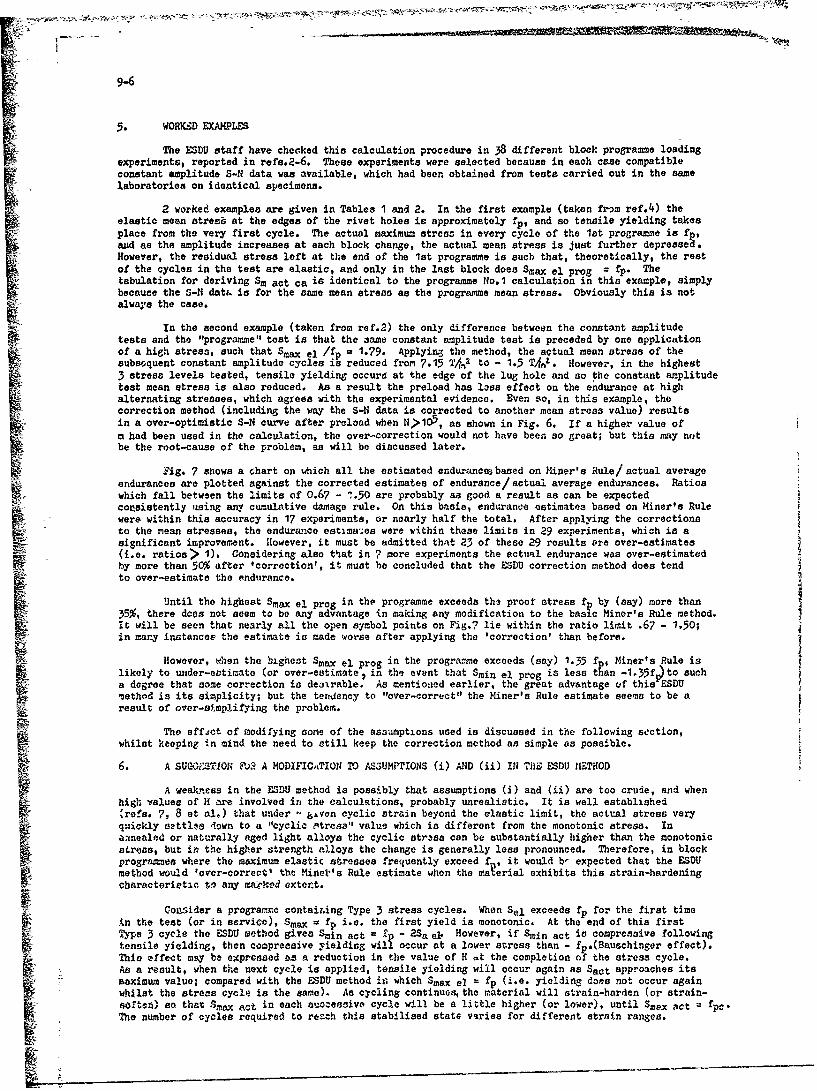
9-6
5. WORKD EXAMPLES
The ESDU staff have checked this calculation procedure in 38 different block programme loadingexper!ments, reported in refs.2-6. These experiments were selected because in each case compatibleconstant amplitude S-N data was available, which had been obtained from tests carried out in the samelaboratories on identical specimens.
2 worked examples are given in Tables 1 and 2. In the first example (taken from ref.4) theelastic mean stress at the edges of the rivet holes is approximately fp, and so tensile yielding takesplace from the very first cycle. The actual maximum streas in every cycle of the lot programme is fand as the amplitude increases at each block change, the actual mean stress is just further depressed.However, the residual stress left at the end of the 1st programme is such that, theoretically, the restof the cycles in the test are elastic, and only in the last block does Smax el prog = fp. Thetabulation for deriving Sm act ca is identical to the programme No.1 calculation in this example, simplybecause the S-N data is for the same mean stress as the programme mean stress. Obviously this is notalways the case.
In the second example (taken from ref.2) the only difference between the constant amplitudetests and the "programme" test is that the same constant amplitude test is preceded by one applicationof a high stress, such that Smax el /f = 1.79. Applying the method, the actual mean stress of thesubsoquent constant amplitude cycles is reduced from 7.15 Thl to - 1.5 ThnL. However, in the highest3 stress levels tested, tensile yielding occurs at the edge of the lug hole and so the constant amplitudetest mean stress is also reduced. As a result the preload has lass effect on the endurance at highalternating stresses, which agrees with the experimental evidence. Even so, in this example, thecorrection method (including the way the S-N data is corrected to another mean stress value) resultsin a over-optimistic S-N curve after preload when N>10 5 , as shown in Fig. 6. If a higher value ofm had been used in the calculation, the over-correction would not have been so great; but this may notbe the root-cause of the problem, as will be discussed later.
Fig. 7 shows a chart on which all the estimated endurances based on Miner's Rule/actual averageendurances are plotted against the corrected estimates of endurance/actual average endurances. Ratioswhich fall between the limits of 0.67 - 1.50 are probably as good a result as can be expectedconsistently using any cumulative damage rule. On this basis, endurance estimates based on Miner's Rulewere within this accuracy in 17 experiments, or nearly half the total. After applying the correctionsto the mean stresses, the endurance estimal:es were within these limits in 29 experiments, which is asignificant improvement. However, it must be admitted that 23 of these 29 results are over-estimates(i.e. ratios> 1). Considering also that in 7 more experiments the actual endurance was over-estimatedby more than 50% after 'correction', it must he concluded that the ESDU correction method does tendto over-estimate the endurance.
Until the highest Smax el prog in the programme exceeds the proof stress fp by (say) more than35%, there dces not seem to be any advantage in making any modification to the basic Miner's Rule method.it will be seen that nearly all the open symbol points on Fig.7 lie within the ratio limit .67 - 1.50;"in mary instances the estimate is made worse after applying the 'correction' than before.
However, when the highest Smax el prog in the progratmme exceeds (say) 1.35 f , Miner's Rule islikely to under-estimate (or over-estimate, in the event that Smin el prog is less t~an -1.35f)to sucha degree that some correction is de3irable. As mentioned earlier, the great advantage of this ESDU-method is its simplicity; but the tend.ency to "over-correct" the Miner's Rule estimate seems to be aresult of over-a$,mplifying the problem.
The effect of modifying some of the assumptions used is discussed in the following section,
whilst keeping In mind the need to still keep the correction method as simple as possible.
6. A SUGOFSTION bOt A MODIFICiTION TO AS3UMPTIONS (i) AND (ii) IN THE ESDU HETHOD
A weakneas in the FSDU method is possibly that assumptions (W) and (ii) are too crude, and whenhigh values of H are involved in the calculations, probably unrealistic. It is well established'refs. 7t 8 at al.) that under - i±ven cyclic strain beyond the elastic limit, the actual stress veryq:zickly settles down to a "cyclic entress" value which is different from the monotonic stress. Inaanealed or naturally aged light alloys the cyclic stress can be substantially higher than the monotonicstress, but ir the higher strength alloys the change is generally less pronounced. Therefore, in blockprogrammes where the maximum elastic stresses frequently exceed f , it would b, expected that the ESDUmethod would 'over-correct' the Minel's Rule estimate when the amterial exhibits this strain-hardeningcharacterietic tP any marked extent.
Co.'sider a programme containing Type 3 stress cycles. When Sel exceeds fp for the first timein the test (or in service), Smax = fp i.e. the first yield is monotonic. At the end of this firstType 3 cycle the ESDU wethod gives Smin act = tp - 2Sa eal However, if Smin act is compressive followingtensile yielding, then compressive yielding will occur at a lower stress than - fp.(Bauschinger effect).This effect may be exprassed as a reduction in the value of H at the completion of the stress cycle.As a result, when the next cycle is applied, tensile yielding will occur again as $act approaches itsmaximum value; compared with the ESDU method in which Smax al = fp (i.e. yielding does not occur againwhilat the streas cycle is the same). As cycling continues the material will strain-harden (or strain-Io ton) so that Smax act in each aucescive cycle will be a little higher (or lower), until Smax act = fpc.
b The number of cycles required to reach this stabilised stat6 varies for different strain ranges.
i7
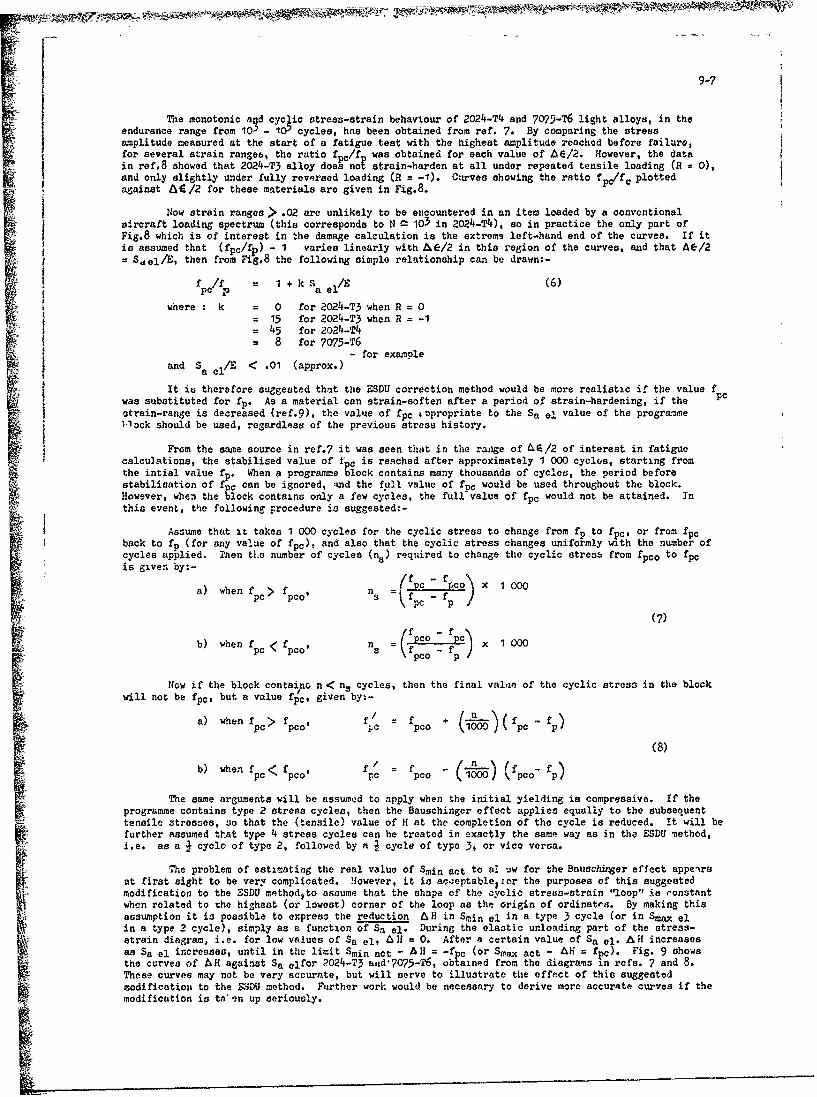
9 -7
The monotonic and cyclic stress-strain behaviour of 2024-T4 and 7095-T6 light alloys, in theendurance range from 10 - 10-, cycles, has been obtained from ref. 7. By comparing the stress
ramplitude measured at the start of a fatigue test with the highest amplitude reached before failure,for several strain ranges, the ratio f./f was obtained for each value of 46/2. However, the datain ref.8 showed that 2024-T3 alloy does not strain-harden at all under repeated tensile loading (R = 0),I !and only slightly under fully reversed loading (R = -1). Carves showing the ratio f•pfc plottedagainst Af/2 for these materials are given in Fig.8.
Now strain ranges > .02 are unlikely to be encountered in an item loaded by a conventionalaircraft loading spectrum (this corresponds to N c 103 in 2024-T4), so in practice the only part ofFig.8 which is of interest in the damage calculation is the extreme left-hand end of the curves. If itis assumed that (fpc/fp) - 1 varies linearly with tA/2 in this region of the curves, and that Ae/2= Sael/E, then from Fig.8 the following simple relationship can be drawn:-
f •f = 1+kaS (6)
where : k = 0 for 2024-T3 when R = 0= 15 for 2024-T3 when R = -1= 45 for 2024-T4= 8 for 7075-T6
d S- for example
• and a el/ .1 (approx.)
It is therefore suggested that the ESDU correction method would be more realistic if the value fwas substituted for fp. As a material can strain-soften after a period of strain-hardening, if the pcatrain-range is decreased (ref.9), the value of fpc topropriate to the Sa el value of the programme1ock should be used, regardless of the previous stress history.
SFrom the same source in ref.7 it was seen that in the range of & E/2 of interest in fatiguecalculations, the stabilised value of pc is reached after approximately 1 000 cycles, starting fromthe intial value fp. When a programme block contains many thousands of cycles, the period beforestabilisation of fpc can be ignored, and the full value of f- would be used throughout the block.However, when the block contains only a few cycles, the full value of fpc would not be attained. Inthis event, the following procedure is suggested:-
Assume that it takes 1 000 cycles for the cyclic stress to change from fo to fpc, or from fpcback to fp (for any value of fpc), and also that the cyclic stress changes uniformly with the number ofcycles applied. Then tLe number of cycles (n.) required to change the cyclic stress from fpco to fpcis given by:-
a) when fpc > fpcol n s =fPCL f co x Po
(7)
b) when fa < fpco' ns = f DO f) xl1p000
flow if the block containG n < ns cycles, then the final value of the cyclic stress in the blockwill not be fpc, but a value fie, given by:-
a) when fpc> fpco' f c pco fpcfp)
I (8)
b) when fpc fpco' f p ) (pco fPC < pcotpc = C 100-
The same arguments will be assumed to apply when the initial yielding is compressive. If theprogramme contains type 2 stress cycles, then the Bauschinger effect applies equally to the subsequenttensile stresses, so that the (tensile) value of H at the completion of the cycle is reduced. it will befurther assumed that type 4 stress cycles can be treated in exactly the same way as in the ESDU method,i.e. as a I cycle of type 2, followed by a I cycle of type 3, or vice versa.
The problem of estimating the real value of Smin act to a] *w for the Bausch&6er effect appeirsat first sight to be very complicated. However, it is ac.:eptable~ior the purposes of this suggestedmodification to the ESDU method$to assume that the shape of the cyclic stress-strain "loop" ia constantwhen related to the highest (or lowest) corner of the loop as the origin of ordinates. By making thisassumption it is possible to express the reduction AH in Snin el in a type 3 cycle (or in Smax elin a type 2 cycle), simply as a function of Sa el. During the elastic unloading part of the stress-strain diagram, i.e. for low values of Sa el, A I = 0. After a certain value of Sa el. 'H increasesas Sa el increases, until in the lirmit Smin act - A41 = "fpc (or Smax act - AH = fpc). Fig. 9 showsthe curves of AH against Sa elfor 2024-73 asd'7075-T6, obtained from the diagrams in refs. 7 and 8.These curves may not be very accurate, but will serve to illustrate the effect of this suggestedmodification to the SiDU method. Further work would be necessary to derive more accurate curves if themodification is tn'en up seriously.
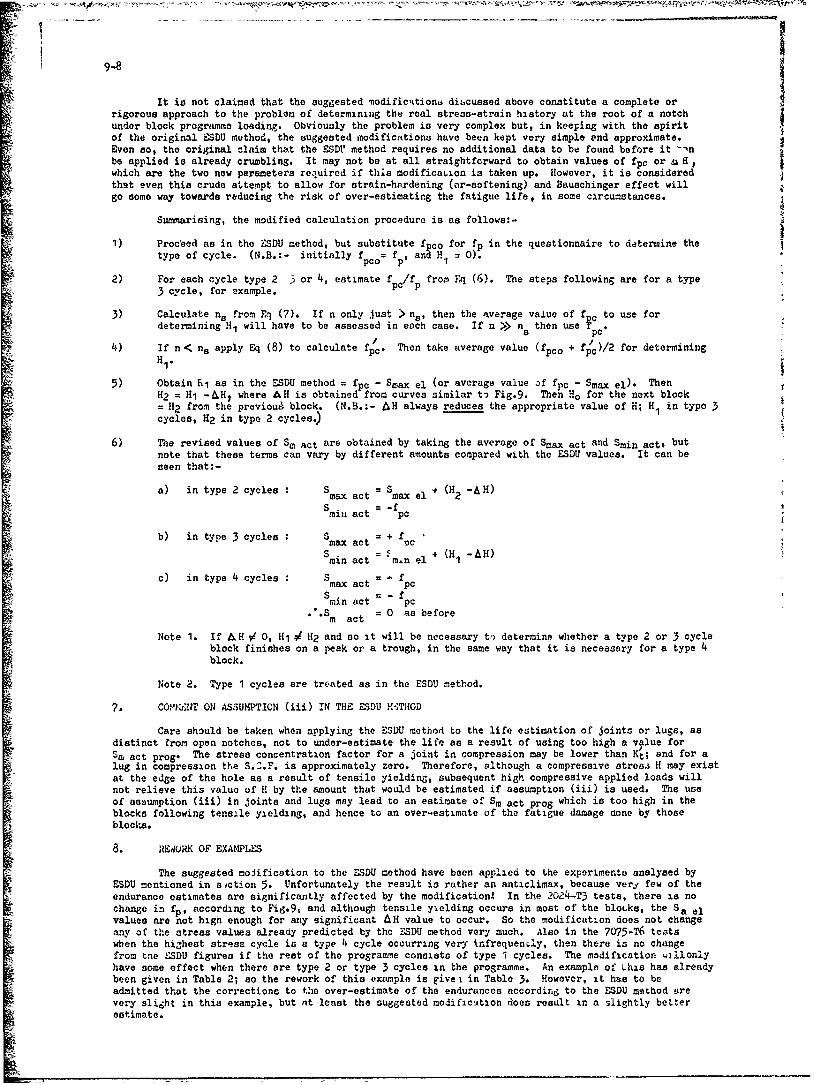
9-8
It is not claimed that the suggested -iodificitioni discussed above constitute a complete or
rigorous approach to the problem of determining the real stress-atrain history at the root of a notchunder block programme loading. Obviously the problem is very complex but, in keeping with the spiritof the original ESDU method, the uuggested modifications have been kept very simple end approximate.Even so, the original claim that the ESDU' method requires no additional data to be found before it '-nbe applied is already crumbling. It may not be at all straightforward to obtain values of fpc or a H,which are the two new parameters reluired if this modificaLion is taken up. However, it is consideredthat even this crude attempt to allow for strain-hardening (or-softening) and Baumchinger effect willgo some way towards reducing the risk of over-estimating the fatigue life, in some circumstances.
Summarising, the modified calculation procedure is as follows:-
1) Proceed as in the ESDU method, but substitute fco for fp in the questionnaire to determine the I
type of cycle. (N.B.:- initially fpco= fp, anN H1 = 0).
2) For each cycle type 2 3 or 4, estimate f /f from Fq (6). The steps following are for a type3 cycle, for example.
3) Calculate n. from Eq (7). If n only just > na, then the average value of f to use fordetermining H1 will have to be assessed in each case. If n > n then use V .
s pc
4) If n< n. apply Eq (8) to calculate fpc" Then take average value (fpco + flc)/2 for determiningHi.
5) Obtain fil as in the ESDU method = fpc - Smax el (or average value of fpc - Smax el). ThenH2 = H1 -AH1 where AH is obtained from curves similar ti Fig.9. Then Ho for the next block= 112 from the previoug block. (N.B.:- AH always reduces the appropriate value of H; H1 in type 3cycles, H2 in type 2 cycles.)
6) The revised values of Sm act are obtained by taking the average of Smax act and Smin act, butnote that these terms can vary by different amounts compared with the ESDU values. It can beseen that:-
a) in type 2 cycles: Smax act = max el + (H2 -AH)
S =-fmiu act pc
b) in type 3 cycles: Smax act + f c
Smin act E m~n el + ( -,)
c) in type 4 cycles : Smax act f PC
s min act f pc• a'.S = 0 as before
Note 1. If A F 4 0, Hi 94 H2 and so it will be necessary to determine whether a type 2 or 3 cycleblock finishes on a peak or a trough, in the same way that it is necessary for a type 4block.
Note 2. Type 1 cycles are treated as in the ESDU method.
7. COYRFNT ON ASSUMPTION (iii) IN THESDU MHT11OD
Care should be taken when applying the ESDU method to the life estimation of joints or lugs, asdistinct from open notches, not to under-estimate the life as a result of using too high a value for
Sm act prog. The stress concentration factor for a joint in compression may be lower than K'; and for alug in compression the S.C.F. is approximately zero. Therefore, although a compressive stress H may existat the edge of the hole as a result of tensile yielding, subsequent high compressive applied loads willnot relieve this value of H by the amount that would be estimated if assumption (iii) is used. The useof assumption (iii) in joints and lugs may lead to an estimate of Sm act prog which is too high in theblocks following tensile yielding, and hence to an over-estimate of the fatigue damage cone by thoseblocks.
8. RE4ORK OF EXAIRPLiz
The suggested moJification to the ESDU method have been applied to the experiments analysed byESDU mentioned in action 5. Unfortunately the result is rather an anticlimax, because verj few of theendurance estimates are significantly affected by the modificationl In the 2024-T3 tests, there is nochange in fp, according to Fig.9, and although tensile yielding occurs in most of the blotka, the $a elvalues are not high enough for any significant 611 value to occur. So the modification does not changeany of the stress values already predicted by the ESDU method very much. Also in the 7075-T6 teitswhen the highest stress cycle is a type 4 cycle occurring very infrequently, then there is no changefrom tne ZSDU figures if the rest of the programme consists of type 1 cycles. The modification willonlyhave some effect when there are type 2 or type 3 cycles in the programme. An example of .his has alreadybeen given in Table 2; so the rework of this example is givei in Table 3. However, it has to beadmitted that the corrections to the over-estimate of the endurances according to the ESDU method erevery slight in this example, but at least the suggested modification does result in a slightly betterestimate.
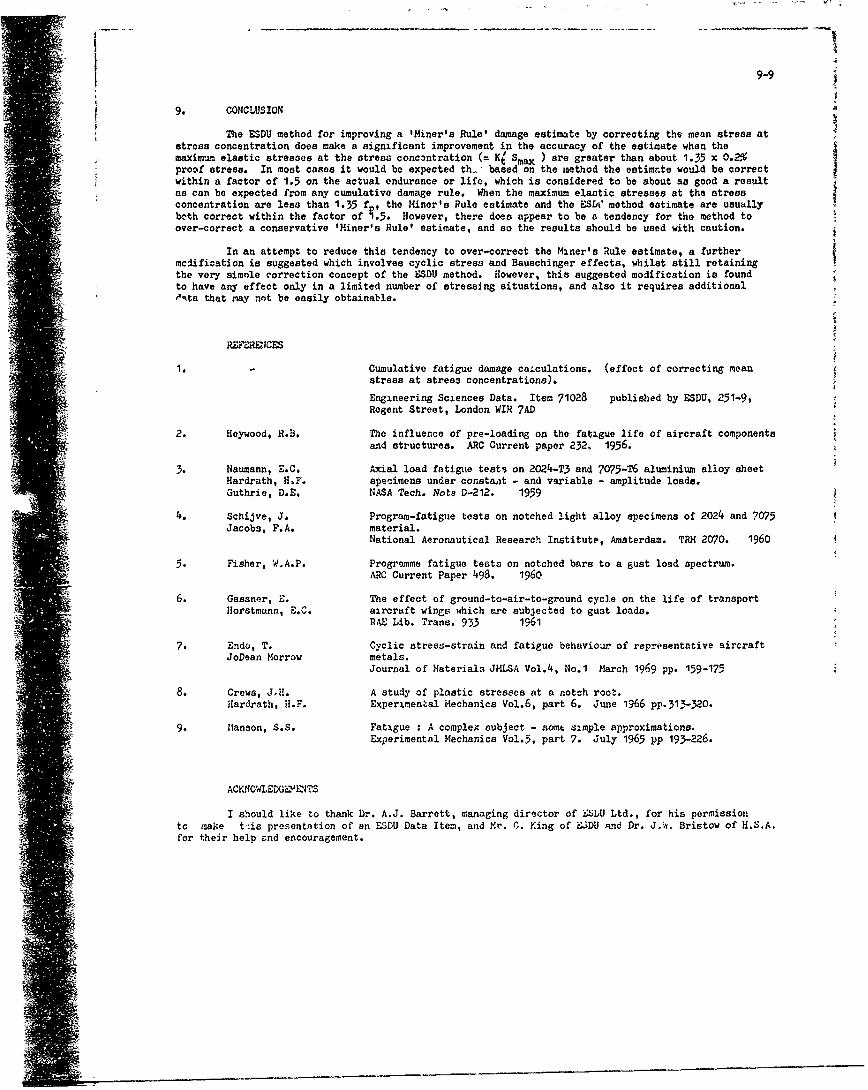
9-9
9. CONCLUSION
The ESDU method for improving a 'Miner's Rule' damage estimate by correcting the mean stress atstress concentration does make a significant improvement in tho accuracy of the estimate when themaximum elastic stresses at the stress concantration (= K• Smax ) are greater than about 1.35 x 0.2%proof stress. In most cases it would be expected th-, based on the eethod the estimate would be correct
within a factor of 1.5 on the actual endurance or life, which is considered to be about as good a resultas can be expected from any cumulative damage rule. When the maximum elastic stresses at the stressconcentration are less than 1.35 f , the Miner's Rule estimate and the ESDE method estimate are usuallyboth correct within the factor of 3.5. However, there does appear to be a tendency for the method toover-correct a conservative 'Miner's Rule' estimate, and so the results should be used with caution.
In an attempt to reduce this tendency to over-correct the Miner's Rule estimate, a furthermcdification is suggested which involves cyclic stress and Bauschinger effects, whilst still retainingthe very simole correction coacept of the ESDU method. However, this suggested modification is foundto have any effect only in a limited number of stressing situations, and also it requires additionalOta that may not be easily obtainable.
REREOCES
1. - Cumulative fatigue damage ca~.culations. (effect of correcting meanstress at stress concentrations).
Engineering Sciences Data. Item 71028 published by ESDU, 251-9,Regent Street, London WIR 7AD
2. Heywood, R.B. The influence of pre-loading on the fatigue life of aircraft componentsand structures. ARC Current paper 232. 1956.
3. Naumann, E.C. Axial load fatigue tests on 2024-T3 and 7075-T6 aluminium alloy sheetHardrath, H.F. specimens under constait - and variable - amplitude loads.Guthrie, D.E. NASA Tech. Note D-212. 1959
4. Schijve, J. Program-fatigue tests on notched light alloy specimens of 2024 and 7075Jacobs, F.A. material.
National Aeronautical Research Institute, Amsterdam. TRM 2070. 1960
5. Fisher, W'A.P. Programme fatigue tests on notched bars to a gust load spectrum.ARC Current Paper 498. 1960
6. Gassner, E. The effect of ground-to-air-to-ground cycle on the life of transportHorstmann, E.C. aircraft wings which are subjected to gust loads.
RAE Lib. Trans. 933 1961
7. Endo, T. Cyclic stress-strain and fatigue behaviour of representative aircraftJoDean Morrow metals.
Journal of Materials JMLSA Vol.4, No.1 March 1969 pp. 159-175
8. Crews, JH. A study of plastic stresses at a notch root.Hardrath, H.F. Experimental Mechanics Vol.6, part 6. June 1966 pp.313-320.
9. Hanson, S.S. Fatigue : A complex subject - some simple approximations.Experimental Mechanics Vol.5, part 7. July 1965 pp 193-226.
ACKNOWLEDGiY!VTS
I should like to thank Dr. A.J. Barrett, managing director of •SDU Ltd., for his permissionto make t-iis presenttion of an ESDU Data Item, and Mr. C. King of E.DU and Dr. J.W. Bristow of H.S.A.for their help rnd encouragement.
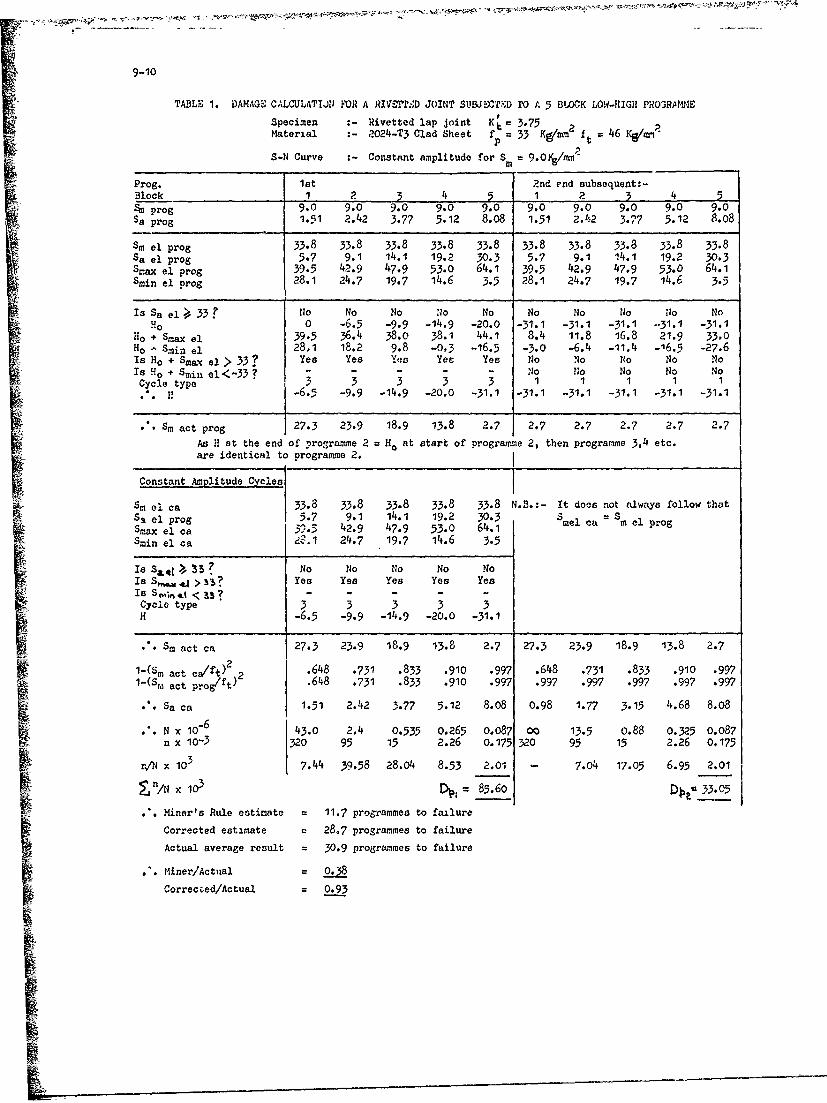
9-10
TABLE 1. DAMAGE C,1LCULATIXJ MOR A RIVLTT,,D JOINT SUBJ0CT-,,D TO A 5 BLOCK LOW-HIGH PRO3RANME
Specimen Rivettod lap joint K, 3.75 2Material 2024-T3 Clad Sheet ft = 33 2 2p 33 Kg/-m ft 6K/n
S-N Curve Constant amplitude for Sm = 9.0-/ 2
Prog. 1st 2nd end subsequent:-Block 1 2 3 4 5 1 2 3 4 5Am prog 9.0 9.0 9.0 9.0 9.0 9.0 9.0 9.0 9.0 9.0Sa prog 1.51 ?.42 3.77 5.12 8.M8 1.51 2.42 3,77 5.12 8.08
Sm el prog 33.8 33.8 33.8 33.8 33.8 33.8 33.8 33.8 33.8 33.8Sa el prog 5.7 9.1 14.1 19.2 30.3 5.7 9.1 14.1 19.2 30.3Smax el prog 39.5 42.9 47.9 53.0 64.1 39.5 42.9 47.9 53.0 64.1Smin el prog 28.1 24.7 19.7 14.6 3.5 28.1 24.7 19.7 14.6 3.5
Is Sa el >, 33 No No No No No No No No No NoHe 0 -6.5 -9.9 -14.9 -20.0 -31.-1 -31.1 -31.1 -.31-1 -31.1
Ho + Smax el 39.5 36.4 38.0 38.1 44.1 8.4 11.8 16.8 21.9 33,0Ho ' Smin el 28.1 18.2 9.8 -0-3 -16.5 -3.0 -6.4 -11.4 -16.5 -27.6Is Ho + Smax el > 33 Yes Yes Yes Yee Yes No No No No NoS+ si, el<-33 ? - - - - - No No No No NoCycle type 3 3 3 3 3 1 1 1 1 1Cyl po -6.5 -9.9 -14.9 -20.0 -31.1 -31.1 -31.1 -31.1 -31.1 -31.1
2 .. Sm act prog 27.3 23.9 18.9 13.8 2.7 2.7 2.7 2.7 2.7 2.7
As H at the end of nrogramme 2 = He at start of programme 2, then programme 3,4 etc.are identical to programme 2.
Constant Amplitude Cycles ISm el ca 33.8 33.8 33.8 33.8 33.8 N.B.:- It does not always follow that
S9L el prog 5.7 9.1 14.1 19.2 30.3 5 -e c SmelpoSmax el ca 39.5 42.9 47.9 53.0 64.1 mel ca a el prog
Smin el ca .8.1 24.7 19.7 14.6 3,5
Is S&[ >, 33? No No No No No
SIS SM.., 4 > 31 .? Yes Yes Yes Yes Yes
Is S ,;.,%L < as? - - - - -Cycle type 3 3 3 3 3
H -6.5 -9.9 -14.9 -20.0 -31.1
.'. Sm act ca 27.3 23.9 18.9 13.8 2.7 27.3 23.9 18.9 13.8 2.7
1(Sm act ca/ft) 2 .648 .731 .833 .910 .997 .648 .731 .833 .910 .9971-(Sr, act prosft) .648 .731 .833 .910 .997 .997 .997 .997 .997 .997
Sa ca 1.51 2.42 3.77 5.12 8.08 0.98 1.77 3.15 4.68 8.08
,. N x 10-6 43.0 2.4 0.535 0.265 0.087 00 13.5 0.88 0.325 0.087n x 10-3 320 95 15 2.26 0.175 320 95 15 2.26 0.175
rnN x 103 7.44 39.58 28.04 8.53 2.01 - 7.04 17.05 6.95 2.01
n/N x 103 = 85.6o D0 33.05
.'. Miner's Rule estimate = 11.7 programmes to failure
Corrected estimate = 28.7 programmes to failure
Actual average result = 30.9 programmes to failure
.. Miner/Actual = 0.38SCorrec ed/Actual = 0.93
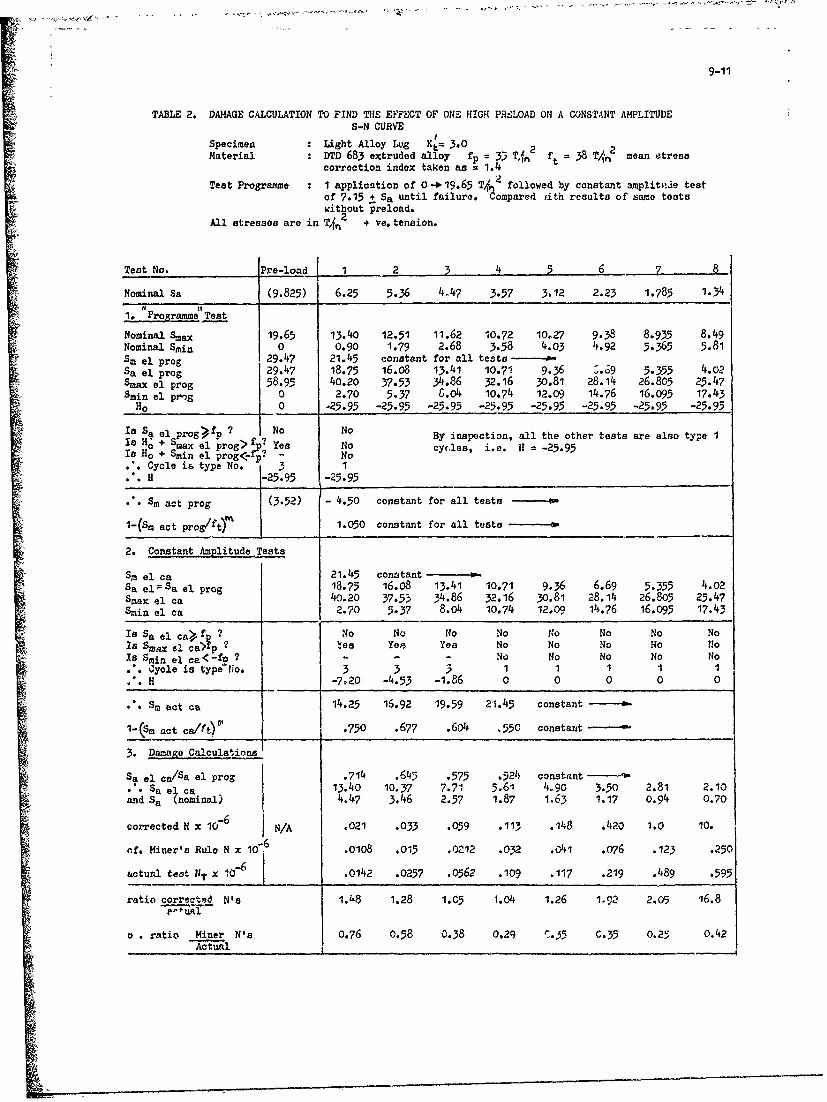
9-11
TABLE 2. DAMAGE CALCULATION TO FIND THE EFFECT OF ONE HIGH PRSLOAD ON A CONSTANT AMPLITUDES-N CURVE
Specimen : Light Alloy Lug KL= 3.0 2Material : DTD 683 extruded alloy f- = 33 T4n ft 38
correction index taken as =1 .4
Test Programme : 1 application of O-*19.65 T/4,. followed by constant amplitnde testof 7.15 + Sa until failure. Compared iith results of same testswithout preload.
All stresses are in T,&2 v re. tension.
Test No. Pre-load 1 2 3 4 5 6 7 8
Nominal Sa (9.825) 6.25 5.36 4A47 3.57 3.12 2.23 1.785 1.34'I'
1. Programme Test
Nominal Smax 19.65 13.40 12.51 11.62 10.72 10,27 9.38 8.935 8.49Nominal Smin 0 0.90 1.79 2.68 3.58 4.03 4.92 5.365 5.81Sm el prog 29.47 21.45 constant for all testsSa el prog 29.47 18.75 16.o8 13.41 10.71 9.36 ".69 5.355 4.02Smax el prog 58.95 40.20 37.53 34.86 32.16 30.81 28.14 26.805 25.47Smin el pmg 0 2.70 5.37 6.o4 10.74 12.09 14.76 16.095 17.43
Ho 0 -25.95 -25.95 -25.95 -25.95 -25.95 -25.95 -25.95 -25.95
Is Sa el progyfp ? No No By inspection, all the other tests are also type IIs H' + Smax el prog> f ? Yes No cycles, i.e. 11 = -25.95Is Ho + Smin el prog<- p? - No.'. Cycle is type No. 3 1. . H -25.95 -25.95
*. Sm act prog (3.52) - 4.50 constant for all tests ----
1-(Sm act prog/ft) M 1.050 constant for all tests
2. Constant Amplitude Tests
Sm el ca 21.45 constant V.Sa el =Sa el prog 18.75 16.08 13.41 10.71 9.36 6.69 5.355 4.02
Smax el ca 440.20 37.55 34.86 32.16 30.81 28.14 26.805 25.47Smin el ca 2.70 5-37 8.04 10.74 12.O9 14.76 16.095 17.43
Is Sa el ca>.fp ? No No No No No No No NoIs SMAX 61 caWRp ? Yes Yep Yea No No No No HoIs Smin el ca<-f) ? - - - No No No No No.'. 'ycle is type'7o. 0 3 3 3 1 1 1 1 1
H -7.20 -4.53 -1.86 0 0 0 0 0
". act a 14.25 16.92 19.59 21.45 constant
1-(S. act ca/Tt)s j .750 .677 .604 .550 constant
3. Damage Calculations
Sa el ca/Sa el prog .714 .645 .575 .524 constant -
".. Sa e! ca " 13.40 10.37 7.71 5.61 4.90 3.50 2.81 2.10and Sa (nominal) 4.47 3.46 2.57 1.87 1.63 1.17 0.94 0.70
corrected N x 10- 6 j N/A .021 .033 .059 .113 .148 .420 1.0 10.
rf. Miner's Rule N x,106 .o108 .015 .0212 .032 .041 .076 .123 .250
actual test NT x 1-o .o142 .0257 .0562 .109 .117 .219 .489 .595
ratio corrected N's 1.48 1.28 1.05 1.O4 1.26 1.92 2.05 16.8
o . ratio Miner N's 0.76 0.58 0.38 0.29 '-35 C.35 0,25 0.42ATctual__________________________________
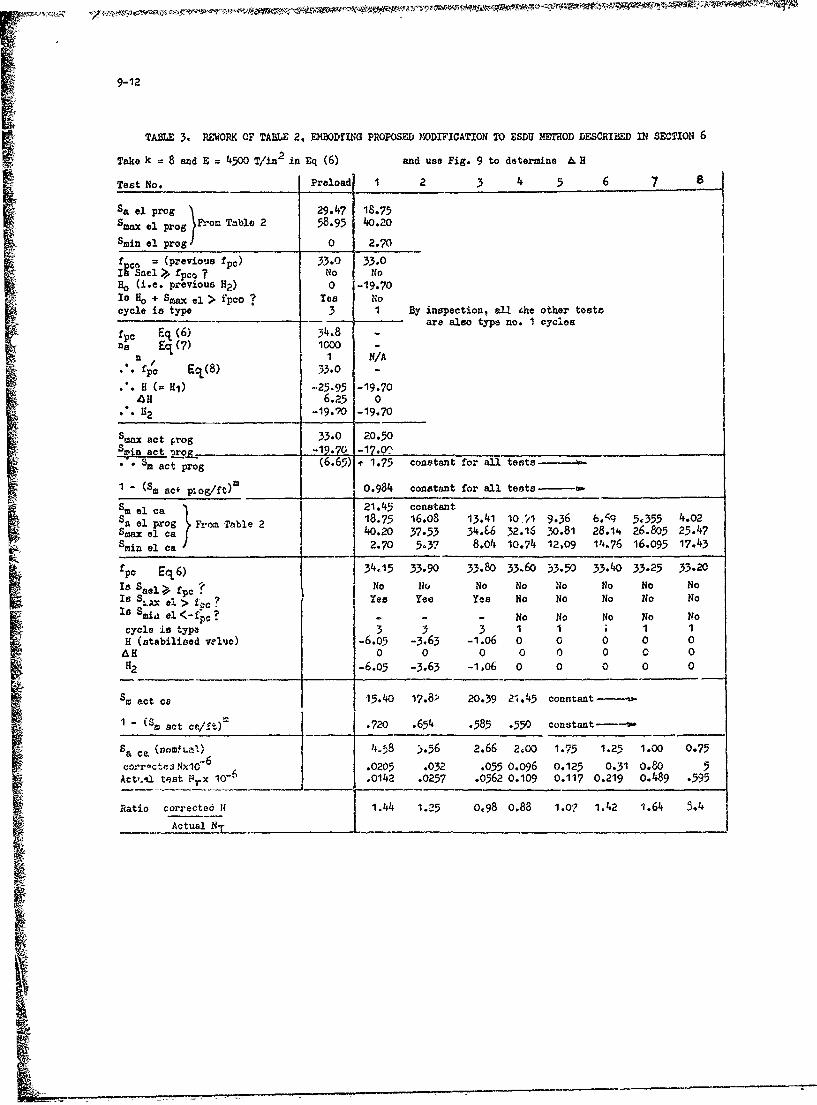
9-12
TABLE 3. REWORK OF TABLE 2, EMBODYING PROPOSED MODIFICATION TO ESDU METHOD DES.CRIBED IN SECTION 6
Take k - 8 and E = 4500 T/in2 in Eq (6) and use Fig. 9 to determine A H
Test No. Preload 1 2 3 4 5 6 7 8
Sa el prog 29.47 18.75Smax al prog From Table 2 58.95 40.20
Smin el prog 0 2.70
fco (previous fpc) 33.0 33.0I"sSel >/ fpco ? No NoHo (i.e. previous H2) 0 -19.70Is Ho + Sax el > k'pco Y Yea Nocycle is type 3 1 By inspection, all 4he other tests
-- -48 - are also type no. 1 cyclesfpc Eq (6) 54.8 -
as EqL() 100 A• /•InNIA
pc EcL( 8 ) 33•0 -• .H (- H1) -25.95 -19•70
40H 6.2-5 0• .H2 -19.-70 -19.70
Smnx act prog 33.0 20-50
Sm act prog (6.65) + 1.75 constant for all tests--
1 (Sm ac- p0og/ft)o o.984 constant for all tests
Sm el, ca 21.45 constantSa el progi From Table 2 18375 1608 13.41 1071 9.36 6.f9 5,355 4.o2Sma el ca 40.20 37-53 34-66 32.16 3o.81 28.1 26.805 25.47
Smin el ca 2.70 5837 8.o4 10.74 12,.9 1476 16.095 17.43
fpc Eq 6) 34.15 33-90 33.80 33-60 53-50 33-40 33-25 33.20
Is Saee >v fpc 'f No 110 No No No No No NoIs SI• &I > f'Zc ?• Yes Yea Yen No No No No NoIs Smia• el <- fpc ? - - - No No No No No
cycle is type 3 3 3 1 1 1 1
H (atabilised vplne) -6.05 -3.63 -. 056 0 0 0 0.8 04 H 0 0 0 0 0 0 0 0H2 -6.o5 -3.63 -1.o6 0 0 0 0 0
Sm act ca 1.5.40 17-8;' 20.39 2,.45 constant
1-(Sm act ce/'ft)m It720 .654 -585 .550 constant - ---
Se.•(~mu! 4.58 5-56 2.66 2ý,00 1.75 1.25 1.00 OM7
corr'cte'i NxIO-6 .0205 .032 .055 0.96 0.125 0.31 0.80 5Acty.•a test Fx 10- o0142 .0257 .0562 0.109 0.117 0.219 0.489 .595
Ratio corrected N 144 o,98 0.88 1.07 1.42 1.64 304
Actual NT
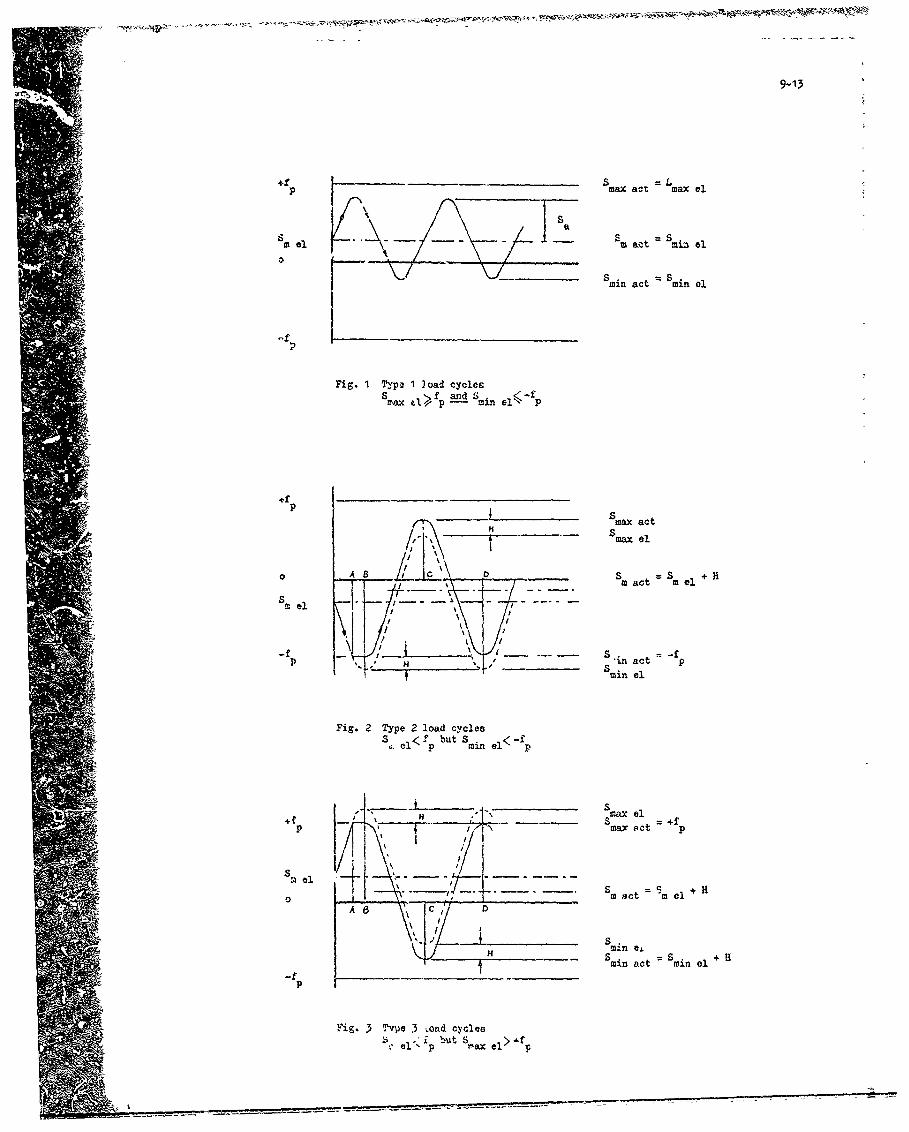
9.-13
+f max a.t m max el
S Mi act S miai el
Smin act = min 0l
Fig. 1 Type 1 load cyclecsmax 'L> ,p m ,and i -f
Pt p S
p ____ ____ max actH6 max el
, \
- , ' - S act 5 m C
min el
Fig. 2 Type 2 load cyclesI" but utS -fS•el< *p min e< p
+ Hmx elp N max act p
S el =•
""rSm act S el
g. 3T 3myn ei-f min act = min el,
Fig. 3 Type .3 •Oad cycles
•.el. " p ,uSax e!>*fr
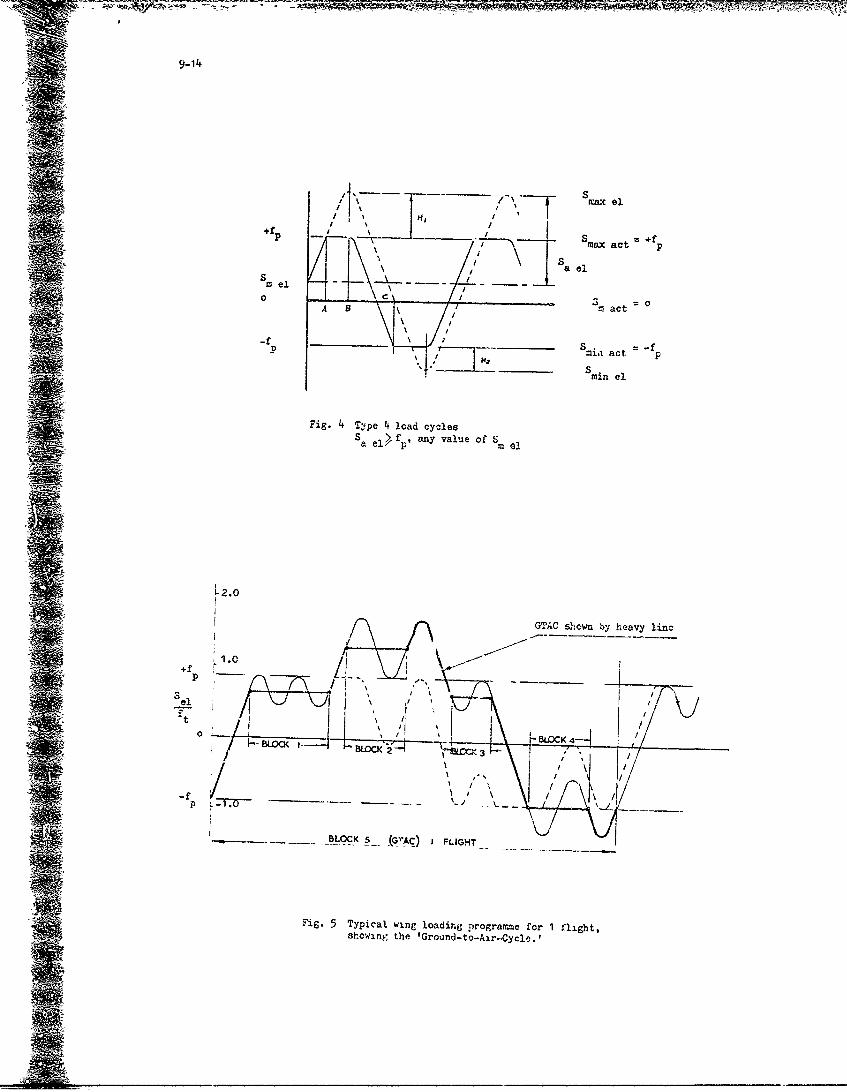
9-14
SI S i el.
f P S
max act p o
Sia elM el - -- -- -
0 0A IM act
P S mia act pf
Sin el
Fig. 4 Type 4 load cyclesSa el),fp, any value of sM e0
-2.o
t
tI /• /•GTAC shown by heavy linc
1.0~BOO -3 ' ~- ____
S /Io i\ Jj-\.,J ;I ,
o - /tI I ,, ,, ; i\ , -,/
- - ---- __ L C 5- I (GV C) I -- -'- IG4T . ! B O K 4 -'I,
1 I• • -•• • I _ . ' 4. ,- .i \ I , / ''I ,I I / ,
-/.1 / 1 /f\
-,,-, BILOCK 5 . _G'AC) iF.IGH'-T
Fig. 5 Typical wing loading progranme for 1 flight,showing the 'Ground-to-Air,,Cycle.,
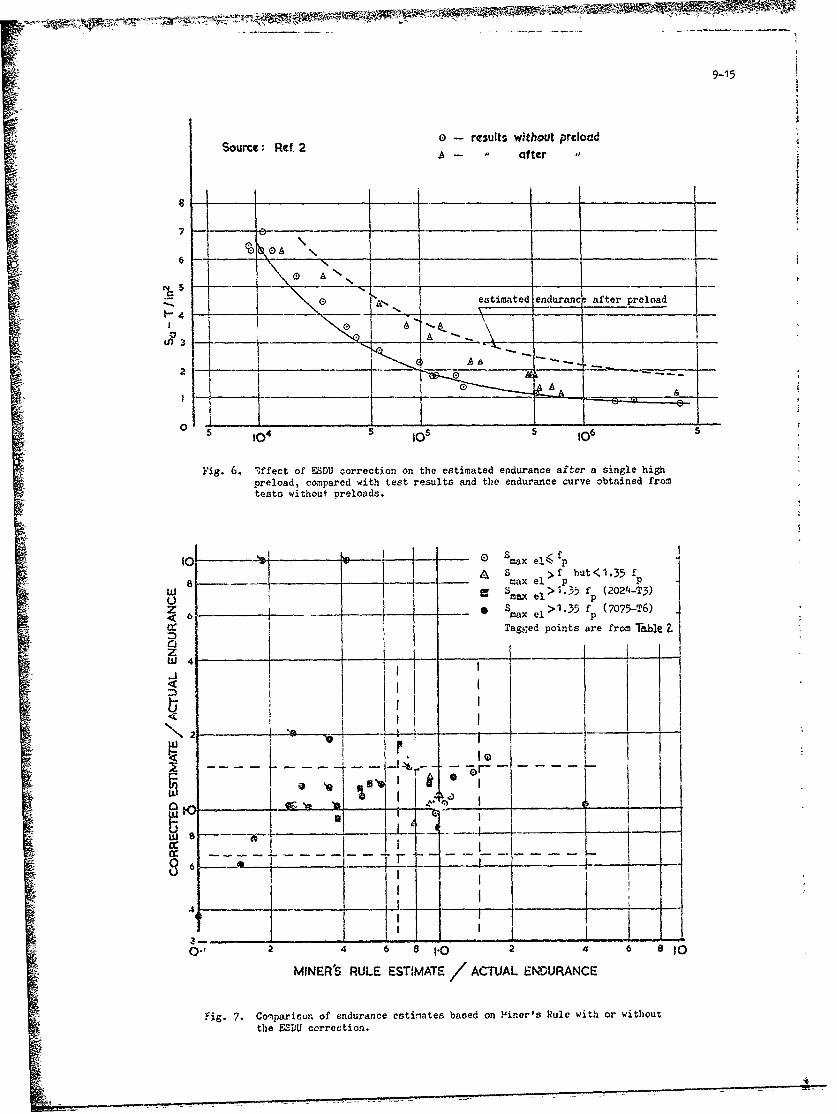
9-15
0 - rCsults wthout preloadSource: Ref° 2 A- af ter ,
7t0L A'o I _ _ _
ANI estimatedienduranc! after preload_+' 1 k e ___ __ A|__ -_ _
2 At &0 0
0 1o4 5 ~ 10 I06
Fig. 6. 7,ffect of E-ZDU correction on the estimated endurance after a single highpreload, compared with test results and the endurance curve obtained fromtesta without preloads.
0 S e~~to max e!l< fp
m_ _ _- A ax el>1.35 f p (2024-T3)
z 6 ->1ax el>1.35 f (7075-T6)< 6 mxecc I Tagged points are from Table Z
W 44. ___.__ _
I --- 2 -1--i\1 2
--I-- ' I, JL2 H.
O" 2 4 6 8 1.0 2 4 6 8a 0
MINER'S RULE ESTIMATE / ACTUAL ENDURANCE
Fig. 7. Comparisun of endurance estimates based on Miner's Rule with or withoutthe ESDU correction.
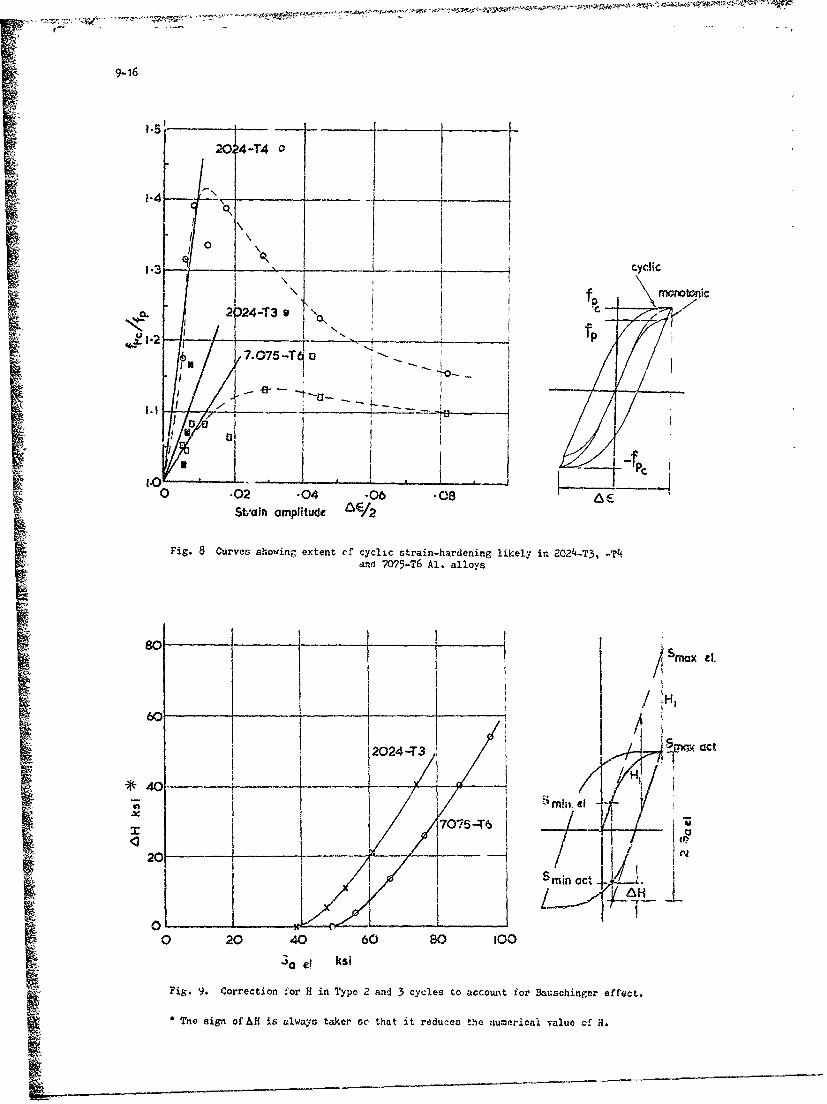
9-16
20, 4-T4 0
1-4 - _____1 t-----
13 ,cyclic
,• ~ ~2ý24-3 • _
7.075-Teo -
1.0I-;.I . -----i-Pc.,•--..---
0o.02 .04 .06 .08 1 aWtrain amplitude A6/ 2
Fig. 8 Curves showing extent ef cyclic strain-hardening likely in 2024-T3, -T4and 7075-T6 Al. alloys
_ _ _ _ _ _ _ _I80-
6 t I 2024-T3
K I•,7 - Oct'!
/7075-T I1(' / -20 (Y4/
I~I O Cmi
0 20 40 60 8o 100
4a e! ksi
Fig, 9. Correction for H in Type 2 and 3 cycles to account for Bauschingor effect.
The sign of &H is always taker sc that it reduces the rnumericai value of H.
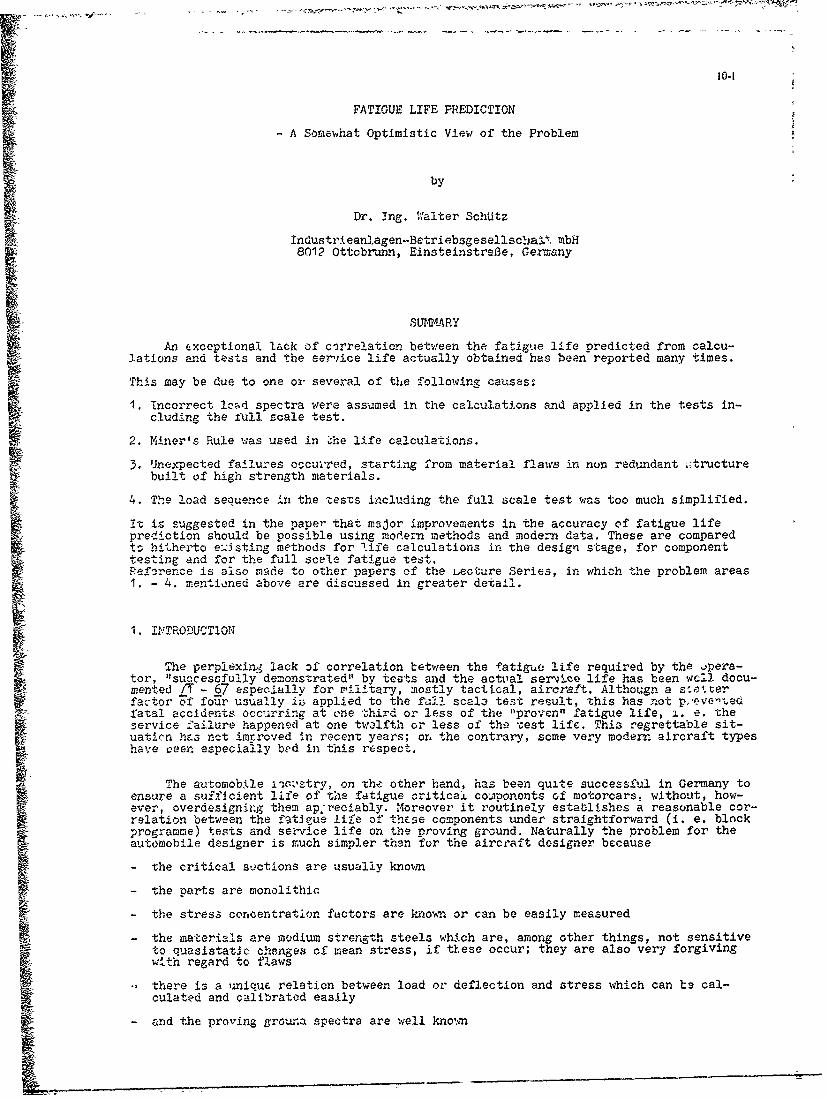
Io-I
FATIGUE LIFE PREDICTION
- A Somewhat Optimistic View of the Problem
by
Dr. Ing. Walter SchUtz
Industrieanlagen-Betriebsgesellsclai% mbH8012 Ottcbrunn, EinsteinstrsiBe, Germany
SUEMARY
An exceptional lack of correlation between the fatigue life predicted from calcu-lations and tests and the service life actually obtained has been reported many times.
This may be due to one oi several of the following causes:
1. incorrect le:d spectra were assumed in the calculations and applied in the tests in-cluding the full scale test.
2. Miner's Rule was used in The life calculations.
3. Unexpected failures occur'red, starting from material flaw¢s in nun redundant ýtructurebuilt of high strength materials.
4. The load sequence -in the tests including the full scale test was too much simplified.
it is suggested in the paper that major improvements in the accuracy of fatigue lifePrediction should be possible using modern methods and modern data. These are comparedt-o hitherto ezisting methods for life calculations in the design stage, for componenttest1--ing and for the full scale fatigue test.Reference is also made to other papers of the Lecture Series, in which the problem areas1. - 4. mentioned above are discussed in greater detail,
1. INTRODUCTION
The perplaxinr lack of correlation between the fatigue life required by the opera-
tor, "successfully demonstrated" by teats and the actilal serAce life has been wcl! docu-mented j - 67 especially for uilitary, mostly tactical, aircraft. Althougn a so"terfactor of four usually ii applied to the fall scala test result, this has not p..evce--'edfatal accidents occurring at one third or less of the "proven" fatigue life, i. e. the
service failure happened at one twelfth or less of tho cest life. This regrettable sit-uatica hMs net imtroved in recent years; on the contrary, some very modern aircraft typeshave oeen especially bed in this respect,
The automobile iiusstry, on the other hand, has been quite successful in Germany toensure a sufficient life of the fatigue critical coaponents of motorcars, without, how-ever, overdesigning them apreciably. Moreover it routinely establishes a reasonable cor-relation between the fatiJue life of these components under straightforward (i. e. blockprogramme) tests and service life on the proving ground. Naturally the problem for theautomobile designer is much simpler than for the aircraft designer because
- the critical suctions are uasually known
- the parts are monolithic
- the stress concentration factors are kmown or can be easily measured
- the materials are modium strength steels which are, among other things, not sensitiveto quasistatic chenges Of mean stress, if these occur; they are also very forgivingwith regard to ~laws
-' there is a aunique relation between load or deflection and stress which can be cal-culated and calibrated easily
- and the proving grouna spectra are well known
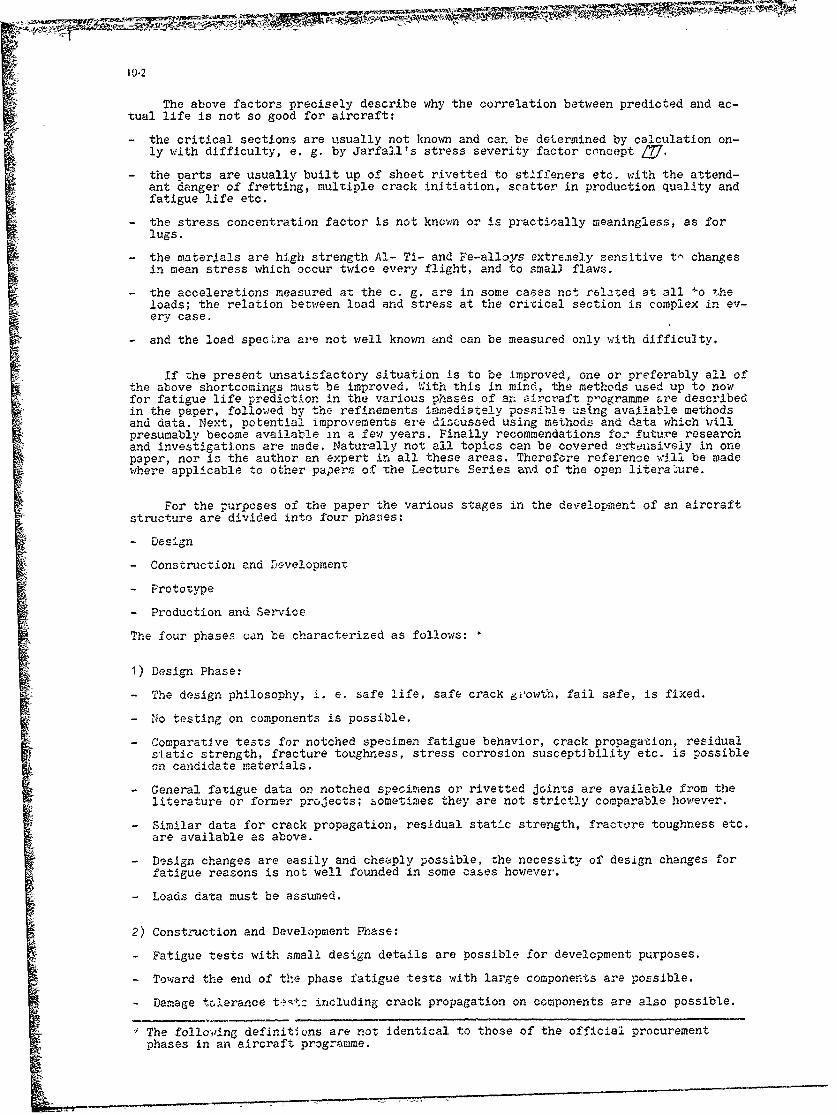
10.2
The above factors precisely describe why the correlation between predicted and ac-tual life is not so good for aircraft:
- the critical sections are usually not known and car. be determined by calculation on-
ly with difficulty, e. g. by Jarfall's stress severity factor concept T7.
- the parts are usually built up of sheet rivetted to stiffeners etc. with the attend-ant danger of fretting, multiple crack initiation, scatter in production quality andfatigue life etc.
- the stress concentration factor is not knovw or is practically meaningless, as forlugs.
- the materials are high strength Al- Ti- and Fe-alloys extremely sensitive t% changesin mean stress which occur twice every flight, and to small flaws.
- the accelerations measured at the c. g. are in some cases not related at all ÷o theloads; the relation between load and stress at the critical section is complex in ev-ery case.
- and the load spectra are not well known and can be measured only with difficu~ty.
if the present unsatisfactory situation is to be improved, one or preferably all ofthe above shortcomings must be improved. With this in mind, the methods used up to nowfor fatigue life prediction in the various phases of ar -ircraft pDogramme are describedin the paper, followed by the refinements immediately possible using available methodsand data. Next, potential improvements are discussed using methods and data which willpresumably become available in a few years. Finally recommendations for future researchand investigations are made. Naturally not all topics can be covered extvisively in onepaper, nor is the author an expert in all these areas. Therefore reference will be madewhere applicable to other papers of The Lecture Series and of the open literature.
For the purposes of the paper the various stages in the development of an aircraft
structure are divided into four phases:
- Design
- Construction and Development
- Prototype
- Production and Service
The four phases can be characterized as follows: *
1) Design Phase:
- The design philosophy, i. e. safe life, safe crack 6iowth, fail safe, is fixed.
- No testing on components is possible.
- Comparative tests for notched specimen fatigue behavior, crack propagation, residualstatic strength, fracture toughness, stress corrosion susceptibility etc. is possibleon candidate materials.
- General fatigue data on notchea specimens or rivetted 5oints are available from theliterature or former projects; sometimes they are not strictly comparable however.
- Similar data for crack propagation, residual static strength, fractore toughness etc.are available as above.
- Design changes are easily and cheaply possible, the necessity of design changes forfatigue reasons is not well founded in some cases however.
- Loads data must be assumed.
2) Construction and Development Phase:
- Fatigue tests with small design details are possible for development purposes,
SToward the end of the phase fatigue tests with large components are possible.
- Damage tolerance testz including crack propagation on components are also possible.
SThe follov'ing definitions are not identical to those of the official procurementphases in an aircraft programme.

10-3
- Design changes are easy but more expensive than in the design phase.
- Loads data must still be assumed, but forecast of the aircraft usage is availablef£om the operator.
3) Prototype Phase:
- Full scale fatigue test is possible on the prototype structure, as well as dsmage
tolerance tests.
- Design changes are quite expensive.
- The prototype is flyi ng, therefore limited data on prototype loads are available to-wards the end of the pnase.
4) Productior and Service Phase:
- Full scale fatigue test is possible on production structure, as well as damage toler-ance tests.
- Design changes are extremely expensive.
- Actual service loads are data available after some years.
- The service load spectrum may change later because of different operations.
- inspection for fatigue and other cracks is required in service aircraft.
- Structural damage due to a variazy of reasons must be repaired in service aircraft.
0-e chapter is devoted to each phase. Individual chapters are subdivided into the four
sections described further above, nqmely
- Present status.
- Refinements immediately possible.
- Potential improvements.
- Fuzure research and investigations necessary.
A few genera2 ý'emarks nay be in order before the discussion of the various methodsin tne four phases: A theoretical solution of the fatigue problem is not to be expectedin the foreseesble future. We are restricted, at best, to hypotheses based more or lesson phenomenological observations during a limit..d (sometimes very limited) number ofte~ts. Even interpolation between test results is not without risk, much more so extra-pclation. Therefore it is the best, if rather trivial, solution to simulate what happensin service as closely as possible, including the environment. As Schijve said at theAgard Conference on Random Load Fatigue in 1972, the necessary step from the firm groundof reliable test 6ata to the labile ground of assumptions and hypotheses should be assmall as possible.
2. DESIGN PHASE
2.1 Present Status
2.1.1 Materials Selection
The main materials for the primary structure of new aircraft have been selected forsome years no longer on their static strength alone but according to fatigue, crack prop-agation, residual static strength, fracture toughness and stress corrosion properties. Anigh strength titanium alloy in the STA condition has been dropped, for example, in oneaircraft project because of unfavourable residual static strength and fracture toughness.Instead, the annealed condition and Ti6A14V (annealed) were selected inspite of theirlower static properties. For establishing fatigue behaviour, complete S-N curves for 2to 3 different stress ratios on notched specimens with a Kt of 3,6 have been used in Ger-many. Sometimes only the finite life region was determined by two stress levels, if thisregion was all that was required for a modified Miner calculation, as explained furtherbelow.
For crack propagation and residual static strength tests sheet or plate spec-mens160 mm wide and 320 - 400 mm long are utilized, because a lot of comparable data is
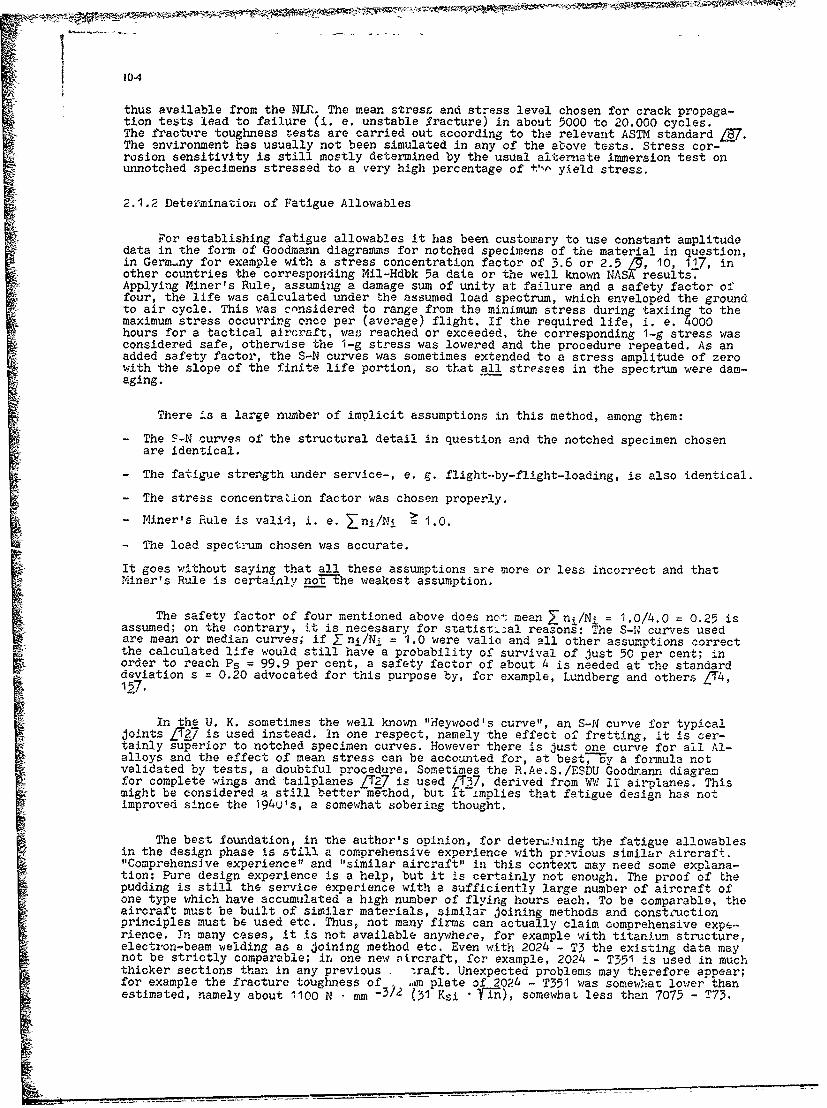
I
10.4
thus available from the NLR. The mean stress and stress level chosen for crack propaga-tion tests lead to failure (i. e. unstable fracture) in about 5000 to 20.000 cycles.The fracture toughness vests are carried out according to the relevant ASTM standard L97.The environment has usually not been simulated in any of the above tests. Stress cor-rosion sensitivity is still mostly determined by the usual alteniate immersion test onunnotched specimens stressed to a very high percentage of +'- yield stress.
2.1.2 Determinazion of Fatigue Allowables
For establishing fatigue allowables it has been customary to use constant amplitudedata in the form of Goodaenn diagramms for notched specimens of the material in question,in Germany for example with a stress concentration factor of 3.6 or 2.5 /1, 10, 117, inother countries the corresponding Mil-Hdbk 5a data or the well known NAS results.Applying Miner's Rule, assuming a damage sum of unity at failure and a safety factor offour, the life was calculated under the assumed load spectrum, wnlich enveloped the groundto air cycle. This was considered to range from the minimum stress during taxiing to themaximum stress occurring once per (average) flight. If the required life, i. e. 4000hours for a tactical aircraft, was reached or exceeded, the corresponding 1-g stress wasconsidered safe, otherwise the 1-g stress was lowered and the procedure repeated. As anadded safety factor, the S-N curves was sometimes extended to a stress amplitude of zerowith the slope of the finite life portion, so that all stresses in the spectrum were dam-aging.
There is a large number of implicit assumptions in this method, among them:
- The S-N curves of the structural detail in question and the notched specimen chosenare identical.
- The fatigue strength under service-, e. g. flight-by-flight-loading, is also identical.
- The stress concentra,ion factor was chosen properly.
- Miner's Rule is valid, i. e. Zni/Ni t 1.0.
- The load spectrum chosen was accurate.
It goes without saying that all these assumptions are more or less incorrect and thatMiner's Rule is certainly no_-t-he weakest assumption.
The safety factor of four mentioned above does no-; mean ni/N1i = 1.0/4.0 = 0.25 isassumed; on the contrary, it is necessary for statisTial reasons: The S-N curves usedare mean or median curves; if Zni/Ni = 1.0 were valio and all other assumptions correct• the calculated life would still have a probability of survival of Just 50 per cent; inorder to reach Ps = 99.9 per cent, a safety factor of about 4 is needed at'the standarddeviation s = 0.20 advocated for this purpose by, for example, Lundberg and others LT4,127.
In the U. K. sometimes the well known "Heywood's curve", an S-N curve for typical
joints LT2 is used instead. ln one respect, namely the effect of fretting, it is cer-tainly superior to notched specimen curves. However there is just one curve for all Al-alloys and the effect of mean stress can be accounted for, at bestý,-v a formula notvalidated by tests, a doubtful procedure. Sometimes the R.Ae.S./ESDU boodr.ann diagramfor complete wings and tailplanes LT27 is used ýT37, derived from W! II airptlanes. Thismight be considered a still better m'thod, but it implies that fatigue design has notimproved since the 194U's, a somewhat sobering thought.
The best foundation, in the author's opinion, for determning the fatigue allowablesin the design phase is still a comprehensive experience with previous similar aircraft."Comprehensive experience" and "similar aircraft" in this context may need some explana-tion: Pure design experience is a help, but it is certainly not enough. The proof of thepudding is still the service experience with a sufficiently large number of aircraft ofone type which have accumulated a high number of flying hours each. To be comparable, theaircraft must be built of similar materials, similar joining methods and constouctionprinciples must be used etc. Thus, not many firms can actually claim comprehensive expe-rience. In many cases, it is not available anywhere, for example with titanium structure,electron-beam welding as a joining method etc. Even with 2024i - T3 the existing data maynot be strictly comparable; in one new otrcraft, for example, 2024 - T351 is used in muchthicker sections than. in any previous , iraft. Unexpected problems may therefore appear;for example the fracture toughness of A ..Im plate of 2024 - T351 was somewhat lower thanestimated, namely about 1100 N - m. -3/2 31 Ksi - i•n-), somewhat less than 7075 - T73.
!
10-5
2.1.3 Residual Static Strength
The critical crack length under limit stress conditions (= 1-g stress times limitload factor) is also sometimes calculated, using the KIC-values determined in the ma-terials selection process and assumirng certain crack shapes and locations. The mostdoubtful assumption here is that the KIC-value determined from a cracked specimen witha certain crack shape is similar to the KIC in the structure, where the crack shane,the kind of stressing, the material properties and the environment will certainly bedifferent.
2.1.4 Design Philosophy
The design philosophy, i. e. safe life or fail-safe will also influence the mate-rials selection, the fatigue allowables, the residual static strength calculations etc.
2.1.5 Load Spectrum
In establishing the load spectrum, one must completely rely on similar aircraft ex-perience. It is therefore a great heý.p if earlier measurement programmes have been setup such that not only the loads on that particular aircraft type could be determined,but also information for the design of new types. Good examples of this policy have beenpresented by Buxbaum in LT6 - 187. There may still be difficulties, if new operationsare envisioned for the aircraft-in question, such as terrain following. Usually at thisstage not even the planned utilisation (mission mix etc.) can be forecast reliably, atleast for military aircraft.
2.2 Refinements Possible Immediately
2.2.' Materials Selection
The author considers the materials selection process described above quite adequateat the moment, with a few exceptions:
- Stress corrosion susceptibility should be tested on cracked specimens, because of thewell known sensitivity of some materials, notably Ti-alloys, to stress corrosion inthe cracked condition. A further advantage is that a number (KISCC), characteristicfor that material and environment, is obtained, suitable for calculating allowablestresses on a fracture mechanics basis. The specimen developed by niper LT27 cs to bepreferr.ed to that of Brown O_7 because with the former type a complete stress-time-curve can be obtained using 4ust one specimen. A still better idea is to perform com-parative tests both on unnotched and on cracked specimens in order to see if bothmethods rate materials in the same order; for some AlZn4gCu-alloys this was the caseL 17. Some further refinement aopears necessary for stress coxrosion testing and isdiscussed in chapter 2.3.1.
- If it is known in this phase that novel joining methods are to be used, like electronbeam welding, the materials should 1,e toaLed IL the joined, e. g. EB-welded conditions,A redesign of major components to a conventional joining method will be very expensive,if not impossible, later. All materials properties mentioned above should be tested,othenrise a grave midjudgeme-nt is possible. For example, at the TABC' fatigue testswere carried out on electron-beam welded 2024 - T3 sheet specimens 12,27. B optimlisingthe welding parameters, it was possible to obtain a fatigue strengtk at 10• cycles ofabout 80 per cent of the unnotched fatigue strength, far better than any other joiningmethod conceivable. But the fracture toughness of the 3B-weld was quite low, only a-bout 75 p~r cent of the unwelded ms-erial, see fig. 1. High faLigue strength alonethus does not tell the whole story; on the contrary it could lead to the selection ofhigh allowable stresses; possibly the static safety factor of 1.5 against ultimatewould be considered sufficient, with dire consequences when flaws, for example weldingporosities, welding cracks etc. were present or battle damage would occur.
- If the materials selected will be employed in an aggressive environment, the varioustests mentioned (fatigue crack propagation etc.) should be carried out in this environ-ment, which may however be difficult to define. For example the high residual staticstrength of some low alloy steels decreases alarmingly below -300C, a temperature whichwill certainly occur in service. Fig. 2 shows this effect. For determining the effectof saltwater on the fracture toughness of Ti6Al4V the following -procedure was adoptedfor a certain aircraft project: A precracked ASTM three point bending specimen wasloaded 'to about 25 per cent KIC in artificial seawater according to DIN 50 900 at con-stant temperature and p-h-value for several hours.* Afterwards, it was broken by in-
SThis short time in the corrosive fluid by the way might not be enough for other mate-rials like Al-alloys.
10-6
creasing the load to failure, KIC was determined per ASTM standard Z7, and compa:edwith KIC determined in air. Results are shown in fig. 3. This low constant load inthe corrosive environment is considered to be more representative of actual servicethan the usual step loaded tests at high percentages of KIC 77, because the con-stant 1-g stress in an aircraft is also only a small fraction )f the failure stresseven if cracks are present. Thus corros-cn damage, if any, is done at low consl-•ntstress, failure occurs at a single high strei. cycle.
The residual static strength of cracked sheet or plate specimens has been -a!'ulatedmostly as the maximum load at fracture divided by (W - 2 lo) - t, the uncracked aresat the end of the -rack propagation test, I. e. s-aole crack extension under ti.e risingload of the residual strength tes- w"as neglect' ; this hat two effects: !k depended oncrack length, even for specimens of identical thfckness and width and, 3n the whole.KC was too low. Liebowitz and Eftis /787 have pur/lished a method to corrtý for thesedeficiencies. Tests at the IABG g9hkave shown tnat this method indee& gves an im-proved, if somewhat too high, KC-vaiue, see fig. 4. However, film o- tf he -r&-zduring the test and inserting the crack length immediately before unstable f,•arelc into the calculation for KC is to be preferet and should be u.-ed from now -n.
2.2.2 Fatigue Allowables
The establishme.t of -atigue allowabl.es car. be impr- .ed by assum..ng Y-,;V' = .6;if high temperatures occur. mhich appreciabl' 2oder the , 9' strength,Zn//Ni'should be used. A comprehensive analysis 4 :f about ¢ 4 iight-_.<-fligrt es;t s-estaken from the literature (mostly NASA, .ARL) ar carec out at tI e IABG L5 •sshown about 50 per cent of the test ser..s to reach or exceed a damage Zum at failureof .6; at higher temperatures, this vas-e ae;reases to .3. see fig. 5. Further if S-Ncurves of joints similar to the ones tý be designed are available. they should be uciinstead of notched specimen curves.
2.2.3 Residual Static Strength, -r7ack Prnpazgtzon
Improvement is also possible ,r th& -rack F-;-. -on and rzid. I .atic Strengtharea. Especially if the aircraft or the structur-al member in guestin _s designed to thesafe life or the safe crack groc'h philosophy as defined i 6_7 is -xtremelv impor-tant to consider the effect of the allowable fatigue stress on :rack --Pagation iarlyas possible. With modern design the stress at limit load factor can be as n-g-nFtu/1.5, at least for short-lived tactical aircraft. The resui-z of the assumed • -
spectrum on crack propagation should at this stage be ana_ sec. by calculation. t
be assumed that flaws of a certain size and shape are presý:._ the material Irom taEbeginning; additional flaws may occur during manufacture of ýhe compore-- ý_ quest_•n,e. g. welding porosity, welding cracks et:. The Forman equation
d21 C nT R) . X, - 2 -7_7
has been proved by several research laboratories to give the best appiuxlmatJon to testresults for many aircraft structural materials. Figs. 6 and 7 show some examrltc of re-sults obtained at the IABG L27. It aas demonstrated by these tests that the constantsC and n in the equation, determined by a few tests at cne stress amplitude and mean trnn,can be used for other mean stresses and stress amplitudes with reasonable accuracy aslong as R 0 0. For R 1 0, they must be derived from new tests at R -'. It was also dem-onstrated that the portion of the stress amplitude below zero cannot be neglected £uisome medium strength materials (e. g. 2024 - T3 or Vascojet 90), while for high strengthmaterials (e. g. 7075 - T6 or maraging steel) it can, see fig. 8.
The Forman equation was originally intended for constant stress amplitudes. It canalso be used for variable stress amplitudes by calculating the crack propagation per in-dividual cycle, neglecting the well known retardation by cycles with high maximum stresses.It is suggested that in the design phase this very simplified procedure is good enough atthe moment for the following reasons:
- The calculation 1s simple, many firms already have computer programmes for the Formanequation.
- A deterministic sequence of the loads, as requireu by all of the methods which cakeretardation into account, is not needed except near KC nor is it available at thistime, If ever.
- All the other phra.iivLuui:r1, 1. Aý strasses, design details etc. are still veryinaccurate at this stage.
-- - - The result is conservative. This conservaism is very useful ,hcn the 'eight of theaircraft increases later, as it 'ertainly will.
10-7
For resildual static strength or fracture toughness calculations, the critical cracklength shoula be calculated and compared to the sensitivity of the NDI methods envis-ioned 'when the aircraft is in service. The sensitivity of the NDI method must be Judgedin a statistical basis under service cond'itions, not on single fortuitous results under_.._-7oratorv conditions. :;umerical data are- available in the literature 30, 317. When theregions of _he structure for which fracture mechanics calculations are perfor~med, haved_-contý.nu.--e? of very large size. like cutouts or wing pivot lugs for v. g. aircraft,the nominal stress must not be used, as shown by one such case in Germany'. Instead theV-__erste 'level in the vicinity of the discontinuity must be oubstituted in the cor-rer--"'inp :-nacttire ,.echan-ics eouation.
.2. Des-,Pr 'ýilosophy
ýor Ple.1 _:icraft, only the fail-safe or the safe crack growth design philosophy-:oler-- tce __t-he definition of ff67) should be allowed, because with the pure
s,- anroah -n, ý-zructural faý ures have occurred. For designs which are a!-r' -~tt<to thý safý life philoscphy, a calculation of the crack propagation and
of sta-, streng.-th should be mandatory in this phase, to be verified later_n _a 1cai,ý test :rogramme.
= -~•a~e .ý;.red afthe structure for several reasons:
- ~ tr a1fI-~ have nst been detected during manufacture and which
:iax res-cn in onl';- few aircraft and not in the full scale test article
- ~ -- rozsion c.-, xs, ::~robjects damage and, last not .~eatst, battle d-amage.
-_ 7,ý -l.u-~ tsure -hen the full scale test has not yet been per-:ore~ seesecý:on 1
§ -- - ~n~er lac, of-r-teweer. the P scale test lif'e and the service
note: _ :<, r a -,eans would also apply if no repeate -,Id-- .'Ouldocccr
-onsidern, i, no-jemen, n -the materials selection process will be nossible i.f_e Drozperic L.- I I nfer 1, judge-d on constant amplitude tests, but on ran-
~y-f igo te-o.~K utihorls knowledge, there are at least "four research.:r-:20% p'ra resent:
- ýsts .iha starndardiz__ paoo rocess sequence on three aeronautical materials,- :3 ~i -7~'' -a~~ngsteel. This is a cooperative programme between the -13
_- he 1. gone, ta-l_ pseudo random sequence is being, develcped and wlbe u~ -, -- fytink ort n ant practical requirements. For example ,Iarkovian-ransi-Lons _il)l b- isea -__ ýý-oit -.he (in service) ';er, unlikely or even impozsible
4ý ~occurrt-i - of a very larrle stress excursion followi-ng a very small stress e/cur~si-11,44-- l~ntlng tim#- nu:+ not _-3 too long etc. Additional details a--e given in L7 27 .i 01. 5 ' .6 are employed; all results w'ill be a~ioei 9'~it is portulated that this or a similar sequence it more universally uzsefuil for the
i~n:r~tonof faýtipue properties ýhan flight-by-flight tests.
-Three different, typical, automotive boau spectra have been standardized and are belnEP-Iitl £n randomr tat to typical automobile _-_lrponents like _;ele spindles in a large
MM P colo'peraitive programme of the Cummulative Damage Puho-onimittee of the TOivisiofl 4 .oin-i~w-WE mitt,6 "Residual ZItressec and Fatigue" of the SociEty of lutomotive Engineers. one of
the objectives of this programme is the generc'tion of -iterial information for desIgrpurposes. Details were recently given by Jaeckel /337.
-Standardized flight-by-il~ight tests with a gust la ecr.In addition ta -'tceSAl-alloys, typical riP'eted 8ing½l and ,>,ble shear j~c.ts
are~wpoye. .ith the single shear Joints sever,.x -alues (,f ~-coi.- y bending afxapplicl as this does influence the _fatigue life. Th -rults ~.il be /allable in 1:t,for further details -,e,- /147., Land- iz H- fl`,,Lt-bý-flight tests with n maneuver bon.1 -pectrum. in.. :s ~ opera-tl*;e p:arr~ebetenLR LB and IABG and will start in -)77. load and +r.-quences typical for various fi=ghter operations li. ' ground atto~k etc. ha.t -Ire
1-eon ~ ~ ~ ~ ~ Z Ue~u~ "te8~ h ocmn il again be typ-,cal jo.,rnls and notcn I! f.,.ibeenrieiup t e._eieo
10-8
In a relatively short time, we will therefore have available
standardized sequences for components stressed by flight-by-flight loading under ma-neuver or gust spectra as well as for components not exposed to the g.t.a.c. and
data on the fatigue behaviour of some materials, partly even in the form of rivetedjoints, under standardized, but realistic loading.
If it could be established that for materials rating, which is qualitative anyway, onepseudo-random sequence would be good enough, a lot of tests could be saved. For example,in crack propagation tests on 2024 - T3, 7075 - TC L357 and T16A14V 4767 under similarflight-by-flight loading to a gust spectrum the omissTon of the g.t.a.c. gave even quan-titatively similar results, i. e. an increase of the number of flights to a certain cracklength of 45 to 75 per cent.
For rating the fracture tuughness of materials, the ASTM standard L7 in force atthe time should be sufficient. It is to be expected 077 that a similar standard will bedeveloed for thinner sections where plane stress condItions prevail. Crack propagationtests employing the standardized sequences mentioned above should also be available in afew years' time.
The one other area where large improvements are necessary and, indeed, possible inthe near future is the effect of the environment on the materials properties of interest
Shere. This is especially true for stress corrosion t(.sts, where "SCC testing must takeon broader dimensions than the important but incompl te story told bv 600 seconds of im-mersion in 3.5 Y% FaCl solution followed by 3000 seconds out of it" (Anderson in Z787). AsAnderson suggested in that paper the actual load sequence including hold times miglt haveto be simulated in order to get data of engineering significance. We then no longer have1 stress corrosion test in the present meaning but a corrosion fatigue test.Mr. Anderson will present detailed information on this subjec• at the Lecture Series /797.If the hold times occurring in service, for example on the upper wing surface of an air-craft, must be simulated in actual timc, these will indeed be expensive tests: Even tac-tical aircraft, which have a required life of only 4000 flying hours must last for 15 to20 years, not much shorter than civilian transports. Research is urgently necessary inthese respects, see section 2.4.1,
2.3.2 Fatigue Allowables
Progress is also to be expected, when the fatigue allowables are no bnr.ger deter-mined by constant amplitude tests, with the attendant assumption that Miner's Rule isvalid. Rather, the results of standardized r-ndom or flight-by-flight tests, even on sometypical joints, will be available for that )urpose. If new tests are necessaro because ofnew materials and/or joining methods, these standardized sejuences should be used. How-ever, when the load spectrum of the aircraft in question is known to differ from thestandardized spectrum, some sort of damage accumulation hypothesis must still be used.Employing Miner's Rule only as a racnsfer function, the life under the different spectruincan be calculated. It is not necessary in this case that the damage sum is unity, as pos-tulated by Miner, but only that the damage sum is similar for the various spectra ("rel-ative" Miner's Rule). This i.vpothercs, as demonstrated in Lf57 and /ZO7, gives reliable re-
sults, as long as the spectri do no' differ too much as to shape and severity *. I wouldlike to come back to the remakrk at the beginning of the paper: The necssary steps fromreliable test data to nearly calculated data must -e as small as posrible! The effect ofchanges in spectrum shape and severity on fa:igue life will be invescigated, by the way,in several of the cooperative programs mentioned in section 2.2.2, so it will be knownin the near future if the relative Miner Rule is generally applicable.
2.3.3 Fracture Toughness
We will certainly see a requirement to the materias producers to guarantee minimumKIC-values for their products. Some producers already are willing to give such guarantees,for certain materials; several aircraft firms already requ_,re mi-Aimum fracture toughnessfor specific applications. Progress must be made in the calculation of the critical sizesof actual flaws. For example, thý quenching crack shown in figs. 9 aid 10 gave a lower KICthah'a corresponding fatigue crack. This may b', ziuo to the embrittling or corrodi•ngin-fluence of the quenching medium or to the greater sharpness of the quenching ca-aeK tip or,most probably, to a combination thereof. This result again pol.ts to the effect Jf theenvironment on all the properties in which we are interested arid which will have to beinvestigated in the near future.
Mr. Crichlow will present simrlh" techniues Lockheed ha: been using for many years atthe Lecture Series X17.
'0-9
The scatter of KIC will also have to be taken into account, because the presentmethod, using mean KIC-values, implies a probability of fracture of 50 per cent. In theliterature there is a fair amount of data showing statistically evaluated KIC-valuesp67; at the IABG we have found L57, 587 that s = 0.05 is a conservative standard de-viation of the fracture toughness of a large number of different aeronautical materials,when the specimens were taken out of the same plate or forging, see fig. 11. For spec-imens taken out of different plates or forging, extremely large variations of KIC havebeen reported for one steel at least, by Wood L727.
-hen welding is ulitized as a principal joining method, as in several modern air-craft, it must be assumed that several pores, not just one, will be present in the weld-ment. There is a test programme underway at the IABG at the moment to investigate theeffect of these multiple flaws, which are usually not crack shaped, on fracture toughnessand other properties. A similar problem has to be solved for riveted joints where mul-tiple crack initiation can occur under the rivet heads.
2.3.4 Crack Propagation
We should be able to calculate crack propagation under variable amplitude loadingwith reasonable accuracy in a few years' time, using methods which take retardation byhigh maximum stresses into account. Mr. Wood gives an overview of this important topicin this lecture Series !27. Several methods are available in the literature ý73 - 467,none however has been compared extensively to test results. It would be a very worthwhileengineering effort to check the accuracy or otherwise of these various techniques againstthe relatively large number of random or flight-by-flight crack propagation tests avail-able at present; in the near future, more test results will become available, for exampleunder the standardized sequences described in section 2.3.1. Fundamentally the method ofHabibie •3, 44, 847 should be superior, if only because it requires a realistic flight-by-flight or random týest as a basis; thus, "the step from reliable test data to merely cal-culated results" is small. For a flight-by-flight load sequence used by the NLR /57 andlater by the IABG 767 on 2024 - T3, 7075 - T6 and Ti6A14V sheet specimens, Habibie dem-onstrated good correTation between tests and calculations. A practical disadvantage isthat a flight-by-flight test is first necessary to determine the required constants. Thisdisadvantage will however disappear, as soon as test results become available in suffi-cient quantities. The "USAF-method" 757 has the advantage of simplicity, as only consTintamplitude tests are required; the necessary calculations are not too tedious, especiallyif a computer program for Forman's crack grorth equation 777 is already available. Forexample, we have recently expanded the Forman computer program at the IABG with littleeffort to include the USAF-method.
One snag is inherent in all methods which take retardation into account: As the ef-fect of single high stress peaks must be allowed for, the deterministic occurence ofthese peaks must be known. It can be known if ever, only after the aircraft has been inservice for a long time like the Venom g77, and then not with any accuracy, as the loadsoccur in a more or less random fashion. Thus a conservative sequence must be assumed,i. e. one with a small number of high loads if the crack propagation in an actual aircrafthas to be predicted.
2.3.5 Loads Data
The number of loads measurements is steadily increasing; it is to be expected thatin future aircraft types several representative aircraft per squadron will be equippedwith an instrument, e. g. tape recorder, which continuously records strains at a largenumber of points in the primary structure as well as other important airplane parameterslike c. g. accelerations, velocity, altitude, flap settings etc. These "recording" air-craft should be flown by service (not test-) pilots in routine squadron service. Thecorresponding tape recorders, if not already available, will be developed /A87. One addi-tional advantage of measuring strains at many locations is that load spectha-(strictlyspeaking ever, load sequences) will be available for those components for which there isno correlation between load and acceleration at the c. g., like the empennage or the land-ing gear. Such spectra are not well known at present. Every aircraft should at least
carry a fatigue meter or similar instrument. The problems of measurement with these ac-celerometers will be presented in more detail by Mr. Lambert g97 at this Lecture Series.
2.4 Future Research and Investigations
2.4.1 Materials
It is evident that the development of materiels, preferably Al-alloys, with superiorfatigue, fracture toughness etc. properties (without loss of other qualities) would con-siderable ease our problems. To the author's knowledge, new alloys of improved fatiguestrength have not been developed on purpose, the (small) gains, if any, obtained up to
FV10-1C
now have been accidental byproducts cf metaliurgical and processing changes for otherreasons, like the T 73 heattreatment cr the addition of silver to AlZn~vgCu alloys to im-prove stress corrosion properties. So it would be a very worthwthile effort to try andimprove the fatigue strength, which should then be verified by tests on notched specimensand typical joints under realistic loading, preferably the standardized sequences men-tioned in 2.3.1, and not by the rotating bending tests on unnotched specimens so dear tometallurgists!The prospects of improving fracture toughness and ýsidual static strength and, to a lim-ited extent, crack' propagation resistance without decrease of static strength look muchbetter. Steels as well as Al-alloys ha-re already been developAd with this aim; for examplethe new AlZn~gCu alloys 7050 and 7475 do have a superior combination of residual staticstrength and crack propagation properties as shonm in Jigs. 12 and 13L/f07, 'ompared tousual Al-alloys like 2024 - T3 or 7075 - T6. The author has shown 517-t~at hight-strengthmaterials are very sensitive to mear. stress, i. e. the allowable stress amplitudes aremuch lower at high pcsitive mean stresses that at zero mean stress, see fig. 14. So itwould already be an improvement if a h4gh strength steel or Al-alloy could be developedwhich did not exhibit this unfavorable cbaracteristic.
The effect of the environment on the materials properties must be investigated thor-oughly. First a definition of the actual environment is necessary. is a test in 3.5 percent NaCl actually a close enough simulation of an airciaft environment?
Second, corrosion is assumed to be a time-dependent phenomenon. However the cobinedaction of time and load, especially if the latter is variable, can reverse this effect,as reported in L787 and shown by some IABG-results 517, see fig. 15. !Pere, tests undervariable (8 step-programme) loading demonstrated a much smaller effect of a saltvater en-vironment than tests at constant amplitude, altiough the former took about 10 timeslonger than the latter. How can this be explained?
Third, a possibility must be found of shortening the testing %ime compared to actualservice time, otherwise the tests take too long, are too expensive and their results cometoo late.
2.4.2 Loads Data
The sequence of loads measured in service by continuous'y recording instruments mustbe evaluated statistically, whereupon the original "history" is lost. This evaluation canbe done ir many different ways, van Dijk, for example listing ten methods in _/87. It isby no means established at present which method is best, especially if it is consideredthat loads measurement programmes may have different objectives: Fatiguc life assessmentof' individual aircraft, or data for the design of new aircraft, or setting up of 2 fullscale fatigue lest. It -,ay well be that different counting methods must be used for theaifferent purposes, as proposed in ZF87. Further research is necessary in this respect;the question wh"h evaluation methoc- Ts best (for the purpose) can only be answered em-
-1 Ppirically, i. e. by tests with the real load sequence ana t1fe synthetic one, assembledfrom thŽ spectrum. With the usial evaluation methods, an additional importart information:.s lost: The correlation between stress anolitude and mean stress. ?ome materials aresensitive to positive mean stresses, as explained in section 2.4.1, others are not. So-c may well be that comparative tests with the real sequence and the synthetic one may
give good results for one material and not so good results for c second material.
3. CONSTRUCTTON AND DEVELOPMENT PHASE
3.1 Present Status
3.1 . Design Detail and Large Component Fatigl'e lests
At present, the fatiguc strength of small design details (e. g. lugs) is still most-ly judged by constant amplitude tests. The re.lts are often compared to other similardata, if available, or to notched specimen -1 curves to check on the design quality,"fatigue performance irdex" /f37etc I if it is below a specified quality, 2t must be im-proved. The fatigue life in service is then calculated using Miner's Ruledetails beingexplained in section 2.1 2. Except when it is definitely established that2ni/Ni : 1.0under realistic loading, as for lugs ý4. 5L7, this method can result in a significantoverestimation of the fatigue life in service. This is true especially if methoas in-ducing residual compressive stresses, such as coining, cold rolllng, shot peening etc.
"*Mr. Cr cnlow Iz presenting similar methods Lockheed has been using for many years atthis Lect.re geries /717o
natve been employed, as on practi-.ally every moder-n aircraft, and are being checked oroptimised on. the results of cor~stakic amplitude teats. The occasional high loads charac-teristic of the more or less random sequence of senrice loads can reduce these beneficialI ~residual ctresses much faster than is juaged by constant ampli-tuade tests... For example, byfar the lowest damage sums to failure, below 2 njJ19i = .1 were found 1147 for surfacerolled axle spindles. in other IABCG ta~ts, the number of c~jl.es to faill~re _n constantamplitude tests was increased nearly ten. times by coining. Under the F-104 G flight-by-flight sequence, the life increased o~nly by a factor of two.
Large components, even If trey are vital for the structure and a design change inthe prototype stage would be probilittvely expensive, such as wing carry through struc-turaes etc. are still sometim'is tested tinder constant load or simple block programme~sL157, althoug- - it is possible that not evep the correct failure locations will show upln such s implified tests 97, 687
3.1.2 Damage Tolerance Testcs, Including Cilack Propagation
The residual static strength of cracnjd parts i~s usually not checked by tests atpresent, one depends on cal:,ulation.3 as,,uw.ing
- that the part will act, i. e. deliver the same }KIC, lihe a standard fracture toughnessspecimen not even t;aker, from the pact it:,self.
- that the :ýritical loca'Aiors, where the cracks will start, and the loads are known and
- that a valid formula for the cilculation of the stress intensity factor for the (as-
sumed) crack shape is available.
~.t least the first two assumptions are quite weak.
For big components crack propagation and residual static strength -%,sts are usuallycombined with the fatigue tests mentioned in sectior. 3.1. The residual static strengthis sometimes determined 1-1th sawouts inst-ead of a~ctial cracks, although it i s not certainif the results will be si1milar, especially if one has to consider cracks ot-her than fa-tigue cracks, like forging laps, welding cr quenching cracks etc. If residual staticstreng'h is just calculated, additional d~fficultits, cofzpared to simple components, arethat the load distributton is usually not well knuivm and that reinforcin5 structur:ý,fastoner holes etc. is noL accounced. ior inl elementary f0racture mechanics theory.
3.1.3 Loads Data
Late in this phase the planned utilisation cnn usually be obtka;ned from the poten-tial operator. so -i reaconable *e~uence .,i loads could be set up for flight-by-flighttests on the large cornonents.
3.2 Refinom-ent, Immediately Possible
3. 2.1 Dessign Detail and Large Component Fatigue Tests
As ex-olained in section 2.2.2 Yni/Ni .6 should be assumod for fatigue lif~e cal-culatons;if however methods like Folining or shot paer.InZ have been applied,'nj/Ni =.05
appears tc be a conservative assumption. Large importsnzit ccmp.;nents zshould in every casebe tested under flight-by- flight loadir-g. using the moat severe spectrum reasonably to beexpected in service. Only a few ',ig aomponents car. over be tested in one aircraft pro-gramime, therefore the much more relinable in._r-rm~tion flight-by-flight tests give is tobe preferred. What is more, v-Ach tzsts car. actuallyv co--t lerss theaq corresponding S-N tests,because a much smaller number of expensive c3o~pnentg is n~eeded. "Severe" spectrum mayneed some explanation: The nurber cf amplitud';s of medium size must* be increased - not thehighest amplitudes of the spectrum. On the contrary. ons s1vnuld be c~ereful not to apolytoo high loads, because these vill usual.1y p.'olong ths fatique life. Schijve ff5 anddthers propose to trincate thpo apectrum at a load levdl ex-.eded aboult 10 times iI? t~etarget life. If the test must be acceleretod, as for lo%.g lj.ce ::ir~raxt where in thisphase more than one hrrndr~eT~-_uzan*d tlights might have t, -esizulated, this should bedone by leaving out small amplitiides, perh-aps onl,. aiter ieveral thoutssnd completeA 'limhts have been applied, as Kirkby haa ahwimt flh ttfe-t*,dmgei oevrearly in the fatigue l-ife under random loadlng.,
3,2.2 Damage Tolerance Tests, including -rack Propagation
The manufacturing processes for parts, expecially forgea ones, can be optimlsel,although with some effort, for maximum fracture toughn(.ss and minimumn residuail teviliestresses. As shown by 1ABG experience, it may even be possible to build up residuc-i comn-pressive stresses by judicious use of heat treatwer~t variables. In aniothez ca~e, usinaa roueh die plus a finishing die instead of just one d~e resu-Ited in a learge impirove-ment in fracture toughness and critical crac~k size, see figs. '16 an! 17, althaough thematerial as such was nominally identical.
Teany exp'irts have required that for critical appli~ktions the standard specimenfor determination of -the 'fracture to-ghnf must be takert -:tt of the part or componentitsself. This requiremenit can be met immediately, if at a,4dit"onal cost. One is remindedof the ertalogous procedure for castings: Formerly the static properties of a castingwere determined by separately c. st specimens. the properties of which were not neces-sarily similar to those if the cacsting, So it ýAas been a requirement for many years thatfor high-quality castings the test specimen must be cast integrally with the actual part.
3-3 Potential Improvements
3.3.1 Design D-at-il and Large Component Fatigue Tests
Design dc.tpils should be tcste6 under the standardized scquences mentioned in sec-tion 2.3.1, especially ýf methods for fatigue strength improvement by induc:ing residualvompressive str.~sse-i have been applied. Some advantages of these standardized test- havealready been mentitnel in Zections 2.3.1 ar.a 2.3.2. There are, however additional good1reasons for suchý tests:
T- Te test- re-tilts are directly comparable; they can be usod to build up a suitable"Ifllbrary", agrainst which to Judge the qual~ity of later design etc,
-The planned utilisation (mission mix) will on!,- be known late in the phase, too lazefor design detail tests.
-it is a big simplification if only one load sequence, and an already existing one atthat,ý can ~be employed, because in a~n-ircraft programme using new materials and tech-niques a lar~e number of design detail tests must be psrformed and programminr a dig-ital cc.-nputer or other programming device7 for acb ne.. ýnbt- can -a .,.y týimfe coni-suming.
Big comph'ne:Ats shoule b3 tested to their individual spectra, as deteiled in section3.3.2. However, some progress 'is to be expected in the near future: Calculation methodswhich will indicate the 4'ztigue critical sections in large, complex structures are al-ready availaole !f,9, 607. They may have to be combined with Jarfall'z Stre~ss SeverityFa,;ztor Concept L , T1-to indicate the individual ,'itigue criticsl fastener in built-upstrictures. More tests aria measurements, for example to determine fastener flexibilities,will certainly be necessary. Anyway, these methods should allow us to improve the fatigueproperties of components 17 distributing the material where is it needed and, hopefu.lly,by predicting the Ifttigue life by comparison with -known results of a similar stress se-verity factor, all before the actual fatigue test has been performed. For ships. this isalready theoretically possible, because the local stress distribution at any section canbe computed with~ quite good accuracy Lfg7 anda the necessary fatigue t~est results areavailable 1/61, 62".
3.3.2 Damage Tolerance Tests, including Crack Propagation
In a few years! timte, we can expect a lot of new methods and some di~ta on the appli-cation of fracture zmechanics to actual parts and struc-tures. In the authorts opinion theobJective of any fracture mechanics calculation in this thase is to be able to computecorrectly the critical crack length or the fi~ling load Zresidual static strength) or theallowable stress, when the respective other para-meters in tbs fracture mechani-ls equationare known. It is postulated that the practical difficulties of obtaining correct resultswill be far great~er than the theoret:ýcal ones, even for monolithic parts. For exampletests at the IABG on nose landing gear struts have shown that depending on crack shape,size, location and orientation, the residual static strength of the strut would have beenundc.r-estimated from~ -,ro -Lo more than one hunerere' per cent, see fig. 18. The eompar sonwas made with the residtial static strength calculated from valid ASIVTM T ~~alues of CTspecimens tak~en out of the strut itsself, which, by the way at *30 Ksi in. agreed ver.,closell, with values taken from the literature L7PJ* for the material. The normal calcula-tion procedure using published KIC data for the Eaterial thus would have been more orless conservative, but. the large scatter is nevertheless disturbing, as it implies thatthe calculation might also somet-imesc be urconservative.
10-13
For built--up structure and for crack propaiaticn the picture does not look too
rbassuring either at the t.oment. "None of the cracks which had been initiated duringservice or during tk~e tests at the L.rner6 of cutouts propagated aopreciably or werethe locations of evertual static failure, even chough some-cf thest. cracks were fourincbfs long" -637. Some other authcrs 'n In-47 are not so pessimistic. Using une of theeth~ods (matr x force analysis) described in section 3.3.1. Swift demonstrated in LS7
that the residual static st-ength of curved and even stiffened panels could be prei c-ted ,_th an error of less then * 10 per cent. One other example: The effect of ballisticdanage on the resiaual static strength of complete wings was also closely predicted byapplication of fracture mechanics at ýhe IABG. We will therefore have to depend in thefuture on a judicious mixture of a large number of well-planned damage tolerance testsand of complex computations,
3.3.3 Loads Data
See eection 2.3,5
3.4 Future Research and In~Vstigations
In the author's opinion it will be the most fruitful field of investigation to ob-tain enough data to prove or disprove the calculation methods mentioned ir sections3.3.1 and '.3.2. Expecially if large components iust be replaced ii, service aircraft,such as the wings on the C-130 f7 these components should not be scrapped but fatigue,crack propagation ard re3idual static strength tests should be carried out. It shouldthen be tried to calculate the failing load, critical crack length, crack propagationetc. using available or new methods and to compare te';ts and calcalations.
4. PROTOTYPE PASE
4.1 Present Status
4.1.1 Full Scale Fatigue Tests, including Damage Toleranze Tests
A full scale fatigue test is possible in this phase; if it is opportune, will bediscussed below. mnyway, the main objectives oi Zhe full scale fatigue test may besummarized as follows:
- determination of the fatigue critical points
- fatigue life
- crack propagation and residual static strength of the struture
- fail safety I- fatigue life extension, if necessary -
- determination of inspection interv&als
- development of inspection procedures
- deter-mination, of replacement times at certain components'
- development and testing of repair methods
At present the full scale fatigue test is usually perfoi'med in the prot'ýtype phaseand on a prototype structure. To the author's knowledge all full szale fatigue tests oncivilJan transport aircraft have been carried out for many years on a flight-by-flightbasis to an assumed snectrum; in Pome cases :i•e sequence was very simple, containingor-ly one or a few difi'erent flights and no taxi loads, for exampl•. After the dezired num-ber of flights multiplied by the safety factor on life of usually two, has been demon-strated, the same structure is used for damage tolerance (crack propagation.-, residualstatic strength-, fail safe-) tests. Often sawouts are utilized as crack starters becauseno cracks have zhown up in the fatigue test et t•e required locations.
Tactical aircraft, on the other hand, have often been subjected to block spectrumloading, without che g. t. a. c., like the r 100 F 104, F 105 and F 106, and sometimeseven without negative loads, like the F-4 ff, 66-. A safety factor of four on life isemployed if the applied spectrum was an average one; if it was a severe one a factor oftwo is sometimes considered sufficient .57. a1e demonstrated number of flights or flying
10-14
hours has to be calculated, assuming for example that one block corresponds to so manyflying hours.
There were also some fatigue life extension programmes, as on the F-100 ff77 inthe USA and the D. H. Venom in Switzerland ff87. In Germany the F 104 G was retestedf27/. The F 100, 'he Venom and the F 104 G were submitted to flight-by-flight tests, thesequences for the latter two aircraft being extremely complex, consisting of varioustaxi and landing loads, gust, maneuvers etc., see for example fig. ,8, and resulting inseveral hundred different flights. The actual service load spectrum was known for allthree aircraft, because the tests had started late in the service life and a very ex-tensive service loads measurement program had previously been conducted. For the Venomeven the lift distribticn had been -hecked in a windtunnel (and had been found to dif-fer substantially from the assumed one). It is significant, that for the F 100, theVenom and the F- 04 quite good c.rrelation between service life and test life was found.This is presumably due to tbree main reasons:
- The aircraft structure tested was to a production configuration, llke the service
aircraft.
- !he service loads were well known and
- these loads were closely simulated as to sequence and magnitude.
These, then, are the rinimum requirements to be met for a reliable fatigue lifiv predic-tion. Taken literally, the first two requirements meah that the full scale fatigue testcould only start quite late in the service period of an aircraft; the actual loads canbe (and have been) gravely underestimated, even if the prototype loads have been measured,and even when production aircraft have started training and operational readiness flyingL67. The production structure will in many cases differ significantly from the prototypestructure, while even small engineering deviations considered to be an item not criticalwith regard to fatigue may actually be critical /67. These reauirements can be met, there-fore, only if the fatigue test is used for a life reassessment / extension programme, asfor the three aircraft mentioned above, or if one is willing to have a number of aircraftin service before the full scale fatigue test has even started. For a new civilian trans-port aircraft, the latter procedure cannot be recommended because of the high yearly uti-ltzation of these types. On the other hand the load spectrum, at least for the first sel-eral years of airline service, is quite well known, grave errors are not likely. Becauseof the long life required of these aircraft, the full scale test takes quite a long time,although small amplitudes are usually omitted for reasons of cost.
For tactical aircraft, however, there are some good arguments to postpone the fullscale test to the service phase:
- the utilization is low, of the order of 200 flying hours per year; therefore the fullscale test, once started, will quickly catch up with the service hours.
- the required life is short, 4000 flying hours or less, so the test will not take toolong even if no cycles have been omitted (see below), and will usually be finishedduring the production run, in time to incorporate necessary design changes in at leastsome aircraft at reasonable cost.
- the damage tolerant design of the airframe, which is necessary any'way, see section2.2 4, will (hope~fully) ensure that no catastrophic failures will occur.
- the preceding flight-by-flight tests with large components have given confidence inthe fatigue life of the complete structure.
The main disadvantage, in the author's opinion is that design changes shown by the fullscale test to be ne-essary are extremely expensive for the aircr..t alrecdy in service.
To wait with the full scale fatigue tests until service loads can be measured andto rely at first on large components tests !•_the procedure adopted by the U.S.A.F. atthe moment ff67. Before that. the U.S.A.F. L21 planned to do two full scale tests, onein the prototype phase, the other Jn the service phase.
The third requirement means that a complex flight-by-flight test is necessary, witha large number of different flights, each flight consisting of a large number of cycles,say fifty to one hur,(-"d. One example is given in fig. 18 for the F-104G full scale testsequ~ence. No simplifications, e. g. use of only a few different flights, or abbreviations,e. g. omission of small amplitudes, are possible, nor are they necessary at least forshort lived tactical aircraft in view of the servohydraulic equipment with digital com-puter control now available tO, 717-
10-15
Conaiderable effort has to be put into setting up the test equipment and producingthe sequence of test loads. In the F-104G full scale test, for example LS97, the follow-ing loads are applied:
gust anO mareuver cycles
- g. t. a. c.
-taxi.
The combined gust and maneuver spectrum obtained from c. g. acceleration measurementshas been divided into three subspectra
- clean configuration 2 %
- tip-tank configuration 92 % of flight time.
- tip-and pylon-tank configuration 6
Theje were again split ap into subspectra for actual missions and flight conditions.
27 tvpical load distributions were simulated, taking into account
- 3 configurations (clean, tip-tan:, tip-tank plus pylon-tank)
- 10 weight distributions
- 2 center of aerodynamic pressure locations
(22 % mean aerodynamic chord for Mach 0.68 and 0.945 % "I It " " 1.45and for 150 flaps at Mach 0.68)
- positive and negative flight loads from - 2.3 g to + 6.9 g
- positive aileron deflections
- taxi loads
- g. t. a. c.
A section of the flight-by-flight programme -"s shown in fig. 18. Additionally an exten-sive stress analysis was performed with several hundred strain gages. And yet, comparedto the price of modern aircraft and to the price oW a life entension program that mightbe necessary as a conseqvence of a simplified full scale test, such a complex full scaletest is not expensive *. One aircraft primary stracture is necessary for any full scaletest anyway, and it is muoh taore expensive than even the most Qomplex full scale test.
Damage Tolerance Tests have been performed, as mentioned before, for many years oncivilian transport aircraft. When it became -bvious that a pure safe-life design was notfeasible, the fail-safe philosophy was adopted. Mr. Crichlow presented a well knownpaper on this subject in 1959 7' 2. Some doubts have been ex:ressed if complete fail-safety already could ever be accomplished, for example with riveted joints; however asfar as the author is aware, not one catastrophic failure of primary structure has occurredin any civilian airliner designed to the fail safe philosophy - and some of the early jettransports like the B 707 cr D-8 have passed 50.000 flights hours! So the service expe-rience with fail safe design is quite reassuring at the moment. On the other hand, evenvery modern tactical aircraft have been recently designed to the pure safe-life philos-ophy. Possibly some European tactical aircraft, which were not designed around highstrength materials like 7075 - T6 or D6ac steel might satisfy the "safe crack growth"requirement of the new MIL - A - 008066 ,67, but that would be a fortuitous byproduct ofother design decisions. Residual static strength tests on tactical aircraft after thefull scale test have usually not been peiformed. If fatigue cracks were detected earlyenough in the full scale tests, their propagation was monitored; this was done in somecases just to avoid e c6oplate faiaizre Jr_-the &Ill. scaile teat. The integral construction,high strength materials, high stress levels and n6nredundant strvcture typical of manytactical aircraft are not conducive to extended crack propagation tests anyway: The ap-pearance of a crack signals imminent danger of failure Z767. Therefore data on crack pro-pagation were rarely developed in full scale tests of tactical aircraft. For the F-100life extension programme several wings were available and crack propagation curves underseveral spectra restricted to 6 g and 4 g were obtained L67., which correlated quite well
* A fighter bomber of the German Air Force was tested to about 8000 flights of about 100cycles each in a complex full scale test for about 2 million Deutsche Markf equivalentto about $ 700.000,00. The test took about two years from the decision to start theprogramme gather service loads data, build the test rig and program the computer etc.urtil 8000 flights had been applied. Every additional 1000 flights cost about 30.000,00Deutsche Mark including inspections.
10t5, "
with the computed curves, although no retardation by high loads waz taken into account.SSome residual static strength tents were also performed. The well-known test programme
for all F-111 service airp'.anes /727 was performed only after a fatal crash had occurred.The USAF has instituted a large fracture control progr-amme fcr its aircraft L77, 79, 807,Mr. Wood is referring to this programme Ln his lecture /a87.-
4.1.2 Loads Data
As soon as the prototype starts flying, loads can be measured. The author is underthe impression however, that the loads measurement programme is not always consideredurgent enough and that it therefore may take an unreasonably long time to obtain the data.
4.2. Refinements Possible Immediately
4.2.1 Full Scale Tests, Including Damage Tolerance Teat
The necessary requirements for a full scale test ghioh can be expected to delivera reasonable correlation with service life, usirg available methods and data have alreadybeen discussed in section 4.1.1. It must be decided in every ±r½ividual case if this"test should be performed in the prototype phase under the load spectrum known at thattime and on a prtotype structure or later, in the service phase, on e production struc-ture. Whatever the decision taken, more efforL can and should be applied to monitoringthe growth of fatigue cracks, especially if the air':raft has been designed to the safelife or safe crack growth philosophy; that is, -racks snould be found while they arestill very small. Besides the obvious advantages, the data and skills zhus obtained bythe NDT inspectors can later be used to advantaZ when the aircraft is ir, service. Afterthe required life has been demonstrated, further aitificial cracks should be introducedinto the structure and the test continued. At the end of every test the residual staticstrength should be determined. It is of utmost im.,rtance to compare tha clzlk propaga-tion and the residual Ltatic strength obtained in 'nis test with calculated values, asmentioned in section 3.4. The ,ocal stresses shout:! also be determined by str&in gagesat as large a number of locatibwv as possible. It .'il increase our knowledge of damageaccumulation if we know the actual stresses at the locetion where, say, the criticalcrack started. For example, in the tests describet in 27 the nominal stress in thenotched specimens simulated exactly, with regard to sequence and magnitude, the localnominal stress at the surface of the F-IO G ,ing .•;in at fitting No. 3 at the wing sta-tion in question, as determined by a strain gige c(libration of the full scale test ar-ticle. This location was fatigue critical, as o&.J, In service aircraft and in the fullscale fatigue test cracks occurred there.Tf it is decided to carry out the full scale tfs6 T' the prototype phase, the mostsevere spectrum that can reasonably be expect4d in *.rv.o stnould be applied (fordefinition of "severe" spectrum, see section . I!). The fatigue critical areas willthen show up quickly, so the necessary design chsnes can be incorporat.a in all produc-tion aircraft at reasonable cost. If this fatigue Jamage shiws up before the target lifemultiplied by the scatter factor of four is reached, 'he snatterfactor could be re-viewed and, possibly, reduced, see section 5.2.1. This is conscýered a more conservativeapproach than using a spectrum of average severity and the uiael scatter factor.
4.2.2 Loads Data
See section 4.1.2.
A.3. Poential imroements
4.3.1 I'ull Scale Fatigue Tests, Including Damage Tolerance Tests
As the next step in improving the full scale test procedures, the effect of theenvironment should be considered. Some authors L797 suggest carrying out the full scalezest in the open as ai approximation of the real environment. However a full sca); testtakes only about one tenth of the time an aircraft is in service and the geographical lo-cation of the full scale test would then influence the result. 1-r. Anderson will discussanother procedure in detail at this Lecture Series LZ77. The other requirements for afull scale test were already mentioned in section 4.1.1. The additional corrosion damagein a test which includes the environment will certainly also influence the crack propaga-tion and the residual static strength behaviour. No further refinements appear necessaryat the moment.
4.4. Future Research and Investigations
See section 2.4.1, remarks on environment.
10-17
5. PRODUJCTIEON AND SERVICE PHASE
.4 number of remarks made in prreceding secticns also apply to the servica phase,for example waith regard to full snale testb etc. They will not be repeated in this chap-ter; instead other pý,obloms which~ may appear in this phase will be discussed.
5. 1 Present Statues and Refi~nementsImnmediately Possible
5.1. i Full Scale Fatigur Tests, including Damage Tolerance Tests
See section. 4.1.1.
5.1.2 Service Loads Data
Service Loads Data shoul' be obtained as quic~cly as possible on many aircraft fly-Ing in aifferent roles. The idea of lead-the-flee`t aircraft in which utilisatlion is ar-tii'l.ially increased. at firsc eight looks very p±'omisiv'g for this purpose and '%Or someOt~er reasons.* However when pilots know '.hay are ilying such airplar.es, they tend tohiandle them very carefully and a spectrum might be obtained w'hich is not typical of ac-tual Aorvice usage.
5.1.3 Char~ge in- Se-vlce Load Spectrum
Whatever the efforts with the measi~rement ofý snirvice load data and with t'ie fullscale te~st all. eventual-ities are still not covered. The -,load spectrum ir service willIn some cases certainly be different from -che one applied in test; some examples:
- The same aircraft t~ypo is used for different puw'poses ZT67 in different squadrons,i. e. ground attack or lI.gh-level reconnai~ssarv,-ý `de'*;erminlstic variationa).
- Individual aircraf% in cnie squcdr,)n may be flciý.n w:.th different severity ff67(statistical variat.ions).
We must also reckon with the change o~f ope-ations during the lic'e of an aircraft typewhich is typical for tactical aircraft. Even civilian transports zav fall into this cat.-egory; for instance the "Super Conistellation", a type orig-nally designed fcr high al-tibijde, long range flight wAs used in Germany as an "airbus" for short range flights at
ow altitude during the latter pelt of its service life. Similarly the firs-z models oftiie DC-8 were used for short range f~lights as soon as later models with fan 9;,ines be-came availablh. What to do in these cases is therefore an i'iportant question, wliieh willbecome even more important in the future because every individual aircraft's Yatigue lifewill have to be vxploited to the full due to the anrmously rising cost of modern types,.By ..arrying a fatIruie meter or sitmilar instrument in every airplane any change in oper-ation will show up very quickly. This is the procedure followed by the U. K. LSi7. Ifaircraft use up their life at too fast a rate. it might then even be possible to assignthem to other, less severe operations. This is an additional zeason, wl'y the installi-tion of fat~gue meters in every aircraft is considered a m~nimum requ.?.ement, see sec-tcion 2.3.5. When the spectrum in service is thus fotnd t., diiffer from the one appliedin the tests the "'velativvV' Miner Rule mentioned in sec.tion 2.3 2 can be applied witl-h, abetter accurac'!r tijan the no-mal damage calculation, if a realistic load sequence hasbeen used for ibe full scale test,; that is, the full scale test, possibly supported bysome flight-by-flight specimen tests, can be used as a basis from which to read acrossto other, not too di.ffeient spectra, This p.rocedure also has been used in the U. K. for
miliary ircaft ~7;howev~er the baeis m:,y not always have been a complex flight, by-flight test, so that the nx(ýessary step from its resu.:.t to a different spectrum was ic-tuelly very large.
5.1.4 Repair of Structural Damage
The structure of present riircraft can usually be repaired at rcasonable cost by ri-ye ted or bolted reinforcements in the daimaged area or by replacement of panels. With
s~,aModzýrn aircraft the repair, which m~y be necessary, for reasons other than fatiguedam~age, may appear to be much more complex, ' g. for EB-welded structure. How ever pr'0s-pects look good for rerair ol cracks by electrcrn-beam welding, a prooodure used in the
- - ~gas turbIne iutr 2 or by 'WIG- o.~ lasma welding ~7 tlatfrselsa-titanium al) oyd.
5.2. Potential Imprcroements
5.2.1 Full Scale Fatigue Tests, Including Damage Tolerance Testb
See si'-ticn 4.2.1 and 4.,1.
To the author's knowledge no full scale fatigue tests have yet been performed withasymmetrical lovds, generate4d for example by aileron actuation or empennage loads. Theseasymmetrical loai s might however be important, at least for the structure of some air-crsft. The main read o for the omissmon of these loads is that practicually no asymetri-cal load spectra are available yet. Such load spectra must therefore be obtained in thenext years in sufficient rumbers. A full scale fatigue test is planned at the IABG on atactical aircraft in which asymmetrical loads will be applied.
it may also be possible to reduce the usual scatter factor of four in the future ifit is established that the standard deviation of s = 0.20, devel.ped from constant ampli-tude and simple programme test, is too haigh. IABG tests on several F-104G wings and othercomponents indicated a much smaller scatter. Fail Safe Tests on ballistically damaged
structure should also be carried out; possibly the damage should be appliea under loadto allow for dynamic effects.
•, •"5.2.2 Service Loads Data
See se;ctions e .3.5 and 5.2.1, remarks on asymmetrical loads. Possibly wil. also
Ssee an increased use of PSD methods, i. e, replacement of the discrcete gust 'cdel by thecontinuous turbulence model LTV7.
5.3 Fut'2re Research and Investigations
5.3.1 Full Scsle Tesza, Inciuding Damage Tolerance Tests
It may be considered advisable in the future to apply the fatigue loads to the struc-ture at the actual velocity, i. e. gust loads very quickly, maneuver loads more slowly toallow for dynamic effects. These may be especially impý.rtnt for landing gears.
6. CLCHNG P-EARKS
The attainment of an adequate service life in an aircraft struztu7e and its correctprediction by tests and calculations is a very complex process containing, at .he momentand for some time to come, many unknowns. The author has tried to show in the paper thatby bringirg together modern, but readily available test ani calculation procedures wecan expect to be more s.4zessfull than in the past to achieve this difficult objective.
10-19
REFERENCES
Z-L7 Raithby K. D.: A Comparison of Predicted and Achieved Fatigue Lives 3f AircraftStructures, in: Fatigue of Aircraft Structures, Proceedings of the 2no ICAF Sym-posium, Paris 1961.W. Barrois and E. L. Ripley, editors.Lowndes, H. B. and W. B. Miller: The U. S. Air Force Weapon Systems Fatigue Certi-icaton Program, in: Fatigue Design Procedures, Proceedings of the 4t,, ICAF Sym-posium, Munich 1965.E. Gassner and W. SchUtz, editors,
[n7 Harpur, N. F. and A. J. Troughton: TheValue of Full Scale Testing, in: Fatigue De-sign Procedures, Proceedings of the 4hn ICAF Symposium, Municni 19o5.E. Gassner and W. Schltz, editors.$< L-&7 Loundes, H. P.: Correlation between Full. Scale Fatigue Test and Service eriencein: ProceedJngs of the Technical Sessions of the 11 ICAF Meeting in Stockholm,May 19E9.G. Wa22gren and S. Eggwertz, editors.
-27 2Troughton, A. J. and N. F. Harpur: Correlation betw-n Test and Service Experience,in: Proceedings of the Technical Sessions of the 11ih ICAF Meeting in Strckholm,M-ay 1969.G. Wall;ren and S. Eggwertz, editors.
_§7 Miller, W. B. and H. B. Lowndes: Correlation between ý.aboratory Tests and ServiceExperience, in: Symposium on Random Load Fatigue, Agard Conference ProceedingsNo. 118.
E-77 Jarfall, L. E.: Optimum Design of Joints: Thv Stress Severity Factor Concept, in:Aircraft Fatigue, Design, Operational and Economic Fffects, Proceedings of the 5thICAF Symposium, Melbourne 1967.J. Y. Manm ar- 1. S. iilligan, editors.
Z8-7 ASTM E 399 - 72: Standard Method of Test for Plane Strain Fracture Toughness ofMetallic Materials.Z-27 Schatz, W.: Zeitfe5iugkeit gekerbter Flachstdbe aus dem Werkstoff 3.1354.5 (2024-T3)Techni.sc.he Mitteilung Nr. 20/67, LBF.LTQ7 Schltz, W.: Zeitfestigkeit gekerbter Plachstdbe aus dem Werkstoff 3.4364.7 (7075-T6)
Technische Mitteilung Nr. 21/67, LBF.LTi7 Scrdtz, W.: Zeitfestigkeit gekerbter und ungekerbter Flachstabe aus dem Werkstoff3.4354.7 (Fuchs AZ 74/72)
Technische Mitteilung Nr. 24/67, LBF.J17 Engineering Sciences Data, Aeronaut:cal Series, Fatigue Subseries E.S.D.L., London.
1T37 Christian, R. D.: FAR 23 Fatigue St-bstantiption Procedures: GAWM Com ittee ReportSAE Paper 710403.
LT47 Landberg, B. 0. K. and S. Egowertz: k Statistical Method fo.' Fail Safe Design withRespect to Aircraft Fatigue. Flygte•%Iska Fbrsbksanstalten Meddelande 99.LT57 Ford, D. G., D. 0. Graff and A. 0. Payne: Some Statistical Aspects oý Fatigue LifeVarlation, in: Fatigue of Aircraft Structures, Proceedings of the 2 na ICAP Sym.-posium, Par-is 1961.
W. Barrois and E. L. Ripley, editors.LT67 Buxbaum, 0.: A Relation between Measured C. G. Vertical Accelerations and the Loadsat the T-Tail of a Military Airplane, in: Symposium on Random Load Fatigue, Agard
CP 118.
LZ77 Buxbaim, 0. and J. M, Zaschel: Gust Velocitiez Encountered by a 720 B-Type Airplaneand Derived by Means of a Model for Continunus Turbulence.LBF-Report FB 105/1973.
/T87 Buxbaum, 0.: BetriebskrUfte an Hauptfahrwerken des Flugzeuges F-104 G.LBF-Bericht FB 82/1969. RAE Library Translation No. 1591, Juni 1971.ZT27 Smith, H. R. and D. E. Piper: Stress Corrosion Testing with Precracked Specimens.Boeing Report D6-24672 ARPA No. 878, June 1970.
.L£O7 Browni -Y F.: A New Stress Corrosion Cracking Test for High-Strength Alloys Mate-rials Research and Stancaras, riarch ;96w.
10-20
L'17 Lehmann, W.: Results of Comparative Stress Corrosion Tests on AlZnMgCu AlloysUsing Different Types of Specimens, in: Specialists Fleeting on Stress CorrosionTesting Methods, Agard CP 98,
927 1'oigt, H.: AbschluBbericht 1969 zur Ztudie: Arbeiten zur Elektroneistrahltech-nologie in Zusamnerarbeit mit der Firma Steigerwald - Strahltechnik.IABG-Bericht Nr. 176.
Ly37 Clark, W. G. and E. T. Wessel: Influence of a Synthetic Seawater Environment onthe Frt-ture Behavior of HP 9-4-25 and HP 9-4-20 Alloy Steels, in: Materials Per-forn.ance and the Deep Sea, ASTM STP 445.
147 SchUtz, W. and H. Zenner: Schadensakkumulationshypothesen zur Lebensdauervorher-sage bei schwingende±" Beanspruchung - ein kritischer IJberolick -.Zeitschrift fUr Werkstofftechnik, 4. Jahrgang, Heft I und 2, 1973.
L517 SchUtz, W.: The Fatigue Life Under Three Differe•,t Load Spectra - Tests and Cal-culations -, in: Symposium on Random Load Fatigue, Agard CP 118.
•_7 Military Specification: Airplane Strength and Rigidity Reliability Requirements,Repeated Loads, and Fatigue.MiA -A- 008866, 31 March 1971.
TV7 Forman, R. G., V. E. Kearney ana .. :. Engle: Numerical Analysis o. Crack Propaga-L _ tion in Cyclic Loadae Structures.Journal of Basic Engineering, Sept. 1967.
L87 Liebowitz, H. and J. Eftis: On Nonlinear Effects in Fractare Mechaxics. Engineer-ing Fracture Mechanics, Vol. 3 (1971) S. 267/81.
Z297 Schitz, W. and W. Oberparleiter: Riffortschritts- und Rostfestigkeitsverhalten vonFlugzeugbauwerkstoffen.IABG-Bericht No. TF 236
/307 Knorr, E.: Reliability of the Detection of Flaws and of the Determination of Flaw- ize, in: Agard Fracture Mechanics Survey, H. Liebowitz, editor.
L317 Packmann, P. F., H. S. Pearson, J. S. Owens and G. Young: The Applicability of aFracture Mechanics - NDT Design. Criterion for Aerospace Structures;.I'ESTEC Conference, March 1969.
L'317 Gassner. E.: Zur experimentellen Letr'rtdauer-Ermittlung von Konstruk~ionselementenmit zufallsartige: Beanspruchtugen. Plenary paper at the Third International Con-ference on Fracture, Munich 8 to 13 I'ril 1973.
r;37 Jaeckel, H. R.: Evaluation of Fatigue Life in Automotive Structures. paper pre-sented at the discussion-seminar in Darmstadt, 26 March 1973.
S47 Schitz, D.: Standardized Flight-by-Flight Test Programme for the Fatigue EvaluationSof Wing Components of Transport Aircraft. Paper at the7 I CAF Lymposium, London,
July 1973.L327 Schijve, J., F. A. Jacobs and P. J. Tromp: Crack Propagation in Aluminium ý.lloy
Sheet Materials under Flight Simulation Loading.NLR TP 68117 U (1968).
/67 Schitz, W. and H. Zenner: Rilfortschritt an Titanbl:,hen im Elnzelflu'ý-ersuch.IABG-Bericht No. TF 224
L737 Kaufmann, J. G.- Progress in Fracture Testing of Meta2lih. Materials, i.: Review ofDevelopments in Plane Strain Fracture Toughness Testing, ASTM STP 463, Sept. 1970.
a87 Anderson, W. E.: Engineering Utility and Significance of Stress Corrosicn Cr8'z;rngData, in: Specialists Meeting on Stress Corrosion Testing Methods, Agard CP 98.
g797 Anderson, W. E.: Corrosion Fatigue - or - How to Replace the Full Scale ratigueTest; 'this Lecture Series publication.
Z 7•Y Kirkby, W. T.: Some effects of Change in Spectrum Severity and Spectrum Shape onFatigue Behaviour under Random Loading in: Symposium on Random Load Fatigue,Agard CP 118.
L117 Crichlow, W. J.: On Fatigue Analysis and Testing for the Design of the Air Frame;this Lecture Series publication.
/4"7 Wood, H. A.: A Summary of Crack Growth Prediction Techniq~ues;this Lecture Series publicatiu.
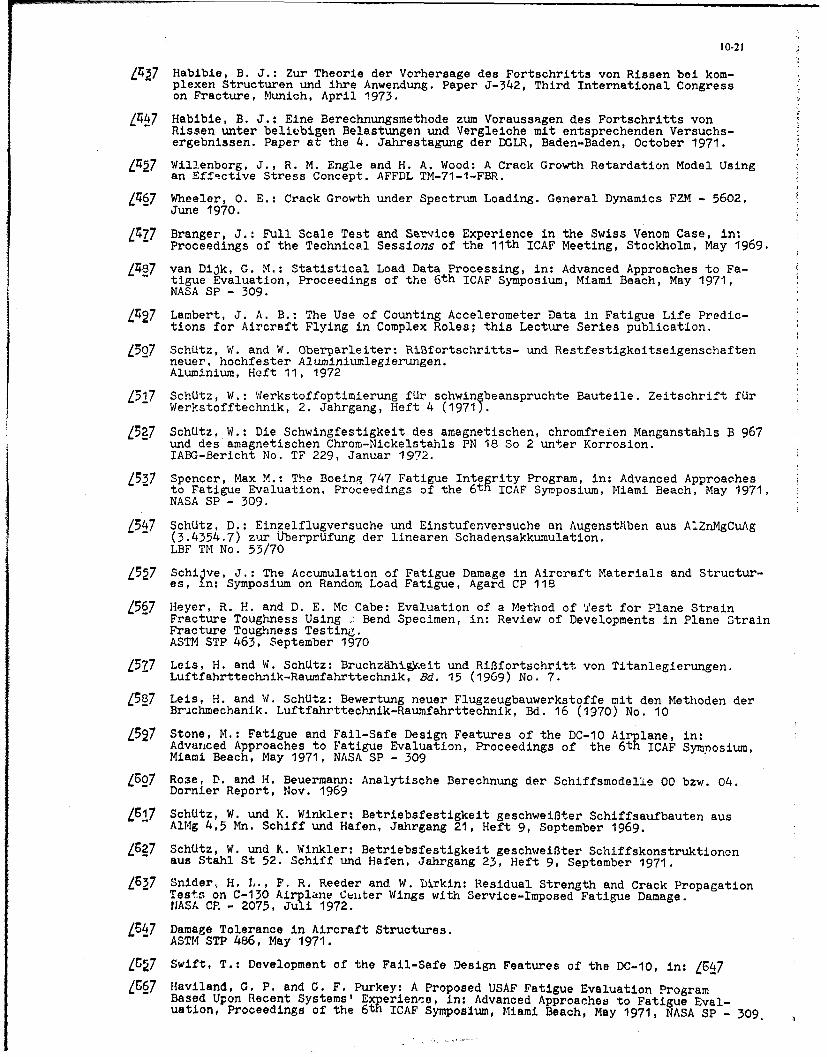
10-21
L137 Habibie, B. J.: Zur Theorie der Vorhersage des Fortschritts von Rissen bei kom-plexen Structuren und ihre Anwendung. Paper J-342, Third International Congresson Fracture, Munich, April 1973.
LZ47 Habibie, B. J.: Eine Berechnungsmethode zum Voraussagen des Fortschritts vonRissen unter beliebigen Belastungen und Vergleiche mit entsprechenden Versuchs-ergebnissen. Paper at the 4. Jahrestagung der DGLR, Baden-Baden, October 1971.
Z47 Willenborg, J., R. M. Engle and H. A. Wood: A Crack Growth Retardation Model Usingan Effective Stress Concept. AFFDL TM-71-1-FBR.
467 Wheeler, 0. E.: Crack Growth under Spectrum Loading. General Dynamics FZM - 5602,June 1970.
Z77 Branger, J.: Full Scale Test and Setvice Experience in the Swiss Venom Case, in:Proceedings of the Technical Sessions of the 11th ICAF Meeting, Stockholm, May 1969.
487 van Dijk, G. M.: Statistical Load Data Processing, in: Advanced Approaches to Fa-tigue Evaluation, Proceedings of the 6th ICAF Symposium, Miami Beach, May 1971,NASA SP - 309.
L427 Lambert, J. A. B.: The Use of Counting Accelerometer Data in Fatigue Life Predic-tions for Aircraft Flying in Complex Roles; this Lecture Series publication.
LZO7 Schltz, W. and W. Oberparleiter: RiBfortsc1iritts- und Restfestigkeitseigenschaftenneuer, hochfester Aluminiumleglerungen.Aluminium, Heft 11, 1972
Z517 SchUtz, W.: Werkstoffoptimierung fUr schwingbeanspruchte Bauteile. Zeitschrift fUrWerkstofftechnik, 2. Jahrgang, Heft 4 (1971).
Z27 SchUtz, W.: Die Schwingfestigkeit des amagnetischen, chromfrelen Manganstahls B 967und des amagnetischen Chrom-Nickelstahls PN 18 So 2 unter Korrosion.IABG-Bericht No. TF 229, Januar 1972.
Z537 Spencer, Max M.: The Boeing 747 Fatigue Integrity Program, in: Advanced Approachesto Fatigue Evaluation, Proceedings of the 6th ICAF Symposium, Miami Beach, May 1971,NASA SP - 309.
547 Sch~tz, D.: Einzelflugversuche und Einstufenversuche an Augensthben aus A!ZnMgCuAg(3.4354.7) zuir tUoerprUfung der linearen Schadensakkumulation.
LBF TM No. 53/70
5 Schi~ve, J.: The Accumulation of Fatigue Damage in Aircraft Materials and Structur-es, in: Symposium on Random Load Fatigue, Agard CP 118
567 Heyer, R. H. and D. E. Mc Cabe: Evaluation of a Method of Test for Plane StrainFracture Toughness Using - Bend Specimen, in: Review of Developments in Plane StrainFracture Toughness Testine.ASTM STP 463, September 1970
L•Z7 Leis, H. and W. SchUtz: Bruchzdhi%Y&eit und Ri3fortschritt von Titanlegierungen.Luftfahrttechnik-Raumfahrttechnik, Bd. 15 (1969) No. 7.
587 Leis, H. and W. SchUtz: Bewertung neuer Flugzeugbauwerkstoffe mit den Methoden derBruchmechanik. Luftfahrttechnik-Raumfahrttechnik, Bd. 16 (1970) No. 10
L527 Stone, M.: Fatigue and Fail-Safe Design Features of the DC-10 Airplane, in:Advanced Approaches to Fatigue Evaluation, Proceedings of the 6th ICAF Symposium,Miami Beach, May 1971, NASA SP - 309
LB-7 Rose, D. and H. Beuermann: Analytische Berechnung der Schiffsmodelle 00 bzw. 04.Dornier Report, Nov. 1969
Z617 SchUtz, W. und K. Winkler: Betriebsfestigkeit geschweilter Schiffsaufbauten ausAlMg 4,5 Mn. Schiff und Hafen, Jahrgang 21, Heft 9, September 1969.
Z27 Schltz, W. und K. Winkler: Betriebsfestigkelt geschweitter Schiffskonstruktionenaus Stahl St 52. Schiff und Hafen, Jahrgang 23, Heft 9, September 1971.
LZ67 Snider, H. L., F. R. Reeder and W. birkin: Residual Strength and Crack PropagationTests on C-130 Airplane Ceiiter Wings with Service-Imposed Fatigue Damage.NASA CR - 2075, Juli 1972.
L67 Damage Tolerance in Aircraft Structures.
ASTM STP 486, May 1971.
ZC27 Swift, T.: Development of the Fail-Safe Design Features of the DC-IO, in: 1647
L67 Haviland, G. P. and G. F. Purkey: A Proposed USAF Fatigue Evaluation ProgramBased Upon Recent Systems' Experienoe, in: Advanced Approaches to Fatigue Eval-uation, Proceedings of the 6th ICAF Symposium, Miami Beach, May 1971, NASA SP - 309.
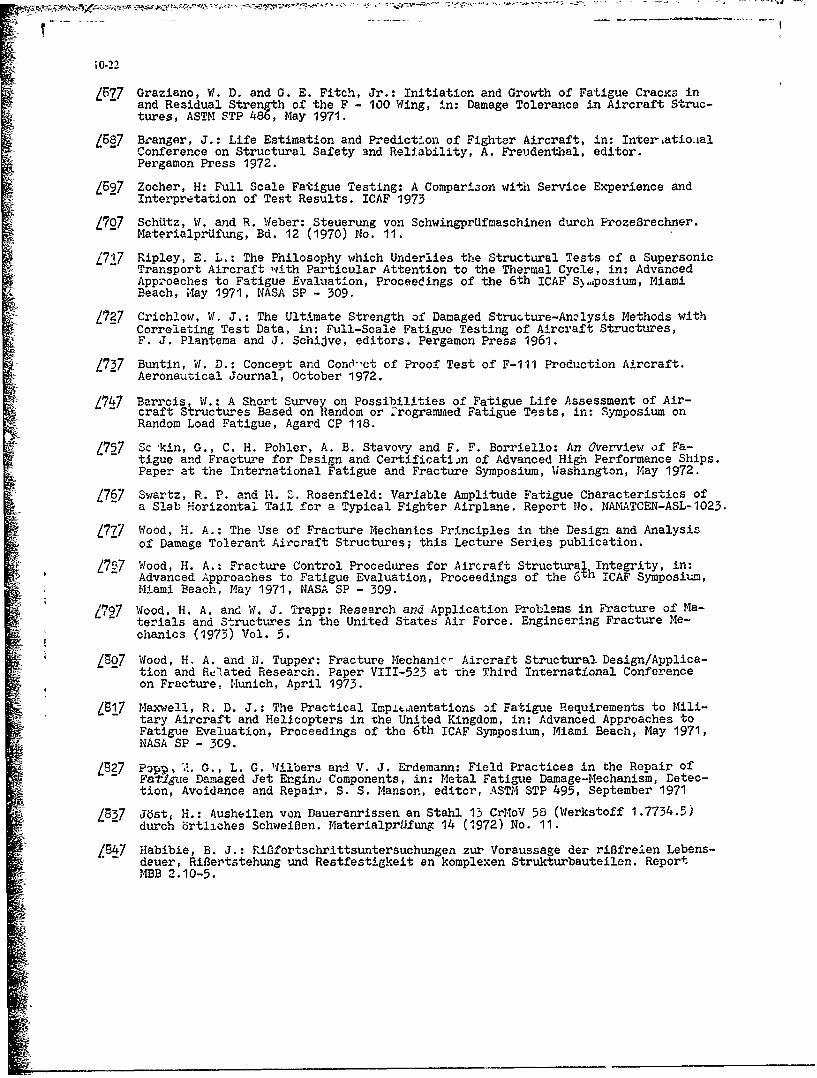
kO.22
L•77 Graziano, W. D. and G. E. Fitch, Jr.: Initiation and Growth of Fatigue Cracxs inand Residual Strength of the F - 100 Wing, in: Damage Tolerance in Aircraft Struc-tures, ASTM STP 486, May 1971.
Z•687 Branger, J.: Life Estimation and Predict'-on of Fighter Aircraft, in: Inter-atioaal"Conference on Structural Safety and Reliability, A. Freudenthal, editor.Pergamon Press 1972.
L697 Zocher, H: Full Scale Fatigue Testing: A Comparison with Service Experience andInterpretation of Test Results. ICAF 1973
L707 Schitz, W. and R. Weber: Steuerung von SchwingprUfnaschinen durch ProzeBrechner.MaterialprUfung, Bd. 12 (1970) No. 11.
L717 Ripley, E. L.: The Philosophy which Underlies the Structural Tests of a SupersonicTransport Aircraft with Particular Attention to the Thermal Cycle, in: AdvancedApproaches to Fatigue Evaluation, Proceedings of the 6th ICAF Sý.,posium, MiamiBeach, May 1971, NASA SP - 309.
Z727 Crichlow, W. J.: The Ulttmate Strength of Damaged Structure-An~lysis Methods withCorrelating Test Data, in: Full-Scale Fatigue Testing of Aircraft Structures,F. J. Plantema and J. Schijve, editors. Pergamon Press 1961.
Z737 Buntin, W. D.: Concept and ConO-ct of Proof Test of F-111 Production Aircraft.Aeronautical Journal, October 1972.
L7 7 Barrois, W.: A Short Survey on Possibilities of Fatigue Life Assessment of Air-craft Structures Based on Random or :rogramoed Fatigue Tests, in: Symposium onRandom Load Fatigue, Agard CP 118.
L757 Sc kin, G., C. H. Pohler, A. B. Stavovy and F. F. Borriello: An Overview of Fa-tigue and Fracture for Design and Certificatirn of Advanced High Performance Ships.Paper at the International Fatigue and Fracture Symposium, Washington, May 1972.
Z L767 Swartz, R. P. and M. 1. Rosenfield: Varlable Amplitude Fatigue Cnaracteristics ofa Slab Horizontal Tail for a Typical Fighter Airplane. Report No. NAIVIATCEN-ASL-1023.
Z777 Wood, H. A.: The Use of Fracture Mechanics Principles in the Design and Analysisof Damage Tolerant Aircraft Structures; this Lecture Series publication.
Z757 Wood, H. A.: Fracture Control Procedures for Aircraft Structural Integrity, in:Advanced Approaches to Fatigue Evaluation, Proceedings of the 6n hICAF Symposium,Miami Beach, May 1971, NASA SP - 309.
Z727 Wood, H. A. and W. J. Trapp: Research and Application Problems in Fracture of Ma-terials and Structures in the United States Air Force. Engineering Fracture Me-chanics (1973) Vol. 5.
Z927 Wood, H. A. and N. Tupper: Fracture Mechanic- Aircraft Structural Design/Applica-tion and Rvated Research. Paper VIII-523 at the Third International Conferenceon Fracture, Munich, April 1973.
Z817 Maxwell, R. D. J.: The Practical Imp±ixentations of Fatigue Requirements to Mili-tary Aircraft and Helicopters in the United Kingdom, in: Advanced Approaches toFatigue Evaluation, Proceedings of the 6th ICAF Sympositum, Miami Beach, May 1971,NASA SP - 3G9.
L927 Pop, 'I. G., L. G. W±hbers and V. J. Erdemann: Field Practices in the Repair of-Fat•gue Damaged Jet Enginj Components, in: Metal Fatigue Damage-Mechanism, Detec-tion, Avoidance and Repair. S. S. Manson, editor, ASTM STP 495, September 1971
Z837 just, H.: Ausheilen von Daueranrissen an Stahl 15 CrMoV 58 (Werkstoff 1.7734.5)durch brtliches Schweiten. Materialpr~fung 14 (1972) No. 11.
/'47 Habibie, B. J.: Ri~fortschrittsuntersuchungen zur Voraussage der risfreien Lebens-deuer, Rifiertstehung und Restfestigkeit an komplexen Strukturbauteilen. ReportMBB 2.10-5.
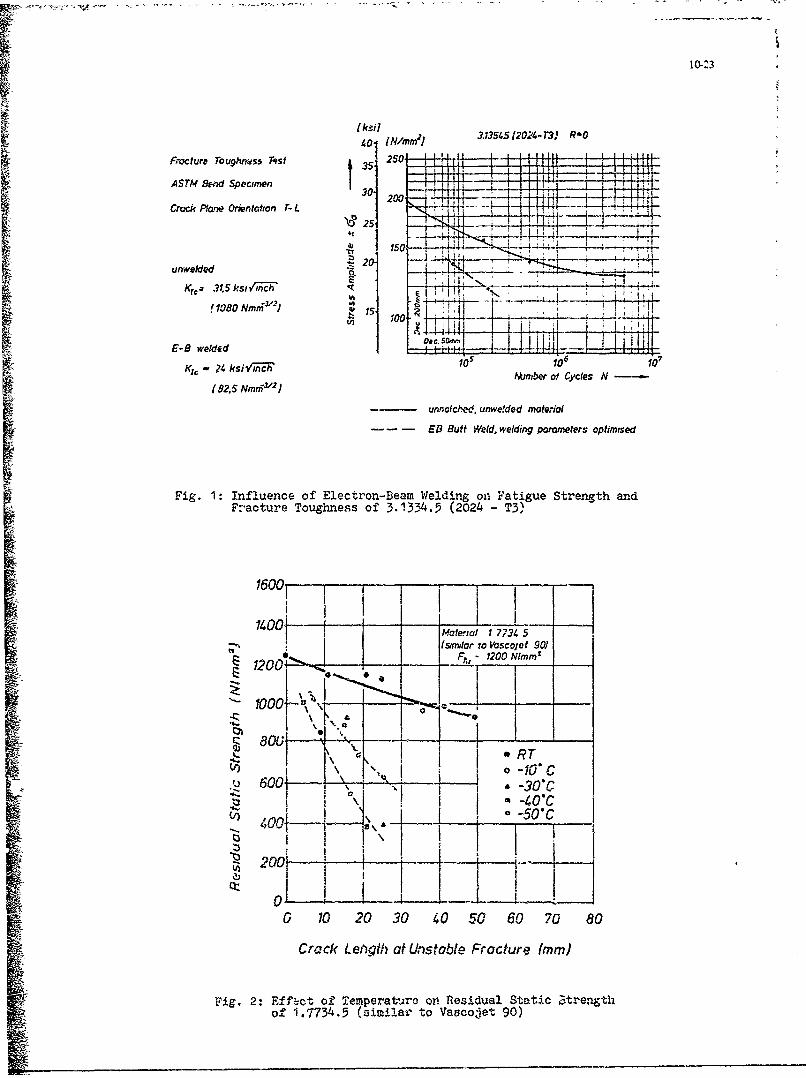
10-23
I ksj 2 3.1354512024-T3, RAO
Anacture TouQhrnss Tist 5 S IItl
ASTM &-ndSpecinmen
-ClT
30.we00 d-2Kr~~~~- J15s.,c
Clok RneOmrlieno' 2J r
u-unnwelddnweddmaera
-r~ - E BttWedwedngpaamtes ptnu
106.01 Imnf~luec Eeto-emWlin FtgeSrnt nF-ctr Tugnsso 31345 204-t3
- I atceda uneI e materi5
EDBt (semlart Vwelding 90) rtsotiie
Fi.1 nlec 1 of~- Eero-Ba Weldin o20 Faige trngh n
-v-----4 '-
Fj -I wcm
.u604 ,- -I -30*C.4-~- -40'C
I a i50-t4j 00ý 7 I
0 10 20 30 40 50 60 70 80
Crack Length at Lins table Fracture (mm)
r i~Fig. 2: Hfo;-cot of Temperat-;ro on Rlesidual Static 3trengthof 1.7734.5 (similar' to VaEscoj-et 90)
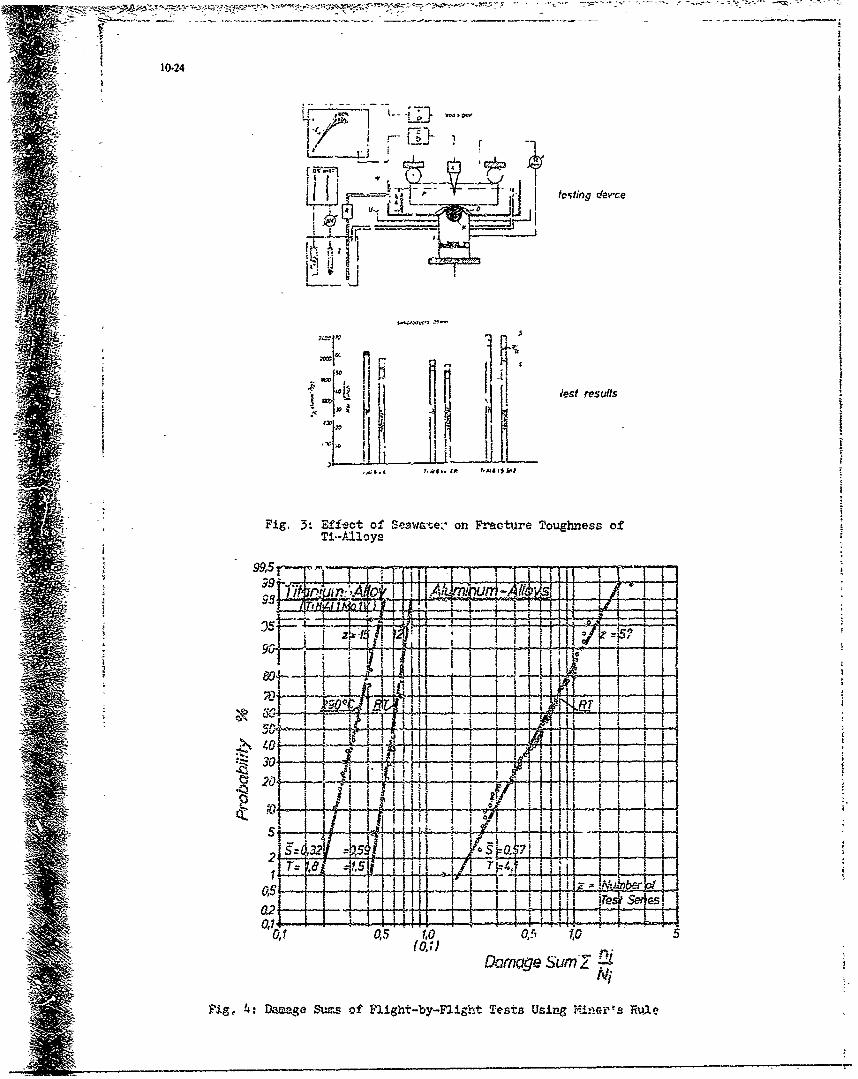
10-24
2
~j.. - osting dev'ce
4-vz
"" iiPiI
1. les' results
.Fig. 3. Eff-ect of Seawa-me, on Fracture Toughness ofS~Ti,-AIloys
991
80,0t 0 ,5f r
Lk32 - 0.7
2O 5
F ii,.age Su t of ht- on-Frhturests TUghamnesges oule
Ti..AiAli
Fit aae u-;o lgh-yFihtTet sn a
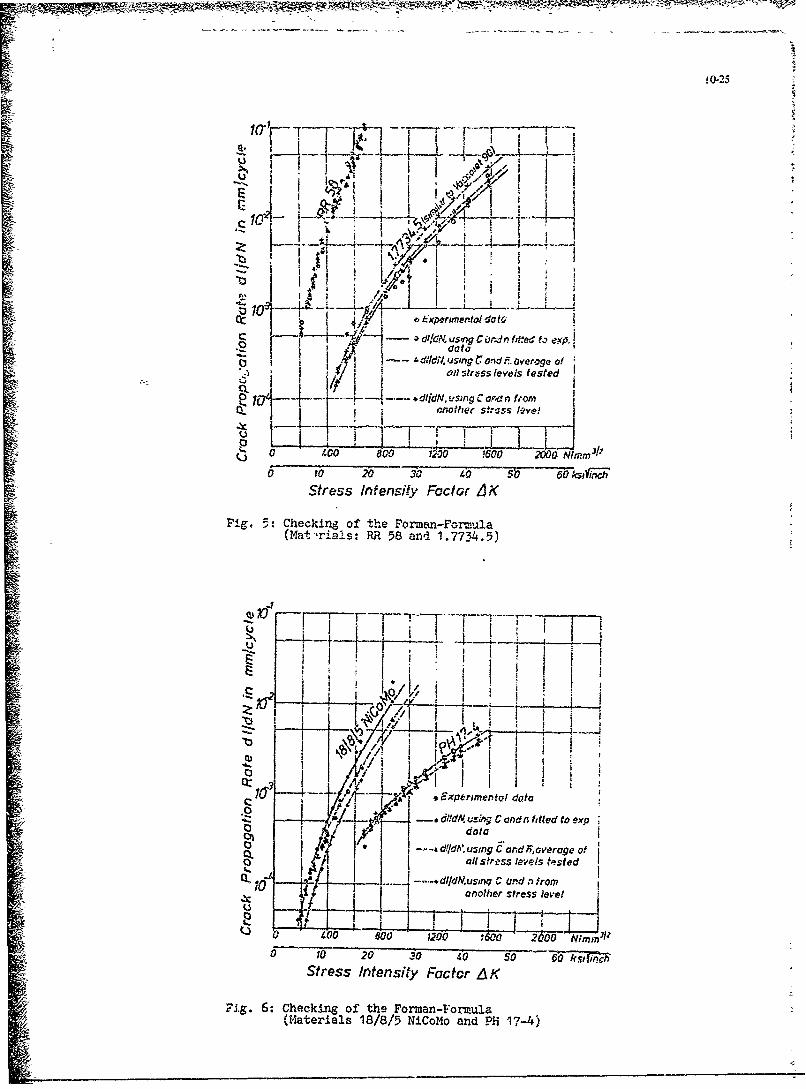
!0-25
., I I.a' I a :A3'
(3 ' /•/i i---'dtlddc164usingIrOnd;ý 0 erage of:I/t~seesetd
I 1r__ dl.N usn 4rdnfo
another sm*nto! /CoW e
0 /0 ý,• 100 .1600 "oP2000 NMtn/Z0 to d0' 3s-•9•40 .... S'o _60 -' 4
Stress Intensity Factor e sK
Fig, 5: Checki.n of the Forman-Formula
(Mal., rlals: RR 58 and 1.o7734•.5)
-- I i - ". i-- I
UT
StrssIn• ni Fac t al da taAND tgf h c in C th e filled t ! !
U Mtras R5 a da1t7a.5
I ., I I j i4 1
O S._r--/s 1 le- . tei ed
.4-,N~ n C an . fo
"" I 0•4 200
.. ! 'o •/!, I _.e3• I i ;
a/,.40 60 lml
I • ' 41 ' I I • ,
0 o 20 3 t4) k1 ,P
Stres intenit Factor AK ,!
c _,i -I t i •.~ i , ,
so-f----.r-----,--dlxdM US ng o r,. d ', ovt ra of
o Mater' -4)- , l 1 5 i a M !
I I [- ! -7 - - . I I. !l stIs 1evl --sl
70r 2 0 3 0 £0o 50oStress Intensity Factor A K
•" Fig. 6: Checkinug of' the Forman-Fornmulai (H.aterials 18/8/.5 NiCoMo and PHi 17-4)
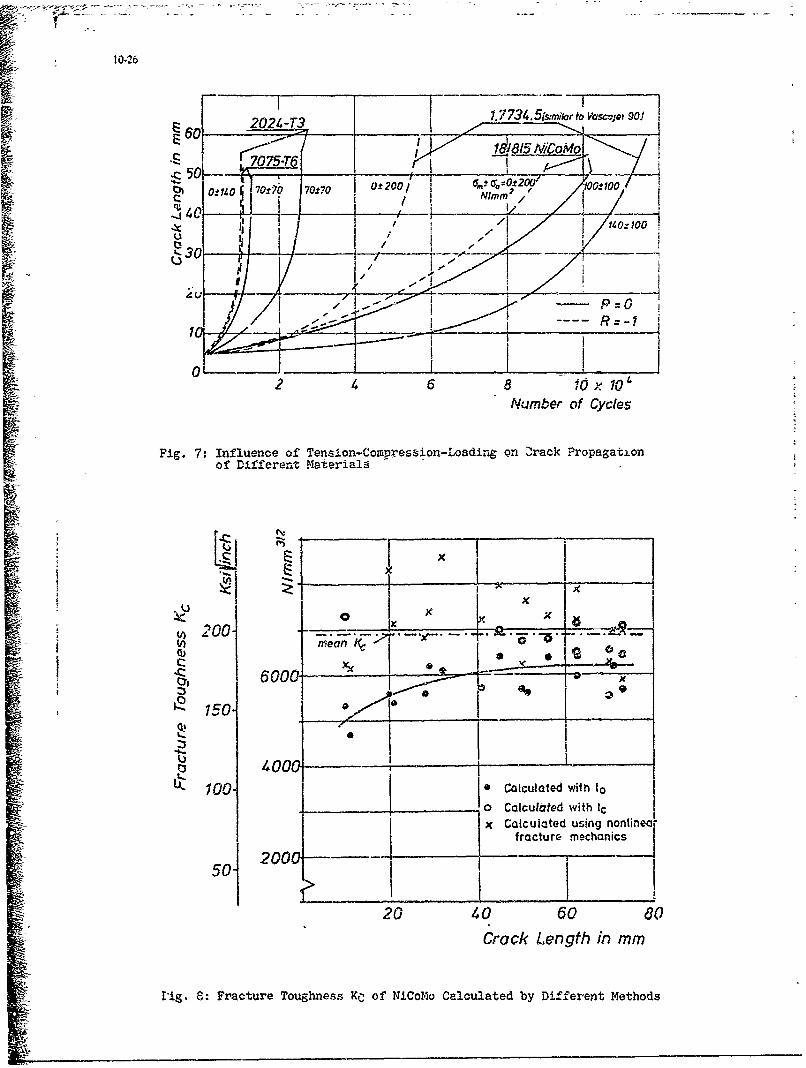
* _- : • • ;..-. .. -- - . . .- . • , L - - •.. -_ - = • -_ .. . . • -
10.26
S1.7734.5fs.,mikartoVcsc=,et90W2024-T3 3______
~60_
I~ 5-r L1815 ICoMO01 200/ i 7 " / 00 i0
50 1 I---- / -o.I
OiAO 70t 70,? " • =O R -M
o ... ._ I _
2 4 6 8 10 x 100
Number of C vcle•
Fig. 7: Influence of Tensl.on-Cowpression-odr n acPopgtoof Different Mat¢erials odn ntrc rpgto
120
2140 1 1 Y I 0
z- X
•" •i! •' ~200- •• I" x • •. •.'- R
I iCo.
100. 0 Calculated with to0o Calculated with Ic
- ~x Calculated using nonlinear
fracture mechanics
20 40 60 80
Crock Length in mm
11g, 8: Fracture Toughness KC of NICoMo Calculated by Different Methods
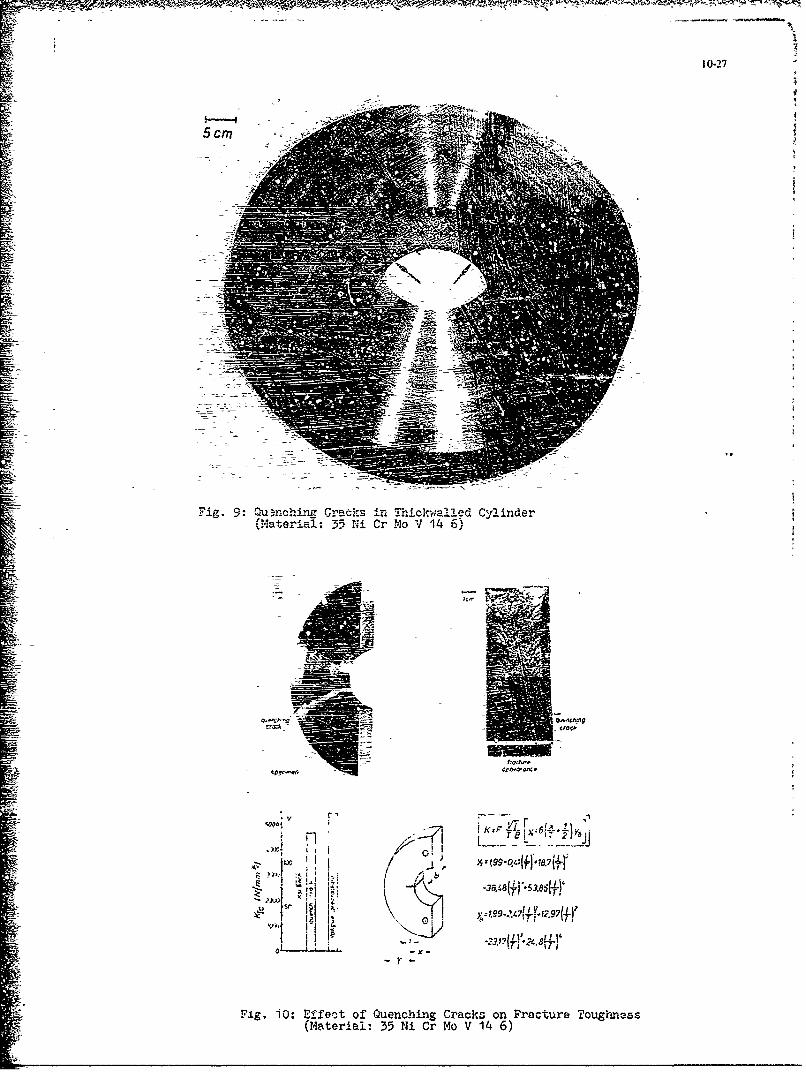
10-27
Jw4-
Fig. 9: Q'u )nchin-- Craeks in 7Thickwa' led Cyl~inder-- (!teria: 7-5 Ni Cr M4o V I4 6)
;-ij
- YI x499-0.4'r1
Pi.g, 10: E.ffoot of' Quenching Cracks on Fracture Toughness(Material: 35 Ni Cr Mo V 14 6)
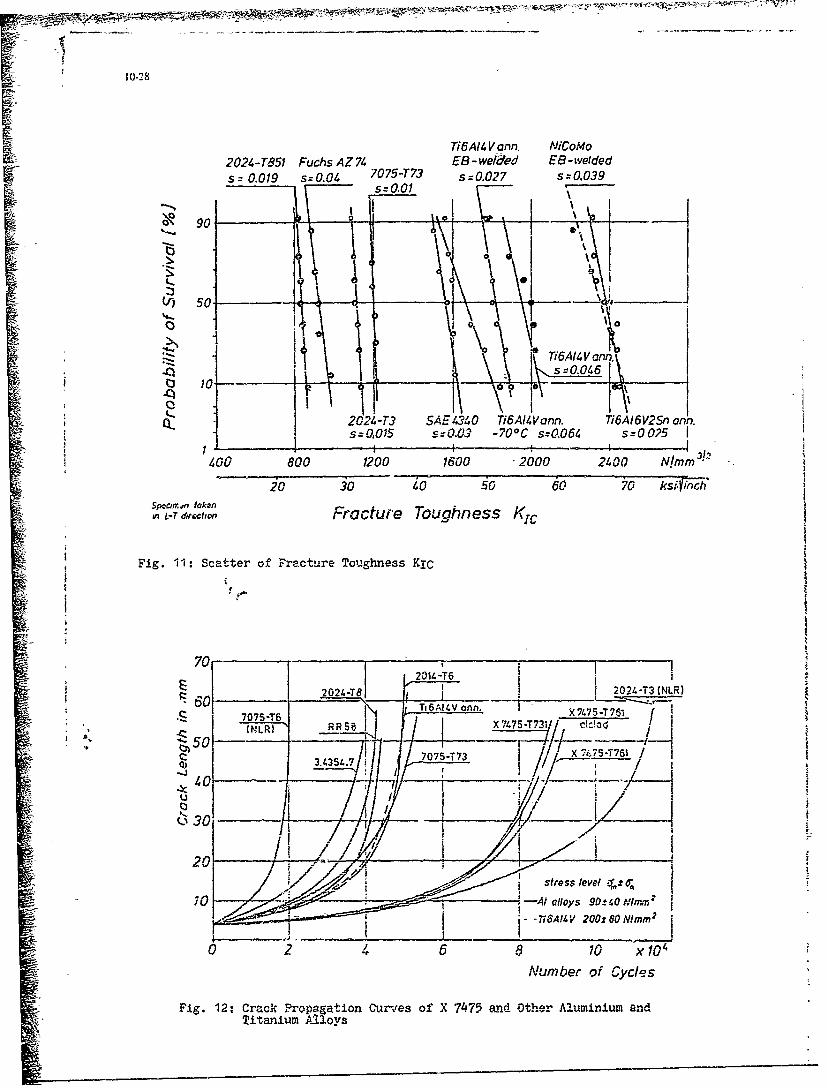
ie'
10-28
"ri6AI4 V ann. NiCoMo
2024-T851 Fuchs AZ 74 EB - weided EB -weldedSz 0.019 s=0.04 7075-T73 s=0.027 s=0.039
~90 ..... 1 ~ i 6 lVal
.046
50
: ' T~i6AI V ann.L
22•.-T3 SAE4.340 Ti6AI Vann. Ti6AI6V2Sn ann.iI s-0,0I5 s-f.03 -700C s=0.064 s-0025 I400 800 1200 1600 2000 2400 N 3!mm !
- ý 20 30 jo 50 60 70 ksi."inc,
Spco,i~~n taken .
An L-T direion Fracture Toughness KVc
Fig. II: Scatter of Fracture Toughness KICi- i
5N+ ~~~70 o2-r'
2014. 116-T6
___202L-T8j i04r3Ni650 -- iVi 2021.-T31NLRi
7075-T6 X o7475-T76 [__5 745T71//_~
INLR) XRS X 717T7- "• " - .I # ---- T- 6 /43S17I 775-T7371 _ _ _,
-. / I i// )40 - -) - -ý17 3 0' Il Ij
20 i .
stress level .1
-41 alloys 90±!40NItrrr, 11- 776A11.V 200t6ONmrnm2
0 24 6 8 10 x 10,Number of Cycles
Fig. 12: Crack Propagation Cur-es of X 7475 and-Other Aluminium andTitanium A-loys
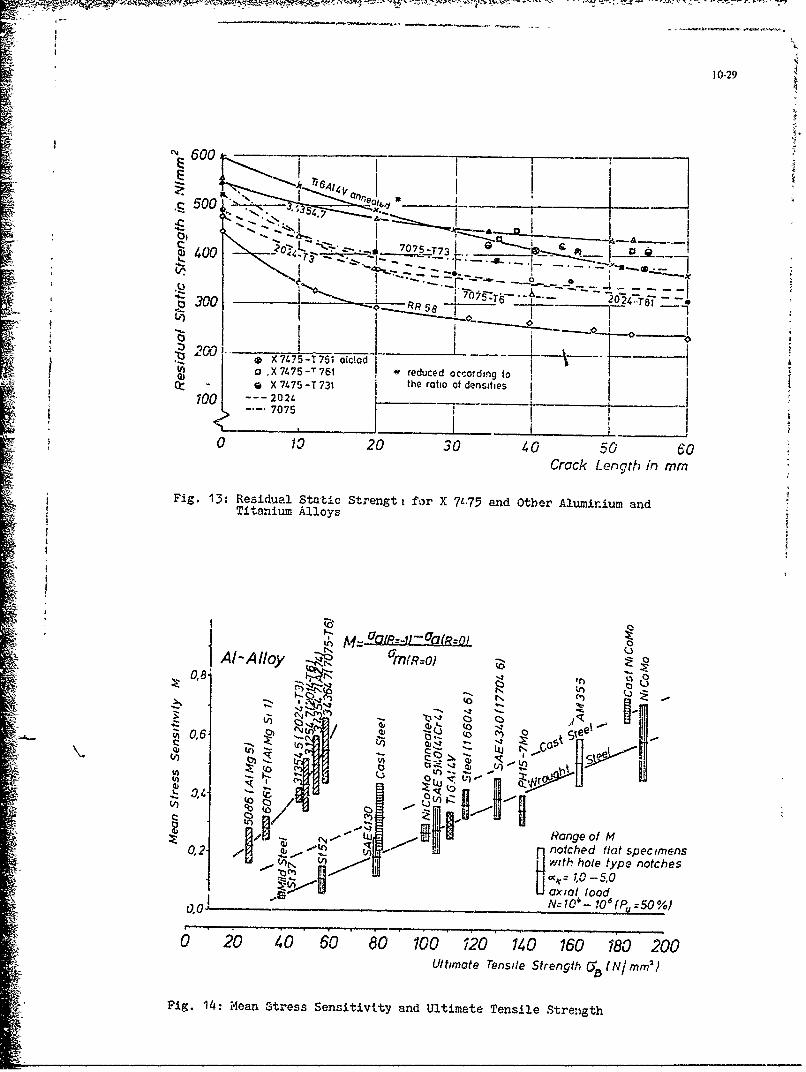
10-29
Z A -- ,
400 2_Ž._ .o_-_7.0-_-'-- .I
-$-4: +• 3 0 0 1 I "Q_. - 7 -T - -. . 2 ._2r , ..4 " _ _ __
SI.. I I I -'T --< - <____I_ . __- _ I 7,,5., o-T,,, tI 0
++ " '• " - I X 7475 -T 731 • the ratio of densities II -- -- -.. •' ____
1- 2027075
_•++ ,+ 1020 30 40500
•: Crack Length in mm
SiFig. 13: Residual Sta~ti c Strengt i for X 7L.75 and Otber Alumir-jum and' Titanium Alloys
S0.8. .••,
2c,. I -
". " ••Il
i o ol - - ,_ _ _ _ _ _ _ _!! to
0,6-. 707a5
_____BJ -- I _ _ _ _ _,n~o•
ReidafUXlhm5t ansde Ctrockt Let i NImm:
•=6T Fl. 14 Hen StessSen~tivty nd UtiOth er Alumitium andS r0
M~~ U (OIL,-p~..)
V)(b ) o.r
c\ 4 .L ~~UUIIM Range of Ml0,2- nnotched flat specimeicns
CVI with hole type notchesL CKV = 1.0 -5.0
Ii~J axial loadN=10"- 106 fp~ 5%
6 20 40 60 60 100 2 140 160 18 20Ultimate Tensile Strength 6Y MN/mm 1?
Fig. 14: Mean Stress Sensitivity and Ultimate Tensile Strenlgth
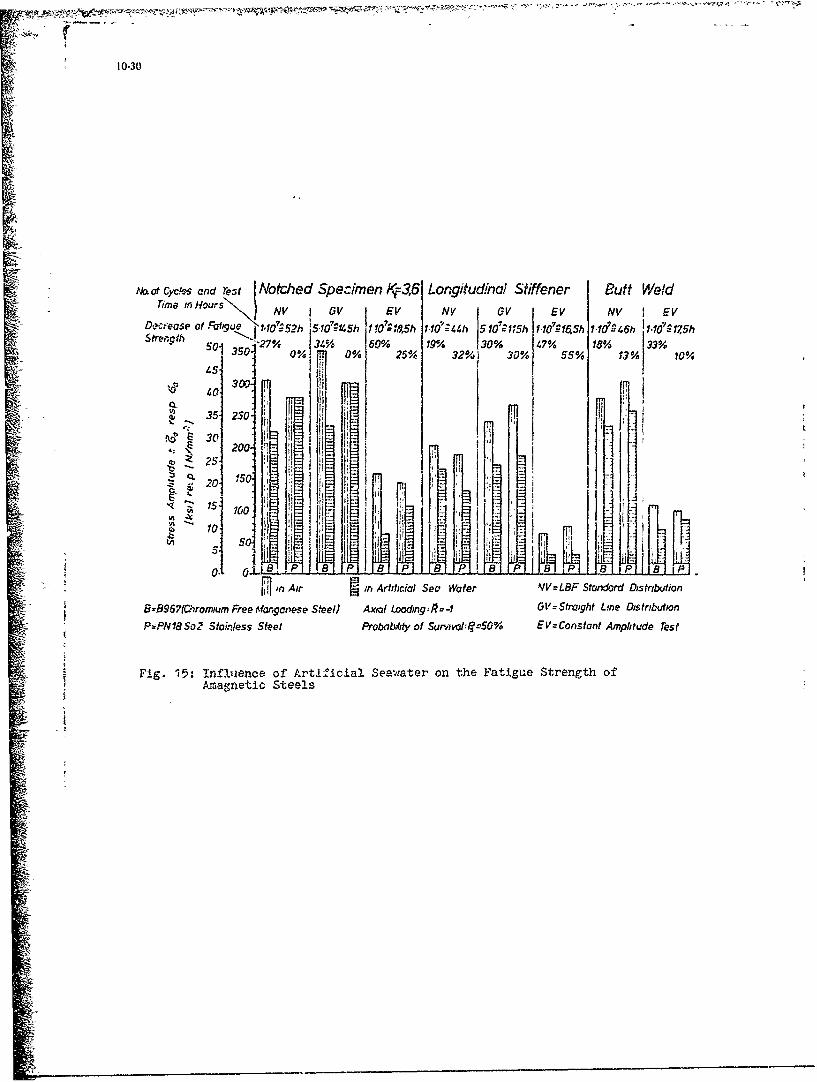
10-30
v ,ot C,,cy's and re:t Notched Specimen K-3,6 Longitudinal aener Butt WelTime in/ louts NV I GV EV NV D 5V I EV NV I EV
D asP Of, figue ,152h 50^145h 18,5h 110 -44h W510 F5h 1.i0 =16.5h 1.1046h 1.14•"'5175hStrength so 350 -27%, 34% 33
j% 60% 19% 30 14% 1"l35: 0%: 0% 25% 32%1 30% 55% 17%133% 10%
*~40 _ TG, 35 250 H3 0
. 200 K:
2 (0 15 1 1 I> 11 i I 1:150
111in Air NIn Artificial Sea Water VV=LBF Standard DistributionS8967(Chromium Free nq,9otnese Steel) Axial Looding ot= =-I GV=Staitnght Line Distribution
P-rPN18So2 Stainless Steel Probbdity of Sur'vlj5jt:,-S0% EV=Constant Amplitude rest
Fig. 15: Influience of Art!.icial Seawater on the Fatigue Strength ofk•agnetic Steels
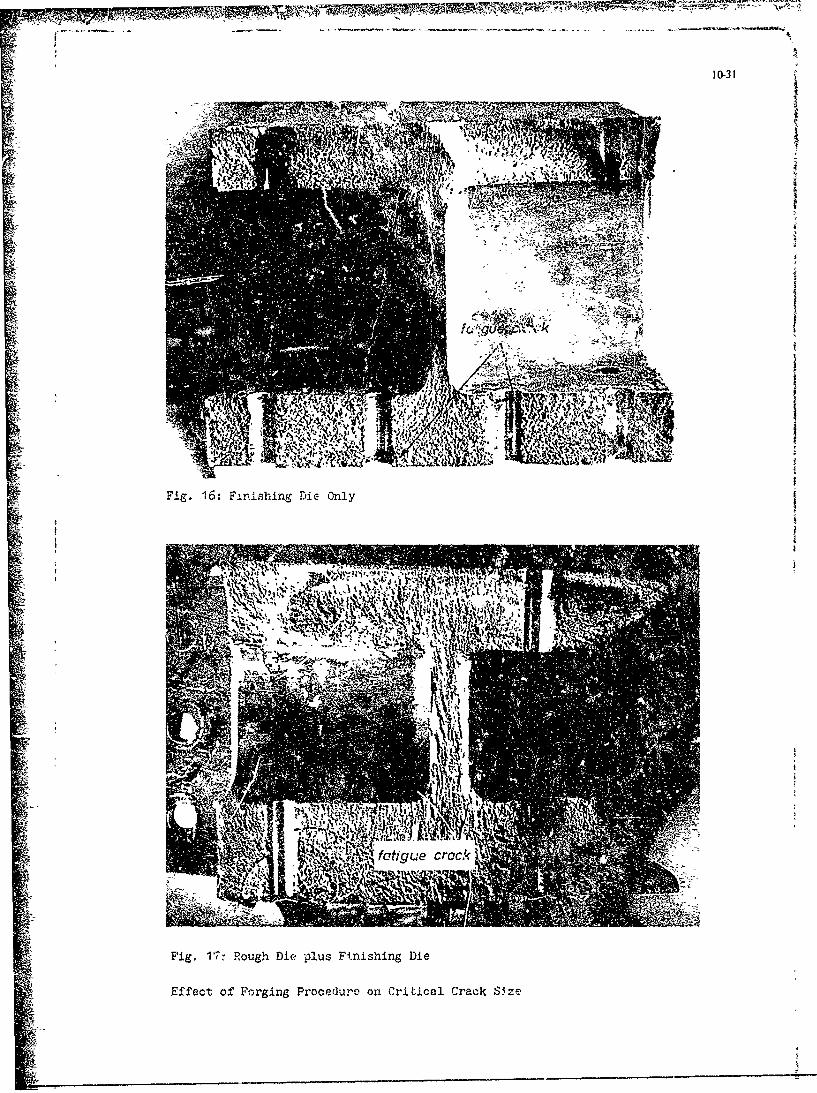
10-31
ILI
Fig. 16: Finirhing DiE Only
rig, 17. Pough Die plus Fi.nishing Die
EffIect oi' Forging Procedure on Critical Crack Si ze
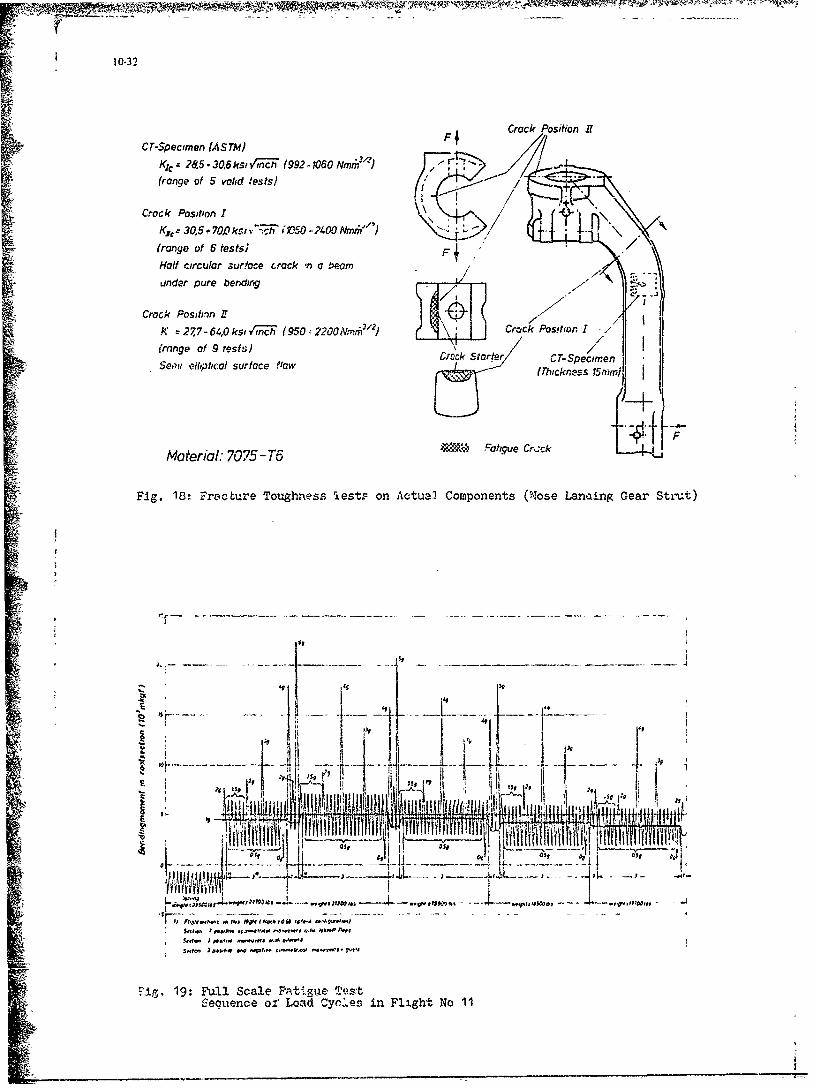
10-32
!cr-Specimen JASTM) F Crack Position .r[
(range of 5 valid tests) .
Crock Position I
K•, 30.5, 00kv,;.;Fhi iV50 -2400 Nml"t )(range of 6 tests) F
Half circular 3ur~fce crock ,n o tbem.
Crock Posi mon rokZi ie
m
K 27P7-64,Okstl-, n _ (950.•2200,W"-n3 ) Crock Position I
( ro n ge o f 9 t es ,t s ). 'o .
Semi eihptical surface elaw Trock Start-or m)
Moterial: 7075-T6 Fatique Crack
Fig. 18: Fracture Toughness lest. on Actual Components (Nose Laniing Gear Strut)
41- .. . ........... . 0 ..
otO
"• rig, 19: Full Scale Fatigue .T('st
• Sequence ofr Lead Cyoc.es in Flight No 11
4i
a> >
no rA 0 rnn Z
cpOt W C c (
0p n 0 C0 0
~0 0.~ 230
0~
e, az.
f-.- Ln CDI-
c
*ca .
I 4
ID c- b
T,0 ', - Ia >" r- > 0
LO) 0 ~
TB ~ i~
- - 0-~'~~2 o
O~n ~ ltj >
-~ '-
- -en
TI
C) C C .-
OC) 'J C6
00
C)-
E E
10 - 0•,.
4- C :- • -• .:
Q >
- , C) C),o •
.2 o--s
_ .- ,• ..• .- -' ,••
.2 8=
t; v t-- C• - -
-J0
ri ) C -3 04'~ u
RuCC) "D .2 >1. 5 )W
a ..- ~~C03 r
C) S.- I-.2
C) T
0.~~ m E-4rj Fr