Embed Size (px)
Citation preview
Gurib c35.tex V1 - January 17, 2014 2:39 P.M. P. 477
35 Natural Dyes for PhotonicsApplicationsM. Maaza1,2
UNESCO–UNISA Africa Chair in Nanosciences/Nanotechnology, College of Graduate Studies, University of South Africa (UNISA), MuckleneukRidge, Pretoria, South AfricaNanosciences African Network (NANOAFNET), iThemba LABS–National Research Foundation, Somerset West Western Cape Province SouthAfrica
35.1 Introduction
Natural dyes are chemical cycles extracted from plants, invertebratesor minerals. From the animal world, one could distinguish thosederived from cochineal insect (red), cow urine (Indian yellow), lacinsect (red, violet), murex snail (purple) and octopus or cuttlefish(sepia brown). From the plant world, the major ones are extractedfrom catechu or cutch tree (brown), Cambodge tree resin (darkmustard yellow), Himalayan rubhada root (yellow), indigofera plant(blue), kamala tree (orange–yellow, golden yellow), madder root(red, pink, orange) and pomegranate peel (yellow), among others.In 1856, William Henry Perkin discovered the first synthetic dye‘Mauve’, which is a basic dye (aniline), while searching for a curefor malaria, indirectly pioneering a new industry of synthetic dyes.This was followed by the design of the second synthetic dye, alizarin(synthetic madder), by Graebe and Liebermann and W.H. Perkin in1868. The discovery of man-made synthetic dyes in the mid 19thcentury triggered a long decline in the large-scale market for naturaldyes. Synthetic dyes, which could be produced in large quantities,quickly superseded natural dyes for commercial textile production,and unlike natural dyes they were suitable for the synthetic fibresindustry.
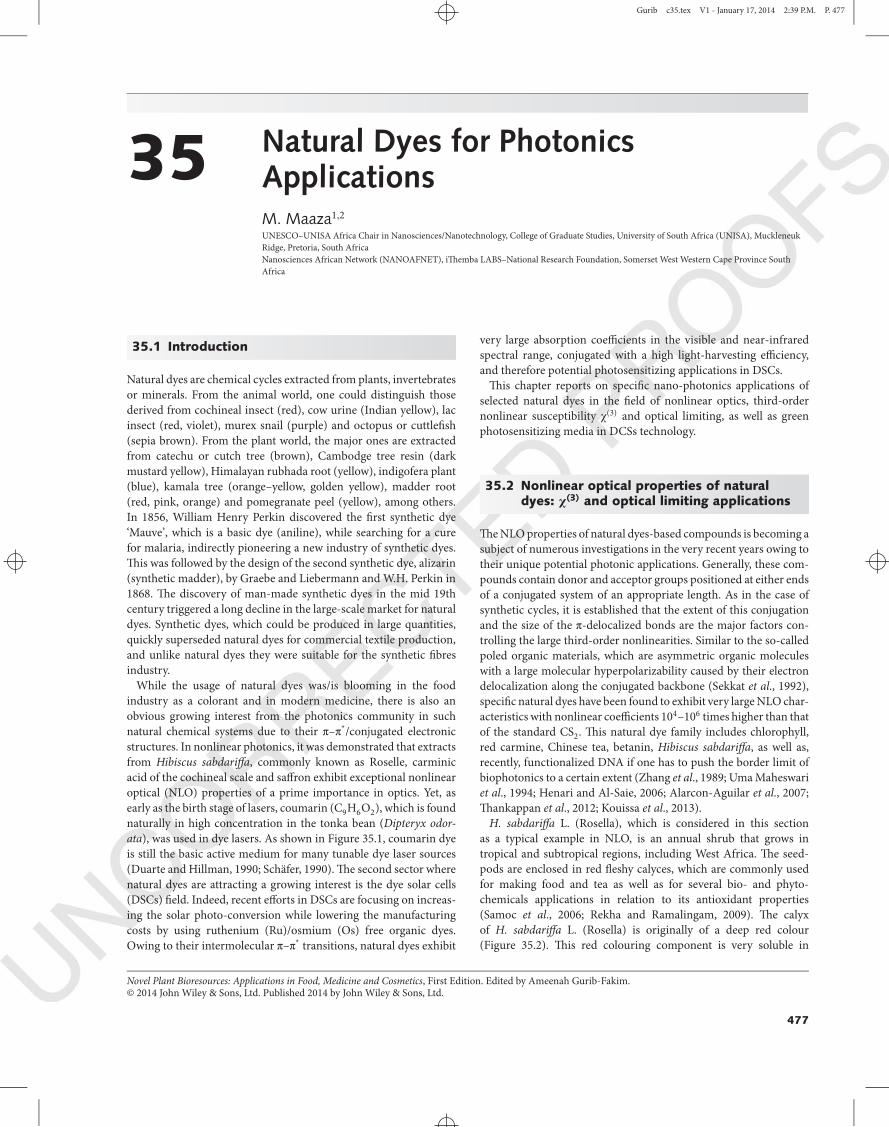
While the usage of natural dyes was/is blooming in the foodindustry as a colorant and in modern medicine, there is also anobvious growing interest from the photonics community in suchnatural chemical systems due to their π–π*/conjugated electronicstructures. In nonlinear photonics, it was demonstrated that extractsfrom Hibiscus sabdariffa, commonly known as Roselle, carminicacid of the cochineal scale and saffron exhibit exceptional nonlinearoptical (NLO) properties of a prime importance in optics. Yet, asearly as the birth stage of lasers, coumarin (C9H6O2), which is foundnaturally in high concentration in the tonka bean (Dipteryx odor-ata), was used in dye lasers. As shown in Figure 35.1, coumarin dyeis still the basic active medium for many tunable dye laser sources(Duarte and Hillman, 1990; Schäfer, 1990). The second sector wherenatural dyes are attracting a growing interest is the dye solar cells(DSCs) field. Indeed, recent efforts in DSCs are focusing on increas-ing the solar photo-conversion while lowering the manufacturingcosts by using ruthenium (Ru)/osmium (Os) free organic dyes.Owing to their intermolecular π–π* transitions, natural dyes exhibit
Novel Plant Bioresources: Applications in Food, Medicine and Cosmetics, First Edition. Edited by Ameenah Gurib-Fakim.© 2014 John Wiley & Sons, Ltd. Published 2014 by John Wiley & Sons, Ltd.
very large absorption coefficients in the visible and near-infraredspectral range, conjugated with a high light-harvesting efficiency,and therefore potential photosensitizing applications in DSCs.
This chapter reports on specific nano-photonics applications ofselected natural dyes in the field of nonlinear optics, third-ordernonlinear susceptibility χ(3) and optical limiting, as well as greenphotosensitizing media in DCSs technology.
35.2 Nonlinear optical properties of naturaldyes: 𝛘(3) and optical limiting applications
The NLO properties of natural dyes-based compounds is becoming asubject of numerous investigations in the very recent years owing totheir unique potential photonic applications. Generally, these com-pounds contain donor and acceptor groups positioned at either endsof a conjugated system of an appropriate length. As in the case ofsynthetic cycles, it is established that the extent of this conjugationand the size of the π-delocalized bonds are the major factors con-trolling the large third-order nonlinearities. Similar to the so-calledpoled organic materials, which are asymmetric organic moleculeswith a large molecular hyperpolarizability caused by their electrondelocalization along the conjugated backbone (Sekkat et al., 1992),specific natural dyes have been found to exhibit very large NLO char-acteristics with nonlinear coefficients 104–106 times higher than thatof the standard CS2. This natural dye family includes chlorophyll,red carmine, Chinese tea, betanin, Hibiscus sabdariffa, as well as,recently, functionalized DNA if one has to push the border limit ofbiophotonics to a certain extent (Zhang et al., 1989; Uma Maheswariet al., 1994; Henari and Al-Saie, 2006; Alarcon-Aguilar et al., 2007;Thankappan et al., 2012; Kouissa et al., 2013).
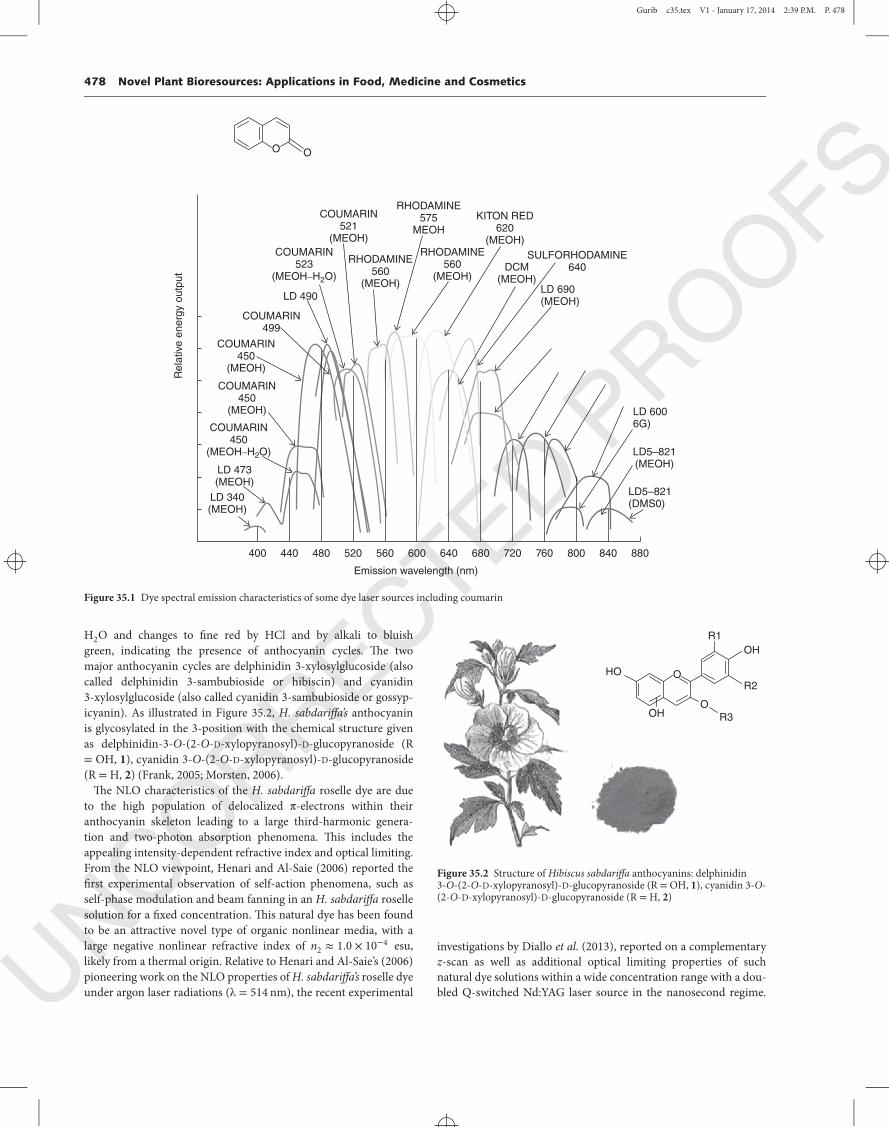
H. sabdariffa L. (Rosella), which is considered in this sectionas a typical example in NLO, is an annual shrub that grows intropical and subtropical regions, including West Africa. The seed-pods are enclosed in red fleshy calyces, which are commonly usedfor making food and tea as well as for several bio- and phyto-chemicals applications in relation to its antioxidant properties(Samoc et al., 2006; Rekha and Ramalingam, 2009). The calyxof H. sabdariffa L. (Rosella) is originally of a deep red colour(Figure 35.2). This red colouring component is very soluble in
477
Gurib c35.tex V1 - January 17, 2014 2:39 P.M. P. 478
478 Novel Plant Bioresources: Applications in Food, Medicine and Cosmetics
SULFORHODAMINE640
KITON RED620
(MEOH)
RHODAMINE575
MEOH
RHODAMINE560
(MEOH)
RHODAMINE560
(MEOH)
COUMARIN521
(MEOH)
O O
COUMARIN523
(MEOH–H2O)
COUMARIN450
(MEOH–H2O)
COUMARIN499
COUMARIN450
(MEOH)
Rela
tive
energ
y o
utp
ut
COUMARIN450
(MEOH)
LD 473(MEOH)
LD 340(MEOH)
400 440 480 520 560 600
Emission wavelength (nm)
640 680 720 760 800 840 880
LD 490LD 690(MEOH)
LD 6006G)
LD5–821(MEOH)
LD5–821(DMS0)
DCM(MEOH)
Figure 35.1 Dye spectral emission characteristics of some dye laser sources including coumarin
H2O and changes to fine red by HCl and by alkali to bluishgreen, indicating the presence of anthocyanin cycles. The twomajor anthocyanin cycles are delphinidin 3-xylosylglucoside (alsocalled delphinidin 3-sambubioside or hibiscin) and cyanidin3-xylosylglucoside (also called cyanidin 3-sambubioside or gossyp-icyanin). As illustrated in Figure 35.2, H. sabdariffa’s anthocyaninis glycosylated in the 3-position with the chemical structure givenas delphinidin-3-O-(2-O-D-xylopyranosyl)-D-glucopyranoside (R= OH, 1), cyanidin 3-O-(2-O-D-xylopyranosyl)-D-glucopyranoside(R = H, 2) (Frank, 2005; Morsten, 2006).
The NLO characteristics of the H. sabdariffa roselle dye are dueto the high population of delocalized π-electrons within theiranthocyanin skeleton leading to a large third-harmonic genera-tion and two-photon absorption phenomena. This includes theappealing intensity-dependent refractive index and optical limiting.From the NLO viewpoint, Henari and Al-Saie (2006) reported thefirst experimental observation of self-action phenomena, such asself-phase modulation and beam fanning in an H. sabdariffa rosellesolution for a fixed concentration. This natural dye has been foundto be an attractive novel type of organic nonlinear media, with alarge negative nonlinear refractive index of n2 ≈ 1.0 × 10⁻⁴ esu,likely from a thermal origin. Relative to Henari and Al-Saie’s (2006)pioneering work on the NLO properties of H. sabdariffa’s roselle dyeunder argon laser radiations (λ = 514 nm), the recent experimental
OH
OHO
O
R1
HO
R2
R3
Figure 35.2 Structure of Hibiscus sabdariffa anthocyanins: delphinidin3-O-(2-O-D-xylopyranosyl)-D-glucopyranoside (R = OH, 1), cyanidin 3-O-(2-O-D-xylopyranosyl)-D-glucopyranoside (R = H, 2)
investigations by Diallo et al. (2013), reported on a complementaryz-scan as well as additional optical limiting properties of suchnatural dye solutions within a wide concentration range with a dou-bled Q-switched Nd:YAG laser source in the nanosecond regime.
Gurib c35.tex V1 - January 17, 2014 2:39 P.M. P. 479
35 Natural Dyes for Photonics Applications 479
More precisely, the coefficient of the intensity-dependent refractiveindex n2 (n = n0 + n2I), the third-order nonlinear susceptibilityχ(3) (χ(3) = n2n0
2∕12π2) and the optical limiting thresholds arepresented in a comprehensive way within this section.
As mentioned previously, H. sabdariffa roselle calyces contain highamounts of anthocyanins, especially delphinidin 3-sambubiosideand cyanidin 3-sambubioside, and this up to 2.5 g/100 g dry weight(Herrera-Arellano et al., 2004; Cisse et al., 2009, 2011). Based onthe work of Cisse et al. (2009, 2011) related to the kinetics andmodelling of the aqueous extraction of the anthocyanins from thecalyces, fresh calyces were collected and immersed in H2O solutionsfor an effective ultrasound surface cleaning. The original collectedcalyces material were dried under sunny conditions at ambienttemperature and then ground with an electric mill of ∼1 mm inmesh. Five extracts were prepared in a fixed volume of deionizedH2O for 48 h each (0.5 L, 25 ∘C). The initial mass of the milled calycepowders was 0.5, 2, 4, 6 and 8 g. The liquid extract samples werefiltered twice to eliminate residual solids, if any. In the followingpart, the samples were designed as S1/2, S2, S4, S6 and S8 where thesubscript i in Si is the mass used during the extraction phase.
Figure 35.3 shows the room-temperature optical UV–VIS–NIRspectra of the five liquid solutions through a quartz cell of 10 mmthickness. Excluding the slight absorption band centred around962 nm, which is due to H2O vibrational modes, two major regionscan be distinguished: 200 ≤ λ ≤ 500 nm and λ ≥ 500 nm. Whilethe optical transmission of the concentrated samples is low in thefirst spectral region of 200 ≤ λ ≤ 500 nm, the less concentrated one(i.e. S1/2) does exhibit a large absorption band (∼347 to ∼513 nm),which is in fact a convolution of at least three peaks. These latterpeaks can be assigned to π–π* and σ–π* transitions. While the opticaltransmission is nearly 90% for all samples above 500 nm, there isa redshift in the cut-off wavelength as the concentration increases.Consequentially, and considering such optical transmission profiles,
200 400 600 800 1000
0.01
0.1
1
10
100
Tra
nsm
ittance
Wavelength (nm)
S1/2
S2
S4
S6
S8
Figure 35.3 UV–VIS–NIR optical transmittance of the various H.sabdariffa roselle dye extract solutions contained in 10 mm quartz cell
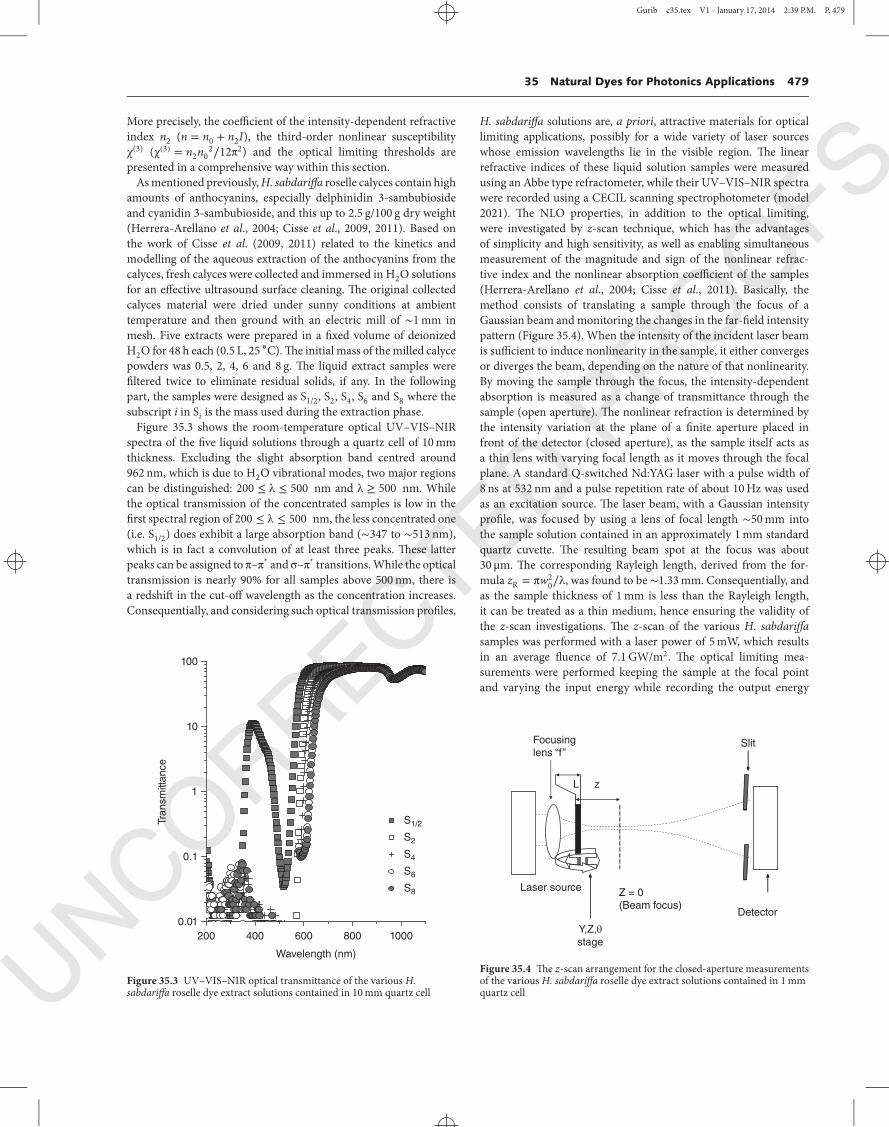
H. sabdariffa solutions are, a priori, attractive materials for opticallimiting applications, possibly for a wide variety of laser sourceswhose emission wavelengths lie in the visible region. The linearrefractive indices of these liquid solution samples were measuredusing an Abbe type refractometer, while their UV–VIS–NIR spectrawere recorded using a CECIL scanning spectrophotometer (model2021). The NLO properties, in addition to the optical limiting,were investigated by z-scan technique, which has the advantagesof simplicity and high sensitivity, as well as enabling simultaneousmeasurement of the magnitude and sign of the nonlinear refrac-tive index and the nonlinear absorption coefficient of the samples(Herrera-Arellano et al., 2004; Cisse et al., 2011). Basically, themethod consists of translating a sample through the focus of aGaussian beam and monitoring the changes in the far-field intensitypattern (Figure 35.4). When the intensity of the incident laser beamis sufficient to induce nonlinearity in the sample, it either convergesor diverges the beam, depending on the nature of that nonlinearity.By moving the sample through the focus, the intensity-dependentabsorption is measured as a change of transmittance through thesample (open aperture). The nonlinear refraction is determined bythe intensity variation at the plane of a finite aperture placed infront of the detector (closed aperture), as the sample itself acts asa thin lens with varying focal length as it moves through the focalplane. A standard Q-switched Nd:YAG laser with a pulse width of8 ns at 532 nm and a pulse repetition rate of about 10 Hz was usedas an excitation source. The laser beam, with a Gaussian intensityprofile, was focused by using a lens of focal length ∼50 mm intothe sample solution contained in an approximately 1 mm standardquartz cuvette. The resulting beam spot at the focus was about30 μm. The corresponding Rayleigh length, derived from the for-mula zR = πw2
0∕λ, was found to be ∼1.33 mm. Consequentially, andas the sample thickness of 1 mm is less than the Rayleigh length,it can be treated as a thin medium, hence ensuring the validity ofthe z-scan investigations. The z-scan of the various H. sabdariffasamples was performed with a laser power of 5 mW, which resultsin an average fluence of 7.1 GW/m2. The optical limiting mea-surements were performed keeping the sample at the focal pointand varying the input energy while recording the output energy
Detector
Focusing
lens “f”
Z = 0(Beam focus)
Laser source
L
Slit
z
Y,Z,θstage
Figure 35.4 The z-scan arrangement for the closed-aperture measurementsof the various H. sabdariffa roselle dye extract solutions contained in 1 mmquartz cell
Gurib c35.tex V1 - January 17, 2014 2:39 P.M. P. 480
480 Novel Plant Bioresources: Applications in Food, Medicine and Cosmetics
without placing the aperture in front of the detector. In order toavoid a cumulative thermal effect, the data were collected in asingle-shot mode.
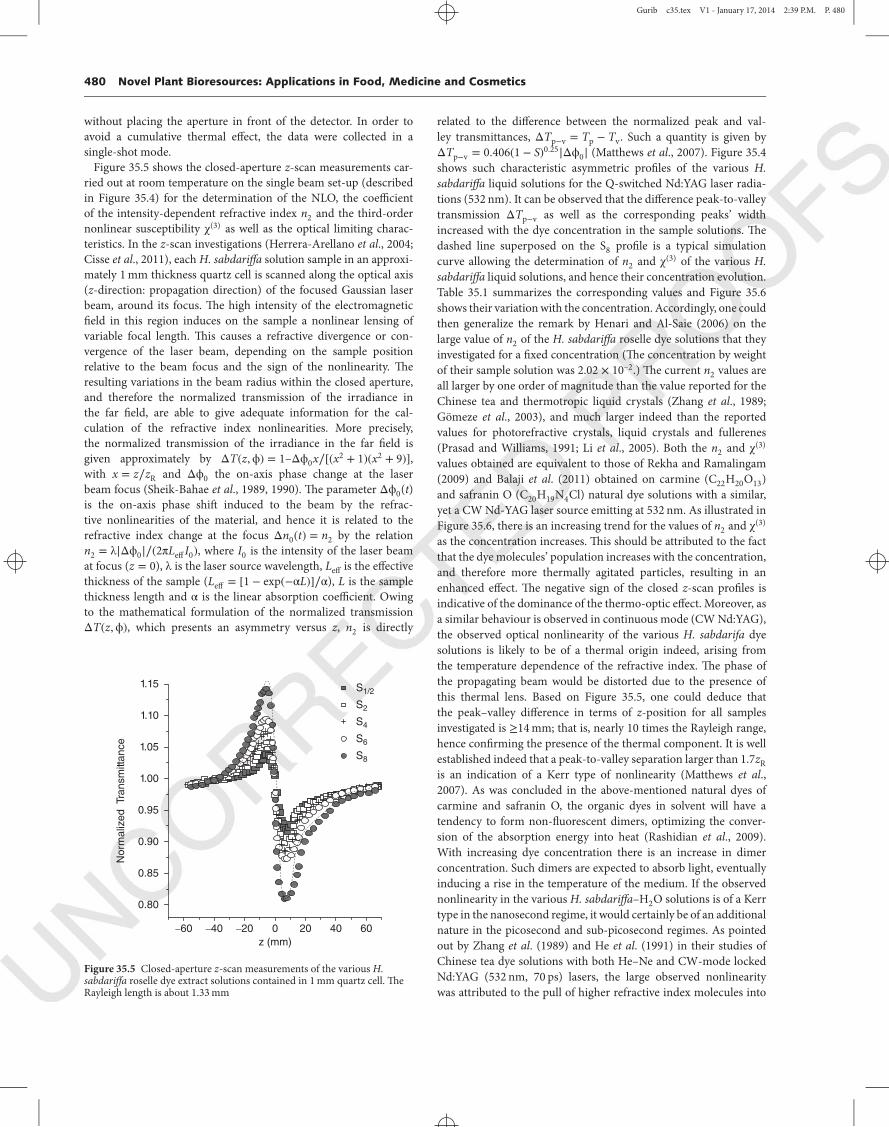
Figure 35.5 shows the closed-aperture z-scan measurements car-ried out at room temperature on the single beam set-up (describedin Figure 35.4) for the determination of the NLO, the coefficientof the intensity-dependent refractive index n2 and the third-ordernonlinear susceptibility χ(3) as well as the optical limiting charac-teristics. In the z-scan investigations (Herrera-Arellano et al., 2004;Cisse et al., 2011), each H. sabdariffa solution sample in an approxi-mately 1 mm thickness quartz cell is scanned along the optical axis(z-direction: propagation direction) of the focused Gaussian laserbeam, around its focus. The high intensity of the electromagneticfield in this region induces on the sample a nonlinear lensing ofvariable focal length. This causes a refractive divergence or con-vergence of the laser beam, depending on the sample positionrelative to the beam focus and the sign of the nonlinearity. Theresulting variations in the beam radius within the closed aperture,and therefore the normalized transmission of the irradiance inthe far field, are able to give adequate information for the cal-culation of the refractive index nonlinearities. More precisely,the normalized transmission of the irradiance in the far field isgiven approximately by ΔT(z,ϕ) = 1–Δϕ0x∕[(x2 + 1)(x2 + 9)],with x = z∕zR and Δϕ0 the on-axis phase change at the laserbeam focus (Sheik-Bahae et al., 1989, 1990). The parameter Δϕ0(t)is the on-axis phase shift induced to the beam by the refrac-tive nonlinearities of the material, and hence it is related to therefractive index change at the focus Δn0(t) = n2 by the relationn2 = λ|Δϕ0|∕(2πLeff I0), where I0 is the intensity of the laser beamat focus (z = 0), λ is the laser source wavelength, Leff is the effectivethickness of the sample (Leff = [1 − exp(−αL)]∕α), L is the samplethickness length and α is the linear absorption coefficient. Owingto the mathematical formulation of the normalized transmissionΔT(z,ϕ), which presents an asymmetry versus z, n2 is directly
–60 –40 –20 0 20 40 60
0.80
0.85
0.90
0.95
1.00
1.05
1.10
1.15
Norm
aliz
ed Tra
nsm
ittance
z (mm)
S1/2
S2
S4
S6
S8
Figure 35.5 Closed-aperture z-scan measurements of the various H.sabdariffa roselle dye extract solutions contained in 1 mm quartz cell. TheRayleigh length is about 1.33 mm
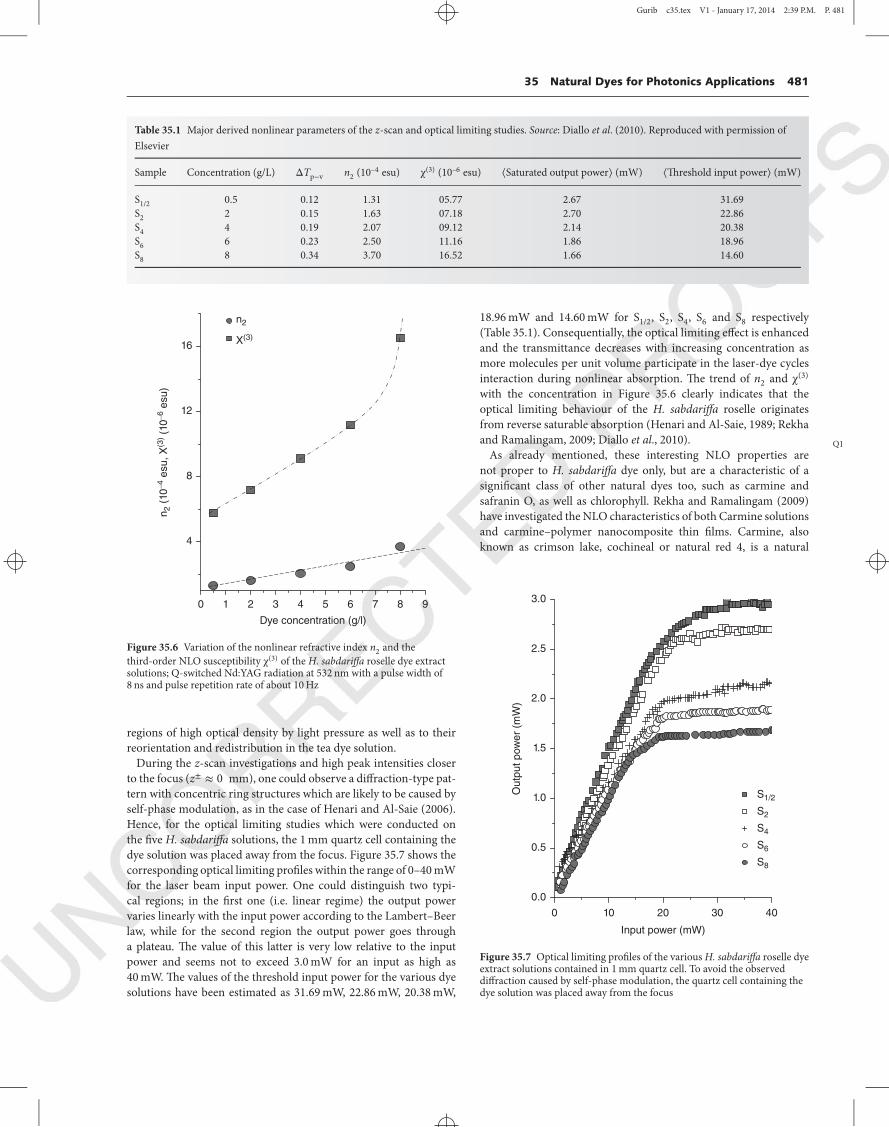
related to the difference between the normalized peak and val-ley transmittances, ΔTp−v = Tp − Tv. Such a quantity is given byΔTp−v = 0.406(1 − S)0.25|Δϕ0| (Matthews et al., 2007). Figure 35.4shows such characteristic asymmetric profiles of the various H.sabdariffa liquid solutions for the Q-switched Nd:YAG laser radia-tions (532 nm). It can be observed that the difference peak-to-valleytransmission ΔTp−v as well as the corresponding peaks’ widthincreased with the dye concentration in the sample solutions. Thedashed line superposed on the S8 profile is a typical simulationcurve allowing the determination of n2 and χ(3) of the various H.sabdariffa liquid solutions, and hence their concentration evolution.Table 35.1 summarizes the corresponding values and Figure 35.6shows their variation with the concentration. Accordingly, one couldthen generalize the remark by Henari and Al-Saie (2006) on thelarge value of n2 of the H. sabdariffa roselle dye solutions that theyinvestigated for a fixed concentration (The concentration by weightof their sample solution was 2.02 × 10⁻².) The current n2 values areall larger by one order of magnitude than the value reported for theChinese tea and thermotropic liquid crystals (Zhang et al., 1989;Gömeze et al., 2003), and much larger indeed than the reportedvalues for photorefractive crystals, liquid crystals and fullerenes(Prasad and Williams, 1991; Li et al., 2005). Both the n2 and χ(3)
values obtained are equivalent to those of Rekha and Ramalingam(2009) and Balaji et al. (2011) obtained on carmine (C22H20O13)and safranin O (C20H19N4Cl) natural dye solutions with a similar,yet a CW Nd-YAG laser source emitting at 532 nm. As illustrated inFigure 35.6, there is an increasing trend for the values of n2 and χ(3)
as the concentration increases. This should be attributed to the factthat the dye molecules’ population increases with the concentration,and therefore more thermally agitated particles, resulting in anenhanced effect. The negative sign of the closed z-scan profiles isindicative of the dominance of the thermo-optic effect. Moreover, asa similar behaviour is observed in continuous mode (CW Nd:YAG),the observed optical nonlinearity of the various H. sabdarifa dyesolutions is likely to be of a thermal origin indeed, arising fromthe temperature dependence of the refractive index. The phase ofthe propagating beam would be distorted due to the presence ofthis thermal lens. Based on Figure 35.5, one could deduce thatthe peak–valley difference in terms of z-position for all samplesinvestigated is ≥14 mm; that is, nearly 10 times the Rayleigh range,hence confirming the presence of the thermal component. It is wellestablished indeed that a peak-to-valley separation larger than 1.7zRis an indication of a Kerr type of nonlinearity (Matthews et al.,2007). As was concluded in the above-mentioned natural dyes ofcarmine and safranin O, the organic dyes in solvent will have atendency to form non-fluorescent dimers, optimizing the conver-sion of the absorption energy into heat (Rashidian et al., 2009).With increasing dye concentration there is an increase in dimerconcentration. Such dimers are expected to absorb light, eventuallyinducing a rise in the temperature of the medium. If the observednonlinearity in the various H. sabdariffa–H2O solutions is of a Kerrtype in the nanosecond regime, it would certainly be of an additionalnature in the picosecond and sub-picosecond regimes. As pointedout by Zhang et al. (1989) and He et al. (1991) in their studies ofChinese tea dye solutions with both He–Ne and CW-mode lockedNd:YAG (532 nm, 70 ps) lasers, the large observed nonlinearitywas attributed to the pull of higher refractive index molecules into
Gurib c35.tex V1 - January 17, 2014 2:39 P.M. P. 481
35 Natural Dyes for Photonics Applications 481
Table 35.1 Major derived nonlinear parameters of the z-scan and optical limiting studies. Source: Diallo et al. (2010). Reproduced with permission ofElsevier
Sample Concentration (g/L) ΔTp−v n2 (10–4 esu) χ(3) (10–6 esu) ⟨Saturated output power⟩ (mW) ⟨Threshold input power⟩ (mW)
S1/2 0.5 0.12 1.31 05.77 2.67 31.69S2 2 0.15 1.63 07.18 2.70 22.86S4 4 0.19 2.07 09.12 2.14 20.38S6 6 0.23 2.50 11.16 1.86 18.96S8 8 0.34 3.70 16.52 1.66 14.60
0 1 2 3 4 5 6 7 8 9
4
8
12
16
Dye concentration (g/l)
n2
X(3)
n2 (
10
–4 e
su, X
(3) (1
0–6
esu)
Figure 35.6 Variation of the nonlinear refractive index n2 and thethird-order NLO susceptibility χ(3) of the H. sabdariffa roselle dye extractsolutions; Q-switched Nd:YAG radiation at 532 nm with a pulse width of8 ns and pulse repetition rate of about 10 Hz
regions of high optical density by light pressure as well as to theirreorientation and redistribution in the tea dye solution.
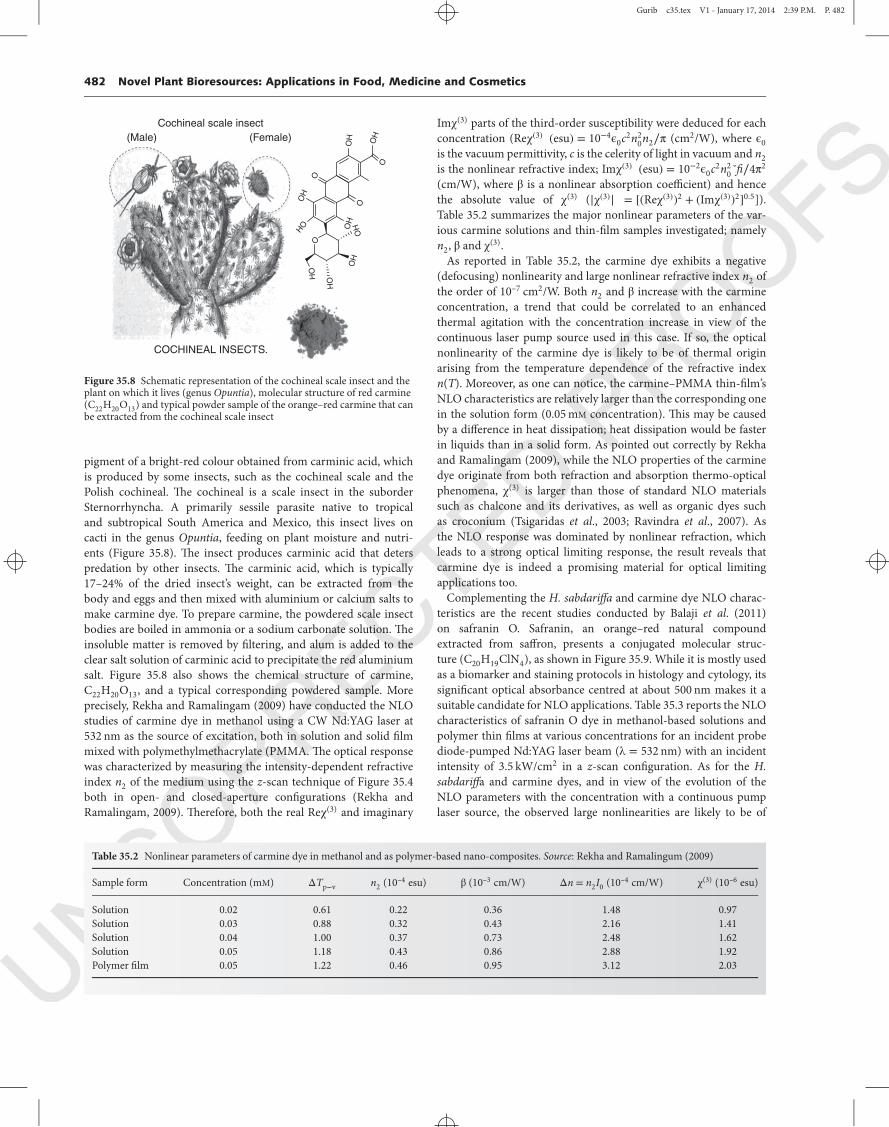
During the z-scan investigations and high peak intensities closerto the focus (z± ≈ 0 mm), one could observe a diffraction-type pat-tern with concentric ring structures which are likely to be caused byself-phase modulation, as in the case of Henari and Al-Saie (2006).Hence, for the optical limiting studies which were conducted onthe five H. sabdariffa solutions, the 1 mm quartz cell containing thedye solution was placed away from the focus. Figure 35.7 shows thecorresponding optical limiting profiles within the range of 0–40 mWfor the laser beam input power. One could distinguish two typi-cal regions; in the first one (i.e. linear regime) the output powervaries linearly with the input power according to the Lambert–Beerlaw, while for the second region the output power goes througha plateau. The value of this latter is very low relative to the inputpower and seems not to exceed 3.0 mW for an input as high as40 mW. The values of the threshold input power for the various dyesolutions have been estimated as 31.69 mW, 22.86 mW, 20.38 mW,
18.96 mW and 14.60 mW for S1/2, S2, S4, S6 and S8 respectively(Table 35.1). Consequentially, the optical limiting effect is enhancedand the transmittance decreases with increasing concentration asmore molecules per unit volume participate in the laser-dye cyclesinteraction during nonlinear absorption. The trend of n2 and χ(3)
with the concentration in Figure 35.6 clearly indicates that theoptical limiting behaviour of the H. sabdariffa roselle originatesfrom reverse saturable absorption (Henari and Al-Saie, 1989; Rekhaand Ramalingam, 2009; Diallo et al., 2010). Q1
As already mentioned, these interesting NLO properties arenot proper to H. sabdariffa dye only, but are a characteristic of asignificant class of other natural dyes too, such as carmine andsafranin O, as well as chlorophyll. Rekha and Ramalingam (2009)have investigated the NLO characteristics of both Carmine solutionsand carmine–polymer nanocomposite thin films. Carmine, alsoknown as crimson lake, cochineal or natural red 4, is a natural
0 10 20 30 40
0.0
0.5
1.0
1.5
2.0
2.5
3.0
Ou
tput pow
er
(mW
)
Input power (mW)
S1/2
S2
S4
S6
S8
Figure 35.7 Optical limiting profiles of the various H. sabdariffa roselle dyeextract solutions contained in 1 mm quartz cell. To avoid the observeddiffraction caused by self-phase modulation, the quartz cell containing thedye solution was placed away from the focus
Gurib c35.tex V1 - January 17, 2014 2:39 P.M. P. 482
482 Novel Plant Bioresources: Applications in Food, Medicine and Cosmetics
OH
O
HO
OH
OH
OH
HO
O
O
OO
H
OH
OH
Cochineal scale insect
COCHINEAL INSECTS.
(Female)(Male)
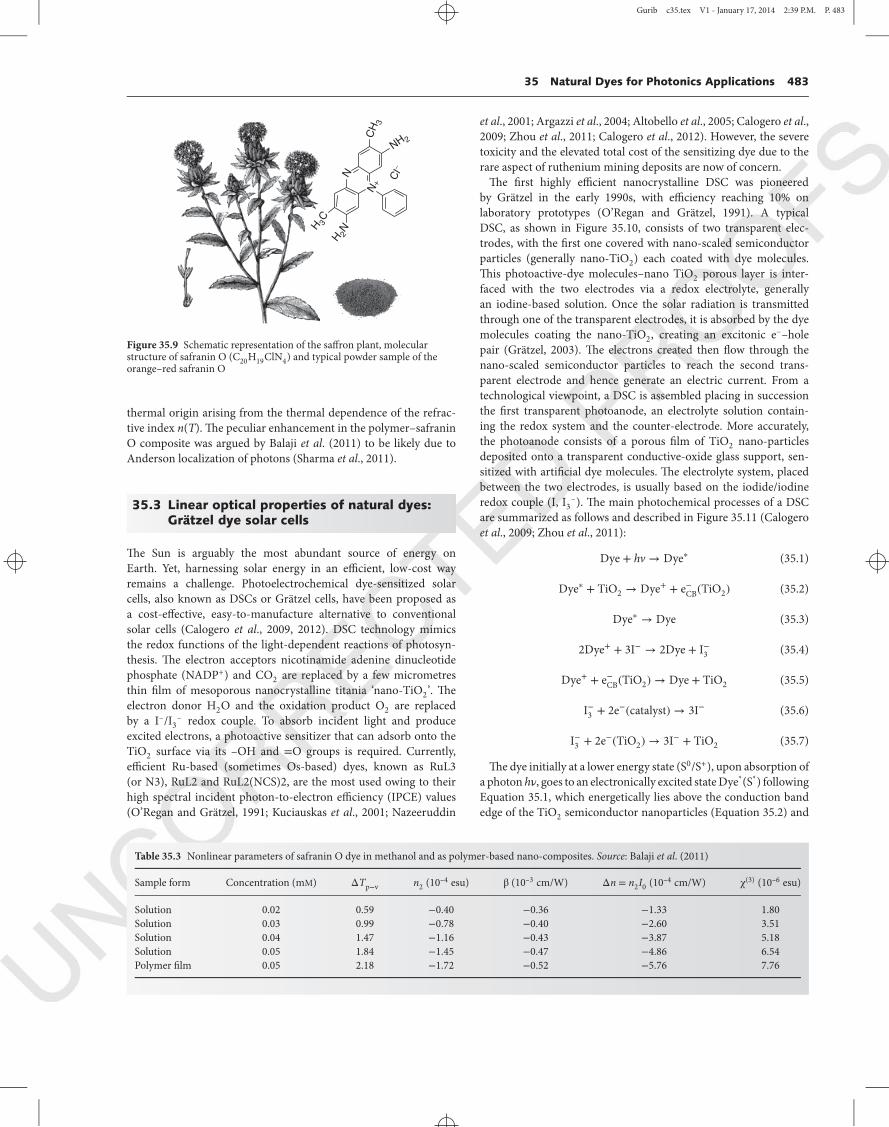
Figure 35.8 Schematic representation of the cochineal scale insect and theplant on which it lives (genus Opuntia), molecular structure of red carmine(C22H20O13) and typical powder sample of the orange–red carmine that canbe extracted from the cochineal scale insect
pigment of a bright-red colour obtained from carminic acid, whichis produced by some insects, such as the cochineal scale and thePolish cochineal. The cochineal is a scale insect in the suborderSternorrhyncha. A primarily sessile parasite native to tropicaland subtropical South America and Mexico, this insect lives oncacti in the genus Opuntia, feeding on plant moisture and nutri-ents (Figure 35.8). The insect produces carminic acid that deterspredation by other insects. The carminic acid, which is typically17–24% of the dried insect’s weight, can be extracted from thebody and eggs and then mixed with aluminium or calcium salts tomake carmine dye. To prepare carmine, the powdered scale insectbodies are boiled in ammonia or a sodium carbonate solution. Theinsoluble matter is removed by filtering, and alum is added to theclear salt solution of carminic acid to precipitate the red aluminiumsalt. Figure 35.8 also shows the chemical structure of carmine,C22H20O13, and a typical corresponding powdered sample. Moreprecisely, Rekha and Ramalingam (2009) have conducted the NLOstudies of carmine dye in methanol using a CW Nd:YAG laser at532 nm as the source of excitation, both in solution and solid filmmixed with polymethylmethacrylate (PMMA. The optical responsewas characterized by measuring the intensity-dependent refractiveindex n2 of the medium using the z-scan technique of Figure 35.4both in open- and closed-aperture configurations (Rekha andRamalingam, 2009). Therefore, both the real Reχ(3) and imaginary
Imχ(3) parts of the third-order susceptibility were deduced for eachconcentration (Reχ(3) (esu) = 10−4ϵ0c2n2
0n2∕π (cm2/W), where ϵ0is the vacuum permittivity, c is the celerity of light in vacuum and n2is the nonlinear refractive index; Imχ(3) (esu) = 10−2ϵ0c2n2
0˘fi∕4π2
(cm/W), where β is a nonlinear absorption coefficient) and hencethe absolute value of χ(3) (|χ(3)| = [(Reχ(3))2 + (Imχ(3))2]0.5]).Table 35.2 summarizes the major nonlinear parameters of the var-ious carmine solutions and thin-film samples investigated; namelyn2, β and χ(3).
As reported in Table 35.2, the carmine dye exhibits a negative(defocusing) nonlinearity and large nonlinear refractive index n2 ofthe order of 10–7 cm2/W. Both n2 and β increase with the carmineconcentration, a trend that could be correlated to an enhancedthermal agitation with the concentration increase in view of thecontinuous laser pump source used in this case. If so, the opticalnonlinearity of the carmine dye is likely to be of thermal originarising from the temperature dependence of the refractive indexn(T). Moreover, as one can notice, the carmine–PMMA thin-film’sNLO characteristics are relatively larger than the corresponding onein the solution form (0.05 mM concentration). This may be causedby a difference in heat dissipation; heat dissipation would be fasterin liquids than in a solid form. As pointed out correctly by Rekhaand Ramalingam (2009), while the NLO properties of the carminedye originate from both refraction and absorption thermo-opticalphenomena, χ(3) is larger than those of standard NLO materialssuch as chalcone and its derivatives, as well as organic dyes suchas croconium (Tsigaridas et al., 2003; Ravindra et al., 2007). Asthe NLO response was dominated by nonlinear refraction, whichleads to a strong optical limiting response, the result reveals thatcarmine dye is indeed a promising material for optical limitingapplications too.
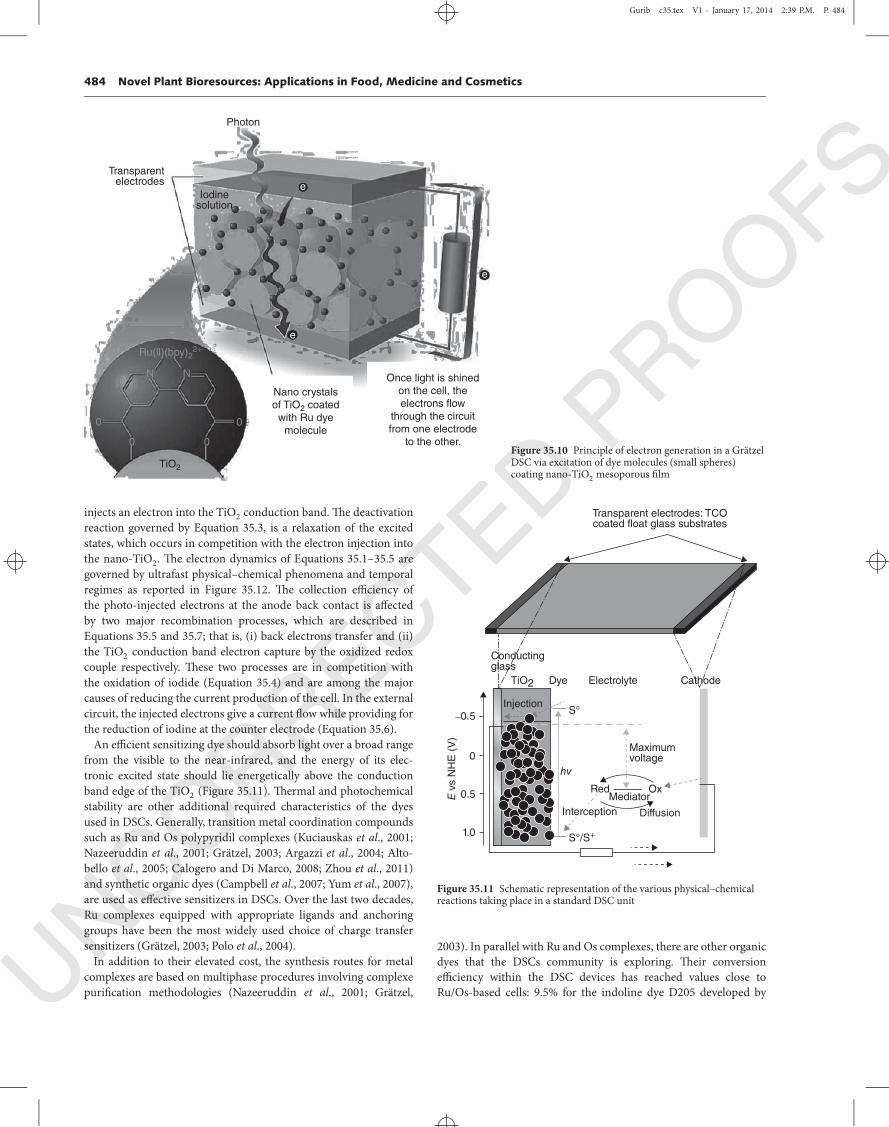
Complementing the H. sabdariffa and carmine dye NLO charac-teristics are the recent studies conducted by Balaji et al. (2011)on safranin O. Safranin, an orange–red natural compoundextracted from saffron, presents a conjugated molecular struc-ture (C20H19ClN4), as shown in Figure 35.9. While it is mostly usedas a biomarker and staining protocols in histology and cytology, itssignificant optical absorbance centred at about 500 nm makes it asuitable candidate for NLO applications. Table 35.3 reports the NLOcharacteristics of safranin O dye in methanol-based solutions andpolymer thin films at various concentrations for an incident probediode-pumped Nd:YAG laser beam (λ = 532 nm) with an incidentintensity of 3.5 kW/cm2 in a z-scan configuration. As for the H.sabdariffa and carmine dyes, and in view of the evolution of theNLO parameters with the concentration with a continuous pumplaser source, the observed large nonlinearities are likely to be of
Table 35.2 Nonlinear parameters of carmine dye in methanol and as polymer-based nano-composites. Source: Rekha and Ramalingum (2009)
Sample form Concentration (mM) ΔTp−v n2 (10–4 esu) β (10–3 cm/W) Δn = n2I0 (10–4 cm/W) χ(3) (10–6 esu)
Solution 0.02 0.61 0.22 0.36 1.48 0.97Solution 0.03 0.88 0.32 0.43 2.16 1.41Solution 0.04 1.00 0.37 0.73 2.48 1.62Solution 0.05 1.18 0.43 0.86 2.88 1.92Polymer film 0.05 1.22 0.46 0.95 3.12 2.03
Gurib c35.tex V1 - January 17, 2014 2:39 P.M. P. 483
35 Natural Dyes for Photonics Applications 483
H 3C
H 2N
CH
3
Cl–
N+
N
NH 2
Figure 35.9 Schematic representation of the saffron plant, molecularstructure of safranin O (C20H19ClN4) and typical powder sample of theorange–red safranin O
thermal origin arising from the thermal dependence of the refrac-tive index n(T). The peculiar enhancement in the polymer–safraninO composite was argued by Balaji et al. (2011) to be likely due toAnderson localization of photons (Sharma et al., 2011).
35.3 Linear optical properties of natural dyes:Grätzel dye solar cells
The Sun is arguably the most abundant source of energy onEarth. Yet, harnessing solar energy in an efficient, low-cost wayremains a challenge. Photoelectrochemical dye-sensitized solarcells, also known as DSCs or Grätzel cells, have been proposed asa cost-effective, easy-to-manufacture alternative to conventionalsolar cells (Calogero et al., 2009, 2012). DSC technology mimicsthe redox functions of the light-dependent reactions of photosyn-thesis. The electron acceptors nicotinamide adenine dinucleotidephosphate (NADP+) and CO2 are replaced by a few micrometresthin film of mesoporous nanocrystalline titania ‘nano-TiO2’. Theelectron donor H2O and the oxidation product O2 are replacedby a I–/I3
– redox couple. To absorb incident light and produceexcited electrons, a photoactive sensitizer that can adsorb onto theTiO2 surface via its –OH and =O groups is required. Currently,efficient Ru-based (sometimes Os-based) dyes, known as RuL3(or N3), RuL2 and RuL2(NCS)2, are the most used owing to theirhigh spectral incident photon-to-electron efficiency (IPCE) values(O’Regan and Grätzel, 1991; Kuciauskas et al., 2001; Nazeeruddin
et al., 2001; Argazzi et al., 2004; Altobello et al., 2005; Calogero et al.,2009; Zhou et al., 2011; Calogero et al., 2012). However, the severetoxicity and the elevated total cost of the sensitizing dye due to therare aspect of ruthenium mining deposits are now of concern.
The first highly efficient nanocrystalline DSC was pioneeredby Grätzel in the early 1990s, with efficiency reaching 10% onlaboratory prototypes (O’Regan and Grätzel, 1991). A typicalDSC, as shown in Figure 35.10, consists of two transparent elec-trodes, with the first one covered with nano-scaled semiconductorparticles (generally nano-TiO2) each coated with dye molecules.This photoactive-dye molecules–nano TiO2 porous layer is inter-faced with the two electrodes via a redox electrolyte, generallyan iodine-based solution. Once the solar radiation is transmittedthrough one of the transparent electrodes, it is absorbed by the dyemolecules coating the nano-TiO2, creating an excitonic e––holepair (Grätzel, 2003). The electrons created then flow through thenano-scaled semiconductor particles to reach the second trans-parent electrode and hence generate an electric current. From atechnological viewpoint, a DSC is assembled placing in successionthe first transparent photoanode, an electrolyte solution contain-ing the redox system and the counter-electrode. More accurately,the photoanode consists of a porous film of TiO2 nano-particlesdeposited onto a transparent conductive-oxide glass support, sen-sitized with artificial dye molecules. The electrolyte system, placedbetween the two electrodes, is usually based on the iodide/iodineredox couple (I, I3
–). The main photochemical processes of a DSCare summarized as follows and described in Figure 35.11 (Calogeroet al., 2009; Zhou et al., 2011):
Dye + hv → Dye∗ (35.1)
Dye∗ + TiO2 → Dye+ + e−CB(TiO2) (35.2)
Dye∗ → Dye (35.3)
2Dye+ + 3I− → 2Dye + I−3 (35.4)
Dye+ + e−CB(TiO2) → Dye + TiO2 (35.5)
I−3 + 2e−(catalyst) → 3I− (35.6)
I−3 + 2e−(TiO2) → 3I− + TiO2 (35.7)
The dye initially at a lower energy state (S0/S+), upon absorption ofa photon hν, goes to an electronically excited state Dye*(S*) followingEquation 35.1, which energetically lies above the conduction bandedge of the TiO2 semiconductor nanoparticles (Equation 35.2) and
Table 35.3 Nonlinear parameters of safranin O dye in methanol and as polymer-based nano-composites. Source: Balaji et al. (2011)
Sample form Concentration (mM) ΔTp−v n2 (10–4 esu) β (10–3 cm/W) Δn = n2I0 (10–4 cm/W) χ(3) (10–6 esu)
Solution 0.02 0.59 −0.40 −0.36 −1.33 1.80Solution 0.03 0.99 −0.78 −0.40 −2.60 3.51Solution 0.04 1.47 −1.16 −0.43 −3.87 5.18Solution 0.05 1.84 −1.45 −0.47 −4.86 6.54Polymer film 0.05 2.18 −1.72 −0.52 −5.76 7.76
Gurib c35.tex V1 - January 17, 2014 2:39 P.M. P. 484
484 Novel Plant Bioresources: Applications in Food, Medicine and Cosmetics
Photon
Transparentelectrodes
Iodinesolution
e
e
0
00
0
Ru(ll)(bpy)22+
TiO2
Nano crystalsof TiO2 coated
with Ru dyemolecule
Once light is shinedon the cell, theelectrons flow
through the circuitfrom one electrode
to the other.
N N
e
Figure 35.10 Principle of electron generation in a GrätzelDSC via excitation of dye molecules (small spheres)coating nano-TiO2 mesoporous film
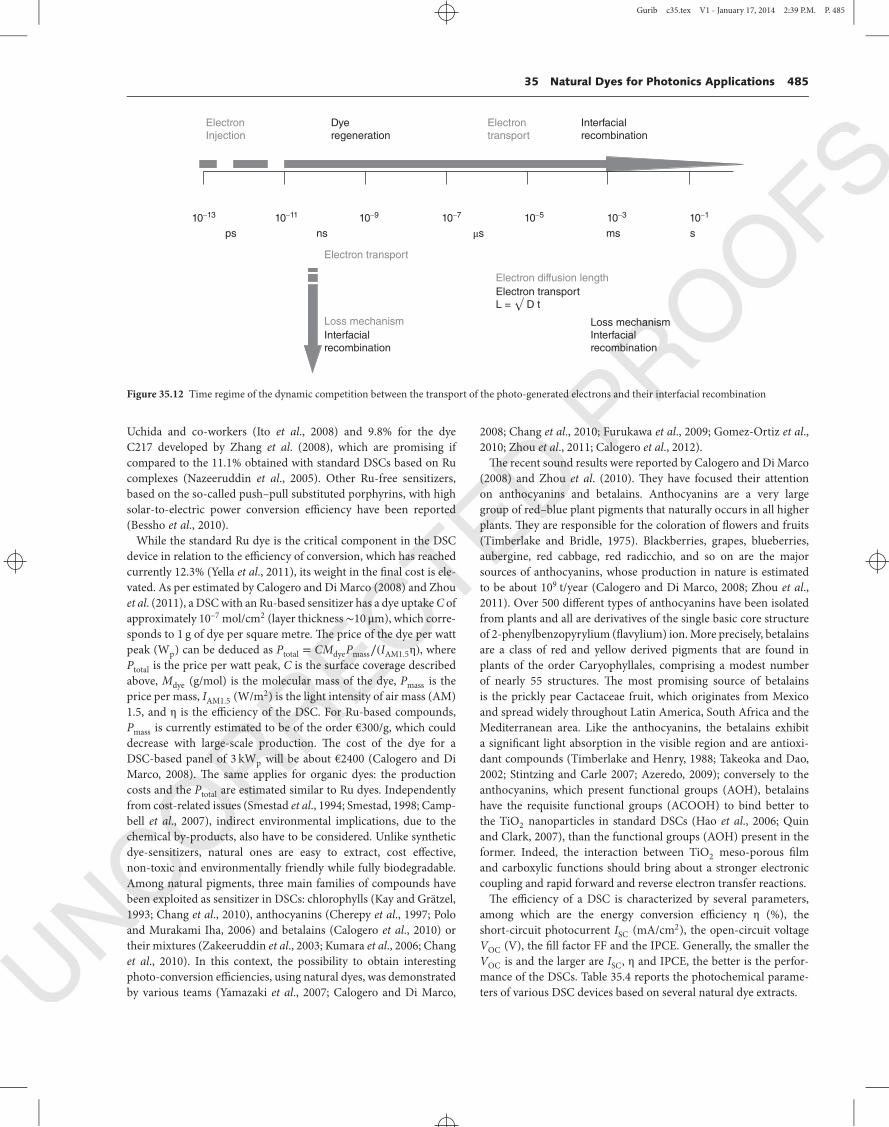
injects an electron into the TiO2 conduction band. The deactivationreaction governed by Equation 35.3, is a relaxation of the excitedstates, which occurs in competition with the electron injection intothe nano-TiO2. The electron dynamics of Equations 35.1–35.5 aregoverned by ultrafast physical–chemical phenomena and temporalregimes as reported in Figure 35.12. The collection efficiency ofthe photo-injected electrons at the anode back contact is affectedby two major recombination processes, which are described inEquations 35.5 and 35.7; that is, (i) back electrons transfer and (ii)the TiO2 conduction band electron capture by the oxidized redoxcouple respectively. These two processes are in competition withthe oxidation of iodide (Equation 35.4) and are among the majorcauses of reducing the current production of the cell. In the externalcircuit, the injected electrons give a current flow while providing forthe reduction of iodine at the counter electrode (Equation 35.6).
An efficient sensitizing dye should absorb light over a broad rangefrom the visible to the near-infrared, and the energy of its elec-tronic excited state should lie energetically above the conductionband edge of the TiO2 (Figure 35.11). Thermal and photochemicalstability are other additional required characteristics of the dyesused in DSCs. Generally, transition metal coordination compoundssuch as Ru and Os polypyridil complexes (Kuciauskas et al., 2001;Nazeeruddin et al., 2001; Grätzel, 2003; Argazzi et al., 2004; Alto-bello et al., 2005; Calogero and Di Marco, 2008; Zhou et al., 2011)and synthetic organic dyes (Campbell et al., 2007; Yum et al., 2007),are used as effective sensitizers in DSCs. Over the last two decades,Ru complexes equipped with appropriate ligands and anchoringgroups have been the most widely used choice of charge transfersensitizers (Grätzel, 2003; Polo et al., 2004).
In addition to their elevated cost, the synthesis routes for metalcomplexes are based on multiphase procedures involving complexepurification methodologies (Nazeeruddin et al., 2001; Grätzel,
Transparent electrodes: TCOcoated float glass substrates
Electrolyte CathodeDyeTiO2
Conductingglass
Injection–0.5
E v
s N
HE
(V
)
0
0.5
1.0
Maximumvoltage
Diffusion
OxRed
Interception
S°/S+
S°
hv
Mediator
Figure 35.11 Schematic representation of the various physical–chemicalreactions taking place in a standard DSC unit
2003). In parallel with Ru and Os complexes, there are other organicdyes that the DSCs community is exploring. Their conversionefficiency within the DSC devices has reached values close toRu/Os-based cells: 9.5% for the indoline dye D205 developed by
Gurib c35.tex V1 - January 17, 2014 2:39 P.M. P. 485
35 Natural Dyes for Photonics Applications 485
ElectronInjection
Electrontransport
Electron transport
Loss mechanism
Dyeregeneration
10–13
ps ns μs ms s
10–11
Interfacialrecombination
Loss mechanismInterfacialrecombination
Electron diffusion length
Electron transportL = √ D t
10–9 10–7 10–5 10–3 10–1
Interfacialrecombination
Figure 35.12 Time regime of the dynamic competition between the transport of the photo-generated electrons and their interfacial recombination
Uchida and co-workers (Ito et al., 2008) and 9.8% for the dyeC217 developed by Zhang et al. (2008), which are promising ifcompared to the 11.1% obtained with standard DSCs based on Rucomplexes (Nazeeruddin et al., 2005). Other Ru-free sensitizers,based on the so-called push–pull substituted porphyrins, with highsolar-to-electric power conversion efficiency have been reported(Bessho et al., 2010).
While the standard Ru dye is the critical component in the DSCdevice in relation to the efficiency of conversion, which has reachedcurrently 12.3% (Yella et al., 2011), its weight in the final cost is ele-vated. As per estimated by Calogero and Di Marco (2008) and Zhouet al. (2011), a DSC with an Ru-based sensitizer has a dye uptake C ofapproximately 10–7 mol/cm2 (layer thickness ∼10 μm), which corre-sponds to 1 g of dye per square metre. The price of the dye per wattpeak (Wp) can be deduced as Ptotal = CMdyePmass∕(IAM1.5η), wherePtotal is the price per watt peak, C is the surface coverage describedabove, Mdye (g/mol) is the molecular mass of the dye, Pmass is theprice per mass, IAM1.5 (W/m2) is the light intensity of air mass (AM)1.5, and η is the efficiency of the DSC. For Ru-based compounds,Pmass is currently estimated to be of the order €300/g, which coulddecrease with large-scale production. The cost of the dye for aDSC-based panel of 3 kWp will be about €2400 (Calogero and DiMarco, 2008). The same applies for organic dyes: the productioncosts and the Ptotal are estimated similar to Ru dyes. Independentlyfrom cost-related issues (Smestad et al., 1994; Smestad, 1998; Camp-bell et al., 2007), indirect environmental implications, due to thechemical by-products, also have to be considered. Unlike syntheticdye-sensitizers, natural ones are easy to extract, cost effective,non-toxic and environmentally friendly while fully biodegradable.Among natural pigments, three main families of compounds havebeen exploited as sensitizer in DSCs: chlorophylls (Kay and Grätzel,1993; Chang et al., 2010), anthocyanins (Cherepy et al., 1997; Poloand Murakami Iha, 2006) and betalains (Calogero et al., 2010) ortheir mixtures (Zakeeruddin et al., 2003; Kumara et al., 2006; Changet al., 2010). In this context, the possibility to obtain interestingphoto-conversion efficiencies, using natural dyes, was demonstratedby various teams (Yamazaki et al., 2007; Calogero and Di Marco,
2008; Chang et al., 2010; Furukawa et al., 2009; Gomez-Ortiz et al.,2010; Zhou et al., 2011; Calogero et al., 2012).
The recent sound results were reported by Calogero and Di Marco(2008) and Zhou et al. (2010). They have focused their attentionon anthocyanins and betalains. Anthocyanins are a very largegroup of red–blue plant pigments that naturally occurs in all higherplants. They are responsible for the coloration of flowers and fruits(Timberlake and Bridle, 1975). Blackberries, grapes, blueberries,aubergine, red cabbage, red radicchio, and so on are the majorsources of anthocyanins, whose production in nature is estimatedto be about 109 t/year (Calogero and Di Marco, 2008; Zhou et al.,2011). Over 500 different types of anthocyanins have been isolatedfrom plants and all are derivatives of the single basic core structureof 2-phenylbenzopyrylium (flavylium) ion. More precisely, betalainsare a class of red and yellow derived pigments that are found inplants of the order Caryophyllales, comprising a modest numberof nearly 55 structures. The most promising source of betalainsis the prickly pear Cactaceae fruit, which originates from Mexicoand spread widely throughout Latin America, South Africa and theMediterranean area. Like the anthocyanins, the betalains exhibita significant light absorption in the visible region and are antioxi-dant compounds (Timberlake and Henry, 1988; Takeoka and Dao,2002; Stintzing and Carle 2007; Azeredo, 2009); conversely to theanthocyanins, which present functional groups (AOH), betalainshave the requisite functional groups (ACOOH) to bind better tothe TiO2 nanoparticles in standard DSCs (Hao et al., 2006; Quinand Clark, 2007), than the functional groups (AOH) present in theformer. Indeed, the interaction between TiO2 meso-porous filmand carboxylic functions should bring about a stronger electroniccoupling and rapid forward and reverse electron transfer reactions.
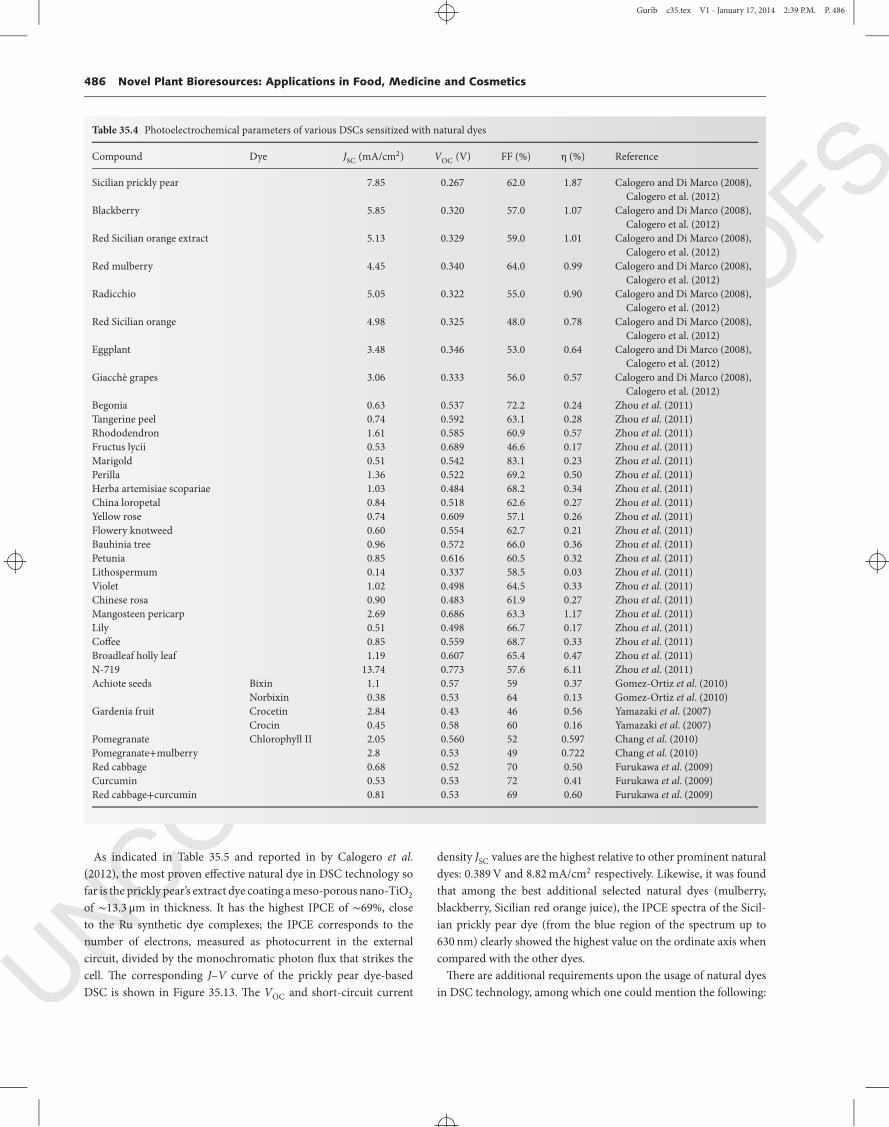
The efficiency of a DSC is characterized by several parameters,among which are the energy conversion efficiency η (%), theshort-circuit photocurrent ISC (mA/cm2), the open-circuit voltageVOC (V), the fill factor FF and the IPCE. Generally, the smaller theVOC is and the larger are ISC, η and IPCE, the better is the perfor-mance of the DSCs. Table 35.4 reports the photochemical parame-ters of various DSC devices based on several natural dye extracts.
Gurib c35.tex V1 - January 17, 2014 2:39 P.M. P. 486
486 Novel Plant Bioresources: Applications in Food, Medicine and Cosmetics
Table 35.4 Photoelectrochemical parameters of various DSCs sensitized with natural dyes
Compound Dye JSC (mA/cm2) VOC (V) FF (%) η (%) Reference
Sicilian prickly pear 7.85 0.267 62.0 1.87 Calogero and Di Marco (2008),Calogero et al. (2012)
Blackberry 5.85 0.320 57.0 1.07 Calogero and Di Marco (2008),Calogero et al. (2012)
Red Sicilian orange extract 5.13 0.329 59.0 1.01 Calogero and Di Marco (2008),Calogero et al. (2012)
Red mulberry 4.45 0.340 64.0 0.99 Calogero and Di Marco (2008),Calogero et al. (2012)
Radicchio 5.05 0.322 55.0 0.90 Calogero and Di Marco (2008),Calogero et al. (2012)
Red Sicilian orange 4.98 0.325 48.0 0.78 Calogero and Di Marco (2008),Calogero et al. (2012)
Eggplant 3.48 0.346 53.0 0.64 Calogero and Di Marco (2008),Calogero et al. (2012)
Giacchè grapes 3.06 0.333 56.0 0.57 Calogero and Di Marco (2008),Calogero et al. (2012)
Begonia 0.63 0.537 72.2 0.24 Zhou et al. (2011)Tangerine peel 0.74 0.592 63.1 0.28 Zhou et al. (2011)Rhododendron 1.61 0.585 60.9 0.57 Zhou et al. (2011)Fructus lycii 0.53 0.689 46.6 0.17 Zhou et al. (2011)Marigold 0.51 0.542 83.1 0.23 Zhou et al. (2011)Perilla 1.36 0.522 69.2 0.50 Zhou et al. (2011)Herba artemisiae scopariae 1.03 0.484 68.2 0.34 Zhou et al. (2011)China loropetal 0.84 0.518 62.6 0.27 Zhou et al. (2011)Yellow rose 0.74 0.609 57.1 0.26 Zhou et al. (2011)Flowery knotweed 0.60 0.554 62.7 0.21 Zhou et al. (2011)Bauhinia tree 0.96 0.572 66.0 0.36 Zhou et al. (2011)Petunia 0.85 0.616 60.5 0.32 Zhou et al. (2011)Lithospermum 0.14 0.337 58.5 0.03 Zhou et al. (2011)Violet 1.02 0.498 64.5 0.33 Zhou et al. (2011)Chinese rosa 0.90 0.483 61.9 0.27 Zhou et al. (2011)Mangosteen pericarp 2.69 0.686 63.3 1.17 Zhou et al. (2011)Lily 0.51 0.498 66.7 0.17 Zhou et al. (2011)Coffee 0.85 0.559 68.7 0.33 Zhou et al. (2011)Broadleaf holly leaf 1.19 0.607 65.4 0.47 Zhou et al. (2011)N-719 13.74 0.773 57.6 6.11 Zhou et al. (2011)Achiote seeds Bixin 1.1 0.57 59 0.37 Gomez-Ortiz et al. (2010)
Norbixin 0.38 0.53 64 0.13 Gomez-Ortiz et al. (2010)Gardenia fruit Crocetin 2.84 0.43 46 0.56 Yamazaki et al. (2007)
Crocin 0.45 0.58 60 0.16 Yamazaki et al. (2007)Pomegranate Chlorophyll II 2.05 0.560 52 0.597 Chang et al. (2010)Pomegranate+mulberry 2.8 0.53 49 0.722 Chang et al. (2010)Red cabbage 0.68 0.52 70 0.50 Furukawa et al. (2009)Curcumin 0.53 0.53 72 0.41 Furukawa et al. (2009)Red cabbage+curcumin 0.81 0.53 69 0.60 Furukawa et al. (2009)
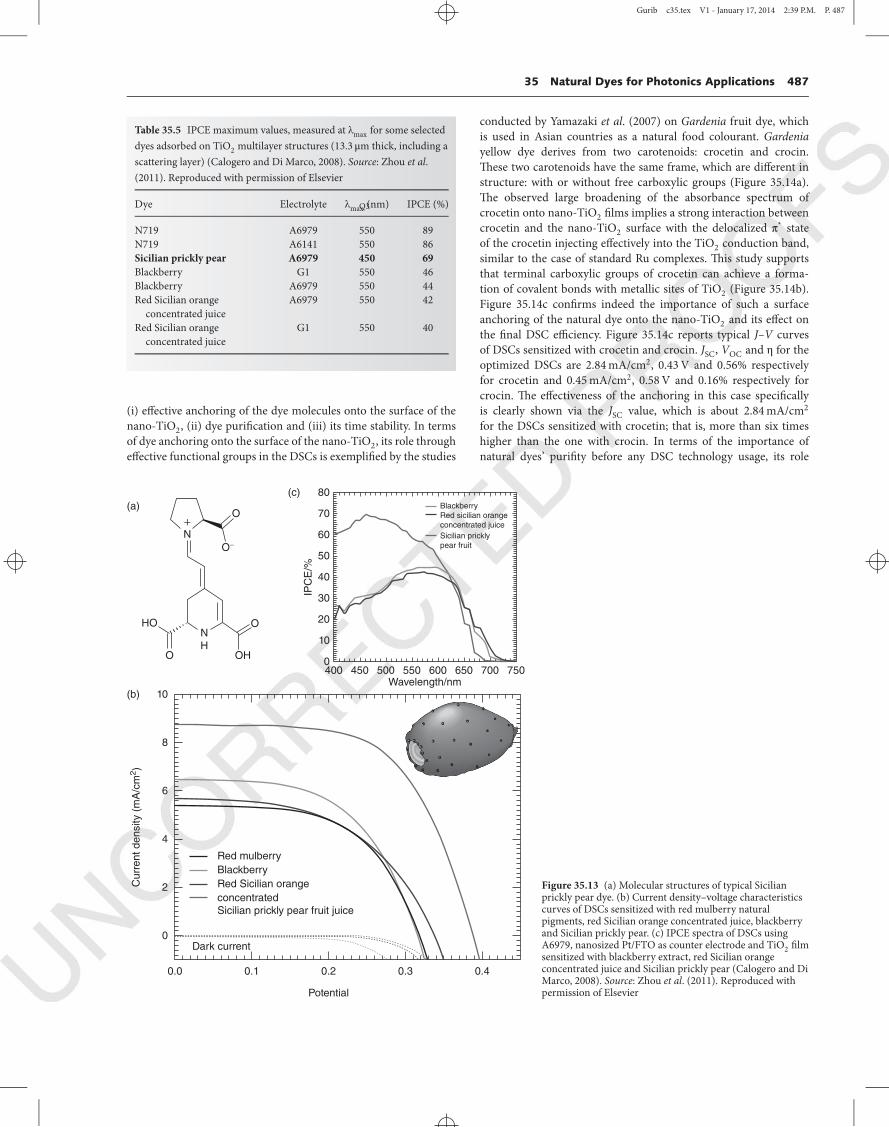
As indicated in Table 35.5 and reported in by Calogero et al.(2012), the most proven effective natural dye in DSC technology sofar is the prickly pear’s extract dye coating a meso-porous nano-TiO2of ∼13.3 μm in thickness. It has the highest IPCE of ∼69%, closeto the Ru synthetic dye complexes; the IPCE corresponds to thenumber of electrons, measured as photocurrent in the externalcircuit, divided by the monochromatic photon flux that strikes thecell. The corresponding J–V curve of the prickly pear dye-basedDSC is shown in Figure 35.13. The VOC and short-circuit current
density JSC values are the highest relative to other prominent naturaldyes: 0.389 V and 8.82 mA/cm2 respectively. Likewise, it was foundthat among the best additional selected natural dyes (mulberry,blackberry, Sicilian red orange juice), the IPCE spectra of the Sicil-ian prickly pear dye (from the blue region of the spectrum up to630 nm) clearly showed the highest value on the ordinate axis whencompared with the other dyes.
There are additional requirements upon the usage of natural dyesin DSC technology, among which one could mention the following:
Gurib c35.tex V1 - January 17, 2014 2:39 P.M. P. 487
35 Natural Dyes for Photonics Applications 487
Table 35.5 IPCE maximum values, measured at λmax for some selecteddyes adsorbed on TiO2 multilayer structures (13.3 μm thick, including ascattering layer) (Calogero and Di Marco, 2008). Source: Zhou et al.(2011). Reproduced with permission of Elsevier
Dye Electrolyte λmax (nm) IPCE (%)
N719 A6979 550 89N719 A6141 550 86Sicilian prickly pear A6979 450 69Blackberry G1 550 46Blackberry A6979 550 44Red Sicilian orange
concentrated juiceA6979 550 42
Red Sicilian orangeconcentrated juice
G1 550 40
(i) effective anchoring of the dye molecules onto the surface of thenano-TiO2, (ii) dye purification and (iii) its time stability. In termsof dye anchoring onto the surface of the nano-TiO2, its role througheffective functional groups in the DSCs is exemplified by the studies
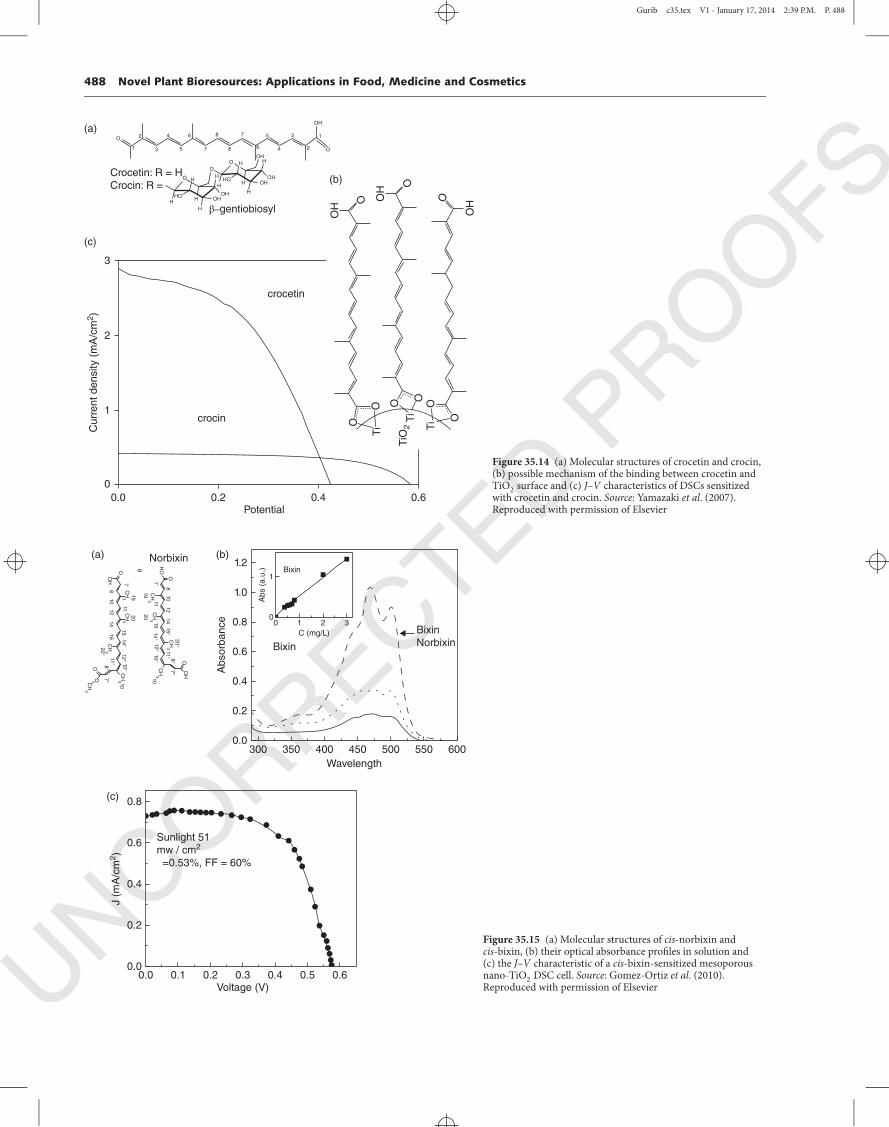
conducted by Yamazaki et al. (2007) on Gardenia fruit dye, whichis used in Asian countries as a natural food colourant. Gardeniayellow dye derives from two carotenoids: crocetin and crocin.These two carotenoids have the same frame, which are different instructure: with or without free carboxylic groups (Figure 35.14a).The observed large broadening of the absorbance spectrum ofcrocetin onto nano-TiO2 films implies a strong interaction betweencrocetin and the nano-TiO2 surface with the delocalized π* stateof the crocetin injecting effectively into the TiO2 conduction band,similar to the case of standard Ru complexes. This study supportsthat terminal carboxylic groups of crocetin can achieve a forma-tion of covalent bonds with metallic sites of TiO2 (Figure 35.14b).Figure 35.14c confirms indeed the importance of such a surfaceanchoring of the natural dye onto the nano-TiO2 and its effect onthe final DSC efficiency. Figure 35.14c reports typical J–V curves
Q3
of DSCs sensitized with crocetin and crocin. JSC, VOC and η for theoptimized DSCs are 2.84 mA/cm2, 0.43 V and 0.56% respectivelyfor crocetin and 0.45 mA/cm2, 0.58 V and 0.16% respectively forcrocin. The effectiveness of the anchoring in this case specificallyis clearly shown via the JSC value, which is about 2.84 mA/cm2
for the DSCs sensitized with crocetin; that is, more than six timeshigher than the one with crocin. In terms of the importance ofnatural dyes’ purifity before any DSC technology usage, its role
10(b)
80(c)BlackberryRed sicilian orange
concentrated juice
Sicilian prickly
pear fruit
70
60
50
40
IPC
E/%
30
20
10
0400 450 500 550
Wavelength/nm600 650 700 750
8
6
Curr
ent density (
mA
/cm
2)
4
Dark current
0.0 0.1 0.2
Potential
0.3 0.4
2
0
Blackberry
Red mulberry
Red Sicilian orange
concentrated
Sicilian prickly pear fruit juice
(a)
HO
OH
N
H
+N
O–
O
O
O
Figure 35.13 (a) Molecular structures of typical Sicilianprickly pear dye. (b) Current density–voltage characteristicscurves of DSCs sensitized with red mulberry naturalpigments, red Sicilian orange concentrated juice, blackberryand Sicilian prickly pear. (c) IPCE spectra of DSCs usingA6979, nanosized Pt/FTO as counter electrode and TiO2 filmsensitized with blackberry extract, red Sicilian orangeconcentrated juice and Sicilian prickly pear (Calogero and DiMarco, 2008). Source: Zhou et al. (2011). Reproduced withpermission of Elsevier
Gurib c35.tex V1 - January 17, 2014 2:39 P.M. P. 488
488 Novel Plant Bioresources: Applications in Food, Medicine and Cosmetics
(c)
(a)
(b)Crocetin: R = HCrocin: R =
β–gentiobiosyl
crocetin
crocin
Curr
ent density (
mA
/cm
2)
2
3
1
0
0.0 0.2 0.4
TiO
O O
OO
O
O
O
O OH
OH
OH
HHO
HOH
H
H
H
H
H H
H
H
O
1
12
23
34
45
56
6
7
7
8
8
OH
OHOH
OHOH
OH
O
O
O
O
Ti
Ti
TiO
2
Potential0.6
Figure 35.14 (a) Molecular structures of crocetin and crocin,(b) possible mechanism of the binding between crocetin andTiO2 surface and (c) J–V characteristics of DSCs sensitizedwith crocetin and crocin. Source: Yamazaki et al. (2007).Reproduced with permission of Elsevier
0.8(c)
Sunlight 51mw / cm2
=0.53%, FF = 60%
J (
mA
/cm
2)
0.6
0.4
0.2
0.00.0 0.1 0.2 0.3
Voltage (V)0.4 0.5 0.6
1.2
1.0
0.8
Bixin
Bixin
Norbixin
(b)
Bixin
Abs (
a.u
.)
00
1
1 2
C (mg/L)
3
Absorb
ance
Norbixin
O
O
O
O
O
HO
OH
8
7 7
19
19
20
20
7°
7°
8°
8°
11°
11°
15°
14
10
12
12
10
8
14
16
10
10
10°
10°
12°
12°20°
20°
14°
14°
15
15
11
11
CH
3
CH
3
CH
3
CH
3
CH
3C
H3
CH
3
CH
3
CH
3
B
(a)
0.6
0.4
0.2
0.0300 350 400 450
Wavelength
500 550 600
OH
Figure 35.15 (a) Molecular structures of cis-norbixin andcis-bixin, (b) their optical absorbance profiles in solution and(c) the J–V characteristic of a cis-bixin-sensitized mesoporousnano-TiO2 DSC cell. Source: Gomez-Ortiz et al. (2010).Reproduced with permission of Elsevier
Gurib c35.tex V1 - January 17, 2014 2:39 P.M. P. 489
35 Natural Dyes for Photonics Applications 489
HO
1,5 20
16
12
IPC
E / %
8
4
0
1,0
Absorb
ance
0,5
40
30
20
I sc (
mA
)V
oc /V
10
0,6
0,4
0,2
0 2 4 6
Time (weeks)
8 10 12 14
400 450 500 550Wavelength (nm)
600 650 700
(a)
(b)
(c)
R4
R3
R2
R1
OH
O+
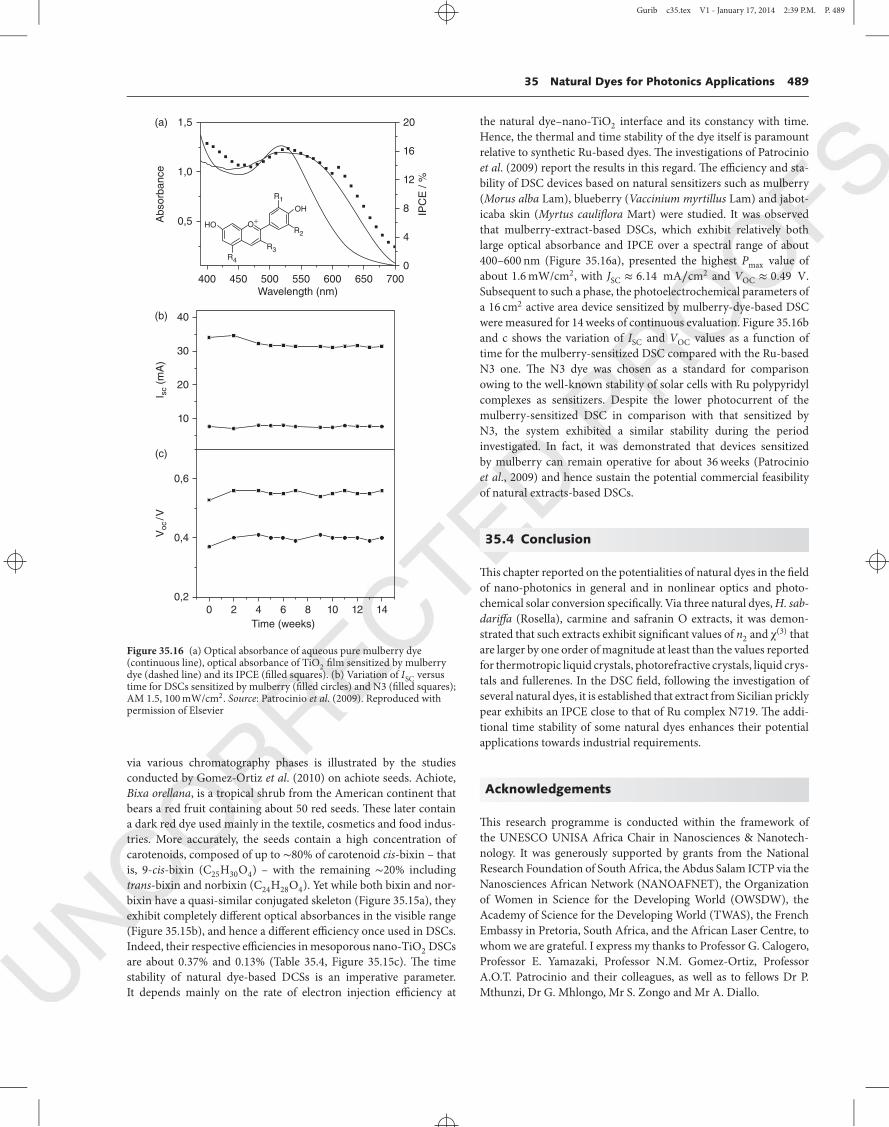
Figure 35.16 (a) Optical absorbance of aqueous pure mulberry dye(continuous line), optical absorbance of TiO2 film sensitized by mulberrydye (dashed line) and its IPCE (filled squares). (b) Variation of ISC versustime for DSCs sensitized by mulberry (filled circles) and N3 (filled squares);AM 1.5, 100 mW/cm2. Source: Patrocinio et al. (2009). Reproduced withpermission of Elsevier
via various chromatography phases is illustrated by the studiesconducted by Gomez-Ortiz et al. (2010) on achiote seeds. Achiote,Bixa orellana, is a tropical shrub from the American continent thatbears a red fruit containing about 50 red seeds. These later containa dark red dye used mainly in the textile, cosmetics and food indus-tries. More accurately, the seeds contain a high concentration ofcarotenoids, composed of up to ∼80% of carotenoid cis-bixin – thatis, 9-cis-bixin (C25H30O4) – with the remaining ∼20% includingtrans-bixin and norbixin (C24H28O4). Yet while both bixin and nor-bixin have a quasi-similar conjugated skeleton (Figure 35.15a), theyexhibit completely different optical absorbances in the visible range(Figure 35.15b), and hence a different efficiency once used in DSCs.Indeed, their respective efficiencies in mesoporous nano-TiO2 DSCsare about 0.37% and 0.13% (Table 35.4, Figure 35.15c). The timestability of natural dye-based DCSs is an imperative parameter.It depends mainly on the rate of electron injection efficiency at
the natural dye–nano-TiO2 interface and its constancy with time.Hence, the thermal and time stability of the dye itself is paramountrelative to synthetic Ru-based dyes. The investigations of Patrocinioet al. (2009) report the results in this regard. The efficiency and sta-bility of DSC devices based on natural sensitizers such as mulberry(Morus alba Lam), blueberry (Vaccinium myrtillus Lam) and jabot-icaba skin (Myrtus cauliflora Mart) were studied. It was observedthat mulberry-extract-based DSCs, which exhibit relatively bothlarge optical absorbance and IPCE over a spectral range of about400–600 nm (Figure 35.16a), presented the highest Pmax value ofabout 1.6 mW/cm2, with JSC ≈ 6.14 mA∕cm2 and VOC ≈ 0.49 V.Subsequent to such a phase, the photoelectrochemical parameters ofa 16 cm2 active area device sensitized by mulberry-dye-based DSCwere measured for 14 weeks of continuous evaluation. Figure 35.16band c shows the variation of ISC and VOC values as a function oftime for the mulberry-sensitized DSC compared with the Ru-basedN3 one. The N3 dye was chosen as a standard for comparisonowing to the well-known stability of solar cells with Ru polypyridylcomplexes as sensitizers. Despite the lower photocurrent of themulberry-sensitized DSC in comparison with that sensitized byN3, the system exhibited a similar stability during the periodinvestigated. In fact, it was demonstrated that devices sensitizedby mulberry can remain operative for about 36 weeks (Patrocinioet al., 2009) and hence sustain the potential commercial feasibilityof natural extracts-based DSCs.
35.4 Conclusion
This chapter reported on the potentialities of natural dyes in the fieldof nano-photonics in general and in nonlinear optics and photo-chemical solar conversion specifically. Via three natural dyes, H. sab-dariffa (Rosella), carmine and safranin O extracts, it was demon-strated that such extracts exhibit significant values of n2 and χ(3) thatare larger by one order of magnitude at least than the values reportedfor thermotropic liquid crystals, photorefractive crystals, liquid crys-tals and fullerenes. In the DSC field, following the investigation ofseveral natural dyes, it is established that extract from Sicilian pricklypear exhibits an IPCE close to that of Ru complex N719. The addi-tional time stability of some natural dyes enhances their potentialapplications towards industrial requirements.
Acknowledgements
This research programme is conducted within the framework ofthe UNESCO UNISA Africa Chair in Nanosciences & Nanotech-nology. It was generously supported by grants from the NationalResearch Foundation of South Africa, the Abdus Salam ICTP via theNanosciences African Network (NANOAFNET), the Organizationof Women in Science for the Developing World (OWSDW), theAcademy of Science for the Developing World (TWAS), the FrenchEmbassy in Pretoria, South Africa, and the African Laser Centre, towhom we are grateful. I express my thanks to Professor G. Calogero,Professor E. Yamazaki, Professor N.M. Gomez-Ortiz, ProfessorA.O.T. Patrocinio and their colleagues, as well as to fellows Dr P.Mthunzi, Dr G. Mhlongo, Mr S. Zongo and Mr A. Diallo.
Gurib c35.tex V1 - January 17, 2014 2:39 P.M. P. 490
490 Novel Plant Bioresources: Applications in Food, Medicine and Cosmetics
References
Alarcon-Aguilar, F.J. Zamilpa, A., Perez-Garcia, D. et al. (2007)J. Ethnopharmacol., 114, 66–71.
Altobello, S., Argazzi, R., Caramori, S. et al. (2005) J. Am. Chem. Soc.,127, 15342.
Argazzi, R., Larramona, G., Contado, C., and Bignozzi, C.A. (2004)J. Photochem. Photobiol. A: Chem., 164, 15.
Azeredo, H.M.C. (2009) Int. J. Food Sci. Technol., 44, 2365.Balaji, G., Rekha, R.K. and Ramalingam, A. (2011) Acta Polon. A,
119 (3), 359.Bessho, T., Yeh, C.Y., Diau, E.W.G. et al. (2010) Angew. Chem. Int.
Edit., 49, 6646.Calogero, G. and Di Marco, G. (2008) Sol. Energy Mater. Sol. Cells,
92, 1341.Calogero, G., Di Marco, G., Caramori, S. et al. (2009) Energy Environ.
Sci., 2, 1162.Calogero, G., Di Marco, G., Cazzanti, S. et al. (2010) Int. J. Mol. Sci.,
11, 254.Calogero, G., Yum, J.–H., Sinopoli, A. et al. (2012) Sol. Energy, 86,
1563–1575.Campbell, W.M., Jolley, K.W., Wagner, P. et al. (2007) J. Phys. Chem.
C, 111, 11760.Chang, H. and Lo, Y.-J. (2010) Sol. Energy, 84, 1833–1837.Chang, H., Wu, H.M., Chen, T.L. et al. (2010) J. Alloys Compd., 495,
606.Cherepy, N.J., Gratzel, M. and Zhang, J.Z. (1997) J. Phys. Chem. B,
101, 9342.Cisse, M. Vaillant, F. and Dornier, M. (2009) J. Agric. Food Chem.,
57 (14), 6285–6291.Cisse, M., Vaillant, F., Soro, D. et al. (2011) J. Food Eng., 106, 20–27.Diallo, A. Zongo, S., Mthunzi, P. et al. (2013) Optics Commun., sub-
mitted.Duarte, F.J. and Hillman, L.W. (eds) (1990) Dye Laser Principles, Aca-
demic Press, New York, NY.Frank, T. (2005) J. Clin. Pharmacol., 45, 203.Furukawa, S., Iino, H., Iwamoto, T. et al. (2009) Thin Solid Films, 518,
526–529.Gömeze, S.L., Cuppo, F.L.S. and Figueiredo Neto, A.M. (2003) Braz.
J. Phys., 33, 813.Gomez-Ortiz, N.M., Vasquez-Maldonado, I.A., Perez-Espadas, A.R.
et al. (2010) Sol. Energy Mater. Sol. Cells, 94, 40–44.Grätzel, M. (2003) J. Photochem. Photobiol. C: Photochem. Rev., 4,
145–153.Hao, S., Wu, J, Huang, Y. and Lin, J. (2006) Sol. Energy, 80, 209–214.He, K.X., Abdeldayem, H., Venkateswaralu, P. and George, M.C.
(1991) Opt. Commun., 81, 101.Henari, F.Z. and Al-Saie, A. (2006) Nonlinear Quant. Opt. Laser
Phys., 16 (12), 1664–1667.Herrera-Arellano, A., Flores-Romero, S. and Tortoriello, J. (2004)
Phytomedicine, 11, 375–38.Ito, S., Miura, H., Uchida, S. et al. (2008) Chem. Commun., 5194.Kay, A. and Grätzel, M. (1993) J. Phys. Chem., 97, 6272.Kouissa, B., Bouchouit, K., Abed, S. et al. (2013) Opt. Commun., 293,
75–79.Kuciauskas, D., Freund, M.S., Gray, H.B. et al. (2001) J. Phys. Chem.
B, 105, 392.
Kumara, G.R.A., Kaneko, S., Okuya, M. et al. (2006) Sol. EnergyMater. Sol. Cells, 90, 1220.
Li, Z., Jin, Z.–H., Kasatani, K. et al. (2005) Jpn. J. Appl. Phys., 44,4956–4961.
Mathews, S.J., Chaitanya Kumar, S., Giribabu, L. and Venugopal Rao,S. (2007) Mater. Lett., 61, 4426–4431.
Mortensen, A. (2006) Pure Appl. Chem., 78 (8), 1477–1491.Nazeeruddin, M.K., Pechy, P., Liska, P. et al. (2001) J. Am. Chem. Soc.,
123, 1613.Nazeeruddin, M.K., De Angelis, F., Fantacci, S. et al. (2005) J. Am.
Chem. Soc., 127, 16835.O’Regan, B. and Grätzel, M., (1991) Nature, 353, 737.Patrocinio, A.O.T., Mizoguchi, S.K., Paterno, L.G. et al. (2009) Synth.
Met., 159, 2342–2344.Polo, A.S., Itokazu, M.K. and Murakami Iha, N.Y. (2004) Coord.
Chem. Rev., 248, 1343.Polo, A.S. and Murakami Iha, N.Y. (2006) Sol. Energy Mater. Sol.
Cells, 90, 1936.Prasad, P.N. and Williams, D.J. (1991) Introduction to Nonlinear
Optical Effects in Molecules and Polymers, John Wiley & Sons,Inc., New York, NY.
Quin, C. and Clark, A.E. (2007) Chem. Phys. Lett., 438, 26.Rashidian, M., Dorranian, D., Ahmadi Darani, S. et al. (2009) Optik,
120, 1000–1006.Ravindra, H.J., Johkiran, A., Chandrasekaran, K. et al. (2007) Appl.
Phys. B. Lasers Opt., 88, 105–110.Rekha, R.K. and Ramalingam, A. (2009) Indian J. Sci. Technol., 2 (8),
27–31.Samoc, M. Samoc, A. and Grote, J.G. (2006) Chem. Phys. Lett., 431,
132–134.Schäfer, F.P. (ed.) (1990) Dye Lasers, 3rd edn, Springer-Verlag,
Berlin.Sekkat, Z. and Dumont, M. (1992) Appl. Phys. B, 45, 486–489.Sharma, S., Mohan, D. and Ghoshal, S.K. (2011) Opt. Commun., 281,
2923–2928.Sheik-Bahae, M., Said, A.A. and Van Stryland, E.W. (1989) Opt. Lett.,
14, 955–957.Sheik-Bahae, M., Said, A.A., Wei, T. et al. (1990) IEEE J. Quant. Elect.,
26, 760–769.Smestad, G.P. (1998) Sol. Energy Mater. Sol. Cells, 55, 157.Smestad, G., Bignozzi, C.A. and Argazzi, R. (1994) Sol. Energy Mater.
Sol. Cells, 32, 259.Stintzing, F.C. and Carle, R. (2007) Trends Food Sci. Technol., 18, 514.Takeoka, G. and Dao, L. (2002) Anthocyanins, in Methods of Analy-
sis for Functional Foods and Nutraceuticals (ed. W.J. Hurst), CRCPress, Boca Raton, FL, pp. 219–241.
Thankappan, A., Thomas, S. and Nampoori, V.P.N. (2012) J. Appl.Phys., 112, 123104.
Timberlake, C.F. and Bridle, P. (1975) The anthocyanins, in TheFlavonoids (eds J.B. Harborne, T.J. Mabry and H. Mabry),Chapman and Hall, London, pp. 214–266.
Timberlake, C.F. and Henry, B.S. (1988) Prog. Clin. Biol. Res., 280,107–121.
Tsigaridas, G., Fakis, M., Polyzos, I. et al. (2003) Appl. Phys. B LasersOpt., 76, 83–86.
Uma Maheswari, R., Kadono, H. and Jaaskelainen, T. (1994) Opt.Laser Technol., 26 (2), 136.

Gurib c35.tex V1 - January 17, 2014 2:39 P.M. P. 491
35 Natural Dyes for Photonics Applications 491
Yamazaki, E., Murayama, M., Nishikawa, N. et al. (2007) Sol. Energy,81, 512–516.
Yella, A., Lee, H.-W., Tsao, H.N. et al. (2011) Science, 334, 629.Yum, J.H., Walter, P., Huber, S. et al. (2007) J. Am. Chem. Soc., 129,
10320.Zakeeruddin, S.M., Comte, P., Charvet, R. et al. (2003) J. Phys. Chem.
B, 107, 14336.
Zhang, D., Lanier, S.M., Downing, J.A. et al. (2008) J. Photochem.Photobiol. A: Chem., 195, 72.
Zhang, H.J., Dai, J.H., Wang, P.Y. and Wu, L.A. (1989) Opt. Lett., 14,695.
Zhou, H., Wu, L., Gao, Y. and Ma, T. (2011) J. Photochem. Photobiol.A: Chem., 219, 188–194.

Gurib c35.tex V1 - January 17, 2014 2:39 P.M. P. 492

Gurib c35.tex V1 - January 17, 2014 2:39 P.M.
Queries in Chapter 35Q1. AQ. See ref list queryQ2. AQ. I to J OK (as in figure)? And similarly below in I cases
where J units are used and J plotted?Q3. To avoid placing after H1 heading, we have placed Figures
35.15 and Figure 35.16 before the citation. Please confirm ifthis is fine with you.


