Embed Size (px)
Citation preview

This article was downloaded by: [University of Houston]On: 09 February 2015, At: 08:05Publisher: Taylor & FrancisInforma Ltd Registered in England and Wales Registered Number: 1072954 Registered office: Mortimer House,37-41 Mortimer Street, London W1T 3JH, UK
Click for updates
International Geology ReviewPublication details, including instructions for authors and subscription information:http://www.tandfonline.com/loi/tigr20
Natural gas potential of Neoproterozoic and lowerPalaeozoic marine shales in the Upper YangtzePlatform, South China: geological and organicgeochemical characterizationJingqiang Tana, Brian Horsfielda, Nicolaj Mahlstedta, Jinchuan Zhangb, Christopher J.Borehamc, Dorothee Hipplerd, Ger van Graase & Bruce Alastair Tochere
a Section of Organic Geochemistry, GFZ- German Research Centre for Geosciences,Potsdam, Germanyb School of Energy Resources, China University of Geosciences (Beijing), Beijing, Chinac Geoscience Australia, Canberra, Australiad Institute of Applied Geosciences, Technical University of Berlin, Berlin, Germanye Statoil, Oslo, NorwayPublished online: 09 Feb 2015.
To cite this article: Jingqiang Tan, Brian Horsfield, Nicolaj Mahlstedt, Jinchuan Zhang, Christopher J. Boreham, DorotheeHippler, Ger van Graas & Bruce Alastair Tocher (2015): Natural gas potential of Neoproterozoic and lower Palaeozoic marineshales in the Upper Yangtze Platform, South China: geological and organic geochemical characterization, InternationalGeology Review, DOI: 10.1080/00206814.2015.1004200
To link to this article: http://dx.doi.org/10.1080/00206814.2015.1004200
PLEASE SCROLL DOWN FOR ARTICLE
Taylor & Francis makes every effort to ensure the accuracy of all the information (the “Content”) containedin the publications on our platform. However, Taylor & Francis, our agents, and our licensors make norepresentations or warranties whatsoever as to the accuracy, completeness, or suitability for any purpose of theContent. Any opinions and views expressed in this publication are the opinions and views of the authors, andare not the views of or endorsed by Taylor & Francis. The accuracy of the Content should not be relied upon andshould be independently verified with primary sources of information. Taylor and Francis shall not be liable forany losses, actions, claims, proceedings, demands, costs, expenses, damages, and other liabilities whatsoeveror howsoever caused arising directly or indirectly in connection with, in relation to or arising out of the use ofthe Content.
This article may be used for research, teaching, and private study purposes. Any substantial or systematicreproduction, redistribution, reselling, loan, sub-licensing, systematic supply, or distribution in anyform to anyone is expressly forbidden. Terms & Conditions of access and use can be found at http://www.tandfonline.com/page/terms-and-conditions

Natural gas potential of Neoproterozoic and lower Palaeozoic marine shales in the UpperYangtze Platform, South China: geological and organic geochemical characterization
Jingqiang Tana*, Brian Horsfielda, Nicolaj Mahlstedta, Jinchuan Zhangb, Christopher J. Borehamc, Dorothee Hipplerd,Ger van Graase and Bruce Alastair Tochere
aSection of Organic Geochemistry, GFZ- German Research Centre for Geosciences, Potsdam, Germany; bSchool of Energy Resources,China University of Geosciences (Beijing), Beijing, China; cGeoscience Australia, Canberra, Australia; dInstitute of Applied
Geosciences, Technical University of Berlin, Berlin, Germany; eStatoil, Oslo, Norway
(Received 16 August 2014; accepted 31 December 2014)
In this article, we describe the geological features of the Ediacaran (upper Sinian), lower Cambrian and lower Silurian shaleintervals in the Upper Yangtze Platform, South China, and report on the gas potential of 53 samples from these majormarine shale formations. Reflected light microscopy, total organic carbon (TOC) measurement, Rock-Eval, carbon isotoperatio analysis, thermovaporization gas chromatography (Tvap-GC), and open pyrolysis gas chromatography (open py-GC)were used to characterize the organic matter. Measured TOC in this research is normally >2% and averages 5%. TOCcontents are roughly positively correlated with increasing geological age, i.e. lower Silurian shales exhibit generally lowerTOC contents than lower Cambrian shales, which in turn commonly have lower TOC contents than Ediacaran shales.Kerogen has evolved to the metagenesis stage, which was demonstrated by the abundant pyrobitumen on microphotographs,the high calculated vitrinite reflectance (Ro = 3%) via bitumen reflectance (Rb), as well as δ
13 C of gas (methane) inclusions.Pyrolysates from Tvap-GC and open py-GC are quantitatively low and only light hydrocarbons were detected. The lowerSilurian shale generally exhibits higher generation of hydrocarbon than the lower Cambrian and Ediacaran shale. Cooles’method and Claypool’s equations were used to reconstruct the original TOC and Rock-Eval parameters of these overmaturesamples. Excellent original hydrocarbon generation was revealed in that the original TOC (TOCo) is between 5% and 23%,and original S1+S2 (S1o+S2o) is ranging from 29 to 215 mg HC/g rock.
Keywords: shale gas; unconventional resource; organic geochemistry; hydrocarbon potential; marine shale; upper YangtzePlatform; South China
1. Introduction
The remarkable success of shale gas exploitation in theUSA has led to shale systems becoming increasinglyimportant exploration targets worldwide. In China, differ-ent black shale formations ranging from Precambrian toCenozoic in age are known (Figure 1A–C). Technically,recoverable shale gas reserves are estimated to range from10 to 45 × 1012 m3 (Zhang et al. 2009; Dong et al. 2010;Liu et al. 2010; EIA 2011, 2013; Zou et al. 2011).Exploration activities are already underway in southern(Sichuan Basin, Yangtze Platform) and northern (e.g.Ordos Basin, Songliao Basin) parts of the country.
The Upper Yangtze Platform (UYP), where the SichuanBasin is located, is one of the largest conventional naturalgas provinces of China, accounting for 22–43% of theannually produced gas over the last 20 years (NationalBureau of Statistics and Energy Bureau 1991-2010). Therecoverable reserves of conventional gas have been esti-mated at around 1.7 × 10¹² m3, with annual yields exceed-ing 23 × 109 m3 in the year 2010 (Ma et al. 2010). Inaddition to conventional petroleum, the lower Silurian andlower Cambrian shale formations have been regarded as
two prolific unconventional shale gas reservoirs with reco-verable reserves around 19.6 × 10¹² m3 (EIA 2011).Although only two formations were reported in that evalua-tion and shale gas reserves outside the Sichuan Basin werenot considered, reported unconventional reserves are sig-nificantly higher than the total reserves of conventionalpetroleum (Ma et al. 2010; EIA 2011). Moreover, theEdiacaran and upper Permian marine shale, the UpperTriassic transitional shale (from marine to lacustrineenvironment) and the Lower Jurassic lacustrine shale alllocally possess shale gas potential in the UYP (Zouet al. 2010; Chen 2011; Guo et al. 2011; He andZhu 2012; EIA 2013; Li et al. 2013; Wang andWang 2013; Wu et al. 2013; Wang et al. 2013b; Zhenget al. 2013b; Chen et al. 2014; Liu et al. 2014).
Studies on shale gas plays in the USA have shown thatthe type, abundance, and maturity of organic matter, aswell as the grain size and mineralogy, determine thesource, reservoir, and seal rock properties of gas shales(Schoell 1980; Martini et al. 1998; Curtis 2002;Bowker 2007; Wang and Carr 2013). Prolific shale playsare normally recognized by certain minimal technical
*Corresponding author. Email: [email protected]
International Geology Review, 2015http://dx.doi.org/10.1080/00206814.2015.1004200
© 2015 Taylor & Francis
Dow
nloa
ded
by [
Uni
vers
ity o
f H
oust
on]
at 0
8:05
09
Febr
uary
201
5

thresholds, which should be fulfilled. These include butare not limited to shale thickness, organic matter richness,maturity, mineralogy, porosity, permeability, pore pressure,and gas-in-place (Curtis 2002; Bowker 2007; Jarvieet al. 2007; Strąpoć et al. 2010; Miceli Romero andPhilp 2012). Zhao et al. (2007) stated that shale thickness,depth, total organic carbon (TOC), and thermal maturityare the most important geological factors for commercialgas production. The minimum net thickness for a shale gasplay to be successfully developed amounts to approxi-mately 10 m, for example for the Fayetteville, Antrim,and Ohio shales, while the depth can be lower than 200 min the case of the Antrim shale, containing biogenic gas, orup to 5 km in the case of the Haynesville shale(Bowker 2007; Hammes et al. 2011). Meanwhile, explora-tion targets are usually thick, widespread, gas-saturated,fine-grained, organic-rich units with (1) significant Type IIorganic matter in a thermally overmature state, (2) richorganic matter of any type that is thermally immature andsubject to extensive biogenic decomposition, and/or (3)significant Type III organic matter in thermally mature toovermature states (Martini et al. 2003; Hamblin 2006).
Some of these general principles have already beenapplied to Chinese gas shales. In the UYP, the Ediacaran,lower Cambrian, and lower Silurian black shale formationsdeposited in marine environments are widespread.
Generally speaking, these black shales are thick succes-sions (from 10 m to >100 m), have TOC content >2% andhigh quartz content, and are variable but usually have highlevels of thermal maturity. Burial depths of these forma-tions can be shallow, such as at outcrop in the marginalregions of the Sichuan Basin and in the southeast UYP, ordeep, reaching >5 km in some depressions (Chenget al. 2009; Zhang et al. 2009, 2013; Wang et al. 2009b;Zou et al. 2010, 2011; Nie et al. 2011; Huang et al. 2012;Song et al. 2013; Tan et al. 2013, 2014a, 2014b; Zhenget al. 2013a; Fan et al. 2014; Guo and Zhang 2014; Luoet al. 2014; Zhou et al. 2014). In a strict sense, however,issues remain on the composition of organic matter, thermalevolution and maturity, and thus the original hydrocarbonpotential and hydrocarbon generation properties have notbeen clearly clarified.
Because of the importance of these marine shale for-mations, we have undertaken a series of investigations ontheir petroleum physical properties, mineralogy, lithofa-cies, petrophysics, rock mechanics, and methane sorptioncapacity using core and outcrop studies, and the resultshave been summarized and published in Marine andPetroleum Geology (Tan et al. 2013), Energy & Fuels(Tan et al. 2014a), and Fuel (Tan et al. 2014b). In orderto explore their natural gas potential more systematicallyand comprehensively, the objectives of this article are to
Figure 1. Black shale distribution map (A–C), modified after Zhang et al. (2009); Zou et al. (2010), and China tectonic framework andlocations of the Upper Yangtze platform (UYP) and the Sichuan Basin (D), modified after Zhang et al. (2011).
TR-P, Tarim Platform; YZ-P, Yangtze Platform; NC-P, North China Platform; JG-F, Junggar fold system; TS-F, Tianshan fold system;EK-F, East Kunlun fold system; QI-F, Qilian fold system; SG-F, Songpan-Ganzi fold system; GN-F, Gangdise-Nyainqentanglha foldsystem; SJ-F, Sanjiang fold system; HY-F, Himalayan fold system; MD-F, Mongolia-Daxinganlin fold system; JH-F, Ji-He fold system;ND-F, Nadanhada fold system; QL-F, Qinling fold system; SC-F, South China fold system; SE-F, Southeast China fold system; UpperYP, Upper Yangtze Platform; Middle YP, Middle Yangtze Platform; Lower YP, Lower Yangtze Platform.
2 J. Tan et al.
Dow
nloa
ded
by [
Uni
vers
ity o
f H
oust
on]
at 0
8:05
09
Febr
uary
201
5

(1) describe the depositional and evolutional history of theUYP and the present geological features of these marineshale formations, and (2) investigate their organic geo-chemical properties, for example organic richness, thermalmaturity, kerogen type, as well as their present and origi-nal hydrocarbon potential.
The construction of organic geochemical properties forthe shale intervals under study is especially difficult becausethe organic matter is overmature (Ro �2.0%). Therefore, aseries of organic screening methods, for example, TOC,Rock-Eval, microcopies, carbon isotope ratio, thermovapor-ization gas chromatography (Tvap-GC), and open-systempyrolysis gas chromatography (open py-GC), were per-formed on representative samples from the central area ofthe UYP. In conjunction with an extensive data compilation,the organic geochemical properties are then revealed indetail. Finally, original organic abundance and hydrocarbongenerative potential were reconstructed via the mass bal-ance models developed by Cooles et al. (1986) and viaClaypool’s equations (Peters et al. 2005).
2. Geological characterization
2.1. Tectonic and sedimentary history
The present-day tectonic framework of China is a mosaiccomposed of three platforms and fifteen-fold systems, andthe UYP is located in the western zone of the YangtzePlatform (Zhang et al. 2011) (Figure 1D). In the lateProterozoic (early Sinian), the basement and boundaries ofthe Yangtze Craton were created in the course of theChengjiang tectonic movement (Editorial Committee ofthe Sichuan Oil & Gas field 1989; Guo 1996). The earliestsedimentary rocks within the UYP, consisting of blackshales and dolomites, were deposited during a major trans-gression in the Ediacaran (late Sinian). The Tongwan tec-tonic movement at the end of the Proterozoic caused adisconformity between the Ediacaran and lower Cambrianstrata (Ma et al. 2007). The second major marine transgres-sion occurred in the early Cambrian. Sedimentary succes-sions, consisting of shale, siltstone, limestone, anddolomite, were laterally deposited extensively in open torestricted marine environments. Between the middleCambrian and Ordovician, depositional environments weregenerally maintained and geographically similar in ancientcontinent/islands that were located in the west, while thelittoral, restricted, and open marine platform and deep mar-ine shelf were developed southeastwards. Carbonates weretherefore deposited in most of the regions, in addition to thedeposition of minor amounts of clastic material occurringalong the western margin. During the early Silurian, thethird major transgression occurred southwestwards, result-ing in the widespread deposition of black shales that con-tributed significantly to the charging of oil and gas fields inthe eastern Sichuan Basin. However, the late Caledonian
orogeny impacted on the whole area at the end of theSilurian. Structural highs and lows in the central and south-ern UYP were markedly formed, which affected sourcerock sedimentation and preservation. As a result of thelate Caledonian orogeny and the subsequent Liujiang andYunnan orogeny, most of the regions in the UYP were incontinental environments during the Devonian andCarboniferous. Consequently, Devonian and Carboniferousterrestrial/continental sedimentary successions were con-fined locally to the east and south of the area, whereas thelower Palaeozoic strata underwent prolonged erosion. Thefourth major marine transgression commenced during theearly Permian and was interrupted only shortly by theDongwu uplift in middle Permian times. Open to restrictedmarine environments re-established again in late Permiantimes and persisted until the Middle Triassic. Coal-bearingshales and carbonates were periodically deposited and pro-vided important source and reservoir rocks (EditorialCommittee of the Sichuan Oil & Gas field 1989;Guo 1996; Ma et al. 2006; Hao et al. 2008; Wanget al. 2013a; Zheng et al. 2013a).
The Indosinian movement in the Middle–Late Triassic isa pivotal event to the tectonic and environmental evolution.The entire UYP was escalated during the course of the inten-sive compression between the South China Plate, the NorthChina Plate, and the Pacific Ocean Plate. As a result, marinesedimentation diminished while terrigenous sedimentationprevailed. A series of structural highs and lows were thencreated during the Yanshanian orogeny in the middle–lateMesozoic and the Himalayan orogeny in the Cenozoic, indi-cating that the tectonic and stratigraphic architectures of theUYP were almost formed. In the Sichuan Basin, thousands ofmetres of clastic strata were deposited, providing importantpetroleum source, reservoir and seal rocks, whereas theregions surrounding the basin in the UYP experiencedremarkable erosions (Editorial Committee of the SichuanOil & Gas field 1989; Korsch et al. 1991; Dai et al. 1992;Guo 1996; Ma et al. 2007, 2010; Hao et al. 2008).
2.2. Petroleum systems of the UYP
In the UYP, marine sediments are characterized by thickcarbonates and shale formations, and terrigenous sedimentsare characterized by fluvio-deltaic strata, coal measures, andlacustrine carbonates or shales (Editorial Committee of theSichuan Oil & Gas field 1989). As far as conventionalpetroleum is concerned, the regional source rocks are thelower Cambrian, lower Silurian, and Lower Jurassic mud-stones and shales, the lower Permian carbonates, and theupper Permian and Upper Triassic coal-bearing shales(Huang et al. 1997). Principal reservoirs comprise theChangxing (upper Permian) and Feixianguan (LowerTriassic) carbonates and the Xujiahe (Upper Triassic) andJurassic terrigenous clastics. They account for over 70% ofthe total conventional reserves in the Sichuan Basin (Dai
International Geology Review 3
Dow
nloa
ded
by [
Uni
vers
ity o
f H
oust
on]
at 0
8:05
09
Febr
uary
201
5

et al. 2009; Ma et al. 2010). Significant seal rocks includeanhydrite, halite, and gypsiferous dolomite, which devel-oped in a major marine regression during Early to MiddleTriassic times (Ma et al. 2006; Hao et al. 2008). The ear-liest thermogenic hydrocarbon generation period has beenreported to be during the Silurian, when Precambrian andlower Cambrian source rocks were buried almost 2 km,ostensibly leading to the formation of small petroleumaccumulations in the east and south Sichuan Basin(Huang et al. 1997). However, the major periods of hydro-carbon generation, migration, and accumulation are thoughtto have occurred between the Triassic and Cretaceous,when the most important source rocks were buried succes-sively to more than 2 km, and reservoir seals became
effective (Editorial Committee of the Sichuan Oil & Gasfield 1989; Dai et al. 1992; Guo 1996; Ma et al. 2010)(Figure 2).
More than a hundred conventional petroleum fields orstructures have been found in the UYP, but most of themare gas fields located in the Sichuan Basin. Within thisbasin, commercial-scale oil fields are confined to the cen-tral area. Gas fields are volumetrically more important andhave preponderance in the south, while most giant gasfields (reserves > 30 × 1012 m3) are situated in the eastof the basin (Editorial Committee of the Sichuan Oil &Gas field 1989; Zhu et al. 2006; Ma et al. 2010). Thebasin is therefore normally divided into four petroleumregions according to the prevalent petroleum type (oil or
Figure 2. Generalized stratigraphic column and petroleum system event chart in the Sichuan Basin, modified after Editorial Committeeof the Sichuan Oil & Gas field (1989).
Note: The lower Cambrian shale formation has several local names, usually Jiulaodong or Qiongzhusi in the Sichuan Basin and Niutitangin the Chongqing area and Guizhou province.
4 J. Tan et al.
Dow
nloa
ded
by [
Uni
vers
ity o
f H
oust
on]
at 0
8:05
09
Febr
uary
201
5
gas) and scale. They are the western gas field region,central oil-gas field region, eastern giant gas field region,and southern gas field region.
2.3. Black shale intervals under investigation
A total of eight major black shale formations can beidentified in the UYP. The Doushantuo Fm. (Ediacaran),Qiongzhusi/Niutitang Fm. (lower Cambrian), Wufeng Fm.(Ordovician), Longmaxi Fm. (lower Silurian), Luofu Fm.(Devonian), and Longtan Fm. (upper Permian) are themajor marine/transitional shale formations, whereas theXujiahe Fm. (Upper Triassic) and Ziliujin Fm. (LowerJurassic) are the principal lacustrine shale formations(Figure 2) (Editorial Committee of the Sichuan Oil &Gas field 1989; Liang et al. 2008; Dong et al. 2010; Zouet al. 2010). In this article, we primarily focus on thelower Silurian and lower Cambrian black shale intervals,
and to some extent on the Ediacaran black shale formationthat occurs in the upper part of Precambrian strata.
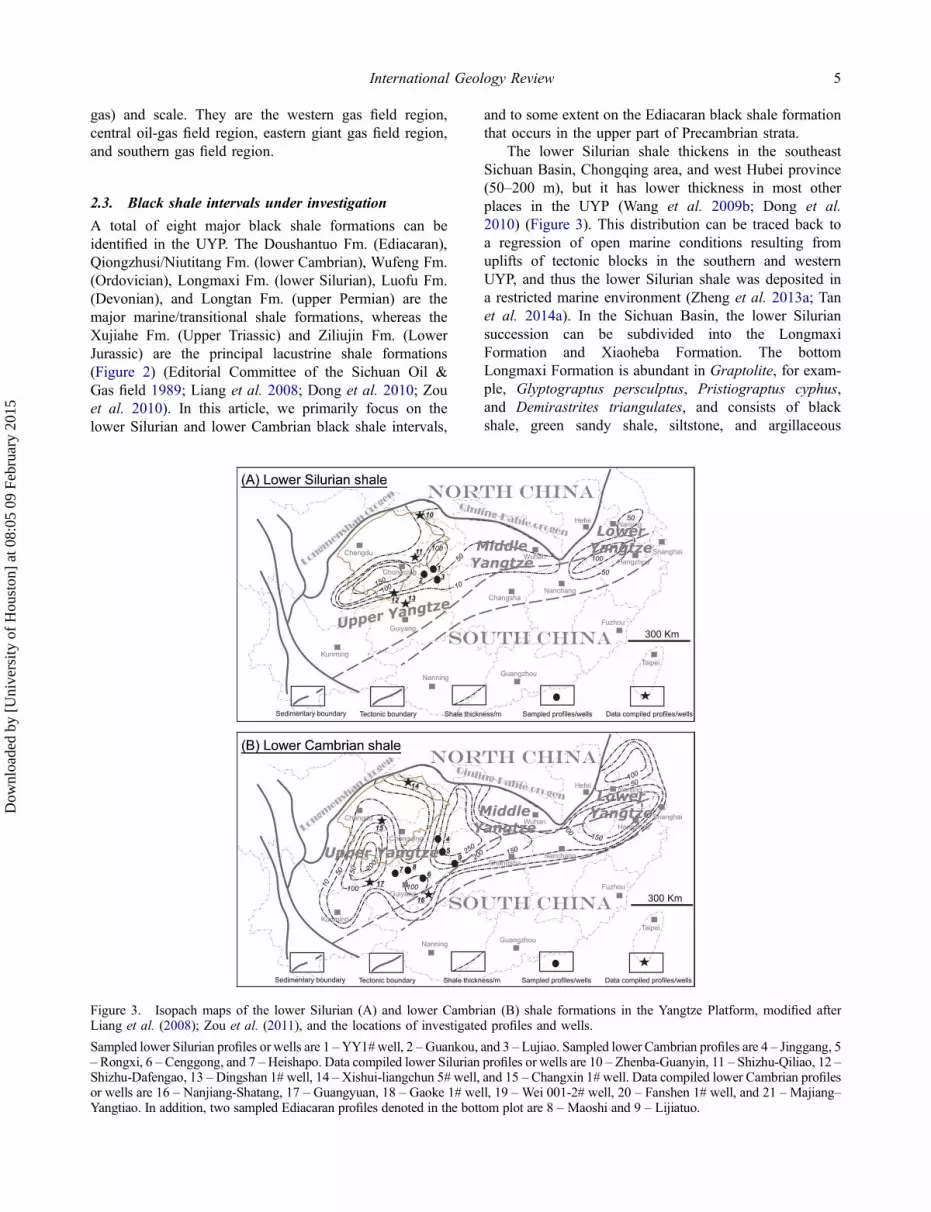
The lower Silurian shale thickens in the southeastSichuan Basin, Chongqing area, and west Hubei province(50–200 m), but it has lower thickness in most otherplaces in the UYP (Wang et al. 2009b; Dong et al.2010) (Figure 3). This distribution can be traced back toa regression of open marine conditions resulting fromuplifts of tectonic blocks in the southern and westernUYP, and thus the lower Silurian shale was deposited ina restricted marine environment (Zheng et al. 2013a; Tanet al. 2014a). In the Sichuan Basin, the lower Siluriansuccession can be subdivided into the LongmaxiFormation and Xiaoheba Formation. The bottomLongmaxi Formation is abundant in Graptolite, for exam-ple, Glyptograptus persculptus, Pristiograptus cyphus,and Demirastrites triangulates, and consists of blackshale, green sandy shale, siltstone, and argillaceous
Figure 3. Isopach maps of the lower Silurian (A) and lower Cambrian (B) shale formations in the Yangtze Platform, modified afterLiang et al. (2008); Zou et al. (2011), and the locations of investigated profiles and wells.
Sampled lower Silurian profiles or wells are 1 –YY1#well, 2 –Guankou, and 3 – Lujiao. Sampled lower Cambrian profiles are 4 – Jinggang, 5– Rongxi, 6 – Cenggong, and 7 –Heishapo. Data compiled lower Silurian profiles or wells are 10 – Zhenba-Guanyin, 11 – Shizhu-Qiliao, 12 –Shizhu-Dafengao, 13 –Dingshan 1# well, 14 –Xishui-liangchun 5# well, and 15 – Changxin 1# well. Data compiled lower Cambrian profilesor wells are 16 – Nanjiang-Shatang, 17 – Guangyuan, 18 – Gaoke 1# well, 19 – Wei 001-2# well, 20 – Fanshen 1# well, and 21 – Majiang–Yangtiao. In addition, two sampled Ediacaran profiles denoted in the bottom plot are 8 – Maoshi and 9 – Lijiatuo.
International Geology Review 5
Dow
nloa
ded
by [
Uni
vers
ity o
f H
oust
on]
at 0
8:05
09
Febr
uary
201
5

limestone (Chen et al. 2013; Qiu et al. 2013; Wanget al. 2014). The top Xiaoheba Formation contains fossilssuch as Graptolites, Trilobites, Brachiopods, etc., andcomprises grey-green siltstone, fine stone, shale, and bio-logical limestone lenses with distinct ripples and biologi-cal traces (Editorial Committee of the Sichuan Oil & Gasfield 1989). The thickness of the complete lower Siluriansuccession ranges between 100 and 500 m in the SichuanBasin, but exceeds 700 m in the southeast Sichuan andChongqing area. In the Longmaxi Formation, organicmatter contents decrease while siliceous minerals increasefrom the bottom upwards. It has been recognized as one ofthe principal contributors to large- and medium-sized gasfields, for example the Puguang and Hechuan giant gasfields (Editorial Committee of the Sichuan Oil & Gasfield 1989; Huang et al. 1997; Wang et al. 2009b; Maet al. 2010). In this investigation, the analysed lowerSilurian samples are dominantly siliceous shale/mudstoneand consist of eight outcrops (Sample ID 01–08, Table 1)collected from the Lujiao and Guankou profiles and sixcores (Sample ID 09–14) sampled from the YY1 shale gaswell (Figures 3 and 4) with depths ranging from the topdown at 136, 207, 267, 276, 285, and 321 m.
The lower Cambrian black shale usually exhibits grossthicknesses of 50–200 m in most of the regions in theYangtze Platform, but it is thinner in the central SichuanBasin and the western and southern marginal areas of theUYP (Figure 3). This feature can be related to the marinetransgression during the early Cambrian. In the UYP, thepresence of thick black shale packages indicate marineplatform to marine shelf depositional environments,whereas the presence of thin black shale packages indi-cates a littoral depositional environment (Donget al. 2010; Wang et al. 2013a; Luo et al. 2014). Thelower Cambrian interval disconformably overlays theuppermost Ediacaran carbonates (Figure 2), with the stra-tigraphic boundary consisting of phosphate-containingsiliceous dolomite, phosphorites, sandy dolomite, and cal-careous shale. Three subdivisions can be recognized onthe basis of lithology, biota, and texture. The bottomcomprises Protospongia containing black shale or carbo-naceous shale with pyrite, phosphate, and siderite nodules,and exhibits a distinct laminated bedding. The middle isgrey-black sandy or silty shale, accompanied by calcar-eous sandstone, fine sandstone and dolomite, and rich infossils, for example containing trilobites, sponge spicules,or brachiopods. The top consists of juxtaposed carbonate,siltstone, and shale, containing various trilobite species,such as Eoredlichia, Hebediscus, and Yunanocephalus(Editorial Committee of the Sichuan Oil & Gasfield 1989). Organic richness, strata colour, and laminationvary gradually from the bottom upwards (Chenget al. 2009; Wang et al. 2009b). Black shale occurs pri-marily in the middle or bottom intervals of the lowerCambrian formation. It is characterized by high gamma Ta
ble1.
Sam
pleinform
ation,
totalorganiccarbon
content,andRock-Evaldata.
Unit
Profile/area
OriginalID
IDDepth
(m)
TOC(%
)S1(m
g/g)
S2(m
g/g)
Tmax
(°C)
HI(m
gHC/g
TOC)
OI(m
gCO2/g
TOC)
Low
erSilu
rian–L
ongm
axi
Lujiao,
Cho
ngqing
G00
9507
13.34
0.02
0.28
439
814
G00
9508
23.76
0.05
0.43
598
1116
G00
9509
31.68
0.03
0.41
331
2465
G00
9510
41.84
0.02
0.31
336
1720
G00
9511
50.93
0.02
0.35
599
3869
Guank
ou,Cho
ngqing
G00
9512
63.89
0.02
0.33
601
814
G00
9513
74.00
0.04
0.48
600
128
G00
9514
83.64
0.02
0.33
599
923
YY1well,Cho
ngqing
G00
9524
913
61.96
0.04
0.37
409
1935
G00
9525
1020
71.47
0.05
0.42
405
2931
G00
9526
1126
72.31
0.04
0.43
600
1922
G00
9527
1227
61.69
0.02
0.33
400
2020
G00
9528
1328
51.68
0.02
0.26
409
1522
G00
9529
1432
12.21
0.03
0.34
313
1545
Low
erCam
brian–Niutitang
Ron
gxi,Cho
ngqing
G00
9515
150.44
0.02
0.38
291
8624
0G00
9516
1610
.20
0.02
0.37
593
419
G00
9517
176.02
0.02
0.33
365
58
(Con
tinued)
6 J. Tan et al.
Dow
nloa
ded
by [
Uni
vers
ity o
f H
oust
on]
at 0
8:05
09
Febr
uary
201
5
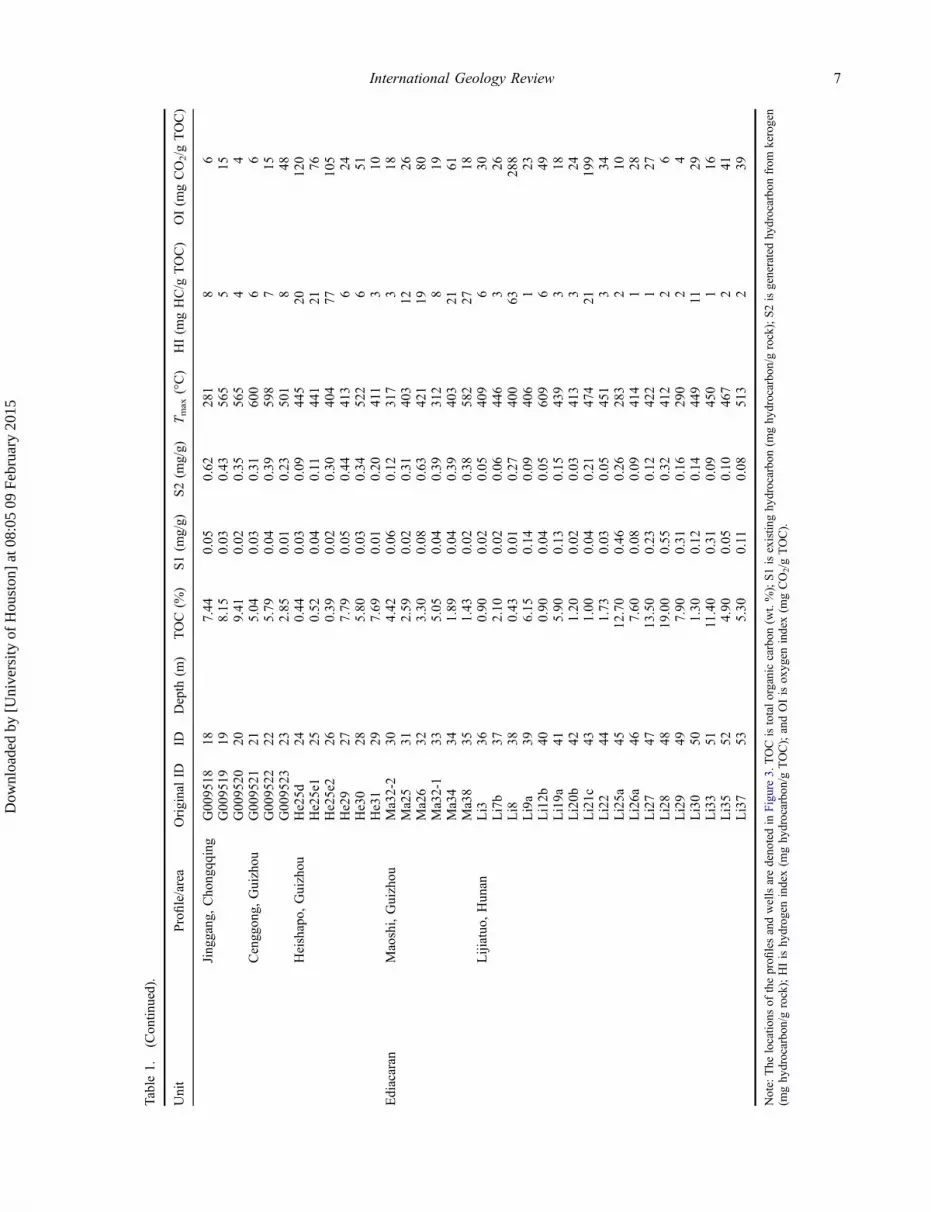
Table1.
(Con
tinued).
Unit
Profile/area
OriginalID
IDDepth
(m)
TOC(%
)S1(m
g/g)
S2(m
g/g)
Tmax
(°C)
HI(m
gHC/g
TOC)
OI(m
gCO2/g
TOC)
Jing
gang
,Cho
ngqq
ing
G00
9518
187.44
0.05
0.62
281
86
G00
9519
198.15
0.03
0.43
565
515
G00
9520
209.41
0.02
0.35
565
44
Cengg
ong,
Guizhou
G00
9521
215.04
0.03
0.31
600
66
G00
9522
225.79
0.04
0.39
598
715
G00
9523
232.85
0.01
0.23
501
848
Heishapo,
Guizhou
He25d
240.44
0.03
0.09
445
2012
0He25e1
250.52
0.04
0.11
441
2176
He25e2
260.39
0.02
0.30
404
7710
5He29
277.79
0.05
0.44
413
624
He30
285.80
0.03
0.34
522
651
He31
297.69
0.01
0.20
411
310
Ediacaran
Maoshi,Guizhou
Ma32-2
304.42
0.06
0.12
317
318
Ma25
312.59
0.02
0.31
403
1226
Ma26
323.30
0.08
0.63
421
1980
Ma32-1
335.05
0.04
0.39
312
819
Ma34
341.89
0.04
0.39
403
2161
Ma38
351.43
0.02
0.38
582
2718
Lijiatuo
,Hun
anLi3
360.90
0.02
0.05
409
630
Li7b
372.10
0.02
0.06
446
326
Li8
380.43
0.01
0.27
400
6328
8Li9a
396.15
0.14
0.09
406
123
Li12b
400.90
0.04
0.05
609
649
Li19a
415.90
0.13
0.15
439
318
Li20b
421.20
0.02
0.03
413
324
Li21c
431.00
0.04
0.21
474
2119
9Li22
441.73
0.03
0.05
451
334
Li25a
4512
.70
0.46
0.26
283
210
Li26a
467.60
0.08
0.09
414
128
Li27
4713
.50
0.23
0.12
422
127
Li28
4819
.00
0.55
0.32
412
26
Li29
497.90
0.31
0.16
290
24
Li30
501.30
0.12
0.14
449
1129
Li33
5111.40
0.31
0.09
450
116
Li35
524.90
0.05
0.10
467
241
Li37
535.30
0.11
0.08
513
239
Note:
The
locatio
nsof
theprofi
lesandwellsaredeno
tedin
Figure3.
TOCistotalorganiccarbon
(wt.%);S1isexistin
ghy
drocarbon(m
ghy
drocarbo
n/grock);S2isgeneratedhy
drocarbo
nfrom
kerogen
(mghy
drocarbo
n/grock);HIishy
drog
enindex(m
ghy
drocarbo
n/gTOC);andOIisox
ygen
index(m
gCO2/g
TOC).
International Geology Review 7
Dow
nloa
ded
by [
Uni
vers
ity o
f H
oust
on]
at 0
8:05
09
Febr
uary
201
5

responses with values between 70 and 150 API – inferringhigh TOC contents of the shale (Cheng et al. 2009). Thelower Cambrian shale has been recognized as the sourcerock of the Weiyuan gas field, which possesses the oldestreservoir rock (Ediacaran dolomite) of all Chinese petro-leum fields (Editorial Committee of the Sichuan Oil & Gasfield 1989; Xu et al. 1989; Huang et al. 1997; Dai 2003;Ma et al. 2010). In the research reported here, a total of 15lower Cambrian samples comprising siliceous or
carbonaceous shale/mudstone and phosphorite were inves-tigated. They were collected from the Rongxi andJinggang profiles (Sample ID 15–20, Table 1) in theChongqing area, the Cenggong profile in the Guizhouprovince (Sample ID 21–23), and the Heishapo profile inthe Hunan province (Sample ID 24–29) (Figures 3 and 4).
The Ediacaran black shale has a more restricted dis-tribution than the lower Silurian and lower Cambrian shaleand locally crop out to the southeast of the Sichuan Basin,
Figure 4. Outcrop photographs and selected hand specimens. Profiles: (A) lower Silurian shale in the Guankou profile, Chongqing area(ID:2); (B) lower Cambrian black (bottom) and Siliceous (upper) shale in the Jinggang profile, Chongqing area (ID4); (C) lowerCambrian black shale (left) in the Cenggong profile, Guizhou province (ID:6); and (D) lower Cambrian siliceous shale (right) in theCenggong profile, Guizhou province (ID:6). ID numbers of these profiles are indicated in Figure 3. Samples: (E) lower Siluriancalcareous shale sample from the Lujiao profile, Chongqing area (ID:1); (F) distinct horizontal laminations in the lower Cambrianshale, sampled from the Rongxi profile, Chongqing area (ID:6); (G) lower Silurian fossiliferous (graptolite) shale sample from theGuankou profile, Chongqing area (ID:21) (Tan et al. 2014a); (H) lower Silurian mudstone with big pyrite accumulation or segregation,sample from the YY1 well (ID:35); (I) fractured lower Silurian mudstone filled with quartz, sampled from the YY1 well (ID:5) (Tanet al. 2014a); (J) lower Cambrian carbonaceous shale sample from the Cenggong profile, Guizhou area (ID:9); (K) Ediacaran phosphaticshale sample from the Maoshi profile, Guizhou province (ID: 12); (L) Ediacaran black shale from the Lijiatuo profile, Hunan province(ID: 26). ID numbers of these samples are indicated in Table 1.
8 J. Tan et al.
Dow
nloa
ded
by [
Uni
vers
ity o
f H
oust
on]
at 0
8:05
09
Febr
uary
201
5

north Guizhou province, and west Hunan and Hubei pro-vinces. A total of 24 Ediacaran samples (Sample ID 30–53, Table 1) collected from two profiles in Guizhou andHunan provinces (Figures 3 and 4) were investigated;here, the lithofacies comprised mudstone, siliceous shale,chert, and phosphorite (Table 1).
3. Methods for organic geochemical characterization
3.1. Sample preparation
Samples were broken by a hammer to make small frag-ments and/or cut into small rectangular strips by a water-cooled saw to make sections for light microscopy. Quartzand calcite minerals were selected from roughly crushedfragments for fluid inclusion analysis. The remaining mate-rials were then ground to 200–250 μm for measuring TOC,Rock-Eval, Tvap-GC, and open py-GC.
3.2. Electronic microscopy
Prepared thin and polished sections were investigated underplane-polarized, cross-polarized, and reflected white lightusing a Zeiss Axiophot Electronic Microscope System,which was equipped with a Carl Zeiss Axiocam digitalcamera and Carl Zeiss Axiovision 2.0 software, and iscapable of taking high-resolution photomicrographs withmagnifying lenses of 10×, 20×, 30×, 40×, and 50×.
3.3. Carbon isotope ratio of fluid inclusions
A total of four samples that had fluid inclusions were ana-lysed for stable isotope ratios using an Elemental Analyser(EA)-IRMS system. This system comprises a crusher, a GC-column, an EA, a ConFloIII interface, and a ThermoDeltaplusXL mass spectrometer, and allows the simulta-neous measurement of the stable isotope ratios of gas mix-tures, for example, N2, CH4, and/or CO2 (Lüders et al. 2012).
3.4. Rock-Eval and TOC measurements
In order to characterize the organic matter richness andthermally extractable total hydrocarbons in the rock, allsamples were measured for TOC and Rock-Eval (Espitaliéet al. 1977). Applied Petroleum Technology AS (Norway)measured these parameters using a Leco SC-632 and aRock-Eval 6 device (Behar et al. 2001).
3.5. Tvap-GC and open py-GC
For Tvap-GC, roughly 20–30 mg of finely ground powderwas weighed into glass capillaries, which were then sealedwith an H2-flame after reducing the internal volume of thetube from ca. 40 ml to ca. 15 ml with pre-cleaned quartzsand. The sealed tubes were then introduced into a
Quantum MSSV-2 Thermal Analyser pyrolysis oven unitinterfaced with an Agilent 6890A GC apparatus equippedwith an HP-Ultra 1 column of 50 m length, 0.32 mminternal diameter and 0.52 µm thickness and an FID. Theexternal surfaces of each tube were purged for 5 min at300°C, during which time volatiles were also mobilizedwithin the tube and thereafter cracked open by a pistondevice to transfer generated products from within thevessel by helium carrier gas with a flow rate of 30 ml/min into a liquid nitrogen-cooled trap. The trapped hydro-carbons were released to the column by ballistic heating ofthe trap to 300°C, and then thermovaporization productswere recorded. Py-GC was performed on the remainingpowder by heating from 300–600°C using a 50°C/minheating rate (3 min, isothermal). Pyrolysis products wereagain collected in the cryogenic trap and further analysedusing the same GC conditions as for Tvap-GC. The GCoven temperature was programmed from 30 to 320°C at5°C/min. Quantification of individual compounds and totalswas conducted by external standardization with n-butane.Reproducibility of measured product concentration wasgenerally better than 4% (Schenk et al. 1997). Because ofthe lower response factor of methane compared to theheavier gases, the methane content was multiplied by 1.1.
3.6. Reconstructing the original TOC and hydrocarbonpotential
Cooles’ method (Cooles et al. 1986) and Claypool’s equa-tions (Peters et al. 2005) were used to reconstruct originalTOC and Rock-Eval parameters of the overmature sam-ples from the UYP, and the original hydrocarbon genera-tive potential is revealed as input parameter for massbalance calculations.
4. Results and discussions
4.1. Organic matter richness
Based on thin section and polished section microscopy on30 samples, the matrix was seen to be composed of quartzand clay minerals, with abundant pyrite and organic mate-rial (Figure 5). In the thin section photomicrographs(sample 6 and G011315), dark coloured amorphous organicmatter clusters can be observed within the quartz and clayor shale matrix, as well as along the crinkle to wavylamination. In polished section photomicrographs (sample2 and 20), organic matter appears as grey aggregates show-ing high reflectance (approximately 4%). Organic matter ofthe examined sample accounts for 20–30% of the photo-micrograph area (sample 20). Its high level of reflectancepoints to the particles being spent kerogen or pyrobitumen(Tissot and Welte 1984; Horsfield and Rullkötter 1994).
The TOC (wt. %) and Rock-Eval data are listed inTable 1. Figure 6 illustrates that the TOC content falls
International Geology Review 9
Dow
nloa
ded
by [
Uni
vers
ity o
f H
oust
on]
at 0
8:05
09
Febr
uary
201
5

Figure 5. Organic matter in section photomicrographs of selected and representative shale samples. (A) – Organic matter (pyrobitumen)and pyrite framboids (polished section with reflected light) (ID:2); (B) – disseminated pyrobitumen in shale matrix, with light reflectanceof the bitumen is over 4.0 % (polished section, reflected light) (ID:20); (C) – unlaminated siliceous shale showing organic matter (black),platy clay or mica minerals and subrounded to angular detrital quartz grains (white) (thin section, plane polarized light) (ID:6); (D) –siliceous shale showing graded bedding with crinkle to wavy laminated organic matter in the bottom and lower organic content in themore granular top (thin section, plane polarized light) (ID:23). ID numbers are indicated in Table 1.
Figure 6. Histograms of TOC content in relation to stratigraphic age.
The TOC content almost positively correlates with increasing geological age. Sample IDs are denoted in Table 1.
10 J. Tan et al.
Dow
nloa
ded
by [
Uni
vers
ity o
f H
oust
on]
at 0
8:05
09
Febr
uary
201
5

between 1% and 19%, with TOC content almost positivelycorrelated with increasing geological age, i.e. theLongmaxi shales (lower Silurian) exhibit generally lowerTOC contents than that of the Niutitang shales (lowerCambrian), which commonly exhibit lower TOC contentsthan that of the Ediacaran shales. The TOC content of theLongmaxi shales mainly range from 1–3% showing thelowest average value of 2.5% of all investigated samples.The TOC values of the Niutitang shales range from0.4–10.2 % with an average value of 5.2%. Particularly,the TOC content values of phosphatic samples from theNiutitang interval are <1%. The highest TOC concentra-tion can be found for the Ediacaran shales for which halfof the samples exhibit >4% TOC, with maximum contentsexceeding 10%, at least in one profile located in thewestern Hunan Province.
The organic matter richness of the measured samplescan thus be described as moderate to very high, which isan important parameter for evaluating either source rock ina conventional petroleum system (Tissot and Welte 1984;Peters and Cassa 1994; Hunt 1995; Peters et al. 2005) orhydrocarbon potential and reservoir quality in unconven-tional petroleum systems (Curtis 2002; Montgomeryet al. 2005; Jarvie et al. 2007; Kinley et al. 2008; Rossand Bustin 2008; Rodriguez and Philp 2010;Hackley 2012). Clearly, the TOC content of the originalimmature equivalents of these samples was much higherthan the present values, the factor being dependent onoriginal kerogen type. In addition, high TOC may indicatean anoxic environment. The abundance of organic matterthus reflects the fact that the UYP sea floor was at times ofdeposition likely anoxic, for if the sea bottom had beenoxic, aerobic bacteria would have thrived and consumed
much of the organic material (Tissot and Welte 1984;Loucks and Ruppel 2007).
Published TOC results of marine shale in the UYP(Liang et al. 2008; Wang et al. 2009a, 2013a; Donget al. 2010; Guo and Liu 2013; Han et al. 2013; Guoand Zhang 2014; Luo et al. 2014) support the abovefindings. High TOC concentration is demonstrated by thehundreds of samples taken from eight profiles/wells withinthe UYP (Figures 3 and 7). Most of the profiles exhibithigher TOC concentrations in the lower part, where blackshale is present, and lower TOC concentrations in theupper part, where carbonates, mud, and/or siltstone dom-inate (Editorial Committee of the Sichuan Oil & Gasfield 1989; Liang et al. 2008; Cheng et al. 2009; Wanget al. 2014). In addition, the published isopach mapsshow that the thickness of shale units with TOC valuesexceeding 2% can reach 20–200 m in most of the regionsof southeast Sichuan, Chongqing, north Guizhou, and westHunan and Hubei (Dong et al. 2010; Guo and Zhang 2014).
4.2. Thermal history and maturity
The Ediacaran and lower Palaeozoic source rocks did notcommence to generate considerable thermogenic hydro-carbon until the late Permian to Early Triassic, followingsubsidence and re-deposition post the prolonged upliftcaused by the late Caledonian and Yunnan orogenybetween the late Silurian and Carboniferous (Huanget al. 1997; Zhang et al. 2007a, 2007b; Wang et al.2009a). The principal period of hydrocarbon generationfrom kerogen (primary cracking) of the lower Palaeozoicshales was suggested to have occurred between the LateTriassic and Early Jurassic. During this period, these
Figure 7. TOC content versus stratigraphic depth for eight sections studied on the UYP (Liang et al. 2008).
(A)–(D) are lower Silurian profiles/wells (IDs: 10-13); (E)–(H) are lower Cambrian profiles/wells (IDs: 14–17). The locations are denotedin Figure 3.
International Geology Review 11
Dow
nloa
ded
by [
Uni
vers
ity o
f H
oust
on]
at 0
8:05
09
Febr
uary
201
5

intervals were buried between 2 and 4 km, which indicatesa geo-temperature range of 120–165°C. In the course ofthe continuous burial and kerogen conversion, secondarycracking processes started to form light hydrocarbon pro-ducts since the Early Jurassic. By the end of the Jurassic,the lower Palaeozoic shales endured maximum burial of6 km and the highest temperature of 220°C (Tanet al. 2013). In this regard, the present organic matter inthe investigated Ediacaran and lower Palaeozoic sourcerocks should have been overmature, having evolved farinto the metagenesis stage (Tissot and Welte 1984;Horsfield and Rullkötter 1994).
Using microscopic images, dark organic clusters canbe observed under transmitted light on thin sections andbright-grey organic aggregates with intense bitumenreflectance (as much as 4%) can be seen under reflectedlight on polished sections (Figure 5). Rock-Eval pyrolysisof whole rocks also indicates the high thermal maturity.Investigated samples exhibit, even though with richorganic matter, very low S2 (<0.65 mg HC /g rock) andconsequently low HI values (<100 mg HC/g TOC)(Table 1), which in turn leads to Tmax values being unreli-able to indicate thermal maturity levels. Vitrinite reflec-tance (Ro) is the most widely used key measure for thermalmaturity. Nevertheless, it is not suitable for the Ediacaranand lower Palaeozoic source rocks since vitrinite in itsstrict sense does not exist in sediments deposited beforeDevonian times. However, methods have been set up tocompare equivalent parameters with Ro, for instance, bitu-men reflectance (Jacob 1967, 1985; Buchardt andLewan 1990; Pawlewicz and King 1992; Bertrand 1993)and carbon isotope ratios (Stahl 1974; Stahl and Carey1975; Schoell 1980; James 1983; Laughrey andBaldassare 1998; Prinzhofer et al. 2000).
For the Sichuan Basin, UYP, Feng and Chen (1988)reported a formula to calculate Ro via bitumen reflec-tance (Rb):
Ro ¼ 0:3195þ 0:6790Rb: (1)
This formula was deduced from thermal experimentson oil shale and was examined by applying the calculatedRo to the Permian source rocks in the Sichuan Basin. Anexcellent correlation of the real measured Ro and thecalculated Ro was found (Feng and Chen 1988).Measured Rb of the investigated lower Cambrian shalesis, as stated above, as high as 4%, which translates to a Ro
of about 3%.The isotopic behaviour of natural gas can be explained
by differences in the binding energy of molecules.Instantaneous methane should, in response to the kineticisotope effect, become increasingly enriched in the 13Cisotope with increasing thermal stress, i.e. with increasingmaturity of the source rock (Stahl 1974; Stahl andCarey 1975). Thus, δ13C of methane (δ13C1) can be used
to deduce Ro and reveal thermal maturity. In the currentwork, δ13C1 has been measured for two samples contain-ing methane inclusions. Measured δ13C1 values are−33.2‰ for the lower Silurian shale and −29.0‰ for thelower Cambrian shale. Figure 8 illustrates the correlationsbetween δ13C1 and Ro. It shows results of a series ofmarine source rocks from the Devonian throughCarboniferous strata in the Val Verde and DelawareBasins (Barnett shale, USA) (Stahl and Carey 1975) anda series of German Carboniferous coal samples(Schoell 1980). The UYP shale samples are obviously inagreement with the Barnett shale, and thermal maturitiesof the lower Silurian and lower Cambrian shale could beextrapolated to a Ro range of 2.5–3.0% and 3.0–3.5%,respectively (Figure 8). For the Ediacaran shale, the ther-mal maturity should be generally higher than that of thelower Silurian and lower Cambrian samples, and a Ro
range of 3.5–4.0% is assumed according to the modellingresults (Tan et al. 2013). The vitrinite reflectance valuespresent here are consistent with those deduced from Rb,which have been extensively published (Nie et al. 2011;Huang et al. 2012; Long et al. 2012; Yu et al. 2012; Hanet al. 2013; Guo and Zhang 2014; Zhou et al. 2014).
4.3. Kerogen type
The kerogen of the successful shale gas plays in NorthAmerica is dominated by Type II organic matter; never-theless, the thick, widespread, gas-saturated, fine-grainedunits with (1) rich organic matter of any type that isthermally immature and subject to extensive biogenic
R2 = 0.95
R2 = 0.87
–50
–45
–40
–35
–30
–25
–200 0.5 1 1.5 2 2.5 3 3.5 4
δ13C
1 (‰
)
Ro (%)
Barnett Shale
UYP lower Silurian shale
UYP lower Cambrian shale
German Carboniferous coal
Figure 8. Compilation of δ13C of methane (δ13C1) versus vitri-nite reflectance (Ro). Carbon isotopic composition of methaneand vitrinite reflectance are positively correlated for both marinesource rocks as well as terrestrial coal samples, with both arraysbeing considerably offset. This is reflected in δ13C1 values frommarine source rocks being more fractionated than δ13C1 valuesfrom terrestrial coal. Values for UYP samples are in agreementwith values measured for the Barnett shale (Stahl andCarey 1975) plotting on the extrapolation towards higher δ13C1
and higher vitrinite reflectance, respectively.
12 J. Tan et al.
Dow
nloa
ded
by [
Uni
vers
ity o
f H
oust
on]
at 0
8:05
09
Febr
uary
201
5

decomposition, and/or (2) significant Type III organicmatter in thermally mature to overmature states can bepromising exploration targets as well (Martini et al. 2003;Hamblin 2006).
Kerogen types of the Ediacaran and lower Palaeozoicshale in the UYP have been speculated to be of Type I(Liu et al. 2000; Dai et al. 2003; Zhu et al. 2006; Guo andLiu 2013; Luo et al. 2014; Zhou et al. 2014), Type II (Yinet al. 2001; Liang et al. 2009; Liu et al. 2011), or Type Iand III origin (Huang 1986; Editorial Committee of theSichuan Oil & Gas field 1989; Zhang et al. 2008; Zouet al. 2010; Guo and Zhang 2014). In this study, the Rock-Eval results are characterized by extremely low HI valuesand a broad Tmax range (Table 1). The original structuresof the organic matter within these three intervals musthave been altered and lost during the maturation processfrom diagenesis to metagenesis. Identification of the ori-ginal kerogen is therefore fraught with difficulties. Wehave tried to identify clues based on the hydrocarbongeneration properties during maturation and the carbonisotope ratios of methane, kerogen, and chloroform bitu-men, which will be summarized in future reports.
4.4. Sorbed hydrocarbon composition as revealed byTvap-GC
Tvap-GC is a method of gas chromatography capable ofresolving the S1 peak of Rock-Eval pyrolysis, whichrepresents the bulk of retained hydrocarbons within therock. Because free gas is lost either during the sampling orpreparation process (crushing), gas measured using Tvap-GC primarily reflects the fraction of sorbed gas whichmight accumulate on the surfaces of minerals or organicmatter and/or retained gas, which may be stored in uncon-nected pores. Mahlstedt and Horsfield (personaldiscussion) have recently outlined how Tvap-GC can beused to screen samples based on their sorption capacity. Inthe current investigation, 14 samples were analysed usingTvap-GC to quantify the retained/sorbed hydrocarbonsthat were generated during the early geological history ofthe rocks (Table 2) (Tan et al. 2014b). Because the sam-ples were taken from outcrops or depths shallower than350 m, the measurable hydrocarbon amounts are less than10 mg/g TOC, i.e. extremely low. Generally, the Tvap-GCresults from the core samples are significantly higher thanthose from the outcrops because of low pressure andweathering influence. In addition, the detectable hydrocar-bons in overmature source rocks were expected to bedominated by light hydrocarbons. Hence, the measuredproducts primarily consist of methane (C1), ethane (C2),propane (C3), butane (C4), pentane (C5), and benzene.Interestingly, C1, C3, and C4 are major components ofthe core samples. C5 and benzene are present in highamounts in certain outcrops, whereas the levels of C2 arelow in the majority of the samples (Table 2). Ta
ble2.
Therm
ovaporizationgaschromatog
raph
yprod
uctsin
µg/gTOC
(Tan
etal.20
14b).
Unit
Low
erSilu
rian
shale
Low
erCam
brianshale
Ediacaran
shale
Sam
ple-ID
910
1112
1314
1617
1819
2039
4151
Depth
(m)
136
207
267
276
285
321
00
00
00
00
TOC
(%)
1.97
1.47
2.31
1.69
1.68
2.21
10.20
6.02
7.44
8.15
9.41
6.15
5.90
11.40
C1
50.66
68.50
13.81
64.56
52.98
75.25
0.79
7.96
7.47
8.98
3.91
8.44
9.71
17.87
C2
13.55
24.08
15.41
34.97
14.64
26.92
3.02
5.30
4.70
5.55
1.71
7.35
7.17
16.69
C3
34.47
95.44
45.97
292.01
51.61
180.14
2.36
6.26
7.96
4.66
2.55
15.41
12.78
6.19
C4
104.62
391.43
212.60
296.75
210.48
393.85
5.30
36.45
19.58
12.17
10.38
45.93
59.81
31.74
C5
6.19
44.76
35.97
39.70
39.82
111.13
2.71
11.03
57.07
173.87
2.62
126.65
149.83
9.65
Benzene
0.00
32.86
43.72
42.25
23.63
127.01
9.86
40.78
9.33
9.99
5.88
55.56
38.07
35.97
∑To
talidentified
209.49
657.07
367.49
770.24
393.15
914.30
24.05
107.77
106.12
215.21
27.06
259.35
277.37
118.11
∑Produ
cts
1707
.56
2551
.56
3397
.71
6516
.98
1610
.36
7600
.05
44.63
271.81
205.50
401.88
96.17
1189
.59
525.49
183.45
International Geology Review 13
Dow
nloa
ded
by [
Uni
vers
ity o
f H
oust
on]
at 0
8:05
09
Febr
uary
201
5

4.5. Remaining hydrocarbon generative potential asrevealed by open py-GC
The low remaining hydrocarbon generative potential ofselected samples is illustrated in Figure 9. The HI of theUYP shales is much lower than that of the samplescontaining Types II and III kerogen from the USA,Germany, and New Zealand. Open py-GC was per-formed on 34 samples to investigate the remaininghydrocarbon generative potential on a molecular level.The pyrolysates are primarily composed of light hydro-carbons, i.e. methane (C1), ethane and ethene (C2),propane and propene (C3), butane and butene (C4),pentane and pentene (C5), and benzene (Figure 10 andTable 3). In general, the lower Silurian shales are cap-able of generating higher yields than the lowerCambrian and Ediacaran shales (Figures 10 and 11A–B), indicating somewhat lower maturities. C1 is by farthe dominant products, and C2 and benzene can bedetected in relatively high amounts in the pyrolysatesfrom the cores and certain outcrop samples (Figures11C–D). Individual hydrocarbon compounds generated
by the core samples display no significant variationswith depth (Figure 11E), whereas a generally positivecorrelation between the levels of C5 and TOC can beobserved (Figure 11F). In addition, the amount of totalhydrocarbon of per gramme TOC of the lower Siluriancore samples is higher than that of most outcrop sam-ples (Figure 11B).
The relatively high remaining generative potential ofthe lower Silurian shale can be principally attributed tothe progressive increase in thermal maturity with geolo-gical age, i.e. from the lower Silurian to lower Cambrianto Ediacaran strata, although the effects of the mineralogyand weathering on the kerogen decomposition cannot beruled out. The highest remaining hydrocarbon potentialper gramme of TOC is observed in the two samples withthe lowest TOC concentrations (<0.5%) (Figure 11B). Ithas been reported, however, that the primary heavy pro-ducts of whole rocks can be trapped on mineral surfacesor interlayers, which can then be cracked into lighthydrocarbon with temperature increases (Eisma andJurg 1967; Espitalié et al. 1980; Horsfield andDouglas 1980). The highest pyrolysis yields from organicmatter lean samples may therefore be attributed to thethermal decomposition of formerly retained bitumen, on aTOC normalized basis. Weathering may also impact theproperties of the organic matter in the shales. It has beenreported that the weathering process could result in thedecrease of TOC content, enrichment of 13C and varia-tion of kerogen structure (Leythaeuser 1973; Clayton andSwetland 1978; Clayton and King 1987; Littkeet al. 1991; Petsch et al. 2000; Wildman et al. 2004;Fischer et al. 2009; Marynowski et al. 2011). A decreasein TOC during weathering is consequently accompaniedby a pronounced reduction in the remaining hydrocarbongenerative potential, which may be responsible for therelatively low TOC content in core samples showinghigher generative potentials than most of the outcrops(Figure 11A).
4.6. Reconstruction of original hydrocarbon generativepotential
The algebraic procedures used in mass balance models forcalculating the transformation ratios (TRs), original TOC(TOCo), original petroleum potential (S1o+S2o), petroleumgeneration index (PGI), petroleum expulsion efficiency(PEE or ExEf), and amount of expelled petroleum(S1EX) have been developed and described in detail(Pelet 1985; Cooles et al. 1986; Santamaria andHorsfield 2004; Peters et al. 2005). These mass balancecalculations are important for constraining the quantity
0
150
300
450
600
750
900
295 330 365 400 435 470 505 540 575 610
Hyd
roge
n In
dex
(mg
HC
/g T
OC
)
Tmax (°C)Barnett shale, USA Bakken shale, USA
Posidonia shale, Germany Coal, Germany
Coal, New Zealand Upper Yangtze Platform marine shale, China
I
II
III
Figure 9. HI-Tmax plot of different source rocks, comprising theUYP shale, Barnett shale (Jarvie 2008), Bakken shale (Kuhnet al. 2010), Posidonia shale (Schenk and Horsfield 1998),German coal (Schenk and Horsfield 1998), and New Zealandcoal (Vu 2008).
14 J. Tan et al.
Dow
nloa
ded
by [
Uni
vers
ity o
f H
oust
on]
at 0
8:05
09
Febr
uary
201
5

and quality of organic matter in the source rock beforematuration.
In this study, the input parameters consisted of themeasured Rock-Eval data (mean values of shale samplesfrom a given interval), the assumed HIo of immatureequivalents in the immature Australian samples(601–620 mg HC/g rock) and Green River shale(777 mg HC/g rock), and an assumed PIo (0.02), whichhas been suggested is reasonable for most immaturesource rocks (Peters et al. 2005). The calculated results(Table 4) indicate that the TRs are over 98%, which is inaccordance with the overmature kerogen and low remain-ing generative potential. However, the restored TOCo
(4.8–23.4%), S1o, and S2o (29–215 mg HC/g rock) indi-cate excellent original petroleum potential, and a mass ofhydrocarbons must have been generated and expelledupon kerogen maturation, as indicated by the fact thatboth the PGI and PEE are >99%. Cooles’ method andClaypool’s equations yield very similar values of TOCo,S1o, and S2o and high values of TR and PGI.Nevertheless, extremely low expulsion efficiencies (PEEor ExEf) of the Ediacaran shale were indicated whenClaypool’s method was applied. The explanation is thatClaypool’s method relies on PI and PIo to calculate theExEf, whereas the PI of the Ediacaran shale is abnormallyhigh (0.37) and that of the lower Silurian (0.08) and lower
Cambrian shale (0.09) is low. The high TOC Ediacaranshale samples commonly possess relatively high values ofS1 and low values of S2 (Table 1), and thus, the measuredPI values are abnormal, which may reflect a strongersorption capacity resulting from the high TOC content.The extrapolated amount of expelled petroleum (S1EX)ranges from 28.9 to 166.0 mg HC/g rock, or nearly88.0 mg HC/g rock on average.
5. Conclusions
The Ediacaran, lower Cambrian, and lower Silurian blackshale intervals were deposited during three major trans-gressions of the late Precambrian and early Palaeozoic.The sedimentary environments were dominated by opento restricted marine platforms and shelves with deep-water conditions. The lower Cambrian shale is distribu-ted throughout most of the UYP and is particularly thickin the southeast Sichuan Basin, Chongqing, northGuizhou, west Hunan, and west Hubei. The lowerSilurian shale, however, is primarily confined to thecentral UYP, where it underlies the southeast SichuanBasin and Chongqing area. The depths vary significantly.There are outcrops along the margins of the SichuanBasin and in the southeast UYP, whereas black shale isencountered at depths exceeding 5 km in certain
Figure 10. The dominant open py-GC pyrolysates of the lower Silurian, lower Cambrian, and Ediacaran shale samples. Considerabledifferences in open py-GC pyrolysate composition are found for the respective units. The lower Silurian sample shows relatively strongeryields than the lower Cambrian sample, which in turn has higher yields than the Ediacaran sample.
International Geology Review 15
Dow
nloa
ded
by [
Uni
vers
ity o
f H
oust
on]
at 0
8:05
09
Febr
uary
201
5

Table3.
Open-system
pyrolysisgaschromatog
raph
yprod
uctsin
µg/gTOC.
Unit
Low
erSilu
rian
shale
Sam
pleID
12
34
56
78
910
1112
1314
Depth
(m)
00
00
00
00
136
207
267
276
285
321
TOC
(%)
3.34
3.76
1.68
1.84
0.93
3.89
43.64
1.97
1.47
2.31
1.69
1.68
2.21
C1
700.8
374.6
320.4
641.4
325.6
140.6
121.2
174.8
395.7
392.9
345.5
359.1
397.9
391.2
C2
327.6
183.5
120.6
141.1
166.4
165.4
48.5
53.2
174.0
245.9
200.8
222.8
175.3
160.8
C3
170.4
108.3
134.0
153.9
100.1
26.9
22.9
142.8
211.1
71.7
147.8
165.4
83.4
C4
47.8
36.6
129.0
66.5
9.3
9.2
101.3
231.9
101.8
160.0
146.5
235.7
C5
38.3
44.7
39.1
111.8
76.3
27.0
20.8
18.5
38.7
74.8
30.4
72.4
57.6
54.3
C6
18.8
33.6
14.7
19.0
12.3
15.6
14.9
18.9
Benzene
27.0
51.1
76.8
50.5
49.2
117.9
36.2
47.7
240.7
227.8
178.5
207.8
211.1
249.5
∑To
talidentified
1311.9
798.8
575.7
1078
.790
0.4
651.1
262.9
326.3
1107
.914
03.5
941.0
1185
.51168
.61193
.8∑
Produ
cts
1607
.616
88.0
1439
.516
13.5
1276
.328
65.0
377.0
469.7
1740
.829
84.1
2011.8
2252
.118
40.5
2774
.2
Unit
Low
erCam
brianshale
Ediacaran
shale
Sam
pleID
1516
1718
1920
2122
2326
2728
2931
3233
3435
3841
Depth
(m)
00
00
00
00
00
00
00
00
00
00
TOC
(%)
0.45
10.2
6.02
7.44
8.15
9.41
2.85
5.79
5.04
0.39
7.79
5.81
7.69
2.59
3.3
5.05
1.89
1.43
0.43
6.7
C1
166.9
17.7
18.7
31.5
14.5
16.8
75.0
106.0
95.0
408.2
23.1
262.5
96.2
37.4
40.6
30.0
181.4
81.7
515.2
23.3
C2
164.0
8.4
15.9
39.7
15.3
12.0
70.9
52.2
48.2
670.3
11.7
35.9
36.4
28.3
91.4
20.2
149.1
80.7
510.4
21.9
C3
83.6
8.7
26.5
7.8
9.1
34.6
24.8
220.5
6.3
15.1
14.7
30.4
12.2
34.7
51.1
258.3
11.1
C4
55.6
6.3
17.8
3.7
3.5
20.5
7.1
9.8
156.2
4.6
14.7
7.3
8.7
54.7
7.5
58.4
170.9
4.9
C5
33.7
14.5
53.6
13.8
31.4
79.4
33.1
60.4
135.5
35.0
40.1
44.6
22.6
48.3
7.2
110.0
79.3
244.0
C6
Benzene
5.0
7.8
6.4
0.0
3.9
175.4
11.0
12.9
59.1
4.8
219.8
170.9
5.6
∑To
talidentified
503.9
31.0
72.0
175.4
55.2
76.7
421.1
243.9
251.0
1649
.785
.558
8.2
355.4
117.3
265.3
77.1
475.2
351.2
1698
.861
.2∑
Produ
cts
1339
.372
.916
5.8
464.5
95.7
102.4
1581
.538
2.2
389.8
3547
.914
3.4
1183
.678
7.0
204.2
520.7
184.6
2823
.961
2.4
2919
.315
8.8
16 J. Tan et al.
Dow
nloa
ded
by [
Uni
vers
ity o
f H
oust
on]
at 0
8:05
09
Febr
uary
201
5

depressions. The mineralogy and organic matter vary inupward succession in both the lower Cambrian and lowerSilurian formations, such that high-TOC black shale istypically situated in the bottom parts, whereas the upperintervals consists of the low-TOC grey shale, siltstone, orcarbonate.
The TOC contents in the analysed samples are gen-erally >2% and average 5%, and they increase withgeological age. For example, the TOC levels in thelower Silurian shale are lower than those in the lowerCambrian shale, which are in turn lower than those inthe Ediacaran shale in general. The thermal maturity ofthe kerogen indicates metagenesis, based on the visibleorganic matter, bitumen reflectance and δ13C of
methane. On the basis of the δ13C of the methane andthe basin modelling results, extrapolated vitrinite reflec-tances (Ro) of 2.5–3.0% for the lower Silurian shale,3.0–3.5% for the lower Cambrian shale, and 3.5–4.0%for the Ediacaran shale were found. Tvap-GC and openpy-GC analyses indicate extremely low remaining gen-erated hydrocarbon and low remaining generative poten-tial, and the products are qualitatively dominated by thelight hydrocarbons. The original petroleum potential andoriginal organic status were calculated and reconstructedusing Cooles’ and Claypool’s equations. Excellent ori-ginal hydrocarbon potential was revealed, based on thevalues of TOCo between 5% and 23% and S1o+S2oranging from 29–215 mg HC/g rock.
Figure 11. Open py-GC products of selected samples. (A) Total amount of open py-GC products of per gram rock; (B) total amount ofopen py-GC products, values were normalized to TOC weight; (C) the amount of the identified light hydrocarbons per gramme rock; (D)the amount of the identified light hydrocarbons, values were normalized to TOC; (E) light hydrocarbons vs. depth of the core samples;and (F) the correlations between C5 and TOC.
International Geology Review 17
Dow
nloa
ded
by [
Uni
vers
ity o
f H
oust
on]
at 0
8:05
09
Febr
uary
201
5

Table4.
Massbalancecalculations
usingthedifferentapproaches.
Unit
Measureddata
(meanvalue)
Assum
ption
Pelet’sequatio
n(Pelet19
85)
Coo
les’
metho
d(Coo
leset
al.19
86)
Clayp
ool’s
metho
d(Peterset
al.,20
06)
TOC
S1
S2
HI
PI
HI
PI O
TR
DCoratio
DCo
TOCo
S1 O
+S2 O
PGI
PEE
TR
TOCo
S1 O
+S2 O
S1E
XExE
f
Low
erSilu
rian
2.5
0.03
0.4
17.43
0.08
900
0.02
99.5
0.22
2.40
10.76
100.66
99.6
99.97
99.5
9.42
86.49
86.07
96.3
800
0.02
99.3
0.31
7.76
64.54
99.4
99.95
99.3
7.13
58.18
57.75
94.3
700
0.02
98.9
0.40
6.07
44.16
99.2
99.93
99.0
5.73
40.95
40.51
91.7
600
0.02
98.5
0.47
5.11
32.66
98.9
99.91
98.6
4.80
29.36
28.91
88.2
Low
erCam
brian
5.2
0.03
0.3
17.77
0.09
900
0.02
99.5
0.22
5.15
23.04
215.55
99.8
99.99
99.5
18.17
166.86
166.02
95.3
800
0.02
99.2
0.31
16.62
138.20
99.8
99.98
99.3
14.16
115.58
114.68
92.8
700
0.02
98.9
0.40
12.99
94.57
99.7
99.97
99.0
11.60
82.84
81.91
89.5
600
0.02
98.5
0.47
10.95
69.94
99.5
99.96
98.5
9.82
60.13
59.18
85.1
Ediacaran
5.1
0.12
0.2
9.17
0.37
900
0.02
99.7
0.22
4.98
22.32
208.82
99.9
99.94
99.8
17.97
164.98
164.37
85.8
800
0.02
99.6
0.31
16.10
133.89
99.9
99.91
99.6
13.99
114.20
113.54
78.2
700
0.02
99.5
0.40
12.59
91.62
99.8
99.87
99.5
11.45
81.82
81.13
68.4
600
0.02
99.2
0.47
10.61
67.76
99.7
99.82
99.2
9.70
59.37
58.67
55.4
(1)HIishydrogen
index(m
ghydrocarbon/gTOC);TRistransformationratio
(%);PIisproductio
nratio
(wt.ratio
);TOCistotalo
rganiccarbon
(wt.%);S1isexistin
ghy
drocarbo
n(m
ghy
drocarbo
n/grock);
S2isgeneratedhy
drocarbo
nfrom
kerogen(m
ghy
drocarbo
n/grock);S1E
Xisexpelledpetroleum
(mghy
drocarbo
n/grock);ExE
fisexpulsionefficiency(%
);DCratio
isdead
carbon/to
talo
rganiccarbon;
DCisdead
carbon
wt./rock
wt.(%
);PGIispetroleum
generatio
nindex(%
);PEEispetroleum
expulsionefficiency
(%).
(2)Pelet’sequatio
n:TR=(1200×(H
I o−HI))/(H
I o×(120
0−HI)),where
HI oishydrogen
indexof
immaturesample,HIishydrogen
indexof
maturesample,and1200
representsthereciprocal(tim
es1000)
of0.83,theassumed
proportio
nof
carbon
inRock-Evalpyrolysisproducts.
(3)Coo
les’
method:
DCo-ratio
=1−(C
2o+C1o)/TOCo=1−(S1 o
+S2 o)×0.83
/TOCo/100
0;DC
=TOC
−(C
2+C1)=TOC
−(S2+S1)
×0.83/10;
TOCo=(TOC
−(C
2+C1))/DCo=DC/DCo;
S1 o
+S2 o
=(C
2o+C1o)×10
/0.83=TOCo×(1
−DCratio
)×10
/0.83;
PGI=1−S2/(S2 o
+S1 o);PEE=((S2 o
+S1 o)−(S2−S1))/((S2 o
−S2)
+S1 o).
(4)Clayp
ool’s
metho
d:TR=1−HI×(120
0−(H
I o/((1
−PI o)))/(H
I o×(1200−(H
I/(1
−PI)));T
OCo=83
.33×HI×TOC/(HI o×(1
−TR)×(83.33
−TOC)+HI×TOC);S1 o
+S2 o
=HI o×TOCo/100
/(1−
PI o);S1EX
=10
00×(TOCo−TOC)/(83.33
−TOC);ExE
f=1−(1-f)×(PI/(1
−PI))/(f+(PIo/(1−PI o))×10
0.
18 J. Tan et al.
Dow
nloa
ded
by [
Uni
vers
ity o
f H
oust
on]
at 0
8:05
09
Febr
uary
201
5

AcknowledgementsThe authors thank Ferdinand Perssen (GFZ-Potsdam) for techni-cal assistance performing experiments and Statoil for the permis-sion to publish.
Disclosure statementNo potential conflict of interest was reported by the authors
FundingThis work was supported by Statoil.
ReferencesBehar, F., Beaumont, V., and Penteado, H.L.D.B., 2001,
Technologie Rock-Eval 6: Performances etdéveloppements: Oil & Gas Science and Technology –Reviews IFP, v. 56, no. 2, p. 111–134.
Bertrand, R., 1993, Standardization of solid bitumen reflectanceto vitrinite in some Paleozoic sequences of Canada: EnergySources, v. 15, no. 2, p. 269–287. doi:10.1080/00908319308909027
Bowker, K.A., 2007, Barnett Shale gas production, Fort WorthBasin: Issues and discussion: AAPG Bulletin, v. 91, no. 4, p.523–533. doi:10.1306/06190606018
Buchardt, B., and Lewan, M., 1990, Reflectance of vitrinite-likemacerals as a thermal maturity index for Cambrian-Ordovician Alum shale, southern Scandinavia (1): AAPGBulletin, v. 74, no. 4, p. 394–406.
Chen, G., Xu, S., Chen, H., Lin, L., and Deng, H., 2014, Poolinggeological conditions of shale gas in T3X5 of west Sichuan -north Sichuan, China: Journal of Chengdu University ofTechnology, v. 41, no. 1, p. 8–18.
Chen, W., Zhou, W., Luo, P., Deng, H., Li, Q., Shan, R., and Qi,M., 2013, Analysis of the shale gas reservoir in the LowerSilurian Longmaxi Formation, Changxin1 well, southeastSichuan Basin, China: Acta Petrological Sinica, v. 29, no.3, p. 1073–1086.
Chen, Z., 2011, Exploration for shale gas of Longtan Member inPermian Leping formation, Sichuan Basin: Natural GasTechnology and Economy, v. 5, no. 2, p. 21–27.
Cheng, K., Wang, S., Dong, D., Huang, J., and Li, X., 2009,Accumulation conditions of shale gas reservoirs in the LowerCambrian Qiongzhusi Formation, the Upper YangtzeRegion: Natural Gas Industry, v. 29, no. 5, p. 40–44.
Clayton, J., and King, J., 1987, Effects of weathering on biolo-gical marker and aromatic hydrocarbon composition oforganic matter in Phosphoria shale outcrop: Geochimica EtCosmochimica Acta, v. 51, no. 8, p. 2153–2157.doi:10.1016/0016-7037(87)90264-X
Clayton, J.L., and Swetland, P.J., 1978, Subaerial weathering ofsedimentary organic matter: Geochimica Et CosmochimicaActa, v. 42, no. 3, p. 305–312. doi:10.1016/0016-7037(78)90183-7
Cooles, G., Mackenzie, A., and Quigley, T., 1986, Calculation ofpetroleum masses generated and expelled from source rocks:Organic Geochemistry, v. 10, no. 1–3, p. 235–245.doi:10.1016/0146-6380(86)90026-4
Curtis, J.B., 2002, Fractured Shale-Gas Systems: AAPG Bulletin,v. 86, no. 11, p. 1921–1938.
Dai, J., 2003, Pool forming periods and gas sources of Weiyuangas field: Petroleum Geology & Experiment, v. 25, no. 5, p.473–480.
Dai, J., Liu, D., and Gao, G., 2003, Discovery of marine muddyhydrocarbon source rocks in the southern margin of theNorth China Block and its significance for gas exploration:Geological Review, v. 49, no. 3, p. 322–329.
Dai, J., Ni, Y., Zou, C., Tao, S., Hu, G., Hu, A., Yang, C., andTao, X., 2009, Stable carbon isotopes of alkane gases fromthe Xujiahe coal measures and implication for gas-sourcecorrelation in the Sichuan Basin, SW China: OrganicGeochemistry, v. 40, no. 5, p. 638–646.
Dai, J., Pei, X., and Qi, H., 1992, China natural gas geology:Petroleum Industry Press, 298p.
Dong, D., Cheng, K., Wang, Y., Li, X., Wang, S., and Huang, J.,2010, Forming condition and characteristics of shale gas inthe Lower Paleozoic of the Upper Yangtze Region, China:Oil & Gas Geology, v. 31, no. 3, p. 288–299.
Editorial Committee of the Sichuan Oil & Gas field, 1989, TheSichuan Oil & Gas field. Petroleum Geology of China, 10:Beijing, Petroleum Industry Press, 516p.
EIA, 2011. World Shale Gas Resources: An initial assessment of14 regions outside the United States: Washington, DC, U.SDepartment of Energy.
EIA, 2013. Technically recoverable shale oil and shale gasresources: An assessment of 137 shale formations in 41countries outside the United States: Washington, DC, U.S.Department of Energy.
Eisma, E., and Jurg, J.W., 1967. Fundamental aspects of thediagenesis of organic matter and the formation of hydrocar-bons, 7th World Petroleum Congress.
Espitalié, J., Laporte, J.L., Madec, M., Marquis, F., Leplat, P.,Paulet, J., and Boutefeu, A., 1977, Méthode rapide decaractérisation des roches mètres, de leur potentiel pétrolieret de leur degré d’évolution: Oil & Gas Science andTechnology - Reviews IFP, v. 32, no. 1, p. 23–42.
Espitalié, J., Madec, M., and Tissot, B., 1980, Role of mineralmatrix in kerogen pyrolysis: Influence on petroleum genera-tion and migration: AAPG Bulletin, v. 64, no. 1, p. 59–66.
Fan, E., Tang, S., Zhang, C., and Jiang, W., 2014, Scanning-electron-microscopic micropore characteristics of the LowerPaleozoic black shale in northwestern Hunan Province:Journal of Palaeogeography, v. 16, no. 1, p. 133–142.
Feng, G., and Chen, S., 1988, Relationship between the reflec-tance of bitumen and vitrinite rock: Natural Gas Industry, v.8, no. 8, p. 20–26.
Fischer, C., Schmidt, C., Bauer, A., Gaupp, R., and Heide, K.,2009, Mineralogical and geochemical alteration of low-grademetamorphic black slates due to oxidative weathering:Chemie Der Erde-Geochemistry, v. 69, no. 2, p. 127–142.doi:10.1016/j.chemer.2009.02.002
Guo, T., Li, Y., and Wei, Z., 2011, Reservoir-forming conditionof shale gas in Ziliujing formation of Yuanba Area inSichuan Basin: Natural Gas Geoscience, v. 22, no. 2, p.1–7.
Guo, T., and Liu, R., 2013, Implications from marine shale gasexploration break-through in complicated structural area athigh thermal stage: Taking Longmaxi Formation in well JY1as an example: Natural Gas Geoscience, v. 24, no. 4, p. 643–651.
Guo, T., and Zhang, H., 2014, Formation and enrichment modeof Jiaoshiba shale gas field, Sichuan Basin: PetroleumExploration and Development, v. 41, no. 1, p. 31–40.doi:10.1016/S1876-3804(14)60003-3
Guo, Z., 1996, The formation and development of SichuanBasin: Beijing, Geological press, 200 p.
Hackley, P.C., 2012, Geological and geochemical characteriza-tion of the Lower Cretaceous Pearsall Formation, Maverick
International Geology Review 19
Dow
nloa
ded
by [
Uni
vers
ity o
f H
oust
on]
at 0
8:05
09
Febr
uary
201
5

Basin: South Texas: A Future Shale Gas Resource?: AAPGBulletin, v. 96, no. 8, p. 1449–1482.
Hamblin, A.P., 2006. The “Shale Gas” concept in Canada: Apreliminary inventory of possibilities. 5384, GeologicalSurvey of Canada
Hammes, U., Hamlin, H.S., and Ewing, T.E., 2011, Geologicanalysis of the Upper Jurassic Haynesville Shale in eastTexas and west Louisiana: AAPG Bulletin, v. 95, no. 10, p.1643–1666. doi:10.1306/02141110128
Han, S., Zhang, J., Li, Y., Jiang, W., Long, P., and Ren, Z., 2013,The optimum selecting of shale gas well location for geolo-gical investigation in Niutitang formation in LowerCambrian, Northern Guizhou Area: Natural GasGeoscience, v. 24, no. 1, p. 182–187.
Hao, F., Guo, T., Zhu, Y., Cai, X., Zou, H., and Li, P., 2008,Evidence for multiple stages of oil cracking and thermoche-mical sulfate reduction in the Puguang gas field, SichuanBasin, China: AAPG Bulletin, v. 92, no. 5, p. 611–637.doi:10.1306/01210807090
He, F., and Zhu, T., 2012, Favorable targets of breakthrough andbuilt-up of shale gas in continental facies in Lower Jurassic,Sichuan Basin: Petroleum Geology & Experiment, v. 34, no.3, p. 246–251.
Horsfield, B., and Douglas, A., 1980, The influence of minerals onthe pyrolysis of kerogens: Geochimica Et Cosmochimica Acta,v. 44, no. 8, p. 1119–1131. doi:10.1016/0016-7037(80)90066-6
Horsfield, B., and Rullkötter, J., 1994, Diagenesis, catagenesis,and metagenesis of organic matter: Memoirs-AmericanAssociation of Petroleum Geologists, p. 189–189.
Huang, J., 1986, Thermal evolution gas in Lower Paleozoic toProterozoic of Sichuan Basin and its exploration prospects:Natural Gas Industry, v. 6, no. 4, p. 8–14.
Huang, J., Chen, S., Song, J., Wang, L., Gou, X., Wang, T., andDai, H., 1997, Hydrocarbon source systems and formation ofgas fields in Sichuan Basin: Science in China Series D: EarthSciences, v. 40, no. 1, p. 32–42. doi:10.1007/BF02878579
Huang, J., Zou, C., Li, J., Dong, D., Wang, S., Wang, S., andCheng, K., 2012, Shale gas generation and potential of theLower Cambrian Qiongzhusi Formation in the SouthernSichuan Basin, China: Petroleum Exploration andDevelopment, v. 39, no. 1, p. 75–81. doi:10.1016/S1876-3804(12)60017-2
Hunt, J.M., 1995, Petroleum geochemistry and geology: W. H.Freeman, 743 p.
Jacob, H., 1967, Petrologie von asphaltiten und asphaltischenpyrobitumina: Erdol Und Kohle, v. 20, p. 393–400.
Jacob, H., 1985, Disperse solid bitumens as an indicator formigration and maturity in prospecting for oil and gas:Erdöl Und Kohle-Erdgas-Petrochemie, v. 38, no. 8, p. 365.
James, A.T., 1983, Correlation of natural gas by use of carbonisotopic distribution between hydrocarbon components:AAPG Bulletin, v. 67, no. 7, p. 1176–1191.
Jarvie, D.M., 2008. Unconventional Shale resource plays: Shale-gas and shale-oil opportunities, Fort Worth Business Pressmeeting.
Jarvie, D.M., Hill, R.J., Ruble, T.E., and Pollastro, R.M., 2007,Unconventional shale-gas systems: The MississippianBarnett Shale of north-central Texas as one model for ther-mogenic shale-gas assessment: AAPG Bulletin, v. 91, no. 4,p. 475–499. doi:10.1306/12190606068
Kinley, T.J., Cook, L.W., Breyer, J.A., Jarvie, D.M., and Busbey,A.B., 2008, Hydrocarbon potential of the Barnett Shale(Mississippian), Delaware Basin, west Texas and southeast-ern New Mexico: AAPG Bulletin, v. 92, no. 8, p. 967–991.doi:10.1306/03240807121
Korsch, R.J., Huazhao, M., Zhaocai, S., and Gorter, J.D., 1991,The Sichuan basin, southwest China: A late Proterozoic(Sinian) petroleum province: Precambrian Research, v. 54,no. 1, p. 45–63. doi:10.1016/0301-9268(91)90068-L
Kuhn, P., Primio, R.D., and Horsfield, B., 2010. Bulk composi-tion and phase behaviour of petroleum sourced by theBakken Formation of the Williston Basin. GeologicalSociety, London, Petroleum Geology Conference series, 7:1065–1077.
Laughrey, C.D., and Baldassare, F.J., 1998, Geochemistry andorigin of some natural gases in the Plateau Province, centralAppalachian Basin, Pennsylvania and Ohio: AAPG Bulletin,v. 82, no. 2, p. 317–335.
Leythaeuser, D., 1973, Effects of weathering on organic matter inshales: Geochimica Et Cosmochimica Acta, v. 37, no. 1, p.113–120. doi:10.1016/0016-7037(73)90249-4
Li, Y., Feng, Y., Liu, H., Zhang, L., and Zhao, S., 2013,Geological characteristics and resource potential of lacustrineshale gas in the Sichuan Basin, SW China: PetroleumExploration and Development, v. 40, no. 4, p. 454–460.doi:10.1016/S1876-3804(13)60057-9
Liang, D., Guo, T., Chen, J., Bian, L., and Zhao, Z., 2008,Some progresses on studies of hydrocarbon generation andaccumulation in marine sedimentary region, southern China(Part 1): Distribution of four suits of regional marinesource rocks: Marine Origin Petroleum Geology, v. 13, no.3, p. 1–16.
Liang, D., Guo, T., Chen, J., Bian, L., and Zhao, Z., 2009, Someprogresses on studies of hydrocarbon generation and accu-mulation in marine sedimentary region, southern China (Part2): Geochemical characteristics of four suits of regionalmarine source rocks, south China: Marine Origin PetroleumGeology, v. 14, no. 1, p. 1–15.
Littke, R., Klussmann, U., Krooss, B., and Leythaeuser, D.,1991, Quantification of loss of calcite, pyrite, and organicmatter due to weathering of Toarcian black shales and effectson kerogen and bitumen characteristics: Geochimica EtCosmochimica Acta, v. 55, no. 11, p. 3369–3378.doi:10.1016/0016-7037(91)90494-P
Liu, D., Song, Y., Xue, A., Li, Y., Luo, Z., Shen, X., Yang, X.,Zhang, Z., and Tao, S., 2000, Structural and natural gasaccumulation belt of the Sichuan Basin: Beijing, PetroleumIndustry Press, 107 p.
Liu, H., Wang, H., Liu, R., Zhao, Q., and Lin, Y., 2010, ChinaShale Gas Resources and Prospect Potential: Acta GeologicaSinica, v. 84, no. 9, p. 1374–1378.
Liu, S., Ma, W., Luba, J., Huang, W., Zeng, X., and Zhang, C.,2011, Characteristics of the shale gas reservoir rocks in theLower Silurian Longmaxi Formation, East Sichuan Basin,China: Acta Petrogica Sinica, v. 27, no. 8, p. 2239–2252.
Liu, Z., He, S., Quan, J., Zhou, H., and Ding, J., 2014, Drillingtechnology for the first shale gas horizontal well in WestSichuan: Oil Drilling & Production Technology, v. 36, no. 1,p. 18–22.
Long, P., Zhang, J., Li, Y., Tang, X., Cheng, L., Liu, Z., and Han,S., 2012, Reservoir-forming conditions and strategic selectfavorable area of shale gas in the Lower Paleozoic ofChongqing and its adjacent areas: Earth Science Frontiers,v. 19, no. 2, p. 221–243.
Loucks, R.G., and Ruppel, S.C., 2007, Mississippian BarnettShale: Lithofacies and depositional setting of a deep-watershale-gas succession in the Fort Worth Basin, Texas: AAPGBulletin, v. 91, no. 4, p. 579–601. doi:10.1306/11020606059
Lüders, V., Plessen, B., and Di Primio, R., 2012, Stable carbonisotopic ratios of CH4-CO2-bearing fluid inclusions in
20 J. Tan et al.
Dow
nloa
ded
by [
Uni
vers
ity o
f H
oust
on]
at 0
8:05
09
Febr
uary
201
5

fracture-fill mineralization from the Lower Saxony Basin(Germany) - A tool for tracing gas sources and maturity:Marine and Petroleum Geology, v. 30, no. 1, p. 174–183.doi:10.1016/j.marpetgeo.2011.10.006
Luo, C., Liu, S., Sun, W., Ran, B., Yong, Z., Yang, D., Zhang,X., Wang, S., Ye, Y., and Deng, B., 2014, Basic character-istics of shale gas in the Lower Cambrian NiutitangFormation in the Upper Yangtze Region: Taking NangaoSection in Danzhai as an example: Natural Gas Geoscience,v. 25, no. 3, p. 453–460.
Ma, Y., Cai, X., Zhao, P., Luo, Y., and Zhang, X., 2010,Distribution and further exploration of the large-mediumsized gas fields in Sichuan Basin: Acata Petrol Ei Sinica, v.31, no. 3, p. 347–354.
Ma, Y., Guo, X., Guo, T., Huang, R., Cai, X., and Li, G., 2007,The Puguang gas field: New giant discovery in the matureSichuan Basin, southwest China: Southwest China AAPGBulletin, v. 91, p. 627–643. doi:10.1306/11030606062
Ma, Y.S., Mu, C.L., Guo, X.S., Tan, Q.Y., and Yu, Q., 2006,Characteristic and framework of the Changxingian sedimen-tation in the northeastern Sichuan Basin (in Chinese withEnglish abstract): Geological Review, v. 52, no. 1, p. 25–39.
Martini, A.M., Walter, L.M., Budai, J.M., Ku, T.C.W., Kaiser, C.J., and Schoell, M., 1998, Genetic and temporal relationsbetween formation waters and biogenic methane: UpperDevonian Antrim Shale, Michigan Basin, USA:Geochimica Et Cosmochimica Acta, v. 62, no. 10, p. 1699–1720. doi:10.1016/S0016-7037(98)00090-8
Martini, A.M., Walter, L.M., Ku, T.C.W., Budai, J.M., McIntosh,J.C., and Schoell, M., 2003, Microbial production and mod-ification of gases in sedimentary basins: A geochemical casestudy from a Devonian shale gas play, Michigan basin:AAPG Bulletin, v. 87, no. 8, p. 1355–1375. doi:10.1306/031903200184
Marynowski, L., Kurkiewicz, S., Rakociński, M., and Simoneit,B.R., 2011, Effects of weathering on organic matter: I.Changes in molecular composition of extractable organiccompounds caused by paleoweathering of a LowerCarboniferous (Tournaisian) marine black shale: ChemicalGeology, v. 285, no. 1–4, p. 144–156. doi:10.1016/j.chemgeo.2011.04.001
Miceli Romero, A., and Philp, R.P., 2012, Organic geochemistryof the Woodford Shale, southeastern Oklahoma: How vari-able can shales be?: AAPG Bulletin, v. 96, no. 3, p. 493–517. doi:10.1306/08101110194
Montgomery, S.L., Jarvie, D.M., Bowker, K.A., and Pollastro, R.M., 2005, Mississippian Barnett Shale, Fort Worth basin,north-central Texas: Gas-shale play with multi–trillioncubic foot potential: AAPG Bulletin, v. 89, no. 2, p. 155–175. doi:10.1306/09170404042
National Bureau of Statistics, P., and Energy Bureau P., editors,1991-2010, China energy statistical yearbook: Beijing, ChinaStatistics Press.
Nie, H., Zhang, J., and Li, Y., 2011, Accumulation conditions ofthe Lower Cambrian shale gas in the Sichuan Basin and itsperiphery: Acta Petrolei Sinica, v. 32, no. 6, p. 959–967.
Pawlewicz, M.J., and King, J.D., 1992, Vitrinite and solid bitu-men reflectance: some correlations and applications, in L.B.Magoon, ed., The petroleum system – status of research andmethods, 1992: U.S. Geological Survey Bulletin 2007, p.58–60.
Pelet, R., 1985, Evaluation quantitative des produits formés lorsde l’évolution géochimique de la matière organique: RevueDe L’institut Français Du Pétrole, v. 40, p. 551–562.
Peters, K.E., and Cassa, M.R., 1994, Applied source rock geo-chemistry, in Magoon, L.B., and Dow, W.G., eds., Thepetroleum system – from source to trap: AAPG Memoir, v.60, p. 93–120.
Peters, K.E., Walters, C., and Moldowan, J., 2005, TheBiomarker Guide, Volume 1: Biomarkers and isotopes inthe environment and human history: New York, CambridgeUniversity Press, 471 p.
Petsch, S., Berner, R., and Eglinton, T., 2000, A field study of thechemical weathering of ancient sedimentary organic matter:Organic Geochemistry, v. 31, no. 5, p. 475–487.doi:10.1016/S0146-6380(00)00014-0
Prinzhofer, A., Mello, M.R., and Takaki, T., 2000, Geochemicalcharacterization of natural gas: A physical multivariableapproach and its applications in maturity and migration esti-mates: AAPG Bulletin, v. 84, no. 8, p. 1152–1172.
Qiu, X., Yang, B., and Hu, M., 2013, Characteristics of shalereservoirs and gas content of Wufeng-Longmaxi formation inthe Middle Yangtze Region: Natural Gas Geoscience, v. 24,no. 6, p. 1274–1283.
Rodriguez, N.D., and Philp, R.P., 2010, Geochemical character-ization of gases from the Mississippian Barnett Shale, FortWorth Basin, Texas: AAPG Bulletin, v. 94, no. 11, p. 1641–1656. doi:10.1306/04061009119
Ross, D.J.K., and Bustin, R.M., 2008, Characterizing the shalegas resource potential of Devonian–Mississippian strata inthe Western Canada sedimentary basin: Application of anintegrated formation evaluation: AAPG Bulletin, v. 92, no. 1,p. 87–125. doi:10.1306/09040707048
Santamaria, O., and Horsfield, B., 2004, Gas generation potentialof Upper Jurassic (Tithonian) source rocks in the Sonda deCampeche, Mexico. The circum-Gulf of Mexico and theCaribbean: Hydrocarbon habitats, basin formation, andplate tectonics:: AAPG Memoir, v. 79, p. 349–363.
Schenk, H., and Horsfield, B., 1998, Using natural maturationseries to evaluate the utility of parallel reaction kineticsmodels: An investigation of Toarcian shales andCarboniferous coals, Germany: Organic Geochemistry, v.29, no. 1–3, p. 137–154. doi:10.1016/S0146-6380(98)00139-9
Schenk, H.J., Di Primio, R., and Horsfield, B., 1997, The con-version of oil into gas in petroleum reservoirs. Part 1:Comparative kinetic investigation of gas generation fromcrude oils of lacustrine, marine and fluviodeltaic origin byprogrammed-temperature closed-system pyrolysis: OrganicGeochemistry, v. 26, no. 7–8, p. 467–481. doi:10.1016/S0146-6380(97)00024-7
Schoell, M., 1980, The hydrogen and carbon isotopic composi-tion of methane from natural gases of various origins:Geochimica Et Cosmochimica Acta, v. 44, no. 5, p. 649–661. doi:10.1016/0016-7037(80)90155-6
Song, X., Wang, S., Cao, T., and Song, Z., 2013, The mathaneadsorption features of Cambrian shales in the YangtzePlatform: Acta Geologica Sinica, v. 87, no. 7, p. 1041–1048.
Stahl, W., 1974, Carbon isotope fractionations in natural gases:Nature, v. 251, no. 5471, p. 134–135. doi:10.1038/251134a0
Stahl, W.J., and Carey, B.D., Jr, 1975, Source-rock identificationby isotope analyses of natural gases from fields in the ValVerde and Delaware basins, west Texas: Chemical Geology,v. 16, no. 4, p. 257–267. doi:10.1016/0009-2541(75)90065-0
Strąpoć, D., Mastalerz, M., Schimmelmann, A., Drobniak, A.,and Hasenmueller, N.R., 2010, Geochemical constraints onthe origin and volume of gas in the New Albany Shale(Devonian–Mississippian), eastern Illinois Basin: AAPG
International Geology Review 21
Dow
nloa
ded
by [
Uni
vers
ity o
f H
oust
on]
at 0
8:05
09
Febr
uary
201
5

Bulletin, v. 94, no. 11, p. 1713–1740. doi:10.1306/06301009197
Tan, J., Horsfield, B., Fink, R., Krooss, B., Schulz, H.-M.,Rybacki, E., Zhang, J., Boreham, C.J., Van Graas, G., andTocher, B.A., 2014a, Shale gas potential of the major marineshale formations in the Upper Yangtze Platform, SouthChina, Part III: Mineralogical, Lithofacial, Petrophysical,and Rock Mechanical Properties: Energy & Fuels, v. 28,no. 4, p. 2322–2342. doi:10.1021/ef4022703
Tan, J., Horsfield, B., Mahlstedt, N., Zhang, J., Diprimio, R., Vu,T.A.T., Boreham, C.J., Van Graas, G., and Tocher, B.A.,2013, Physical properties of petroleum formed duringmaturation of Lower Cambrian shale in the upper YangtzePlatform, South China, as inferred from PhaseKinetics mod-elling: Marine and Petroleum Geology, v. 48, p.47–56.10.1016/j.marpetgeo.2013.07.013
Tan, J., Weniger, P., Krooss, B., Merkel, A., Horsfield, B., Zhang,J., Boreham, C.J., Graas, G.V., and Tocher, B.A., 2014b,Shale gas potential of the major marine shale formations inthe Upper Yangtze Platform, South China, Part II methanesorption capacity.: Fuel, v. 129, p. 204–218.
Tissot, B.P., and Welte, D.H., 1984, Petroleum formation andoccurrence: Berlin, Springer-Verlag, p. 169–174.
Vu, T.A.T., 2008. Origin and Maturation of organic Matter inNew Zealands Coals, Universitätsbibliothek, Dissertation.
Wang, G., and Carr, T.R., 2013, Organic-rich MarcellusShale lithofacies modeling and distribution patternanalysis in the Appalachian Basin: AAPG Bulletin, v. 97,no. 12 p. 2173–2205.
Wang, L., Jiu, K., Zeng, W., Fu, J., and Zhao, S., 2013a,Characteristics of Lower Cambrian marine black shales andevaluation of shale gas prospective area in Qianbei area,Upper Yangtze Region: Acta Petrological Sinica, v. 29, no.9, p. 3263–3278.
Wang, L., and Wang, Q., 2013, Formation conditions andexplorative directions of Jurassic shale gas in FulingSichuan Basin: Journal of Northwest University, v. 43, no.5, p. 757–764.
Wang, L., Zou, C., Deng, P., Chen, S., Zhang, Q., Xu, B., and Li,H., 2009a, Geochemical evidence of shale gas existed in theLower Paleozoic Sichuan Basin: Natural Gas Industry, v. 29,no. 5, p. 59–62.
Wang, Q., Liu, R., Wei, X., Ni, K., and Gao, H., 2013b, Geologiccondition of shale gas accumulation in continental facies andmain controlling factors of enrichment and high production:Taking Yuanba District as an example: Fault-Block Oil &Gas Field, v. 06, p. 698–703.
Wang, S., Chen, G., Dong, D., Yang, G., Lu, Z., Xu, Y., andHuang, Y., 2009b, Accumulation conditions and exploitationprospect of shale gas in the Lower Paleozoic Sichuan Basin:Natural Gas Industry, v. 29, no. 5, p. 51–58.
Wang, S., Zou, C., Dong, D., Wang, Y., Huang, J., and Guo, Z.,2014, Biogenic silica of organic-rich shale in Sichuan Basinand its significance for shale gas: Acta ScientiarumNaturalium Universitatis Pekinensis. doi:10.13209/j.0479-8023.2014.079
Wildman, R.A., Berner, R.A., Petsch, S.T., Bolton, E.W., Eckert,J.O., Mok, U., and Evans, J.B., 2004, The weathering ofsedimentary organic matter as a control on atmospheric O2:I. Analysis of a black shale: American Journal of Science, v.304, no. 3, p. 234–249. doi:10.2475/ajs.304.3.234
Wu, H., Yao, S., Jiao, K., Hu, W., Yin, H., and Gu, D., 2013,Shale-gas exploration prospect of Longtan Formation in theLower Yangtze area of China: Journal of China Coal Society,v. 38, no. 5, p. 870–876.
Xu, Y., Shen, P., and Li, Y., 1989, The oldest gas pool of China -Weiyuan Sinian gas pool: Sichuan Province: ActaSedimentologica Sinica, v. 7, no. 4. p. 3–13.
Yin, C., Wang, T., Wang, S., and Lin, F., 2001, Differencesbetween Kerogen and oil cracked gases in Sinian reservoirof Weiyuan and Ziyang area: Acta Sedimentologica Sinica,v. 19, no. 1, p. 156–164.
Yu, C., Bao, S., Qin, Q., Nie, H., Zhu, H., and Shao, X., 2012,Analysis of reservoir-forming conditions of shale gas inLower Silurian of southeast Sichuan area: Journal of Oiland Gas Technology, v. 34, no. 2, p. 41–46.
Zhang, B., Zhao, Z., Zhang, S., and Chen, J., 2007a, Discussionon marine source rocks thermal evolvement patterns in theTarim Basin and Sichuan Basin, west China: ChineseScience Bulletin, v. 52, no. zk1, p. 141–149.
Zhang, J., Jiang, S., Tang, X., Zhang, P., Tang, Y., and Jin, T.,2009, Accumulation types and resources characteristics ofshale gas in China: Natural Gas Industry, v. 29, no. 12, p.109–114.
Zhang, L., Wei, G., Han, L., Wang, L., and Wang, D., 2008,Evaluation of the high and over matured Sinian-LowerCambrian Paleozoic source rocks in the Sichuan Basin:Petroleum Geology & Experiment, v. 30, no. 3, p. 286–290.
Zhang, L., Wei, G., Li, X., Wang, Z., and Xiao, X., 2007b, Thethermal history of Sinian-Lower Paleozoic high/over maturesource rock in Sichuan Basin: Natural Gas Geoscience, v. 18,no. 5, p. 726–731.
Zhang, Z., Hu, F., Sheng, J., Rao, W., and Li, W., 2013, Mineralcompositions and organic matter occurrence modes of LowerSilurian Longmaxi Formation of Sichuan Basin: Journal ofChina Coal Society, v. 38, no. 5, p. 48–53.
Zhang, Z., Yang, L., Teng, J., and Badal, J., 2011, An over-view of the earth crust under China: Earth-ScienceReviews, v. 104, no. 1–3, p. 143–166. doi:10.1016/j.earscirev.2010.10.003
Zhao, H., Givens, N.B., and Curtis, B., 2007, Thermal maturityof the Barnett Shale determined from well-log analysis:AAPG Bulletin, v. 91, no. 4, p. 535–549. doi:10.1306/10270606060
Zheng, H., Gao, B., Peng, Y., Nie, H., and Yang, F., 2013a,Sedimentary evolution and shale gas exploration directionof the Lower Silurian in Middle-Upper Yangtze area: Journalof Palaeogeography, v. 15, no. 5, p. 645–656.
Zheng, R., He, L., Liang, X., and Xu, W., 2013b, Formingconditions of shale gas (oil) plays in the Lower JurassicDa’anzhai member in the eastern Sichuan Basin: NaturalGas Industry, v. 33, no. 12, p. 30–40.
Zhou, Q., Song, N., Wang, C., Li, B., Wang, X., Peng, C., andRen, Y., 2014, Geological evaluation and exploration pro-spect of Huayuan Shale Gas Block in Hunan Province:Natural Gas Geoscience, v. 25, no. 1, p. 130–140.
Zhu, G., Zhang, S., Liang, Y., Ma, Y., Dai, J., Li, J., and Zhou,G., 2006, The characteristics of natural gas in Sichuanbasin and its sources: Earth Science Frontiers, v. 13, no. 2,p. 243–248.
Zou, C., Dong, D., Wang, S., Li, J., Li, X., Wang, Y., Li, D., andCheng, K., 2010, Geological characteristics and resourcepotential of shale gas in China: Petroleum Exploration andDevelopment, v. 37, no. 6, p. 641–653. doi:10.1016/S1876-3804(11)60001-3
Zou, C., Dong, D., Yang, H., Wang, Y., Huang, J., Wang, S., andFu, C., 2011, Conditions of shale gas accumulation andexploration practices in China: Natural Gas Industry, v. 31,no. 12, p. 26–39.
22 J. Tan et al.
Dow
nloa
ded
by [
Uni
vers
ity o
f H
oust
on]
at 0
8:05
09
Febr
uary
201
5