Embed Size (px)
Citation preview

Beta Draft Confidential
NavisCore Troubleshooting Guide
Product Code: 80137Revision 03
July, 2003
ii7/17/03 NavisCore Troubleshooting Guide
Beta Draft Confidential
Copyright© 2003 Lucent Technologies. All Rights Reserved.
This material is protected by the copyright laws of the United States and other countries. It may not be reproduced, distributed, or altered in any fashion by any entity (either internal or external to Lucent Technologies), except in accordance with applicable agreements, contracts or licensing, without the express written consent of Lucent Technologies.
For permission to reproduce or distribute, please contact: Technical Publications, Integrated Network Solutions/Core Switching Division at 978-692-2600.
Notice. Every effort was made to ensure that the information in this document was complete and accurate at the time of printing. However, information is subject to change.
Trademarks. IP Navigator, Navis, NavisXtend, Navis iEngineer, NavisCore, and GX 550 are trademarks of Lucent Technologies. CBX 500 and B-STDX 9000 are registered trademarks of Lucent Technologies. Other trademarks and trade names mentioned in this document belong to their respective owners.
Limited Warranty. Lucent Technologies provides a limited warranty to this product. For more information, see the software license agreement in this document.
Ordering Information. To order copies of this document, use the online ordering instructions presented later in this guide.
Support Telephone Numbers. For technical support and other services, see the customer support contact information in the “About This Guide” section of this document.
Beta Draft Confidential
LUCENT TECHNOLOGIES END-USER LICENSE AGREEMENT
LUCENT TECHNOLOGIES IS WILLING TO LICENSE THE ENCLOSED SOFTWARE AND ACCOMPANYING USER DOCUMENTATION (COLLECTIVELY, THE “PROGRAM”) TO YOU ONLY UPON THE CONDITION THAT YOU ACCEPT ALL OF THE TERMS AND CONDITIONS OF THIS LICENSE AGREEMENT. PLEASE READ THE TERMS AND CONDITIONS OF THIS LICENSE AGREEMENT CAREFULLY BEFORE OPENING THE PACKAGE(S) OR USING THE LUCENT SWITCH(ES) CONTAINING THE SOFTWARE, AND BEFORE USING THE ACCOMPANYING USER DOCUMENTATION. OPENING THE PACKAGE(S) OR USING THE LUCENT SWITCH(ES) CONTAINING THE PROGRAM WILL INDICATE YOUR ACCEPTANCE OF THE TERMS OF THIS LICENSE AGREEMENT. IF YOU ARE NOT WILLING TO BE BOUND BY THE TERMS OF THIS LICENSE AGREEMENT, LUCENT IS UNWILLING TO LICENSE THE PROGRAM TO YOU, IN WHICH EVENT YOU SHOULD RETURN THE PROGRAM WITHIN TEN (10) DAYS FROM SHIPMENT TO THE PLACE FROM WHICH IT WAS ACQUIRED, AND YOUR LICENSE FEE WILL BE REFUNDED. THIS LICENSE AGREEMENT REPRESENTS THE ENTIRE AGREEMENT CONCERNING THE PROGRAM BETWEEN YOU AND LUCENT, AND IT SUPERSEDES ANY PRIOR PROPOSAL, REPRESENTATION OR UNDERSTANDING BETWEEN THE PARTIES.
1. License Grant. Lucent hereby grants to you, and you accept, a non-exclusive, non-transferable license to use the computer software, including all patches, error corrections, updates and revisions thereto in machine-readable, object code form only (the “Software”), and the accompanying User Documentation, only as authorized in this License Agreement. The Software may be used only on a single computer owned, leased, or otherwise controlled by you; or in the event of inoperability of that computer, on a backup computer selected by you. You agree that you will not pledge, lease, rent, or share your rights under this License Agreement, and that you will not, without Lucent’s prior written consent, assign or transfer your rights hereunder. You agree that you may not modify, reverse assemble, reverse compile, or otherwise translate the Software or permit a third party to do so. You may make one copy of the Software and User Documentation for backup purposes. Any such copies of the Software or the User Documentation shall include Lucent’s copyright and other proprietary notices. Except as authorized under this paragraph, no copies of the Program or any portions thereof may be made by you or any person under your authority or control.
2. Lucent’s Rights. You agree that the Software and the User Documentation are proprietary, confidential products of Lucent or Lucent’s licensor protected under US copyright law and you will use your best efforts to maintain their confidentiality. You further acknowledge and agree that all right, title and interest in and to the Program, including associated intellectual property rights, are and shall remain with Lucent or Lucent’s licensor. This License Agreement does not convey to you an interest in or to the Program, but only a limited right of use revocable in accordance with the terms of this License Agreement.
NavisCore Troubleshooting Guide 7/17/03iii
Beta Draft Confidential
3. License Fees. The license fees paid by you are paid in consideration of the license granted under this License Agreement.
4. Term. This License Agreement is effective upon your opening of the package(s) or use of the switch(es) containing Software and shall continue until terminated. You may terminate this License Agreement at any time by returning the Program and all copies or portions thereof to Lucent. Lucent may terminate this License Agreement upon the breach by you of any term hereof. Upon such termination by Lucent, you agree to return to Lucent the Program and all copies or portions thereof. Termination of this License Agreement shall not prejudice Lucent’s rights to damages or any other available remedy.
5. Limited Warranty. Lucent warrants, for your benefit alone, for a period of 90 days from the date of shipment of the Program by Lucent (the “Warranty Period”) that the program diskettes in which the Software is contained are free from defects in material and workmanship. Lucent further warrants, for your benefit alone, that during the Warranty Period the Program shall operate substantially in accordance with the User Documentation. If during the Warranty Period, a defect in the Program appears, you may return the Program to the party from which the Program was acquired for either replacement or, if so elected by such party, refund of amounts paid by you under this License Agreement. You agree that the foregoing constitutes your sole and exclusive remedy for breach by Lucent of any warranties made under this Agreement. EXCEPT FOR THE WARRANTIES SET FORTH ABOVE, THE PROGRAM IS LICENSED “AS IS”, AND LUCENT DISCLAIMS ANY AND ALL OTHER WARRANTIES, WHETHER EXPRESS, IMPLIED OR STATUTORY, INCLUDING, WITHOUT LIMITATION, ANY IMPLIED WARRANTIES OF MERCHANTABILITY OR FITNESS FOR A PARTICULAR PURPOSE AND ANY WARRANTIES OF NONINFRINGEMENT.
6. Limitation of Liability. Lucent’s cumulative liability to you or any other party for any loss or damages resulting from any claims, demands, or actions arising out of or relating to this License Agreement shall not exceed the greater of: (i) ten thousand US dollars ($10,000) or (ii) the total license fee paid to Lucent for the use of the Program. In no event shall Lucent be liable for any indirect, incidental, consequential, special, punitive or exemplary damages or lost profits, even if Lucent has been advised of the possibility of such damages.
iv7/17/03 NavisCore Troubleshooting Guide

Beta Draft Confidential
7. Proprietary Rights Indemnification. Lucent shall at its expense defend you against and, subject to the limitations set forth elsewhere herein, pay all costs and damages made in settlement or awarded against you resulting from a claim that the Program as supplied by Lucent infringes a United States copyright or a United States patent, or misappropriates a United States trade secret, provided that you: (a) provide prompt written notice of any such claim, (b) allow Lucent to direct the defense and settlement of the claim, and (c) provide Lucent with the authority, information, and assistance that Lucent deems reasonably necessary for the defense and settlement of the claim. You shall not consent to any judgment or decree or do any other act in compromise of any such claim without first obtaining Lucent’s written consent. In any action based on such a claim, Lucent may, at its sole option, either: (1) obtain for you the right to continue using the Program, (2) replace or modify the Program to avoid the claim, or (3) if neither (1) nor (2) can reasonably be effected by Lucent, terminate the license granted hereunder and give you a prorata refund of the license fee paid for such Program, calculated on the basis of straight-line depreciation over a five-year useful life. Notwithstanding the preceding sentence, Lucent will have no liability for any infringement or misappropriation claim of any kind if such claim is based on: (i) the use of other than the current unaltered release of the Program and Lucent has provided or offers to provide such release to you for its then current license fee, or (ii) use or combination of the Program with programs or data not supplied or approved by Lucent to the extent such use or combination caused the claim.
8. Export Control. You agree not to export or disclose to anyone except a United States national any portion of the Program supplied by Lucent without first obtaining the required permits or licenses to do so from the US Office of Export Administration, and any other appropriate government agency.
9. Governing Law. This License Agreement shall be construed and governed in accordance with the laws and under the jurisdiction of the Commonwealth of Massachusetts, USA. Any dispute arising out of this Agreement shall be referred to an arbitration proceeding in Boston, Massachusetts, USA by the American Arbitration Association.
10. Miscellaneous. If any action is brought by either party to this License Agreement against the other party regarding the subject matter hereof, the prevailing party shall be entitled to recover, in addition to any other relief granted, reasonable attorneys’ fees and expenses of arbitration. Should any term of this License Agreement be declared void or unenforceable by any court of competent jurisdiction, such declaration shall have no effect on the remaining terms hereof. The failure of either party to enforce any rights granted hereunder or to take action against the other party in the event of any breach hereunder shall not be deemed a waiver by that party as to subsequent enforcement of rights or subsequent actions in the event of future breaches.
NavisCore Troubleshooting Guide 7/17/03v

Beta Draft Confidential
vi7/17/03 NavisCore Troubleshooting Guide
Beta Draft Confidential
Contents
About This GuideWhat You Need to Know........................................................................................... xxiReading Path .............................................................................................................xxii
NMS Documentation..........................................................................................xxiiSwitch Software Documentation.......................................................................xxiiiDocumentation for New Modules ..................................................................... xxiv
How to Use This Guide............................................................................................ xxivWhat’s New in This Guide?...................................................................................... xxvConventions ............................................................................................................. xxviRelated Documents .................................................................................................xxvii
Lucent...............................................................................................................xxviiThird Party........................................................................................................xxvii
Ordering Printed Manuals Online..........................................................................xxviiiCustomer Comments................................................................................................ xxixTechnical Support .................................................................................................... xxix
Chapter 1 Introduction to Network TroubleshootingKnow Your Network Components ............................................................................1-1Know Your Troubleshooting Tools ...........................................................................1-3Have a Troubleshooting Process in Place..................................................................1-4
Identify the Problem............................................................................................1-5Verify the Problem ..............................................................................................1-8Isolate the Problem..............................................................................................1-9Take Corrective Action .......................................................................................1-9Troubleshooting Process Flowchart ..................................................................1-10
What’s Next? ...........................................................................................................1-11
Chapter 2 Troubleshooting Frame Relay ProblemsTroubleshooting Frame Relay Physical Ports............................................................2-2
Identifying Frame Relay Physical Port Problems ...............................................2-2Frame Relay Back Panel Physical Port Status..............................................2-2Frame Relay Front Panel Physical Port LEDs..............................................2-4Frame Relay Physical Port Traps..................................................................2-8
NavisCore Troubleshooting Guide rvii
Contents
Beta Draft Confidential
Verifying Frame Relay Physical Port Problems..................................................2-9Verifying Problems for Channelized Physical Ports ..................................2-12
Isolating Frame Relay Physical Port Problems .................................................2-14Diagnostic Tests..........................................................................................2-14Loopback Tests ...........................................................................................2-16Loopback Testing Examples.......................................................................2-17
Correcting Frame Relay Physical Port Problems ..............................................2-19Troubleshooting Frame Relay Logical Ports ...........................................................2-20
Identifying Frame Relay Logical Port Problems...............................................2-20Verifying a Frame Relay Logical Port Problem................................................2-21
Is LMI Operator Status Up?........................................................................2-23Are DTE/DCE Errors Present? ...................................................................2-24Is the Logical Port Transmitting and Receiving Frames at All?.................2-25Is the Logical Port Configured on a Physical Port Channel? .....................2-25
Isolating a Frame Relay Logical Port Problem .................................................2-26Running Diagnostics and Loopbacks to Isolate Logical Port Problems.....2-26Changing Logical Ports from UNI to NNI .................................................2-29
Correcting Frame Relay Logical Port Problems ...............................................2-29Frame Relay Logical Port Troubleshooting Flowchart .....................................2-30
Troubleshooting Frame Relay Trunks .....................................................................2-31Frame Relay Trunks ..........................................................................................2-31Identifying Frame Relay Trunk Problems.........................................................2-31
Frame Relay Trunk Colors .........................................................................2-32Frame Relay Trunk Traps ...........................................................................2-33
Verifying Frame Relay Trunk Problems ...........................................................2-34Frame Relay Trunk Summary Statistics .....................................................2-34Using ping to Verify Frame Trunk Problems .............................................2-37
Isolating Frame Relay Trunk Problems.............................................................2-38Correcting Frame Relay Trunk Problems .........................................................2-39
Troubleshooting Frame Relay PVCs .......................................................................2-40Identifying Frame Relay PVC Problems...........................................................2-40
Frame Relay PVC Traps .............................................................................2-40Customer Complaints .................................................................................2-41
Verifying Frame Relay PVC Problems .............................................................2-42Frame Relay PVC is Active........................................................................2-45PVC is Inactive ...........................................................................................2-49PVC is Invalid.............................................................................................2-52PVC is Unknown ........................................................................................2-52
Isolating Frame Relay PVC Problems...............................................................2-53Using the Circuit Path to Isolate Frame Relay PVC Problems...................2-53Using FECN and BECN Statistics to Isolate Problems..............................2-54Using Frames Discarded Statistics to Isolate a Problem ............................2-57Using PVC Loopback to Isolate Problems .................................................2-59
Correcting Frame Relay PVC Problems ...........................................................2-60Frame Relay PVC Troubleshooting Flowcharts ...............................................2-61
viii7/17/03 NavisCore Troubleshooting Guide
Contents
Beta Draft Confidential
Troubleshooting Frame Relay SVCs .......................................................................2-64Overview of the Frame Relay SVC Call Setup Procedure................................2-64Identifying Frame Relay SVC Problems...........................................................2-66
Frame Relay SVC Traps .............................................................................2-66Customer Complaints .................................................................................2-66
Verifying Frame Relay SVC Problems .............................................................2-67Verifying Frame Relay SVC Call Setup Problems.....................................2-67Verifying Active Frame Relay SVC Data Transmission Problems............2-69
Isolating Frame Relay SVC Problems...............................................................2-70View Attributes and Statistics for Failed Frame Relay SVCs ....................2-71Check Frame Relay SVC CUG Membership .............................................2-72Check Frame Relay SVC Port Security Screening.....................................2-72
Correcting Frame Relay SVC Problems ...........................................................2-72First-in First-out Block Limits on Channelized DS3/1and DS3/1/0 Modules (CBX 500)............................................................................2-73
Logical Port Limits for Channelized DS3/1 and DS3/1/0 Modules..................2-73FIFO Block Allocation......................................................................................2-74
Example 1: FIFO Block (Over Allocation Limits) .....................................2-74Example 2: FIFO Block (Within Allocation Limits)..................................2-75
Calculating FIFO Blocks...................................................................................2-75Using the get lport MIB Command ............................................................2-75Determining Time Slot Positions................................................................2-76Using the FIFO Conversion Table..............................................................2-77FIFO Conversion Table Examples .............................................................2-77
Chapter 3 Troubleshooting ATM ProblemsTroubleshooting ATM Physical Ports .......................................................................3-2
Identifying ATM Physical Port Problems ...........................................................3-2ATM Back Panel Physical Port Status .........................................................3-2ATM Front Panel Physical Port LEDs .........................................................3-5ATM DS1 and DS3 Physical Port Failures ..................................................3-9ATM OC-n/STM-n Physical Port Failures.................................................3-10ATM Physical Port Traps ...........................................................................3-12
Verifying ATM Physical Port Problems ...........................................................3-15Isolating ATM Physical Port Problems.............................................................3-18Correcting ATM Physical Port Problems..........................................................3-18
Troubleshooting ATM Logical Ports.......................................................................3-19Identifying ATM Logical Port Problems ..........................................................3-19Verifying an ATM Logical Port Problem .........................................................3-20
Verifying ILMI Problems ...........................................................................3-23Verifying SVC Signaling Problems............................................................3-25
Isolating an ATM Logical Port Problem...........................................................3-26Correcting ATM Logical Port Problems ...........................................................3-26ATM Logical Port Troubleshooting Flowchart.................................................3-27
NavisCore Troubleshooting Guide ix
Contents
Beta Draft Confidential
Troubleshooting ATM Trunks.................................................................................3-28About ATM Trunks...........................................................................................3-28Identifying ATM Trunk Problems ....................................................................3-28Verifying ATM Trunk Problems.......................................................................3-30
Using Trunk Status and Trunk Summary Statistics to Verify ATMTrunk Problems...........................................................................................3-30Using Control Channel Statistics to Verify ATM Trunk Problems............3-32Using the show tproto Command to Verify Trunk Problems.....................3-35Using PING to Verify ATM Trunk Problems ............................................3-36
Isolating ATM Trunk Problems ........................................................................3-37Correcting ATM Trunk Problems .....................................................................3-38
Troubleshooting Point-to-Point ATM PVCs ...........................................................3-39Identifying Point-to-Point ATM PVC Problems...............................................3-39
Point-to-Point ATM PVC Traps .................................................................3-39Customer Complaints .................................................................................3-41
Verifying Point-to-Point ATM PVC Problems .................................................3-42Point-to-Point ATM PVC Status and Summary Statistics..........................3-42NTM Statistics and NDC Statistics for Point-to-Point PVCs.....................3-51
Isolating Point-to-Point ATM PVC Problems...................................................3-53Using the Circuit Path to Isolate ATM PVC Problems ..............................3-53Using OAM Loopback Tests to Isolate ATM PVC Problems....................3-53
Correcting Point-to-Point ATM PVC Problems ...............................................3-55Point-to-Point ATM PVC Troubleshooting Flowcharts ...................................3-55
Troubleshooting Point-to-Multipoint ATM PVCs...................................................3-59Identifying PMP ATM PVC Problems .............................................................3-59
PMP ATM PVC Traps................................................................................3-59Customer Complaints .................................................................................3-60
Verifying PMP ATM PVC Problems................................................................3-60PMP ATM PVC Status and Summary Statistics ........................................3-60NTM Statistics and NDC Statistics for PMP PVCs ...................................3-65
Isolating PMP ATM PVC Problems .................................................................3-66Correcting PMP ATM PVC Problems ..............................................................3-66
Troubleshooting Point-to-Point ATM SVCs and SPVCs........................................3-67Overview of the ATM SVC and SPVC Call Setup Procedure..........................3-67
ATM SVC Call Setup .................................................................................3-67ATM SPVC Call Setup...............................................................................3-69
Identifying Point-to-Point ATM SVC and SPVC Problems .............................3-70Point-to-Point ATM SVC and SPVC Traps ...............................................3-70Customer Complaints .................................................................................3-71
Verifying Point-to-Point ATM SVC and SPVC Problems ...............................3-71Verifying Point-to-Point ATM SVC and SPVC Call Setup Problems.......3-71Verifying Active Point-to-Point ATM SVC and SPVC DataTransmission Problems...............................................................................3-75
x7/17/03 NavisCore Troubleshooting Guide
Contents
Beta Draft Confidential
Isolating Point-to-Point ATM SVC and SPVC Problems.................................3-78View Attributes and Statistics for Failed ATM SVCs and SPVCs ............3-80Checking ILMI and Signaling UNI Logical Port Attributes ......................3-81Check for QoS Problems ............................................................................3-81Check ATM SVC CUG Membership.........................................................3-82Check ATM SVC Port Security Screening.................................................3-82
Correcting Point-to-Point ATM SVC and SPVC Problems..............................3-82Troubleshooting PMP ATM SVCs and SPVCs Problems ......................................3-83
Identifying PMP ATM SVC Root-to-Leaf Connections...................................3-84Identifying PMP ATM SPVC Root-to-Leaf Connections ................................3-85
Troubleshooting QoS and Traffic Descriptor Problems ..........................................3-86Wrong Choice of QoS Class .............................................................................3-86Improperly Configured PCR, SCR, and MBS ..................................................3-87Improperly Configured CDV Tolerance ...........................................................3-89
Chapter 4 Troubleshooting IP Navigator ProblemsIdentifying IP Navigator Problems ............................................................................4-1Verifying IP Navigator Problems ..............................................................................4-2Isolating IP Navigator Problems................................................................................4-2IP Navigator Limitations............................................................................................4-3TCP/IP Programs .......................................................................................................4-3
ping Program .......................................................................................................4-3IP Source Address Selection in a public VPN..............................................4-3IP Source Address Selection in a private VPN.............................................4-4ping Extended Options ................................................................................4-4
traceroute Program ..............................................................................................4-6traceroute IP Address Selection ..............................................................4-6
IP Navigator Diagnostic Utilities...............................................................................4-7IP Trace Utility....................................................................................................4-7
Creating a Trace Profile ................................................................................4-8Starting a Trace...........................................................................................4-11Using the IP Trace Commands With IP VPNs ...........................................4-13Sample Trace Output ..................................................................................4-14IP Trace Command Syntax .........................................................................4-15
LSP Trace Utility...............................................................................................4-15ctr Command Syntax ..................................................................................4-16tr Command Syntax ....................................................................................4-17Sample LSP Trace Output ..........................................................................4-17
Label Switched Paths...............................................................................................4-19Overview ...........................................................................................................4-19LSP Call Signaling ............................................................................................4-20LSP Call Forwarding.........................................................................................4-21Identifying the IP Data Path ..............................................................................4-22Using LSPs over Frame Trunks ........................................................................4-23Using LSPs over OPTimum Cell Trunks ..........................................................4-23Understanding LSPs and Quality of Service.....................................................4-23LSP Forwarding Criteria ...................................................................................4-24MPT LSP and Point-to-point LSP Commands..................................................4-24
NavisCore Troubleshooting Guide xi
Contents
Beta Draft Confidential
Multicast LSPs ..................................................................................................4-25How a Multicast LSP is Created.................................................................4-26How to Identify the Leaves of a Multicast LSP..........................................4-26What Happens When a Multicast Member Joins or Leaves a Group.........4-26Why a Multicast LSP Becomes Inactive ....................................................4-27Multicast LSP Commands ..........................................................................4-27MPT LSP Problem Checklist......................................................................4-29
LSP Terms ...............................................................................................................4-31Examining LSP Data Paths......................................................................................4-33
How to Examine MPT LSP Data Paths.............................................................4-33Step 1: Verify that MPT LSPs are Operational ..........................................4-36Step 2: Identify the Ingress Switch .............................................................4-37Step 3: Identify the Ingress Card at the Ingress Switch..............................4-37Step 4: Identify the Ingress Circuit on the Ingress Card at the Ingress Switch ...................................................................................4-38Step 5: Identify the Root Switch of the Ingress Circuit ..............................4-39Step 6: Identify the Egress Circuit (OVc) From the Ingress Card to the Egress Card on the Ingress Switch ...................................................4-40Step 7: Identify the Egress Card From the Ingress Switch to the Transit Switch ...................................................................................4-42Step 8: Identify the Ingress Circuit (RVc) From the Egress Card on the Ingress Switch to the Ingress Card on the Transit Switch ..................................................................................4-44Step 9: Identify the Egress Circuit (OVc) From the Ingress Card to the Egress Card on the Transit Switch....................................................4-45Step 10: Identify the Ingress Circuit (RVc) From the Egress Card at the Transit Switch to the Ingress Card at the Egress Switch ..................4-46Step 11: Identify the Egress Circuit and the FE at the Root Switch...........4-47Step 12: Send IP Traffic Through the LSP Data Path to Validate IP Forwarding...........................................................................4-48
LSP Connection Failure Reasons.............................................................................4-49LSP Path Failure Reasons........................................................................................4-53LSP Flag Characteristics..........................................................................................4-54IP Forwarding ..........................................................................................................4-56
Routing Tables ..................................................................................................4-56How an IP Packet is Forwarded ........................................................................4-56Route Protocol Priority......................................................................................4-57Show IP Forwarding Statistics Console Command ..........................................4-58
show ip forward statistics ...........................................................................4-58TCP/IP Statistics ......................................................................................................4-70UDP Statistics ..........................................................................................................4-74Troubleshooting OSPF Trunks, LSAs, and Virtual Links.......................................4-75
OSPF Trunks .....................................................................................................4-75OSPF LSAs .......................................................................................................4-75OSPF Virtual Links ...........................................................................................4-76
xii7/17/03 NavisCore Troubleshooting Guide
Contents
Beta Draft Confidential
Chapter 5 Troubleshooting NMS ProblemsBasic Troubleshooting ...............................................................................................5-1
HP OpenView Problems .....................................................................................5-2NMS Problems ....................................................................................................5-2
Common NMS Installation Problems........................................................................5-3I am having problems seeing my external cdrom drive. .....................................5-3How much physical memory do I have? .............................................................5-3I am having trouble installing Solaris 7...............................................................5-4How do I copy Lucent switch software from a floppy to my NMS? ..................5-4How do I start NavisCore? ..................................................................................5-5What is my password?.........................................................................................5-5What must I do before I shut down the NMS?....................................................5-5Where do I get an HP OpenView key? ...............................................................5-5I get the error “Cannot connect to database.”......................................................5-6What kind of hardware do I need? ......................................................................5-6What software versions do I need?......................................................................5-6What is a raw file-system partition?....................................................................5-6I cannot start Sybase! ..........................................................................................5-6I get a “cannot allocate shared memory” error when I start Sybase....................5-7How do I know if NavisCore is running?............................................................5-7I keep getting the message “access denied.” .......................................................5-7Error “1997” displays in the same window I started NavisCore.........................5-8How do I know the Sybase server is running? ..................................................5-10How do I start the Sybase server? .....................................................................5-10How do I shut down the Sybase server?............................................................5-10After upgrading Solaris, I cannot PRAM sync. The TFTP server isnot running. .......................................................................................................5-11How Can I Save My PVC Connections When Upgrading a Switch or Replacing an I/O Module? .............................................................5-12
Restrictions When Moving Circuits ...........................................................5-12Moving Circuits ..........................................................................................5-13
Common Operating Problems..................................................................................5-15My switch will not turn green on the network map. .........................................5-15I cannot ping my switch. ...................................................................................5-15I am locked out of a node that no one else is using...........................................5-16Performance is being degraded. ........................................................................5-16I cannot access a switch (red nodes). ................................................................5-17I cannot delete a switch from the database........................................................5-17What is the Lucent Alarm Browser and what does it do for me? .....................5-17I keep getting the error / or /var is full. .............................................................5-17How do I change a logical port name? ..............................................................5-18What is a core file?............................................................................................5-18I am in the correct directory and I can see the file, but I cannot execute it.......5-18How do I change the IP address of my machine? .............................................5-19What do I do if I get an error that the log device is full? ..................................5-19Heap Error 30.11 Displays ................................................................................5-20
Checking for Heap Errors on IOMs............................................................5-20Checking for Heap Errors on Processor Modules ......................................5-21
NavisCore Troubleshooting Guide xiii
Contents
Beta Draft Confidential
Error 30.3/Out of Memory Bank 9 Error Displays for Processor Modules ......5-22“A Conflicting Switch Object Was Found” Error After Deletingand Adding a Map Symbol................................................................................5-23
NMS-to-Network Connectivity Problems ...............................................................5-24Using Erase Standby When Swapping Processor Modules.....................................5-26
Before You Begin..............................................................................................5-26Module Swapping Process Overview................................................................5-27Using Erase Standby .........................................................................................5-27
Chapter 6 Working with the TACContacting the TAC ...................................................................................................6-1Technical Support Checklist ......................................................................................6-2Accessing The Problem Switch .................................................................................6-4
Appendix A Determining Calling and Called Endpoints for PVCs PVC Endpoint Rules .................................................................................................A-2Viewing Logical Port Interfaces ...............................................................................A-3Determining the Higher Service Name Binding.......................................................A-4
Appendix B Common Console Commands for Troubleshooting
Appendix C Using MIB Troubleshooting Tools About MIBs .............................................................................................................. C-2Troubleshooting with MIBs...................................................................................... C-2
MIB Structure..................................................................................................... C-3SNMP Structure of Management Information.......................................................... C-4
MIB Object Example.......................................................................................... C-4MIB Object Identifiers .............................................................................................. C-5Accessing MIB Directories and Objects................................................................... C-6MIB Command Format............................................................................................. C-6
Creating a MIB Command ................................................................................. C-7Common MIB Commands for Troubleshooting....................................................... C-8
Appendix D Quick MIB Group Reference Introduction...............................................................................................................D-2The Network Group ..................................................................................................D-3
Sample Command ..............................................................................................D-3Network Group Table.........................................................................................D-3
OSPF Autonomous System External Device and Host Group (For NMS paths).....D-4Sample Command ..............................................................................................D-4OSPF Autonomous System Group Table...........................................................D-4
The Node Group .......................................................................................................D-5Sample Command ..............................................................................................D-5Node Group Table ..............................................................................................D-5
The Card Group ........................................................................................................D-7Sample Command ..............................................................................................D-7Card Group Table...............................................................................................D-7
xiv7/17/03 NavisCore Troubleshooting Guide
Contents
Beta Draft Confidential
The Physical Port Group...........................................................................................D-9Sample Command ..............................................................................................D-9Physical Port Group Table .................................................................................D-9
The Logical Port Group ..........................................................................................D-11Sample Command ............................................................................................D-11Logical Port Group Table.................................................................................D-11
The Interfaces Group ..............................................................................................D-15Sample Command ............................................................................................D-15Interfaces Group Table.....................................................................................D-15
The Circuit Group ...................................................................................................D-16Sample Command ............................................................................................D-16Circuit Group Table..........................................................................................D-16
The Circuit Leaf Table............................................................................................D-18Sample Command ............................................................................................D-18Circuit Leaf Group Table .................................................................................D-18
The SMDS Circuit Table ........................................................................................D-19Sample Command ............................................................................................D-19SMDS Circuit Group Table..............................................................................D-19
The DS1 Configuration Table.................................................................................D-20Sample Command ............................................................................................D-20DS1 Current Group Table ................................................................................D-20
The DS1 Current Table...........................................................................................D-21Sample Command ............................................................................................D-21DS1 Current Group Table ................................................................................D-21
The DS1 Interval.....................................................................................................D-22Sample Command ............................................................................................D-22DS1 Interval Group Table ................................................................................D-22
The DS1 Total.........................................................................................................D-23Sample Command ............................................................................................D-23DS1 Total Group Table ....................................................................................D-23
The SMDS Address Group .....................................................................................D-24Sample Command ............................................................................................D-24SMDS Address Interface Group Table ............................................................D-24
The ISDN Address Group.......................................................................................D-25ISDN Address Interface Sample Command.....................................................D-25ISDN Address Interface Group Table ..............................................................D-25ISDN Caller ID Sample Command ..................................................................D-25ISDN Caller ID Group Table ...........................................................................D-25
The Service Name Binding Group..........................................................................D-26Sample Command ............................................................................................D-26Service Name Binding Group Table ................................................................D-26
The Software Group................................................................................................D-27Sample Command ............................................................................................D-27Software Group Table ......................................................................................D-27
Acronyms
Index
NavisCore Troubleshooting Guide xv

Contents
Beta Draft Confidential
List of Figures
Figure 1-1. Sample Network ..............................................................................1-2Figure 1-2. Troubleshooting Process Flowchart ..............................................1-10Figure 2-1. Frame Relay PPort on a B-STDX Switch Back Panel
Dialog Box.......................................................................................2-3Figure 2-2. Red Alarm Condition (B-STDX Switch) ........................................2-4Figure 2-3. Possible Blue, Red, and Yellow Alarm Conditions
(B-STDX Switch) ............................................................................2-5Figure 2-4. Alarm Status LEDs on a B-STDX...................................................2-6Figure 2-5. Sample Physical Port Sending and Receiving Frames ....................2-9Figure 2-6. Sample Physical Port Summary Statistics Dialog Box..................2-10Figure 2-7. Channelized DS3 Physical Port with a Failed Channel.................2-12Figure 2-9. Near-end Diag Loopback...............................................................2-17Figure 2-10. Near-end Loopback .......................................................................2-17Figure 2-11. DS1 Far-end CSU/DSU Loopback................................................2-18Figure 2-12. DS1 Far-end NI Loopback.............................................................2-18Figure 2-13. Sample Frame Relay Logical Port Summary Statistics
Dialog Box...................................................................................2-22Figure 2-14. Exchange of Status Enquiry and Status Response Frames............2-24Figure 2-15. DS0 Problem Test Points...............................................................2-27Figure 2-16. DS0 Near-End Loopback...............................................................2-27Figure 2-17. DS0 Far-End Loopbacks................................................................2-28Figure 2-18. Frame Relay Logical Port Troubleshooting Flowchart .................2-30Figure 2-19. Is the Trunk Transmitting Frames from A to B and Vice Versa? .2-35Figure 2-20. Sample Frame Relay Trunk Summary Statistics Dialog Box .......2-36Figure 2-21. Sample Frame Trunk Test Points ..................................................2-38Figure 2-22. Sample Show All PVCs Dialog Box (Frame Relay) .....................2-43Figure 2-23. PVC Fails Due to Frame Trunk Failure.........................................2-45Figure 2-24. Sample Circuit Summary Statistics Dialog Box (Frame Relay) ...2-46Figure 2-25. Using FECN and BECN to Isolate a Problem (1st Example) .......2-55Figure 2-26. Using FECN and BECN to Isolate a Problem (2nd Example) ......2-56Figure 2-27. Frame Relay PVC with No Congestion.........................................2-58Figure 2-28. PVC Endpoint A Set to Local, Endpoint B Set to None ...............2-59Figure 2-29. PVC Endpoint A Set to None, Endpoint B Set to Local ...............2-59Figure 2-30. PVC Endpoint A Set to Remote, Endpoint B Set to None ............2-60Figure 2-31. PVC Endpoint A Set to None, Endpoint B Set to Remote ............2-60Figure 2-32. Troubleshooting an Inactive Frame Relay PVC............................2-61Figure 2-33. Troubleshooting an Active Frame Relay PVC With
Performance Issues ......................................................................2-62Figure 2-34. Troubleshooting an Active Frame Relay PVC With No
Endpoint Communication............................................................2-63Figure 2-35. Simplified View of Frame Relay SVC Connection
Establishment Process .................................................................2-65Figure 2-36. Sample Show All Failed SVCs Dialog Box (Frame Relay) ..........2-67Figure 2-37. Sample Show All Active SVCs Dialog Box (Frame Relay) .........2-69
xvi7/17/03 NavisCore Troubleshooting Guide
Contents
Beta Draft Confidential
Figure 2-38. Possible Frame Relay SVC Problem Points ..................................2-70Figure 3-1. ATM Physical Ports on a CBX 500.................................................3-3Figure 3-2. ATM Physical Ports on a GX 550 ...................................................3-4Figure 3-3. Red Alarm Condition (CBX 500 Switch)........................................3-5Figure 3-4. Possible Blue, Red, and Yellow Alarm Conditions
(CBX 500 Switch) ...........................................................................3-6Figure 3-5. Alarm Status LEDs on a CBX 500 ..................................................3-7Figure 3-6. Alarm Status LEDs on a GX 550 ....................................................3-8Figure 3-7. GX 550 Switch in a Traditional Core Transmission Network ......3-10Figure 3-8. GX 550 Switch Connected Directly to DWDM Equipment .........3-10Figure 3-9. Sample Physical Port Sending and Receiving Cells......................3-15Figure 3-10. Sample Physical Port Summary Statistics Dialog Box (CBX)......3-16Figure 3-11. Show All Logical Ports in Switch Dialog Box..............................3-21Figure 3-12. Sample ATM Logical Port Summary Statistics Dialog Box .........3-22Figure 3-13. ILMI Polling Process.....................................................................3-24Figure 3-14. ILMI/Signaling/OAM Attributes...................................................3-25Figure 3-15. ATM Logical Port Troubleshooting Flowchart .............................3-27Figure 3-16. Is the Trunk Transmitting Cells from A to B and Vice Versa? .....3-31Figure 3-17. Sample ATM Trunk Summary Statistics Dialog Box ...................3-31Figure 3-18. Sample Logical Port Control Channel Statistics Dialog Box........3-33Figure 3-19. Sample ATM Trunk Test Points....................................................3-37Figure 3-20. Sample Show All PVCs Dialog Box (ATM).................................3-43Figure 3-21. PVC Fails Due to ATM Trunk Failure ..........................................3-45Figure 3-22. Sample Circuit Summary Statistics Dialog Box (ATM) ...............3-46Figure 3-23. OAM Loopback Process From UNI/NNI Interface.......................3-54Figure 3-24. OAM Loopback Process Through Lucent Network......................3-54Figure 3-25. Troubleshooting an Inactive Point-to-Point ATM PVC................3-56Figure 3-26. Troubleshooting an Active Point-to-Point ATM PVC With
Performance Issues ......................................................................3-57Figure 3-27. Troubleshooting an Active Pt-to-Pt ATM PVC With No
Endpoint Communication............................................................3-58Figure 3-28. Sample Show All Point-to-Multiple Point Circuit Roots
Dialog Box...................................................................................3-61Figure 3-29. Sample Point-to-Multipoint Circuit Statistics Dialog Box
(CBX 500 Switch) .......................................................................3-63Figure 3-30. Address Registration......................................................................3-68Figure 3-31. Simplified View of Point-to-Point ATM SVC Connection
Establishment Process .................................................................3-69Figure 3-32. Sample Show All Failed SVCs Dialog Box (ATM)......................3-72Figure 3-33. Sample Show Failed SVC Attributes Dialog Box (ATM) ............3-74Figure 3-34. Sample Show All Active SVCs Dialog Box (ATM) .....................3-75Figure 3-35. Show All Point-to-Point SPVCs Dialog Box ................................3-77Figure 3-36. Possible Point-to-Point ATM SVC/SPVC Problem Points ...........3-79Figure 3-37. Show All Point-to-Multipoint SPVCs Dialog Box........................3-85Figure 3-38. Service Classes ..............................................................................3-87Figure 3-39. Leaky Bucket Algorithm ...............................................................3-88Figure 4-1. MPT LSP Data Path Network........................................................4-34Figure C-1. SNMP MIB tree hierarchy.............................................................. C-3
NavisCore Troubleshooting Guide 7/17/03xvii
Contents
Beta Draft Confidential
List of Tables
Table 1-1. LED/Physical Port Colors Displayed Through the NMS............... 1-5Table 1-2. Trap Alarm Colors.......................................................................... 1-7Table 1-3. Network Map Object Colors........................................................... 1-8Table 2-1. Alarm Type Values (Frame Relay Physical Ports)......................... 2-8Table 2-2. Frame Relay Physical Port Summary Statistics............................ 2-11Table 2-3. Frame Trunk Color Status Indicators ........................................... 2-32Table 2-4. Troubleshooting Actions Based on Circuit Summary Statistics... 2-47Table 2-5. Inactive Frame Relay PVC Fail Reasons...................................... 2-49Table 2-6. FIFO Blocks for Fractional T1s.................................................... 2-74Table 2-7. FIFO Conversion Table ................................................................ 2-77Table 3-1. Alarm Type Values (ATM Physical Ports) .................................. 3-12Table 3-2. ATM Physical Port Summary Statistics ....................................... 3-17Table 3-3. Sample ATM Logical Port Traps ................................................. 3-19Table 3-4. ATM Trunk Color Status Indicators............................................. 3-29Table 3-5. Logical Port Control Channel Statistics ....................................... 3-33Table 3-6. Troubleshooting Actions Based on Circuit Summary Statistics... 3-47Table 3-7. Inactive ATM PVC Fail Reasons ................................................. 3-48Table 3-8. Troubleshooting Actions Based on PMP Circuit Statistics .......... 3-64Table 3-9. Show All Point-to-Point SPVCs Fields ........................................ 3-78Table 4-1. Acronym Terminology Changes................................................... 4-19Table 4-2. MPT LSP and Point-to-point Commands..................................... 4-24Table 4-3. Multicast LSP Commands ............................................................ 4-28Table 4-4. MPT LSP Problem Checklist........................................................ 4-29Table 4-5. LSP Terms/Acronyms ................................................................. 4-31Table 4-6. MPT LSP Data Path Steps to Follow .......................................... 4-35Table 4-7. show ip route Fields...................................................................... 4-38Table 4-8. show mpt rootnodes Fields ........................................................... 4-40Table 4-9. show mpt rsvcarray Fields ............................................................ 4-41Table 4-10. show lport Fields........................................................................... 4-43Table 4-11. show mpt vcarray Fields............................................................... 4-44Table 4-12. show mpt vcarray Fields............................................................... 4-45Table 4-13. show mpt vcarray Fields............................................................... 4-46Table 4-14. LSP Connection Failure Reasons ................................................. 4-49Table 4-15. LSP Path Failure Reasons............................................................. 4-53Table 4-16. LSP Flags...................................................................................... 4-54Table 4-17. Route Protocol Priority ................................................................. 4-57Table 4-18. Logical Ports That Support IP Routing on the B-STDX
8000/9000 ..................................................................................... 4-59Table 4-19. Logical Ports That Support IP Routing on the CBX 500 ............. 4-59Table 4-20. Card Types with Number of Forwarding Engines........................ 4-60Table 4-21. show ip forward statistics Command Fields................................. 4-63Table 4-22. show tcp Command Fields............................................................ 4-71Table 4-23. show udp Command Fields .......................................................... 4-74Table 5-1. NMS Directories............................................................................. 5-1
xviii7/17/03 NavisCore Troubleshooting Guide
Contents
Beta Draft Confidential
Table 5-2. Causes for Error Code 1997 ........................................................... 5-8Table 5-3. Questions for Heap Errors on IOMs............................................. 5-20Table 5-4. Questions for Heap Errors on Processor Modules........................ 5-21Table 5-5. Connectivity Troubleshooting Solutions ...................................... 5-24Table 6-1. Technical Support Checklist........................................................... 6-2Table B-1. Common Console Commands for Troubleshooting ...................... B-1Table 3-1. MIB Terminology.......................................................................... C-2Table 3-2. Common MIB Commands for Troubleshooting............................ C-8Table D-1. Network Group Variables.............................................................. D-3Table D-2. OSPF Autonomous System Group Variables................................ D-4Table D-3. Node Group ................................................................................... D-5Table D-4. Card Group .................................................................................... D-7Table D-5. Physical Port Group....................................................................... D-9Table D-6. Logical Port Group ...................................................................... D-11Table D-7. Interfaces Group .......................................................................... D-15Table D-8. Circuit Group ............................................................................... D-16Table D-9. Circuit Leaf Group....................................................................... D-18Table D-10. SMDS Circuit Group Variables................................................... D-19Table D-11. DS1 Current Group Variables ..................................................... D-20Table D-12. DS1 Current Group Variables ..................................................... D-21Table D-13. DS1 Interval Group Variables ..................................................... D-22Table D-14. DS1 Total Group Variables ......................................................... D-23Table D-15. SMDS Address Interface Group Variables.................................. D-24Table D-16. ISDN Address Interface Group Variables ................................... D-25Table D-17. ISDN Caller ID Group Variables ................................................ D-25Table D-18. Service Name Binding Group Variables ..................................... D-26Table D-19. Software Group Variables ........................................................... D-27
NavisCore Troubleshooting Guide 7/17/03xix

Contents
Beta Draft Confidential
xx7/17/03 NavisCore Troubleshooting Guide
Beta Draft Confidential
About This Guide
The NavisCore Troubleshooting Guide describes how to troubleshoot problems on a Lucent-switch network. This guide is intended for network administrators and operators and should be used in conjunction with the NavisCore Diagnostics Guide.
This guide supports the following Network Management Station (NMS) and switch software releases:
• NavisCore™ Release 08.00.03.00 or greater
• CBX 500® switch software Release 08.00.03.00 or greater
• GX 550 Multiservice WAN™ switch software Release 08.00.03.00 or greater
• Prior supported releases of B-STDX 8000/9000 switch software as noted in the Interoperability section of the NavisCore Software Release Notes (SRNs).
What You Need to Know
As a reader of this guide, you should be familiar with UNIX, HP OpenView, and Lucent switch management. You should also know about relational databases to properly maintain Sybase, which is used by NavisCore.
This guide assumes that you have already installed the Lucent switch hardware, NMS and switch software. See the “Related Documents” section for a list of documents that describe these and other tasks.
Be sure to read the Software Release Notice (SRN) that accompanies each product. The SRN contains the most current feature information and requirements.
NavisCore Troubleshooting Guide xxi
Beta Draft ConfidentialAbout This GuideReading Path
Reading Path
This section describes all of the documents that support the NavisCore NMS and switch software.
NMS Documentation
Read the following documents to install and operate NavisCore Release 08.00.00.00 or greater. Be sure to review the NavisCore Software Release Notice for any changes not included in these guides.
This guide describes prerequisite tasks, hardware and software requirements, and instructions for installing Solaris, HP OpenView, and NavisCore on the NMS.
This guide describes how to configure and manage NavisCore, network maps, and Lucent switches. It also describes how to add third-party objects to the map and access them through NavisCore.
Network Management Station Installation Guide
NavisCore NMS Getting Started Guide
xxii7/17/03 NavisCore Troubleshooting Guide
Beta Draft Confidential About This GuideReading Path
Switch Software Documentation
Read the following documents to configure switch software:
The following guides describe how to configure WAN services on the B-STDX, CBX, and GX switch platforms:
• NavisCore Frame Relay Configuration Guide
• NavisCore ATM Configuration Guide
• NavisCore IP Navigator Configuration Guide
NavisCore Configuration Guides
Console Command Reference
This reference lists and describes the NavisCore switch console commands.
This guide describes how to monitor and diagnose problems in your NavisCore switch network.
NavisCore Diagnostics Guide
This guide describes the processor and I/O modules on each switch platform, and how to configure physical ports, timing, and other attributes through NavisCore.
NavisCore Physical Interface Configuration Guide
NavisCore Troubleshooting Guide 7/17/03xxiii
Beta Draft ConfidentialAbout This GuideHow to Use This Guide
Documentation for New Modules
The following guides provide information about hardware installation and switch software configuration for specific modules.
• 8-Port Subrate DS3 FR/IP I/O Module User’s Guide (Product Code: 80123)
• Base Input/Output 2 (BIO2) Module User’s Guide (Product Code: 80124)
• 32-Port Channelized T1/E1 FR/IP I/O Module User’s Guide (Product Code: 80140)
• 3-Port Channelized DS3/1 IMA I/O Module User’s Guide (Product Code: 80141)
How to Use This Guide
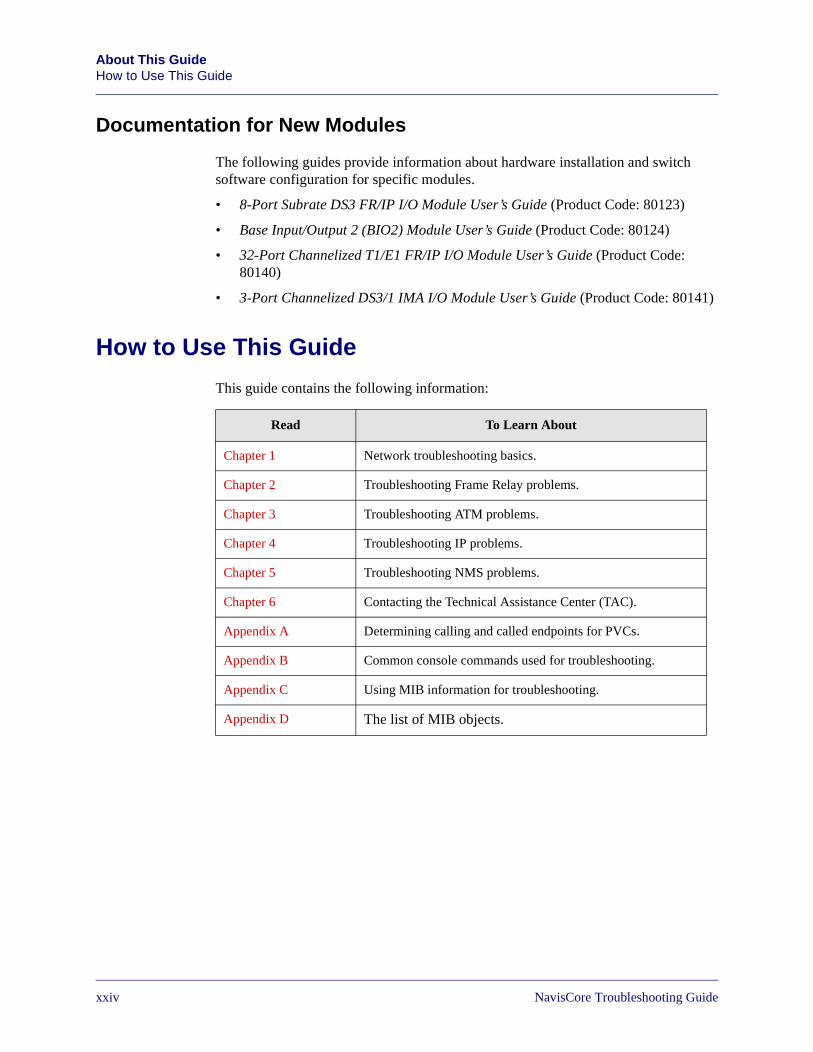
This guide contains the following information:
Read To Learn About
Chapter 1 Network troubleshooting basics.
Chapter 2 Troubleshooting Frame Relay problems.
Chapter 3 Troubleshooting ATM problems.
Chapter 4 Troubleshooting IP problems.
Chapter 5 Troubleshooting NMS problems.
Chapter 6 Contacting the Technical Assistance Center (TAC).
Appendix A Determining calling and called endpoints for PVCs.
Appendix B Common console commands used for troubleshooting.
Appendix C Using MIB information for troubleshooting.
Appendix D The list of MIB objects.
xxiv7/17/03 NavisCore Troubleshooting Guide
Beta Draft Confidential About This GuideWhat’s New in This Guide?
What’s New in This Guide?
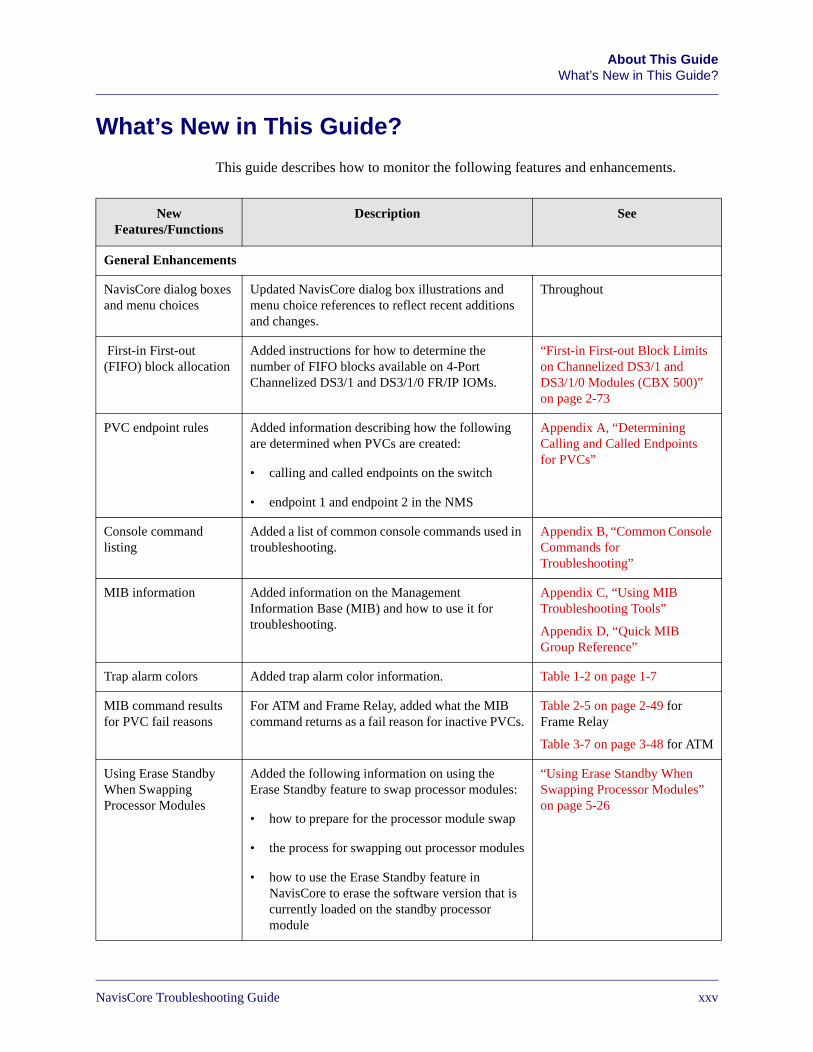
This guide describes how to monitor the following features and enhancements.
New Features/Functions
Description See
General Enhancements
NavisCore dialog boxes and menu choices
Updated NavisCore dialog box illustrations and menu choice references to reflect recent additions and changes.
Throughout
First-in First-out (FIFO) block allocation
Added instructions for how to determine the number of FIFO blocks available on 4-Port Channelized DS3/1 and DS3/1/0 FR/IP IOMs.
“First-in First-out Block Limits on Channelized DS3/1 and DS3/1/0 Modules (CBX 500)” on page 2-73
PVC endpoint rules Added information describing how the following are determined when PVCs are created:
• calling and called endpoints on the switch
• endpoint 1 and endpoint 2 in the NMS
Appendix A, “Determining Calling and Called Endpoints for PVCs”
Console command listing
Added a list of common console commands used in troubleshooting.
Appendix B, “Common Console Commands for Troubleshooting”
MIB information Added information on the Management Information Base (MIB) and how to use it for troubleshooting.
Appendix C, “Using MIB Troubleshooting Tools”
Appendix D, “Quick MIB Group Reference”
Trap alarm colors Added trap alarm color information. Table 1-2 on page 1-7
MIB command results for PVC fail reasons
For ATM and Frame Relay, added what the MIB command returns as a fail reason for inactive PVCs.
Table 2-5 on page 2-49 for Frame Relay
Table 3-7 on page 3-48 for ATM
Using Erase Standby When Swapping Processor Modules
Added the following information on using the Erase Standby feature to swap processor modules:
• how to prepare for the processor module swap
• the process for swapping out processor modules
• how to use the Erase Standby feature in NavisCore to erase the software version that is currently loaded on the standby processor module
“Using Erase Standby When Swapping Processor Modules” on page 5-26
NavisCore Troubleshooting Guide 7/17/03xxv
Beta Draft ConfidentialAbout This GuideWhat’s New in This Guide?
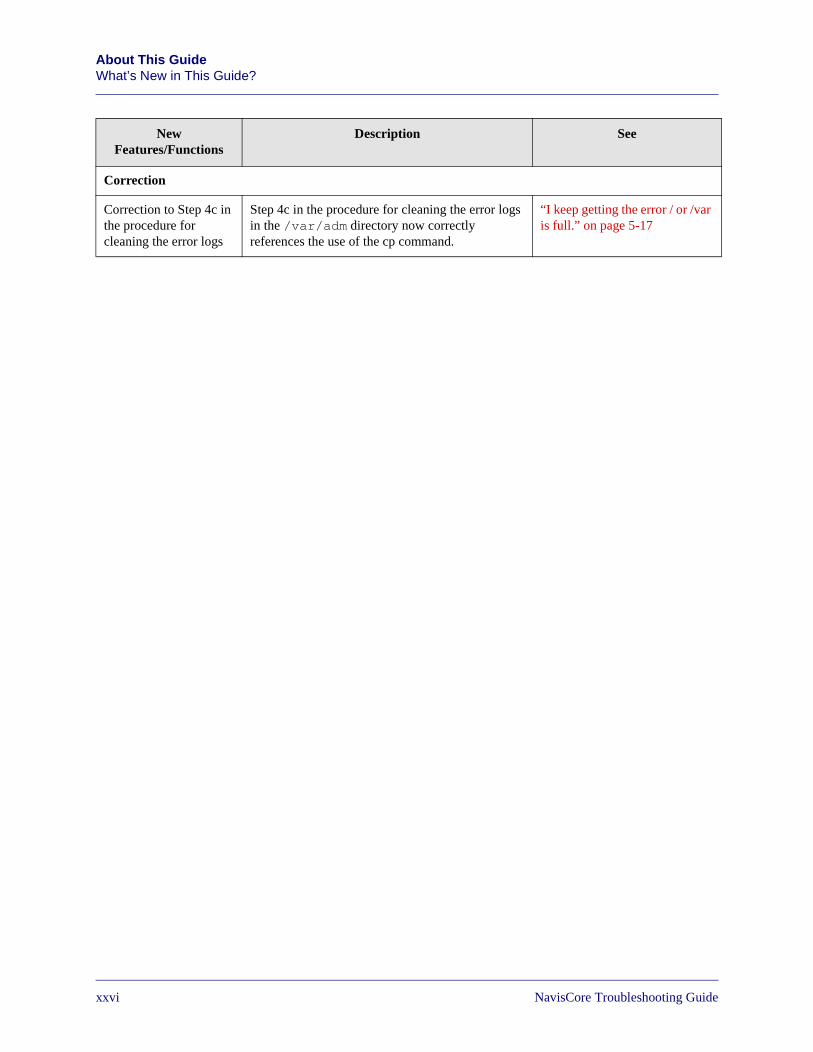
Correction
Correction to Step 4c in the procedure for cleaning the error logs
Step 4c in the procedure for cleaning the error logs in the /var/adm directory now correctly references the use of the cp command.
“I keep getting the error / or /var is full.” on page 5-17
New Features/Functions
Description See
xxvi7/17/03 NavisCore Troubleshooting Guide
Beta Draft Confidential About This GuideConventions
Conventions
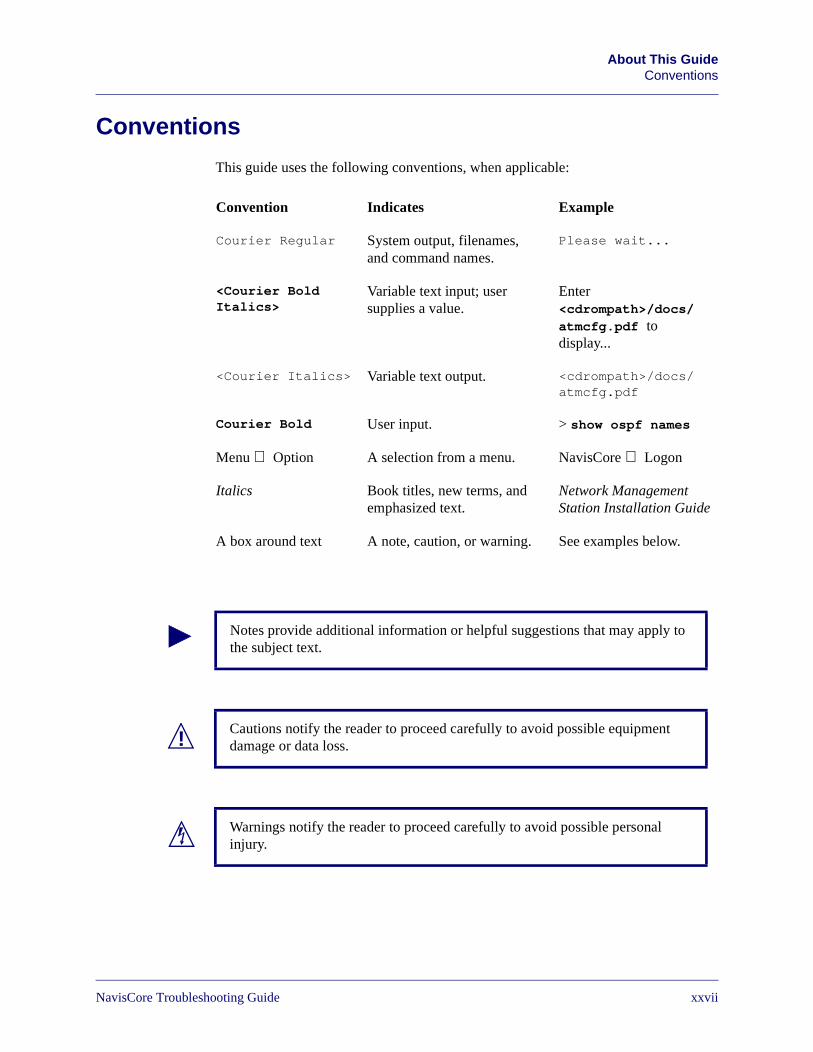
This guide uses the following conventions, when applicable:
Convention Indicates Example
Courier Regular System output, filenames, and command names.
Please wait...
<Courier Bold Italics>
Variable text input; user supplies a value.
Enter <cdrompath>/docs/atmcfg.pdf to display...
<Courier Italics> Variable text output. <cdrompath>/docs/atmcfg.pdf
Courier Bold User input. > show ospf names
Menu ⇒ Option A selection from a menu. NavisCore ⇒ Logon
Italics Book titles, new terms, and emphasized text.
Network Management Station Installation Guide
A box around text A note, caution, or warning. See examples below.
Notes provide additional information or helpful suggestions that may apply to the subject text.
!Cautions notify the reader to proceed carefully to avoid possible equipment damage or data loss.
Warnings notify the reader to proceed carefully to avoid possible personal injury.
NavisCore Troubleshooting Guide 7/17/03xxvii
Beta Draft ConfidentialAbout This GuideRelated Documents
Related Documents
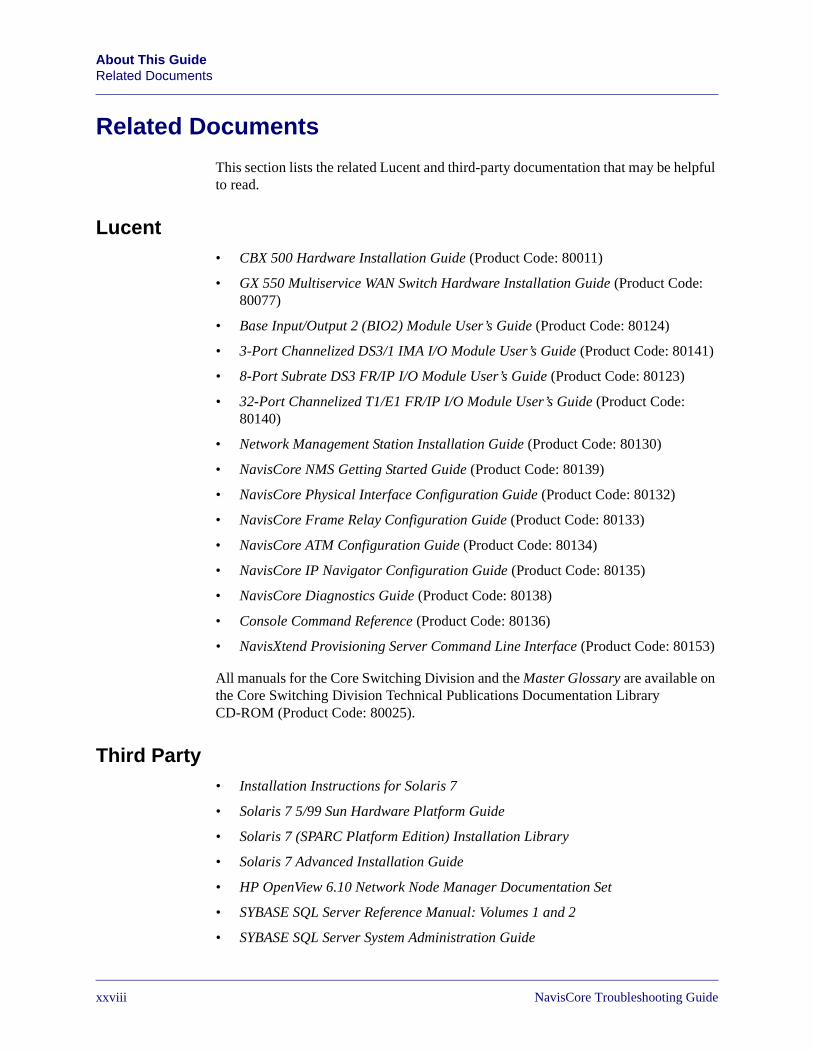
This section lists the related Lucent and third-party documentation that may be helpful to read.
Lucent• CBX 500 Hardware Installation Guide (Product Code: 80011)
• GX 550 Multiservice WAN Switch Hardware Installation Guide (Product Code: 80077)
• Base Input/Output 2 (BIO2) Module User’s Guide (Product Code: 80124)
• 3-Port Channelized DS3/1 IMA I/O Module User’s Guide (Product Code: 80141)
• 8-Port Subrate DS3 FR/IP I/O Module User’s Guide (Product Code: 80123)
• 32-Port Channelized T1/E1 FR/IP I/O Module User’s Guide (Product Code: 80140)
• Network Management Station Installation Guide (Product Code: 80130)
• NavisCore NMS Getting Started Guide (Product Code: 80139)
• NavisCore Physical Interface Configuration Guide (Product Code: 80132)
• NavisCore Frame Relay Configuration Guide (Product Code: 80133)
• NavisCore ATM Configuration Guide (Product Code: 80134)
• NavisCore IP Navigator Configuration Guide (Product Code: 80135)
• NavisCore Diagnostics Guide (Product Code: 80138)
• Console Command Reference (Product Code: 80136)
• NavisXtend Provisioning Server Command Line Interface (Product Code: 80153)
All manuals for the Core Switching Division and the Master Glossary are available on the Core Switching Division Technical Publications Documentation Library CD-ROM (Product Code: 80025).
Third Party• Installation Instructions for Solaris 7
• Solaris 7 5/99 Sun Hardware Platform Guide
• Solaris 7 (SPARC Platform Edition) Installation Library
• Solaris 7 Advanced Installation Guide
• HP OpenView 6.10 Network Node Manager Documentation Set
• SYBASE SQL Server Reference Manual: Volumes 1 and 2
• SYBASE SQL Server System Administration Guide
xxviii7/17/03 NavisCore Troubleshooting Guide

Beta Draft Confidential About This GuideOrdering Printed Manuals Online
Ordering Printed Manuals Online
You can order Core Switching manuals online. Use the following URL to access the Lucent Bookstore:
http://www.lucentdocs.com
NavisCore Troubleshooting Guide 7/17/03xxix

Beta Draft ConfidentialAbout This GuideCustomer Comments
Customer Comments
Customer comments are welcome. Please respond in one of the following ways:
• Fill out the Customer Comment Form located at the back of this guide and return it to us.
• E-mail your comments to [email protected]
• FAX your comments to 978-692-1510, attention Technical Publications.
Technical Support
The Lucent Technical Assistance Center (TAC) is available to assist you with any problems encountered while using this Lucent product. Log on to our Customer Support web site to obtain telephone numbers for the Lucent TAC in your region:
http://www.lucent.com/support
xxx7/17/03 NavisCore Troubleshooting Guide
NavisCore Troubleshooting Guide
Beta Draft Confidential
1
Introduction to Network Troubleshooting
A network is usually a complex system of many interconnected hardware and software components. Because of this inherent complexity, the problems that occur in networks tend to be complex as well.
You should be prepared to resolve network problems before they occur. Three things you can do to prepare for these problems are:
1. Know your network components.
2. Know your network problem-solving tools.
3. Have a troubleshooting process in place.
The following sections describe each of these preparation methods.
Know Your Network Components
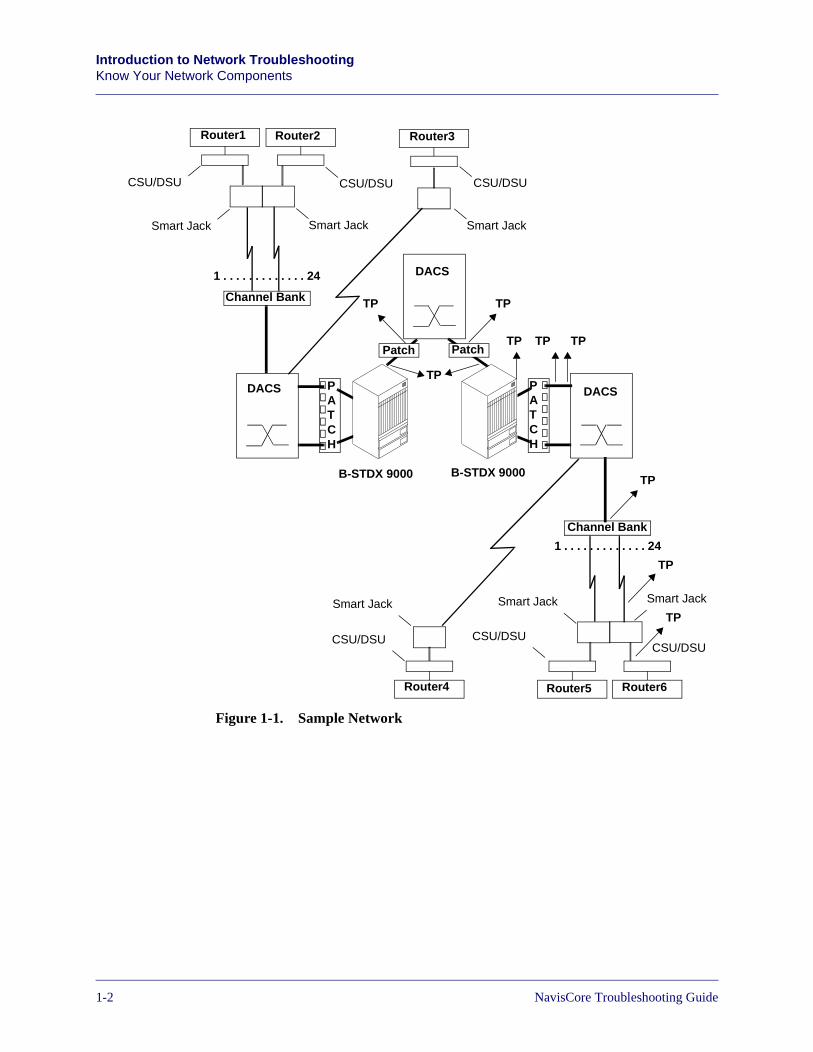
Take an inventory of your network hardware and software components from time to time and understand the interfaces that connect them. Your network components and their interfaces will eventually act as test points — places in the network for isolating problems — when you perform your troubleshooting tasks.
Figure 1-1 shows a sample network that consists of many types of network components, including routers and Lucent switches. Some sample test points (TPs) are indicated by arrows.
1-1
Beta Draft ConfidentialIntroduction to Network TroubleshootingKnow Your Network Components
Figure 1-1. Sample Network
1 . . . . . . . . . . . . . 24
1 . . . . . . . . . . . . . 24
Router1 Router2 Router3
Router4 Router5 Router6
CSU/DSU
Smart Jack
CSU/DSU
Smart Jack
Channel Bank
DACS
DACS
DACSPATCH
PATCH
PatchPatch
CSU/DSU
Smart Jack
Channel Bank
CSU/DSU
Smart Jack
CSU/DSU
Smart Jack Smart Jack
CSU/DSU
TP TP
TP TP TP
TP
TP
TP
TP
B-STDX 9000 B-STDX 9000
1-27/17/03 NavisCore Troubleshooting Guide
Beta Draft ConfidentialIntroduction to Network Troubleshooting
Know Your Troubleshooting Tools
In some cases, knowledge of your network alone can help you isolate and correct problems quickly. For example, suppose that SNMP traps indicate that Router4 in the sample network is suddenly unreachable, but Router5 and Router6 have no problem exchanging data with the rest of the network. You could troubleshoot the problem as follows:
1. Based on your knowledge of the network, you know that Router4, Router5, and Router6 all send data and receive data via the same DACS.
2. Since Router5 and Router6 have no problems communicating with the rest of the network, the problem is on Router4.
At this point, you should begin troubleshooting Router4 and progressively work your way toward the switch network.
3. You take the following action:
• Check Router4’s configuration.
• Check the configuration of Router4’s connection to the network.
• Check Router4’s CSU/DSU and its smart jack.
• Check the link between Router4’s smart jack and the DACS.
Know Your Troubleshooting Tools
Take an inventory of all Lucent and third-party hardware and software troubleshooting tools that are available to you, and understand the types of problems that they can troubleshoot.
Troubleshooting tools from Lucent include:
NavisCore — Provides configuration functions, performance statistics, traps/alarms, and diagnostic capabilities.
Console Commands — Provide many of the same management functions as NavisCore through commands issued from the switch console. Console commands also include a complete set of Management Information Base (MIB) commands. See Appendix B, “Common Console Commands for Troubleshooting,” and Appendix C, “Using MIB Troubleshooting Tools,” for more information.
NavisXtend Family of Products — Provides additional network management and troubleshooting tools such as bulk statistics collection and accounting statistics collection.
Many network troubleshooting tools are available from a variety of third-party vendors. Examples of these include:
NavisCore Troubleshooting Guide 7/17/031-3
Beta Draft ConfidentialIntroduction to Network TroubleshootingHave a Troubleshooting Process in Place
Protocol Analyzer — Analyzes packets transmitted on a network (usually LANs). Analyzers are typically used to analyze OSI Layer 3 (and above) protocols such as TCP/IP, Novell IPX, IBM SNA, and AppleTalk, but can also analyze OSI Layer 2 protocols (e.g., Ethernet and Token Ring).
WAN Analyzer — Analyzes packets transmitted over WAN links. They typically support all of the commonly found WAN interfaces (e.g., EIA/TIA-232 and ITU-T V.35) and protocols (e.g., HDLC, Frame Relay, and ISDN).
Optical Time Domain Reflectometer (TDR) — Tests fiber-optic cables for transmission problems.
Optical Power Source and Meter — Tests fiber-optic cables for transmission problems. They tend to be less expensive than optical TDRs.
Oscilloscope — Tests voltages on EIA/TIA-232 and EIA/TIA-422 interfaces.
Breakout Box — Provides status information on EIA/TIA-232-D leads between DTEs and DCEs.
Standard TCP/IP Commands — Standard TCP/IP commands such as ping can help you determine if destinations are reachable. These commands are available on most computers. Note that ping is also available as a switch console command.
Management Software — Provides troubleshooting with graphical or command-line interface. Routers, hubs, and other network devices typically come with their own management software.
Have a Troubleshooting Process in Place
You need a proven troubleshooting process to deal with the kinds of complex problems you will encounter in your network when they occur. You should base your troubleshooting process on the following guidelines:
1. Identify the problem
2. Verify the problem
3. Isolate the problem
4. Take corrective action
1-47/17/03 NavisCore Troubleshooting Guide
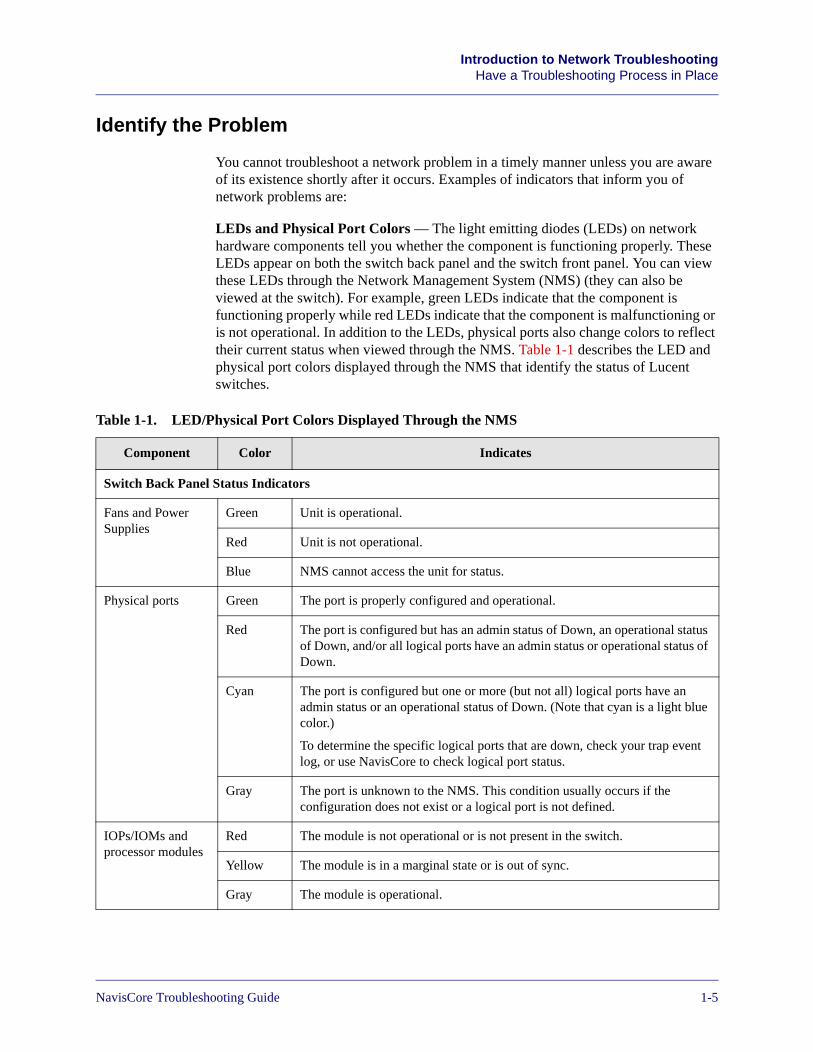
Beta Draft ConfidentialIntroduction to Network Troubleshooting
Have a Troubleshooting Process in Place
Identify the Problem
You cannot troubleshoot a network problem in a timely manner unless you are aware of its existence shortly after it occurs. Examples of indicators that inform you of network problems are:
LEDs and Physical Port Colors — The light emitting diodes (LEDs) on network hardware components tell you whether the component is functioning properly. These LEDs appear on both the switch back panel and the switch front panel. You can view these LEDs through the Network Management System (NMS) (they can also be viewed at the switch). For example, green LEDs indicate that the component is functioning properly while red LEDs indicate that the component is malfunctioning or is not operational. In addition to the LEDs, physical ports also change colors to reflect their current status when viewed through the NMS. Table 1-1 describes the LED and physical port colors displayed through the NMS that identify the status of Lucent switches.
Table 1-1. LED/Physical Port Colors Displayed Through the NMS
Component Color Indicates
Switch Back Panel Status Indicators
Fans and Power Supplies
Green Unit is operational.
Red Unit is not operational.
Blue NMS cannot access the unit for status.
Physical ports Green The port is properly configured and operational.
Red The port is configured but has an admin status of Down, an operational status of Down, and/or all logical ports have an admin status or operational status of Down.
Cyan The port is configured but one or more (but not all) logical ports have an admin status or an operational status of Down. (Note that cyan is a light blue color.)
To determine the specific logical ports that are down, check your trap event log, or use NavisCore to check logical port status.
Gray The port is unknown to the NMS. This condition usually occurs if the configuration does not exist or a logical port is not defined.
IOPs/IOMs and processor modules
Red The module is not operational or is not present in the switch.
Yellow The module is in a marginal state or is out of sync.
Gray The module is operational.
NavisCore Troubleshooting Guide 7/17/031-5
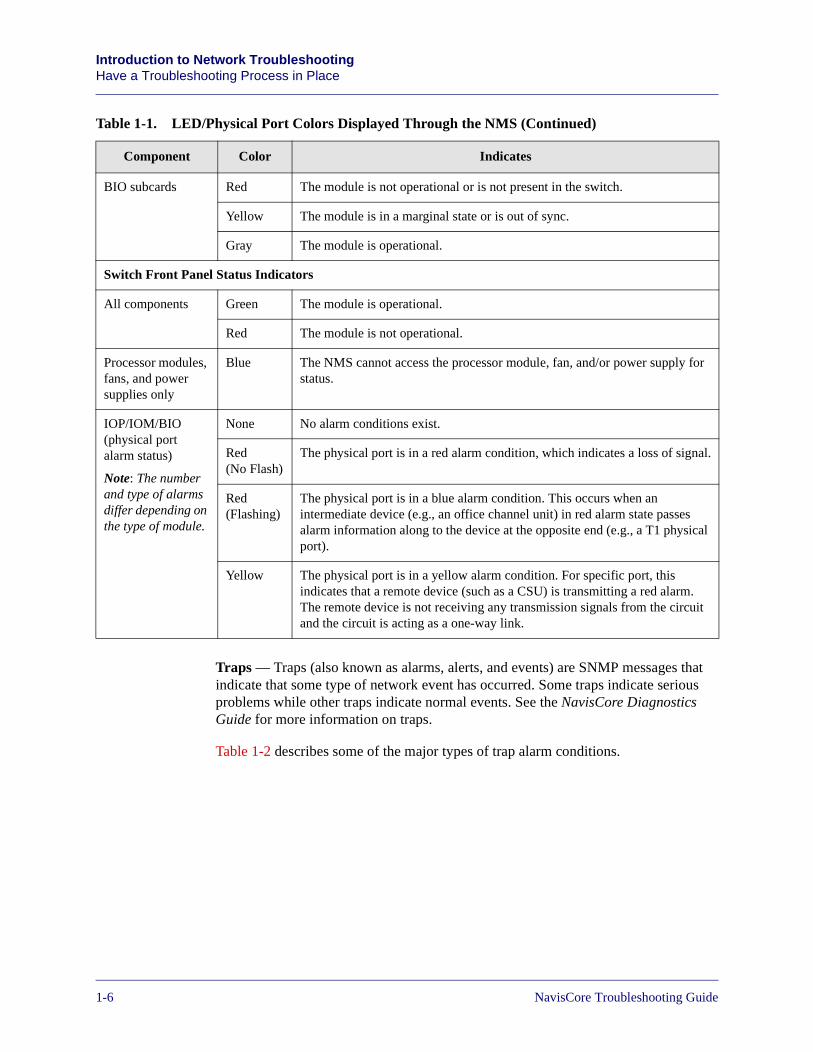
Beta Draft ConfidentialIntroduction to Network TroubleshootingHave a Troubleshooting Process in Place
Traps — Traps (also known as alarms, alerts, and events) are SNMP messages that indicate that some type of network event has occurred. Some traps indicate serious problems while other traps indicate normal events. See the NavisCore Diagnostics Guide for more information on traps.
Table 1-2 describes some of the major types of trap alarm conditions.
BIO subcards Red The module is not operational or is not present in the switch.
Yellow The module is in a marginal state or is out of sync.
Gray The module is operational.
Switch Front Panel Status Indicators
All components Green The module is operational.
Red The module is not operational.
Processor modules, fans, and power supplies only
Blue The NMS cannot access the processor module, fan, and/or power supply for status.
IOP/IOM/BIO (physical port alarm status)
Note: The number and type of alarms differ depending on the type of module.
None No alarm conditions exist.
Red (No Flash)
The physical port is in a red alarm condition, which indicates a loss of signal.
Red (Flashing)
The physical port is in a blue alarm condition. This occurs when an intermediate device (e.g., an office channel unit) in red alarm state passes alarm information along to the device at the opposite end (e.g., a T1 physical port).
Yellow The physical port is in a yellow alarm condition. For specific port, this indicates that a remote device (such as a CSU) is transmitting a red alarm. The remote device is not receiving any transmission signals from the circuit and the circuit is acting as a one-way link.
Table 1-1. LED/Physical Port Colors Displayed Through the NMS (Continued)
Component Color Indicates
1-67/17/03 NavisCore Troubleshooting Guide
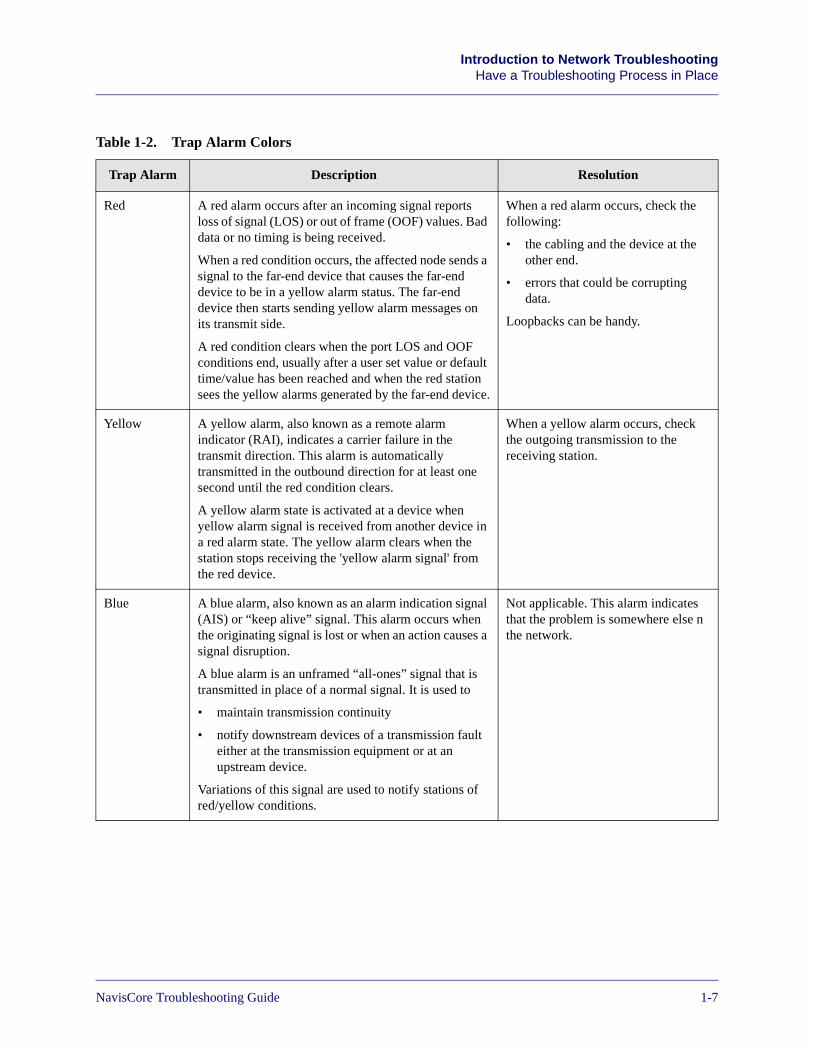
Beta Draft ConfidentialIntroduction to Network Troubleshooting
Have a Troubleshooting Process in Place
Table 1-2. Trap Alarm Colors
Trap Alarm Description Resolution
Red A red alarm occurs after an incoming signal reports loss of signal (LOS) or out of frame (OOF) values. Bad data or no timing is being received.
When a red condition occurs, the affected node sends a signal to the far-end device that causes the far-end device to be in a yellow alarm status. The far-end device then starts sending yellow alarm messages on its transmit side.
A red condition clears when the port LOS and OOF conditions end, usually after a user set value or default time/value has been reached and when the red station sees the yellow alarms generated by the far-end device.
When a red alarm occurs, check the following:
• the cabling and the device at the other end.
• errors that could be corrupting data.
Loopbacks can be handy.
Yellow A yellow alarm, also known as a remote alarm indicator (RAI), indicates a carrier failure in the transmit direction. This alarm is automatically transmitted in the outbound direction for at least one second until the red condition clears.
A yellow alarm state is activated at a device when yellow alarm signal is received from another device in a red alarm state. The yellow alarm clears when the station stops receiving the 'yellow alarm signal' from the red device.
When a yellow alarm occurs, check the outgoing transmission to the receiving station.
Blue A blue alarm, also known as an alarm indication signal (AIS) or “keep alive” signal. This alarm occurs when the originating signal is lost or when an action causes a signal disruption.
A blue alarm is an unframed “all-ones” signal that is transmitted in place of a normal signal. It is used to
• maintain transmission continuity
• notify downstream devices of a transmission fault either at the transmission equipment or at an upstream device.
Variations of this signal are used to notify stations of red/yellow conditions.
Not applicable. This alarm indicates that the problem is somewhere else n the network.
NavisCore Troubleshooting Guide 7/17/031-7
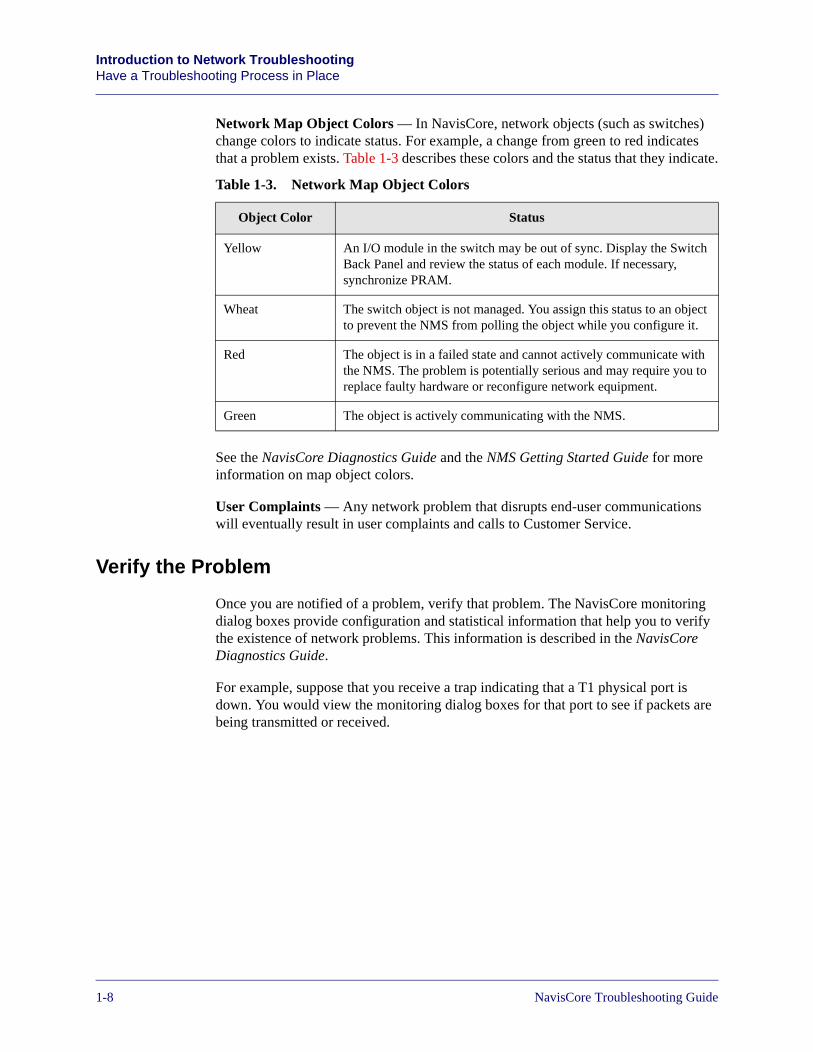
Beta Draft ConfidentialIntroduction to Network TroubleshootingHave a Troubleshooting Process in Place
Network Map Object Colors — In NavisCore, network objects (such as switches) change colors to indicate status. For example, a change from green to red indicates that a problem exists. Table 1-3 describes these colors and the status that they indicate.
See the NavisCore Diagnostics Guide and the NMS Getting Started Guide for more information on map object colors.
User Complaints — Any network problem that disrupts end-user communications will eventually result in user complaints and calls to Customer Service.
Verify the Problem
Once you are notified of a problem, verify that problem. The NavisCore monitoring dialog boxes provide configuration and statistical information that help you to verify the existence of network problems. This information is described in the NavisCore Diagnostics Guide.
For example, suppose that you receive a trap indicating that a T1 physical port is down. You would view the monitoring dialog boxes for that port to see if packets are being transmitted or received.
Table 1-3. Network Map Object Colors
Object Color Status
Yellow An I/O module in the switch may be out of sync. Display the Switch Back Panel and review the status of each module. If necessary, synchronize PRAM.
Wheat The switch object is not managed. You assign this status to an object to prevent the NMS from polling the object while you configure it.
Red The object is in a failed state and cannot actively communicate with the NMS. The problem is potentially serious and may require you to replace faulty hardware or reconfigure network equipment.
Green The object is actively communicating with the NMS.
1-87/17/03 NavisCore Troubleshooting Guide
Beta Draft ConfidentialIntroduction to Network Troubleshooting
Have a Troubleshooting Process in Place
Isolate the Problem
Isolate the problem once you have verified it. You can isolate the problem in several ways:
• Run diagnostics and loopbacks, which can narrow the problem to a specific area:
– Run diagnostics and loopbacks on processor modules, IOP/IOM/BIO modules, physical ports, and channels.
– Run OAM loopbacks on ATM circuits.
– Run PVC loopbacks on Frame Relay PVCs.
See the NavisCore Diagnostics Guide for information on running diagnostics and loopbacks.
• Correlate all the information you have gathered while identifying and verifying the problem. In some cases, you can isolate a problem by analyzing the sum of all the traps, statistical information, user complaints, and other information you have collected.
• Review your network topology. In some cases, knowledge of your network topology alone can help you isolate a problem. See “Know Your Network Components” on page 1-1 for more information about topology and problem isolation.
Take Corrective Action
Corrective action can come in many forms, depending on the specific problem you have encountered.
When the source of the problem lies within your administrative control, you can take action yourself by, for example, reconfiguring your network or replacing malfunctioning components. Lucent technical support staff are available to help whenever you need assistance solving network problems.
In other cases, the source of the problem may not lie within your administrative control. For example, you may have isolated the source of the problem to a router at a customer site. If you determine that the problem lies outside your administrative control, compile all of the information you have gathered and share it with the administrative staff who will be responsible for resolving the problem.
NavisCore Troubleshooting Guide 7/17/031-9
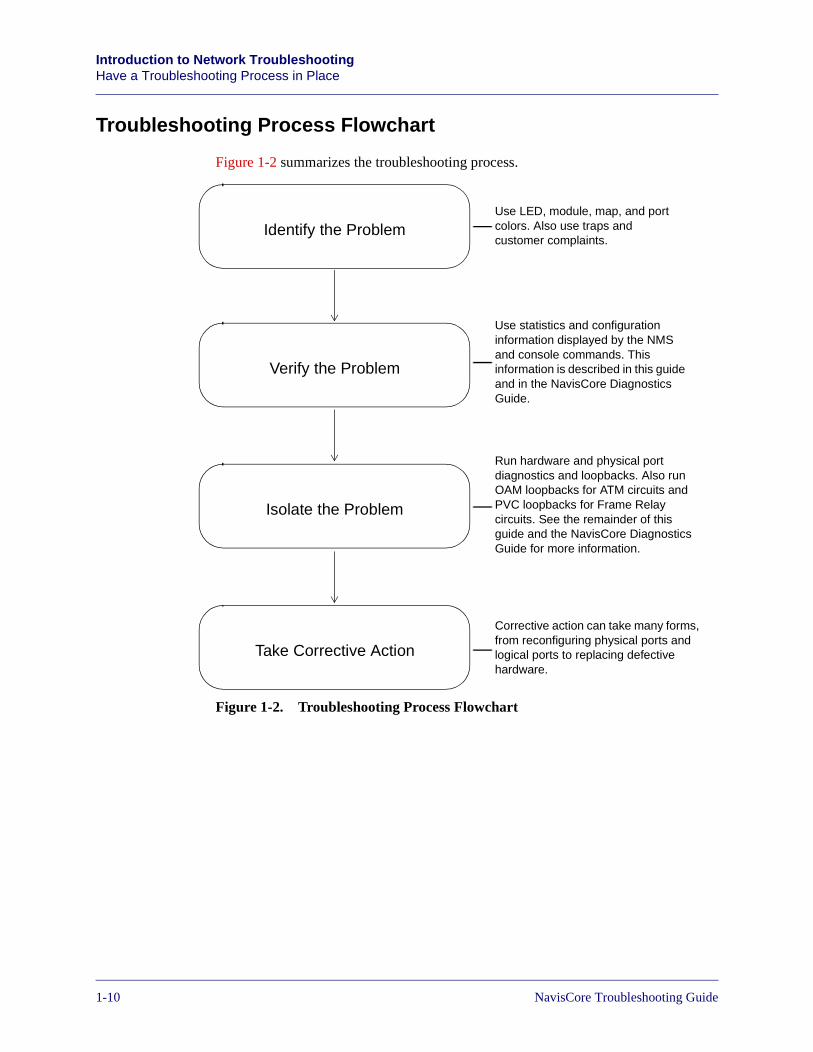
Beta Draft ConfidentialIntroduction to Network TroubleshootingHave a Troubleshooting Process in Place
Troubleshooting Process Flowchart
Figure 1-2 summarizes the troubleshooting process.
Figure 1-2. Troubleshooting Process Flowchart
Identify the Problem
Take Corrective Action
Isolate the Problem
Verify the Problem
Take Corrective Action
Use LED, module, map, and port colors. Also use traps and customer complaints.
Use statistics and configuration information displayed by the NMS and console commands. This information is described in this guide and in the NavisCore Diagnostics Guide.
Run hardware and physical port diagnostics and loopbacks. Also run OAM loopbacks for ATM circuits and PVC loopbacks for Frame Relay circuits. See the remainder of this guide and the NavisCore Diagnostics Guide for more information.
Corrective action can take many forms, from reconfiguring physical ports and logical ports to replacing defective hardware.
1-107/17/03 NavisCore Troubleshooting Guide

Beta Draft ConfidentialIntroduction to Network Troubleshooting
What’s Next?
What’s Next?
The rest of this guide describes how to troubleshoot problems in various network environments, including Frame Relay, ATM and IP. It also describes how to troubleshoot problems on the NMS. Regardless of the kinds of problems you investigate, it is important to keep in mind the process described in this chapter, which can be used to solve problems of all kinds.
NavisCore Troubleshooting Guide 7/17/031-11

Beta Draft ConfidentialIntroduction to Network TroubleshootingWhat’s Next?
1-127/17/03 NavisCore Troubleshooting Guide
NavisCore Troubleshooting Guide
Beta Draft Confidential
2
Troubleshooting Frame Relay Problems
This chapter describes how to troubleshoot problems on Lucent switches in Frame Relay networks using the NMS. This chapter divides Frame Relay troubleshooting into the following areas:
• Physical ports
• Logical ports
• Trunks
• Circuits (PVCs and SVCs)
In addition, First-In First-Out (FIFO) block limits for CBX 4-Port Channelized DS3/1 and DS3/1/0 modules have been included at the end of the chapter.
2-1
Beta Draft ConfidentialTroubleshooting Frame Relay ProblemsTroubleshooting Frame Relay Physical Ports
Troubleshooting Frame Relay Physical Ports
This section describes how to identify, verify, isolate, and correct problems with Frame Relay physical ports.
Identifying Frame Relay Physical Port Problems
In addition to customer complaints, you can identify physical port problems in three ways:
• NMS back panel physical port colors
• NMS front panel LEDs
• Traps
Frame Relay Back Panel Physical Port Status
On the switch back panel, displayed via the NMS, physical ports change colors to indicate their current status. These colors are described in Table 1-1 on page 1-5.
To display the switch back panel in NavisCore:
1. Select the appropriate switch object on the network map.
2. From the Monitor menu, select Lucent Objects ⇒ Show Detail. The Switch Back Panel dialog box appears. Figure 2-1 shows a B-STDX switch back panel.
To make changes to the switch back panel in NavisCore:
1. Select the appropriate switch object on the network map.
2. From the Administer menu, select Lucent Objects ⇒ Set Parameters. The Switch Back Panel dialog box appears. Figure 2-1 shows a B-STDX switch back panel.
2-27/17/03 NavisCore Troubleshooting Guide
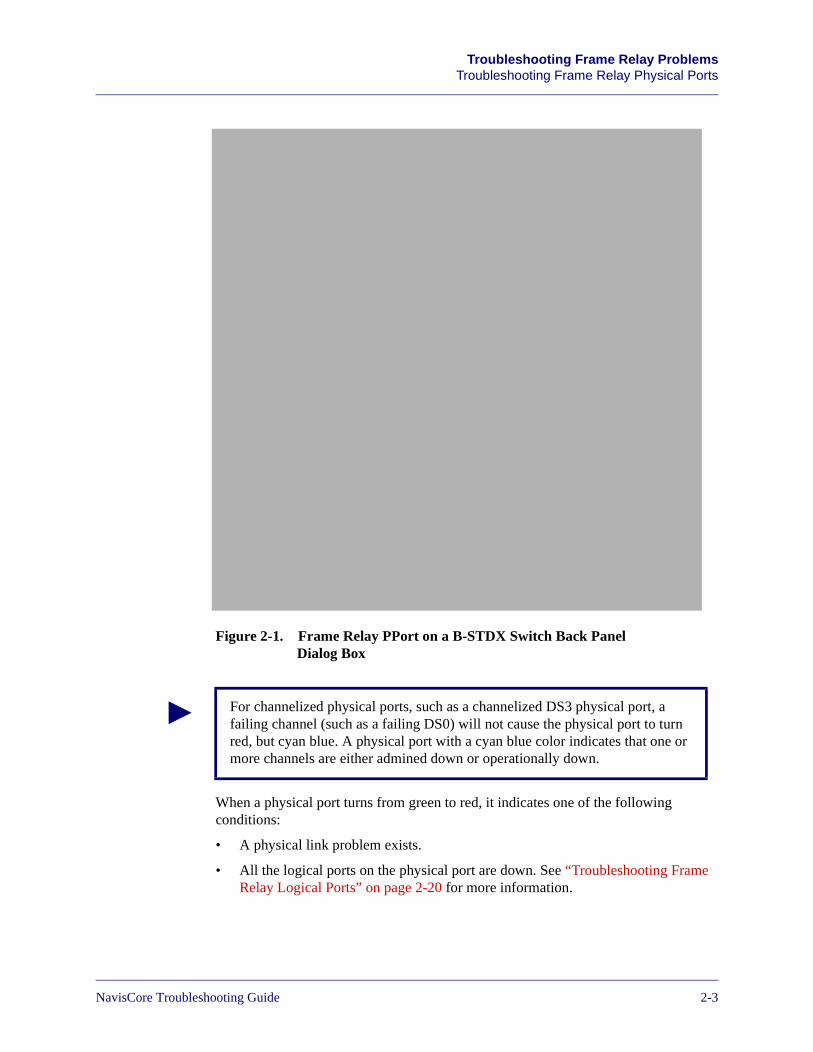
Beta Draft ConfidentialTroubleshooting Frame Relay Problems
Troubleshooting Frame Relay Physical Ports
Figure 2-1. Frame Relay PPort on a B-STDX Switch Back PanelDialog Box
When a physical port turns from green to red, it indicates one of the following conditions:
• A physical link problem exists.
• All the logical ports on the physical port are down. See “Troubleshooting Frame Relay Logical Ports” on page 2-20 for more information.
For channelized physical ports, such as a channelized DS3 physical port, a failing channel (such as a failing DS0) will not cause the physical port to turn red, but cyan blue. A physical port with a cyan blue color indicates that one or more channels are either admined down or operationally down.
NavisCore Troubleshooting Guide 7/17/032-3
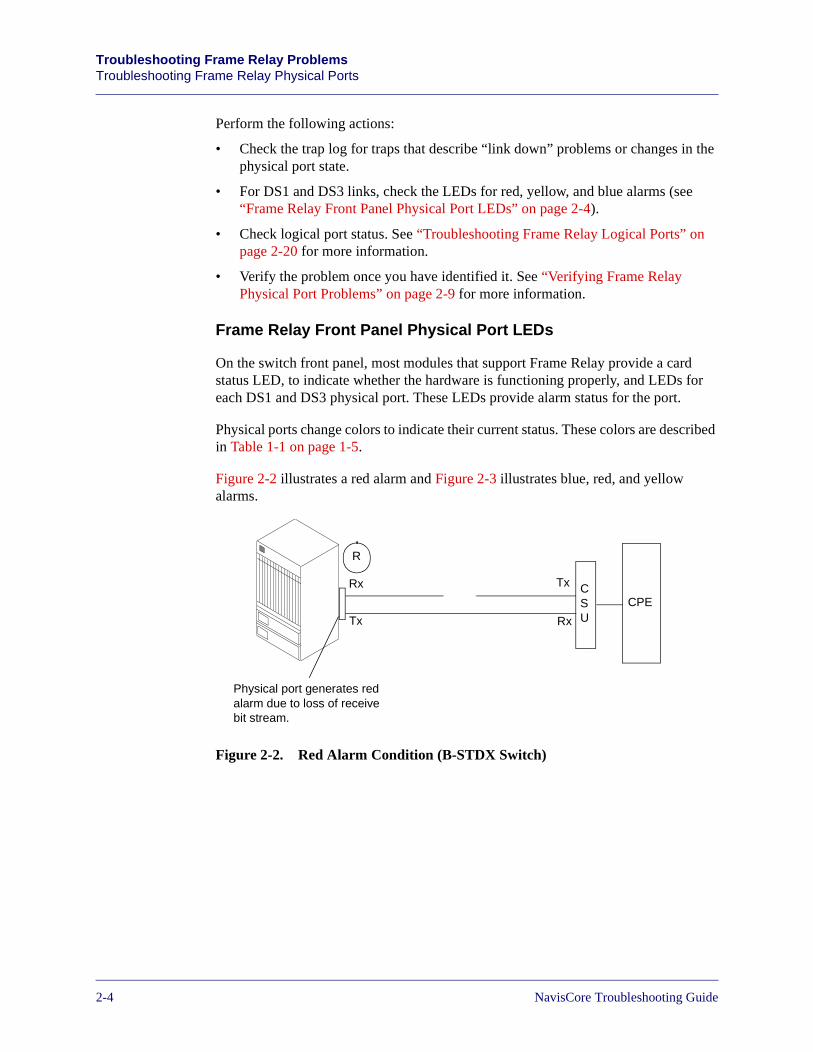
Beta Draft ConfidentialTroubleshooting Frame Relay ProblemsTroubleshooting Frame Relay Physical Ports
Perform the following actions:
• Check the trap log for traps that describe “link down” problems or changes in the physical port state.
• For DS1 and DS3 links, check the LEDs for red, yellow, and blue alarms (see “Frame Relay Front Panel Physical Port LEDs” on page 2-4).
• Check logical port status. See “Troubleshooting Frame Relay Logical Ports” on page 2-20 for more information.
• Verify the problem once you have identified it. See “Verifying Frame Relay Physical Port Problems” on page 2-9 for more information.
Frame Relay Front Panel Physical Port LEDs
On the switch front panel, most modules that support Frame Relay provide a card status LED, to indicate whether the hardware is functioning properly, and LEDs for each DS1 and DS3 physical port. These LEDs provide alarm status for the port.
Physical ports change colors to indicate their current status. These colors are described in Table 1-1 on page 1-5.
Figure 2-2 illustrates a red alarm and Figure 2-3 illustrates blue, red, and yellow alarms.
Figure 2-2. Red Alarm Condition (B-STDX Switch)
CSU
CPE
Physical port generates red alarm due to loss of receive bit stream.
Tx
Rx Tx
Rx
R
2-47/17/03 NavisCore Troubleshooting Guide
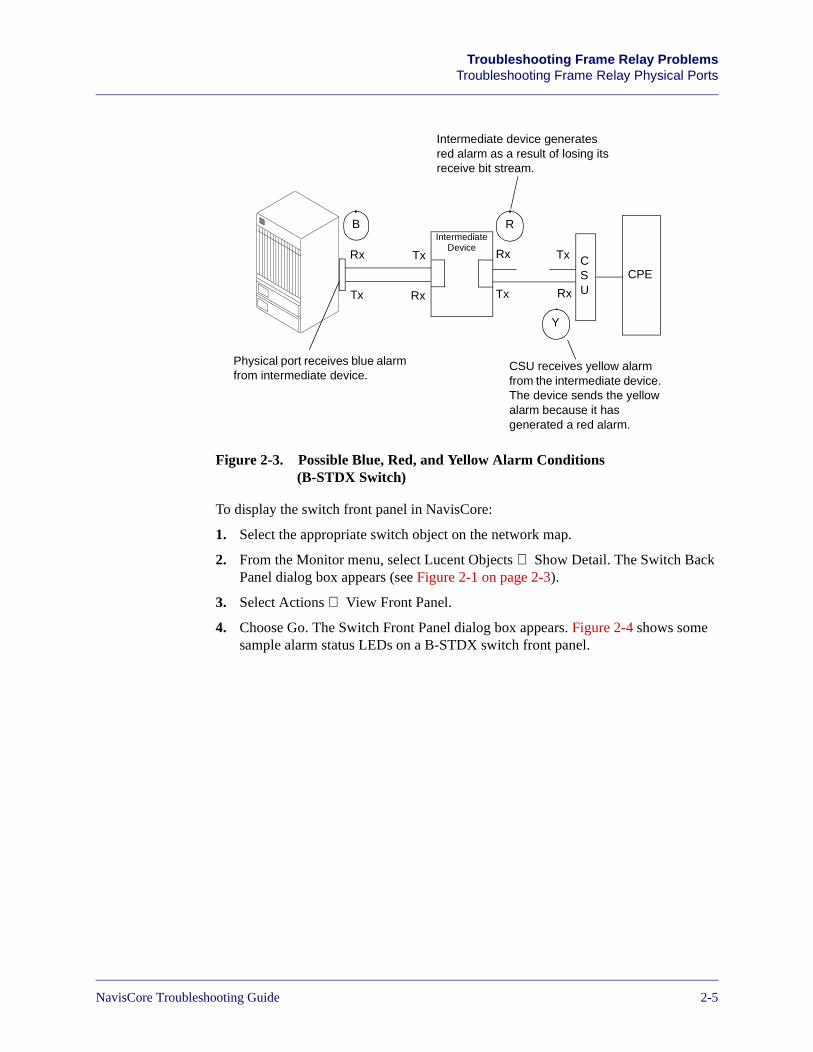
Beta Draft ConfidentialTroubleshooting Frame Relay Problems
Troubleshooting Frame Relay Physical Ports
Figure 2-3. Possible Blue, Red, and Yellow Alarm Conditions(B-STDX Switch)
To display the switch front panel in NavisCore:
1. Select the appropriate switch object on the network map.
2. From the Monitor menu, select Lucent Objects ⇒ Show Detail. The Switch Back Panel dialog box appears (see Figure 2-1 on page 2-3).
3. Select Actions ⇒ View Front Panel.
4. Choose Go. The Switch Front Panel dialog box appears. Figure 2-4 shows some sample alarm status LEDs on a B-STDX switch front panel.
CSU
CPE
Physical port receives blue alarm from intermediate device.
Tx
Rx Tx
Tx
Tx
Rx
Rx
Rx
Intermediate device generates red alarm as a result of losing its receive bit stream.
B
Y
R
CSU receives yellow alarm from the intermediate device. The device sends the yellow alarm because it has generated a red alarm.
IntermediateDevice
NavisCore Troubleshooting Guide 7/17/032-5
Beta Draft ConfidentialTroubleshooting Frame Relay ProblemsTroubleshooting Frame Relay Physical Ports
Figure 2-4. Alarm Status LEDs on a B-STDX
For HSSI physical ports, ignore the alarm status indicators on the front panel. They do not actually report alarms.
2-67/17/03 NavisCore Troubleshooting Guide
Beta Draft ConfidentialTroubleshooting Frame Relay Problems
Troubleshooting Frame Relay Physical Ports
Frame Relay DS1 and DS3 Physical Port Failures
In addition to the red, blue, and yellow alarms, other reasons for DS1 and DS3 failures include:
Bipolar Violations (BPVs) — BPV or “noise” errors depend on the type of signal coding that is in use. The types of signal coding are alternate mark inversion (AMI), bipolar with eight zero substitution (B8ZS), and high-density bipolar of order 3 (HDB3). The errors are as follows:
• For an AMI-coded signal, a BPV error is the occurrence of a pulse of the same polarity as the previous pulse.
• For a B8ZS-coded or an HDB3-coded signal, a BPV error is the occurrence of a pulse of the same polarity as the previous pulse without being a part of the zero substitution code.
Excessive Zeroes (EXZs) — EXZ errors are of three types, depending on the type of signal coding (AMI, B8ZS, or HDB3):
• For an AMI-coded signal, an EXZ error event is the occurrence of more than 15 contiguous zeroes.
• For a B8ZS-coded signal, an EXZ error event is the occurrence of more than seven contiguous zeroes.
• For an HDB3-coded signal, an EXZ error event is the occurrence of more than three contiguous zeroes.
To detect the presence of BPV and EXZ errors, display DS3 and DS1 performance monitoring statistics. Pay special attention to Code Violations and Errored Seconds statistics. See the NavisCore Diagnostics Guide for more information.
Performance monitoring statistics are not available for all modules.
NavisCore Troubleshooting Guide 7/17/032-7
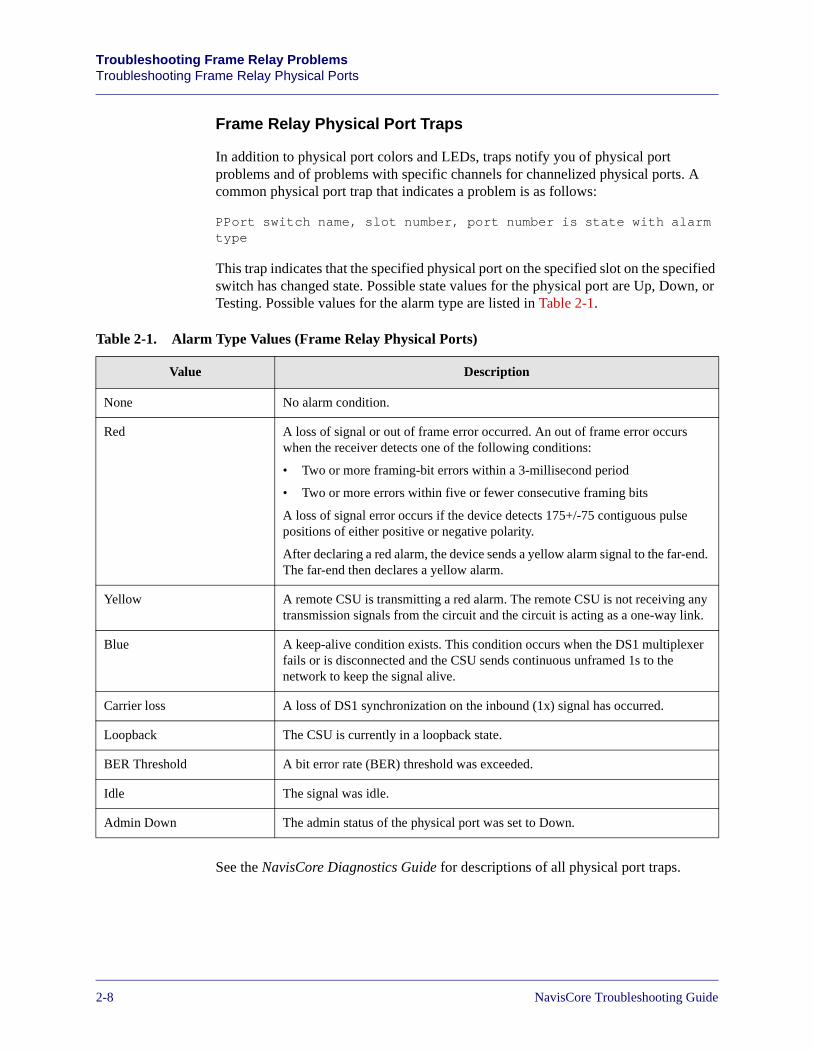
Beta Draft ConfidentialTroubleshooting Frame Relay ProblemsTroubleshooting Frame Relay Physical Ports
Frame Relay Physical Port Traps
In addition to physical port colors and LEDs, traps notify you of physical port problems and of problems with specific channels for channelized physical ports. A common physical port trap that indicates a problem is as follows:
PPort switch name, slot number, port number is state with alarm type
This trap indicates that the specified physical port on the specified slot on the specified switch has changed state. Possible state values for the physical port are Up, Down, or Testing. Possible values for the alarm type are listed in Table 2-1.
See the NavisCore Diagnostics Guide for descriptions of all physical port traps.
Table 2-1. Alarm Type Values (Frame Relay Physical Ports)
Value Description
None No alarm condition.
Red A loss of signal or out of frame error occurred. An out of frame error occurs when the receiver detects one of the following conditions:
• Two or more framing-bit errors within a 3-millisecond period
• Two or more errors within five or fewer consecutive framing bits
A loss of signal error occurs if the device detects 175+/-75 contiguous pulse positions of either positive or negative polarity.
After declaring a red alarm, the device sends a yellow alarm signal to the far-end. The far-end then declares a yellow alarm.
Yellow A remote CSU is transmitting a red alarm. The remote CSU is not receiving any transmission signals from the circuit and the circuit is acting as a one-way link.
Blue A keep-alive condition exists. This condition occurs when the DS1 multiplexer fails or is disconnected and the CSU sends continuous unframed 1s to the network to keep the signal alive.
Carrier loss A loss of DS1 synchronization on the inbound (1x) signal has occurred.
Loopback The CSU is currently in a loopback state.
BER Threshold A bit error rate (BER) threshold was exceeded.
Idle The signal was idle.
Admin Down The admin status of the physical port was set to Down.
2-87/17/03 NavisCore Troubleshooting Guide
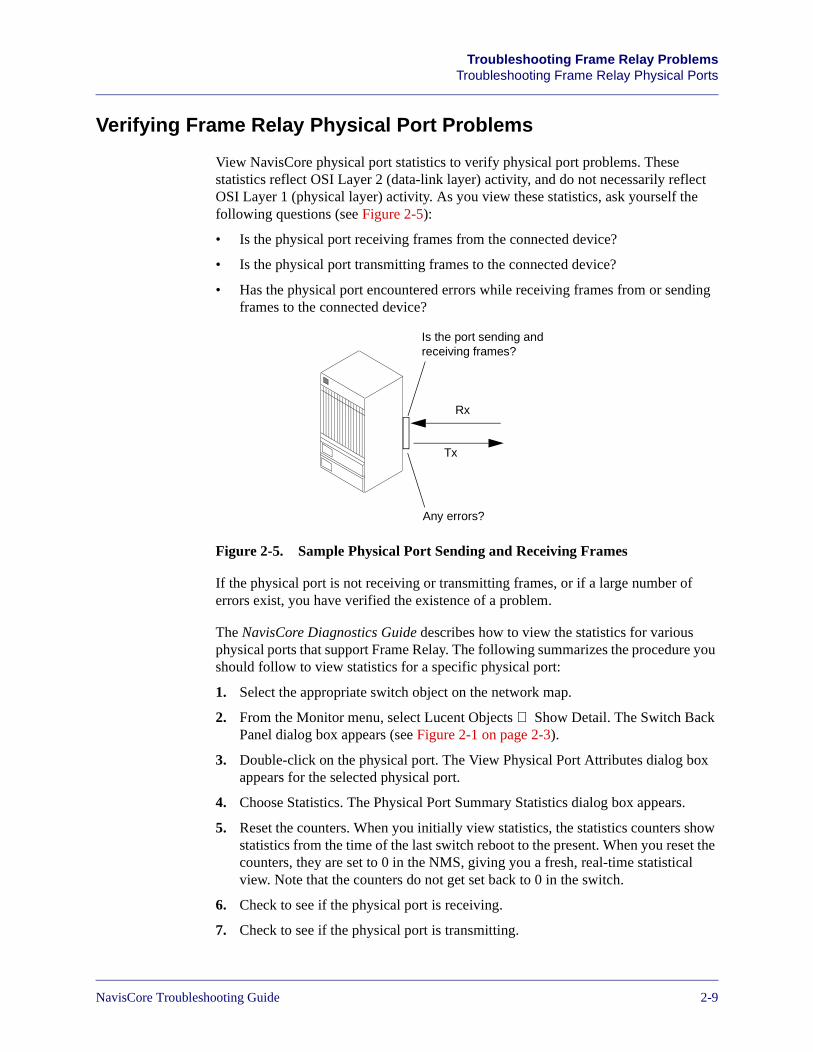
Beta Draft ConfidentialTroubleshooting Frame Relay Problems
Troubleshooting Frame Relay Physical Ports
Verifying Frame Relay Physical Port Problems
View NavisCore physical port statistics to verify physical port problems. These statistics reflect OSI Layer 2 (data-link layer) activity, and do not necessarily reflect OSI Layer 1 (physical layer) activity. As you view these statistics, ask yourself the following questions (see Figure 2-5):
• Is the physical port receiving frames from the connected device?
• Is the physical port transmitting frames to the connected device?
• Has the physical port encountered errors while receiving frames from or sending frames to the connected device?
Figure 2-5. Sample Physical Port Sending and Receiving Frames
If the physical port is not receiving or transmitting frames, or if a large number of errors exist, you have verified the existence of a problem.
The NavisCore Diagnostics Guide describes how to view the statistics for various physical ports that support Frame Relay. The following summarizes the procedure you should follow to view statistics for a specific physical port:
1. Select the appropriate switch object on the network map.
2. From the Monitor menu, select Lucent Objects ⇒ Show Detail. The Switch Back Panel dialog box appears (see Figure 2-1 on page 2-3).
3. Double-click on the physical port. The View Physical Port Attributes dialog box appears for the selected physical port.
4. Choose Statistics. The Physical Port Summary Statistics dialog box appears.
5. Reset the counters. When you initially view statistics, the statistics counters show statistics from the time of the last switch reboot to the present. When you reset the counters, they are set to 0 in the NMS, giving you a fresh, real-time statistical view. Note that the counters do not get set back to 0 in the switch.
6. Check to see if the physical port is receiving.
7. Check to see if the physical port is transmitting.
Tx
Rx
Is the port sending and receiving frames?
Any errors?
NavisCore Troubleshooting Guide 7/17/032-9
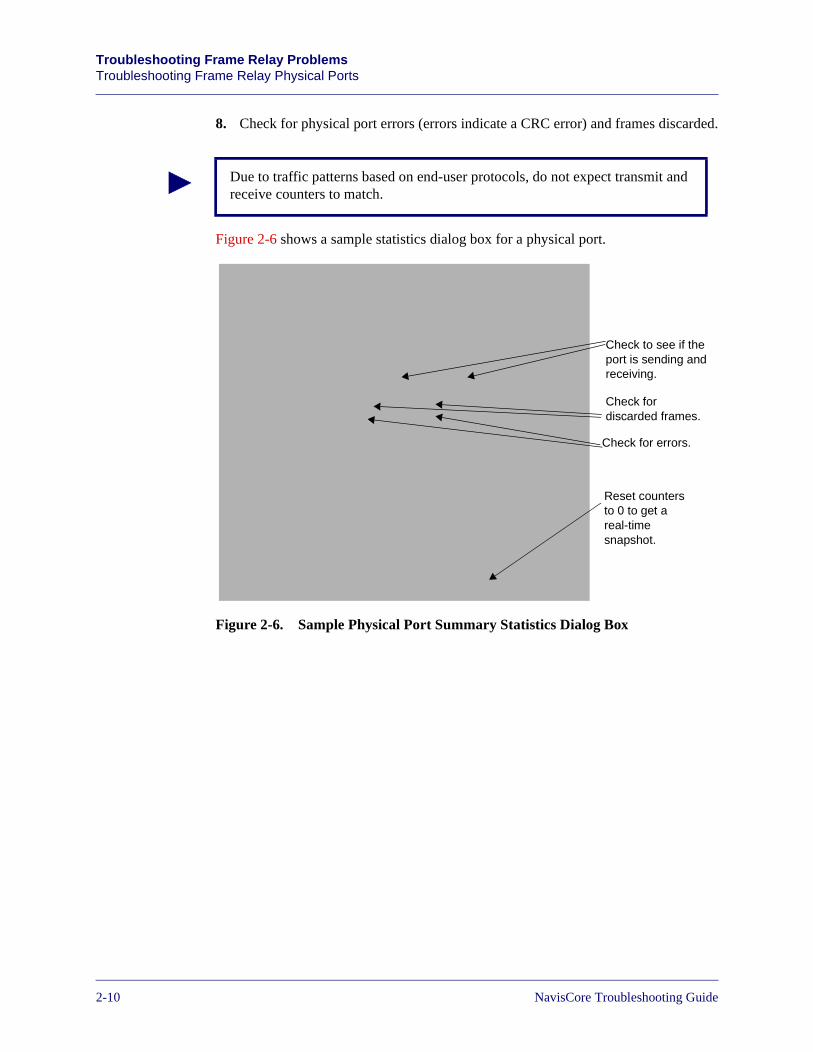
Beta Draft ConfidentialTroubleshooting Frame Relay ProblemsTroubleshooting Frame Relay Physical Ports
8. Check for physical port errors (errors indicate a CRC error) and frames discarded.
Figure 2-6 shows a sample statistics dialog box for a physical port.
Figure 2-6. Sample Physical Port Summary Statistics Dialog Box
Due to traffic patterns based on end-user protocols, do not expect transmit and receive counters to match.
Check for errors.
Check to see if the port is sending and receiving.
Reset counters to 0 to get a real-time snapshot.
Check for discarded frames.
2-107/17/03 NavisCore Troubleshooting Guide
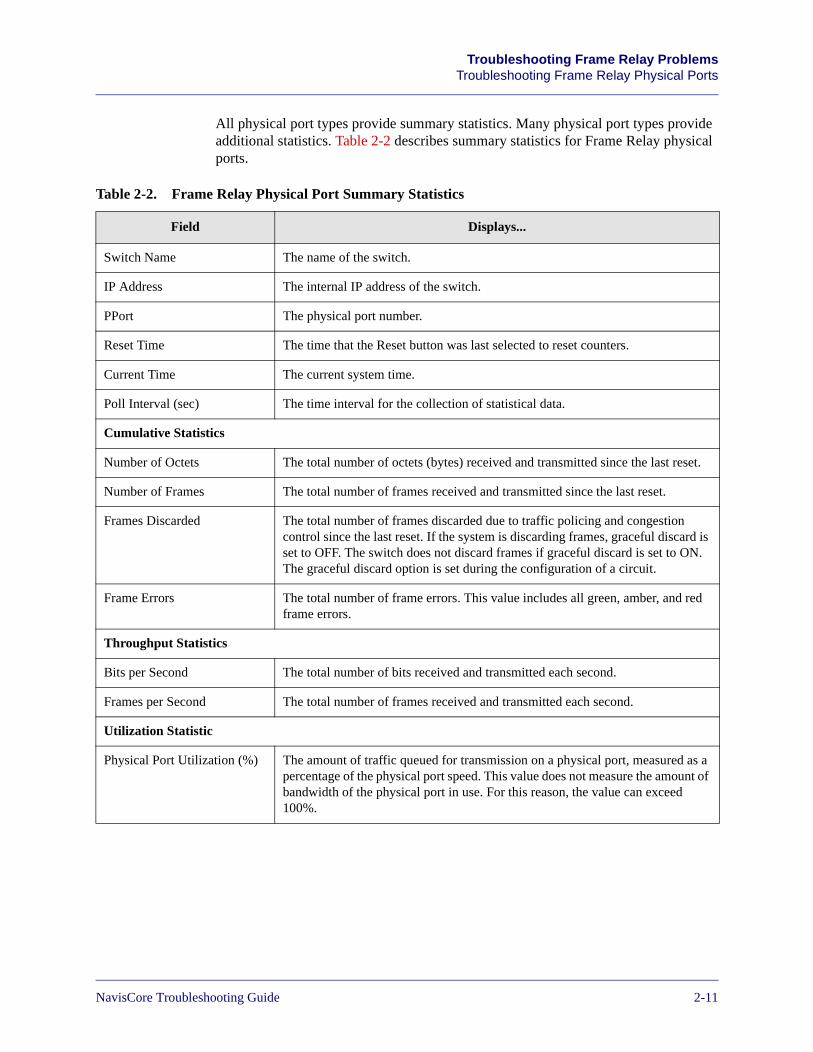
Beta Draft ConfidentialTroubleshooting Frame Relay Problems
Troubleshooting Frame Relay Physical Ports
All physical port types provide summary statistics. Many physical port types provide additional statistics. Table 2-2 describes summary statistics for Frame Relay physical ports.
Table 2-2. Frame Relay Physical Port Summary Statistics
Field Displays...
Switch Name The name of the switch.
IP Address The internal IP address of the switch.
PPort The physical port number.
Reset Time The time that the Reset button was last selected to reset counters.
Current Time The current system time.
Poll Interval (sec) The time interval for the collection of statistical data.
Cumulative Statistics
Number of Octets The total number of octets (bytes) received and transmitted since the last reset.
Number of Frames The total number of frames received and transmitted since the last reset.
Frames Discarded The total number of frames discarded due to traffic policing and congestion control since the last reset. If the system is discarding frames, graceful discard is set to OFF. The switch does not discard frames if graceful discard is set to ON. The graceful discard option is set during the configuration of a circuit.
Frame Errors The total number of frame errors. This value includes all green, amber, and red frame errors.
Throughput Statistics
Bits per Second The total number of bits received and transmitted each second.
Frames per Second The total number of frames received and transmitted each second.
Utilization Statistic
Physical Port Utilization (%) The amount of traffic queued for transmission on a physical port, measured as a percentage of the physical port speed. This value does not measure the amount of bandwidth of the physical port in use. For this reason, the value can exceed 100%.
NavisCore Troubleshooting Guide 7/17/032-11
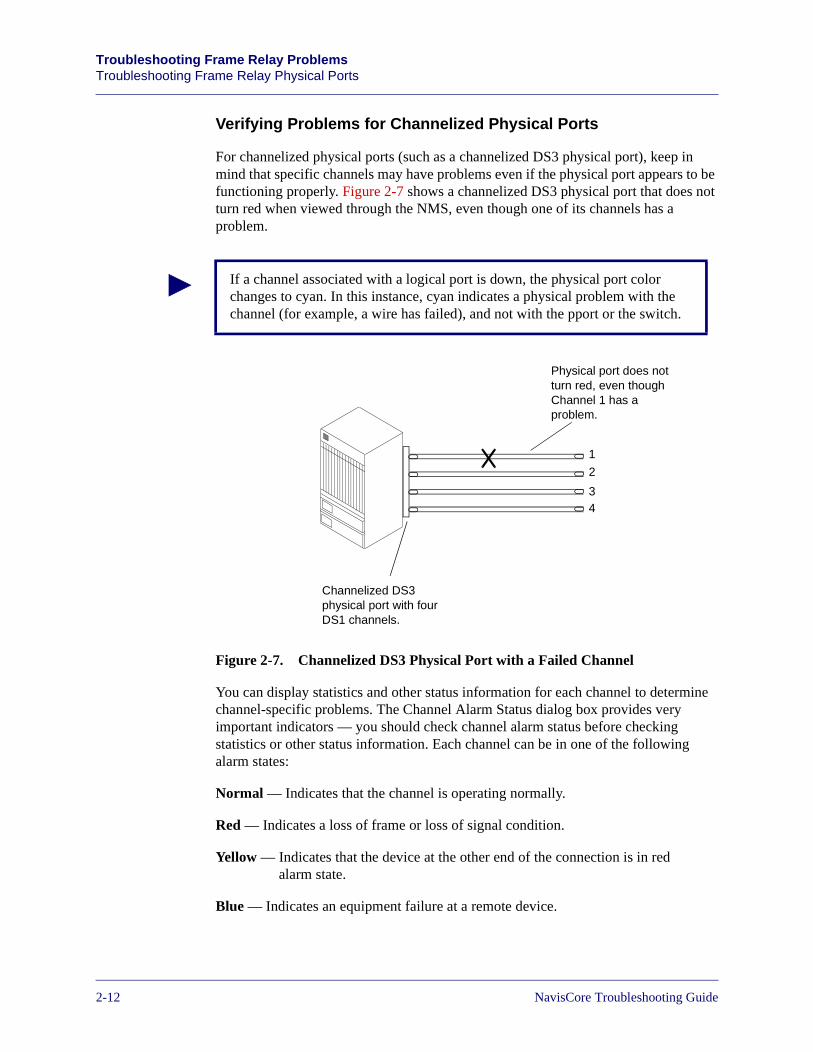
Beta Draft ConfidentialTroubleshooting Frame Relay ProblemsTroubleshooting Frame Relay Physical Ports
Verifying Problems for Channelized Physical Ports
For channelized physical ports (such as a channelized DS3 physical port), keep in mind that specific channels may have problems even if the physical port appears to be functioning properly. Figure 2-7 shows a channelized DS3 physical port that does not turn red when viewed through the NMS, even though one of its channels has a problem.
Figure 2-7. Channelized DS3 Physical Port with a Failed Channel
You can display statistics and other status information for each channel to determine channel-specific problems. The Channel Alarm Status dialog box provides very important indicators — you should check channel alarm status before checking statistics or other status information. Each channel can be in one of the following alarm states:
Normal — Indicates that the channel is operating normally.
Red — Indicates a loss of frame or loss of signal condition.
Yellow — Indicates that the device at the other end of the connection is in red alarm state.
Blue — Indicates an equipment failure at a remote device.
If a channel associated with a logical port is down, the physical port color changes to cyan. In this instance, cyan indicates a physical problem with the channel (for example, a wire has failed), and not with the pport or the switch.
Channelized DS3 physical port with four DS1 channels.
1
2
34
Physical port does not turn red, even though Channel 1 has a problem.
2-127/17/03 NavisCore Troubleshooting Guide
Beta Draft ConfidentialTroubleshooting Frame Relay Problems
Troubleshooting Frame Relay Physical Ports
To view the alarm status:
1. Select the appropriate switch object on the network map.
2. From the Monitor menu, select Lucent Objects ⇒ Show Detail. The Switch Back Panel dialog box appears (see Figure 2-1 on page 2-3).
3. Double-click on the channelized DS3 or DS3/1/0 physical port. The View Physical Port Attributes dialog box appears.
4. Choose Chan Alarm Status. The Channel Alarm Status dialog box appears (see Figure 2-8).
Figure 2-8. Channel Alarm Status Dialog Box
NavisCore Troubleshooting Guide 7/17/032-13
Beta Draft ConfidentialTroubleshooting Frame Relay ProblemsTroubleshooting Frame Relay Physical Ports
Isolating Frame Relay Physical Port Problems
Once you have verified that a problem exists, perform diagnostic tests and loopback tests to isolate the problem. These tests pinpoint the problem to a specific component, configuration, cable, or connection.
Diagnostic Tests
You can obtain node-level diagnostic information for a selected switch, as well as physical and logical port-level diagnostic information. NavisCore provides the following diagnostic programs:
Background Diagnostics — Run continuously in background to monitor the switches for potential failures or problems. Background diagnostics execute automatically and do not interfere with switch operations.
Foreground Diagnostics — Provide current status for all active switches and enable you to test physical and logical port integrity.
Background Diagnostics
Background diagnostics can alert you to the following types of problems that can occur on an active switch:
• Corruption of different data structures
• Corruption of code space
Background diagnostics provide real-time status information, categorized by fatal and non-fatal errors.
Fatal errors — Includes those conditions that cause the module (e.g., an IOP) to fail and reboot and may also include user-initiated outages, such as a requested reboot, synchronization, or software download. Document and report any non-user initiated fatal errors to the Lucent Technical Assistance Center (TAC).
Non-fatal errors — Includes those conditions whereby system resources are strained by some event, either internally or externally. Non-fatal errors are reported to the NMS via trap alarms and viewed through the Lucent Events browser.
For details on how to use background diagnostics, see the NavisCore Diagnostics Guide.
2-147/17/03 NavisCore Troubleshooting Guide
Beta Draft ConfidentialTroubleshooting Frame Relay Problems
Troubleshooting Frame Relay Physical Ports
Foreground Diagnostics
You can run foreground diagnostics on a module, a physical port, a channel, or a logical port. You cannot run foreground diagnostics on a CP, SP, or NP.
You use foreground diagnostics to test for problems indicated by background diagnostics (non-fatal errors) or to collect statistical data. You can also run foreground diagnostics to verify that new equipment functions properly.
Foreground diagnostics enable you to:
• Verify whether a module, physical port, channel, or logical port is transmitting data properly at the physical link level
• Isolate the cause of a transmission stall error (error codes 27.1 and 27.2)
Foreground diagnostics provide more information about non-fatal error conditions. The following foreground diagnostic tests are available, depending on the component you are testing:
Internal — Tests the internal hardware of a specific physical port. You can use this test on all modules.
External — Performs an external test that directs signals back toward the source along a communications path to test the module’s ability to send and receive data. This test requires an external loopback connector, which you install on the physical port being tested.
For details on how to use foreground diagnostics, see the NavisCore Diagnostics Guide.
Foreground diagnostic tests require the physical port to provide clocking (set to Internal).
It is recommended that you run foreground diagnostics on a physical port only if it appears red on the switch back panel.
Do not run foreground diagnostics at the physical port level if individual DS1 or DS0 channels are malfunctioning, but other channels are functioning properly. Instead, run foreground diagnostics on the specific channels.
NavisCore Troubleshooting Guide 7/17/032-15
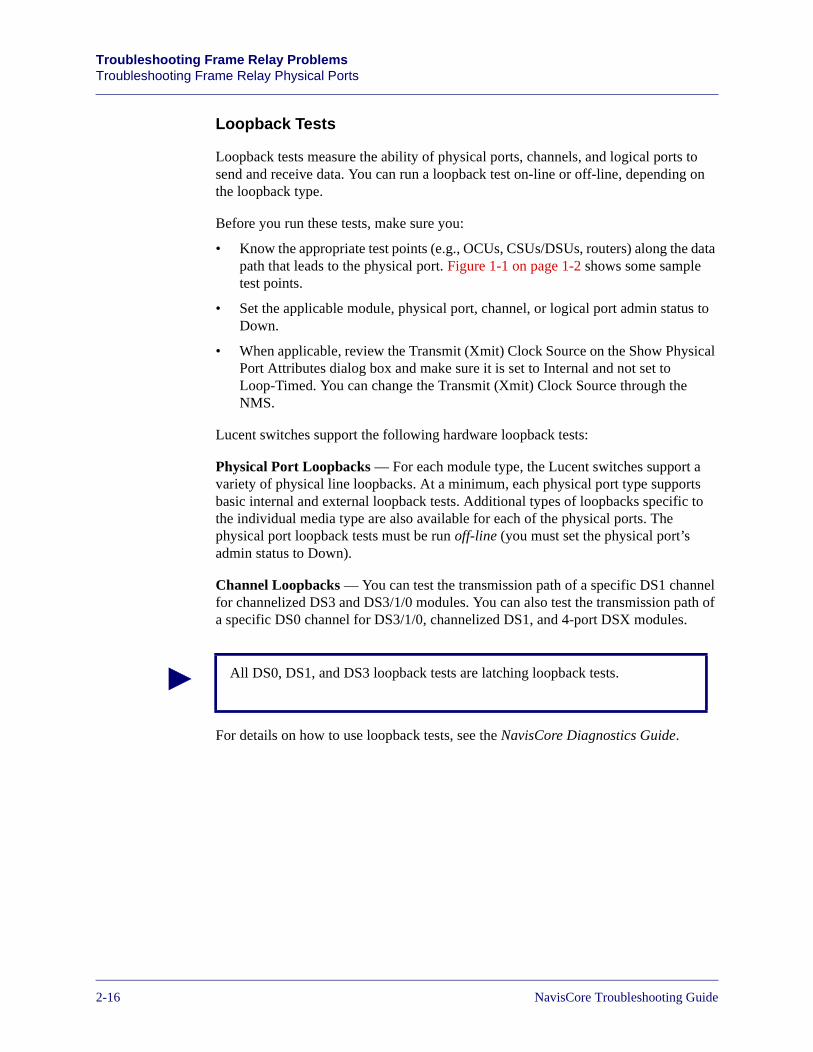
Beta Draft ConfidentialTroubleshooting Frame Relay ProblemsTroubleshooting Frame Relay Physical Ports
Loopback Tests
Loopback tests measure the ability of physical ports, channels, and logical ports to send and receive data. You can run a loopback test on-line or off-line, depending on the loopback type.
Before you run these tests, make sure you:
• Know the appropriate test points (e.g., OCUs, CSUs/DSUs, routers) along the data path that leads to the physical port. Figure 1-1 on page 1-2 shows some sample test points.
• Set the applicable module, physical port, channel, or logical port admin status to Down.
• When applicable, review the Transmit (Xmit) Clock Source on the Show Physical Port Attributes dialog box and make sure it is set to Internal and not set to Loop-Timed. You can change the Transmit (Xmit) Clock Source through the NMS.
Lucent switches support the following hardware loopback tests:
Physical Port Loopbacks — For each module type, the Lucent switches support a variety of physical line loopbacks. At a minimum, each physical port type supports basic internal and external loopback tests. Additional types of loopbacks specific to the individual media type are also available for each of the physical ports. The physical port loopback tests must be run off-line (you must set the physical port’s admin status to Down).
Channel Loopbacks — You can test the transmission path of a specific DS1 channel for channelized DS3 and DS3/1/0 modules. You can also test the transmission path of a specific DS0 channel for DS3/1/0, channelized DS1, and 4-port DSX modules.
For details on how to use loopback tests, see the NavisCore Diagnostics Guide.
All DS0, DS1, and DS3 loopback tests are latching loopback tests.
2-167/17/03 NavisCore Troubleshooting Guide
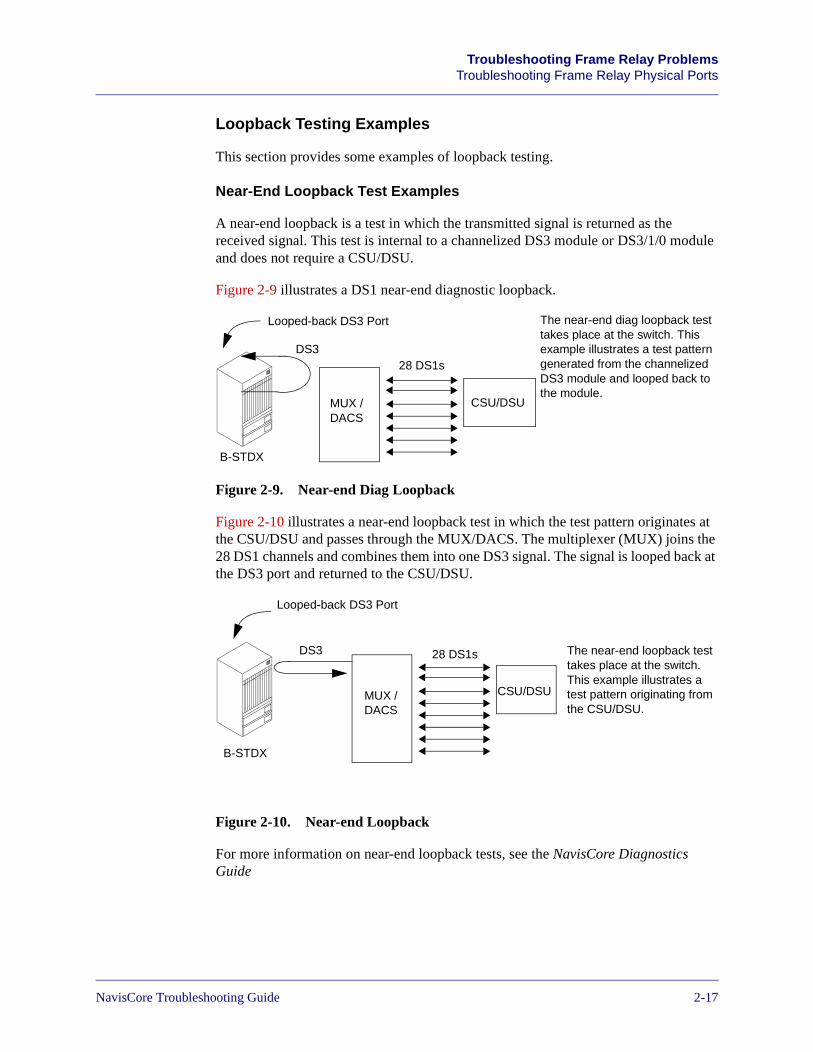
Beta Draft ConfidentialTroubleshooting Frame Relay Problems
Troubleshooting Frame Relay Physical Ports
Loopback Testing Examples
This section provides some examples of loopback testing.
Near-End Loopback Test Examples
A near-end loopback is a test in which the transmitted signal is returned as the received signal. This test is internal to a channelized DS3 module or DS3/1/0 module and does not require a CSU/DSU.
Figure 2-9 illustrates a DS1 near-end diagnostic loopback.
Figure 2-9. Near-end Diag Loopback
Figure 2-10 illustrates a near-end loopback test in which the test pattern originates at the CSU/DSU and passes through the MUX/DACS. The multiplexer (MUX) joins the 28 DS1 channels and combines them into one DS3 signal. The signal is looped back at the DS3 port and returned to the CSU/DSU.
Figure 2-10. Near-end Loopback
For more information on near-end loopback tests, see the NavisCore Diagnostics Guide
The near-end diag loopback test takes place at the switch. This example illustrates a test pattern generated from the channelized DS3 module and looped back to the module.
Looped-back DS3 Port
CSU/DSU
28 DS1s
B-STDX
DS3
MUX /DACS
The near-end loopback test takes place at the switch. This example illustrates a test pattern originating from the CSU/DSU.
Looped-back DS3 Port
28 DS1s
CSU/DSU
B-STDX
DS3
MUX /DACS
NavisCore Troubleshooting Guide 7/17/032-17
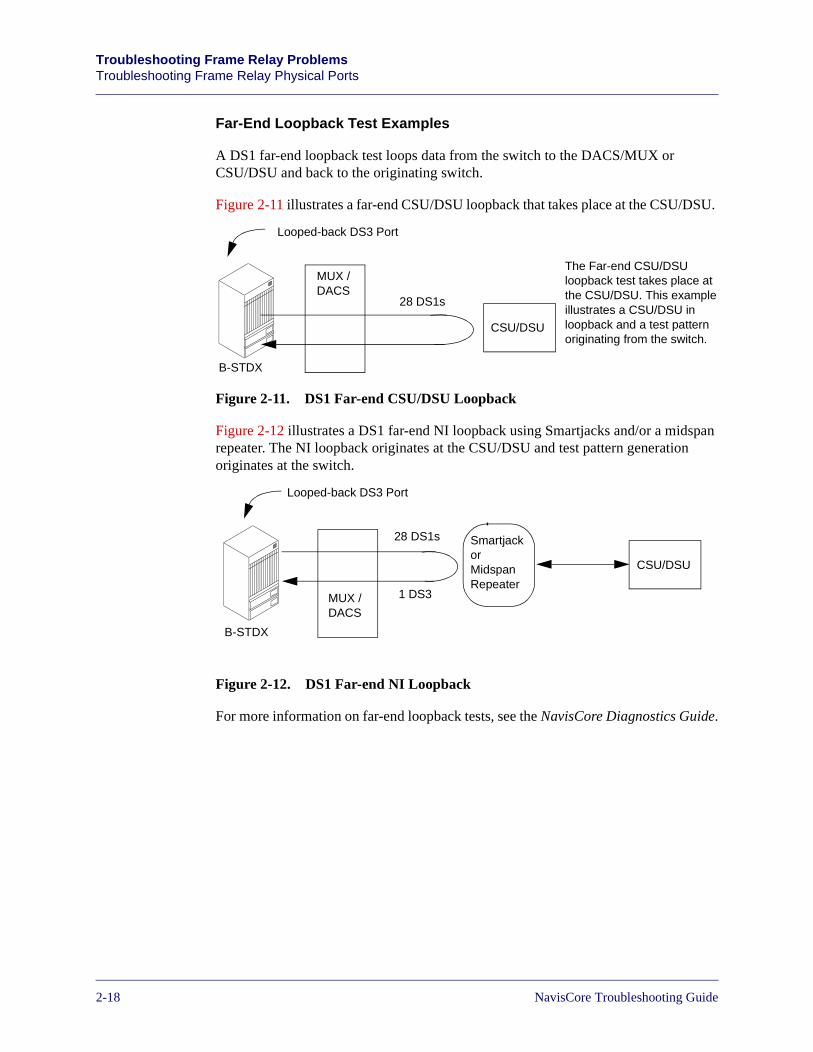
Beta Draft ConfidentialTroubleshooting Frame Relay ProblemsTroubleshooting Frame Relay Physical Ports
Far-End Loopback Test Examples
A DS1 far-end loopback test loops data from the switch to the DACS/MUX or CSU/DSU and back to the originating switch.
Figure 2-11 illustrates a far-end CSU/DSU loopback that takes place at the CSU/DSU.
Figure 2-11. DS1 Far-end CSU/DSU Loopback
Figure 2-12 illustrates a DS1 far-end NI loopback using Smartjacks and/or a midspan repeater. The NI loopback originates at the CSU/DSU and test pattern generation originates at the switch.
Figure 2-12. DS1 Far-end NI Loopback
For more information on far-end loopback tests, see the NavisCore Diagnostics Guide.
The Far-end CSU/DSU loopback test takes place atthe CSU/DSU. This example illustrates a CSU/DSU in loopback and a test pattern originating from the switch.
Looped-back DS3 Port
28 DS1s
CSU/DSU
B-STDX
MUX /DACS
Looped-back DS3 Port
1 DS3
28 DS1s SmartjackorMidspanRepeater
CSU/DSU
B-STDX
MUX /DACS
2-187/17/03 NavisCore Troubleshooting Guide
Beta Draft ConfidentialTroubleshooting Frame Relay Problems
Troubleshooting Frame Relay Physical Ports
Correcting Frame Relay Physical Port Problems
Based on the results of the diagnostic tests and/or loopback tests, you may take any number of actions, such as:
• Change the physical port configuration. For example, the results of your testing on a V.35 physical port may indicate that the port has a clocking problem. To correct this problem, you change the clock source. As another example, you may determine that a DS1 physical port’s link framing parameter does not match the link framing parameter of the CPE (e.g., a router) at the other end of the DS1 connection. See the NavisCore Physical Interface Configuration Guide for details.
• Work with the carrier or customer. Keep in mind that the switch may not be the source of the problem. Carrier equipment or CPE may be causing the problem. For example, a high Unavailable Seconds value for a DS3 physical port usually indicates a carrier problem. See the NavisCore Diagnostics Guide for more information on this value.
• Replace faulty hardware.
NavisCore Troubleshooting Guide 7/17/032-19
Beta Draft ConfidentialTroubleshooting Frame Relay ProblemsTroubleshooting Frame Relay Logical Ports
Troubleshooting Frame Relay Logical Ports
This section describes how to identify, verify, isolate, and correct problems with Frame Relay logical ports.
Identifying Frame Relay Logical Port Problems
Frame Relay logical port problems are typically identified through:
• Traps
• Customer complaints
Logical port traps notify you that the state of a logical port has changed or that a congestion threshold was exceeded. This means that the logical port may not be the source of the problem — the physical port with which the logical port is associated may be the source of the problem.
These traps are described in detail in the NavisCore Diagnostics Guide.
If a trap notifies you that the link protocol state of a logical port has changed, then LMI Operator Status is probably Down. The trap is in the format:
LPort port name at switch switch name is link protocol status
If a trap notifies you that an interface is down on a logical port, then the logical port’s Operational Status is Down. The trap is in the format:
Switch switch name interface down (SNMP linkDown trap) on LPort LPort name
“Verifying a Frame Relay Logical Port Problem” on page 2-21 describes LMI Operator Status and Operational Status in more detail.
If you notice a physical port problem at the same time that you notice a problem with a logical port associated with that physical port, then the problem lies with the physical port. Begin troubleshooting the physical port. See “Troubleshooting Frame Relay Physical Ports” on page 2-2 for more information. Otherwise, verify the logical port problem.
Physical ports on channelized modules typically have multiple logical ports associated with them. Unchannelized physical ports may also have multiple logical ports associated with a physical port.
If one or more of the logical ports malfunction, while other logical ports function normally, there is a logical port problem. Otherwise, a physical port problem may be occurring.
2-207/17/03 NavisCore Troubleshooting Guide
Beta Draft ConfidentialTroubleshooting Frame Relay ProblemsTroubleshooting Frame Relay Logical Ports
Verifying a Frame Relay Logical Port Problem
The Frame Relay Logical Port Summary Statistics dialog box provides you with a lot of useful information for verifying Frame Relay logical port problems.
Follow these steps to check for a logical port problem:
1. Select the appropriate switch object on the network map.
2. From the Monitor menu, select Lucent Objects ⇒ Show Logical Ports. The Show All Logical Ports in Switch dialog box appears.
3. Select the appropriate logical port name from the list of logical ports on the switch.
4. If the Oper Status field on the Show All Logical Ports in Switch dialog box indicates that the selected logical port is down, check for a physical port problem. See “Troubleshooting Frame Relay Physical Ports” on page 2-2 for more information. Otherwise, proceed to the next step.
5. Select Options ⇒ Statistics.
6. Choose View. The Logical Port Summary statistics dialog box appears (see Figure 2-13 on page 2-22).
7. Check to see if the LMI Operator Status displays a value of Up. If it is set to Down, there is a problem with the logical port.
8. Check to see if the logical port is transmitting and receiving LMI status frames. This information is displayed in the Cumulative Statistics fields. If no frames are being transmitted or received, there is a problem with the logical port.
9. Check for DCE or DTE errors, which indicate a problem with the logical port.
10. Check to see if the logical port is transmitting and receiving any frames at all.
Figure 2-13 shows a sample Logical Port Summary Statistics dialog box for a Frame Relay UNI DCE logical port. Note that for UNI DCE logical ports, the DTE fields are grayed out, and, for UNI DTE logical ports, the DCE fields are grayed out. For NNI logical ports, both DTE and DCE fields appear.
If the physical port has channels configured on it, also check for a channel problem. See “Verifying Problems for Channelized Physical Ports” on page 2-12 for more information.
If LMI Operator Status is Down, and the field is grayed out, then LMI Operator Status was disabled manually. LMI Operator Status is disabled by setting the Link Mgmt Protocol attribute to Disabled. See the NavisCore Frame Relay Configuration Guide for more information.
NavisCore Troubleshooting Guide 7/17/032-21
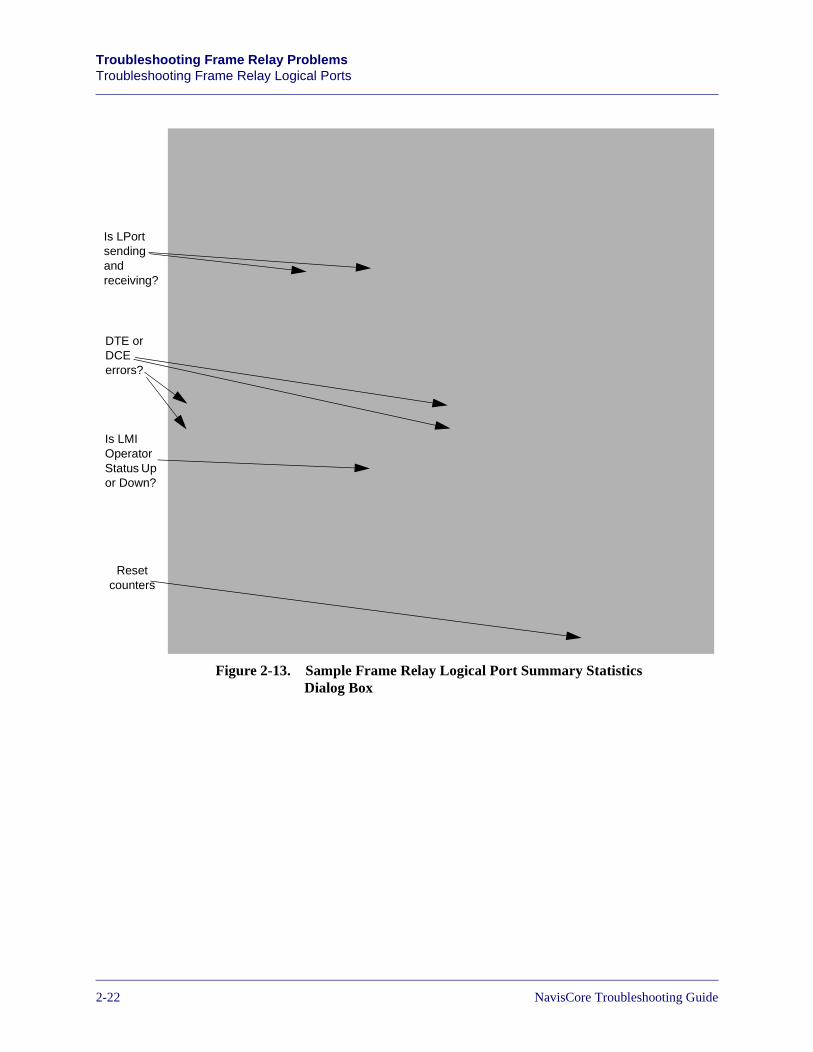
Beta Draft ConfidentialTroubleshooting Frame Relay ProblemsTroubleshooting Frame Relay Logical Ports
Figure 2-13. Sample Frame Relay Logical Port Summary Statistics Dialog Box
Is LMI Operator Status Up or Down?
Is LPort sending and receiving?
DTE or DCE errors?
Reset counters
2-227/17/03 NavisCore Troubleshooting Guide
Beta Draft ConfidentialTroubleshooting Frame Relay ProblemsTroubleshooting Frame Relay Logical Ports
Is LMI Operator Status Up?
LMI Operator Status is an extremely important indicator. For a Frame Relay logical port to operate properly, LMI Operator Status must be Up. Because Frame Relay is a connection-oriented protocol, the DTE must know the status of the logical link to the DCE at all times, and it is LMI that maintains the logical link.
When LMI Operator Status is Down, the operational status of any PVCs associated with the logical port is Inactive.
LMI Operator Status could be Down for any of the following reasons:
• CPE equipment, such as a router, may have been powered down. In this case, look for a trap that indicates a change in logical port status.
• A physical layer problem may exist. In this case, look for a trap that indicates a change in physical port status or check physical port summary statistics errors. Examples of physical layer problems include bad cables, a bad DS1or DS0 channel or a misconfigured physical port. See the NavisCore Diagnostics Guide for more information on physical port summary statistics.
• A Frame Relay configuration error may exist. Look for errors on the Frame Relay Logical Port Summary Statistics dialog box. Examples of configuration problems include a misconfigured DCE poll timer or a misconfigured logical port type. See the NavisCore Frame Relay Configuration Guide for more information on Frame Relay configuration.
• Hardware failures may have occurred, as indicated by traps and background diagnostics. Check for problems with CSUs/DSUs, routers, carrier equipment, and Lucent equipment.
If there is a problem with the logical port and the LMI Operator Status is Up, check for the following conditions:
• DTE/DCE errors
• Failure to transmit or receive any frames at all
If LMI Operator Status is Down, and the field is grayed out, then LMI Operator Status was disabled manually. LMI Operator Status is disabled by setting the Link Mgmt Protocol attribute to Disabled. See the NavisCore Frame Relay Configuration Guide for more information.
NavisCore Troubleshooting Guide 7/17/032-23
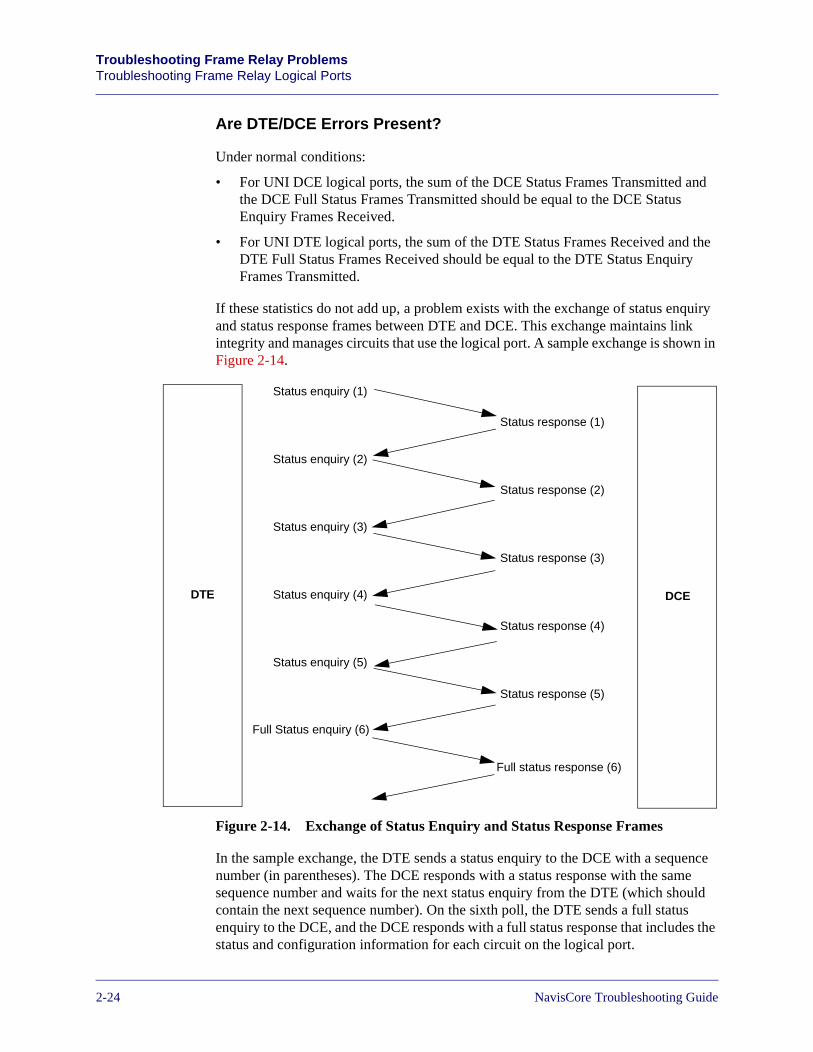
Beta Draft ConfidentialTroubleshooting Frame Relay ProblemsTroubleshooting Frame Relay Logical Ports
Are DTE/DCE Errors Present?
Under normal conditions:
• For UNI DCE logical ports, the sum of the DCE Status Frames Transmitted and the DCE Full Status Frames Transmitted should be equal to the DCE Status Enquiry Frames Received.
• For UNI DTE logical ports, the sum of the DTE Status Frames Received and the DTE Full Status Frames Received should be equal to the DTE Status Enquiry Frames Transmitted.
If these statistics do not add up, a problem exists with the exchange of status enquiry and status response frames between DTE and DCE. This exchange maintains link integrity and manages circuits that use the logical port. A sample exchange is shown in Figure 2-14.
Figure 2-14. Exchange of Status Enquiry and Status Response Frames
In the sample exchange, the DTE sends a status enquiry to the DCE with a sequence number (in parentheses). The DCE responds with a status response with the same sequence number and waits for the next status enquiry from the DTE (which should contain the next sequence number). On the sixth poll, the DTE sends a full status enquiry to the DCE, and the DCE responds with a full status response that includes the status and configuration information for each circuit on the logical port.
DTE
Status enquiry (1)
Status response (1)
Status response (2)
Status response (3)
Status response (4)
Status response (5)
Status enquiry (2)
Status enquiry (3)
Status enquiry (4)
Status enquiry (5)
Full Status enquiry (6)
Full status response (6)
DCE
2-247/17/03 NavisCore Troubleshooting Guide
Beta Draft ConfidentialTroubleshooting Frame Relay ProblemsTroubleshooting Frame Relay Logical Ports
If you notice DTE or DCE errors (such as DTE/DCE Error Frames Received or DTE/DCE Status Enquiry Frames Error Count), a link management configuration problem may exist. Verify the logical port link management configuration and the link management configuration of the CPE device (such as a router) on the other end. The problem may be that the DCE Poll Verify Timer is set to a value less than the DTE Poll Interval. This is a typical configuration error — the DCE Poll Verify Timer should be higher than the DTE Poll Interval.
Is the Logical Port Transmitting and Receiving Frames at All?
To tell whether the logical port is transmitting and receiving any frames, you can:
• Check the operational status for the logical port. You can view this information in the Oper Status field on the Show All Logical Ports in Switch dialog box (see the NavisCore Diagnostics Guide for more information). If the operational status is Down, you know that the logical port is incapable of sending or receiving frames. If the operational status is Down for all logical ports on a physical port, a problem exists at the physical port level. See “Troubleshooting Frame Relay Physical Ports” on page 2-2 for more information.
• Reset the counters on the Logical Port Summary Statistics dialog box. If the counters do not increment at all, you know that the logical port is not sending or receiving any frames. The physical port should be checked to ensure that it is not the source of the problem. See “Troubleshooting Frame Relay Physical Ports” on page 2-2 for more information.
Keep in mind that you may have a situation in which LMI Operator Status is Down but Oper Status is Up. This indicates that the physical link is operating normally, but the problem involves link management. See “Is LMI Operator Status Up?” on page 2-23 for more information.
Is the Logical Port Configured on a Physical Port Channel?
If a logical port associated with a channel is down, the physical port color changes to cyan. In this instance, cyan indicates a physical problem with the lport or channel (for example, a wire has failed), and not with the switch or pport. Check lport and channel statistics for more information.
If the logical port is configured on the DS0 channel of a channelized DS3/1/0 module, the failed logical port may have run out of buffers. When configuring logical ports on the DS0 channel, you have to consider the First-in First-out (FIFO) block limits for the card. For more information on FIFO block limits, see “First-in First-out Block Limits on Channelized DS3/1 and DS3/1/0 Modules (CBX 500)” on page 2-73.
NavisCore Troubleshooting Guide 7/17/032-25
Beta Draft ConfidentialTroubleshooting Frame Relay ProblemsTroubleshooting Frame Relay Logical Ports
Isolating a Frame Relay Logical Port Problem
You can isolate logical port problems in two ways:
• Run diagnostics and loopbacks
• Change logical ports from UNI to NNI
Running Diagnostics and Loopbacks to Isolate Logical Port Problems
Once you have verified that a problem exists, you can isolate the problem with internal and external diagnostics and loopbacks. These diagnostics and loopbacks are similar to the diagnostics and loopbacks you can use to test physical ports. See “Isolating Frame Relay Physical Port Problems” on page 2-14 and the NavisCore Diagnostics Guide for more information.
For logical ports associated with DS1 and DS0 channels on channelized modules (such as Channelized DS1, Channelized DS3, and Channelized DS3/1/0 modules), loopback tests effect only the DS1 and DS0 channels associated with the logical port. They do not effect the entire physical port.
Example: Logical Ports on a B-STDX Channelized DS1 Module
To test logical ports associated with DS0 circuits on B-STDX Channelized DS1 modules, you can run the following loopback tests:
• DS0 near-end loopback from the NMS
• Loopback from far-end equipment
Figure 2-15 shows the test points for isolating problems with a DS0 circuit between a B-STDX 9000 and a router (Router 6).
2-267/17/03 NavisCore Troubleshooting Guide
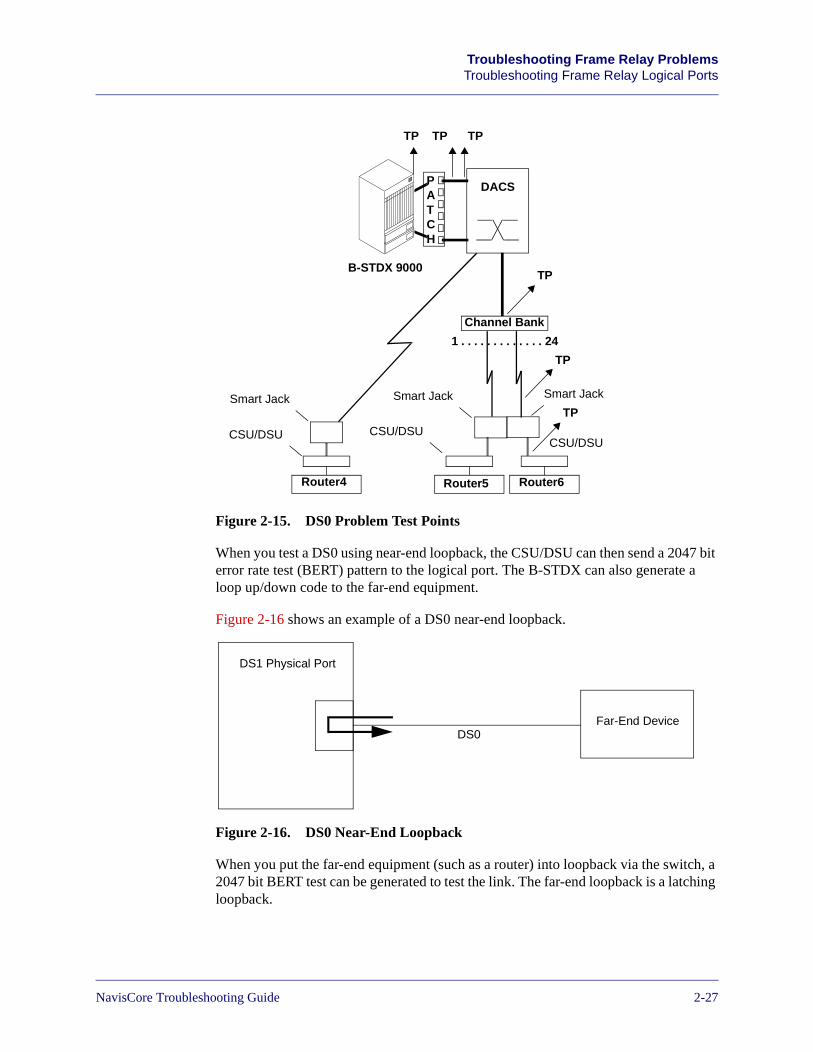
Beta Draft ConfidentialTroubleshooting Frame Relay ProblemsTroubleshooting Frame Relay Logical Ports
Figure 2-15. DS0 Problem Test Points
When you test a DS0 using near-end loopback, the CSU/DSU can then send a 2047 bit error rate test (BERT) pattern to the logical port. The B-STDX can also generate a loop up/down code to the far-end equipment.
Figure 2-16 shows an example of a DS0 near-end loopback.
Figure 2-16. DS0 Near-End Loopback
When you put the far-end equipment (such as a router) into loopback via the switch, a 2047 bit BERT test can be generated to test the link. The far-end loopback is a latching loopback.
1 . . . . . . . . . . . . . 24
Router4 Router5 Router6
DACSPATCH
Channel Bank
CSU/DSU
Smart Jack
CSU/DSU
Smart Jack Smart Jack
CSU/DSU
TP TP TP
TP
TP
TP
B-STDX 9000
DS1 Physical Port
Far-End DeviceDS0
NavisCore Troubleshooting Guide 7/17/032-27
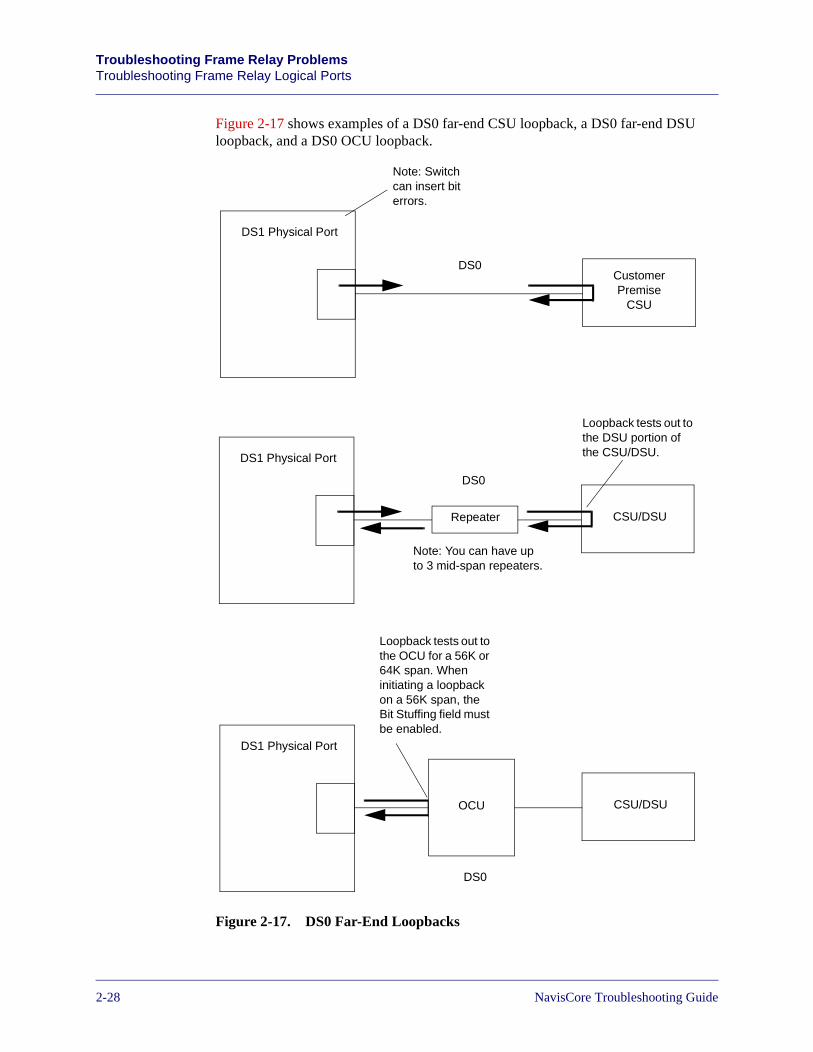
Beta Draft ConfidentialTroubleshooting Frame Relay ProblemsTroubleshooting Frame Relay Logical Ports
Figure 2-17 shows examples of a DS0 far-end CSU loopback, a DS0 far-end DSU loopback, and a DS0 OCU loopback.
Figure 2-17. DS0 Far-End Loopbacks
DS1 Physical Port
Customer Premise
CSU
DS0
DS1 Physical Port
CSU/DSURepeater
DS0
Note: You can have up to 3 mid-span repeaters.
Loopback tests out to the DSU portion of the CSU/DSU.
Note: Switch can insert bit errors.
DS1 Physical Port
CSU/DSUOCU
DS0
Loopback tests out to the OCU for a 56K or 64K span. When initiating a loopback on a 56K span, the Bit Stuffing field must be enabled.
2-287/17/03 NavisCore Troubleshooting Guide
Beta Draft ConfidentialTroubleshooting Frame Relay ProblemsTroubleshooting Frame Relay Logical Ports
Using a combination of near-end and far-end loopback tests helps to isolate a logical port problem on the Channelized DS1 module. See the NavisCore Diagnostics Guide for more information on running these tests.
Changing Logical Ports from UNI to NNI
By changing a UNI logical port to an NNI logical port, you configure the logical port to act as both DTE and DCE. The logical port can then generate a DCE status enquiry and respond to it as well. The NavisCore Frame Relay Configuration Guide explains how to configure a logical port to support NNI.
Once you change the logical port, you must place a loopback connector at either:
• The logical port’s physical port
• An external piece of equipment, such as a CSU/DSU
The NNI then responds to its own requests, which causes LMI to come up if the link is operating normally. Also, any PVCs that use the physical port should come up. If LMI or PVCs do not come up, you know that a problem exists at the switch.
Correcting Frame Relay Logical Port Problems
Based on the conclusions you reached while isolating the logical port problem, you can take any number of actions, such as:
• Power up a CPE, such as a router. Powering down a CPE can generate a logical port status trap or cause LMI to go down.
• Address physical port problems, hardware problems, and other physical layer problems such as bad cables, faulty CSUs/DSUs and routers, carrier problems, physical port configuration errors, and so on.
• Address Frame Relay configuration problems as indicated by errors in the statistics on the Frame Relay Logical Port Summary Statistics dialog box (Figure 2-13 on page 2-22). Examples of these problems include a mismatched LMI, improperly configured DCE poll timer, and an improperly configured logical port type (that is, you configured a logical port as UNI DCE when it should have been configured as UNI DTE).
NavisCore Troubleshooting Guide 7/17/032-29
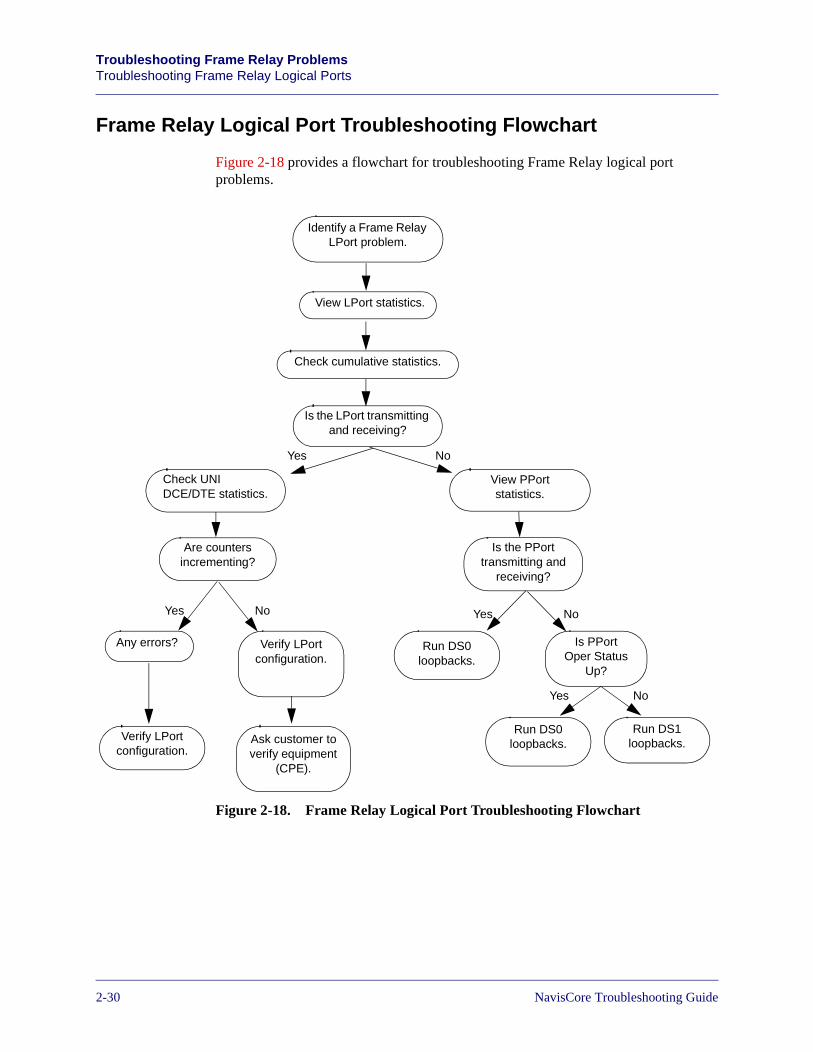
Beta Draft ConfidentialTroubleshooting Frame Relay ProblemsTroubleshooting Frame Relay Logical Ports
Frame Relay Logical Port Troubleshooting Flowchart
Figure 2-18 provides a flowchart for troubleshooting Frame Relay logical port problems.
Figure 2-18. Frame Relay Logical Port Troubleshooting Flowchart
Identify a Frame Relay LPort problem.
View LPort statistics.
Check cumulative statistics.
Is the LPort transmitting and receiving?
View PPort statistics.
Check UNI DCE/DTE statistics.
Is the PPort transmitting and
receiving?
Is PPort Oper Status
Up?
Any errors?
Verify LPort configuration.
Run DS0 loopbacks.
Verify LPort configuration.
Ask customer to verify equipment
(CPE).
Run DS0 loopbacks.
Run DS1 loopbacks.
Yes No
Yes No
Yes No
Are counters incrementing?
Yes No
2-307/17/03 NavisCore Troubleshooting Guide
Beta Draft ConfidentialTroubleshooting Frame Relay Problems
Troubleshooting Frame Relay Trunks
Troubleshooting Frame Relay Trunks
This section describes how to identify, verify, isolate, and correct problems with Frame Relay trunks.
Frame Relay Trunks
A Frame Relay trunk can fail to complete initialization for several reasons. For example, the physical port and or logical port may be in error.
The show pport statistics <slot>.<port> and show lport statistics <slot>.<port> commands are used to display physical and logical port statistics. Use these commands to monitor the receive and transmit counters. If these counters are not incrementing, then communication between the two routers is not bi-directional. The local link may be up, but the remote link is probably down with an error condition.
To route Frame Relay between Lucent switches, VNN uses OSPF with some proprietary extensions. The show tproto command is used to display trunk protocol activity on Frame Relay direct and OPTimum trunks. The physical link state counter indicates whether the trunk protocol is up or down.
Identifying Frame Relay Trunk Problems
In addition to customer complaints, you can identify trunk problems in two ways:
• Trunk colors
• Traps
NavisCore Troubleshooting Guide 7/17/032-31
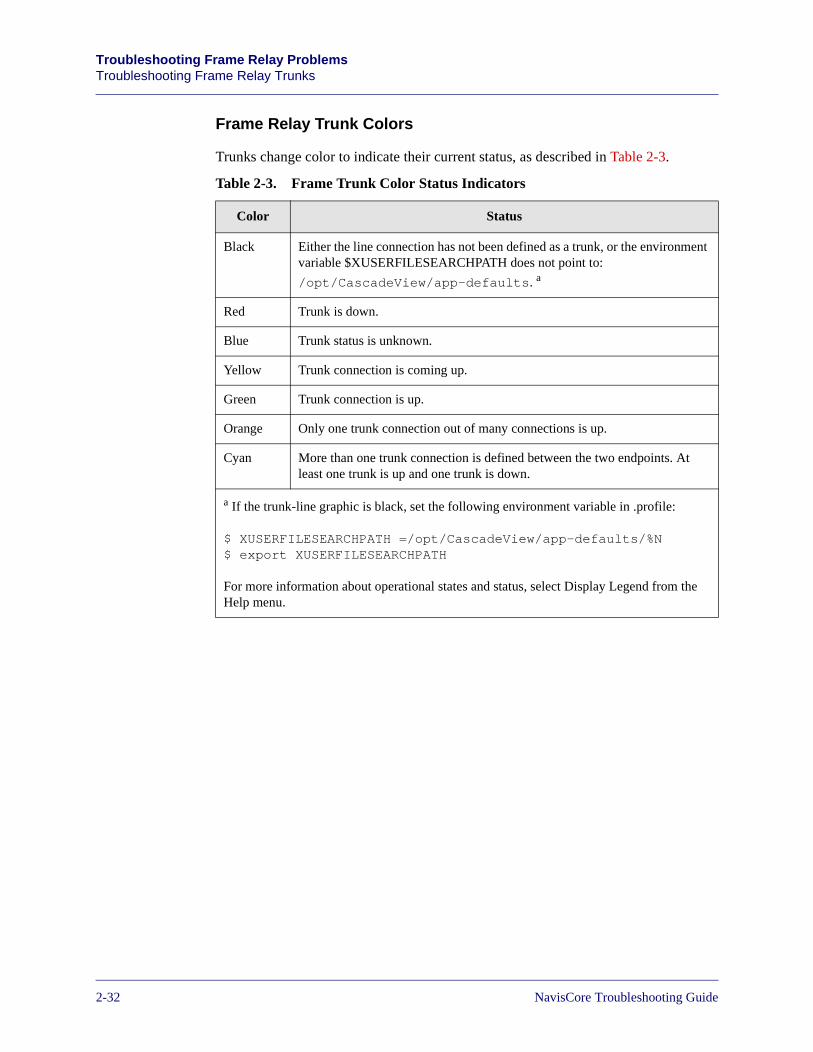
Beta Draft ConfidentialTroubleshooting Frame Relay ProblemsTroubleshooting Frame Relay Trunks
Frame Relay Trunk Colors
Trunks change color to indicate their current status, as described in Table 2-3.
Table 2-3. Frame Trunk Color Status Indicators
Color Status
Black Either the line connection has not been defined as a trunk, or the environment variable $XUSERFILESEARCHPATH does not point to:
/opt/CascadeView/app-defaults. a
Red Trunk is down.
Blue Trunk status is unknown.
Yellow Trunk connection is coming up.
Green Trunk connection is up.
Orange Only one trunk connection out of many connections is up.
Cyan More than one trunk connection is defined between the two endpoints. At least one trunk is up and one trunk is down.
a If the trunk-line graphic is black, set the following environment variable in .profile:
$ XUSERFILESEARCHPATH =/opt/CascadeView/app-defaults/%N$ export XUSERFILESEARCHPATH
For more information about operational states and status, select Display Legend from the Help menu.
2-327/17/03 NavisCore Troubleshooting Guide
Beta Draft ConfidentialTroubleshooting Frame Relay Problems
Troubleshooting Frame Relay Trunks
Frame Relay Trunk Traps
Traps notify you that the state of a trunk has changed. A close inspection of trap information may reveal the source of the problem. Some sample traps that indicate trunk state changes are as follows:
• ML Member Trunk ML member LPort name at switch switch name bound to MLFR Trunk Bundle LPort LPort name has changed state to state. The corresponding MLFR Trunk trunk name has total aggregate bandwidth of aggregate BW and operational bandwidth of operational BW.
• Trunk trunk name in switch name is down. Following PVCs are also down: circuit name list.
• Trunk trunk name at switch switch name is state
These traps are described in detail in the NavisCore Diagnostics Guide.
Correlate trunk traps with physical port and logical port traps. The source of the trunk problem may be the trunk’s physical port or logical port.
A good way to detect congestion or line problems on a trunk is to set congestion and frame error thresholds when you configure the trap control attributes for the trunk logical ports. When these thresholds are exceeded, the switch generates traps. If you suspect that a trunk has problems, you can use the trunk name to configure a filter for just the traps that describe problems with that trunk.
See the NavisCore Frame Relay Configuration Guide for more information on configuring trap control attributes. See the NavisCore Diagnostics Guide for more information on traps.
NavisCore Troubleshooting Guide 7/17/032-33
Beta Draft ConfidentialTroubleshooting Frame Relay ProblemsTroubleshooting Frame Relay Trunks
Verifying Frame Relay Trunk Problems
Summary statistics help you to verify Frame Relay trunk problems. The ping, traceroute, show tproto, and show ospf vcpath commands can also help you verify the existence of a trunk problem.
For more information on these commands, see the following sections:
• ping — See “Using ping to Verify Frame Trunk Problems” on page 2-37.
• traceroute — See “traceroute Program” on page 4-6.
• show tproto — See “Using the show tproto Command to Verify Trunk Problems” on page 3-35.
• show ospf vcpath <ip address of adjcent switch> — See the Console Command Reference.
• show pport attributes <slot>.<port> — Verify the operational status of the PPort. If it is Down, troubleshoot for a physical port problem.
• show lport attributes <slot>.<port> — Verify the operational status of the LPort. If it is Down, troubleshoot for a logical port problem.
Frame Relay Trunk Summary Statistics
The Show All Trunks dialog box and the Trunk Summary Statistics dialog box provide you with a lot of useful information for verifying trunk problems.
Follow these steps to check for a trunk problem:
1. From the Monitor menu, select Lucent Objects ⇒ Show Trunks, and select one of the following options:
All on Map — Displays a list of all the trunks configured for the current map.
All on Switch — Displays a list of all the trunks configured for a selected switch.
2. After you select an option, the Show All Trunks dialog box appears. See the NavisCore Diagnostics Guide for detailed descriptions of the fields on this dialog box.
3. Check to see if the Trunk Status displays a value of Up. If it is set to Down, there is a problem with the trunk.
4. Choose Statistics to see if the trunk is transmitting from point A to point B and vice versa (see Figure 2-19). Reset the counters to obtain a real-time snapshot of transmission activity.
5. Verify that a rate of data transmission exists — that is, there is non-zero throughput in bits per second and packets per second.
2-347/17/03 NavisCore Troubleshooting Guide
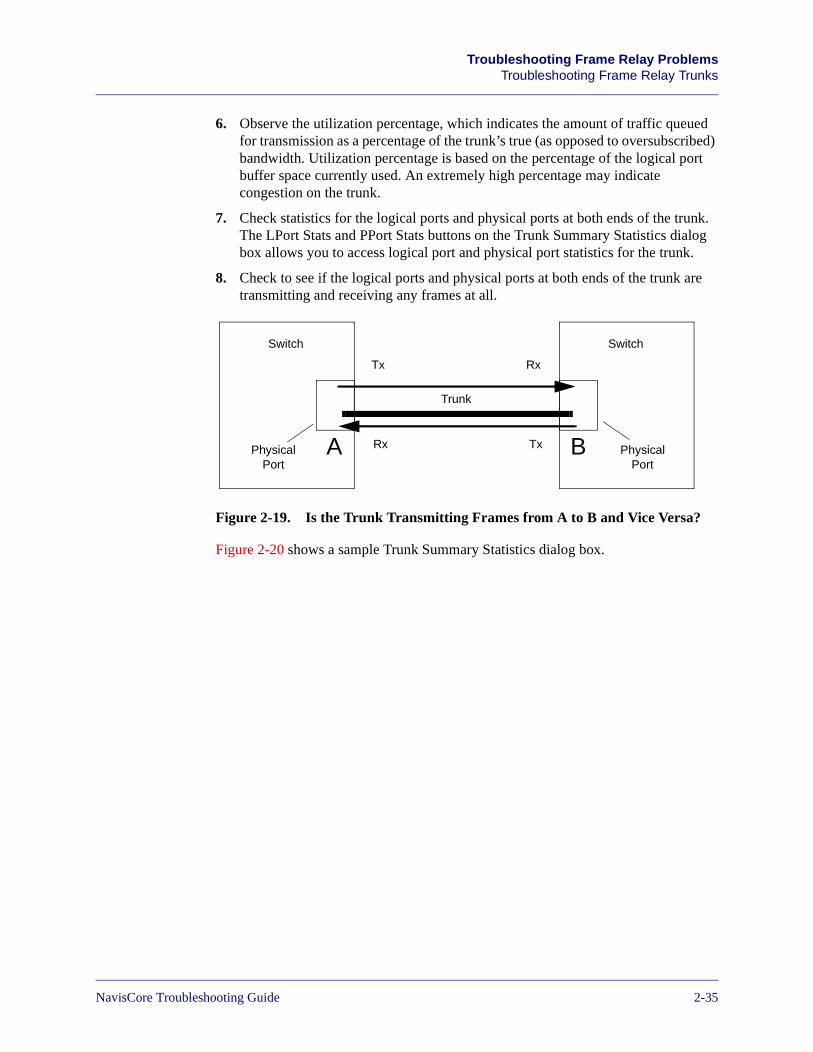
Beta Draft ConfidentialTroubleshooting Frame Relay Problems
Troubleshooting Frame Relay Trunks
6. Observe the utilization percentage, which indicates the amount of traffic queued for transmission as a percentage of the trunk’s true (as opposed to oversubscribed) bandwidth. Utilization percentage is based on the percentage of the logical port buffer space currently used. An extremely high percentage may indicate congestion on the trunk.
7. Check statistics for the logical ports and physical ports at both ends of the trunk. The LPort Stats and PPort Stats buttons on the Trunk Summary Statistics dialog box allows you to access logical port and physical port statistics for the trunk.
8. Check to see if the logical ports and physical ports at both ends of the trunk are transmitting and receiving any frames at all.
Figure 2-19. Is the Trunk Transmitting Frames from A to B and Vice Versa?
Figure 2-20 shows a sample Trunk Summary Statistics dialog box.
A B
Tx Rx
TxRx
Trunk
Physical Port
Physical Port
Switch Switch
NavisCore Troubleshooting Guide 7/17/032-35
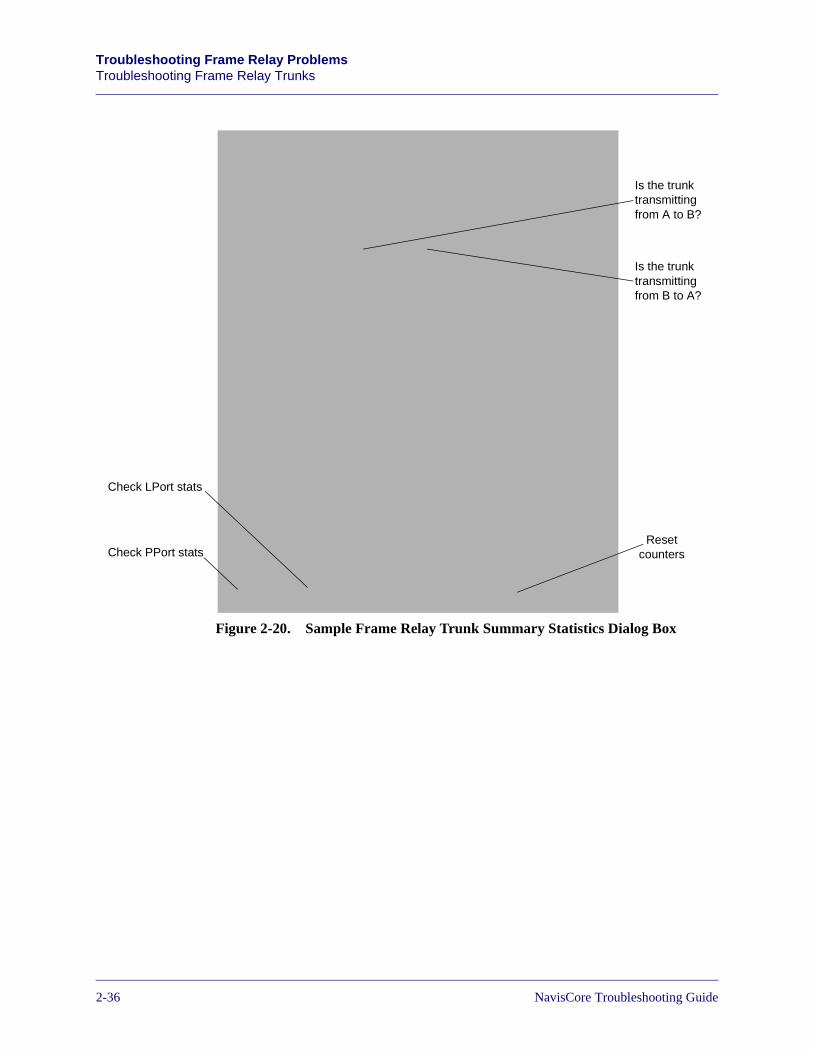
Beta Draft ConfidentialTroubleshooting Frame Relay ProblemsTroubleshooting Frame Relay Trunks
Figure 2-20. Sample Frame Relay Trunk Summary Statistics Dialog Box
Is the trunk transmitting from A to B?
Is the trunk transmitting from B to A?
Reset countersCheck PPort stats
Check LPort stats
2-367/17/03 NavisCore Troubleshooting Guide
Beta Draft ConfidentialTroubleshooting Frame Relay Problems
Troubleshooting Frame Relay Trunks
Using ping to Verify Frame Trunk Problems
The ping command is a standard troubleshooting tool in most networks. It is a request/reply program that enables you to test connectivity between two points in the network, such as the switches at both ends of a trunk. A sample ping command is shown below:
ping 150.201.87.105
This command tests connectivity between the node from which you issue the command to a network node with an IP address of 150.201.87.105. The command output would indicate whether or not 150.201.87.105 is reachable.
To test connectivity between two switches connected by a trunk, access the console of one of the switches (using telnet), and issue the ping command. Use the internal IP address of the switch at the other end of the trunk in the ping command line. You can obtain this address by performing the following steps:
1. Select the switch at the other end of the trunk on the network map.
2. Select Configuration ⇒ System Information. The System Information dialog box appears, displaying the internal IP address of the switch.
The ping command is not as useful for troubleshooting problems if multiple paths exist between two switches. For example, if multiple paths exist, and one path goes down, the ping packets will use the alternate path and indicate that connectivity between the switches exists. Ping will not indicate failure of one of the paths.
NavisCore Troubleshooting Guide 7/17/032-37
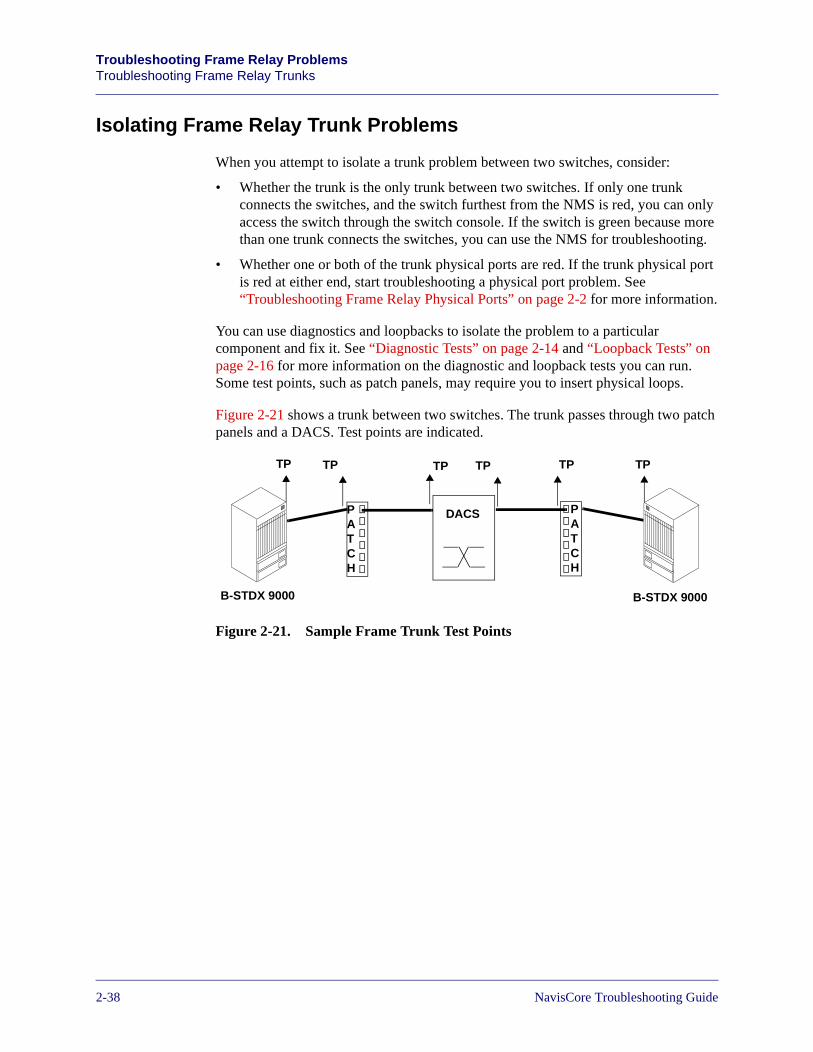
Beta Draft ConfidentialTroubleshooting Frame Relay ProblemsTroubleshooting Frame Relay Trunks
Isolating Frame Relay Trunk Problems
When you attempt to isolate a trunk problem between two switches, consider:
• Whether the trunk is the only trunk between two switches. If only one trunk connects the switches, and the switch furthest from the NMS is red, you can only access the switch through the switch console. If the switch is green because more than one trunk connects the switches, you can use the NMS for troubleshooting.
• Whether one or both of the trunk physical ports are red. If the trunk physical port is red at either end, start troubleshooting a physical port problem. See “Troubleshooting Frame Relay Physical Ports” on page 2-2 for more information.
You can use diagnostics and loopbacks to isolate the problem to a particular component and fix it. See “Diagnostic Tests” on page 2-14 and “Loopback Tests” on page 2-16 for more information on the diagnostic and loopback tests you can run. Some test points, such as patch panels, may require you to insert physical loops.
Figure 2-21 shows a trunk between two switches. The trunk passes through two patch panels and a DACS. Test points are indicated.
Figure 2-21. Sample Frame Trunk Test Points
DACSPATCH
TP TP TP
B-STDX 9000
PATCH
TPTPTP
B-STDX 9000
2-387/17/03 NavisCore Troubleshooting Guide
Beta Draft ConfidentialTroubleshooting Frame Relay Problems
Troubleshooting Frame Relay Trunks
Correcting Frame Relay Trunk Problems
Depending on the type of problem you find, you may take any number of corrective actions, including:
• Replacing faulty hardware.
• Changing the physical port configuration. See the NavisCore Physical Interface Configuration Guide for details.
• Changing the logical port configuration. See the NavisCore Frame Relay Configuration Guide for more information.
NavisCore Troubleshooting Guide 7/17/032-39
Beta Draft ConfidentialTroubleshooting Frame Relay ProblemsTroubleshooting Frame Relay PVCs
Troubleshooting Frame Relay PVCs
This section provides guidelines on troubleshooting Frame Relay PVCs.
Identifying Frame Relay PVC Problems
You identify Frame Relay PVC problems through:
• Traps
• Customer complaints
Frame Relay PVC Traps
Traps are the only PVC problem indicators available through NavisCore. Switches generate traps when events that effect PVCs occur.
The following traps inform you of PVC problems:
Circuit circuit name at switch switch name is state with fail reason (FailNode: node ID, FailPort: LPort IF index)
This trap indicates that the specified point-to-point Frame Relay PVC on the specified switch has changed state. The possible states for the circuit include active (0), inactive (1), and invalid (2). When the circuit is inactive, an explanation is provided in the fail reason portion of the message. The node where the failure occurred is also indicated (the last 2 octets of the internal node ID is provided) along with the interface (IF) index of the logical port where the failure occurred. Use the Show All Logical Ports dialog box to determine the mapping between logical port names and IF indexes. See the NavisCore Diagnostics Guide for more information.
Circuit name at switch name has been rerouted
This trap indicates that a Frame Relay PVC has been rerouted. Typical causes of PVC rerouting include:
• A new, shorter route is available
• An existing route has substantially more available bandwidth
• A PVC’s manually defined path has become available
See the NavisCore Diagnostics Guide for more information.
For information on the rules used by the switch and NMS during PVC creation to determine the calling and called endpoints as well as endpoint 1 and endpoint 2, see Appendix A, “Determining Calling and Called Endpoints for PVCs.”
2-407/17/03 NavisCore Troubleshooting Guide
Beta Draft ConfidentialTroubleshooting Frame Relay Problems
Troubleshooting Frame Relay PVCs
LPort name in switch name is down, the following PVCs are also down: circuit name list
This trap indicates that the specified logical port is down; as a result, the specified circuits are also down. See the NavisCore Diagnostics Guide for more information.
Trunk trunkname in switch name is down. Following PVCs are also down: circuit name list.
The specified trunk is down; as a result, the specified circuits are also down. See the NavisCore Diagnostics Guide for more information.
IOP in Slot slot number at switch switch name is down, following PVCs is also down: circuit name list
An IOP in the specified slot number is down; as a result the specified circuits are also down. See the NavisCore Diagnostics Guide for more information.
Customer Complaints
When you receive a customer complaint, gather as much information as possible to speed up the recovery time. Then, ask yourself the following questions:
• Does the customer have one PVC down or multiple PVCs down? If only one circuit is down, you can narrow the problem to a specific circuit configuration issue, such as a circuit configuration problem with the switch or the CPE.
• Do multiple customers have PVCs on the same physical port? Are they all encountering the same problem? If so, a potential physical port problem exists. See “Troubleshooting Frame Relay Physical Ports” on page 2-2 for more information.
• Do multiple customers have PVCs on the same logical port? Are they all encountering the same problem? If so, a potential logical port problem exists. See “Troubleshooting Frame Relay Logical Ports” on page 2-20 for more information.
• Is the PVC down, or does a performance problem exist? If the PVC is up, but is performing poorly, you may have a network congestion or a configuration problem.
NavisCore Troubleshooting Guide 7/17/032-41
Beta Draft ConfidentialTroubleshooting Frame Relay ProblemsTroubleshooting Frame Relay PVCs
Verifying Frame Relay PVC Problems
The Show All PVCs dialog box is the best source of information on a PVC, and therefore is your best tool for verifying a PVC problem. To access this dialog box:
1. From the Monitor menu, select Lucent Objects ⇒ Show Circuits, and select one of the following options:
All by Name — Enter a specific circuit name. To use wild-card characters to search by name, type an asterisk (*) to replace several characters or type a question mark (?) to replace one character.
All on Switch and by Name — Select a switch on the current map, then use this option to enter a specific circuit to search by name. To use wild-card characters, type an asterisk (*) to replace several characters or type a question mark (?) to replace one character.
All by Defined Path — Displays a list of all circuits that have a defined path.
All Point-to-Multipoint — Displays a list of all point-to-multipoint circuits.
Redirect — Displays a list of all redirect PVCs.
After you select an option, the Show All PVCs dialog box appears. Figure 2-22 shows a sample Show All PVCs dialog box.
2-427/17/03 NavisCore Troubleshooting Guide
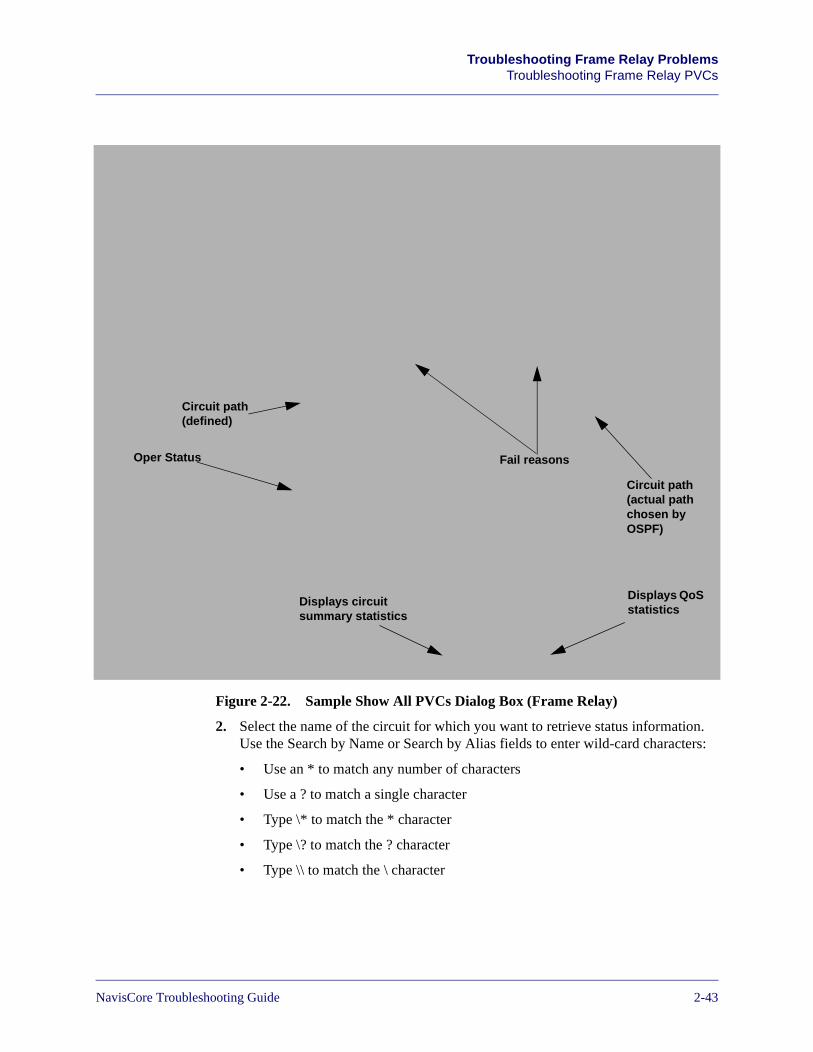
Beta Draft ConfidentialTroubleshooting Frame Relay Problems
Troubleshooting Frame Relay PVCs
Figure 2-22. Sample Show All PVCs Dialog Box (Frame Relay)
2. Select the name of the circuit for which you want to retrieve status information. Use the Search by Name or Search by Alias fields to enter wild-card characters:
• Use an * to match any number of characters
• Use a ? to match a single character
• Type \* to match the * character
• Type \? to match the ? character
• Type \\ to match the \ character
Oper Status Fail reasons
Displays circuit summary statistics
Circuit path (actual path chosen by OSPF)
Circuit path (defined)
Displays QoS statistics
NavisCore Troubleshooting Guide 7/17/032-43
Beta Draft ConfidentialTroubleshooting Frame Relay ProblemsTroubleshooting Frame Relay PVCs
This first thing to look for on the Show All PVCs dialog box is the Oper Status, which is one of the Frame Relay administrative attributes. Oper Status can have one of the following values:
Active — The PVC is operational between the two endpoints.
Inactive — The PVC is not operational between the two endpoints. A status of Inactive could mean that LMI operator status for the PVC’s logical port is Down.
Invalid — The module that the point-to-point PVC uses on one of the switches is out of sync.
Unknown — One of the point-to-point PVC endpoint switches did not respond to an NMS request.
Based on the Oper Status value, Frame Relay PVC problems can be categorized as follows:
• PVC is active but has performance issues (slow response or packet loss)
• PVC is active but the endpoints cannot communicate
• PVC is inactive
• PVC is invalid
• PVC is unknown
After you place the problem into one of these categories, you can take certain steps to correct the problem. The sections that follow describe each of these categories.
2-447/17/03 NavisCore Troubleshooting Guide
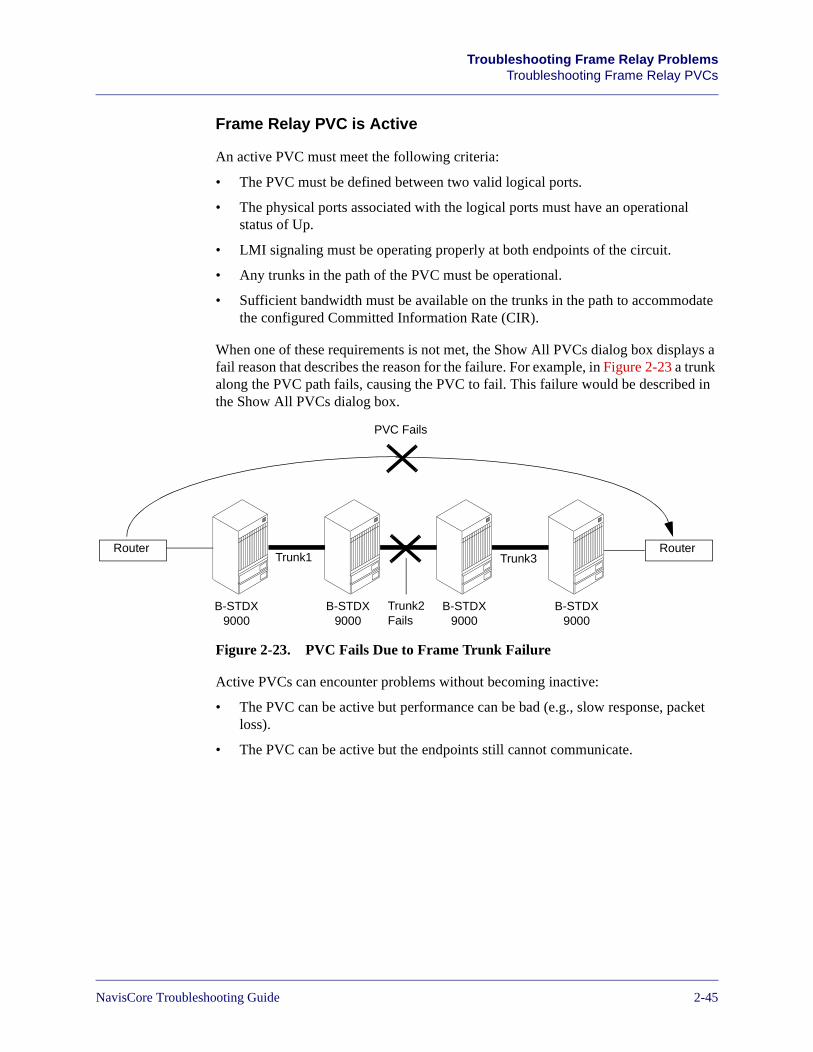
Beta Draft ConfidentialTroubleshooting Frame Relay Problems
Troubleshooting Frame Relay PVCs
Frame Relay PVC is Active
An active PVC must meet the following criteria:
• The PVC must be defined between two valid logical ports.
• The physical ports associated with the logical ports must have an operational status of Up.
• LMI signaling must be operating properly at both endpoints of the circuit.
• Any trunks in the path of the PVC must be operational.
• Sufficient bandwidth must be available on the trunks in the path to accommodate the configured Committed Information Rate (CIR).
When one of these requirements is not met, the Show All PVCs dialog box displays a fail reason that describes the reason for the failure. For example, in Figure 2-23 a trunk along the PVC path fails, causing the PVC to fail. This failure would be described in the Show All PVCs dialog box.
Figure 2-23. PVC Fails Due to Frame Trunk Failure
Active PVCs can encounter problems without becoming inactive:
• The PVC can be active but performance can be bad (e.g., slow response, packet loss).
• The PVC can be active but the endpoints still cannot communicate.
RouterRouter
PVC Fails
Trunk1
Trunk2 Fails
Trunk3
B-STDX 9000
B-STDX 9000
B-STDX 9000
B-STDX 9000
NavisCore Troubleshooting Guide 7/17/032-45
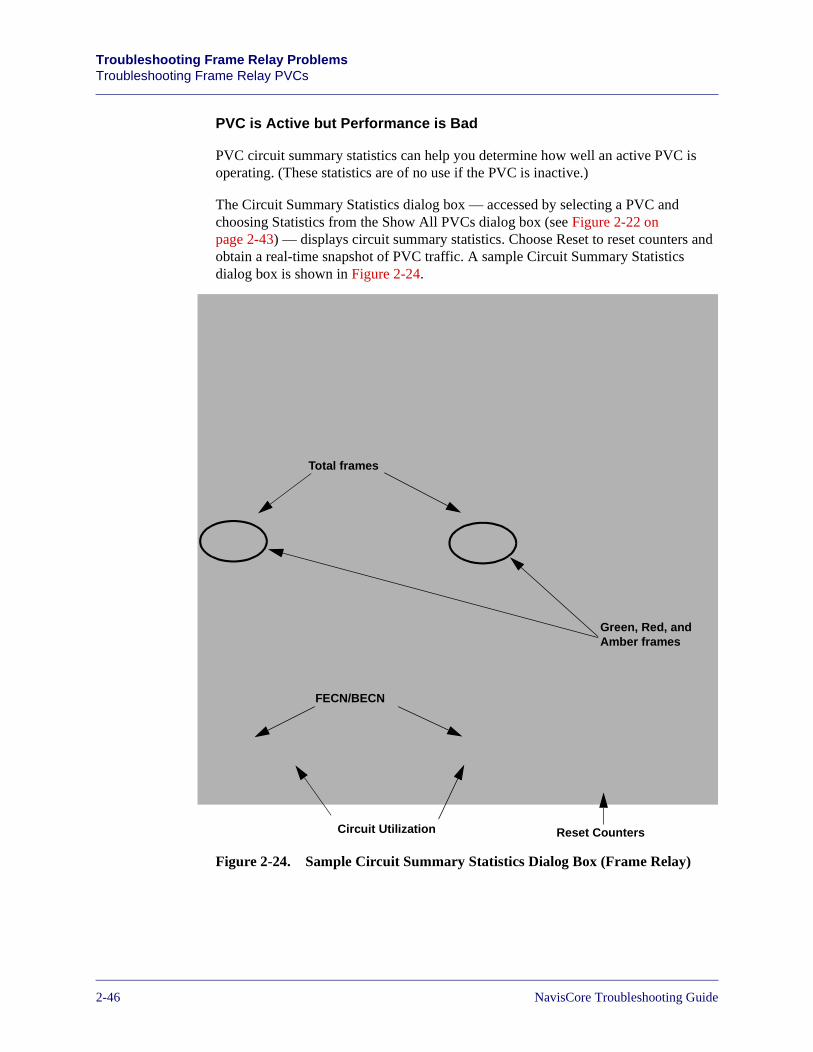
Beta Draft ConfidentialTroubleshooting Frame Relay ProblemsTroubleshooting Frame Relay PVCs
PVC is Active but Performance is Bad
PVC circuit summary statistics can help you determine how well an active PVC is operating. (These statistics are of no use if the PVC is inactive.)
The Circuit Summary Statistics dialog box — accessed by selecting a PVC and choosing Statistics from the Show All PVCs dialog box (see Figure 2-22 on page 2-43) — displays circuit summary statistics. Choose Reset to reset counters and obtain a real-time snapshot of PVC traffic. A sample Circuit Summary Statistics dialog box is shown in Figure 2-24.
Figure 2-24. Sample Circuit Summary Statistics Dialog Box (Frame Relay)
Green, Red, and Amber frames
Total frames
FECN/BECN
Circuit Utilization Reset Counters
2-467/17/03 NavisCore Troubleshooting Guide
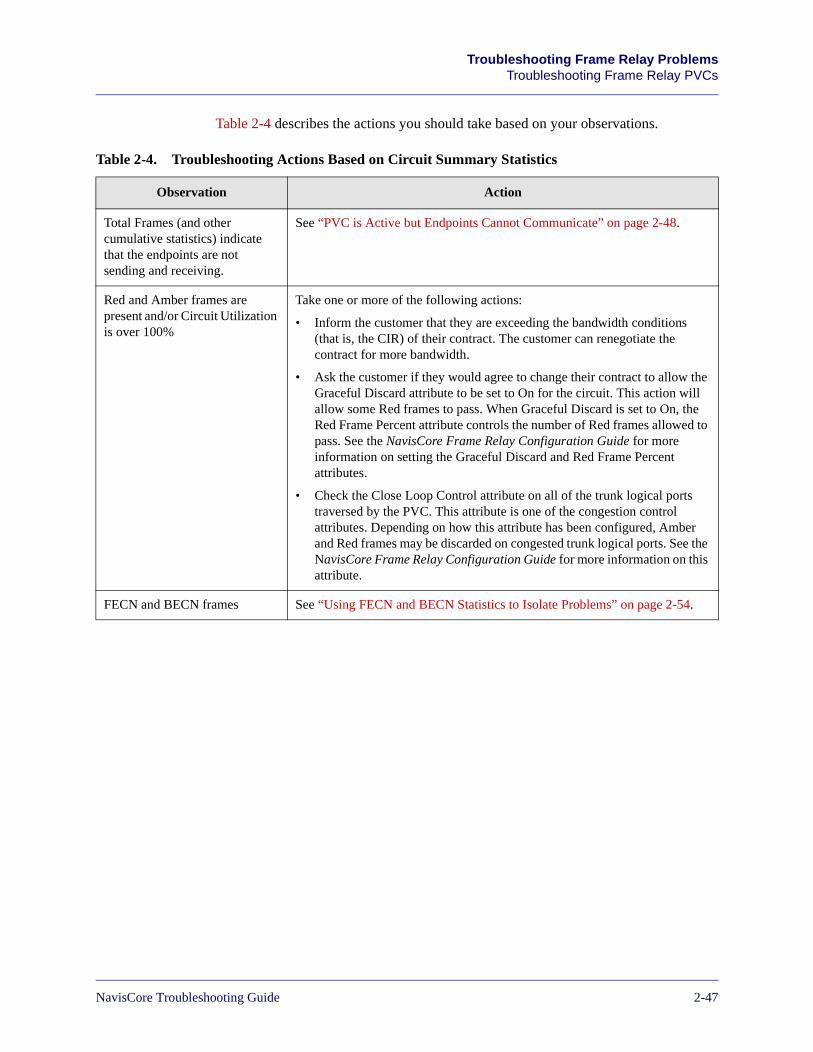
Beta Draft ConfidentialTroubleshooting Frame Relay Problems
Troubleshooting Frame Relay PVCs
Table 2-4 describes the actions you should take based on your observations.
Table 2-4. Troubleshooting Actions Based on Circuit Summary Statistics
Observation Action
Total Frames (and other cumulative statistics) indicate that the endpoints are not sending and receiving.
See “PVC is Active but Endpoints Cannot Communicate” on page 2-48.
Red and Amber frames are present and/or Circuit Utilization is over 100%
Take one or more of the following actions:
• Inform the customer that they are exceeding the bandwidth conditions (that is, the CIR) of their contract. The customer can renegotiate the contract for more bandwidth.
• Ask the customer if they would agree to change their contract to allow the Graceful Discard attribute to be set to On for the circuit. This action will allow some Red frames to pass. When Graceful Discard is set to On, the Red Frame Percent attribute controls the number of Red frames allowed to pass. See the NavisCore Frame Relay Configuration Guide for more information on setting the Graceful Discard and Red Frame Percent attributes.
• Check the Close Loop Control attribute on all of the trunk logical ports traversed by the PVC. This attribute is one of the congestion control attributes. Depending on how this attribute has been configured, Amber and Red frames may be discarded on congested trunk logical ports. See the NavisCore Frame Relay Configuration Guide for more information on this attribute.
FECN and BECN frames See “Using FECN and BECN Statistics to Isolate Problems” on page 2-54.
NavisCore Troubleshooting Guide 7/17/032-47
Beta Draft ConfidentialTroubleshooting Frame Relay ProblemsTroubleshooting Frame Relay PVCs
PVC is Active but Endpoints Cannot Communicate
When a PVC is active, but the endpoints cannot communicate, a typical cause is an improperly configured Data Link Connection Identifier (DLCI) for the PVC. Perform the following actions:
• For one of the PVC switch endpoints, select the switch on the network map and choose Lucent Objects ⇒ Show Logical Ports. When the Show All Logical Ports in Switch dialog box appears, select the logical port that the PVC uses. Then, check the Last Invalid DLCI field. If a value appears in this field, the switch at the other end of the PVC may have an improperly configured DLCI. Repeat this procedure for the other switch endpoint. See the NavisCore Diagnostics Guide for more information on the Show All Logical Ports in Switch dialog box.
• Check the switch PVC configuration. If the DLCI is incorrect, you must delete the PVC and recreate it with the correct DLCI. Once a PVC is created, you cannot change the name of the PVC or its DLCI. See the NavisCore Frame Relay Configuration Guide for more information on configuring PVCs.
• Check the PVC configuration at the CPE (such as a router). Configure the correct DLCI if necessary.
To determine the last valid DLCI on a logical port, issue the following MIB command:
get lport.2.1.175.<interface #>
2-487/17/03 NavisCore Troubleshooting Guide
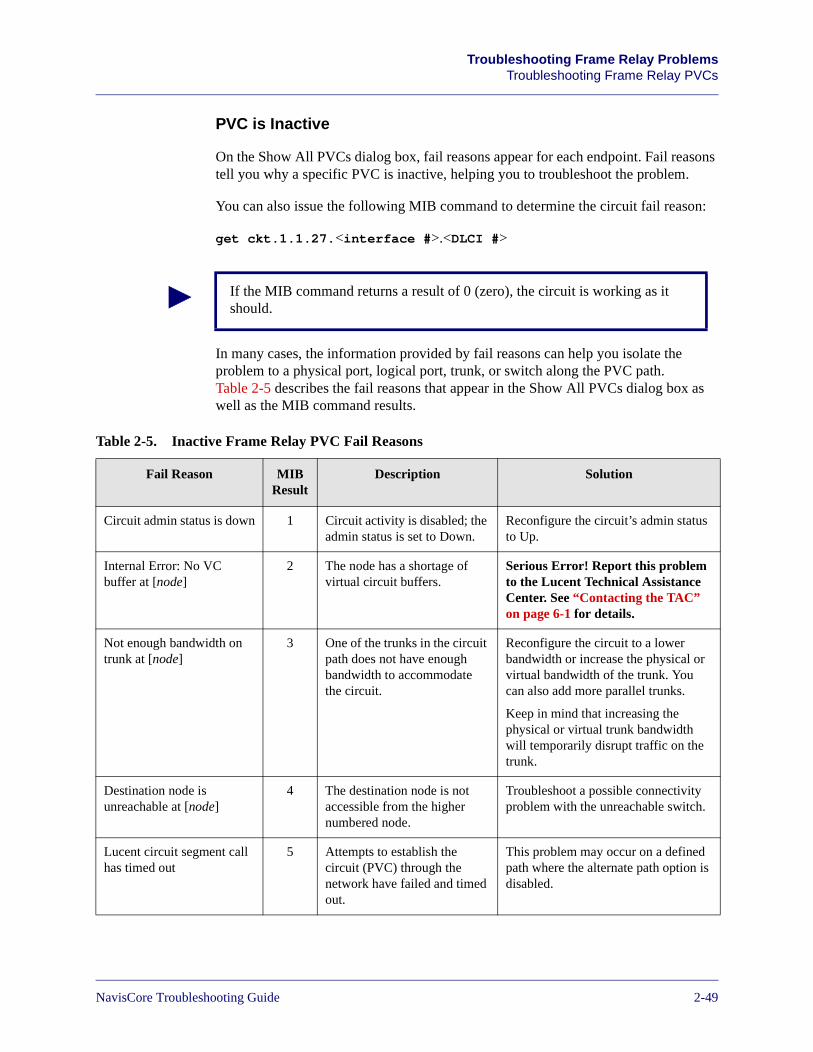
Beta Draft ConfidentialTroubleshooting Frame Relay Problems
Troubleshooting Frame Relay PVCs
PVC is Inactive
On the Show All PVCs dialog box, fail reasons appear for each endpoint. Fail reasons tell you why a specific PVC is inactive, helping you to troubleshoot the problem.
You can also issue the following MIB command to determine the circuit fail reason:
get ckt.1.1.27.<interface #>.<DLCI #>
In many cases, the information provided by fail reasons can help you isolate the problem to a physical port, logical port, trunk, or switch along the PVC path. Table 2-5 describes the fail reasons that appear in the Show All PVCs dialog box as well as the MIB command results.
If the MIB command returns a result of 0 (zero), the circuit is working as it should.
Table 2-5. Inactive Frame Relay PVC Fail Reasons
Fail Reason MIB Result
Description Solution
Circuit admin status is down 1 Circuit activity is disabled; the admin status is set to Down.
Reconfigure the circuit’s admin status to Up.
Internal Error: No VC buffer at [node]
2 The node has a shortage of virtual circuit buffers.
Serious Error! Report this problem to the Lucent Technical Assistance Center. See “Contacting the TAC” on page 6-1 for details.
Not enough bandwidth on trunk at [node]
3 One of the trunks in the circuit path does not have enough bandwidth to accommodate the circuit.
Reconfigure the circuit to a lower bandwidth or increase the physical or virtual bandwidth of the trunk. You can also add more parallel trunks.
Keep in mind that increasing the physical or virtual trunk bandwidth will temporarily disrupt traffic on the trunk.
Destination node is unreachable at [node]
4 The destination node is not accessible from the higher numbered node.
Troubleshoot a possible connectivity problem with the unreachable switch.
Lucent circuit segment call has timed out
5 Attempts to establish the circuit (PVC) through the network have failed and timed out.
This problem may occur on a defined path where the alternate path option is disabled.
NavisCore Troubleshooting Guide 7/17/032-49
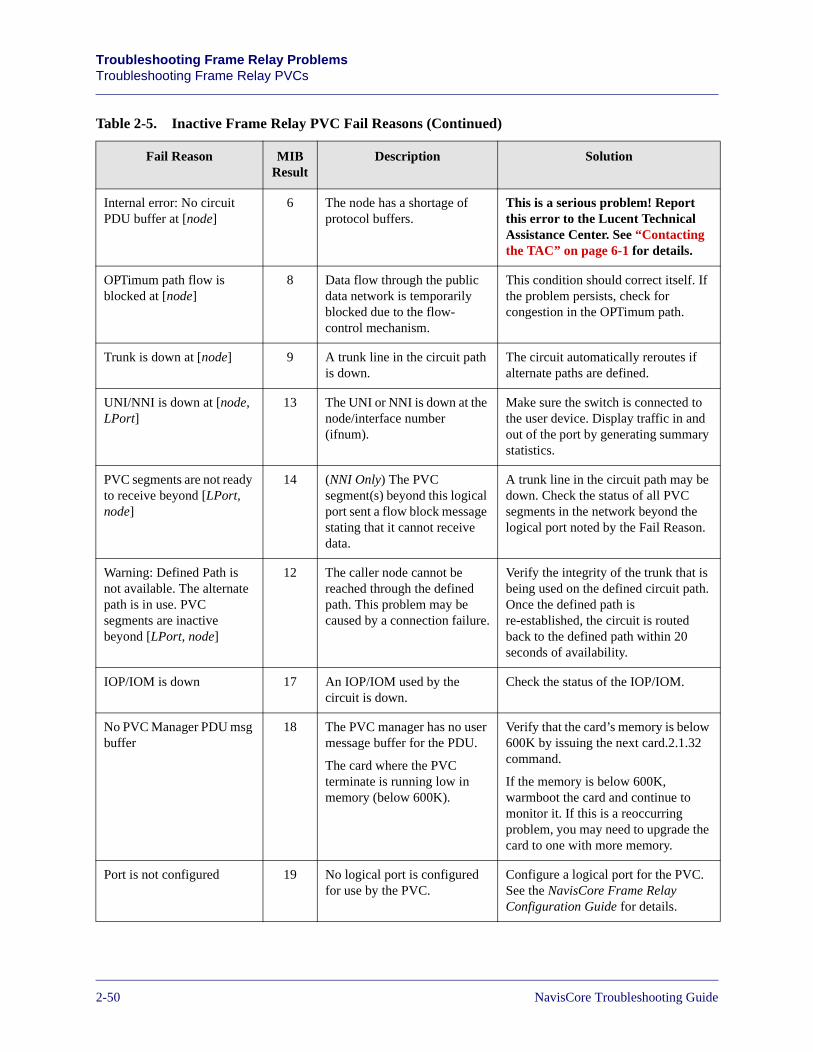
Beta Draft ConfidentialTroubleshooting Frame Relay ProblemsTroubleshooting Frame Relay PVCs
Internal error: No circuit PDU buffer at [node]
6 The node has a shortage of protocol buffers.
This is a serious problem! Report this error to the Lucent Technical Assistance Center. See “Contacting the TAC” on page 6-1 for details.
OPTimum path flow is blocked at [node]
8 Data flow through the public data network is temporarily blocked due to the flow- control mechanism.
This condition should correct itself. If the problem persists, check for congestion in the OPTimum path.
Trunk is down at [node] 9 A trunk line in the circuit path is down.
The circuit automatically reroutes if alternate paths are defined.
UNI/NNI is down at [node, LPort]
13 The UNI or NNI is down at the node/interface number (ifnum).
Make sure the switch is connected to the user device. Display traffic in and out of the port by generating summary statistics.
PVC segments are not ready to receive beyond [LPort, node]
14 (NNI Only) The PVC segment(s) beyond this logical port sent a flow block message stating that it cannot receive data.
A trunk line in the circuit path may be down. Check the status of all PVC segments in the network beyond the logical port noted by the Fail Reason.
Warning: Defined Path is not available. The alternate path is in use. PVC segments are inactive beyond [LPort, node]
12 The caller node cannot be reached through the defined path. This problem may be caused by a connection failure.
Verify the integrity of the trunk that is being used on the defined circuit path. Once the defined path is re-established, the circuit is routed back to the defined path within 20 seconds of availability.
IOP/IOM is down 17 An IOP/IOM used by the circuit is down.
Check the status of the IOP/IOM.
No PVC Manager PDU msg buffer
18 The PVC manager has no user message buffer for the PDU.
The card where the PVC terminate is running low in memory (below 600K).
Verify that the card’s memory is below 600K by issuing the next card.2.1.32 command.
If the memory is below 600K, warmboot the card and continue to monitor it. If this is a reoccurring problem, you may need to upgrade the card to one with more memory.
Port is not configured 19 No logical port is configured for use by the PVC.
Configure a logical port for the PVC. See the NavisCore Frame Relay Configuration Guide for details.
Table 2-5. Inactive Frame Relay PVC Fail Reasons (Continued)
Fail Reason MIB Result
Description Solution
2-507/17/03 NavisCore Troubleshooting Guide
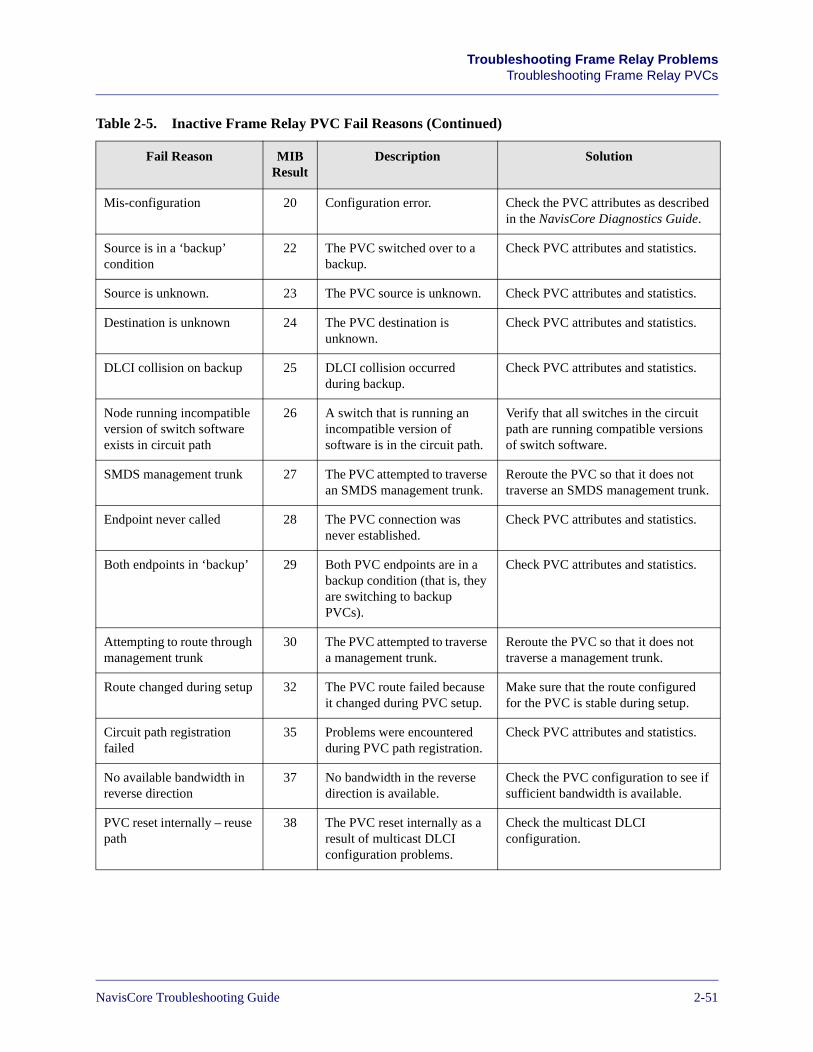
Beta Draft ConfidentialTroubleshooting Frame Relay Problems
Troubleshooting Frame Relay PVCs
Mis-configuration 20 Configuration error. Check the PVC attributes as described in the NavisCore Diagnostics Guide.
Source is in a ‘backup’ condition
22 The PVC switched over to a backup.
Check PVC attributes and statistics.
Source is unknown. 23 The PVC source is unknown. Check PVC attributes and statistics.
Destination is unknown 24 The PVC destination is unknown.
Check PVC attributes and statistics.
DLCI collision on backup 25 DLCI collision occurred during backup.
Check PVC attributes and statistics.
Node running incompatible version of switch software exists in circuit path
26 A switch that is running an incompatible version of software is in the circuit path.
Verify that all switches in the circuit path are running compatible versions of switch software.
SMDS management trunk 27 The PVC attempted to traverse an SMDS management trunk.
Reroute the PVC so that it does not traverse an SMDS management trunk.
Endpoint never called 28 The PVC connection was never established.
Check PVC attributes and statistics.
Both endpoints in ‘backup’ 29 Both PVC endpoints are in a backup condition (that is, they are switching to backup PVCs).
Check PVC attributes and statistics.
Attempting to route through management trunk
30 The PVC attempted to traverse a management trunk.
Reroute the PVC so that it does not traverse a management trunk.
Route changed during setup 32 The PVC route failed because it changed during PVC setup.
Make sure that the route configured for the PVC is stable during setup.
Circuit path registration failed
35 Problems were encountered during PVC path registration.
Check PVC attributes and statistics.
No available bandwidth in reverse direction
37 No bandwidth in the reverse direction is available.
Check the PVC configuration to see if sufficient bandwidth is available.
PVC reset internally – reuse path
38 The PVC reset internally as a result of multicast DLCI configuration problems.
Check the multicast DLCI configuration.
Table 2-5. Inactive Frame Relay PVC Fail Reasons (Continued)
Fail Reason MIB Result
Description Solution
NavisCore Troubleshooting Guide 7/17/032-51
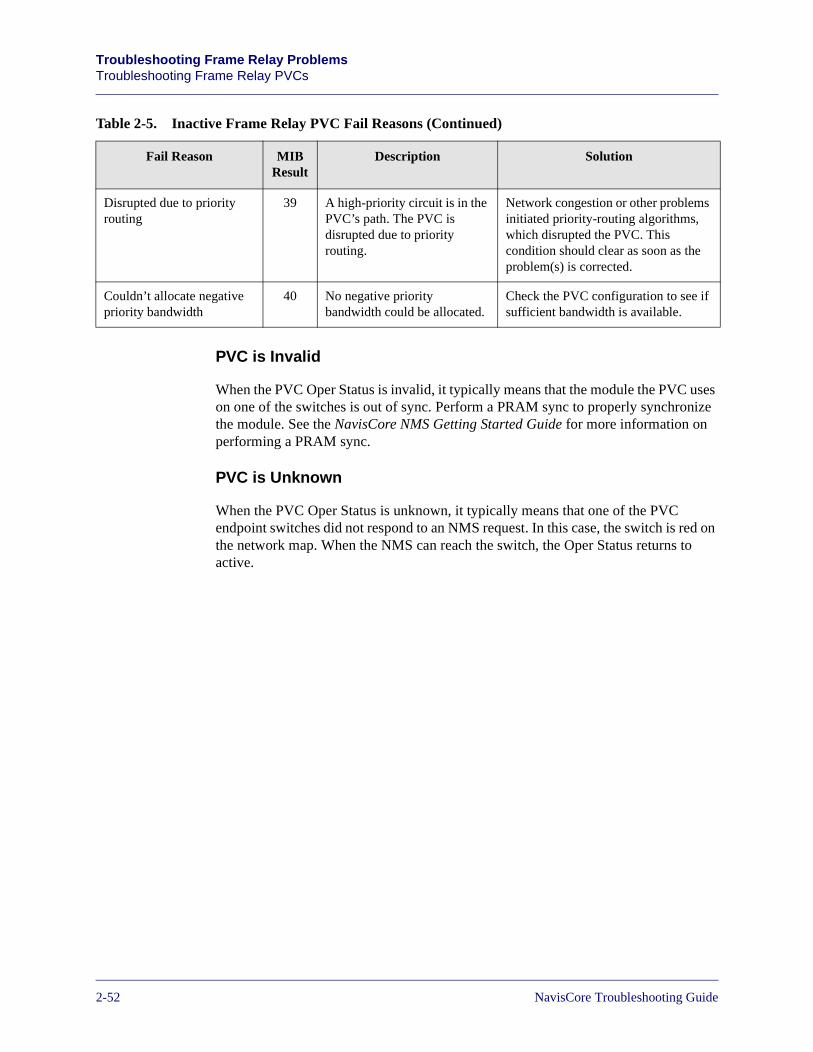
Beta Draft ConfidentialTroubleshooting Frame Relay ProblemsTroubleshooting Frame Relay PVCs
PVC is Invalid
When the PVC Oper Status is invalid, it typically means that the module the PVC uses on one of the switches is out of sync. Perform a PRAM sync to properly synchronize the module. See the NavisCore NMS Getting Started Guide for more information on performing a PRAM sync.
PVC is Unknown
When the PVC Oper Status is unknown, it typically means that one of the PVC endpoint switches did not respond to an NMS request. In this case, the switch is red on the network map. When the NMS can reach the switch, the Oper Status returns to active.
Disrupted due to priority routing
39 A high-priority circuit is in the PVC’s path. The PVC is disrupted due to priority routing.
Network congestion or other problems initiated priority-routing algorithms, which disrupted the PVC. This condition should clear as soon as the problem(s) is corrected.
Couldn’t allocate negative priority bandwidth
40 No negative priority bandwidth could be allocated.
Check the PVC configuration to see if sufficient bandwidth is available.
Table 2-5. Inactive Frame Relay PVC Fail Reasons (Continued)
Fail Reason MIB Result
Description Solution
2-527/17/03 NavisCore Troubleshooting Guide
Beta Draft ConfidentialTroubleshooting Frame Relay Problems
Troubleshooting Frame Relay PVCs
Isolating Frame Relay PVC Problems
When you verify the existence of a Frame Relay PVC problem, use the following tools and information to isolate the problem:
• Circuit path
• Forward explicit congestion notification (FECN) and backward explicit congestion notification (BECN) statistics
• Frames-discarded statistics
• PVC loopback
FECN/BECN statistics, frames-discarded statistics, and PVC loopback help you to troubleshoot problems on active PVCs only. They do not help you to troubleshoot problems on inactive PVCs.
You should only use PVC loopback as a last resort on active PVCs, since user traffic does not flow while PVC loopback is testing the circuit. All the other problem isolation methods allow user traffic to continue to flow.
For inactive PVCs, use the fail reasons to isolate problems, as well as the tools and information for isolating problems with the logical ports, physical ports, and trunks that the PVC uses.
Using the Circuit Path to Isolate Frame Relay PVC Problems
The circuit path information on the Show All PVCs dialog box (see Figure 2-22 on page 2-43) may provide enough information for you to isolate the PVC problem. The circuit path information includes the name of the intermediate trunks and switches between PVC endpoints. You can then check the statistics and attributes of the intermediate trunks and their associated physical and logical ports. See “Troubleshooting Frame Relay Trunks” on page 2-31 for more information on troubleshooting trunks.
NavisCore Troubleshooting Guide 7/17/032-53
Beta Draft ConfidentialTroubleshooting Frame Relay ProblemsTroubleshooting Frame Relay PVCs
Using FECN and BECN Statistics to Isolate Problems
When you notice that FECN and BECN statistics are incrementing on the Circuit Summary Statistics dialog box (see Figure 2-24 on page 2-46), it probably means that a trunk is significantly oversubscribed or that CPE is bursting data excessively.
Using FECN and BECN statistics, it is possible to isolate the problem. Perform the following steps:
1. Verify that the CPE equipment supports FECN and BECN.
If FECN and BECN statistics are not supported, the CPE equipment is not standards-based. If the problem exists on equipment that is not standards-based, contact the support organization of your CPE equipment provider.
2. Reset the counters to zero on the Circuit Summary Statistics dialog box (see Figure 2-24 on page 2-46).
3. Note the specific counters that are incrementing on the Circuit Summary Statistics dialog box.
For example, Figure 2-25 shows a PVC between two routers that traverses a congested trunk logical port, and how the congestion is reflected in the FECN and BECN counters. In Figure 2-25, the trunk logical port on point A’s side of the PVC is congested. All frames that the port transmits will have the FECN bit set to one. As the frames traverse the network and reach point B, the FECN bit remains set to 1, and point B transmits FECNs to Router2. When Router2 responds to Router1, point A transmits frames with the BECN bit set to one.
2-547/17/03 NavisCore Troubleshooting Guide
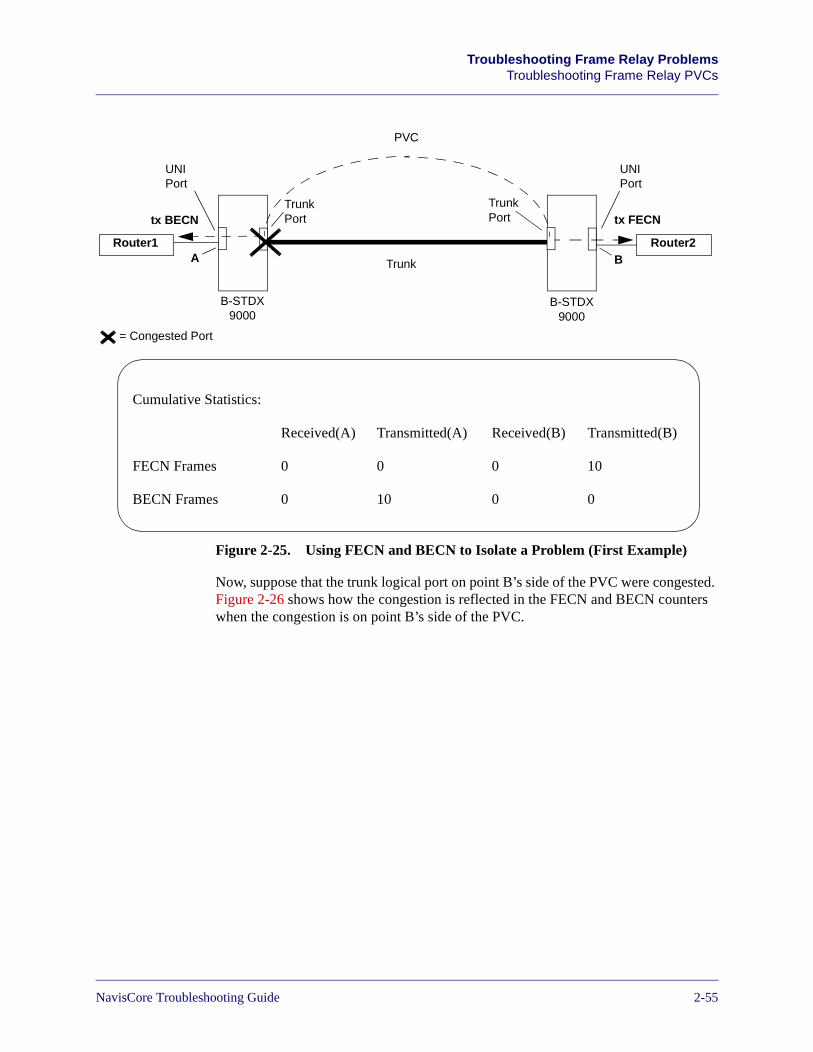
Beta Draft ConfidentialTroubleshooting Frame Relay Problems
Troubleshooting Frame Relay PVCs
Figure 2-25. Using FECN and BECN to Isolate a Problem (First Example)
Now, suppose that the trunk logical port on point B’s side of the PVC were congested. Figure 2-26 shows how the congestion is reflected in the FECN and BECN counters when the congestion is on point B’s side of the PVC.
Router2Router1
PVC
Trunk
B-STDX 9000
B-STDX 9000
Cumulative Statistics:
Received(A) Transmitted(A) Received(B) Transmitted(B)
FECN Frames 0 0 0 10
BECN Frames 0 10 0 0
A B
TrunkPort
TrunkPort
UNIPort
UNIPort
tx BECN tx FECN
= Congested Port
NavisCore Troubleshooting Guide 7/17/032-55
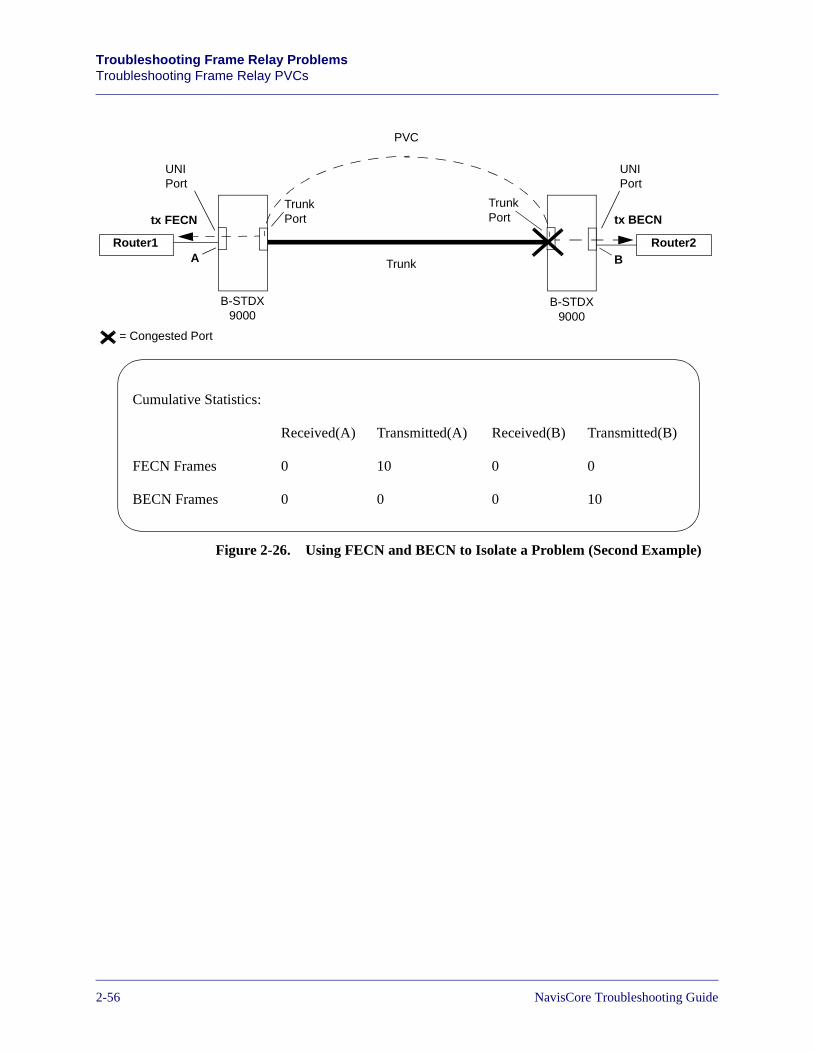
Beta Draft ConfidentialTroubleshooting Frame Relay ProblemsTroubleshooting Frame Relay PVCs
Figure 2-26. Using FECN and BECN to Isolate a Problem (Second Example)
Router2Router1
PVC
Trunk
B-STDX 9000
B-STDX 9000
Cumulative Statistics:
Received(A) Transmitted(A) Received(B) Transmitted(B)
FECN Frames 0 10 0 0
BECN Frames 0 0 0 10
A B
TrunkPort
TrunkPort
UNIPort
UNIPort
tx FECN tx BECN
= Congested Port
2-567/17/03 NavisCore Troubleshooting Guide
Beta Draft ConfidentialTroubleshooting Frame Relay Problems
Troubleshooting Frame Relay PVCs
Using Frames Discarded Statistics to Isolate a Problem
You can use the Frames Discarded statistic to isolate PVC congestion problems if the PVC configuration meets one of the following criterion:
• The Graceful Discard attribute is set to Off. In this case, all Red Frames are discarded.
• The Graceful Discard attribute is set to On, and the Red Frame Percent attribute is set to a percentage that is less than 100%. In this case, a percentage of Red Frames are discarded.
The Graceful Discard and Red Frame Percent attributes are part of the PVC’s Frame User Preference attributes. See the NavisCore Frame Relay Configuration Guide for more information on configuring these attributes.
If frames are not discarded due to congestion, the Circuit Summary Statistics dialog box (see Figure 2-24 on page 2-46) for the PVC should indicate the following:
• Frames Discarded will not increment or increment very little.
• Total frames received on endpoint B will approximately equal total frames transmitted on endpoint A.
• Total frames received on endpoint A will approximately equal total frames transmitted on endpoint B.
Figure 2-27 illustrates a PVC with no congestion.
NavisCore Troubleshooting Guide 7/17/032-57
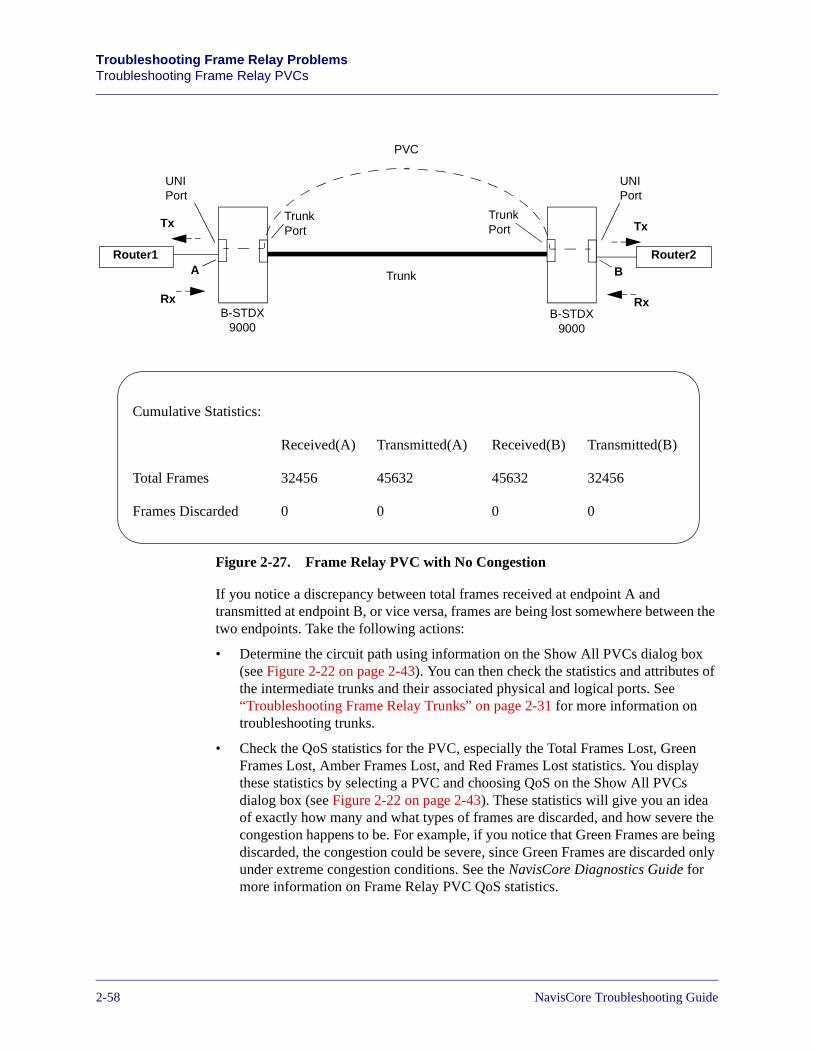
Beta Draft ConfidentialTroubleshooting Frame Relay ProblemsTroubleshooting Frame Relay PVCs
Figure 2-27. Frame Relay PVC with No Congestion
If you notice a discrepancy between total frames received at endpoint A and transmitted at endpoint B, or vice versa, frames are being lost somewhere between the two endpoints. Take the following actions:
• Determine the circuit path using information on the Show All PVCs dialog box (see Figure 2-22 on page 2-43). You can then check the statistics and attributes of the intermediate trunks and their associated physical and logical ports. See “Troubleshooting Frame Relay Trunks” on page 2-31 for more information on troubleshooting trunks.
• Check the QoS statistics for the PVC, especially the Total Frames Lost, Green Frames Lost, Amber Frames Lost, and Red Frames Lost statistics. You display these statistics by selecting a PVC and choosing QoS on the Show All PVCs dialog box (see Figure 2-22 on page 2-43). These statistics will give you an idea of exactly how many and what types of frames are discarded, and how severe the congestion happens to be. For example, if you notice that Green Frames are being discarded, the congestion could be severe, since Green Frames are discarded only under extreme congestion conditions. See the NavisCore Diagnostics Guide for more information on Frame Relay PVC QoS statistics.
Router2Router1
PVC
Trunk
B-STDX 9000
B-STDX 9000
Cumulative Statistics:
Received(A) Transmitted(A) Received(B) Transmitted(B)
Total Frames 32456 45632 45632 32456
Frames Discarded 0 0 0 0
A B
TrunkPort
TrunkPort
UNIPort
UNIPort
Rx
Tx
Rx
Tx
2-587/17/03 NavisCore Troubleshooting Guide
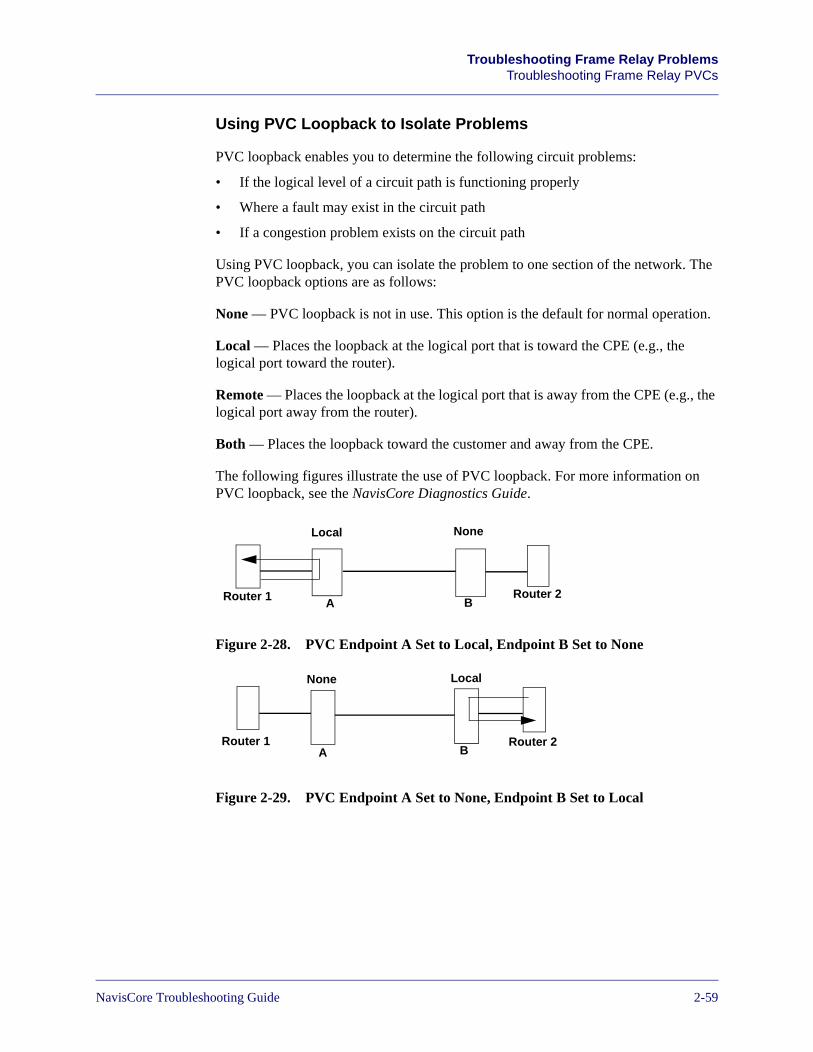
Beta Draft ConfidentialTroubleshooting Frame Relay Problems
Troubleshooting Frame Relay PVCs
Using PVC Loopback to Isolate Problems
PVC loopback enables you to determine the following circuit problems:
• If the logical level of a circuit path is functioning properly
• Where a fault may exist in the circuit path
• If a congestion problem exists on the circuit path
Using PVC loopback, you can isolate the problem to one section of the network. The PVC loopback options are as follows:
None — PVC loopback is not in use. This option is the default for normal operation.
Local — Places the loopback at the logical port that is toward the CPE (e.g., the logical port toward the router).
Remote — Places the loopback at the logical port that is away from the CPE (e.g., the logical port away from the router).
Both — Places the loopback toward the customer and away from the CPE.
The following figures illustrate the use of PVC loopback. For more information on PVC loopback, see the NavisCore Diagnostics Guide.
Figure 2-28. PVC Endpoint A Set to Local, Endpoint B Set to None
Figure 2-29. PVC Endpoint A Set to None, Endpoint B Set to Local
Router 1 Router 2A B
Local None
Router 1 Router 2A B
LocalNone
NavisCore Troubleshooting Guide 7/17/032-59
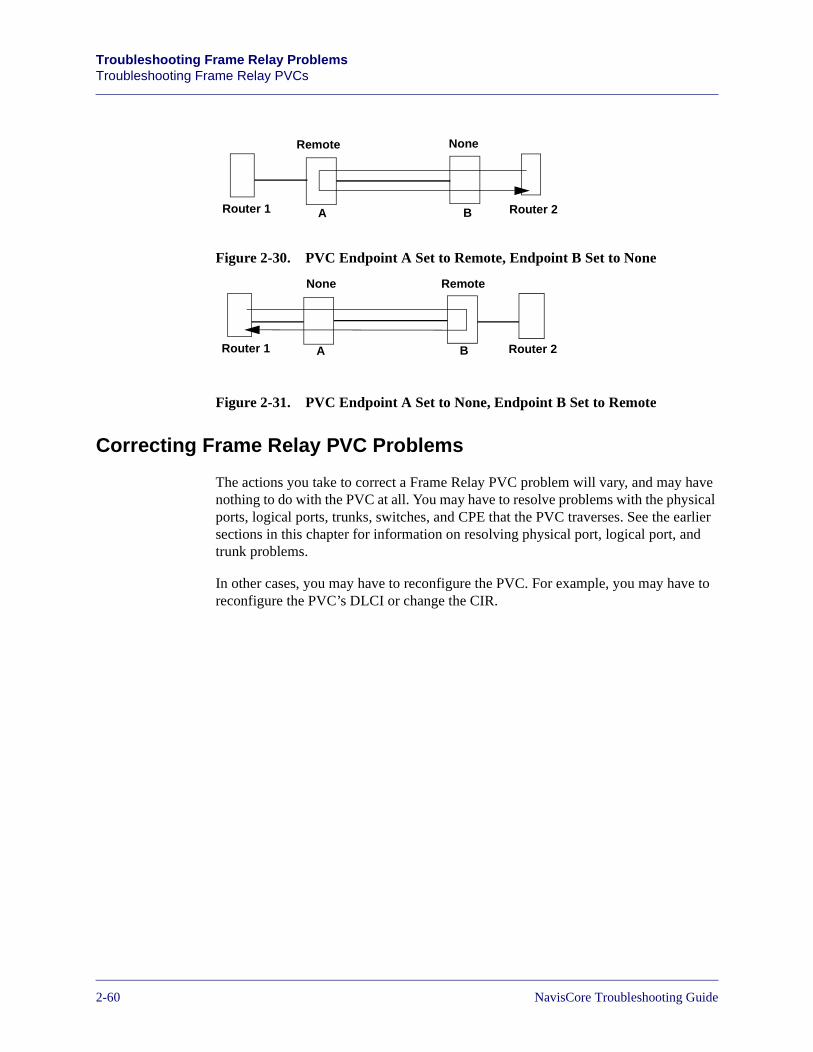
Beta Draft ConfidentialTroubleshooting Frame Relay ProblemsTroubleshooting Frame Relay PVCs
Figure 2-30. PVC Endpoint A Set to Remote, Endpoint B Set to None
Figure 2-31. PVC Endpoint A Set to None, Endpoint B Set to Remote
Correcting Frame Relay PVC Problems
The actions you take to correct a Frame Relay PVC problem will vary, and may have nothing to do with the PVC at all. You may have to resolve problems with the physical ports, logical ports, trunks, switches, and CPE that the PVC traverses. See the earlier sections in this chapter for information on resolving physical port, logical port, and trunk problems.
In other cases, you may have to reconfigure the PVC. For example, you may have to reconfigure the PVC’s DLCI or change the CIR.
Router 1 Router 2A B
Remote None
Router 1 Router 2A B
RemoteNone
2-607/17/03 NavisCore Troubleshooting Guide
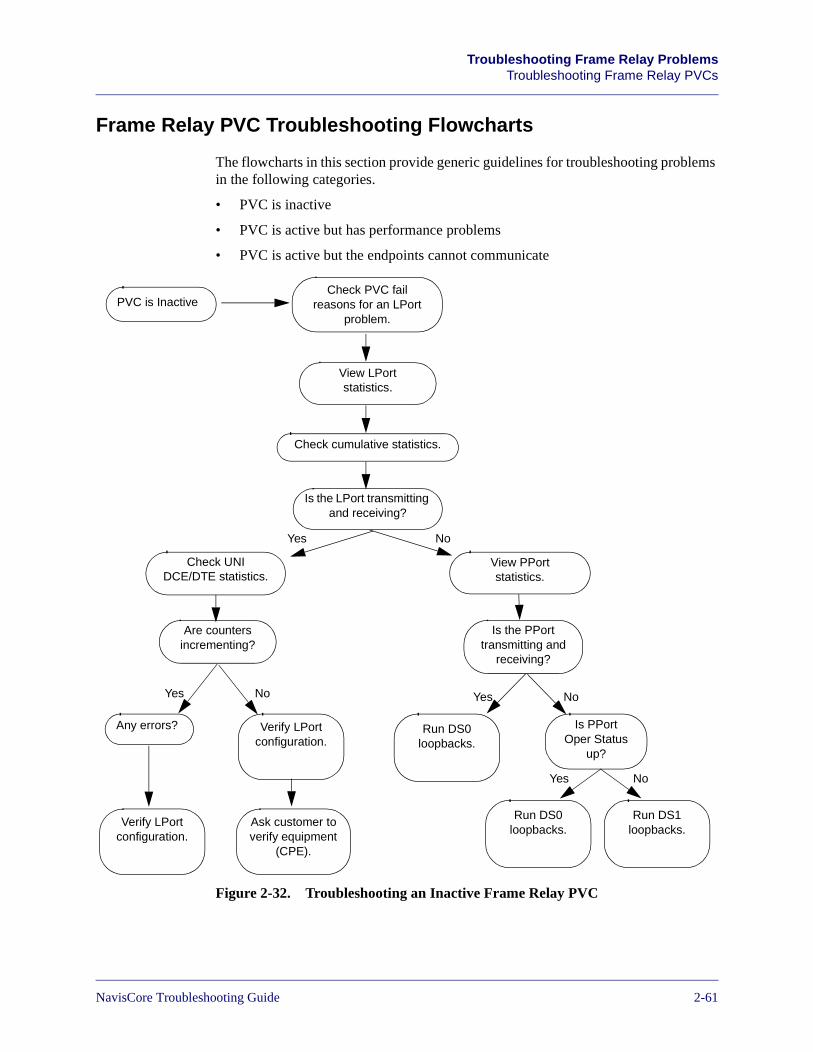
Beta Draft ConfidentialTroubleshooting Frame Relay Problems
Troubleshooting Frame Relay PVCs
Frame Relay PVC Troubleshooting Flowcharts
The flowcharts in this section provide generic guidelines for troubleshooting problems in the following categories.
• PVC is inactive
• PVC is active but has performance problems
• PVC is active but the endpoints cannot communicate
Figure 2-32. Troubleshooting an Inactive Frame Relay PVC
PVC is Inactive
View LPort statistics.
Check cumulative statistics.
Is the LPort transmitting and receiving?
View PPort statistics.
Check UNI DCE/DTE statistics.
Is the PPort transmitting and
receiving?
Is PPort Oper Status
up?
Any errors?
Verify LPort configuration.
Run DS0 loopbacks.
Verify LPort configuration.
Ask customer to verify equipment
(CPE).
Run DS0 loopbacks.
Run DS1 loopbacks.
Yes No
Yes No
Yes No
Are counters incrementing?
Yes No
Check PVC fail reasons for an LPort
problem.
NavisCore Troubleshooting Guide 7/17/032-61
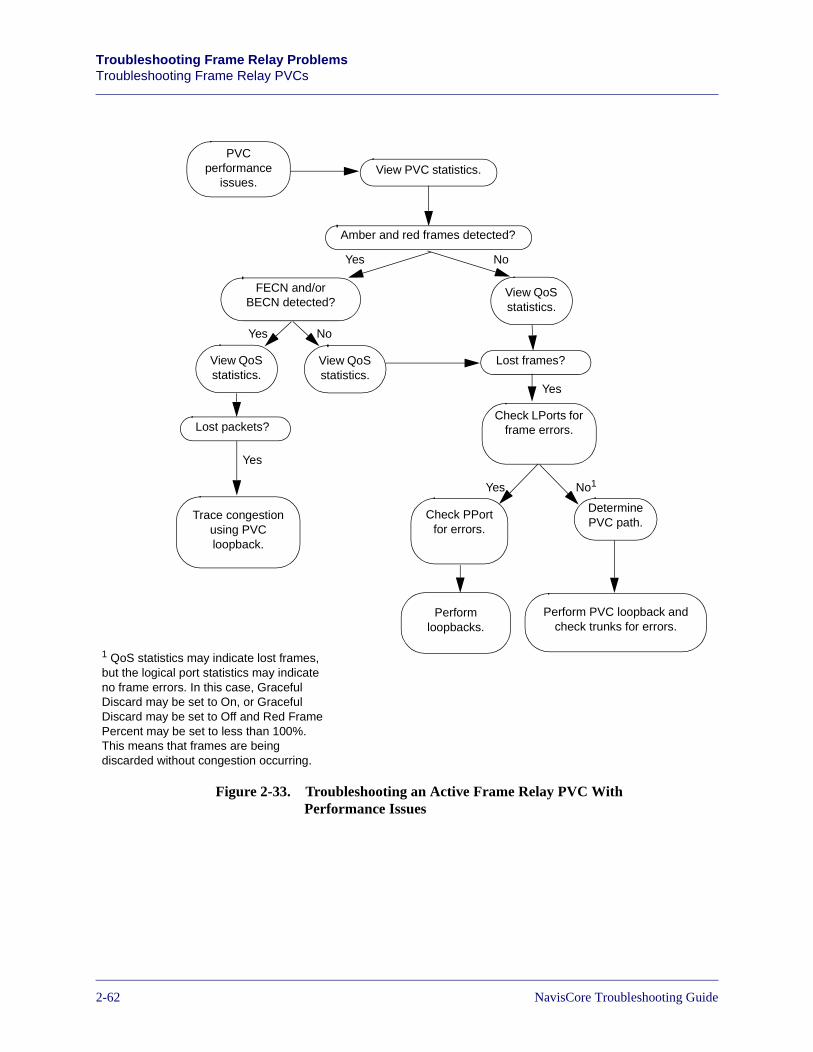
Beta Draft ConfidentialTroubleshooting Frame Relay ProblemsTroubleshooting Frame Relay PVCs
Figure 2-33. Troubleshooting an Active Frame Relay PVC WithPerformance Issues
PVC performance
issues.View PVC statistics.
Amber and red frames detected?
FECN and/or BECN detected?
View QoS statistics.
Yes No1
Yes No
Yes No
View QoS statistics.
Lost packets?
View QoS statistics.
Lost frames?
Trace congestion using PVC loopback.
Check PPort for errors.
Perform loopbacks.
Check LPorts for frame errors.
Perform PVC loopback and check trunks for errors.
Determine PVC path.
Yes
Yes
1 QoS statistics may indicate lost frames, but the logical port statistics may indicate no frame errors. In this case, Graceful Discard may be set to On, or Graceful Discard may be set to Off and Red Frame Percent may be set to less than 100%. This means that frames are being discarded without congestion occurring.
2-627/17/03 NavisCore Troubleshooting Guide
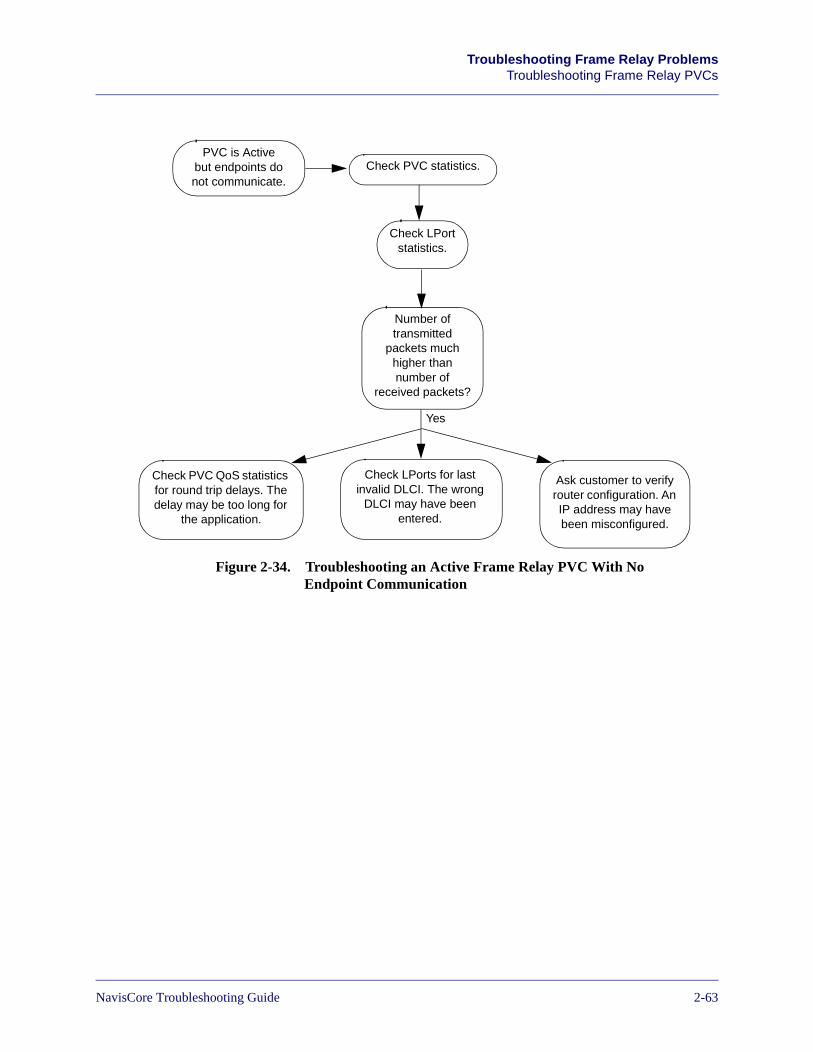
Beta Draft ConfidentialTroubleshooting Frame Relay Problems
Troubleshooting Frame Relay PVCs
Figure 2-34. Troubleshooting an Active Frame Relay PVC With No Endpoint Communication
PVC is Activebut endpoints donot communicate.
Check PVC statistics.
Check LPort statistics.
Number of transmitted
packets much higher than number of
received packets?
Yes
Check PVC QoS statistics for round trip delays. The delay may be too long for
the application.
Check LPorts for last invalid DLCI. The wrong
DLCI may have been entered.
Ask customer to verify router configuration. An IP address may have been misconfigured.
NavisCore Troubleshooting Guide 7/17/032-63
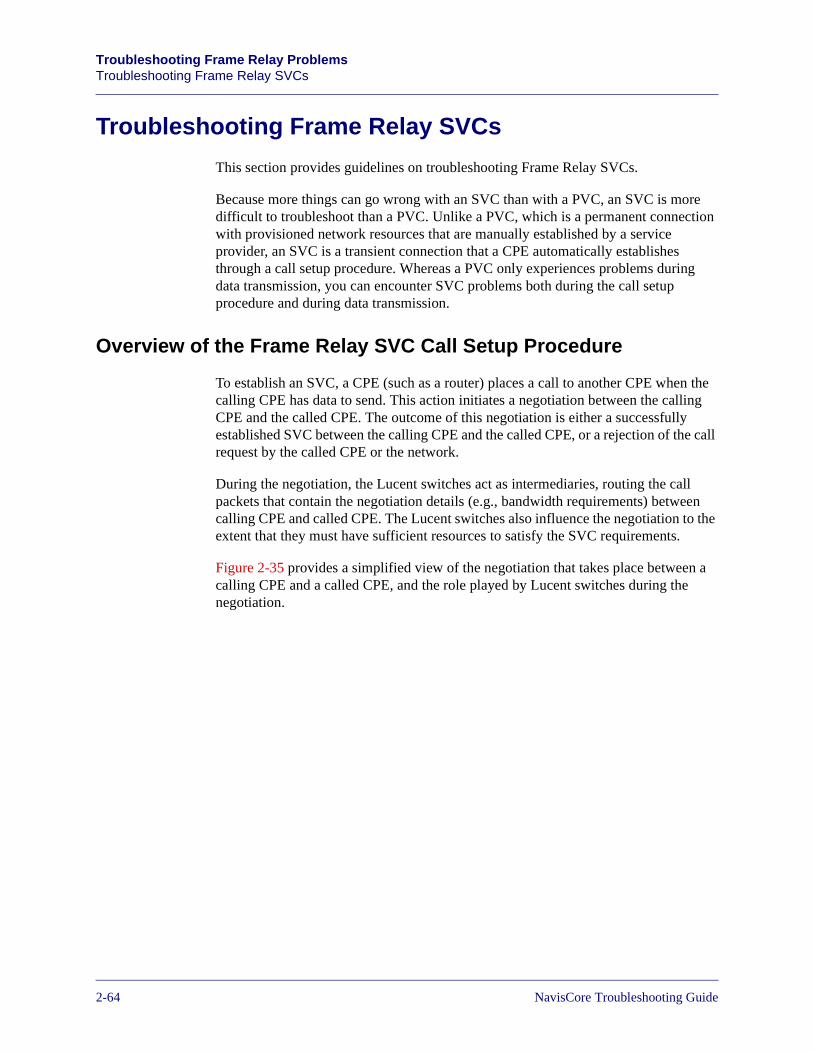
Beta Draft ConfidentialTroubleshooting Frame Relay ProblemsTroubleshooting Frame Relay SVCs
Troubleshooting Frame Relay SVCs
This section provides guidelines on troubleshooting Frame Relay SVCs.
Because more things can go wrong with an SVC than with a PVC, an SVC is more difficult to troubleshoot than a PVC. Unlike a PVC, which is a permanent connection with provisioned network resources that are manually established by a service provider, an SVC is a transient connection that a CPE automatically establishes through a call setup procedure. Whereas a PVC only experiences problems during data transmission, you can encounter SVC problems both during the call setup procedure and during data transmission.
Overview of the Frame Relay SVC Call Setup Procedure
To establish an SVC, a CPE (such as a router) places a call to another CPE when the calling CPE has data to send. This action initiates a negotiation between the calling CPE and the called CPE. The outcome of this negotiation is either a successfully established SVC between the calling CPE and the called CPE, or a rejection of the call request by the called CPE or the network.
During the negotiation, the Lucent switches act as intermediaries, routing the call packets that contain the negotiation details (e.g., bandwidth requirements) between calling CPE and called CPE. The Lucent switches also influence the negotiation to the extent that they must have sufficient resources to satisfy the SVC requirements.
Figure 2-35 provides a simplified view of the negotiation that takes place between a calling CPE and a called CPE, and the role played by Lucent switches during the negotiation.
2-647/17/03 NavisCore Troubleshooting Guide
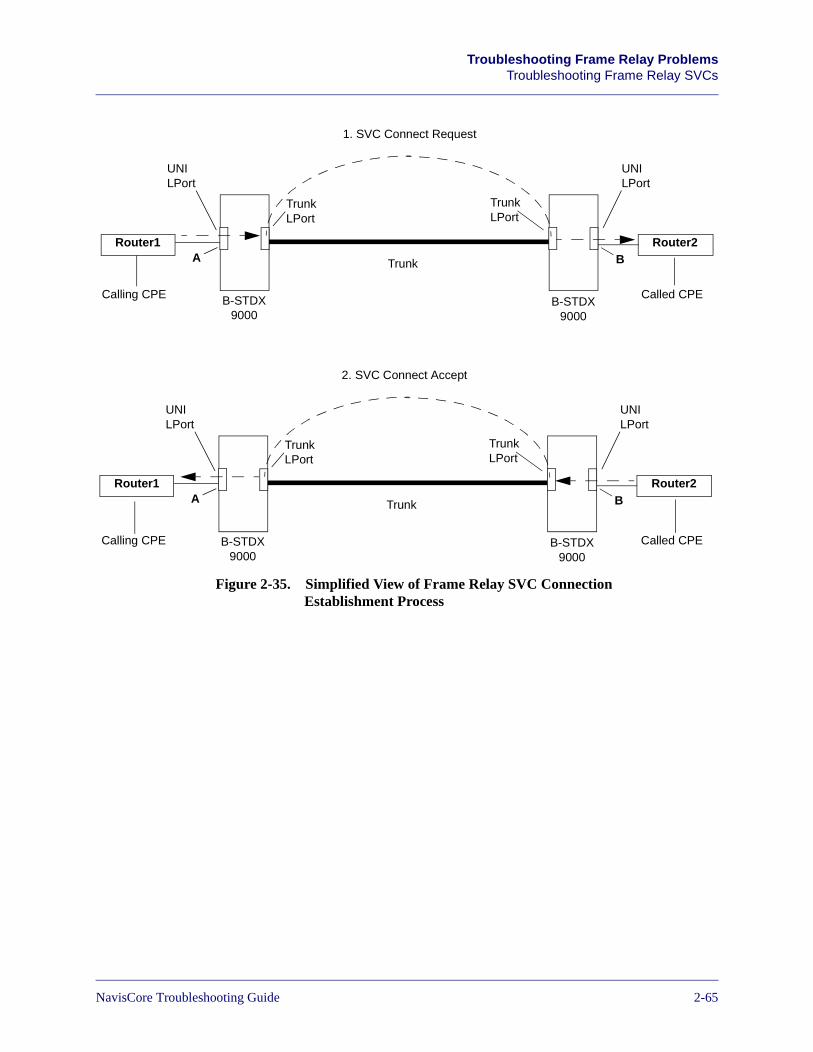
Beta Draft ConfidentialTroubleshooting Frame Relay Problems
Troubleshooting Frame Relay SVCs
Figure 2-35. Simplified View of Frame Relay SVC Connection Establishment Process
Router2Router1
1. SVC Connect Request
Trunk
B-STDX 9000
B-STDX 9000
A B
TrunkLPort
TrunkLPort
UNILPort
UNILPort
Router2Router1
2. SVC Connect Accept
Trunk
B-STDX 9000
B-STDX 9000
A B
TrunkLPort
TrunkLPort
UNILPort
UNILPort
Calling CPE Called CPE
Calling CPE Called CPE
NavisCore Troubleshooting Guide 7/17/032-65
Beta Draft ConfidentialTroubleshooting Frame Relay ProblemsTroubleshooting Frame Relay SVCs
Identifying Frame Relay SVC Problems
You identify Frame Relay SVC problems through:
• Traps
• Customer complaints
Frame Relay SVC Traps
Traps are the only SVC problem indicators available through NavisCore. Switches generate traps when events that effect SVCs occur.
The following trap is very important:
SVC failure threshold has been exceeded on LPort LPort name at switch switch name
This trap indicates that the number of Frame Relay SVC failures that have occurred on a specified logical port has exceeded the port’s configured Trap Failure Threshold. See the NavisCore Frame Relay Configuration Guide for more information on configuring this threshold.
Traps are described in detail in the NavisCore Diagnostics Guide.
The default value of this threshold is 1 failure every 15 minutes (meaning that if 1 failure occurs in a 15-minute period, this trap is displayed). If more than one failure occurs, another trap is not displayed for another 15 minutes.
Write down the logical port name and switch name specified in the trap. Then, use the Show All Failed SVCs dialog box to view specific information about SVC failures. See “Verifying Frame Relay SVC Problems” on page 2-67 for more information.
Customer Complaints
When you receive a customer complaint, gather as much information as possible in order to speed up the recovery time. Then, ask yourself the following questions:
• Are the SVCs being established in the first place? If not, you know that call setup attempts are failing. If the SVCs are being established, you know that problems other than those related to call setup are occurring, such as network congestion that is hampering the flow of data on the circuit.
• Do multiple customers have SVCs on the same physical port? Are they all encountering the same problem? If so, a potential physical port problem exists. See “Troubleshooting Frame Relay Physical Ports” on page 2-2 for more information.
2-667/17/03 NavisCore Troubleshooting Guide
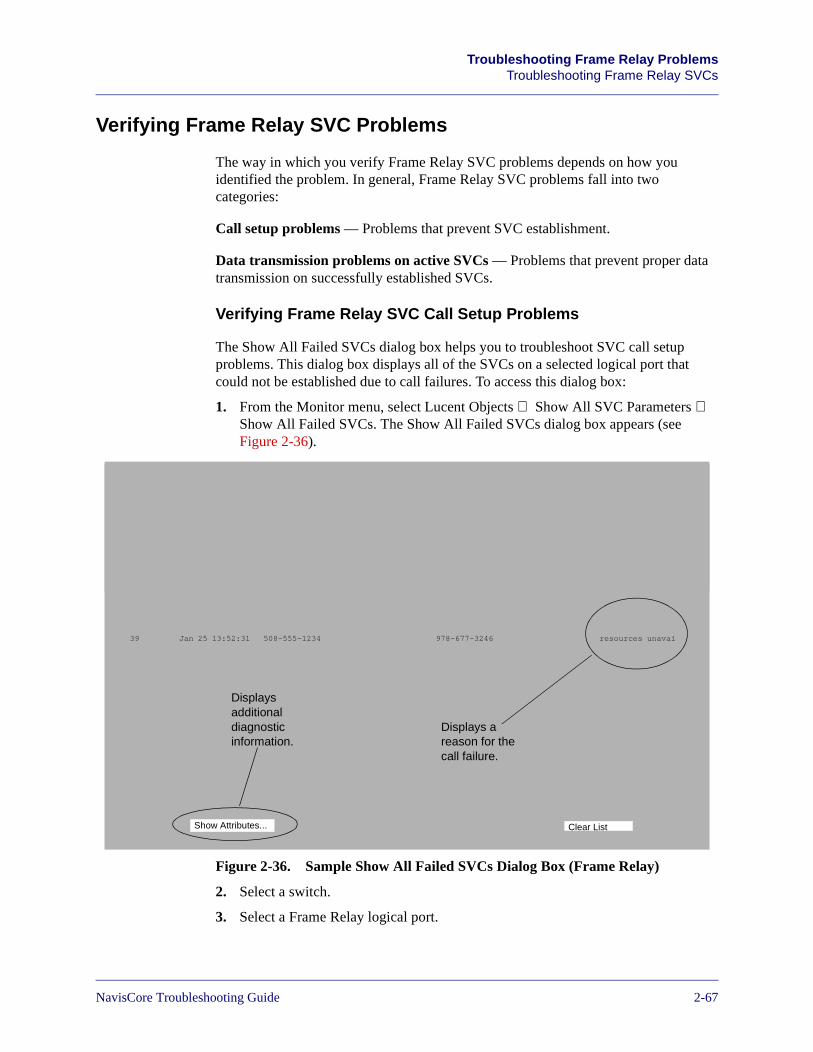
Beta Draft ConfidentialTroubleshooting Frame Relay Problems
Troubleshooting Frame Relay SVCs
Verifying Frame Relay SVC Problems
The way in which you verify Frame Relay SVC problems depends on how you identified the problem. In general, Frame Relay SVC problems fall into two categories:
Call setup problems — Problems that prevent SVC establishment.
Data transmission problems on active SVCs — Problems that prevent proper data transmission on successfully established SVCs.
Verifying Frame Relay SVC Call Setup Problems
The Show All Failed SVCs dialog box helps you to troubleshoot SVC call setup problems. This dialog box displays all of the SVCs on a selected logical port that could not be established due to call failures. To access this dialog box:
1. From the Monitor menu, select Lucent Objects ⇒ Show All SVC Parameters ⇒ Show All Failed SVCs. The Show All Failed SVCs dialog box appears (see Figure 2-36).
Figure 2-36. Sample Show All Failed SVCs Dialog Box (Frame Relay)
2. Select a switch.
3. Select a Frame Relay logical port.
39 Jan 25 13:52:31 508-555-1234 978-677-3246 resources unavai
Clear ListShow Attributes...
Displays a reason for the call failure.
Displays additional diagnostic information.
NavisCore Troubleshooting Guide 7/17/032-67
Beta Draft ConfidentialTroubleshooting Frame Relay ProblemsTroubleshooting Frame Relay SVCs
4. Choose Upload to view the failed SVC calls for the logical port. The records associated with the calls appear when the upload is completed.
To determine which switch name and logical port name to select, use the switch name and logical port name from the following trap:
SVC failure threshold has been exceeded on LPort LPort name at switch switch name
See “Identifying Frame Relay SVC Problems” on page 2-66 for more information on this trap.
The Cause Code field displays a reason for the call failure. You can display additional diagnostic information, such as the location (switch, logical port, and physical port) of the failure, by selecting an SVC and choosing Show Attributes. See the NavisCore Diagnostics Guide for more information. Examples of fail reasons include:
No route to destination — The network through which the call was routed does not serve the destination. As a result, the called party cannot be reached.
Destination is out of order — The user cannot reach it because the interface to the destination is not functioning properly (that is, a signaling message could not be delivered to the destination).
Invalid number format — The called party is unreachable because the number of the called party is not in the proper format or it is incomplete. Check to see if SVC addresses are configured correctly. See the NavisCore Frame Relay Configuration Guide for more information.
Network is out of order — The problem will probably last a long period of time (that is, an immediate retry of the call is not likely to succeed).
No user response — A called party did not respond to a call establishment message with either an alerting or connect indication within a designated time period.
2-687/17/03 NavisCore Troubleshooting Guide
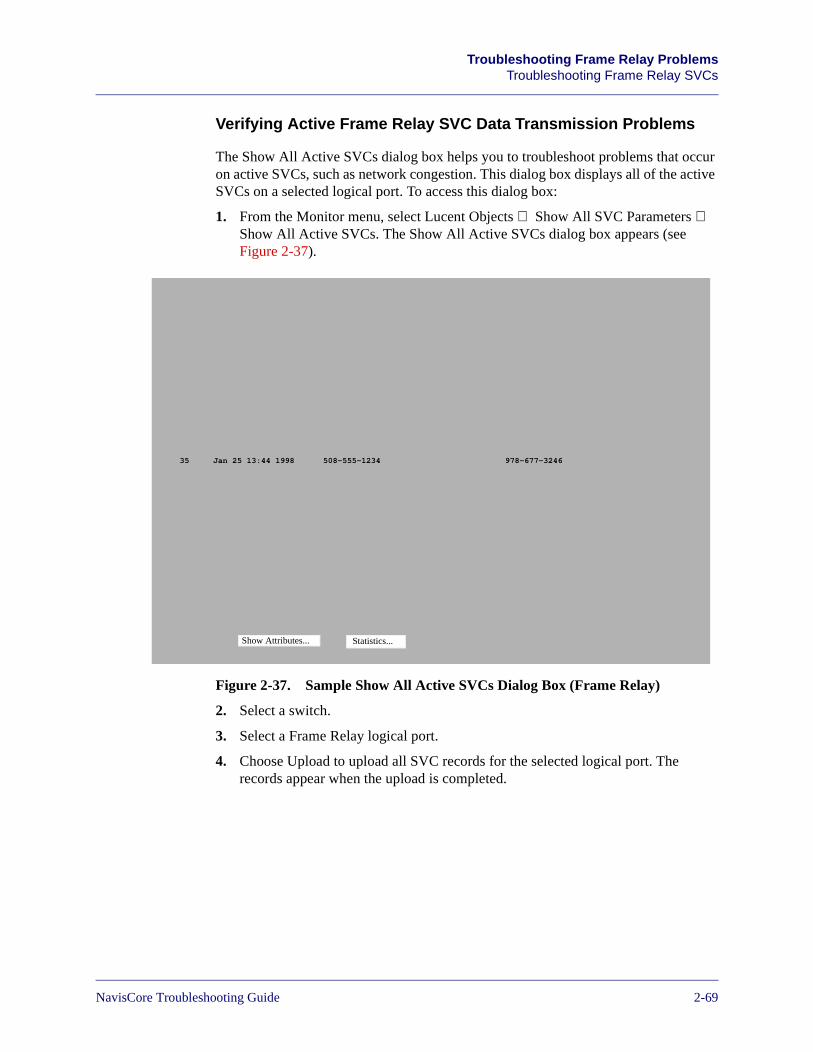
Beta Draft ConfidentialTroubleshooting Frame Relay Problems
Troubleshooting Frame Relay SVCs
Verifying Active Frame Relay SVC Data Transmission Problems
The Show All Active SVCs dialog box helps you to troubleshoot problems that occur on active SVCs, such as network congestion. This dialog box displays all of the active SVCs on a selected logical port. To access this dialog box:
1. From the Monitor menu, select Lucent Objects ⇒ Show All SVC Parameters ⇒ Show All Active SVCs. The Show All Active SVCs dialog box appears (see Figure 2-37).
Figure 2-37. Sample Show All Active SVCs Dialog Box (Frame Relay)
2. Select a switch.
3. Select a Frame Relay logical port.
4. Choose Upload to upload all SVC records for the selected logical port. The records appear when the upload is completed.
35 Jan 25 13:44 1998 508-555-1234 978-677-3246
Statistics...Show Attributes...
NavisCore Troubleshooting Guide 7/17/032-69
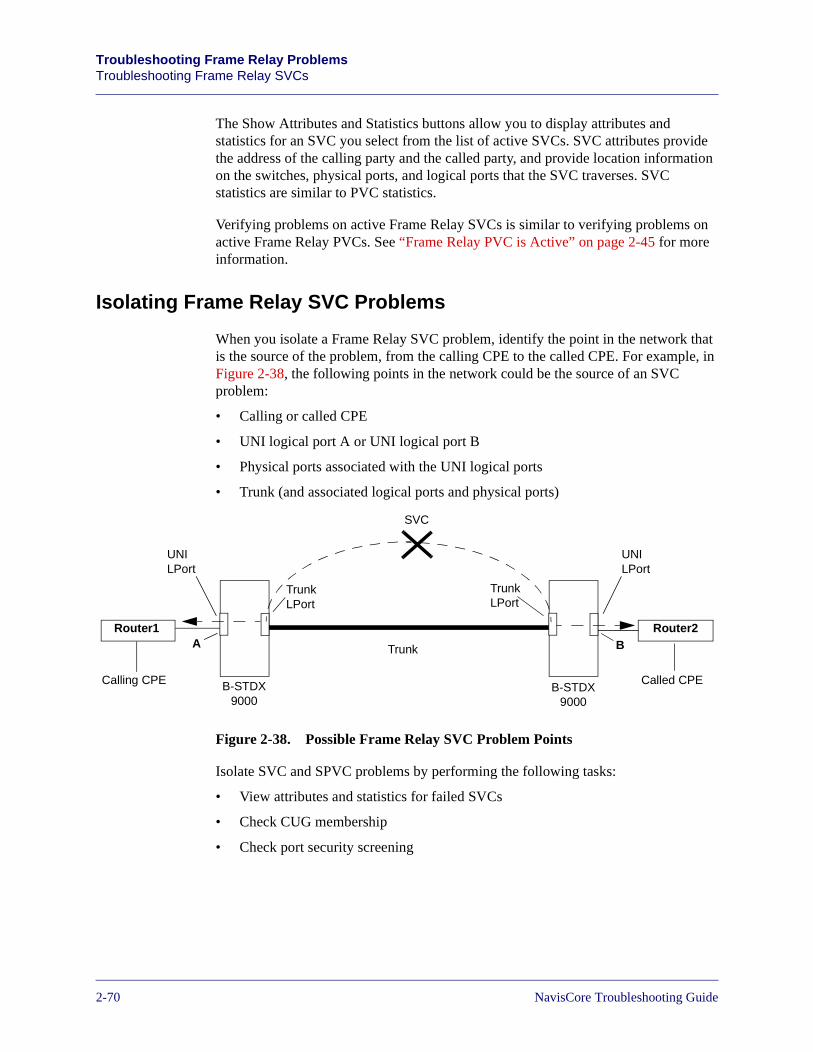
Beta Draft ConfidentialTroubleshooting Frame Relay ProblemsTroubleshooting Frame Relay SVCs
The Show Attributes and Statistics buttons allow you to display attributes and statistics for an SVC you select from the list of active SVCs. SVC attributes provide the address of the calling party and the called party, and provide location information on the switches, physical ports, and logical ports that the SVC traverses. SVC statistics are similar to PVC statistics.
Verifying problems on active Frame Relay SVCs is similar to verifying problems on active Frame Relay PVCs. See “Frame Relay PVC is Active” on page 2-45 for more information.
Isolating Frame Relay SVC Problems
When you isolate a Frame Relay SVC problem, identify the point in the network that is the source of the problem, from the calling CPE to the called CPE. For example, in Figure 2-38, the following points in the network could be the source of an SVC problem:
• Calling or called CPE
• UNI logical port A or UNI logical port B
• Physical ports associated with the UNI logical ports
• Trunk (and associated logical ports and physical ports)
Figure 2-38. Possible Frame Relay SVC Problem Points
Isolate SVC and SPVC problems by performing the following tasks:
• View attributes and statistics for failed SVCs
• Check CUG membership
• Check port security screening
Router2Router1
SVC
Trunk
B-STDX 9000
B-STDX 9000
A B
TrunkLPort
TrunkLPort
UNILPort
UNILPort
Calling CPE Called CPE
2-707/17/03 NavisCore Troubleshooting Guide
Beta Draft ConfidentialTroubleshooting Frame Relay Problems
Troubleshooting Frame Relay SVCs
View Attributes and Statistics for Failed Frame Relay SVCs
Begin the problem isolation process by viewing attributes for the failed or active SVCs. See “Verifying Frame Relay SVC Problems” on page 2-67 and the NavisCore Diagnostics Guide for more information.
For failed SVCs, the following attributes prove especially useful for problem isolation:
• Addresses of the calling party and the called party. Use these addresses to identify the calling CPE and the called CPE.
• Failure cause and diagnostic information that describe the reason for the failure.
• Failure location information, which helps you identify the point in the network where the failure occurred.
For active SVCs, the following attributes prove especially useful for problem isolation:
• Addresses of the calling party and the called party.
• SVC location and destination information, which helps you identify the switches, physical ports, logical ports, and path that the SVC traverses.
See the NavisCore Diagnostics Guide for more information on the active and failed SVC attributes.
In addition, for active SVCs, you can use the SVC Summary Statistics dialog box to both verify and isolate problems. The SVC Summary Statistics dialog box provides the same statistics as the Circuit Summary Statistics dialog box for PVCs (see Figure 2-24 on page 2-46). The FECN and BECN statistics can prove especially valuable in isolating SVC problems, just as they can help you isolate PVC problems. See “Using FECN and BECN Statistics to Isolate Problems” on page 2-54 for more information.
NavisCore Troubleshooting Guide 7/17/032-71
Beta Draft ConfidentialTroubleshooting Frame Relay ProblemsTroubleshooting Frame Relay SVCs
Check Frame Relay SVC CUG Membership
If a called node repeatedly rejects calls from a calling node, the rejection could result from the called node’s membership in a Closed User Group (CUG).
If the calling node does not belong to the called node’s CUG, then the called node will reject the call. This may not be a problem, depending on your network security requirements.
Check the CUG membership of the calling node and the called node. Depending on network security requirements, reconfigure CUG membership to allow the calling node to call the called node, or leave the current CUG membership unchanged.
See the NavisCore Frame Relay Configuration Guide for more information on configuring CUG membership.
Check Frame Relay SVC Port Security Screening
Call attempts may not complete due to port security screening, which can block SVC call setup attempts at either ingress or egress logical ports. This may not be a problem, depending on your network security requirements.
Check the port security screen configuration at ingress and egress logical ports. Depending on network security requirements, reconfigure port security screens so that call setup attempts are no longer blocked, or leave the current port security screen configuration unchanged.
See the NavisCore Frame Relay Configuration Guide for more information on configuring port security screens.
Correcting Frame Relay SVC Problems
The actions you take to correct a Frame Relay SVC problem will vary, and may have nothing to do with the SVC at all. You may have to resolve problems with the physical ports, logical ports, trunks, switches, and CPE that the SVC traverses. See the earlier sections in this chapter for information on resolving physical port, logical port, and trunk problems.
A significant number of failed SVCs on a specific logical port may indicate that the logical port is oversubscribed. Consider off-loading some of the SVC calls on to other logical ports. See the NavisCore Frame Relay Configuration Guide for details on configuring logical ports for SVCs.
2-727/17/03 NavisCore Troubleshooting Guide
Beta Draft ConfidentialTroubleshooting Frame Relay Problems
First-in First-out Block Limits on Channelized DS3/1 and DS3/1/0 Modules (CBX 500)
First-in First-out Block Limits on Channelized DS3/1and DS3/1/0 Modules (CBX 500)
When configuring LPorts on 4-Port Channelized DS3/1 and DS3/1/0 PPorts, the number of First-In First-Out (FIFO) blocks on these LPorts cannot exceed the parameter listed in the release notes for the software running on your switch. This limitation holds true even if the LPort limits on each of these PPorts have not been reached.
Logical Port Limits for Channelized DS3/1 and DS3/1/0 Modules
The lport limits for the Channelized DS3/1 and DS3/1/0 modules are as follows:
• DS3/1 logical port capability — Allows up to 112 logical ports per card with a maximum of 28 logical ports per physical port.
• DS3/1/0 logical port capability — Allows up to 1024 logical ports per card with
– 128 logical ports available on physical ports 1 and 2.
– 384 logical ports available on physical ports 3 and 4.
These numbers may vary by release, see the software release notice for your version of the CBX switch software for the most up-to-date information.
NavisCore Troubleshooting Guide 7/17/032-73
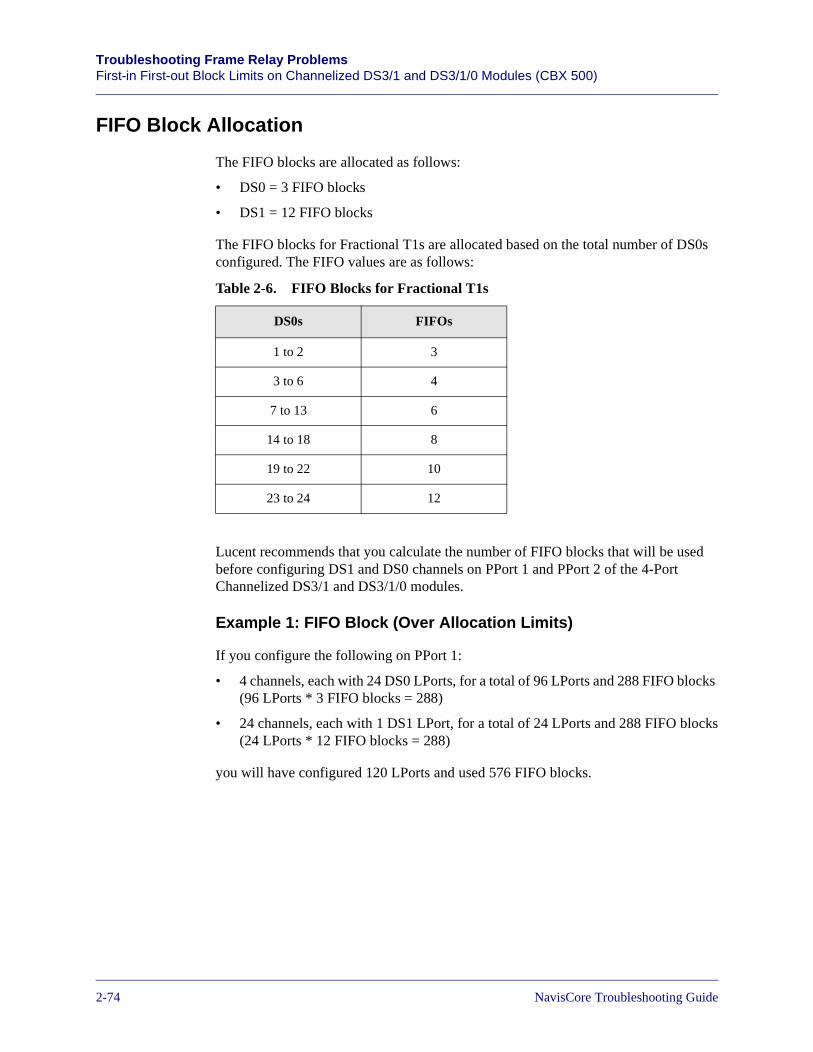
Beta Draft ConfidentialTroubleshooting Frame Relay ProblemsFirst-in First-out Block Limits on Channelized DS3/1 and DS3/1/0 Modules (CBX 500)
FIFO Block Allocation
The FIFO blocks are allocated as follows:
• DS0 = 3 FIFO blocks
• DS1 = 12 FIFO blocks
The FIFO blocks for Fractional T1s are allocated based on the total number of DS0s configured. The FIFO values are as follows:
Lucent recommends that you calculate the number of FIFO blocks that will be used before configuring DS1 and DS0 channels on PPort 1 and PPort 2 of the 4-Port Channelized DS3/1 and DS3/1/0 modules.
Example 1: FIFO Block (Over Allocation Limits)
If you configure the following on PPort 1:
• 4 channels, each with 24 DS0 LPorts, for a total of 96 LPorts and 288 FIFO blocks (96 LPorts * 3 FIFO blocks = 288)
• 24 channels, each with 1 DS1 LPort, for a total of 24 LPorts and 288 FIFO blocks(24 LPorts * 12 FIFO blocks = 288)
you will have configured 120 LPorts and used 576 FIFO blocks.
Table 2-6. FIFO Blocks for Fractional T1s
DS0s FIFOs
1 to 2 3
3 to 6 4
7 to 13 6
14 to 18 8
19 to 22 10
23 to 24 12
2-747/17/03 NavisCore Troubleshooting Guide
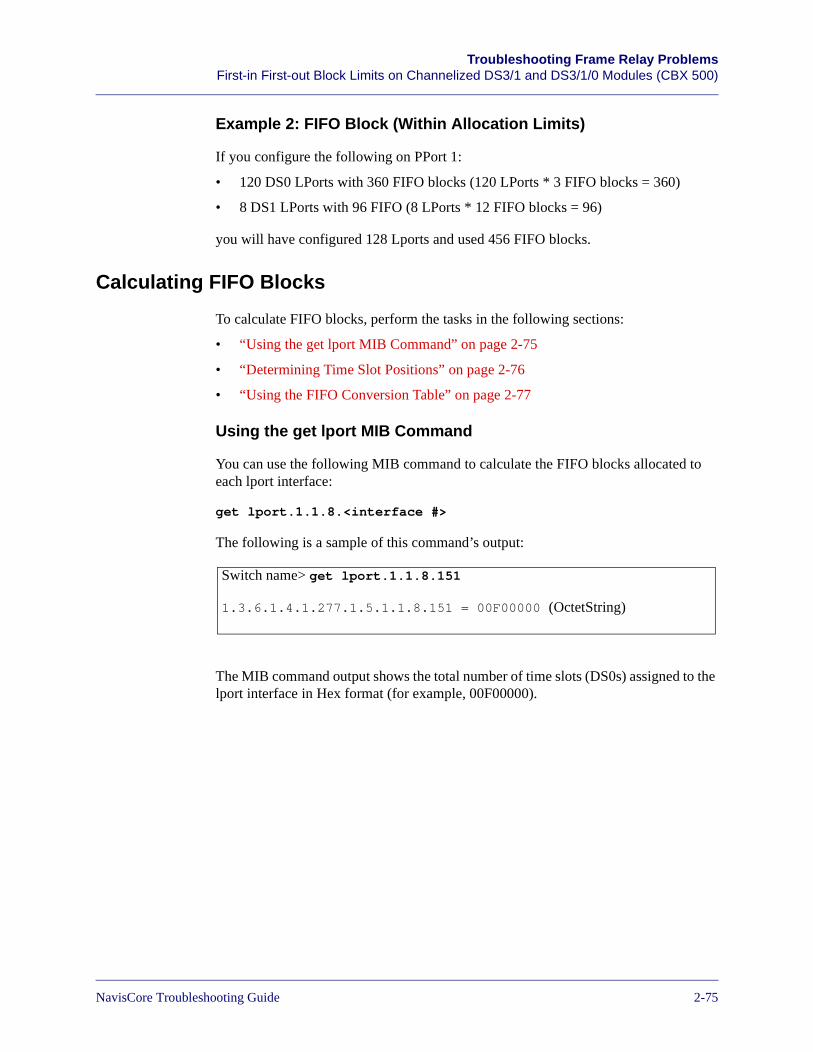
Beta Draft ConfidentialTroubleshooting Frame Relay Problems
First-in First-out Block Limits on Channelized DS3/1 and DS3/1/0 Modules (CBX 500)
Example 2: FIFO Block (Within Allocation Limits)
If you configure the following on PPort 1:
• 120 DS0 LPorts with 360 FIFO blocks (120 LPorts * 3 FIFO blocks = 360)
• 8 DS1 LPorts with 96 FIFO (8 LPorts * 12 FIFO blocks = 96)
you will have configured 128 Lports and used 456 FIFO blocks.
Calculating FIFO Blocks
To calculate FIFO blocks, perform the tasks in the following sections:
• “Using the get lport MIB Command” on page 2-75
• “Determining Time Slot Positions” on page 2-76
• “Using the FIFO Conversion Table” on page 2-77
Using the get lport MIB Command
You can use the following MIB command to calculate the FIFO blocks allocated to each lport interface:
get lport.1.1.8.<interface #>
The following is a sample of this command’s output:
The MIB command output shows the total number of time slots (DS0s) assigned to the lport interface in Hex format (for example, 00F00000).
Switch name> get lport.1.1.8.151
1.3.6.1.4.1.277.1.5.1.1.8.151 = 00F00000 (OctetString)
NavisCore Troubleshooting Guide 7/17/032-75
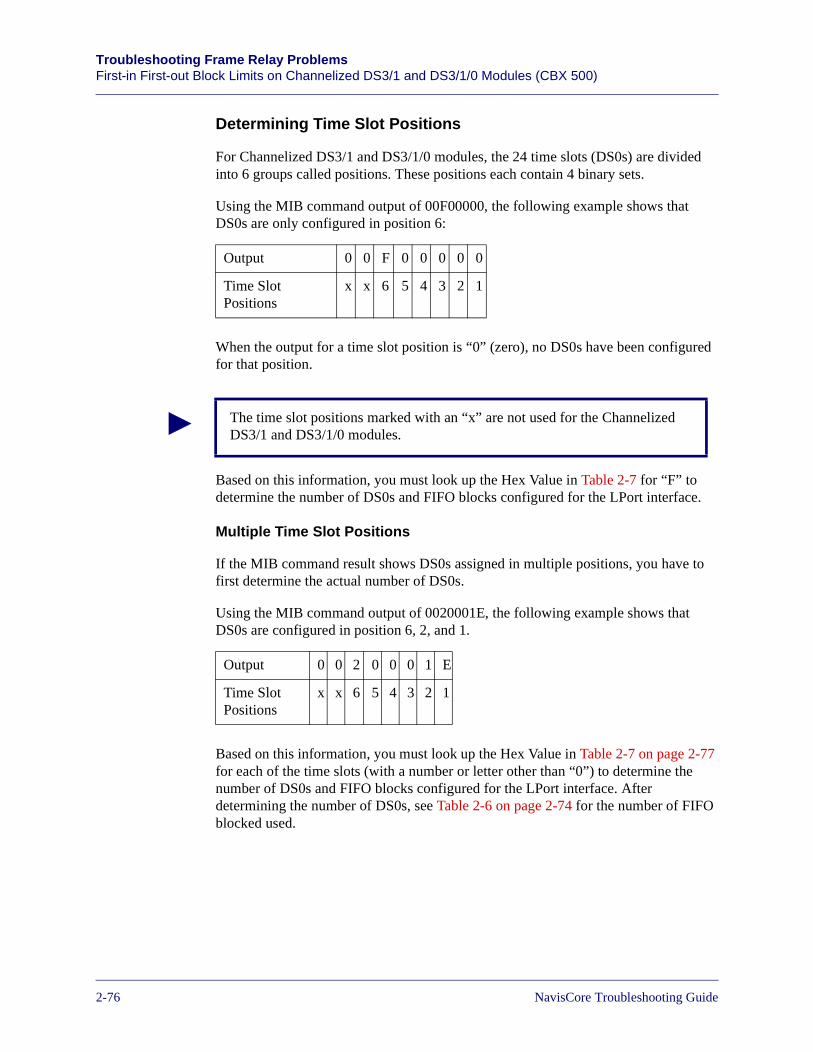
Beta Draft ConfidentialTroubleshooting Frame Relay ProblemsFirst-in First-out Block Limits on Channelized DS3/1 and DS3/1/0 Modules (CBX 500)
Determining Time Slot Positions
For Channelized DS3/1 and DS3/1/0 modules, the 24 time slots (DS0s) are divided into 6 groups called positions. These positions each contain 4 binary sets.
Using the MIB command output of 00F00000, the following example shows that DS0s are only configured in position 6:
When the output for a time slot position is “0” (zero), no DS0s have been configured for that position.
Based on this information, you must look up the Hex Value in Table 2-7 for “F” to determine the number of DS0s and FIFO blocks configured for the LPort interface.
Multiple Time Slot Positions
If the MIB command result shows DS0s assigned in multiple positions, you have to first determine the actual number of DS0s.
Using the MIB command output of 0020001E, the following example shows that DS0s are configured in position 6, 2, and 1.
Based on this information, you must look up the Hex Value in Table 2-7 on page 2-77 for each of the time slots (with a number or letter other than “0”) to determine the number of DS0s and FIFO blocks configured for the LPort interface. After determining the number of DS0s, see Table 2-6 on page 2-74 for the number of FIFO blocked used.
Output 0 0 F 0 0 0 0 0
Time Slot Positions
x x 6 5 4 3 2 1
The time slot positions marked with an “x” are not used for the Channelized DS3/1 and DS3/1/0 modules.
Output 0 0 2 0 0 0 1 E
Time Slot Positions
x x 6 5 4 3 2 1
2-767/17/03 NavisCore Troubleshooting Guide
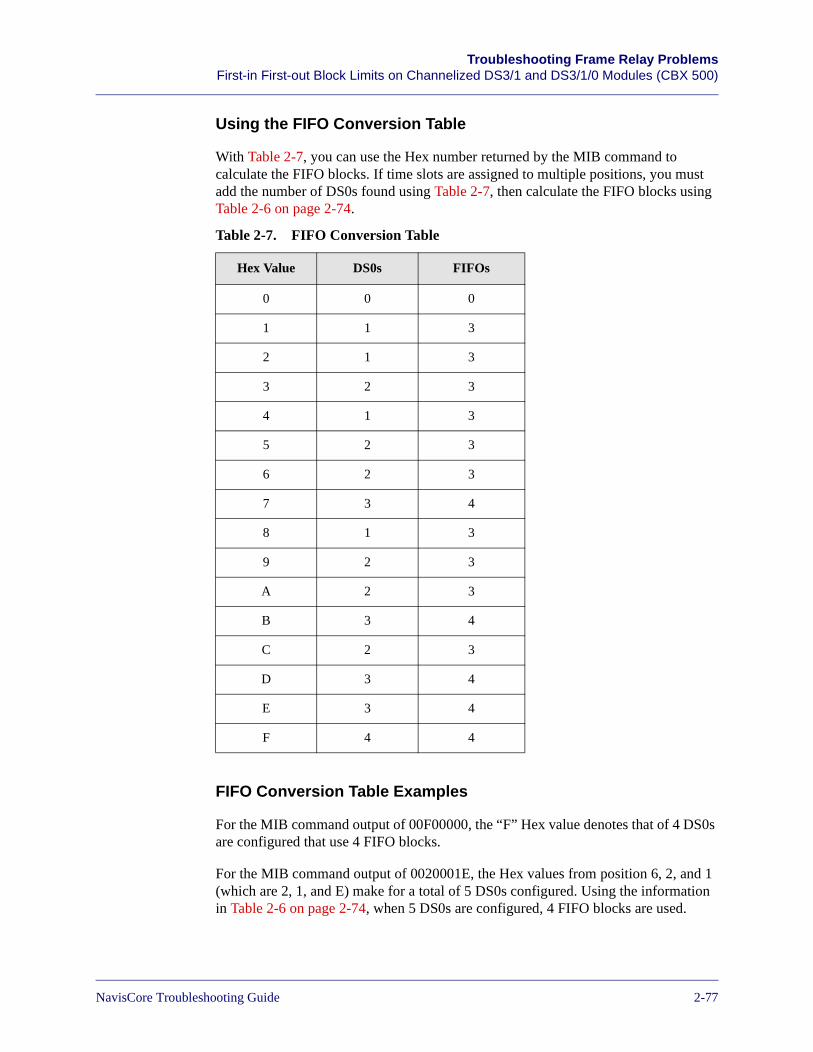
Beta Draft ConfidentialTroubleshooting Frame Relay Problems
First-in First-out Block Limits on Channelized DS3/1 and DS3/1/0 Modules (CBX 500)
Using the FIFO Conversion Table
With Table 2-7, you can use the Hex number returned by the MIB command to calculate the FIFO blocks. If time slots are assigned to multiple positions, you must add the number of DS0s found using Table 2-7, then calculate the FIFO blocks using Table 2-6 on page 2-74.
FIFO Conversion Table Examples
For the MIB command output of 00F00000, the “F” Hex value denotes that of 4 DS0s are configured that use 4 FIFO blocks.
For the MIB command output of 0020001E, the Hex values from position 6, 2, and 1 (which are 2, 1, and E) make for a total of 5 DS0s configured. Using the information in Table 2-6 on page 2-74, when 5 DS0s are configured, 4 FIFO blocks are used.
Table 2-7. FIFO Conversion Table
Hex Value DS0s FIFOs
0 0 0
1 1 3
2 1 3
3 2 3
4 1 3
5 2 3
6 2 3
7 3 4
8 1 3
9 2 3
A 2 3
B 3 4
C 2 3
D 3 4
E 3 4
F 4 4
NavisCore Troubleshooting Guide 7/17/032-77

Beta Draft ConfidentialTroubleshooting Frame Relay ProblemsFirst-in First-out Block Limits on Channelized DS3/1 and DS3/1/0 Modules (CBX 500)
2-787/17/03 NavisCore Troubleshooting Guide
NavisCore Troubleshooting Guide
Beta Draft Confidential
3
Troubleshooting ATM Problems
This chapter describes how to troubleshoot problems on Lucent switches in ATM networks using the NMS. This chapter divides ATM troubleshooting into the following areas:
• Physical ports
• Logical ports
• Trunks
• Circuits (PVCs, SVCs, and SPVCs)
3-1
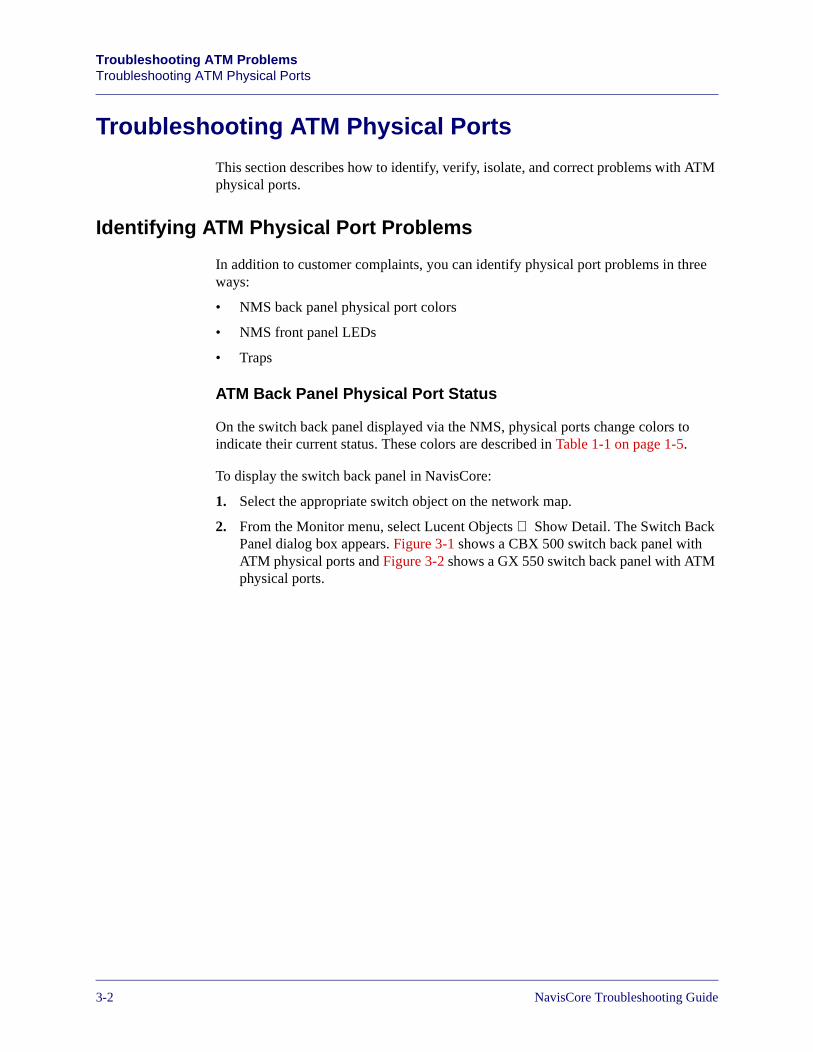
Beta Draft ConfidentialTroubleshooting ATM ProblemsTroubleshooting ATM Physical Ports
Troubleshooting ATM Physical Ports
This section describes how to identify, verify, isolate, and correct problems with ATM physical ports.
Identifying ATM Physical Port Problems
In addition to customer complaints, you can identify physical port problems in three ways:
• NMS back panel physical port colors
• NMS front panel LEDs
• Traps
ATM Back Panel Physical Port Status
On the switch back panel displayed via the NMS, physical ports change colors to indicate their current status. These colors are described in Table 1-1 on page 1-5.
To display the switch back panel in NavisCore:
1. Select the appropriate switch object on the network map.
2. From the Monitor menu, select Lucent Objects ⇒ Show Detail. The Switch Back Panel dialog box appears. Figure 3-1 shows a CBX 500 switch back panel with ATM physical ports and Figure 3-2 shows a GX 550 switch back panel with ATM physical ports.
3-27/17/03 NavisCore Troubleshooting Guide
Beta Draft ConfidentialTroubleshooting ATM Problems
Troubleshooting ATM Physical Ports
Figure 3-1. ATM Physical Ports on a CBX 500
NavisCore Troubleshooting Guide 7/17/033-3
Beta Draft ConfidentialTroubleshooting ATM ProblemsTroubleshooting ATM Physical Ports
Figure 3-2. ATM Physical Ports on a GX 550
When a physical port turns from green to red, it indicates one of the following conditions:
• A physical link problem exists.
• All the logical ports on the physical port are down. See “Troubleshooting ATM Logical Ports” on page 3-19 for more information.
3-47/17/03 NavisCore Troubleshooting Guide
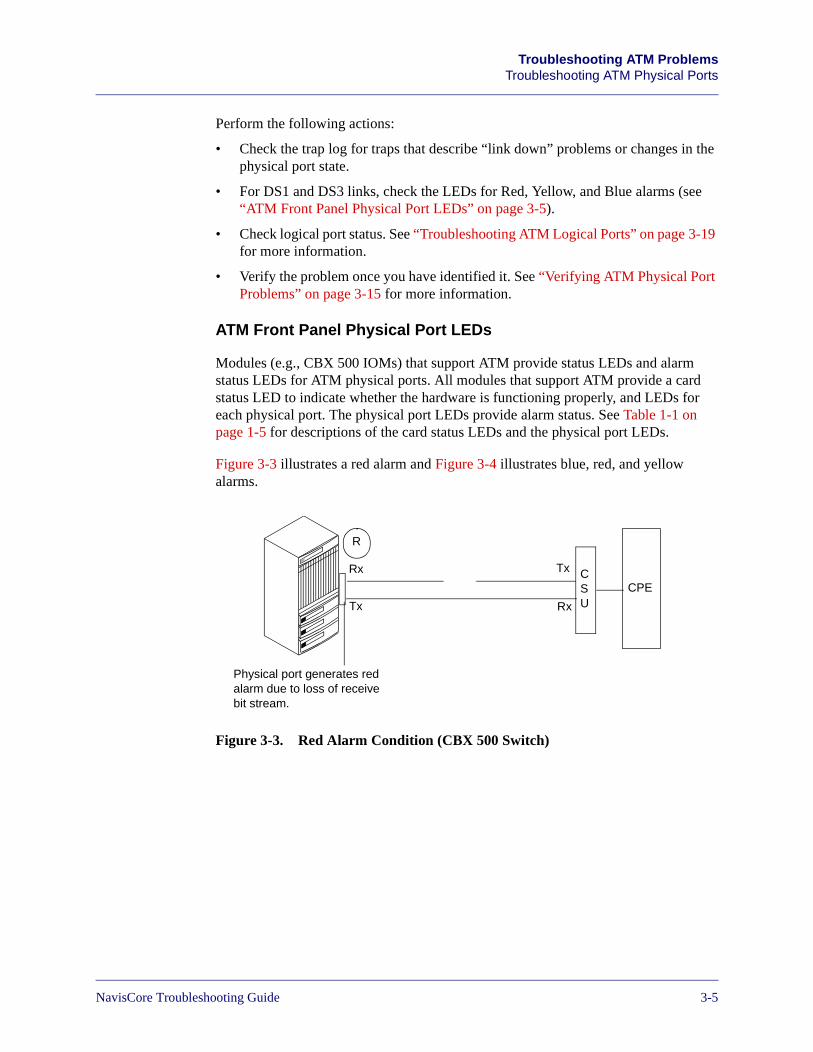
Beta Draft ConfidentialTroubleshooting ATM Problems
Troubleshooting ATM Physical Ports
Perform the following actions:
• Check the trap log for traps that describe “link down” problems or changes in the physical port state.
• For DS1 and DS3 links, check the LEDs for Red, Yellow, and Blue alarms (see “ATM Front Panel Physical Port LEDs” on page 3-5).
• Check logical port status. See “Troubleshooting ATM Logical Ports” on page 3-19 for more information.
• Verify the problem once you have identified it. See “Verifying ATM Physical Port Problems” on page 3-15 for more information.
ATM Front Panel Physical Port LEDs
Modules (e.g., CBX 500 IOMs) that support ATM provide status LEDs and alarm status LEDs for ATM physical ports. All modules that support ATM provide a card status LED to indicate whether the hardware is functioning properly, and LEDs for each physical port. The physical port LEDs provide alarm status. See Table 1-1 on page 1-5 for descriptions of the card status LEDs and the physical port LEDs.
Figure 3-3 illustrates a red alarm and Figure 3-4 illustrates blue, red, and yellow alarms.
Figure 3-3. Red Alarm Condition (CBX 500 Switch)
CSU
CPE
Physical port generates red alarm due to loss of receive bit stream.
Tx
Rx Tx
Rx
R
NavisCore Troubleshooting Guide 7/17/033-5
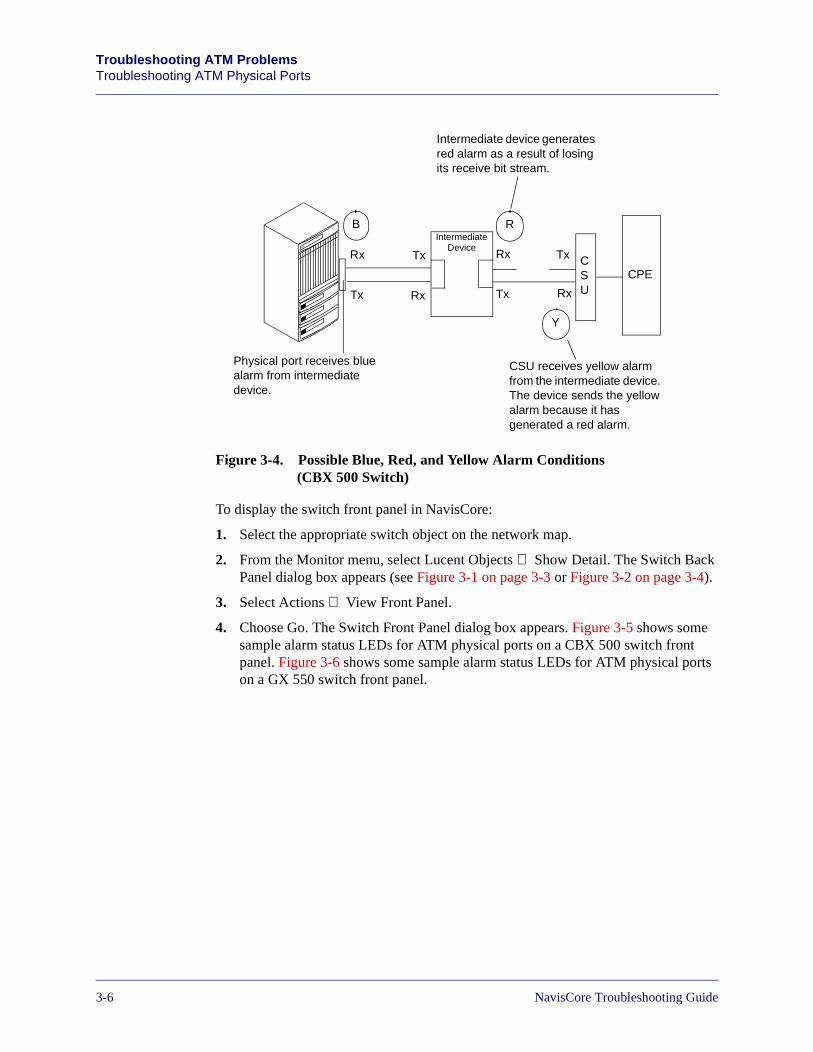
Beta Draft ConfidentialTroubleshooting ATM ProblemsTroubleshooting ATM Physical Ports
Figure 3-4. Possible Blue, Red, and Yellow Alarm Conditions(CBX 500 Switch)
To display the switch front panel in NavisCore:
1. Select the appropriate switch object on the network map.
2. From the Monitor menu, select Lucent Objects ⇒ Show Detail. The Switch Back Panel dialog box appears (see Figure 3-1 on page 3-3 or Figure 3-2 on page 3-4).
3. Select Actions ⇒ View Front Panel.
4. Choose Go. The Switch Front Panel dialog box appears. Figure 3-5 shows some sample alarm status LEDs for ATM physical ports on a CBX 500 switch front panel. Figure 3-6 shows some sample alarm status LEDs for ATM physical ports on a GX 550 switch front panel.
CSU
CPE
Physical port receives blue alarm from intermediate device.
Tx
Rx Tx
Tx
Tx
Rx
Rx
Rx
IntermediateDevice
Intermediate device generates red alarm as a result of losing its receive bit stream.
B
Y
R
CSU receives yellow alarm from the intermediate device. The device sends the yellow alarm because it has generated a red alarm.
3-67/17/03 NavisCore Troubleshooting Guide
Beta Draft ConfidentialTroubleshooting ATM Problems
Troubleshooting ATM Physical Ports
Figure 3-5. Alarm Status LEDs on a CBX 500
NavisCore Troubleshooting Guide 7/17/033-7
Beta Draft ConfidentialTroubleshooting ATM ProblemsTroubleshooting ATM Physical Ports
Figure 3-6. Alarm Status LEDs on a GX 550
3-87/17/03 NavisCore Troubleshooting Guide
Beta Draft ConfidentialTroubleshooting ATM Problems
Troubleshooting ATM Physical Ports
ATM DS1 and DS3 Physical Port Failures
In addition to the red, blue, and yellow alarms, other reasons for DS1 and DS3 failures include:
Bipolar Violations (BPVs) — BPV or “noise” errors depend on the type of signal coding that is in use. The types of signal coding are alternate mark inversion (AMI), bipolar with eight zero substitution (B8ZS), and high-density bipolar of order 3 (HDB3). The errors are as follows:
• For an AMI-coded signal, a BPV error is the occurrence of a pulse of the same polarity as the previous pulse.
• For a B8ZS-coded or an HDB3-coded signal, a BPV error is the occurrence of a pulse of the same polarity as the previous pulse without being a part of the zero substitution code.
Excessive Zeroes (EXZs) — EXZ errors are of three types, depending on the type of signal coding (AMI, B8ZS, or HDB3):
• For an AMI-coded signal, an EXZ error event is the occurrence of more than 15 contiguous zeroes.
• For a B8ZS-coded signal, an EXZ error event is the occurrence of more than seven contiguous zeroes.
• For an HDB3-coded signal, an EXZ error event is the occurrence of more than three contiguous zeroes.
To detect the presence of BPV and EXZ errors, display DS3 and DS1 performance monitoring statistics. Pay special attention to Code Violations and Errored Seconds statistics. See the NavisCore Diagnostics Guide for more information.
Performance monitoring statistics are not available for all modules.
NavisCore Troubleshooting Guide 7/17/033-9
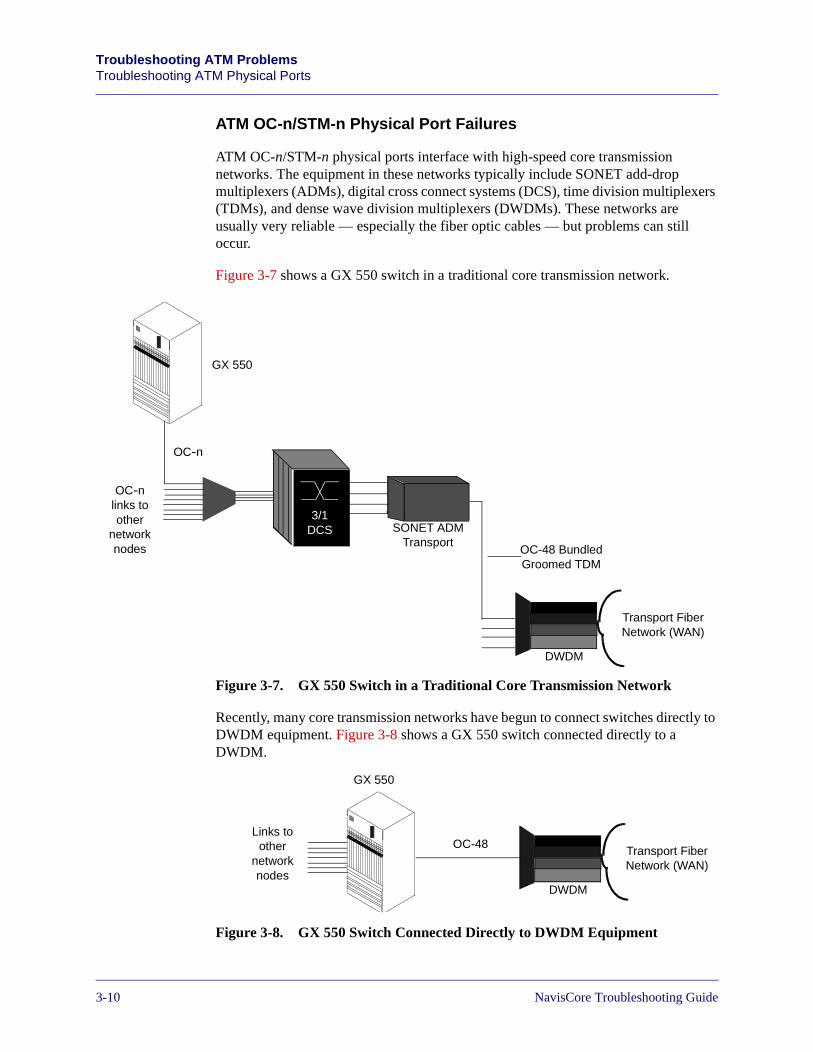
Beta Draft ConfidentialTroubleshooting ATM ProblemsTroubleshooting ATM Physical Ports
ATM OC-n/STM-n Physical Port Failures
ATM OC-n/STM-n physical ports interface with high-speed core transmission networks. The equipment in these networks typically include SONET add-drop multiplexers (ADMs), digital cross connect systems (DCS), time division multiplexers (TDMs), and dense wave division multiplexers (DWDMs). These networks are usually very reliable — especially the fiber optic cables — but problems can still occur.
Figure 3-7 shows a GX 550 switch in a traditional core transmission network.
Figure 3-7. GX 550 Switch in a Traditional Core Transmission Network
Recently, many core transmission networks have begun to connect switches directly to DWDM equipment. Figure 3-8 shows a GX 550 switch connected directly to a DWDM.
Figure 3-8. GX 550 Switch Connected Directly to DWDM Equipment
3/1DCS SONET ADM
Transport
DWDM
Transport Fiber Network (WAN)
OC-n
OC-n links to other
network nodes
GX 550
OC-48 Bundled Groomed TDM
DWDM
Transport Fiber Network (WAN)
Links to other
network nodes
GX 550
OC-48
3-107/17/03 NavisCore Troubleshooting Guide
Beta Draft ConfidentialTroubleshooting ATM Problems
Troubleshooting ATM Physical Ports
If a physical port in a core transmission network turns red, the source of the problem may be:
• The Lucent switch
• The other equipment in the network (DWDMs, ADMs, TDMs, etc.)
Although they are infrequent, fiber optic cable problems may be the source of the problem. Some typical problems include:
• Cable break. This problem is often referred to as a “back hoe fade,” where construction equipment accidentally cuts the cable.
• Improperly configured fiber optic connections. A fiber optic connection consists of two fibers that transmit in both directions (Point A to Point B and Point B to Point A). Upon installation, it is fairly common for the transmit and receive fibers to be switched. The result is that you transmit to a transmitter and receive from a receiver.
• Dirty optical equipment. All optical components must be kept clean. Dirt on any optical surface causes transmission loss.
• Damaged connectors and cables. Connectors and cables should be handled with care. Cables should not be bent too tightly, especially near the connectors, as sharp bends can break the fibers. Dropped connectors can be damaged by a blow to the optical face. If you pull hard on the connectors, you may break the fiber in the back of the connector or cause other problems.
• High end-to-end signal loss. Fiber optic networks are designed to operate over a range of signal loss, which is commonly referred to as the system margin. Too much loss or too little loss can be a problem. If the loss is too high, the signal will be low at the receiver, causing a poor signal-to-noise condition in the receiver. If the loss is too low, the power level at the receiver will be too high, causing receiver saturation. Both these conditions cause high bit-error rates in digital systems or poor analog signal performance. Possible causes of high and low loss include bad connectors, bad splice bushings in patch panels, cables bent too tightly around corners, broken fibers in cables, or even bad launch or receive cables or instruments.
• A failed LED or laser transmitter. These components are the most likely to fail since they undergo more stress than any other components.
See the documentation from your fiber optic equipment manufacturer for more information on troubleshooting fiber optic problems.
NavisCore Troubleshooting Guide 7/17/033-11
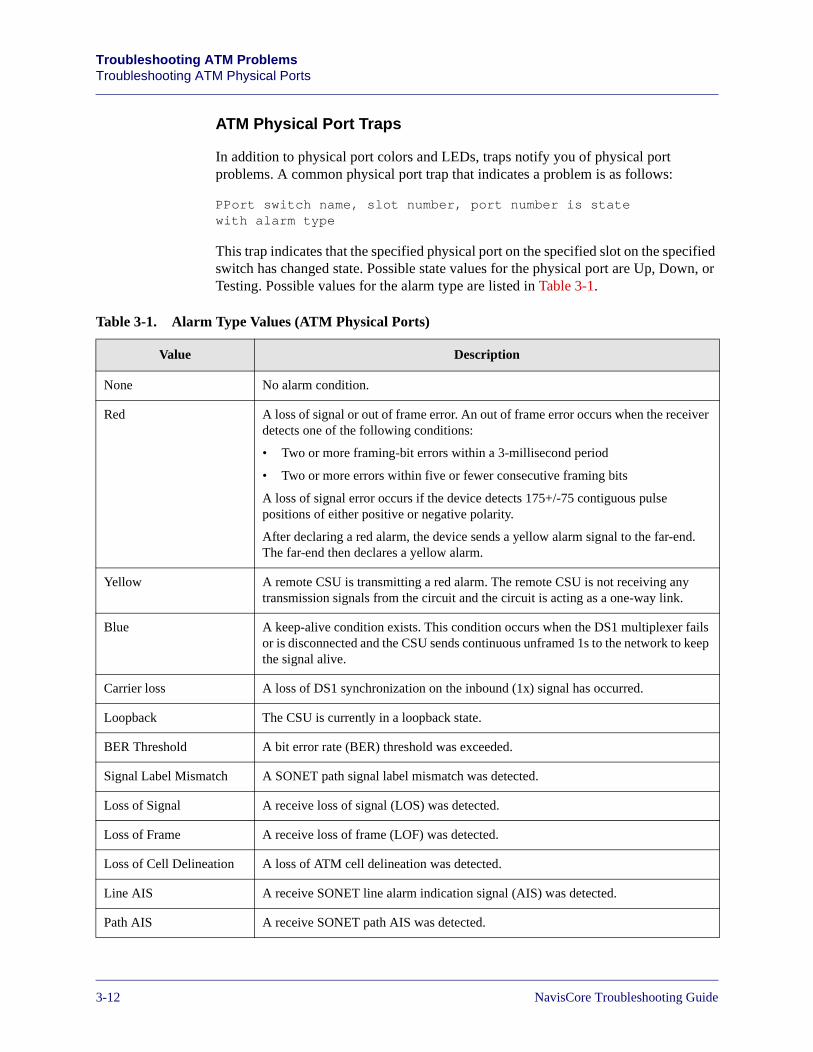
Beta Draft ConfidentialTroubleshooting ATM ProblemsTroubleshooting ATM Physical Ports
ATM Physical Port Traps
In addition to physical port colors and LEDs, traps notify you of physical port problems. A common physical port trap that indicates a problem is as follows:
PPort switch name, slot number, port number is state with alarm type
This trap indicates that the specified physical port on the specified slot on the specified switch has changed state. Possible state values for the physical port are Up, Down, or Testing. Possible values for the alarm type are listed in Table 3-1.
Table 3-1. Alarm Type Values (ATM Physical Ports)
Value Description
None No alarm condition.
Red A loss of signal or out of frame error. An out of frame error occurs when the receiver detects one of the following conditions:
• Two or more framing-bit errors within a 3-millisecond period
• Two or more errors within five or fewer consecutive framing bits
A loss of signal error occurs if the device detects 175+/-75 contiguous pulse positions of either positive or negative polarity.
After declaring a red alarm, the device sends a yellow alarm signal to the far-end. The far-end then declares a yellow alarm.
Yellow A remote CSU is transmitting a red alarm. The remote CSU is not receiving any transmission signals from the circuit and the circuit is acting as a one-way link.
Blue A keep-alive condition exists. This condition occurs when the DS1 multiplexer fails or is disconnected and the CSU sends continuous unframed 1s to the network to keep the signal alive.
Carrier loss A loss of DS1 synchronization on the inbound (1x) signal has occurred.
Loopback The CSU is currently in a loopback state.
BER Threshold A bit error rate (BER) threshold was exceeded.
Signal Label Mismatch A SONET path signal label mismatch was detected.
Loss of Signal A receive loss of signal (LOS) was detected.
Loss of Frame A receive loss of frame (LOF) was detected.
Loss of Cell Delineation A loss of ATM cell delineation was detected.
Line AIS A receive SONET line alarm indication signal (AIS) was detected.
Path AIS A receive SONET path AIS was detected.
3-127/17/03 NavisCore Troubleshooting Guide
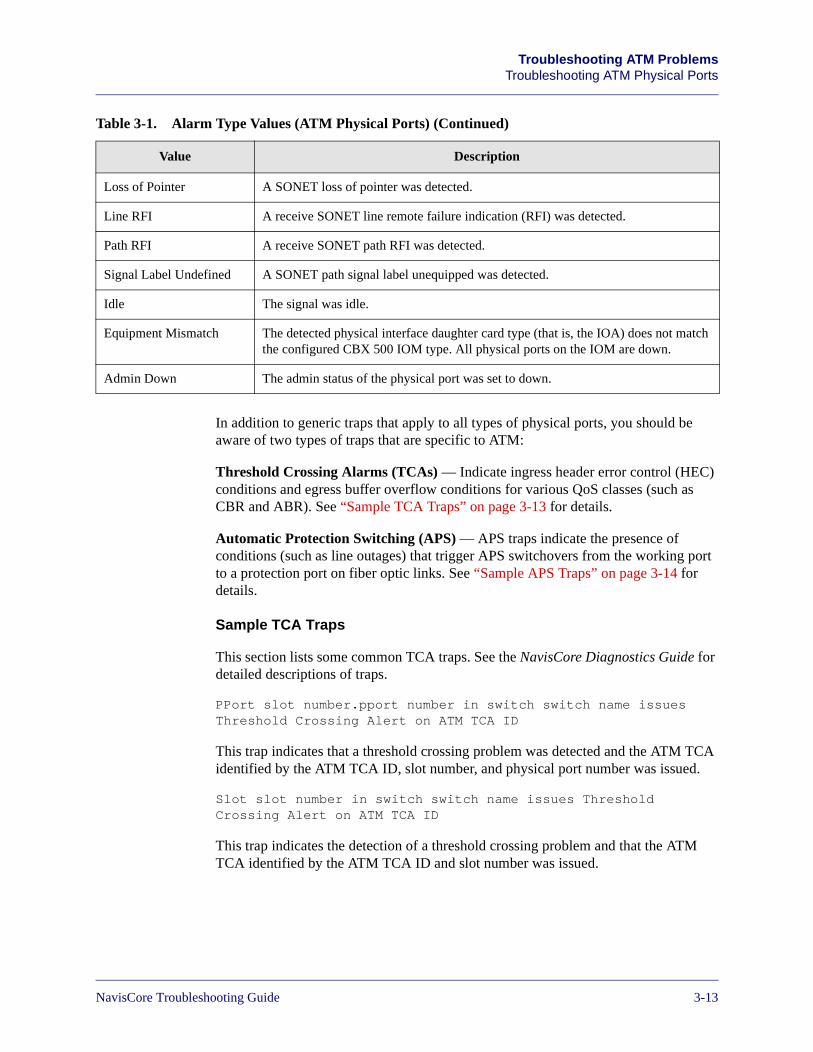
Beta Draft ConfidentialTroubleshooting ATM Problems
Troubleshooting ATM Physical Ports
In addition to generic traps that apply to all types of physical ports, you should be aware of two types of traps that are specific to ATM:
Threshold Crossing Alarms (TCAs) — Indicate ingress header error control (HEC) conditions and egress buffer overflow conditions for various QoS classes (such as CBR and ABR). See “Sample TCA Traps” on page 3-13 for details.
Automatic Protection Switching (APS) — APS traps indicate the presence of conditions (such as line outages) that trigger APS switchovers from the working port to a protection port on fiber optic links. See “Sample APS Traps” on page 3-14 for details.
Sample TCA Traps
This section lists some common TCA traps. See the NavisCore Diagnostics Guide for detailed descriptions of traps.
PPort slot number.pport number in switch switch name issues Threshold Crossing Alert on ATM TCA ID
This trap indicates that a threshold crossing problem was detected and the ATM TCA identified by the ATM TCA ID, slot number, and physical port number was issued.
Slot slot number in switch switch name issues Threshold Crossing Alert on ATM TCA ID
This trap indicates the detection of a threshold crossing problem and that the ATM TCA identified by the ATM TCA ID and slot number was issued.
Loss of Pointer A SONET loss of pointer was detected.
Line RFI A receive SONET line remote failure indication (RFI) was detected.
Path RFI A receive SONET path RFI was detected.
Signal Label Undefined A SONET path signal label unequipped was detected.
Idle The signal was idle.
Equipment Mismatch The detected physical interface daughter card type (that is, the IOA) does not match the configured CBX 500 IOM type. All physical ports on the IOM are down.
Admin Down The admin status of the physical port was set to down.
Table 3-1. Alarm Type Values (ATM Physical Ports) (Continued)
Value Description
NavisCore Troubleshooting Guide 7/17/033-13
Beta Draft ConfidentialTroubleshooting ATM ProblemsTroubleshooting ATM Physical Ports
Sample APS Traps
This section lists some common APS traps. See the NavisCore Diagnostics Guide for detailed descriptions of traps.
At Slot slot number Port port number in Switch switch name the protection line is now state
This trap indicates that a protection switching (APS) event has just taken place on the specified port on the specified slot on the specified switch.
At Slot slot number Port port number in Switch switch name attempting to receive traffic from working line
This trap indicates that the specified working line physical port (APS related) on the specified slot on the specified switch has resumed carrying user traffic. This may be due to either an auto switch condition that has cleared or a problem detected on the protection line.
At Slot slot number Port port number in Switch switch name a mode mismatch has been detected
This trap indicates that a mode mismatch has been detected based on this physical port’s APS configuration and the received K2 byte. This happens when one LTE is configured for 1+1 APS and the other for 1:n APS. The LTE configured for 1:n will fall back to 1+1 mode.
At Slot slot number Port port number in Switch switch name the protection line is now in a failed state
This trap indicates that the protection line is now in a failed state. APS switchover to protection is now inhibited. If the protection line was carrying user traffic, it is switched back to the working line.
At Slot slot number Port port number in Switch switch name the protection line is now in an operational state
This trap indicates that the protection line is now in an operational state. APS switchover to protection is now possible.
At Slot slot number Port port number in Switch switch name the protection line has declared a protection byte failure
This trap indicates that the protection line has declared a protection byte failure. This happens when a protection byte defect or inconsistent K1 byte is received and the condition persists for 2.5 seconds. APS switchover to protection is inhibited. If the protection line was carrying user traffic, it is switched back to the working line.
3-147/17/03 NavisCore Troubleshooting Guide
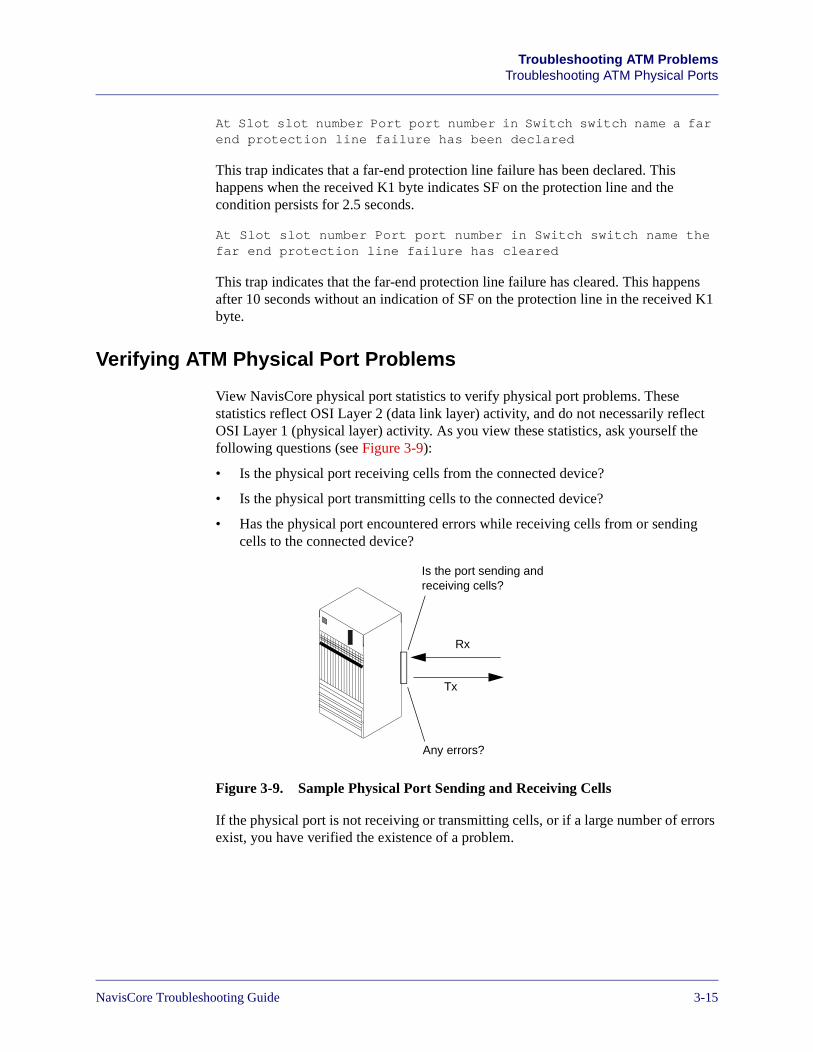
Beta Draft ConfidentialTroubleshooting ATM Problems
Troubleshooting ATM Physical Ports
At Slot slot number Port port number in Switch switch name a far end protection line failure has been declared
This trap indicates that a far-end protection line failure has been declared. This happens when the received K1 byte indicates SF on the protection line and the condition persists for 2.5 seconds.
At Slot slot number Port port number in Switch switch name the far end protection line failure has cleared
This trap indicates that the far-end protection line failure has cleared. This happens after 10 seconds without an indication of SF on the protection line in the received K1 byte.
Verifying ATM Physical Port Problems
View NavisCore physical port statistics to verify physical port problems. These statistics reflect OSI Layer 2 (data link layer) activity, and do not necessarily reflect OSI Layer 1 (physical layer) activity. As you view these statistics, ask yourself the following questions (see Figure 3-9):
• Is the physical port receiving cells from the connected device?
• Is the physical port transmitting cells to the connected device?
• Has the physical port encountered errors while receiving cells from or sending cells to the connected device?
Figure 3-9. Sample Physical Port Sending and Receiving Cells
If the physical port is not receiving or transmitting cells, or if a large number of errors exist, you have verified the existence of a problem.
Tx
Rx
Is the port sending and receiving cells?
Any errors?
NavisCore Troubleshooting Guide 7/17/033-15
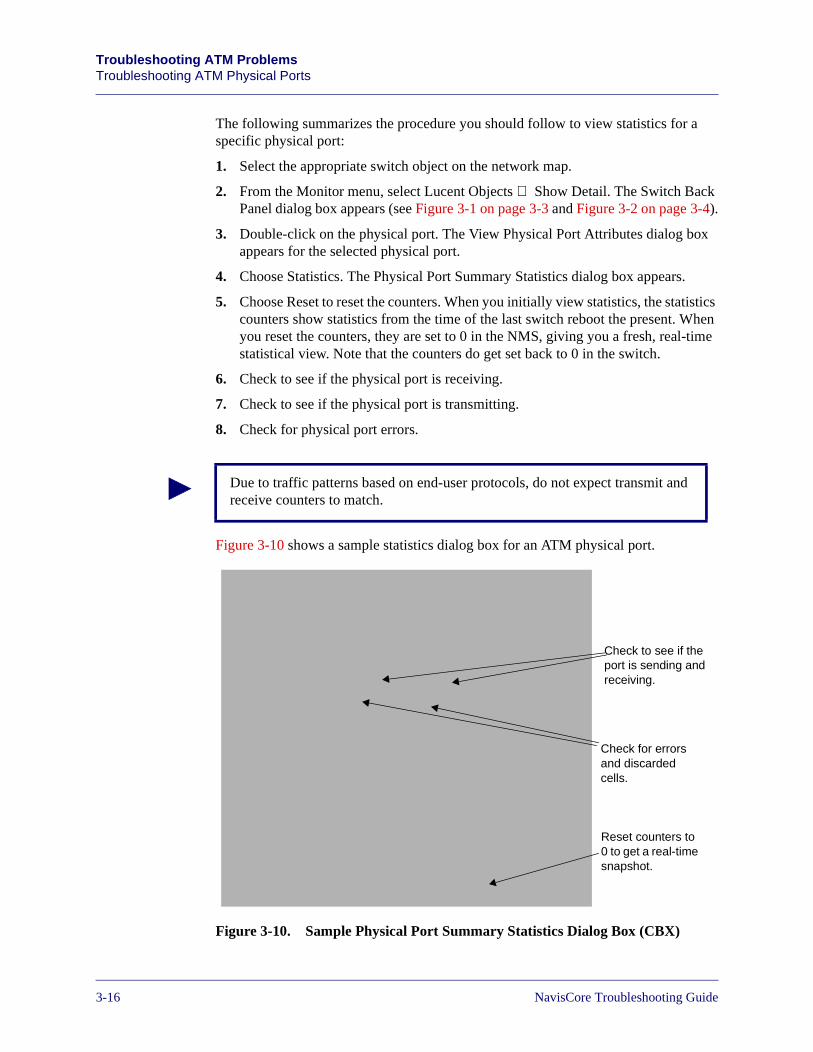
Beta Draft ConfidentialTroubleshooting ATM ProblemsTroubleshooting ATM Physical Ports
The following summarizes the procedure you should follow to view statistics for a specific physical port:
1. Select the appropriate switch object on the network map.
2. From the Monitor menu, select Lucent Objects ⇒ Show Detail. The Switch Back Panel dialog box appears (see Figure 3-1 on page 3-3 and Figure 3-2 on page 3-4).
3. Double-click on the physical port. The View Physical Port Attributes dialog box appears for the selected physical port.
4. Choose Statistics. The Physical Port Summary Statistics dialog box appears.
5. Choose Reset to reset the counters. When you initially view statistics, the statistics counters show statistics from the time of the last switch reboot the present. When you reset the counters, they are set to 0 in the NMS, giving you a fresh, real-time statistical view. Note that the counters do get set back to 0 in the switch.
6. Check to see if the physical port is receiving.
7. Check to see if the physical port is transmitting.
8. Check for physical port errors.
Figure 3-10 shows a sample statistics dialog box for an ATM physical port.
Figure 3-10. Sample Physical Port Summary Statistics Dialog Box (CBX)
Due to traffic patterns based on end-user protocols, do not expect transmit and receive counters to match.
Check for errors and discarded cells.
Check to see if the port is sending and receiving.
Reset counters to 0 to get a real-time snapshot.
3-167/17/03 NavisCore Troubleshooting Guide
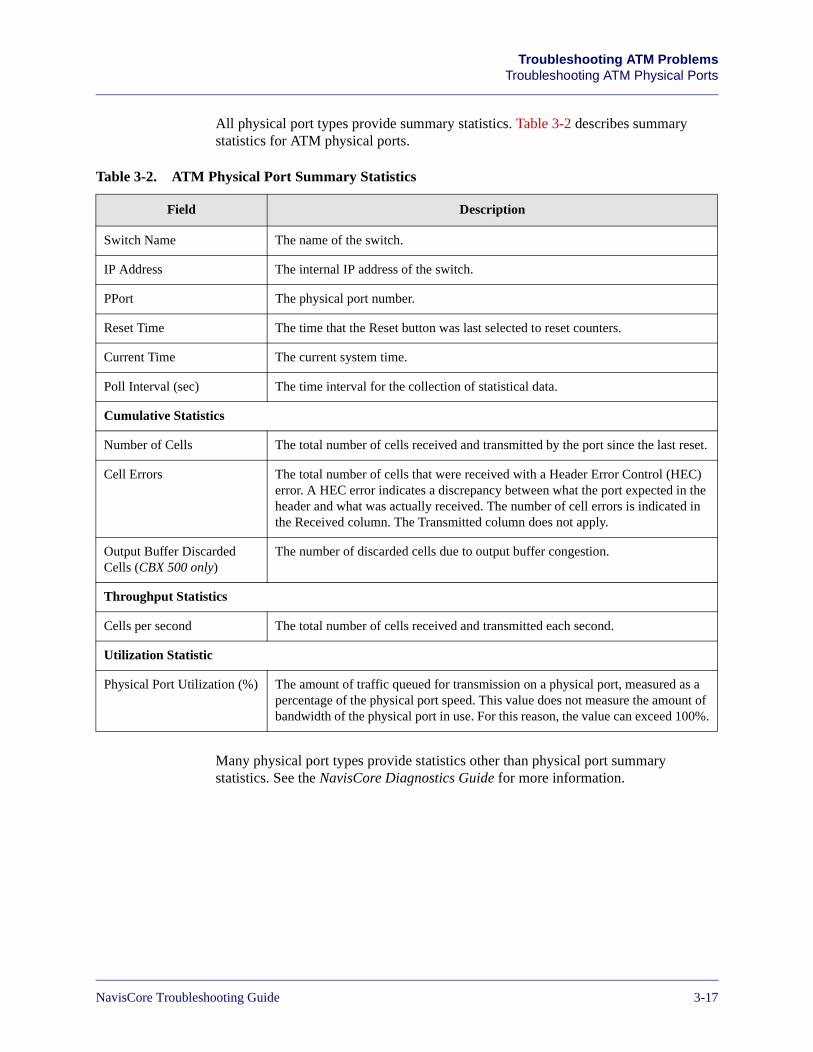
Beta Draft ConfidentialTroubleshooting ATM Problems
Troubleshooting ATM Physical Ports
All physical port types provide summary statistics. Table 3-2 describes summary statistics for ATM physical ports.
Many physical port types provide statistics other than physical port summary statistics. See the NavisCore Diagnostics Guide for more information.
Table 3-2. ATM Physical Port Summary Statistics
Field Description
Switch Name The name of the switch.
IP Address The internal IP address of the switch.
PPort The physical port number.
Reset Time The time that the Reset button was last selected to reset counters.
Current Time The current system time.
Poll Interval (sec) The time interval for the collection of statistical data.
Cumulative Statistics
Number of Cells The total number of cells received and transmitted by the port since the last reset.
Cell Errors The total number of cells that were received with a Header Error Control (HEC) error. A HEC error indicates a discrepancy between what the port expected in the header and what was actually received. The number of cell errors is indicated in the Received column. The Transmitted column does not apply.
Output Buffer Discarded Cells (CBX 500 only)
The number of discarded cells due to output buffer congestion.
Throughput Statistics
Cells per second The total number of cells received and transmitted each second.
Utilization Statistic
Physical Port Utilization (%) The amount of traffic queued for transmission on a physical port, measured as a percentage of the physical port speed. This value does not measure the amount of bandwidth of the physical port in use. For this reason, the value can exceed 100%.
NavisCore Troubleshooting Guide 7/17/033-17
Beta Draft ConfidentialTroubleshooting ATM ProblemsTroubleshooting ATM Physical Ports
Isolating ATM Physical Port Problems
Once you have verified that a problem exists, perform diagnostic tests and loopback tests to isolate the problem. These tests pinpoint the problem to a specific component, configuration, cable, or connection.
The diagnostic and loopback tests you can perform on ATM physical ports and modules are the same (for the most part) as the tests you can perform on Frame Relay physical ports and modules. (See “Diagnostic Tests” on page 2-14 and “Loopback Tests” on page 2-16 for more information.) Note the following differences between the ATM and Frame Relay tests:
• Background diagnostics that run on ATM modules on the CBX 500 report total invalid ATM cells received (i.e., number of cells with an invalid VPI/VCI) and the last invalid VPI/VCI cell received. Each ATM circuit uses a VPI/VCI value. If you notice that cells containing invalid VPI/VCI values are being received, then the problem may originate with an ATM logical port or circuit associated with the module.
• Only ATM DS3 modules support the payload DS3 loopback.
• Only ATM DS1 modules support the metallic loopback.
• ATM OC-n/STM-n ports support internal, external, and near-end line loopbacks only.
Correcting ATM Physical Port Problems
Based on the results of the diagnostic tests and/or loopback tests, you may take a number of actions, such as:
• Replace faulty hardware.
• Change the physical port configuration. For example, you may determine that a DS1 physical port’s link framing parameter does not match the link framing parameter of the CPE (e.g., a router) at the other end of the DS1 connection.
• Work with the carrier or customer. Keep in mind that the switch may not be the source of the problem. Carrier equipment or CPE may be causing the problem. For example, a high Unavailable Seconds statistics value — a performance monitoring (PM) statistics value — for a DS3 physical port usually indicates a carrier problem.
3-187/17/03 NavisCore Troubleshooting Guide
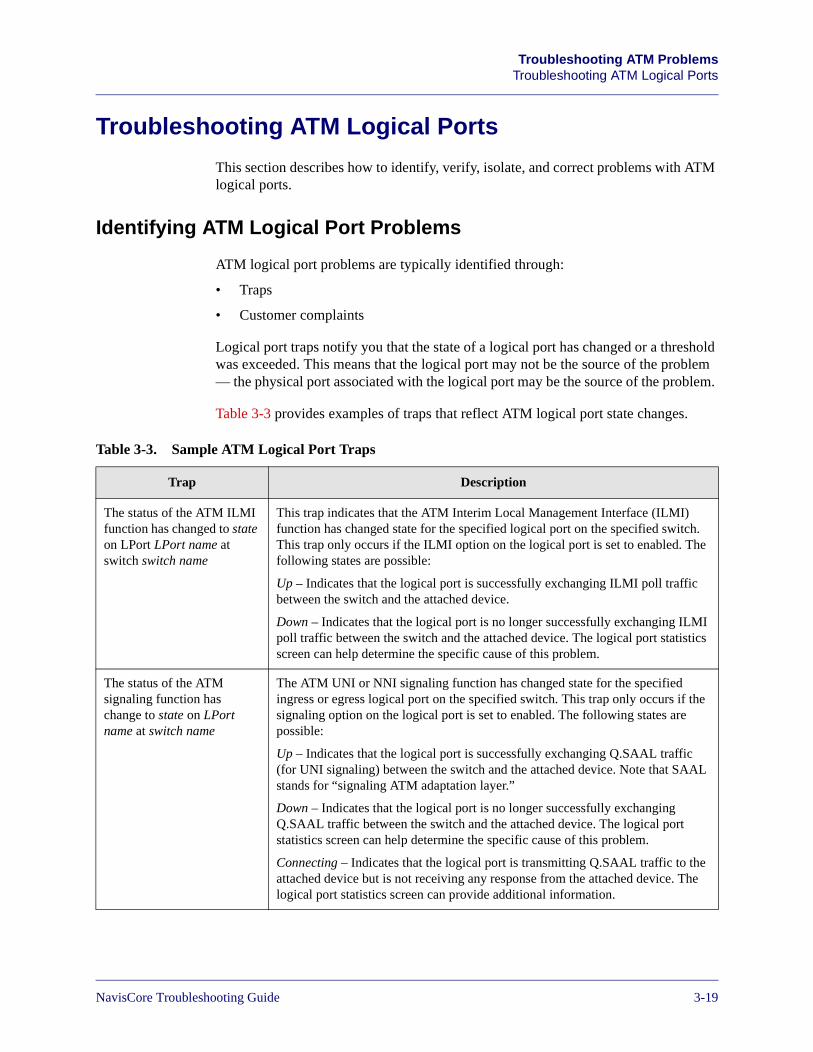
Beta Draft ConfidentialTroubleshooting ATM Problems
Troubleshooting ATM Logical Ports
Troubleshooting ATM Logical Ports
This section describes how to identify, verify, isolate, and correct problems with ATM logical ports.
Identifying ATM Logical Port Problems
ATM logical port problems are typically identified through:
• Traps
• Customer complaints
Logical port traps notify you that the state of a logical port has changed or a threshold was exceeded. This means that the logical port may not be the source of the problem — the physical port associated with the logical port may be the source of the problem.
Table 3-3 provides examples of traps that reflect ATM logical port state changes.
Table 3-3. Sample ATM Logical Port Traps
Trap Description
The status of the ATM ILMI function has changed to state on LPort LPort name at switch switch name
This trap indicates that the ATM Interim Local Management Interface (ILMI) function has changed state for the specified logical port on the specified switch. This trap only occurs if the ILMI option on the logical port is set to enabled. The following states are possible:
Up – Indicates that the logical port is successfully exchanging ILMI poll traffic between the switch and the attached device.
Down – Indicates that the logical port is no longer successfully exchanging ILMI poll traffic between the switch and the attached device. The logical port statistics screen can help determine the specific cause of this problem.
The status of the ATM signaling function has change to state on LPort name at switch name
The ATM UNI or NNI signaling function has changed state for the specified ingress or egress logical port on the specified switch. This trap only occurs if the signaling option on the logical port is set to enabled. The following states are possible:
Up – Indicates that the logical port is successfully exchanging Q.SAAL traffic (for UNI signaling) between the switch and the attached device. Note that SAAL stands for “signaling ATM adaptation layer.”
Down – Indicates that the logical port is no longer successfully exchanging Q.SAAL traffic between the switch and the attached device. The logical port statistics screen can help determine the specific cause of this problem.
Connecting – Indicates that the logical port is transmitting Q.SAAL traffic to the attached device but is not receiving any response from the attached device. The logical port statistics screen can provide additional information.
NavisCore Troubleshooting Guide 7/17/033-19
Beta Draft ConfidentialTroubleshooting ATM ProblemsTroubleshooting ATM Logical Ports
If you notice a physical port problem at the same time that you notice a problem with a logical port associated with that physical port, then the problem lies with the physical port. Begin troubleshooting the physical port. See “Troubleshooting ATM Physical Ports” on page 3-2 for more information. Otherwise, verify the logical port problem.
Verifying an ATM Logical Port Problem
The Show All Logical Ports in Switch dialog box and the ATM Logical Port Summary Statistics dialog box provide you with a lot of useful information for verifying ATM logical port problems.
Follow these steps to check for a logical port problem:
1. Select the switch object on the network map.
2. From the Monitor menu, select Lucent Objects ⇒ Show Logical Ports. The Show All Logical Ports in Switch dialog box appears (see Figure 3-11).
3-207/17/03 NavisCore Troubleshooting Guide
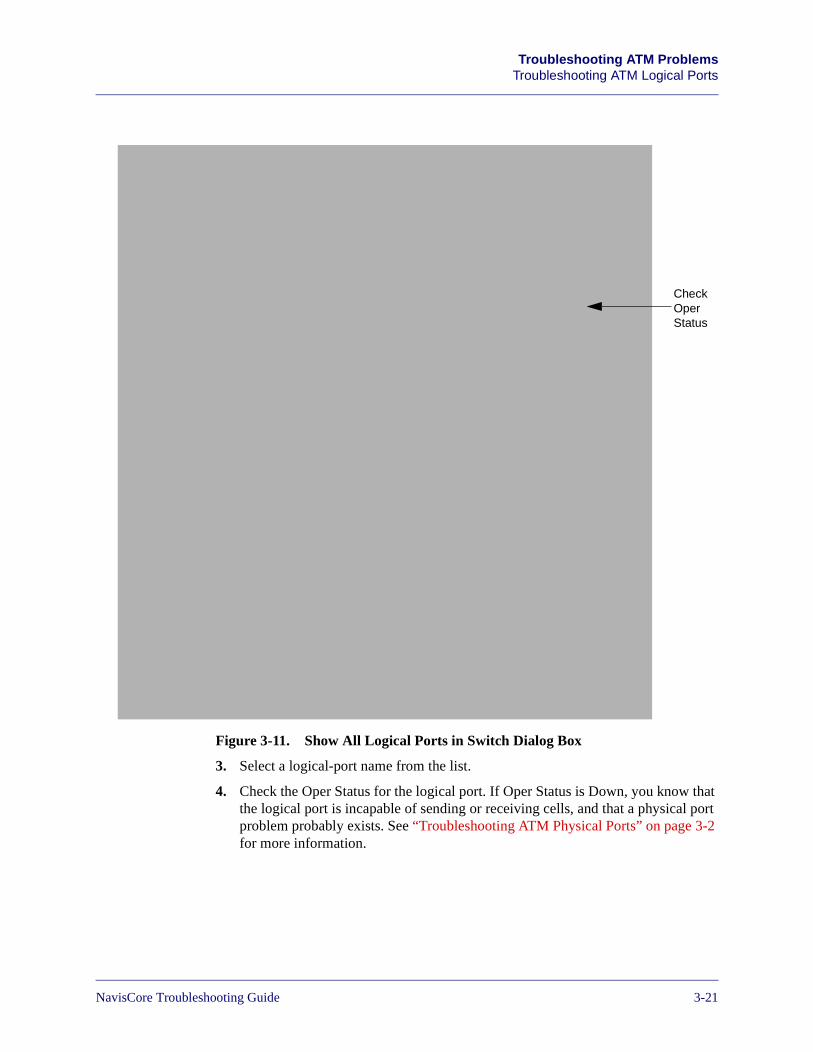
Beta Draft ConfidentialTroubleshooting ATM Problems
Troubleshooting ATM Logical Ports
Figure 3-11. Show All Logical Ports in Switch Dialog Box
3. Select a logical-port name from the list.
4. Check the Oper Status for the logical port. If Oper Status is Down, you know that the logical port is incapable of sending or receiving cells, and that a physical port problem probably exists. See “Troubleshooting ATM Physical Ports” on page 3-2 for more information.
Check Oper Status
NavisCore Troubleshooting Guide 7/17/033-21
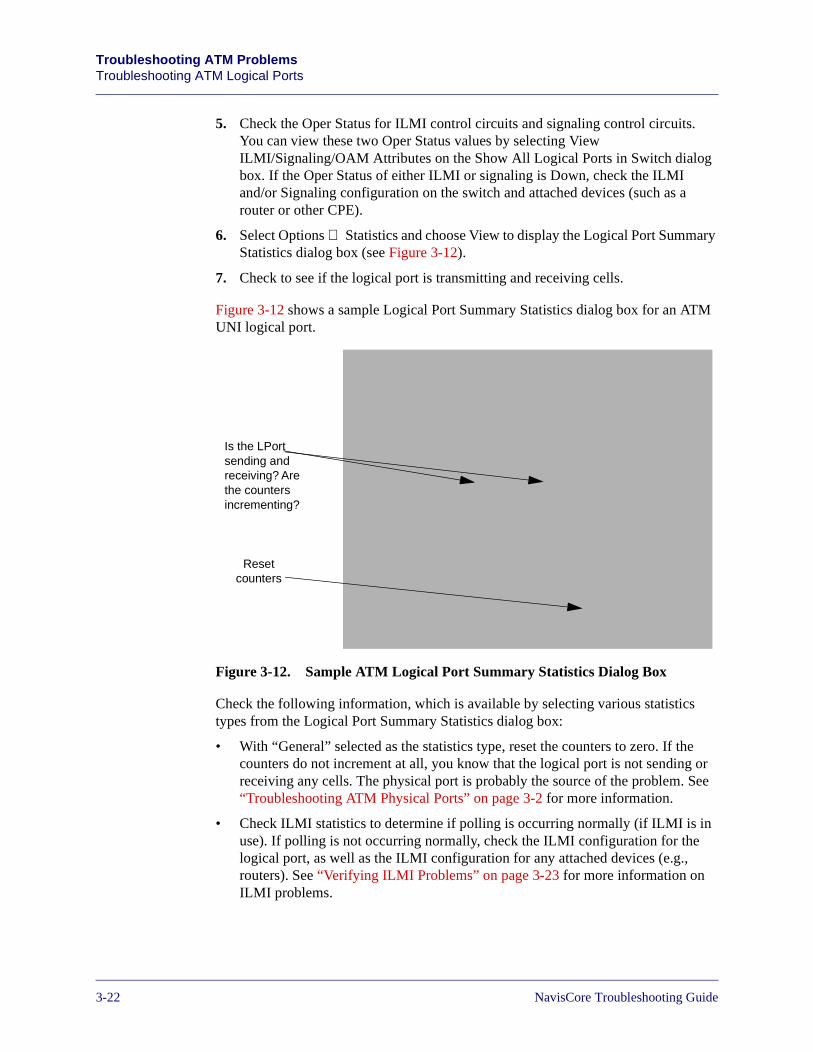
Beta Draft ConfidentialTroubleshooting ATM ProblemsTroubleshooting ATM Logical Ports
5. Check the Oper Status for ILMI control circuits and signaling control circuits. You can view these two Oper Status values by selecting View ILMI/Signaling/OAM Attributes on the Show All Logical Ports in Switch dialog box. If the Oper Status of either ILMI or signaling is Down, check the ILMI and/or Signaling configuration on the switch and attached devices (such as a router or other CPE).
6. Select Options ⇒ Statistics and choose View to display the Logical Port Summary Statistics dialog box (see Figure 3-12).
7. Check to see if the logical port is transmitting and receiving cells.
Figure 3-12 shows a sample Logical Port Summary Statistics dialog box for an ATM UNI logical port.
Figure 3-12. Sample ATM Logical Port Summary Statistics Dialog Box
Check the following information, which is available by selecting various statistics types from the Logical Port Summary Statistics dialog box:
• With “General” selected as the statistics type, reset the counters to zero. If the counters do not increment at all, you know that the logical port is not sending or receiving any cells. The physical port is probably the source of the problem. See “Troubleshooting ATM Physical Ports” on page 3-2 for more information.
• Check ILMI statistics to determine if polling is occurring normally (if ILMI is in use). If polling is not occurring normally, check the ILMI configuration for the logical port, as well as the ILMI configuration for any attached devices (e.g., routers). See “Verifying ILMI Problems” on page 3-23 for more information on ILMI problems.
Is the LPort sending and receiving? Are the counters incrementing?
Reset counters
3-227/17/03 NavisCore Troubleshooting Guide
Beta Draft ConfidentialTroubleshooting ATM Problems
Troubleshooting ATM Logical Ports
• If you are encountering SVC problems, check Q.2931 statistics for an excessive number of failed SVCs (Number of SVC Failures statistic). Also check the Last Cause Code for a failure reason. See “Troubleshooting Point-to-Point ATM SVCs and SPVCs” on page 3-67 for more information on troubleshooting SVCs.
In addition to the statistics on the Logical Port Summary Statistics dialog box, check Network Traffic Management (NTM) and Network Data Collection (NDC) statistics for the logical port. NTM and NDC provide you with statistics on point-to-point PVC and point-to-multipoint PVC traffic on the logical port. The purpose of NTM is to improve PVC traffic performance during overloads and failures in the network. NDC measurements detect any violation of PVC service subscription parameters and establish trends in network traffic patterns and loads. “NTM Statistics and NDC Statistics for Point-to-Point PVCs” on page 3-51 for more information on NTM and NDC.
See the NavisCore Diagnostics Guide for detailed information on all of the statistics you can display on the ATM Logical Port Summary Statistics dialog box.
Verifying ILMI Problems
ILMI is comparable to LMI in Frame Relay networks. ILMI is a protocol that allows ATM UNI devices to exchange information on the status of circuits, routes, and address registration. If this exchange does not function properly, the link between the devices will go down.
For example, a Lucent ATM UNI DCE logical port (with ILMI enabled) exchanges ILMI status information with an attached DTE. The ILMI information exchange is summarized as follows:
1. The DTE continuously polls the DCE. The period of time between each poll is called the polling period. For example, if the polling period is five seconds, the DTE polls the DCE every five seconds. The DTE polls the DCE for the following reasons:
– To determine whether the data link is up.
– To get a full status from the DCE. This happens every sixth poll. The DTE wants to know how many circuits it owns, and the current status of the circuits.
NTM and NDC are supported on CBX 500 switches and GX 550 switches only.
On Lucent switches, ILMI is disabled by default. ILMI should be enabled on the Lucent switch only if the attached device (e.g., CPE) supports it. See the NavisCore ATM Configuration Guide for more information on enabling ILMI.
NavisCore Troubleshooting Guide 7/17/033-23
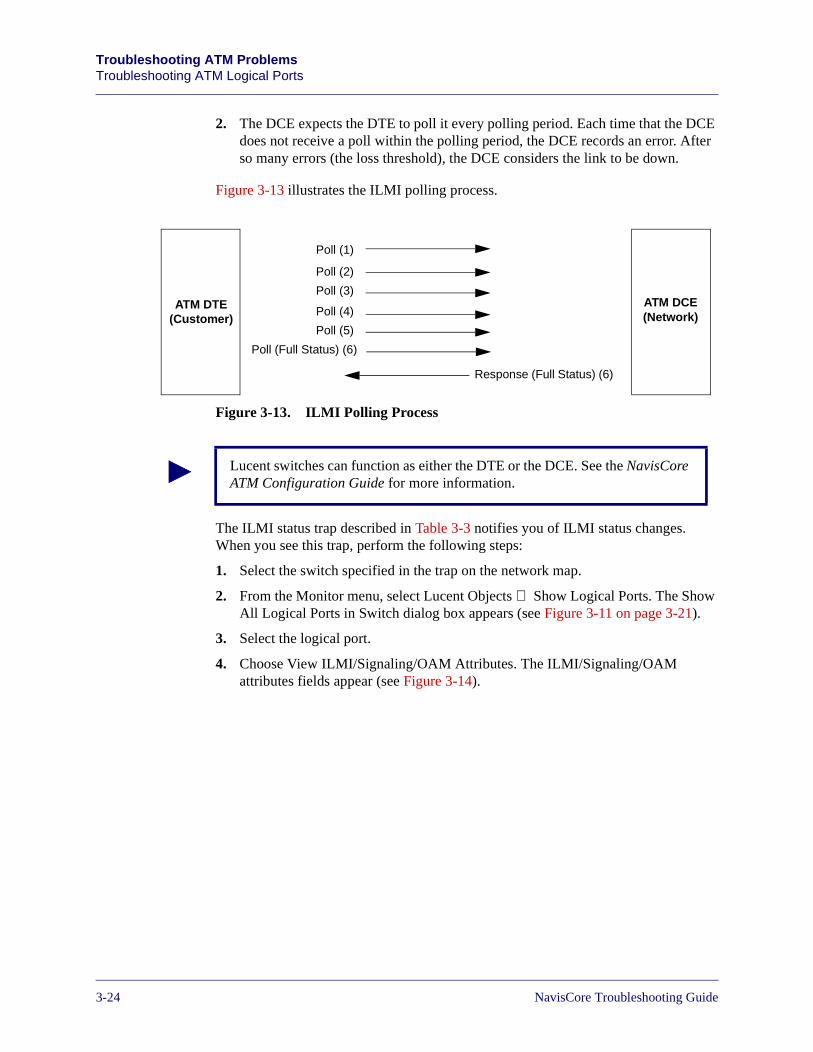
Beta Draft ConfidentialTroubleshooting ATM ProblemsTroubleshooting ATM Logical Ports
2. The DCE expects the DTE to poll it every polling period. Each time that the DCE does not receive a poll within the polling period, the DCE records an error. After so many errors (the loss threshold), the DCE considers the link to be down.
Figure 3-13 illustrates the ILMI polling process.
Figure 3-13. ILMI Polling Process
The ILMI status trap described in Table 3-3 notifies you of ILMI status changes. When you see this trap, perform the following steps:
1. Select the switch specified in the trap on the network map.
2. From the Monitor menu, select Lucent Objects ⇒ Show Logical Ports. The Show All Logical Ports in Switch dialog box appears (see Figure 3-11 on page 3-21).
3. Select the logical port.
4. Choose View ILMI/Signaling/OAM Attributes. The ILMI/Signaling/OAM attributes fields appear (see Figure 3-14).
Poll (1)
Poll (2)
Poll (3)
Poll (4)
Poll (5)
Poll (Full Status) (6)
Response (Full Status) (6)
ATM DCE(Network)
ATM DTE(Customer)
Lucent switches can function as either the DTE or the DCE. See the NavisCore ATM Configuration Guide for more information.
3-247/17/03 NavisCore Troubleshooting Guide
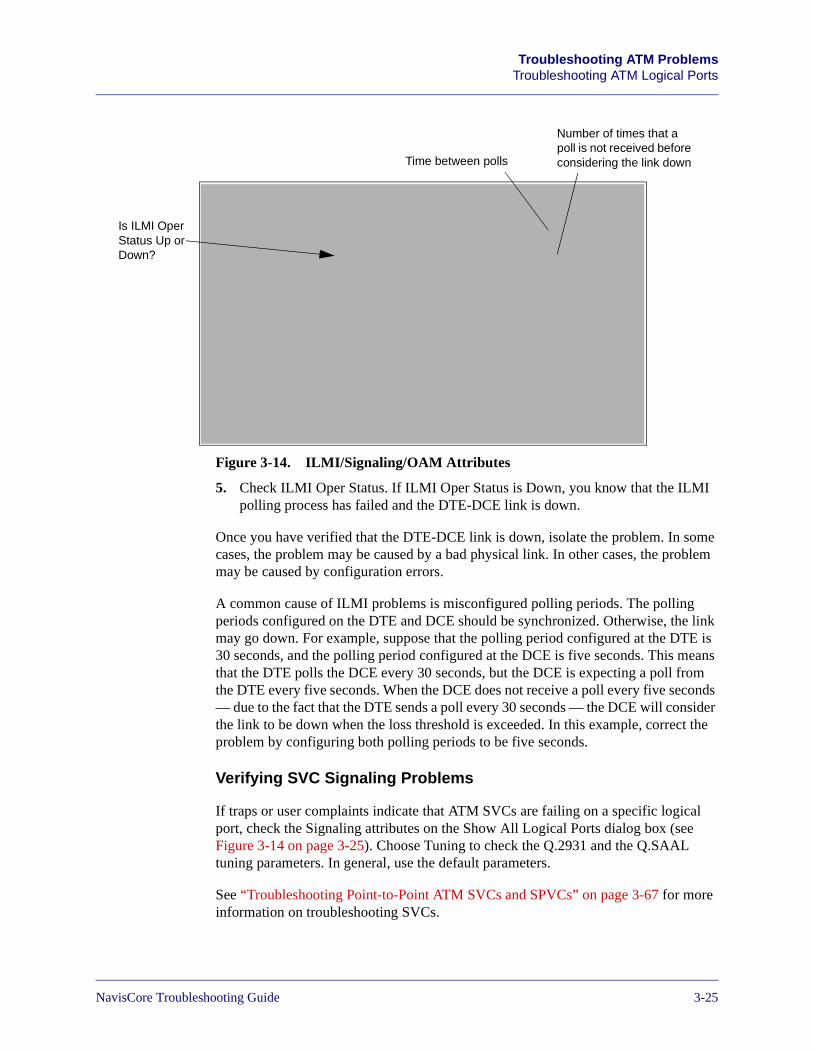
Beta Draft ConfidentialTroubleshooting ATM Problems
Troubleshooting ATM Logical Ports
Figure 3-14. ILMI/Signaling/OAM Attributes
5. Check ILMI Oper Status. If ILMI Oper Status is Down, you know that the ILMI polling process has failed and the DTE-DCE link is down.
Once you have verified that the DTE-DCE link is down, isolate the problem. In some cases, the problem may be caused by a bad physical link. In other cases, the problem may be caused by configuration errors.
A common cause of ILMI problems is misconfigured polling periods. The polling periods configured on the DTE and DCE should be synchronized. Otherwise, the link may go down. For example, suppose that the polling period configured at the DTE is 30 seconds, and the polling period configured at the DCE is five seconds. This means that the DTE polls the DCE every 30 seconds, but the DCE is expecting a poll from the DTE every five seconds. When the DCE does not receive a poll every five seconds — due to the fact that the DTE sends a poll every 30 seconds — the DCE will consider the link to be down when the loss threshold is exceeded. In this example, correct the problem by configuring both polling periods to be five seconds.
Verifying SVC Signaling Problems
If traps or user complaints indicate that ATM SVCs are failing on a specific logical port, check the Signaling attributes on the Show All Logical Ports dialog box (see Figure 3-14 on page 3-25). Choose Tuning to check the Q.2931 and the Q.SAAL tuning parameters. In general, use the default parameters.
See “Troubleshooting Point-to-Point ATM SVCs and SPVCs” on page 3-67 for more information on troubleshooting SVCs.
Is ILMI Oper Status Up or Down?
Time between polls
Number of times that a poll is not received before considering the link down
NavisCore Troubleshooting Guide 7/17/033-25
Beta Draft ConfidentialTroubleshooting ATM ProblemsTroubleshooting ATM Logical Ports
Isolating an ATM Logical Port Problem
The way in which you isolate an ATM logical port problem depends on the conclusions you draw during the problem verification process. For example, if there are ILMI polling problems (e.g., ILMI Oper Status is Down), check the configuration of the logical port and any attached devices.
If the ATM logical port is not transmitting and receiving any cells (or the logical port Oper Status is Down), a physical port problem probably exists. See “Isolating ATM Physical Port Problems” on page 3-18 for more information.
Correcting ATM Logical Port Problems
Based on the conclusions you reached while isolating the logical port problem, you may take a number of actions, such as:
• Power up a previously powered-down CPE, such as a router. Powering down a CPE can cause a logical port status trap to generate.
• Address physical port problems, hardware problems, and other physical layer problems such as bad cables, faulty CSUs/DSUs and routers, carrier problems, and physical port configuration errors.
• Address ATM configuration problems on either the logical port and/or an attached device, such as a router.
3-267/17/03 NavisCore Troubleshooting Guide
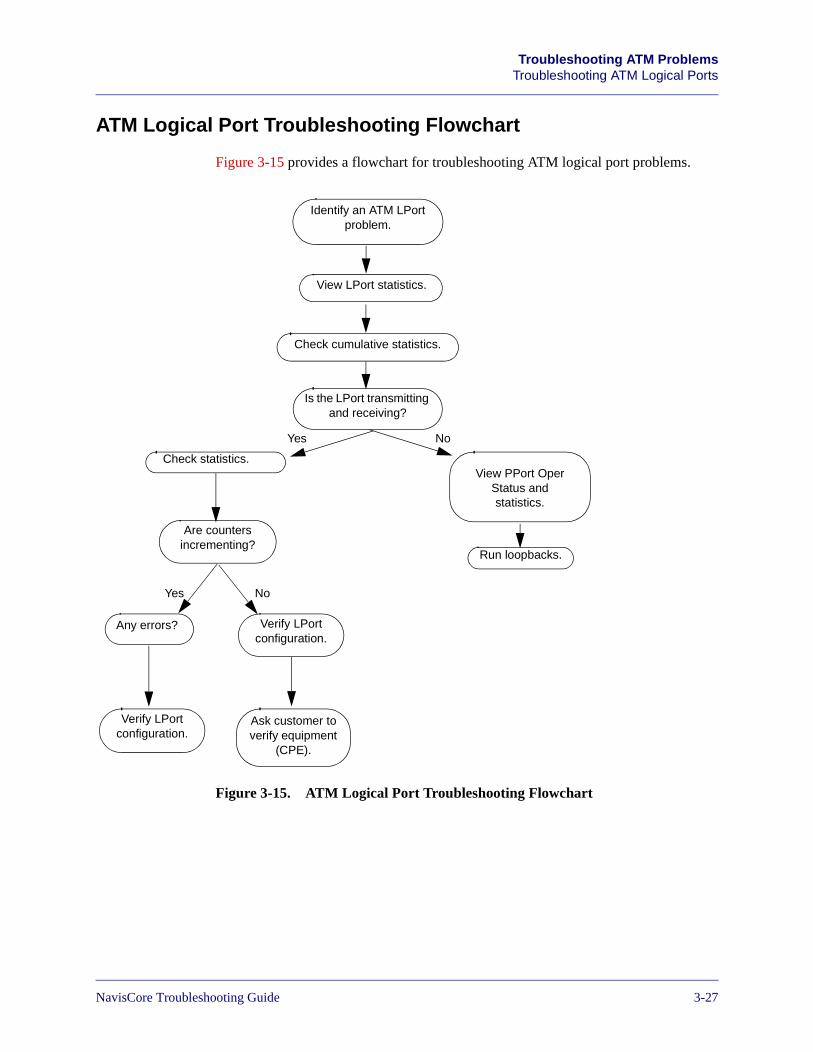
Beta Draft ConfidentialTroubleshooting ATM Problems
Troubleshooting ATM Logical Ports
ATM Logical Port Troubleshooting Flowchart
Figure 3-15 provides a flowchart for troubleshooting ATM logical port problems.
Figure 3-15. ATM Logical Port Troubleshooting Flowchart
Identify an ATM LPort problem.
View LPort statistics.
Check cumulative statistics.
Is the LPort transmitting and receiving?
View PPort Oper Status and statistics.
Check statistics.
Any errors?
Verify LPort configuration.
Verify LPort configuration.
Ask customer to verify equipment
(CPE).
Run loopbacks.
Yes No
Are counters incrementing?
Yes No
NavisCore Troubleshooting Guide 7/17/033-27
Beta Draft ConfidentialTroubleshooting ATM ProblemsTroubleshooting ATM Trunks
Troubleshooting ATM Trunks
This section describes how to identify, verify, isolate, and correct problems with ATM trunks.
About ATM Trunks
An ATM trunk can fail to complete initialization for several reasons. For example, the physical port and or logical port may be in error.
The show pport statistics <slot>.<port> and show lport statistics <slot>.<port> commands are used to display physical and logical port statistics. Use these commands to monitor the receive and transmit counters. If these counters are not incrementing, then communication between the two routers is not bi-directional. The local link may be up, but the remote link is probably down with an error condition.
To route ATM between Lucent switches, VNN uses OSPF with some proprietary extensions. The show tproto command is used to display trunk protocol activity on ATM direct and OPTimum trunks. The physical link state counter indicates whether the trunk protocol is up or down.
Identifying ATM Trunk Problems
In addition to customer complaints, you can identify trunk problems in two ways:
• Trunk colors
• Traps
3-287/17/03 NavisCore Troubleshooting Guide
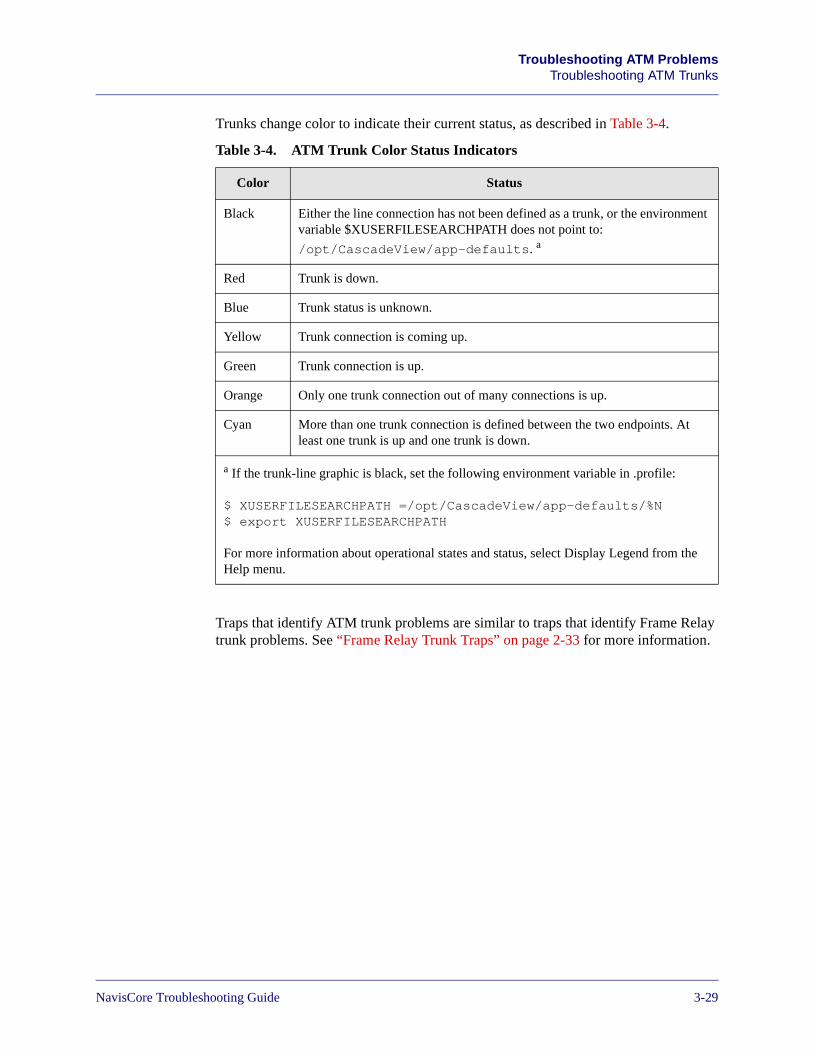
Beta Draft ConfidentialTroubleshooting ATM Problems
Troubleshooting ATM Trunks
Trunks change color to indicate their current status, as described in Table 3-4.
Traps that identify ATM trunk problems are similar to traps that identify Frame Relay trunk problems. See “Frame Relay Trunk Traps” on page 2-33 for more information.
Table 3-4. ATM Trunk Color Status Indicators
Color Status
Black Either the line connection has not been defined as a trunk, or the environment variable $XUSERFILESEARCHPATH does not point to:
/opt/CascadeView/app-defaults. a
Red Trunk is down.
Blue Trunk status is unknown.
Yellow Trunk connection is coming up.
Green Trunk connection is up.
Orange Only one trunk connection out of many connections is up.
Cyan More than one trunk connection is defined between the two endpoints. At least one trunk is up and one trunk is down.
a If the trunk-line graphic is black, set the following environment variable in .profile:
$ XUSERFILESEARCHPATH =/opt/CascadeView/app-defaults/%N$ export XUSERFILESEARCHPATH
For more information about operational states and status, select Display Legend from the Help menu.
NavisCore Troubleshooting Guide 7/17/033-29
Beta Draft ConfidentialTroubleshooting ATM ProblemsTroubleshooting ATM Trunks
Verifying ATM Trunk Problems
Trunk status, summary statistics, and control channel statistics help you to verify ATM trunk problems. The ping command can also help you verify the existence of a trunk problem.
Using Trunk Status and Trunk Summary Statistics to Verify ATMTrunk Problems
The Show All Trunks dialog box and the Trunk Summary Statistics dialog box provide you with a lot of useful information for verifying trunk problems.
Follow these steps to check for a trunk problem:
1. From the Monitor menu, select Lucent Objects ⇒ Show Trunks, and select one of the following options:
All on Map — Displays a list of all the trunks configured for the current map.
All on Switch — Displays a list of all the trunks configured for a selected switch.
2. After you select an option, the Show All Trunks dialog box appears. See the NavisCore Diagnostics Guide for detailed descriptions of the fields on this dialog box.
3. Check to see if the Trunk Status displays a value of Up. If it is set to Down, there is a problem with the trunk.
4. Choose Statistics to see if the trunk is transmitting from point A to point B and vice versa (see Figure 3-16 and Figure 3-17). Reset the counters to obtain a real-time snapshot of transmission activity.
5. Verify that a rate of data transmission exists — that is, there is non-zero throughput in bits per second and cells per second.
6. Observe the utilization percentage, which indicates the amount of traffic queued for transmission as a percentage of the trunk’s true (as opposed to oversubscribed) bandwidth. Utilization percentage is based on the percentage of the logical port buffer space currently used. An extremely high percentage may indicate congestion on the trunk.
7. Check statistics for the logical ports and physical ports at both ends of the trunk. The LPort Stats and PPort Stats buttons on the Trunk Summary Statistics dialog box allows you to access logical port and physical port statistics for the trunk.
8. Check to see if the logical ports and physical ports at both ends of the trunk are transmitting and receiving any cells at all.
3-307/17/03 NavisCore Troubleshooting Guide
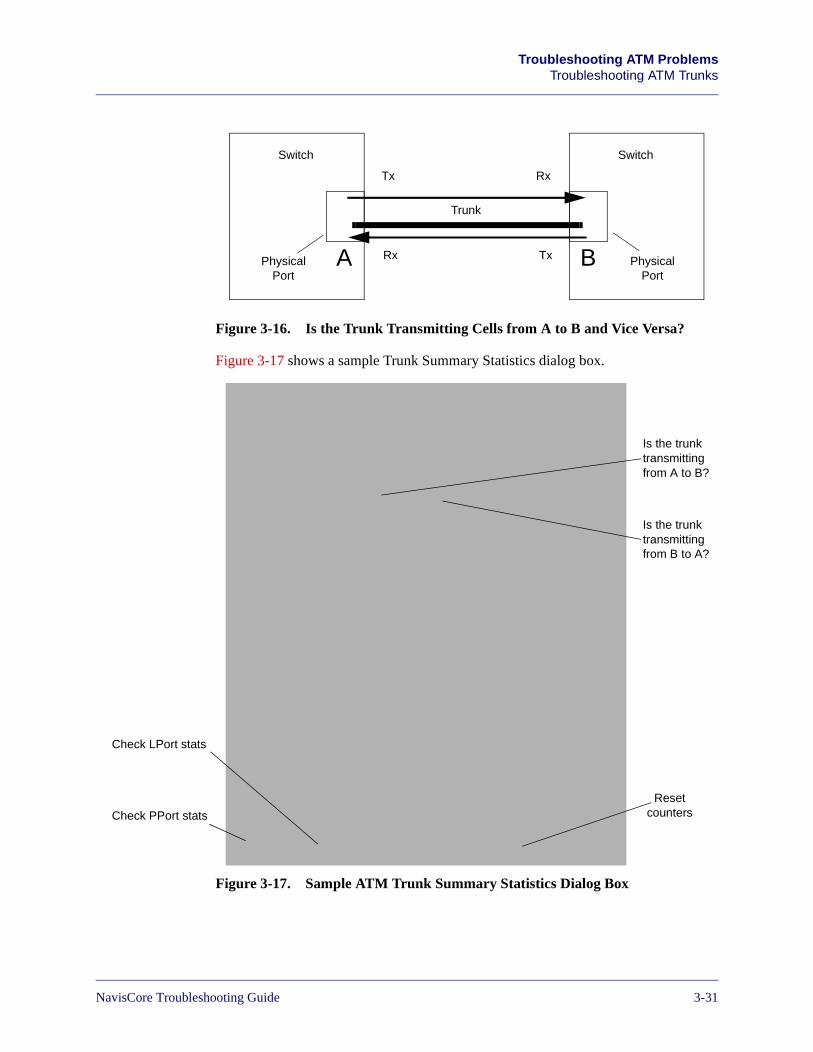
Beta Draft ConfidentialTroubleshooting ATM Problems
Troubleshooting ATM Trunks
Figure 3-16. Is the Trunk Transmitting Cells from A to B and Vice Versa?
Figure 3-17 shows a sample Trunk Summary Statistics dialog box.
Figure 3-17. Sample ATM Trunk Summary Statistics Dialog Box
A B
Tx Rx
TxRx
Trunk
Physical Port
Physical Port
Switch Switch
Is the trunk transmitting from A to B?
Is the trunk transmitting from B to A?
Reset countersCheck PPort stats
Check LPort stats
NavisCore Troubleshooting Guide 7/17/033-31

Beta Draft ConfidentialTroubleshooting ATM ProblemsTroubleshooting ATM Trunks
Using Control Channel Statistics to Verify ATM Trunk Problems
For ATM direct and OPTimum trunks, you can view statistics on control channel activity. These statistics tell you whether the control channels between the trunk endpoints are functioning properly.
Control channels allow trunk endpoints to exchange management and control messages. If these messages cannot be exchanged, the trunk cannot function properly.
You can view node management and trunk signaling control channel statistics. Focus primarily on the trunk signaling control channel statistics, as these statistics reflect activity on the exchange of trunk keep-alive (KA) messages between the trunk endpoints. The trunk cannot operate properly if these messages cannot be exchanged.
To view control channel statistics:
1. Select a switch on the network map that acts as one of the trunk endpoints.
2. From the Monitor menu, select Lucent Objects ⇒ Show Logical Ports. The Show All Logical Ports in Switch dialog box appears (see Figure 3-11 on page 3-21).
3. Select the name of the trunk logical port from the list box on the left.
4. Depending on the type of trunk logical port selected, perform one of the following actions:
• Select Options ⇒ Conf Ctrl Chan Stats for ATM OPTimum trunk logical ports.
• Select Options ⇒ Statistics for ATM Direct trunk logical ports.
5. Select View. Depending on your action in the previous step, one of the following events occurs:
• If you selected Options ⇒ Conf Ctrl Chan Stats, the Logical Port Control Channel Statistics dialog box appears, allowing you to view control channel statistics. Figure 3-18 shows a sample Logical Port Control Channel Statistics dialog box. See Table 3-5 for descriptions of these statistics.
• If you selected Options ⇒ Statistics, the Logical Port Summary Statistics dialog box appears. This dialog box provides a Ctrl Chan Stats command, which allows you to display control channel statistics on the Logical Port Control Channel Statistics dialog box. Figure 3-18 shows a sample Logical Port Control Channel Statistics dialog box. See Table 3-5 for descriptions of these statistics.
3-327/17/03 NavisCore Troubleshooting Guide
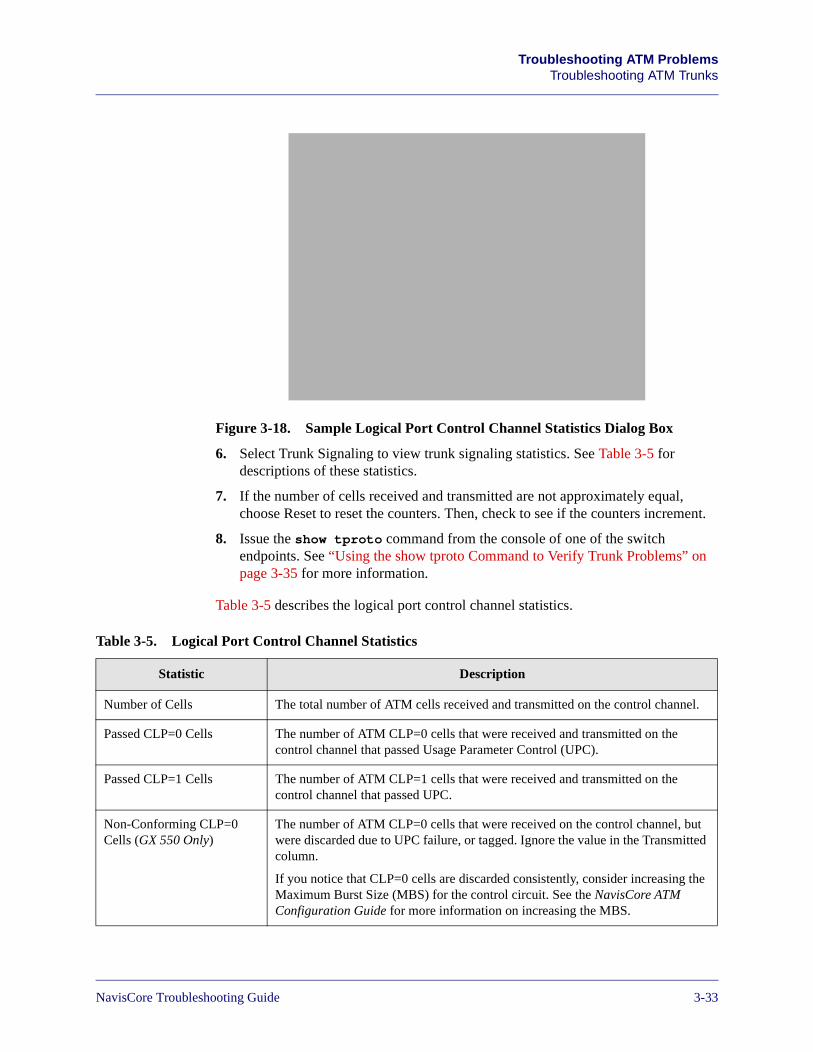
Beta Draft ConfidentialTroubleshooting ATM Problems
Troubleshooting ATM Trunks
Figure 3-18. Sample Logical Port Control Channel Statistics Dialog Box
6. Select Trunk Signaling to view trunk signaling statistics. See Table 3-5 for descriptions of these statistics.
7. If the number of cells received and transmitted are not approximately equal, choose Reset to reset the counters. Then, check to see if the counters increment.
8. Issue the show tproto command from the console of one of the switch endpoints. See “Using the show tproto Command to Verify Trunk Problems” on page 3-35 for more information.
Table 3-5 describes the logical port control channel statistics.
Table 3-5. Logical Port Control Channel Statistics
Statistic Description
Number of Cells The total number of ATM cells received and transmitted on the control channel.
Passed CLP=0 Cells The number of ATM CLP=0 cells that were received and transmitted on the control channel that passed Usage Parameter Control (UPC).
Passed CLP=1 Cells The number of ATM CLP=1 cells that were received and transmitted on the control channel that passed UPC.
Non-Conforming CLP=0 Cells (GX 550 Only)
The number of ATM CLP=0 cells that were received on the control channel, but were discarded due to UPC failure, or tagged. Ignore the value in the Transmitted column.
If you notice that CLP=0 cells are discarded consistently, consider increasing the Maximum Burst Size (MBS) for the control circuit. See the NavisCore ATM Configuration Guide for more information on increasing the MBS.
NavisCore Troubleshooting Guide 7/17/033-33
Beta Draft ConfidentialTroubleshooting ATM ProblemsTroubleshooting ATM Trunks
Non-Conforming CLP=1 Cells (GX 550 Only)
The number of ATM CLP=1 cells that were received on the control channel, but were discarded due to UPC failure, or tagged. Ignore the value in the Transmitted column.
If you notice that CLP=1 cells are discarded consistently, consider increasing the Maximum Burst Size (MBS) for the control circuit. See the NavisCore ATM Configuration Guide for more information on increasing the MBS.
Discarded CLP=0 Cells (CBX 500 Only)
The number of ATM CLP=0 cells that were received on the control channel, but were discarded due to UPC failure. Ignore the value in the Transmitted column.
If you notice that CLP=0 cells are discarded consistently, consider increasing the Maximum Burst Size (MBS) for the control circuit. See the NavisCore ATM Configuration Guide for more information on increasing the MBS.
Discarded CLP=1 Cells (CBX 500 Only)
The number of ATM CLP=1 cells that were received on the control channel, but were discarded due to UPC failure. Ignore the value in the Transmitted column.
If you notice that CLP=1 cells are discarded consistently, consider increasing the Maximum Burst Size (MBS) for the control circuit. See the NavisCore ATM Configuration Guide for more information on increasing the MBS.
Tagged Cells(CBX 500 Only)
The number of tagged ATM cells received. Ignore the value in the Transmitted column.
If you notice that cells are tagged consistently, consider increasing the Maximum Burst Size (MBS) for the control circuit. See the NavisCore ATM Configuration Guide for more information on increasing the MBS.
OAM CLP=0 Cells(CBX 500 Only)
The number of ATM OAM CLP=0 cells transmitted. Ignore the value in the Received column.
OAM CLP=1 Cells(CBX 500 Only)
The number of ATM OAM CLP=1 cells transmitted. Ignore the value in the Received column.
Table 3-5. Logical Port Control Channel Statistics (Continued)
Statistic Description
3-347/17/03 NavisCore Troubleshooting Guide
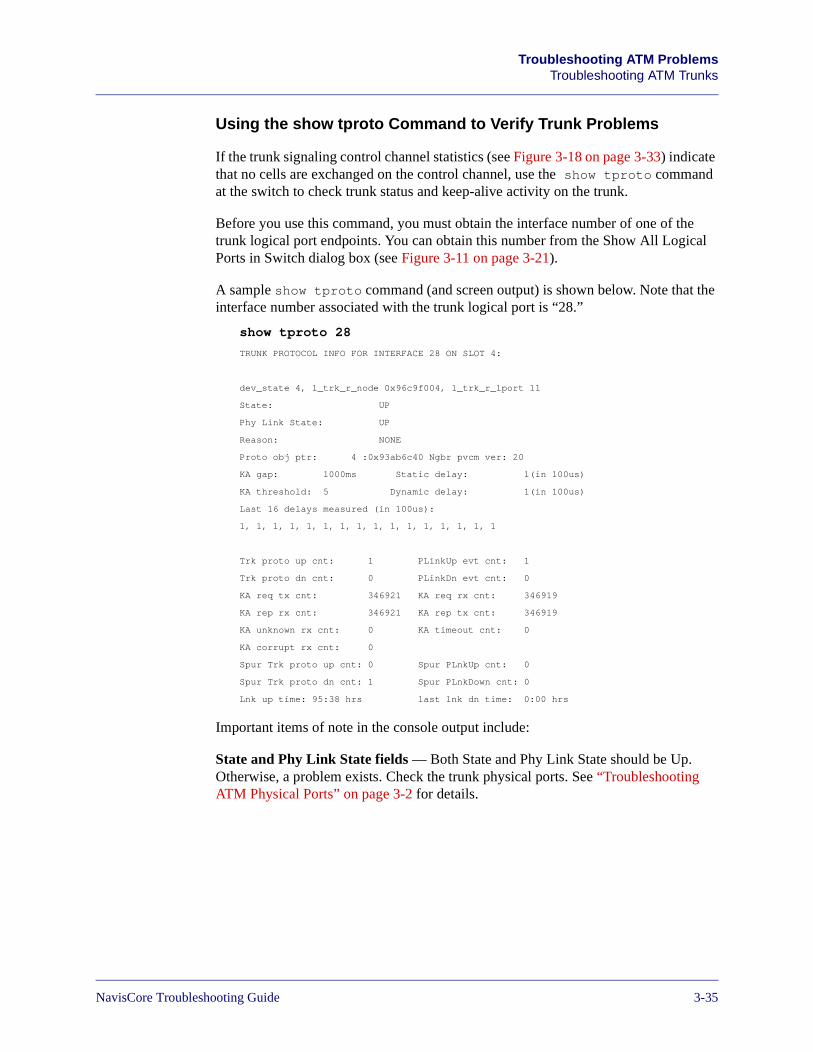
Beta Draft ConfidentialTroubleshooting ATM Problems
Troubleshooting ATM Trunks
Using the show tproto Command to Verify Trunk Problems
If the trunk signaling control channel statistics (see Figure 3-18 on page 3-33) indicate that no cells are exchanged on the control channel, use the show tproto command at the switch to check trunk status and keep-alive activity on the trunk.
Before you use this command, you must obtain the interface number of one of the trunk logical port endpoints. You can obtain this number from the Show All Logical Ports in Switch dialog box (see Figure 3-11 on page 3-21).
A sample show tproto command (and screen output) is shown below. Note that the interface number associated with the trunk logical port is “28.”
show tproto 28
TRUNK PROTOCOL INFO FOR INTERFACE 28 ON SLOT 4:
dev_state 4, l_trk_r_node 0x96c9f004, l_trk_r_lport 11
State: UP
Phy Link State: UP
Reason: NONE
Proto obj ptr: 4 :0x93ab6c40 Ngbr pvcm ver: 20
KA gap: 1000ms Static delay: 1(in 100us)
KA threshold: 5 Dynamic delay: 1(in 100us)
Last 16 delays measured (in 100us):
1, 1, 1, 1, 1, 1, 1, 1, 1, 1, 1, 1, 1, 1, 1, 1
Trk proto up cnt: 1 PLinkUp evt cnt: 1
Trk proto dn cnt: 0 PLinkDn evt cnt: 0
KA req tx cnt: 346921 KA req rx cnt: 346919
KA rep rx cnt: 346921 KA rep tx cnt: 346919
KA unknown rx cnt: 0 KA timeout cnt: 0
KA corrupt rx cnt: 0
Spur Trk proto up cnt: 0 Spur PLnkUp cnt: 0
Spur Trk proto dn cnt: 1 Spur PLnkDown cnt: 0
Lnk up time: 95:38 hrs last lnk dn time: 0:00 hrs
Important items of note in the console output include:
State and Phy Link State fields — Both State and Phy Link State should be Up. Otherwise, a problem exists. Check the trunk physical ports. See “Troubleshooting ATM Physical Ports” on page 3-2 for details.
NavisCore Troubleshooting Guide 7/17/033-35
Beta Draft ConfidentialTroubleshooting ATM ProblemsTroubleshooting ATM Trunks
KA req tx/rx cnt and KA rep tx/rx fields cnt — Check for the following:
• The values in these fields should be non-zero. Otherwise, a problem exists. Check the trunk physical ports. See “Troubleshooting ATM Physical Ports” on page 3-2 for details.
• The left-column values should be approximately equal, as should the right column values. In the left column, the value in the KA req tx cnt field should approximately equal the value in the KA rep rx cnt field. In the right column, the value in the KA req rx cnt field should approximately equal the value in the KA rep tx cnt field. If the values in these fields are disproportionate, check the trunk physical ports. See “Troubleshooting ATM Physical Ports” on page 3-2 for details.
Using PING to Verify ATM Trunk Problems
The ping command is a standard troubleshooting tool in most networks. It is a request/reply program that enables you to test connectivity between two points in the network, such as the switches at both ends of a trunk. A sample ping command is shown below:
ping 150.201.87.105
This command tests connectivity between the node from which you issue the command to a network node with an IP address of 150.201.87.105. The command output would indicate whether or not 150.201.87.105 is reachable.
To test connectivity between two switches connected by a trunk, access the console of one of the switches (using telnet), and issue the ping command. Use the internal IP address of the switch at the other end of the trunk in the ping command line. You can obtain this address by performing the following steps:
1. Select the switch at the other end of the trunk on the network map.
2. Select Configuration ⇒ System Information. The System Information dialog box appears, displaying the internal IP address of the switch.
The ping command is not as useful for troubleshooting problems if multiple paths exist between two switches. For example, if multiple paths exist, and one path goes down, the ping packets will use the alternate path and indicate connectivity between the switches exists. Ping will not indicate failure of one of the paths.
3-367/17/03 NavisCore Troubleshooting Guide
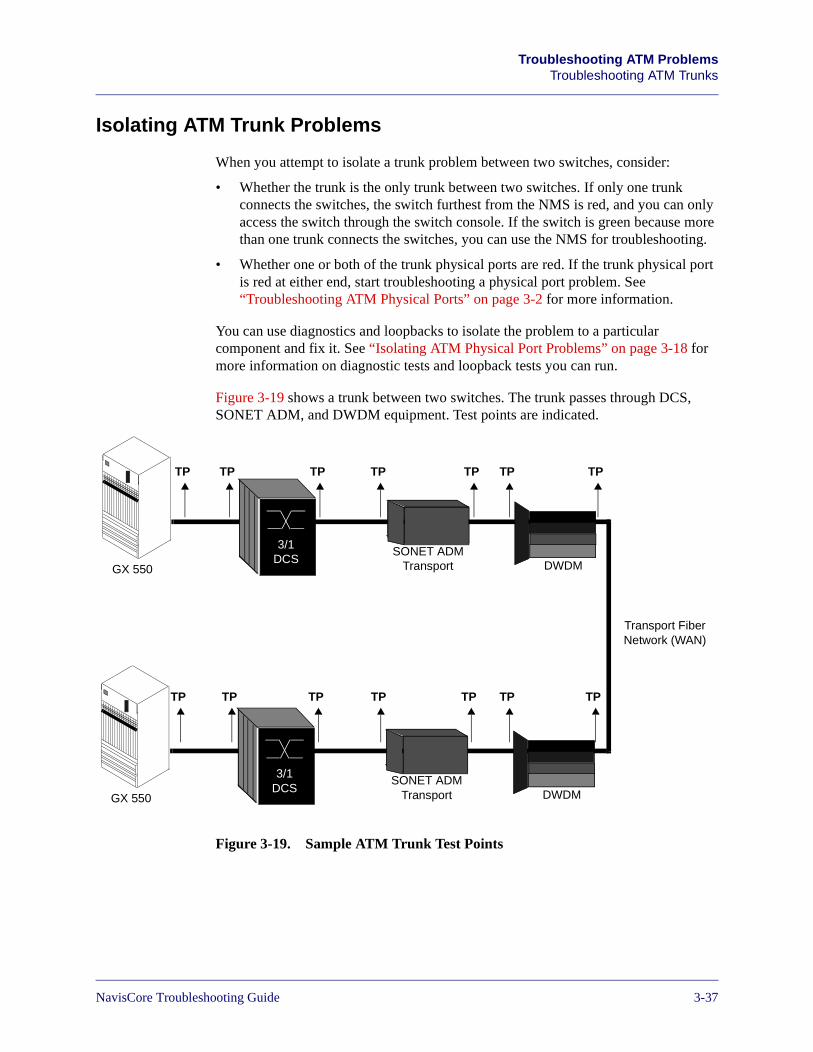
Beta Draft ConfidentialTroubleshooting ATM Problems
Troubleshooting ATM Trunks
Isolating ATM Trunk Problems
When you attempt to isolate a trunk problem between two switches, consider:
• Whether the trunk is the only trunk between two switches. If only one trunk connects the switches, the switch furthest from the NMS is red, and you can only access the switch through the switch console. If the switch is green because more than one trunk connects the switches, you can use the NMS for troubleshooting.
• Whether one or both of the trunk physical ports are red. If the trunk physical port is red at either end, start troubleshooting a physical port problem. See “Troubleshooting ATM Physical Ports” on page 3-2 for more information.
You can use diagnostics and loopbacks to isolate the problem to a particular component and fix it. See “Isolating ATM Physical Port Problems” on page 3-18 for more information on diagnostic tests and loopback tests you can run.
Figure 3-19 shows a trunk between two switches. The trunk passes through DCS, SONET ADM, and DWDM equipment. Test points are indicated.
Figure 3-19. Sample ATM Trunk Test Points
3/1DCS
SONET ADM Transport DWDM
Transport Fiber Network (WAN)
GX 550
3/1DCS
SONET ADM Transport DWDMGX 550
TP TP TP TP TP TP TP
TPTPTPTP TPTPTP
NavisCore Troubleshooting Guide 7/17/033-37
Beta Draft ConfidentialTroubleshooting ATM ProblemsTroubleshooting ATM Trunks
Correcting ATM Trunk Problems
Depending on the type of problem you find, you may take a number of corrective actions, including:
• Replacing faulty hardware.
• Changing the physical port configuration. See the NavisCore Physical Interface Configuration Guide for details.
• Changing the logical port configuration. See the NavisCore ATM Configuration Guide for more information.
3-387/17/03 NavisCore Troubleshooting Guide
Beta Draft ConfidentialTroubleshooting ATM Problems
Troubleshooting Point-to-Point ATM PVCs
Troubleshooting Point-to-Point ATM PVCs
This section provides guidelines on troubleshooting point-to-point ATM PVCs.
Identifying Point-to-Point ATM PVC Problems
You identify point-to-point ATM PVC problems through:
• Traps
• Customer complaints
Point-to-Point ATM PVC Traps
Traps are the only point-to-point PVC problem indicators available through NavisCore. Switches generate traps when events that effect PVCs occur.
The traps that indicate Frame Relay PVC problems also indicate point-to-point ATM PVC problems. See “Frame Relay PVC Traps” on page 2-40 for details. The following additional traps — NTM and NDC traps — indicate problems that are specific to ATM PVCs:
The LPort NTM Congestion status of interface index at switch name has changed to congestion status
This trap indicates that there is a change of congestion status on a logical port. Possible values for the severe congestion status include the following:
• Not congested (1)
• Congested (2)
The NDC Threshold has been crossed (switch name, interface number, source connection identification number) with Incoming Discarded CLP0 Cells = number for the associated threshold value of value
For information on the rules used by the switch and NMS during PVC creation to determine the calling and called endpoints as well as endpoint 1 and endpoint 2, see Appendix A, “Determining Calling and Called Endpoints for PVCs.”
NTM and NDC are supported on CBX 500 switches and GX 550 switches only.
NavisCore Troubleshooting Guide 7/17/033-39

Beta Draft ConfidentialTroubleshooting ATM ProblemsTroubleshooting Point-to-Point ATM PVCs
This trap is an NDC Threshold Crossing Alarm measuring the number of CLP0 cells discarded from a PVC on a module. It is generated not more than once within the 15-minute NDC measurement interval.
3-407/17/03 NavisCore Troubleshooting Guide
Beta Draft ConfidentialTroubleshooting ATM Problems
Troubleshooting Point-to-Point ATM PVCs
The NDC Threshold has been crossed (switch name, interface number, source connection identification number) with Incoming Discarded CLP0+1 Cells = number for the associated threshold value of value
This trap indicates an NDC Threshold Crossing Alarm measuring the number of CLP0+1 cells discarded from a PVC on a module. It is generated not more than once within the 15-minute NDC measurement interval.
See “NTM Statistics and NDC Statistics for Point-to-Point PVCs” on page 3-51 for more information on NTM and NDC.
Customer Complaints
When you receive a customer complaint, gather as much information as possible to speed up the recovery time. Then, ask yourself the following questions:
• Does the customer have one point-to-point PVC down or multiple point-to-point PVCs down? If only one circuit is down, you can narrow the problem to a specific circuit configuration issue, such as a circuit configuration problem with the switch or the CPE.
• Do multiple customers have point-to-point PVCs on the same physical port? Are they all encountering the same problem? If so, a potential physical port problem exists. See “Troubleshooting ATM Physical Ports” on page 3-2 for more information.
• Is the point-to-point PVC down, or does a performance problem exist? If the PVC is up, but is performing poorly, you may have a network congestion problem.
NavisCore Troubleshooting Guide 7/17/033-41
Beta Draft ConfidentialTroubleshooting ATM ProblemsTroubleshooting Point-to-Point ATM PVCs
Verifying Point-to-Point ATM PVC Problems
NavisCore provides you with two ways to verify problems with point-to-point ATM PVCs:
• ATM PVC Status and Summary Statistics
• NTM and NDC statistics
Point-to-Point ATM PVC Status and Summary Statistics
The Show All PVCs dialog box is the best source of information on a point-to-point ATM PVC, and therefore is your best tool for verifying a PVC problem. To access this dialog box:
1. From the Monitor menu, select Lucent Objects ⇒ Show Circuits, and select one of the following options:
All by Name — Enter a specific circuit name. To use wild-card characters to search by name, type an asterisk (*) to replace several characters or type a question mark (?) to replace one character.
All on Switch and by Name — Select a switch on the current map, then use this option to enter a specific circuit to search by name. To use wild-card characters, type an asterisk (*) to replace several characters or type a question mark (?) to replace one character.
All by Defined Path — Displays a list of all circuits that have a defined path.
All Point-to-Multipoint — Displays a list of all point-to-multipoint circuits.
Redirect — Displays a list of all redirect PVCs.
After you select an option, the Show All PVCs dialog box appears. Figure 3-20 shows a sample Show All PVCs dialog box.
3-427/17/03 NavisCore Troubleshooting Guide
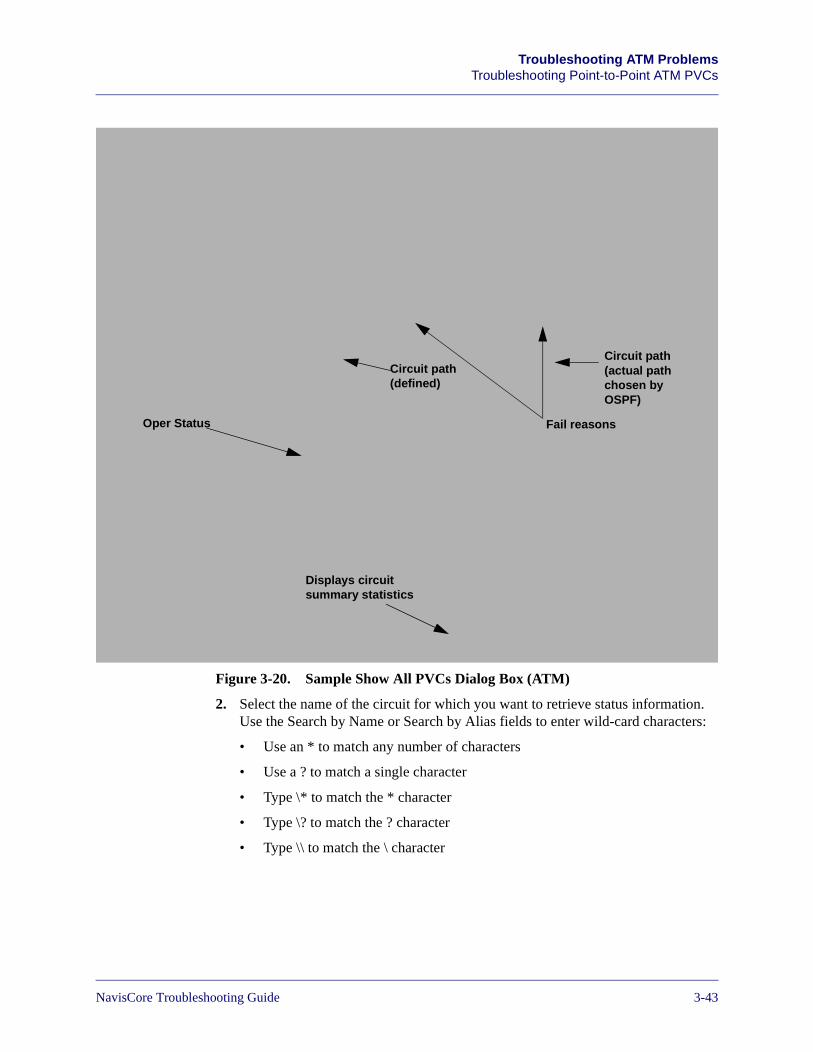
Beta Draft ConfidentialTroubleshooting ATM Problems
Troubleshooting Point-to-Point ATM PVCs
Figure 3-20. Sample Show All PVCs Dialog Box (ATM)
2. Select the name of the circuit for which you want to retrieve status information. Use the Search by Name or Search by Alias fields to enter wild-card characters:
• Use an * to match any number of characters
• Use a ? to match a single character
• Type \* to match the * character
• Type \? to match the ? character
• Type \\ to match the \ character
Oper Status Fail reasons
Displays circuit summary statistics
Circuit path (actual path chosen by OSPF)
Circuit path (defined)
NavisCore Troubleshooting Guide 7/17/033-43
Beta Draft ConfidentialTroubleshooting ATM ProblemsTroubleshooting Point-to-Point ATM PVCs
This first thing to look for on the Show All PVCs dialog box is the Oper Status, which is one of the ATM administrative attributes. Oper Status can have one of the following values:
Active — The PVC is operational between the two endpoints.
Inactive — The PVC is not operational between the two endpoints.
Invalid — The module that the point-to-point PVC uses on one of the switches is out of sync.
Unknown — One of the point-to-point PVC endpoint switches did not respond to an NMS request.
Based on the Oper Status value, ATM PVC problems can be categorized as follows:
• PVC is active but has performance issues (slow response or packet loss)
• PVC is active but the endpoints cannot communicate
• PVC is inactive
• PVC is invalid
• PVC is unknown
After you place the problem into one of these categories, you can take certain steps to correct the problem. The sections that follow describe each of these categories.
What is an Active Point-to-Point ATM PVC?
An active point-to-point ATM PVC must meet the following criteria:
• The PVC must be defined between two valid logical ports.
• The physical ports associated with the logical ports must have an operational status of Up.
• Signaling (i.e., ILMI) should be operating properly at both endpoints of the circuit.
• Any trunks in the path of the PVC must be operational.
• Sufficient bandwidth must be available on the trunks in the path to accommodate the configured traffic descriptors.
When one of these requirements is not met, the Show All PVCs dialog box displays a fail reason that describes the reason for the failure. Table 3-7 on page 3-48 describes these codes.
For example, a fail reason would appear for the PVC in Figure 3-21. In this figure, a trunk along the PVC path fails, causing the PVC to fail.
3-447/17/03 NavisCore Troubleshooting Guide
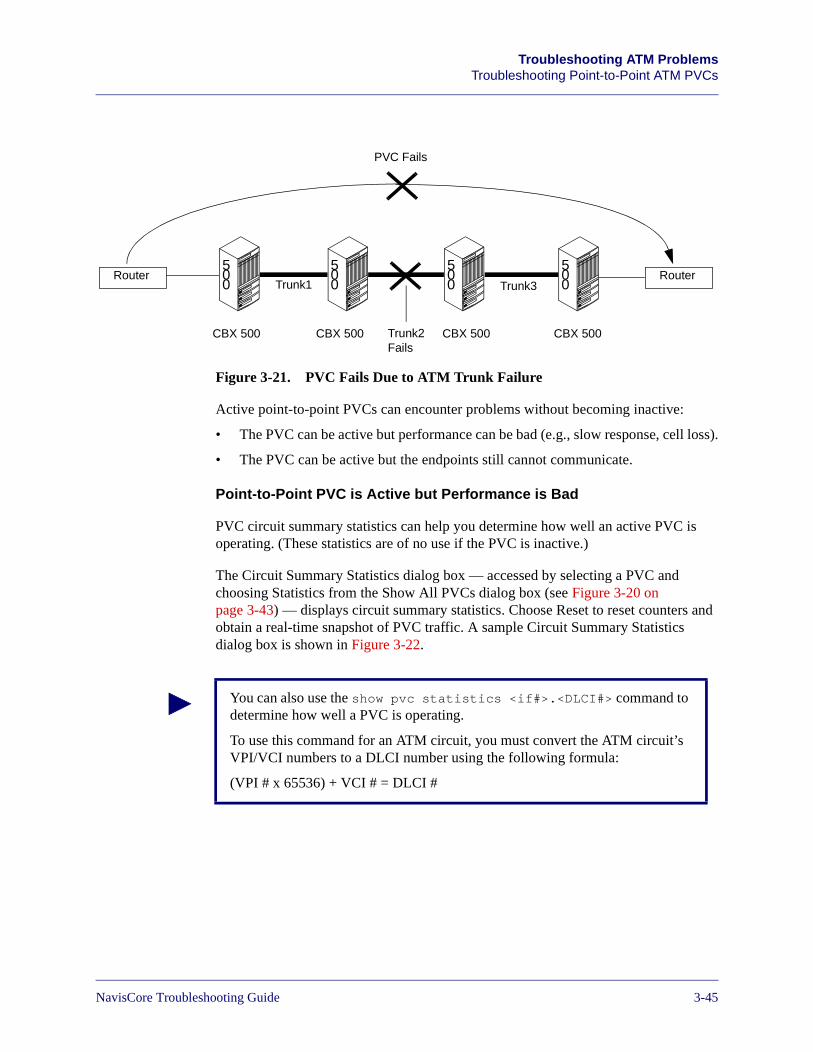
Beta Draft ConfidentialTroubleshooting ATM Problems
Troubleshooting Point-to-Point ATM PVCs
Figure 3-21. PVC Fails Due to ATM Trunk Failure
Active point-to-point PVCs can encounter problems without becoming inactive:
• The PVC can be active but performance can be bad (e.g., slow response, cell loss).
• The PVC can be active but the endpoints still cannot communicate.
Point-to-Point PVC is Active but Performance is Bad
PVC circuit summary statistics can help you determine how well an active PVC is operating. (These statistics are of no use if the PVC is inactive.)
The Circuit Summary Statistics dialog box — accessed by selecting a PVC and choosing Statistics from the Show All PVCs dialog box (see Figure 3-20 on page 3-43) — displays circuit summary statistics. Choose Reset to reset counters and obtain a real-time snapshot of PVC traffic. A sample Circuit Summary Statistics dialog box is shown in Figure 3-22.
RouterRouter
PVC Fails
Trunk1
Trunk2 Fails
Trunk3
CBX 500
500
500
500
500
CBX 500 CBX 500 CBX 500
You can also use the show pvc statistics <if#>.<DLCI#> command to determine how well a PVC is operating.
To use this command for an ATM circuit, you must convert the ATM circuit’s VPI/VCI numbers to a DLCI number using the following formula:
(VPI # x 65536) + VCI # = DLCI #
NavisCore Troubleshooting Guide 7/17/033-45
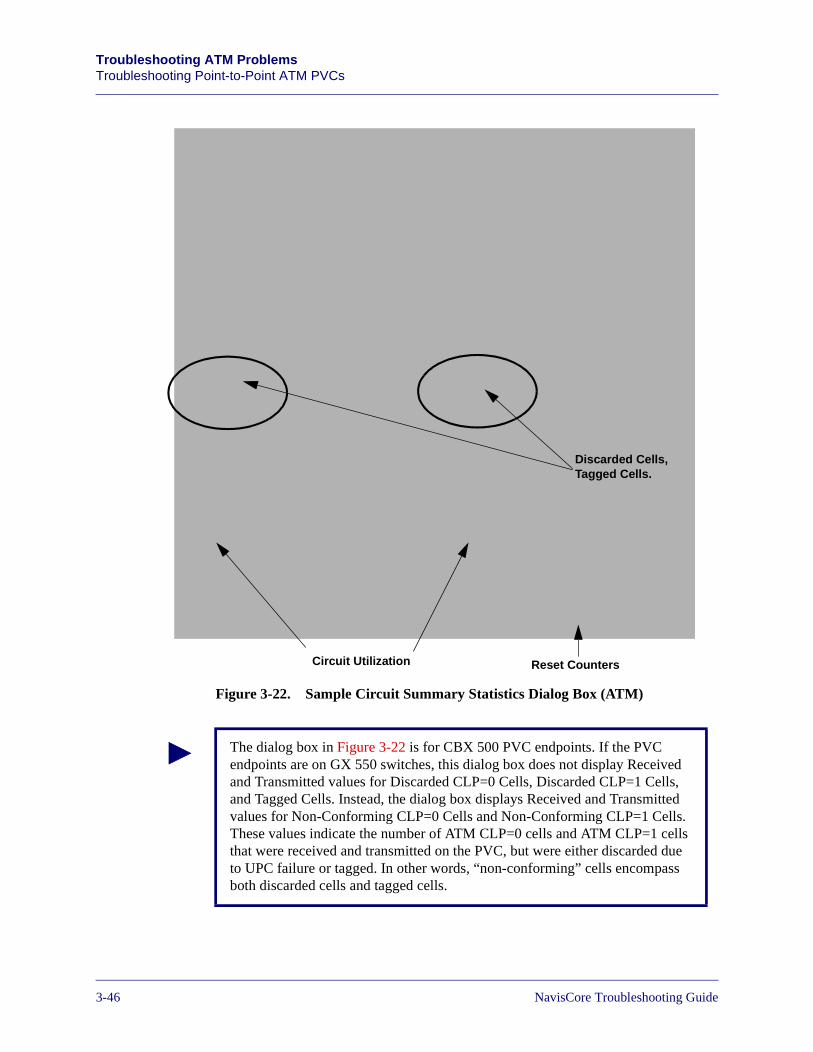
Beta Draft ConfidentialTroubleshooting ATM ProblemsTroubleshooting Point-to-Point ATM PVCs
Figure 3-22. Sample Circuit Summary Statistics Dialog Box (ATM)
Discarded Cells, Tagged Cells.
Circuit Utilization Reset Counters
The dialog box in Figure 3-22 is for CBX 500 PVC endpoints. If the PVC endpoints are on GX 550 switches, this dialog box does not display Received and Transmitted values for Discarded CLP=0 Cells, Discarded CLP=1 Cells, and Tagged Cells. Instead, the dialog box displays Received and Transmitted values for Non-Conforming CLP=0 Cells and Non-Conforming CLP=1 Cells. These values indicate the number of ATM CLP=0 cells and ATM CLP=1 cells that were received and transmitted on the PVC, but were either discarded due to UPC failure or tagged. In other words, “non-conforming” cells encompass both discarded cells and tagged cells.
3-467/17/03 NavisCore Troubleshooting Guide
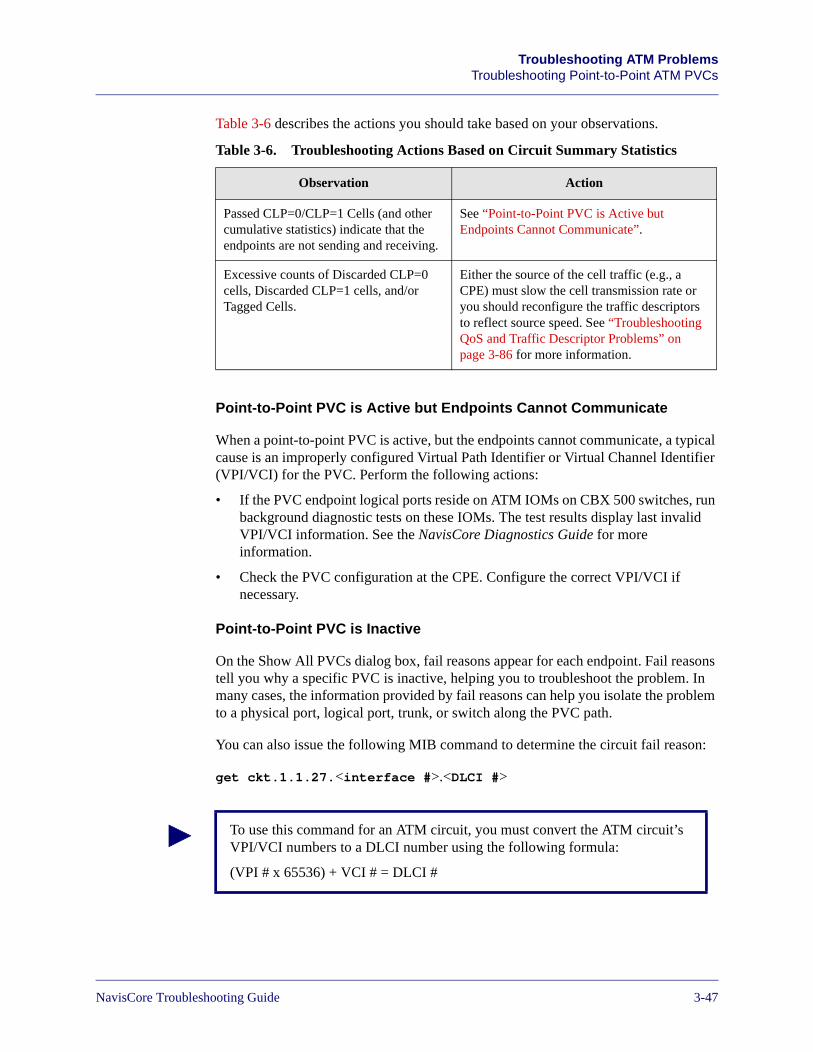
Beta Draft ConfidentialTroubleshooting ATM Problems
Troubleshooting Point-to-Point ATM PVCs
Table 3-6 describes the actions you should take based on your observations.
Point-to-Point PVC is Active but Endpoints Cannot Communicate
When a point-to-point PVC is active, but the endpoints cannot communicate, a typical cause is an improperly configured Virtual Path Identifier or Virtual Channel Identifier (VPI/VCI) for the PVC. Perform the following actions:
• If the PVC endpoint logical ports reside on ATM IOMs on CBX 500 switches, run background diagnostic tests on these IOMs. The test results display last invalid VPI/VCI information. See the NavisCore Diagnostics Guide for more information.
• Check the PVC configuration at the CPE. Configure the correct VPI/VCI if necessary.
Point-to-Point PVC is Inactive
On the Show All PVCs dialog box, fail reasons appear for each endpoint. Fail reasons tell you why a specific PVC is inactive, helping you to troubleshoot the problem. In many cases, the information provided by fail reasons can help you isolate the problem to a physical port, logical port, trunk, or switch along the PVC path.
You can also issue the following MIB command to determine the circuit fail reason:
get ckt.1.1.27.<interface #>.<DLCI #>
Table 3-6. Troubleshooting Actions Based on Circuit Summary Statistics
Observation Action
Passed CLP=0/CLP=1 Cells (and other cumulative statistics) indicate that the endpoints are not sending and receiving.
See “Point-to-Point PVC is Active but Endpoints Cannot Communicate”.
Excessive counts of Discarded CLP=0 cells, Discarded CLP=1 cells, and/or Tagged Cells.
Either the source of the cell traffic (e.g., a CPE) must slow the cell transmission rate or you should reconfigure the traffic descriptors to reflect source speed. See “Troubleshooting QoS and Traffic Descriptor Problems” on page 3-86 for more information.
To use this command for an ATM circuit, you must convert the ATM circuit’s VPI/VCI numbers to a DLCI number using the following formula:
(VPI # x 65536) + VCI # = DLCI #
NavisCore Troubleshooting Guide 7/17/033-47
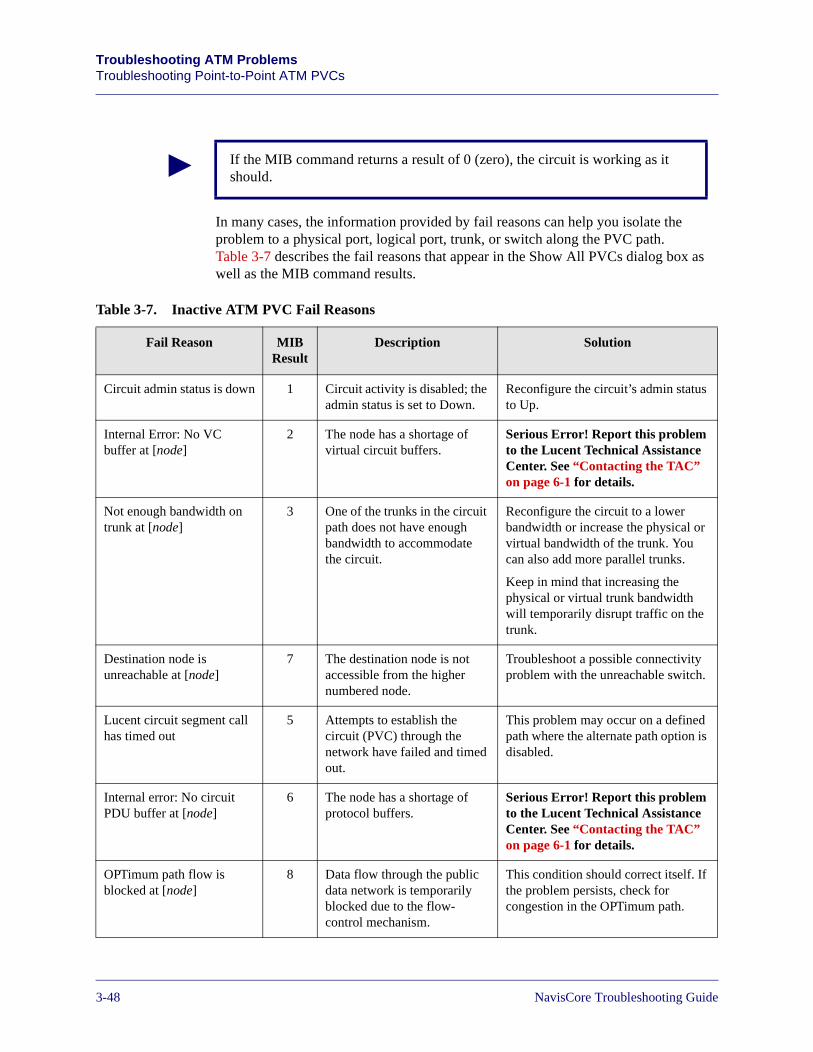
Beta Draft ConfidentialTroubleshooting ATM ProblemsTroubleshooting Point-to-Point ATM PVCs
In many cases, the information provided by fail reasons can help you isolate the problem to a physical port, logical port, trunk, or switch along the PVC path. Table 3-7 describes the fail reasons that appear in the Show All PVCs dialog box as well as the MIB command results.
If the MIB command returns a result of 0 (zero), the circuit is working as it should.
Table 3-7. Inactive ATM PVC Fail Reasons
Fail Reason MIB Result
Description Solution
Circuit admin status is down 1 Circuit activity is disabled; the admin status is set to Down.
Reconfigure the circuit’s admin status to Up.
Internal Error: No VC buffer at [node]
2 The node has a shortage of virtual circuit buffers.
Serious Error! Report this problem to the Lucent Technical Assistance Center. See “Contacting the TAC” on page 6-1 for details.
Not enough bandwidth on trunk at [node]
3 One of the trunks in the circuit path does not have enough bandwidth to accommodate the circuit.
Reconfigure the circuit to a lower bandwidth or increase the physical or virtual bandwidth of the trunk. You can also add more parallel trunks.
Keep in mind that increasing the physical or virtual trunk bandwidth will temporarily disrupt traffic on the trunk.
Destination node is unreachable at [node]
7 The destination node is not accessible from the higher numbered node.
Troubleshoot a possible connectivity problem with the unreachable switch.
Lucent circuit segment call has timed out
5 Attempts to establish the circuit (PVC) through the network have failed and timed out.
This problem may occur on a defined path where the alternate path option is disabled.
Internal error: No circuit PDU buffer at [node]
6 The node has a shortage of protocol buffers.
Serious Error! Report this problem to the Lucent Technical Assistance Center. See “Contacting the TAC” on page 6-1 for details.
OPTimum path flow is blocked at [node]
8 Data flow through the public data network is temporarily blocked due to the flow- control mechanism.
This condition should correct itself. If the problem persists, check for congestion in the OPTimum path.
3-487/17/03 NavisCore Troubleshooting Guide
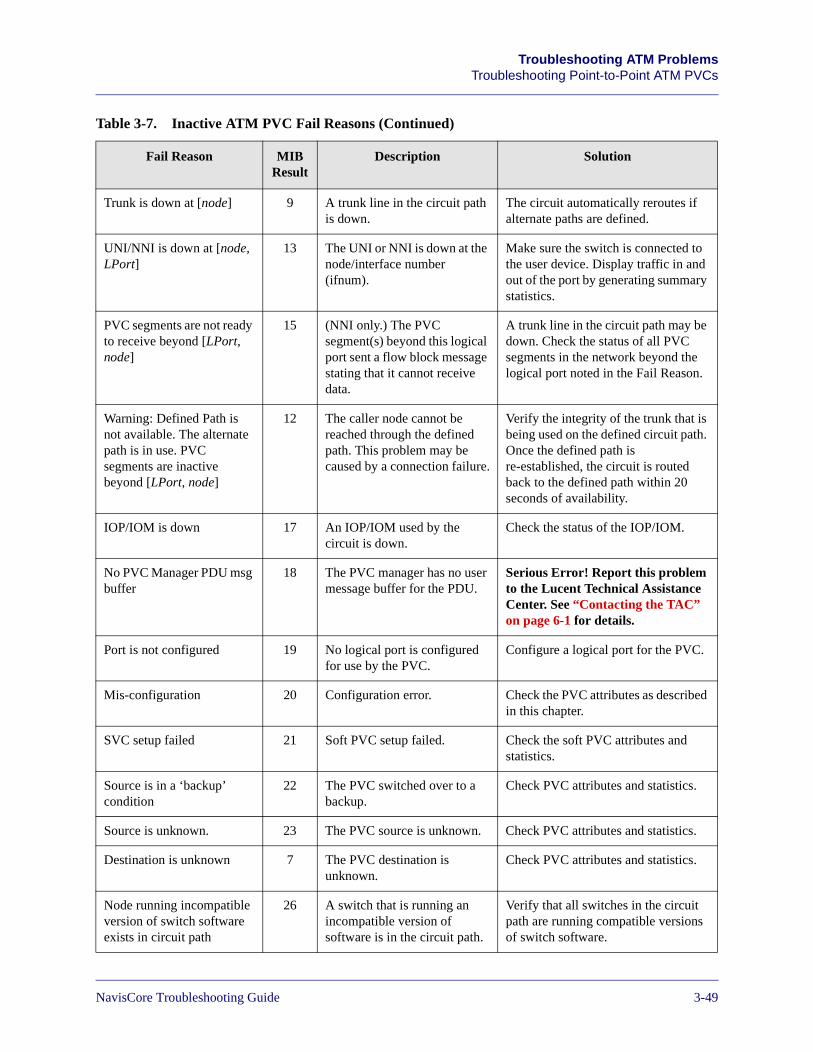
Beta Draft ConfidentialTroubleshooting ATM Problems
Troubleshooting Point-to-Point ATM PVCs
Trunk is down at [node] 9 A trunk line in the circuit path is down.
The circuit automatically reroutes if alternate paths are defined.
UNI/NNI is down at [node, LPort]
13 The UNI or NNI is down at the node/interface number (ifnum).
Make sure the switch is connected to the user device. Display traffic in and out of the port by generating summary statistics.
PVC segments are not ready to receive beyond [LPort, node]
15 (NNI only.) The PVC segment(s) beyond this logical port sent a flow block message stating that it cannot receive data.
A trunk line in the circuit path may be down. Check the status of all PVC segments in the network beyond the logical port noted in the Fail Reason.
Warning: Defined Path is not available. The alternate path is in use. PVC segments are inactive beyond [LPort, node]
12 The caller node cannot be reached through the defined path. This problem may be caused by a connection failure.
Verify the integrity of the trunk that is being used on the defined circuit path. Once the defined path is re-established, the circuit is routed back to the defined path within 20 seconds of availability.
IOP/IOM is down 17 An IOP/IOM used by the circuit is down.
Check the status of the IOP/IOM.
No PVC Manager PDU msg buffer
18 The PVC manager has no user message buffer for the PDU.
Serious Error! Report this problem to the Lucent Technical Assistance Center. See “Contacting the TAC” on page 6-1 for details.
Port is not configured 19 No logical port is configured for use by the PVC.
Configure a logical port for the PVC.
Mis-configuration 20 Configuration error. Check the PVC attributes as described in this chapter.
SVC setup failed 21 Soft PVC setup failed. Check the soft PVC attributes and statistics.
Source is in a ‘backup’ condition
22 The PVC switched over to a backup.
Check PVC attributes and statistics.
Source is unknown. 23 The PVC source is unknown. Check PVC attributes and statistics.
Destination is unknown 7 The PVC destination is unknown.
Check PVC attributes and statistics.
Node running incompatible version of switch software exists in circuit path
26 A switch that is running an incompatible version of software is in the circuit path.
Verify that all switches in the circuit path are running compatible versions of switch software.
Table 3-7. Inactive ATM PVC Fail Reasons (Continued)
Fail Reason MIB Result
Description Solution
NavisCore Troubleshooting Guide 7/17/033-49
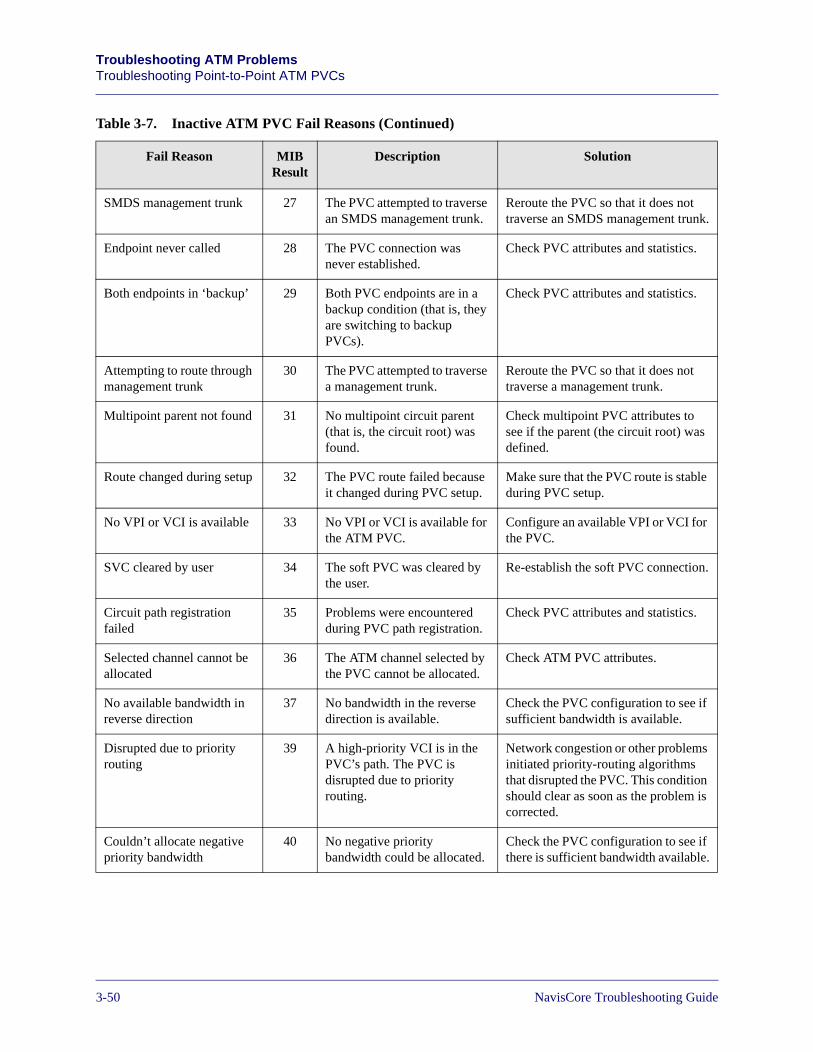
Beta Draft ConfidentialTroubleshooting ATM ProblemsTroubleshooting Point-to-Point ATM PVCs
SMDS management trunk 27 The PVC attempted to traverse an SMDS management trunk.
Reroute the PVC so that it does not traverse an SMDS management trunk.
Endpoint never called 28 The PVC connection was never established.
Check PVC attributes and statistics.
Both endpoints in ‘backup’ 29 Both PVC endpoints are in a backup condition (that is, they are switching to backup PVCs).
Check PVC attributes and statistics.
Attempting to route through management trunk
30 The PVC attempted to traverse a management trunk.
Reroute the PVC so that it does not traverse a management trunk.
Multipoint parent not found 31 No multipoint circuit parent (that is, the circuit root) was found.
Check multipoint PVC attributes to see if the parent (the circuit root) was defined.
Route changed during setup 32 The PVC route failed because it changed during PVC setup.
Make sure that the PVC route is stable during PVC setup.
No VPI or VCI is available 33 No VPI or VCI is available for the ATM PVC.
Configure an available VPI or VCI for the PVC.
SVC cleared by user 34 The soft PVC was cleared by the user.
Re-establish the soft PVC connection.
Circuit path registration failed
35 Problems were encountered during PVC path registration.
Check PVC attributes and statistics.
Selected channel cannot be allocated
36 The ATM channel selected by the PVC cannot be allocated.
Check ATM PVC attributes.
No available bandwidth in reverse direction
37 No bandwidth in the reverse direction is available.
Check the PVC configuration to see if sufficient bandwidth is available.
Disrupted due to priority routing
39 A high-priority VCI is in the PVC’s path. The PVC is disrupted due to priority routing.
Network congestion or other problems initiated priority-routing algorithms that disrupted the PVC. This condition should clear as soon as the problem is corrected.
Couldn’t allocate negative priority bandwidth
40 No negative priority bandwidth could be allocated.
Check the PVC configuration to see if there is sufficient bandwidth available.
Table 3-7. Inactive ATM PVC Fail Reasons (Continued)
Fail Reason MIB Result
Description Solution
3-507/17/03 NavisCore Troubleshooting Guide
Beta Draft ConfidentialTroubleshooting ATM Problems
Troubleshooting Point-to-Point ATM PVCs
Point-to-Point PVC is Invalid
When the PVC Oper Status is Invalid, it typically means that the module the point-to-point PVC uses on one of the switches is out of sync. Perform a PRAM sync to properly synchronize the module. See the NavisCore NMS Getting Started Guide for more information on performing a PRAM sync.
Point-to-Point PVC is Unknown
When the PVC Oper Status is Unknown, it typically means that one of the point-to-point PVC endpoint switches did not respond to an NMS request. In this case, the switch is red on the network map. When the NMS can reach the switch, the Oper Status returns to Active.
NTM Statistics and NDC Statistics for Point-to-Point PVCs
NTM and NDC provide you with statistics on point-to-point PVC and point-to-multipoint PVC traffic. Lucent has based the functional requirements for NTM and NDC on the Bellcore GR-1248 specification [GR1248].
NTM and NDC are disabled by default. To enable NTM and NDC, you first configure the NTM congestion thresholds for the “feeder” logical port. The feeder port can be any UNI, Direct trunk, or NNI logical port. Then, you set the NDC thresholds on a per-PVC basis. You can then monitor the NTM and NDC data that the logical port and PVC collect.
You can enable the NTM and NDC functions when you first configure your switch, or you can take the logical port/PVCs off-line to enable these functions once you establish a basic switch-to-NMS configuration.
About NTM
The purpose of NTM is to improve PVC traffic performance during overloads and failures in the network. NTM provides the following functions:
Measures of Congestion (MOC) — Defined at the ATM level based on percentage of cell loss. NTM applies a MOC to all congestable ATM modules. A congestable ATM module is any entity within an ATM Network Element (ATM NE) that can experience traffic congestion.
NTM surveillance measurements — Used to detect overloads based on MOCs.
NTM control functions — Used to regulate/reroute the traffic flow during overloads.
See the NavisCore Diagnostics Guide for more information on configuring NTM.
NTM and NDC are supported on CBX 500 switches and GX 550 switches only.
NavisCore Troubleshooting Guide 7/17/033-51
Beta Draft ConfidentialTroubleshooting ATM ProblemsTroubleshooting Point-to-Point ATM PVCs
NDC
You configure the NDC measurements to detect any violation of PVC service subscription parameters and establish trends in network traffic patterns and loads. Scheduled measurements are taken on a regular basis as soon as the ATM NE is put into service. The measurements monitor the usage and health of the network.
Lucent switches support NDC scheduled measurements for up to 360 simultaneously monitored circuits per module.
For each feeder port and PVC, NavisCore provides a variety of NDC statistics including:
• The current plus two 15-minute history counts.
• The timestamps for the history counts (taken at the end of respective 15-minute periods). The timestamps use the Universal Coordinated Time (UCT) available on the switch and have a 1-second resolution.
• The time elapsed in the current 15-minute period.
There are three types of NDC scheduled measurements:
Traffic load measurements — Count the number of incoming/outgoing cells on a per-interface and per-VC basis.
Usage Parameter Control/Network Parameter Control (UPC/NPC) disagreement measurements — Collect the number of cells discarded due to UPC/NPC violations on a per-VC basis.
Traffic load and congestion measurements — Count the cells processed and discarded by a congestable ATM NE module, respectively. These counts do not include cells discarded due to UPC/NPC disagreements.
See the NavisCore Diagnostics Guide for more information on configuring NDC.
3-527/17/03 NavisCore Troubleshooting Guide
Beta Draft ConfidentialTroubleshooting ATM Problems
Troubleshooting Point-to-Point ATM PVCs
Isolating Point-to-Point ATM PVC Problems
To isolate ATM PVC problems, use:
• Circuit path information
• OAM loopback tests
Using the Circuit Path to Isolate ATM PVC Problems
The circuit path information on the Show All PVCs dialog box (see Figure 3-20 on page 3-43) may provide enough information for you to isolate the PVC problem. The circuit path information includes the name of the intermediate trunks and switches between PVC endpoints. You can then check the statistics and attributes of the intermediate trunks and their associated physical and logical ports. See “Troubleshooting ATM Trunks” on page 3-28 for more information on troubleshooting trunks.
Using OAM Loopback Tests to Isolate ATM PVC Problems
When you verify the existence of a point-to-point ATM PVC problem, use Operation, Administration, and Maintenance (OAM) loopback tests to isolate the problem.
OAM cells are used with ATM-layer fault management to provide the following functions:
• OAM connectivity verification
• OAM alarm surveillance
The CBX 500 and GX 550 support two types of OAM connectivity verification:
• OAM cells sent to a CBX 500 or GX 550 UNI/NNI port from an attached device
• OAM loopback cell generation
OAM loopback tests are supported on the CBX 500 and GX 550 only. For ATM PVCs whose endpoints reside on B-STDX switches, use PVC loopback tests. See the NavisCore Diagnostics Guide for details.
NavisCore Troubleshooting Guide 7/17/033-53
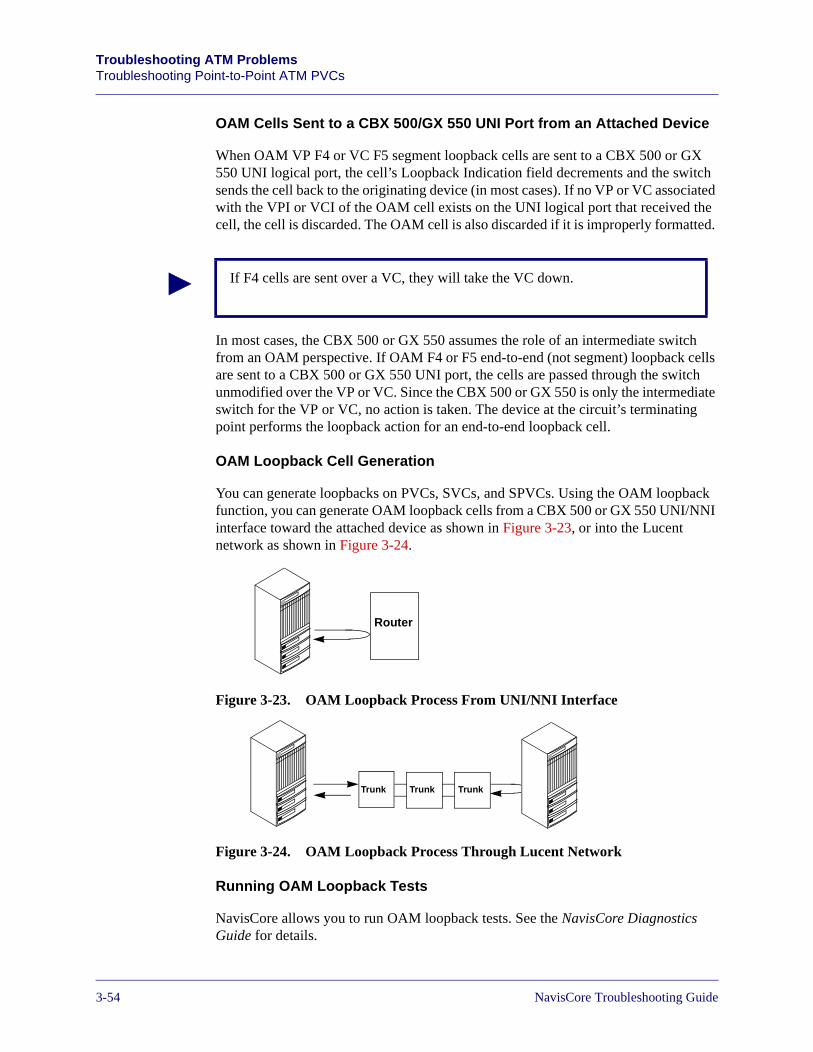
Beta Draft ConfidentialTroubleshooting ATM ProblemsTroubleshooting Point-to-Point ATM PVCs
OAM Cells Sent to a CBX 500/GX 550 UNI Port from an Attached Device
When OAM VP F4 or VC F5 segment loopback cells are sent to a CBX 500 or GX 550 UNI logical port, the cell’s Loopback Indication field decrements and the switch sends the cell back to the originating device (in most cases). If no VP or VC associated with the VPI or VCI of the OAM cell exists on the UNI logical port that received the cell, the cell is discarded. The OAM cell is also discarded if it is improperly formatted.
In most cases, the CBX 500 or GX 550 assumes the role of an intermediate switch from an OAM perspective. If OAM F4 or F5 end-to-end (not segment) loopback cells are sent to a CBX 500 or GX 550 UNI port, the cells are passed through the switch unmodified over the VP or VC. Since the CBX 500 or GX 550 is only the intermediate switch for the VP or VC, no action is taken. The device at the circuit’s terminating point performs the loopback action for an end-to-end loopback cell.
OAM Loopback Cell Generation
You can generate loopbacks on PVCs, SVCs, and SPVCs. Using the OAM loopback function, you can generate OAM loopback cells from a CBX 500 or GX 550 UNI/NNI interface toward the attached device as shown in Figure 3-23, or into the Lucent network as shown in Figure 3-24.
Figure 3-23. OAM Loopback Process From UNI/NNI Interface
Figure 3-24. OAM Loopback Process Through Lucent Network
Running OAM Loopback Tests
NavisCore allows you to run OAM loopback tests. See the NavisCore Diagnostics Guide for details.
If F4 cells are sent over a VC, they will take the VC down.
Router
Trunk Trunk Trunk
3-547/17/03 NavisCore Troubleshooting Guide
Beta Draft ConfidentialTroubleshooting ATM Problems
Troubleshooting Point-to-Point ATM PVCs
Correcting Point-to-Point ATM PVC Problems
The actions you take to correct a point-to-point ATM PVC problem will vary, and may have nothing to do with the PVC at all. You may have to resolve problems with the physical ports, logical ports, trunks, switches, and CPE that the PVC traverses. See the earlier sections in this chapter for resolving those kinds of problems.
In other cases, you may have to reconfigure the point-to-point PVC. For example, you may have to reconfigure VPI Start and VPI Stop values.
Point-to-Point ATM PVC Troubleshooting Flowcharts
The flowcharts in this section provide generic guidelines for troubleshooting problems in the following categories:
• Point-to-point VC is inactive
• Point-to-point PVC is active but has performance problems
• Point-to-point PVC is active but the endpoints cannot communicate
NavisCore Troubleshooting Guide 7/17/033-55
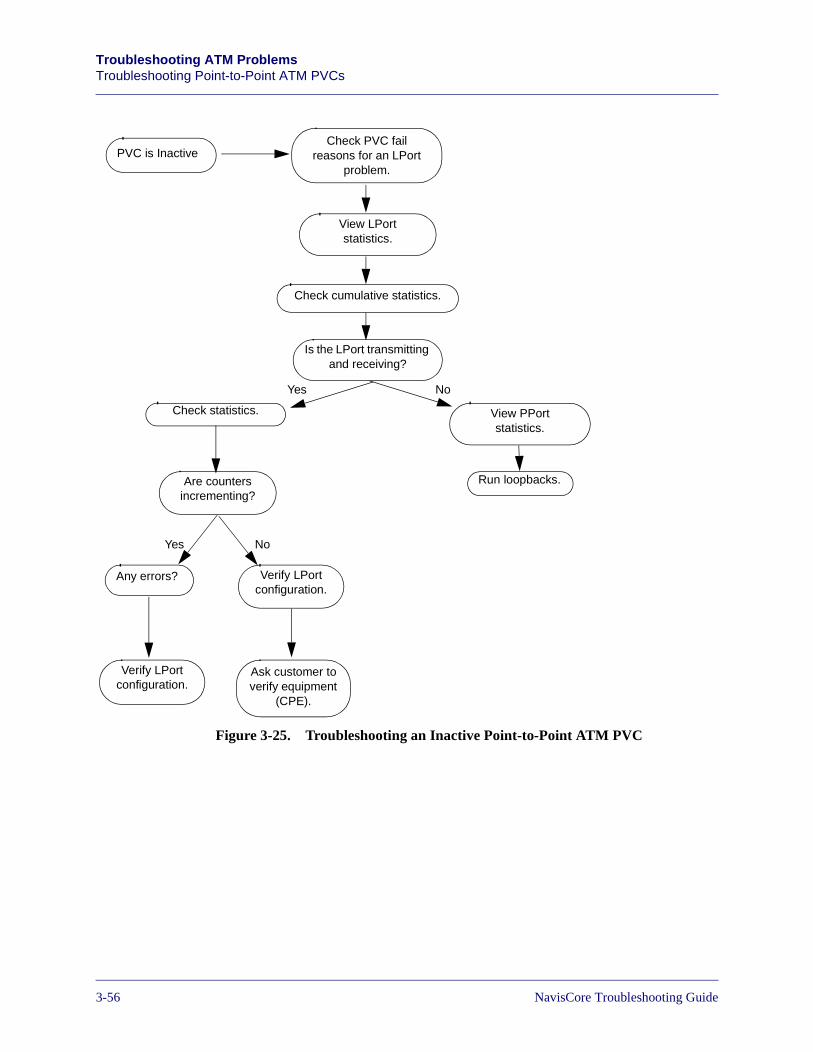
Beta Draft ConfidentialTroubleshooting ATM ProblemsTroubleshooting Point-to-Point ATM PVCs
Figure 3-25. Troubleshooting an Inactive Point-to-Point ATM PVC
PVC is InactiveCheck PVC fail
reasons for an LPort problem.
View LPort statistics.
Check cumulative statistics.
Is the LPort transmitting and receiving?
View PPort statistics.
Check statistics.
Any errors?
Verify LPort configuration.
Verify LPort configuration.
Ask customer to verify equipment
(CPE).
Run loopbacks.
Yes No
Are counters incrementing?
Yes No
3-567/17/03 NavisCore Troubleshooting Guide
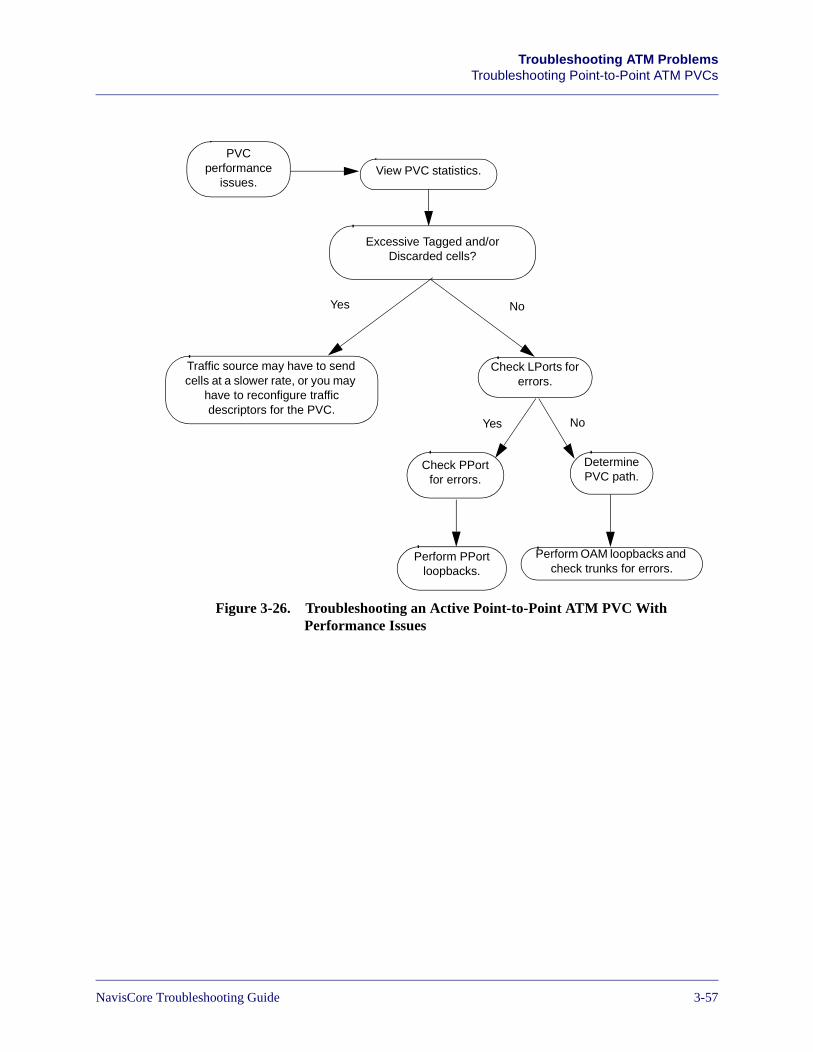
Beta Draft ConfidentialTroubleshooting ATM Problems
Troubleshooting Point-to-Point ATM PVCs
Figure 3-26. Troubleshooting an Active Point-to-Point ATM PVC WithPerformance Issues
PVC performance
issues.View PVC statistics.
Excessive Tagged and/or Discarded cells?
Yes No
Yes No
Traffic source may have to send cells at a slower rate, or you may
have to reconfigure traffic descriptors for the PVC.
Check PPort for errors.
Perform PPort loopbacks.
Check LPorts for errors.
Perform OAM loopbacks and check trunks for errors.
Determine PVC path.
NavisCore Troubleshooting Guide 7/17/033-57
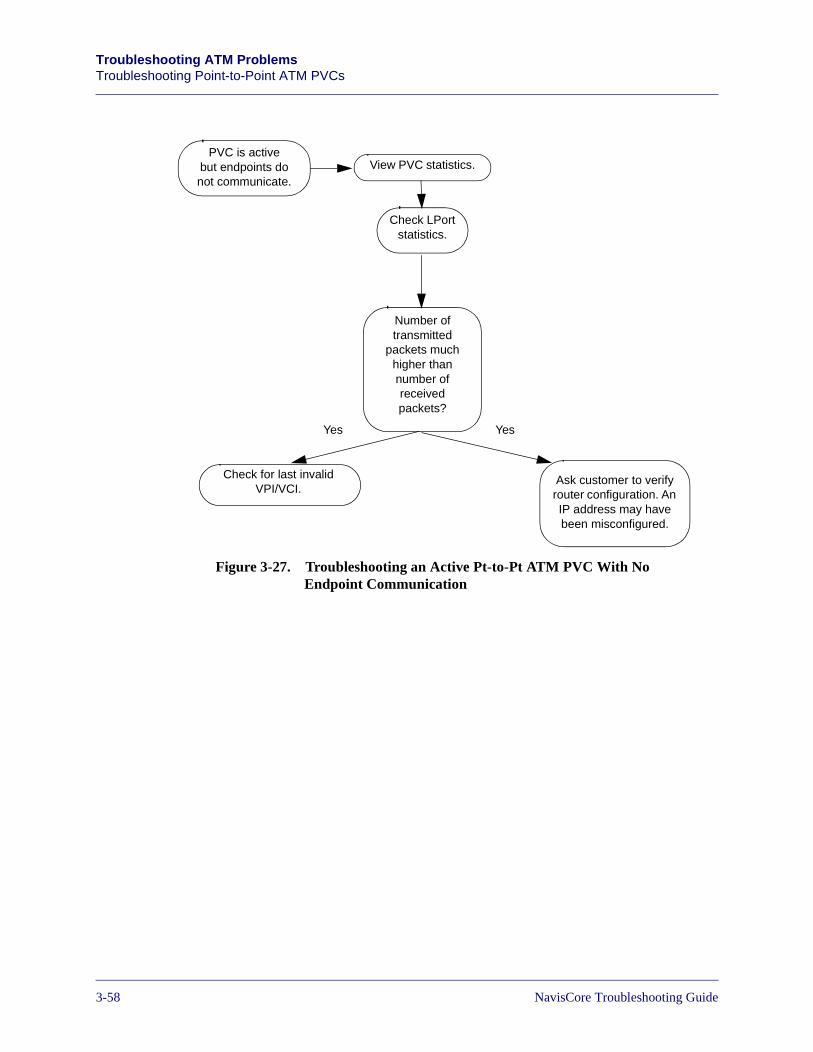
Beta Draft ConfidentialTroubleshooting ATM ProblemsTroubleshooting Point-to-Point ATM PVCs
Figure 3-27. Troubleshooting an Active Pt-to-Pt ATM PVC With No Endpoint Communication
PVC is activebut endpoints donot communicate.
View PVC statistics.
Check LPort statistics.
Number of transmitted
packets much higher than number of received packets?
Check for last invalid VPI/VCI.
Ask customer to verify router configuration. An IP address may have been misconfigured.
YesYes
3-587/17/03 NavisCore Troubleshooting Guide
Beta Draft ConfidentialTroubleshooting ATM Problems
Troubleshooting Point-to-Multipoint ATM PVCs
Troubleshooting Point-to-Multipoint ATM PVCs
This section provides guidelines on troubleshooting point-to-multipoint (PMP) ATM PVCs. On a PMP ATM PVC, multiple switches share a common circuit in a root-to-leaf topology. A single switch at the root of the circuit has connections to multiple switches at the leaves of the circuit.
Identifying PMP ATM PVC Problems
You identify PMP ATM PVC problems through:
• Traps
• Customer complaints
PMP ATM PVC Traps
Traps are the only PMP PVC problem indicators available through NavisCore. Switches generate traps when events that effect PMP PVCs occur.
The following trap provides valuable information on PMP PVC problems:
PMP ATM circuit circuit name endpoint index number at switch switch name is Ckt Leaf Oper Status Ckt leaf Connection Fail Reason, Node Port
This trap indicates that the PMP ATM PVC state has been changed. The possible values for the Ckt Leaf Oper Status are the following: Invalid (0), Inactive (1), Active (2). The possible values for the fail reason include the values in Table 3-7 on page 3-48.
NTM and NDC traps also provide information on PMP PVC problems, just as they provide information on point-to-point PVC problems. See “Point-to-Point ATM PVC Traps” on page 3-39 for more information on NTM and NDC traps.
NTM and NDC are supported on CBX 500 and GX 550 switches only.
NavisCore Troubleshooting Guide 7/17/033-59
Beta Draft ConfidentialTroubleshooting ATM ProblemsTroubleshooting Point-to-Multipoint ATM PVCs
Customer Complaints
When you receive a customer complaint, gather as much information as possible to speed up the recovery time. Then, ask yourself the following questions:
• Does the customer have one PMP PVC down or multiple PMP PVCs down? If only one circuit is down, you can narrow the problem to a specific circuit configuration issue, such as a circuit configuration problem with the switch.
• On a single PMP PVC, are multiple root-to-leaf connections down, or just a single root-to-leaf connection? If multiple root-to-leaf connections are down, determine what all the connections have in common (for example, the switch at the connection root is a common denominator, a trunk that all the connections traverse is a common denominator, etc.). Knowing the common denominators will help you verify and isolate the problem. If just a single connection is down, the problem may be at either the switch that acts as the root or the switch that acts as the leaf (somewhere in the network in between).
• Does a performance problem exist? If the PMP PVC is up, but is performing poorly, you may have a network congestion problem.
Verifying PMP ATM PVC Problems
NavisCore provides you with two ways to verify problems with PMP ATM PVCs:
• PMP ATM PVC Status and Summary Statistics
• NTM and NDC statistics
PMP ATM PVC Status and Summary Statistics
The Show All Point-to-Multiple-Point Circuit Roots dialog box is the best source of information on a PMP ATM PVC, and therefore is your best tool for verifying a PMP PVC problem. To access this dialog box:
1. From the Monitor menu, select Lucent Objects ⇒ Show Circuits ⇒ All Point-to-Multipoint. The Show All Point-to-Multiple-Point Circuit Roots dialog box appears. Figure 3-28 shows a sample Show All Point-to-Multiple-Point Circuit Roots dialog box.
3-607/17/03 NavisCore Troubleshooting Guide
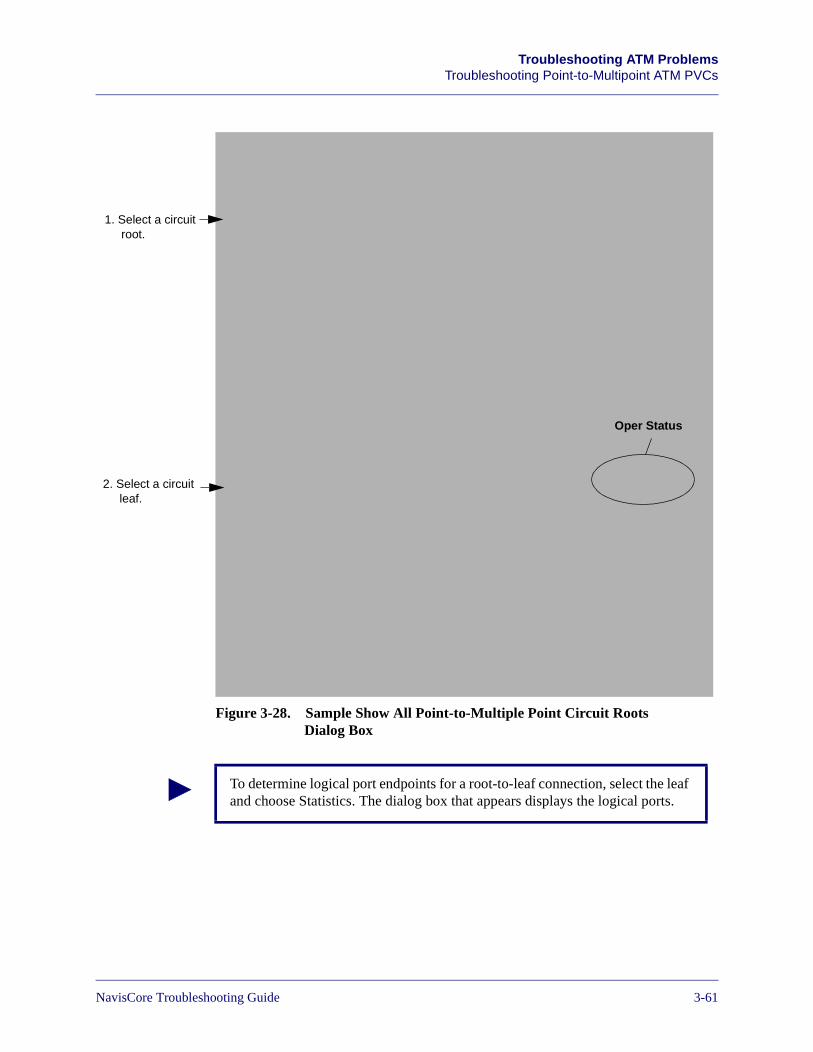
Beta Draft ConfidentialTroubleshooting ATM Problems
Troubleshooting Point-to-Multipoint ATM PVCs
Figure 3-28. Sample Show All Point-to-Multiple Point Circuit Roots Dialog Box
1. Select a circuit root.
2. Select a circuit leaf.
Oper Status
To determine logical port endpoints for a root-to-leaf connection, select the leaf and choose Statistics. The dialog box that appears displays the logical ports.
NavisCore Troubleshooting Guide 7/17/033-61
Beta Draft ConfidentialTroubleshooting ATM ProblemsTroubleshooting Point-to-Multipoint ATM PVCs
2. Select each leaf to obtain status information on the connection between the root and the leaf. This information appears in the bottom half of the dialog box. The first thing to look for is the Oper Status, which indicates the current state of the root-to-leaf connection. Oper Status can have one of the following values:
Active — The root-to-leaf connection is operational.
Inactive — The root-to-leaf connection is not operational.
Invalid — The root-to-leaf configuration is not contained within the calling node.
Unknown — The node did not respond to the NMS’ request for status.
Based on the Oper Status value, PMP ATM PVC problems can be categorized as follows:
• Root-to-leaf connection is active but has performance issues (slow response or packet loss)
• Root-to-leaf connection is active but the endpoints cannot communicate
• Root-to-leaf connection is inactive
• Root-to-leaf connection is invalid
• Root-to-leaf connection is unknown
After you place the problem into one of these categories, you can take certain steps to correct the problem. The sections that follow describe each of these categories.
If all of the root-to-leaf connections are inactive, begin isolating the problem at the root. See “Isolating PMP ATM PVC Problems” on page 3-66 for more information.
3-627/17/03 NavisCore Troubleshooting Guide
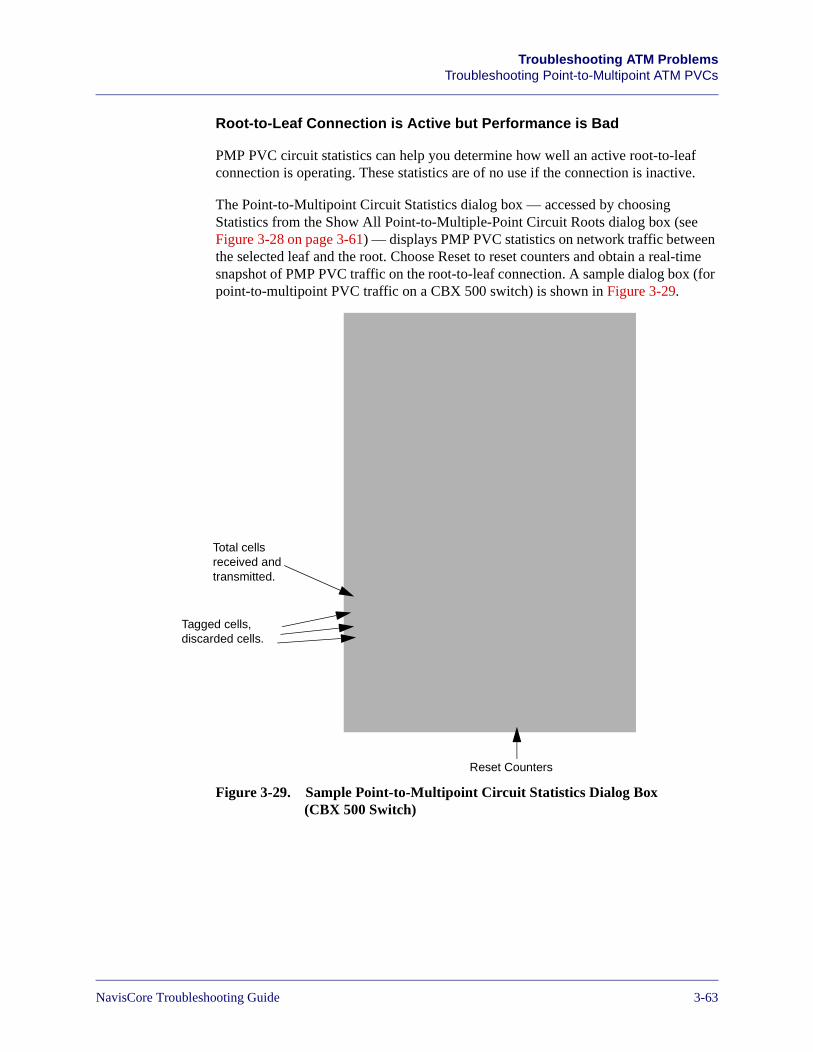
Beta Draft ConfidentialTroubleshooting ATM Problems
Troubleshooting Point-to-Multipoint ATM PVCs
Root-to-Leaf Connection is Active but Performance is Bad
PMP PVC circuit statistics can help you determine how well an active root-to-leaf connection is operating. These statistics are of no use if the connection is inactive.
The Point-to-Multipoint Circuit Statistics dialog box — accessed by choosing Statistics from the Show All Point-to-Multiple-Point Circuit Roots dialog box (see Figure 3-28 on page 3-61) — displays PMP PVC statistics on network traffic between the selected leaf and the root. Choose Reset to reset counters and obtain a real-time snapshot of PMP PVC traffic on the root-to-leaf connection. A sample dialog box (for point-to-multipoint PVC traffic on a CBX 500 switch) is shown in Figure 3-29.
Figure 3-29. Sample Point-to-Multipoint Circuit Statistics Dialog Box (CBX 500 Switch)
Tagged cells, discarded cells.
Reset Counters
Total cells received and transmitted.
NavisCore Troubleshooting Guide 7/17/033-63
Beta Draft ConfidentialTroubleshooting ATM ProblemsTroubleshooting Point-to-Multipoint ATM PVCs
Table 3-6 describes the actions you should take based on your observations.
Root-to-Leaf Connection is Active but Endpoints Cannot Communicate
When a root-to-leaf connection is active, but the endpoints cannot communicate, a typical cause is an improperly configured Virtual Path Identifier or Virtual Channel Identifier (VPI/VCI) for the connection. Perform the following actions:
• Check the VPI Start and VPI Stop attributes configured for both ends of the connection. Verify that they are correct and reconfigure if necessary. See the NavisCore ATM Configuration Guide for more information.
• If the connection endpoints reside on ATM IOMs on CBX 500 switches, run background diagnostic tests on these IOMs. The test results display last invalid VPI/VCI information. See the NavisCore Diagnostics Guide for more information.
• Check the configuration at the CPE. Configure the correct VPI/VCI if necessary.
Root-to-Leaf Connection is Inactive
Fail reasons tell you why a specific root-to-leaf connection is inactive. On the Show All Point-to-Multiple-Point Circuit Roots dialog box, fail reasons appear for each leaf you select (that is, each root-to-leaf connection). This information helps you to troubleshoot the problem. In many cases, the information provided by fail reasons can help you isolate the problem to a physical port, logical port, trunk, or switch along the connection path.
See Table 3-7 on page 3-48 for a description of fail reasons.
Table 3-8. Troubleshooting Actions Based on PMP Circuit Statistics
Observation Action
Total cells (and other cumulative statistics) indicate that the endpoints are not sending and receiving.
See “Root-to-Leaf Connection is Active but Endpoints Cannot Communicate” on page 3-64.
Excessive counts of Discarded CLP=0 cells, Discarded CLP=1 cells, and/or Tagged Cells.
Either the source of the cell traffic (e.g., a CPE) must slow the cell transmission rate or you should reconfigure the traffic descriptors to reflect source speed. See “Troubleshooting QoS and Traffic Descriptor Problems” on page 3-86 for more information.
3-647/17/03 NavisCore Troubleshooting Guide
Beta Draft ConfidentialTroubleshooting ATM Problems
Troubleshooting Point-to-Multipoint ATM PVCs
Root-to-Leaf Connection is Invalid
When the Oper Status is Invalid, it typically means that the module the PMP PVC uses on one of the switches is out of sync. Perform a PRAM sync to properly synchronize the module. See the NavisCore NMS Getting Started Guide for more information on performing a PRAM sync.
Root-to-Leaf Connection is Unknown
When the Oper Status is Unknown, it typically means that one of the root-to-leaf endpoint switches did not respond to an NMS request. In this case, the switch is red on the network map. When the NMS can reach the switch, the Oper Status returns to Active.
NTM Statistics and NDC Statistics for PMP PVCs
NTM and NDC provide you with statistics on point-to-point PVC and PMP PVC traffic. The PMP PVC statistics are for a selected root-to-leaf connection on the Show All Point-to-Multiple-Point Circuit Roots dialog box. Lucent has based the functional requirements for NTM and NDC on the Bellcore GR-1248 specification [GR1248]. See “NTM Statistics and NDC Statistics for Point-to-Point PVCs” on page 3-51 for more information.
NavisCore Troubleshooting Guide 7/17/033-65
Beta Draft ConfidentialTroubleshooting ATM ProblemsTroubleshooting Point-to-Multipoint ATM PVCs
Isolating PMP ATM PVC Problems
To isolate PMP PVC problems, view the information on the Show All Point-to-Multiple-Point Circuit Roots dialog box. Then, ask yourself the following questions:
• Is one PMP PVC down or are multiple PMP PVCs down? If only one circuit is down, you can narrow the problem to a specific circuit configuration issue, such as a circuit configuration problem with the switch.
• On a PMP PVC, are multiple root-to-leaf connections inactive, or is just a single root-to-leaf connection inactive? If multiple root-to-leaf connections are inactive, determine what all the connections have in common (for example, the switch at the connection root is a common denominator, a trunk that all the connections traverse is a common denominator, etc.). Knowing the common denominators will help you isolate the problem. If just a single connection is down, the problem may be at either the switch that acts as the root or the switch that acts as the leaf (or somewhere in the network in between).
• On a PMP PVC, if all root-to-leaf connections are inactive, start troubleshooting the problem at the root.
• If a root-to-leaf connection is active, but you notice excessive amounts of tagged and discarded cells on the Point-to-Multipoint Circuit Statistics dialog box, you may have to reconfigure the sustainable cell rate (SCR) traffic descriptor. See “Troubleshooting QoS and Traffic Descriptor Problems” on page 3-86 for more information.
Correcting PMP ATM PVC Problems
The actions you take to correct a PMP ATM PVC problem will vary, and may have nothing to do with the PMP PVC at all. You may have to resolve problems with the physical ports, logical ports, trunks, switches, and CPE that the PMP PVC traverses. See the earlier sections in this chapter for resolving those kinds of problems.
In other cases, you may have to reconfigure the PMP PVC. For example, you may have to reconfigure VPI values or traffic descriptors.
3-667/17/03 NavisCore Troubleshooting Guide
Beta Draft ConfidentialTroubleshooting ATM Problems
Troubleshooting Point-to-Point ATM SVCs and SPVCs
Troubleshooting Point-to-Point ATM SVCs and SPVCs
This section provides guidelines on troubleshooting point-to-point ATM SVCs and soft PVCs (SPVCs).
Because more things can go wrong with a point-to-point ATM SVC or SPVC than with a point-to-point ATM PVC, SVCs and SPVCs are more difficult to troubleshoot. Unlike a PVC, which is a permanent connection with provisioned network resources that is manually established by a service provider, an SVC and an SPVC are connections that CPE automatically establish through a call setup procedure. Whereas a PVC only experiences problems during data transmission, you can encounter SVC and SPVC problems both during the call setup procedure and during data transmission.
Overview of the ATM SVC and SPVC Call Setup Procedure
This section provides an overview of the call setup procedures for ATM SVCs and SPVCs.
ATM SVC Call Setup
ATM SVC calls cannot be setup unless SVC addresses are properly configured at both ends of the SVC. The NavisCore ATM Configuration Guide discusses SVC address configuration in detail.
Two common approaches to SVC address configuration are:
Address Registration — In order to establish an SVC, a UNI DTE device (that is, a user or customer) must register its address with a UNI DCE device (that is, the network service provider). Both the UNI DTE and UNI DCE devices must support the ILMI protocol. To form a complete SVC address, a UNI DCE device sends a network address prefix to a UNI DTE device which, in turn, forms a complete address by appending the user part of the address to the network prefix. The UNI DTE device then registers the complete address with the UNI DCE device. The UNI DCE device advertises registered addresses to the rest of the network.
Complete Address Configuration — If the UNI DTE device does not support the ILMI protocol, you can configure the complete SVC address at the UNI DCE device.
Figure 3-30 illustrates address registration. Note that this figure uses the ATM End System Addressing (AESA) form of SVC addressing.
Lucent switches can act as either the DTE or the DCE.
NavisCore Troubleshooting Guide 7/17/033-67
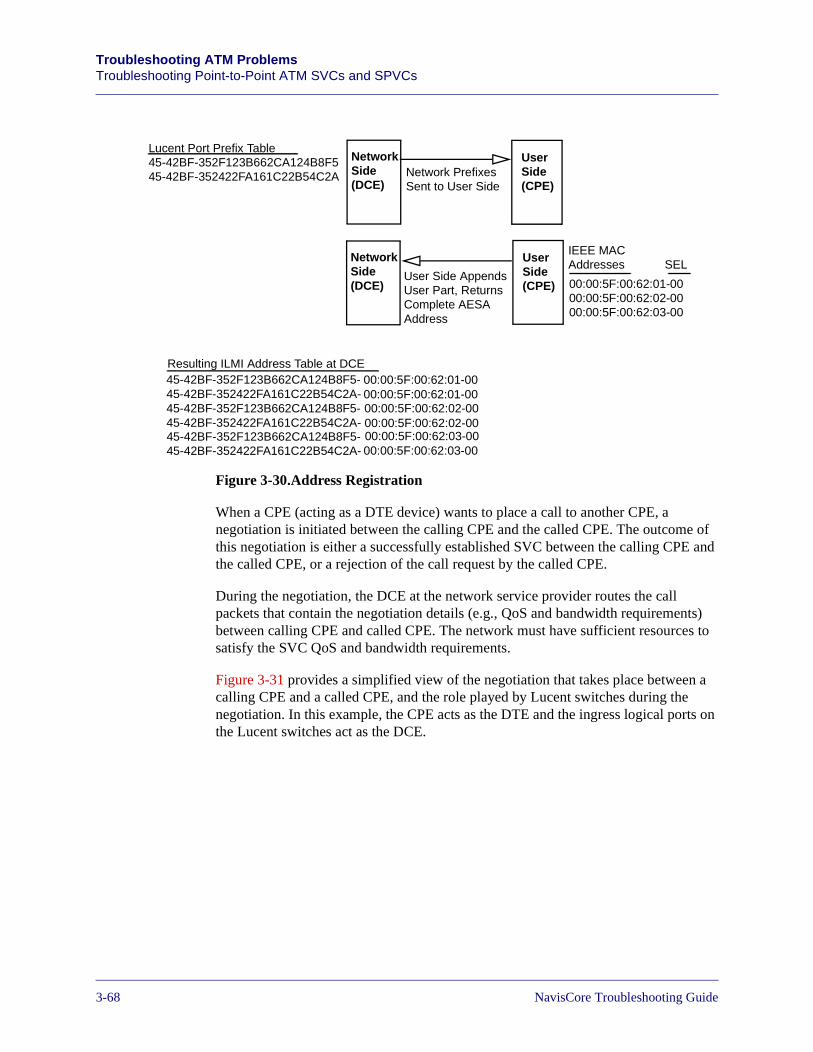
Beta Draft ConfidentialTroubleshooting ATM ProblemsTroubleshooting Point-to-Point ATM SVCs and SPVCs
Figure 3-30.Address Registration
When a CPE (acting as a DTE device) wants to place a call to another CPE, a negotiation is initiated between the calling CPE and the called CPE. The outcome of this negotiation is either a successfully established SVC between the calling CPE and the called CPE, or a rejection of the call request by the called CPE.
During the negotiation, the DCE at the network service provider routes the call packets that contain the negotiation details (e.g., QoS and bandwidth requirements) between calling CPE and called CPE. The network must have sufficient resources to satisfy the SVC QoS and bandwidth requirements.
Figure 3-31 provides a simplified view of the negotiation that takes place between a calling CPE and a called CPE, and the role played by Lucent switches during the negotiation. In this example, the CPE acts as the DTE and the ingress logical ports on the Lucent switches act as the DCE.
NetworkSide
IEEE MACAddresses SEL
00:00:5F:00:62:01-0000:00:5F:00:62:02-0000:00:5F:00:62:03-00
Lucent Port Prefix Table45-42BF-352F123B662CA124B8F545-42BF-352422FA161C22B54C2A Network Prefixes
Sent to User Side
User Side AppendsUser Part, ReturnsComplete AESAAddress
Resulting ILMI Address Table at DCE45-42BF-352F123B662CA124B8F5-45-42BF-352422FA161C22B54C2A-
00:00:5F:00:62:01-0000:00:5F:00:62:01-00
45-42BF-352F123B662CA124B8F5-45-42BF-352422FA161C22B54C2A-45-42BF-352F123B662CA124B8F5-45-42BF-352422FA161C22B54C2A-
00:00:5F:00:62:02-0000:00:5F:00:62:02-0000:00:5F:00:62:03-0000:00:5F:00:62:03-00
NetworkSide
UserSide
UserSide
(DCE) (CPE)
(DCE) (CPE)
3-687/17/03 NavisCore Troubleshooting Guide
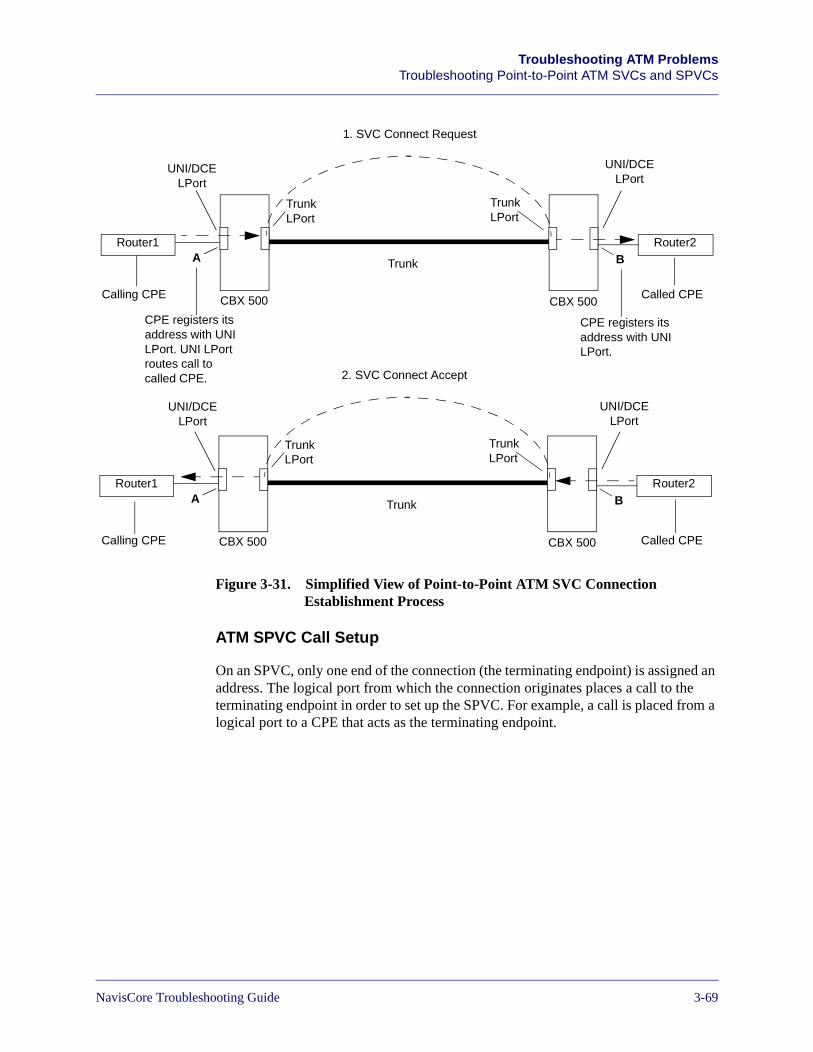
Beta Draft ConfidentialTroubleshooting ATM Problems
Troubleshooting Point-to-Point ATM SVCs and SPVCs
Figure 3-31. Simplified View of Point-to-Point ATM SVC ConnectionEstablishment Process
ATM SPVC Call Setup
On an SPVC, only one end of the connection (the terminating endpoint) is assigned an address. The logical port from which the connection originates places a call to the terminating endpoint in order to set up the SPVC. For example, a call is placed from a logical port to a CPE that acts as the terminating endpoint.
Router2Router1
1. SVC Connect Request
Trunk
CBX 500 CBX 500
A B
TrunkLPort
TrunkLPort
UNI/DCELPort
Router2Router1
2. SVC Connect Accept
Trunk
CBX 500 CBX 500
A B
TrunkLPort
TrunkLPort
Calling CPE Called CPE
Calling CPE Called CPE
CPE registers its address with UNI LPort. UNI LPort routes call to called CPE.
CPE registers its address with UNI LPort.
UNI/DCELPort
UNI/DCELPort
UNI/DCELPort
NavisCore Troubleshooting Guide 7/17/033-69
Beta Draft ConfidentialTroubleshooting ATM ProblemsTroubleshooting Point-to-Point ATM SVCs and SPVCs
Identifying Point-to-Point ATM SVC and SPVC Problems
You identify ATM SVC and SPVC problems through:
• Traps
• Customer complaints
Point-to-Point ATM SVC and SPVC Traps
Traps are the only SVC and SPVC problem indicators available through NavisCore. Switches generate traps when events that effect SVCs and SPVCs occur.
The following trap is very important:
SVC failure threshold has been exceeded on LPort LPort name at switch switch name
This trap indicates that the number of ATM SVC and SPVC failures that have occurred on the specified logical port has exceeded the port’s configured Trap Failure Threshold. See the NavisCore ATM Configuration Guide for more information on configuring this threshold.
For more information about traps, see the NavisCore Diagnostics Guide
The default value of this threshold is 1 failure every 15 minutes (meaning that if 1 failure occurs in a 15-minute period, a trap is sent). If more than one failure occurs, another trap is not displayed for another 15 minutes.
Write down the logical port name and switch name specified in the trap. Then, use the Show All Failed SVCs dialog box to view specific information about SVC and SPVC failures. See “Verifying Point-to-Point ATM SVC and SPVC Problems” on page 3-71 for more information.
Although the trap message does not mention SPVCs specifically, the trap applies to both SVCs and SPVCs.
3-707/17/03 NavisCore Troubleshooting Guide
Beta Draft ConfidentialTroubleshooting ATM Problems
Troubleshooting Point-to-Point ATM SVCs and SPVCs
Customer Complaints
When you receive a customer complaint, gather as much information as possible to speed up the recovery time. Then, ask yourself the following questions:
• Are the SVCs and SPVCs being established in the first place? If not, you know that call setup attempts are failing. If the SVCs and SPVCs are being established, you know that problems other than those related to call setup are occurring, such as network congestion that is hampering the flow of data on the circuit.
• Do multiple customers have SVCs and SPVCs on the same physical port? Are they all encountering the same problem? If so, a potential physical port problem exists. See “Troubleshooting ATM Physical Ports” on page 3-2 for more information.
Verifying Point-to-Point ATM SVC and SPVC Problems
The way in which you verify ATM SVC and SPVC problems depends on how you identified the problem. In general, ATM SVC and SPVC problems fall into two categories:
Call setup problems — Problems that prevent SVC and SPVC establishment.
Data transmission problems on active SVCs and SPVCs — Problems that prevent proper data transmission on successfully established SVCs and SPVCs.
Verifying Point-to-Point ATM SVC and SPVC Call Setup Problems
The Show All Failed SVCs dialog box helps you to troubleshoot both point-to-point SVC and point-to-point SPVC call setup problems. This dialog box displays all of the SVCs and SPVCs on a selected logical port that could not be established due to call failures.
1. From the Monitor menu, select Lucent Objects ⇒ Show All SVC Parameters ⇒ Show All Failed SVCs. The Show All Failed SVCs dialog box appears (see Figure 3-32).
NavisCore Troubleshooting Guide 7/17/033-71
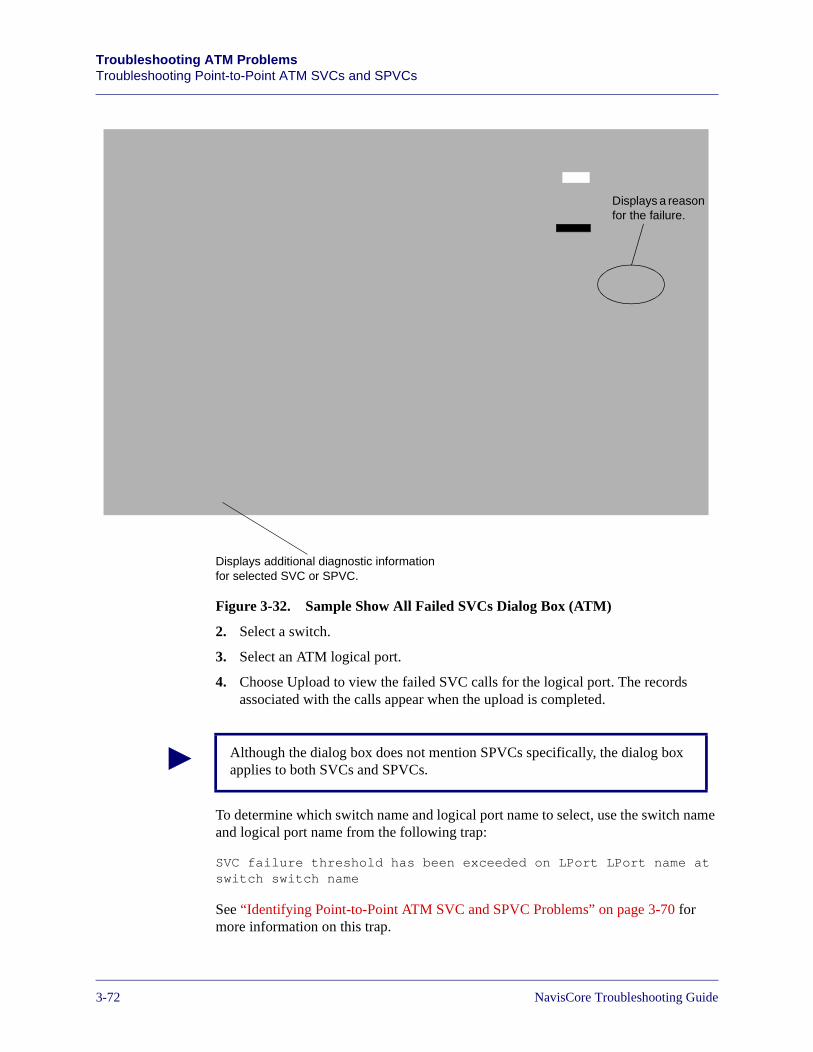
Beta Draft ConfidentialTroubleshooting ATM ProblemsTroubleshooting Point-to-Point ATM SVCs and SPVCs
Figure 3-32. Sample Show All Failed SVCs Dialog Box (ATM)
2. Select a switch.
3. Select an ATM logical port.
4. Choose Upload to view the failed SVC calls for the logical port. The records associated with the calls appear when the upload is completed.
To determine which switch name and logical port name to select, use the switch name and logical port name from the following trap:
SVC failure threshold has been exceeded on LPort LPort name at switch switch name
See “Identifying Point-to-Point ATM SVC and SPVC Problems” on page 3-70 for more information on this trap.
Displays additional diagnostic information for selected SVC or SPVC.
Displays a reason for the failure.
Although the dialog box does not mention SPVCs specifically, the dialog box applies to both SVCs and SPVCs.
3-727/17/03 NavisCore Troubleshooting Guide
Beta Draft ConfidentialTroubleshooting ATM Problems
Troubleshooting Point-to-Point ATM SVCs and SPVCs
The Cause Code field displays a reason for the call failure. Cause codes are described in the NavisCore Diagnostics Guide. Examples of failure reasons include:
No user response — A called party did not respond to a call establishment message with either an alerting or connect indication within a designated time period.
Network is out of order — The problem will probably last a long period of time (that is, an immediate retry of the call is not likely to succeed).
Invalid number format — The called party is unreachable because the number of the called party is not in the proper format or it is incomplete. Check to see if SVC addresses are configured correctly. See the NavisCore ATM Configuration Guide for more information.
User is busy — The called party is unable to accept another call because the user busy condition has been encountered.
No route to destination — The network through which the call was routed does not serve the destination. As a result, the called party cannot be reached.
User cell rate is unavailable — The requested cell rate is unavailable for the ATM SVC.
Quality of Service is unavailable — The requested QoS class is unavailable for the SVC. The network may not be able to meet the SVC’s QoS requirements.
Requested VPCI/VCI is unavailable — The ATM SVC attempted to use a VPCI/VCI that is unavailable.
To display additional diagnostic information, select an SVC or SPVC and choose Show Attributes. The Show Failed SVC Attributes dialog box appears (see Figure 3-33).
NavisCore Troubleshooting Guide 7/17/033-73
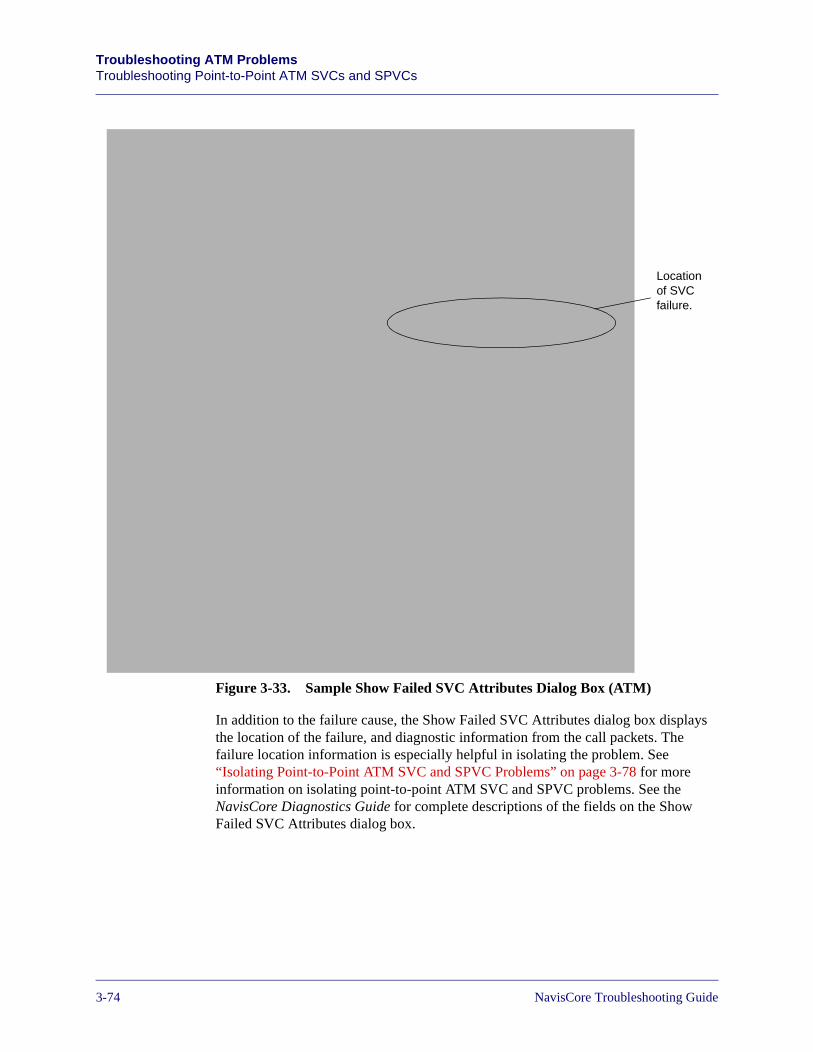
Beta Draft ConfidentialTroubleshooting ATM ProblemsTroubleshooting Point-to-Point ATM SVCs and SPVCs
Figure 3-33. Sample Show Failed SVC Attributes Dialog Box (ATM)
In addition to the failure cause, the Show Failed SVC Attributes dialog box displays the location of the failure, and diagnostic information from the call packets. The failure location information is especially helpful in isolating the problem. See “Isolating Point-to-Point ATM SVC and SPVC Problems” on page 3-78 for more information on isolating point-to-point ATM SVC and SPVC problems. See the NavisCore Diagnostics Guide for complete descriptions of the fields on the Show Failed SVC Attributes dialog box.
Location of SVC failure.
3-747/17/03 NavisCore Troubleshooting Guide
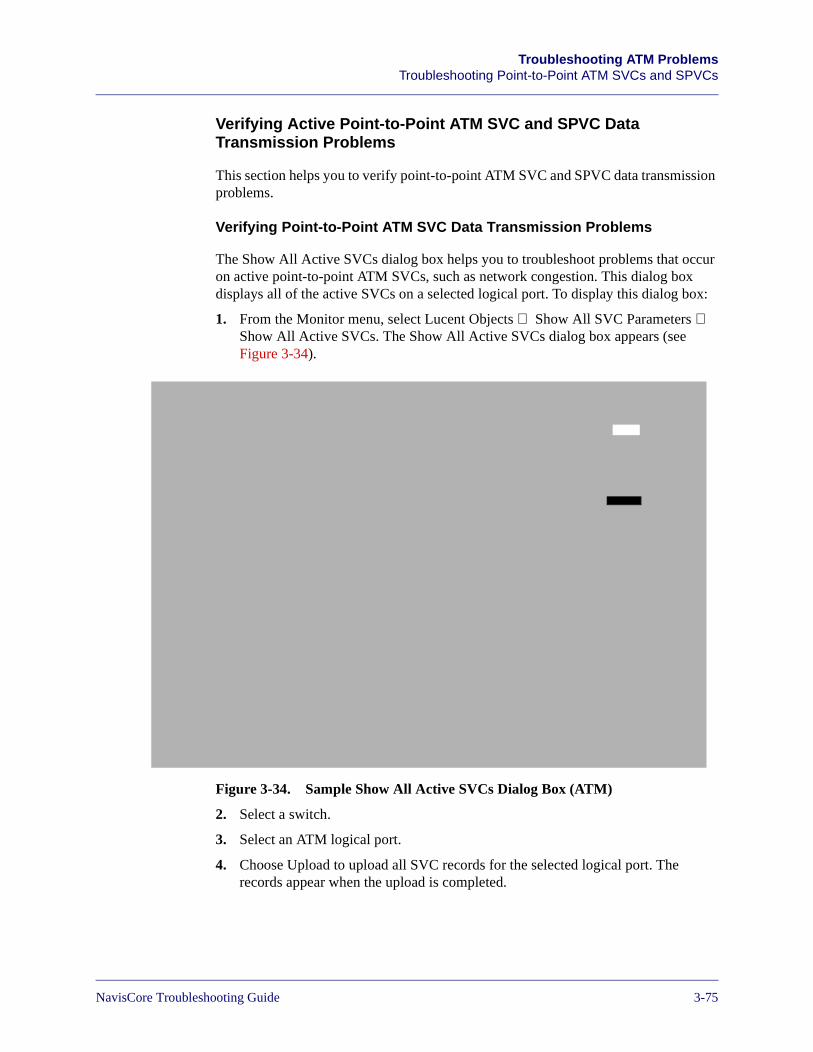
Beta Draft ConfidentialTroubleshooting ATM Problems
Troubleshooting Point-to-Point ATM SVCs and SPVCs
Verifying Active Point-to-Point ATM SVC and SPVC DataTransmission Problems
This section helps you to verify point-to-point ATM SVC and SPVC data transmission problems.
Verifying Point-to-Point ATM SVC Data Transmission Problems
The Show All Active SVCs dialog box helps you to troubleshoot problems that occur on active point-to-point ATM SVCs, such as network congestion. This dialog box displays all of the active SVCs on a selected logical port. To display this dialog box:
1. From the Monitor menu, select Lucent Objects ⇒ Show All SVC Parameters ⇒ Show All Active SVCs. The Show All Active SVCs dialog box appears (see Figure 3-34).
Figure 3-34. Sample Show All Active SVCs Dialog Box (ATM)
2. Select a switch.
3. Select an ATM logical port.
4. Choose Upload to upload all SVC records for the selected logical port. The records appear when the upload is completed.
NavisCore Troubleshooting Guide 7/17/033-75
Beta Draft ConfidentialTroubleshooting ATM ProblemsTroubleshooting Point-to-Point ATM SVCs and SPVCs
The Show Attributes button and Statistics button allow you to display attributes and statistics for an SVC you select from the list of active SVCs. SVC attributes provide the address of the calling party and the called party, and provide location information on the switches, physical ports, and logical ports that the SVC traverses. SVC statistics are similar to PVC statistics.
Verifying problems on active point-to-point ATM SVCs is similar to verifying problems on active point-to-point ATM PVCs. Point-to-point ATM SVC statistics are the same as point-to-point ATM PVC statistics. See “Verifying Point-to-Point ATM PVC Problems” on page 3-42 for more information.
Verifying Point-to-Point ATM SPVC Data Transmission Problems
The Show All Point-to-Point SPVCs dialog box helps you to troubleshoot problems that occur on active point-to-point SPVCs, such as network congestion. This dialog box displays all of the active and failed SPVCs in the network. To display this dialog box:
1. From the Monitor menu, select Lucent Objects ⇒ Show All Soft PVC Parameters ⇒ Point-to-Point. The Show All Point-to-Point SPVCs dialog box appears (see Figure 3-35).
3-767/17/03 NavisCore Troubleshooting Guide
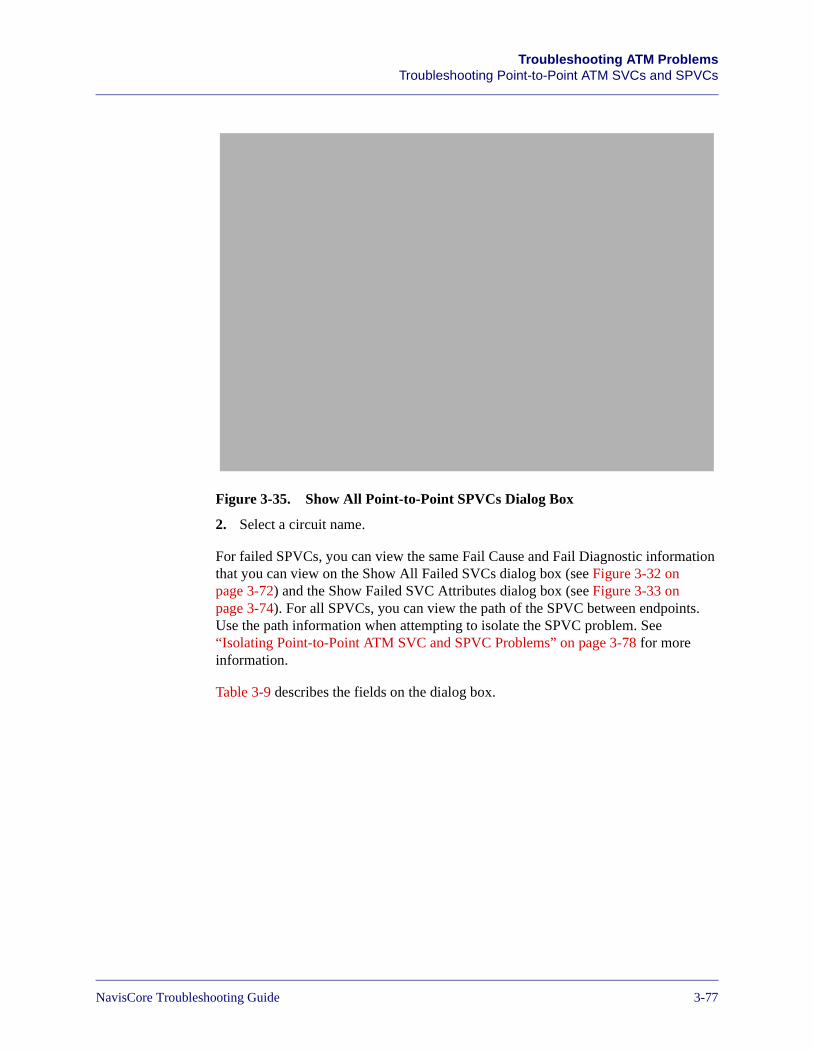
Beta Draft ConfidentialTroubleshooting ATM Problems
Troubleshooting Point-to-Point ATM SVCs and SPVCs
Figure 3-35. Show All Point-to-Point SPVCs Dialog Box
2. Select a circuit name.
For failed SPVCs, you can view the same Fail Cause and Fail Diagnostic information that you can view on the Show All Failed SVCs dialog box (see Figure 3-32 on page 3-72) and the Show Failed SVC Attributes dialog box (see Figure 3-33 on page 3-74). For all SPVCs, you can view the path of the SPVC between endpoints. Use the path information when attempting to isolate the SPVC problem. See “Isolating Point-to-Point ATM SVC and SPVC Problems” on page 3-78 for more information.
Table 3-9 describes the fields on the dialog box.
NavisCore Troubleshooting Guide 7/17/033-77
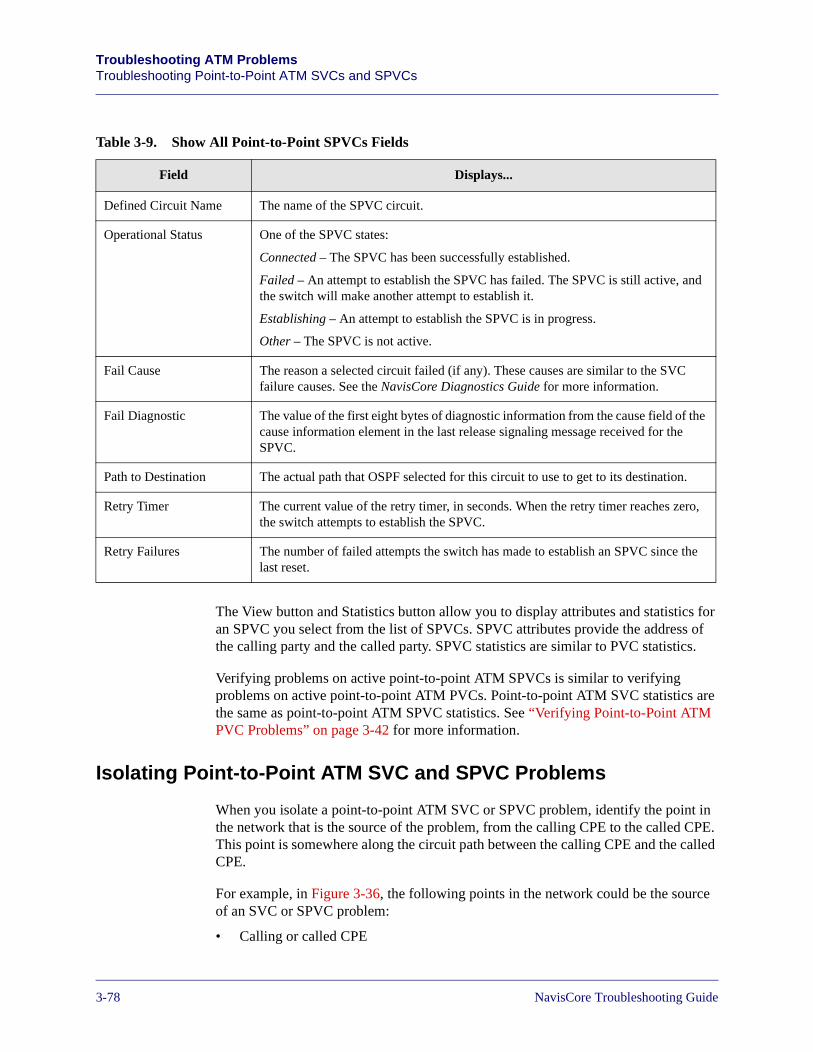
Beta Draft ConfidentialTroubleshooting ATM ProblemsTroubleshooting Point-to-Point ATM SVCs and SPVCs
The View button and Statistics button allow you to display attributes and statistics for an SPVC you select from the list of SPVCs. SPVC attributes provide the address of the calling party and the called party. SPVC statistics are similar to PVC statistics.
Verifying problems on active point-to-point ATM SPVCs is similar to verifying problems on active point-to-point ATM PVCs. Point-to-point ATM SVC statistics are the same as point-to-point ATM SPVC statistics. See “Verifying Point-to-Point ATM PVC Problems” on page 3-42 for more information.
Isolating Point-to-Point ATM SVC and SPVC Problems
When you isolate a point-to-point ATM SVC or SPVC problem, identify the point in the network that is the source of the problem, from the calling CPE to the called CPE. This point is somewhere along the circuit path between the calling CPE and the called CPE.
For example, in Figure 3-36, the following points in the network could be the source of an SVC or SPVC problem:
• Calling or called CPE
Table 3-9. Show All Point-to-Point SPVCs Fields
Field Displays...
Defined Circuit Name The name of the SPVC circuit.
Operational Status One of the SPVC states:
Connected – The SPVC has been successfully established.
Failed – An attempt to establish the SPVC has failed. The SPVC is still active, and the switch will make another attempt to establish it.
Establishing – An attempt to establish the SPVC is in progress.
Other – The SPVC is not active.
Fail Cause The reason a selected circuit failed (if any). These causes are similar to the SVC failure causes. See the NavisCore Diagnostics Guide for more information.
Fail Diagnostic The value of the first eight bytes of diagnostic information from the cause field of the cause information element in the last release signaling message received for the SPVC.
Path to Destination The actual path that OSPF selected for this circuit to use to get to its destination.
Retry Timer The current value of the retry timer, in seconds. When the retry timer reaches zero, the switch attempts to establish the SPVC.
Retry Failures The number of failed attempts the switch has made to establish an SPVC since the last reset.
3-787/17/03 NavisCore Troubleshooting Guide
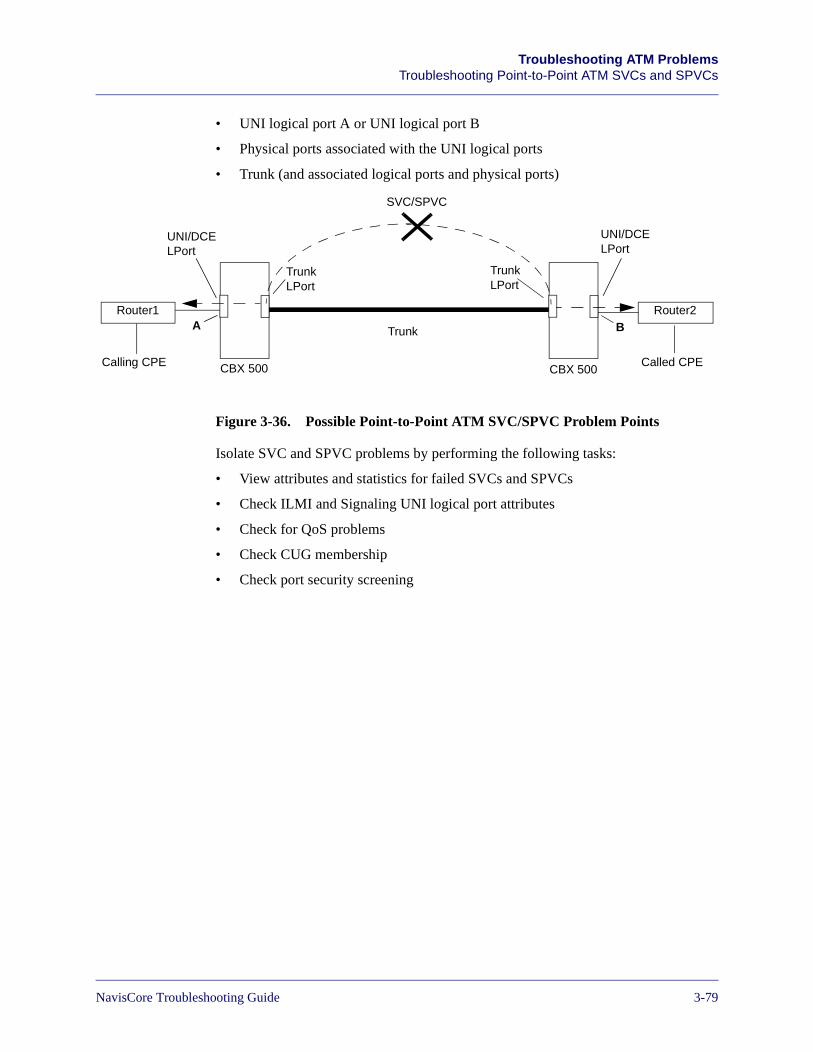
Beta Draft ConfidentialTroubleshooting ATM Problems
Troubleshooting Point-to-Point ATM SVCs and SPVCs
• UNI logical port A or UNI logical port B
• Physical ports associated with the UNI logical ports
• Trunk (and associated logical ports and physical ports)
Figure 3-36. Possible Point-to-Point ATM SVC/SPVC Problem Points
Isolate SVC and SPVC problems by performing the following tasks:
• View attributes and statistics for failed SVCs and SPVCs
• Check ILMI and Signaling UNI logical port attributes
• Check for QoS problems
• Check CUG membership
• Check port security screening
Router2Router1
SVC/SPVC
Trunk
CBX 500 CBX 500
A B
TrunkLPort
TrunkLPort
UNI/DCELPort
Calling CPE Called CPE
UNI/DCELPort
NavisCore Troubleshooting Guide 7/17/033-79
Beta Draft ConfidentialTroubleshooting ATM ProblemsTroubleshooting Point-to-Point ATM SVCs and SPVCs
View Attributes and Statistics for Failed ATM SVCs and SPVCs
Begin the problem isolation process by viewing attributes for the failed or active SVCs or SPVCs. See “Verifying Point-to-Point ATM SVC and SPVC Problems” on page 3-71 for more information.
For failed SVCs and SPVCs, the following attributes prove especially useful for problem isolation:
• Addresses of the calling party and the called party. Use these addresses to identify the calling CPE and the called CPE.
• Failure cause and diagnostic information that describe the reason for the failure.
• Failure location information, which helps you identify the point in the network (along the circuit path) where the failure occurred.
For active SVCs and SPVCs, the following attributes prove especially useful for problem isolation:
• Addresses of the calling party and the called party.
• SVC and SPVC location and destination information, which helps you identify the switches, physical ports, logical ports, and path that the SVC and SPVC traverses.
In addition, for active SVCs and SPVCs, you can use the SVC Summary Statistics dialog box to both verify and isolate problems. The SVC Summary Statistics dialog box provides the same statistics as the Circuit Summary Statistics dialog box for PVCs (see Figure 3-22 on page 3-46).
You can also use OAM loopback tests to isolate the problem, just as you can use OAM loopback tests to isolate problems on point-to-point ATM PVCs. See “Isolating Point-to-Point ATM PVC Problems” on page 3-53 for more information on OAM.
3-807/17/03 NavisCore Troubleshooting Guide
Beta Draft ConfidentialTroubleshooting ATM Problems
Troubleshooting Point-to-Point ATM SVCs and SPVCs
Checking ILMI and Signaling UNI Logical Port Attributes
Check to see if the ILMI and Signaling logical port attributes are configured properly. Keep in mind that address registration cannot function properly if ILMI and Signaling logical port attributes are not properly configured.
The ILMI and Signaling logical port attributes are visible on Show All Logical Ports in Switch dialog box. See “Verifying ILMI Problems” on page 3-23 instructions on how to view these attributes.
Check ILMI Admin Status and Oper Status as well as Signaling Admin Status and Oper Status. If ILMI or Signaling Admin Status is Disabled, chances are that you have found the source of the SVC call setup failure. Set the ILMI or Signaling Admin Status to Enabled.
If ILMI or Signaling Oper Status remains Down after you enable Admin Status, check other ILMI and Signaling configuration parameters. For example, a common cause of ILMI problems is misconfigured polling periods. The polling periods configured on the DTE and DCE should be synchronized. Otherwise, the link may go down. For example, suppose that the polling period configured at the DTE is 30 seconds, and the polling period configured at the DCE is five seconds. This means that the DTE polls the DCE every 30 seconds, but the DCE is expecting a poll from the DTE every five seconds. When the DCE does not receive a poll every five seconds — due to the fact that the DTE sends a poll every 30 seconds — the DCE will consider the link to be down when the loss threshold is exceeded. In this example, correct the problem by configuring both polling periods to be five seconds.
Check for QoS Problems
If the cause codes indicate that the calls are not being established due to the network’s failure to meet QoS requirements (see the NavisCore Diagnostics Guide for cause code descriptions), disable the User UPC Function and the Control UPC Function on the ATM UNI logical port where the failures are occurring. When you disable these parameters, cells will not be discarded if they do not conform to the configured QoS and traffic descriptors. See the NavisCore ATM Configuration Guide for more information on disabling the User UPC Function and Control UPC Function attributes and on configuring traffic descriptors.
If calls establish once you disable the User UPC Function and the Control UPC Function, the problem is QoS-related. Check the configured QoS class and traffic descriptors for the SVC. If the network cannot meet the requirements of the traffic descriptors, reconfigure them. See “Troubleshooting QoS and Traffic Descriptor Problems” on page 3-86 for more information.
NavisCore Troubleshooting Guide 7/17/033-81
Beta Draft ConfidentialTroubleshooting ATM ProblemsTroubleshooting Point-to-Point ATM SVCs and SPVCs
Check ATM SVC CUG Membership
If a called node repeatedly rejects calls from a calling node, the rejection could result from the called node’s membership in a Closed User Group (CUG).
If the calling node does not belong to the called node’s CUG, then the called node will reject the call. This may not be a problem, depending on your network security requirements.
Check the CUG membership of the calling node and the called node. Depending on network security requirements, reconfigure CUG membership to allow the calling node to call the called node, or leave the current CUG membership unchanged.
See the NavisCore ATM Configuration Guide for more information on configuring CUG membership.
Check ATM SVC Port Security Screening
Call attempts may not complete due to port security screening, which can block SVC call setup attempts at either ingress or egress logical ports. This may not be a problem, depending on your network security requirements.
Check the port security screen configuration at ingress and egress logical ports. Depending on network security requirements, reconfigure port security screens so that call setup attempts are no longer blocked, or leave the current port security screen configuration unchanged.
See the NavisCore ATM Configuration Guide for more information on configuring port security screens.
Correcting Point-to-Point ATM SVC and SPVC Problems
The actions you take to correct a point-to-point ATM SVC or SPVC problem will vary, and may have nothing to do with the SVC or SPVC at all. You may have to resolve problems with the physical ports, logical ports, trunks, switches, and CPE that the SVC or SPVC traverses. See the earlier sections in this chapter for information on resolving physical port, logical port, and trunk problems.
A significant number of failed SVCs or SPVCs on a specific logical port may indicate that the logical port is oversubscribed. Consider off-loading some of the SVC or SPVC calls on to other logical ports. See the NavisCore ATM Configuration Guide for details on configuring logical ports for SVCs.
3-827/17/03 NavisCore Troubleshooting Guide
Beta Draft ConfidentialTroubleshooting ATM Problems
Troubleshooting PMP ATM SVCs and SPVCs Problems
Troubleshooting PMP ATM SVCs and SPVCs Problems
This section provides guidelines on troubleshooting point-to-multipoint (PMP) ATM SVCs and SPVCs. On a PMP ATM SVC or SPVC, multiple switches share a common circuit in a root-to-leaf topology. A single switch at the root of the circuit has connections to multiple switches at the leaves of the circuit.
PMP ATM SVCs and SPVCs are similar to PMP ATM PVCs, with one major exception: whereas root-to-leaf connections on a PMP ATM PVC are established manually by network managers, PMP ATM SVCs and SPVCs must perform a call setup procedure for each root-to-leaf connection.
To troubleshoot PMP ATM SVCs and SPVCs, you first need to know how to identify root-to-leaf connections. See “Identifying PMP ATM SVC Root-to-Leaf Connections” on page 3-84 and “Identifying PMP ATM SPVC Root-to-Leaf Connections” on page 3-85 for details.
Once you understand how to identify PMP ATM SVC and SPVC root-to-leaf connections, use a combination of the following troubleshooting guidelines:
• Guidelines for troubleshooting point-to-point ATM SVC and SPVC call setup problems. Call setup procedures for establishing PMP ATM SVC or SPVC root-to-leaf connections are similar to the call setup procedures for establishing point-to-point ATM SVC or SPVC connections between endpoint nodes. See “Troubleshooting Point-to-Point ATM SVCs and SPVCs” on page 3-67.
• Guidelines for troubleshooting PMP ATM PVCs. Troubleshooting problems with successfully established SVC and SPVC root-to-leaf connections are similar to troubleshooting problems with PMP ATM PVCs. See “Troubleshooting Point-to-Multipoint ATM PVCs” on page 3-59 for more information.
NavisCore Troubleshooting Guide 7/17/033-83
Beta Draft ConfidentialTroubleshooting ATM ProblemsTroubleshooting PMP ATM SVCs and SPVCs Problems
Identifying PMP ATM SVC Root-to-Leaf Connections
Use the End Ref field on the Show All Failed SVCs dialog box (see Figure 3-32 on page 3-72) to identify failed PMP ATM SVC root-to-leaf connection attempts. For failed root-to-leaf connection attempts, the End Ref field displays a number that identifies a leaf endpoint. The address of the endpoint appears in the Called Party Address field.
The End Ref field on the Show All Failed SVCs dialog box displays a dash (-) for failed point-to-point ATM SVC connection attempts.
Use the End Ref field on the Show All Active SVCs dialog box (see Figure 3-34 on page 3-75) to identify active PMP ATM SVC root-to-leaf connections. For active root-to-leaf connections, the End Ref field displays a number that identifies a leaf endpoint. The address of the endpoint appears in the Called Party Address field.
The End Ref field on the Show All Active SVCs dialog box displays a dash (-) for active point-to-point ATM SVCs.
The End Ref field on the Show All Failed SVCs dialog box and the Show All Active SVCs dialog box can also be used to identify PMP ATM SPVC leaf endpoints. However, an easier way to identify PMP ATM SPVC leaf endpoints is described in “Identifying PMP ATM SPVC Root-to-Leaf Connections.”
3-847/17/03 NavisCore Troubleshooting Guide
Beta Draft ConfidentialTroubleshooting ATM Problems
Troubleshooting PMP ATM SVCs and SPVCs Problems
Identifying PMP ATM SPVC Root-to-Leaf Connections
The Show All Point-to-Multipoint SPVCs dialog box displays all of the PMP SPVC circuits and their associated leaves. To access this dialog box:
1. From the Monitor menu, select Lucent Objects ⇒ Show All Soft PVCs ⇒ Point-to-Multipoint. The Show All Point-to-Multipoint SPVCs dialog box appears (see Figure 3-37).
Figure 3-37. Show All Point-to-Multipoint SPVCs Dialog Box
2. Select the name of the circuit for which you want to retrieve status information. The leaves appear in the SPVC Leaves list.
The fields that appear on the Show All Point-to-Multipoint SPVCs dialog box are the same as the fields on the Show All Point-to-Point SPVCs dialog box (see Figure 3-35 on page 3-77), except for the following fields:
SPVC Leaves — Lists SPVC leaf associated with the selected circuit.
Admin Status — Displays a value of Up or Down to indicate the Admin Status of the circuit.
If the circuit names do not appear immediately in the Defined Circuit Name list box, insert the cursor in the blank Search by Name field and press Return. This action will cause a list of configured circuits to display.
NavisCore Troubleshooting Guide 7/17/033-85

Beta Draft ConfidentialTroubleshooting ATM ProblemsTroubleshooting QoS and Traffic Descriptor Problems
Troubleshooting QoS and Traffic Descriptor Problems
This section describes three common QoS and traffic descriptor problems that apply to all types of ATM circuits:
• Wrong choice of QoS class
• Improperly configured PCR, SCR, and MBS
• Improperly configured cell delay variation (CDV) tolerance
Wrong Choice of QoS Class
The QoS class that you configure for a given circuit should be appropriate for the type of traffic that the circuit handles. Otherwise, images, audio, and so on can become scrambled.
The International Telecommunications Union-Telecommunications Sub-section (ITU-T) has defined certain QoS classifications based on how bits are transmitted, the required bandwidth, and the types of connections required. Lucent supports the following QoS classifications for ATM:
Class A (Constant Bit Rate (CBR)) — Connection-oriented, constant bit rate data with a timing relationship between source and destination, for example, digital voice. With circuits that support CBR, the data rate does not change (for example, no bursting or rate averaging occurs).
Class B (Variable Bit Rate Real-Time (VBRrt)) — Connection-oriented, variable bit-rate video and audio with a timing relationship between source and destination, for example, real-time video. Keep in mind that real-time video traffic can burst. When images are static (e.g., a person standing still), the data rate is slow. However, when images move (e.g., a person makes a sudden movement), the data rate increases.
Class C (Variable Bit Rate Non-Real Time (VBRnrt)) — Connection-oriented, variable bit-rate with no timing relationship between source and destination.
Class D (Unavailable Bit Rate/Available Bit Rate (UBR/ABR)) — Connectionless, variable bit-rate data with no timing relationship between source and destination, for example e-mail or HTTP traffic.
3-867/17/03 NavisCore Troubleshooting Guide
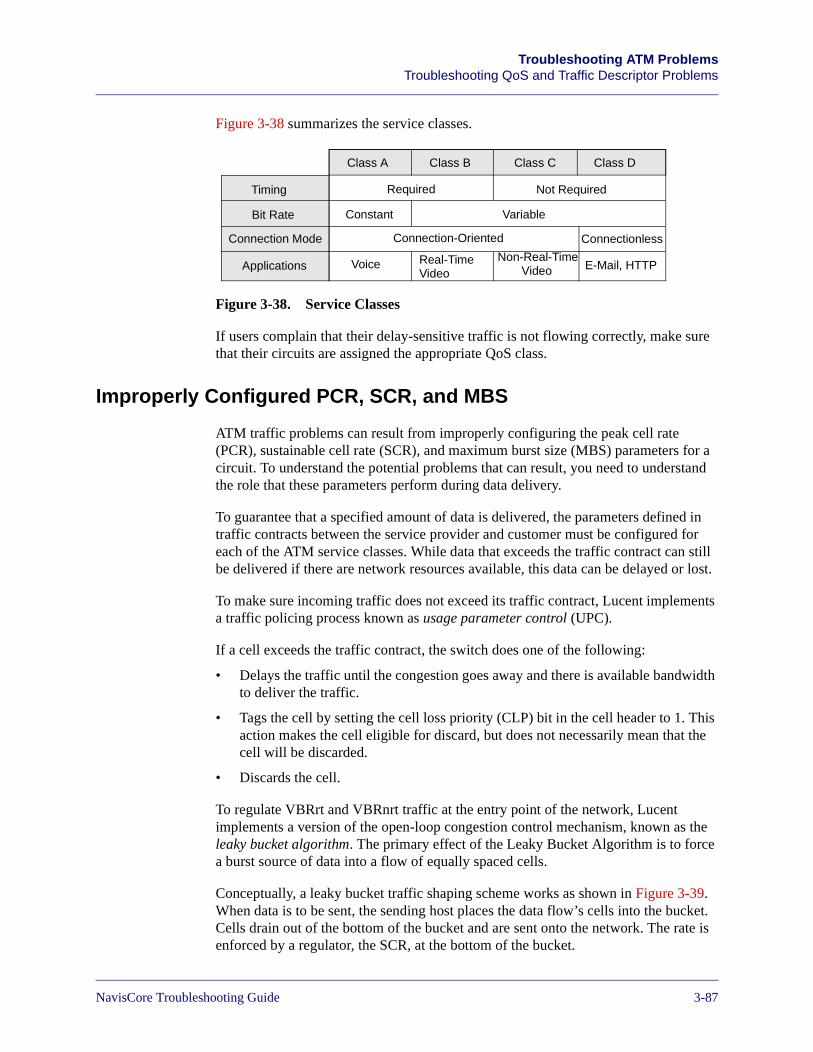
Beta Draft ConfidentialTroubleshooting ATM Problems
Troubleshooting QoS and Traffic Descriptor Problems
Figure 3-38 summarizes the service classes.
Figure 3-38. Service Classes
If users complain that their delay-sensitive traffic is not flowing correctly, make sure that their circuits are assigned the appropriate QoS class.
Improperly Configured PCR, SCR, and MBS
ATM traffic problems can result from improperly configuring the peak cell rate (PCR), sustainable cell rate (SCR), and maximum burst size (MBS) parameters for a circuit. To understand the potential problems that can result, you need to understand the role that these parameters perform during data delivery.
To guarantee that a specified amount of data is delivered, the parameters defined in traffic contracts between the service provider and customer must be configured for each of the ATM service classes. While data that exceeds the traffic contract can still be delivered if there are network resources available, this data can be delayed or lost.
To make sure incoming traffic does not exceed its traffic contract, Lucent implements a traffic policing process known as usage parameter control (UPC).
If a cell exceeds the traffic contract, the switch does one of the following:
• Delays the traffic until the congestion goes away and there is available bandwidth to deliver the traffic.
• Tags the cell by setting the cell loss priority (CLP) bit in the cell header to 1. This action makes the cell eligible for discard, but does not necessarily mean that the cell will be discarded.
• Discards the cell.
To regulate VBRrt and VBRnrt traffic at the entry point of the network, Lucent implements a version of the open-loop congestion control mechanism, known as the leaky bucket algorithm. The primary effect of the Leaky Bucket Algorithm is to force a burst source of data into a flow of equally spaced cells.
Conceptually, a leaky bucket traffic shaping scheme works as shown in Figure 3-39. When data is to be sent, the sending host places the data flow’s cells into the bucket. Cells drain out of the bottom of the bucket and are sent onto the network. The rate is enforced by a regulator, the SCR, at the bottom of the bucket.
Class A Class B Class C Class D
Required Not RequiredTiming
Connection Mode
Applications
Constant Variable
Connection-Oriented Connectionless
Voice Real-Time Non-Real-TimeE-Mail, HTTP
Bit Rate
Video Video
NavisCore Troubleshooting Guide 7/17/033-87
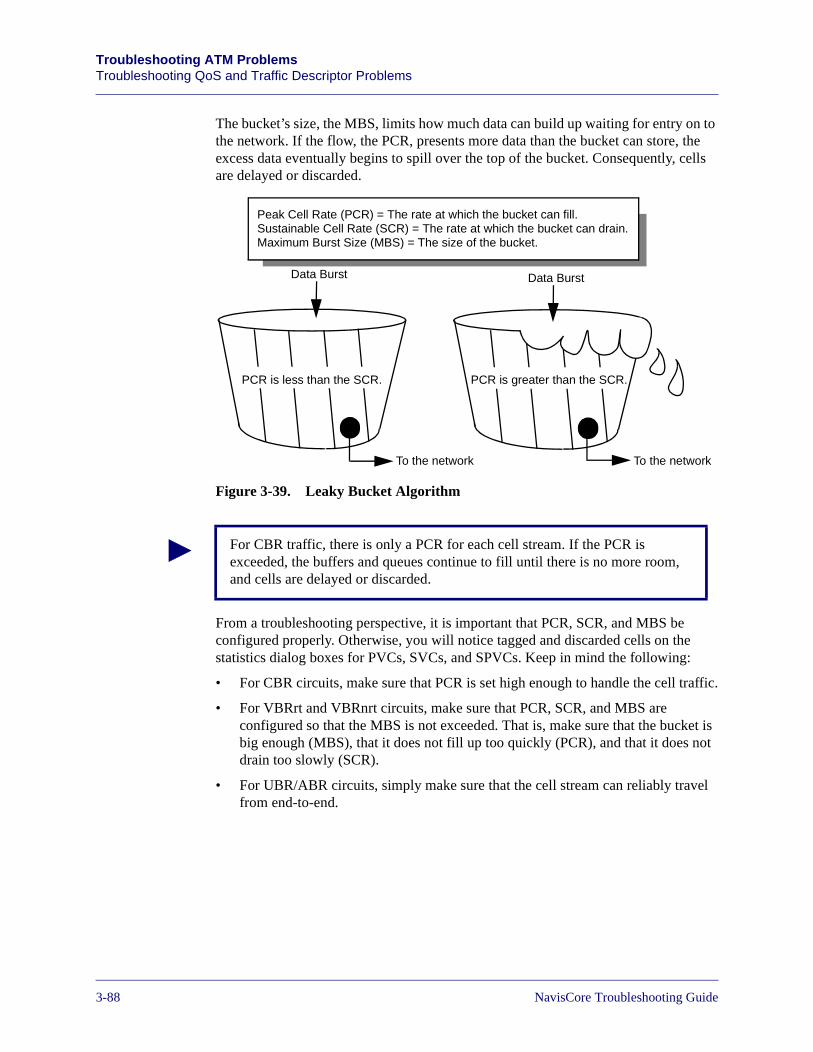
Beta Draft ConfidentialTroubleshooting ATM ProblemsTroubleshooting QoS and Traffic Descriptor Problems
The bucket’s size, the MBS, limits how much data can build up waiting for entry on to the network. If the flow, the PCR, presents more data than the bucket can store, the excess data eventually begins to spill over the top of the bucket. Consequently, cells are delayed or discarded.
Figure 3-39. Leaky Bucket Algorithm
From a troubleshooting perspective, it is important that PCR, SCR, and MBS be configured properly. Otherwise, you will notice tagged and discarded cells on the statistics dialog boxes for PVCs, SVCs, and SPVCs. Keep in mind the following:
• For CBR circuits, make sure that PCR is set high enough to handle the cell traffic.
• For VBRrt and VBRnrt circuits, make sure that PCR, SCR, and MBS are configured so that the MBS is not exceeded. That is, make sure that the bucket is big enough (MBS), that it does not fill up too quickly (PCR), and that it does not drain too slowly (SCR).
• For UBR/ABR circuits, simply make sure that the cell stream can reliably travel from end-to-end.
Data Burst
To the network
PCR is less than the SCR.
To the network
PCR is greater than the SCR.
Data Burst
Peak Cell Rate (PCR) = The rate at which the bucket can fill.Sustainable Cell Rate (SCR) = The rate at which the bucket can drain.Maximum Burst Size (MBS) = The size of the bucket.
For CBR traffic, there is only a PCR for each cell stream. If the PCR is exceeded, the buffers and queues continue to fill until there is no more room, and cells are delayed or discarded.
3-887/17/03 NavisCore Troubleshooting Guide
Beta Draft ConfidentialTroubleshooting ATM Problems
Troubleshooting QoS and Traffic Descriptor Problems
Improperly Configured CDV Tolerance
Although you configure ample bandwidth for a circuit, you may still notice discarded cells. In this case, check the value you configured for the CDV tolerance (CDVT) user-preference attribute. See the NavisCore ATM Configuration Guide for more information on configuring this attribute.
To correct cell discard caused by an incorrect CDVT value, use the following formula to determine a new CDVT value:
CDVT > (N - 1)(T - d)
Where:
N = The maximum number of cells in a burst from the incoming traffic
T = 1/PCR
d = 1/Maximum Transfer Rate (or line rate)
NavisCore Troubleshooting Guide 7/17/033-89

Beta Draft ConfidentialTroubleshooting ATM ProblemsTroubleshooting QoS and Traffic Descriptor Problems
3-907/17/03 NavisCore Troubleshooting Guide
NavisCore Troubleshooting Guide
Beta Draft Confidential
4
Troubleshooting IP Navigator Problems
This chapter describes how to troubleshoot and understand IP Navigator problems on Lucent switches.
Identifying IP Navigator Problems
The first thing to remember when troubleshooting IP Navigator problems on a Lucent switch is that the problem may not be directly related to IP. The problem may be related instead to one of the following causes:
• Hardware failure, such as a bad cable.
• Data link protocols that encapsulate IP packets.
IP packets that pass through Lucent switches are encapsulated in one of the following protocols:
Frame Relay — Frame headers encapsulate IP packets that are forwarded over Frame Relay circuits.
ATM — ATM cell headers encapsulate IP packets that are forwarded over ATM circuits.
Ethernet — Ethernet headers encapsulate IP packets that are forwarded over Ethernet LANs.
PPP — PPP headers encapsulate IP packets that are forwarded over PPP interfaces.
When IP Navigator problems occur, you should first determine if Frame Relay, ATM, or Ethernet problems also exist. Check for traps, changes in network map object colors, LEDs changing from green to red, and user complaints that might indicate the presence of Frame Relay, ATM, or Ethernet problems. If problems in any of these areas coincide with IP problems, one (or more) of these areas may be the source of the problem. For more information, see Chapter 2, “Troubleshooting Frame Relay Problems,” and Chapter 3, “Troubleshooting ATM Problems.”
4-1
Beta Draft ConfidentialTroubleshooting IP Navigator ProblemsVerifying IP Navigator Problems
Verifying IP Navigator Problems
Use the NMS and console commands to help you verify IP Navigator problems. In particular, use the following statistics and commands to verify the presence of problems:
• the IP attributes and statistics described in the NavisCore Diagnostics Guide.
• the ping command, described in “ping Program” on page 4-3.
• the show IP route command, described in “Identifying the IP Data Path” on page 4-22.
• the show OSPF database command, described in the Console Command Reference.
• the show ARP command, described in the Console Command Reference.
• the traceroute command, described in “traceroute Program” on page 4-6.
• the show ip forward statistics command, described in “Show IP Forwarding Statistics Console Command” on page 4-58.
These commands show inbound and outbound counter statistics to help identify the IP data path and potential errors.
Isolating IP Navigator Problems
If you determine that the problem is related to IP Navigator, then the problem is probably the result of configuration errors, such as a misconfigured IP address, ARP entry, routing table entry, or route maps.
You can isolate IP Navigator problems by performing the following steps:
1. Determine which nodes are unreachable (for example, switches, routers, and hosts).
2. Determine the physical paths to the unreachable nodes.
3. Check the connections and configurations of each node and interface along the path (for example, routing tables, ARP entries, and IP forwarding statistics).
4. Consult other administrative personnel. For example, you may determine that the source of the problem lies with customer premise equipment (CPE) at a customer site, and you need the assistance of administrative personnel at that site to correct the problem.
4-2 NavisCore Troubleshooting Guide
Beta Draft ConfidentialTroubleshooting IP Navigator Problems
IP Navigator Limitations
IP Navigator Limitations
The IP Navigator limits for this release are described in the “IP Navigator Limits” section in the Software Release Notice (SRN) for your switch software. Unless otherwise noted, the public and private IP VPN limits apply to both the B-STDX 8000/9000 and the CBX 500.
TCP/IP Programs
TCP/IP uses the following two programs in troubleshooting IP problems:
ping — An industry standard TCP/IP program that tests the connectivity with a remote host by sending Internet Control Message Protocol (ICMP) echo commands and then waiting for the corresponding replies. If ping receives at least one echo, it can deduce that the remote host is operational. ping is described in RFC2151.
traceroute — An industry standard TCP/IP program that lets you see the route that IP datagrams follow from one host to another. traceroute is described in RFC2151.
ping Program
The ICMP protocol is handled by the active CP/SP card. ICMP echo response packets may be lost when the CP/SP is processing higher priority packets such as BGP updates.
IP Source Address Selection in a public VPN
Lucent switches use the following process to select the IP source address used for transmitting an ICMP echo request or reply packet in a public VPN:
• If the outgoing interface is an IP logical port (Lport), the switch uses the highest numbered IP address on that Lport.
• If the logical port does not have an IP address (for example, a trunk or unnumbered PPP interface) and the destination address is not known via VNN, the switch uses the highest numbered IP loopback address on the switch.
• If the logical port does not have an IP address (for example, a trunk or unnumbered PPP interface) and the destination address is known via VNN, the switch uses the internal switch address.
You can retrieve RFC2151 from http://www.ietf.org/rfc/rfc2151.txt on the internet.
NavisCore Troubleshooting Guide 4-3
Beta Draft ConfidentialTroubleshooting IP Navigator ProblemsTCP/IP Programs
• If a loopback address is not configured, the switch uses the highest numbered IP interface on the switch.
• If there are no configured loopback addresses or IP addresses, then the switch will not send the packet.
IP Source Address Selection in a private VPN
Lucent switches use the following process to select the IP source address used for transmitting an ICMP echo request or reply packet in a private VPN:
• If the outgoing interface is an IP Lport, the switch uses the highest numbered IP address on that Lport.
• If the logical port does not have an IP address, the switch uses the highest numbered IP interface on the switch, including the cloud interface.
ping Extended Options
To run the ping program with extended options, you must log in as a privileged user. The following options are available when ping is run with extended options:
Destination address — Specify the destination IP.
Number of datagrams –– Specify the number of packets to transmit. The default is 5 and there is no range.
Data length –– Specify the packet data length. The default is 100 and the range is 1 to 65507.
Vary data length –– Specify the default value by entering yes, or enter no to specify the starting data length (range is 0 to 100) and data length increment (range is 1 to 65507).
Timeout in seconds –– Specify the timeout in seconds. The default is 2 and the range is 1 to 120.
Source address –– Specify the source address. The local IP address should be an address on the Lucent switch.
Set DF Bit — Specify the Set DF Bit. The default is no. All fragmented packets will be discarded. Enter yes to set the fragment bit to forward fragmented packets.
Data pattern — Select the default or enter a unique data pattern.
The ping program may timeout if any of the following conditions occur:
• The user specified an incorrect IP address.1
• The destination IP interface is down.
• There is a problem with the cabling.
4-4 NavisCore Troubleshooting Guide
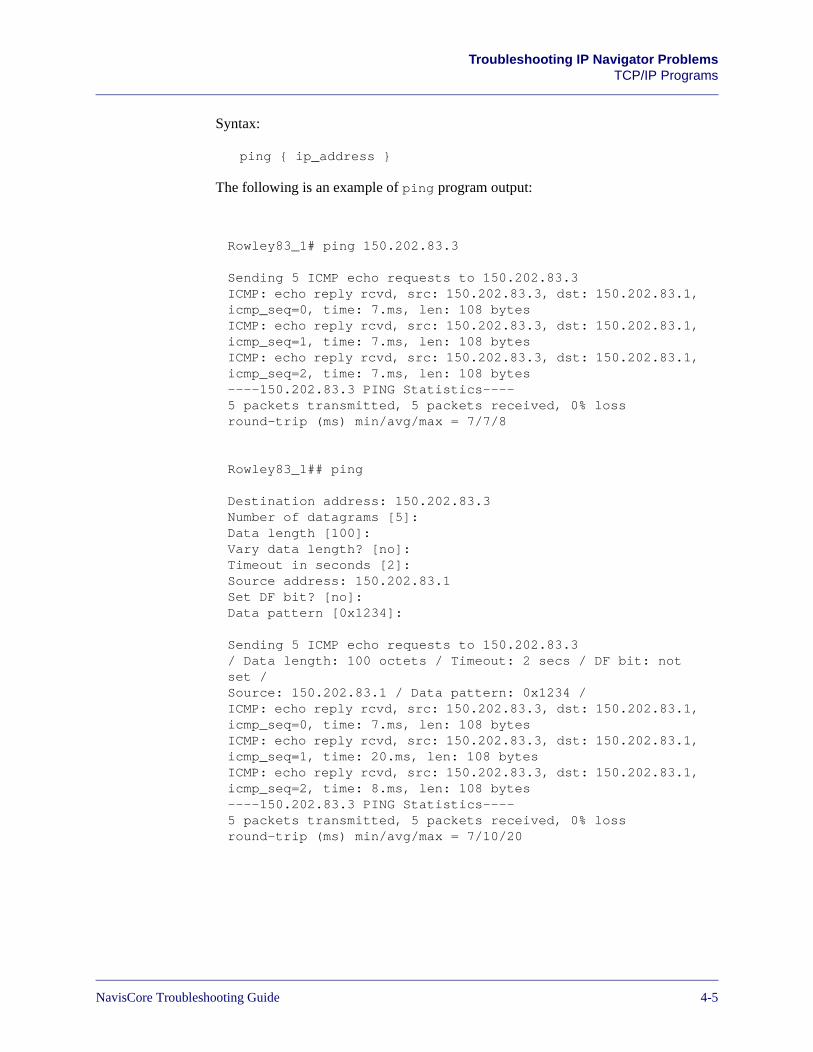
Beta Draft ConfidentialTroubleshooting IP Navigator Problems
TCP/IP Programs
Syntax:
ping { ip_address }
The following is an example of ping program output:
Rowley83_1# ping 150.202.83.3
Sending 5 ICMP echo requests to 150.202.83.3ICMP: echo reply rcvd, src: 150.202.83.3, dst: 150.202.83.1, icmp_seq=0, time: 7.ms, len: 108 bytesICMP: echo reply rcvd, src: 150.202.83.3, dst: 150.202.83.1, icmp_seq=1, time: 7.ms, len: 108 bytesICMP: echo reply rcvd, src: 150.202.83.3, dst: 150.202.83.1, icmp_seq=2, time: 7.ms, len: 108 bytes----150.202.83.3 PING Statistics----5 packets transmitted, 5 packets received, 0% lossround-trip (ms) min/avg/max = 7/7/8
Rowley83_1## ping
Destination address: 150.202.83.3Number of datagrams [5]: Data length [100]: Vary data length? [no]: Timeout in seconds [2]: Source address: 150.202.83.1Set DF bit? [no]: Data pattern [0x1234]:
Sending 5 ICMP echo requests to 150.202.83.3/ Data length: 100 octets / Timeout: 2 secs / DF bit: not set /Source: 150.202.83.1 / Data pattern: 0x1234 /ICMP: echo reply rcvd, src: 150.202.83.3, dst: 150.202.83.1, icmp_seq=0, time: 7.ms, len: 108 bytesICMP: echo reply rcvd, src: 150.202.83.3, dst: 150.202.83.1, icmp_seq=1, time: 20.ms, len: 108 bytesICMP: echo reply rcvd, src: 150.202.83.3, dst: 150.202.83.1, icmp_seq=2, time: 8.ms, len: 108 bytes----150.202.83.3 PING Statistics----5 packets transmitted, 5 packets received, 0% lossround-trip (ms) min/avg/max = 7/10/20
NavisCore Troubleshooting Guide 4-5
Beta Draft ConfidentialTroubleshooting IP Navigator ProblemsTCP/IP Programs
traceroute Program
The traceroute program is handled by the CP/SP card. By default, traceroute provides the hop-by-hop path that an IP datagram takes to get to an IP destination.
Usage of the mpt keyword shows the ingress switch and the egress switch in the circuit data path that the MPT takes to get to an IP destination. A transit node will not respond to a traceroute request because the LSP leaf node at the ingress of the cloud will forward any packet with a TTL > 1 over an LSP to the root node. A transit switch will respond to a traceroute request if MPTs are disabled and an IP interface or loopback is configured.
traceroute traces an IP route until one of the following conditions occur:
• The IP datagram reaches its final destination.
• The connection break point is identified.
Syntax:
traceroute [mpt ip-address | ip-address]
traceroute IP Address Selection
Lucent switches use the following process to select the IP address used for replying to a traceroute request:
• If the outgoing interface is an IP logical port (Lport), the switch uses the highest numbered IP address on that Lport.
• If the logical port does not have an IP address (for example, a trunk or unnumbered PPP interface) and the destination address is not known via VNN, the switch uses the highest numbered IP loopback address on the switch.
• If the logical port does not have an IP address (for example, a trunk or unnumbered PPP interface) and the destination address is known via VNN, the switch uses the internal switch address.
• If a loopback address is not configured, the switch uses the highest numbered IP interface on the switch.
• If there are no configured loopback addresses or IP addresses, then the switch will not send the packet.
The traceroute command functions the same for either a public VPN 0 or a private VPN.
4-6 NavisCore Troubleshooting Guide
Beta Draft ConfidentialTroubleshooting IP Navigator Problems
IP Navigator Diagnostic Utilities
IP Navigator Diagnostic Utilities
This section describes how to use the IP trace utility and the LSP trace utility and describes how to:
• Create a trace profile.
• Start a trace.
• Use the IP trace utilities with IP/VPNs.
Sample trace outputs, IP Trace command syntax, ctr command syntax, and tr command syntax are also included in this section.
IP Trace Utility
The IP trace utility is a packet trace tool for troubleshooting IP-related network problems. This utility has a command line interface only; you cannot use it from the NMS.
To set up, start, and stop the IP packet trace, you use the set ip trace profile command. You can view the packet trace setup through the show ip trace profile command.
The IP trace utility screen output displays:
• IP packet header information.
• Data, called the payload, that follows the IP header. The payload is in hexadecimal format.
See “Sample Trace Output” on page 4-14 for an example of trace output.
You can perform a trace of incoming and/or outgoing IP packets on any of the following:
• IP logical ports
• Ethernet management ports on the B-STDX 8000/9000 CP, CBX 500 SP, or GX 500 NP
• Control ports, which act as an interface between the CP/SP/NP and the IOMs/IOPs on the switch
Trace filters allow you to trace IP packets selectively. These filters include the fields in the IP packet header (such as source IP address and destination port).
You must be in debug mode to issue the set ip trace profile command. To enter debug mode, issue the enable debug command from the switch console and specify the required password when prompted.
NavisCore Troubleshooting Guide 4-7
Beta Draft ConfidentialTroubleshooting IP Navigator ProblemsIP Navigator Diagnostic Utilities
Creating a Trace Profile
A trace profile consists of three parts:
• Trace filters
• Payload length
• Trace counter
Trace Filters
A trace profile includes one or more trace filters, which specify values that the IP packet must match to be traced. For example, only IP packets that meet both of the following criteria are traced:
• IP packets with a destination IP address of 131.100.110.1
• IP packets that carry HTTP data
If you do not specify a filter value, the default (“any”) is assumed. For example, if you do not specify a source IP address, any source IP address is accepted.
Trace profiles are stored in memory only. They are never written to a permanent storage area. When you reset a card, trace profile information is lost.
4-8 NavisCore Troubleshooting Guide
Beta Draft ConfidentialTroubleshooting IP Navigator Problems
IP Navigator Diagnostic Utilities
You can specify the following trace filters as part of a trace profile:
Source IP address with optional mask — Specify a valid source IP address. A mask can be assigned although it is optional.
Destination IP address with optional mask — Specify a valid destination IP address. A mask can be assigned although it is optional.
Source port — Specify the source port. You can specify a name or a decimal number. The command supports the following names: TELNET, FTP, FTPDATA, HTTP, SNMP, SNMPTRP, TFTP, and BGP. Port numbers are described in RFC1700.
Destination port — Specify the destination port. You can specify a name or a decimal number. The command supports the following names: TELNET, FTP, FTPDATA, HTTP, SNMP, SNMPTRP, TFTP, and BGP. Port numbers are described in RFC1700.
Protocol — Specify the protocol type. You can specify a name or a decimal number. The command supports the following names: ICMP, IGMP, IPIP, TCP, UDP, EGP, OSPF, and RAW. Protocol numbers are described in RFC1700.
Type of Service (TOS) with optional mask — Specify a hexadecimal number that identifies the TOS (with optional mask).
Transmission direction (send, receive, or any) — Specify the direction of transmission (send, receive, or any).
You specify each filter on a separate command line. For example, suppose that you want to filter IP packets on the IP logical port identified by interface number 20, and you want to specify three filters: a source IP address of 150.140.10.5, a source port of HTTP, and you are only interested in filtering received packets. You would specify the following commands to accomplish this:
set ip trace profile port 20 source_ip 150.140.10.5set ip trace profile port 20 source_port HTTPset ip trace profile port 20 direction receive
See “IP Trace Command Syntax” on page 4-15 for more information about the syntax that you use to specify filters.
You can retrieve RFC1700 from http://www.ietf.org/rfc/rfc1700.txt on the Internet.
NavisCore Troubleshooting Guide 4-9
Beta Draft ConfidentialTroubleshooting IP Navigator ProblemsIP Navigator Diagnostic Utilities
Payload Length
The payload length is the number of bytes of data following the IP header to be traced. You can specify a payload length in the range of 0-100 for the control port and the Ethernet management port, and 0-32 for IOMs/IOPs. The default value is 0 (zero).
The data_len keyword on the set ip trace profile command line allows you to specify the payload length. For example, the following command specifies a payload length of 32 bytes:
set ip trace profile port 20 data_len 32
See “IP Trace Command Syntax” on page 4-15 for more information about command syntax.
Trace Counter
After you start a trace, the trace counter increments each time an IP packet that matches the trace filter is detected. If you want to reset the counter, use the count option. For example, the following command resets the counter to 0 (zero:
set ip trace profile port 20 count 0
See “IP Trace Command Syntax” on page 4-15 for more information about command syntax.
When you view a profile using the show ip trace profile command, the count appears in the format value/value (for example, 5/0). The first value displays the number of IP packets that were displayed on the console screen. The second value displays the number of IP packets that could not be displayed on the console screen for performance reasons. For example, a count of 12/2 means that 12 packets were displayed, but two packets were not.
Deleting Trace Profiles
To delete a trace profile, use the deleted keyword. For example, the following command deletes the trace profile associated with an IP logical port identified by interface number 10:
set ip trace profile port 10 deleted
The payload starts immediately after the IP header and includes the TCP/UDP header, if present. Any IP header options are not included.
For all IOPB cards and IOP3 cards on B-STDX 8000/9000 switches, a full 32 bytes of payload cannot be traced. For these IOPs, no more than 12 payload bytes can be traced in the send direction. All 32 bytes are traced in the receive direction.
4-10 NavisCore Troubleshooting Guide
Beta Draft ConfidentialTroubleshooting IP Navigator Problems
IP Navigator Diagnostic Utilities
The following command deletes the trace profile associated with all the ports on the switch:
set ip trace profile port all deleted
See “IP Trace Command Syntax” on page 4-15 for more information about command syntax.
Starting a Trace
To start tracing, you must:
• Enable logging on the switch by issuing the following command from the switch console:
set logging on
• Start tracing by using the set ip trace profile command. You can start tracing on a single port, all the ports associated with an IOM/IOP, or all ports on the switch.
On a Single Port
To start tracing on a single port, issue the following command:
set ip trace profile port port_id on
The port_id variable identifies the port and can be set to any of the following values:
Interface # — An interface number that identifies an IP logical port. To determine the interface numbers of IP logical ports on the switch, use the show ip Lport command. The interface numbers appear in the IpLport column of the command output.
ethernet — Specifies the Ethernet management port on the CP/SP/NP.
control — Specifies the control port on the CP/SP/NP.
You should create trace profiles before you start tracing. If you start tracing, and no trace filters exist, all of the filters are set to “any” by default and all IP packets are output to the console screen.
NavisCore Troubleshooting Guide 4-11
Beta Draft ConfidentialTroubleshooting IP Navigator ProblemsIP Navigator Diagnostic Utilities
When you start tracing, the trace output appears on the console screen. See “Sample Trace Output” on page 4-14 for more information. Some examples are shown below:
Examples:
To start tracing on the IP logical port identified by interface number 20:
set ip trace profile port 20 on
To start tracing on the Ethernet management port:
set ip trace profile port ethernet on
To start tracing on the control port:
set ip trace profile port control on
To stop tracing on a port, use the off keyword. See “IP Trace Command Syntax” on page 4-15 for more information about command syntax.
On All Ports Associated With an IOM/IOP
To start tracing on all ports associated with an IOM/IOP, issue the following command:
set ip trace profile slot_id on
The slot_id variable identifies the slot number of the IOM/IOP.
4-12 NavisCore Troubleshooting Guide
Beta Draft ConfidentialTroubleshooting IP Navigator Problems
IP Navigator Diagnostic Utilities
When you start tracing, the trace output appears on the console screen. See “Sample Trace Output” on page 4-14 for more information.
Example:
set ip trace profile slot 4 on
This command starts tracing for all of the IP logical ports associated with the IOM/IOP in slot 4.
To stop tracing on the IOM/IOP, use the off switch. See “IP Trace Command Syntax” on page 4-15 for more information about command syntax.
On All Ports on the Switch
To start tracing on all ports on the switch, issue the following command:
set ip trace profile slot all on
When you start tracing, the trace output appears on the console. See “Sample Trace Output” on page 4-14 for more information.
To stop tracing on the entire switch, use the off switch.
See “IP Trace Command Syntax” on page 4-15 for more information about command syntax.
Using the IP Trace Commands With IP VPNs
This section describes how to use the set ip trace profile and show ip trace profile commands with IP VPNs.
set ip trace profile
You can issue the set ip trace profile command only if you are logged into the public IP VPN (IP VPN 0) at the switch console.
Although you can issue the set ip trace profile command while logged in to the public IP VPN only, you can still set up and start traces for other IP VPNs. To do this, specify an IP VPN ID at the end of the command line. For example, the following command starts a trace on the IP logical port identified by interface number 3 for IP VPN 2:
set ip trace profile port 3 on vpn 2
If you do not specify an IP VPN ID, the public IP VPN is assumed, by default.
To view the IP VPN trace packets, you must log in to the IP VPN at the switch console after you start the trace. To log in to an IP VPN at the switch console, you must provide the Telnet password assigned to that IP VPN when it was added. See the NavisCore IP Navigator Configuration Guide for a description of the Telnet password.
NavisCore Troubleshooting Guide 4-13
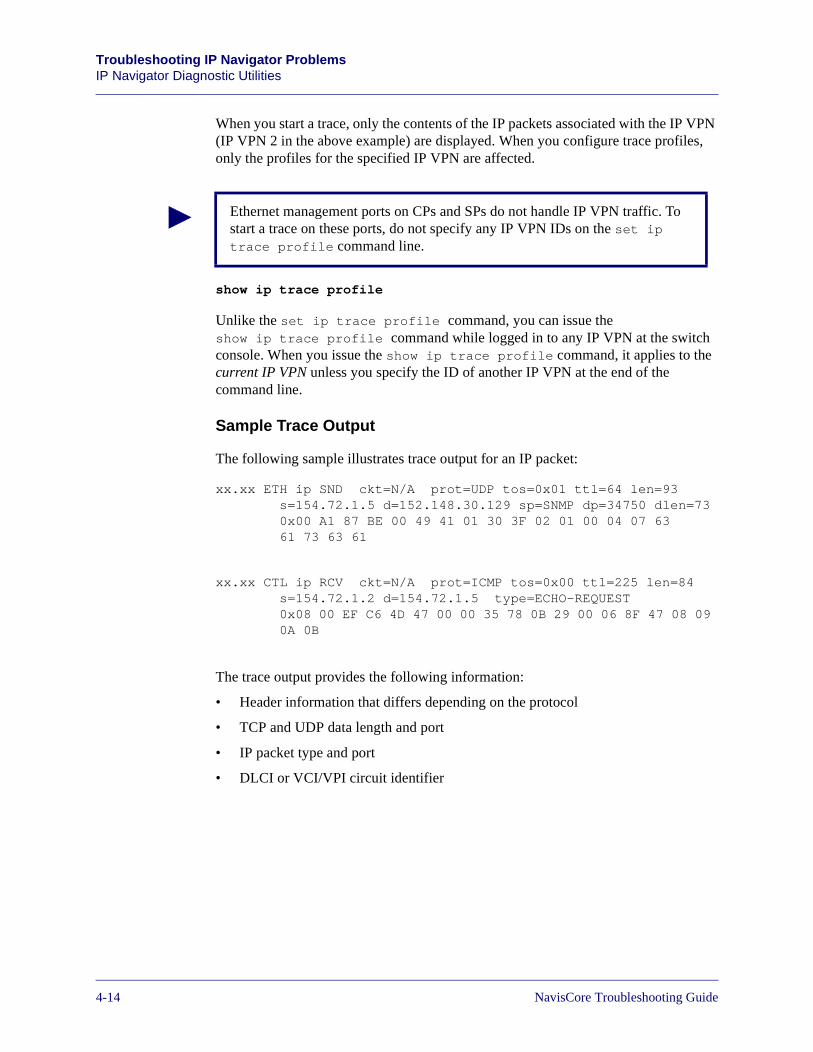
Beta Draft ConfidentialTroubleshooting IP Navigator ProblemsIP Navigator Diagnostic Utilities
When you start a trace, only the contents of the IP packets associated with the IP VPN (IP VPN 2 in the above example) are displayed. When you configure trace profiles, only the profiles for the specified IP VPN are affected.
show ip trace profile
Unlike the set ip trace profile command, you can issue the show ip trace profile command while logged in to any IP VPN at the switch console. When you issue the show ip trace profile command, it applies to the current IP VPN unless you specify the ID of another IP VPN at the end of the command line.
Sample Trace Output
The following sample illustrates trace output for an IP packet:
xx.xx ETH ip SND ckt=N/A prot=UDP tos=0x01 ttl=64 len=93s=154.72.1.5 d=152.148.30.129 sp=SNMP dp=34750 dlen=73 0x00 A1 87 BE 00 49 41 01 30 3F 02 01 00 04 07 63 61 73 63 61
xx.xx CTL ip RCV ckt=N/A prot=ICMP tos=0x00 ttl=225 len=84s=154.72.1.2 d=154.72.1.5 type=ECHO-REQUEST0x08 00 EF C6 4D 47 00 00 35 78 0B 29 00 06 8F 47 08 09 0A 0B
The trace output provides the following information:
• Header information that differs depending on the protocol
• TCP and UDP data length and port
• IP packet type and port
• DLCI or VCI/VPI circuit identifier
Ethernet management ports on CPs and SPs do not handle IP VPN traffic. To start a trace on these ports, do not specify any IP VPN IDs on the set ip trace profile command line.
4-14 NavisCore Troubleshooting Guide
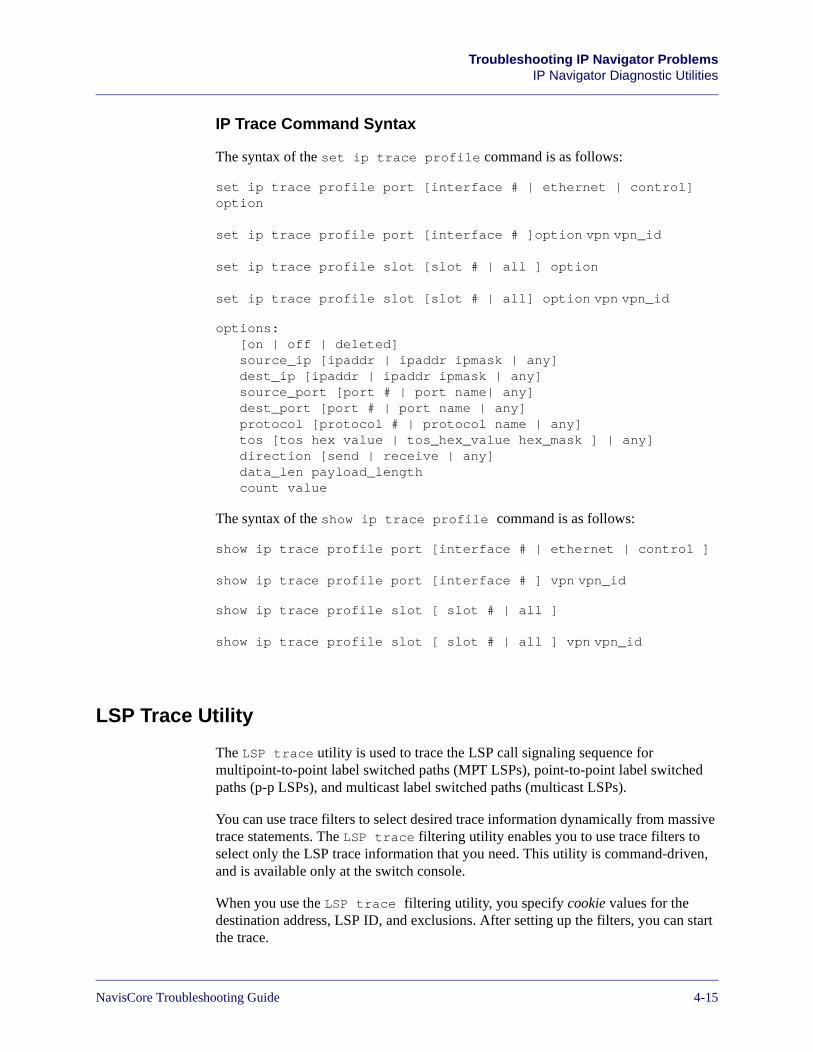
Beta Draft ConfidentialTroubleshooting IP Navigator Problems
IP Navigator Diagnostic Utilities
IP Trace Command Syntax
The syntax of the set ip trace profile command is as follows:
set ip trace profile port [interface # | ethernet | control] option
set ip trace profile port [interface # ]option vpn vpn_id
set ip trace profile slot [slot # | all ] option
set ip trace profile slot [slot # | all] option vpn vpn_id
options: [on | off | deleted]source_ip [ipaddr | ipaddr ipmask | any]dest_ip [ipaddr | ipaddr ipmask | any]source_port [port # | port name| any]dest_port [port # | port name | any]protocol [protocol # | protocol name | any]tos [tos hex value | tos_hex_value hex_mask ] | any]direction [send | receive | any]data_len payload_lengthcount value
The syntax of the show ip trace profile command is as follows:
show ip trace profile port [interface # | ethernet | control ]
show ip trace profile port [interface # ] vpn vpn_id
show ip trace profile slot [ slot # | all ]
show ip trace profile slot [ slot # | all ] vpn vpn_id
LSP Trace Utility
The LSP trace utility is used to trace the LSP call signaling sequence for multipoint-to-point label switched paths (MPT LSPs), point-to-point label switched paths (p-p LSPs), and multicast label switched paths (multicast LSPs).
You can use trace filters to select desired trace information dynamically from massive trace statements. The LSP trace filtering utility enables you to use trace filters to select only the LSP trace information that you need. This utility is command-driven, and is available only at the switch console.
When you use the LSP trace filtering utility, you specify cookie values for the destination address, LSP ID, and exclusions. After setting up the filters, you can start the trace.
NavisCore Troubleshooting Guide 4-15
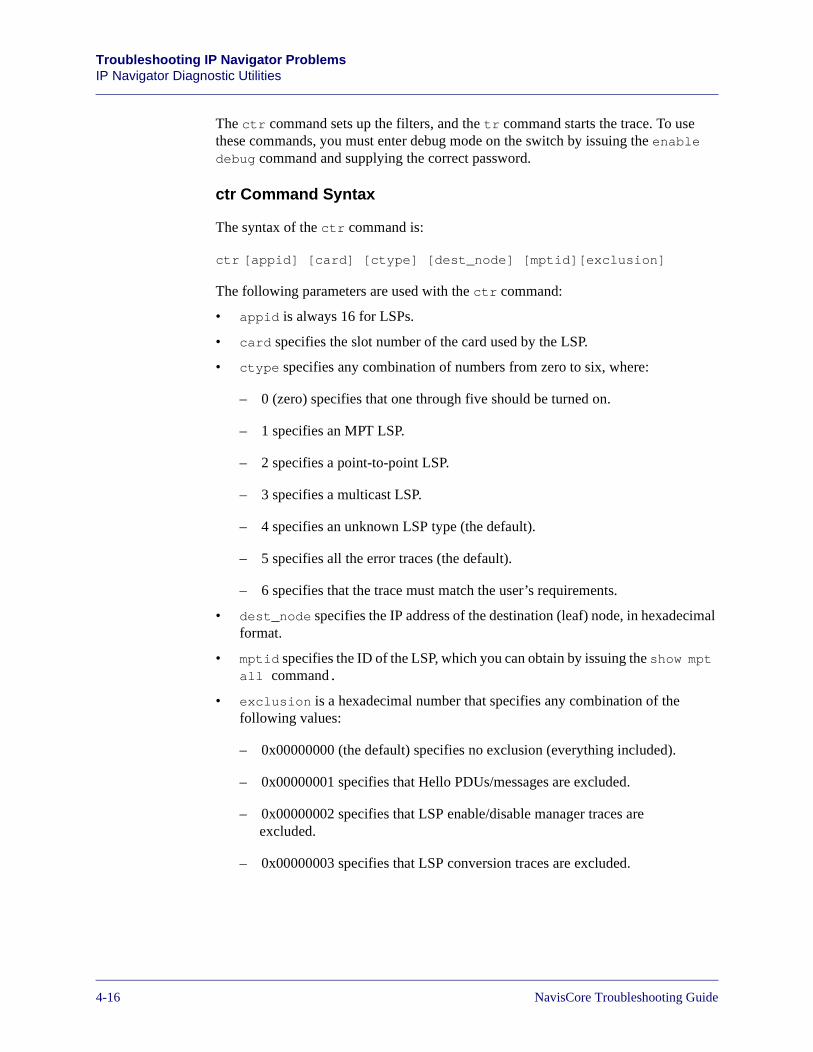
Beta Draft ConfidentialTroubleshooting IP Navigator ProblemsIP Navigator Diagnostic Utilities
The ctr command sets up the filters, and the tr command starts the trace. To use these commands, you must enter debug mode on the switch by issuing the enable debug command and supplying the correct password.
ctr Command Syntax
The syntax of the ctr command is:
ctr [appid] [card] [ctype] [dest_node] [mptid][exclusion]
The following parameters are used with the ctr command:
• appid is always 16 for LSPs.
• card specifies the slot number of the card used by the LSP.
• ctype specifies any combination of numbers from zero to six, where:
– 0 (zero) specifies that one through five should be turned on.
– 1 specifies an MPT LSP.
– 2 specifies a point-to-point LSP.
– 3 specifies a multicast LSP.
– 4 specifies an unknown LSP type (the default).
– 5 specifies all the error traces (the default).
– 6 specifies that the trace must match the user’s requirements.
• dest_node specifies the IP address of the destination (leaf) node, in hexadecimal format.
• mptid specifies the ID of the LSP, which you can obtain by issuing the show mpt all command.
• exclusion is a hexadecimal number that specifies any combination of the following values:
– 0x00000000 (the default) specifies no exclusion (everything included).
– 0x00000001 specifies that Hello PDUs/messages are excluded.
– 0x00000002 specifies that LSP enable/disable manager traces are excluded.
– 0x00000003 specifies that LSP conversion traces are excluded.
4-16 NavisCore Troubleshooting Guide

Beta Draft ConfidentialTroubleshooting IP Navigator Problems
IP Navigator Diagnostic Utilities
tr Command Syntax
The syntax of the tr command is:
tr [ appid ] [ level ] [ output ] [ card ]
The following parameters are used with the tr command:
• appid is always 16 for LSPs.
• level specifies the trace level from one to eight. The level specifies the amount of information that you want in the trace, from the least information (one) to the most information (eight). Zero (0) disables the trace.
• output specifies how the trace statements are output as follows:
– 0 (no output)
– 1 (output to console)
– 2 (debug)
– 3 (output to both console and debug)
• card specifies the slot number of the card used by the LSP.
Sample LSP Trace Output
Example 1:
cheetah## ctr 16 8 1 0x01020304 1 0
cheetah## tr 16 8 1 8
In example 1, the trace output displays all of the trace statements that apply to the card in slot 8, according to the following criteria:
• The LSP type is MPT LSP (1).
• The IP address of the leaf node is 1.2.3.4 (0x01020304).
• The LSP ID is 1.
• The trace statements are output to console if the filter cannot determine whether the user’s requirements are met.
NavisCore Troubleshooting Guide 4-17

Beta Draft ConfidentialTroubleshooting IP Navigator ProblemsIP Navigator Diagnostic Utilities
Example 2:
cheetah## ctr 16 8 12 0x0a0b0c0d 1 1
cheetah## tr 16 8 1 8
In example 2, the trace output displays all of the trace statements that apply to the card in slot 8, according to the following criteria:
• The LSP types are MPT LSP (1) and point-to-point LSP (2).
• The IP address of the leaf node is 10.11.12.13 (0x0a0b0c0d).
• The LSP ID is 1.
• Ignore all of the hello messages or PDUs (1).
• The trace statements are output to console if the filter cannot determine whether the user’s requirements are met.
Example 3:
cheetah## tr 16 8 126 0x0a0b0c0d 2 3
cheetah## tr 16 8 1 8
In example 3, the trace output displays all of the trace statements that apply to the card in slot 8, according to the following criteria:
• The MPT type is MPT LSP (1) and point-to-point LSP (2).
• The IP address of the leaf node is 10.11.12.13.
• The MPT ID is 2.
• The trace statements associated with the hello PDU/messages and MPT LSP manager are ignored.
• The trace statements are shown if they match the user’s requirements (this is specified by the 6 at the end of 126).
4-18 NavisCore Troubleshooting Guide
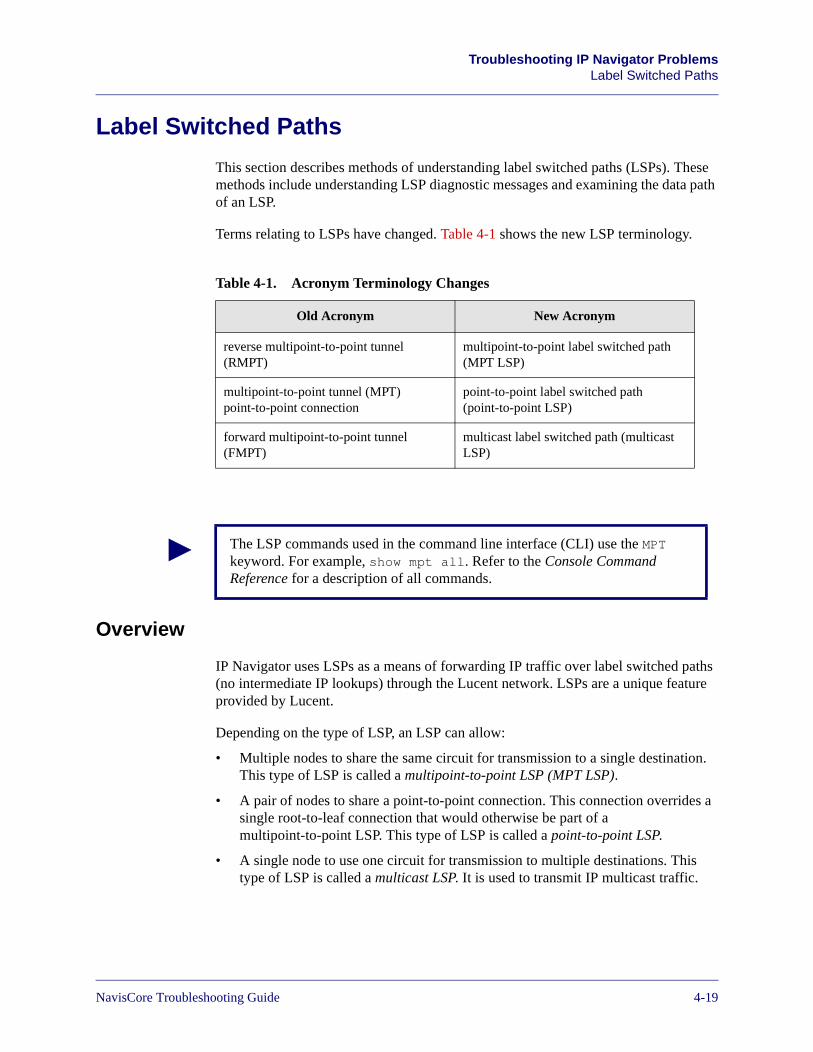
Beta Draft ConfidentialTroubleshooting IP Navigator Problems
Label Switched Paths
Label Switched Paths
This section describes methods of understanding label switched paths (LSPs). These methods include understanding LSP diagnostic messages and examining the data path of an LSP.
Terms relating to LSPs have changed. Table 4-1 shows the new LSP terminology.
Overview
IP Navigator uses LSPs as a means of forwarding IP traffic over label switched paths (no intermediate IP lookups) through the Lucent network. LSPs are a unique feature provided by Lucent.
Depending on the type of LSP, an LSP can allow:
• Multiple nodes to share the same circuit for transmission to a single destination. This type of LSP is called a multipoint-to-point LSP (MPT LSP).
• A pair of nodes to share a point-to-point connection. This connection overrides a single root-to-leaf connection that would otherwise be part of a multipoint-to-point LSP. This type of LSP is called a point-to-point LSP.
• A single node to use one circuit for transmission to multiple destinations. This type of LSP is called a multicast LSP. It is used to transmit IP multicast traffic.
Table 4-1. Acronym Terminology Changes
Old Acronym New Acronym
reverse multipoint-to-point tunnel (RMPT)
multipoint-to-point label switched path (MPT LSP)
multipoint-to-point tunnel (MPT) point-to-point connection
point-to-point label switched path (point-to-point LSP)
forward multipoint-to-point tunnel (FMPT)
multicast label switched path (multicast LSP)
The LSP commands used in the command line interface (CLI) use the MPT keyword. For example, show mpt all. Refer to the Console Command Reference for a description of all commands.
NavisCore Troubleshooting Guide 4-19
Beta Draft ConfidentialTroubleshooting IP Navigator ProblemsLabel Switched Paths
Both the MPT LSP and multicast LSP networks are rooted at the switch. A root is a standard circuit endpoint that is created at initialization time on every CP card in the B-STDX 8000/9000 and every SP card in the CBX 500. An LSP leaf is the source of data that is forwarded over the LSP. Traffic flow occurs from the leaves to the root on MPT LSPs, and from the root to the leaves on multicast LSPs. On point-to-point LSP connections, traffic is bi-directional, since each node configured on a point-to-point LSP connection acts as both a leaf and a root.
LSP Call Signaling
LSPs use a process called call signaling to set up virtual circuits and to determine the label switched path. Virtual circuits are used to forward IP traffic over label switched paths. A label switched path is a path with a circuit on it that allows data to be switched instead of forwarded hop-by-hop.
The following list describes how the switch processes call signaling for a cell LSP:
1. As each cell Input/Output Module (IOM) initializes on a CBX 500 root switch, the cell IOM sets up connections to each forwarding engine on each frame IOM in the switch. These connections allow LSP data that is received on the cell trunk to be forwarded to the appropriate forwarding engine.
2. When Open Shortest Path First (OSPF) determines that a node is reachable, it informs the LSP component running on the switch processor (SP). The LSP component then requests OSPF for a route to the leaf node.
3. The SP sends a Call Setup to the cell IOM. The LSP component on the cell IOM allocates a virtual path identifier (VPI) and informs the hardware that the VPI is an LSP VPI.
4. A Call PDU is then sent to the next switch as follows:
a. At a transit node, the LSP component on the cell IOM receives the Call Setup and forwards the Call Setup to the next cell IOM.
b. At a leaf node, the LSP component on the cell IOM receives the Call Setup and forwards the Call Setup to the SP.
5. The SP receives the Call Setup and sends a confirmation back to the LSP root indicating which forwarding engine (FE) with IP interfaces it has on its node.
6. At the root node, the LSP component on the SP receives the Confirm message and allocates a reassembly identifier (RID) for each FE with IP interfaces at the leaf.
7. The LSP component on the SP informs each FE at the root about the RIDs that it has allocated and sends a Call Setup to each FE at the leaf.
8. At the leaf node, the LSP component on the cell IOM receives the call setup and forwards each Call Setup to the appropriate FEs.
For more information about LSPs, see Chapter 12 in the NavisCore IP Navigator Configuration Guide.
4-20 NavisCore Troubleshooting Guide
Beta Draft ConfidentialTroubleshooting IP Navigator Problems
Label Switched Paths
LSP Call Forwarding
LSPs use a process known as call forwarding to forward IP data over label switched paths.
The CBX 500 call forwarding functions for a cell circuit as follows:
1. At the leaf node, the FE determines that data can be forwarded on an LSP. The FE segments the IP packet into ATM cells and inserts the MPT VCI into the cell header. The ATM cell is then sent across the switching fabric to the cell IOM.
2. At the transit node, the LSP cells are switched on virtual paths until they reach the LSP root.
3. At the root node, if the LSP cell is received on a cell IOM, the IOM determines the cell is an LSP based on its VPI. The IOM examines the first five bits of the VCI to determine which FE will receive the ATM cell. The VPI bits are used to separate streams of multiple LSPs.
4. At the root node, if the LSP cell is received on the frame IOM, the cells are reassembled based on the RID (found in the remaining 11 bits of the VCI). Once the packet is reassembled, another IP lookup is performed and the data is forwarded out of the physical interface.
NavisCore Troubleshooting Guide 4-21
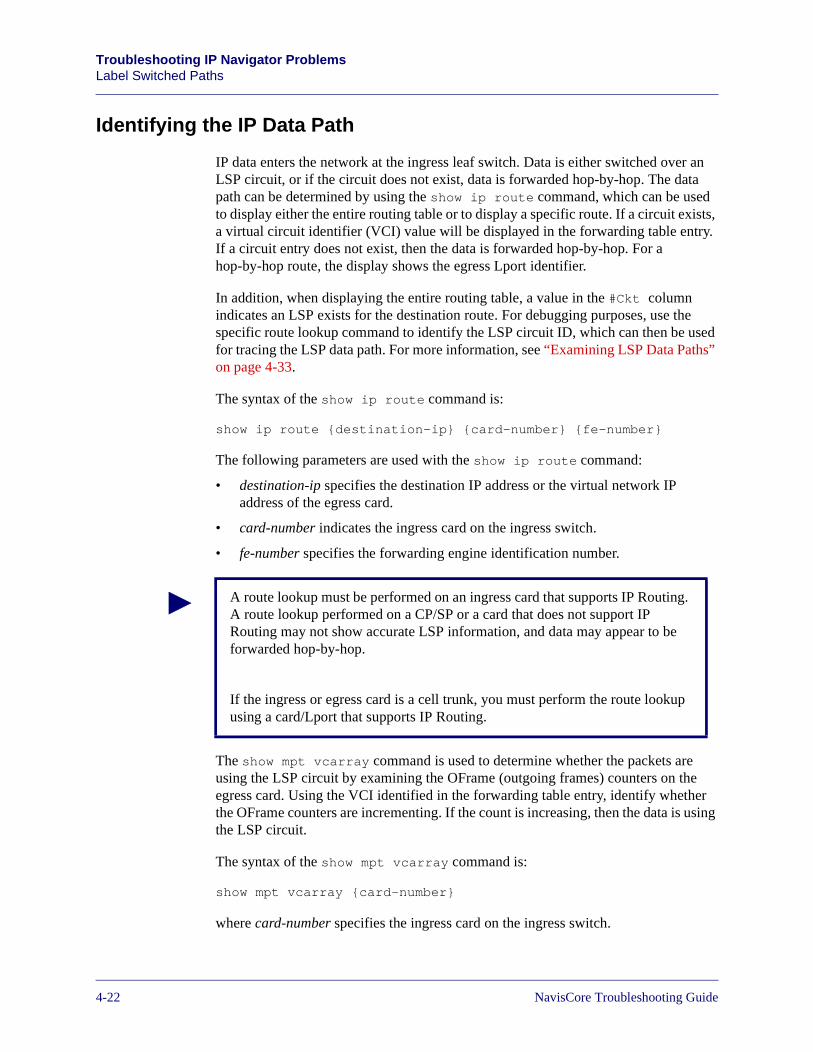
Beta Draft ConfidentialTroubleshooting IP Navigator ProblemsLabel Switched Paths
Identifying the IP Data Path
IP data enters the network at the ingress leaf switch. Data is either switched over an LSP circuit, or if the circuit does not exist, data is forwarded hop-by-hop. The data path can be determined by using the show ip route command, which can be used to display either the entire routing table or to display a specific route. If a circuit exists, a virtual circuit identifier (VCI) value will be displayed in the forwarding table entry. If a circuit entry does not exist, then the data is forwarded hop-by-hop. For a hop-by-hop route, the display shows the egress Lport identifier.
In addition, when displaying the entire routing table, a value in the #Ckt column indicates an LSP exists for the destination route. For debugging purposes, use the specific route lookup command to identify the LSP circuit ID, which can then be used for tracing the LSP data path. For more information, see “Examining LSP Data Paths” on page 4-33.
The syntax of the show ip route command is:
show ip route {destination-ip} {card-number} {fe-number}
The following parameters are used with the show ip route command:
• destination-ip specifies the destination IP address or the virtual network IP address of the egress card.
• card-number indicates the ingress card on the ingress switch.
• fe-number specifies the forwarding engine identification number.
The show mpt vcarray command is used to determine whether the packets are using the LSP circuit by examining the OFrame (outgoing frames) counters on the egress card. Using the VCI identified in the forwarding table entry, identify whether the OFrame counters are incrementing. If the count is increasing, then the data is using the LSP circuit.
The syntax of the show mpt vcarray command is:
show mpt vcarray {card-number}
where card-number specifies the ingress card on the ingress switch.
A route lookup must be performed on an ingress card that supports IP Routing. A route lookup performed on a CP/SP or a card that does not support IP Routing may not show accurate LSP information, and data may appear to be forwarded hop-by-hop.
If the ingress or egress card is a cell trunk, you must perform the route lookup using a card/Lport that supports IP Routing.
4-22 NavisCore Troubleshooting Guide
Beta Draft ConfidentialTroubleshooting IP Navigator Problems
Label Switched Paths
Using LSPs over Frame Trunks
LSPs can traverse ATM and Frame trunks. For LSPs to take advantage of Quality of Service (QoS) traffic options over a frame trunk, the frame trunk Lport must be configured for Priority Frame Multi-class. When you select multi-class, Frame Relay QoS is enabled and all QoS classes are supported. The multi-class setting default transmit scheduling mode is “Fixed Priority”. See the NavisCore Frame Relay Configuration Guide for more information on configuring Priority Frame Multi-class.
Use the NMS to configure the Lport Priority Frame Multi-class attribute.
Using LSPs over OPTimum Cell Trunks
On CBX 500 switches, IP Navigator assigns a virtual path connection (VPC) to each MPT LSP or point-to-point LSP crossing an OPTimum trunk. On B-STDX 8000/9000 switches, IP Navigator assigns a virtual channel Connection (VCC) to each MPT LSP or point-to-point LSP crossing an OPTimum trunk.
Before IP Navigator can assign VPCs and VCCs, you must configure specific VPI values for each logical port endpoint of the OPTimum trunk. The VPI value is required for MPT LSP and point-to-point LSPs because they are bi-directional. The VPI value is not required for a multicast LSP because it is not bi-directional.
See the NavisCore IP Configuration Guide for more information on configuring LSP parameters for ATM OPTimum cell trunks.
Understanding LSPs and Quality of Service
Quality of service (QOS) refers to the performance attributes of an end-to-end connection. The particular elements of a QoS definition depend on the information being transported. Typically, a lower cost QoS service costs less.
LSPs support the following Class of Service:
MPT LSPs — Supports unspecified bit rate (UBR), and a circuit priority of 3. The class and priority are not configurable.
Point-to-point LSPs — Supports either variable bit rate - real time (VBR-RT) and variable bit rate - non-real time (VBR-NRT), and a circuit priority of 1-3. These classes and priorities are configurable.
Multicast LSPs — Supports available bit rate (ABR). The class and priority are not configurable.
Point-to-point LSP traffic descriptors only apply to ATM trunks. When the point-to-point LSP traverses Frame trunks, best-effort guarantees are made to meet the CIR.
NavisCore Troubleshooting Guide 4-23
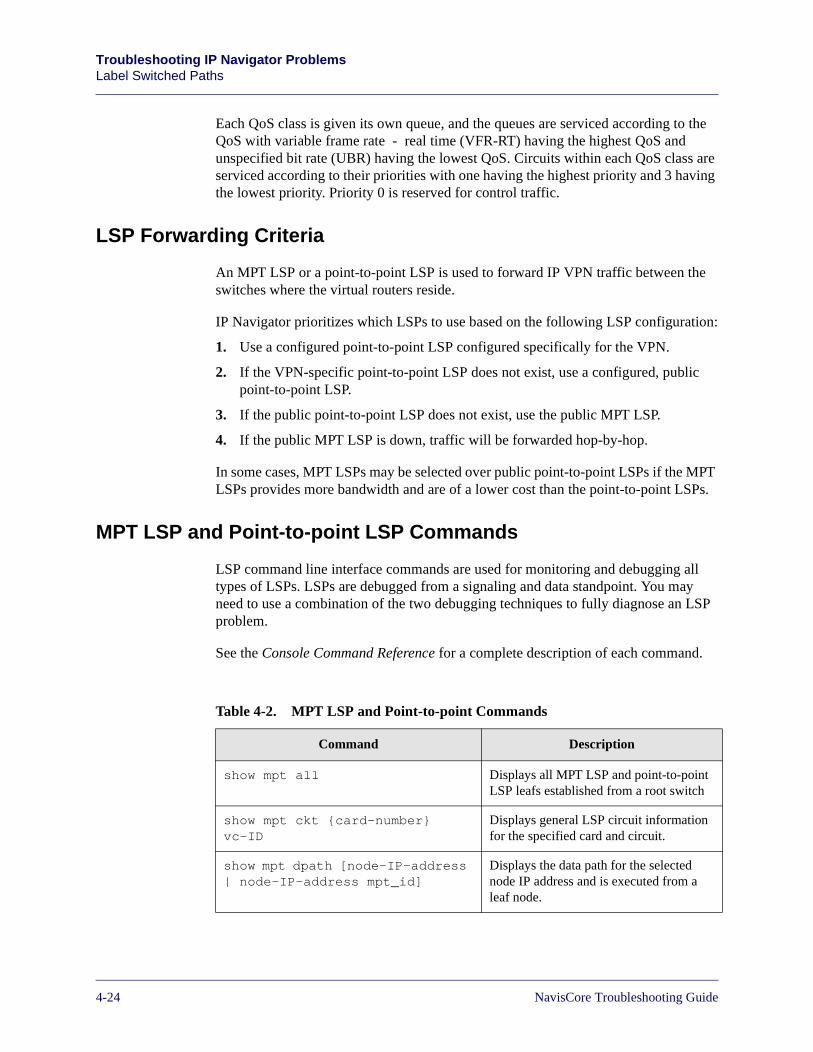
Beta Draft ConfidentialTroubleshooting IP Navigator ProblemsLabel Switched Paths
Each QoS class is given its own queue, and the queues are serviced according to the QoS with variable frame rate - real time (VFR-RT) having the highest QoS and unspecified bit rate (UBR) having the lowest QoS. Circuits within each QoS class are serviced according to their priorities with one having the highest priority and 3 having the lowest priority. Priority 0 is reserved for control traffic.
LSP Forwarding Criteria
An MPT LSP or a point-to-point LSP is used to forward IP VPN traffic between the switches where the virtual routers reside.
IP Navigator prioritizes which LSPs to use based on the following LSP configuration:
1. Use a configured point-to-point LSP configured specifically for the VPN.
2. If the VPN-specific point-to-point LSP does not exist, use a configured, public point-to-point LSP.
3. If the public point-to-point LSP does not exist, use the public MPT LSP.
4. If the public MPT LSP is down, traffic will be forwarded hop-by-hop.
In some cases, MPT LSPs may be selected over public point-to-point LSPs if the MPT LSPs provides more bandwidth and are of a lower cost than the point-to-point LSPs.
MPT LSP and Point-to-point LSP Commands
LSP command line interface commands are used for monitoring and debugging all types of LSPs. LSPs are debugged from a signaling and data standpoint. You may need to use a combination of the two debugging techniques to fully diagnose an LSP problem.
See the Console Command Reference for a complete description of each command.
Table 4-2. MPT LSP and Point-to-point Commands
Command Description
show mpt all Displays all MPT LSP and point-to-point LSP leafs established from a root switch
show mpt ckt {card-number} vc-ID
Displays general LSP circuit information for the specified card and circuit.
show mpt dpath [node-IP-address | node-IP-address mpt_id]
Displays the data path for the selected node IP address and is executed from a leaf node.
4-24 NavisCore Troubleshooting Guide
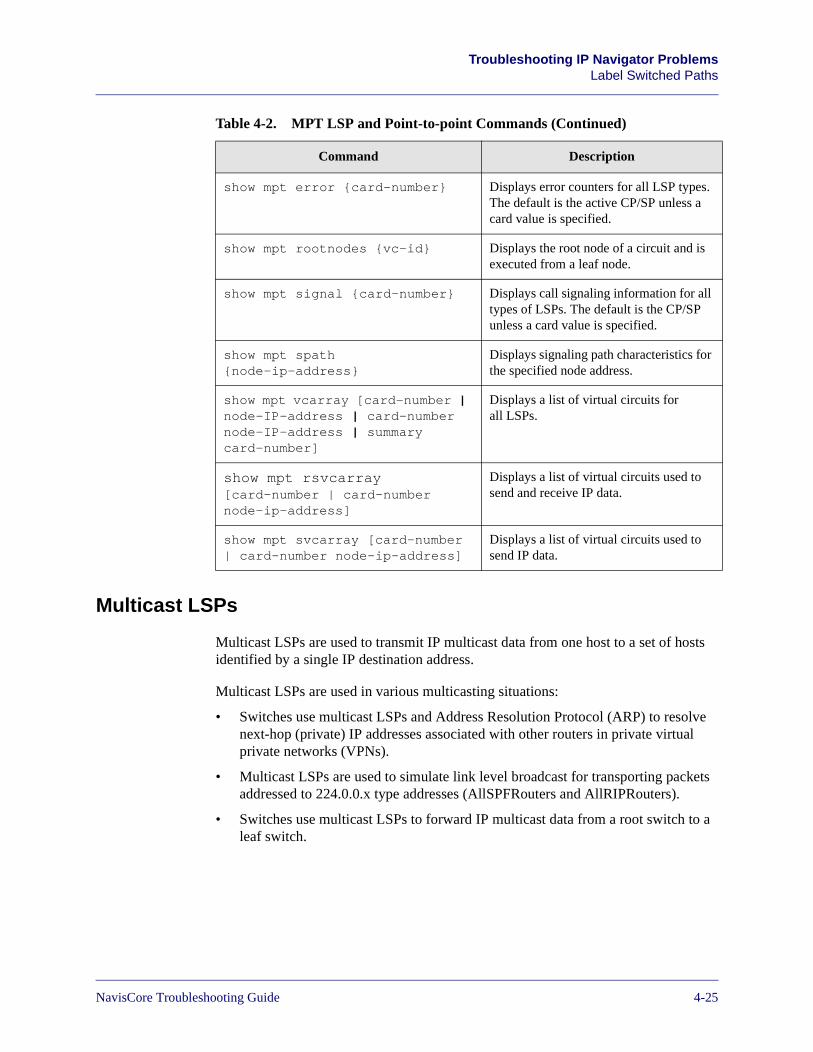
Beta Draft ConfidentialTroubleshooting IP Navigator Problems
Label Switched Paths
Multicast LSPs
Multicast LSPs are used to transmit IP multicast data from one host to a set of hosts identified by a single IP destination address.
Multicast LSPs are used in various multicasting situations:
• Switches use multicast LSPs and Address Resolution Protocol (ARP) to resolve next-hop (private) IP addresses associated with other routers in private virtual private networks (VPNs).
• Multicast LSPs are used to simulate link level broadcast for transporting packets addressed to 224.0.0.x type addresses (AllSPFRouters and AllRIPRouters).
• Switches use multicast LSPs to forward IP multicast data from a root switch to a leaf switch.
show mpt error {card-number} Displays error counters for all LSP types. The default is the active CP/SP unless a card value is specified.
show mpt rootnodes {vc-id} Displays the root node of a circuit and is executed from a leaf node.
show mpt signal {card-number} Displays call signaling information for all types of LSPs. The default is the CP/SP unless a card value is specified.
show mpt spath {node-ip-address}
Displays signaling path characteristics for the specified node address.
show mpt vcarray [card-number | node-IP-address | card-number node-IP-address | summary card-number]
Displays a list of virtual circuits for all LSPs.
show mpt rsvcarray [card-number | card-number node-ip-address]
Displays a list of virtual circuits used to send and receive IP data.
show mpt svcarray [card-number | card-number node-ip-address]
Displays a list of virtual circuits used to send IP data.
Table 4-2. MPT LSP and Point-to-point Commands (Continued)
Command Description
NavisCore Troubleshooting Guide 4-25
Beta Draft ConfidentialTroubleshooting IP Navigator ProblemsLabel Switched Paths
How a Multicast LSP is Created
When a root switch needs to forward IP multicast data to a particular multicast group, it checks whether a multicast LSP already exists. If it does, the root switch uses this circuit to forward data to the multicast group members. If the circuit does not exist, the root switch sets up a connection to each leaf switch, and forwards the data to the multicast group members. Multicast packets are routed until the multicast LSP is fully initialized.
The show fmpt all command is used to display all multicast LSPs rooted at the switch.
How to Identify the Leaves of a Multicast LSP
A multicast LSP is rooted at a switch, and each multicast leaf represents the source endpoint node and forwarding engine (FE) state of the leafs. The leaves of a multicast LSP can be identified by using the show fmpt card command.
The syntax of the show fmpt card command is:
show fmpt card card-number node mpt-ID
The following parameters are used with the show fmpt card command:
• card-number is the card the multicast LSP is rooted on. That is, 1 for for LSPs rooted on a CP/SP and 3 through 16 for LSPs rooted on an IOM2 on a CBX 500 switch.
• mpt-ID represents an MPT Identifier value
The values for card-number and mpt-ID are derived from the show fmpt all display output. Both values must be selected from the same line.
What Happens When a Multicast Member Joins or Leaves a Group
IP multicast traffic is transmitted from the source to the destination via a spanning tree that connects all the hosts in the group. Different IP multicast routing protocols use different techniques to construct these trees. All multicast traffic is distributed through this tree once it is constructed. A host joins a multicast group through use of the Internet Group Management Protocol (IGMP). This protocol allows hosts to register as members of a particular multicast group. For details about IP multicast routing, see the IP Navigator Configuration Guide.
When a multicast group member joins or leaves a multicast group, the current multicast LSP is set to inactive and all multicast packets are temporarily routed until a new multicast LSP is established to the remaining multicast members.
4-26 NavisCore Troubleshooting Guide
Beta Draft ConfidentialTroubleshooting IP Navigator Problems
Label Switched Paths
Why a Multicast LSP Becomes Inactive
A multicast LSP is set to inactive if a leaf endpoint failure occurs. A leaf endpoint may fail because a trunk has failed between the leaf switch and the root switch. The multicast packets are then routed until a new multicast LSP is established between the root and leaf endpoints.
When a root switch stops transmitting IP multicast data to group members, the active multicast LSP becomes inactive. Multicast LSPs in the inactive state will be de-allocated after one hour. If the root switch receives IP multicast data that matches the source/destination IP address criteria, the inactive multicast LSP will become active. A multicast LSP may also become inactive when a new multicast LSP is being formed due to a member change.
To determine if a multicast LSP is active or inactive, use the show fmpt all command to display the state condition of the LSP.
Multicast LSP Commands
The show fmpt <card-number> commands are used to display multicast LSP information for LSPs rooted on a specified card. Note that card 1 specifies multicast LSPs rooted at a CP/SP, and cards 3-16 specify multicast LSPs rooted at a IOM2 on a CBX 500 switch.
See the Console Command Reference for a complete description of each command.
The show mpt command is replaced by the show fmpt command in software greater than or equal to B-STDX 8000/9000 06.05.02.00 and CBX 500 03.05.02.00.
NavisCore Troubleshooting Guide 4-27
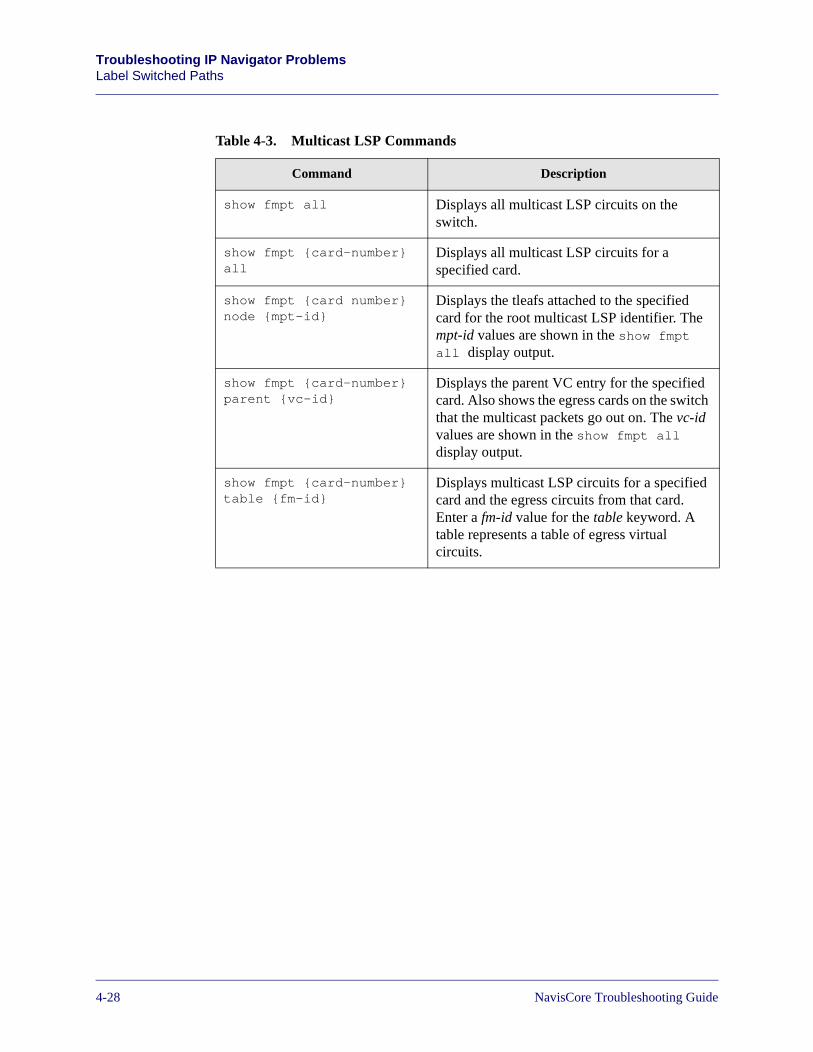
Beta Draft ConfidentialTroubleshooting IP Navigator ProblemsLabel Switched Paths
Table 4-3. Multicast LSP Commands
Command Description
show fmpt all Displays all multicast LSP circuits on the switch.
show fmpt {card-number} all
Displays all multicast LSP circuits for a specified card.
show fmpt {card number} node {mpt-id}
Displays the tleafs attached to the specified card for the root multicast LSP identifier. The mpt-id values are shown in the show fmpt all display output.
show fmpt {card-number} parent {vc-id}
Displays the parent VC entry for the specified card. Also shows the egress cards on the switch that the multicast packets go out on. The vc-id values are shown in the show fmpt all display output.
show fmpt {card-number} table {fm-id}
Displays multicast LSP circuits for a specified card and the egress circuits from that card. Enter a fm-id value for the table keyword. A table represents a table of egress virtual circuits.
4-28 NavisCore Troubleshooting Guide
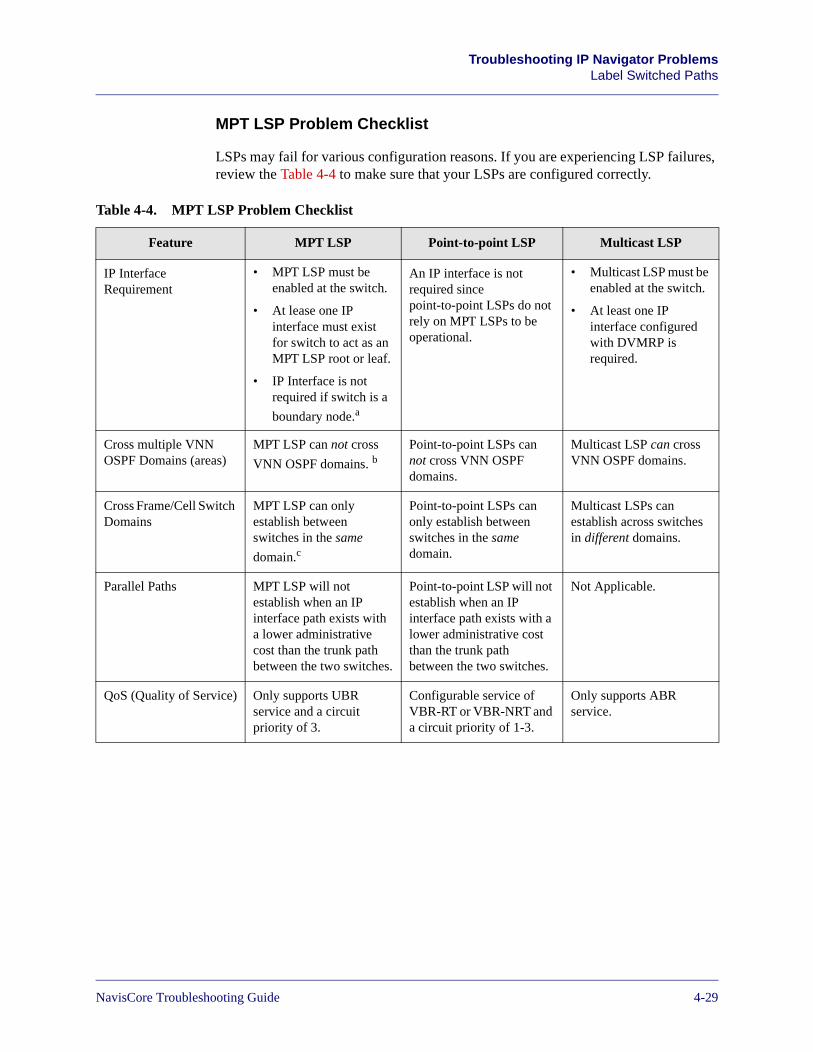
Beta Draft ConfidentialTroubleshooting IP Navigator Problems
Label Switched Paths
MPT LSP Problem Checklist
LSPs may fail for various configuration reasons. If you are experiencing LSP failures, review the Table 4-4 to make sure that your LSPs are configured correctly.
Table 4-4. MPT LSP Problem Checklist
Feature MPT LSP Point-to-point LSP Multicast LSP
IP Interface Requirement
• MPT LSP must be enabled at the switch.
• At lease one IP interface must exist for switch to act as an MPT LSP root or leaf.
• IP Interface is not required if switch is a
boundary node.a
An IP interface is not required since point-to-point LSPs do not rely on MPT LSPs to be operational.
• Multicast LSP must be enabled at the switch.
• At least one IP interface configured with DVMRP is required.
Cross multiple VNN OSPF Domains (areas)
MPT LSP can not cross
VNN OSPF domains. bPoint-to-point LSPs can not cross VNN OSPF domains.
Multicast LSP can cross VNN OSPF domains.
Cross Frame/Cell Switch Domains
MPT LSP can only establish between switches in the same
domain.c
Point-to-point LSPs can only establish between switches in the same domain.
Multicast LSPs can establish across switches in different domains.
Parallel Paths MPT LSP will not establish when an IP interface path exists with a lower administrative cost than the trunk path between the two switches.
Point-to-point LSP will not establish when an IP interface path exists with a lower administrative cost than the trunk path between the two switches.
Not Applicable.
QoS (Quality of Service) Only supports UBR service and a circuit priority of 3.
Configurable service of VBR-RT or VBR-NRT and a circuit priority of 1-3.
Only supports ABR service.
NavisCore Troubleshooting Guide 4-29
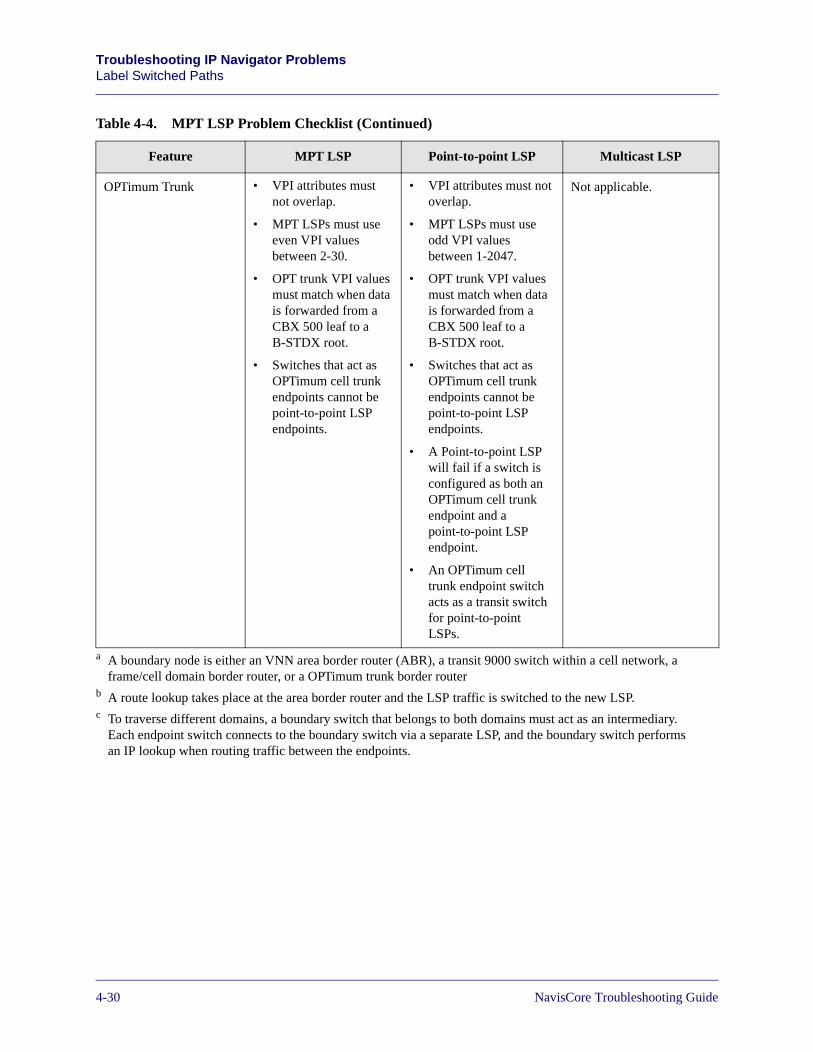
Beta Draft ConfidentialTroubleshooting IP Navigator ProblemsLabel Switched Paths
OPTimum Trunk • VPI attributes must not overlap.
• MPT LSPs must use even VPI values between 2-30.
• OPT trunk VPI values must match when data is forwarded from a CBX 500 leaf to a B-STDX root.
• Switches that act as OPTimum cell trunk endpoints cannot be point-to-point LSP endpoints.
• VPI attributes must not overlap.
• MPT LSPs must use odd VPI values between 1-2047.
• OPT trunk VPI values must match when data is forwarded from a CBX 500 leaf to a B-STDX root.
• Switches that act as OPTimum cell trunk endpoints cannot be point-to-point LSP endpoints.
• A Point-to-point LSP will fail if a switch is configured as both an OPTimum cell trunk endpoint and a point-to-point LSP endpoint.
• An OPTimum cell trunk endpoint switch acts as a transit switch for point-to-point LSPs.
Not applicable.
a A boundary node is either an VNN area border router (ABR), a transit 9000 switch within a cell network, a frame/cell domain border router, or a OPTimum trunk border router
b A route lookup takes place at the area border router and the LSP traffic is switched to the new LSP.c To traverse different domains, a boundary switch that belongs to both domains must act as an intermediary.
Each endpoint switch connects to the boundary switch via a separate LSP, and the boundary switch performs an IP lookup when routing traffic between the endpoints.
Table 4-4. MPT LSP Problem Checklist (Continued)
Feature MPT LSP Point-to-point LSP Multicast LSP
4-30 NavisCore Troubleshooting Guide
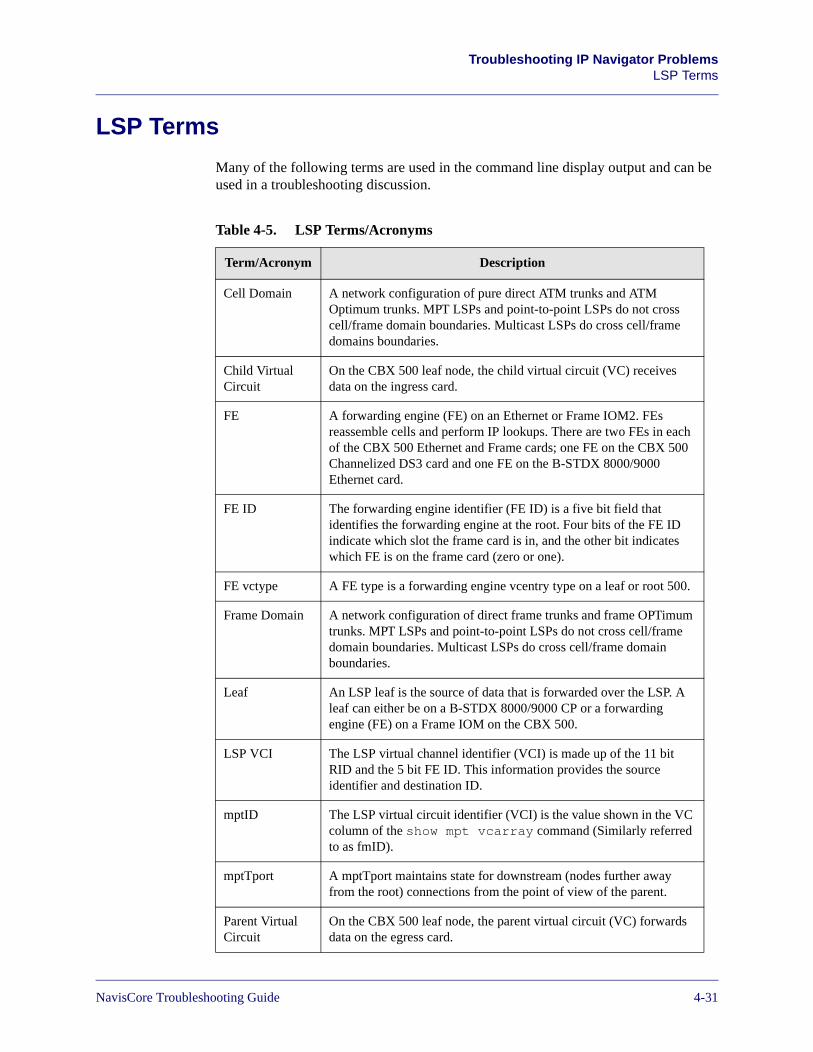
Beta Draft ConfidentialTroubleshooting IP Navigator Problems
LSP Terms
LSP Terms
Many of the following terms are used in the command line display output and can be used in a troubleshooting discussion.
Table 4-5. LSP Terms/Acronyms
Term/Acronym Description
Cell Domain A network configuration of pure direct ATM trunks and ATM Optimum trunks. MPT LSPs and point-to-point LSPs do not cross cell/frame domain boundaries. Multicast LSPs do cross cell/frame domains boundaries.
Child Virtual Circuit
On the CBX 500 leaf node, the child virtual circuit (VC) receives data on the ingress card.
FE A forwarding engine (FE) on an Ethernet or Frame IOM2. FEs reassemble cells and perform IP lookups. There are two FEs in each of the CBX 500 Ethernet and Frame cards; one FE on the CBX 500 Channelized DS3 card and one FE on the B-STDX 8000/9000 Ethernet card.
FE ID The forwarding engine identifier (FE ID) is a five bit field that identifies the forwarding engine at the root. Four bits of the FE ID indicate which slot the frame card is in, and the other bit indicates which FE is on the frame card (zero or one).
FE vctype A FE type is a forwarding engine vcentry type on a leaf or root 500.
Frame Domain A network configuration of direct frame trunks and frame OPTimum trunks. MPT LSPs and point-to-point LSPs do not cross cell/frame domain boundaries. Multicast LSPs do cross cell/frame domain boundaries.
Leaf An LSP leaf is the source of data that is forwarded over the LSP. A leaf can either be on a B-STDX 8000/9000 CP or a forwarding engine (FE) on a Frame IOM on the CBX 500.
LSP VCI The LSP virtual channel identifier (VCI) is made up of the 11 bit RID and the 5 bit FE ID. This information provides the source identifier and destination ID.
mptID The LSP virtual circuit identifier (VCI) is the value shown in the VC column of the show mpt vcarray command (Similarly referred to as fmID).
mptTport A mptTport maintains state for downstream (nodes further away from the root) connections from the point of view of the parent.
Parent Virtual Circuit
On the CBX 500 leaf node, the parent virtual circuit (VC) forwards data on the egress card.
NavisCore Troubleshooting Guide 4-31
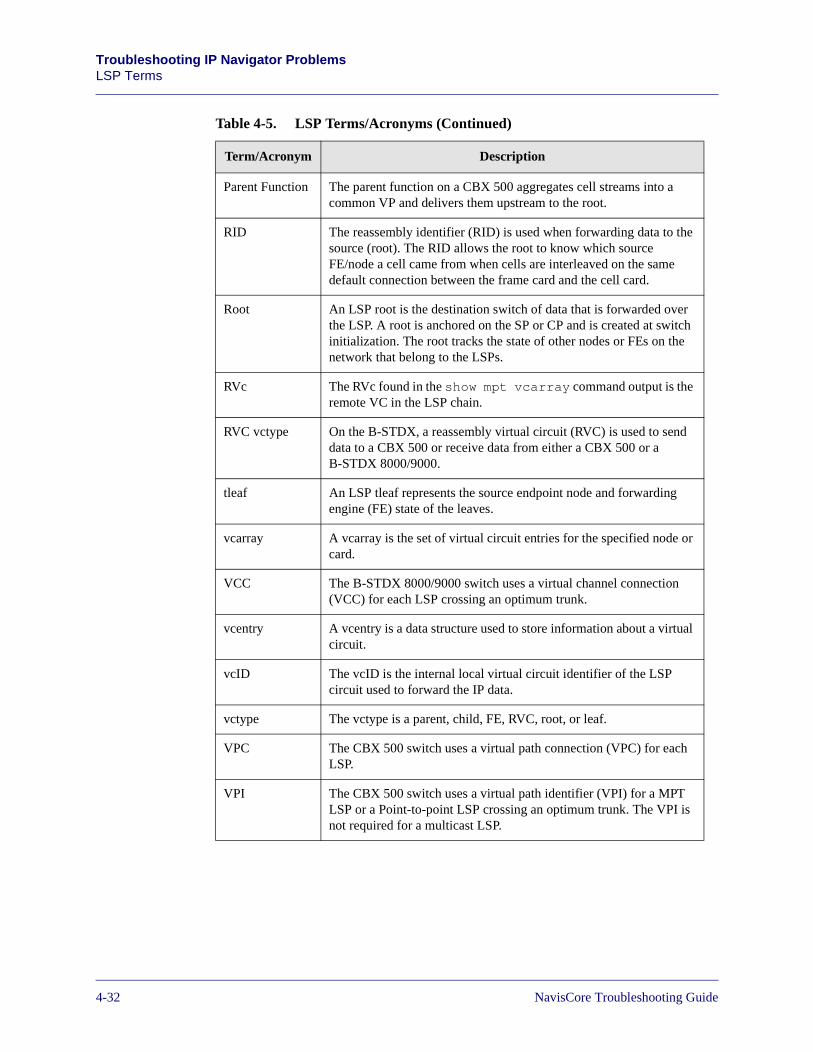
Beta Draft ConfidentialTroubleshooting IP Navigator ProblemsLSP Terms
Parent Function The parent function on a CBX 500 aggregates cell streams into a common VP and delivers them upstream to the root.
RID The reassembly identifier (RID) is used when forwarding data to the source (root). The RID allows the root to know which source FE/node a cell came from when cells are interleaved on the same default connection between the frame card and the cell card.
Root An LSP root is the destination switch of data that is forwarded over the LSP. A root is anchored on the SP or CP and is created at switch initialization. The root tracks the state of other nodes or FEs on the network that belong to the LSPs.
RVc The RVc found in the show mpt vcarray command output is the remote VC in the LSP chain.
RVC vctype On the B-STDX, a reassembly virtual circuit (RVC) is used to send data to a CBX 500 or receive data from either a CBX 500 or a B-STDX 8000/9000.
tleaf An LSP tleaf represents the source endpoint node and forwarding engine (FE) state of the leaves.
vcarray A vcarray is the set of virtual circuit entries for the specified node or card.
VCC The B-STDX 8000/9000 switch uses a virtual channel connection (VCC) for each LSP crossing an optimum trunk.
vcentry A vcentry is a data structure used to store information about a virtual circuit.
vcID The vcID is the internal local virtual circuit identifier of the LSP circuit used to forward the IP data.
vctype The vctype is a parent, child, FE, RVC, root, or leaf.
VPC The CBX 500 switch uses a virtual path connection (VPC) for each LSP.
VPI The CBX 500 switch uses a virtual path identifier (VPI) for a MPT LSP or a Point-to-point LSP crossing an optimum trunk. The VPI is not required for a multicast LSP.
Table 4-5. LSP Terms/Acronyms (Continued)
Term/Acronym Description
4-32 NavisCore Troubleshooting Guide
Beta Draft ConfidentialTroubleshooting IP Navigator Problems
Examining LSP Data Paths
Examining LSP Data Paths
The data path of an MPT LSP and a point-to-point LSP travels begins at the ingress switch and travels through one or more transit switch to the egress switch. For a multicast LSP, the data path travels from the egress switch through a transit switch to the ingress switch. The switch names are:
• The ingress switch and the transit switch are leaf switches.
• Each switch along the data path between the ingress and egress switch is called a transit switch.
• The egress switch is a root switch.
You can examine the data path of an LSP to diagnose IP forwarding problems. The user should be familiar with the network topology in order to identify switches and interfaces in the following sections.
This section includes descriptions of fields shown for each console command display output. Only the fields that are pertinent to the examples are explained. See the Console Command Reference for a complete description of all commands and corresponding display output fields.
How to Examine MPT LSP Data Paths
This section describes how to examine the data path of an MPT LSP in a network of CBX 500 switches connected by cell OPTimum trunks. In this example, IP lookups are not required because the LSP is in a pure cell domain and in one VNN OSPF area. Table 4-1 shows the MPT LSP data path network used as an example in this section. Table 4-6 on page 4-35 shows the MPT LSP data path identification process.
In Figure 4-1, MPT LSP tracing begins at the ingress switch that is closest to the data source and continues as follows:
• The customer premise equipment (CPE) data source transmits IP data to an IP destination located on the other side of the network cloud.
• IP data enters the network at the ingress leaf switch (VC type is Parent).
• The data is switched from the ingress leaf switch to the egress root switch via the transit leaf switch.
• IP data exits the network at the egress root switch (VC type is Child).
NavisCore Troubleshooting Guide 4-33
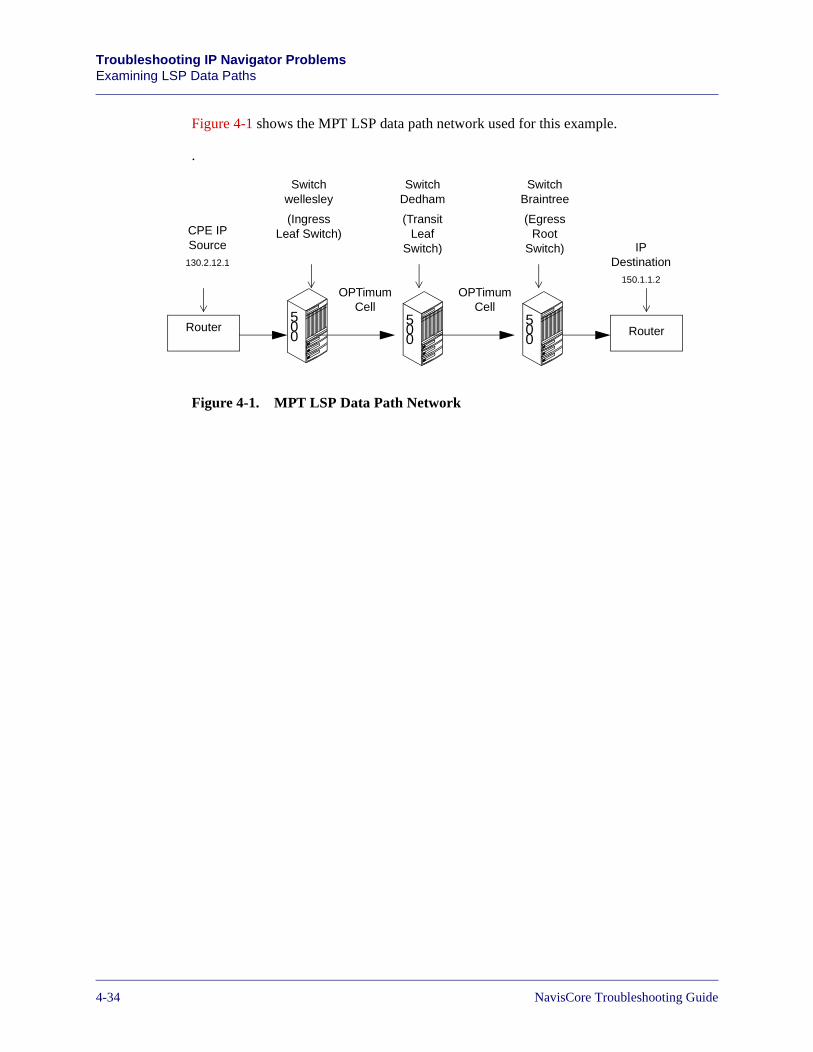
Beta Draft ConfidentialTroubleshooting IP Navigator ProblemsExamining LSP Data Paths
Figure 4-1 shows the MPT LSP data path network used for this example.
.
Figure 4-1. MPT LSP Data Path Network
OPTimum Cell
500
500
500
RouterRouter
OPTimum Cell
Switch wellesley
(Ingress Leaf Switch)
IP Destination
150.1.1.2
Switch Braintree
(Egress Root
Switch)
Switch Dedham
(Transit Leaf
Switch)
CPE IP Source
130.2.12.1
4-34 NavisCore Troubleshooting Guide
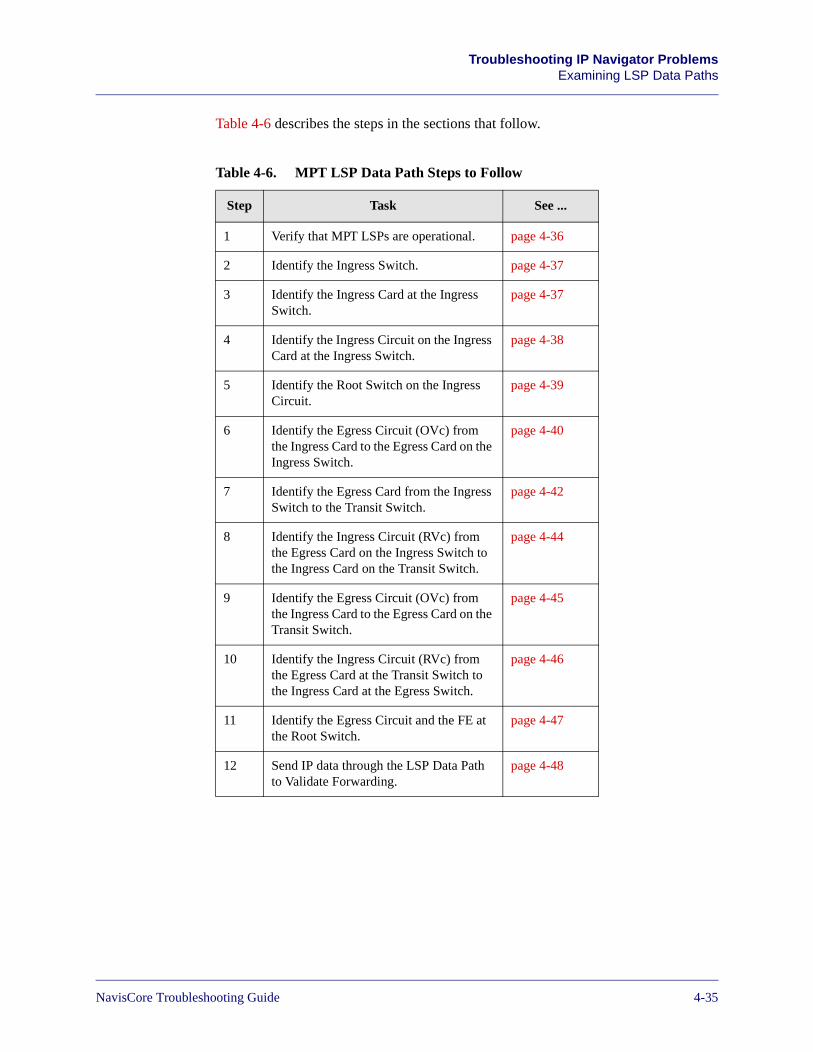
Beta Draft ConfidentialTroubleshooting IP Navigator Problems
Examining LSP Data Paths
Table 4-6 describes the steps in the sections that follow.
Table 4-6. MPT LSP Data Path Steps to Follow
Step Task See ...
1 Verify that MPT LSPs are operational. page 4-36
2 Identify the Ingress Switch. page 4-37
3 Identify the Ingress Card at the Ingress Switch.
page 4-37
4 Identify the Ingress Circuit on the Ingress Card at the Ingress Switch.
page 4-38
5 Identify the Root Switch on the Ingress Circuit.
page 4-39
6 Identify the Egress Circuit (OVc) from the Ingress Card to the Egress Card on the Ingress Switch.
page 4-40
7 Identify the Egress Card from the Ingress Switch to the Transit Switch.
page 4-42
8 Identify the Ingress Circuit (RVc) from the Egress Card on the Ingress Switch to the Ingress Card on the Transit Switch.
page 4-44
9 Identify the Egress Circuit (OVc) from the Ingress Card to the Egress Card on the Transit Switch.
page 4-45
10 Identify the Ingress Circuit (RVc) from the Egress Card at the Transit Switch to the Ingress Card at the Egress Switch.
page 4-46
11 Identify the Egress Circuit and the FE at the Root Switch.
page 4-47
12 Send IP data through the LSP Data Path to Validate Forwarding.
page 4-48
NavisCore Troubleshooting Guide 4-35
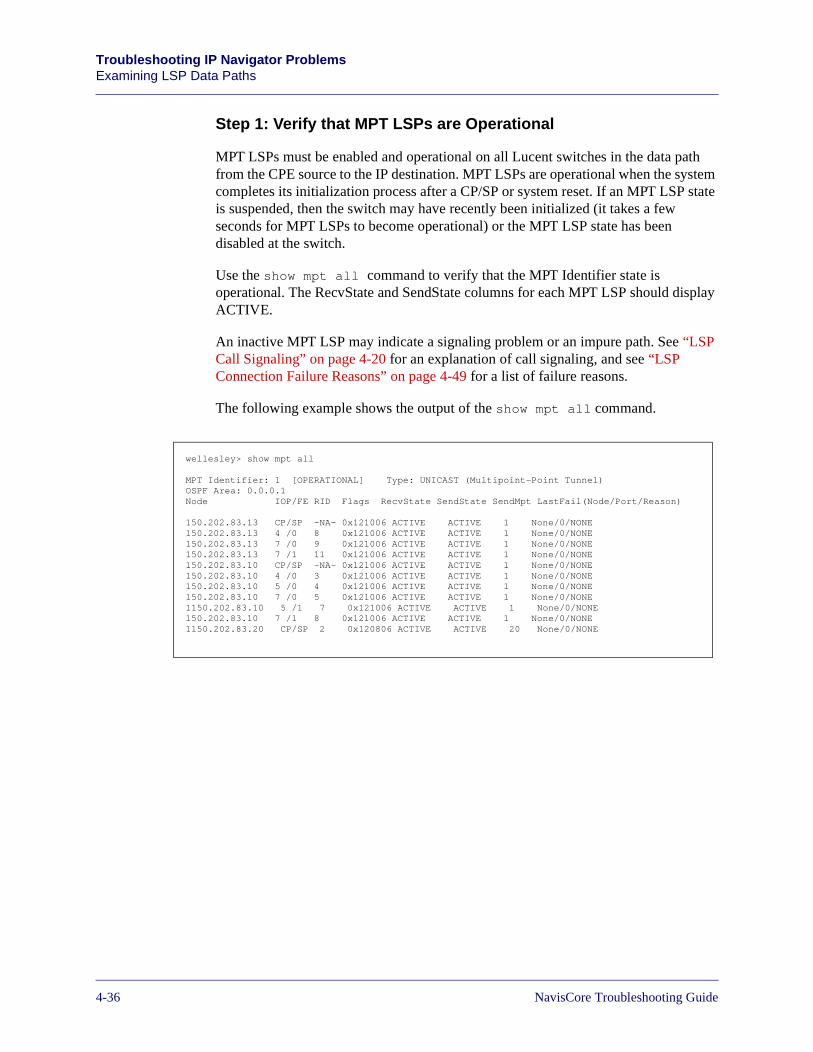
Beta Draft ConfidentialTroubleshooting IP Navigator ProblemsExamining LSP Data Paths
Step 1: Verify that MPT LSPs are Operational
MPT LSPs must be enabled and operational on all Lucent switches in the data path from the CPE source to the IP destination. MPT LSPs are operational when the system completes its initialization process after a CP/SP or system reset. If an MPT LSP state is suspended, then the switch may have recently been initialized (it takes a few seconds for MPT LSPs to become operational) or the MPT LSP state has been disabled at the switch.
Use the show mpt all command to verify that the MPT Identifier state is operational. The RecvState and SendState columns for each MPT LSP should display ACTIVE.
An inactive MPT LSP may indicate a signaling problem or an impure path. See “LSP Call Signaling” on page 4-20 for an explanation of call signaling, and see “LSP Connection Failure Reasons” on page 4-49 for a list of failure reasons.
The following example shows the output of the show mpt all command.
wellesley> show mpt all
MPT Identifier: 1 [OPERATIONAL] Type: UNICAST (Multipoint-Point Tunnel) OSPF Area: 0.0.0.1Node IOP/FE RID Flags RecvState SendState SendMpt LastFail(Node/Port/Reason)
150.202.83.13 CP/SP -NA- 0x121006 ACTIVE ACTIVE 1 None/0/NONE150.202.83.13 4 /0 8 0x121006 ACTIVE ACTIVE 1 None/0/NONE150.202.83.13 7 /0 9 0x121006 ACTIVE ACTIVE 1 None/0/NONE150.202.83.13 7 /1 11 0x121006 ACTIVE ACTIVE 1 None/0/NONE150.202.83.10 CP/SP -NA- 0x121006 ACTIVE ACTIVE 1 None/0/NONE150.202.83.10 4 /0 3 0x121006 ACTIVE ACTIVE 1 None/0/NONE150.202.83.10 5 /0 4 0x121006 ACTIVE ACTIVE 1 None/0/NONE150.202.83.10 7 /0 5 0x121006 ACTIVE ACTIVE 1 None/0/NONE1150.202.83.10 5 /1 7 0x121006 ACTIVE ACTIVE 1 None/0/NONE150.202.83.10 7 /1 8 0x121006 ACTIVE ACTIVE 1 None/0/NONE1150.202.83.20 CP/SP 2 0x120806 ACTIVE ACTIVE 20 None/0/NONE
4-36 NavisCore Troubleshooting Guide
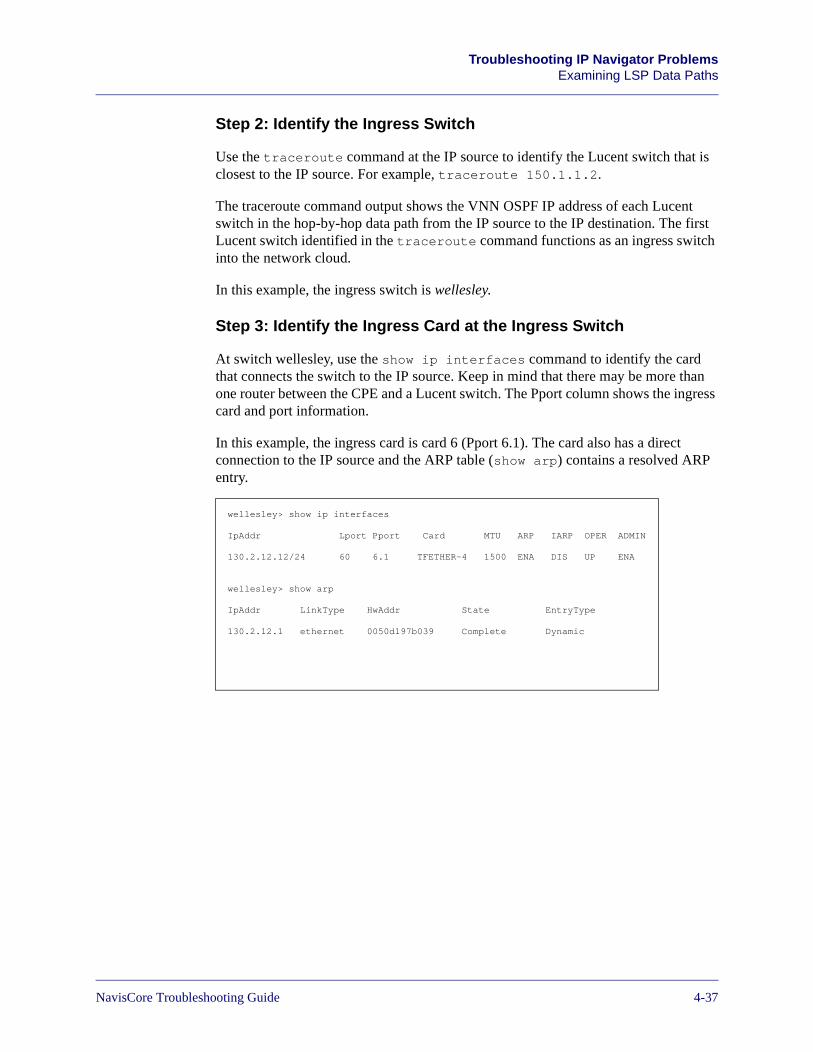
Beta Draft ConfidentialTroubleshooting IP Navigator Problems
Examining LSP Data Paths
Step 2: Identify the Ingress Switch
Use the traceroute command at the IP source to identify the Lucent switch that is closest to the IP source. For example, traceroute 150.1.1.2.
The traceroute command output shows the VNN OSPF IP address of each Lucent switch in the hop-by-hop data path from the IP source to the IP destination. The first Lucent switch identified in the traceroute command functions as an ingress switch into the network cloud.
In this example, the ingress switch is wellesley.
Step 3: Identify the Ingress Card at the Ingress Switch
At switch wellesley, use the show ip interfaces command to identify the card that connects the switch to the IP source. Keep in mind that there may be more than one router between the CPE and a Lucent switch. The Pport column shows the ingress card and port information.
In this example, the ingress card is card 6 (Pport 6.1). The card also has a direct connection to the IP source and the ARP table (show arp) contains a resolved ARP entry.
wellesley> show ip interfaces
IpAddr Lport Pport Card MTU ARP IARP OPER ADMIN
130.2.12.12/24 60 6.1 TFETHER-4 1500 ENA DIS UP ENA
wellesley> show arp
IpAddr LinkType HwAddr State EntryType
130.2.12.1 ethernet 0050d197b039 Complete Dynamic
NavisCore Troubleshooting Guide 4-37
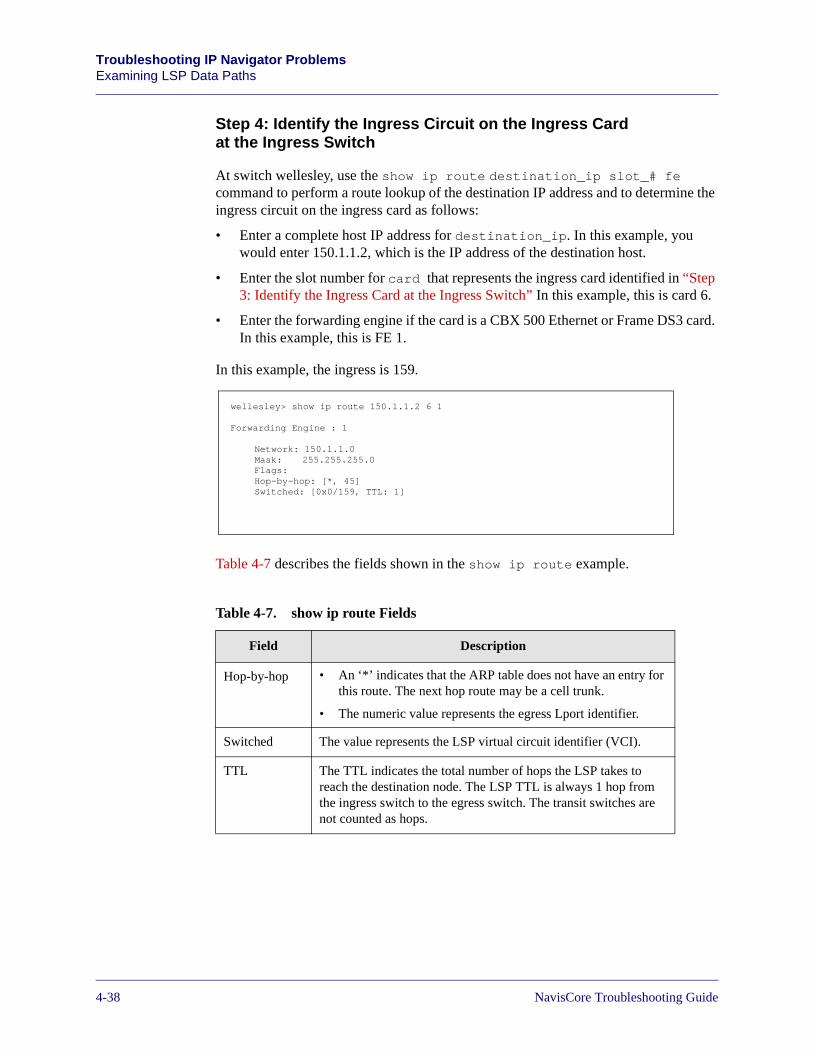
Beta Draft ConfidentialTroubleshooting IP Navigator ProblemsExamining LSP Data Paths
Step 4: Identify the Ingress Circuit on the Ingress Card at the Ingress Switch
At switch wellesley, use the show ip route destination_ip slot_# fe command to perform a route lookup of the destination IP address and to determine the ingress circuit on the ingress card as follows:
• Enter a complete host IP address for destination_ip. In this example, you would enter 150.1.1.2, which is the IP address of the destination host.
• Enter the slot number for card that represents the ingress card identified in “Step 3: Identify the Ingress Card at the Ingress Switch” In this example, this is card 6.
• Enter the forwarding engine if the card is a CBX 500 Ethernet or Frame DS3 card. In this example, this is FE 1.
In this example, the ingress is 159.
Table 4-7 describes the fields shown in the show ip route example.
Table 4-7. show ip route Fields
Field Description
Hop-by-hop • An ‘*’ indicates that the ARP table does not have an entry for this route. The next hop route may be a cell trunk.
• The numeric value represents the egress Lport identifier.
Switched The value represents the LSP virtual circuit identifier (VCI).
TTL The TTL indicates the total number of hops the LSP takes to reach the destination node. The LSP TTL is always 1 hop from the ingress switch to the egress switch. The transit switches are not counted as hops.
wellesley> show ip route 150.1.1.2 6 1
Forwarding Engine : 1
Network: 150.1.1.0Mask: 255.255.255.0Flags: Hop-by-hop: [*, 45]Switched: [0x0/159, TTL: 1]
4-38 NavisCore Troubleshooting Guide
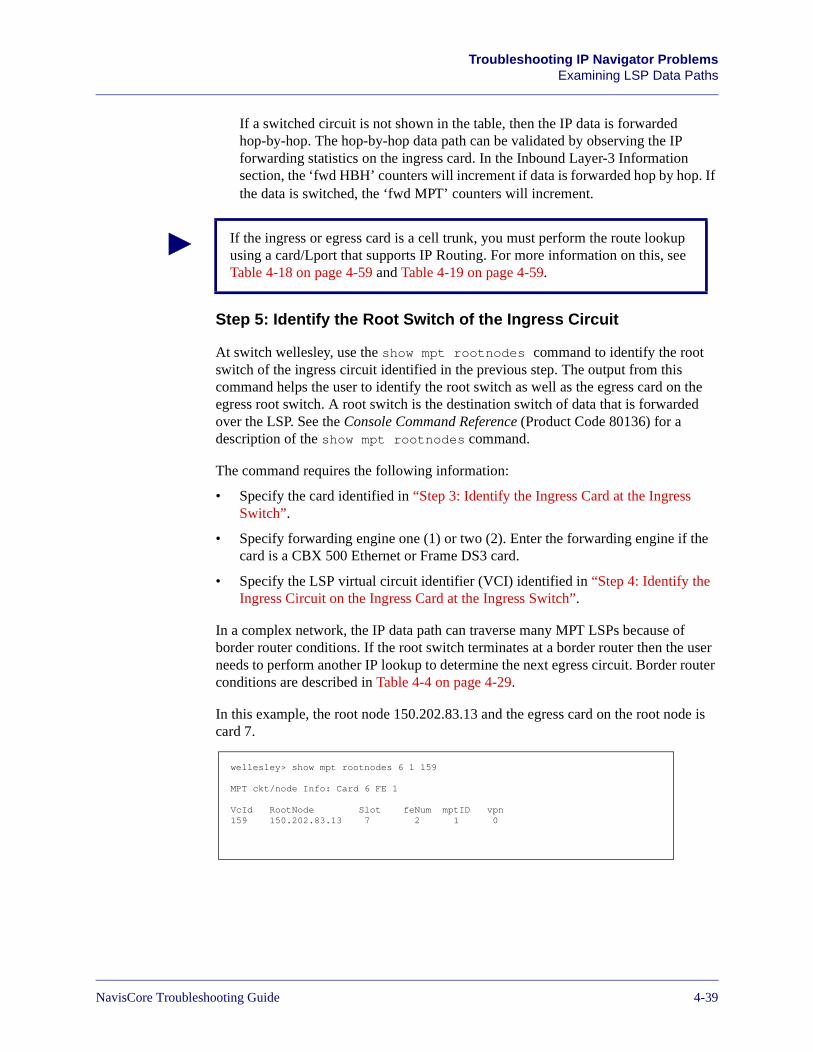
Beta Draft ConfidentialTroubleshooting IP Navigator Problems
Examining LSP Data Paths
If a switched circuit is not shown in the table, then the IP data is forwarded hop-by-hop. The hop-by-hop data path can be validated by observing the IP forwarding statistics on the ingress card. In the Inbound Layer-3 Information section, the ‘fwd HBH’ counters will increment if data is forwarded hop by hop. If the data is switched, the ‘fwd MPT’ counters will increment.
Step 5: Identify the Root Switch of the Ingress Circuit
At switch wellesley, use the show mpt rootnodes command to identify the root switch of the ingress circuit identified in the previous step. The output from this command helps the user to identify the root switch as well as the egress card on the egress root switch. A root switch is the destination switch of data that is forwarded over the LSP. See the Console Command Reference (Product Code 80136) for a description of the show mpt rootnodes command.
The command requires the following information:
• Specify the card identified in “Step 3: Identify the Ingress Card at the Ingress Switch”.
• Specify forwarding engine one (1) or two (2). Enter the forwarding engine if the card is a CBX 500 Ethernet or Frame DS3 card.
• Specify the LSP virtual circuit identifier (VCI) identified in “Step 4: Identify the Ingress Circuit on the Ingress Card at the Ingress Switch”.
In a complex network, the IP data path can traverse many MPT LSPs because of border router conditions. If the root switch terminates at a border router then the user needs to perform another IP lookup to determine the next egress circuit. Border router conditions are described in Table 4-4 on page 4-29.
In this example, the root node 150.202.83.13 and the egress card on the root node is card 7.
If the ingress or egress card is a cell trunk, you must perform the route lookup using a card/Lport that supports IP Routing. For more information on this, see Table 4-18 on page 4-59 and Table 4-19 on page 4-59.
wellesley> show mpt rootnodes 6 1 159
MPT ckt/node Info: Card 6 FE 1
VcId RootNode Slot feNum mptID vpn159 150.202.83.13 7 2 1 0
NavisCore Troubleshooting Guide 4-39
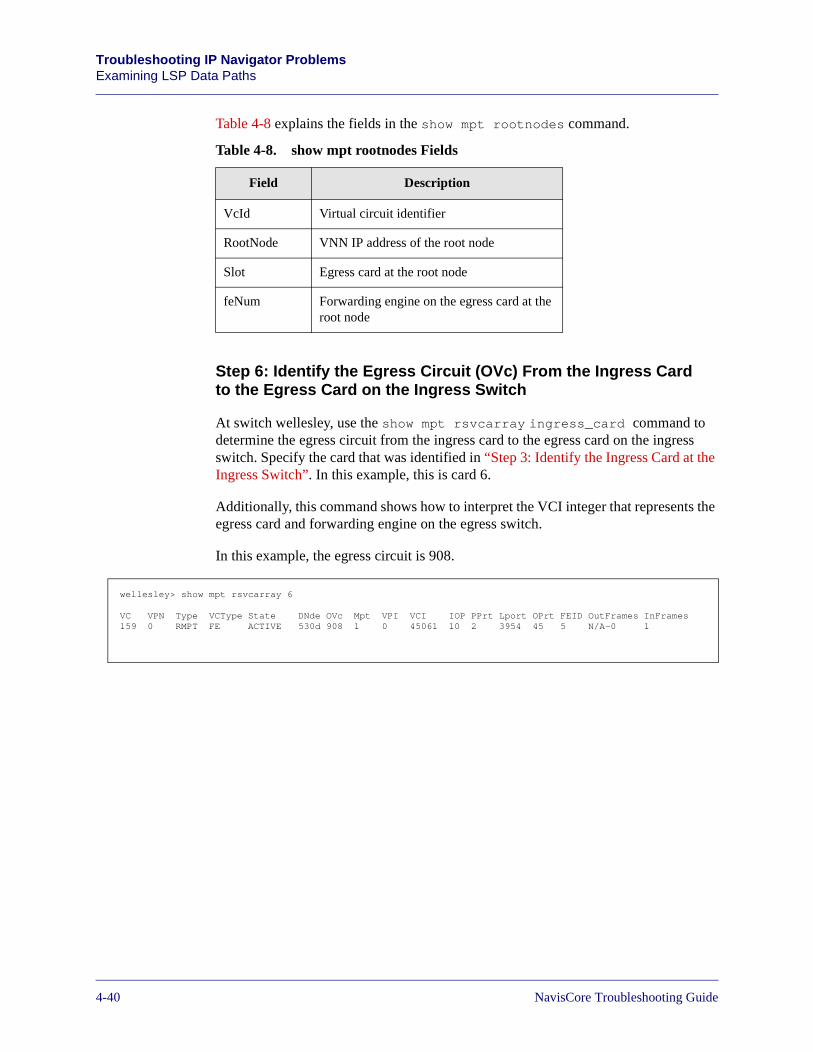
Beta Draft ConfidentialTroubleshooting IP Navigator ProblemsExamining LSP Data Paths
Table 4-8 explains the fields in the show mpt rootnodes command.
Step 6: Identify the Egress Circuit (OVc) From the Ingress Card to the Egress Card on the Ingress Switch
At switch wellesley, use the show mpt rsvcarray ingress_card command to determine the egress circuit from the ingress card to the egress card on the ingress switch. Specify the card that was identified in “Step 3: Identify the Ingress Card at the Ingress Switch”. In this example, this is card 6.
Additionally, this command shows how to interpret the VCI integer that represents the egress card and forwarding engine on the egress switch.
In this example, the egress circuit is 908.
Table 4-8. show mpt rootnodes Fields
Field Description
VcId Virtual circuit identifier
RootNode VNN IP address of the root node
Slot Egress card at the root node
feNum Forwarding engine on the egress card at the root node
wellesley> show mpt rsvcarray 6
VC VPN Type VCType State DNde OVc Mpt VPI VCI IOP PPrt Lport OPrt FEID OutFrames InFrames159 0 RMPT FE ACTIVE 530d 908 1 0 45061 10 2 3954 45 5 N/A-0 1
4-40 NavisCore Troubleshooting Guide
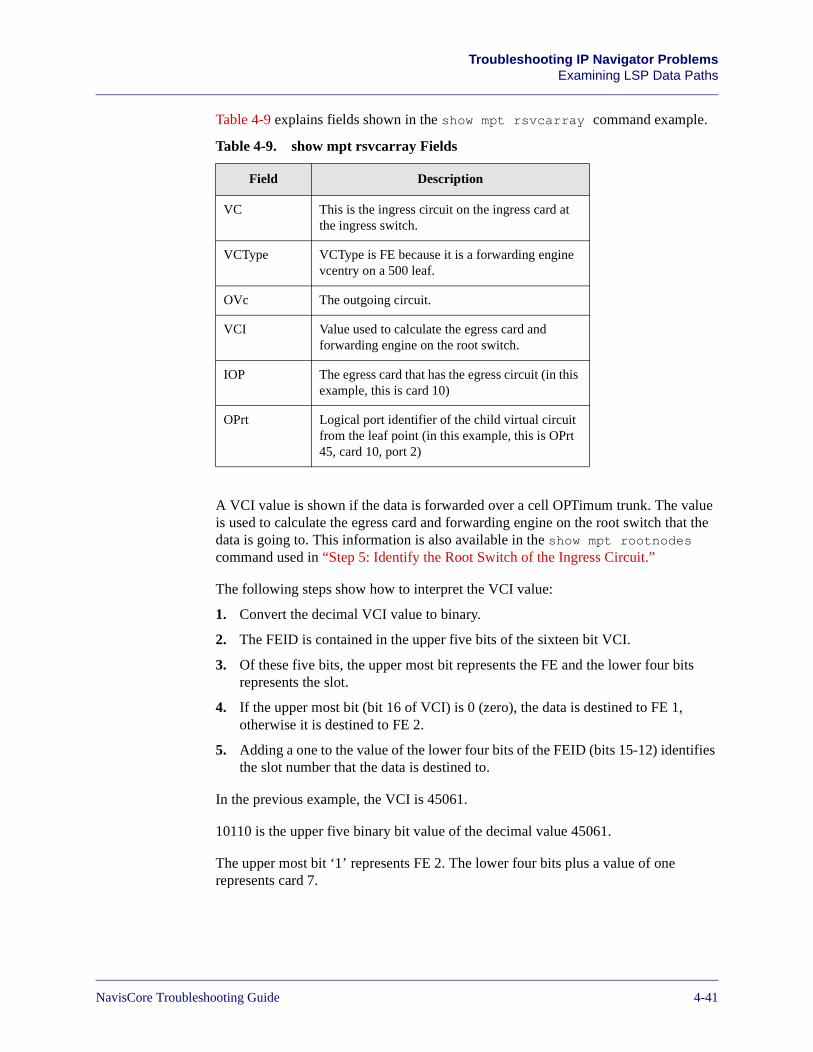
Beta Draft ConfidentialTroubleshooting IP Navigator Problems
Examining LSP Data Paths
Table 4-9 explains fields shown in the show mpt rsvcarray command example.
A VCI value is shown if the data is forwarded over a cell OPTimum trunk. The value is used to calculate the egress card and forwarding engine on the root switch that the data is going to. This information is also available in the show mpt rootnodes command used in “Step 5: Identify the Root Switch of the Ingress Circuit.”
The following steps show how to interpret the VCI value:
1. Convert the decimal VCI value to binary.
2. The FEID is contained in the upper five bits of the sixteen bit VCI.
3. Of these five bits, the upper most bit represents the FE and the lower four bits represents the slot.
4. If the upper most bit (bit 16 of VCI) is 0 (zero), the data is destined to FE 1, otherwise it is destined to FE 2.
5. Adding a one to the value of the lower four bits of the FEID (bits 15-12) identifies the slot number that the data is destined to.
In the previous example, the VCI is 45061.
10110 is the upper five binary bit value of the decimal value 45061.
The upper most bit ‘1’ represents FE 2. The lower four bits plus a value of one represents card 7.
Table 4-9. show mpt rsvcarray Fields
Field Description
VC This is the ingress circuit on the ingress card at the ingress switch.
VCType VCType is FE because it is a forwarding engine vcentry on a 500 leaf.
OVc The outgoing circuit.
VCI Value used to calculate the egress card and forwarding engine on the root switch.
IOP The egress card that has the egress circuit (in this example, this is card 10)
OPrt Logical port identifier of the child virtual circuit from the leaf point (in this example, this is OPrt 45, card 10, port 2)
NavisCore Troubleshooting Guide 4-41

Beta Draft ConfidentialTroubleshooting IP Navigator ProblemsExamining LSP Data Paths
Step 7: Identify the Egress Card From the Ingress Switch to the Transit Switch
There are two methods used to identify the egress card from the ingress switch to the transit switch. You can simply use the IOP value shown in the previous command to determine the egress card or you can use the show mpt spath and show lport statistics <slot>.<port> commands to identify the egress card. The show mpt spath command shows the next transit switch and ingress card in the signaling path to the root switch.
The IOP value from the previous command is card 10. This card is the egress card from the ingress switch to the transit switch.
The show mpt spath command identifies each switch in the signaling path from ingress switch to the root switch. Enter the node_IP_address of the switch identified in “Step 5: Identify the Root Switch of the Ingress Circuit”. In this example, this is IP address 150.202.83.13.
The egress card is derived from the logical port identifier of the first node/Lport pair shown in the show mpt spath display output. In this example, this is node 150.202.83.12 and Lport 45.
wellesley> show mpt spath 150.202.83.13
MPT in VPN 0: List of node/interface pairs in path to node 150.202.83.13: 150.202.83.12/45, 150.202.83.10/156 Path characteristics: PURE_CELL, FOR_IP, FE_ARCH, JADEM1_PATH, OSPF_PATH_REG
4-42 NavisCore Troubleshooting Guide
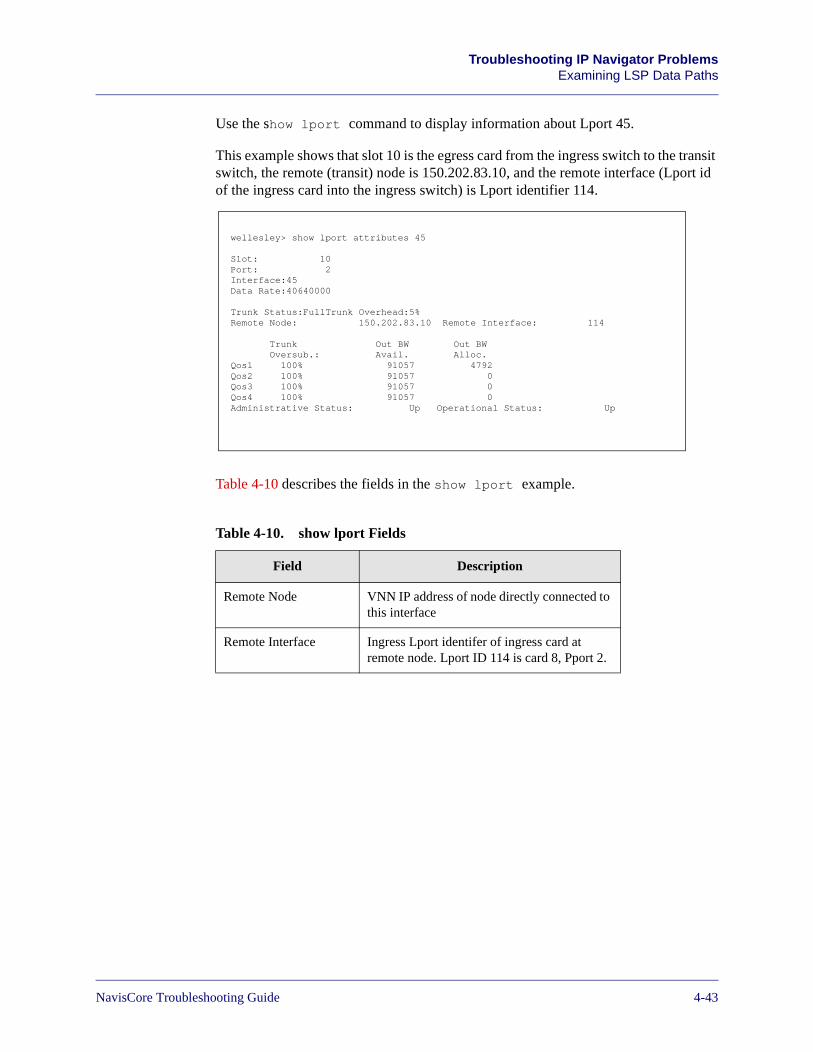
Beta Draft ConfidentialTroubleshooting IP Navigator Problems
Examining LSP Data Paths
Use the show lport command to display information about Lport 45.
This example shows that slot 10 is the egress card from the ingress switch to the transit switch, the remote (transit) node is 150.202.83.10, and the remote interface (Lport id of the ingress card into the ingress switch) is Lport identifier 114.
Table 4-10 describes the fields in the show lport example.
Table 4-10. show lport Fields
Field Description
Remote Node VNN IP address of node directly connected to this interface
Remote Interface Ingress Lport identifer of ingress card at remote node. Lport ID 114 is card 8, Pport 2.
wellesley> show lport attributes 45
Slot: 10Port: 2Interface:45Data Rate:40640000
Trunk Status:FullTrunk Overhead:5%Remote Node: 150.202.83.10 Remote Interface: 114
Trunk Out BW Out BW Oversub.: Avail. Alloc.Qos1 100% 91057 4792Qos2 100% 91057 0Qos3 100% 91057 0Qos4 100% 91057 0Administrative Status: Up Operational Status: Up
NavisCore Troubleshooting Guide 4-43
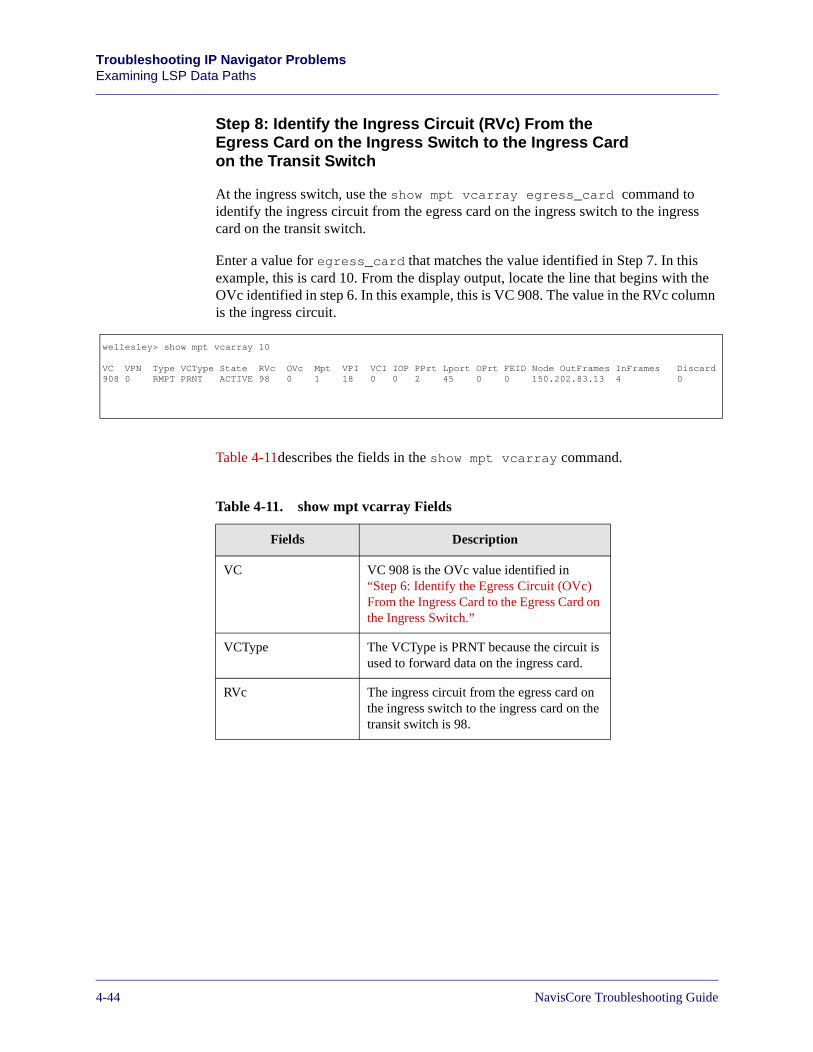
Beta Draft ConfidentialTroubleshooting IP Navigator ProblemsExamining LSP Data Paths
Step 8: Identify the Ingress Circuit (RVc) From the Egress Card on the Ingress Switch to the Ingress Card on the Transit Switch
At the ingress switch, use the show mpt vcarray egress_card command to identify the ingress circuit from the egress card on the ingress switch to the ingress card on the transit switch.
Enter a value for egress_card that matches the value identified in Step 7. In this example, this is card 10. From the display output, locate the line that begins with the OVc identified in step 6. In this example, this is VC 908. The value in the RVc column is the ingress circuit.
Table 4-11describes the fields in the show mpt vcarray command.
wellesley> show mpt vcarray 10
VC VPN Type VCType State RVc OVc Mpt VPI VCI IOP PPrt Lport OPrt FEID Node OutFrames InFrames Discard908 0 RMPT PRNT ACTIVE 98 0 1 18 0 0 2 45 0 0 150.202.83.13 4 0
Table 4-11. show mpt vcarray Fields
Fields Description
VC VC 908 is the OVc value identified in “Step 6: Identify the Egress Circuit (OVc) From the Ingress Card to the Egress Card on the Ingress Switch.”
VCType The VCType is PRNT because the circuit is used to forward data on the ingress card.
RVc The ingress circuit from the egress card on the ingress switch to the ingress card on the transit switch is 98.
4-44 NavisCore Troubleshooting Guide
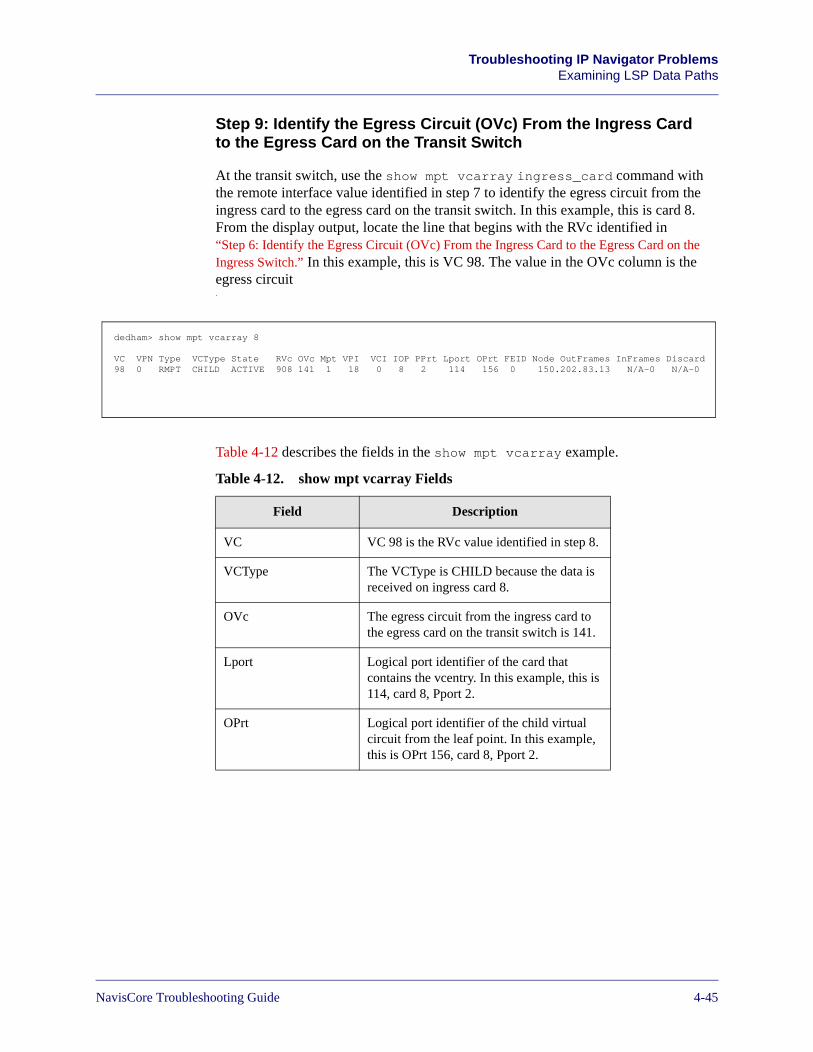
Beta Draft ConfidentialTroubleshooting IP Navigator Problems
Examining LSP Data Paths
Step 9: Identify the Egress Circuit (OVc) From the Ingress Card to the Egress Card on the Transit Switch
At the transit switch, use the show mpt vcarray ingress_card command with the remote interface value identified in step 7 to identify the egress circuit from the ingress card to the egress card on the transit switch. In this example, this is card 8. From the display output, locate the line that begins with the RVc identified in “Step 6: Identify the Egress Circuit (OVc) From the Ingress Card to the Egress Card on the Ingress Switch.” In this example, this is VC 98. The value in the OVc column is the egress circuit.
Table 4-12 describes the fields in the show mpt vcarray example.
dedham> show mpt vcarray 8
VC VPN Type VCType State RVc OVc Mpt VPI VCI IOP PPrt Lport OPrt FEID Node OutFrames InFrames Discard98 0 RMPT CHILD ACTIVE 908 141 1 18 0 8 2 114 156 0 150.202.83.13 N/A-0 N/A-0
Table 4-12. show mpt vcarray Fields
Field Description
VC VC 98 is the RVc value identified in step 8.
VCType The VCType is CHILD because the data is received on ingress card 8.
OVc The egress circuit from the ingress card to the egress card on the transit switch is 141.
Lport Logical port identifier of the card that contains the vcentry. In this example, this is 114, card 8, Pport 2.
OPrt Logical port identifier of the child virtual circuit from the leaf point. In this example, this is OPrt 156, card 8, Pport 2.
NavisCore Troubleshooting Guide 4-45
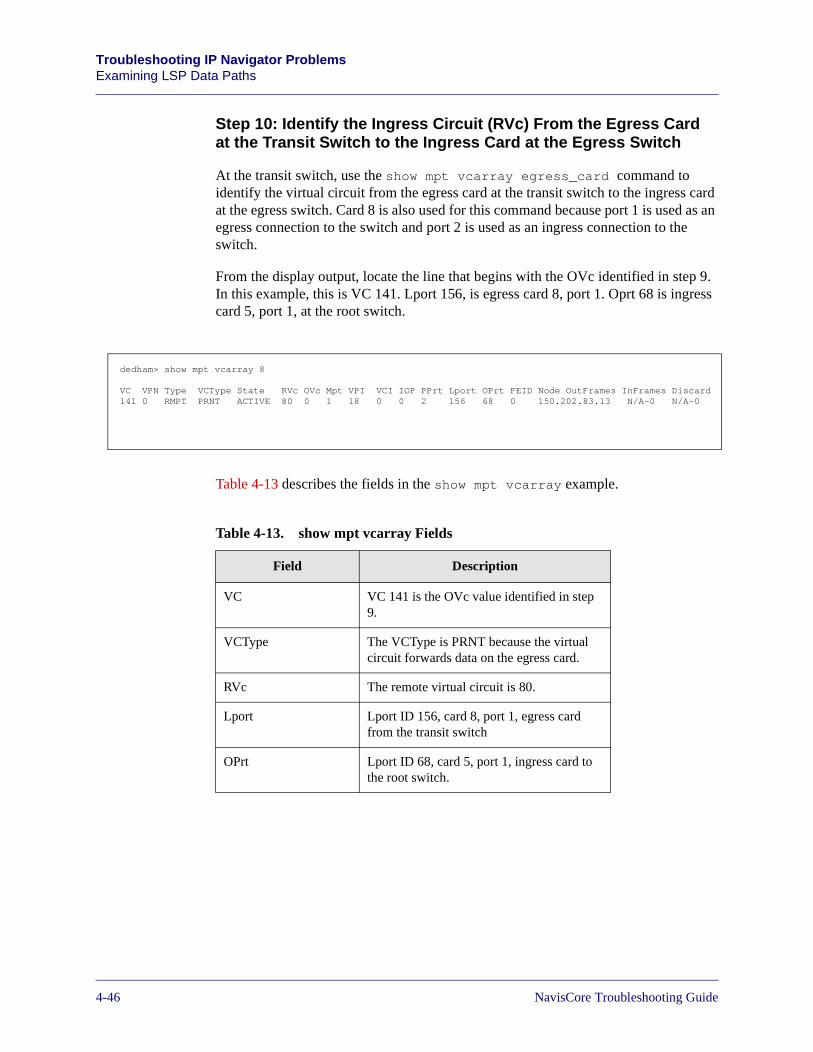
Beta Draft ConfidentialTroubleshooting IP Navigator ProblemsExamining LSP Data Paths
Step 10: Identify the Ingress Circuit (RVc) From the Egress Card at the Transit Switch to the Ingress Card at the Egress Switch
At the transit switch, use the show mpt vcarray egress_card command to identify the virtual circuit from the egress card at the transit switch to the ingress card at the egress switch. Card 8 is also used for this command because port 1 is used as an egress connection to the switch and port 2 is used as an ingress connection to the switch.
From the display output, locate the line that begins with the OVc identified in step 9. In this example, this is VC 141. Lport 156, is egress card 8, port 1. Oprt 68 is ingress card 5, port 1, at the root switch.
Table 4-13 describes the fields in the show mpt vcarray example.
dedham> show mpt vcarray 8
VC VPN Type VCType State RVc OVc Mpt VPI VCI IOP PPrt Lport OPrt FEID Node OutFrames InFrames Discard141 0 RMPT PRNT ACTIVE 80 0 1 18 0 0 2 156 68 0 150.202.83.13 N/A-0 N/A-0
Table 4-13. show mpt vcarray Fields
Field Description
VC VC 141 is the OVc value identified in step 9.
VCType The VCType is PRNT because the virtual circuit forwards data on the egress card.
RVc The remote virtual circuit is 80.
Lport Lport ID 156, card 8, port 1, egress card from the transit switch
OPrt Lport ID 68, card 5, port 1, ingress card to the root switch.
4-46 NavisCore Troubleshooting Guide
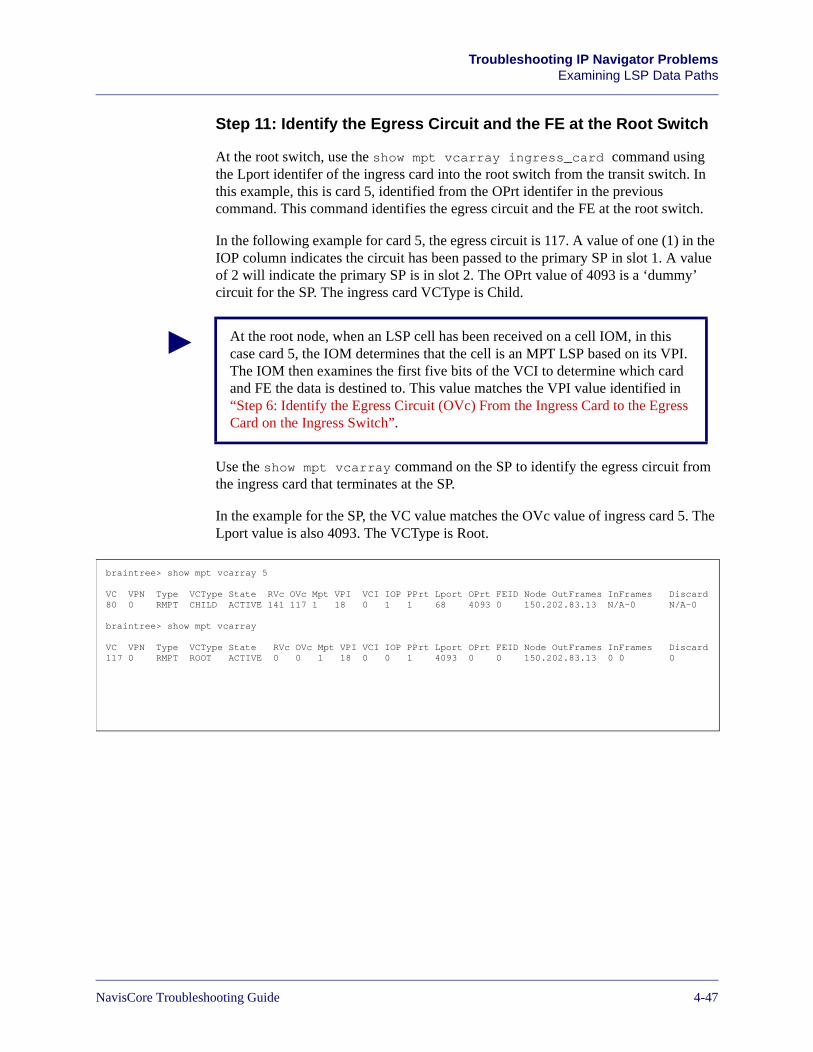
Beta Draft ConfidentialTroubleshooting IP Navigator Problems
Examining LSP Data Paths
Step 11: Identify the Egress Circuit and the FE at the Root Switch
At the root switch, use the show mpt vcarray ingress_card command using the Lport identifer of the ingress card into the root switch from the transit switch. In this example, this is card 5, identified from the OPrt identifer in the previous command. This command identifies the egress circuit and the FE at the root switch.
In the following example for card 5, the egress circuit is 117. A value of one (1) in the IOP column indicates the circuit has been passed to the primary SP in slot 1. A value of 2 will indicate the primary SP is in slot 2. The OPrt value of 4093 is a ‘dummy’ circuit for the SP. The ingress card VCType is Child.
Use the show mpt vcarray command on the SP to identify the egress circuit from the ingress card that terminates at the SP.
In the example for the SP, the VC value matches the OVc value of ingress card 5. The Lport value is also 4093. The VCType is Root.
At the root node, when an LSP cell has been received on a cell IOM, in this case card 5, the IOM determines that the cell is an MPT LSP based on its VPI. The IOM then examines the first five bits of the VCI to determine which card and FE the data is destined to. This value matches the VPI value identified in “Step 6: Identify the Egress Circuit (OVc) From the Ingress Card to the Egress Card on the Ingress Switch”.
braintree> show mpt vcarray 5
VC VPN Type VCType State RVc OVc Mpt VPI VCI IOP PPrt Lport OPrt FEID Node OutFrames InFrames Discard80 0 RMPT CHILD ACTIVE 141 117 1 18 0 1 1 68 4093 0 150.202.83.13 N/A-0 N/A-0
braintree> show mpt vcarray
VC VPN Type VCType State RVc OVc Mpt VPI VCI IOP PPrt Lport OPrt FEID Node OutFrames InFrames Discard117 0 RMPT ROOT ACTIVE 0 0 1 18 0 0 1 4093 0 0 150.202.83.13 0 0 0
NavisCore Troubleshooting Guide 4-47
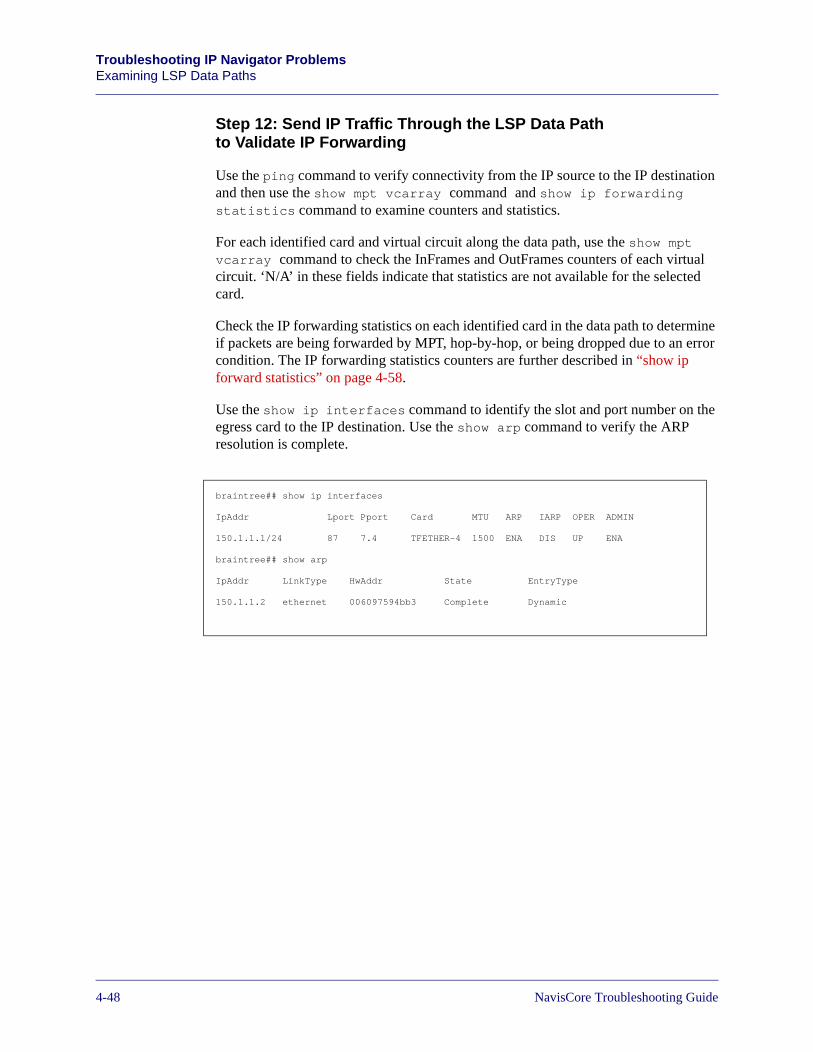
Beta Draft ConfidentialTroubleshooting IP Navigator ProblemsExamining LSP Data Paths
Step 12: Send IP Traffic Through the LSP Data Path to Validate IP Forwarding
Use the ping command to verify connectivity from the IP source to the IP destination and then use the show mpt vcarray command and show ip forwarding statistics command to examine counters and statistics.
For each identified card and virtual circuit along the data path, use the show mpt vcarray command to check the InFrames and OutFrames counters of each virtual circuit. ‘N/A’ in these fields indicate that statistics are not available for the selected card.
Check the IP forwarding statistics on each identified card in the data path to determine if packets are being forwarded by MPT, hop-by-hop, or being dropped due to an error condition. The IP forwarding statistics counters are further described in “show ip forward statistics” on page 4-58.
Use the show ip interfaces command to identify the slot and port number on the egress card to the IP destination. Use the show arp command to verify the ARP resolution is complete.
braintree## show ip interfaces
IpAddr Lport Pport Card MTU ARP IARP OPER ADMIN
150.1.1.1/24 87 7.4 TFETHER-4 1500 ENA DIS UP ENA
braintree## show arp
IpAddr LinkType HwAddr State EntryType
150.1.1.2 ethernet 006097594bb3 Complete Dynamic
4-48 NavisCore Troubleshooting Guide
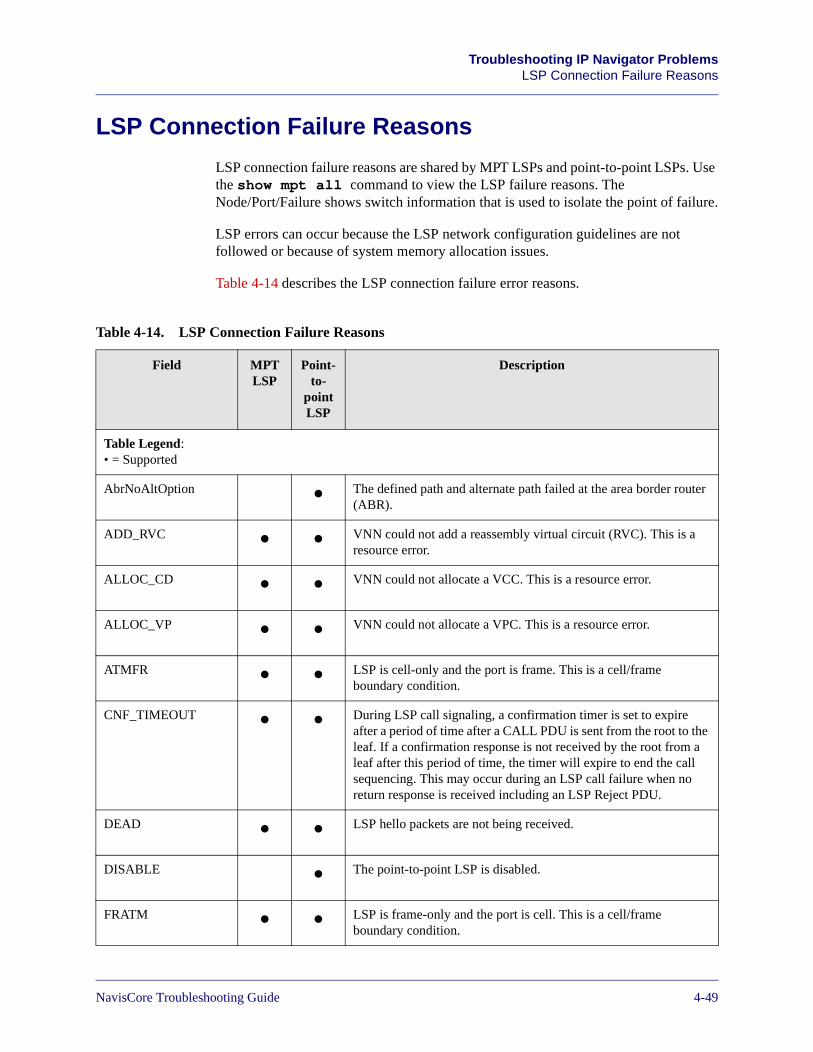
Beta Draft ConfidentialTroubleshooting IP Navigator Problems
LSP Connection Failure Reasons
LSP Connection Failure Reasons
LSP connection failure reasons are shared by MPT LSPs and point-to-point LSPs. Use the show mpt all command to view the LSP failure reasons. The Node/Port/Failure shows switch information that is used to isolate the point of failure.
LSP errors can occur because the LSP network configuration guidelines are not followed or because of system memory allocation issues.
Table 4-14 describes the LSP connection failure error reasons.
Table 4-14. LSP Connection Failure Reasons
Field MPT LSP
Point-to-
point LSP
Description
Table Legend:• = Supported
AbrNoAltOption • The defined path and alternate path failed at the area border router (ABR).
ADD_RVC • • VNN could not add a reassembly virtual circuit (RVC). This is a resource error.
ALLOC_CD • • VNN could not allocate a VCC. This is a resource error.
ALLOC_VP • • VNN could not allocate a VPC. This is a resource error.
ATMFR • • LSP is cell-only and the port is frame. This is a cell/frame boundary condition.
CNF_TIMEOUT • • During LSP call signaling, a confirmation timer is set to expire after a period of time after a CALL PDU is sent from the root to the leaf. If a confirmation response is not received by the root from a leaf after this period of time, the timer will expire to end the call sequencing. This may occur during an LSP call failure when no return response is received including an LSP Reject PDU.
DEAD • • LSP hello packets are not being received.
DISABLE • The point-to-point LSP is disabled.
FRATM • • LSP is frame-only and the port is cell. This is a cell/frame boundary condition.
NavisCore Troubleshooting Guide 4-49
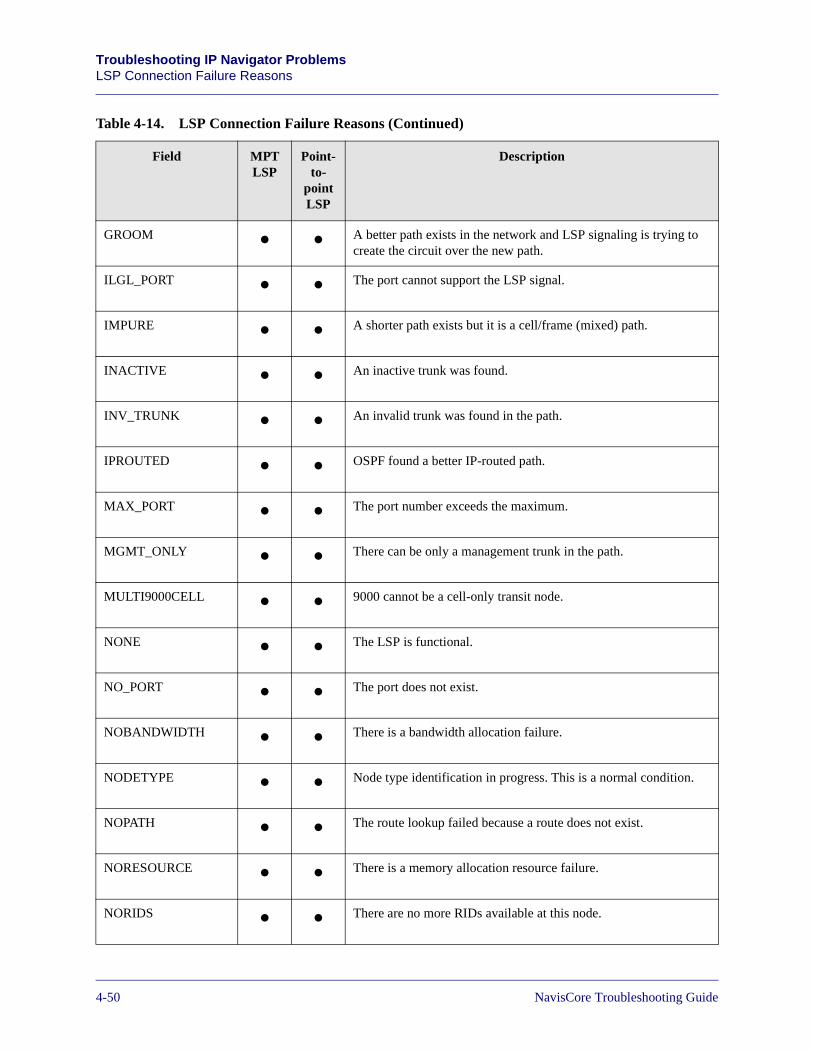
Beta Draft ConfidentialTroubleshooting IP Navigator ProblemsLSP Connection Failure Reasons
GROOM • • A better path exists in the network and LSP signaling is trying to create the circuit over the new path.
ILGL_PORT • • The port cannot support the LSP signal.
IMPURE • • A shorter path exists but it is a cell/frame (mixed) path.
INACTIVE • • An inactive trunk was found.
INV_TRUNK • • An invalid trunk was found in the path.
IPROUTED • • OSPF found a better IP-routed path.
MAX_PORT • • The port number exceeds the maximum.
MGMT_ONLY • • There can be only a management trunk in the path.
MULTI9000CELL • • 9000 cannot be a cell-only transit node.
NONE • • The LSP is functional.
NO_PORT • • The port does not exist.
NOBANDWIDTH • • There is a bandwidth allocation failure.
NODETYPE • • Node type identification in progress. This is a normal condition.
NOPATH • • The route lookup failed because a route does not exist.
NORESOURCE • • There is a memory allocation resource failure.
NORIDS • • There are no more RIDs available at this node.
Table 4-14. LSP Connection Failure Reasons (Continued)
Field MPT LSP
Point-to-
point LSP
Description
4-50 NavisCore Troubleshooting Guide
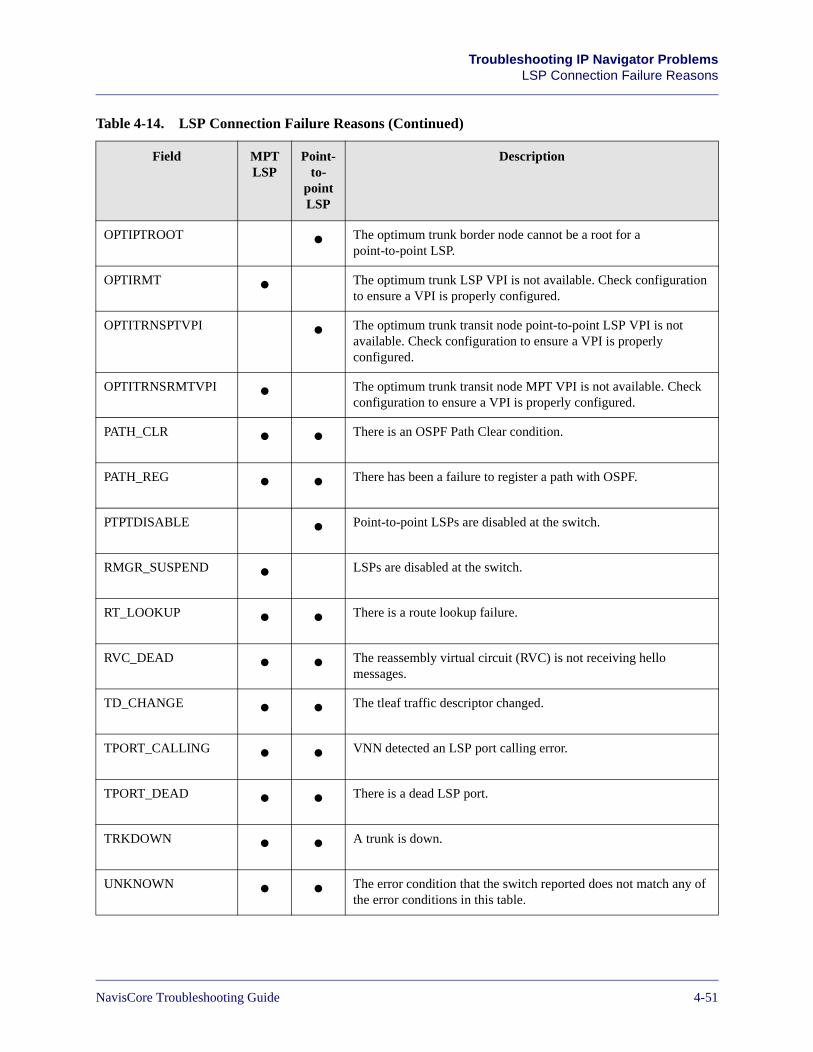
Beta Draft ConfidentialTroubleshooting IP Navigator Problems
LSP Connection Failure Reasons
OPTIPTROOT • The optimum trunk border node cannot be a root for a point-to-point LSP.
OPTIRMT • The optimum trunk LSP VPI is not available. Check configuration to ensure a VPI is properly configured.
OPTITRNSPTVPI • The optimum trunk transit node point-to-point LSP VPI is not available. Check configuration to ensure a VPI is properly configured.
OPTITRNSRMTVPI • The optimum trunk transit node MPT VPI is not available. Check configuration to ensure a VPI is properly configured.
PATH_CLR • • There is an OSPF Path Clear condition.
PATH_REG • • There has been a failure to register a path with OSPF.
PTPTDISABLE • Point-to-point LSPs are disabled at the switch.
RMGR_SUSPEND • LSPs are disabled at the switch.
RT_LOOKUP • • There is a route lookup failure.
RVC_DEAD • • The reassembly virtual circuit (RVC) is not receiving hello messages.
TD_CHANGE • • The tleaf traffic descriptor changed.
TPORT_CALLING • • VNN detected an LSP port calling error.
TPORT_DEAD • • There is a dead LSP port.
TRKDOWN • • A trunk is down.
UNKNOWN • • The error condition that the switch reported does not match any of the error conditions in this table.
Table 4-14. LSP Connection Failure Reasons (Continued)
Field MPT LSP
Point-to-
point LSP
Description
NavisCore Troubleshooting Guide 4-51
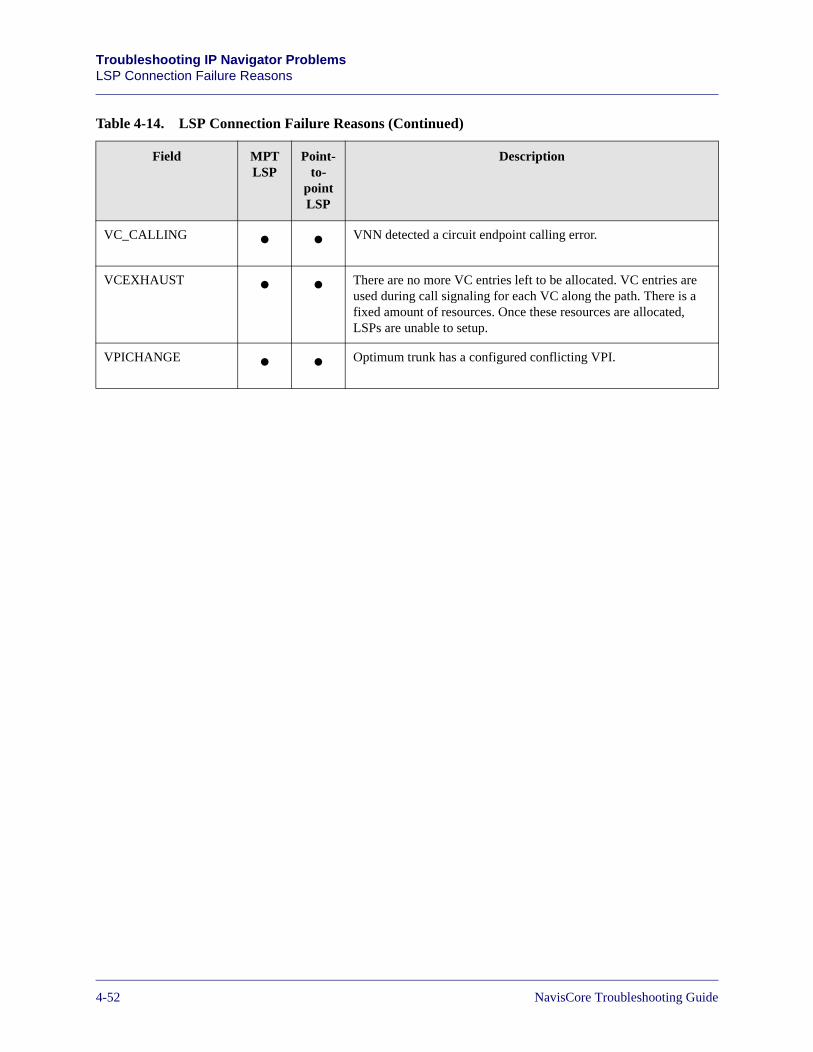
Beta Draft ConfidentialTroubleshooting IP Navigator ProblemsLSP Connection Failure Reasons
VC_CALLING • • VNN detected a circuit endpoint calling error.
VCEXHAUST • • There are no more VC entries left to be allocated. VC entries are used during call signaling for each VC along the path. There is a fixed amount of resources. Once these resources are allocated, LSPs are unable to setup.
VPICHANGE • • Optimum trunk has a configured conflicting VPI.
Table 4-14. LSP Connection Failure Reasons (Continued)
Field MPT LSP
Point-to-
point LSP
Description
4-52 NavisCore Troubleshooting Guide
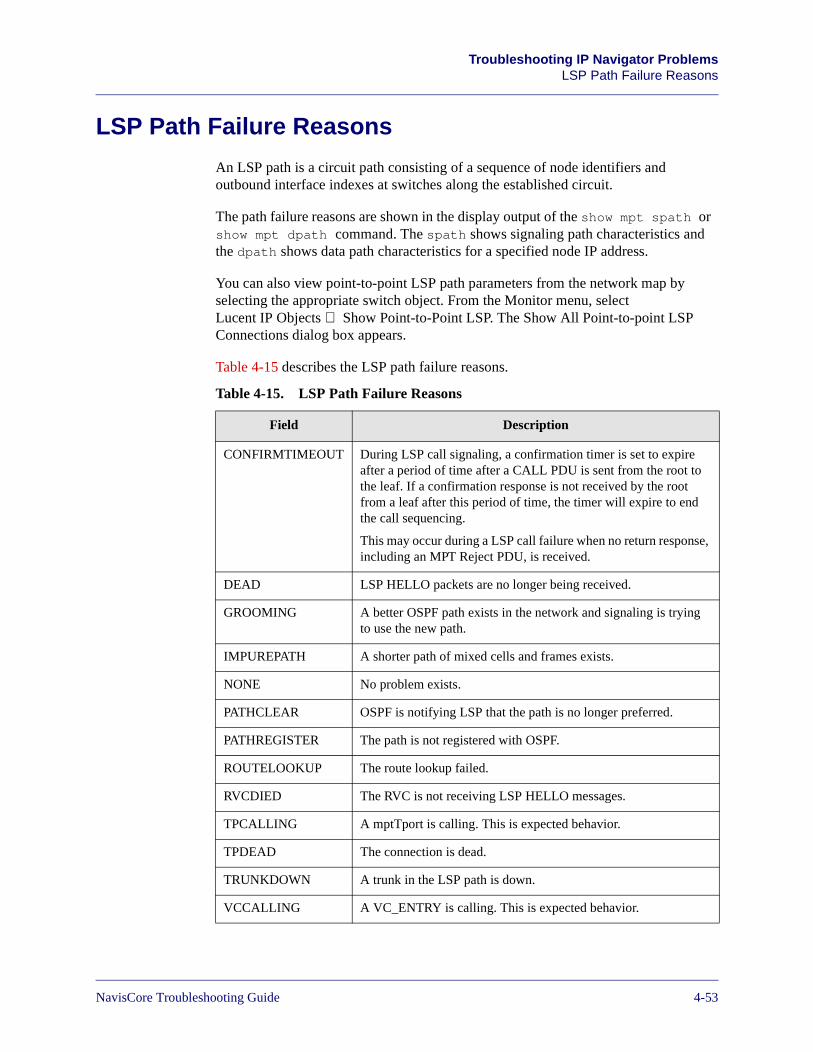
Beta Draft ConfidentialTroubleshooting IP Navigator Problems
LSP Path Failure Reasons
LSP Path Failure Reasons
An LSP path is a circuit path consisting of a sequence of node identifiers and outbound interface indexes at switches along the established circuit.
The path failure reasons are shown in the display output of the show mpt spath or show mpt dpath command. The spath shows signaling path characteristics and the dpath shows data path characteristics for a specified node IP address.
You can also view point-to-point LSP path parameters from the network map by selecting the appropriate switch object. From the Monitor menu, select Lucent IP Objects ⇒ Show Point-to-Point LSP. The Show All Point-to-point LSP Connections dialog box appears.
Table 4-15 describes the LSP path failure reasons.
Table 4-15. LSP Path Failure Reasons
Field Description
CONFIRMTIMEOUT During LSP call signaling, a confirmation timer is set to expire after a period of time after a CALL PDU is sent from the root to the leaf. If a confirmation response is not received by the root from a leaf after this period of time, the timer will expire to end the call sequencing.
This may occur during a LSP call failure when no return response, including an MPT Reject PDU, is received.
DEAD LSP HELLO packets are no longer being received.
GROOMING A better OSPF path exists in the network and signaling is trying to use the new path.
IMPUREPATH A shorter path of mixed cells and frames exists.
NONE No problem exists.
PATHCLEAR OSPF is notifying LSP that the path is no longer preferred.
PATHREGISTER The path is not registered with OSPF.
ROUTELOOKUP The route lookup failed.
RVCDIED The RVC is not receiving LSP HELLO messages.
TPCALLING A mptTport is calling. This is expected behavior.
TPDEAD The connection is dead.
TRUNKDOWN A trunk in the LSP path is down.
VCCALLING A VC_ENTRY is calling. This is expected behavior.
NavisCore Troubleshooting Guide 4-53
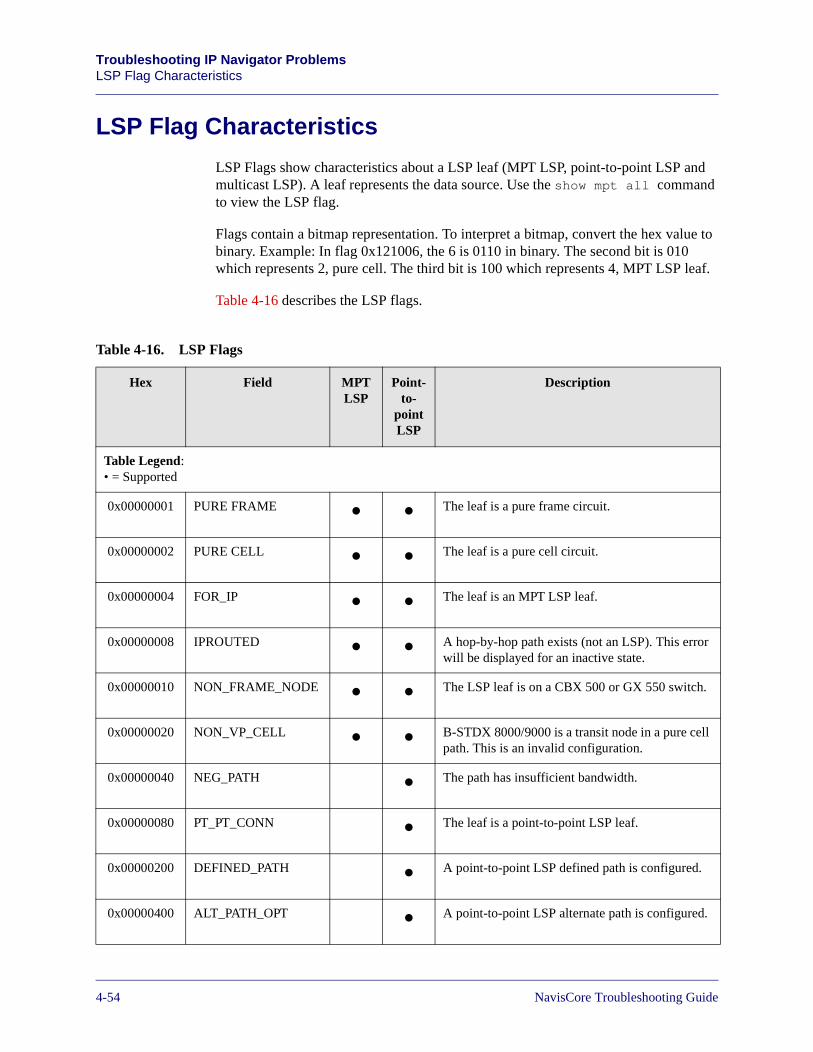
Beta Draft ConfidentialTroubleshooting IP Navigator ProblemsLSP Flag Characteristics
LSP Flag Characteristics
LSP Flags show characteristics about a LSP leaf (MPT LSP, point-to-point LSP and multicast LSP). A leaf represents the data source. Use the show mpt all command to view the LSP flag.
Flags contain a bitmap representation. To interpret a bitmap, convert the hex value to binary. Example: In flag 0x121006, the 6 is 0110 in binary. The second bit is 010 which represents 2, pure cell. The third bit is 100 which represents 4, MPT LSP leaf.
Table 4-16 describes the LSP flags.
Table 4-16. LSP Flags
Hex Field MPT LSP
Point-to-
pointLSP
Description
Table Legend:• = Supported
0x00000001 PURE FRAME • • The leaf is a pure frame circuit.
0x00000002 PURE CELL • • The leaf is a pure cell circuit.
0x00000004 FOR_IP • • The leaf is an MPT LSP leaf.
0x00000008 IPROUTED • • A hop-by-hop path exists (not an LSP). This error will be displayed for an inactive state.
0x00000010 NON_FRAME_NODE • • The LSP leaf is on a CBX 500 or GX 550 switch.
0x00000020 NON_VP_CELL • • B-STDX 8000/9000 is a transit node in a pure cell path. This is an invalid configuration.
0x00000040 NEG_PATH • The path has insufficient bandwidth.
0x00000080 PT_PT_CONN • The leaf is a point-to-point LSP leaf.
0x00000200 DEFINED_PATH • A point-to-point LSP defined path is configured.
0x00000400 ALT_PATH_OPT • A point-to-point LSP alternate path is configured.
4-54 NavisCore Troubleshooting Guide
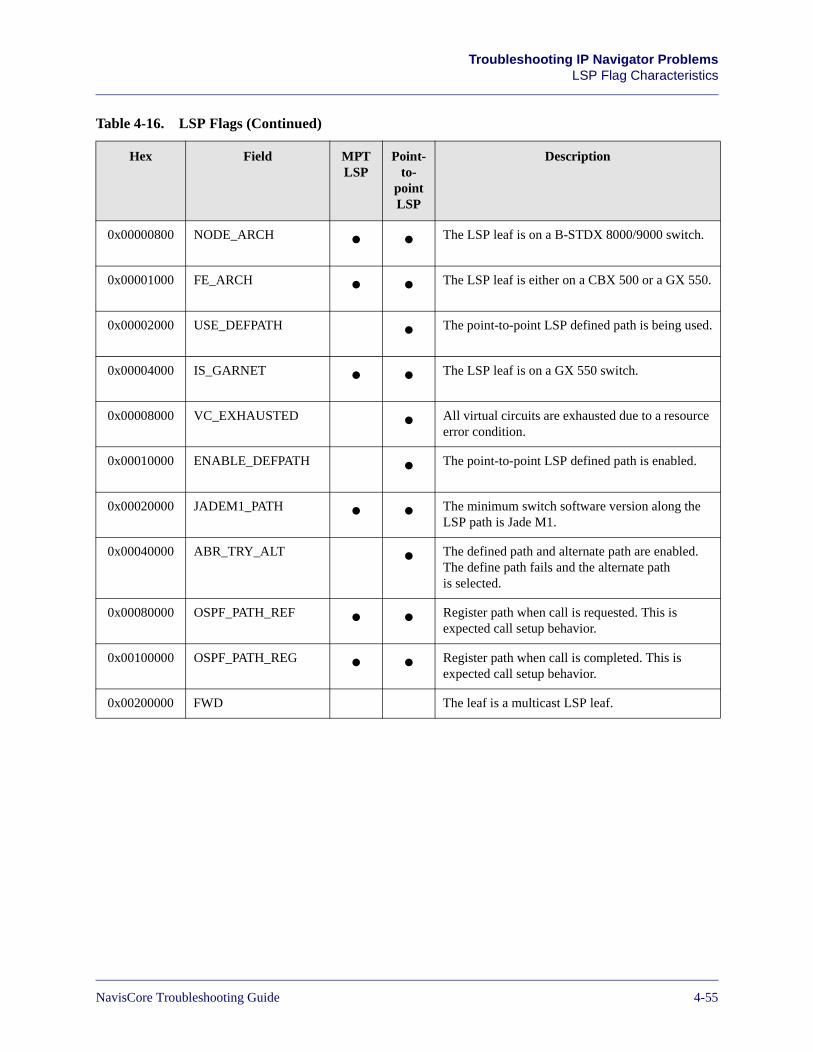
Beta Draft ConfidentialTroubleshooting IP Navigator Problems
LSP Flag Characteristics
0x00000800 NODE_ARCH • • The LSP leaf is on a B-STDX 8000/9000 switch.
0x00001000 FE_ARCH • • The LSP leaf is either on a CBX 500 or a GX 550.
0x00002000 USE_DEFPATH • The point-to-point LSP defined path is being used.
0x00004000 IS_GARNET • • The LSP leaf is on a GX 550 switch.
0x00008000 VC_EXHAUSTED • All virtual circuits are exhausted due to a resource error condition.
0x00010000 ENABLE_DEFPATH • The point-to-point LSP defined path is enabled.
0x00020000 JADEM1_PATH • • The minimum switch software version along the LSP path is Jade M1.
0x00040000 ABR_TRY_ALT • The defined path and alternate path are enabled. The define path fails and the alternate path is selected.
0x00080000 OSPF_PATH_REF • • Register path when call is requested. This is expected call setup behavior.
0x00100000 OSPF_PATH_REG • • Register path when call is completed. This is expected call setup behavior.
0x00200000 FWD The leaf is a multicast LSP leaf.
Table 4-16. LSP Flags (Continued)
Hex Field MPT LSP
Point-to-
pointLSP
Description
NavisCore Troubleshooting Guide 4-55
Beta Draft ConfidentialTroubleshooting IP Navigator ProblemsIP Forwarding
IP Forwarding
Lucent IP forwarding uses a combination of IP lookups and virtual circuit paths to improve network performance.
Routing Tables
The routing protocols running on the CP/SP are responsible for building a routing table from information learned through their respective routing updates. To maximize IP forwarding throughput, the routing tables are distributed to the IOPs so that routing table lookups are a local operation.
The following routing tables are maintained on the CP/SP:
Unicast – The unicast routing table contains a list of unicast destination addresses. These addresses include the IP address that identifies the next hop to reach a network, the state and cost of the IP route, the logical port being reported on, the age (in seconds) of the route advertisement (RIP only), and a label switched path circuit indicator.
Multicast – The multicast routing table contains a list of multicast source IP addresses. These addresses include multicast destination group IP addresses, the upstream neighbor interface, the multicast LSP identification number, and the number of outgoing interfaces.
How an IP Packet is Forwarded
IP packets are checked at the ingress and egress ports of each switch in the Lucent network. The following describes what happens or what you should do when a Lucent switch receives an IP packet:
1. Check if received packet matches a configured Packet Filter. If packet matches filter, accept or discard packet according to filter.
2. Datagrams that specify IP header options are automatically forwarded to the CP, which implements a full IP protocol stack capable of handling the options.
3. Check if received packet matches a configured Next Hop Resolution Protocol (NHRP) profile. If packet matches profile, forward according to profile.
4. Check if received packet matches a forwarding policy. If packet matches policy, forward according to policy.
5. Perform an IP lookup on the packet’s destination address. If the forwarding entry shows that the destination is a local switch IP address (SNMP, ping, etc.) forward to the CP/SP for processing.
4-56 NavisCore Troubleshooting Guide
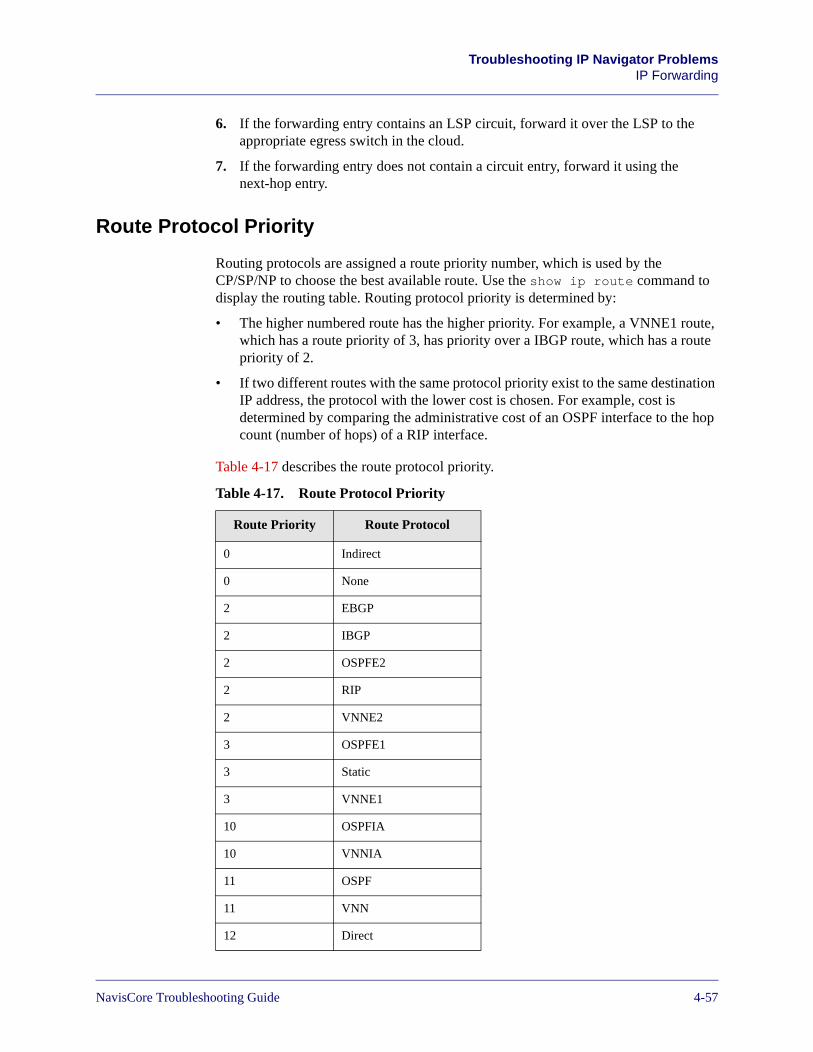
Beta Draft ConfidentialTroubleshooting IP Navigator Problems
IP Forwarding
6. If the forwarding entry contains an LSP circuit, forward it over the LSP to the appropriate egress switch in the cloud.
7. If the forwarding entry does not contain a circuit entry, forward it using the next-hop entry.
Route Protocol Priority
Routing protocols are assigned a route priority number, which is used by the CP/SP/NP to choose the best available route. Use the show ip route command to display the routing table. Routing protocol priority is determined by:
• The higher numbered route has the higher priority. For example, a VNNE1 route, which has a route priority of 3, has priority over a IBGP route, which has a route priority of 2.
• If two different routes with the same protocol priority exist to the same destination IP address, the protocol with the lower cost is chosen. For example, cost is determined by comparing the administrative cost of an OSPF interface to the hop count (number of hops) of a RIP interface.
Table 4-17 describes the route protocol priority.
Table 4-17. Route Protocol Priority
Route Priority Route Protocol
0 Indirect
0 None
2 EBGP
2 IBGP
2 OSPFE2
2 RIP
2 VNNE2
3 OSPFE1
3 Static
3 VNNE1
10 OSPFIA
10 VNNIA
11 OSPF
11 VNN
12 Direct
NavisCore Troubleshooting Guide 4-57
Beta Draft ConfidentialTroubleshooting IP Navigator ProblemsIP Forwarding
Show IP Forwarding Statistics Console Command
show ip forward statistics
This command displays Layer 2 (datalink) and Layer 3 (IP) counters and statistics for IOP and IOM modules that support IP routing.
IP statistics counters increment when a specific condition is met. For example:
• The Inbound Layer 3 RcvIP counter increments when the switch receives an IP packet.
• The Inbound or Outbound FwdCP counters increment when an IP packet is forwarded to the CP/SP/NP.
• The Inbound Layer 3 ttl_exceed counter increments when the TTL of an IP packet has been exceeded.
If an expected counter does not increment, troubleshooting begins by determining if links are up, if ARP entries exist, if correct routing entries exist and are being forwarded based on configured route maps, and whether IP packets are being dropped at ingress or egress switch links.
Syntax:
show ip forward [inbound|outbound|mcast|all] statistics card [card-number] fe [forwarding-engine {1|2}]
Table 4-18 lists the logical ports and card types that support IP routing on the B-STDX 8000/9000.
Table 4-19 lists the logical ports and examples of card types that support IP routing on the CBX 500.
Table 4-20 lists cards with forwarding engines.
See the Console Command Reference (Product Code: 80136) for a complete description of the show ip forwarding command.
4-58 NavisCore Troubleshooting Guide
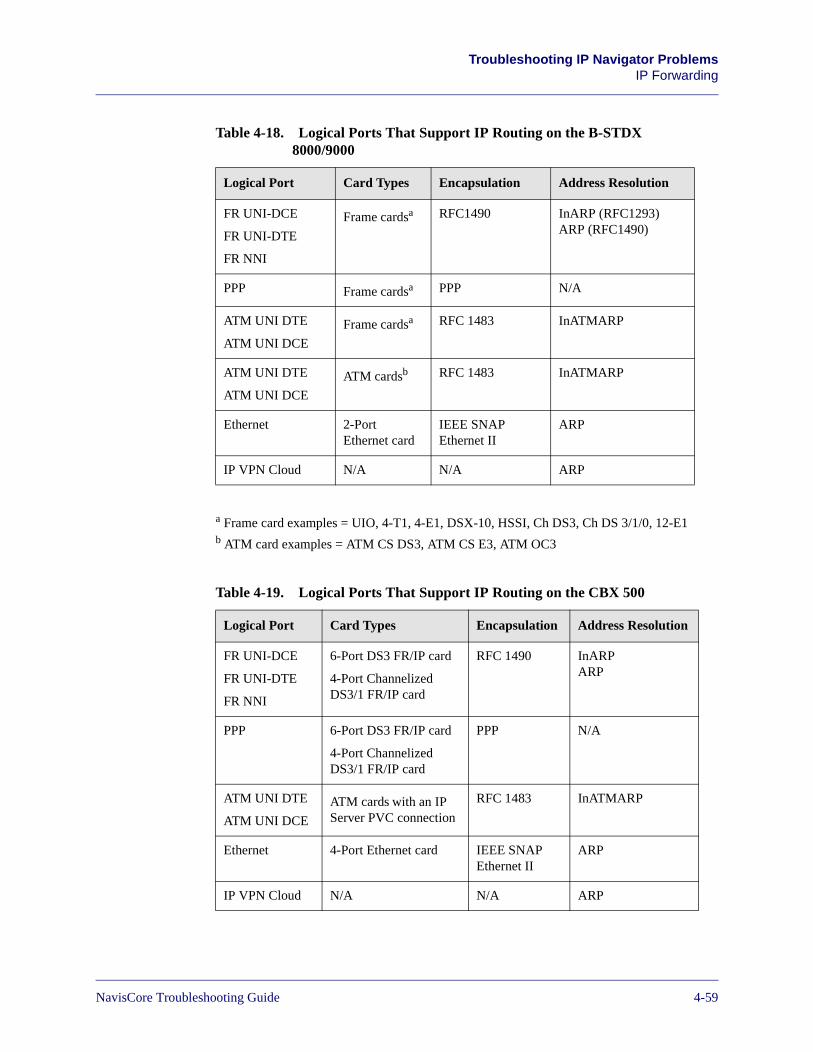
Beta Draft ConfidentialTroubleshooting IP Navigator Problems
IP Forwarding
a Frame card examples = UIO, 4-T1, 4-E1, DSX-10, HSSI, Ch DS3, Ch DS 3/1/0, 12-E1b ATM card examples = ATM CS DS3, ATM CS E3, ATM OC3
Table 4-18. Logical Ports That Support IP Routing on the B-STDX8000/9000
Logical Port Card Types Encapsulation Address Resolution
FR UNI-DCE
FR UNI-DTE
FR NNI
Frame cardsa RFC1490 InARP (RFC1293)ARP (RFC1490)
PPP Frame cardsa PPP N/A
ATM UNI DTE
ATM UNI DCE
Frame cardsa RFC 1483 InATMARP
ATM UNI DTE
ATM UNI DCE
ATM cardsb RFC 1483 InATMARP
Ethernet 2-Port Ethernet card
IEEE SNAPEthernet II
ARP
IP VPN Cloud N/A N/A ARP
Table 4-19. Logical Ports That Support IP Routing on the CBX 500
Logical Port Card Types Encapsulation Address Resolution
FR UNI-DCE
FR UNI-DTE
FR NNI
6-Port DS3 FR/IP card
4-Port Channelized DS3/1 FR/IP card
RFC 1490 InARPARP
PPP 6-Port DS3 FR/IP card
4-Port Channelized DS3/1 FR/IP card
PPP N/A
ATM UNI DTE
ATM UNI DCE
ATM cards with an IP Server PVC connection
RFC 1483 InATMARP
Ethernet 4-Port Ethernet card IEEE SNAPEthernet II
ARP
IP VPN Cloud N/A N/A ARP
NavisCore Troubleshooting Guide 4-59
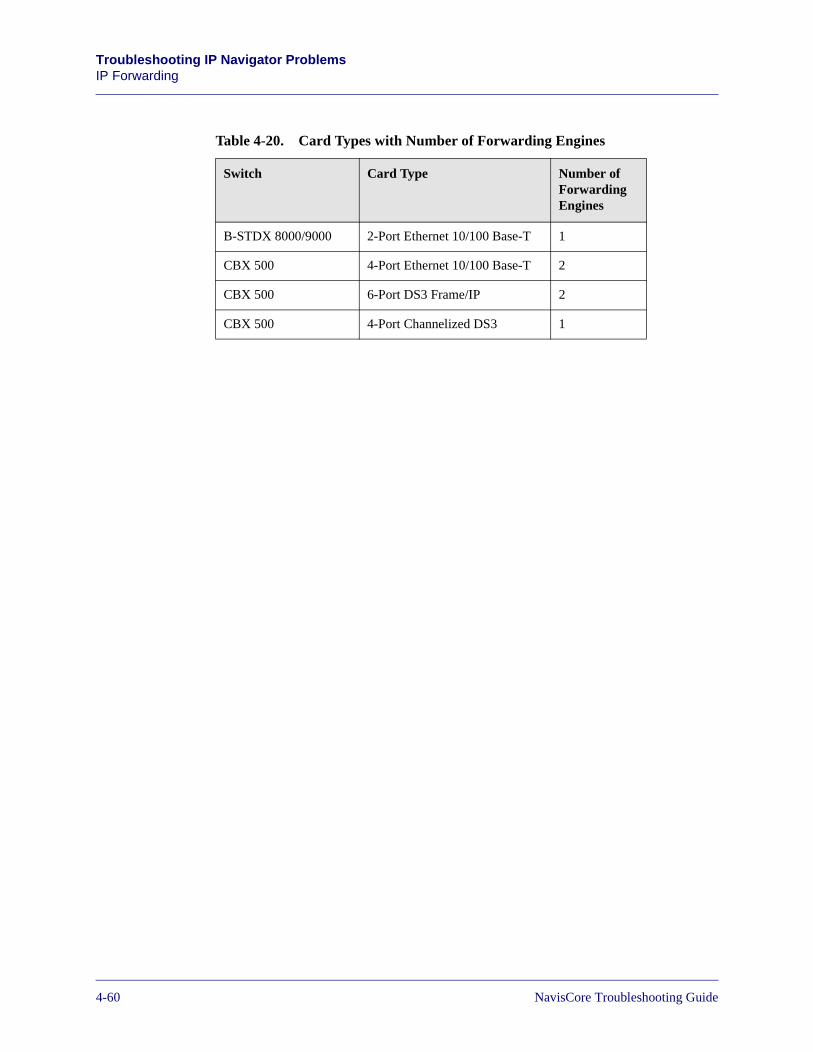
Beta Draft ConfidentialTroubleshooting IP Navigator ProblemsIP Forwarding
Table 4-20. Card Types with Number of Forwarding Engines
Switch Card Type Number of Forwarding Engines
B-STDX 8000/9000 2-Port Ethernet 10/100 Base-T 1
CBX 500 4-Port Ethernet 10/100 Base-T 2
CBX 500 6-Port DS3 Frame/IP 2
CBX 500 4-Port Channelized DS3 1
4-60 NavisCore Troubleshooting Guide
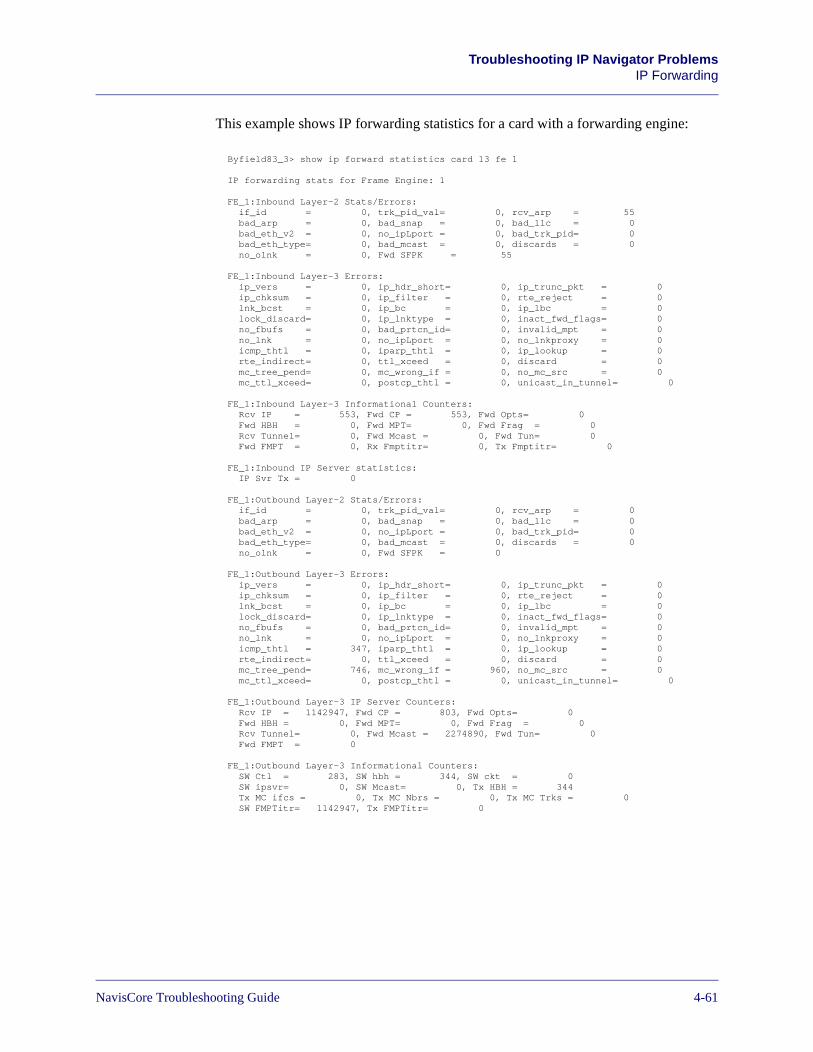
Beta Draft ConfidentialTroubleshooting IP Navigator Problems
IP Forwarding
This example shows IP forwarding statistics for a card with a forwarding engine:
Byfield83_3> show ip forward statistics card 13 fe 1
IP forwarding stats for Frame Engine: 1
FE_1:Inbound Layer-2 Stats/Errors: if_id = 0, trk_pid_val= 0, rcv_arp = 55 bad_arp = 0, bad_snap = 0, bad_llc = 0 bad_eth_v2 = 0, no_ipLport = 0, bad_trk_pid= 0 bad_eth_type= 0, bad_mcast = 0, discards = 0 no_olnk = 0, Fwd SFPK = 55
FE_1:Inbound Layer-3 Errors: ip_vers = 0, ip_hdr_short= 0, ip_trunc_pkt = 0 ip_chksum = 0, ip_filter = 0, rte_reject = 0 lnk_bcst = 0, ip_bc = 0, ip_lbc = 0 lock_discard= 0, ip_lnktype = 0, inact_fwd_flags= 0 no_fbufs = 0, bad_prtcn_id= 0, invalid_mpt = 0 no_lnk = 0, no_ipLport = 0, no_lnkproxy = 0 icmp_thtl = 0, iparp_thtl = 0, ip_lookup = 0 rte_indirect= 0, ttl_xceed = 0, discard = 0 mc_tree_pend= 0, mc_wrong_if = 0, no_mc_src = 0 mc_ttl_xceed= 0, postcp_thtl = 0, unicast_in_tunnel= 0
FE_1:Inbound Layer-3 Informational Counters: Rcv IP = 553, Fwd CP = 553, Fwd Opts= 0 Fwd HBH = 0, Fwd MPT= 0, Fwd Frag = 0 Rcv Tunnel= 0, Fwd Mcast = 0, Fwd Tun= 0 Fwd FMPT = 0, Rx Fmptitr= 0, Tx Fmptitr= 0
FE_1:Inbound IP Server statistics: IP Svr Tx = 0
FE_1:Outbound Layer-2 Stats/Errors: if_id = 0, trk_pid_val= 0, rcv_arp = 0 bad_arp = 0, bad_snap = 0, bad_llc = 0 bad_eth_v2 = 0, no_ipLport = 0, bad_trk_pid= 0 bad_eth_type= 0, bad_mcast = 0, discards = 0 no_olnk = 0, Fwd SFPK = 0
FE_1:Outbound Layer-3 Errors: ip_vers = 0, ip_hdr_short= 0, ip_trunc_pkt = 0 ip_chksum = 0, ip_filter = 0, rte_reject = 0 lnk_bcst = 0, ip_bc = 0, ip_lbc = 0 lock_discard= 0, ip_lnktype = 0, inact_fwd_flags= 0 no_fbufs = 0, bad_prtcn_id= 0, invalid_mpt = 0 no_lnk = 0, no_ipLport = 0, no_lnkproxy = 0 icmp_thtl = 347, iparp_thtl = 0, ip_lookup = 0 rte_indirect= 0, ttl_xceed = 0, discard = 0 mc_tree_pend= 746, mc_wrong_if = 960, no_mc_src = 0 mc_ttl_xceed= 0, postcp_thtl = 0, unicast_in_tunnel= 0
FE_1:Outbound Layer-3 IP Server Counters: Rcv IP = 1142947, Fwd CP = 803, Fwd Opts= 0 Fwd HBH = 0, Fwd MPT= 0, Fwd Frag = 0 Rcv Tunnel= 0, Fwd Mcast = 2274890, Fwd Tun= 0 Fwd FMPT = 0
FE_1:Outbound Layer-3 Informational Counters: SW Ctl = 283, SW hbh = 344, SW ckt = 0 SW ipsvr= 0, SW Mcast= 0, Tx HBH = 344 Tx MC ifcs = 0, Tx MC Nbrs = 0, Tx MC Trks = 0 SW FMPTitr= 1142947, Tx FMPTitr= 0
NavisCore Troubleshooting Guide 4-61
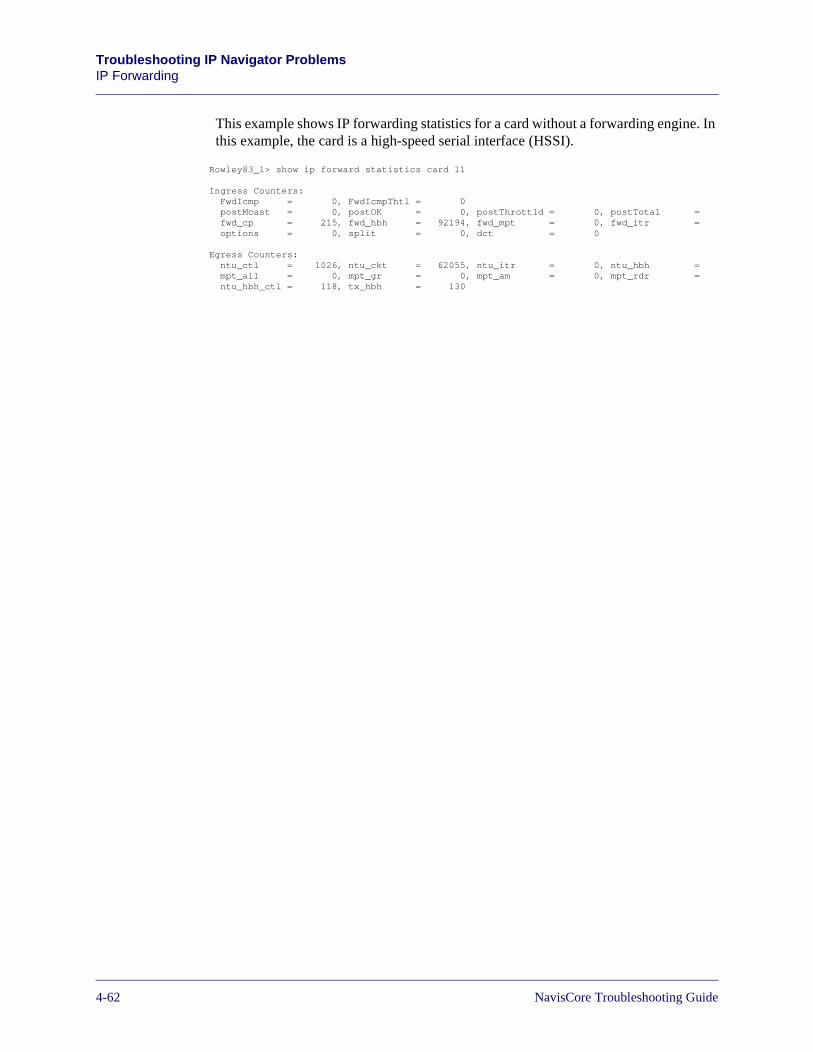
Beta Draft ConfidentialTroubleshooting IP Navigator ProblemsIP Forwarding
This example shows IP forwarding statistics for a card without a forwarding engine. In this example, the card is a high-speed serial interface (HSSI).
Rowley83_1> show ip forward statistics card 11
Ingress Counters: FwdIcmp = 0, FwdIcmpThtl = 0 postMcast = 0, postOK = 0, postThrottld = 0, postTotal = fwd_cp = 215, fwd_hbh = 92194, fwd_mpt = 0, fwd_itr = options = 0, split = 0, dct = 0
Egress Counters: ntu_ctl = 1026, ntu_ckt = 62055, ntu_itr = 0, ntu_hbh = mpt_all = 0, mpt_gr = 0, mpt_am = 0, mpt_rdr = ntu_hbh_ctl = 118, tx_hbh = 130
4-62 NavisCore Troubleshooting Guide
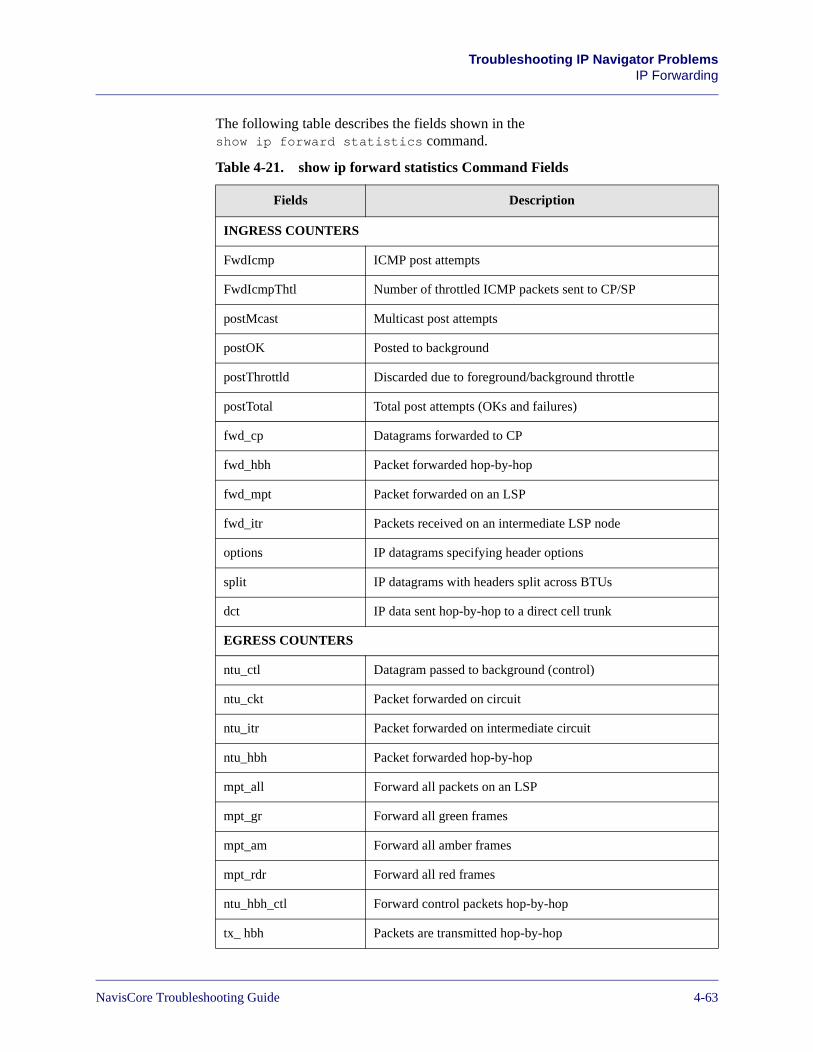
Beta Draft ConfidentialTroubleshooting IP Navigator Problems
IP Forwarding
The following table describes the fields shown in the show ip forward statistics command.
Table 4-21. show ip forward statistics Command Fields
Fields Description
INGRESS COUNTERS
FwdIcmp ICMP post attempts
FwdIcmpThtl Number of throttled ICMP packets sent to CP/SP
postMcast Multicast post attempts
postOK Posted to background
postThrottld Discarded due to foreground/background throttle
postTotal Total post attempts (OKs and failures)
fwd_cp Datagrams forwarded to CP
fwd_hbh Packet forwarded hop-by-hop
fwd_mpt Packet forwarded on an LSP
fwd_itr Packets received on an intermediate LSP node
options IP datagrams specifying header options
split IP datagrams with headers split across BTUs
dct IP data sent hop-by-hop to a direct cell trunk
EGRESS COUNTERS
ntu_ctl Datagram passed to background (control)
ntu_ckt Packet forwarded on circuit
ntu_itr Packet forwarded on intermediate circuit
ntu_hbh Packet forwarded hop-by-hop
mpt_all Forward all packets on an LSP
mpt_gr Forward all green frames
mpt_am Forward all amber frames
mpt_rdr Forward all red frames
ntu_hbh_ctl Forward control packets hop-by-hop
tx_ hbh Packets are transmitted hop-by-hop
NavisCore Troubleshooting Guide 4-63
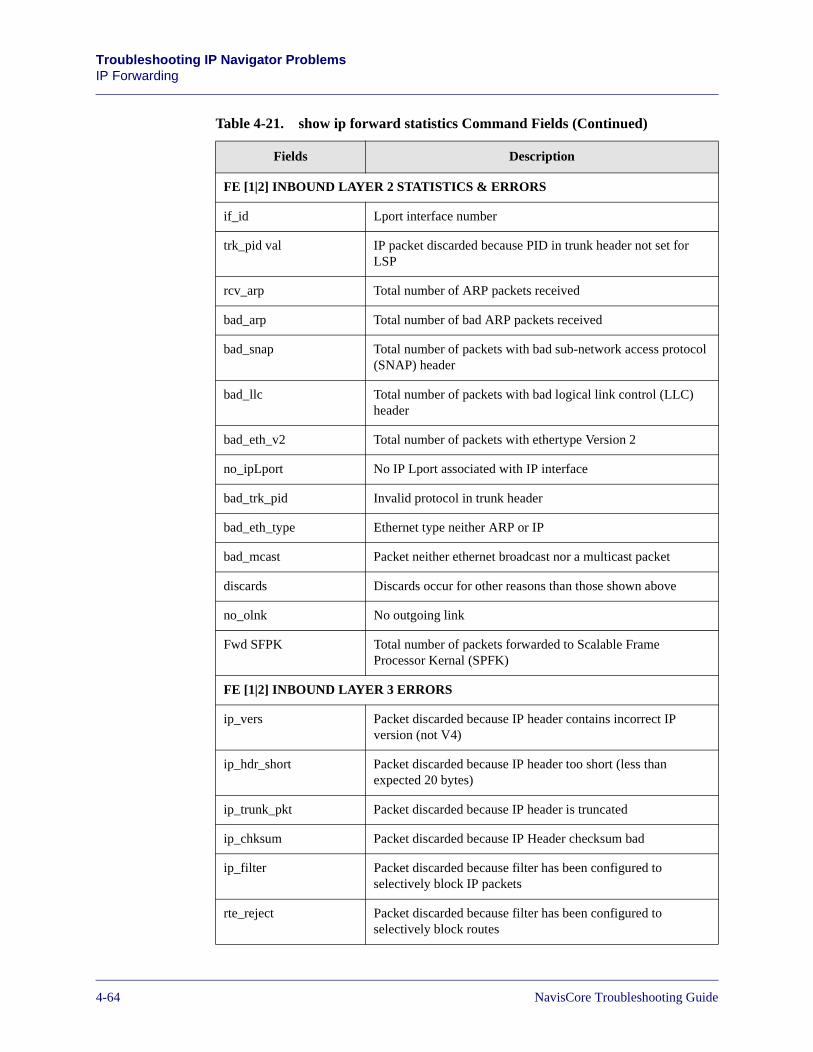
Beta Draft ConfidentialTroubleshooting IP Navigator ProblemsIP Forwarding
FE [1|2] INBOUND LAYER 2 STATISTICS & ERRORS
if_id Lport interface number
trk_pid val IP packet discarded because PID in trunk header not set for LSP
rcv_arp Total number of ARP packets received
bad_arp Total number of bad ARP packets received
bad_snap Total number of packets with bad sub-network access protocol (SNAP) header
bad_llc Total number of packets with bad logical link control (LLC) header
bad_eth_v2 Total number of packets with ethertype Version 2
no_ipLport No IP Lport associated with IP interface
bad_trk_pid Invalid protocol in trunk header
bad_eth_type Ethernet type neither ARP or IP
bad_mcast Packet neither ethernet broadcast nor a multicast packet
discards Discards occur for other reasons than those shown above
no_olnk No outgoing link
Fwd SFPK Total number of packets forwarded to Scalable Frame Processor Kernal (SPFK)
FE [1|2] INBOUND LAYER 3 ERRORS
ip_vers Packet discarded because IP header contains incorrect IP version (not V4)
ip_hdr_short Packet discarded because IP header too short (less than expected 20 bytes)
ip_trunk_pkt Packet discarded because IP header is truncated
ip_chksum Packet discarded because IP Header checksum bad
ip_filter Packet discarded because filter has been configured to selectively block IP packets
rte_reject Packet discarded because filter has been configured to selectively block routes
Table 4-21. show ip forward statistics Command Fields (Continued)
Fields Description
4-64 NavisCore Troubleshooting Guide
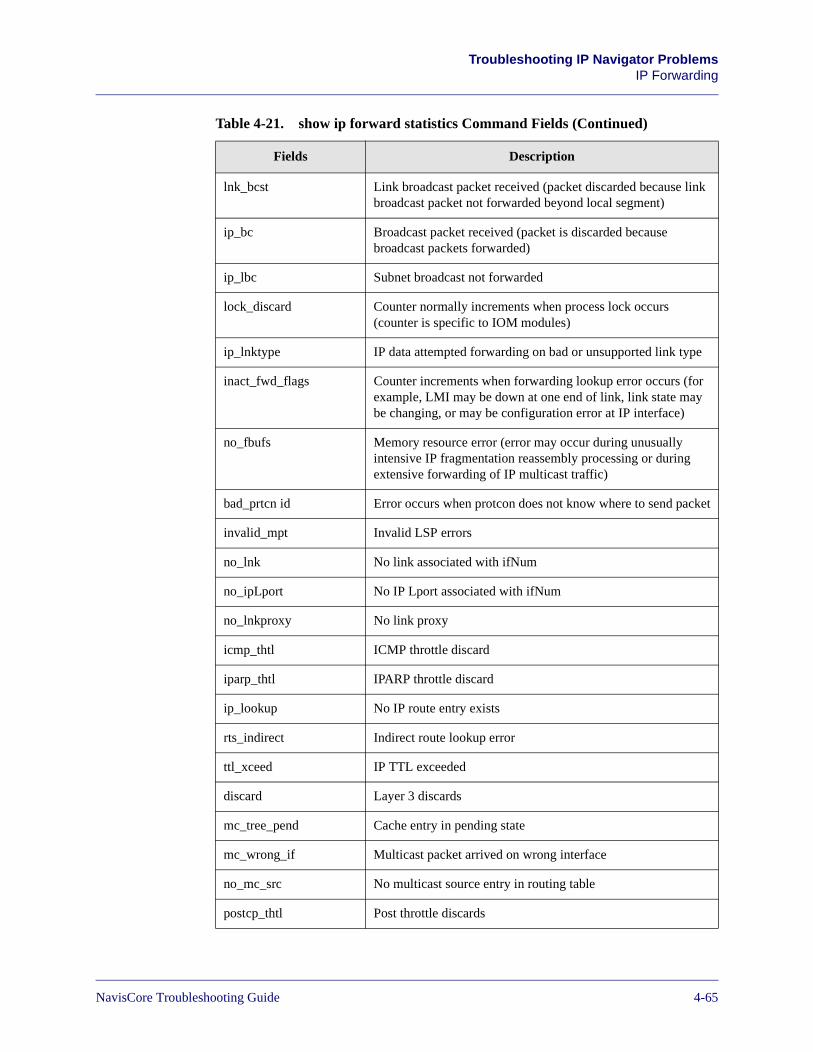
Beta Draft ConfidentialTroubleshooting IP Navigator Problems
IP Forwarding
lnk_bcst Link broadcast packet received (packet discarded because link broadcast packet not forwarded beyond local segment)
ip_bc Broadcast packet received (packet is discarded because broadcast packets forwarded)
ip_lbc Subnet broadcast not forwarded
lock_discard Counter normally increments when process lock occurs (counter is specific to IOM modules)
ip_lnktype IP data attempted forwarding on bad or unsupported link type
inact_fwd_flags Counter increments when forwarding lookup error occurs (for example, LMI may be down at one end of link, link state may be changing, or may be configuration error at IP interface)
no_fbufs Memory resource error (error may occur during unusually intensive IP fragmentation reassembly processing or during extensive forwarding of IP multicast traffic)
bad_prtcn id Error occurs when protcon does not know where to send packet
invalid_mpt Invalid LSP errors
no_lnk No link associated with ifNum
no_ipLport No IP Lport associated with ifNum
no_lnkproxy No link proxy
icmp_thtl ICMP throttle discard
iparp_thtl IPARP throttle discard
ip_lookup No IP route entry exists
rts_indirect Indirect route lookup error
ttl_xceed IP TTL exceeded
discard Layer 3 discards
mc_tree_pend Cache entry in pending state
mc_wrong_if Multicast packet arrived on wrong interface
no_mc_src No multicast source entry in routing table
postcp_thtl Post throttle discards
Table 4-21. show ip forward statistics Command Fields (Continued)
Fields Description
NavisCore Troubleshooting Guide 4-65
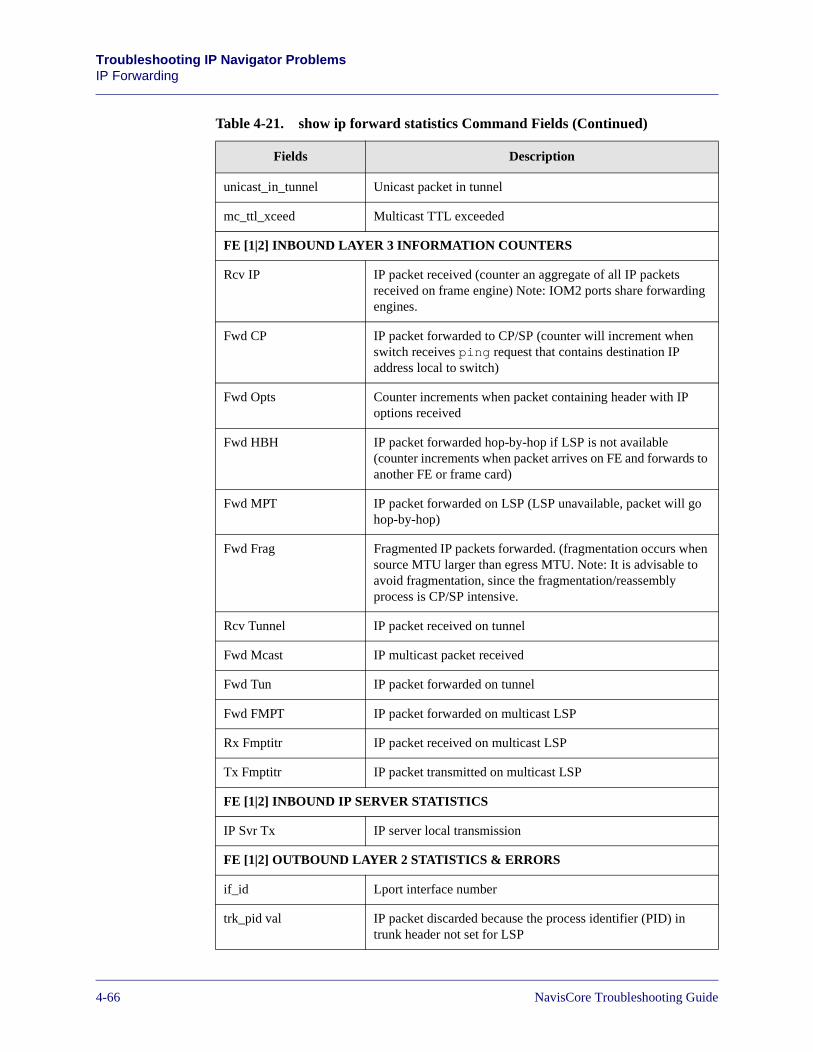
Beta Draft ConfidentialTroubleshooting IP Navigator ProblemsIP Forwarding
unicast_in_tunnel Unicast packet in tunnel
mc_ttl_xceed Multicast TTL exceeded
FE [1|2] INBOUND LAYER 3 INFORMATION COUNTERS
Rcv IP IP packet received (counter an aggregate of all IP packets received on frame engine) Note: IOM2 ports share forwarding engines.
Fwd CP IP packet forwarded to CP/SP (counter will increment when switch receives ping request that contains destination IP address local to switch)
Fwd Opts Counter increments when packet containing header with IP options received
Fwd HBH IP packet forwarded hop-by-hop if LSP is not available (counter increments when packet arrives on FE and forwards to another FE or frame card)
Fwd MPT IP packet forwarded on LSP (LSP unavailable, packet will go hop-by-hop)
Fwd Frag Fragmented IP packets forwarded. (fragmentation occurs when source MTU larger than egress MTU. Note: It is advisable to avoid fragmentation, since the fragmentation/reassembly process is CP/SP intensive.
Rcv Tunnel IP packet received on tunnel
Fwd Mcast IP multicast packet received
Fwd Tun IP packet forwarded on tunnel
Fwd FMPT IP packet forwarded on multicast LSP
Rx Fmptitr IP packet received on multicast LSP
Tx Fmptitr IP packet transmitted on multicast LSP
FE [1|2] INBOUND IP SERVER STATISTICS
IP Svr Tx IP server local transmission
FE [1|2] OUTBOUND LAYER 2 STATISTICS & ERRORS
if_id Lport interface number
trk_pid val IP packet discarded because the process identifier (PID) in trunk header not set for LSP
Table 4-21. show ip forward statistics Command Fields (Continued)
Fields Description
4-66 NavisCore Troubleshooting Guide
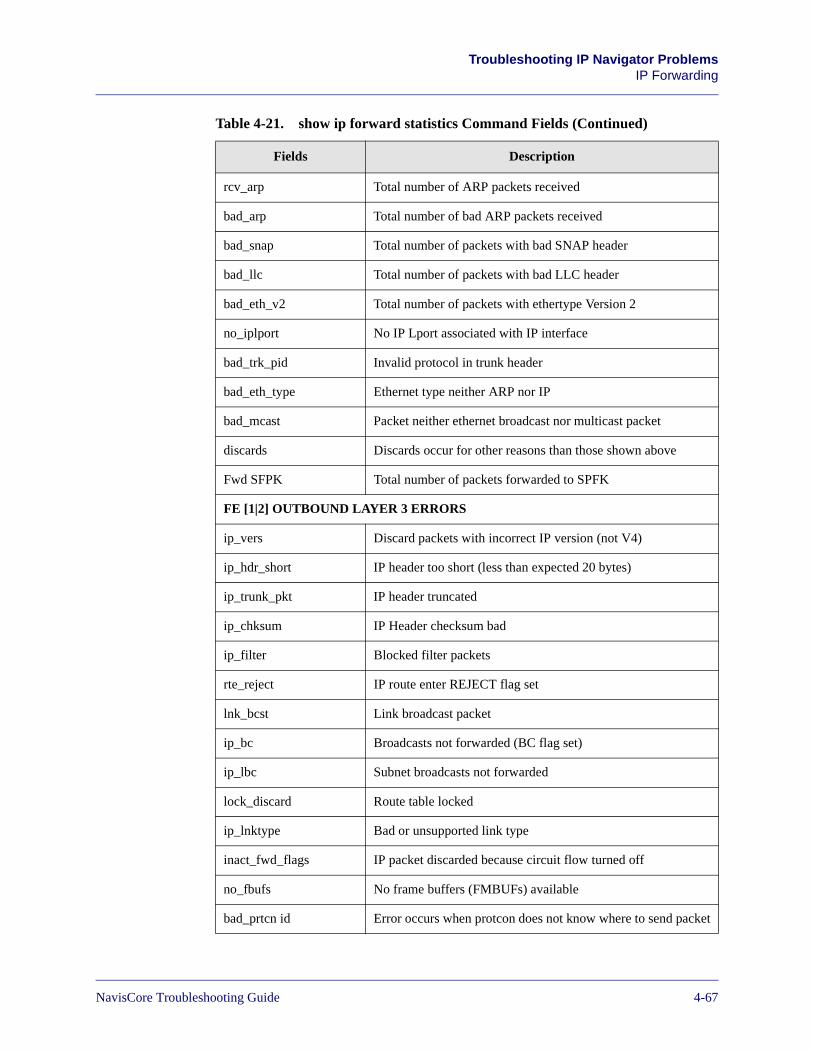
Beta Draft ConfidentialTroubleshooting IP Navigator Problems
IP Forwarding
rcv_arp Total number of ARP packets received
bad_arp Total number of bad ARP packets received
bad_snap Total number of packets with bad SNAP header
bad_llc Total number of packets with bad LLC header
bad_eth_v2 Total number of packets with ethertype Version 2
no_iplport No IP Lport associated with IP interface
bad_trk_pid Invalid protocol in trunk header
bad_eth_type Ethernet type neither ARP nor IP
bad_mcast Packet neither ethernet broadcast nor multicast packet
discards Discards occur for other reasons than those shown above
Fwd SFPK Total number of packets forwarded to SPFK
FE [1|2] OUTBOUND LAYER 3 ERRORS
ip_vers Discard packets with incorrect IP version (not V4)
ip_hdr_short IP header too short (less than expected 20 bytes)
ip_trunk_pkt IP header truncated
ip_chksum IP Header checksum bad
ip_filter Blocked filter packets
rte_reject IP route enter REJECT flag set
lnk_bcst Link broadcast packet
ip_bc Broadcasts not forwarded (BC flag set)
ip_lbc Subnet broadcasts not forwarded
lock_discard Route table locked
ip_lnktype Bad or unsupported link type
inact_fwd_flags IP packet discarded because circuit flow turned off
no_fbufs No frame buffers (FMBUFs) available
bad_prtcn id Error occurs when protcon does not know where to send packet
Table 4-21. show ip forward statistics Command Fields (Continued)
Fields Description
NavisCore Troubleshooting Guide 4-67
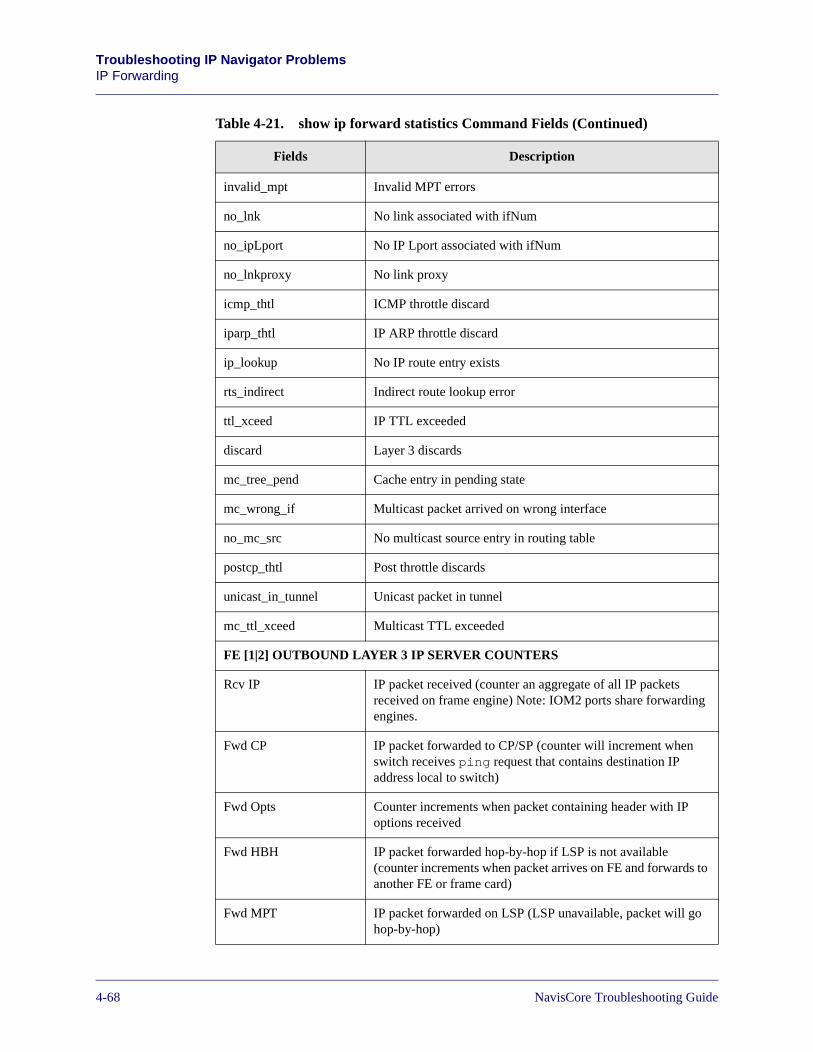
Beta Draft ConfidentialTroubleshooting IP Navigator ProblemsIP Forwarding
invalid_mpt Invalid MPT errors
no_lnk No link associated with ifNum
no_ipLport No IP Lport associated with ifNum
no_lnkproxy No link proxy
icmp_thtl ICMP throttle discard
iparp_thtl IP ARP throttle discard
ip_lookup No IP route entry exists
rts_indirect Indirect route lookup error
ttl_xceed IP TTL exceeded
discard Layer 3 discards
mc_tree_pend Cache entry in pending state
mc_wrong_if Multicast packet arrived on wrong interface
no_mc_src No multicast source entry in routing table
postcp_thtl Post throttle discards
unicast_in_tunnel Unicast packet in tunnel
mc_ttl_xceed Multicast TTL exceeded
FE [1|2] OUTBOUND LAYER 3 IP SERVER COUNTERS
Rcv IP IP packet received (counter an aggregate of all IP packets received on frame engine) Note: IOM2 ports share forwarding engines.
Fwd CP IP packet forwarded to CP/SP (counter will increment when switch receives ping request that contains destination IP address local to switch)
Fwd Opts Counter increments when packet containing header with IP options received
Fwd HBH IP packet forwarded hop-by-hop if LSP is not available (counter increments when packet arrives on FE and forwards to another FE or frame card)
Fwd MPT IP packet forwarded on LSP (LSP unavailable, packet will go hop-by-hop)
Table 4-21. show ip forward statistics Command Fields (Continued)
Fields Description
4-68 NavisCore Troubleshooting Guide
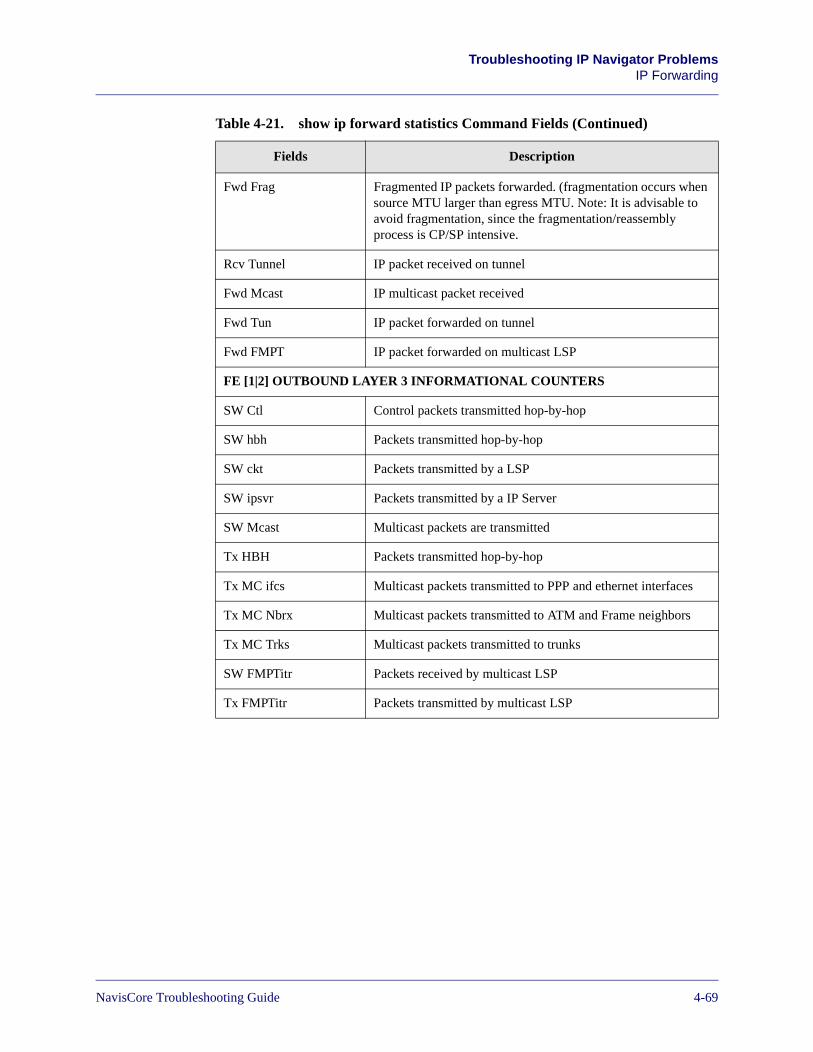
Beta Draft ConfidentialTroubleshooting IP Navigator Problems
IP Forwarding
Fwd Frag Fragmented IP packets forwarded. (fragmentation occurs when source MTU larger than egress MTU. Note: It is advisable to avoid fragmentation, since the fragmentation/reassembly process is CP/SP intensive.
Rcv Tunnel IP packet received on tunnel
Fwd Mcast IP multicast packet received
Fwd Tun IP packet forwarded on tunnel
Fwd FMPT IP packet forwarded on multicast LSP
FE [1|2] OUTBOUND LAYER 3 INFORMATIONAL COUNTERS
SW Ctl Control packets transmitted hop-by-hop
SW hbh Packets transmitted hop-by-hop
SW ckt Packets transmitted by a LSP
SW ipsvr Packets transmitted by a IP Server
SW Mcast Multicast packets are transmitted
Tx HBH Packets transmitted hop-by-hop
Tx MC ifcs Multicast packets transmitted to PPP and ethernet interfaces
Tx MC Nbrx Multicast packets transmitted to ATM and Frame neighbors
Tx MC Trks Multicast packets transmitted to trunks
SW FMPTitr Packets received by multicast LSP
Tx FMPTitr Packets transmitted by multicast LSP
Table 4-21. show ip forward statistics Command Fields (Continued)
Fields Description
NavisCore Troubleshooting Guide 4-69
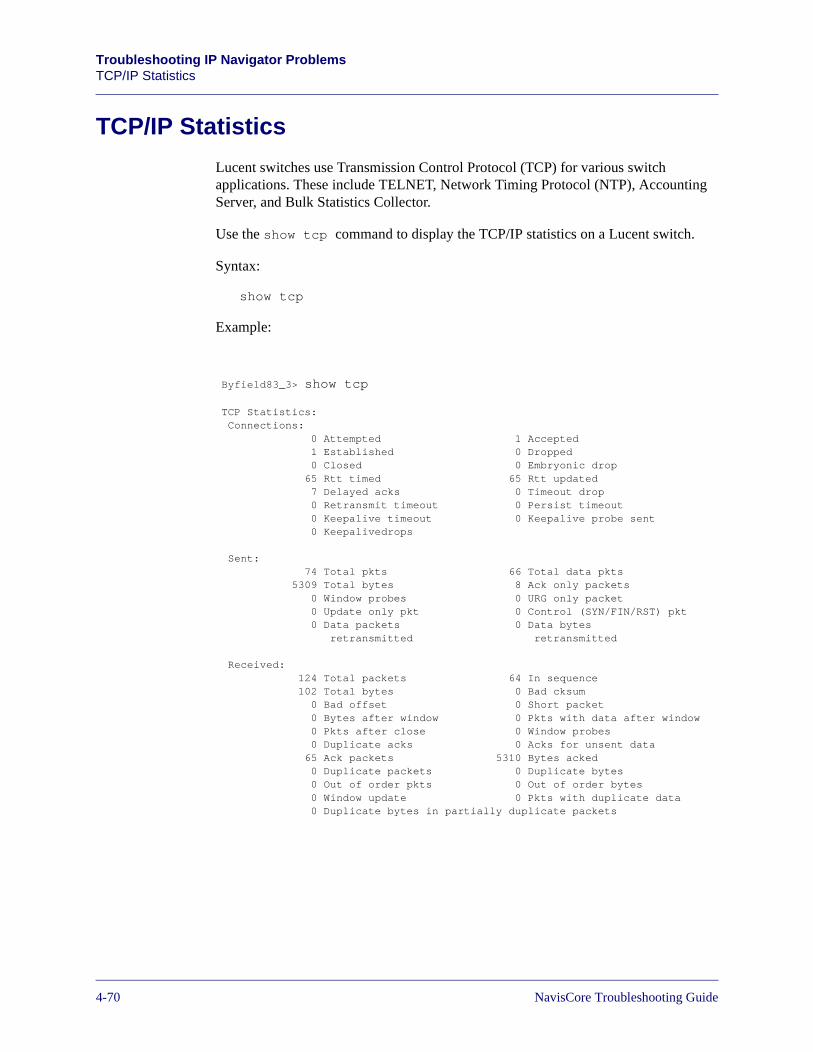
Beta Draft ConfidentialTroubleshooting IP Navigator ProblemsTCP/IP Statistics
TCP/IP Statistics
Lucent switches use Transmission Control Protocol (TCP) for various switch applications. These include TELNET, Network Timing Protocol (NTP), Accounting Server, and Bulk Statistics Collector.
Use the show tcp command to display the TCP/IP statistics on a Lucent switch.
Syntax:
show tcp
Example:
Byfield83_3> show tcp
TCP Statistics: Connections: 0 Attempted 1 Accepted 1 Established 0 Dropped 0 Closed 0 Embryonic drop 65 Rtt timed 65 Rtt updated 7 Delayed acks 0 Timeout drop 0 Retransmit timeout 0 Persist timeout 0 Keepalive timeout 0 Keepalive probe sent 0 Keepalivedrops
Sent: 74 Total pkts 66 Total data pkts 5309 Total bytes 8 Ack only packets 0 Window probes 0 URG only packet 0 Update only pkt 0 Control (SYN/FIN/RST) pkt 0 Data packets 0 Data bytes retransmitted retransmitted
Received: 124 Total packets 64 In sequence 102 Total bytes 0 Bad cksum 0 Bad offset 0 Short packet 0 Bytes after window 0 Pkts with data after window 0 Pkts after close 0 Window probes 0 Duplicate acks 0 Acks for unsent data 65 Ack packets 5310 Bytes acked 0 Duplicate packets 0 Duplicate bytes 0 Out of order pkts 0 Out of order bytes 0 Window update 0 Pkts with duplicate data 0 Duplicate bytes in partially duplicate packets
4-70 NavisCore Troubleshooting Guide
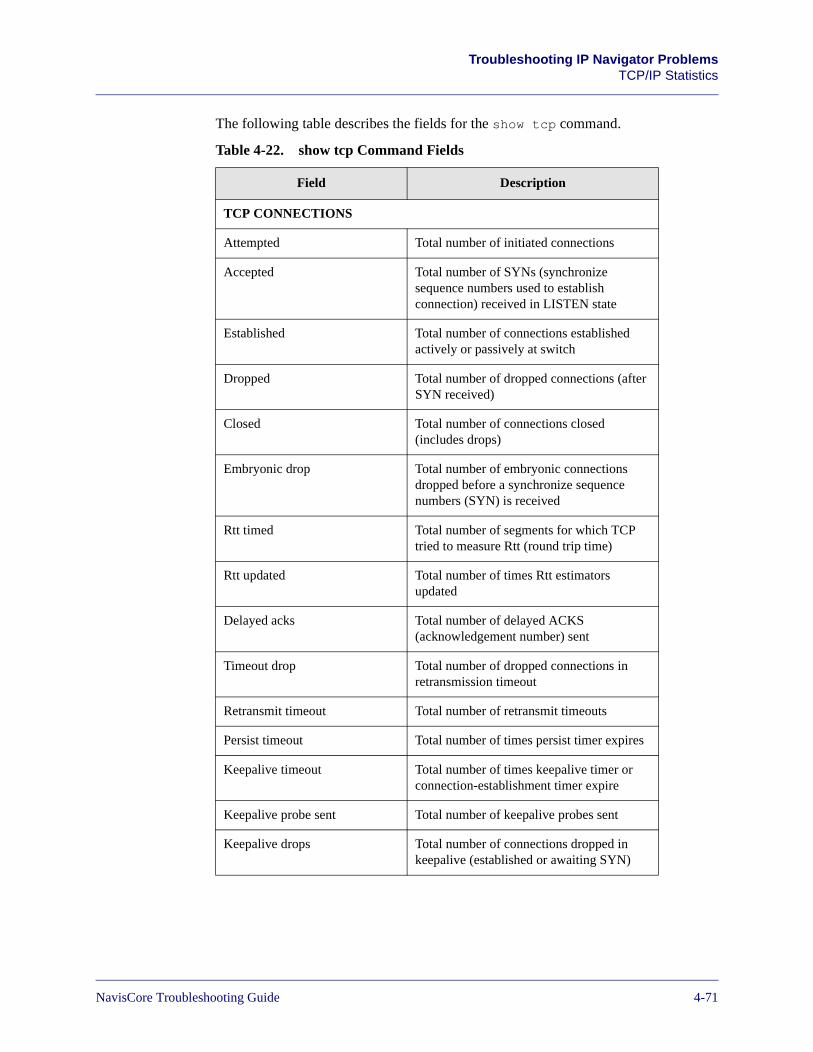
Beta Draft ConfidentialTroubleshooting IP Navigator Problems
TCP/IP Statistics
The following table describes the fields for the show tcp command.
Table 4-22. show tcp Command Fields
Field Description
TCP CONNECTIONS
Attempted Total number of initiated connections
Accepted Total number of SYNs (synchronize sequence numbers used to establish connection) received in LISTEN state
Established Total number of connections established actively or passively at switch
Dropped Total number of dropped connections (after SYN received)
Closed Total number of connections closed (includes drops)
Embryonic drop Total number of embryonic connections dropped before a synchronize sequence numbers (SYN) is received
Rtt timed Total number of segments for which TCP tried to measure Rtt (round trip time)
Rtt updated Total number of times Rtt estimators updated
Delayed acks Total number of delayed ACKS (acknowledgement number) sent
Timeout drop Total number of dropped connections in retransmission timeout
Retransmit timeout Total number of retransmit timeouts
Persist timeout Total number of times persist timer expires
Keepalive timeout Total number of times keepalive timer or connection-establishment timer expire
Keepalive probe sent Total number of keepalive probes sent
Keepalive drops Total number of connections dropped in keepalive (established or awaiting SYN)
NavisCore Troubleshooting Guide 4-71
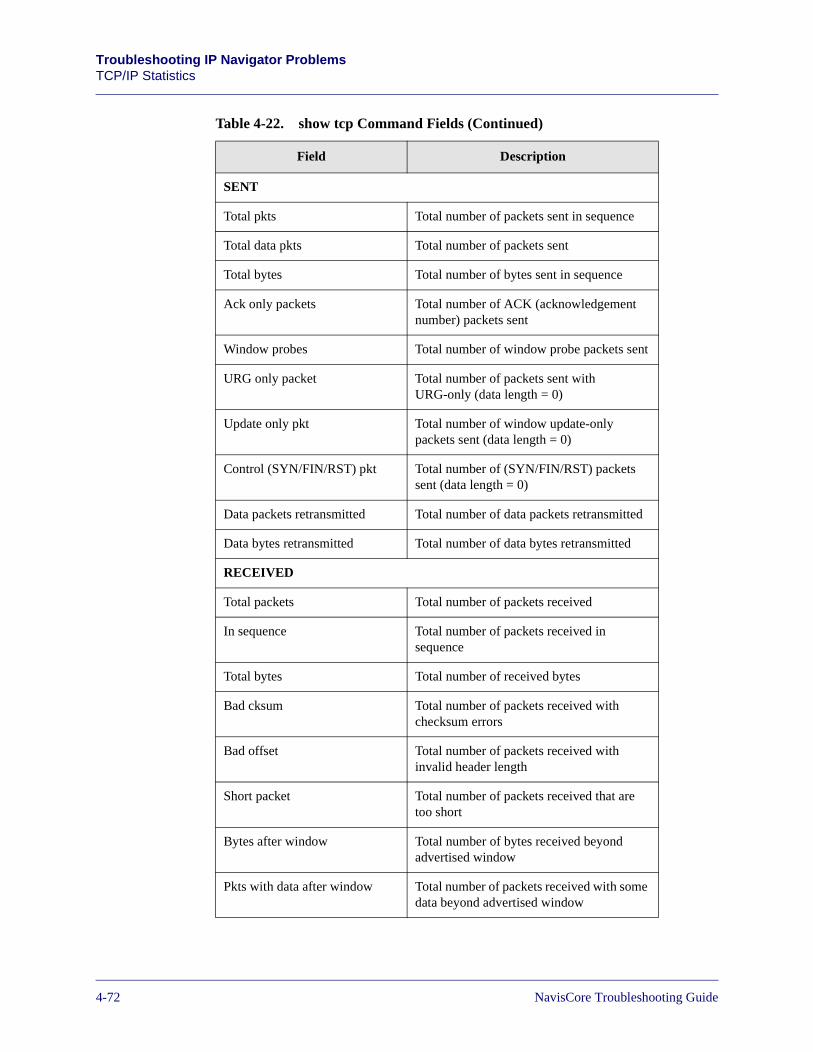
Beta Draft ConfidentialTroubleshooting IP Navigator ProblemsTCP/IP Statistics
SENT
Total pkts Total number of packets sent in sequence
Total data pkts Total number of packets sent
Total bytes Total number of bytes sent in sequence
Ack only packets Total number of ACK (acknowledgement number) packets sent
Window probes Total number of window probe packets sent
URG only packet Total number of packets sent with URG-only (data length = 0)
Update only pkt Total number of window update-only packets sent (data length = 0)
Control (SYN/FIN/RST) pkt Total number of (SYN/FIN/RST) packets sent (data length = 0)
Data packets retransmitted Total number of data packets retransmitted
Data bytes retransmitted Total number of data bytes retransmitted
RECEIVED
Total packets Total number of packets received
In sequence Total number of packets received in sequence
Total bytes Total number of received bytes
Bad cksum Total number of packets received with checksum errors
Bad offset Total number of packets received with invalid header length
Short packet Total number of packets received that are too short
Bytes after window Total number of bytes received beyond advertised window
Pkts with data after window Total number of packets received with some data beyond advertised window
Table 4-22. show tcp Command Fields (Continued)
Field Description
4-72 NavisCore Troubleshooting Guide
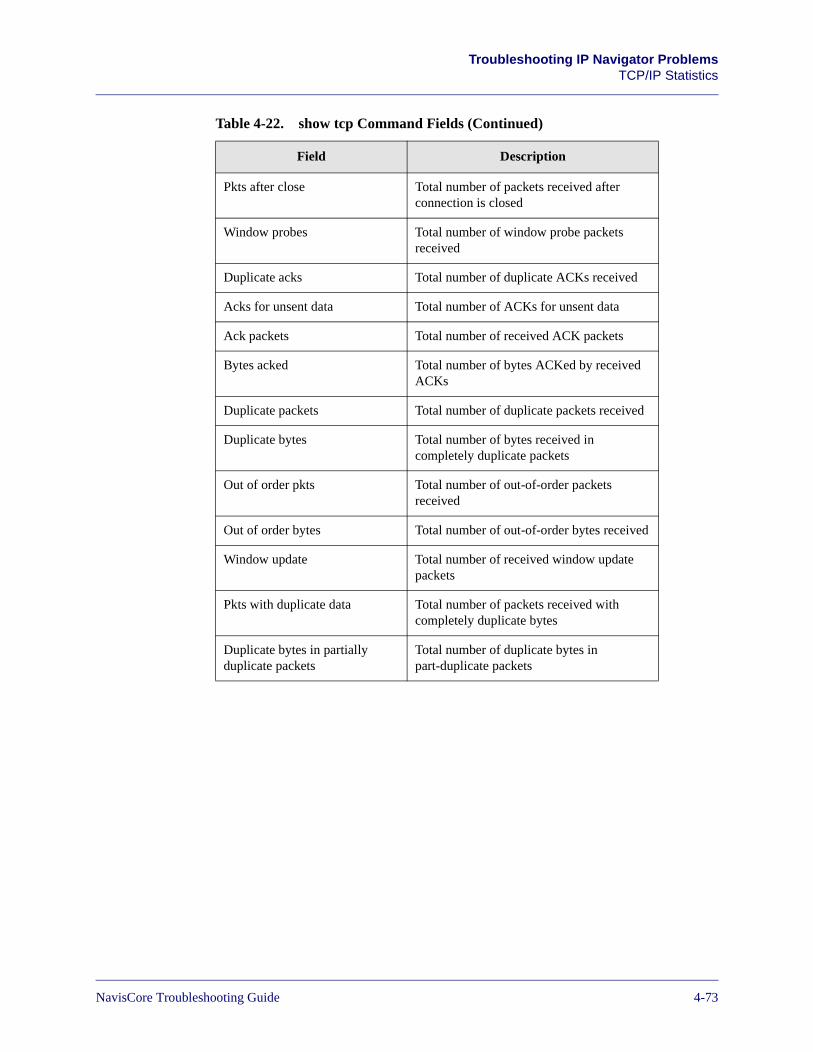
Beta Draft ConfidentialTroubleshooting IP Navigator Problems
TCP/IP Statistics
Pkts after close Total number of packets received after connection is closed
Window probes Total number of window probe packets received
Duplicate acks Total number of duplicate ACKs received
Acks for unsent data Total number of ACKs for unsent data
Ack packets Total number of received ACK packets
Bytes acked Total number of bytes ACKed by received ACKs
Duplicate packets Total number of duplicate packets received
Duplicate bytes Total number of bytes received in completely duplicate packets
Out of order pkts Total number of out-of-order packets received
Out of order bytes Total number of out-of-order bytes received
Window update Total number of received window update packets
Pkts with duplicate data Total number of packets received with completely duplicate bytes
Duplicate bytes in partially duplicate packets
Total number of duplicate bytes in part-duplicate packets
Table 4-22. show tcp Command Fields (Continued)
Field Description
NavisCore Troubleshooting Guide 4-73
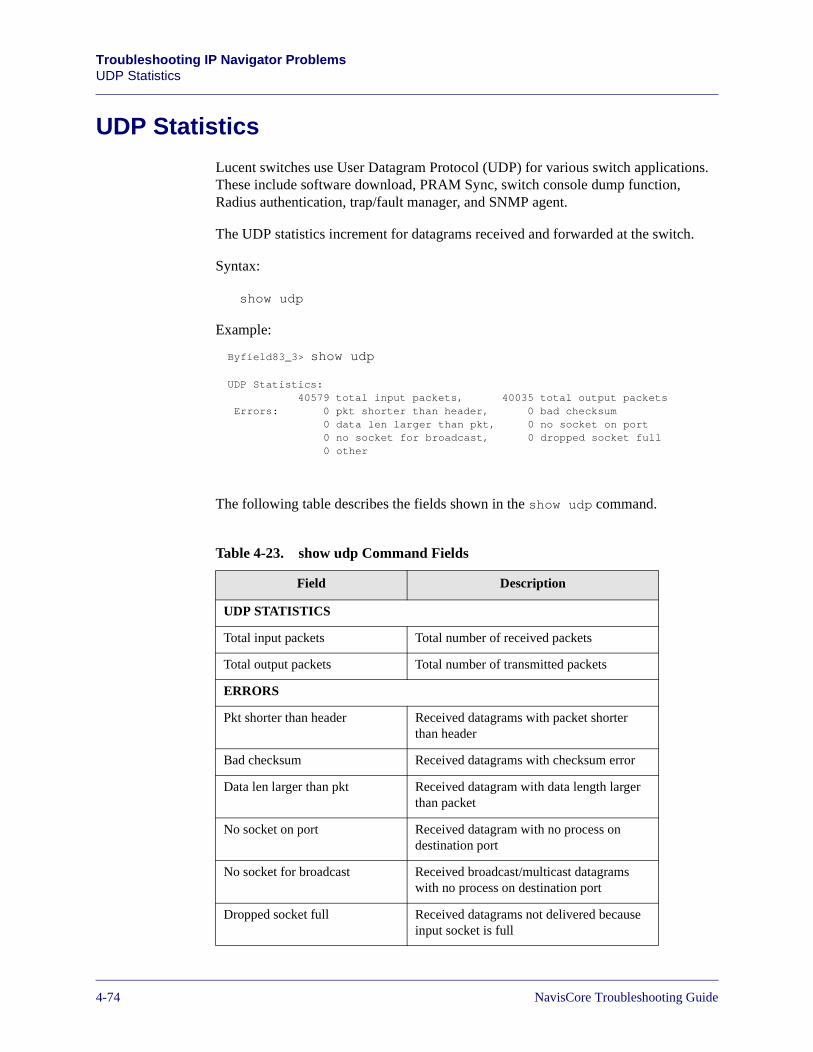
Beta Draft ConfidentialTroubleshooting IP Navigator ProblemsUDP Statistics
UDP Statistics
Lucent switches use User Datagram Protocol (UDP) for various switch applications. These include software download, PRAM Sync, switch console dump function, Radius authentication, trap/fault manager, and SNMP agent.
The UDP statistics increment for datagrams received and forwarded at the switch.
Syntax:
show udp
Example:
The following table describes the fields shown in the show udp command.
Table 4-23. show udp Command Fields
Field Description
UDP STATISTICS
Total input packets Total number of received packets
Total output packets Total number of transmitted packets
ERRORS
Pkt shorter than header Received datagrams with packet shorter than header
Bad checksum Received datagrams with checksum error
Data len larger than pkt Received datagram with data length larger than packet
No socket on port Received datagram with no process on destination port
No socket for broadcast Received broadcast/multicast datagrams with no process on destination port
Dropped socket full Received datagrams not delivered because input socket is full
Byfield83_3> show udp
UDP Statistics:40579 total input packets, 40035 total output packets
Errors: 0 pkt shorter than header, 0 bad checksum0 data len larger than pkt, 0 no socket on port0 no socket for broadcast, 0 dropped socket full0 other
4-74 NavisCore Troubleshooting Guide
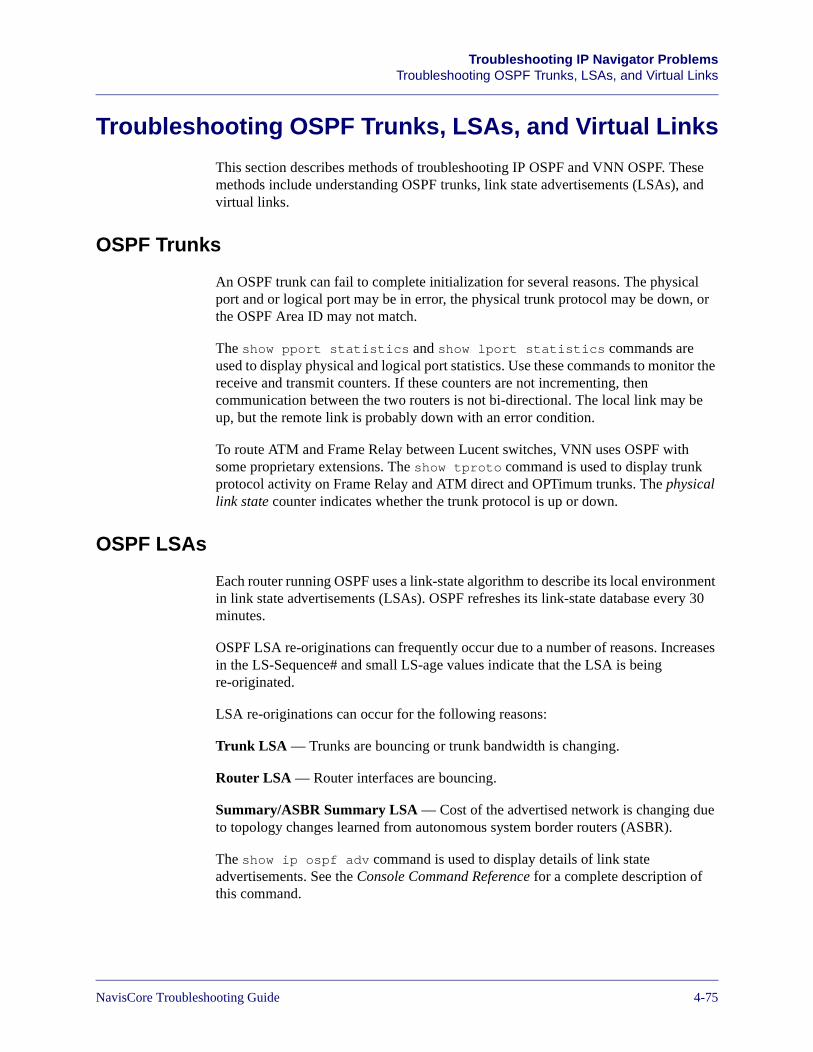
Beta Draft ConfidentialTroubleshooting IP Navigator Problems
Troubleshooting OSPF Trunks, LSAs, and Virtual Links
Troubleshooting OSPF Trunks, LSAs, and Virtual Links
This section describes methods of troubleshooting IP OSPF and VNN OSPF. These methods include understanding OSPF trunks, link state advertisements (LSAs), and virtual links.
OSPF Trunks
An OSPF trunk can fail to complete initialization for several reasons. The physical port and or logical port may be in error, the physical trunk protocol may be down, or the OSPF Area ID may not match.
The show pport statistics and show lport statistics commands are used to display physical and logical port statistics. Use these commands to monitor the receive and transmit counters. If these counters are not incrementing, then communication between the two routers is not bi-directional. The local link may be up, but the remote link is probably down with an error condition.
To route ATM and Frame Relay between Lucent switches, VNN uses OSPF with some proprietary extensions. The show tproto command is used to display trunk protocol activity on Frame Relay and ATM direct and OPTimum trunks. The physical link state counter indicates whether the trunk protocol is up or down.
OSPF LSAs
Each router running OSPF uses a link-state algorithm to describe its local environment in link state advertisements (LSAs). OSPF refreshes its link-state database every 30 minutes.
OSPF LSA re-originations can frequently occur due to a number of reasons. Increases in the LS-Sequence# and small LS-age values indicate that the LSA is being re-originated.
LSA re-originations can occur for the following reasons:
Trunk LSA — Trunks are bouncing or trunk bandwidth is changing.
Router LSA — Router interfaces are bouncing.
Summary/ASBR Summary LSA — Cost of the advertised network is changing due to topology changes learned from autonomous system border routers (ASBR).
The show ip ospf adv command is used to display details of link state advertisements. See the Console Command Reference for a complete description of this command.
NavisCore Troubleshooting Guide 4-75
Beta Draft ConfidentialTroubleshooting IP Navigator ProblemsTroubleshooting OSPF Trunks, LSAs, and Virtual Links
OSPF Virtual Links
OSPF requires area border routers (ABR) to be connected to Area 0. This can be virtually accomplished through a transit area if a direct physical connection is not possible. Virtual links can be configured in either a IP OSPF or a VNN OSPF network.
Virtual links may fail for the following reasons:
Neighbor Router ID — A router ID may not be configured at each virtual link endpoint.
For VNN OSPF, the router ID is the same value as the switch ID. IP OSPF has its own router ID. The endpoint switches are the ABRs that border on the transit area.
Transit Area — The switch may not have OSPF interfaces in the same transit area. A loopback address (VNN or IP) may not be configured in the transit area.
Refer to the NavisCore IP Navigator Configuration Guide for a complete description of IP OSPF virtual links and VNN OSPF virtual links.
The following commands are useful in debugging virtual link problems:
sho vnn statistics — Displays the router ID as well as VNN statistics.
show ip ospf interface — Displays virtual link interfaces (type = vlink) as well as all other IP OSPF interfaces.
show vnn interface — Displays virtual link interfaces (type = vlink) as well as all other VNN interface.
4-76 NavisCore Troubleshooting Guide
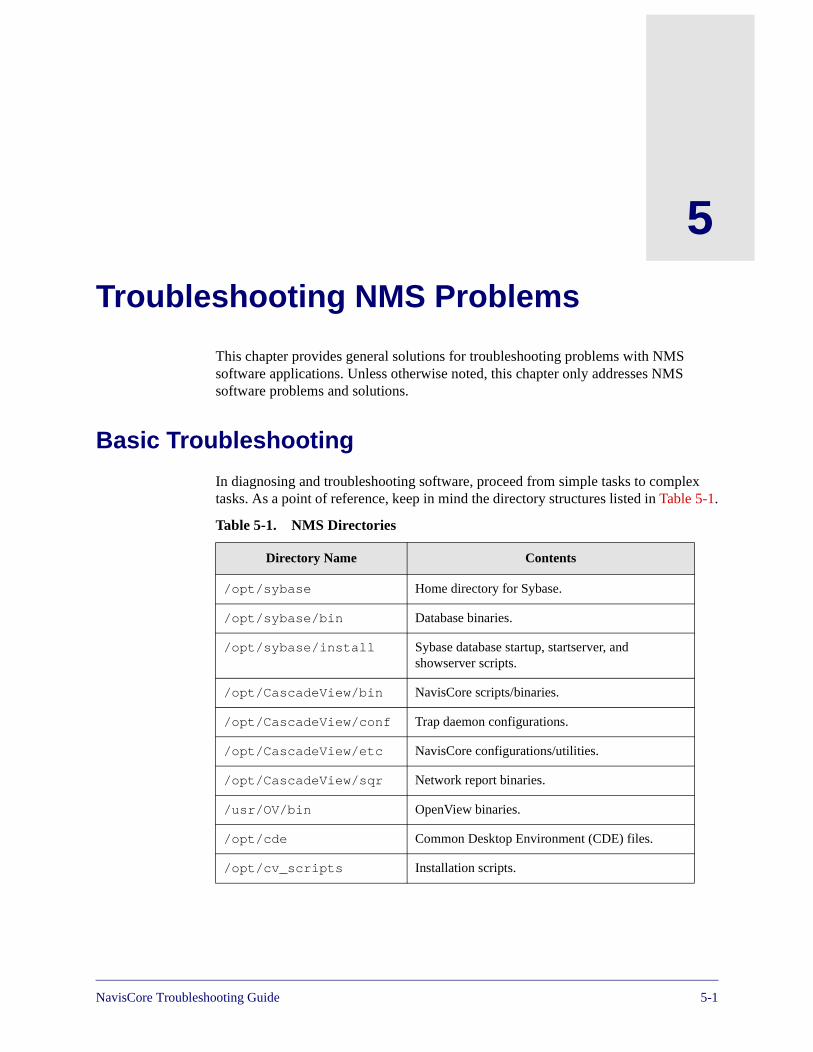
NavisCore Troubleshooting Guide
Beta Draft Confidential
5
Troubleshooting NMS Problems
This chapter provides general solutions for troubleshooting problems with NMS software applications. Unless otherwise noted, this chapter only addresses NMS software problems and solutions.
Basic Troubleshooting
In diagnosing and troubleshooting software, proceed from simple tasks to complex tasks. As a point of reference, keep in mind the directory structures listed in Table 5-1.
Table 5-1. NMS Directories
Directory Name Contents
/opt/sybase Home directory for Sybase.
/opt/sybase/bin Database binaries.
/opt/sybase/install Sybase database startup, startserver, and showserver scripts.
/opt/CascadeView/bin NavisCore scripts/binaries.
/opt/CascadeView/conf Trap daemon configurations.
/opt/CascadeView/etc NavisCore configurations/utilities.
/opt/CascadeView/sqr Network report binaries.
/usr/OV/bin OpenView binaries.
/opt/cde Common Desktop Environment (CDE) files.
/opt/cv_scripts Installation scripts.
5-1
Beta Draft ConfidentialTroubleshooting NMS ProblemsBasic Troubleshooting
HP OpenView Problems
If you are having problems with your Sun System, complete the following steps on your Sun System to isolate the cause:
1. List the configuration of all hardware and software items currently installed on the Sun System. Include all related external devices, software configuration settings, and vendor types.
2. Restart the OV processes using ovstop and ovstart.
3. Verify the output of boot messages (dmesg).
NMS Problems
To isolate the cause of new problems on an NMS:
Check the hardware.
Verify any new hardware installations on the Sun System. If you recently added a new device or card to the Sun System, it may have conflicts with existing devices for system resources. Verify that the SCSI device target addresses for the CD-ROM drive is 6.
Check the software.
If you install or run new software on the Sun System, it may have conflicts with existing software for control of peripheral devices or use of memory. Deactivate the new software to verify a potential conflict. If existing applications run without the new software, you must then determine the cause of the conflict and correct the problem.
If you changed any settings in your configuration files, return the files to their previous configurations.
5-27/17/03 NavisCore Troubleshooting Guide
Beta Draft ConfidentialTroubleshooting NMS Problems
Common NMS Installation Problems
Common NMS Installation Problems
This section describes some common problems and questions related to new NMS software installations. The section also covers possible solutions.
I am having problems seeing my external cdrom drive.
Perform the following steps if the NMS has problems seeing its external cdrom drive:
1. Verify that the SCSI target address on the back of the CD-ROM drive is 6.
2. The SCSI devices need to be terminated. Verify that there is a terminator installed on the last device in the SCSI chain.
3. Turn on the external SCSI devices, then power up the system. This gives the devices time to boot up and be recognized by the system.
4. While holding down the stop key, type a to stop the boot process.
– At the OK prompt, type probe-scsi
This searches the system for SCSI devices and lists what is installed and the corresponding SCSI IDs. Make a note of the SCSI addresses for all the devices.
5. Type boot -r when the system recognizes the devices.
How much physical memory do I have?
When you first boot up the system, the system tests the memory and displays the amount of memory (MB) available. To determine the amount of physical memory you have while the system is running:
1. Log in as the root user and enter the root password.
2. Enter the following command:
/usr/bin/dmesg
This command provides system boot-up information and displays the amount of installed physical memory in (MB). If the system has been running, the amount displayed is not correct. Shut down and restart the system. Repeat steps 1 and 2 to display the amount of available memory.
Every device must have a unique SCSI address.
NavisCore Troubleshooting Guide 7/17/035-3
Beta Draft ConfidentialTroubleshooting NMS ProblemsCommon NMS Installation Problems
I am having trouble installing Solaris 7.
Verify that you have identified your hardware correctly and partitioned your disks properly by doing the following:
1. Restart the Solaris 7/8 installation by holding down the stop key and typing a to interrupt the machine.
2. Verify that the Solaris 2.7/2.8 installation CD is installed in the CD-ROM drive.
3. Enter boot cdrom.
4. See the Network Management Station Installation Guide for further installation instructions.
How do I copy Lucent switch software from a floppy to my NMS?
To copy the Lucent switch software from a floppy to your NMS:
1. Insert the floppy into the drive.
2. To initiate the File Manager from the command window, enter:
/usr/openwin/bin/filemgr &
3. From the File menu, select Check for Floppy. A File Manager window appears and displays the contents of the floppy. The switch software files are listed in the window.
4. Verify that the system File Manager is set to the following directory:
/opt/CascadeView.var/switchSoftware
5. Select the switch software window. Select a file and drag it to the system File Manager window.
Continue this procedure for each file that you want to copy. This process takes a few minutes to complete.
When the copy is complete, the file icon appears.
6. Choose the eject disk button located in the floppy File Manager box.
7. To download the switch software from the NMS to the switch, see the Software Release Notice that comes with your software release.
5-47/17/03 NavisCore Troubleshooting Guide
Beta Draft ConfidentialTroubleshooting NMS Problems
Common NMS Installation Problems
How do I start NavisCore?
To start NavisCore:
1. Verify that you are logged in as an NMS user by entering the following command:
whoami
2. Verify that you are in the /opt/nms directory by entering the following command:
pwd
3. If necessary, start NavisCore by typing:
/usr/OV/bin/ovw &
If NavisCore is set up correctly, the path is not needed.
What is my password?
Lucent does not know the root or NMS user passwords. Lucent does not have default passwords.
What must I do before I shut down the NMS?
You must shut down all UNIX processes before you can power off the NMS.
Where do I get an HP OpenView key?
A key comes with each copy of HP OpenView. The key matches the IP address of the UNIX workstation for which HP OpenView was purchased. Register the key by sending the completed software certificate included with your HP OpenView package to Hewlett Packard.
NavisCore Troubleshooting Guide 7/17/035-5
Beta Draft ConfidentialTroubleshooting NMS ProblemsCommon NMS Installation Problems
I get the error “Cannot connect to database.”
If you receive the error “cannot connect to database” when you try to start NavisCore, it may be because some daemons are not running. Do the following:
1. Log in as the root user and enter the appropriate password.
2. Verify that all OV daemons are running by entering the following command:
/usr/OV/bin/ovstatus
3. If all OV daemons are not running, restart the OV daemons by entering:
/usr/OV/bin/ovstart ovwdb
4. To start all daemons, enter the following command:
/usr/OV/bin/ovstart
5. To confirm that all daemons are running, enter:
/usr/OV/bin/ovstatus
What kind of hardware do I need?
See the Network Management Station Installation Guide for your software release.
What software versions do I need?
See the Network Management Station Installation Guide for your software release.
What is a raw file-system partition?
A raw partition is not part of the operating system. It is treated as a separate device, and is assigned to one of the database devices used by Sybase. A file device is part of the UNIX file system and runs on a cooked partition, which is a partition that has readable directory structures. A file-system partition is a file that grows bigger and bigger as the database size increases.
I cannot start Sybase!
See the Network Management Station Installation Guide for information on starting Sybase.
5-67/17/03 NavisCore Troubleshooting Guide
Beta Draft ConfidentialTroubleshooting NMS Problems
Common NMS Installation Problems
I get a “cannot allocate shared memory” error when I start Sybase.
Perform the following steps when you see the error “cannot allocate shared memory” when you start Sybase:
1. Make sure that the shared-memory allocation was added to the /etc/system file and the system was rebooted after the file was edited.
2. Restart the Sybase server.
How do I know if NavisCore is running?
The NavisCore icon appears on the screen when NavisCore is running. Never close this icon, unless one of the supporting programs (such as HP OpenView) stops processing.
I keep getting the message “access denied.”
You are not logged on. To log on:
1. From the Misc menu, select NavisCore ⇒ Logon.
2. Enter your operator password.
Corrupt files are caused by improperly shutting down the Sybase server. These files are shared-memory files that Sybase uses. If these files become corrupt, you cannot start the server. Be sure to always perform an orderly shut down. See “How do I shut down the Sybase server?” on page 5-10.
NavisCore Troubleshooting Guide 7/17/035-7
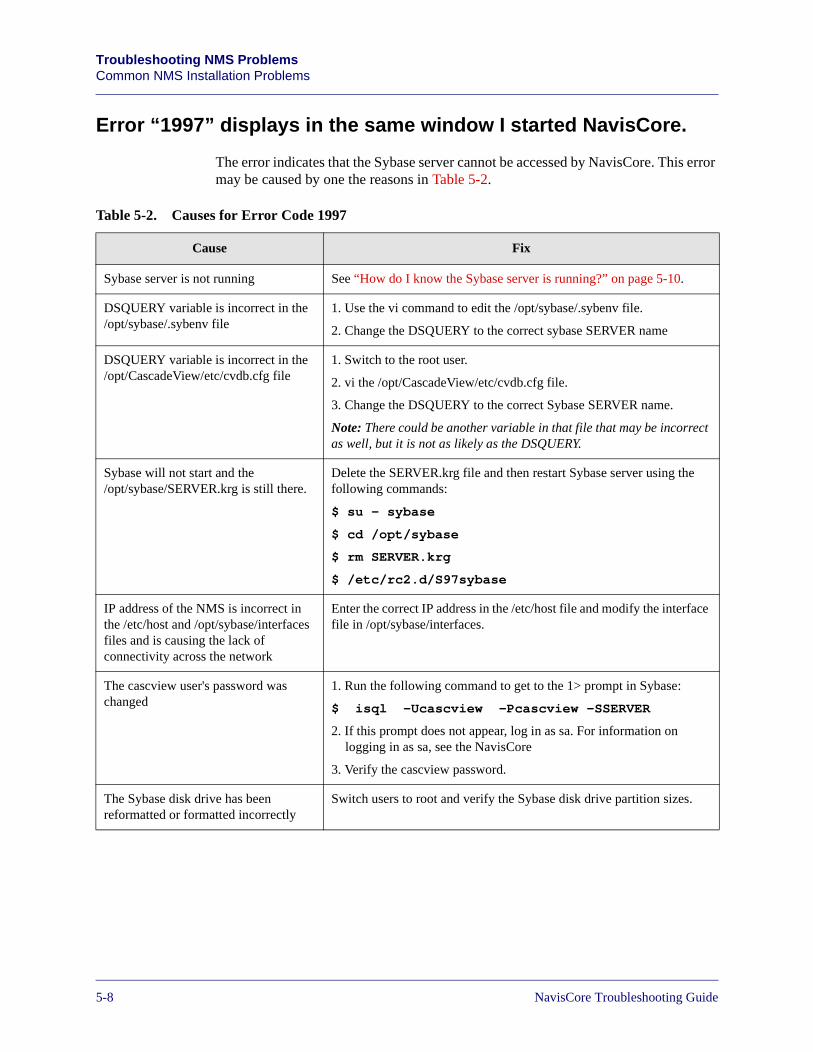
Beta Draft ConfidentialTroubleshooting NMS ProblemsCommon NMS Installation Problems
Error “1997” displays in the same window I started NavisCore.
The error indicates that the Sybase server cannot be accessed by NavisCore. This error may be caused by one the reasons in Table 5-2.
Table 5-2. Causes for Error Code 1997
Cause Fix
Sybase server is not running See “How do I know the Sybase server is running?” on page 5-10.
DSQUERY variable is incorrect in the /opt/sybase/.sybenv file
1. Use the vi command to edit the /opt/sybase/.sybenv file.
2. Change the DSQUERY to the correct sybase SERVER name
DSQUERY variable is incorrect in the /opt/CascadeView/etc/cvdb.cfg file
1. Switch to the root user.
2. vi the /opt/CascadeView/etc/cvdb.cfg file.
3. Change the DSQUERY to the correct Sybase SERVER name.
Note: There could be another variable in that file that may be incorrect as well, but it is not as likely as the DSQUERY.
Sybase will not start and the /opt/sybase/SERVER.krg is still there.
Delete the SERVER.krg file and then restart Sybase server using the following commands:
$ su - sybase
$ cd /opt/sybase
$ rm SERVER.krg
$ /etc/rc2.d/S97sybase
IP address of the NMS is incorrect in the /etc/host and /opt/sybase/interfaces files and is causing the lack of connectivity across the network
Enter the correct IP address in the /etc/host file and modify the interface file in /opt/sybase/interfaces.
The cascview user's password was changed
1. Run the following command to get to the 1> prompt in Sybase:
$ isql -Ucascview -Pcascview -SSERVER
2. If this prompt does not appear, log in as sa. For information on logging in as sa, see the NavisCore
3. Verify the cascview password.
The Sybase disk drive has been reformatted or formatted incorrectly
Switch users to root and verify the Sybase disk drive partition sizes.
5-87/17/03 NavisCore Troubleshooting Guide
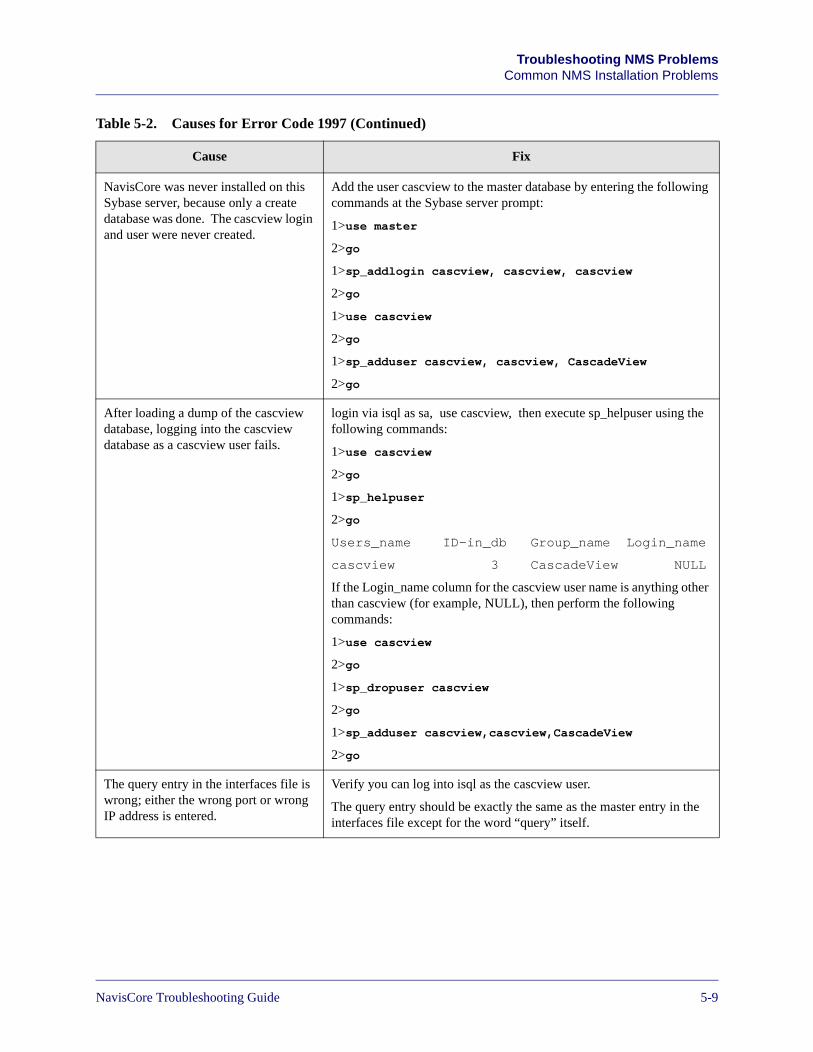
Beta Draft ConfidentialTroubleshooting NMS Problems
Common NMS Installation Problems
NavisCore was never installed on this Sybase server, because only a create database was done. The cascview login and user were never created.
Add the user cascview to the master database by entering the following commands at the Sybase server prompt:
1>use master
2>go
1>sp_addlogin cascview, cascview, cascview
2>go
1>use cascview
2>go
1>sp_adduser cascview, cascview, CascadeView
2>go
After loading a dump of the cascview database, logging into the cascview database as a cascview user fails.
login via isql as sa, use cascview, then execute sp_helpuser using the following commands:
1>use cascview
2>go
1>sp_helpuser
2>go
Users_name ID-in_db Group_name Login_name
cascview 3 CascadeView NULL
If the Login_name column for the cascview user name is anything other than cascview (for example, NULL), then perform the following commands:
1>use cascview
2>go
1>sp_dropuser cascview
2>go
1>sp_adduser cascview,cascview,CascadeView
2>go
The query entry in the interfaces file is wrong; either the wrong port or wrong IP address is entered.
Verify you can log into isql as the cascview user.
The query entry should be exactly the same as the master entry in the interfaces file except for the word “query” itself.
Table 5-2. Causes for Error Code 1997 (Continued)
Cause Fix
NavisCore Troubleshooting Guide 7/17/035-9
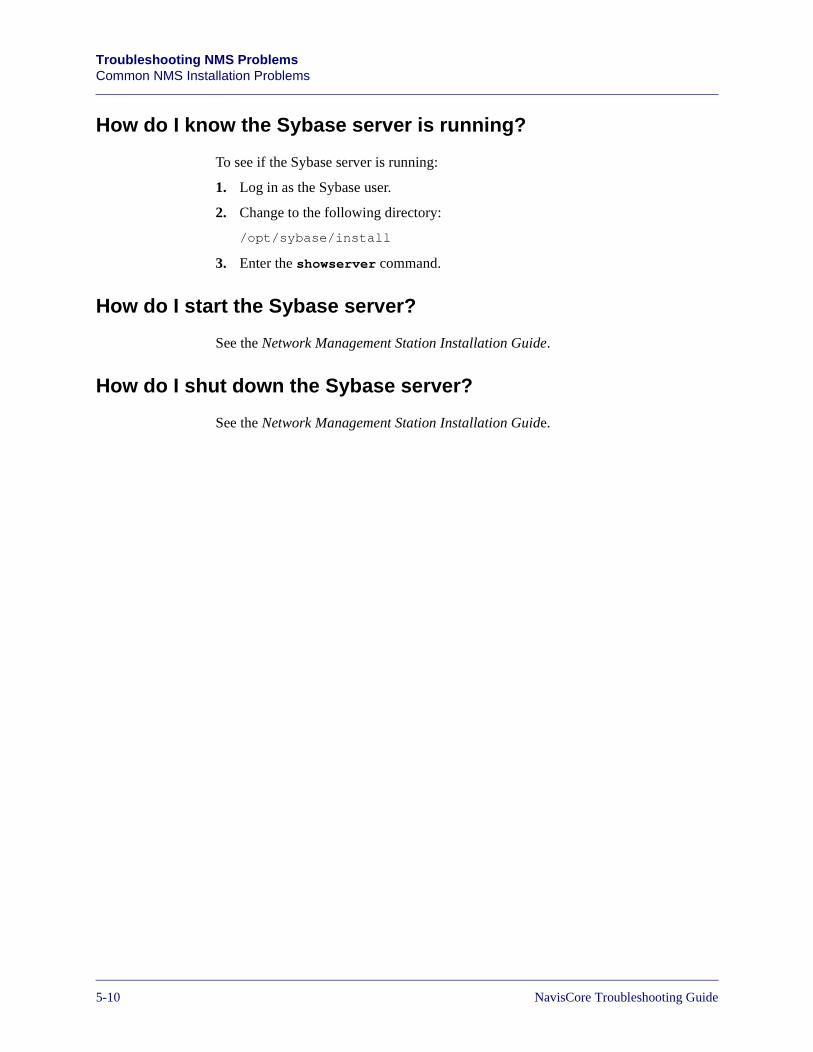
Beta Draft ConfidentialTroubleshooting NMS ProblemsCommon NMS Installation Problems
How do I know the Sybase server is running?
To see if the Sybase server is running:
1. Log in as the Sybase user.
2. Change to the following directory:
/opt/sybase/install
3. Enter the showserver command.
How do I start the Sybase server?
See the Network Management Station Installation Guide.
How do I shut down the Sybase server?
See the Network Management Station Installation Guide.
5-107/17/03 NavisCore Troubleshooting Guide
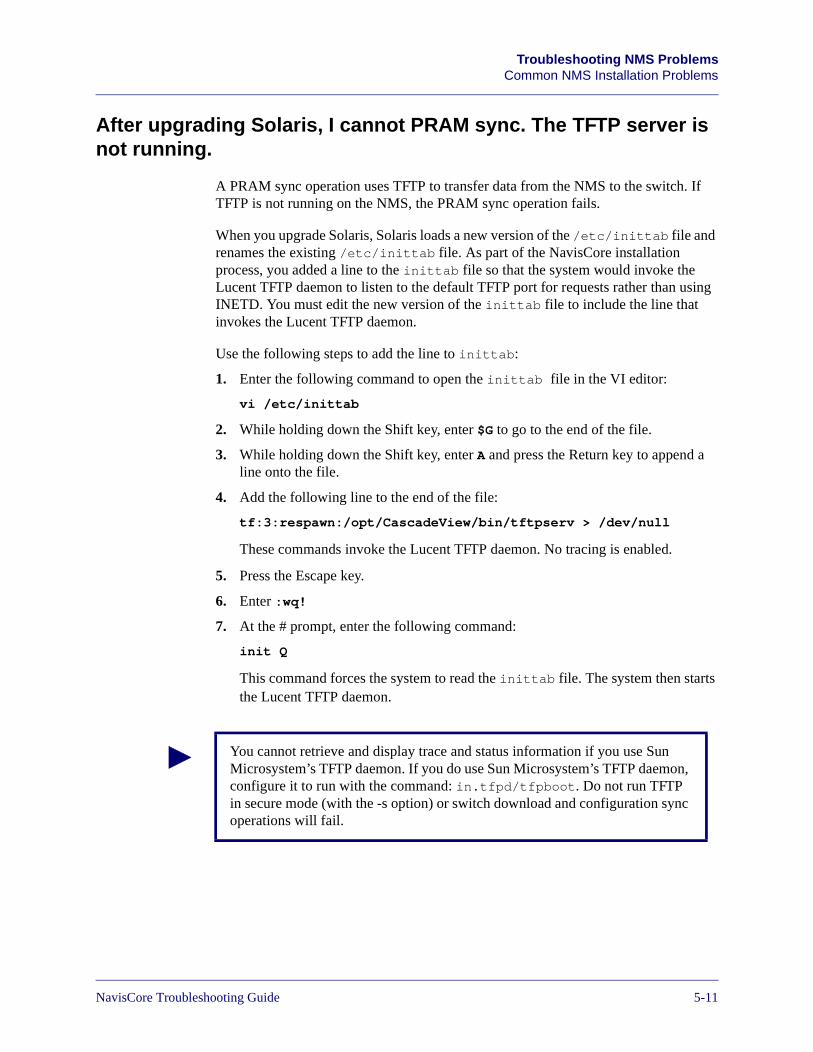
Beta Draft ConfidentialTroubleshooting NMS Problems
Common NMS Installation Problems
After upgrading Solaris, I cannot PRAM sync. The TFTP server isnot running.
A PRAM sync operation uses TFTP to transfer data from the NMS to the switch. If TFTP is not running on the NMS, the PRAM sync operation fails.
When you upgrade Solaris, Solaris loads a new version of the /etc/inittab file and renames the existing /etc/inittab file. As part of the NavisCore installation process, you added a line to the inittab file so that the system would invoke the Lucent TFTP daemon to listen to the default TFTP port for requests rather than using INETD. You must edit the new version of the inittab file to include the line that invokes the Lucent TFTP daemon.
Use the following steps to add the line to inittab:
1. Enter the following command to open the inittab file in the VI editor:
vi /etc/inittab
2. While holding down the Shift key, enter $G to go to the end of the file.
3. While holding down the Shift key, enter A and press the Return key to append a line onto the file.
4. Add the following line to the end of the file:
tf:3:respawn:/opt/CascadeView/bin/tftpserv > /dev/null
These commands invoke the Lucent TFTP daemon. No tracing is enabled.
5. Press the Escape key.
6. Enter :wq!
7. At the # prompt, enter the following command:
init Q
This command forces the system to read the inittab file. The system then starts the Lucent TFTP daemon.
You cannot retrieve and display trace and status information if you use Sun Microsystem’s TFTP daemon. If you do use Sun Microsystem’s TFTP daemon, configure it to run with the command: in.tfpd/tfpboot. Do not run TFTP in secure mode (with the -s option) or switch download and configuration sync operations will fail.
NavisCore Troubleshooting Guide 7/17/035-11
Beta Draft ConfidentialTroubleshooting NMS ProblemsCommon NMS Installation Problems
How Can I Save My PVC Connections When Upgrading a Switch or Replacing an I/O Module?
To save your PVC connections you can move the circuits to another switch. The Move Circuit function enables you to move circuit endpoints defined for one logical port (the source) to another logical port (the destination).
Restrictions When Moving Circuits
This function has the following restrictions:
• You cannot move circuits you previously defined as part of a fault-tolerant PVC configuration (defined with a service name or designated as a backup).
• You cannot move a circuit that is currently in use as it may lose traffic.
• You cannot move a circuit if you receive an error that indicates there is a problem acquiring a lock for the circuit and all associated logical ports.
• You cannot move a circuit that has a manually defined circuit path.
• You cannot define more than one circuit for a Frame Relay Assembler/Disassembler (FRAD) logical port.
• The DLCI or VPI/VCI must be unique to the destination logical port.
• You cannot move a circuit if the source logical port type is not a valid type for the destination port. For example, you cannot move a Frame Relay or SMDS logical port type to an ATM DS3 module.
• The Move Circuit function will fail if the number of circuits moved exceeds the maximum allowed for the I/O card.
• You cannot move a circuit that is a member of a multicast DLCI configuration.
5-127/17/03 NavisCore Troubleshooting Guide
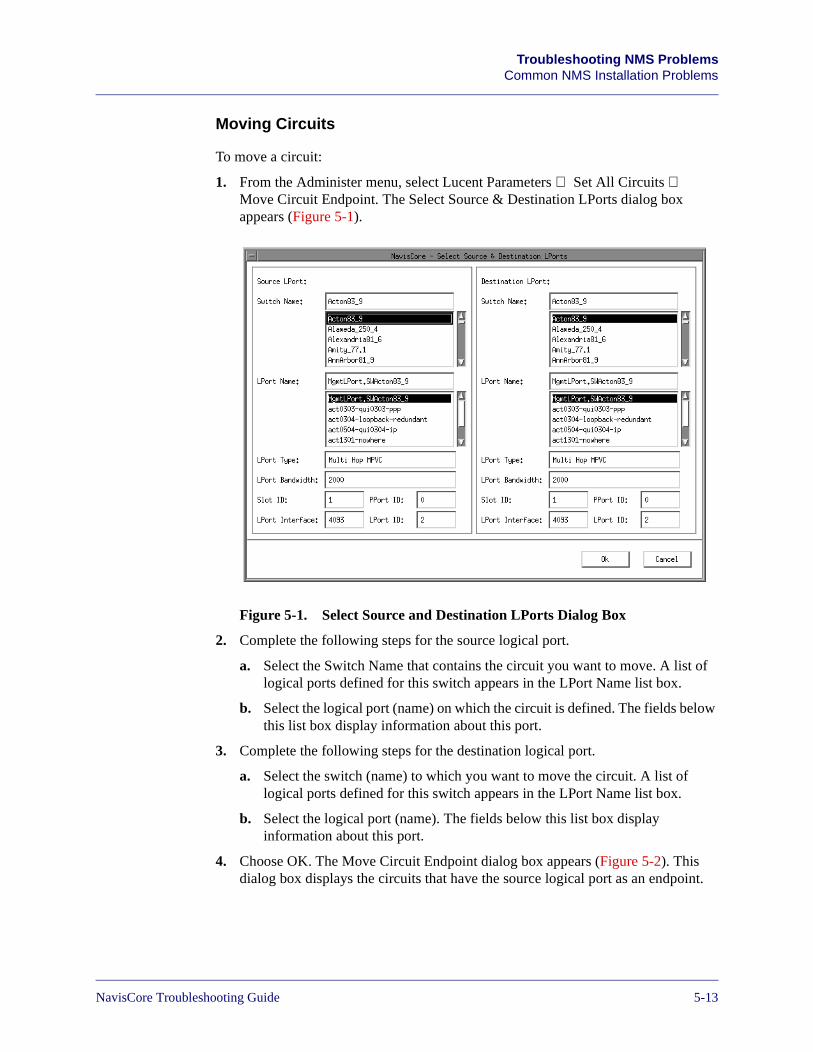
Beta Draft ConfidentialTroubleshooting NMS Problems
Common NMS Installation Problems
Moving Circuits
To move a circuit:
1. From the Administer menu, select Lucent Parameters ⇒ Set All Circuits ⇒ Move Circuit Endpoint. The Select Source & Destination LPorts dialog box appears (Figure 5-1).
Figure 5-1. Select Source and Destination LPorts Dialog Box
2. Complete the following steps for the source logical port.
a. Select the Switch Name that contains the circuit you want to move. A list of logical ports defined for this switch appears in the LPort Name list box.
b. Select the logical port (name) on which the circuit is defined. The fields below this list box display information about this port.
3. Complete the following steps for the destination logical port.
a. Select the switch (name) to which you want to move the circuit. A list of logical ports defined for this switch appears in the LPort Name list box.
b. Select the logical port (name). The fields below this list box display information about this port.
4. Choose OK. The Move Circuit Endpoint dialog box appears (Figure 5-2). This dialog box displays the circuits that have the source logical port as an endpoint.
NavisCore Troubleshooting Guide 7/17/035-13
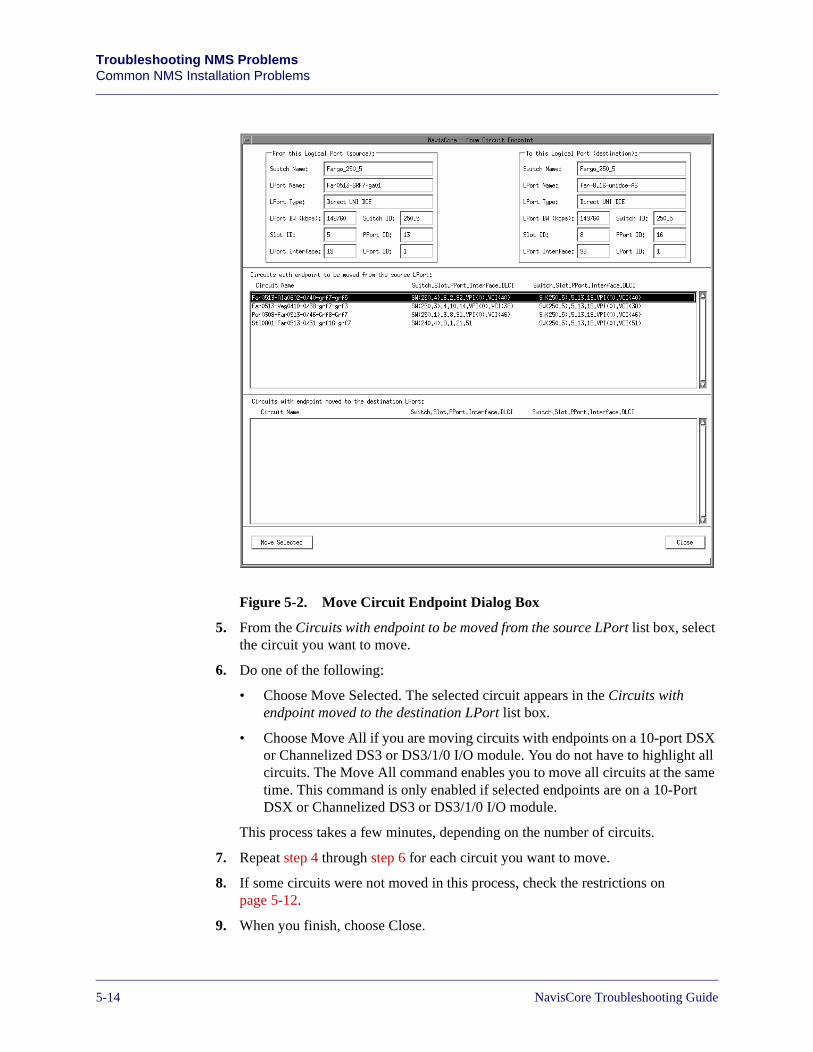
Beta Draft ConfidentialTroubleshooting NMS ProblemsCommon NMS Installation Problems
Figure 5-2. Move Circuit Endpoint Dialog Box
5. From the Circuits with endpoint to be moved from the source LPort list box, select the circuit you want to move.
6. Do one of the following:
• Choose Move Selected. The selected circuit appears in the Circuits with endpoint moved to the destination LPort list box.
• Choose Move All if you are moving circuits with endpoints on a 10-port DSX or Channelized DS3 or DS3/1/0 I/O module. You do not have to highlight all circuits. The Move All command enables you to move all circuits at the same time. This command is only enabled if selected endpoints are on a 10-Port DSX or Channelized DS3 or DS3/1/0 I/O module.
This process takes a few minutes, depending on the number of circuits.
7. Repeat step 4 through step 6 for each circuit you want to move.
8. If some circuits were not moved in this process, check the restrictions on page 5-12.
9. When you finish, choose Close.
5-147/17/03 NavisCore Troubleshooting Guide
Beta Draft ConfidentialTroubleshooting NMS Problems
Common Operating Problems
Common Operating Problems
This section describes common operating problems.
My switch will not turn green on the network map.
If your switch cannot turn green on the network map, the switch is not available to the network. Verify the following:
• You can ping the switch.
• The initial configuration (performed through script download, PRAM Kermit, or console install) was successful.
• The cable connections are correct and secure.
• The configuration is correct.
I cannot ping my switch.
If you cannot ping your switch, perform the following steps:
1. Check the route to the switch. To do this, log on as the root user and enter netstat -r. The system lists the destination networks and gateways. Make sure the appropriate route is listed. The Use column also lists the route to the switch.
An H in the flag field of this route indicates you added a host route instead ofa net route. (A UG in the flag field indicates a net route.) Make sure you use the keyword net in the route add statement. Note that Solaris follows traditional subnetting. For this reason, the lowest route in a subnet always reverts to its IP class (for example, 152.148.50.0 becomes 152.148.0.0).
2. If you cannot find the ping utility, it is in the /usr/sbin directory.
NavisCore Troubleshooting Guide 7/17/035-15
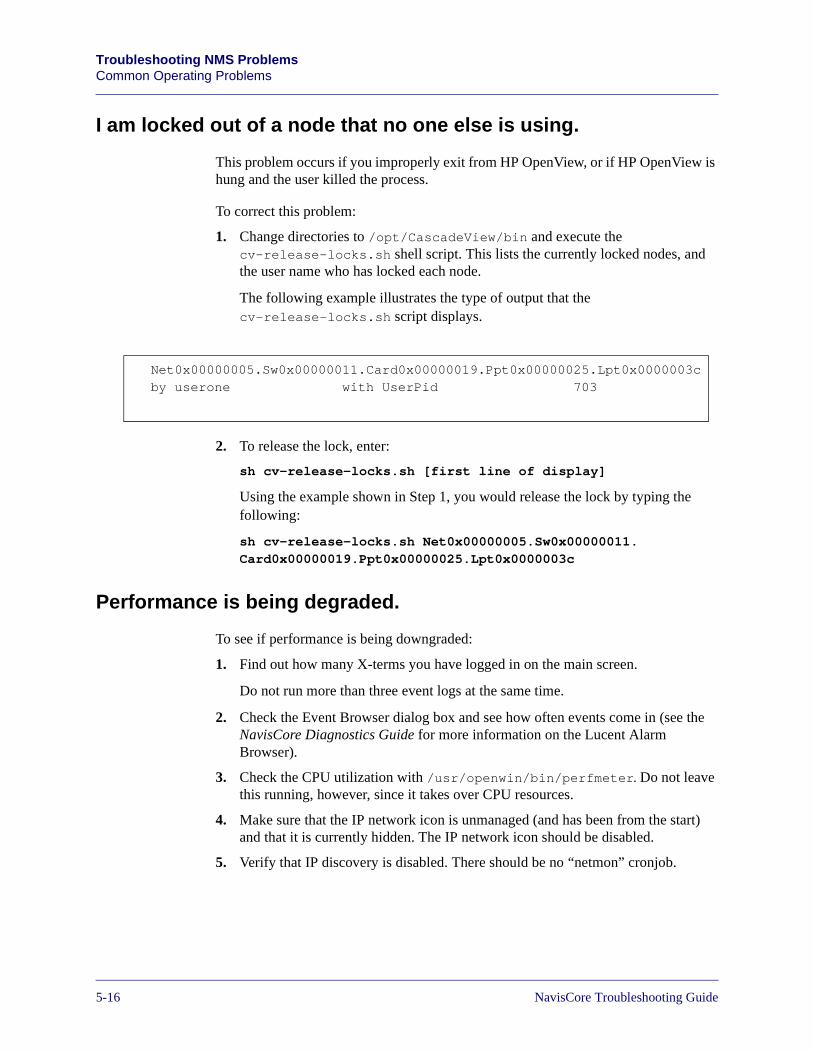
Beta Draft ConfidentialTroubleshooting NMS ProblemsCommon Operating Problems
I am locked out of a node that no one else is using.
This problem occurs if you improperly exit from HP OpenView, or if HP OpenView is hung and the user killed the process.
To correct this problem:
1. Change directories to /opt/CascadeView/bin and execute the cv-release-locks.sh shell script. This lists the currently locked nodes, and the user name who has locked each node.
The following example illustrates the type of output that the cv-release-locks.sh script displays.
2. To release the lock, enter:
sh cv-release-locks.sh [first line of display]
Using the example shown in Step 1, you would release the lock by typing the following:
sh cv-release-locks.sh Net0x00000005.Sw0x00000011.Card0x00000019.Ppt0x00000025.Lpt0x0000003c
Performance is being degraded.
To see if performance is being downgraded:
1. Find out how many X-terms you have logged in on the main screen.
Do not run more than three event logs at the same time.
2. Check the Event Browser dialog box and see how often events come in (see the NavisCore Diagnostics Guide for more information on the Lucent Alarm Browser).
3. Check the CPU utilization with /usr/openwin/bin/perfmeter. Do not leave this running, however, since it takes over CPU resources.
4. Make sure that the IP network icon is unmanaged (and has been from the start) and that it is currently hidden. The IP network icon should be disabled.
5. Verify that IP discovery is disabled. There should be no “netmon” cronjob.
Net0x00000005.Sw0x00000011.Card0x00000019.Ppt0x00000025.Lpt0x0000003c by userone with UserPid 703
5-167/17/03 NavisCore Troubleshooting Guide

Beta Draft ConfidentialTroubleshooting NMS Problems
Common Operating Problems
I cannot access a switch (red nodes).
If you attempt to configure the switch and the NMS with multiple community names and swap NMS entry one with NMS entry two, the switch may interchange the IP addresses (but not the community names), resulting in unreachable nodes. Check your NMS and switch configurations. See the NavisCore NMS Getting Started Guide for details.
I cannot delete a switch from the database.
You cannot delete a switch until you delete all of its associated configurations (trunks, circuits, etc.). See the NavisCore NMS Getting Started Guide for details.
What is the Lucent Alarm Browser and what does it do for me?
In the NMS, the trap daemon is a separate process. The Lucent Alarm Browser is the display for this process. Therefore, if you do not use Lucent Alarm Browser, you can close the trap daemon process without affecting the rest of the NMS. See the NavisCore Diagnostics Guide for more information.
I keep getting the error / or /var is full.
If you repeatedly see the error “/ or /var is full,” perform the following steps:
1. The wtmp and wtmpx files may be too large. Enter the following command from the /var/adm directory to check the size of the /var/adm/wtmp and /var/adm/wtmpx files.
ls -al
2. The file may have tftpserv errors. Use the following command to check for tftpserv errors.
tail wtmp
3. Check to see if tftpserv is actually running. To do this, enter the following:
ps -ef|grep tftp
Null results indicate that tftpserv is not running. Contact the Lucent Core Switching Technical Assistance Center to determine why this condition exists.
If tftpserv is running, proceed to step 4.
If the wtmp and wtmpx files are not very large, or if the wtmp file is filled with errors other than tftpserv errors, consult your System Administrator.
NavisCore Troubleshooting Guide 7/17/035-17
Beta Draft ConfidentialTroubleshooting NMS ProblemsCommon Operating Problems
4. Clean the error logs in the /var/adm directory. To do this, perform the following steps:
a. Log on as the root user.
b. Entering the following command to access the /var/adm directory:
cd /var/adm
c. Enter the following commands:
cp /dev/null wtmp
cp /dev/null wtmpx
d. Enter the following commands to move to the tmp directory and check to see if there are more than two tftpserv error logs.
cd /tmp
ls tftp.error.log.*
e. If there are a large number of error logs, enter the following to remove all of the error logs:
rm tftp.error.log.*
f. Periodically check the /opt/CascadeView.var/initFiles and /opt/CascadeView.var/cfgSyncFiles directories. The system creates the files in these directories each time you create a text file or PRAM sync a card or switch. Delete these files if you no longer have a need for them.
How do I change a logical port name?
You cannot use the NavisCore NMS to change a logical port name. To change a logical port name, you must use the NavisXtend Tools product.
What is a core file?
A core file is a UNIX process that dumps the entire system contents when the process crashes. UNIX programmers can interpret this core file to determine what caused the system crash. If the NavisCore NMS crashes, you should copy the core file, and then you can delete it.
I am in the correct directory and I can see the file, but I cannot execute it.
Enter./filename instead of filename.
5-187/17/03 NavisCore Troubleshooting Guide
Beta Draft ConfidentialTroubleshooting NMS Problems
Common Operating Problems
How do I change the IP address of my machine?
To change the IP address of your machine, you must contact the Lucent TAC. For information about TAC procedures, see Chapter 6, “Working with the TAC.”
What do I do if I get an error that the log device is full?
If you receive an error that the log device is full, you must purge the transaction log.
Use the following procedure to safely purge the transaction log:
1. Log in to ISQL.
2. Enter the following commands:
1> dump transaction cascview with truncate_only
2> go
If you save your transaction dump files, you must first perform a dump database before completing the tasks in this section.
NavisCore Troubleshooting Guide 7/17/035-19
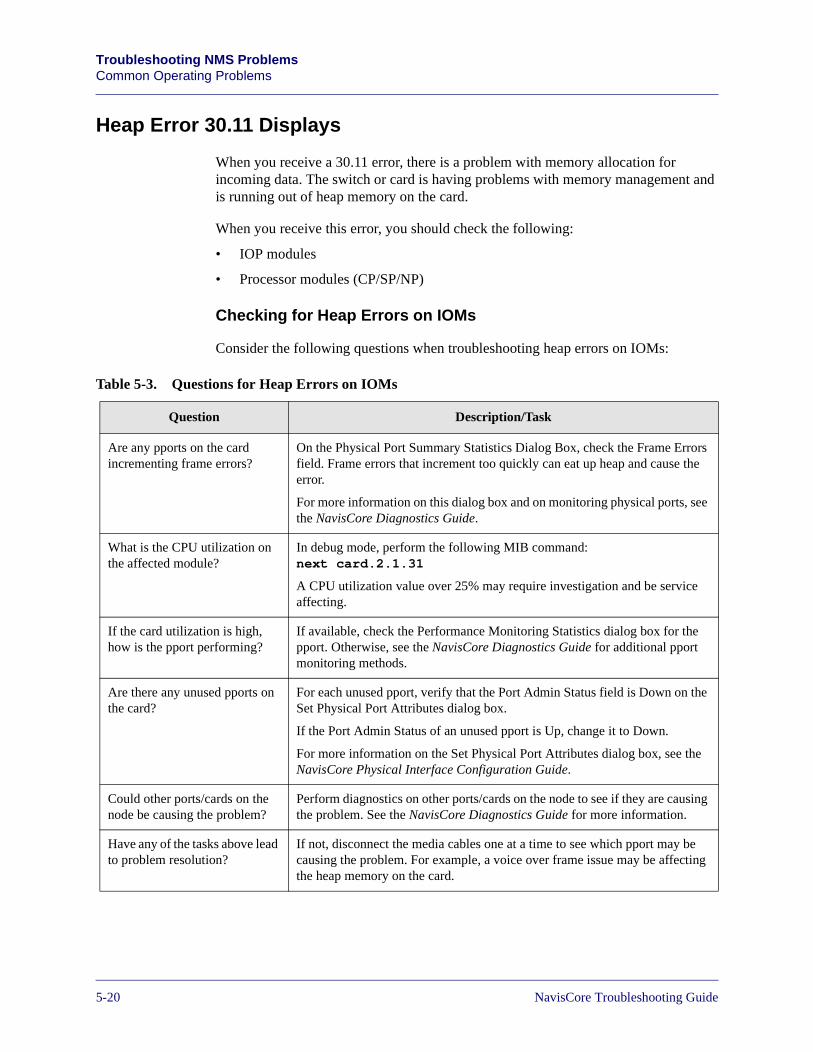
Beta Draft ConfidentialTroubleshooting NMS ProblemsCommon Operating Problems
Heap Error 30.11 Displays
When you receive a 30.11 error, there is a problem with memory allocation for incoming data. The switch or card is having problems with memory management and is running out of heap memory on the card.
When you receive this error, you should check the following:
• IOP modules
• Processor modules (CP/SP/NP)
Checking for Heap Errors on IOMs
Consider the following questions when troubleshooting heap errors on IOMs:
Table 5-3. Questions for Heap Errors on IOMs
Question Description/Task
Are any pports on the card incrementing frame errors?
On the Physical Port Summary Statistics Dialog Box, check the Frame Errors field. Frame errors that increment too quickly can eat up heap and cause the error.
For more information on this dialog box and on monitoring physical ports, see the NavisCore Diagnostics Guide.
What is the CPU utilization on the affected module?
In debug mode, perform the following MIB command:next card.2.1.31
A CPU utilization value over 25% may require investigation and be service affecting.
If the card utilization is high, how is the pport performing?
If available, check the Performance Monitoring Statistics dialog box for the pport. Otherwise, see the NavisCore Diagnostics Guide for additional pport monitoring methods.
Are there any unused pports on the card?
For each unused pport, verify that the Port Admin Status field is Down on the Set Physical Port Attributes dialog box.
If the Port Admin Status of an unused pport is Up, change it to Down.
For more information on the Set Physical Port Attributes dialog box, see the NavisCore Physical Interface Configuration Guide.
Could other ports/cards on the node be causing the problem?
Perform diagnostics on other ports/cards on the node to see if they are causing the problem. See the NavisCore Diagnostics Guide for more information.
Have any of the tasks above lead to problem resolution?
If not, disconnect the media cables one at a time to see which pport may be causing the problem. For example, a voice over frame issue may be affecting the heap memory on the card.
5-207/17/03 NavisCore Troubleshooting Guide
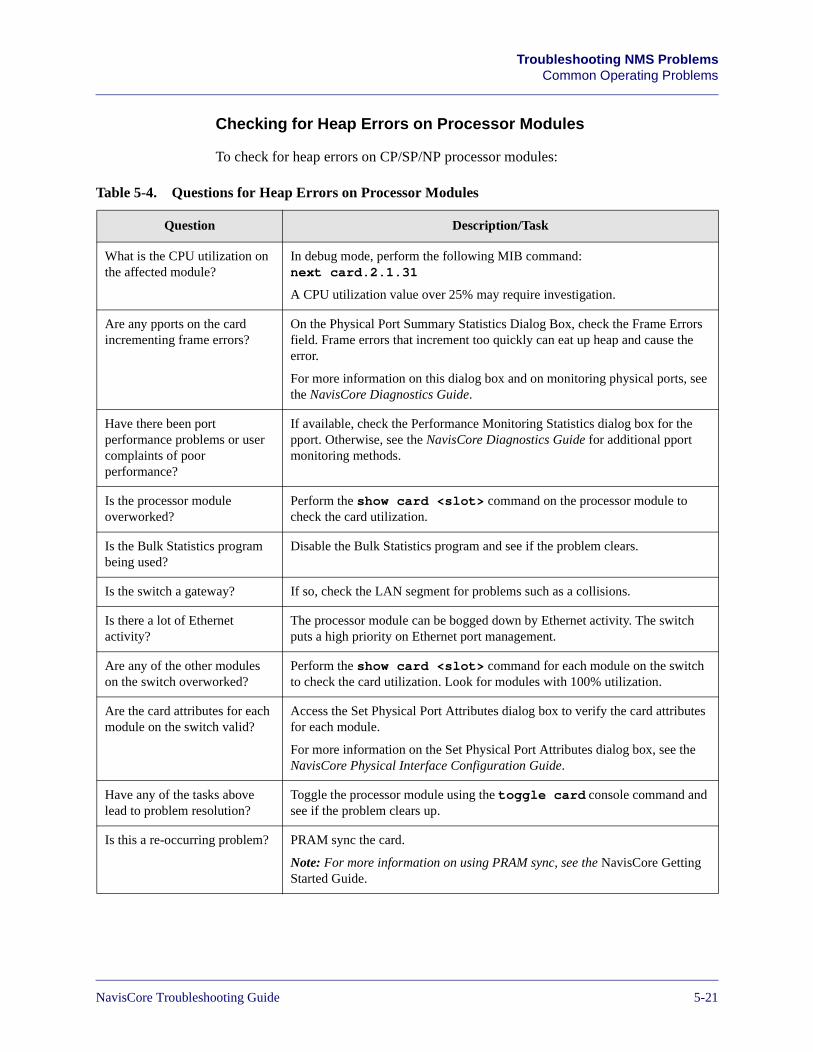
Beta Draft ConfidentialTroubleshooting NMS Problems
Common Operating Problems
Checking for Heap Errors on Processor Modules
To check for heap errors on CP/SP/NP processor modules:
Table 5-4. Questions for Heap Errors on Processor Modules
Question Description/Task
What is the CPU utilization on the affected module?
In debug mode, perform the following MIB command:next card.2.1.31
A CPU utilization value over 25% may require investigation.
Are any pports on the card incrementing frame errors?
On the Physical Port Summary Statistics Dialog Box, check the Frame Errors field. Frame errors that increment too quickly can eat up heap and cause the error.
For more information on this dialog box and on monitoring physical ports, see the NavisCore Diagnostics Guide.
Have there been port performance problems or user complaints of poor performance?
If available, check the Performance Monitoring Statistics dialog box for the pport. Otherwise, see the NavisCore Diagnostics Guide for additional pport monitoring methods.
Is the processor module overworked?
Perform the show card <slot> command on the processor module to check the card utilization.
Is the Bulk Statistics program being used?
Disable the Bulk Statistics program and see if the problem clears.
Is the switch a gateway? If so, check the LAN segment for problems such as a collisions.
Is there a lot of Ethernet activity?
The processor module can be bogged down by Ethernet activity. The switch puts a high priority on Ethernet port management.
Are any of the other modules on the switch overworked?
Perform the show card <slot> command for each module on the switch to check the card utilization. Look for modules with 100% utilization.
Are the card attributes for each module on the switch valid?
Access the Set Physical Port Attributes dialog box to verify the card attributes for each module.
For more information on the Set Physical Port Attributes dialog box, see the NavisCore Physical Interface Configuration Guide.
Have any of the tasks above lead to problem resolution?
Toggle the processor module using the toggle card console command and see if the problem clears up.
Is this a re-occurring problem? PRAM sync the card.
Note: For more information on using PRAM sync, see the NavisCore Getting Started Guide.
NavisCore Troubleshooting Guide 7/17/035-21
Beta Draft ConfidentialTroubleshooting NMS ProblemsCommon Operating Problems
Error 30.3/Out of Memory Bank 9 Error Displays for Processor Modules
This error appears on processor modules (CP/SP/NP) when there is an out-of-memory condition and the last allocation is within a 100 bytes of the end of the heap. When this error occurs, it may appear that there is nothing wrong with the switch software or the processor module.
When a processor module is on a branch or gateway node it can support the following:
• OSPF routing
• Node poll responses from every switch downstream
• Posting traps, forwarding traps
• Any additional work with all instances of the NMS
However, if more than one of the above features are configured at the same time, an out-of-memory condition may occur.
You may be able to resolve this error by performing one of the following tasks:
• Partitioning the network to lessen the management load on this node.
• Configuring a Management PVC to off load some work from the processor module.
• Upgrading to a processor module with more memory.
5-227/17/03 NavisCore Troubleshooting Guide
Beta Draft ConfidentialTroubleshooting NMS Problems
Common Operating Problems
“A Conflicting Switch Object Was Found” Error After Deletingand Adding a Map Symbol
After a switch map symbol is deleted and re-added, the following error displays:
A conflicting switch object was found
This error occurs when the name of the deleted switch is the same as a different switch on an import map within a different submap.
To resolve this issue, perform the following tasks:
1. Delete the import map.
2. Re-add the switch that had been deleted.
3. Re-import the deleted map.
For more information about deleting and adding maps and map objects, see the NavisCore Getting Started Guide.
NavisCore Troubleshooting Guide 7/17/035-23
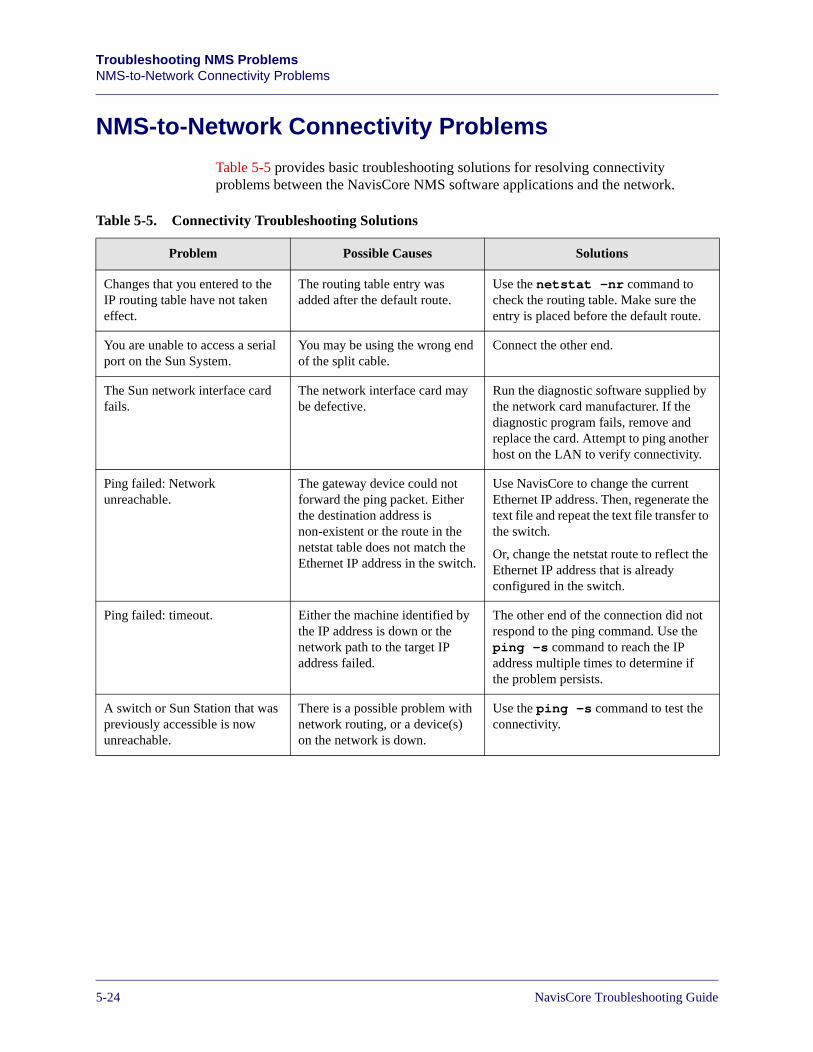
Beta Draft ConfidentialTroubleshooting NMS ProblemsNMS-to-Network Connectivity Problems
NMS-to-Network Connectivity Problems
Table 5-5 provides basic troubleshooting solutions for resolving connectivity problems between the NavisCore NMS software applications and the network.
Table 5-5. Connectivity Troubleshooting Solutions
Problem Possible Causes Solutions
Changes that you entered to the IP routing table have not taken effect.
The routing table entry was added after the default route.
Use the netstat -nr command to check the routing table. Make sure the entry is placed before the default route.
You are unable to access a serial port on the Sun System.
You may be using the wrong end of the split cable.
Connect the other end.
The Sun network interface card fails.
The network interface card may be defective.
Run the diagnostic software supplied by the network card manufacturer. If the diagnostic program fails, remove and replace the card. Attempt to ping another host on the LAN to verify connectivity.
Ping failed: Network unreachable.
The gateway device could not forward the ping packet. Either the destination address is non-existent or the route in the netstat table does not match the Ethernet IP address in the switch.
Use NavisCore to change the current Ethernet IP address. Then, regenerate the text file and repeat the text file transfer to the switch.
Or, change the netstat route to reflect the Ethernet IP address that is already configured in the switch.
Ping failed: timeout. Either the machine identified by the IP address is down or the network path to the target IP address failed.
The other end of the connection did not respond to the ping command. Use the ping -s command to reach the IP address multiple times to determine if the problem persists.
A switch or Sun Station that was previously accessible is now unreachable.
There is a possible problem with network routing, or a device(s) on the network is down.
Use the ping -s command to test the connectivity.
5-247/17/03 NavisCore Troubleshooting Guide
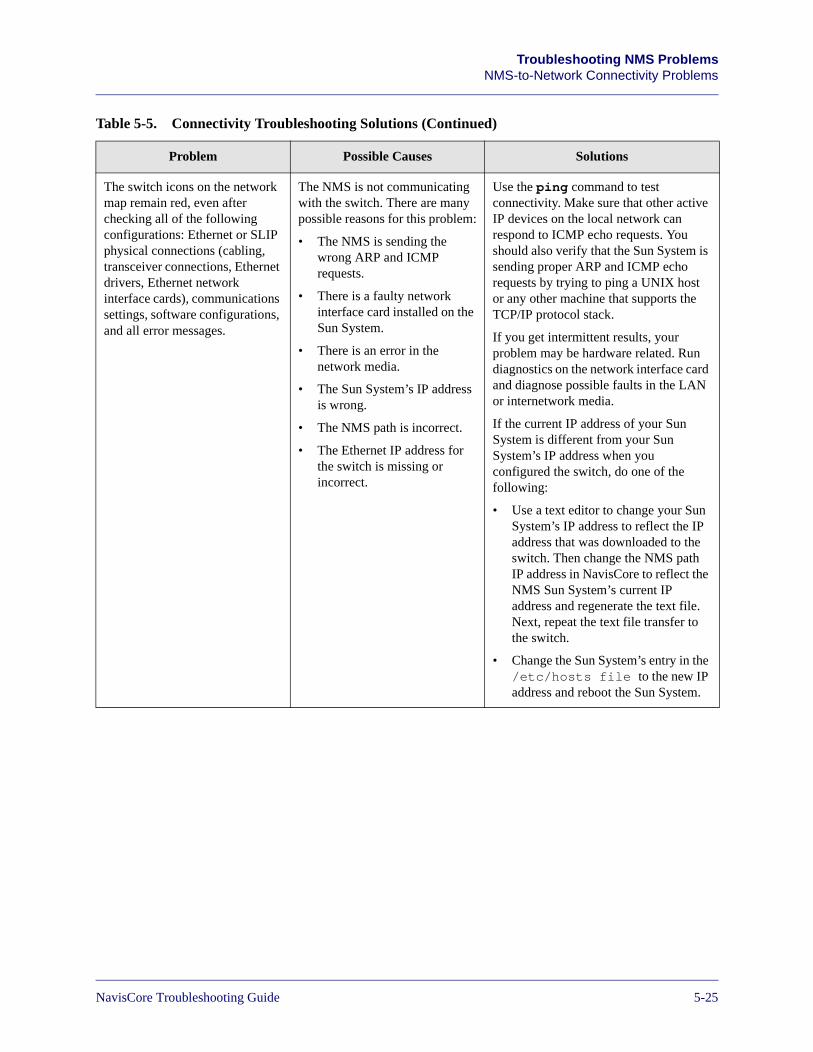
Beta Draft ConfidentialTroubleshooting NMS Problems
NMS-to-Network Connectivity Problems
The switch icons on the network map remain red, even after checking all of the following configurations: Ethernet or SLIP physical connections (cabling, transceiver connections, Ethernet drivers, Ethernet network interface cards), communications settings, software configurations, and all error messages.
The NMS is not communicating with the switch. There are many possible reasons for this problem:
• The NMS is sending the wrong ARP and ICMP requests.
• There is a faulty network interface card installed on the Sun System.
• There is an error in the network media.
• The Sun System’s IP address is wrong.
• The NMS path is incorrect.
• The Ethernet IP address for the switch is missing or incorrect.
Use the ping command to test connectivity. Make sure that other active IP devices on the local network can respond to ICMP echo requests. You should also verify that the Sun System is sending proper ARP and ICMP echo requests by trying to ping a UNIX host or any other machine that supports the TCP/IP protocol stack.
If you get intermittent results, your problem may be hardware related. Run diagnostics on the network interface card and diagnose possible faults in the LAN or internetwork media.
If the current IP address of your Sun System is different from your Sun System’s IP address when you configured the switch, do one of the following:
• Use a text editor to change your Sun System’s IP address to reflect the IP address that was downloaded to the switch. Then change the NMS path IP address in NavisCore to reflect the NMS Sun System’s current IP address and regenerate the text file. Next, repeat the text file transfer to the switch.
• Change the Sun System’s entry in the /etc/hosts file to the new IP address and reboot the Sun System.
Table 5-5. Connectivity Troubleshooting Solutions (Continued)
Problem Possible Causes Solutions
NavisCore Troubleshooting Guide 7/17/035-25
Beta Draft ConfidentialTroubleshooting NMS ProblemsUsing Erase Standby When Swapping Processor Modules
Using Erase Standby When Swapping Processor Modules
The B-STDX 9000 control processor (CP), the GX 550 node processor (NP) modules and the hard drive on the CBX 5000 are critical to proper switch operation. Therefore, when swapping out processor modules, minimizing downtime is critical.
This section describes the following:
• how to prepare for the processor module swap
• the process for swapping out processor modules
• how to use the Erase Standby feature in NavisCore to erase the software version that is currently loaded on the standby processor module
Before You Begin
You can minimize down time through careful planning. When planning to swap out processor modules, you must be able to answer “Yes” to the following questions:
• Do you have console access to the switch? Is it functioning correctly?
• Does your on-site technician have the necessary hardware (for example, PCs, cables, software, etc.)?
• Is your on-site technician familiar with switch recovery procedures?
• Do you have an up-to-date initialization script file available to the member of your staff that has console access to the switch? This file is needed in case the switch needs to be recovered.
For more information about the initialization script file, see the NavisCore Getting Started Guide.
• Is your switch set up so that a Lucent TAC engineer can gain out-of-band access to it (through a modem) if necessary?
• Have you taken reasonable precautionary measures to provide for effective switch recovery, should it go down?
• Are you in a maintenance window?
5-267/17/03 NavisCore Troubleshooting Guide
Beta Draft ConfidentialTroubleshooting NMS Problems
Using Erase Standby When Swapping Processor Modules
Module Swapping Process Overview
The following steps summarize the process used to swap modules:
1. Verify that you can answer “Yes” to the questions listed in “Before You Begin” on page 5-26.
2. Remove and install the new processor module using the instructions in one of the following hardware guides:
• B-STDX 8000/9000 Hardware Installation Guide
• CBX 500 Hardware Installation Guide
• GX 550 Multiservice WAN Switch Hardware Installation Guide
3. Run Erase Standby using the instructions in “Using Erase Standby.”
Using Erase Standby
The Erase Standby feature erases the software version that is loaded on a standby CP, SP, or NP module. Use the following instructions to perform an Erase Standby.
1. Verify the following:
• if your switch software release supports the Erase Standby feature. You can verify this information by referring to the appropriate Software Release Notice (SRN) for your switch type.
If your release does not support Erase Standby, call the TAC.
• the active processor module is loaded with the software version you want, and the standby processor is loaded with the undesired software version.
If the replacement processor module has a higher software version, or if you are unsure of the software version, call the TAC for assistance to help minimize service interruption.
If the standby module is running a B-STDX release prior to 06.xx.xx.xx or a CBX release prior to 03.xx.xx.xx, the wrong code will be loaded, unless you are notified otherwise.
If you request a Return Material Authorization (RMA), it is recommended that you have the TAC preload the code on the module before it is shipped to avoid unnecessary down time.
NavisCore Troubleshooting Guide 7/17/035-27
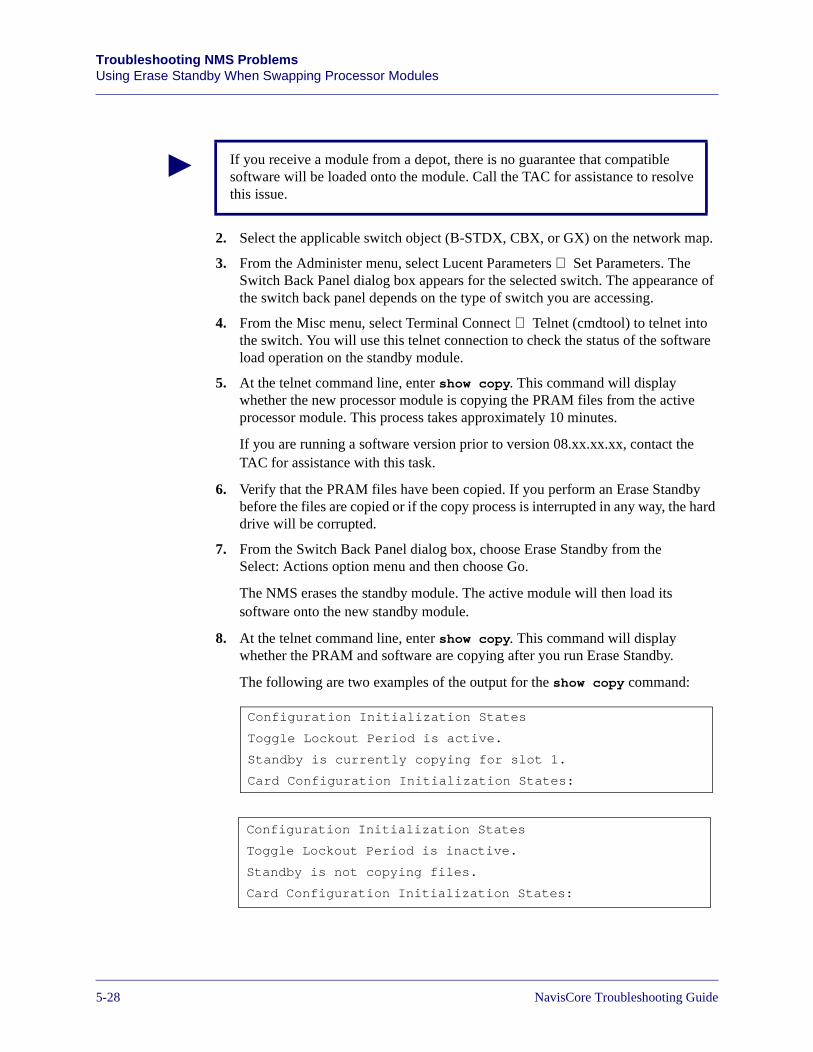
Beta Draft ConfidentialTroubleshooting NMS ProblemsUsing Erase Standby When Swapping Processor Modules
2. Select the applicable switch object (B-STDX, CBX, or GX) on the network map.
3. From the Administer menu, select Lucent Parameters ⇒ Set Parameters. The Switch Back Panel dialog box appears for the selected switch. The appearance of the switch back panel depends on the type of switch you are accessing.
4. From the Misc menu, select Terminal Connect ⇒ Telnet (cmdtool) to telnet into the switch. You will use this telnet connection to check the status of the software load operation on the standby module.
5. At the telnet command line, enter show copy. This command will display whether the new processor module is copying the PRAM files from the active processor module. This process takes approximately 10 minutes.
If you are running a software version prior to version 08.xx.xx.xx, contact the TAC for assistance with this task.
6. Verify that the PRAM files have been copied. If you perform an Erase Standby before the files are copied or if the copy process is interrupted in any way, the hard drive will be corrupted.
7. From the Switch Back Panel dialog box, choose Erase Standby from the Select: Actions option menu and then choose Go.
The NMS erases the standby module. The active module will then load its software onto the new standby module.
8. At the telnet command line, enter show copy. This command will display whether the PRAM and software are copying after you run Erase Standby.
The following are two examples of the output for the show copy command:
If you receive a module from a depot, there is no guarantee that compatible software will be loaded onto the module. Call the TAC for assistance to resolve this issue.
Configuration Initialization States
Toggle Lockout Period is active.
Standby is currently copying for slot 1.
Card Configuration Initialization States:
Configuration Initialization States
Toggle Lockout Period is inactive.
Standby is not copying files.
Card Configuration Initialization States:
5-287/17/03 NavisCore Troubleshooting Guide
NavisCore Troubleshooting Guide
Beta Draft Confidential
6
Working with the TAC
This chapter provides:
• Information on how to contact the Lucent Core Switching (CS) Technical Assistance Center (TAC).
• A checklist to help you work with the Lucent CS TAC.
Contacting the TAC
Lucent provides a full range of support services to ensure that maximum network uptime is achieved with low equipment cost. The staff at the Lucent CS TAC is also available to assist with any problems you encounter while using the NMS software.
You can contact the Lucent CS TAC by phone, email, or fax. Log on to our Customer Support web site to obtain contact information for the Lucent TAC in your region:
http://www.lucent.com/support
6-1
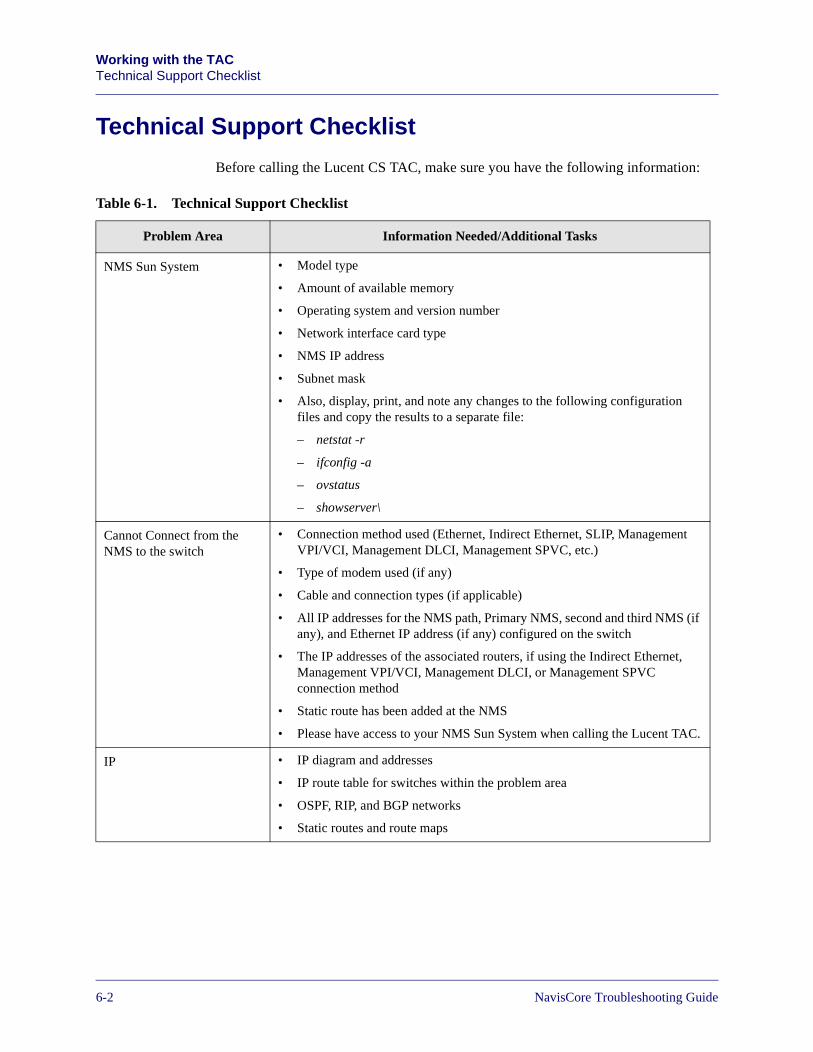
Beta Draft ConfidentialWorking with the TACTechnical Support Checklist
Technical Support Checklist
Before calling the Lucent CS TAC, make sure you have the following information:
Table 6-1. Technical Support Checklist
Problem Area Information Needed/Additional Tasks
NMS Sun System • Model type
• Amount of available memory
• Operating system and version number
• Network interface card type
• NMS IP address
• Subnet mask
• Also, display, print, and note any changes to the following configuration files and copy the results to a separate file:
– netstat -r
– ifconfig -a
– ovstatus
– showserver\
Cannot Connect from the NMS to the switch
• Connection method used (Ethernet, Indirect Ethernet, SLIP, Management VPI/VCI, Management DLCI, Management SPVC, etc.)
• Type of modem used (if any)
• Cable and connection types (if applicable)
• All IP addresses for the NMS path, Primary NMS, second and third NMS (if any), and Ethernet IP address (if any) configured on the switch
• The IP addresses of the associated routers, if using the Indirect Ethernet, Management VPI/VCI, Management DLCI, or Management SPVC connection method
• Static route has been added at the NMS
• Please have access to your NMS Sun System when calling the Lucent TAC.
IP • IP diagram and addresses
• IP route table for switches within the problem area
• OSPF, RIP, and BGP networks
• Static routes and route maps
6-27/17/03 NavisCore Troubleshooting Guide
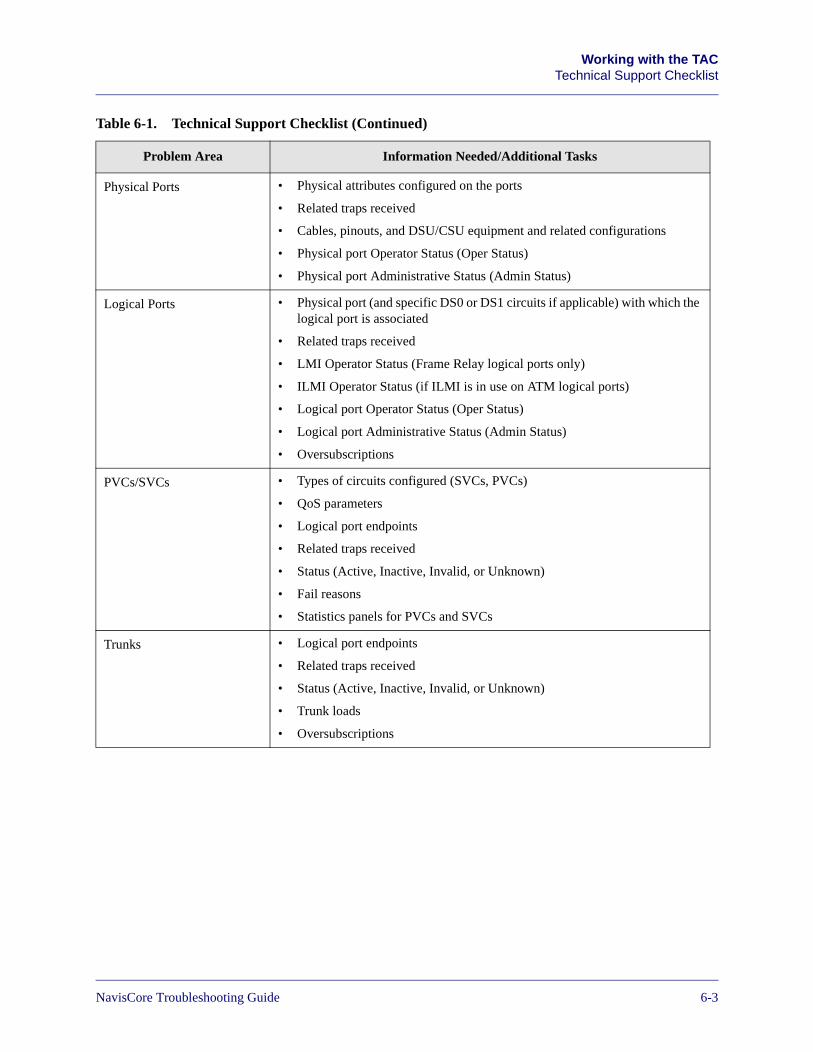
Beta Draft ConfidentialWorking with the TAC
Technical Support Checklist
Physical Ports • Physical attributes configured on the ports
• Related traps received
• Cables, pinouts, and DSU/CSU equipment and related configurations
• Physical port Operator Status (Oper Status)
• Physical port Administrative Status (Admin Status)
Logical Ports • Physical port (and specific DS0 or DS1 circuits if applicable) with which the logical port is associated
• Related traps received
• LMI Operator Status (Frame Relay logical ports only)
• ILMI Operator Status (if ILMI is in use on ATM logical ports)
• Logical port Operator Status (Oper Status)
• Logical port Administrative Status (Admin Status)
• Oversubscriptions
PVCs/SVCs • Types of circuits configured (SVCs, PVCs)
• QoS parameters
• Logical port endpoints
• Related traps received
• Status (Active, Inactive, Invalid, or Unknown)
• Fail reasons
• Statistics panels for PVCs and SVCs
Trunks • Logical port endpoints
• Related traps received
• Status (Active, Inactive, Invalid, or Unknown)
• Trunk loads
• Oversubscriptions
Table 6-1. Technical Support Checklist (Continued)
Problem Area Information Needed/Additional Tasks
NavisCore Troubleshooting Guide 7/17/036-3

Beta Draft ConfidentialWorking with the TACAccessing The Problem Switch
Accessing The Problem Switch
You must provide a backdoor connection to your switch for troubleshooting purposes. A backdoor connection is a modem connection to the console port on the switch.
If the NavisCore NMS is down, and you cannot reach the switch that is having problems, the backdoor connection can be used to troubleshoot the problem.
6-47/17/03 NavisCore Troubleshooting Guide
NavisCore Troubleshooting Guide
Beta Draft Confidential
A
Determining Calling and Called Endpoints for PVCs
This appendix describes the following:
• the rules used by the switch and NMS during PVC creation to determine the calling and called endpoints as well as endpoint 1 and endpoint 2.
• how to use the show ospf names console command to view logical port interface numbers. These interface numbers are used by the switch and NMS to determine circuit endpoints for certain types of PVCs.
• how to use the Cvlistcontained command in Provisioning Server to determine service name binding (SNB) IDs. These IDs are used by the switch and NMS to determine circuit endpoints for certain types of PVCs.
• the dialog boxes you can access to view fields that are used by the switch and the NMS to determine circuit endpoints for PVCs.
A-1
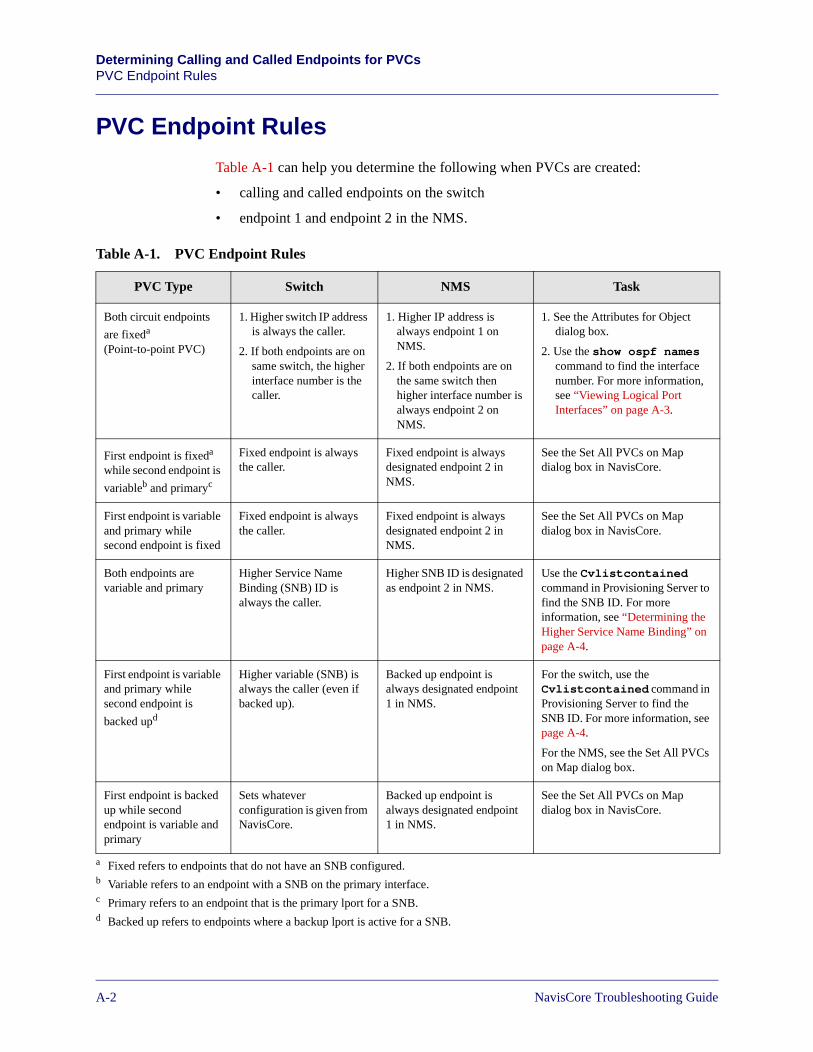
Beta Draft ConfidentialDetermining Calling and Called Endpoints for PVCsPVC Endpoint Rules
PVC Endpoint Rules
Table A-1 can help you determine the following when PVCs are created:
• calling and called endpoints on the switch
• endpoint 1 and endpoint 2 in the NMS.
Table A-1. PVC Endpoint Rules
PVC Type Switch NMS Task
Both circuit endpoints
are fixeda (Point-to-point PVC)
1. Higher switch IP address is always the caller.
2. If both endpoints are on same switch, the higher interface number is the caller.
1. Higher IP address is always endpoint 1 on NMS.
2. If both endpoints are on the same switch then higher interface number is always endpoint 2 on NMS.
1. See the Attributes for Object dialog box.
2. Use the show ospf names command to find the interface number. For more information, see “Viewing Logical Port Interfaces” on page A-3.
First endpoint is fixeda while second endpoint is
variableb and primaryc
Fixed endpoint is always the caller.
Fixed endpoint is always designated endpoint 2 in NMS.
See the Set All PVCs on Map dialog box in NavisCore.
First endpoint is variable and primary while second endpoint is fixed
Fixed endpoint is always the caller.
Fixed endpoint is always designated endpoint 2 in NMS.
See the Set All PVCs on Map dialog box in NavisCore.
Both endpoints are variable and primary
Higher Service Name Binding (SNB) ID is always the caller.
Higher SNB ID is designated as endpoint 2 in NMS.
Use the Cvlistcontained command in Provisioning Server to find the SNB ID. For more information, see “Determining the Higher Service Name Binding” on page A-4.
First endpoint is variable and primary while second endpoint is
backed upd
Higher variable (SNB) is always the caller (even if backed up).
Backed up endpoint is always designated endpoint 1 in NMS.
For the switch, use the Cvlistcontained command in Provisioning Server to find the SNB ID. For more information, see page A-4.
For the NMS, see the Set All PVCs on Map dialog box.
First endpoint is backed up while second endpoint is variable and primary
Sets whatever configuration is given from NavisCore.
Backed up endpoint is always designated endpoint 1 in NMS.
See the Set All PVCs on Map dialog box in NavisCore.
a Fixed refers to endpoints that do not have an SNB configured.b Variable refers to an endpoint with a SNB on the primary interface.c Primary refers to an endpoint that is the primary lport for a SNB.d Backed up refers to endpoints where a backup lport is active for a SNB.
A-27/17/03 NavisCore Troubleshooting Guide
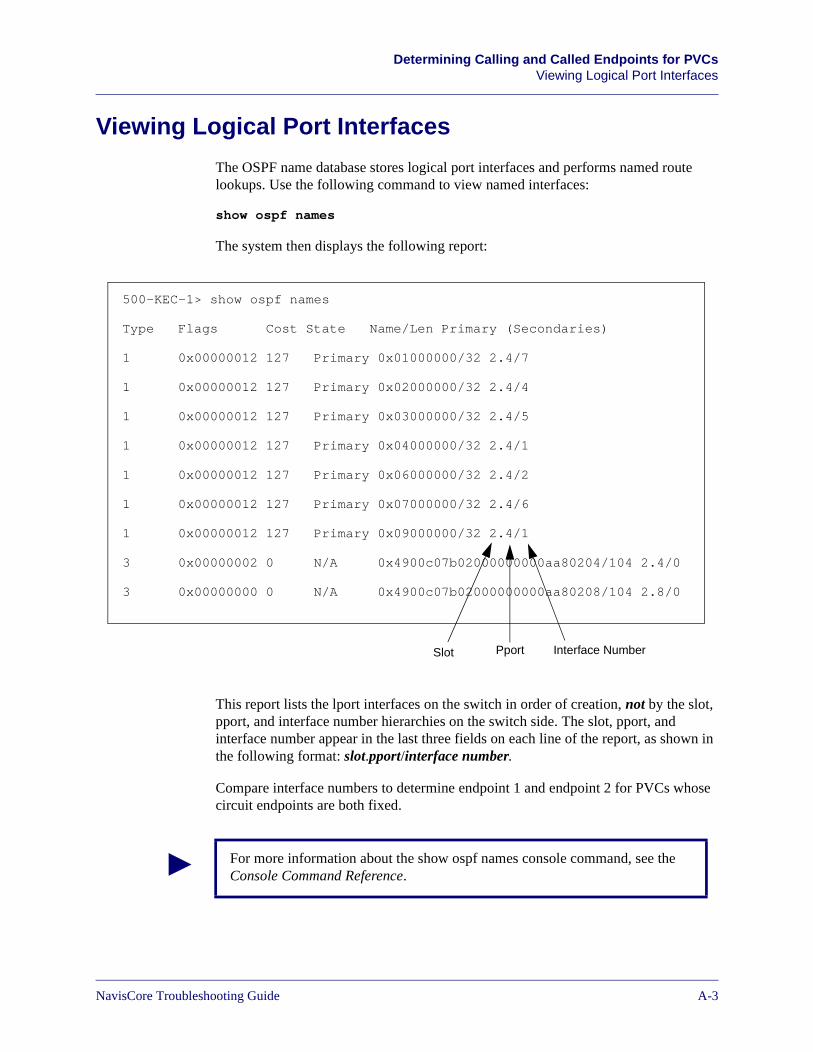
Beta Draft ConfidentialDetermining Calling and Called Endpoints for PVCsViewing Logical Port Interfaces
Viewing Logical Port Interfaces
The OSPF name database stores logical port interfaces and performs named route lookups. Use the following command to view named interfaces:
show ospf names
The system then displays the following report:
This report lists the lport interfaces on the switch in order of creation, not by the slot, pport, and interface number hierarchies on the switch side. The slot, pport, and interface number appear in the last three fields on each line of the report, as shown in the following format: slot.pport/interface number.
Compare interface numbers to determine endpoint 1 and endpoint 2 for PVCs whose circuit endpoints are both fixed.
500-KEC-1> show ospf names
Type Flags Cost State Name/Len Primary (Secondaries)
1 0x00000012 127 Primary 0x01000000/32 2.4/7
1 0x00000012 127 Primary 0x02000000/32 2.4/4
1 0x00000012 127 Primary 0x03000000/32 2.4/5
1 0x00000012 127 Primary 0x04000000/32 2.4/1
1 0x00000012 127 Primary 0x06000000/32 2.4/2
1 0x00000012 127 Primary 0x07000000/32 2.4/6
1 0x00000012 127 Primary 0x09000000/32 2.4/1
3 0x00000002 0 N/A 0x4900c07b02000000000aa80204/104 2.4/0
3 0x00000000 0 N/A 0x4900c07b02000000000aa80208/104 2.8/0
Slot Pport Interface Number
For more information about the show ospf names console command, see the Console Command Reference.
NavisCore Troubleshooting Guide 7/17/03A-3

Beta Draft ConfidentialDetermining Calling and Called Endpoints for PVCsDetermining the Higher Service Name Binding
Determining the Higher Service Name Binding
Use the following Provisioning Server command to display service name binding IDs for all SNBs on a switch:
Cvlistcontained Switch.<IP address> ServiceName –Name –PrimaryLport –ServiceNameID –ActiveBinding
The service name binding ID is used to determine the calling and called endpoints for the following types of PVCs:
• PVCs whose endpoints are both variable
• PVCs whose first endpoint is variable and second endpoint is backed up
Provisioning Server then displays the following report:
A higher value for the ServiceNameID field indicates a higher service name binding. For example, in the above output ServiceNameID 2136 is greater than ServiceNameID 328, thus dev_9000_1-SNB-36 is a higher SNB than dev_9000_1-SNB-10.
cvlistcontained Network.20.20.0.0.ServiceName.dev_9000_1-SNB-7 -Name dev_9000_1-SNB-7 -PrimaryLPort Switch.20.20.5.1.card.9.pport.1.lport.1 -ServiceNameID 296 -ActiveBinding Primary
cvlistcontained Network.20.20.0.0.ServiceName.dev_9000_1-SNB-36 -Name dev_9000_1-SNB-36 -PrimaryLPort Switch.20.20.5.1.card.3.pport.1.lport.1 -ServiceNameID 2136 -ActiveBinding Primary
cvlistcontained Network.20.20.0.0.ServiceName.dev_9000_1-SNB-8 -Name dev_9000_1-SNB-8 -PrimaryLPort Switch.20.20.5.1.card.9.pport.2.lport.1 -ServiceNameID 297 -ActiveBinding Primary
cvlistcontained Network.20.20.0.0.ServiceName.dev_9000_1-SNB-31 -Name dev_9000_1-SNB-31 -PrimaryLPort Switch.20.20.5.1.card.13.pport.4.lport.1 -ServiceNameID 1793 -ActiveBinding Primary
cvlistcontained Network.20.20.0.0.ServiceName.dev_9000_1-SNB-32 -Name dev_9000_1-SNB-32 -PrimaryLPort Switch.20.20.5.1.card.13.pport.1.lport.1 -ServiceNameID 1929 -ActiveBinding Primary
cvlistcontained Network.20.20.0.0.ServiceName.dev_9000_1-SNB-33 -Name dev_9000_1-SNB-33 -PrimaryLPort Switch.20.20.5.1.card.15.pport.2.lport.1 -ServiceNameID 1951 -ActiveBinding Primary
cvlistcontained Network.20.20.0.0.ServiceName.dev_9000_1-SNB-9 -Name dev_9000_1-SNB-9 -PrimaryLPort Switch.20.20.5.1.card.6.pport.3.lport.1 -ServiceNameID 299 -ActiveBinding Primary
cvlistcontained Network.20.20.0.0.ServiceName.dev_9000_1-SNB-10 -Name dev_9000_1-SNB-10 -PrimaryLPort Switch.20.20.5.1.card.11.pport.3.lport.1 -ServiceNameID 328 -ActiveBinding Primary
cvlistcontained Network.20.20.0.0.ServiceName.dev_9000_1-SNB-11 -Name dev_9000_1-SNB-11 -PrimaryLPort Switch.20.20.5.1.card.11.pport.4.lport.1 -ServiceNameID 586 -ActiveBinding Primary
cvlistcontained Network.20.20.0.0.ServiceName.dev_9000_1-SNB-40 -Name dev_9000_1-SNB-40 -PrimaryLPort Switch.20.20.5.1.card.15.pport.1.lport.1 -ServiceNameID 2252 -ActiveBinding Primary
cvlistcontained Network.20.20.0.0.ServiceName.dev_9000_1-SNB-41 -Name dev_9000_1-SNB-41 -PrimaryLPort Switch.20.20.5.1.card.4.pport.4.lport.1 -ServiceNameID 2269 -ActiveBinding Primary
A-47/17/03 NavisCore Troubleshooting Guide
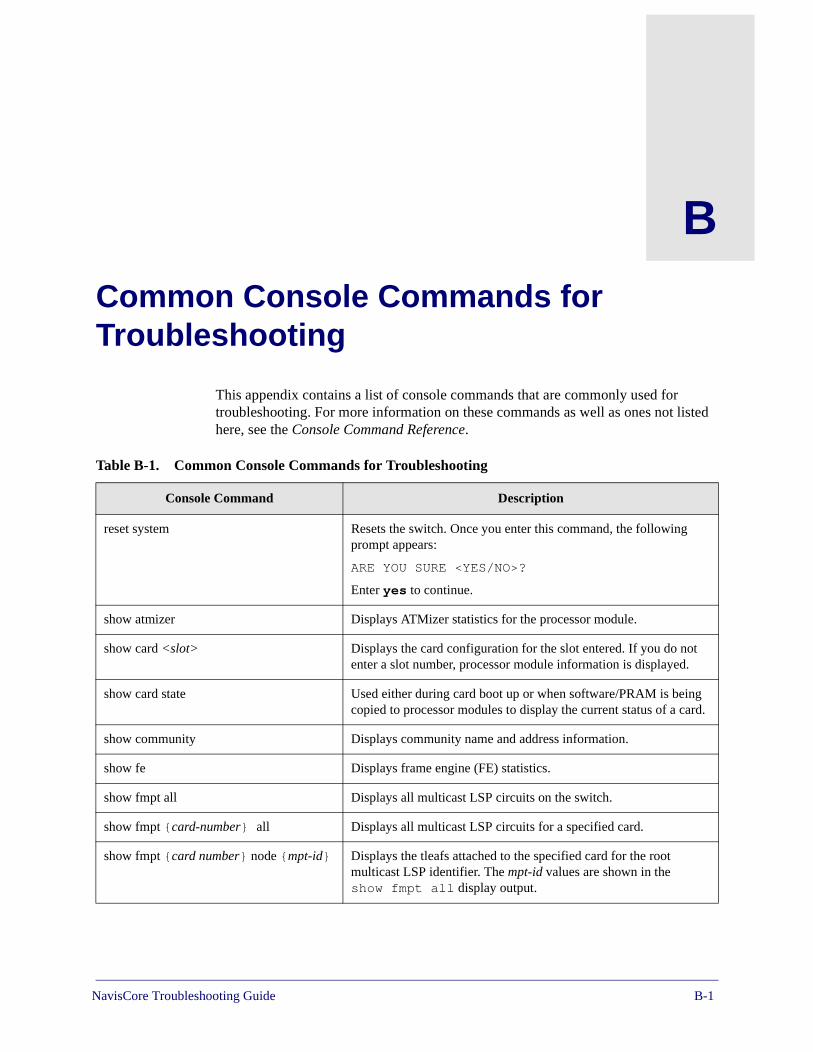
NavisCore Troubleshooting Guide
Beta Draft Confidential
B
Common Console Commands for Troubleshooting
This appendix contains a list of console commands that are commonly used for troubleshooting. For more information on these commands as well as ones not listed here, see the Console Command Reference.
Table B-1. Common Console Commands for Troubleshooting
Console Command Description
reset system Resets the switch. Once you enter this command, the following prompt appears:
ARE YOU SURE <YES/NO>?
Enter yes to continue.
show atmizer Displays ATMizer statistics for the processor module.
show card <slot> Displays the card configuration for the slot entered. If you do not enter a slot number, processor module information is displayed.
show card state Used either during card boot up or when software/PRAM is being copied to processor modules to display the current status of a card.
show community Displays community name and address information.
show fe Displays frame engine (FE) statistics.
show fmpt all Displays all multicast LSP circuits on the switch.
show fmpt {card-number} all Displays all multicast LSP circuits for a specified card.
show fmpt {card number} node {mpt-id} Displays the tleafs attached to the specified card for the root multicast LSP identifier. The mpt-id values are shown in the show fmpt all display output.
B-1
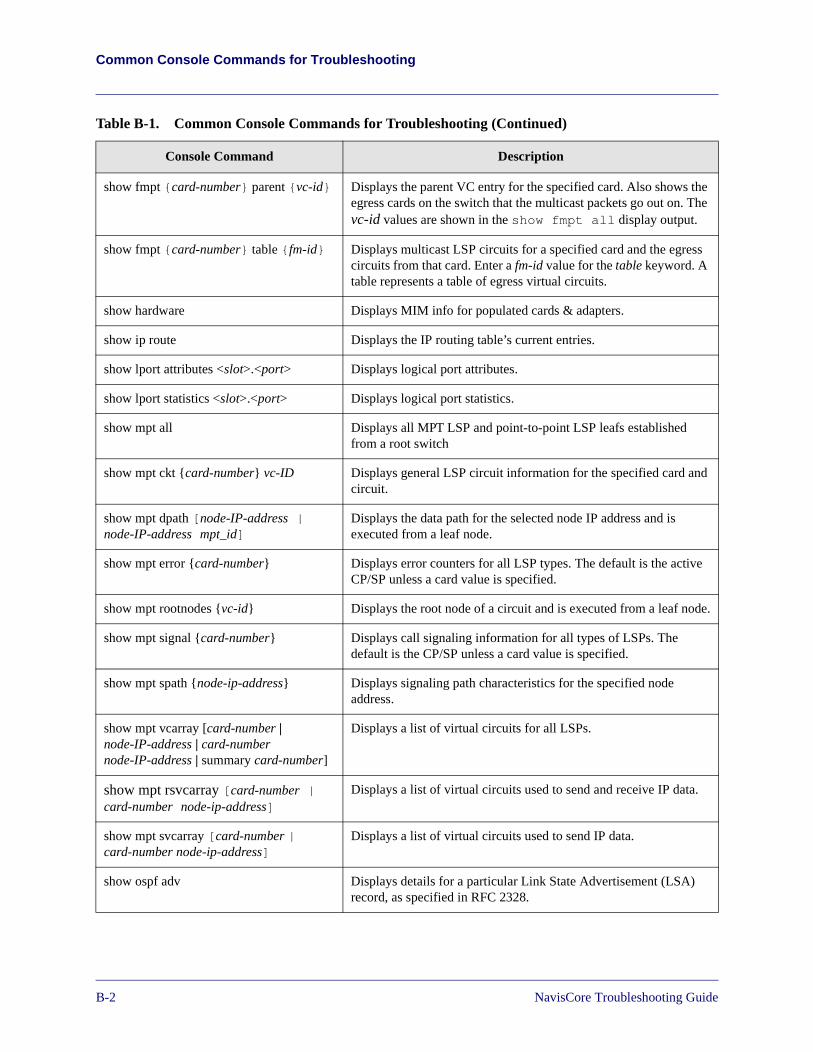
Beta Draft ConfidentialCommon Console Commands for Troubleshooting
show fmpt {card-number} parent {vc-id} Displays the parent VC entry for the specified card. Also shows the egress cards on the switch that the multicast packets go out on. The vc-id values are shown in the show fmpt all display output.
show fmpt {card-number} table {fm-id} Displays multicast LSP circuits for a specified card and the egress circuits from that card. Enter a fm-id value for the table keyword. A table represents a table of egress virtual circuits.
show hardware Displays MIM info for populated cards & adapters.
show ip route Displays the IP routing table’s current entries.
show lport attributes <slot>.<port> Displays logical port attributes.
show lport statistics <slot>.<port> Displays logical port statistics.
show mpt all Displays all MPT LSP and point-to-point LSP leafs established from a root switch
show mpt ckt {card-number} vc-ID Displays general LSP circuit information for the specified card and circuit.
show mpt dpath [node-IP-address | node-IP-address mpt_id]
Displays the data path for the selected node IP address and is executed from a leaf node.
show mpt error {card-number} Displays error counters for all LSP types. The default is the active CP/SP unless a card value is specified.
show mpt rootnodes {vc-id} Displays the root node of a circuit and is executed from a leaf node.
show mpt signal {card-number} Displays call signaling information for all types of LSPs. The default is the CP/SP unless a card value is specified.
show mpt spath {node-ip-address} Displays signaling path characteristics for the specified node address.
show mpt vcarray [card-number | node-IP-address | card-number node-IP-address | summary card-number]
Displays a list of virtual circuits for all LSPs.
show mpt rsvcarray [card-number | card-number node-ip-address]
Displays a list of virtual circuits used to send and receive IP data.
show mpt svcarray [card-number | card-number node-ip-address]
Displays a list of virtual circuits used to send IP data.
show ospf adv Displays details for a particular Link State Advertisement (LSA) record, as specified in RFC 2328.
Table B-1. Common Console Commands for Troubleshooting (Continued)
Console Command Description
B-27/17/03 NavisCore Troubleshooting Guide
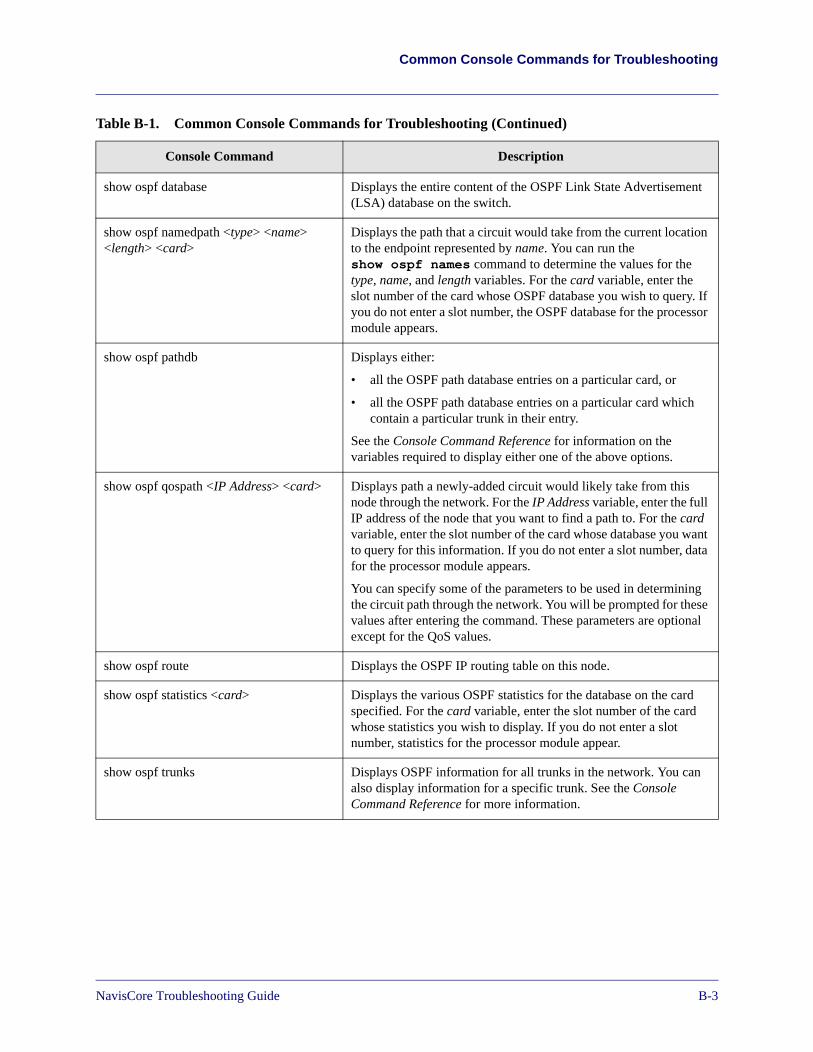
Beta Draft ConfidentialCommon Console Commands for Troubleshooting
show ospf database Displays the entire content of the OSPF Link State Advertisement (LSA) database on the switch.
show ospf namedpath <type> <name> <length> <card>
Displays the path that a circuit would take from the current location to the endpoint represented by name. You can run the show ospf names command to determine the values for the type, name, and length variables. For the card variable, enter the slot number of the card whose OSPF database you wish to query. If you do not enter a slot number, the OSPF database for the processor module appears.
show ospf pathdb Displays either:
• all the OSPF path database entries on a particular card, or
• all the OSPF path database entries on a particular card which contain a particular trunk in their entry.
See the Console Command Reference for information on the variables required to display either one of the above options.
show ospf qospath <IP Address> <card> Displays path a newly-added circuit would likely take from this node through the network. For the IP Address variable, enter the full IP address of the node that you want to find a path to. For the card variable, enter the slot number of the card whose database you want to query for this information. If you do not enter a slot number, data for the processor module appears.
You can specify some of the parameters to be used in determining the circuit path through the network. You will be prompted for these values after entering the command. These parameters are optional except for the QoS values.
show ospf route Displays the OSPF IP routing table on this node.
show ospf statistics <card> Displays the various OSPF statistics for the database on the card specified. For the card variable, enter the slot number of the card whose statistics you wish to display. If you do not enter a slot number, statistics for the processor module appear.
show ospf trunks Displays OSPF information for all trunks in the network. You can also display information for a specific trunk. See the Console Command Reference for more information.
Table B-1. Common Console Commands for Troubleshooting (Continued)
Console Command Description
NavisCore Troubleshooting Guide 7/17/03B-3
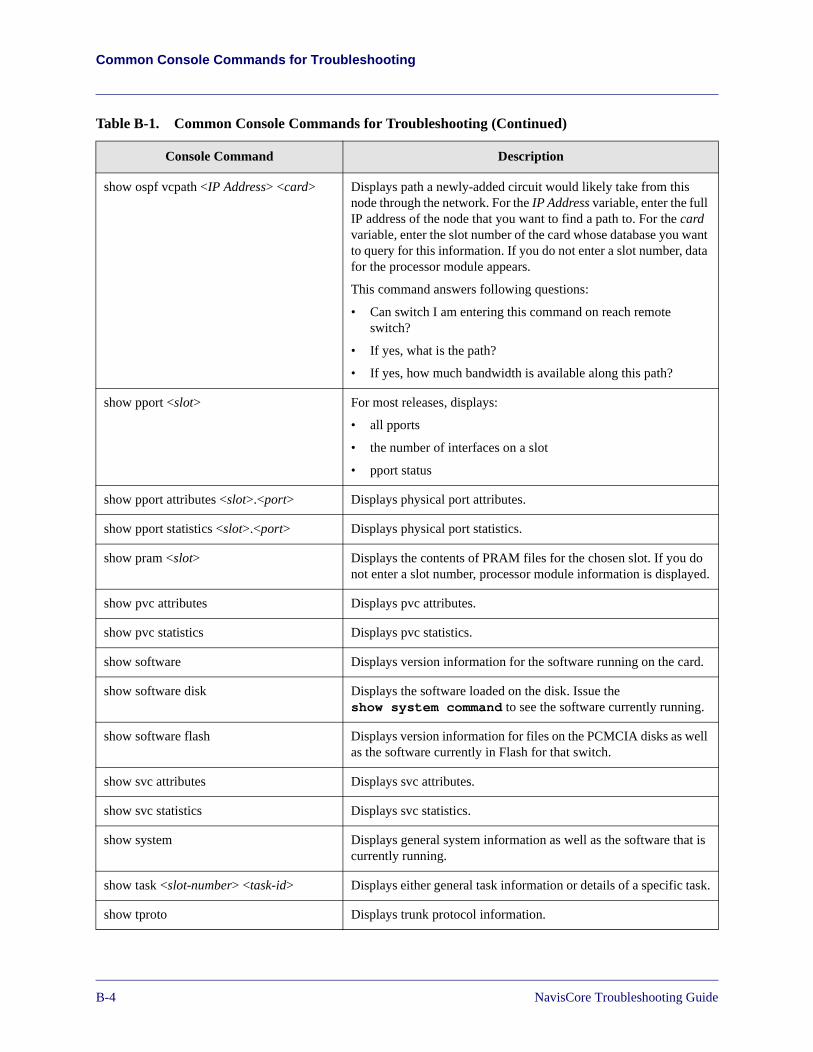
Beta Draft ConfidentialCommon Console Commands for Troubleshooting
show ospf vcpath <IP Address> <card> Displays path a newly-added circuit would likely take from this node through the network. For the IP Address variable, enter the full IP address of the node that you want to find a path to. For the card variable, enter the slot number of the card whose database you want to query for this information. If you do not enter a slot number, data for the processor module appears.
This command answers following questions:
• Can switch I am entering this command on reach remote switch?
• If yes, what is the path?
• If yes, how much bandwidth is available along this path?
show pport <slot> For most releases, displays:
• all pports
• the number of interfaces on a slot
• pport status
show pport attributes <slot>.<port> Displays physical port attributes.
show pport statistics <slot>.<port> Displays physical port statistics.
show pram <slot> Displays the contents of PRAM files for the chosen slot. If you do not enter a slot number, processor module information is displayed.
show pvc attributes Displays pvc attributes.
show pvc statistics Displays pvc statistics.
show software Displays version information for the software running on the card.
show software disk Displays the software loaded on the disk. Issue the show system command to see the software currently running.
show software flash Displays version information for files on the PCMCIA disks as well as the software currently in Flash for that switch.
show svc attributes Displays svc attributes.
show svc statistics Displays svc statistics.
show system Displays general system information as well as the software that is currently running.
show task <slot-number> <task-id> Displays either general task information or details of a specific task.
show tproto Displays trunk protocol information.
Table B-1. Common Console Commands for Troubleshooting (Continued)
Console Command Description
B-47/17/03 NavisCore Troubleshooting Guide
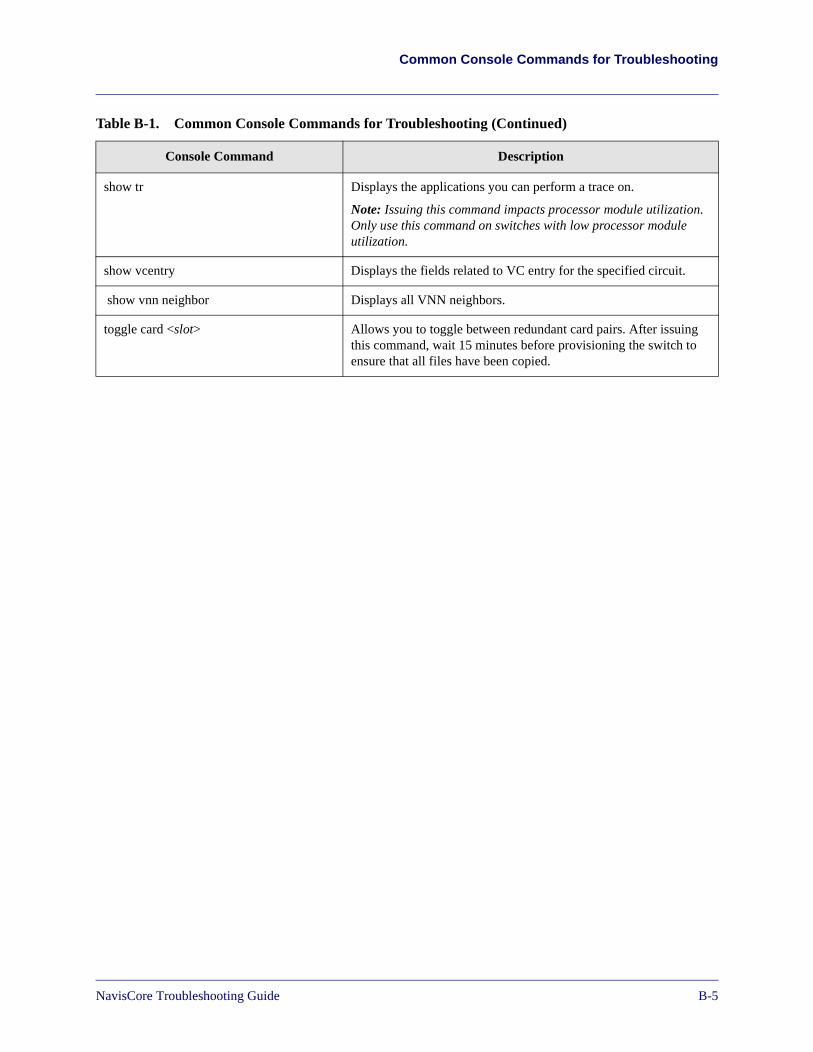
Beta Draft ConfidentialCommon Console Commands for Troubleshooting
show tr Displays the applications you can perform a trace on.
Note: Issuing this command impacts processor module utilization. Only use this command on switches with low processor module utilization.
show vcentry Displays the fields related to VC entry for the specified circuit.
show vnn neighbor Displays all VNN neighbors.
toggle card <slot> Allows you to toggle between redundant card pairs. After issuing this command, wait 15 minutes before provisioning the switch to ensure that all files have been copied.
Table B-1. Common Console Commands for Troubleshooting (Continued)
Console Command Description
NavisCore Troubleshooting Guide 7/17/03B-5

Beta Draft ConfidentialCommon Console Commands for Troubleshooting
B-67/17/03 NavisCore Troubleshooting Guide
NavisCore Troubleshooting Guide
Beta Draft Confidential
C
Using MIB Troubleshooting Tools
This appendix describes how to use MIB information for troubleshooting. This appendix consists of the following topics:
• “About MIBs” on page C-2
• “Troubleshooting with MIBs” on page C-2
• “SNMP Structure of Management Information” on page C-4
• “MIB Object Identifiers” on page C-5
• “Accessing MIB Directories and Objects” on page C-6
• “MIB Command Format” on page C-6
• “Common MIB Commands for Troubleshooting” on page C-8
C-1
Beta Draft ConfidentialUsing MIB Troubleshooting ToolsAbout MIBs
About MIBs
The MIB is a collection of objects that represent network devices and their internal components. Common MIB objects include:
• Counters of packets sent
• Connections used
• Connections attempted
The following table defines some terms related to MIBs.
Troubleshooting with MIBs
When troubleshooting with MIBs, check for information in the following order:
1. system level information
2. software revision information
3. PRAM information
4. card information
5. physical level (pport) information
6. logical level (lport) information
7. circuit (ckt) information
The following sections describe MIB structure and how to use MIB information.
Table 3-1. MIB Terminology
Term Definition
Enterprise-specific MIBs MIBs defined by various hardware vendors.
Instance The existence of a particular value for a MIB object in the agent database.
Some MIB objects have only a single instance for a given device (for example, system description). Other MIB objects have multiple instances for a given device (for example, interface status for each interface on the system).
MIB Module MIBs are organized into MIB modules. A MIB module is a file defining all the MIB objects under a sub-tree.
The foundation module is the standards-based MIB-II module defined by RFC 1213: Management Information Base of Network Management of TCP/IP internets: MIB- II.
MIB object A specific type or class of management information (for example, a system description or an interface status).
C-27/17/03 NavisCore Troubleshooting Guide
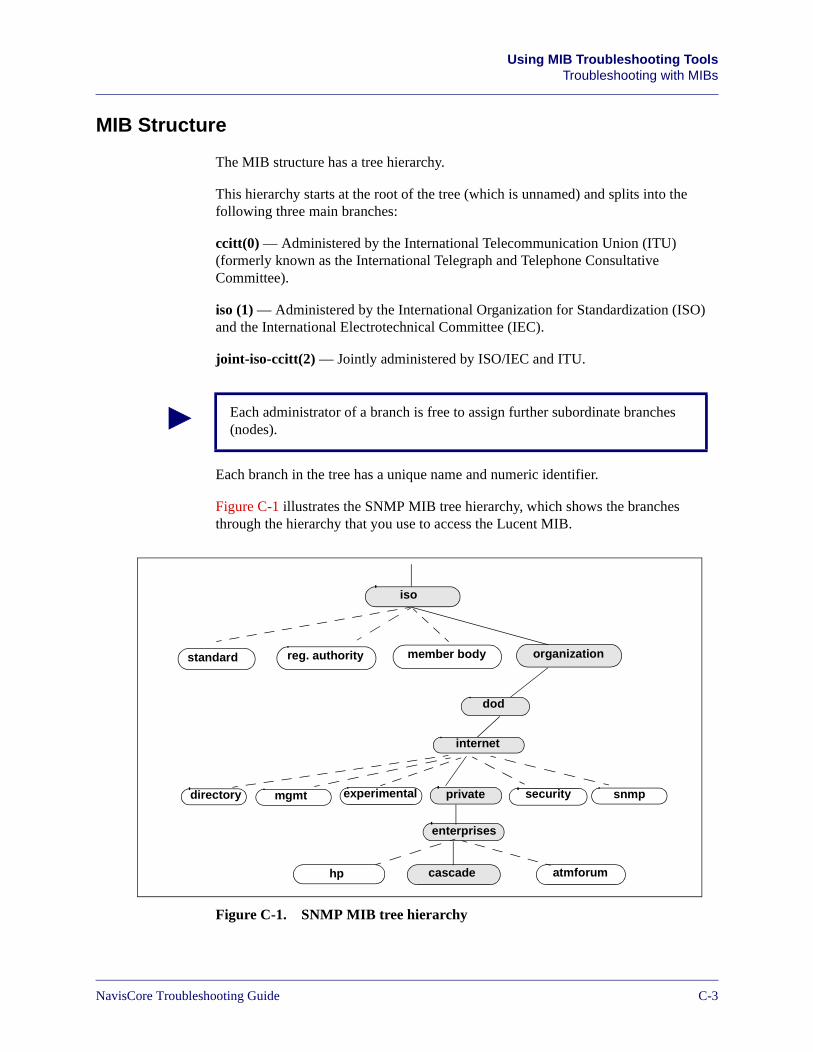
Beta Draft Confidential Using MIB Troubleshooting ToolsTroubleshooting with MIBs
MIB Structure
The MIB structure has a tree hierarchy.
This hierarchy starts at the root of the tree (which is unnamed) and splits into the following three main branches:
ccitt(0) — Administered by the International Telecommunication Union (ITU) (formerly known as the International Telegraph and Telephone Consultative Committee).
iso (1) — Administered by the International Organization for Standardization (ISO) and the International Electrotechnical Committee (IEC).
joint-iso-ccitt(2) — Jointly administered by ISO/IEC and ITU.
Each branch in the tree has a unique name and numeric identifier.
Figure C-1 illustrates the SNMP MIB tree hierarchy, which shows the branches through the hierarchy that you use to access the Lucent MIB.
Figure C-1. SNMP MIB tree hierarchy
Each administrator of a branch is free to assign further subordinate branches (nodes).
iso
standard reg. authority member body organization
dod
internet
directory mgmt experimental private security snmp
enterprises
hp cascade atmforum
NavisCore Troubleshooting Guide 7/17/03C-3
Beta Draft ConfidentialUsing MIB Troubleshooting ToolsSNMP Structure of Management Information
SNMP Structure of Management Information
The Lucent MIB uses the SNMP Structure of Management Information (SMI) rules to define the MIB structure.
The following rules specify the structure of each object in the MIB:
Object Type — Specifies the type of MIB object.
Syntax — Identifies the data type for the object as integer, string, counter, IP address, or pointer.
Access — Specifies the access to the object as read-only, read-write, or non-accessible.
Status — Uses one of the following types to specify the currency of the object:
Mandatory – The object is required to configure a switch.
Current – The object is not required for configuration.
Obsolete – The object is no longer part of the MIB.
Description — A text definition that further describes the object.
Index — Lists an index value that provides instructions for identifying object instances. For example, an index value of
::={lportEntry 68}
indicates the 68th instance of lportEntry.
MIB Object Example
The following example illustrates the MIB object for the source logical address of a circuit:
cktSrcLaddr OBJECT-TYPESYNTAX INTEGERACCESS read-writeSTATUS mandatoryDESCRIPTION
“The source logical address of the circuit.”:: = { cktEntry 82 }
See “Accessing MIB Directories and Objects” on page C-6 for information on viewing MIB Objects.
C-47/17/03 NavisCore Troubleshooting Guide

Beta Draft Confidential Using MIB Troubleshooting ToolsMIB Object Identifiers
MIB Object Identifiers
Each branch of the MIB is identified by a short text string (for example, iso) and a non-negative integer (for example, 1). The integer is used as part of an object identifier for each object in the MIB.
The object identifier (OID) provides a way to identify a specific object within a MIB. It contains a sequence of non-negative integers that denote a path from the root of the path to the object. The string of integers is separated by periods.
For example, the following string specifies the path to the Lucent MIB:
iso(1).org(3).dod(6).internet(1).private(4).enterprises(1).cascade(277)
The object identifier for each branch of this path is indicated in parentheses. The following string specifies the object identifier for the path to the Lucent MIB.
1.3.6.1.4.1.277
The OID string for each variable is shown in brackets ({ }) as shown in the following example:
: : = { cktEntry 82 }
In this example, the OID string for the circuit is specified in the brackets as 82.
NavisCore Troubleshooting Guide 7/17/03C-5
Beta Draft ConfidentialUsing MIB Troubleshooting ToolsAccessing MIB Directories and Objects
Accessing MIB Directories and Objects
Once you access a MIB directory you can view information about specific MIB objects.
You can access MIB directories by using one of the following methods:
• opening the MIB Browser in HP Openview. For more information about accessing the MIB Browser, see the NavisCore Diagnostics Guide.
• entering the following command at the network prompt:
cd /ats/data/mibs
Once you enter this command, you may perform the MIB-related tasks listed in Table 3-2.
MIB Command Format
The manager accesses the agent's MIB object instances using SNMP's get and set operations from a switch console. There are three commands used for MIBs:
• Get — Provides data for a specific instance (for example, logical port statistics)
• Set — Configures a specific instance (for examples, admin up/down a port)
• Next — Provides data for a set of instances (for example, the next card.x.x.x command lists the cards on the switch that have the specific instance of x.x.x).
When you want to access a specific variable from a MIB group, you type a command which uses the following format:
{group name}.{Table}.{Entry #}.{Index}
You can also refer to Appendix D, “Quick MIB Group Reference,” for MIB object information at the Group level.
You must be in debug mode to issue set commands. To enter debug mode, issue the enable debug command from the switch console and specify the required password when prompted.
You can also refer to Appendix D, “Quick MIB Group Reference,” for MIB object information at the Group level.
C-67/17/03 NavisCore Troubleshooting Guide
Beta Draft Confidential Using MIB Troubleshooting ToolsMIB Command Format
Creating a MIB Command
To find a MIB status for a particular switch, card, physical/logical port or any attribute on the switch:
1. Use Appendix D, “Quick MIB Group Reference,” for MIB object information at the Group level. This appendix also includes the group name abbreviation used for commands.
2. Access the appropriate MIB file using the instructions in “Accessing MIB Directories and Objects” on page C-6.
3. Select the OID string numbers for the Table, Entry #, and Index places of the command.
You may have to add interface and DLCI numbers to MIB commands in the following format: {group name}.{able}.{Entry #}.{Index}.<if#>.<dlci#>
NavisCore Troubleshooting Guide 7/17/03C-7
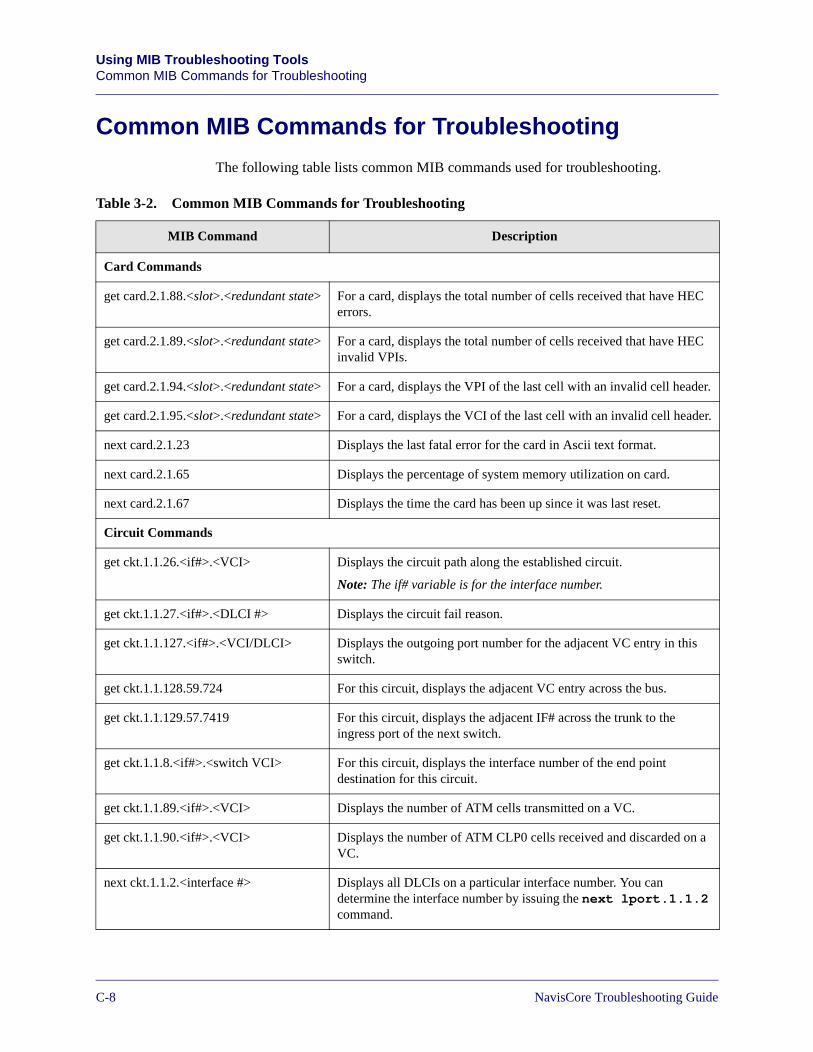
Beta Draft ConfidentialUsing MIB Troubleshooting ToolsCommon MIB Commands for Troubleshooting
Common MIB Commands for Troubleshooting
The following table lists common MIB commands used for troubleshooting.
Table 3-2. Common MIB Commands for Troubleshooting
MIB Command Description
Card Commands
get card.2.1.88.<slot>.<redundant state> For a card, displays the total number of cells received that have HEC errors.
get card.2.1.89.<slot>.<redundant state> For a card, displays the total number of cells received that have HEC invalid VPIs.
get card.2.1.94.<slot>.<redundant state> For a card, displays the VPI of the last cell with an invalid cell header.
get card.2.1.95.<slot>.<redundant state> For a card, displays the VCI of the last cell with an invalid cell header.
next card.2.1.23 Displays the last fatal error for the card in Ascii text format.
next card.2.1.65 Displays the percentage of system memory utilization on card.
next card.2.1.67 Displays the time the card has been up since it was last reset.
Circuit Commands
get ckt.1.1.26.<if#>.<VCI> Displays the circuit path along the established circuit.
Note: The if# variable is for the interface number.
get ckt.1.1.27.<if#>.<DLCI #> Displays the circuit fail reason.
get ckt.1.1.127.<if#>.<VCI/DLCI> Displays the outgoing port number for the adjacent VC entry in this switch.
get ckt.1.1.128.59.724 For this circuit, displays the adjacent VC entry across the bus.
get ckt.1.1.129.57.7419 For this circuit, displays the adjacent IF# across the trunk to the ingress port of the next switch.
get ckt.1.1.8.<if#>.<switch VCI> For this circuit, displays the interface number of the end point destination for this circuit.
get ckt.1.1.89.<if#>.<VCI> Displays the number of ATM cells transmitted on a VC.
get ckt.1.1.90.<if#>.<VCI> Displays the number of ATM CLP0 cells received and discarded on a VC.
next ckt.1.1.2.<interface #> Displays all DLCIs on a particular interface number. You can determine the interface number by issuing the next lport.1.1.2 command.
C-87/17/03 NavisCore Troubleshooting Guide
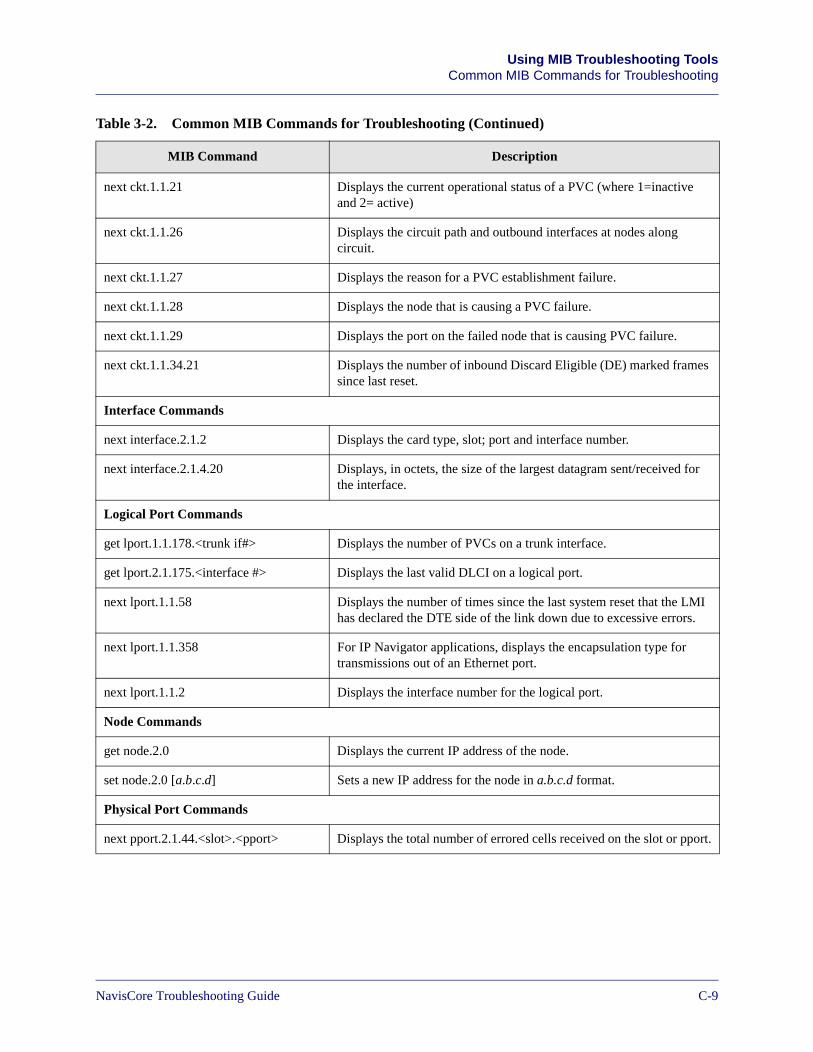
Beta Draft Confidential Using MIB Troubleshooting ToolsCommon MIB Commands for Troubleshooting
next ckt.1.1.21 Displays the current operational status of a PVC (where 1=inactive and 2= active)
next ckt.1.1.26 Displays the circuit path and outbound interfaces at nodes along circuit.
next ckt.1.1.27 Displays the reason for a PVC establishment failure.
next ckt.1.1.28 Displays the node that is causing a PVC failure.
next ckt.1.1.29 Displays the port on the failed node that is causing PVC failure.
next ckt.1.1.34.21 Displays the number of inbound Discard Eligible (DE) marked frames since last reset.
Interface Commands
next interface.2.1.2 Displays the card type, slot; port and interface number.
next interface.2.1.4.20 Displays, in octets, the size of the largest datagram sent/received for the interface.
Logical Port Commands
get lport.1.1.178.<trunk if#> Displays the number of PVCs on a trunk interface.
get lport.2.1.175.<interface #> Displays the last valid DLCI on a logical port.
next lport.1.1.58 Displays the number of times since the last system reset that the LMI has declared the DTE side of the link down due to excessive errors.
next lport.1.1.358 For IP Navigator applications, displays the encapsulation type for transmissions out of an Ethernet port.
next lport.1.1.2 Displays the interface number for the logical port.
Node Commands
get node.2.0 Displays the current IP address of the node.
set node.2.0 [a.b.c.d] Sets a new IP address for the node in a.b.c.d format.
Physical Port Commands
next pport.2.1.44.<slot>.<pport> Displays the total number of errored cells received on the slot or pport.
Table 3-2. Common MIB Commands for Troubleshooting (Continued)
MIB Command Description
NavisCore Troubleshooting Guide 7/17/03C-9

Beta Draft ConfidentialUsing MIB Troubleshooting ToolsCommon MIB Commands for Troubleshooting
C-107/17/03 NavisCore Troubleshooting Guide
NavisCore Troubleshooting Guide
Beta Draft Confidential
D
Quick MIB Group Reference
This appendix provides a quick reference to group-level MIB objects. These MIB objects include the following:
• “The Network Group” on page D-3
• “OSPF Autonomous System External Device and Host Group (For NMS paths)” on page D-4
• “The Node Group” on page D-5
• “The Card Group” on page D-7
• “The Physical Port Group” on page D-9
• “The Logical Port Group” on page D-11
• “The Interfaces Group” on page D-15
• “The Circuit Group” on page D-16
• “The Circuit Leaf Table” on page D-18
• “The SMDS Circuit Table” on page D-19
• “The DS1 Configuration Table” on page D-20
• “The DS1 Current Table” on page D-21
• “The DS1 Interval” on page D-22
• “The DS1 Total” on page D-23
• “The SMDS Address Group” on page D-24
• “The ISDN Address Group” on page D-25
• “The Service Name Binding Group” on page D-26
• “The Software Group” on page D-27
D-1

Beta Draft ConfidentialQuick MIB Group ReferenceIntroduction
Introduction
The following string specifies the path to the Lucent MIB:
iso(1).org(3).dod(6).internet(1).private(4).enterprises(1).cascade(277)
The object identifier for each branch of this path is indicated in parentheses. The following string specifies the object identifier for the path to the Lucent MIB.
1.3.6.1.4.1.277
The OID string for each variable is shown in brackets ({ }) as shown in the following example:
: : = { cktEntry 82 }
In this example, the OID string for the circuit is specified in the brackets as 82.
The following list shows some of the groups under cascade (277). This MIB module uses the extended macro as defined in RFC 1212.
• cascfr — OBJECT IDENTIFIER ::= { cascade 1 }
• cascsmds — OBJECT IDENTIFIER ::= { cascade 2 }
• namebinding — OBJECT IDENTIFIER ::= { cascade 3 }
• isdnaddr — OBJECT IDENTIFIER ::= { cascade 4 }
• cascsvc — OBJECT IDENTIFIER ::= { cascade 5 }
• software — OBJECT IDENTIFIER ::= { cascade 6 }
• provserver — OBJECT IDENTIFIER ::= { cascade 9 }
The following lists shows some of the groups under cascfr (cascade 1)
• net — OBJECT IDENTIFIER ::= { cascfr 1 }
• ase — OBJECT IDENTIFIER ::= { cascfr 2 }
• node — OBJECT IDENTIFIER ::= { cascfr 3 }
• pport — OBJECT IDENTIFIER ::= { cascfr 4 }
• lport — OBJECT IDENTIFIER ::= { cascfr 5 }
• ckt — OBJECT IDENTIFIER ::= { cascfr 6 }
• card — OBJECT IDENTIFIER ::= { cascfr 7 }
• ds1 — OBJECT IDENTIFIER ::= { cascfr 8 }
D-27/17/03 NavisCore Troubleshooting Guide
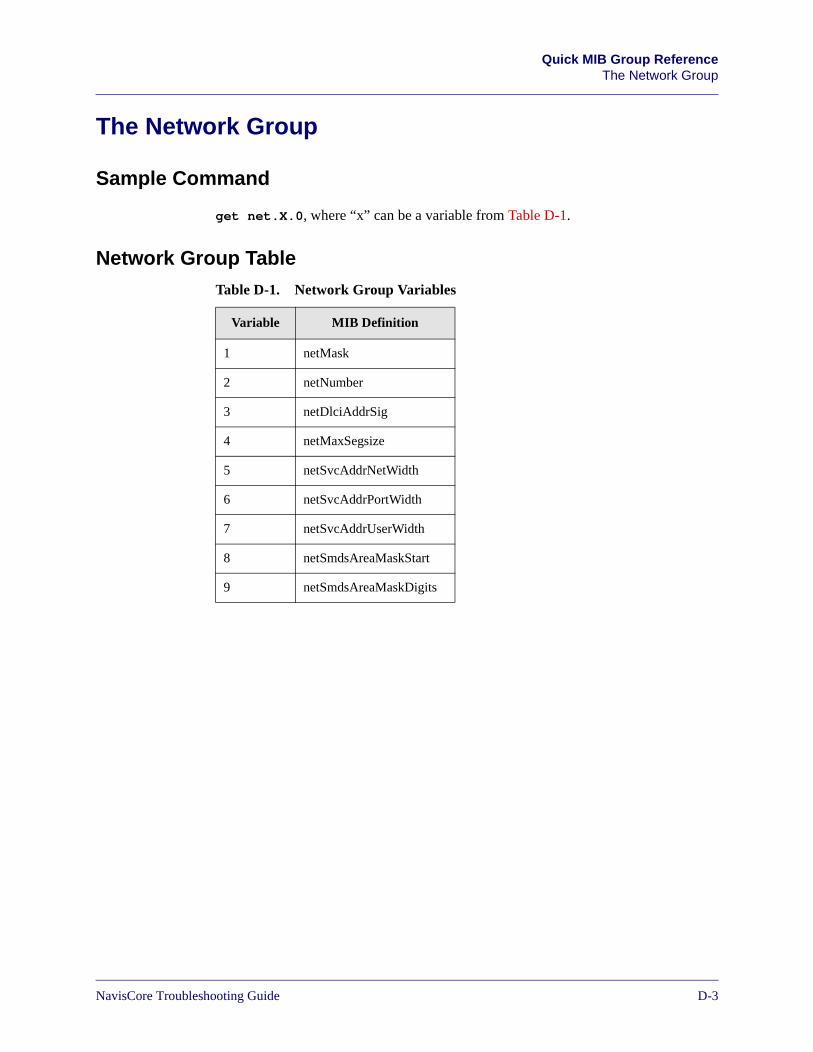
Beta Draft Confidential Quick MIB Group ReferenceThe Network Group
The Network Group
Sample Command
get net.X.0, where “x” can be a variable from Table D-1.
Network Group Table
Table D-1. Network Group Variables
Variable MIB Definition
1 netMask
2 netNumber
3 netDlciAddrSig
4 netMaxSegsize
5 netSvcAddrNetWidth
6 netSvcAddrPortWidth
7 netSvcAddrUserWidth
8 netSmdsAreaMaskStart
9 netSmdsAreaMaskDigits
NavisCore Troubleshooting Guide 7/17/03D-3
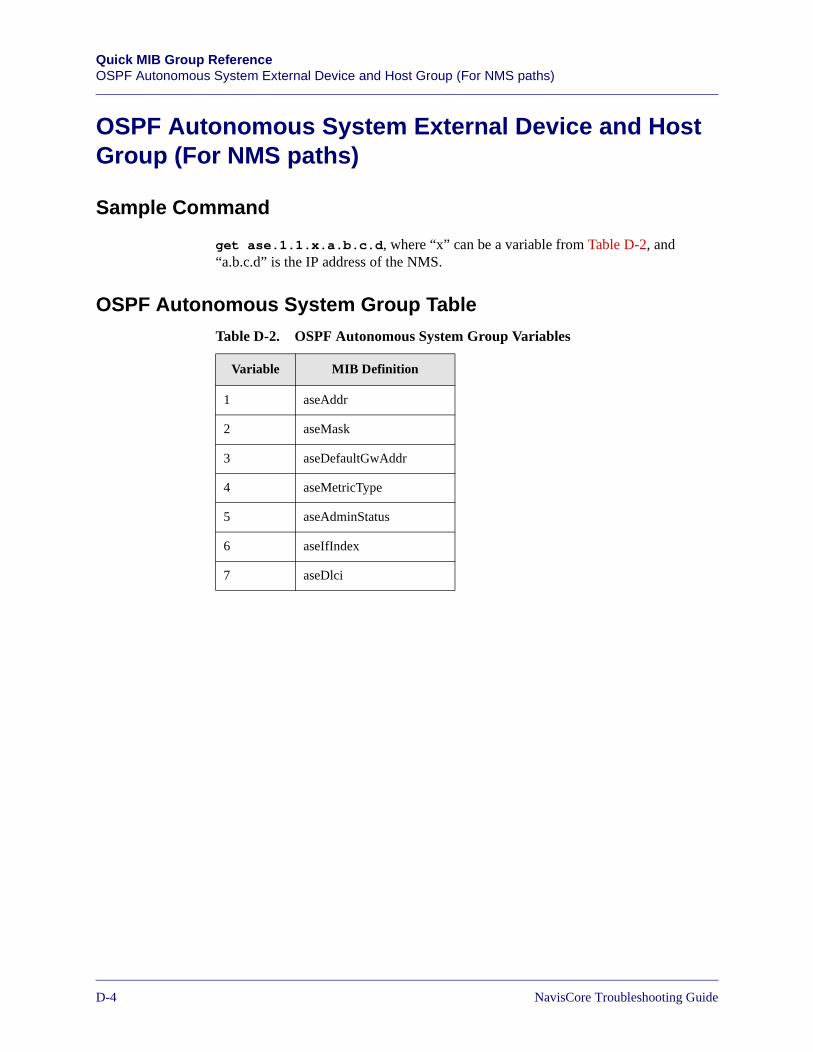
Beta Draft ConfidentialQuick MIB Group ReferenceOSPF Autonomous System External Device and Host Group (For NMS paths)
OSPF Autonomous System External Device and Host Group (For NMS paths)
Sample Command
get ase.1.1.x.a.b.c.d, where “x” can be a variable from Table D-2, and “a.b.c.d” is the IP address of the NMS.
OSPF Autonomous System Group Table
Table D-2. OSPF Autonomous System Group Variables
Variable MIB Definition
1 aseAddr
2 aseMask
3 aseDefaultGwAddr
4 aseMetricType
5 aseAdminStatus
6 aseIfIndex
7 aseDlci
D-47/17/03 NavisCore Troubleshooting Guide
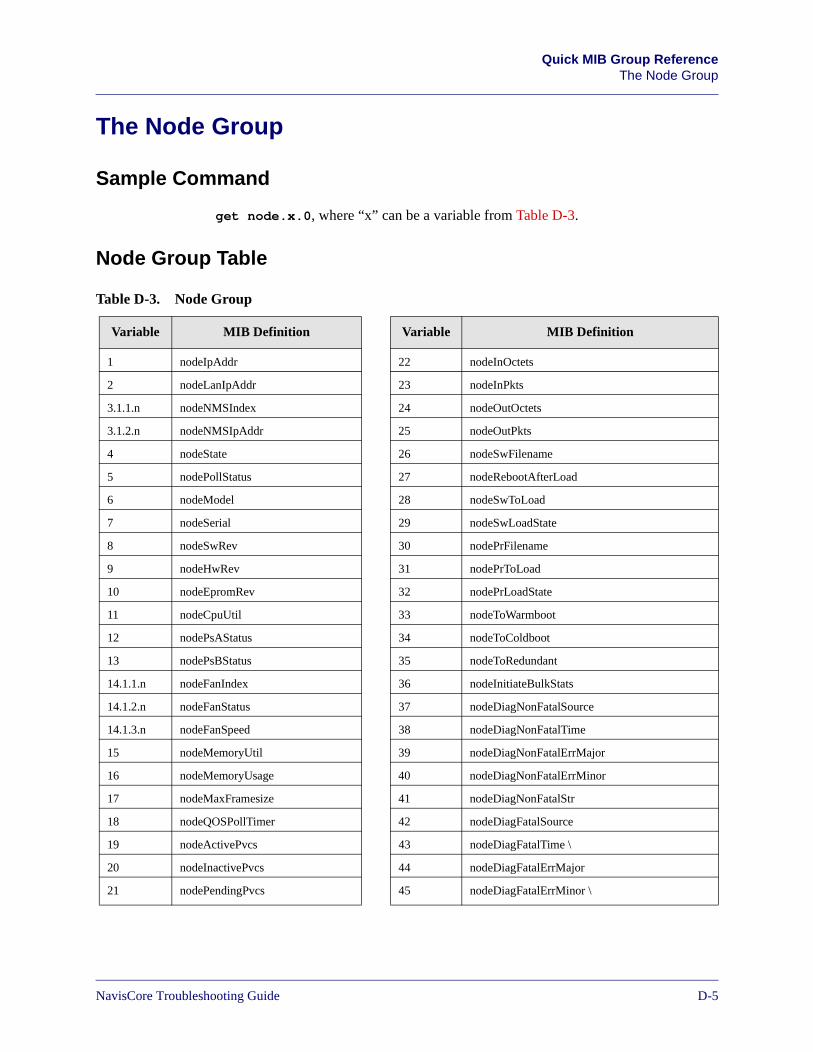
Beta Draft Confidential Quick MIB Group ReferenceThe Node Group
The Node Group
Sample Command
get node.x.0, where “x” can be a variable from Table D-3.
Node Group Table
Table D-3. Node Group
Variable MIB Definition Variable MIB Definition
1 nodeIpAddr 22 nodeInOctets
2 nodeLanIpAddr 23 nodeInPkts
3.1.1.n nodeNMSIndex 24 nodeOutOctets
3.1.2.n nodeNMSIpAddr 25 nodeOutPkts
4 nodeState 26 nodeSwFilename
5 nodePollStatus 27 nodeRebootAfterLoad
6 nodeModel 28 nodeSwToLoad
7 nodeSerial 29 nodeSwLoadState
8 nodeSwRev 30 nodePrFilename
9 nodeHwRev 31 nodePrToLoad
10 nodeEpromRev 32 nodePrLoadState
11 nodeCpuUtil 33 nodeToWarmboot
12 nodePsAStatus 34 nodeToColdboot
13 nodePsBStatus 35 nodeToRedundant
14.1.1.n nodeFanIndex 36 nodeInitiateBulkStats
14.1.2.n nodeFanStatus 37 nodeDiagNonFatalSource
14.1.3.n nodeFanSpeed 38 nodeDiagNonFatalTime
15 nodeMemoryUtil 39 nodeDiagNonFatalErrMajor
16 nodeMemoryUsage 40 nodeDiagNonFatalErrMinor
17 nodeMaxFramesize 41 nodeDiagNonFatalStr
18 nodeQOSPollTimer 42 nodeDiagFatalSource
19 nodeActivePvcs 43 nodeDiagFatalTime \
20 nodeInactivePvcs 44 nodeDiagFatalErrMajor
21 nodePendingPvcs 45 nodeDiagFatalErrMinor \
NavisCore Troubleshooting Guide 7/17/03D-5
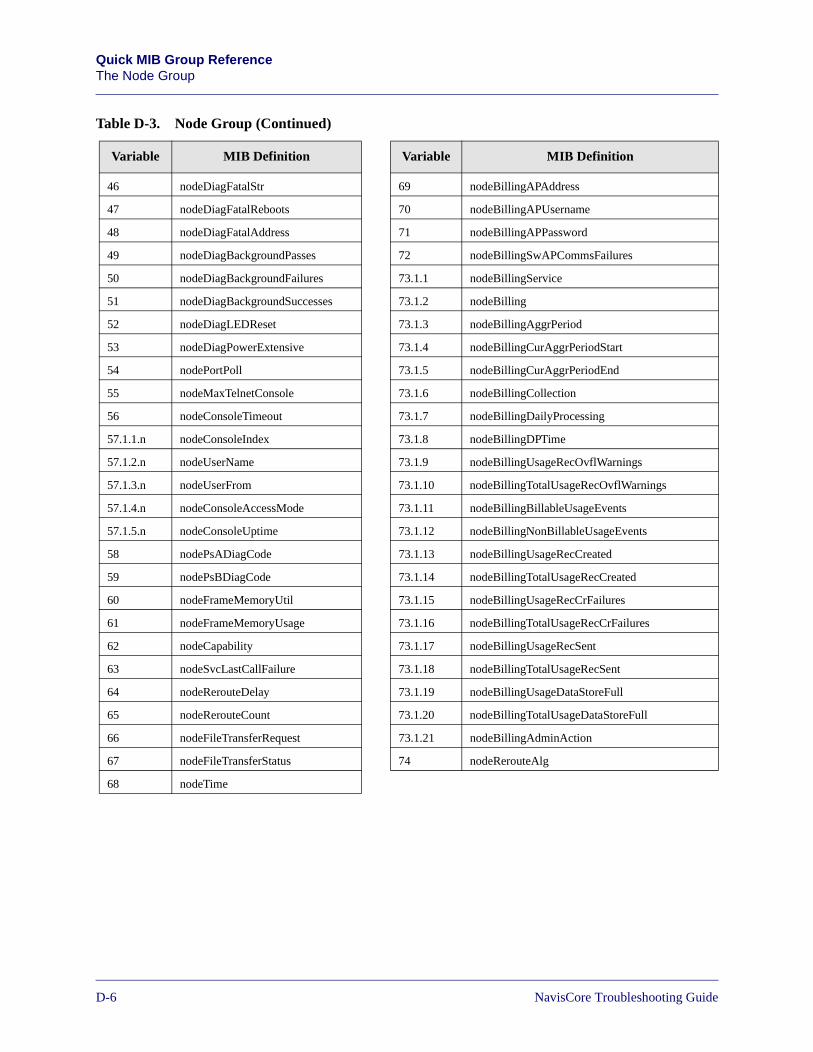
Beta Draft ConfidentialQuick MIB Group ReferenceThe Node Group
46 nodeDiagFatalStr 69 nodeBillingAPAddress
47 nodeDiagFatalReboots 70 nodeBillingAPUsername
48 nodeDiagFatalAddress 71 nodeBillingAPPassword
49 nodeDiagBackgroundPasses 72 nodeBillingSwAPCommsFailures
50 nodeDiagBackgroundFailures 73.1.1 nodeBillingService
51 nodeDiagBackgroundSuccesses 73.1.2 nodeBilling
52 nodeDiagLEDReset 73.1.3 nodeBillingAggrPeriod
53 nodeDiagPowerExtensive 73.1.4 nodeBillingCurAggrPeriodStart
54 nodePortPoll 73.1.5 nodeBillingCurAggrPeriodEnd
55 nodeMaxTelnetConsole 73.1.6 nodeBillingCollection
56 nodeConsoleTimeout 73.1.7 nodeBillingDailyProcessing
57.1.1.n nodeConsoleIndex 73.1.8 nodeBillingDPTime
57.1.2.n nodeUserName 73.1.9 nodeBillingUsageRecOvflWarnings
57.1.3.n nodeUserFrom 73.1.10 nodeBillingTotalUsageRecOvflWarnings
57.1.4.n nodeConsoleAccessMode 73.1.11 nodeBillingBillableUsageEvents
57.1.5.n nodeConsoleUptime 73.1.12 nodeBillingNonBillableUsageEvents
58 nodePsADiagCode 73.1.13 nodeBillingUsageRecCreated
59 nodePsBDiagCode 73.1.14 nodeBillingTotalUsageRecCreated
60 nodeFrameMemoryUtil 73.1.15 nodeBillingUsageRecCrFailures
61 nodeFrameMemoryUsage 73.1.16 nodeBillingTotalUsageRecCrFailures
62 nodeCapability 73.1.17 nodeBillingUsageRecSent
63 nodeSvcLastCallFailure 73.1.18 nodeBillingTotalUsageRecSent
64 nodeRerouteDelay 73.1.19 nodeBillingUsageDataStoreFull
65 nodeRerouteCount 73.1.20 nodeBillingTotalUsageDataStoreFull
66 nodeFileTransferRequest 73.1.21 nodeBillingAdminAction
67 nodeFileTransferStatus 74 nodeRerouteAlg
68 nodeTime
Table D-3. Node Group (Continued)
Variable MIB Definition Variable MIB Definition
D-67/17/03 NavisCore Troubleshooting Guide
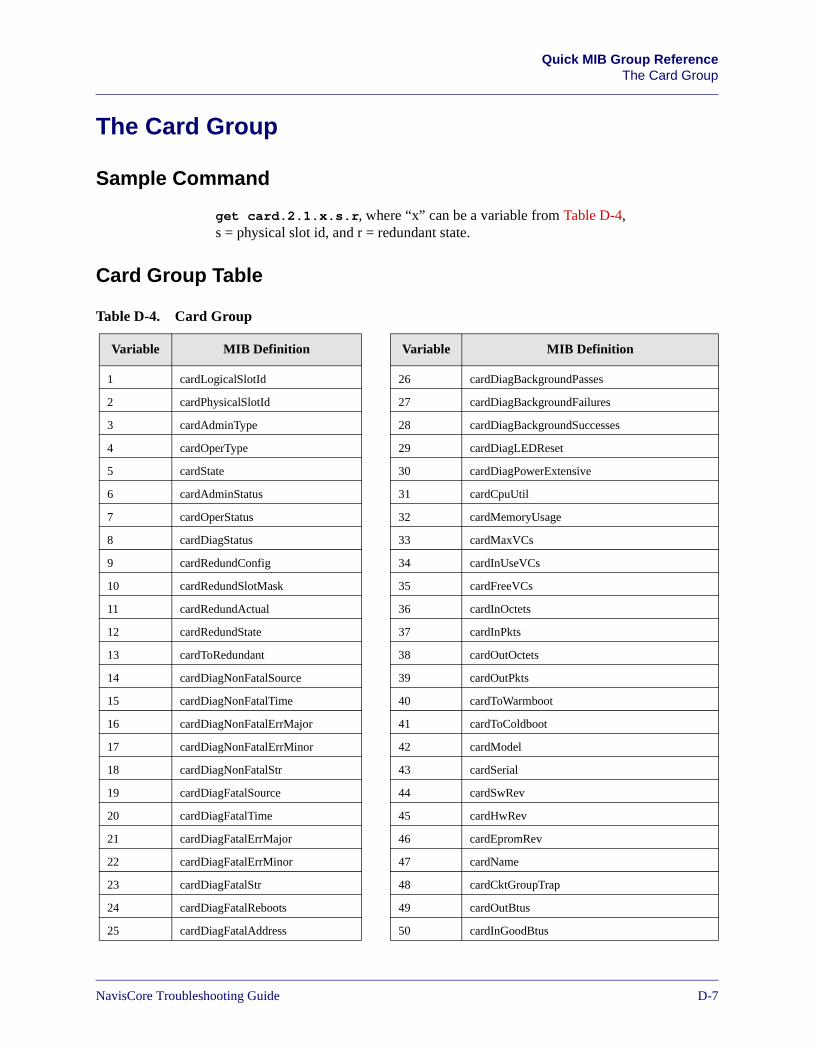
Beta Draft Confidential Quick MIB Group ReferenceThe Card Group
The Card Group
Sample Command
get card.2.1.x.s.r, where “x” can be a variable from Table D-4, s = physical slot id, and r = redundant state.
Card Group Table
Table D-4. Card Group
Variable MIB Definition Variable MIB Definition
1 cardLogicalSlotId 26 cardDiagBackgroundPasses
2 cardPhysicalSlotId 27 cardDiagBackgroundFailures
3 cardAdminType 28 cardDiagBackgroundSuccesses
4 cardOperType 29 cardDiagLEDReset
5 cardState 30 cardDiagPowerExtensive
6 cardAdminStatus 31 cardCpuUtil
7 cardOperStatus 32 cardMemoryUsage
8 cardDiagStatus 33 cardMaxVCs
9 cardRedundConfig 34 cardInUseVCs
10 cardRedundSlotMask 35 cardFreeVCs
11 cardRedundActual 36 cardInOctets
12 cardRedundState 37 cardInPkts
13 cardToRedundant 38 cardOutOctets
14 cardDiagNonFatalSource 39 cardOutPkts
15 cardDiagNonFatalTime 40 cardToWarmboot
16 cardDiagNonFatalErrMajor 41 cardToColdboot
17 cardDiagNonFatalErrMinor 42 cardModel
18 cardDiagNonFatalStr 43 cardSerial
19 cardDiagFatalSource 44 cardSwRev
20 cardDiagFatalTime 45 cardHwRev
21 cardDiagFatalErrMajor 46 cardEpromRev
22 cardDiagFatalErrMinor 47 cardName
23 cardDiagFatalStr 48 cardCktGroupTrap
24 cardDiagFatalReboots 49 cardOutBtus
25 cardDiagFatalAddress 50 cardInGoodBtus
NavisCore Troubleshooting Guide 7/17/03D-7
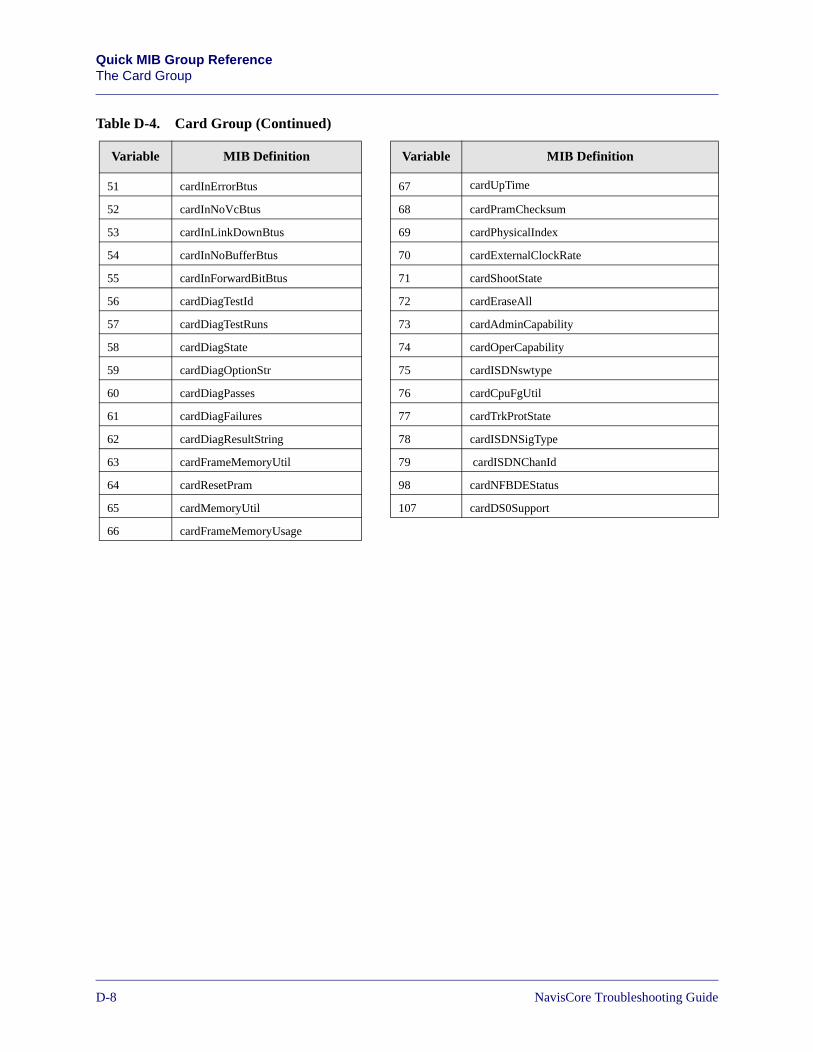
Beta Draft ConfidentialQuick MIB Group ReferenceThe Card Group
51 cardInErrorBtus 67 cardUpTime
52 cardInNoVcBtus 68 cardPramChecksum
53 cardInLinkDownBtus 69 cardPhysicalIndex
54 cardInNoBufferBtus 70 cardExternalClockRate
55 cardInForwardBitBtus 71 cardShootState
56 cardDiagTestId 72 cardEraseAll
57 cardDiagTestRuns 73 cardAdminCapability
58 cardDiagState 74 cardOperCapability
59 cardDiagOptionStr 75 cardISDNswtype
60 cardDiagPasses 76 cardCpuFgUtil
61 cardDiagFailures 77 cardTrkProtState
62 cardDiagResultString 78 cardISDNSigType
63 cardFrameMemoryUtil 79 cardISDNChanId
64 cardResetPram 98 cardNFBDEStatus
65 cardMemoryUtil 107 cardDS0Support
66 cardFrameMemoryUsage
Table D-4. Card Group (Continued)
Variable MIB Definition Variable MIB Definition
D-87/17/03 NavisCore Troubleshooting Guide
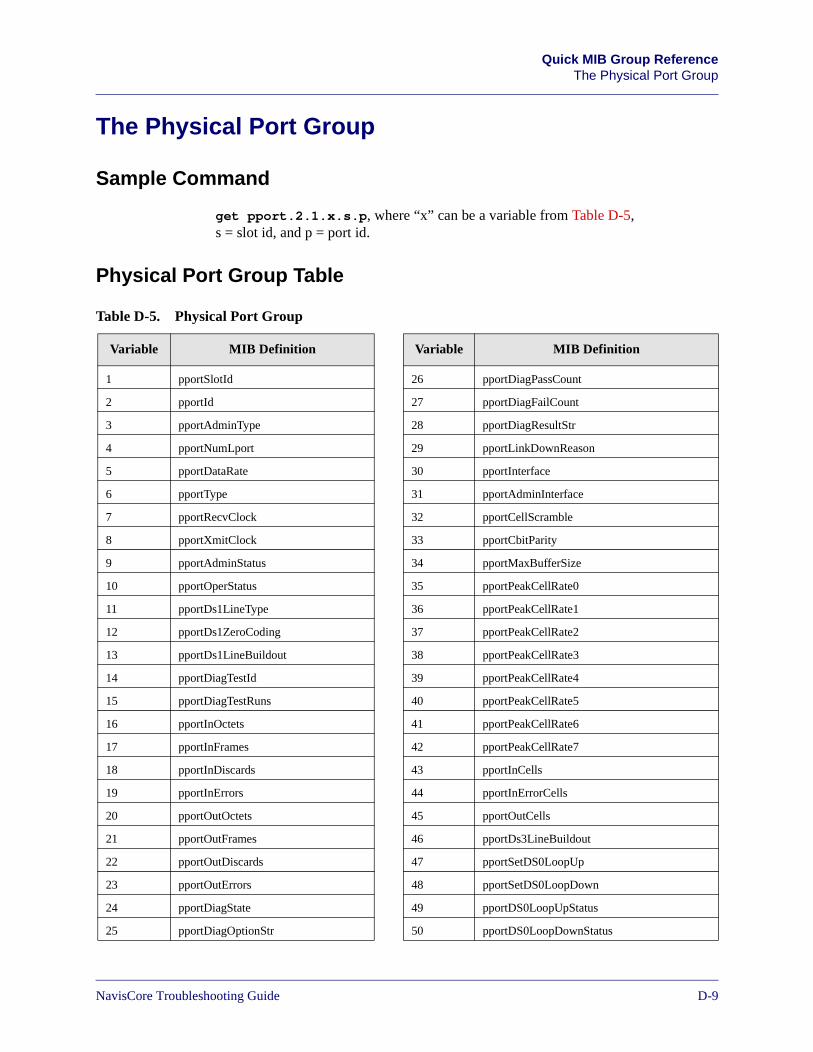
Beta Draft Confidential Quick MIB Group ReferenceThe Physical Port Group
The Physical Port Group
Sample Command
get pport.2.1.x.s.p, where “x” can be a variable from Table D-5, s = slot id, and p = port id.
Physical Port Group Table
Table D-5. Physical Port Group
Variable MIB Definition Variable MIB Definition
1 pportSlotId 26 pportDiagPassCount
2 pportId 27 pportDiagFailCount
3 pportAdminType 28 pportDiagResultStr
4 pportNumLport 29 pportLinkDownReason
5 pportDataRate 30 pportInterface
6 pportType 31 pportAdminInterface
7 pportRecvClock 32 pportCellScramble
8 pportXmitClock 33 pportCbitParity
9 pportAdminStatus 34 pportMaxBufferSize
10 pportOperStatus 35 pportPeakCellRate0
11 pportDs1LineType 36 pportPeakCellRate1
12 pportDs1ZeroCoding 37 pportPeakCellRate2
13 pportDs1LineBuildout 38 pportPeakCellRate3
14 pportDiagTestId 39 pportPeakCellRate4
15 pportDiagTestRuns 40 pportPeakCellRate5
16 pportInOctets 41 pportPeakCellRate6
17 pportInFrames 42 pportPeakCellRate7
18 pportInDiscards 43 pportInCells
19 pportInErrors 44 pportInErrorCells
20 pportOutOctets 45 pportOutCells
21 pportOutFrames 46 pportDs3LineBuildout
22 pportOutDiscards 47 pportSetDS0LoopUp
23 pportOutErrors 48 pportSetDS0LoopDown
24 pportDiagState 49 pportDS0LoopUpStatus
25 pportDiagOptionStr 50 pportDS0LoopDownStatus
NavisCore Troubleshooting Guide 7/17/03D-9
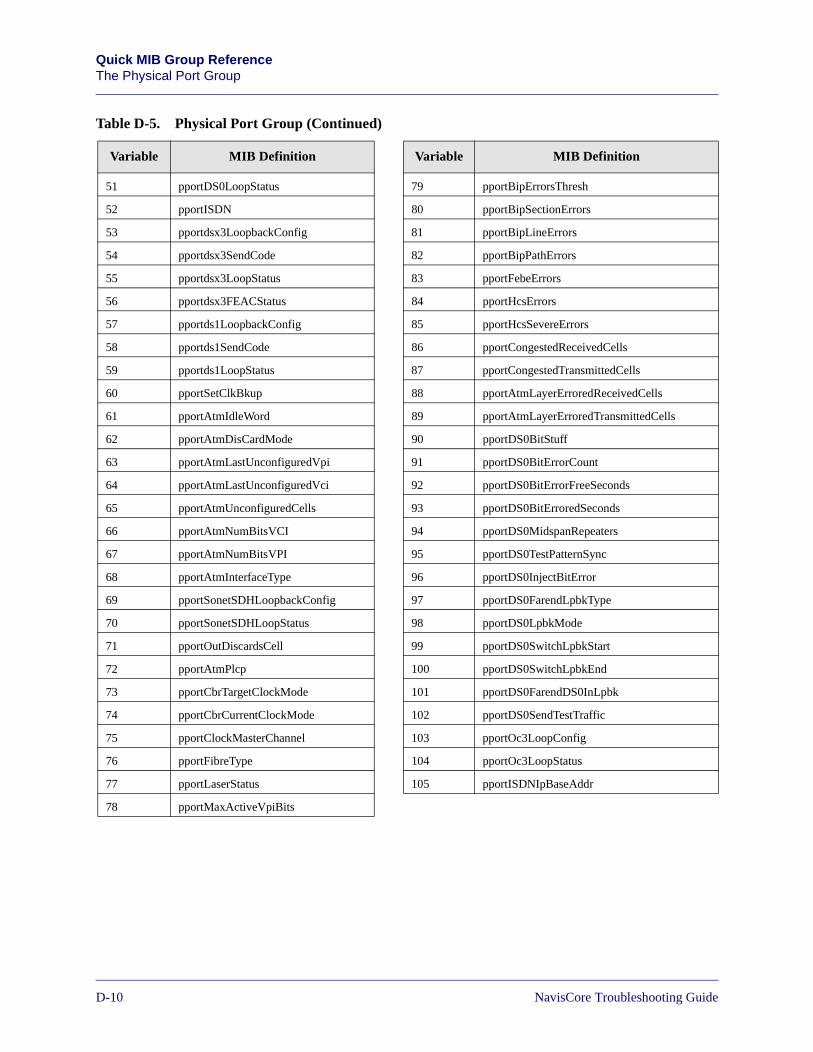
Beta Draft ConfidentialQuick MIB Group ReferenceThe Physical Port Group
51 pportDS0LoopStatus 79 pportBipErrorsThresh
52 pportISDN 80 pportBipSectionErrors
53 pportdsx3LoopbackConfig 81 pportBipLineErrors
54 pportdsx3SendCode 82 pportBipPathErrors
55 pportdsx3LoopStatus 83 pportFebeErrors
56 pportdsx3FEACStatus 84 pportHcsErrors
57 pportds1LoopbackConfig 85 pportHcsSevereErrors
58 pportds1SendCode 86 pportCongestedReceivedCells
59 pportds1LoopStatus 87 pportCongestedTransmittedCells
60 pportSetClkBkup 88 pportAtmLayerErroredReceivedCells
61 pportAtmIdleWord 89 pportAtmLayerErroredTransmittedCells
62 pportAtmDisCardMode 90 pportDS0BitStuff
63 pportAtmLastUnconfiguredVpi 91 pportDS0BitErrorCount
64 pportAtmLastUnconfiguredVci 92 pportDS0BitErrorFreeSeconds
65 pportAtmUnconfiguredCells 93 pportDS0BitErroredSeconds
66 pportAtmNumBitsVCI 94 pportDS0MidspanRepeaters
67 pportAtmNumBitsVPI 95 pportDS0TestPatternSync
68 pportAtmInterfaceType 96 pportDS0InjectBitError
69 pportSonetSDHLoopbackConfig 97 pportDS0FarendLpbkType
70 pportSonetSDHLoopStatus 98 pportDS0LpbkMode
71 pportOutDiscardsCell 99 pportDS0SwitchLpbkStart
72 pportAtmPlcp 100 pportDS0SwitchLpbkEnd
73 pportCbrTargetClockMode 101 pportDS0FarendDS0InLpbk
74 pportCbrCurrentClockMode 102 pportDS0SendTestTraffic
75 pportClockMasterChannel 103 pportOc3LoopConfig
76 pportFibreType 104 pportOc3LoopStatus
77 pportLaserStatus 105 pportISDNIpBaseAddr
78 pportMaxActiveVpiBits
Table D-5. Physical Port Group (Continued)
Variable MIB Definition Variable MIB Definition
D-107/17/03 NavisCore Troubleshooting Guide
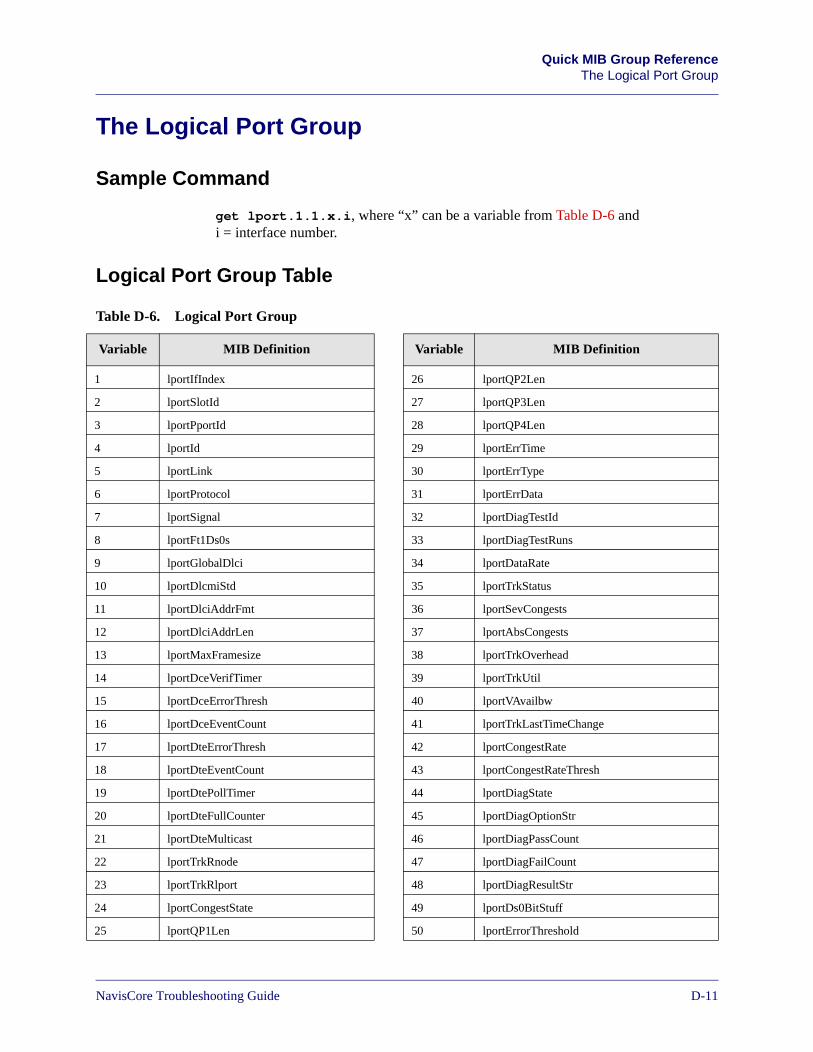
Beta Draft Confidential Quick MIB Group ReferenceThe Logical Port Group
The Logical Port Group
Sample Command
get lport.1.1.x.i, where “x” can be a variable from Table D-6 and i = interface number.
Logical Port Group Table
Table D-6. Logical Port Group
Variable MIB Definition Variable MIB Definition
1 lportIfIndex 26 lportQP2Len
2 lportSlotId 27 lportQP3Len
3 lportPportId 28 lportQP4Len
4 lportId 29 lportErrTime
5 lportLink 30 lportErrType
6 lportProtocol 31 lportErrData
7 lportSignal 32 lportDiagTestId
8 lportFt1Ds0s 33 lportDiagTestRuns
9 lportGlobalDlci 34 lportDataRate
10 lportDlcmiStd 35 lportTrkStatus
11 lportDlciAddrFmt 36 lportSevCongests
12 lportDlciAddrLen 37 lportAbsCongests
13 lportMaxFramesize 38 lportTrkOverhead
14 lportDceVerifTimer 39 lportTrkUtil
15 lportDceErrorThresh 40 lportVAvailbw
16 lportDceEventCount 41 lportTrkLastTimeChange
17 lportDteErrorThresh 42 lportCongestRate
18 lportDteEventCount 43 lportCongestRateThresh
19 lportDtePollTimer 44 lportDiagState
20 lportDteFullCounter 45 lportDiagOptionStr
21 lportDteMulticast 46 lportDiagPassCount
22 lportTrkRnode 47 lportDiagFailCount
23 lportTrkRlport 48 lportDiagResultStr
24 lportCongestState 49 lportDs0BitStuff
25 lportQP1Len 50 lportErrorThreshold
NavisCore Troubleshooting Guide 7/17/03D-11
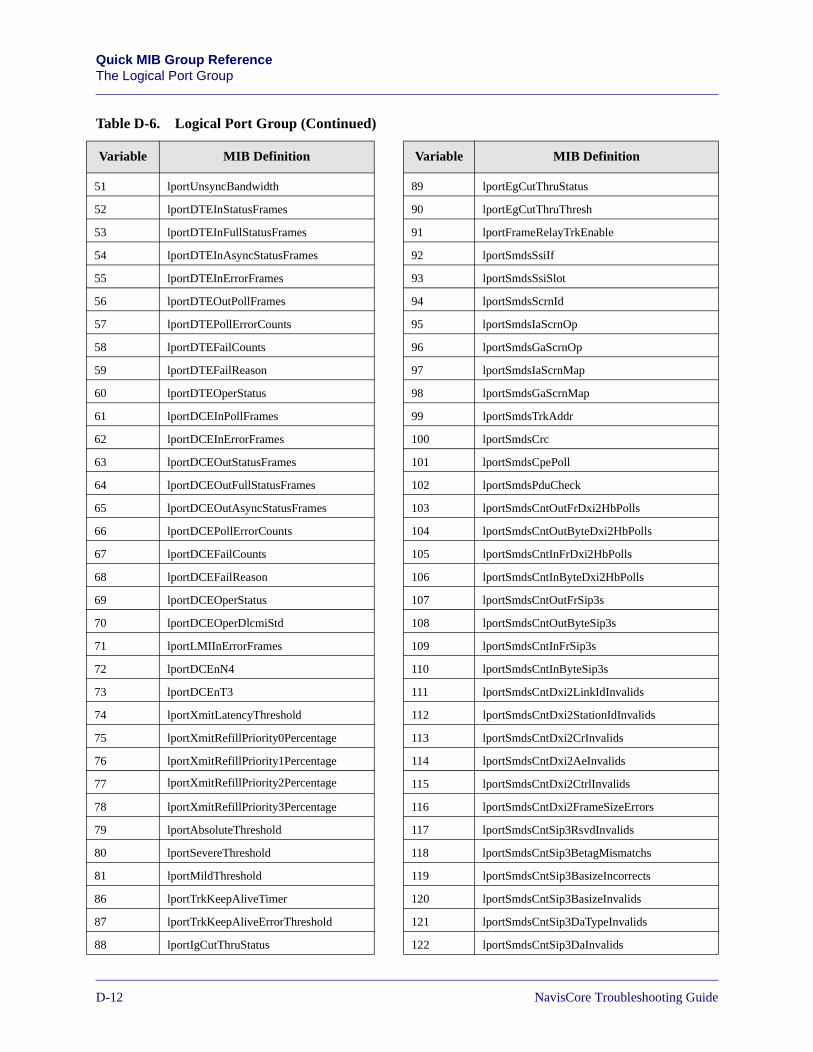
Beta Draft ConfidentialQuick MIB Group ReferenceThe Logical Port Group
51 lportUnsyncBandwidth 89 lportEgCutThruStatus
52 lportDTEInStatusFrames 90 lportEgCutThruThresh
53 lportDTEInFullStatusFrames 91 lportFrameRelayTrkEnable
54 lportDTEInAsyncStatusFrames 92 lportSmdsSsiIf
55 lportDTEInErrorFrames 93 lportSmdsSsiSlot
56 lportDTEOutPollFrames 94 lportSmdsScrnId
57 lportDTEPollErrorCounts 95 lportSmdsIaScrnOp
58 lportDTEFailCounts 96 lportSmdsGaScrnOp
59 lportDTEFailReason 97 lportSmdsIaScrnMap
60 lportDTEOperStatus 98 lportSmdsGaScrnMap
61 lportDCEInPollFrames 99 lportSmdsTrkAddr
62 lportDCEInErrorFrames 100 lportSmdsCrc
63 lportDCEOutStatusFrames 101 lportSmdsCpePoll
64 lportDCEOutFullStatusFrames 102 lportSmdsPduCheck
65 lportDCEOutAsyncStatusFrames 103 lportSmdsCntOutFrDxi2HbPolls
66 lportDCEPollErrorCounts 104 lportSmdsCntOutByteDxi2HbPolls
67 lportDCEFailCounts 105 lportSmdsCntInFrDxi2HbPolls
68 lportDCEFailReason 106 lportSmdsCntInByteDxi2HbPolls
69 lportDCEOperStatus 107 lportSmdsCntOutFrSip3s
70 lportDCEOperDlcmiStd 108 lportSmdsCntOutByteSip3s
71 lportLMIInErrorFrames 109 lportSmdsCntInFrSip3s
72 lportDCEnN4 110 lportSmdsCntInByteSip3s
73 lportDCEnT3 111 lportSmdsCntDxi2LinkIdInvalids
74 lportXmitLatencyThreshold 112 lportSmdsCntDxi2StationIdInvalids
75 lportXmitRefillPriority0Percentage 113 lportSmdsCntDxi2CrInvalids
76 lportXmitRefillPriority1Percentage 114 lportSmdsCntDxi2AeInvalids
77 lportXmitRefillPriority2Percentage 115 lportSmdsCntDxi2CtrlInvalids
78 lportXmitRefillPriority3Percentage 116 lportSmdsCntDxi2FrameSizeErrors
79 lportAbsoluteThreshold 117 lportSmdsCntSip3RsvdInvalids
80 lportSevereThreshold 118 lportSmdsCntSip3BetagMismatchs
81 lportMildThreshold 119 lportSmdsCntSip3BasizeIncorrects
86 lportTrkKeepAliveTimer 120 lportSmdsCntSip3BasizeInvalids
87 lportTrkKeepAliveErrorThreshold 121 lportSmdsCntSip3DaTypeInvalids
88 lportIgCutThruStatus 122 lportSmdsCntSip3DaInvalids
Table D-6. Logical Port Group (Continued)
Variable MIB Definition Variable MIB Definition
D-127/17/03 NavisCore Troubleshooting Guide
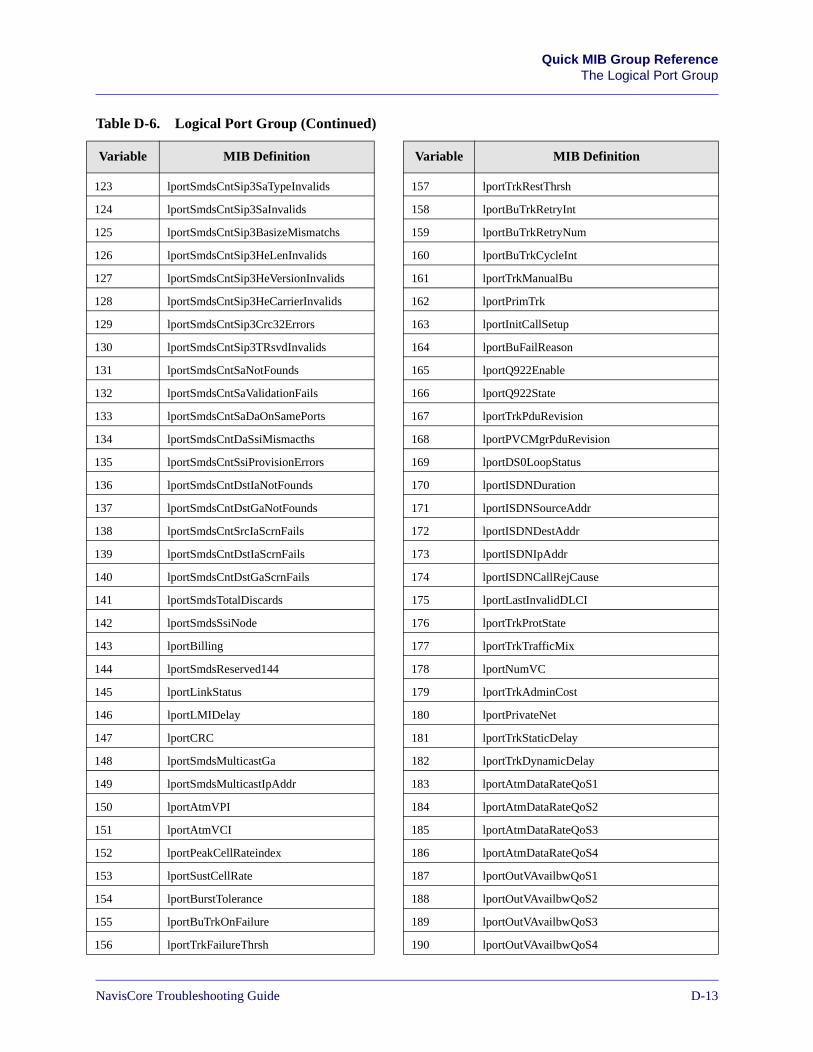
Beta Draft Confidential Quick MIB Group ReferenceThe Logical Port Group
123 lportSmdsCntSip3SaTypeInvalids 157 lportTrkRestThrsh
124 lportSmdsCntSip3SaInvalids 158 lportBuTrkRetryInt
125 lportSmdsCntSip3BasizeMismatchs 159 lportBuTrkRetryNum
126 lportSmdsCntSip3HeLenInvalids 160 lportBuTrkCycleInt
127 lportSmdsCntSip3HeVersionInvalids 161 lportTrkManualBu
128 lportSmdsCntSip3HeCarrierInvalids 162 lportPrimTrk
129 lportSmdsCntSip3Crc32Errors 163 lportInitCallSetup
130 lportSmdsCntSip3TRsvdInvalids 164 lportBuFailReason
131 lportSmdsCntSaNotFounds 165 lportQ922Enable
132 lportSmdsCntSaValidationFails 166 lportQ922State
133 lportSmdsCntSaDaOnSamePorts 167 lportTrkPduRevision
134 lportSmdsCntDaSsiMismacths 168 lportPVCMgrPduRevision
135 lportSmdsCntSsiProvisionErrors 169 lportDS0LoopStatus
136 lportSmdsCntDstIaNotFounds 170 lportISDNDuration
137 lportSmdsCntDstGaNotFounds 171 lportISDNSourceAddr
138 lportSmdsCntSrcIaScrnFails 172 lportISDNDestAddr
139 lportSmdsCntDstIaScrnFails 173 lportISDNIpAddr
140 lportSmdsCntDstGaScrnFails 174 lportISDNCallRejCause
141 lportSmdsTotalDiscards 175 lportLastInvalidDLCI
142 lportSmdsSsiNode 176 lportTrkProtState
143 lportBilling 177 lportTrkTrafficMix
144 lportSmdsReserved144 178 lportNumVC
145 lportLinkStatus 179 lportTrkAdminCost
146 lportLMIDelay 180 lportPrivateNet
147 lportCRC 181 lportTrkStaticDelay
148 lportSmdsMulticastGa 182 lportTrkDynamicDelay
149 lportSmdsMulticastIpAddr 183 lportAtmDataRateQoS1
150 lportAtmVPI 184 lportAtmDataRateQoS2
151 lportAtmVCI 185 lportAtmDataRateQoS3
152 lportPeakCellRateindex 186 lportAtmDataRateQoS4
153 lportSustCellRate 187 lportOutVAvailbwQoS1
154 lportBurstTolerance 188 lportOutVAvailbwQoS2
155 lportBuTrkOnFailure 189 lportOutVAvailbwQoS3
156 lportTrkFailureThrsh 190 lportOutVAvailbwQoS4
Table D-6. Logical Port Group (Continued)
Variable MIB Definition Variable MIB Definition
NavisCore Troubleshooting Guide 7/17/03D-13
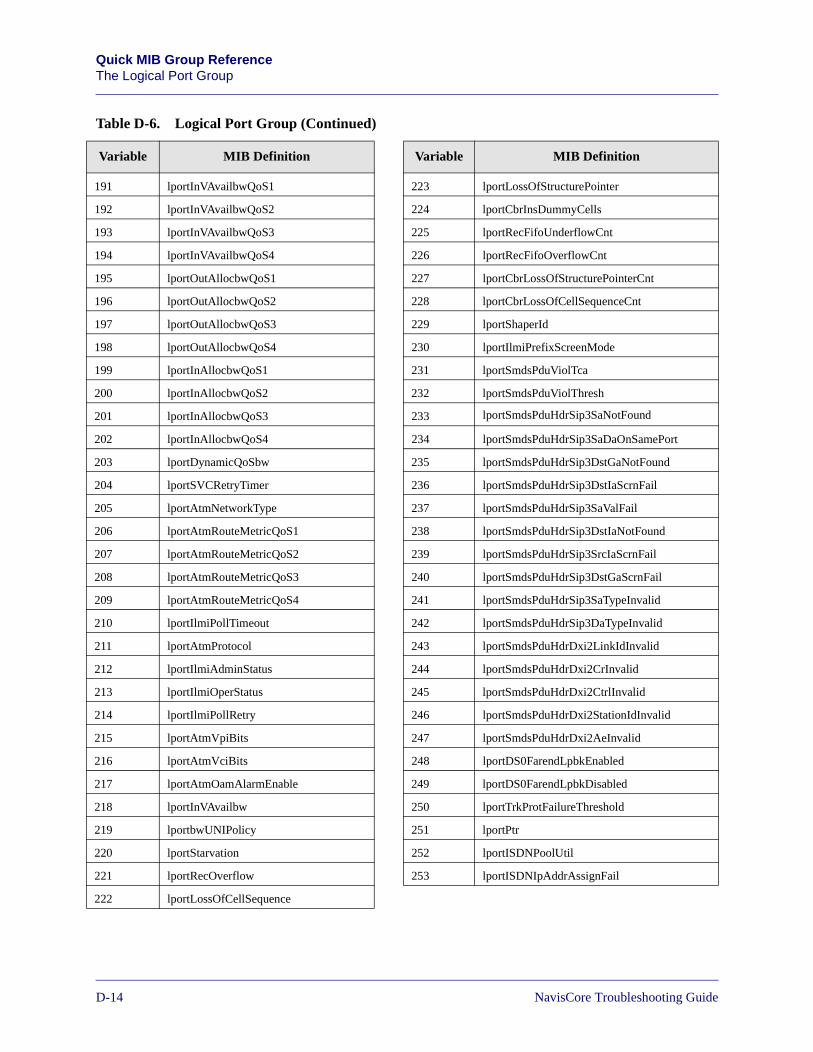
Beta Draft ConfidentialQuick MIB Group ReferenceThe Logical Port Group
191 lportInVAvailbwQoS1 223 lportLossOfStructurePointer
192 lportInVAvailbwQoS2 224 lportCbrInsDummyCells
193 lportInVAvailbwQoS3 225 lportRecFifoUnderflowCnt
194 lportInVAvailbwQoS4 226 lportRecFifoOverflowCnt
195 lportOutAllocbwQoS1 227 lportCbrLossOfStructurePointerCnt
196 lportOutAllocbwQoS2 228 lportCbrLossOfCellSequenceCnt
197 lportOutAllocbwQoS3 229 lportShaperId
198 lportOutAllocbwQoS4 230 lportIlmiPrefixScreenMode
199 lportInAllocbwQoS1 231 lportSmdsPduViolTca
200 lportInAllocbwQoS2 232 lportSmdsPduViolThresh
201 lportInAllocbwQoS3 233 lportSmdsPduHdrSip3SaNotFound
202 lportInAllocbwQoS4 234 lportSmdsPduHdrSip3SaDaOnSamePort
203 lportDynamicQoSbw 235 lportSmdsPduHdrSip3DstGaNotFound
204 lportSVCRetryTimer 236 lportSmdsPduHdrSip3DstIaScrnFail
205 lportAtmNetworkType 237 lportSmdsPduHdrSip3SaValFail
206 lportAtmRouteMetricQoS1 238 lportSmdsPduHdrSip3DstIaNotFound
207 lportAtmRouteMetricQoS2 239 lportSmdsPduHdrSip3SrcIaScrnFail
208 lportAtmRouteMetricQoS3 240 lportSmdsPduHdrSip3DstGaScrnFail
209 lportAtmRouteMetricQoS4 241 lportSmdsPduHdrSip3SaTypeInvalid
210 lportIlmiPollTimeout 242 lportSmdsPduHdrSip3DaTypeInvalid
211 lportAtmProtocol 243 lportSmdsPduHdrDxi2LinkIdInvalid
212 lportIlmiAdminStatus 244 lportSmdsPduHdrDxi2CrInvalid
213 lportIlmiOperStatus 245 lportSmdsPduHdrDxi2CtrlInvalid
214 lportIlmiPollRetry 246 lportSmdsPduHdrDxi2StationIdInvalid
215 lportAtmVpiBits 247 lportSmdsPduHdrDxi2AeInvalid
216 lportAtmVciBits 248 lportDS0FarendLpbkEnabled
217 lportAtmOamAlarmEnable 249 lportDS0FarendLpbkDisabled
218 lportInVAvailbw 250 lportTrkProtFailureThreshold
219 lportbwUNIPolicy 251 lportPtr
220 lportStarvation 252 lportISDNPoolUtil
221 lportRecOverflow 253 lportISDNIpAddrAssignFail
222 lportLossOfCellSequence
Table D-6. Logical Port Group (Continued)
Variable MIB Definition Variable MIB Definition
D-147/17/03 NavisCore Troubleshooting Guide
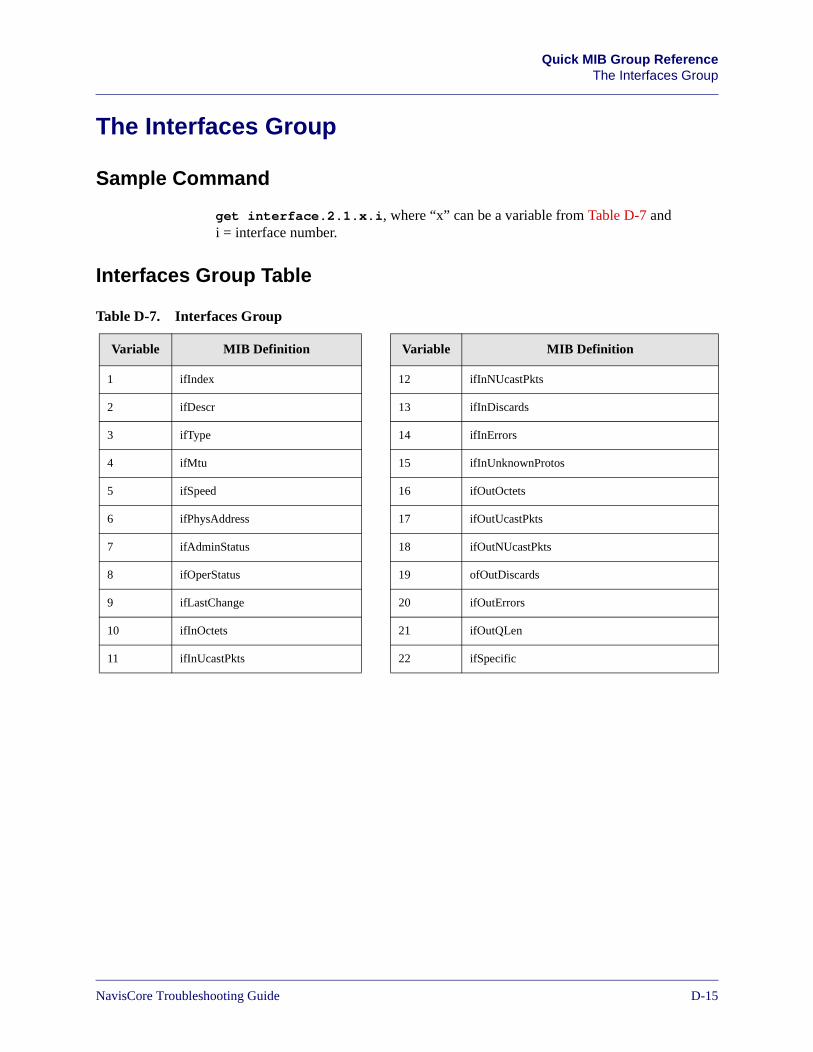
Beta Draft Confidential Quick MIB Group ReferenceThe Interfaces Group
The Interfaces Group
Sample Command
get interface.2.1.x.i, where “x” can be a variable from Table D-7 and i = interface number.
Interfaces Group Table
Table D-7. Interfaces Group
Variable MIB Definition Variable MIB Definition
1 ifIndex 12 ifInNUcastPkts
2 ifDescr 13 ifInDiscards
3 ifType 14 ifInErrors
4 ifMtu 15 ifInUnknownProtos
5 ifSpeed 16 ifOutOctets
6 ifPhysAddress 17 ifOutUcastPkts
7 ifAdminStatus 18 ifOutNUcastPkts
8 ifOperStatus 19 ofOutDiscards
9 ifLastChange 20 ifOutErrors
10 ifInOctets 21 ifOutQLen
11 ifInUcastPkts 22 ifSpecific
NavisCore Troubleshooting Guide 7/17/03D-15
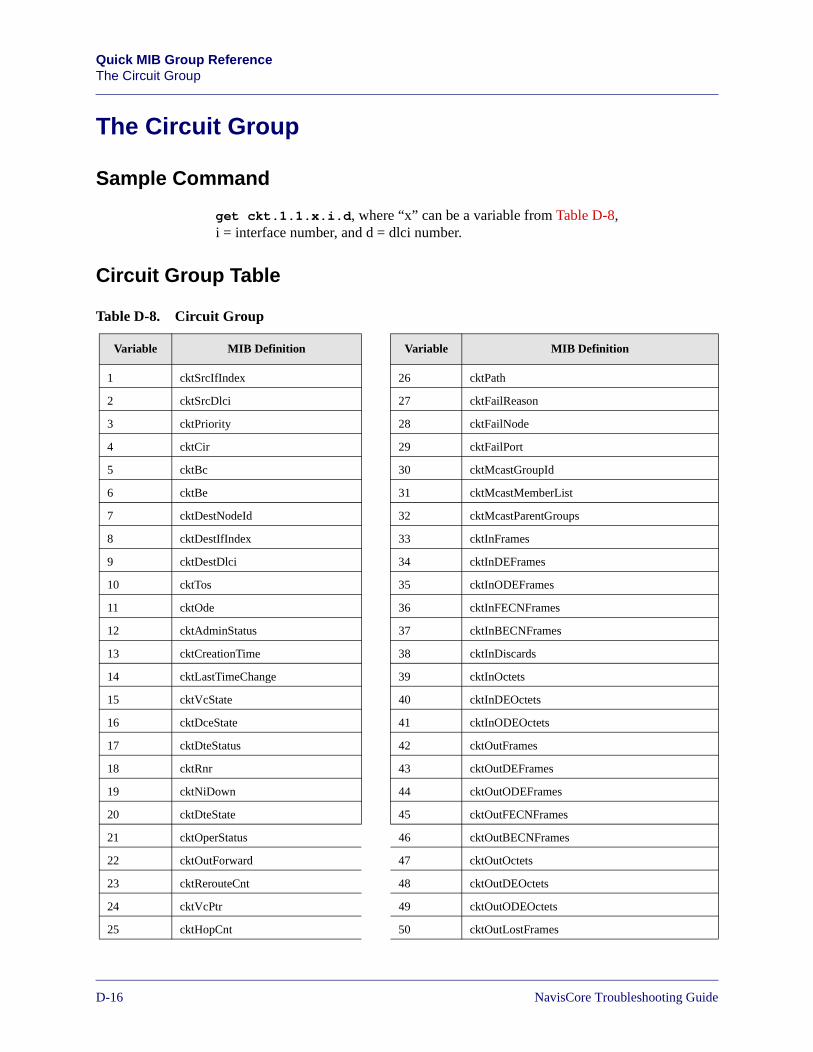
Beta Draft ConfidentialQuick MIB Group ReferenceThe Circuit Group
The Circuit Group
Sample Command
get ckt.1.1.x.i.d, where “x” can be a variable from Table D-8, i = interface number, and d = dlci number.
Circuit Group Table
Table D-8. Circuit Group
Variable MIB Definition Variable MIB Definition
1 cktSrcIfIndex 26 cktPath
2 cktSrcDlci 27 cktFailReason
3 cktPriority 28 cktFailNode
4 cktCir 29 cktFailPort
5 cktBc 30 cktMcastGroupId
6 cktBe 31 cktMcastMemberList
7 cktDestNodeId 32 cktMcastParentGroups
8 cktDestIfIndex 33 cktInFrames
9 cktDestDlci 34 cktInDEFrames
10 cktTos 35 cktInODEFrames
11 cktOde 36 cktInFECNFrames
12 cktAdminStatus 37 cktInBECNFrames
13 cktCreationTime 38 cktInDiscards
14 cktLastTimeChange 39 cktInOctets
15 cktVcState 40 cktInDEOctets
16 cktDceState 41 cktInODEOctets
17 cktDteStatus 42 cktOutFrames
18 cktRnr 43 cktOutDEFrames
19 cktNiDown 44 cktOutODEFrames
20 cktDteState 45 cktOutFECNFrames
21 cktOperStatus 46 cktOutBECNFrames
22 cktOutForward 47 cktOutOctets
23 cktRerouteCnt 48 cktOutDEOctets
24 cktVcPtr 49 cktOutODEOctets
25 cktHopCnt 50 cktOutLostFrames
D-167/17/03 NavisCore Troubleshooting Guide
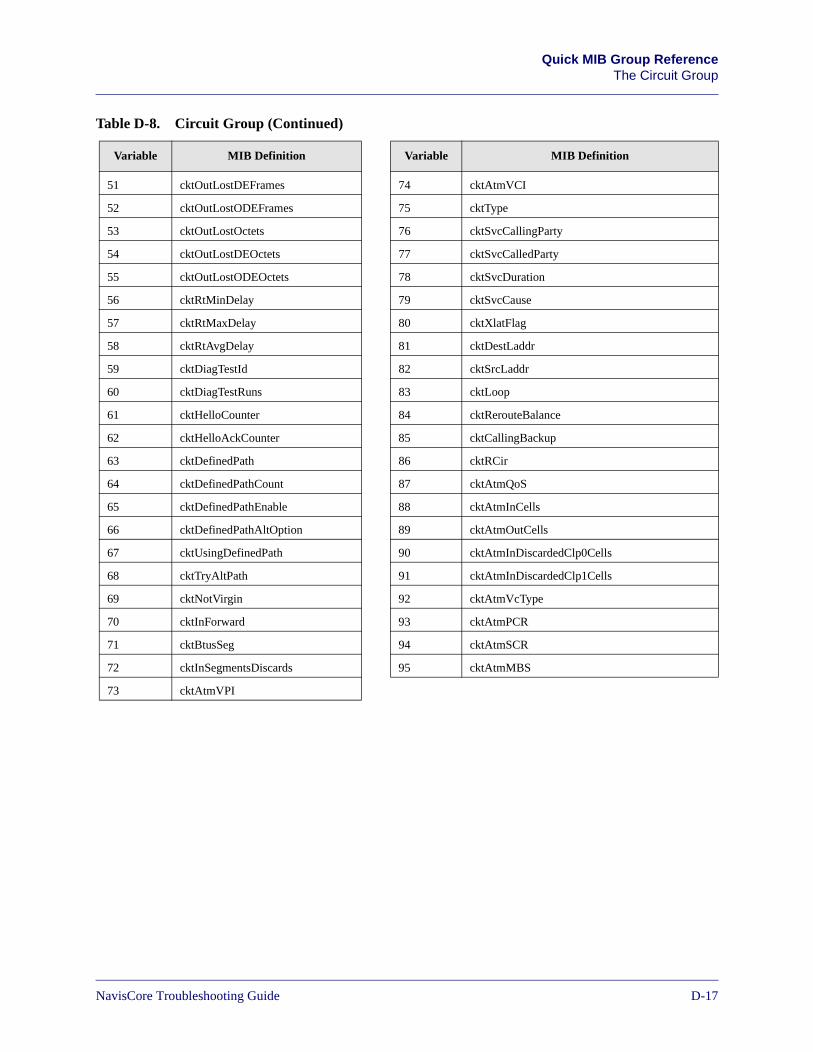
Beta Draft Confidential Quick MIB Group ReferenceThe Circuit Group
51 cktOutLostDEFrames 74 cktAtmVCI
52 cktOutLostODEFrames 75 cktType
53 cktOutLostOctets 76 cktSvcCallingParty
54 cktOutLostDEOctets 77 cktSvcCalledParty
55 cktOutLostODEOctets 78 cktSvcDuration
56 cktRtMinDelay 79 cktSvcCause
57 cktRtMaxDelay 80 cktXlatFlag
58 cktRtAvgDelay 81 cktDestLaddr
59 cktDiagTestId 82 cktSrcLaddr
60 cktDiagTestRuns 83 cktLoop
61 cktHelloCounter 84 cktRerouteBalance
62 cktHelloAckCounter 85 cktCallingBackup
63 cktDefinedPath 86 cktRCir
64 cktDefinedPathCount 87 cktAtmQoS
65 cktDefinedPathEnable 88 cktAtmInCells
66 cktDefinedPathAltOption 89 cktAtmOutCells
67 cktUsingDefinedPath 90 cktAtmInDiscardedClp0Cells
68 cktTryAltPath 91 cktAtmInDiscardedClp1Cells
69 cktNotVirgin 92 cktAtmVcType
70 cktInForward 93 cktAtmPCR
71 cktBtusSeg 94 cktAtmSCR
72 cktInSegmentsDiscards 95 cktAtmMBS
73 cktAtmVPI
Table D-8. Circuit Group (Continued)
Variable MIB Definition Variable MIB Definition
NavisCore Troubleshooting Guide 7/17/03D-17
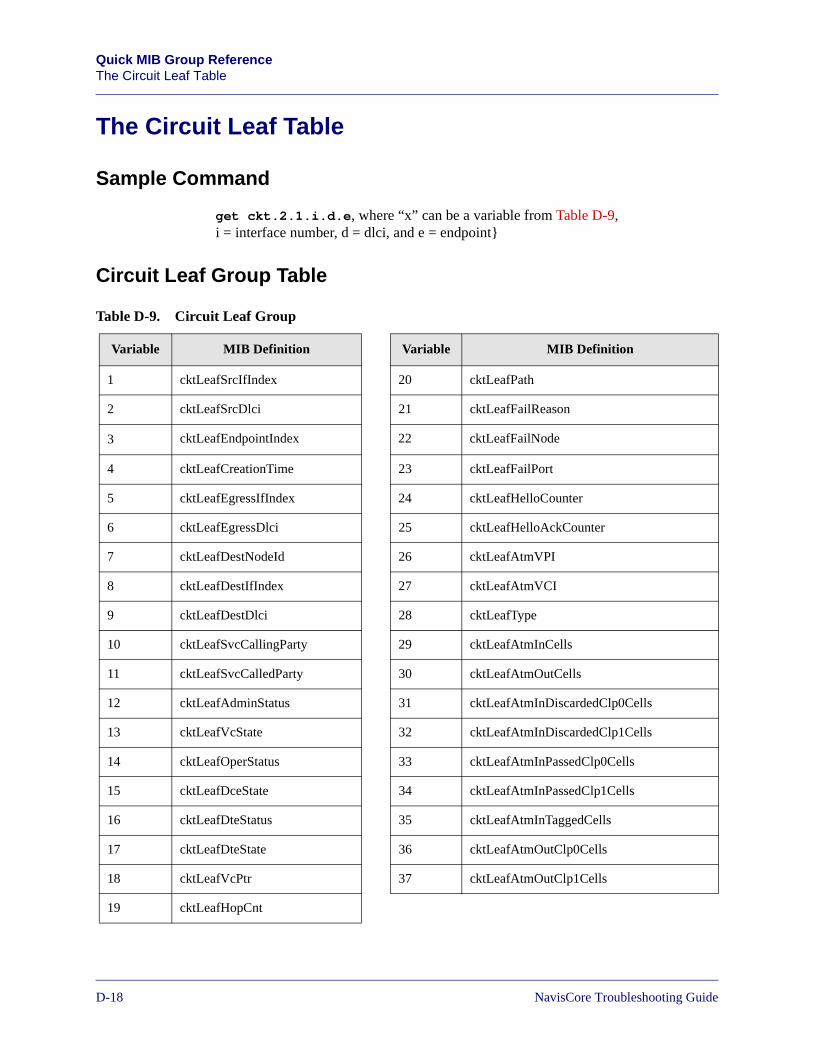
Beta Draft ConfidentialQuick MIB Group ReferenceThe Circuit Leaf Table
The Circuit Leaf Table
Sample Command
get ckt.2.1.i.d.e, where “x” can be a variable from Table D-9, i = interface number, d = dlci, and e = endpoint}
Circuit Leaf Group Table
Table D-9. Circuit Leaf Group
Variable MIB Definition Variable MIB Definition
1 cktLeafSrcIfIndex 20 cktLeafPath
2 cktLeafSrcDlci 21 cktLeafFailReason
3 cktLeafEndpointIndex 22 cktLeafFailNode
4 cktLeafCreationTime 23 cktLeafFailPort
5 cktLeafEgressIfIndex 24 cktLeafHelloCounter
6 cktLeafEgressDlci 25 cktLeafHelloAckCounter
7 cktLeafDestNodeId 26 cktLeafAtmVPI
8 cktLeafDestIfIndex 27 cktLeafAtmVCI
9 cktLeafDestDlci 28 cktLeafType
10 cktLeafSvcCallingParty 29 cktLeafAtmInCells
11 cktLeafSvcCalledParty 30 cktLeafAtmOutCells
12 cktLeafAdminStatus 31 cktLeafAtmInDiscardedClp0Cells
13 cktLeafVcState 32 cktLeafAtmInDiscardedClp1Cells
14 cktLeafOperStatus 33 cktLeafAtmInPassedClp0Cells
15 cktLeafDceState 34 cktLeafAtmInPassedClp1Cells
16 cktLeafDteStatus 35 cktLeafAtmInTaggedCells
17 cktLeafDteState 36 cktLeafAtmOutClp0Cells
18 cktLeafVcPtr 37 cktLeafAtmOutClp1Cells
19 cktLeafHopCnt
D-187/17/03 NavisCore Troubleshooting Guide
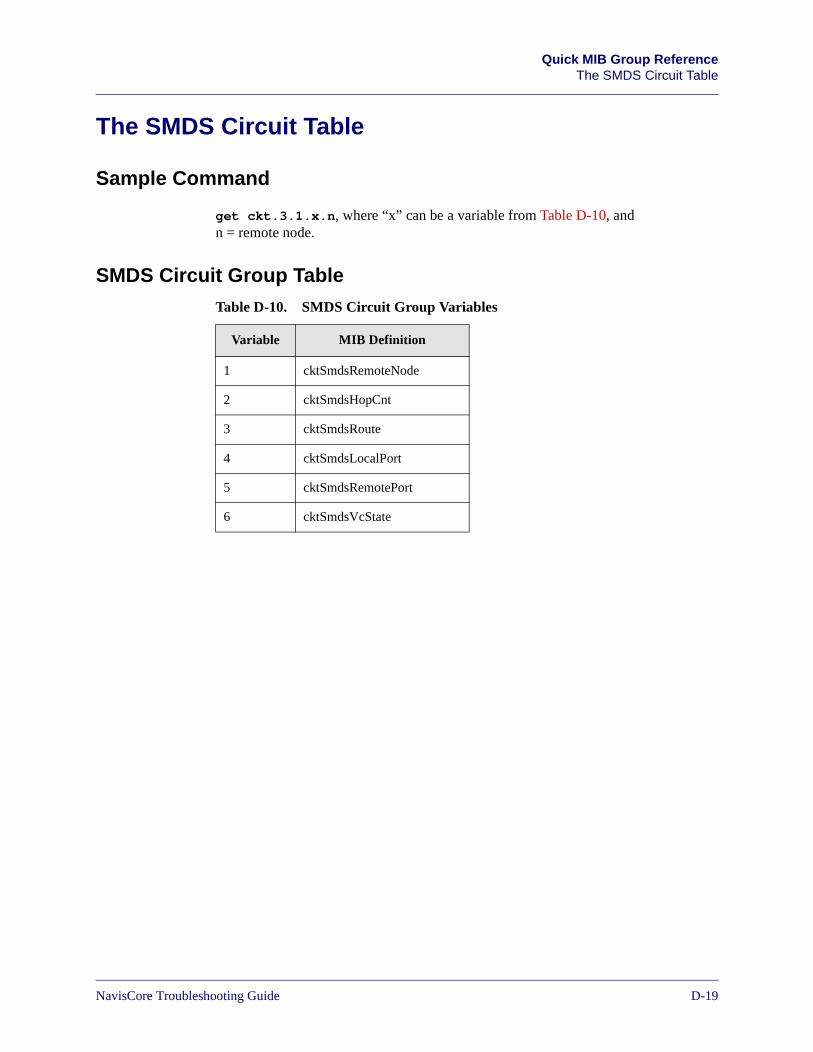
Beta Draft Confidential Quick MIB Group ReferenceThe SMDS Circuit Table
The SMDS Circuit Table
Sample Command
get ckt.3.1.x.n, where “x” can be a variable from Table D-10, and n = remote node.
SMDS Circuit Group Table
Table D-10. SMDS Circuit Group Variables
Variable MIB Definition
1 cktSmdsRemoteNode
2 cktSmdsHopCnt
3 cktSmdsRoute
4 cktSmdsLocalPort
5 cktSmdsRemotePort
6 cktSmdsVcState
NavisCore Troubleshooting Guide 7/17/03D-19
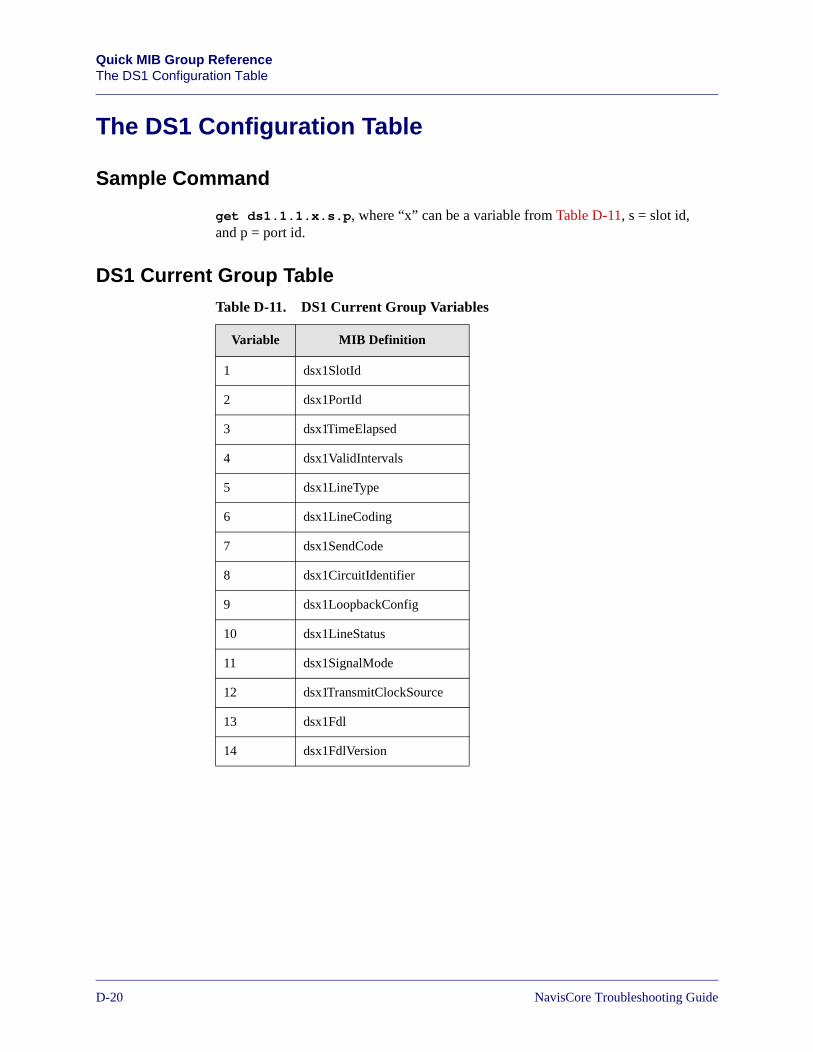
Beta Draft ConfidentialQuick MIB Group ReferenceThe DS1 Configuration Table
The DS1 Configuration Table
Sample Command
get ds1.1.1.x.s.p, where “x” can be a variable from Table D-11, s = slot id, and p = port id.
DS1 Current Group Table
Table D-11. DS1 Current Group Variables
Variable MIB Definition
1 dsx1SlotId
2 dsx1PortId
3 dsx1TimeElapsed
4 dsx1ValidIntervals
5 dsx1LineType
6 dsx1LineCoding
7 dsx1SendCode
8 dsx1CircuitIdentifier
9 dsx1LoopbackConfig
10 dsx1LineStatus
11 dsx1SignalMode
12 dsx1TransmitClockSource
13 dsx1Fdl
14 dsx1FdlVersion
D-207/17/03 NavisCore Troubleshooting Guide
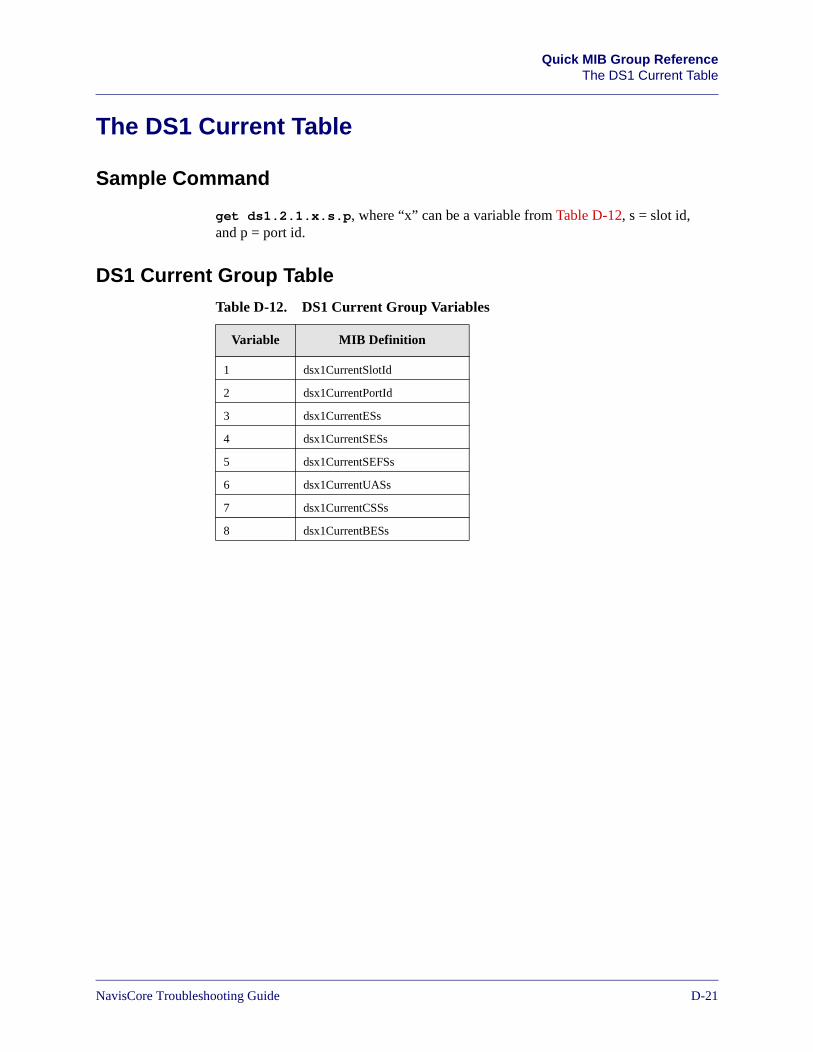
Beta Draft Confidential Quick MIB Group ReferenceThe DS1 Current Table
The DS1 Current Table
Sample Command
get ds1.2.1.x.s.p, where “x” can be a variable from Table D-12, s = slot id, and p = port id.
DS1 Current Group Table
Table D-12. DS1 Current Group Variables
Variable MIB Definition
1 dsx1CurrentSlotId
2 dsx1CurrentPortId
3 dsx1CurrentESs
4 dsx1CurrentSESs
5 dsx1CurrentSEFSs
6 dsx1CurrentUASs
7 dsx1CurrentCSSs
8 dsx1CurrentBESs
NavisCore Troubleshooting Guide 7/17/03D-21
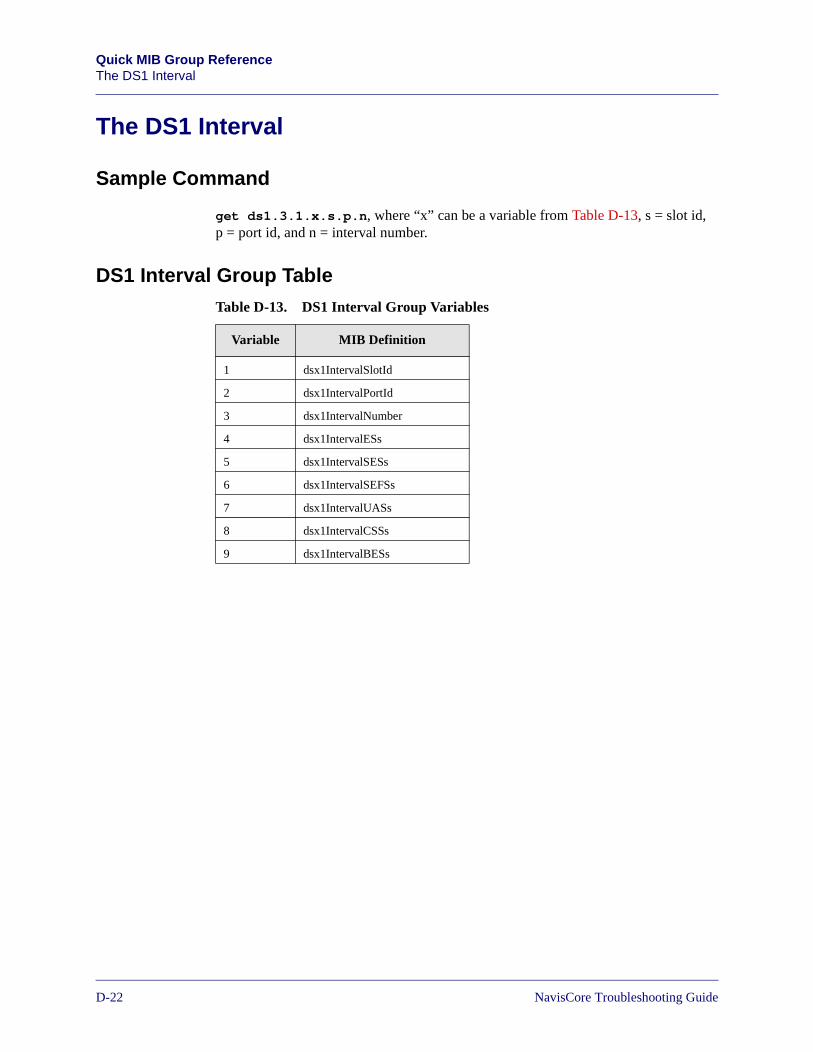
Beta Draft ConfidentialQuick MIB Group ReferenceThe DS1 Interval
The DS1 Interval
Sample Command
get ds1.3.1.x.s.p.n, where “x” can be a variable from Table D-13, s = slot id, p = port id, and n = interval number.
DS1 Interval Group Table
Table D-13. DS1 Interval Group Variables
Variable MIB Definition
1 dsx1IntervalSlotId
2 dsx1IntervalPortId
3 dsx1IntervalNumber
4 dsx1IntervalESs
5 dsx1IntervalSESs
6 dsx1IntervalSEFSs
7 dsx1IntervalUASs
8 dsx1IntervalCSSs
9 dsx1IntervalBESs
D-227/17/03 NavisCore Troubleshooting Guide
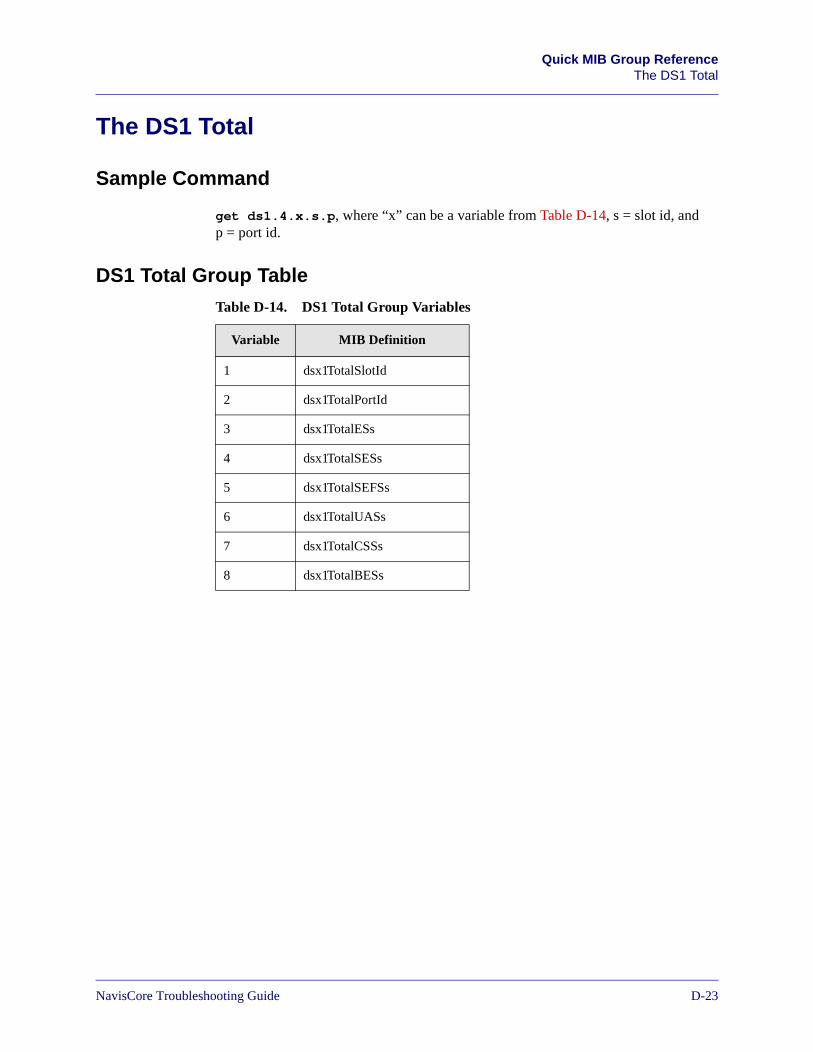
Beta Draft Confidential Quick MIB Group ReferenceThe DS1 Total
The DS1 Total
Sample Command
get ds1.4.x.s.p, where “x” can be a variable from Table D-14, s = slot id, and p = port id.
DS1 Total Group Table
Table D-14. DS1 Total Group Variables
Variable MIB Definition
1 dsx1TotalSlotId
2 dsx1TotalPortId
3 dsx1TotalESs
4 dsx1TotalSESs
5 dsx1TotalSEFSs
6 dsx1TotalUASs
7 dsx1TotalCSSs
8 dsx1TotalBESs
NavisCore Troubleshooting Guide 7/17/03D-23
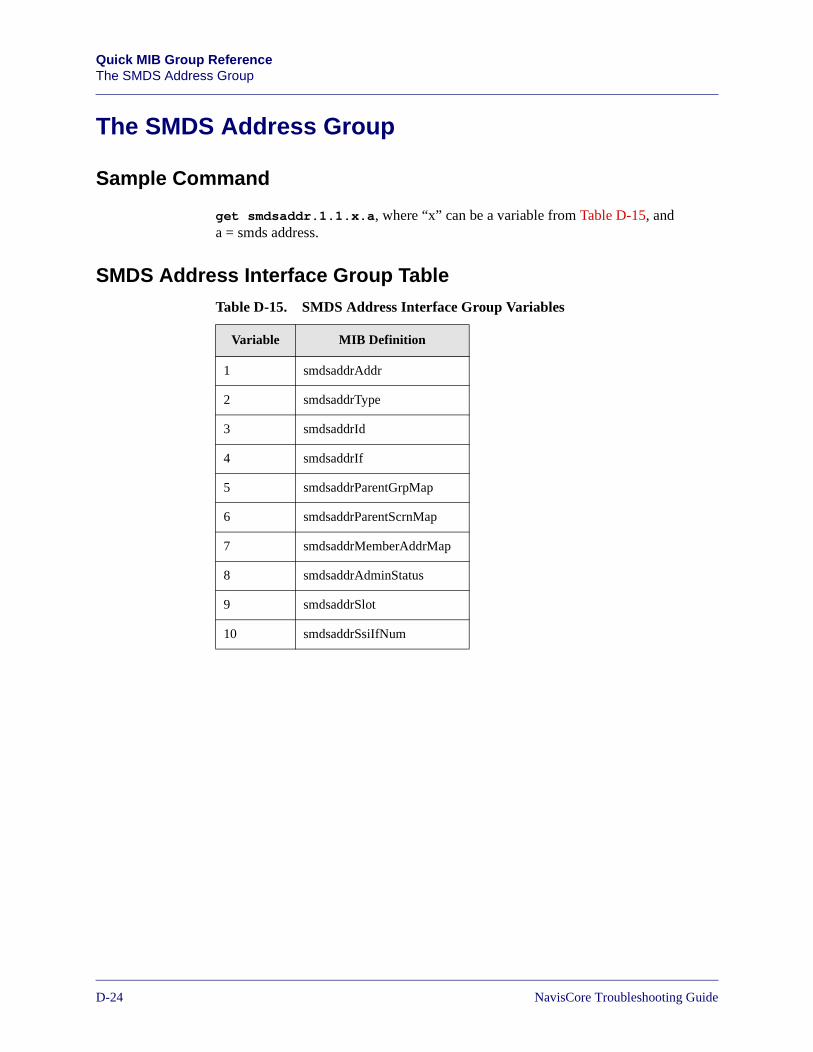
Beta Draft ConfidentialQuick MIB Group ReferenceThe SMDS Address Group
The SMDS Address Group
Sample Command
get smdsaddr.1.1.x.a, where “x” can be a variable from Table D-15, and a = smds address.
SMDS Address Interface Group Table
Table D-15. SMDS Address Interface Group Variables
Variable MIB Definition
1 smdsaddrAddr
2 smdsaddrType
3 smdsaddrId
4 smdsaddrIf
5 smdsaddrParentGrpMap
6 smdsaddrParentScrnMap
7 smdsaddrMemberAddrMap
8 smdsaddrAdminStatus
9 smdsaddrSlot
10 smdsaddrSsiIfNum
D-247/17/03 NavisCore Troubleshooting Guide
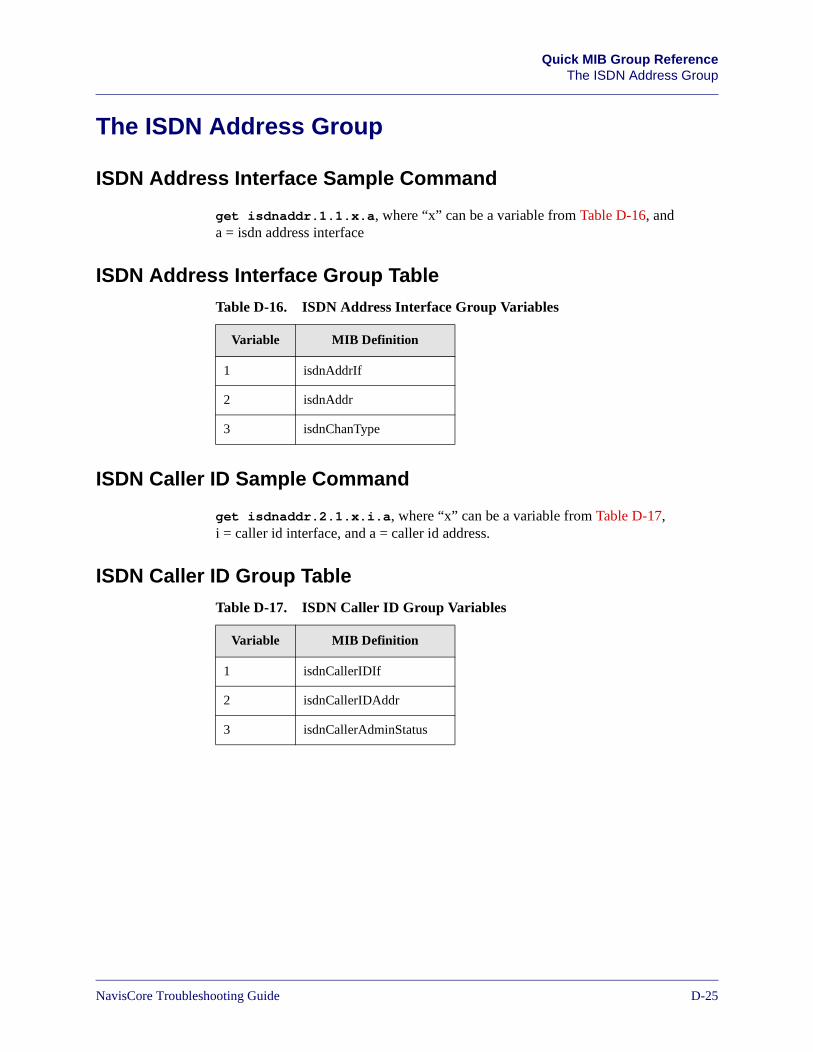
Beta Draft Confidential Quick MIB Group ReferenceThe ISDN Address Group
The ISDN Address Group
ISDN Address Interface Sample Command
get isdnaddr.1.1.x.a, where “x” can be a variable from Table D-16, and a = isdn address interface
ISDN Address Interface Group Table
ISDN Caller ID Sample Command
get isdnaddr.2.1.x.i.a, where “x” can be a variable from Table D-17, i = caller id interface, and a = caller id address.
ISDN Caller ID Group Table
Table D-16. ISDN Address Interface Group Variables
Variable MIB Definition
1 isdnAddrIf
2 isdnAddr
3 isdnChanType
Table D-17. ISDN Caller ID Group Variables
Variable MIB Definition
1 isdnCallerIDIf
2 isdnCallerIDAddr
3 isdnCallerAdminStatus
NavisCore Troubleshooting Guide 7/17/03D-25
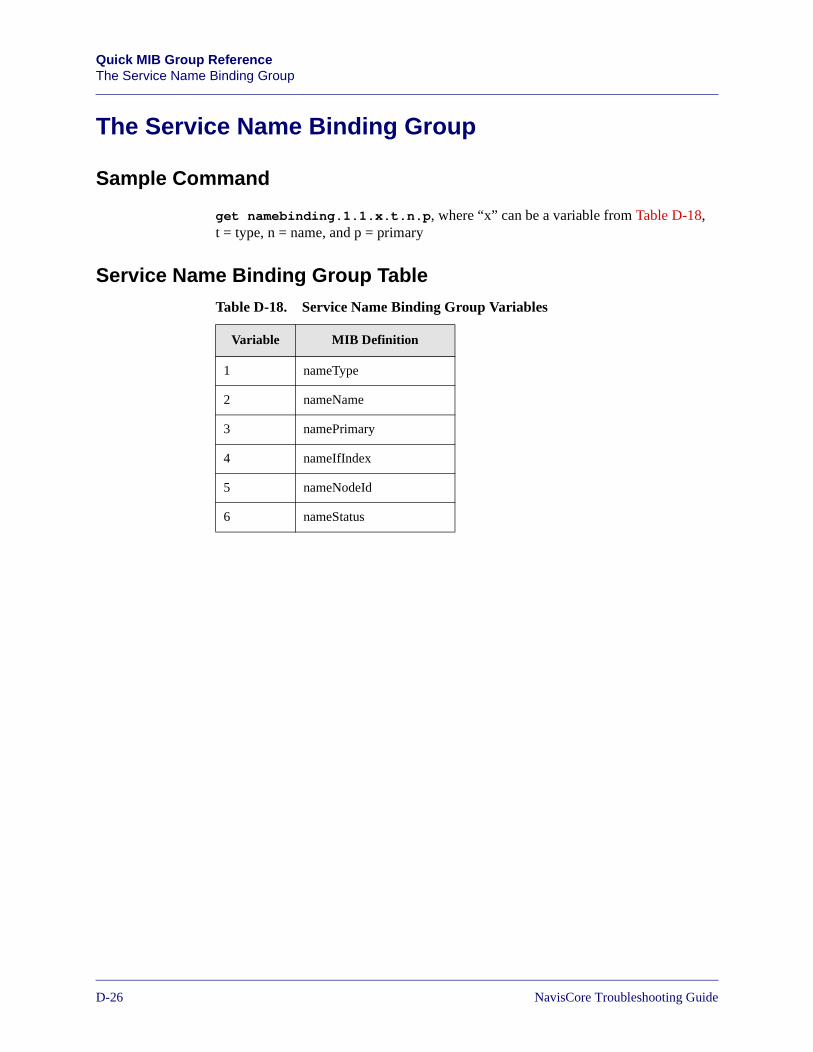
Beta Draft ConfidentialQuick MIB Group ReferenceThe Service Name Binding Group
The Service Name Binding Group
Sample Command
get namebinding.1.1.x.t.n.p, where “x” can be a variable from Table D-18, t = type, n = name, and p = primary
Service Name Binding Group Table
Table D-18. Service Name Binding Group Variables
Variable MIB Definition
1 nameType
2 nameName
3 namePrimary
4 nameIfIndex
5 nameNodeId
6 nameStatus
D-267/17/03 NavisCore Troubleshooting Guide
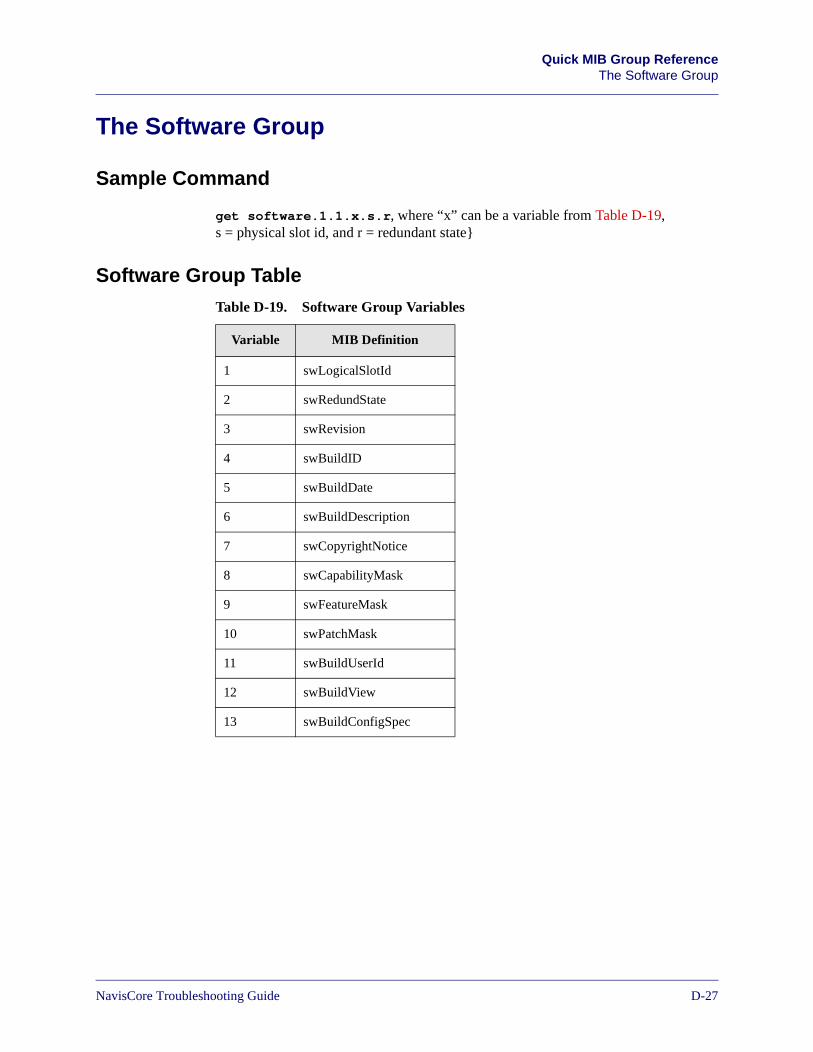
Beta Draft Confidential Quick MIB Group ReferenceThe Software Group
The Software Group
Sample Command
get software.1.1.x.s.r, where “x” can be a variable from Table D-19, s = physical slot id, and r = redundant state}
Software Group Table
Table D-19. Software Group Variables
Variable MIB Definition
1 swLogicalSlotId
2 swRedundState
3 swRevision
4 swBuildID
5 swBuildDate
6 swBuildDescription
7 swCopyrightNotice
8 swCapabilityMask
9 swFeatureMask
10 swPatchMask
11 swBuildUserId
12 swBuildView
13 swBuildConfigSpec
NavisCore Troubleshooting Guide 7/17/03D-27

Beta Draft ConfidentialQuick MIB Group ReferenceThe Software Group
D-287/17/03 NavisCore Troubleshooting Guide
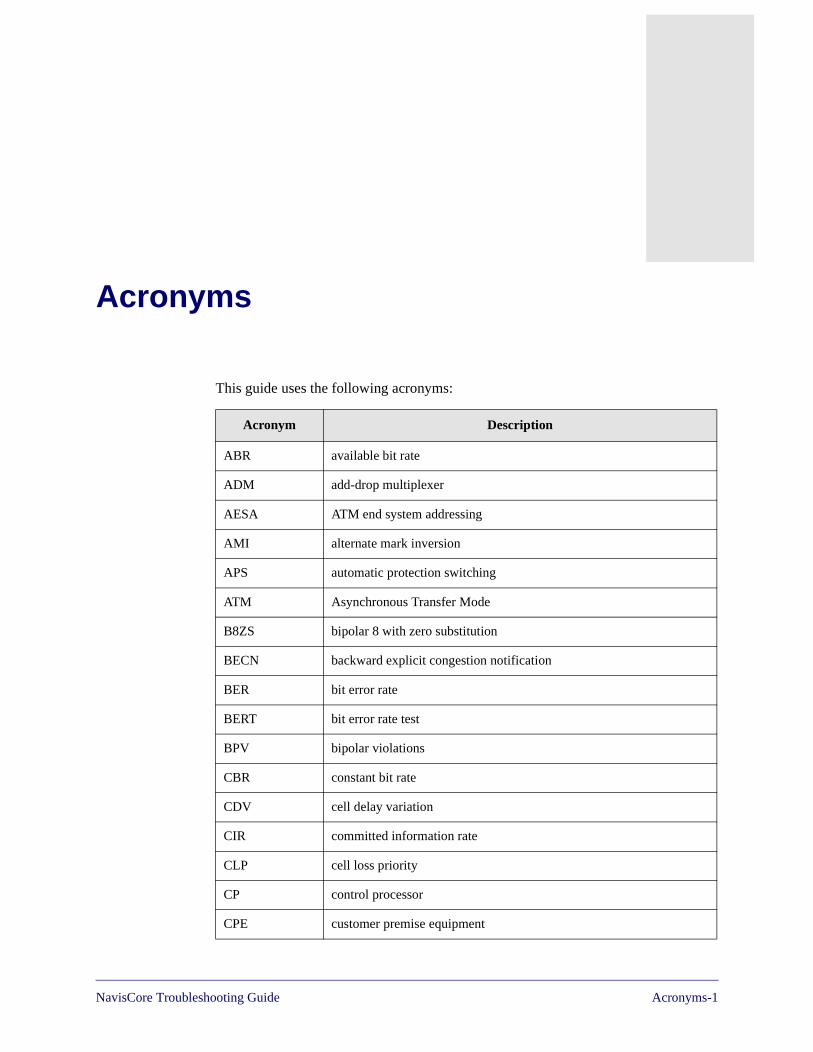
Beta Draft Confidential
Acronyms
This guide uses the following acronyms:
Acronym Description
ABR available bit rate
ADM add-drop multiplexer
AESA ATM end system addressing
AMI alternate mark inversion
APS automatic protection switching
ATM Asynchronous Transfer Mode
B8ZS bipolar 8 with zero substitution
BECN backward explicit congestion notification
BER bit error rate
BERT bit error rate test
BPV bipolar violations
CBR constant bit rate
CDV cell delay variation
CIR committed information rate
CLP cell loss priority
CP control processor
CPE customer premise equipment
NavisCore Troubleshooting Guide Acronyms-1
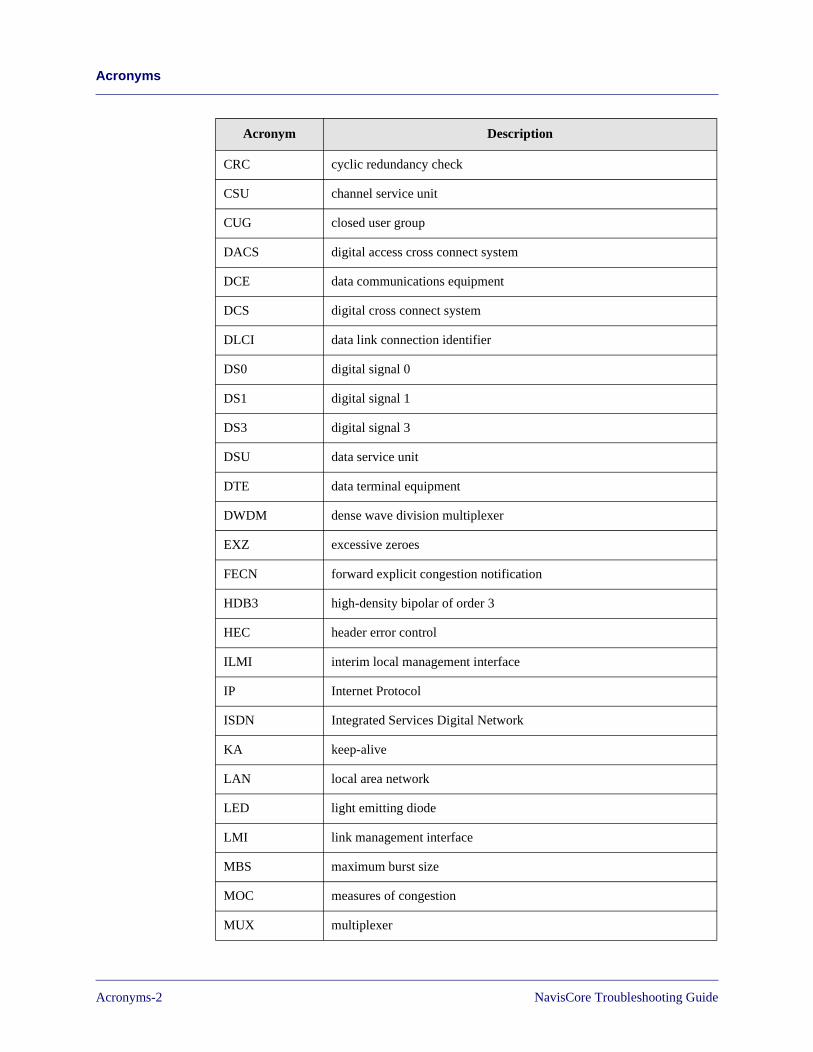
Beta Draft ConfidentialAcronyms
CRC cyclic redundancy check
CSU channel service unit
CUG closed user group
DACS digital access cross connect system
DCE data communications equipment
DCS digital cross connect system
DLCI data link connection identifier
DS0 digital signal 0
DS1 digital signal 1
DS3 digital signal 3
DSU data service unit
DTE data terminal equipment
DWDM dense wave division multiplexer
EXZ excessive zeroes
FECN forward explicit congestion notification
HDB3 high-density bipolar of order 3
HEC header error control
ILMI interim local management interface
IP Internet Protocol
ISDN Integrated Services Digital Network
KA keep-alive
LAN local area network
LED light emitting diode
LMI link management interface
MBS maximum burst size
MOC measures of congestion
MUX multiplexer
Acronym Description
Acronyms-2 NavisCore Troubleshooting Guide
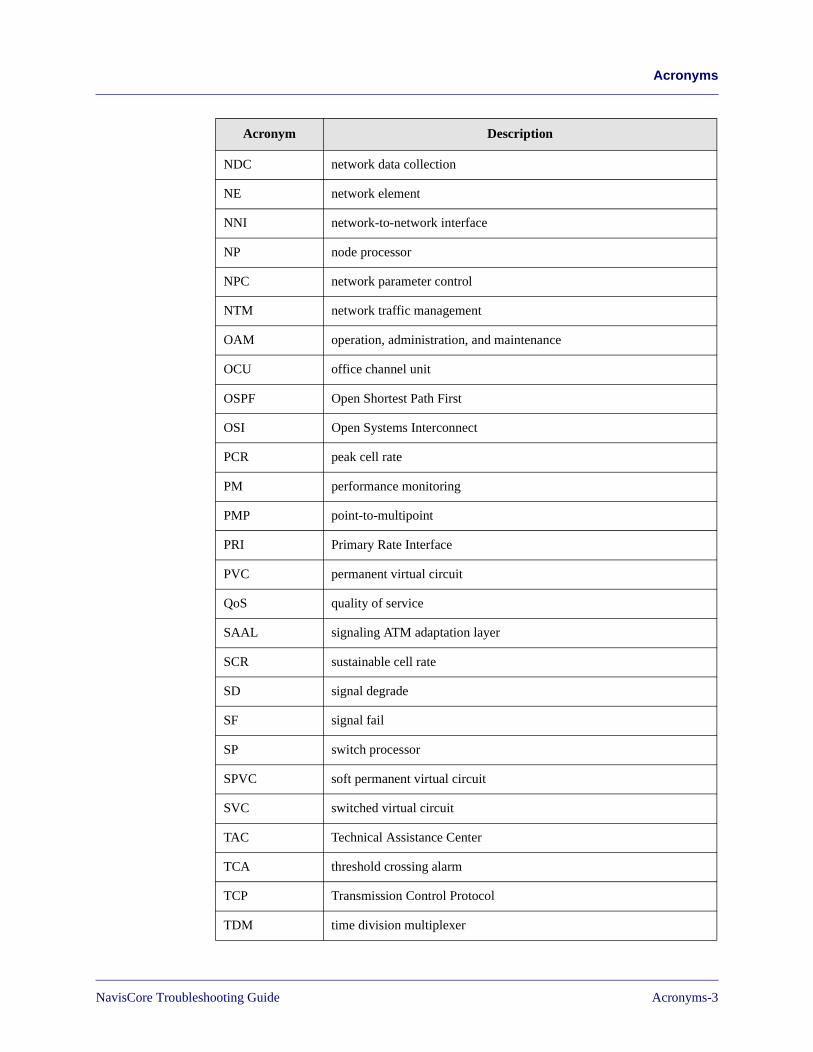
Beta Draft ConfidentialAcronyms
NDC network data collection
NE network element
NNI network-to-network interface
NP node processor
NPC network parameter control
NTM network traffic management
OAM operation, administration, and maintenance
OCU office channel unit
OSPF Open Shortest Path First
OSI Open Systems Interconnect
PCR peak cell rate
PM performance monitoring
PMP point-to-multipoint
PRI Primary Rate Interface
PVC permanent virtual circuit
QoS quality of service
SAAL signaling ATM adaptation layer
SCR sustainable cell rate
SD signal degrade
SF signal fail
SP switch processor
SPVC soft permanent virtual circuit
SVC switched virtual circuit
TAC Technical Assistance Center
TCA threshold crossing alarm
TCP Transmission Control Protocol
TDM time division multiplexer
Acronym Description
NavisCore Troubleshooting Guide Acronyms-3
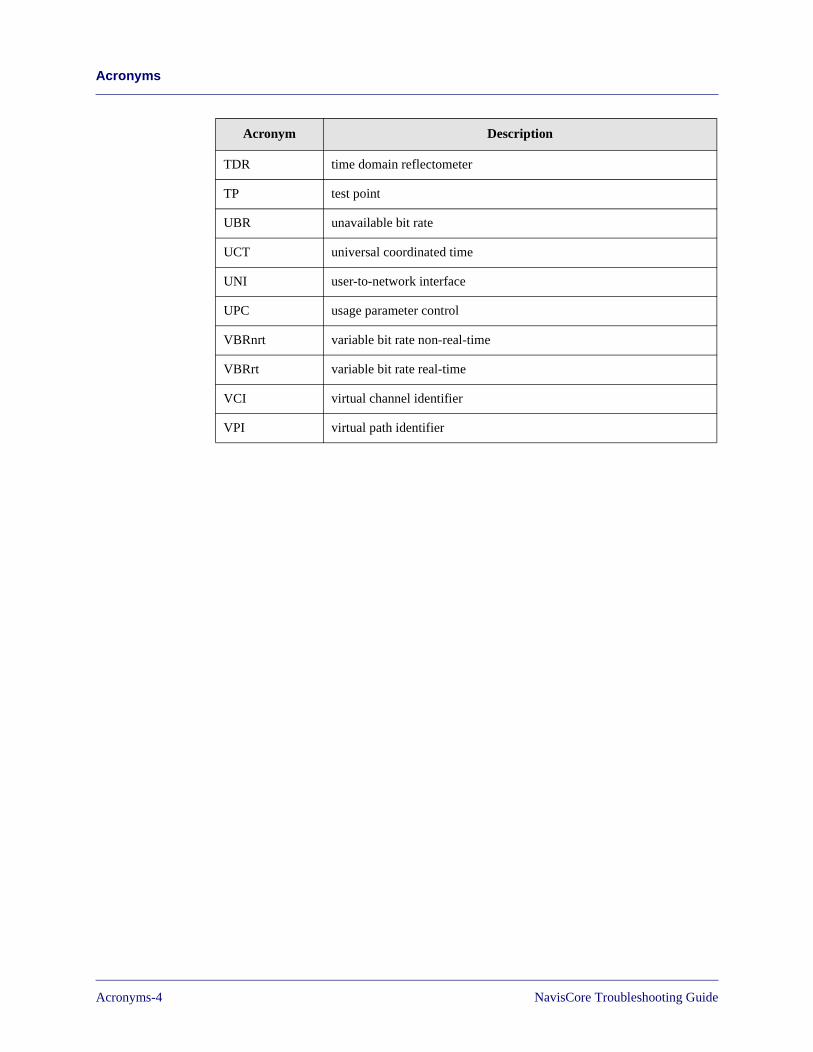
Beta Draft ConfidentialAcronyms
TDR time domain reflectometer
TP test point
UBR unavailable bit rate
UCT universal coordinated time
UNI user-to-network interface
UPC usage parameter control
VBRnrt variable bit rate non-real-time
VBRrt variable bit rate real-time
VCI virtual channel identifier
VPI virtual path identifier
Acronym Description
Acronyms-4 NavisCore Troubleshooting Guide
Beta Draft Confidential
Index
A
Access denied, 5-7Add-Drop Multiplexer (ADM), 3-10Address registration, 3-67Alarms, 2-4, 2-12, 3-5Alternate Mark Inversion (AMI), 2-7, 3-9Amber frames, 2-58ATM End System Addressing (AESA), 3-67Automatic Protection Switching (APS), 3-13
B
Backdoor Connections, 6-4Backward Explicit Congestion Notification
(BECN), 2-54Bipolar 8 with Zero Substitution (B8ZS), 2-7, 3-9Bipolar violations, 2-7, 3-9
C
Call failures, 2-67, 3-72Called Endpoint, A-1 to A-4Calling Endpoint, A-1 to A-4Changing the switch IP address, 5-19Commands
Cvlistcontained, A-4Committed Information Rate (CIR), 2-45Common installation problems, 5-3 to 5-15Common operating problems, 5-15 to 5-25
Console Commands, 1-3list of commonly used commands, B-1 to B-5show ospf names, A-3
Core file, 5-18Customer Support. See Lucent TACCvlistcontained command, A-4
D
Deleting a switch, 5-17Dense Wave Division Multiplexer (DWDM), 3-10Diagnostics
background, 2-14fatal errors, 2-14foreground, 2-15non-fatal errors, 2-14
Digital Cross-connect System (DCS), 3-10Discarded cells, 3-87Documentation
new in this guide, xxvDS3 modules
moving circuits, 5-12, 5-14DS3/1/0 modules
moving all circuits, 5-14
NavisCore Troubleshooting Guide Index-1
Index
Beta Draft Confidential
E
Encapsulation FRADone circuit supported per logical port, 5-12
Endpointsrules used to determine, A-1 to A-4
Erase Standby, 5-26 to 5-28Error 1997, 5-8Errors
30.3, 5-22for conflicting switch objects, 5-23heap, 5-20 to 5-21memory-related, 5-22on processor modules, 5-22Out of Memory Bank 9, 5-22
Eventsmonitoring, 5-17
Excessive zeroes, 2-7, 3-9
F
Far-end loopback tests, 2-18, 2-28Fatal errors, 2-14Features
general enhancements, xxvFiber optics, 3-11First-In First-Out (FIFO) Blocks
on CBX 4-Port Channelized DS3/1 and DS3/1/0 modules, 2-73 to 2-77
Forward Explicit Congestion Notification (FECN), 2-54
Forwardingconsole commands
show ip forward statistics, 4-58 to 4-69how an IP packet is forwarded, 4-56 to 4-57introduction, 4-56IP Navigator limitations, 4-3IP trace utility, 4-7 to 4-15route protocol priority, 4-57route tables, 4-56TCP/IP, 4-70
ping, 4-3 to 4-5
show tcp, 4-70 to 4-73show udp, 4-74traceroute, 4-6
troubleshooting, 4-1
G
Graceful discard, 2-57Green frames, 2-58
H
Heap Error, 5-20 to 5-21High-Density Bipolar of Order 3 (HDB3), 2-7, 3-9
I
Interim Local Management Interface (ILMI), 3-19, 3-23 to 3-25, 3-81
IPforwarding
console commandsshow ip forward statistics, 4-58 to 4-69
how an IP packet is forwarded, 4-56 to 4-57introduction, 4-56route protocol priority, 4-57route tables, 4-56
IP Navigator limitations, 4-3IP OSPF
OSPF LSAs, 4-75OSPF trunks, 2-31, 3-28, 4-75OSPF virtual links, 4-76
IP trace utility, 4-7 to 4-15TCP/IP, 4-70
ping, 4-3 to 4-5show tcp, 4-70 to 4-73show udp, 4-74traceroute, 4-6
troubleshooting, 4-1
Index-2 NavisCore Troubleshooting Guide
Index
Beta Draft Confidential
K
Keep-alives, 3-35
L
Label Switched Pathscall forwarding, 4-21call signaling, 4-20connection failure reasons, 4-49 to 4-52examining LSP data paths, 4-33 to 4-48flag characteristics, 4-54 to 4-55identifying the IP data path, 4-22introduction, 4-19LSP forwarding criteria, 4-24LSP trace utility, 4-15 to 4-18MPT LSP and point-to-point LSP commands,
4-24 to 4-25MPT LSP problem checklist, 4-29 to 4-30multicast LSPs
how a multicast LSP is created, 4-26how to identify the leaves of a multicast LSP,
4-26introduction, 4-25multicast LSP commands, 4-27 to 4-28what happens when a multicast member joins
or leaves a group, 4-26why a multicast LSP becomes inactive, 4-27
path failure reasons, 4-53terms/acronyms, 4-31 to 4-32understanding LSPs and quality of service, 4-23
to 4-24using LSPs over frame trunks, 4-23using LSPs over OPTimum cell trunks, 4-23
Leaky Bucket Algorithm, 3-87Link Management Interface (LMI), 2-21, 2-23Locked database, 5-16Log device full, 5-19Logical ports
ATM, 3-19 to 3-26changing name of, 5-18Frame Relay, 2-20 to 2-29troubleshooting, 2-20 to 2-29, 3-19 to 3-26viewing interfaces for, A-3
Loopbacksfar-end, 2-18, 2-28near-end, 2-17, 2-27OAM, 3-53PVC, 2-59
LSP. See Label Switched PathsLucent TAC
checklist, 6-2contacting, 6-1
M
Management Information Base (MIB)common commands, C-8object reference, D-1 to D-27structure, C-3using, C-1 to C-9
Manually switching to a standby card, 5-25Map Symbols
errors when deleting, 5-23Maximum Burst Size (MBS), 3-87Moving
circuits, 5-12circuits for DS3 modules, 5-12circuits for DS3/1/0 modules, 5-14PVCs, 5-12 to 5-14
N
Near-end loopback tests, 2-27Network Data Collection (NDC), 3-23, 3-39, 3-51Network Traffic Management (NTM), 3-23, 3-39,
3-51
O
Operation, Administration, and Maintenance (OAM), 3-53
NavisCore Troubleshooting Guide Index-3
Index
Beta Draft Confidential
P
Peak Cell Rate (PCR), 3-87Physical ports
ATM, 3-2 to 3-18back panel colors, 2-2 to 2-4, 3-2 to 3-5Frame Relay, 2-2 to 2-19front panel LEDs, 2-4 to 2-6, 3-5 to 3-8troubleshooting, 2-2 to 2-19, 3-2 to 3-18
PING, 1-4, 2-37, 3-36, 5-15PMP PVCs
troubleshooting, 3-59 to 3-66PMP SPVCs
troubleshooting, 3-83 to 3-85PMP SVCs
troubleshooting, 3-83 to 3-85Processor Modules
swapping, 5-26 to 5-28PVCs
ATM, 3-39 to 3-55endpoints
rules used to determine, A-1 to A-4fail reasons, 2-49, 3-48Frame Relay, 2-40 to 2-60inactive
MIB results for, 2-49, 3-48moving, 5-12 to 5-14saving connections when upgrading, 5-12 to 5-14troubleshooting, 2-40 to 2-60, 3-39 to 3-55
Q
Q.2931, 3-23Q.SAAL, 3-19Quality of Service (QoS)
ATM, 3-87classes, 3-87
R
Red frames, 2-58Redundancy
manually switching to a standby card, 5-25
S
Service Name Bindingsdetermining ID number for, A-4
SPVCstroubleshooting, 3-67 to 3-82
Statisticscontrol channel, 3-33logical port, 2-22, 3-22physical port, 2-11, 3-16PMP PVC, 3-63PVC, 2-46, 3-46SPVC, 3-78SVC, 2-71, 3-76trunk, 2-36, 3-31
Sustainable Cell Rate (SCR), 3-87Leaky Bucket Algorithm, 3-88
SVCsATM, 3-67 to 3-82Frame Relay, 2-64 to 2-72troubleshooting, 2-64 to 2-72, 3-67 to 3-82
Switchesaccessing, 6-4
Sybase Server, 5-8 to 5-10error 1997, 5-8
T
Tagged cells, 3-87Technical Assistance Center (TAC). See Lucent
TACTechnical Support Checklist, 6-2Threshold Crossing Alarm (TCA), 3-13Time Division Multiplexer (TDM), 3-10Traps
description, 1-6, 1-7logical port, 2-20, 3-19
Index-4 NavisCore Troubleshooting Guide
Index
Beta Draft Confidential
physical port, 2-8, 3-12PMP PVCs, 3-59PVC, 2-40, 3-39SPVC, 3-70SVC, 2-66, 3-70trunk, 2-33
TroubleshootingATM QoS problems, 3-86flowchart, 1-10introduction, 1-1 to 1-11logical ports, 2-20 to 2-29, 3-19 to 3-26manually switching to a Standby Card, 5-25network connectivity problems, 5-24physical ports, 2-2 to 2-19, 3-2 to 3-18PMP PVCs, 3-59 to 3-66PMP SPVCs, 3-83 to 3-85PMP SVCs, 3-83 to 3-85process, 1-4PVCs, 2-40 to 2-60, 3-39 to 3-55SPVCs, 3-67 to 3-82SVCs, 2-64 to 2-72, 3-67 to 3-82Technical Support checklist, 6-2tools, 1-3trunks, 2-31 to 2-39, 3-28 to 3-38
TrunksATM, 3-28 to 3-38Frame Relay, 2-31 to 2-39status colors, 2-32, 3-29troubleshooting, 2-31 to 2-39, 3-28 to 3-38
V
VNN OSPF. See IP OSPF
NavisCore Troubleshooting Guide Index-5

Index
Beta Draft Confidential
Index-6 NavisCore Troubleshooting Guide

wNavisCore Troubleshooting Guide
Customer Comments
Please take time to fill out this questionnaire so that we can do our best to meet your documentation needs. Then fax or e-mail your comments to our Technical Publications Dept. Your opinions are of great value to us!
FAX: (978) 692-1510 (Attn: Tech Pubs) E-MAIL: [email protected]