Embed Size (px)
Citation preview
1
Negative selection algorithm for dengue outbreak detection
Maryam Mousavi1, Azuraliza Abu Bakar
1, Suhaila Zainudin
1, Zalizah Awang
Long2, Mazrura Sahani
3, Mohammadmahdi Vakilian
1
1Centre for Artificial Intelligence Technology, Faculty of Information Science and
Technology, Universiti Kebangsaan Malaysia, 43600 Bangi, Selangor Darul
Ehsan, MALAYSIA
2Malaysia Institute of Information Technology (MIIT),Universiti Kuala Lumpur
(UNIKL) City Campus,1016 Jalan Sultan Ismail, 50250 Kuala Lumpur,
MALAYSIA
3 Faculty of Health Sciences, Universiti Kebangsaan Malaysia
[email protected], [email protected], [email protected],
[email protected], [email protected],
2
Abstract
Dengue is a critical communicable and vector borne disease and is becoming a serious
concern in Malaysia. It is important to have an early detection system that could provide
immediate action, such as the control of dengue transmission at a specific location.
However, the available strategy and action may give long-term effects to the community
since inaccurate decision making or prediction may lead to other circumstances.
Moreover, the need to have a system that can detect the outbreak in a reasonable amount
of time is critical. In this study, a nature-inspired computing technique, the Artificial
Immune System (AIS), is used for dengue outbreak detection. One of the variants of the
AIS algorithms, called the Negative Selection Algorithm (NSA), has been widely
applied in anomaly detection and fault detection. This study aims to employ the NSA
for dengue outbreak detection.
Keywords: Dengue outbreak, Artificial immune system, Negative selection algorithm
1 Introduction
In recent years, by expanding urbanization life, the number of dengue patients has
increased significantly. This disease has mostly been found in tropical climate regions,
such as Malaysia. Dengue disease is transmitted by "Aedes" mosquitoes and is also
known as "break bone fever" because it causes severe joint and muscle pain. According
to the World Health Organization (WHO), dengue disease is divided into two
categories, dengue fever (DF) and dengue hemorrhagic fever (DHF) [1]. In recent
decades, dengue outbreaks have increased considerably throughout the world.
Currently, approximately two-fifths of the world’s population is at risk of contracting
3
dengue. There are fifty million reported cases of dengue, with five hundred thousand
reported cases of DHF in the world each year [2].
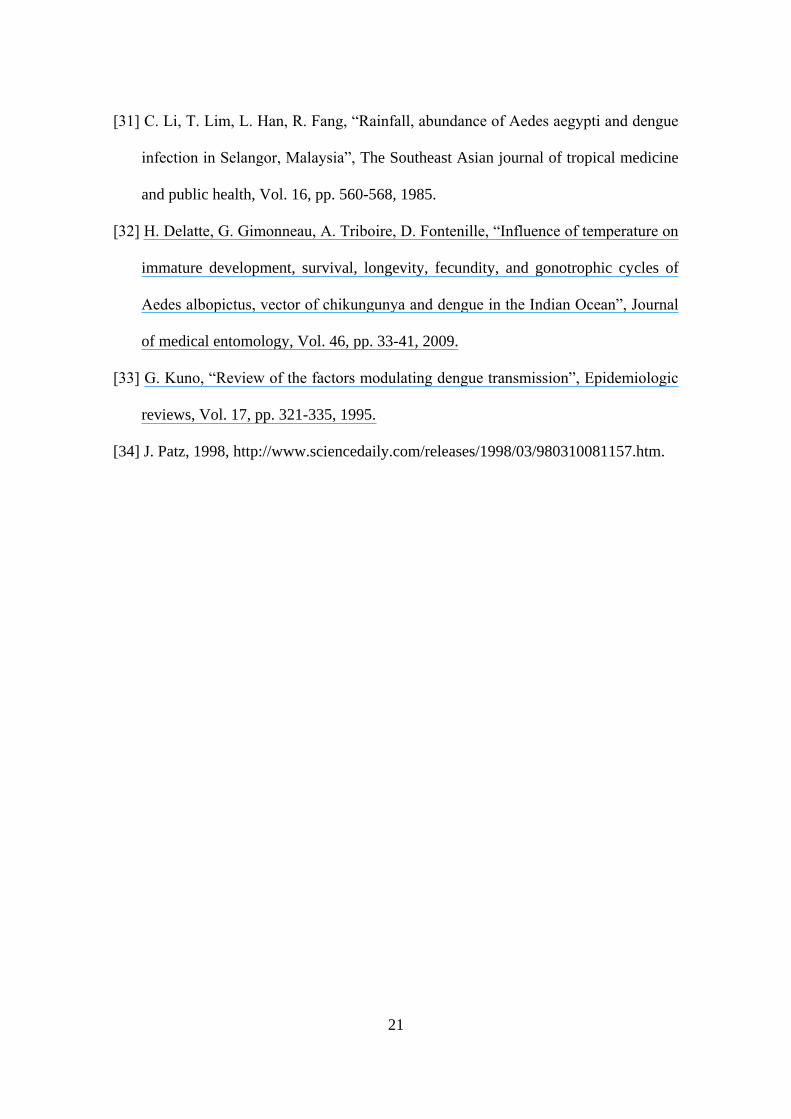
In Malaysia, the reported cases of this disease have been increasing. In 2000, a total of
31.6 cases/100,000 people were reported. Dengue has continued to be a public health
concern, with 160 cases/100,000 people reported in 2010 during a global pandemic.
This number is based on reported clinically diagnosed cases, as shown in Figure 1 [3].
Outbreak detection is closely related to the anomaly detection problem. It can be
divided into two possible tasks: a classification task and an outlier (deviation) detection
task. The outbreak detection problem can be a classification problem if the number of
cases in both the outbreak and the no-outbreak are almost balanced. Such a
classification process is necessary for determining the objects that belong in each class
according to their specific features. However, an outbreak can be treated as an outlier
detection task if the outbreak cases are rare in the dataset. This process involves finding
a rare class among the data and is usually performed with unsupervised learning. This
task is related to a clustering task. In this study, because of the availability of the dataset
with the outbreak and no-outbreak cases provided by the state public health department,
outbreak detection-based classification is employed.
The early detection of dengue outbreaks can improve the public health surveillance
system in Malaysia and can help to control epidemics and reduce the impact of dengue
outbreaks on other countries. In action against the dengue outbreak, the government has
implemented several campaigns and countermeasures. As indicated in the saying,
“Prevention is better than a cure”, having an outbreak detection program is very
important. Such a system can ensure a rapid response when an outbreak is detected.
Unfortunately, any action to counter an outbreak can be difficult to implement, and any
4
misjudgment while countering an outbreak could lead to devastating consequences.
Therefore, an adaptable detection program that is capable of reacting to the ever-
changing nature of this disease is imperative [4]. Thus, the existing outbreak data have
yet to be analyzed intelligently, to extract any discernible patterns that would provide
insight for accurately predicting future outbreaks. To achieve this end, considerable
research over the past two decades has focused on Artificial Intelligence (AI)
technology. AI technology has been proven to be a valuable predictive analytical tool
when used with a new technology known as knowledge discovery.
One of the AI approaches that has gained the attention of researchers is Artificial
Immune System (AIS). AIS was first introduced in the 1990s and is a new subdivision
of Artificial Intelligence. The inspiration for AIS comes from the inner workings of the
human immune system [5]. As quoted from De Castro, the definition of artificial
immune systems is as follows: “The Artificial Immune Systems (AIS) are adaptable
systems applicable in problem solving. They are inspired from interpretations taken
from the principles, models and immune functions of theoretical immunology” [6]. AIS
have been applied in different areas, such as pattern recognition, machine learning,
optimization, classification, clustering, and anomaly detection. The focus of this paper
is the implementation of a new model for dengue outbreak detection by using the
Negative Selection Algorithm (NSA) because of its ability to recognize self (no-
outbreak) and non-self (outbreak). The remainder of this paper is organized as follows.
Section 2 highlights the related studies regarding the dengue outbreak detection
methods, AIS algorithms and their applications. Section 3 focuses on the methodology
of this study. The presentation of the results and discussion, and concluding remarks are
presented in Sections 4 and 5 respectively.
5
2 Related Studies
Several methods are available for detecting outbreaks, comprising both statistical and
AI approaches [7-12]. An efficient outbreak detection program is imperative for
planning countermeasures to outbreaks, which can be achieved by recognizing the early
signs of such outbreaks. The process of outbreak detection is closely related to the
classification process as well as the detection of deviations in data mining.
Classification techniques can be used as an outbreak detector because of the availability
of data from previous outbreaks [13]. Buckeridge et al. suggested a practical
classification system that could be used with algorithms for detecting outbreaks, and
this system utilizes information collected during surveillance analysis [14]. Shen and
Cooper used multivariate Bayesian as an outbreak detection program to combine the
modeling of both known and unknown origins of previous outbreaks [15].
Bakar et al. used multiple classifiers to develop a predictive model for dengue outbreak
detection in terms of predicting repetitive cases. The classifiers used were decision tree,
rough classifier, associative classification and Naïve Bayes classifier [4]. The authors
obtained an average prediction accuracy of 76%. Long et al. proposed a multiple
attribute value method for dengue outbreak detection called MAV [16]. MAV is based
on frequent mining analysis, for which the calculations are based on the frequent
attribute elements within a dataset. In dengue outbreak detection, MAV is based on
Apriori concept that finds a frequent item based on the multiple attribute value of a real
data repository and generates association rules. Long et al. identified the number of
attributes to be used in outbreak detection instead of using only case counts. They
compared their work with the Cumulative sum (CUSUM). CUSUM is often used in the
detection of small changes in a process parameter that are important. CUSUM and
6
regression are frequently used as tools in detecting outbreaks within a dataset [17-18].
In this study, MAV and CUSUM will be used as comparative methods.
Dasgupta categorized AIS algorithms into two main categories: population-based
algorithms and network-based algorithms. Population-based algorithms apply negative
selection and clonal selection theory, while network-based algorithms apply the concept
of immune network theory [19]. One of the reasons to apply AIS rather than other
algorithms is that it needs only positive examples, and the patterns learnt can be clearly
examined. Furthermore, AIS does not need a considerable number of parameters for the
system because it is a self-organizing algorithm [20].The Negative Selection Algorithm
(NSA) is one of the earliest methods in AIS that has been widely applied in anomaly
detection and fault detection problems. This algorithm was proposed by Forrest et al.
and is inspired from immune system mechanisms. NSA is based on T cells. T cells can
recognize self from non-self cells, where the self and non-self cells are considered to be
the body and pathogens, respectively. This algorithm is based on the idea of generating
a set of detectors that are capable of detecting anomalies [21].
A successful algorithm, known as the negative selection algorithm, is commonly used to
detect changes and anomalies. This algorithm is a supervised learning algorithm-based
population. After the emergence of AIS, the NSA has increasingly found its way in the
classification process, and the result is a system that inherits the constructive features of
the biological immune system [22]. According to [23], the negative selection algorithm
has been widely applied in anomaly detection and fault detection applications by using
self and non-self recognition. Bendiab proposed a method based on the negative
selection algorithm for skin detection and classification to recognize skin pixels from
non-skin pixels in images [22]. Gonzalez et al. proposed a new method for performing
7
anomaly detection by combining the negative selection algorithm and a classification
algorithm [24]. Another proposed algorithm in [25] uses the negative selection
algorithm for fault detection. It was applied in a fault model of DC motors and was
compared with other fault detection algorithms. This comparison showed that the
proposed algorithm is a suitable algorithm and that method is a promising solution for
fault detection. In 2010, Yue et al. designed a new fault detection model based on NSA
to eliminate the disadvantages of conventional fault detection techniques. These authors
could increase the detection accuracy by using a sufficient number of training samples
[26].
From the above discussion on the NSA and from the definition of an outbreak, we
intend to employ this AIS-based algorithm for disease outbreak detection. To date, the
work on NSA in disease and surveillance problem is yet to be available in this research
area.
3 Methodology
This study consists of three main phases. The first phase is the preliminary study of the
dengue outbreak detection problem, which includes the identifying the problem and the
data preparation steps. The second phase is the implementation of the NSA. This phase
consists of several important steps of the algorithm. The third phase involves testing and
evaluation to measures the performance of the NSA compared to two other methods, as
determined by the detection rate and the false alarm rate. The comparative study
includes the evaluation of the obtained results compared with the previous techniques
used on the same dataset.
8
3.1 PHASE I: Problem Identification and Data Preparation
Dengue is one of the most common diseases in Malaysia. Because there is no vaccine
against the dengue virus, the mortality rate associated with the disease is high,
especially for children, and because of the lack of suitable treatment, the dengue
mortality rate will continue to increase [2]. The early detection of a dengue outbreak can
improve public health surveillance systems in Malaysia and can help to control
epidemics and reduce their impact on other countries. Unfortunately, there is not
sufficient discussion about suitable models for detecting dengue outbreaks in Malaysia.
The data that is relevant to this task was obtained from the Public Health Department,
Negeri Sembilan, one of the states in Malaysia. We presented our proposed work to a
team of public health officers, and a series of meetings were conducted to define the
dengue outbreak problem. It is important to have a detection model that can better
detect the spread of a dengue outbreak. The purpose of this research is the use of the
negative selection algorithm as an outbreak detection model to obtain high performance
in the detection rate.
i. Data Collection and Preprocessing
The dataset was collected from a study on dengue fever conducted by the Vector
Control Unit of the Hulu Langat District Health Centre, Selangor State, Malaysia. Data
on a total of 8505 dengue patients were collected from 2003 to 2009. The original
dataset contains 134 attributes, including the demographic and clinical data. The
attribute selection for this study was performed by consulting with public health officers
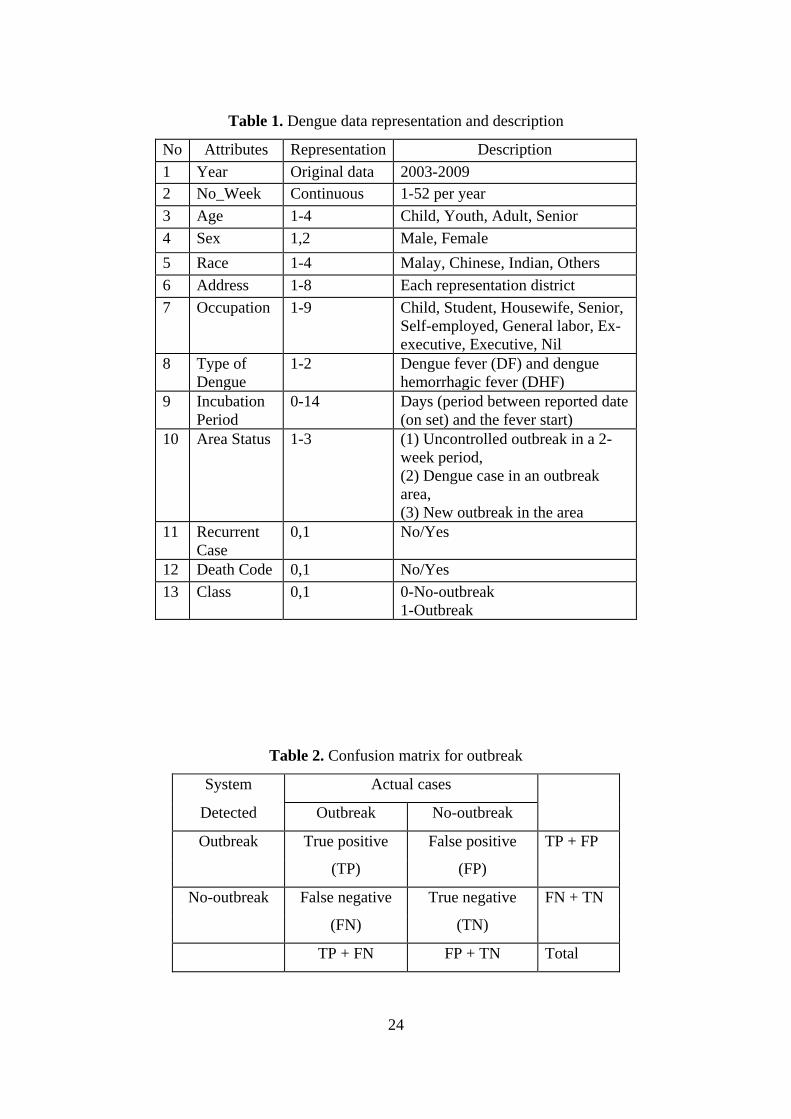
and environmental and epidemiology experts. Table 1 shows that the selected dataset
consists of 12 attributes, including the year, the number of weeks (no_week), the age,
sex, race, address, occupation, type of dengue, incubation period, area status, recurrent
9
cases, death code and one class attribute (outbreak/no-outbreak). These attributes were
used in previous research [4,16]. This data is the real dataset; thus, the preprocessing
steps for cleaning, data transformation and data reduction are handled with care to
ensure that the authenticity of the data is retained. Then, the data was prepared to suit
the NSA for dengue outbreak detection.
ii. Determining the Class Attribute
We determined the class attribute for the outbreak and no-outbreak cases following the
given outbreak definition. A dengue outbreak is defined as an occurrence of more than
one case in the same locality, where the date of onset between the cases is less than 14
days. The outbreak is cleared when no new cases have been reported within 14 days
[27].
In this problem, two classes are identified; the outbreak class and the no-outbreak class.
Data classification was conducted according to the definition of a dengue outbreak, for
example, in week 4 and week 5 of 2008, the numbers of dengue cases were 49 and 57,
respectively. Next, to determine the outbreak class for week 6, with 62 dengue cases,
the mean of the number of cases related to weeks 4 and 5 must be calculated. Because
the number of cases in week 6 is larger than the mean of the two previous weeks (62 >
53), this week is classified as an outbreak, which means that new cases were reported
within 14 days.
3.2 PHASE II: Implementation of Algorithm
The negative selection algorithm has two phases: i) the generation phase and ii) the
detection phase. These two phases are described in the following sections.
10
i. Generation Phase
Detector sets are typically created during this phase through several random processes.
As depicted in Figure 2, the matched self samples are removed during the generation
stage, and samples that do not match become the detectors.
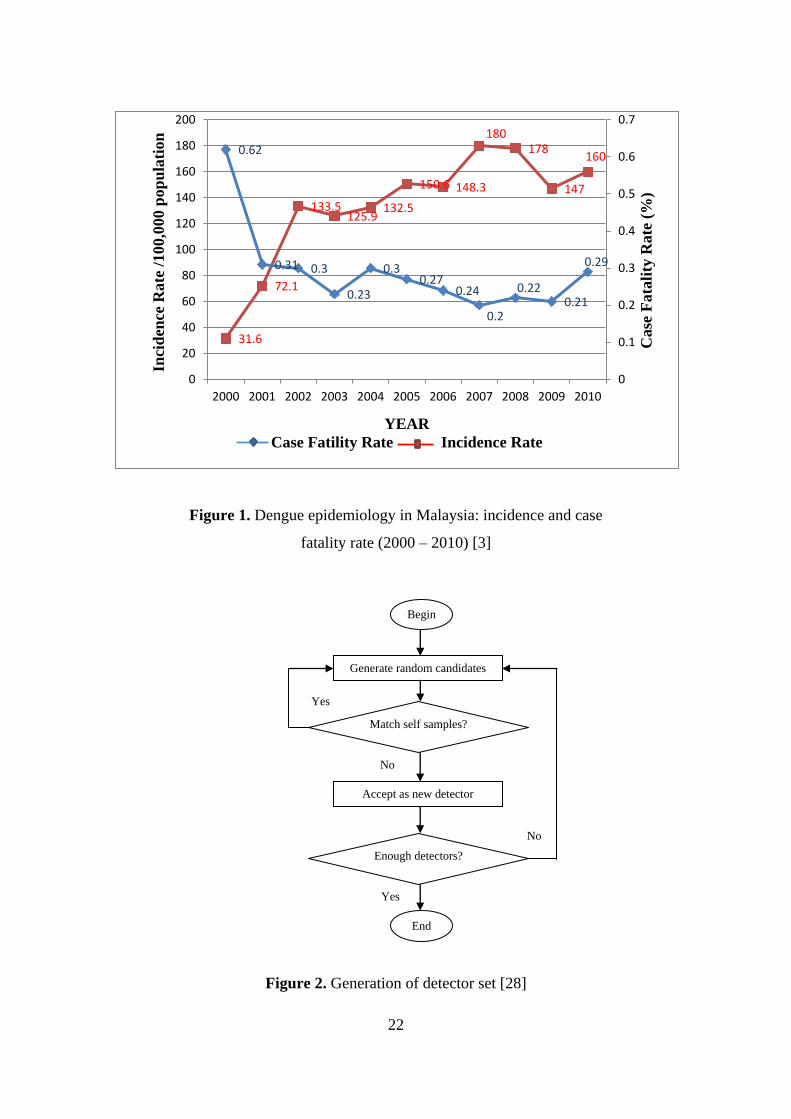
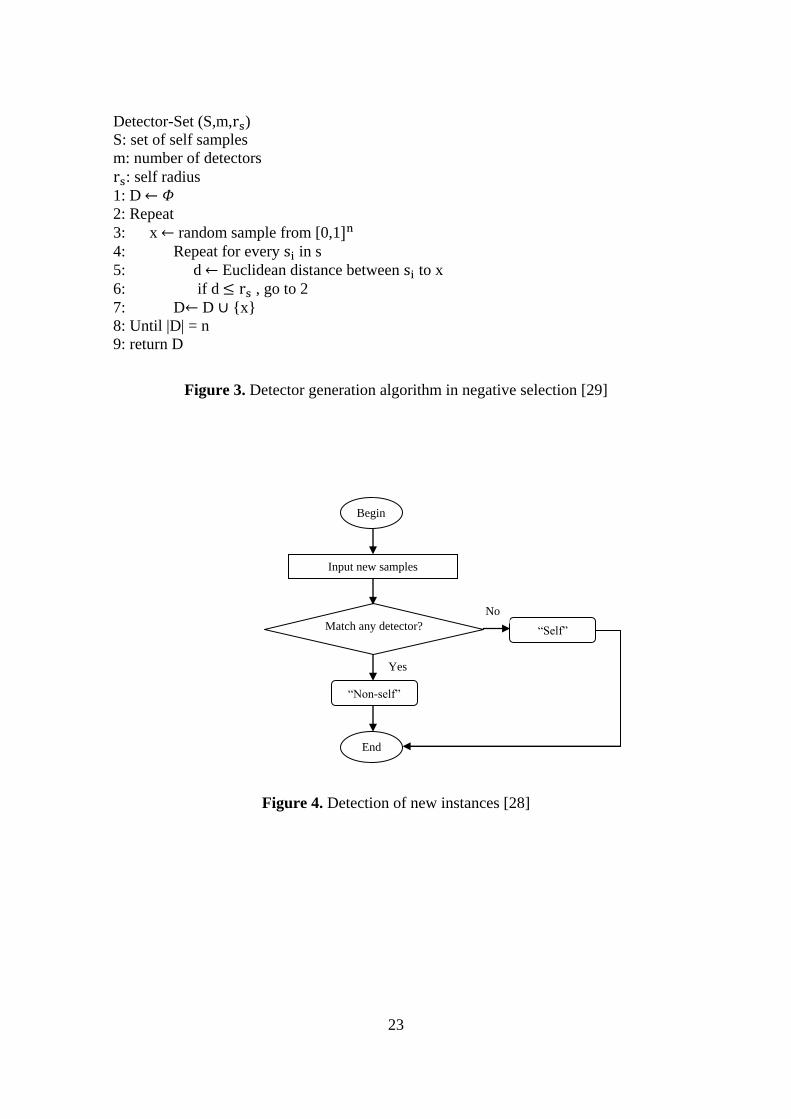
Figure 3 presents the pseudocode inventory of the process of generating detectors for
the NSA.
During the experiment, a real-valued vector dataset for dengue outbreak is used. Thus,
in an n-dimensional space, the detector or self set (a set of real-valued data) is in the
form of a hyper-sphere. Min-max normalization is applied to this type of data. When
working with the negative selection algorithm, its real-valued data should be normalized
to super-rectangular space [0,1]n with n representing the number of attributes.
As previously stated, the initial phase in the negative selection algorithm involves
creating detectors through random processes and then testing to determine whether they
match any self samples. Self samples can be considered as the standard (normal)
behavior of the data in the first phase. Another component of a NSA is the matching
rule, where it characterizes the difference between matched data to be removed and non-
matched data that are suitable to be detectors. The matching rule relies on the
representation format of the data and the detectors. For the NSA with real-valued data,
its matching rule is the Euclidean distance (d). Euclidean distance represents the
distance between the random detectors and the self samples in the first phase. The
distance between a candidate detector and the self samples must be compared with the
self radius (rs). In this case, if a match occurs (d ≤ rs) then that detector is removed.
Through this process, the detectors are generated until the required allocation is filled.
11
ii. Detection Phase
After the first phase, the created detector set is applied to detect new samples, whether
they are self or non-self. The matched samples with the detectors are accepted as
anomaly or non-self; otherwise, they are considered as self. Figure 4 shows the second
phase process.
In the second phase, the inputs are detectors that were generated in the first phase and
test data (unseen data), which must be compared with each other by using the Euclidean
distance as the matching rule, to determine whether there is a match between them. If a
match is found, then the test data is recognized as non-self otherwise, the test data is
self. In this research, self and non-self represent no-outbreak and outbreak, respectively.
3.3 PHASE III: Testing and Evaluation
Because the NSA is a supervised learning algorithm, a confusion matrix, which is a
specific table arrangement, was employed. This matrix provides a visualized
representation of the NSA performance. The columns in the table represent the values in
the actual class, and the rows represent the values in the predicted class. Data from this
matrix were applied to analyze the performance of the NSA. Table 2 shows a confusion
matrix constructed for the dengue outbreak.
Well-accepted metrics that are used to describe the performance of the NSA include the
detection rate and the false alarm rate, which can be calculated from values obtained
from the confusion matrix using Eq. (1) and Eq. (2) below, respectively.
Detection rate (DR) = TP / (TP + FN) (1)
False alarm rate (FR) = FP / (TN + FP) (2)
12
where
TP: outbreak elements that are detected as outbreak;
TN: no-outbreak elements that are detected as no-outbreak;
FP: no-outbreak elements that are detected as outbreak;
FN: outbreak elements that are detected as no-outbreak.
Therefore, the accuracy can be calculated by using the formula in Eq. (3):
Accuracy = (TP + TN) / (TP + TN + FP + FN) (3)
4 Experiments
The experiment is conducted in several phases to test the reliability of the dataset when
presented to the NSA. Using the original dataset obtained from the work by [4,16], the
NSA fails to detect the outbreak with a high detection rate because some correlation
exists between the conditional attributes and the class attribute (outbreak). The initial
results showed that there is no logical relationship between some attributes (e.g., the
gender) and the outbreak class. Therefore, feature selection is performed to increase the
detection rate. We perform a simple forward selection algorithm to determine the set of
attributes that give a high detection rate. The result is that the attributes that achieve a
more accurate detection rate are the Year and the Number of Weeks.
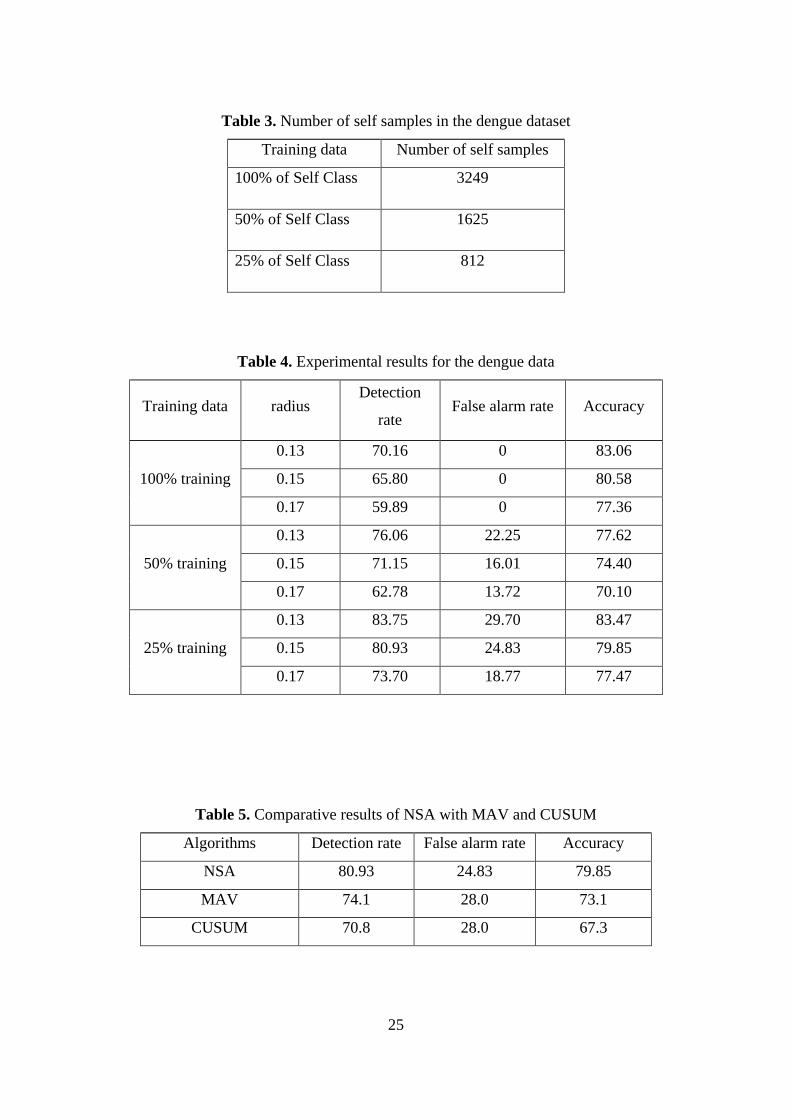
In the experiment, 100% of the no-outbreak (normal) class data are used as a complete
training set, and then, 50% and 25% of the elements are taken randomly from the no-
outbreak class as a partial training set that are used to train the system. The number of
self samples used is shown in Table 3. All of the elements in the dataset must be
classified as either outbreak or no-outbreak in test phase. In our experiments, the
13
maximum detector set size is set at 50000. For each method, we repeat each run 100
times, and then, averages are taken.
4.1 Results
The experimental results with different radiuses are depicted in Table 4. To demonstrate
which result is the optimal, the minimum error must be calculated. The minimum error
is defined as in Eq.(4), where di is the detection rate and fi is the false alarm rate.
minimum error = min (1 - (di - fi )) , for every i (4)
The best balance between the detection rate and the false alarm rate occurs when the
amount of this error is at a minimum [30]. As shown in Table 4, when all of the values
of the self class were used as training data, false alarms did not occur (FR=0), and the
detection rates were less than the cases trained by the partial training data. Therefore, to
achieve the best balance between the detection rate and the false alarm rate, the
minimum error must be calculated when only partial training data (i.e., 50% and 25% of
the self class from the dengue data) are used to train the classifiers.
The purpose of using partial self data as training data is to demonstrate the capability of
the system to recognize unknown no-outbreak data. As illustrated in Table 4, the
minimum error was obtained for 50% of the training data with rs = 0.15, where the
detection rate and the false alarm rate are 71.15 and 16.01, respectively; additionally,
for 25% of the training data, the minimum error was obtained with rs = 0.15, where the
detection rate and the false alarm rate are 80.93 and 24.83, respectively. In conclusion,
these results show that the classification experiment using 25% of the self data produces
better detection of the dengue outbreak compared to the other experiments.
Our experimental results are compared with two other existing methods on the same
dataset, namely, the MAV [16] and the CUSUM [17-18], which are discussed in related
14
works. Long et al. applied MAV to the dengue data and then compared their results with
CUSUM, which is a statistical technique [16]. Table 5 shows the comparison of NSA
with these two techniques.
As shown in Table 5, the NSA method outperforms the two other techniques in terms of
the detection rate, the false alarm rate and accuracy. NSA achieved higher accuracy, a
higher detection rate and a lower false alarm rate compared to the other two techniques.
NSA is based on the reduced features because the initial experiments indicate some
non-logical relationship in the original sets. Therefore, the detection rate is higher than
MAV and CUSUM because of its reduced features.
We presented the results obtained to a group of experts in Vector Disease from the
Public Health Department, Seremban, Negeri Sembilan, Malaysia, and they confirmed
that the finding is meaningful because the year and week play important roles in the
Aedes mosquito’s lifecycle. In addition, the behavior of the NSA and the representation
of the data also contribute to the reason why it works well with these reduced features.
Therefore, the features that were used are the most significant features for the dengue
outbreak problem.
4.2 Discussion of the Results
The experimental results showed that the NSA performs better than the two other
methods that used the same dataset. However, the high detection rate of NSA is based
on the reduced attributes that are utilized, after several runs of the NSA are performed.
The performance of the NSA toward the original data indicates some limitation in the
representation of the data used. The NSA was not able to provide accurate detection
with the original dataset for the following reasons:
15
(i) The NSA detectors for outlier detection were obtained from a set of normal data. In
the detector generation phase, the candidate detectors must be different in terms of their
characteristics, or the similarity distance must be sufficiently distinct from the normal
dataset. During detection, the data (cases) are compared, each of them with the detectors
that are generated in the generation phase. If the cases match, then they are considered
to be outliers.
(ii) For the dengue outbreak detection case, the values of the dengue patients visiting
inside and outside the outbreak week are almost similar, i.e., there is no significant
variation in both of the conditions. Therefore, it is difficult for the NSA to detect the
rare cases (the potential outbreaks) because NSA is an instant-based method. However,
if the data contain more distinct values in most of the parameters, then the detection can
be improved. For this reason, in this study, NSA detects, with a generalized model
based on the year and week, because these attributes present a large range of values
whereas the other attributes are categorical data.
5 Conclusions and Future Work
In this study, for the first time the NSA is applied to solve dengue outbreak detection
problem. Dengue fever is one of the most common diseases in Malaysia, with a high
mortality rate, especially in children. Therefore, the need to have a system that can
detect a dengue outbreak in a reasonable amount of time is critical. The NSA has been
widely applied in anomaly detection, but to date, the algorithm has not been used for
dengue outbreak detection. The work presented here shows the potential and effective
use of the Immune System-based method for outbreak detection. With a higher
detection rate and a lower false alarm rate compared with other available methods, the
results of this study can help to build the public health surveillance system in Malaysia
16
to facilitate early detection of dengue outbreaks and can help to control epidemics and
reduce the impact of such epidemics on other countries.
Several issues can be addressed to improve the current work.
i. Because the NSA works better with the reduced attributes, the NSA could
improve the generalized model in terms of the availability of an accurate dataset
that is crucial for improving the NSA model. Therefore, additional important
features are required.
ii. In the negative selection algorithm, the number of detectors and the self radius
are critical parameters to obtain a balance between the detection rate and the
false alarm rate, but because there is no available literature that discusses the
appropriate self radius, different values for this parameter must be examined to
determine the proper self radius that achieve the best result with the minimum
error. This issue can be investigated in future work on this method.
iii. Most of the parameters in the dengue data are categorical. Therefore, when NSA
attempts to discriminate between the self and non-self class, the task becomes
difficult. The new representation of the data and the computation of the distance
values are essential to improve the algorithm.
iv. The transmission of dengue is closely related to the local climate. After bouts of
rain, pools of stagnant water provide ample breeding sites for mosquitoes [31].
A warm and ambient temperature is conducive to the mosquito’s gonotrophic
life cycle [32-34]. Combining the available dataset, which was obtained from the
Public Health Department, with several additional suggested features, such as
rainfall, humidity and temperature, might improve the accuracy and
interpretability of the model.
17
Acknowledgement
This work is supported by the Exploratory Research Grant Scheme
(ERGS/1/2011/STG/UKM/02/49) Ministry of Higher Learning, Malaysia. We would
like to express our gratitude to our research team from UKM, Dr. Zainudin Mohd Ali
from the Public Health Department, Ministry of Health, and Assoc. Prof. Dr. Hidayatul
Fathi (Entomologist) from the Faculty of Health Sciences, UKM.
REFERENCES
[1] T. Faisal, F. Ibrahim, M. N. Taib, “A noninvasive intelligent approach for predicting
the risk in dengue patients”, Expert Systems with Applications,Vol. 37, pp. 2175-
2181, 2010.
[2] WHO, “Dengue and Dengue Haemorrhagic Fevers”, WHO Fact Sheet 117, 2012,
http://www.who.int/mediacentre/factsheets/fs117/en/index.html.
[3] L. Hakim, “Tropical Diseases in Malaysia: Situational Analysis”, 2010,
www.akademisains.gov.my/download/tropical/Lokman.pdf.
[4] A. A. Bakar, Z. Kefli, S. Abdullah, M. Sahani, “Predictive models for dengue
outbreak using multiple rulebase classifiers”, in Electrical Engineering and
Informatics (ICEEI), 2011 International Conference on, 17-19 July 2011, pp. 1-6,
2011.
[5] M. B. Abdul Hamid, T. K. Abdul Rahman, “Short Term Load Forecasting Using an
Artificial Neural Network Trained by Artificial Immune System Learning
Algorithm”, in Computer Modelling and Simulation (UKSim), 12th International
Conference on, 24-26 March 2010, pp. 408-413, 2010.
18
[6] L. N. De Castro, J. Timmis, Artificial immune systems: a new computational
intelligence approach, Springer Verlag, 2002.
[7] A. Er, M. Rosli, A. Asmahani, M. Mohamad Naim, M. Harsuzilawati, “Spatial
Mapping of Dengue Incidence: A Case Study in Hulu Langat District, Selangor,
Malaysia”, International Journal of Human and Social Sciene, Vol. 15, pp. 410-414,
2010.
[8] J. Gubler, “Epidemic Dengue/Dengue Haemorrhagic Fever: A Global Public Health
Problem in the 21st Century”, Dengue Bulletin, Vol. 21, pp.1–120, 1997.
[9] N. A. Husin, Back propagation neural network and non-linear regression models for
dengue outbreak prediction, Universiti Teknologi Malaysia, Faculty of Computer
Science and Information System.2008.
[10] R. Muto, “Summary of dengue situation in WHO Western Pacific Region”,
Dengue Bulletin, Vol. 22, pp.12-19, 1998.
[11] S. Poovaneswari, “Dengue situation in Malaysia”, Malaysian Journal of Pathology,
Vol.15, pp. 3-7, 1993.
[12] A. K. Teng, S. Singh, “Epidemiology and new initiatives in the prevention and
control of dengue in Malaysia”, Dengue Bulletin, Vol. 25, pp. 7-14, 2001.
[13] A. A. Bakar, N. Idris, A.R. Hamdan, Z. Othman, M. Z. A. Nazari, S. Zainudin,
“Classification models for outbreak detection in oil and gas pollution area”, in
Electrical Engineering and Informatics (ICEEI), 2011 International Conference on,
17-19 July, pp. 1-6, 2011.
[14] D. L. Buckeridge, H. Burkom, M. Campbell, W.R. Hogan, A. W. Moore, A. P.
Bio, “Algorithms for rapid outbreak detection: a research synthesis”, Journal of
Biomedical Informatics, Vol. 38, pp. 99-113, 2005.
19
[15] Y. Shen, G. F. Cooper, “Multivariate Bayesian modeling of known and unknown
causes of events-An application to biosurveillance”, Computer Methods and
Programs in Biomedicine, 2010.
[16] Z. Long, A. A. Bakar, A. R. Hamdan, M. Sahani, “Multiple attribute frequent
mining-based for dengue outbreak”, Advanced Data Mining and Applications, pp.
489-496, 2010.
[17] G. Shmueli, “Current and Potential Statistical Methods for Anomaly Detection in
Modern Time Series Data: The Case of Biosurveillance”, Data Mining Methods for
Anomaly Detection, pp. 75, 2005.
[18] R. Watkins, S. Eagleson, B. Veenendaal, G. Wright, A. Plant, “Applying cusum-
based methods for the detection of outbreaks of Ross River virus disease in
Western Australia”, Bmc Medical Informatics and Decision Making, Vol. 8, pp. 37,
2008.
[19] D. Dasgupta, “Advances in artificial immune systems”, Computational Intelligence
Magazine, IEEE, Vol. 1, pp. 40-49, 2006.
[20] U. Aickelin, “Artificial immune systems (AIS)-A new paradigm for heuristic
decision making”, Computing Research Repository, 2008.
[21] S. Forrest, A. S. Perelson, L. Allen, R. Cherukuri, “Self-nonself discrimination in a
computer”, in Research in Security and Privacy, IEEE Computer Society
Symposium on, 16-18 May, pp. 202-212, 1994.
[22] E. Bendiab, M. K. Kholladi, “The Negative Selection Algorithm: a Supervised
Learning Approach for Skin Detection and Classification”, IJCSNS, Vol. 10, pp.
86-92, 2010.
20
[23] J. R. Al-Enezi, M. F. Abbod, S. Al-Sharhan, “ Advancement in Artificial Immune
Systems: A perspective of models, algorithms and applications”, in GCC
Conference & Exhibition, 5th IEEE, 17-19 March, pp. 1-6, 2009.
[24] F. Gonzalez, D. Dasgupta, R. Kozma, “Combining negative selection and
classification techniques for anomaly detection”, in Evolutionary Computation,
CEC '02. Proceedings of the 2002 Congress on, 12-17 May, pp. 705-710, 2002.
[25] C. A. Laurentys, G. Ronacher, R. M. Palhares, W. M. Caminhas, “Design of an
Artificial Immune System for fault detection: A Negative Selection Approach”,
Expert Systems with Applications, Vol. 37, pp. 5507-5513, 2010.
[26] X. Yue, D. Wen, H. Ma, J. Zhang, “Fault detection based on real-value negative
selection algorithm of Artificial Immune System”, Proc. Intelligent Computing and
Cognitive Informatics (ICICCI), International Conference, pp. 243-246, 2010.
[27] S. B. Seng, A. K. Chong, A. Moore , “Geostatistical modelling, analysis and
mapping of epidemiology of Dengue Fever in Johor State, Malaysia”, 2005.
[28] Z. Ji, D. Dasgupta, “Revisiting negative selection algorithms”, Evolutionary
Computation, Vol. 15, pp. 223-251, 2007.
[29] Z. Ji, D. Dasgupta, “Real-valued negative selection algorithm with variable-sized
detectors”, in Genetic and Evolutionary Computation - Gecco 2004, Pt 1,
Proceedings,Lecture Notes in Computer Science, Vol. 3102, pp. 287-298, 2004.
[30] T. Stibor, P. Mohr, J. Timmis, “Is negative selection appropriate for anomaly
detection ?”, GECCO 2005: Genetic and Evolutionary Computation Conference,
Vols1 and 2, 2005.
21
[31] C. Li, T. Lim, L. Han, R. Fang, “Rainfall, abundance of Aedes aegypti and dengue
infection in Selangor, Malaysia”, The Southeast Asian journal of tropical medicine
and public health, Vol. 16, pp. 560-568, 1985.
[32] H. Delatte, G. Gimonneau, A. Triboire, D. Fontenille, “Influence of temperature on
immature development, survival, longevity, fecundity, and gonotrophic cycles of
Aedes albopictus, vector of chikungunya and dengue in the Indian Ocean”, Journal
of medical entomology, Vol. 46, pp. 33-41, 2009.
[33] G. Kuno, “Review of the factors modulating dengue transmission”, Epidemiologic
reviews, Vol. 17, pp. 321-335, 1995.
[34] J. Patz, 1998, http://www.sciencedaily.com/releases/1998/03/980310081157.htm.
22
Figure 1. Dengue epidemiology in Malaysia: incidence and case
fatality rate (2000 – 2010) [3]
Figure 2. Generation of detector set [28]
31.6
72.1
133.5 125.9
132.5
150.6 148.3
180 178
147
160 0.62
0.31 0.3
0.23
0.3 0.27
0.24
0.2
0.22 0.21
0.29
0
0.1
0.2
0.3
0.4
0.5
0.6
0.7
0
20
40
60
80
100
120
140
160
180
200
2000 2001 2002 2003 2004 2005 2006 2007 2008 2009 2010
Inci
den
ce R
ate
/100,0
00 p
op
ula
tion
Case
Fata
lity
Rate
(%
)
YEAR
Case Fatility Rate Incidence Rate
Generate random candidates
Accept as new detector
End
Match self samples?
Enough detectors?
Yes
Yes
No
No
Begin
23
Detector-Set (S,m, )
S: set of self samples
m: number of detectors
: self radius
1: D
2: Repeat
3: x random sample from [0,1
4: Repeat for every in s
5: d Euclidean distance between to x
6: if d , go to 2
7: D D {x}
8: Until |D| = n
9: return D
Figure 3. Detector generation algorithm in negative selection [29]
Figure 4. Detection of new instances [28]
Input new samples
Match any detector?
“Non-self”
End
“Self”
Yes
No
Begin
24
Table 1. Dengue data representation and description
No Attributes Representation Description
1 Year Original data 2003-2009
2 No_Week Continuous 1-52 per year
3 Age 1-4 Child, Youth, Adult, Senior
4 Sex 1,2 Male, Female
5 Race 1-4 Malay, Chinese, Indian, Others
6 Address 1-8 Each representation district
7 Occupation 1-9
Child, Student, Housewife, Senior,
Self-employed, General labor, Ex-
executive, Executive, Nil
8 Type of
Dengue
1-2 Dengue fever (DF) and dengue
hemorrhagic fever (DHF)
9 Incubation
Period
0-14 Days (period between reported date
(on set) and the fever start)
10 Area Status 1-3
(1) Uncontrolled outbreak in a 2-
week period,
(2) Dengue case in an outbreak
area,
(3) New outbreak in the area
11 Recurrent
Case
0,1 No/Yes
12 Death Code 0,1 No/Yes
13 Class 0,1 0-No-outbreak
1-Outbreak
Table 2. Confusion matrix for outbreak
System Actual cases
Detected Outbreak No-outbreak
Outbreak True positive False positive TP + FP
(TP) (FP)
No-outbreak False negative True negative FN + TN
(FN) (TN)
TP + FN FP + TN Total
25
Table 3. Number of self samples in the dengue dataset
Training data Number of self samples
100% of Self Class 3249
50% of Self Class 1625
25% of Self Class 812
Table 4. Experimental results for the dengue data
Training data radius Detection
rate False alarm rate Accuracy
0.13 70.16 0 83.06
100% training 0.15 65.80 0 80.58
0.17 59.89 0 77.36
0.13 76.06 22.25 77.62
50% training 0.15 71.15 16.01 74.40
0.17 62.78 13.72 70.10
0.13 83.75 29.70 83.47
25% training 0.15 80.93 24.83 79.85
0.17 73.70 18.77 77.47
Table 5. Comparative results of NSA with MAV and CUSUM
Algorithms Detection rate False alarm rate Accuracy
NSA 80.93 24.83 79.85
MAV 74.1 28.0 73.1
CUSUM 70.8 28.0 67.3
![[Outbreak of indigenous dengue in the Buenos Aires Metropolitan Area. Experience of the F. J. Muñiz Hospital]](https://img.pdfslide.net/doc/110x75/634b45cfc27aad9758029439/outbreak-of-indigenous-dengue-in-the-buenos-aires-metropolitan-area-experience.jpg)

![[Concurrent infections by two dengue virus serotypes during an outbreak in northwestern Peru, 2008]](https://img.pdfslide.net/doc/110x75/6347647e35661330610f8bef/concurrent-infections-by-two-dengue-virus-serotypes-during-an-outbreak-in-northwestern.jpg)