Embed Size (px)
Citation preview
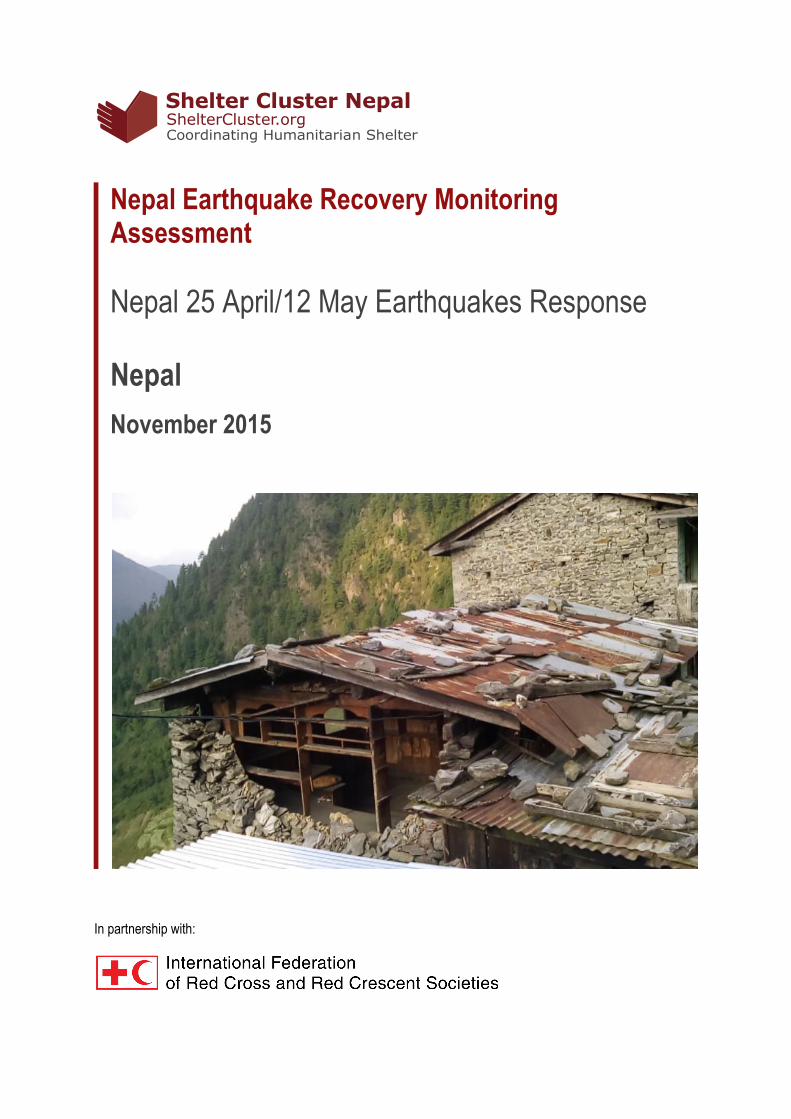
Nepal Earthquake Recovery Monitoring Assessment
Nepal 25 April/12 May Earthquakes Response Nepal
November 2015
In partnership with:
ShelterCluster.orgCoordinating Humanitarian Shelter
Shelter Cluster Nepal
Nepal Earthquake Recovery Monitoring Assessment – November 2015
www.sheltercluster.org 1
ACKNOWLEDGMENTS
The Shelter Recovery Monitoring Evaluation was designed by the Global Shelter Cluster Assessment Coordinator, and facilitated by REACH. The assessment was developed by REACH on behalf of the Global Shelter Cluster, with technical input from Nepal Shelter Cluster partners and the Government of Nepal. Funding for the assessment was provided by the International Federation of the Red Cross, the British Red Cross, the International Organisation for Migration (IOM), Save the Children, CARE and Australian Red Cross, with in-kind donations from Christian Aid Nepal, OXFAM, Catholic Relief Services (CRS) and Plan International.
A particular acknowledgement to IFRC and IOM for their assistance in overcoming the challenges posed by the fuel crisis. Data collection was implemented with support from the Institute of Engineering (IoE) at the University of Tribhuvan and volunteers from the Nepal Red Cross Society. In addition the Shelter Cluster would like to thank the 2,527 households that gave their time to contribute towards this assessment.
Cover photo: ©REACH, 2015
Nepal Earthquake Recovery Monitoring Assessment – November 2015
www.sheltercluster.org 2
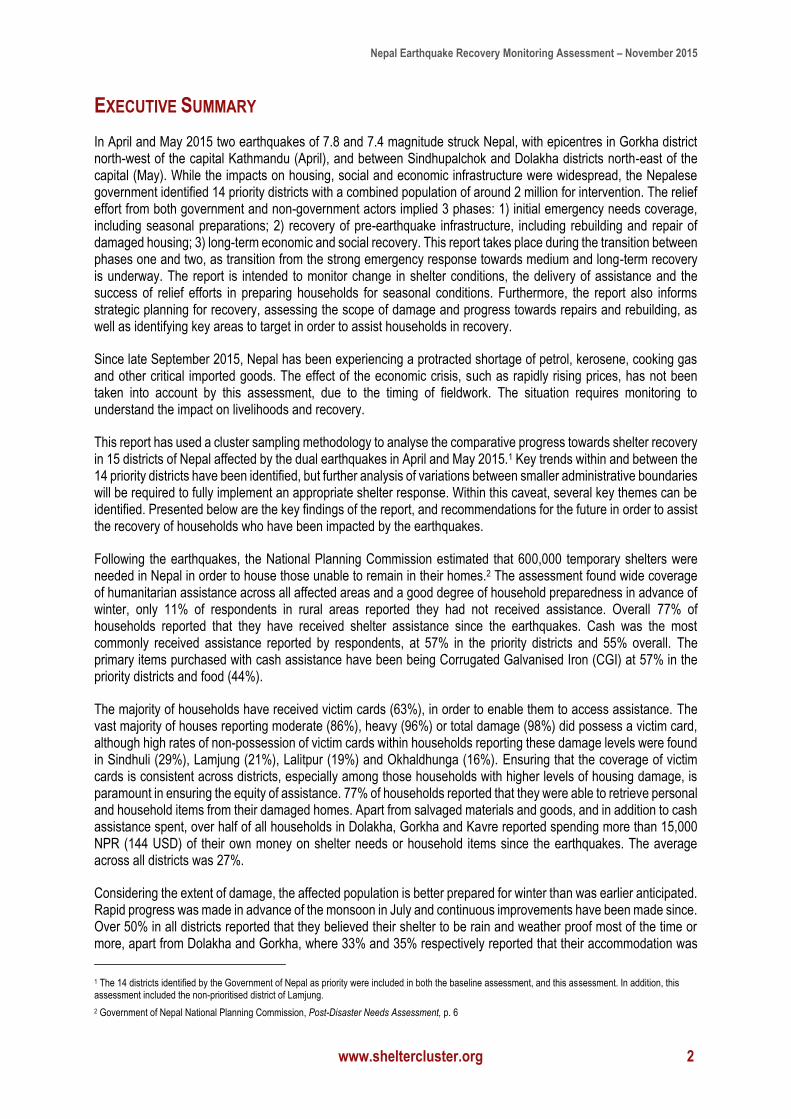
EXECUTIVE SUMMARY
In April and May 2015 two earthquakes of 7.8 and 7.4 magnitude struck Nepal, with epicentres in Gorkha district north-west of the capital Kathmandu (April), and between Sindhupalchok and Dolakha districts north-east of the capital (May). While the impacts on housing, social and economic infrastructure were widespread, the Nepalese government identified 14 priority districts with a combined population of around 2 million for intervention. The relief effort from both government and non-government actors implied 3 phases: 1) initial emergency needs coverage, including seasonal preparations; 2) recovery of pre-earthquake infrastructure, including rebuilding and repair of damaged housing; 3) long-term economic and social recovery. This report takes place during the transition between phases one and two, as transition from the strong emergency response towards medium and long-term recovery is underway. The report is intended to monitor change in shelter conditions, the delivery of assistance and the success of relief efforts in preparing households for seasonal conditions. Furthermore, the report also informs strategic planning for recovery, assessing the scope of damage and progress towards repairs and rebuilding, as well as identifying key areas to target in order to assist households in recovery.
Since late September 2015, Nepal has been experiencing a protracted shortage of petrol, kerosene, cooking gas and other critical imported goods. The effect of the economic crisis, such as rapidly rising prices, has not been taken into account by this assessment, due to the timing of fieldwork. The situation requires monitoring to understand the impact on livelihoods and recovery.
This report has used a cluster sampling methodology to analyse the comparative progress towards shelter recovery in 15 districts of Nepal affected by the dual earthquakes in April and May 2015.1 Key trends within and between the 14 priority districts have been identified, but further analysis of variations between smaller administrative boundaries will be required to fully implement an appropriate shelter response. Within this caveat, several key themes can be identified. Presented below are the key findings of the report, and recommendations for the future in order to assist the recovery of households who have been impacted by the earthquakes.
Following the earthquakes, the National Planning Commission estimated that 600,000 temporary shelters were needed in Nepal in order to house those unable to remain in their homes.2 The assessment found wide coverage of humanitarian assistance across all affected areas and a good degree of household preparedness in advance of winter, only 11% of respondents in rural areas reported they had not received assistance. Overall 77% of households reported that they have received shelter assistance since the earthquakes. Cash was the most commonly received assistance reported by respondents, at 57% in the priority districts and 55% overall. The primary items purchased with cash assistance have been being Corrugated Galvanised Iron (CGI) at 57% in the priority districts and food (44%).
The majority of households have received victim cards (63%), in order to enable them to access assistance. The vast majority of houses reporting moderate (86%), heavy (96%) or total damage (98%) did possess a victim card, although high rates of non-possession of victim cards within households reporting these damage levels were found in Sindhuli (29%), Lamjung (21%), Lalitpur (19%) and Okhaldhunga (16%). Ensuring that the coverage of victim cards is consistent across districts, especially among those households with higher levels of housing damage, is paramount in ensuring the equity of assistance. 77% of households reported that they were able to retrieve personal and household items from their damaged homes. Apart from salvaged materials and goods, and in addition to cash assistance spent, over half of all households in Dolakha, Gorkha and Kavre reported spending more than 15,000 NPR (144 USD) of their own money on shelter needs or household items since the earthquakes. The average across all districts was 27%.
Considering the extent of damage, the affected population is better prepared for winter than was earlier anticipated. Rapid progress was made in advance of the monsoon in July and continuous improvements have been made since. Over 50% in all districts reported that they believed their shelter to be rain and weather proof most of the time or more, apart from Dolakha and Gorkha, where 33% and 35% respectively reported that their accommodation was
1 The 14 districts identified by the Government of Nepal as priority were included in both the baseline assessment, and this assessment. In addition, this assessment included the non-prioritised district of Lamjung.
2 Government of Nepal National Planning Commission, Post-Disaster Needs Assessment, p. 6
Nepal Earthquake Recovery Monitoring Assessment – November 2015
www.sheltercluster.org 3
prepared for snow and cold most of the time or all of the time, with those in temporary shelter reporting the greatest concern for winter. In total 41% of households surveyed expect to spend the coming winter in temporary shelter, with large variations by district.
Direct winterisation needs look to be less severe than some previous assessments have indicated, reflecting the strong emergency response in preparation for the monsoon season. Over 50% in all districts reported that they believed their shelter to be rain and weather proof most of the time or more, apart from Dolakha and Gorkha, where 33% and 35% respectively reported that their shelter was prepared for snow and cold most of the time or all of the time. There is limited variation in the proportion of households believing their shelter to be not at all prepared for winter by location type, access conditions or elevation. Nevertheless, lower proportions of those households in rural areas, hard to reach areas, and areas above 1500 meters report their household is ‘always prepared for cold’ than in those in urban areas, road-accessible areas, and areas below 1500 meters.
There is more variation in winter preparations depending on whether or not a household is currently in a temporary shelter. 11% of households in temporary shelter report that their shelter is not at all prepared for cold weather, compared to 2% of households not currently in temporary shelter. In total 41% of households surveyed expect to spend the coming winter in temporary shelter, with large variations by district. Conditions in temporary shelter largely meet expected standards, with 86% of households in temporary shelter having a total covered living space per person of over 3.5 metres; although there is a district variation meaning many still live in conditions below required standards, especially in Gorkha. The easy access to CGI either through assistance or markets is reflected in the primary use of the material in temporary shelter wall (71%) and roof (90%) structures.
Moving forward, more work will be required to enable a household-lead rebuilding effort for houses damaged by the earthquakes, although a solid base exists in the resources available to households, knowledge of building techniques and availability of labour. Further interventions will need to focus on advocacy of Build Back Safer (BBS) techniques using materials households are already familiar with, and on overcoming uncertainty in the degree of, and access to, financial assistance for recovery. There has been little change in the income sources reported by households before and after the earthquake. The continued prevalence of agricultural income sources, especially in rural areas, suggests that households have been prioritising agricultural inputs over shelter recovery in the distribution of household resources, both labour and financial. Any moves towards recovery will require a recalibration of these resources, for example in the distribution of household cash to shelter supplies, and the use of household members as labour on rebuilding/ repair rather than agriculture. The implicit fine margins of income stability, indicated by the high proportion of rural households reporting subsistence farming as an income source (56%), mean that recovery assistance must be mindful of the potential decrease in the stability of income as households have less time and resources to expend on agriculture.
Moving forward, economic vulnerability will be a constraint in reconstruction through a household led process. There has been little change in the income sources reported by households before and after the earthquake with a high proportion of rural households reporting subsistence farming as their income source (56%). 9% of households across the priority districts reported having at least one member having migrated for work, either within Nepal or abroad. This varied across the districts, with Sindhupalchok (25%) Lamjung (23%), Dhading (19%) and Gorkha (19%) reporting the highest levels of migration. This appears to reflect the higher levels of migration in rural areas than urban areas. The rates of migration were also higher for those households in hard-to-reach areas (15%) than areas accessible by road (9%).
A majority, 81% of respondents in the priority districts, reported that they had access to at least one form of banking service. However, significant proportions in all districts have no access to financial services. Furthermore, only 48% reported they currently use a bank for financial services. This has implications on plans for the disbursement of any government or other subsidies.
Reconstruction and rehabilitation aims to meet BBS (building back safer) criteria particularly around hazard resistant construction. While only 1% of those surveyed were unable to name a build back safer technique, the techniques named most frequently tend to be more general and more expensive than those techniques named less frequently. This indicates a need for high levels of technical guidance to support households in rebuilding safely with existing materials, which should serve the dual purpose of increasing the safety of recovery, and decreasing
Nepal Earthquake Recovery Monitoring Assessment – November 2015
www.sheltercluster.org 4
the anticipated costs households face. This is highlighted also by the Government of Nepal: “As the recovery is going to be largely owner led, it is essential to make them aware of need of disaster resistant construction. There will be need to guide them on choice of building typologies, materials and costing in addition to minimum disaster resistant features. As the owners hire artisans and take decision with regards to materials and construction system, their awareness is critical. Dissemination of required information on reconstruction, repairs and retrofitting to them is very important.”3 Communication, training and awareness activities during the humanitarian phase have achieved limited coverage and impact at household level. 99% of respondents across all districts reported they have not received technical training, assistance or information materials, reflecting that outreach activities had not yet reached broad public scale or household level.
The majority of housing in the affected districts is constructed in load bearing masonry (89%), predominantly stone or brick. Reinforced concrete frames are concentrated in urban areas. Levels of damage were higher in low strength load bearing masonry, (dry stone mortar and mud mortar) which constitute the highest proportion of rural construction. While respondents expressed intentions to move to reinforced concrete construction for safety reasons, there will be considerable challenges in terms of cost. In response to questions on safer construction, the majority of households focused on reinforced concrete. This raises two concerns, that improvements to stone and brick masonry are less well known and that reinforced concrete safety is an assumption. Load bearing masonry is more likely to involve household members in construction (69%) compared to 29% in building with reinforced concrete frames which are more likely built by contractors. This pattern should inform the targeting of information and training.
Current progress on repair and reconstruction has been limited overall, 5% report that repairs or rebuilding work has been completed, a further 8% are currently being repaired. However, in some districts the percentage repaired or under repair is as high as 28% (Kavre district).The reasons for the overall low rate of reconstruction include: investment of resources and effort into temporary shelter construction, agricultural priorities including planting and the impact of the monsoon season on access and construction. Since the field assessments were carried out, the fuel crisis has also slowed down construction activity nationally. Households and assistance agencies expressed concern that the lack of clarity on government subsidies was making it difficult to plan for reconstruction.
The primary barriers to repair or rebuild after the earthquakes in the priority districts were reported as lack of funds (97%), lack of skilled labour (38%), lack of materials (39%) and lack of knowledge (25%). More detailed examination of both the availability of skilled labour and materials suggests that both are available in all locations, but that the price is rising. In particular 83% of households indicated that masons are available in their location, but at an increased cost since before the earthquake. A marked increase in the rate of reconstruction is likely to precipitate inflation in skilled labour and material costs, with implications for the application of building back safer measures.
The current phase, after rapid construction of shelter and before large scale permanent reconstruction affords an important window of opportunity to start to increase skilled labour supply through training, to improve supply chains of materials and particularly to plan and start broad scale household and public awareness initiatives on a range of options to rebuild, repair and retrofit their homes safely.
3 Government of Nepal, National Planning Commission, Post-Disaster Needs Assessment, p. 18
Nepal Earthquake Recovery Monitoring Assessment – November 2015
www.sheltercluster.org 5
CONTENTS
EXECUTIVE SUMMARY ...............................................................................................................................................2
LIST OF FIGURES .......................................................................................................................................................6
LIST OF MAPS ...........................................................................................................................................................6
LIST OF TABLES ........................................................................................................................................................7
LIST OF BOXES .........................................................................................................................................................7
GEOGRAPHICAL CLASSIFICATIONS ............................................................................................................................8
INTRODUCTION ..........................................................................................................................................................9
Acknowledgments .............................................................................................. Error! Bookmark not defined.
METHODOLOGY .........................................................................................................................................................9
FINDINGS ................................................................................................................................................................ 15
Demographics .................................................................................................................................................. 15
Pre-Earthquake Building Typologies ................................................................................................................ 23
Pre-Earthquake Housing Damage ................................................................................................................... 28
Seasonal Preparations and Temporary Shelter ............................................................................................... 34
Assistance and Access to Services ................................................................................................................. 39
Current Status .................................................................................................................................................. 51
Recovery .......................................................................................................................................................... 53
CONCLUSION .......................................................................................................................................................... 60
ANNEXES ................................................................................................................................................................ 63
Annex A: Household Questionnaire ................................................................................................................. 63
Annex B: Manual for Enumerators ................................................................................................................... 85
Nepal Earthquake Recovery Monitoring Assessment – November 2015
www.sheltercluster.org 6
LIST OF FIGURES
Figure 1: Population pyramid of households covered in the survey ...................................................................... 15
Figure 2: Head of households by district ............................................................................................................... 16
Figure 3: Head of household by age group ........................................................................................................... 16
Figure 4: Proportion of households by current living arrangement, and by vulnerability ....................................... 23
Figure 5: Reported load bearing wall load bearing structural/ frame materials in the priority districts ................... 23
Figure 6: Reported wall load bearing structural/ frame materials by location type ................................................ 25
Figure 7: Reported upper storey structural/ frame material by wall load bearing structural/ frame materials ........ 26
Figure 8: Reported roof structural/ frame material by wall load bearing structural/ frame materials ...................... 26
Figure 9: Average covered living space of whole building by district in square metres ......................................... 27
Figure 10: Building type by wall load bearing structural/ frame material ................................................................ 27
Figure 11: Damage levels by load bearing structural/ frame material .................................................................... 29
Figure 12: Damage levels by rural/ urban location ................................................................................................ 30
Figure 13: Damage levels by access and elevation .............................................................................................. 30
Figure 14: Self-reported anticipated repair cost in priority districts ........................................................................ 32
Figure 15: Proportion of buildings reporting inclination by district ......................................................................... 32
Figure 16: Specific damage levels for reinforced concrete frame buildings ........................................................... 34
Figure 17: Proportion of households expecting to spend winter in temporary shelter, by vulnerability score ........ 37
Figure 18: Households currently in temporary shelter by district ........................................................................... 38
Figure 19: Average square metres per person in temporary shelter ..................................................................... 38
Figure 20: Assistance received by accessibility ..................................................................................................... 41
Figure 21: Assistance received by vulnerability score ........................................................................................... 42
Figure 22: Proportion of households who received CGI assistance by point in time when assistance last received .............................................................................................................................................................................. 42
Figure 23: Average cash assistance by district ..................................................................................................... 45
Figure 24: Households reporting the receipt of technical assistance, training or messaging ................................ 47
Figure 25: Primary electricity source, by vulnerability ............................................................................................ 49
Figure 26: Type of financial service access in the priority districts ........................................................................ 50
Figure 27: Repair and rebuilding intentions in the priority districts ........................................................................ 53
Figure 28: Primary barriers to rebuild in the priority districts.................................................................................. 54
Figure 29: BBS techniques named by 10% or more of households ...................................................................... 59
LIST OF MAPS
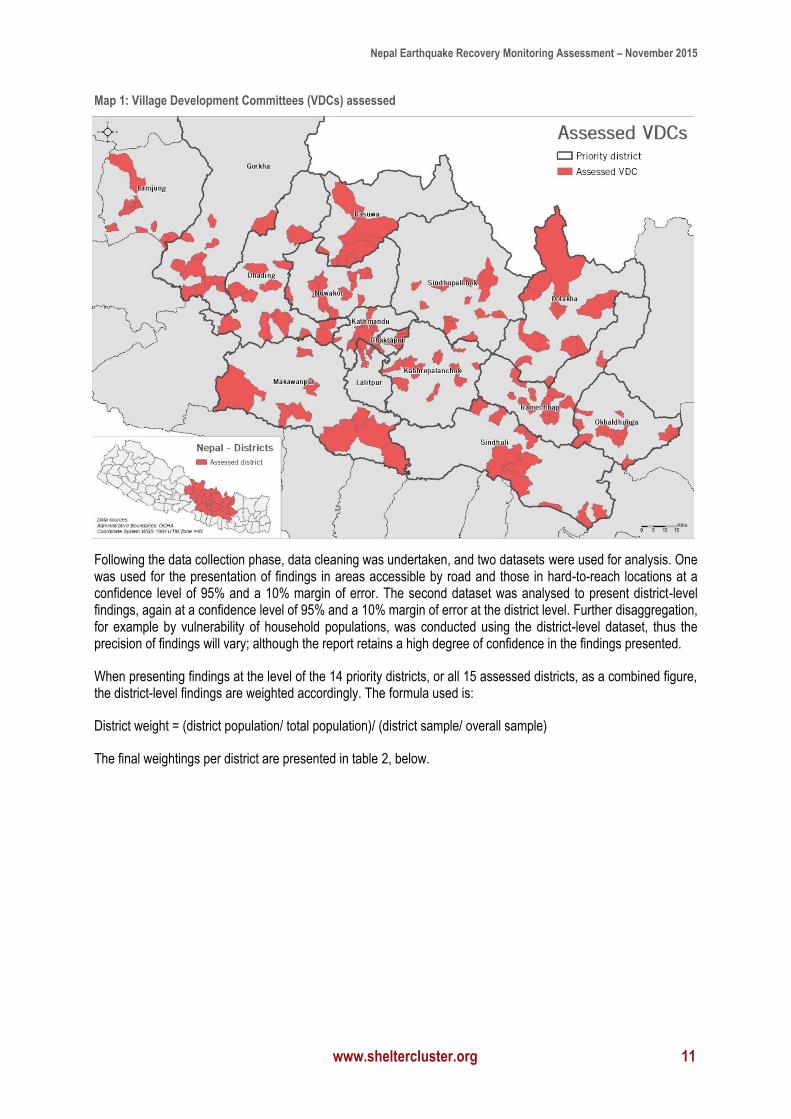
Map 1: Village Development Committees (VDCs) assessed ................................................................................. 11
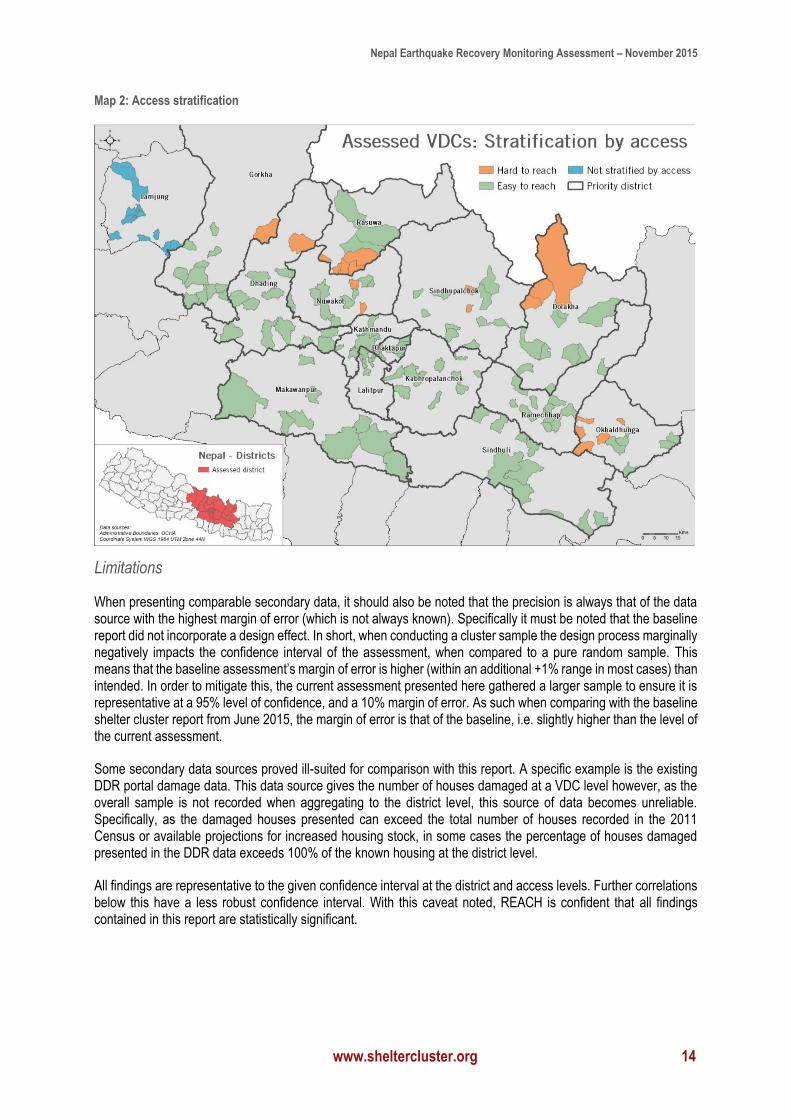
Map 2: Access stratification ................................................................................................................................... 14
Map 3: Proportion of households reporting property damage who left their pre-earthquake house ...................... 21
Map 4: Households still living in a house damaged by the earthquakes ............................................................... 22
Map 5: Proportion of affected households reporting no shelter assistance by district ........................................... 39
Map 6: Blankets and sleeping mats received ........................................................................................................ 40
Map 7: Tarpaulin assistance received ................................................................................................................... 40
Map 8: Households reporting receipt off CGI assistance ...................................................................................... 43
Map 9: Sources of assistance - INGO ................................................................................................................... 44
Nepal Earthquake Recovery Monitoring Assessment – November 2015
www.sheltercluster.org 7
Map 10: Sources of assistance - Local authorities ................................................................................................ 44
Map 11: Households receiving cash assistance .................................................................................................... 46
Map 12: Proportion of households not accessing financial services by district ..................................................... 50
Map 13: Proportion of households reporting market selling shelter supplies more than a 4 hours walk ............... 58
LIST OF TABLES
Table 1: Collected sample per district ................................................................................................................... 10
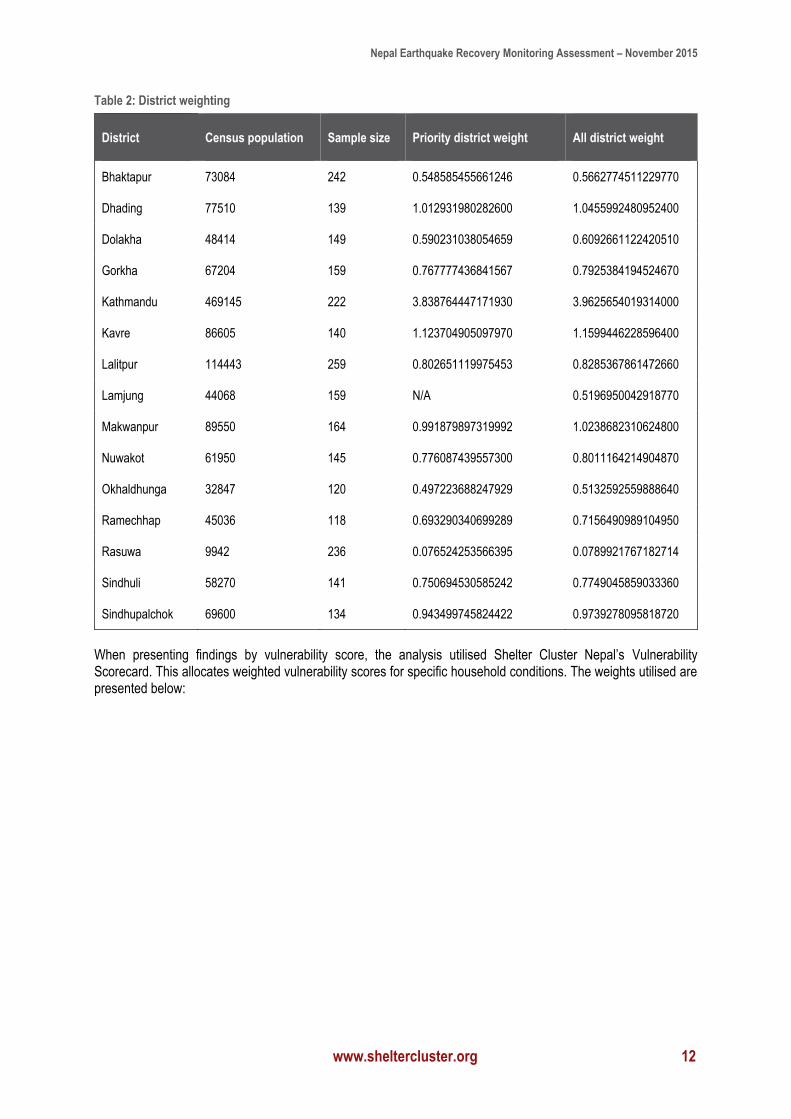
Table 2: District weighting ..................................................................................................................................... 12
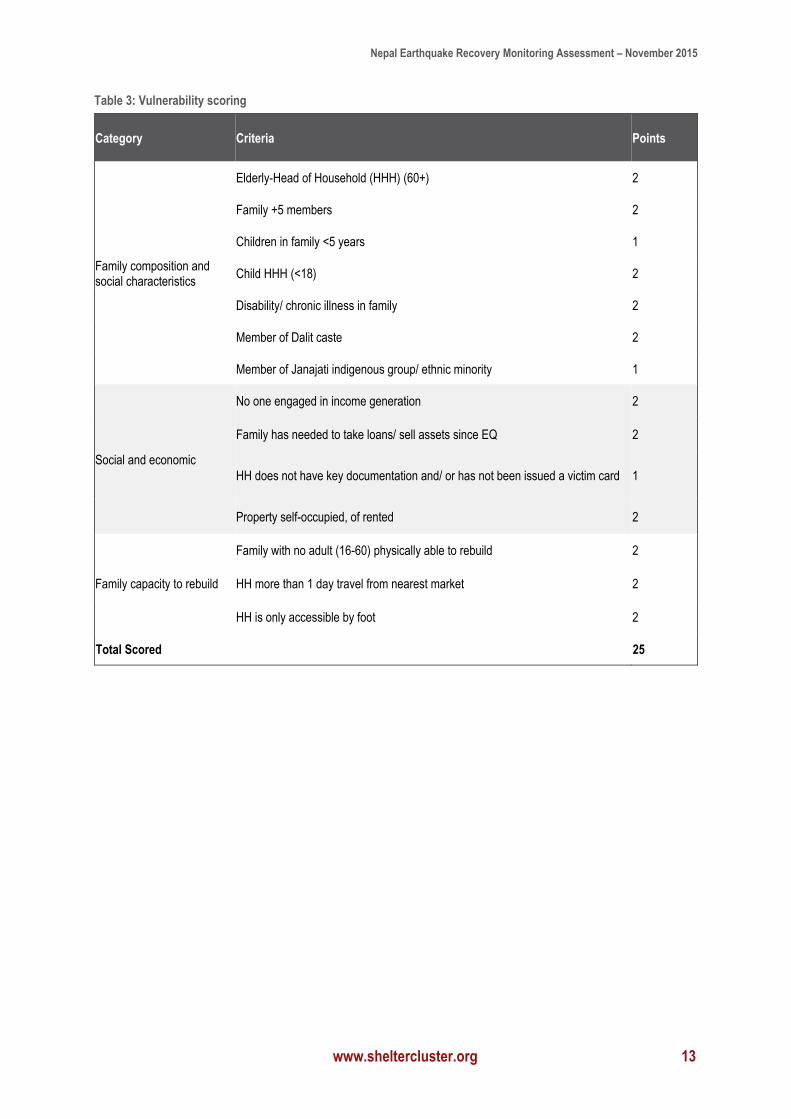
Table 3: Vulnerability scoring ................................................................................................................................ 13
Table 4: Distribution of castes by district ............................................................................................................... 17
Table 5: Migration rates by location type ............................................................................................................... 18
Table 6: Pre-earthquake property arrangement, by vulnerability score ................................................................. 20
Table 7: Reported wall load bearing structural/ frame materials (grouped) by district ........................................... 24
Table 8: Damage levels by district ......................................................................................................................... 28
Table 9: % Households reporting specific damage, by wall load bearing structural material ................................ 33
Table 10: Specific damage reported for load bearing masonry wall structures ..................................................... 33
Table 11: Preparedness of current shelter for rain, by district ............................................................................... 35
Table 12: Preparedness of current shelter for snow/ cold by district ..................................................................... 36
Table 13: Primary electricity source, by district ..................................................................................................... 48
Table 14: Current status of repairs/ rebuilding by district ...................................................................................... 51
Table 15: Cost and availability of skilled labour – mason ...................................................................................... 55
Table 16: Cost and availability of skilled labour – Carpenter ................................................................................. 56
LIST OF BOXES
Box 1: Demographics and Livelihoods in Lamjung ................................................................................................ 19
Box 2: Building typologies and damage in Lamjung .............................................................................................. 31
Box 3: Seasonal preparedness in Lamjung ........................................................................................................... 36
Box 4: Assistance in Lamjung ............................................................................................................................... 43
Box 5: Recovery barriers in Lamjung .................................................................................................................... 57
LIST OF ACRONYMS
BBS Build Back Safer
CGI Corrugated Galvanised Iron
RCC
VDC
Reinforced Concrete Cement
Village Development Committee
Nepal Earthquake Recovery Monitoring Assessment – November 2015
www.sheltercluster.org 8
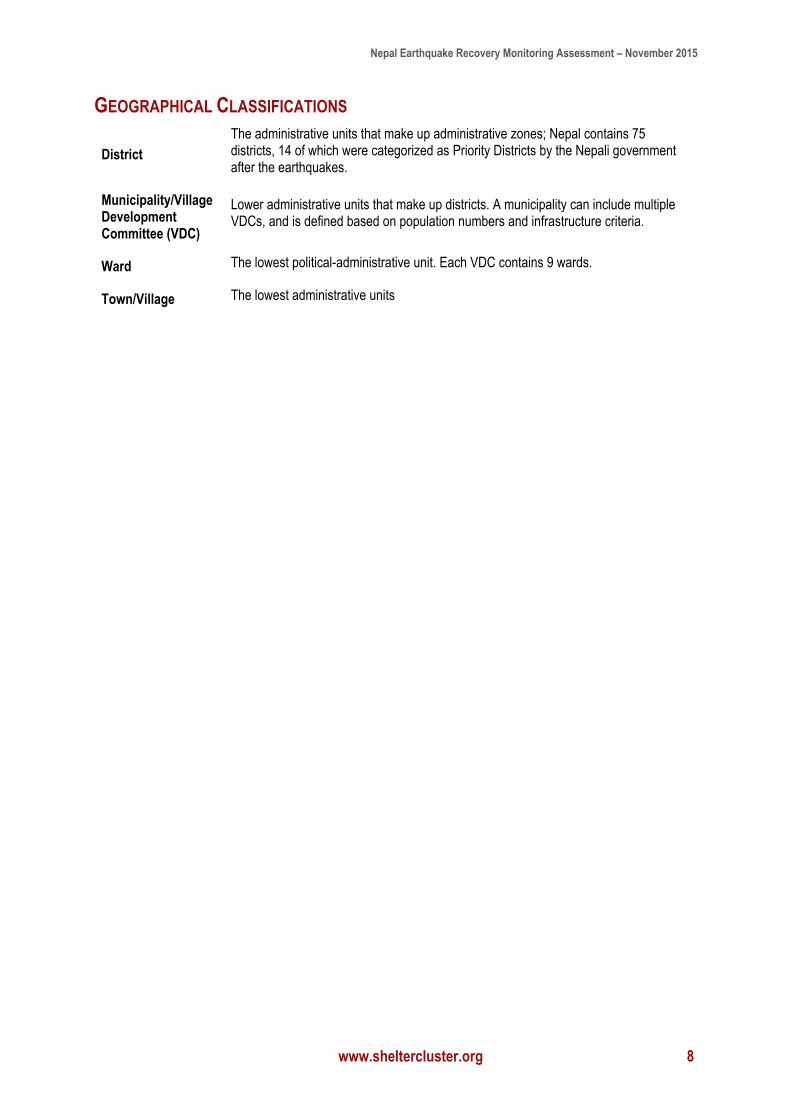
GEOGRAPHICAL CLASSIFICATIONS
District
The administrative units that make up administrative zones; Nepal contains 75 districts, 14 of which were categorized as Priority Districts by the Nepali government after the earthquakes.
Municipality/Village Development Committee (VDC)
Lower administrative units that make up districts. A municipality can include multiple VDCs, and is defined based on population numbers and infrastructure criteria.
Ward The lowest political-administrative unit. Each VDC contains 9 wards.
Town/Village The lowest administrative units
Nepal Earthquake Recovery Monitoring Assessment – November 2015
www.sheltercluster.org 9
INTRODUCTION
On 25 April 2015, a 7.8 magnitude earthquake struck Nepal with its epicentre in Gorkha District, approximately 81km northwest of the country capital, Kathmandu. Intense tremors, and subsequent aftershocks, landslides, and avalanches caused widespread damage to homes, infrastructure, and livelihoods, affecting millions of people across 39 out of 75 districts. The Nepalese government categorized 14 of these districts as severely affected: Dhading, Gorkha, Rasuwa, Kavrepalanchok, Nuwakot, Dolakha, Sindhupalchok, Kathmandu, Ramechhap, Bhaktapur, Lalitpur, Makawanpur, Sindhuli and Okhaldhunga. Combined, these districts contain over 2 million people.
Amid ongoing recovery efforts following the earthquake of 25 April 2015, Nepal was struck by a second earthquake on 12 May 2015, with a magnitude of 7.4. The epicentre of the second earthquake was located further east than the first, close to the border between the Sindupalchok and Dolakha districts, causing further damage in areas that had already been affected, whilst causing new devastation in areas which had previously experienced limited damage
According to government estimates, the earthquakes combined caused over 8,790 casualties and 22,300 injuries, and left over 500,000 houses and hundreds of historical and cultural monuments destroyed.4 It is estimated that the earthquakes affected the lives of approximately eight million people, constituting almost one-third of the population of Nepal.5
In April 2015, following the Gorkha earthquake, REACH Initiative was deployed with support from the shelter cluster to assess the impacts of the earthquake on the shelter conditions in Nepal. During data collection the second earthquake hit Nepal, exacerbating an already severe humanitarian crisis. Following an adaptation of the methodology the assessment was restarted, to form the baseline of future longitudinal analysis, as well as to inform the immediate planning of humanitarian relief efforts.
In September 2015 REACH Initiative was redeployed at the request of the Global Shelter Cluster and the Nepal Shelter Cluster in order to conduct a follow up monitoring assessment of the shelter relief and recovery efforts. Being timed during a transition between emergency relief and longer term recovery, this assessment report presents findings on the progress and scope of emergency relief, and the progress of recovery.
Primary data was collected across the 14 priority districts identified by the Nepalese government, which were also assessed in the baseline reports. Initially, the assessment was planned to include 4 non-priority districts as well: Lamjung, Solokhumbu, Tanahu and Kotang. However, due to the effects of a severe fuel crisis in Nepal during the data collection period, it was only possible to include Lamjung district. Additionally, a secondary data review was conducted by the Nepal Shelter Cluster, with assistance from REACH.
METHODOLOGY
This assessment used a multi-stage cluster sampling in order to give a complete picture of the shelter situation of households in districts of Nepal that sustained the highest levels of shelter damage as a result of the April and May earthquakes, in addition to districts where information gaps exist.
A sample of 120 households (+10% buffer) was drawn from each of the 15 districts of interest, including a minimum of 120 households drawn overall from areas that were inaccessible by road at the time of data collection in priority/non-priority districts. This was intended to achieve:
1. The widest possible geographical coverage including districts not previous assessed,
4 Government of Nepal - National Planning Commission, “Nepal Earthquake 2015 - Post Disaster Needs Assessment (PDNA): Executive Summary” p. 5, 2015.
5 Ibid.
Nepal Earthquake Recovery Monitoring Assessment – November 2015
www.sheltercluster.org 10
2. A minimum acceptable level of precision when disaggregating either by district or by road access in priority
districts.
3. Direct comparability with the baseline assessment
Stage 1: Selection of target geographies Geographies included, where logistically feasible, difficult to reach mountainous areas, and areas that are at risk of monsoon flooding/landslides. All 14 districts covered in the baseline will be assessed, with the aim of including areas not accessible by road. Where resources permitted, an additional four non-priority districts, not included in the baseline, were assessed to gather comparable data on areas where a severe information gap exists. Further, a sample was gathered to enable the analysis of areas accessible/ not accessible by road within the priority districts. While the assessment had intended to include three additional non-priority districts, only one, Lamjung, was included as a result of limitations imposed by the ongoing fuel crisis in Nepal.
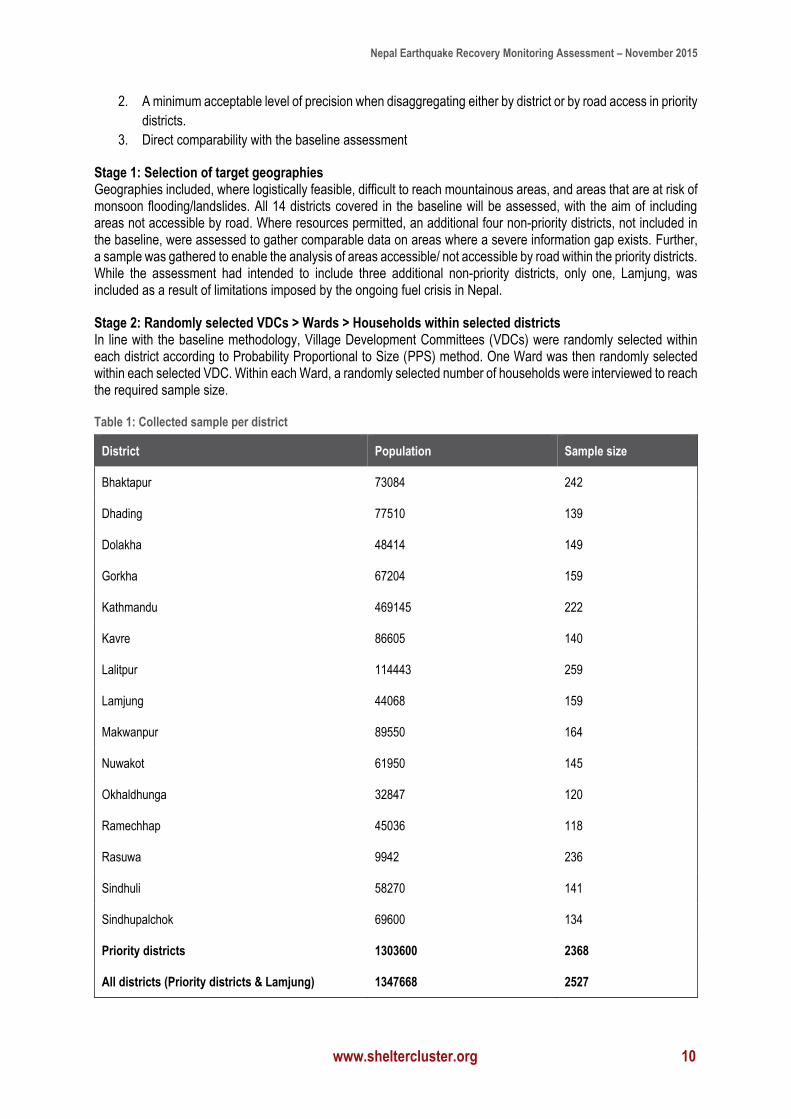
Stage 2: Randomly selected VDCs > Wards > Households within selected districts In line with the baseline methodology, Village Development Committees (VDCs) were randomly selected within each district according to Probability Proportional to Size (PPS) method. One Ward was then randomly selected within each selected VDC. Within each Ward, a randomly selected number of households were interviewed to reach the required sample size.
Table 1: Collected sample per district
District Population Sample size
Bhaktapur 73084 242
Dhading 77510 139
Dolakha 48414 149
Gorkha 67204 159
Kathmandu 469145 222
Kavre 86605 140
Lalitpur 114443 259
Lamjung 44068 159
Makwanpur 89550 164
Nuwakot 61950 145
Okhaldhunga 32847 120
Ramechhap 45036 118
Rasuwa 9942 236
Sindhuli 58270 141
Sindhupalchok 69600 134
Priority districts 1303600 2368
All districts (Priority districts & Lamjung) 1347668 2527
Nepal Earthquake Recovery Monitoring Assessment – November 2015
www.sheltercluster.org 11
Map 1: Village Development Committees (VDCs) assessed
Following the data collection phase, data cleaning was undertaken, and two datasets were used for analysis. One was used for the presentation of findings in areas accessible by road and those in hard-to-reach locations at a confidence level of 95% and a 10% margin of error. The second dataset was analysed to present district-level findings, again at a confidence level of 95% and a 10% margin of error at the district level. Further disaggregation, for example by vulnerability of household populations, was conducted using the district-level dataset, thus the precision of findings will vary; although the report retains a high degree of confidence in the findings presented.
When presenting findings at the level of the 14 priority districts, or all 15 assessed districts, as a combined figure, the district-level findings are weighted accordingly. The formula used is:
District weight = (district population/ total population)/ (district sample/ overall sample)
The final weightings per district are presented in table 2, below.
Nepal Earthquake Recovery Monitoring Assessment – November 2015
www.sheltercluster.org 12
Table 2: District weighting
District Census population Sample size Priority district weight All district weight
Bhaktapur 73084 242 0.548585455661246 0.5662774511229770
Dhading 77510 139 1.012931980282600 1.0455992480952400
Dolakha 48414 149 0.590231038054659 0.6092661122420510
Gorkha 67204 159 0.767777436841567 0.7925384194524670
Kathmandu 469145 222 3.838764447171930 3.9625654019314000
Kavre 86605 140 1.123704905097970 1.1599446228596400
Lalitpur 114443 259 0.802651119975453 0.8285367861472660
Lamjung 44068 159 N/A 0.5196950042918770
Makwanpur 89550 164 0.991879897319992 1.0238682310624800
Nuwakot 61950 145 0.776087439557300 0.8011164214904870
Okhaldhunga 32847 120 0.497223688247929 0.5132592559888640
Ramechhap 45036 118 0.693290340699289 0.7156490989104950
Rasuwa 9942 236 0.076524253566395 0.0789921767182714
Sindhuli 58270 141 0.750694530585242 0.7749045859033360
Sindhupalchok 69600 134 0.943499745824422 0.9739278095818720
When presenting findings by vulnerability score, the analysis utilised Shelter Cluster Nepal’s Vulnerability Scorecard. This allocates weighted vulnerability scores for specific household conditions. The weights utilised are presented below:
Nepal Earthquake Recovery Monitoring Assessment – November 2015
www.sheltercluster.org 13
Table 3: Vulnerability scoring
Category Criteria Points
Family composition and social characteristics
Elderly-Head of Household (HHH) (60+) 2
Family +5 members 2
Children in family <5 years 1
Child HHH (<18) 2
Disability/ chronic illness in family 2
Member of Dalit caste 2
Member of Janajati indigenous group/ ethnic minority 1
Social and economic
No one engaged in income generation 2
Family has needed to take loans/ sell assets since EQ 2
HH does not have key documentation and/ or has not been issued a victim card 1
Property self-occupied, of rented 2
Family capacity to rebuild
Family with no adult (16-60) physically able to rebuild 2
HH more than 1 day travel from nearest market 2
HH is only accessible by foot 2
Total Scored 25
Nepal Earthquake Recovery Monitoring Assessment – November 2015
www.sheltercluster.org 14
Map 2: Access stratification
Limitations
When presenting comparable secondary data, it should also be noted that the precision is always that of the data source with the highest margin of error (which is not always known). Specifically it must be noted that the baseline report did not incorporate a design effect. In short, when conducting a cluster sample the design process marginally negatively impacts the confidence interval of the assessment, when compared to a pure random sample. This means that the baseline assessment’s margin of error is higher (within an additional +1% range in most cases) than intended. In order to mitigate this, the current assessment presented here gathered a larger sample to ensure it is representative at a 95% level of confidence, and a 10% margin of error. As such when comparing with the baseline shelter cluster report from June 2015, the margin of error is that of the baseline, i.e. slightly higher than the level of the current assessment.
Some secondary data sources proved ill-suited for comparison with this report. A specific example is the existing DDR portal damage data. This data source gives the number of houses damaged at a VDC level however, as the overall sample is not recorded when aggregating to the district level, this source of data becomes unreliable. Specifically, as the damaged houses presented can exceed the total number of houses recorded in the 2011 Census or available projections for increased housing stock, in some cases the percentage of houses damaged presented in the DDR data exceeds 100% of the known housing at the district level.
All findings are representative to the given confidence interval at the district and access levels. Further correlations below this have a less robust confidence interval. With this caveat noted, REACH is confident that all findings contained in this report are statistically significant.
Nepal Earthquake Recovery Monitoring Assessment – November 2015
www.sheltercluster.org 15
FINDINGS
Demographics
Household characteristics
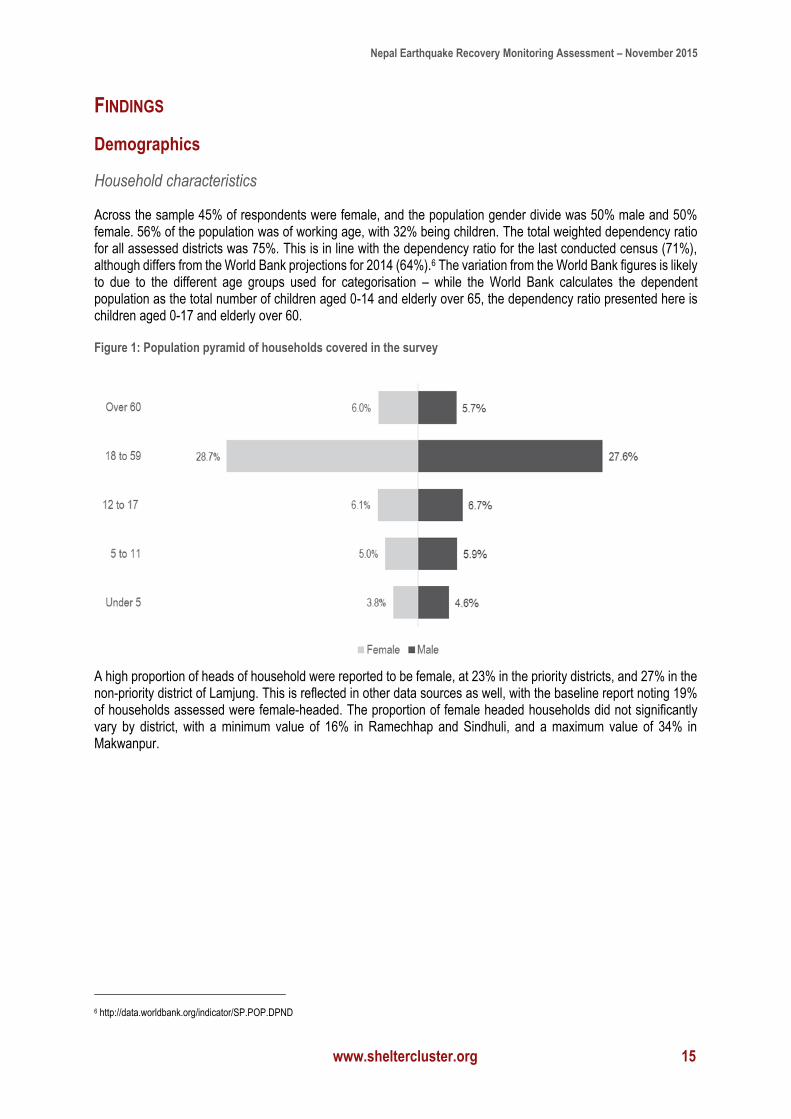
Across the sample 45% of respondents were female, and the population gender divide was 50% male and 50% female. 56% of the population was of working age, with 32% being children. The total weighted dependency ratio for all assessed districts was 75%. This is in line with the dependency ratio for the last conducted census (71%), although differs from the World Bank projections for 2014 (64%).6 The variation from the World Bank figures is likely to due to the different age groups used for categorisation – while the World Bank calculates the dependent population as the total number of children aged 0-14 and elderly over 65, the dependency ratio presented here is children aged 0-17 and elderly over 60.
Figure 1: Population pyramid of households covered in the survey
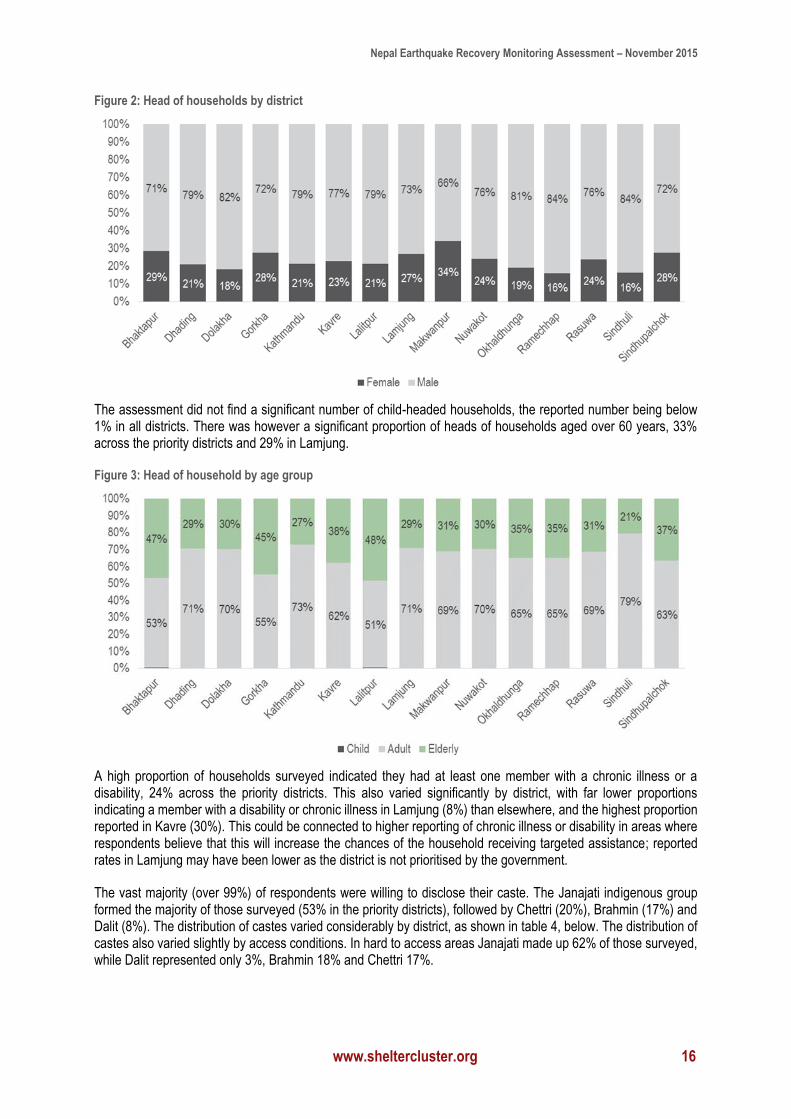
A high proportion of heads of household were reported to be female, at 23% in the priority districts, and 27% in the non-priority district of Lamjung. This is reflected in other data sources as well, with the baseline report noting 19% of households assessed were female-headed. The proportion of female headed households did not significantly vary by district, with a minimum value of 16% in Ramechhap and Sindhuli, and a maximum value of 34% in Makwanpur.
6 http://data.worldbank.org/indicator/SP.POP.DPND
Nepal Earthquake Recovery Monitoring Assessment – November 2015
www.sheltercluster.org 16
Figure 2: Head of households by district
The assessment did not find a significant number of child-headed households, the reported number being below 1% in all districts. There was however a significant proportion of heads of households aged over 60 years, 33% across the priority districts and 29% in Lamjung.
Figure 3: Head of household by age group
A high proportion of households surveyed indicated they had at least one member with a chronic illness or a disability, 24% across the priority districts. This also varied significantly by district, with far lower proportions indicating a member with a disability or chronic illness in Lamjung (8%) than elsewhere, and the highest proportion reported in Kavre (30%). This could be connected to higher reporting of chronic illness or disability in areas where respondents believe that this will increase the chances of the household receiving targeted assistance; reported rates in Lamjung may have been lower as the district is not prioritised by the government.
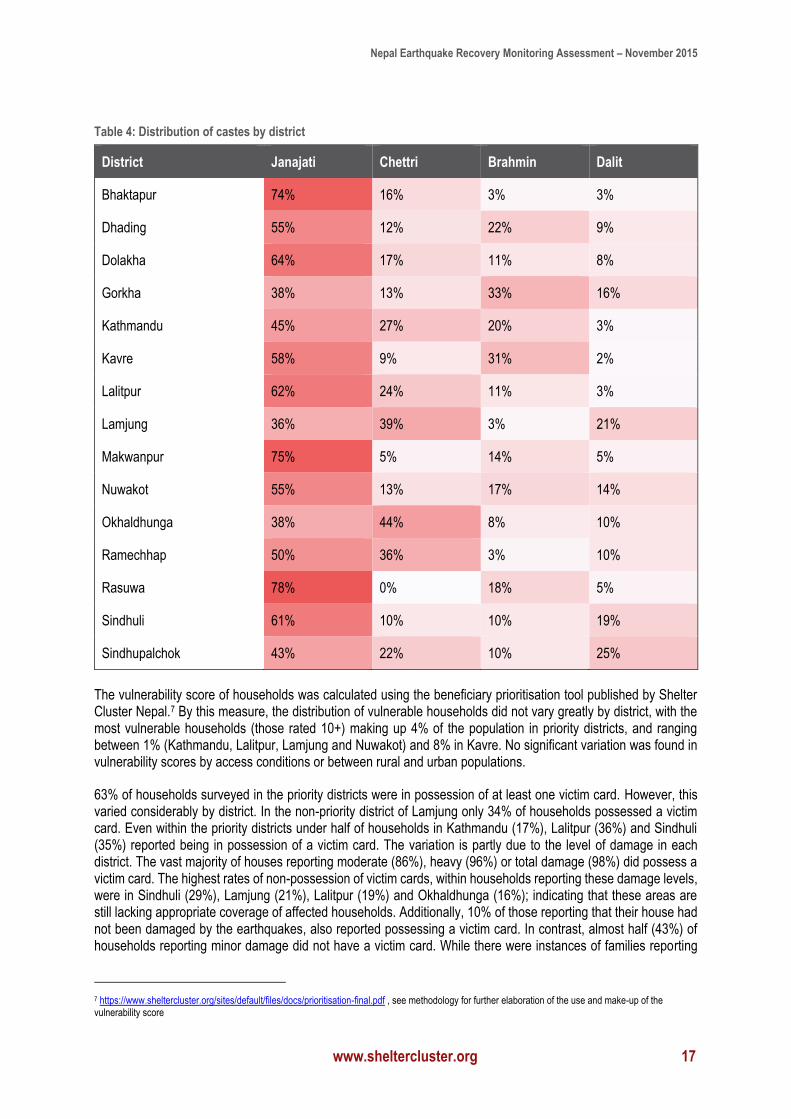
The vast majority (over 99%) of respondents were willing to disclose their caste. The Janajati indigenous group formed the majority of those surveyed (53% in the priority districts), followed by Chettri (20%), Brahmin (17%) and Dalit (8%). The distribution of castes varied considerably by district, as shown in table 4, below. The distribution of castes also varied slightly by access conditions. In hard to access areas Janajati made up 62% of those surveyed, while Dalit represented only 3%, Brahmin 18% and Chettri 17%.
Nepal Earthquake Recovery Monitoring Assessment – November 2015
www.sheltercluster.org 17
Table 4: Distribution of castes by district
The vulnerability score of households was calculated using the beneficiary prioritisation tool published by Shelter Cluster Nepal.7 By this measure, the distribution of vulnerable households did not vary greatly by district, with the most vulnerable households (those rated 10+) making up 4% of the population in priority districts, and ranging between 1% (Kathmandu, Lalitpur, Lamjung and Nuwakot) and 8% in Kavre. No significant variation was found in vulnerability scores by access conditions or between rural and urban populations.
63% of households surveyed in the priority districts were in possession of at least one victim card. However, this varied considerably by district. In the non-priority district of Lamjung only 34% of households possessed a victim card. Even within the priority districts under half of households in Kathmandu (17%), Lalitpur (36%) and Sindhuli (35%) reported being in possession of a victim card. The variation is partly due to the level of damage in each district. The vast majority of houses reporting moderate (86%), heavy (96%) or total damage (98%) did possess a victim card. The highest rates of non-possession of victim cards, within households reporting these damage levels, were in Sindhuli (29%), Lamjung (21%), Lalitpur (19%) and Okhaldhunga (16%); indicating that these areas are still lacking appropriate coverage of affected households. Additionally, 10% of those reporting that their house had not been damaged by the earthquakes, also reported possessing a victim card. In contrast, almost half (43%) of households reporting minor damage did not have a victim card. While there were instances of families reporting
7 https://www.sheltercluster.org/sites/default/files/docs/prioritisation-final.pdf , see methodology for further elaboration of the use and make-up of the vulnerability score
District Janajati Chettri Brahmin Dalit
Bhaktapur 74% 16% 3% 3%
Dhading 55% 12% 22% 9%
Dolakha 64% 17% 11% 8%
Gorkha 38% 13% 33% 16%
Kathmandu 45% 27% 20% 3%
Kavre 58% 9% 31% 2%
Lalitpur 62% 24% 11% 3%
Lamjung 36% 39% 3% 21%
Makwanpur 75% 5% 14% 5%
Nuwakot 55% 13% 17% 14%
Okhaldhunga 38% 44% 8% 10%
Ramechhap 50% 36% 3% 10%
Rasuwa 78% 0% 18% 5%
Sindhuli 61% 10% 10% 19%
Sindhupalchok 43% 22% 10% 25%
Nepal Earthquake Recovery Monitoring Assessment – November 2015
www.sheltercluster.org 18
more than one victim card in possession of the household, this was not a significant sub-group, amounting to less than 1% of the sample.
Reported literacy rates were high across the assessed districts, with 96% of households reporting at least one member able to read and write in Nepali. Only two districts, Gorkha (88%) and Dolakha (89%) reported literacy rates below 90%. While there was no significant variation between rural and urban areas, the literacy rate was higher in areas accessible by road (96%) than in hard to reach areas (89%). There was also a slight variation in the literacy rates by the age of the head of household, with households with a head of household older than 60 years reporting a higher rate of having no literate member (9%) than households with a head of household between 18-59 years (3%). However, this variation is within the margin of error of the sample. There was no significant variation in literacy rates by other demographic indicators.
9% of households across the priority districts reported having at least one member having migrated for work, either within Nepal or abroad. This varied across the districts, with Sindhupalchok (25%) Lamjung (23%), Dhading (19%) and Gorkha (19%) reporting the highest levels of migration. This appears to reflect the higher levels of migration in rural areas than urban areas, as shown in table 5. The rates of migration were also higher for those households in hard-to-reach areas (15%) than areas accessible by road (9%).
Table 5: Migration rates by location type
Location type No member migrated Member migrated
Rural 87% 13%
Urban 94% 6%
Livelihoods
The most commonly reported primary income source before the earthquake was owning a business, reported by 19% of households as their first income source. This was followed by crop farming (18%) and formal salaried labour (14%). Following the earthquake, the primary income sources generally have remained stable, with business, crop farming and formal job remaining at the same levels.
As highlighted in the baseline report, there is a variation in income sources by district, largely reflective of the concentration of business related income sources in urban centres, especially Kathmandu, where 42% of households reported business as an income source.
Nepal Earthquake Recovery Monitoring Assessment – November 2015
www.sheltercluster.org 19
While the overall proportions have remained stable, 10% of households did report a change in their primary source of income in the past year, with the proportion of change particularly high in Makwanpur (23%), Bhaktapur (19%) and Sindhupalchok (18%).
When looking at all sources of income (respondents could choose up to three) there was still little variation in income sources pre and post-earthquake. Notably the baseline report observed that 55% of respondents were engaged in subsistence farming, whilst only 47% reported so for this report; a figure that was within the margin of error. These households may be particularly vulnerable to shocks, although, the stability of agricultural activities (crop farming, livestock farming and subsistence farming), indicates that disruption to the planting season, highlighted as a risk in the baseline report, did not have a significant impact on the income sources of households. Similarly the National Planning Commission highlighted this risk.8 This is possibly due to households prioritising agricultural inputs over reconstruction in both the application of labour, and the distribution of household finances as observed in the Asia Foundation report of June 2015: “as the planting of crops such as rice and wheat had not yet begun at the time of the first quake, the impact on farming was relatively low; by mid-June, most farmers had resumed their work.”9
The findings on livelihoods differ from some other data sources available on the reliance on remittances, with the census of 2011 suggesting 35% of households receive remittances, and OCHA reporting that 30% were entirely dependent on remittances.10 In the data for this report, only 14% reported receiving remittances, either before or after the earthquake.
Housing, Land and Property
The vast majority of households across the priority districts (92%), reported that they owned both their pre-earthquake house and the land on which it was situated. A smaller proportion (6%) reported renting both their pre-earthquake property and the land it is on. The only variation by district is the higher proportion of those renting in Kathmandu (19%), compared to 80% owning their property. This reflects the findings of the baseline assessment, which found that 91% owned the property and the land they lived on prior to the earthquake, and the increased rental rates in the Kathmandu Valley. These findings corroborate those of the baseline report, where 91% of respondents indicated owning the land on which their pre-earthquake house was built, and 8% were renting. There is little variation by vulnerability groups, with those households with a vulnerability score of 10+ being marginally less likely to own their property, as shown in table 6.
8 National Planning Commission, Post-Disaster Needs Assessment - Executive Summary, p. 8
9 The Asia Foundation, Independent Impacts and Recovery Monitoring Nepal Phase 1: June 2015, p.18
10 UNOCHA - Nepal Earthquake Assessment Unit, Note on Migration and Remittances, August 2015
The non-priority district of Lamjung has a lower proportion of households reporting possession of a victim card than any of the priority districts – just 34% compared to the priority district average of 63%. The lower prioritization for assistance has also led to an increase in the migration rates within households. In total 23% of households in Lamjung reported at least one member having migrated to a different part of Nepal or abroad for work; the highest of any district and above the priority district average of 9%. The higher migration rate is matched by an increased proportion of households reporting remittances as a pre-earthquake primary income source (23%) than any other district. After the earthquake income sources have remained stable in Lamjung, with remittances continuing to be reported as the primary income source for 23% of households. Lamjung also has a higher proportion of households continuing to live in their pre-earthquake house (91%). Even among only those respondents whose pre-earthquake house was damaged only 16% in Lamjung had moved as a result – the lowest of the assessed districts.
Box 1: Demographics and Livelihoods in Lamjung
Nepal Earthquake Recovery Monitoring Assessment – November 2015
www.sheltercluster.org 20
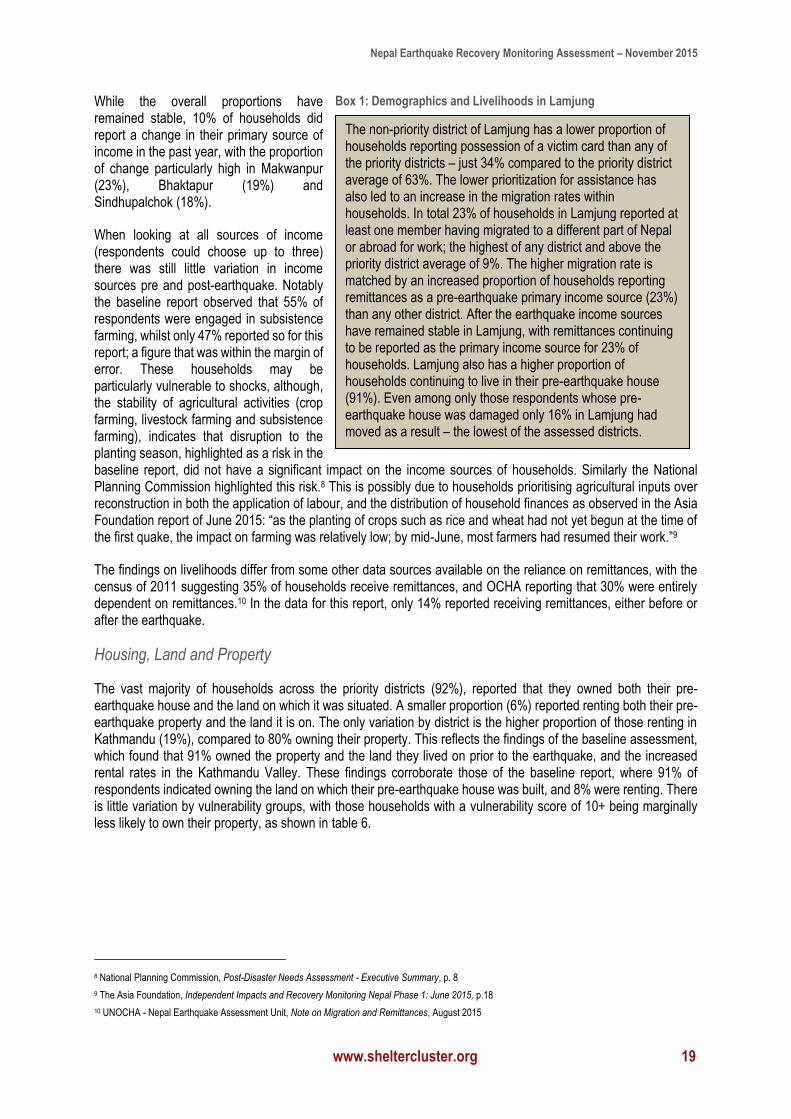
Table 6: Pre-earthquake property arrangement, by vulnerability score
Vulnerability score Own house and plot Rent house and plot Other
0 100% 0% 0%
1 98% 0% 2%
2 97% 0% 3%
3 96% 3% 1%
4 94% 3% 2%
5 95% 3% 2%
6 96% 2% 2%
7 93% 3% 4%
8 94% 3% 3%
9 94% 5% 1%
10+ 88% 6% 7%
Similarly, 90% of respondents in the priority districts reported having had at any point in time a land title certificate or rental agreement for their property. 4% reported having had a verbal agreement, with only 4% reporting no documentation or agreement. Only 3% of respondents reported having lost their documentation, and less than 1% of these reported they had lost their documentation as a result of the earthquake. Overall, 88% of respondents own their pre-earthquake housing, and have a land title document still in their possession.
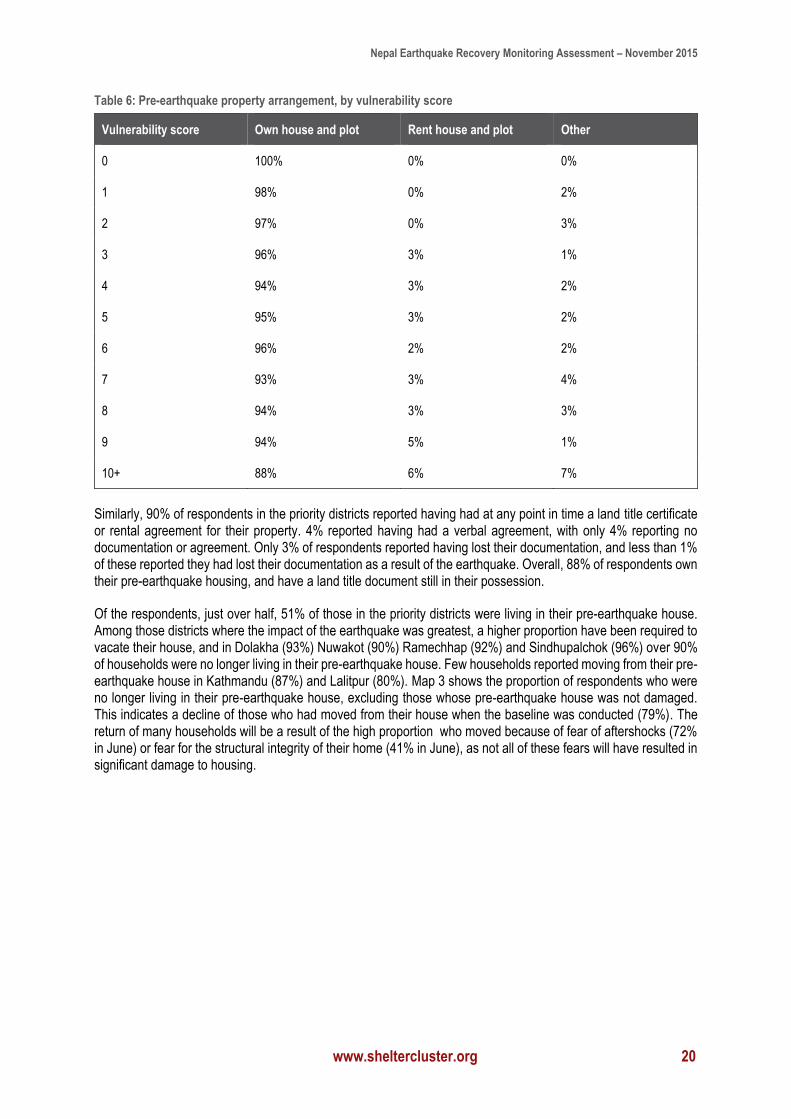
Of the respondents, just over half, 51% of those in the priority districts were living in their pre-earthquake house. Among those districts where the impact of the earthquake was greatest, a higher proportion have been required to vacate their house, and in Dolakha (93%) Nuwakot (90%) Ramechhap (92%) and Sindhupalchok (96%) over 90% of households were no longer living in their pre-earthquake house. Few households reported moving from their pre-earthquake house in Kathmandu (87%) and Lalitpur (80%). Map 3 shows the proportion of respondents who were no longer living in their pre-earthquake house, excluding those whose pre-earthquake house was not damaged. This indicates a decline of those who had moved from their house when the baseline was conducted (79%). The return of many households will be a result of the high proportion who moved because of fear of aftershocks (72% in June) or fear for the structural integrity of their home (41% in June), as not all of these fears will have resulted in significant damage to housing.
Nepal Earthquake Recovery Monitoring Assessment – November 2015
www.sheltercluster.org 21
Map 3: Proportion of households reporting property damage who left their pre-earthquake house
Of the 49% of households in the priority districts reporting they had moved out of their pre-earthquake house, only 10% reported they had left their existing community, all of which reported being in temporary shelter. The majority of households assessed (68%) reported they were living in temporary shelter next to their existing house matching findings from the baseline assessment. 20% of those who moved (5% of the overall population), largely concentrated in urban areas of Kathmandu and Makwanpur, reported renting or building another property. Overall, inclusive of all damage and non-damaged houses, 43% of households in the priority districts reported they are currently living in temporary shelter.
The primary reason for leaving the pre-earthquake house was damage, reported by 42% of all households in the priority districts. However, relatively high proportions of households reported fear of aftershocks as the motivation for moving in Gorkha (20%), Kavre (11%) and Okhaldhunga (13%).
Nepal Earthquake Recovery Monitoring Assessment – November 2015
www.sheltercluster.org 22
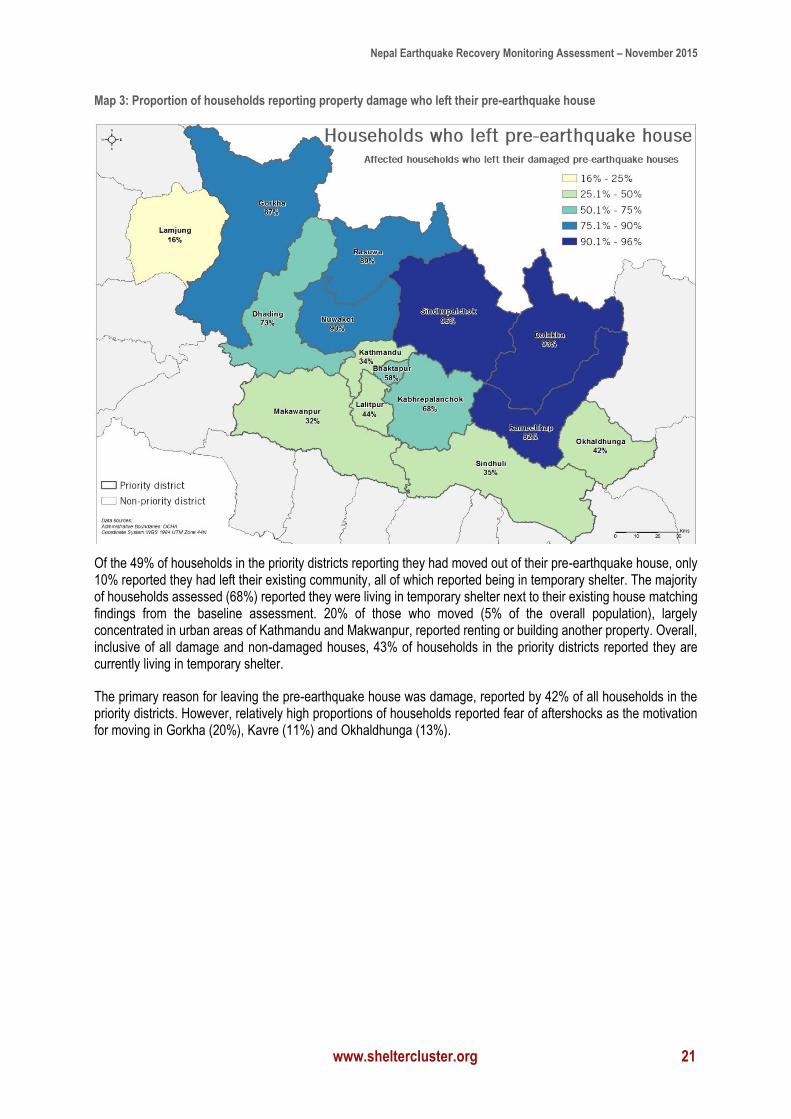
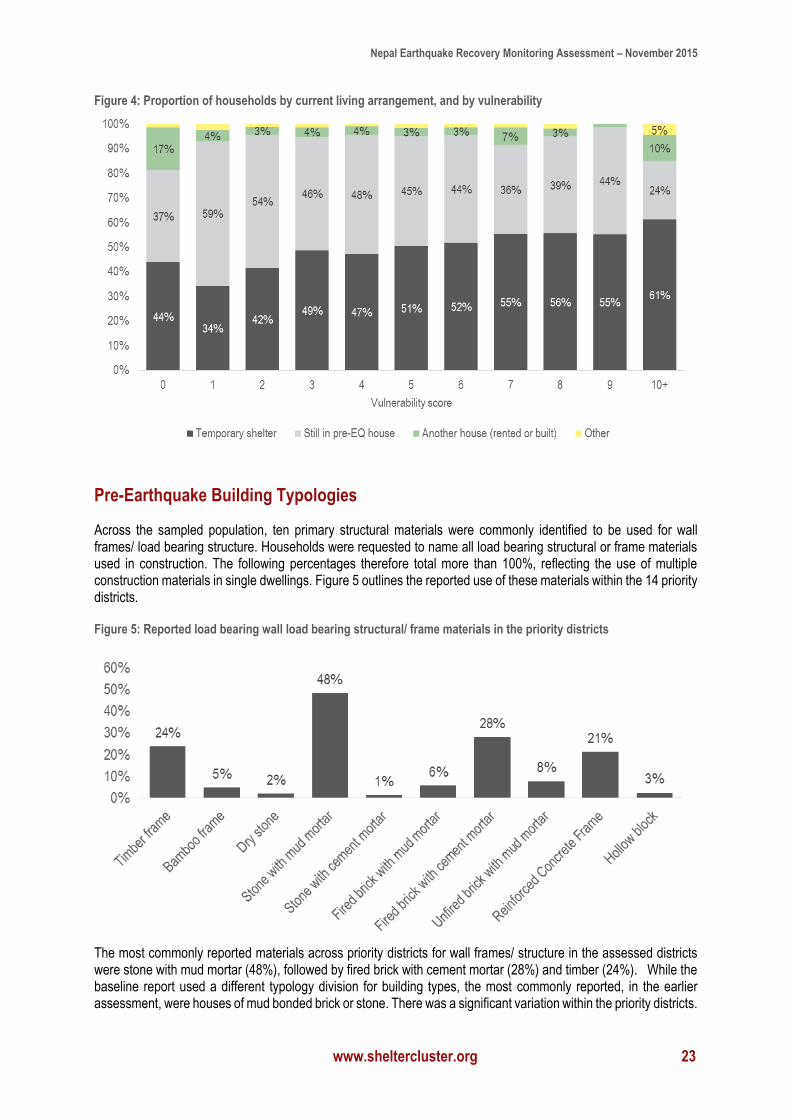
There was no significant variation in those leaving their homes by gender of head of household, but those of the Dalit (66%) caste were well above the district average. There was a higher proportion of those with a vulnerability score of 10+ who had had left their pre-earthquake house (76%), compared to the district average, although 63% of those with a vulnerability score of 0 had also left their home. However, households with a higher vulnerability score are more likely to have left their pre-earthquake house and be currently living in temporary shelter, as indicated by figure 4, below. Even amongst those displaced from their pre-earthquake house, very few households reported having to share spaces with other households, just 13% in the priority districts. However, the proportion was much higher in Lalitpur, where 17% reported sharing a bathroom, 17% reported sharing kitchen facilities, and 23% reported sharing sleeping spaces.
Map 4: Households still living in a house damaged by the earthquakes
Nepal Earthquake Recovery Monitoring Assessment – November 2015
www.sheltercluster.org 23
Figure 4: Proportion of households by current living arrangement, and by vulnerability
Pre-Earthquake Building Typologies
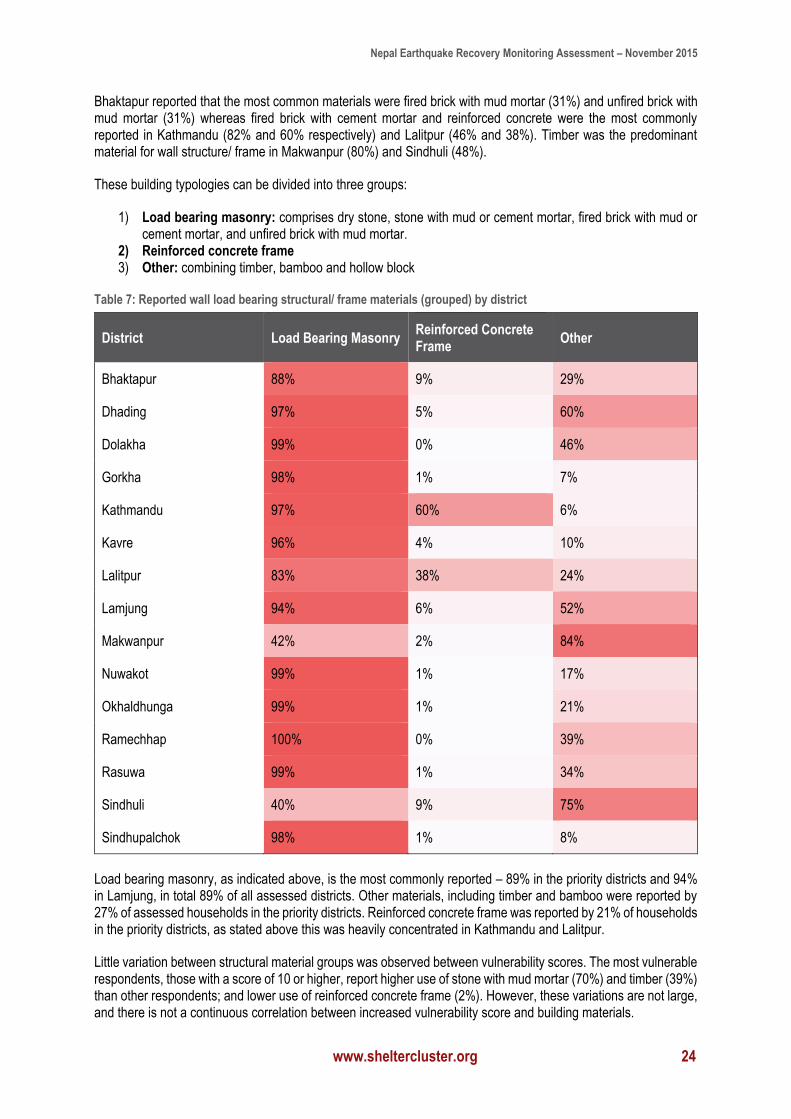
Across the sampled population, ten primary structural materials were commonly identified to be used for wall frames/ load bearing structure. Households were requested to name all load bearing structural or frame materials used in construction. The following percentages therefore total more than 100%, reflecting the use of multiple construction materials in single dwellings. Figure 5 outlines the reported use of these materials within the 14 priority districts.
Figure 5: Reported load bearing wall load bearing structural/ frame materials in the priority districts
The most commonly reported materials across priority districts for wall frames/ structure in the assessed districts were stone with mud mortar (48%), followed by fired brick with cement mortar (28%) and timber (24%). While the baseline report used a different typology division for building types, the most commonly reported, in the earlier assessment, were houses of mud bonded brick or stone. There was a significant variation within the priority districts.
Nepal Earthquake Recovery Monitoring Assessment – November 2015
www.sheltercluster.org 24
Bhaktapur reported that the most common materials were fired brick with mud mortar (31%) and unfired brick with mud mortar (31%) whereas fired brick with cement mortar and reinforced concrete were the most commonly reported in Kathmandu (82% and 60% respectively) and Lalitpur (46% and 38%). Timber was the predominant material for wall structure/ frame in Makwanpur (80%) and Sindhuli (48%).
These building typologies can be divided into three groups:
1) Load bearing masonry: comprises dry stone, stone with mud or cement mortar, fired brick with mud or cement mortar, and unfired brick with mud mortar.
2) Reinforced concrete frame 3) Other: combining timber, bamboo and hollow block
Table 7: Reported wall load bearing structural/ frame materials (grouped) by district
District Load Bearing Masonry Reinforced Concrete Frame
Other
Bhaktapur 88% 9% 29%
Dhading 97% 5% 60%
Dolakha 99% 0% 46%
Gorkha 98% 1% 7%
Kathmandu 97% 60% 6%
Kavre 96% 4% 10%
Lalitpur 83% 38% 24%
Lamjung 94% 6% 52%
Makwanpur 42% 2% 84%
Nuwakot 99% 1% 17%
Okhaldhunga 99% 1% 21%
Ramechhap 100% 0% 39%
Rasuwa 99% 1% 34%
Sindhuli 40% 9% 75%
Sindhupalchok 98% 1% 8%
Load bearing masonry, as indicated above, is the most commonly reported – 89% in the priority districts and 94% in Lamjung, in total 89% of all assessed districts. Other materials, including timber and bamboo were reported by 27% of assessed households in the priority districts. Reinforced concrete frame was reported by 21% of households in the priority districts, as stated above this was heavily concentrated in Kathmandu and Lalitpur.
Little variation between structural material groups was observed between vulnerability scores. The most vulnerable respondents, those with a score of 10 or higher, report higher use of stone with mud mortar (70%) and timber (39%) than other respondents; and lower use of reinforced concrete frame (2%). However, these variations are not large, and there is not a continuous correlation between increased vulnerability score and building materials.
Nepal Earthquake Recovery Monitoring Assessment – November 2015
www.sheltercluster.org 25
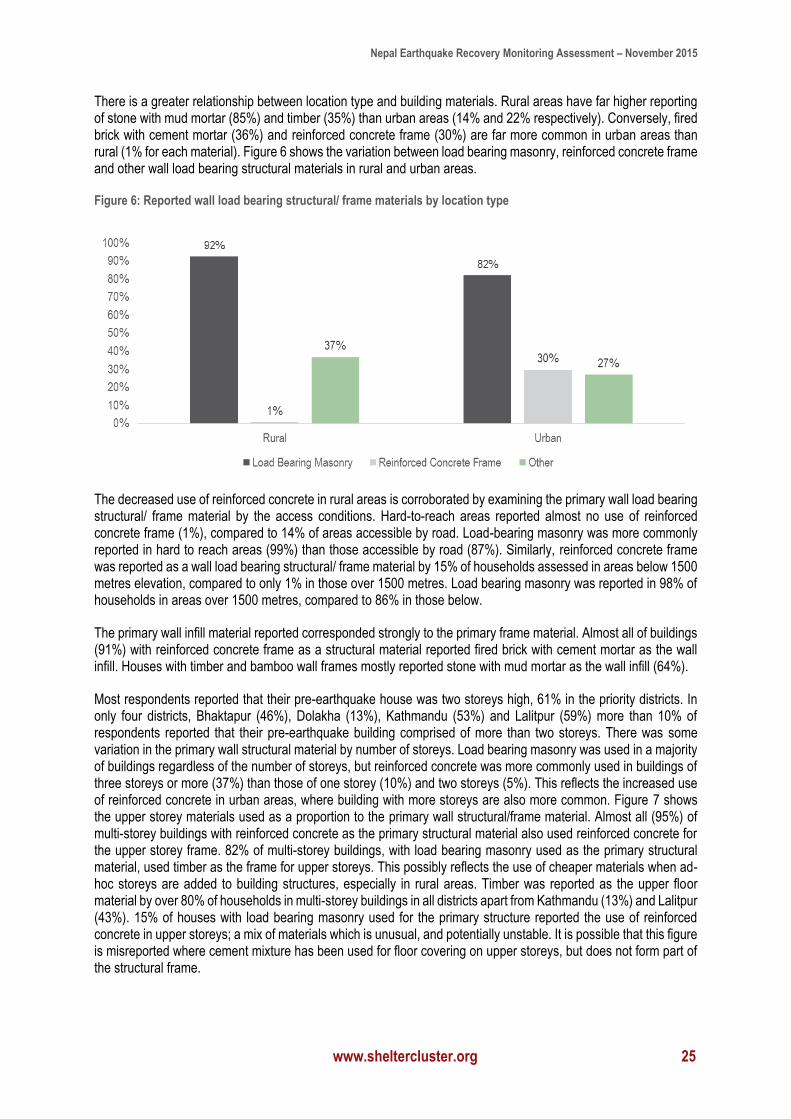
There is a greater relationship between location type and building materials. Rural areas have far higher reporting of stone with mud mortar (85%) and timber (35%) than urban areas (14% and 22% respectively). Conversely, fired brick with cement mortar (36%) and reinforced concrete frame (30%) are far more common in urban areas than rural (1% for each material). Figure 6 shows the variation between load bearing masonry, reinforced concrete frame and other wall load bearing structural materials in rural and urban areas.
Figure 6: Reported wall load bearing structural/ frame materials by location type
The decreased use of reinforced concrete in rural areas is corroborated by examining the primary wall load bearing structural/ frame material by the access conditions. Hard-to-reach areas reported almost no use of reinforced concrete frame (1%), compared to 14% of areas accessible by road. Load-bearing masonry was more commonly reported in hard to reach areas (99%) than those accessible by road (87%). Similarly, reinforced concrete frame was reported as a wall load bearing structural/ frame material by 15% of households assessed in areas below 1500 metres elevation, compared to only 1% in those over 1500 metres. Load bearing masonry was reported in 98% of households in areas over 1500 metres, compared to 86% in those below.
The primary wall infill material reported corresponded strongly to the primary frame material. Almost all of buildings (91%) with reinforced concrete frame as a structural material reported fired brick with cement mortar as the wall infill. Houses with timber and bamboo wall frames mostly reported stone with mud mortar as the wall infill (64%).
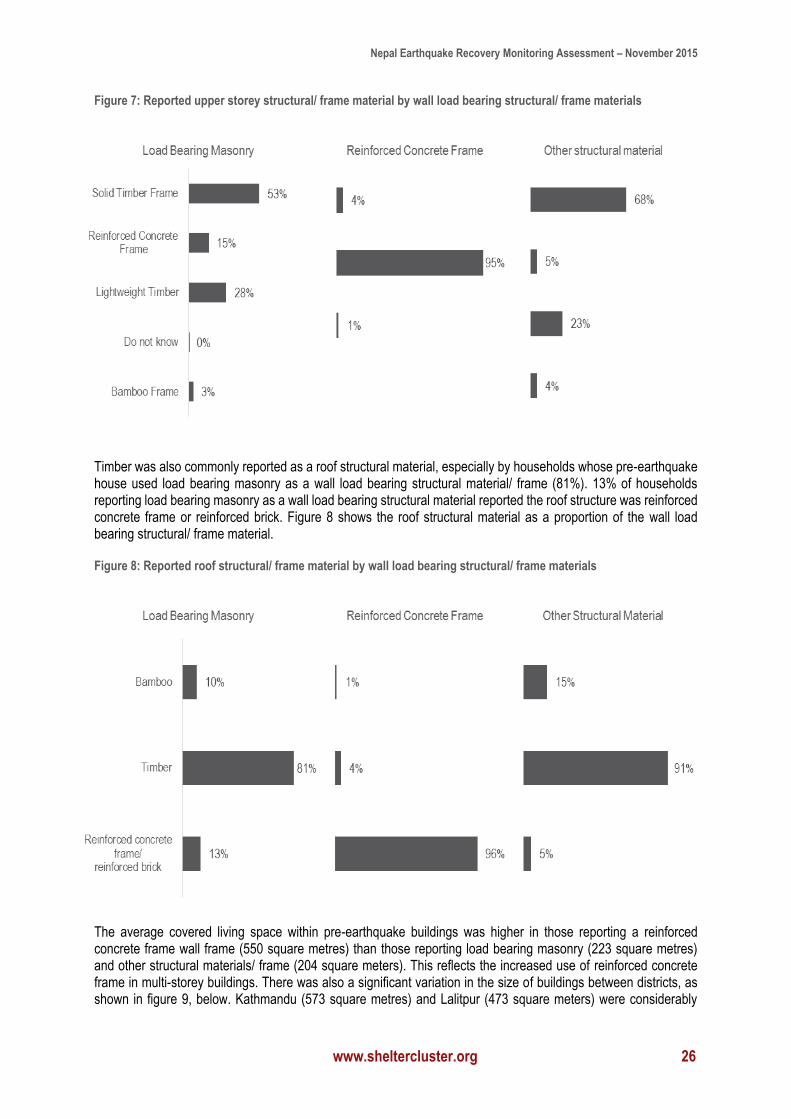
Most respondents reported that their pre-earthquake house was two storeys high, 61% in the priority districts. In only four districts, Bhaktapur (46%), Dolakha (13%), Kathmandu (53%) and Lalitpur (59%) more than 10% of respondents reported that their pre-earthquake building comprised of more than two storeys. There was some variation in the primary wall structural material by number of storeys. Load bearing masonry was used in a majority of buildings regardless of the number of storeys, but reinforced concrete was more commonly used in buildings of three storeys or more (37%) than those of one storey (10%) and two storeys (5%). This reflects the increased use of reinforced concrete in urban areas, where building with more storeys are also more common. Figure 7 shows the upper storey materials used as a proportion to the primary wall structural/frame material. Almost all (95%) of multi-storey buildings with reinforced concrete as the primary structural material also used reinforced concrete for the upper storey frame. 82% of multi-storey buildings, with load bearing masonry used as the primary structural material, used timber as the frame for upper storeys. This possibly reflects the use of cheaper materials when ad-hoc storeys are added to building structures, especially in rural areas. Timber was reported as the upper floor material by over 80% of households in multi-storey buildings in all districts apart from Kathmandu (13%) and Lalitpur (43%). 15% of houses with load bearing masonry used for the primary structure reported the use of reinforced concrete in upper storeys; a mix of materials which is unusual, and potentially unstable. It is possible that this figure is misreported where cement mixture has been used for floor covering on upper storeys, but does not form part of the structural frame.
Nepal Earthquake Recovery Monitoring Assessment – November 2015
www.sheltercluster.org 26
Figure 7: Reported upper storey structural/ frame material by wall load bearing structural/ frame materials
Timber was also commonly reported as a roof structural material, especially by households whose pre-earthquake house used load bearing masonry as a wall load bearing structural material/ frame (81%). 13% of households reporting load bearing masonry as a wall load bearing structural material reported the roof structure was reinforced concrete frame or reinforced brick. Figure 8 shows the roof structural material as a proportion of the wall load bearing structural/ frame material.
Figure 8: Reported roof structural/ frame material by wall load bearing structural/ frame materials
The average covered living space within pre-earthquake buildings was higher in those reporting a reinforced concrete frame wall frame (550 square metres) than those reporting load bearing masonry (223 square metres) and other structural materials/ frame (204 square meters). This reflects the increased use of reinforced concrete frame in multi-storey buildings. There was also a significant variation in the size of buildings between districts, as shown in figure 9, below. Kathmandu (573 square metres) and Lalitpur (473 square meters) were considerably
Nepal Earthquake Recovery Monitoring Assessment – November 2015
www.sheltercluster.org 27
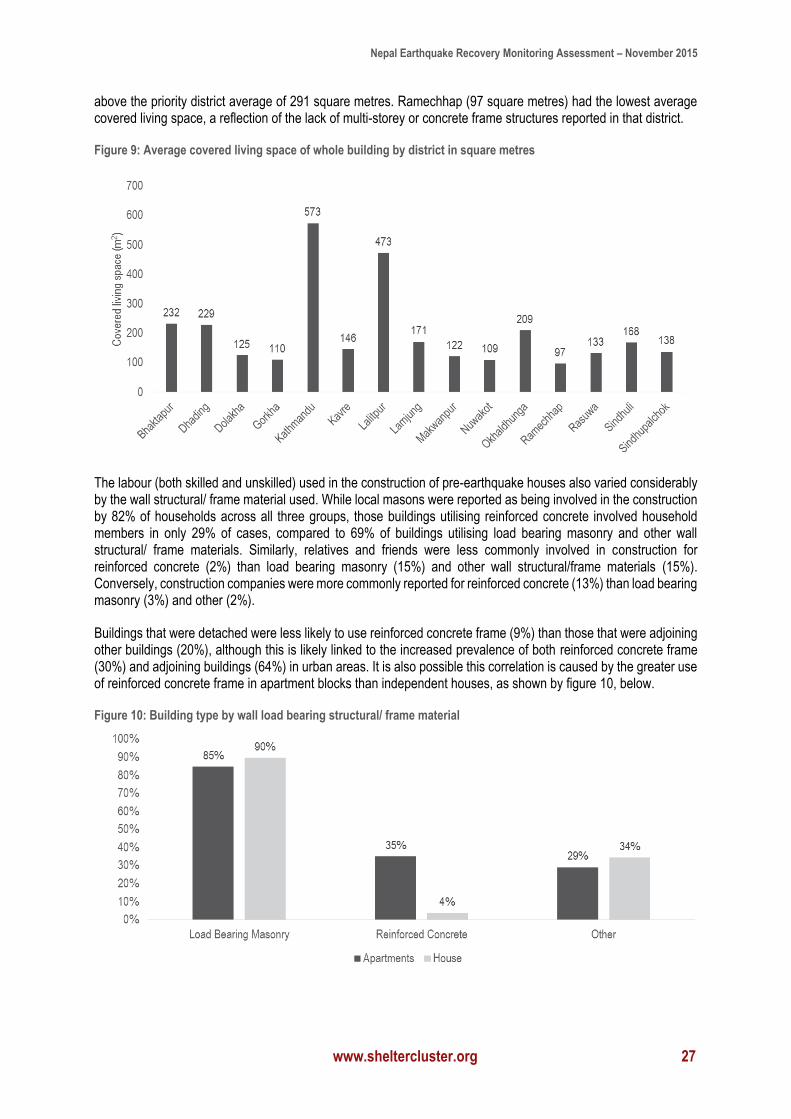
above the priority district average of 291 square metres. Ramechhap (97 square metres) had the lowest average covered living space, a reflection of the lack of multi-storey or concrete frame structures reported in that district.
Figure 9: Average covered living space of whole building by district in square metres
The labour (both skilled and unskilled) used in the construction of pre-earthquake houses also varied considerably by the wall structural/ frame material used. While local masons were reported as being involved in the construction by 82% of households across all three groups, those buildings utilising reinforced concrete involved household members in only 29% of cases, compared to 69% of buildings utilising load bearing masonry and other wall structural/ frame materials. Similarly, relatives and friends were less commonly involved in construction for reinforced concrete (2%) than load bearing masonry (15%) and other wall structural/frame materials (15%). Conversely, construction companies were more commonly reported for reinforced concrete (13%) than load bearing masonry (3%) and other (2%).
Buildings that were detached were less likely to use reinforced concrete frame (9%) than those that were adjoining other buildings (20%), although this is likely linked to the increased prevalence of both reinforced concrete frame (30%) and adjoining buildings (64%) in urban areas. It is also possible this correlation is caused by the greater use of reinforced concrete frame in apartment blocks than independent houses, as shown by figure 10, below.
Figure 10: Building type by wall load bearing structural/ frame material
Nepal Earthquake Recovery Monitoring Assessment – November 2015
www.sheltercluster.org 28
Pre-Earthquake Housing Damage
Overall damage to pre-Earthquake housing
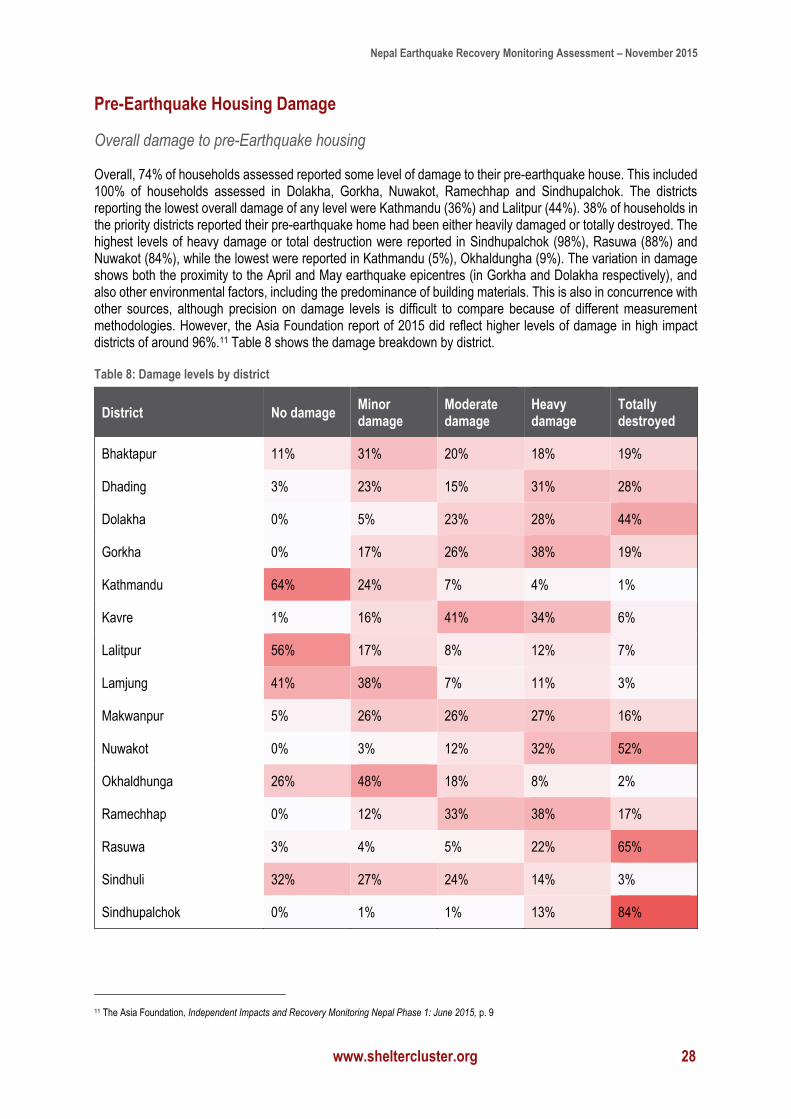
Overall, 74% of households assessed reported some level of damage to their pre-earthquake house. This included 100% of households assessed in Dolakha, Gorkha, Nuwakot, Ramechhap and Sindhupalchok. The districts reporting the lowest overall damage of any level were Kathmandu (36%) and Lalitpur (44%). 38% of households in the priority districts reported their pre-earthquake home had been either heavily damaged or totally destroyed. The highest levels of heavy damage or total destruction were reported in Sindhupalchok (98%), Rasuwa (88%) and Nuwakot (84%), while the lowest were reported in Kathmandu (5%), Okhaldungha (9%). The variation in damage shows both the proximity to the April and May earthquake epicentres (in Gorkha and Dolakha respectively), and also other environmental factors, including the predominance of building materials. This is also in concurrence with other sources, although precision on damage levels is difficult to compare because of different measurement methodologies. However, the Asia Foundation report of 2015 did reflect higher levels of damage in high impact districts of around 96%.11 Table 8 shows the damage breakdown by district.
Table 8: Damage levels by district
District No damage Minor damage
Moderate damage
Heavy damage
Totally destroyed
Bhaktapur 11% 31% 20% 18% 19%
Dhading 3% 23% 15% 31% 28%
Dolakha 0% 5% 23% 28% 44%
Gorkha 0% 17% 26% 38% 19%
Kathmandu 64% 24% 7% 4% 1%
Kavre 1% 16% 41% 34% 6%
Lalitpur 56% 17% 8% 12% 7%
Lamjung 41% 38% 7% 11% 3%
Makwanpur 5% 26% 26% 27% 16%
Nuwakot 0% 3% 12% 32% 52%
Okhaldhunga 26% 48% 18% 8% 2%
Ramechhap 0% 12% 33% 38% 17%
Rasuwa 3% 4% 5% 22% 65%
Sindhuli 32% 27% 24% 14% 3%
Sindhupalchok 0% 1% 1% 13% 84%
11 The Asia Foundation, Independent Impacts and Recovery Monitoring Nepal Phase 1: June 2015, p. 9
Nepal Earthquake Recovery Monitoring Assessment – November 2015
www.sheltercluster.org 29
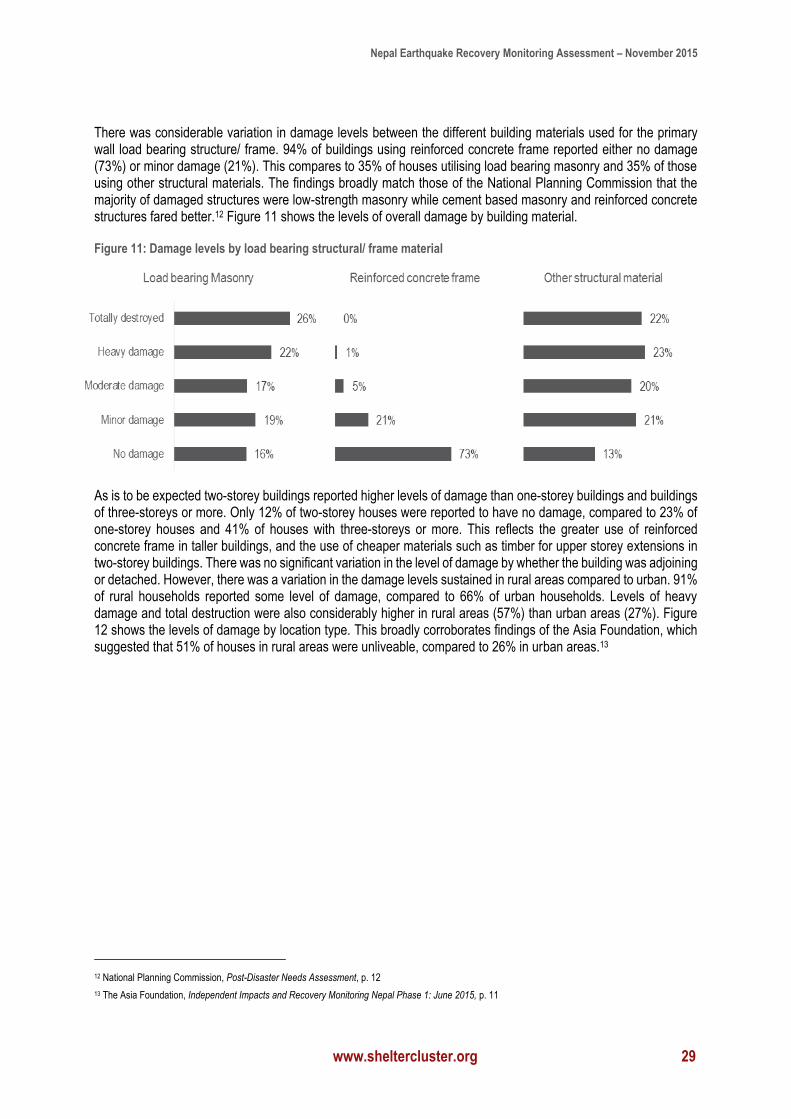
There was considerable variation in damage levels between the different building materials used for the primary wall load bearing structure/ frame. 94% of buildings using reinforced concrete frame reported either no damage (73%) or minor damage (21%). This compares to 35% of houses utilising load bearing masonry and 35% of those using other structural materials. The findings broadly match those of the National Planning Commission that the majority of damaged structures were low-strength masonry while cement based masonry and reinforced concrete structures fared better.12 Figure 11 shows the levels of overall damage by building material.
Figure 11: Damage levels by load bearing structural/ frame material
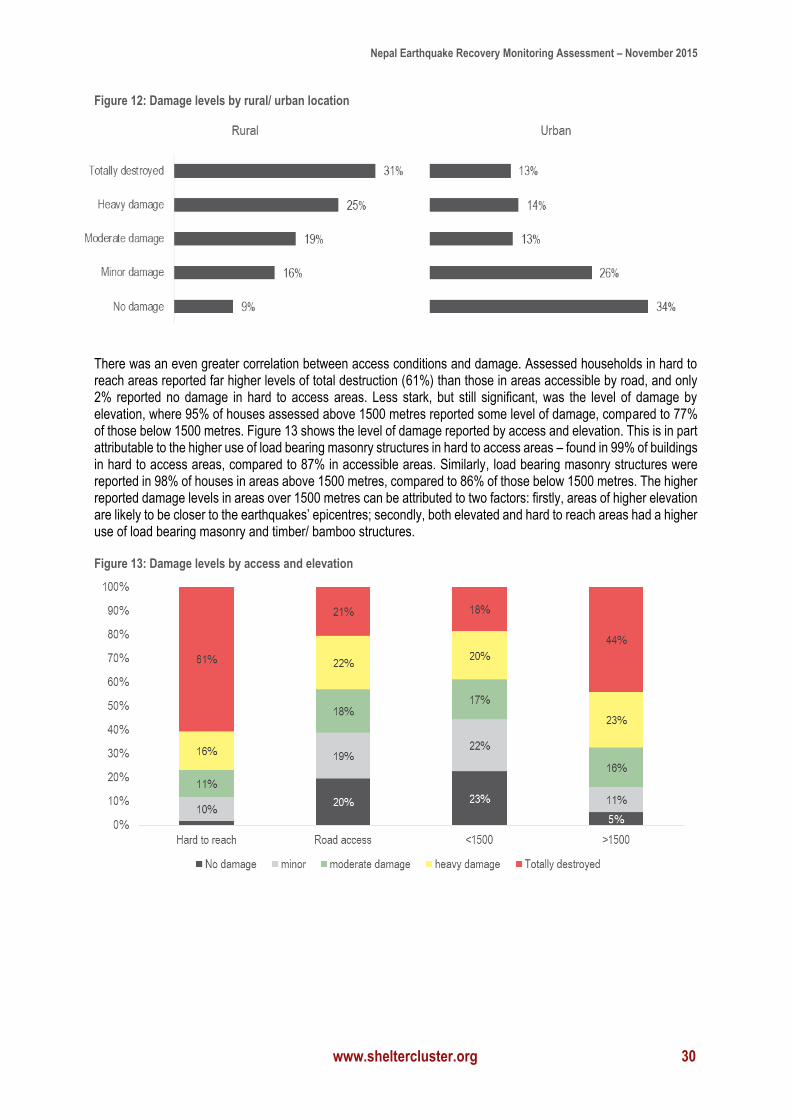
As is to be expected two-storey buildings reported higher levels of damage than one-storey buildings and buildings of three-storeys or more. Only 12% of two-storey houses were reported to have no damage, compared to 23% of one-storey houses and 41% of houses with three-storeys or more. This reflects the greater use of reinforced concrete frame in taller buildings, and the use of cheaper materials such as timber for upper storey extensions in two-storey buildings. There was no significant variation in the level of damage by whether the building was adjoining or detached. However, there was a variation in the damage levels sustained in rural areas compared to urban. 91% of rural households reported some level of damage, compared to 66% of urban households. Levels of heavy damage and total destruction were also considerably higher in rural areas (57%) than urban areas (27%). Figure 12 shows the levels of damage by location type. This broadly corroborates findings of the Asia Foundation, which suggested that 51% of houses in rural areas were unliveable, compared to 26% in urban areas.13
12 National Planning Commission, Post-Disaster Needs Assessment, p. 12
13 The Asia Foundation, Independent Impacts and Recovery Monitoring Nepal Phase 1: June 2015, p. 11
Nepal Earthquake Recovery Monitoring Assessment – November 2015
www.sheltercluster.org 30
Figure 12: Damage levels by rural/ urban location
There was an even greater correlation between access conditions and damage. Assessed households in hard to reach areas reported far higher levels of total destruction (61%) than those in areas accessible by road, and only 2% reported no damage in hard to access areas. Less stark, but still significant, was the level of damage by elevation, where 95% of houses assessed above 1500 metres reported some level of damage, compared to 77% of those below 1500 metres. Figure 13 shows the level of damage reported by access and elevation. This is in part attributable to the higher use of load bearing masonry structures in hard to access areas – found in 99% of buildings in hard to access areas, compared to 87% in accessible areas. Similarly, load bearing masonry structures were reported in 98% of houses in areas above 1500 metres, compared to 86% of those below 1500 metres. The higher reported damage levels in areas over 1500 metres can be attributed to two factors: firstly, areas of higher elevation are likely to be closer to the earthquakes’ epicentres; secondly, both elevated and hard to reach areas had a higher use of load bearing masonry and timber/ bamboo structures.
Figure 13: Damage levels by access and elevation
Nepal Earthquake Recovery Monitoring Assessment – November 2015
www.sheltercluster.org 31
Status of building damage assessment
Across the priority districts 79% of households reported that someone had assessed their house, with 92% of the assessments being carried out with government representatives. There is also considerable variation within the priority districts: 58% of respondents in Kathmandu, 62% in Dolakha, 69% in Sindhuli and 72% in Rasuwa reported that a building assessment has been carried out, while other districts all report over 80%. Some of this variation is caused by the higher proportions of no damage in districts such as Kathmandu. Overall 61% of houses reported to have no damage were not assessed after the earthquake. Variation by access conditions varies less markedly, with 84% of respondents in areas accessible by road reporting their property has been assessed, compared to 71% in hard to reach areas. There was no significant variation in whether houses had been assessed by rural/ urban divide or elevation.
The recommendation given generally corresponded to the level of damage, with 75% of houses reported as totally destroyed and 78% of houses with heavy damage receiving a demolition recommendation (an additional 23% of totally destroyed, and 14% of heavily damaged buildings were either not assessed or received no recommendation). However, a large proportion of houses reported as moderately damaged received a demolition recommendation (34%), compared to 31% being recommended as unsafe and requiring repair, and 19% being reported as safe but requiring repair. There was no significant correlation between a household’s vulnerability score and whether their household was assessed, or a recommendation given.
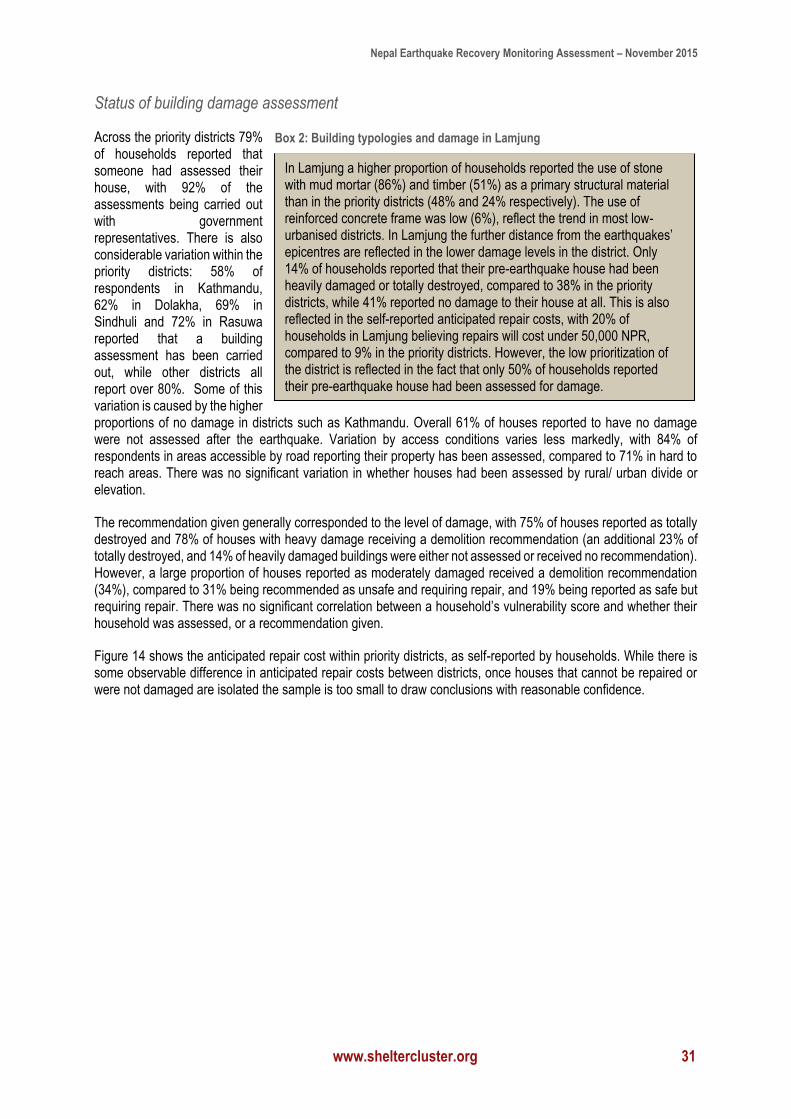
Figure 14 shows the anticipated repair cost within priority districts, as self-reported by households. While there is some observable difference in anticipated repair costs between districts, once houses that cannot be repaired or were not damaged are isolated the sample is too small to draw conclusions with reasonable confidence.
In Lamjung a higher proportion of households reported the use of stone with mud mortar (86%) and timber (51%) as a primary structural material than in the priority districts (48% and 24% respectively). The use of reinforced concrete frame was low (6%), reflect the trend in most low-urbanised districts. In Lamjung the further distance from the earthquakes’ epicentres are reflected in the lower damage levels in the district. Only 14% of households reported that their pre-earthquake house had been heavily damaged or totally destroyed, compared to 38% in the priority districts, while 41% reported no damage to their house at all. This is also reflected in the self-reported anticipated repair costs, with 20% of households in Lamjung believing repairs will cost under 50,000 NPR, compared to 9% in the priority districts. However, the low prioritization of the district is reflected in the fact that only 50% of households reported their pre-earthquake house had been assessed for damage.
Box 2: Building typologies and damage in Lamjung
Nepal Earthquake Recovery Monitoring Assessment – November 2015
www.sheltercluster.org 32
Figure 14: Self-reported anticipated repair cost in priority districts
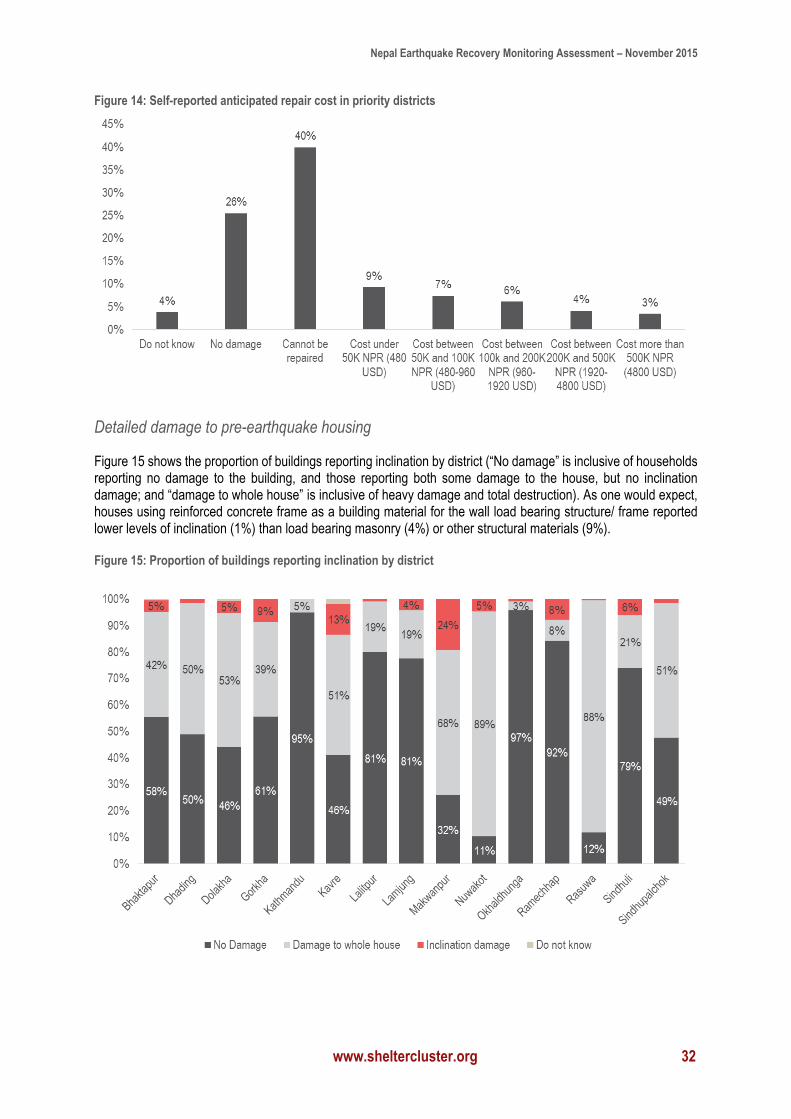
Detailed damage to pre-earthquake housing
Figure 15 shows the proportion of buildings reporting inclination by district (“No damage” is inclusive of households reporting no damage to the building, and those reporting both some damage to the house, but no inclination damage; and “damage to whole house” is inclusive of heavy damage and total destruction). As one would expect, houses using reinforced concrete frame as a building material for the wall load bearing structure/ frame reported lower levels of inclination (1%) than load bearing masonry (4%) or other structural materials (9%).
Figure 15: Proportion of buildings reporting inclination by district
Nepal Earthquake Recovery Monitoring Assessment – November 2015
www.sheltercluster.org 33
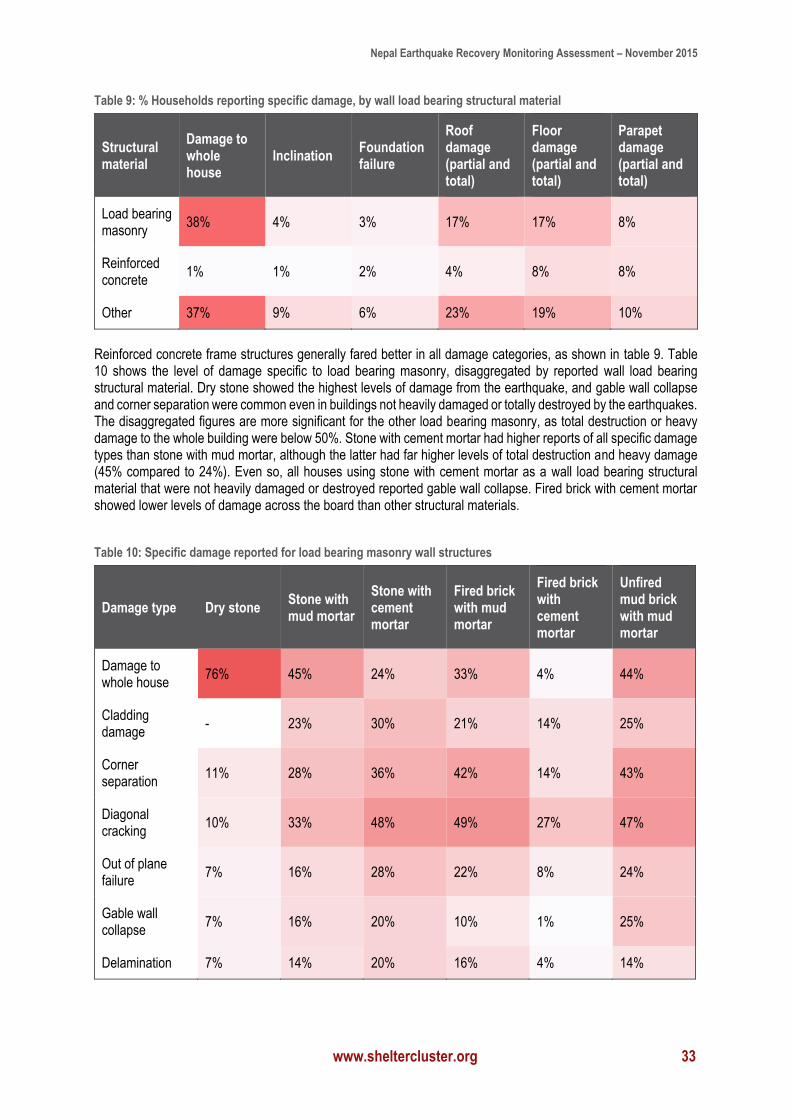
Table 9: % Households reporting specific damage, by wall load bearing structural material
Structural material
Damage to whole house
Inclination Foundation failure
Roof damage (partial and total)
Floor damage (partial and total)
Parapet damage (partial and total)
Load bearing masonry
38% 4% 3% 17% 17% 8%
Reinforced concrete
1% 1% 2% 4% 8% 8%
Other 37% 9% 6% 23% 19% 10%
Reinforced concrete frame structures generally fared better in all damage categories, as shown in table 9. Table 10 shows the level of damage specific to load bearing masonry, disaggregated by reported wall load bearing structural material. Dry stone showed the highest levels of damage from the earthquake, and gable wall collapse and corner separation were common even in buildings not heavily damaged or totally destroyed by the earthquakes. The disaggregated figures are more significant for the other load bearing masonry, as total destruction or heavy damage to the whole building were below 50%. Stone with cement mortar had higher reports of all specific damage types than stone with mud mortar, although the latter had far higher levels of total destruction and heavy damage (45% compared to 24%). Even so, all houses using stone with cement mortar as a wall load bearing structural material that were not heavily damaged or destroyed reported gable wall collapse. Fired brick with cement mortar showed lower levels of damage across the board than other structural materials.
Table 10: Specific damage reported for load bearing masonry wall structures
Damage type Dry stone Stone with mud mortar
Stone with cement mortar
Fired brick with mud mortar
Fired brick with cement mortar
Unfired mud brick with mud mortar
Damage to whole house
76% 45% 24% 33% 4% 44%
Cladding damage
- 23% 30% 21% 14% 25%
Corner separation
11% 28% 36% 42% 14% 43%
Diagonal cracking
10% 33% 48% 49% 27% 47%
Out of plane failure
7% 16% 28% 22% 8% 24%
Gable wall collapse
7% 16% 20% 10% 1% 25%
Delamination 7% 14% 20% 16% 4% 14%
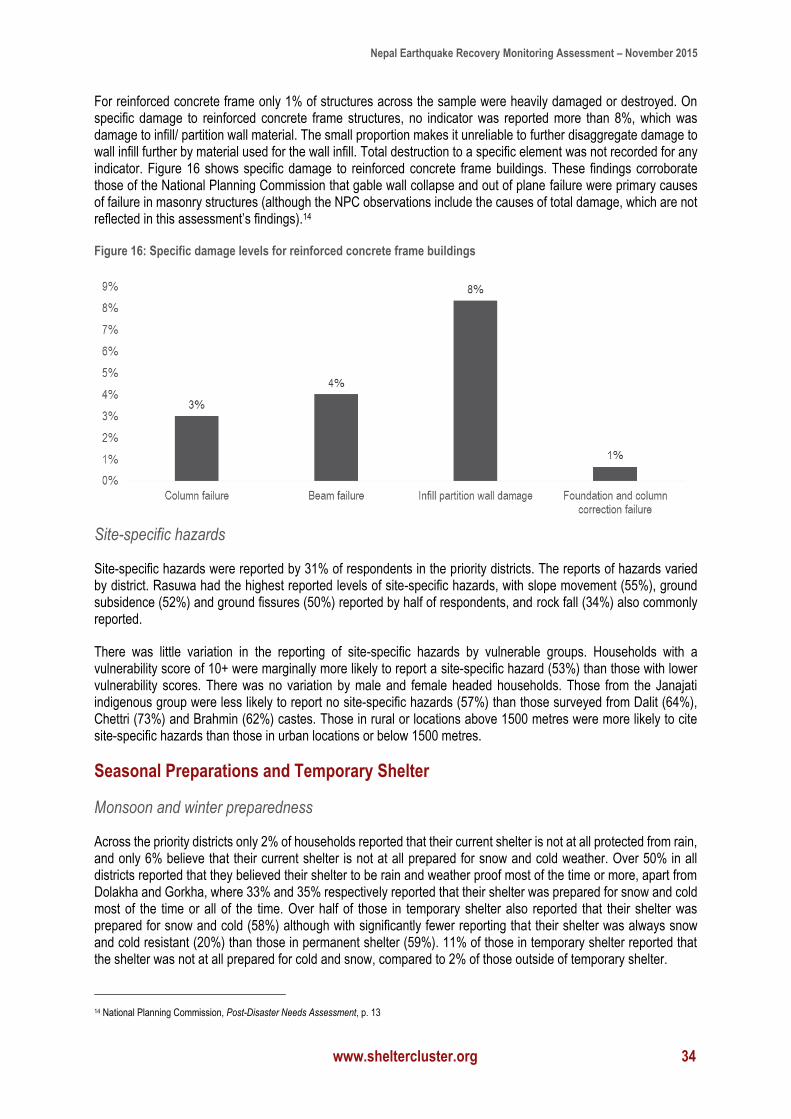
Nepal Earthquake Recovery Monitoring Assessment – November 2015
www.sheltercluster.org 34
For reinforced concrete frame only 1% of structures across the sample were heavily damaged or destroyed. On specific damage to reinforced concrete frame structures, no indicator was reported more than 8%, which was damage to infill/ partition wall material. The small proportion makes it unreliable to further disaggregate damage to wall infill further by material used for the wall infill. Total destruction to a specific element was not recorded for any indicator. Figure 16 shows specific damage to reinforced concrete frame buildings. These findings corroborate those of the National Planning Commission that gable wall collapse and out of plane failure were primary causes of failure in masonry structures (although the NPC observations include the causes of total damage, which are not reflected in this assessment’s findings).14
Figure 16: Specific damage levels for reinforced concrete frame buildings
Site-specific hazards
Site-specific hazards were reported by 31% of respondents in the priority districts. The reports of hazards varied by district. Rasuwa had the highest reported levels of site-specific hazards, with slope movement (55%), ground subsidence (52%) and ground fissures (50%) reported by half of respondents, and rock fall (34%) also commonly reported.
There was little variation in the reporting of site-specific hazards by vulnerable groups. Households with a vulnerability score of 10+ were marginally more likely to report a site-specific hazard (53%) than those with lower vulnerability scores. There was no variation by male and female headed households. Those from the Janajati indigenous group were less likely to report no site-specific hazards (57%) than those surveyed from Dalit (64%), Chettri (73%) and Brahmin (62%) castes. Those in rural or locations above 1500 metres were more likely to cite site-specific hazards than those in urban locations or below 1500 metres.
Seasonal Preparations and Temporary Shelter
Monsoon and winter preparedness
Across the priority districts only 2% of households reported that their current shelter is not at all protected from rain, and only 6% believe that their current shelter is not at all prepared for snow and cold weather. Over 50% in all districts reported that they believed their shelter to be rain and weather proof most of the time or more, apart from Dolakha and Gorkha, where 33% and 35% respectively reported that their shelter was prepared for snow and cold most of the time or all of the time. Over half of those in temporary shelter also reported that their shelter was prepared for snow and cold (58%) although with significantly fewer reporting that their shelter was always snow and cold resistant (20%) than those in permanent shelter (59%). 11% of those in temporary shelter reported that the shelter was not at all prepared for cold and snow, compared to 2% of those outside of temporary shelter.
14 National Planning Commission, Post-Disaster Needs Assessment, p. 13
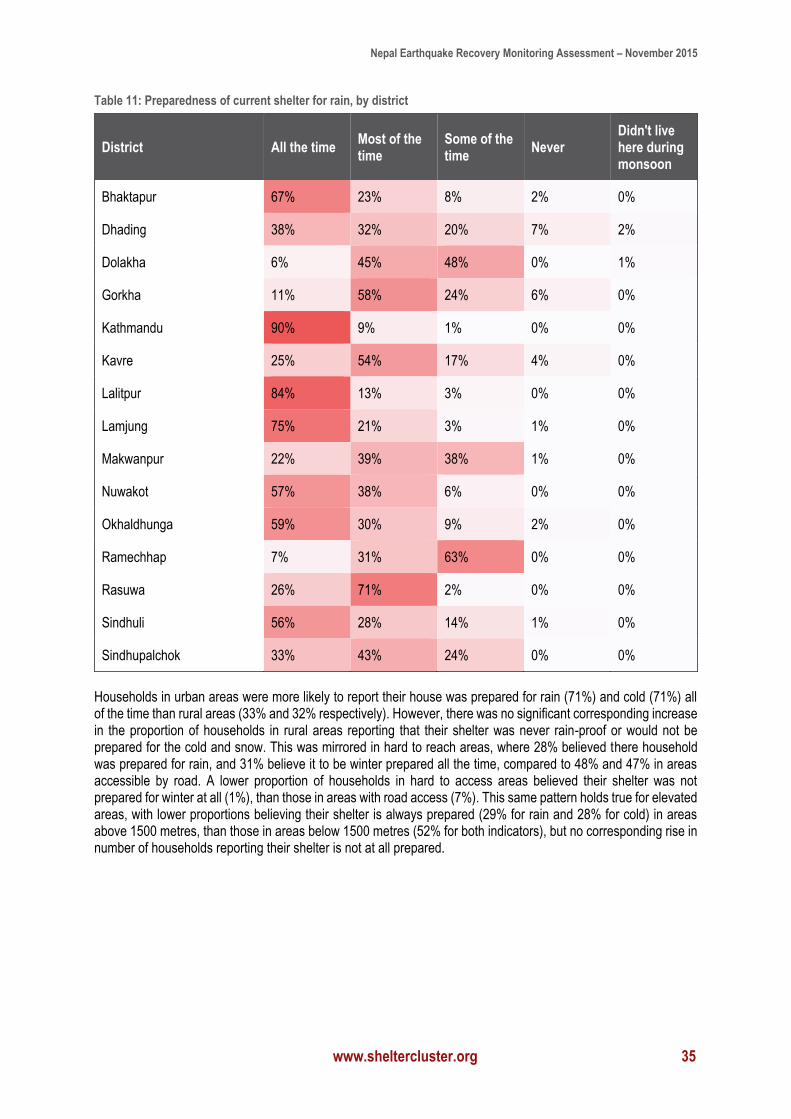
Nepal Earthquake Recovery Monitoring Assessment – November 2015
www.sheltercluster.org 35
Table 11: Preparedness of current shelter for rain, by district
District All the time Most of the time
Some of the time
Never Didn't live here during monsoon
Bhaktapur 67% 23% 8% 2% 0%
Dhading 38% 32% 20% 7% 2%
Dolakha 6% 45% 48% 0% 1%
Gorkha 11% 58% 24% 6% 0%
Kathmandu 90% 9% 1% 0% 0%
Kavre 25% 54% 17% 4% 0%
Lalitpur 84% 13% 3% 0% 0%
Lamjung 75% 21% 3% 1% 0%
Makwanpur 22% 39% 38% 1% 0%
Nuwakot 57% 38% 6% 0% 0%
Okhaldhunga 59% 30% 9% 2% 0%
Ramechhap 7% 31% 63% 0% 0%
Rasuwa 26% 71% 2% 0% 0%
Sindhuli 56% 28% 14% 1% 0%
Sindhupalchok 33% 43% 24% 0% 0%
Households in urban areas were more likely to report their house was prepared for rain (71%) and cold (71%) all of the time than rural areas (33% and 32% respectively). However, there was no significant corresponding increase in the proportion of households in rural areas reporting that their shelter was never rain-proof or would not be prepared for the cold and snow. This was mirrored in hard to reach areas, where 28% believed there household was prepared for rain, and 31% believe it to be winter prepared all the time, compared to 48% and 47% in areas accessible by road. A lower proportion of households in hard to access areas believed their shelter was not prepared for winter at all (1%), than those in areas with road access (7%). This same pattern holds true for elevated areas, with lower proportions believing their shelter is always prepared (29% for rain and 28% for cold) in areas above 1500 metres, than those in areas below 1500 metres (52% for both indicators), but no corresponding rise in number of households reporting their shelter is not at all prepared.
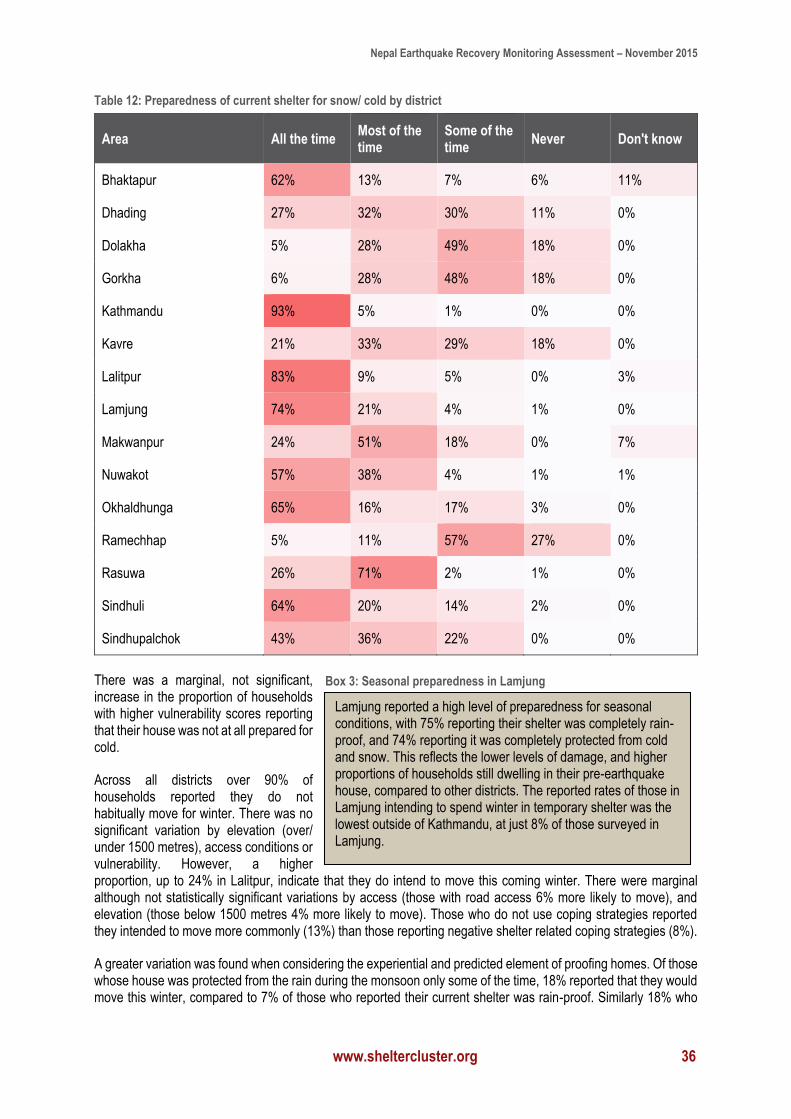
Nepal Earthquake Recovery Monitoring Assessment – November 2015
www.sheltercluster.org 36
Table 12: Preparedness of current shelter for snow/ cold by district
Area All the time Most of the time
Some of the time
Never Don't know
Bhaktapur 62% 13% 7% 6% 11%
Dhading 27% 32% 30% 11% 0%
Dolakha 5% 28% 49% 18% 0%
Gorkha 6% 28% 48% 18% 0%
Kathmandu 93% 5% 1% 0% 0%
Kavre 21% 33% 29% 18% 0%
Lalitpur 83% 9% 5% 0% 3%
Lamjung 74% 21% 4% 1% 0%
Makwanpur 24% 51% 18% 0% 7%
Nuwakot 57% 38% 4% 1% 1%
Okhaldhunga 65% 16% 17% 3% 0%
Ramechhap 5% 11% 57% 27% 0%
Rasuwa 26% 71% 2% 1% 0%
Sindhuli 64% 20% 14% 2% 0%
Sindhupalchok 43% 36% 22% 0% 0%
There was a marginal, not significant, increase in the proportion of households with higher vulnerability scores reporting that their house was not at all prepared for cold.
Across all districts over 90% of households reported they do not habitually move for winter. There was no significant variation by elevation (over/ under 1500 metres), access conditions or vulnerability. However, a higher proportion, up to 24% in Lalitpur, indicate that they do intend to move this coming winter. There were marginal although not statistically significant variations by access (those with road access 6% more likely to move), and elevation (those below 1500 metres 4% more likely to move). Those who do not use coping strategies reported they intended to move more commonly (13%) than those reporting negative shelter related coping strategies (8%).
A greater variation was found when considering the experiential and predicted element of proofing homes. Of those whose house was protected from the rain during the monsoon only some of the time, 18% reported that they would move this winter, compared to 7% of those who reported their current shelter was rain-proof. Similarly 18% who
Lamjung reported a high level of preparedness for seasonal conditions, with 75% reporting their shelter was completely rain-proof, and 74% reporting it was completely protected from cold and snow. This reflects the lower levels of damage, and higher proportions of households still dwelling in their pre-earthquake house, compared to other districts. The reported rates of those in Lamjung intending to spend winter in temporary shelter was the lowest outside of Kathmandu, at just 8% of those surveyed in Lamjung.
Box 3: Seasonal preparedness in Lamjung
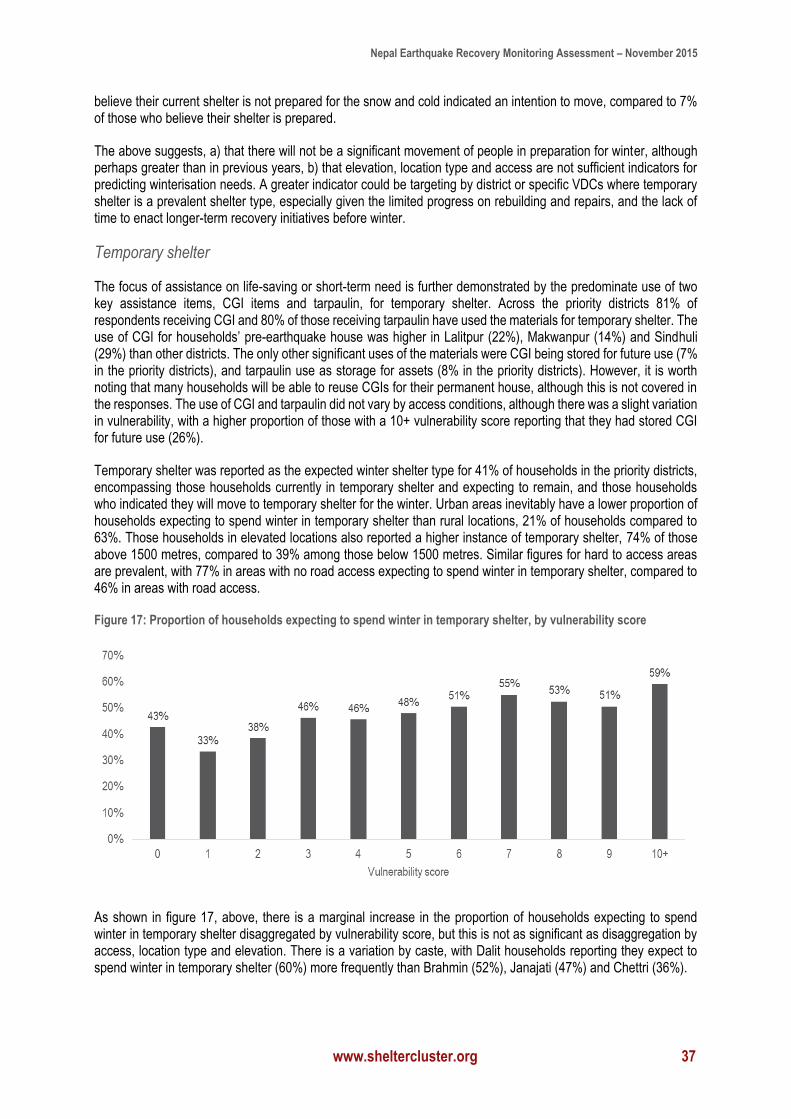
Nepal Earthquake Recovery Monitoring Assessment – November 2015
www.sheltercluster.org 37
believe their current shelter is not prepared for the snow and cold indicated an intention to move, compared to 7% of those who believe their shelter is prepared.
The above suggests, a) that there will not be a significant movement of people in preparation for winter, although perhaps greater than in previous years, b) that elevation, location type and access are not sufficient indicators for predicting winterisation needs. A greater indicator could be targeting by district or specific VDCs where temporary shelter is a prevalent shelter type, especially given the limited progress on rebuilding and repairs, and the lack of time to enact longer-term recovery initiatives before winter.
Temporary shelter
The focus of assistance on life-saving or short-term need is further demonstrated by the predominate use of two key assistance items, CGI items and tarpaulin, for temporary shelter. Across the priority districts 81% of respondents receiving CGI and 80% of those receiving tarpaulin have used the materials for temporary shelter. The use of CGI for households’ pre-earthquake house was higher in Lalitpur (22%), Makwanpur (14%) and Sindhuli (29%) than other districts. The only other significant uses of the materials were CGI being stored for future use (7% in the priority districts), and tarpaulin use as storage for assets (8% in the priority districts). However, it is worth noting that many households will be able to reuse CGIs for their permanent house, although this is not covered in the responses. The use of CGI and tarpaulin did not vary by access conditions, although there was a slight variation in vulnerability, with a higher proportion of those with a 10+ vulnerability score reporting that they had stored CGI for future use (26%).
Temporary shelter was reported as the expected winter shelter type for 41% of households in the priority districts, encompassing those households currently in temporary shelter and expecting to remain, and those households who indicated they will move to temporary shelter for the winter. Urban areas inevitably have a lower proportion of households expecting to spend winter in temporary shelter than rural locations, 21% of households compared to 63%. Those households in elevated locations also reported a higher instance of temporary shelter, 74% of those above 1500 metres, compared to 39% among those below 1500 metres. Similar figures for hard to access areas are prevalent, with 77% in areas with no road access expecting to spend winter in temporary shelter, compared to 46% in areas with road access.
Figure 17: Proportion of households expecting to spend winter in temporary shelter, by vulnerability score
As shown in figure 17, above, there is a marginal increase in the proportion of households expecting to spend winter in temporary shelter disaggregated by vulnerability score, but this is not as significant as disaggregation by access, location type and elevation. There is a variation by caste, with Dalit households reporting they expect to spend winter in temporary shelter (60%) more frequently than Brahmin (52%), Janajati (47%) and Chettri (36%).
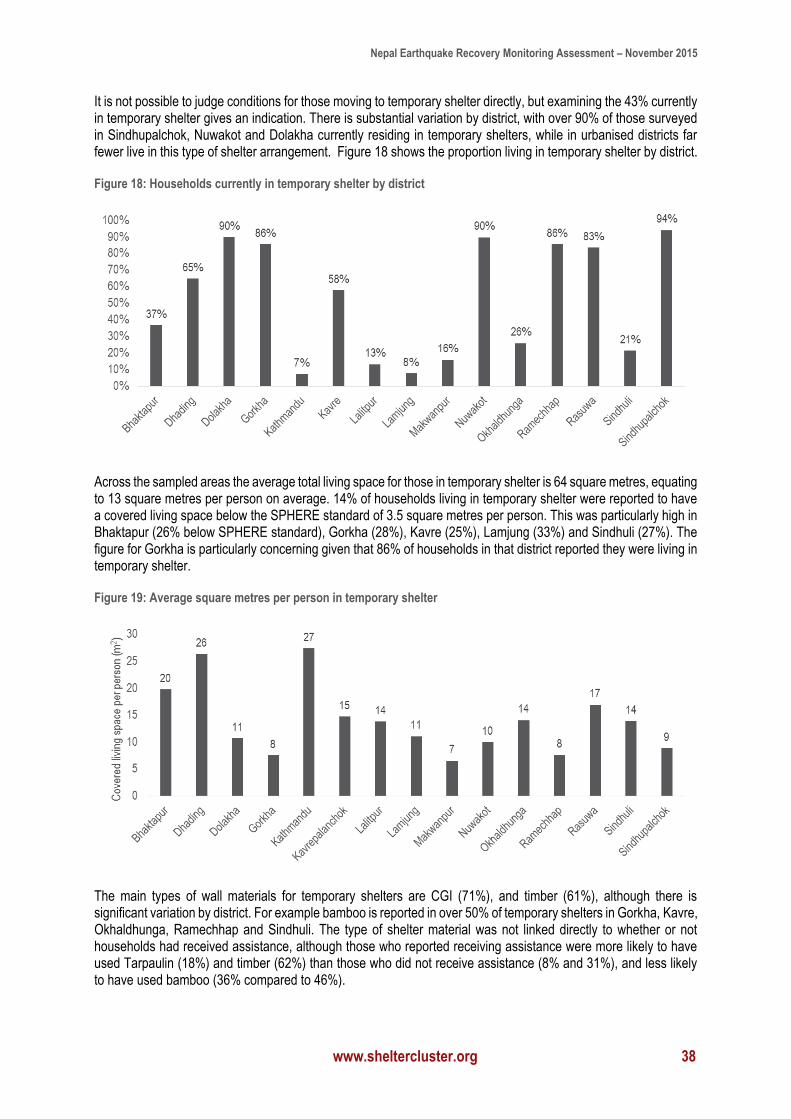
Nepal Earthquake Recovery Monitoring Assessment – November 2015
www.sheltercluster.org 38
It is not possible to judge conditions for those moving to temporary shelter directly, but examining the 43% currently in temporary shelter gives an indication. There is substantial variation by district, with over 90% of those surveyed in Sindhupalchok, Nuwakot and Dolakha currently residing in temporary shelters, while in urbanised districts far fewer live in this type of shelter arrangement. Figure 18 shows the proportion living in temporary shelter by district.
Figure 18: Households currently in temporary shelter by district
Across the sampled areas the average total living space for those in temporary shelter is 64 square metres, equating to 13 square metres per person on average. 14% of households living in temporary shelter were reported to have a covered living space below the SPHERE standard of 3.5 square metres per person. This was particularly high in Bhaktapur (26% below SPHERE standard), Gorkha (28%), Kavre (25%), Lamjung (33%) and Sindhuli (27%). The figure for Gorkha is particularly concerning given that 86% of households in that district reported they were living in temporary shelter.
Figure 19: Average square metres per person in temporary shelter
The main types of wall materials for temporary shelters are CGI (71%), and timber (61%), although there is significant variation by district. For example bamboo is reported in over 50% of temporary shelters in Gorkha, Kavre, Okhaldhunga, Ramechhap and Sindhuli. The type of shelter material was not linked directly to whether or not households had received assistance, although those who reported receiving assistance were more likely to have used Tarpaulin (18%) and timber (62%) than those who did not receive assistance (8% and 31%), and less likely to have used bamboo (36% compared to 46%).
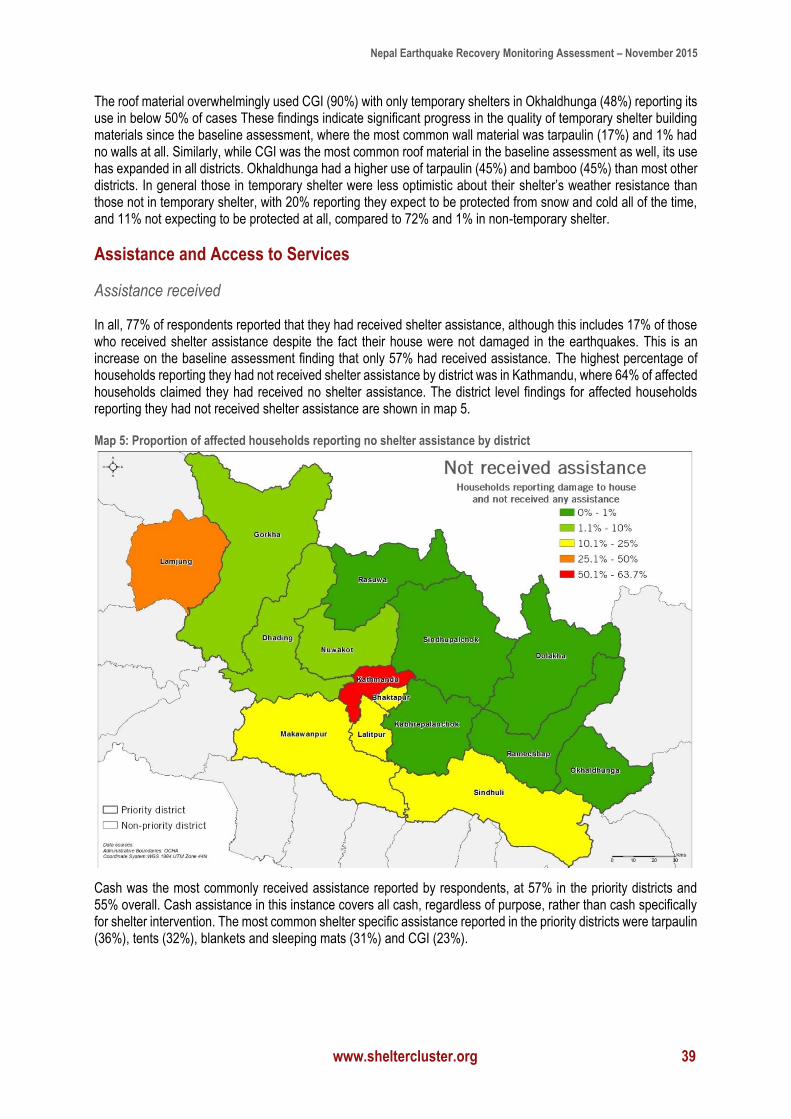
Nepal Earthquake Recovery Monitoring Assessment – November 2015
www.sheltercluster.org 39
The roof material overwhelmingly used CGI (90%) with only temporary shelters in Okhaldhunga (48%) reporting its use in below 50% of cases These findings indicate significant progress in the quality of temporary shelter building materials since the baseline assessment, where the most common wall material was tarpaulin (17%) and 1% had no walls at all. Similarly, while CGI was the most common roof material in the baseline assessment as well, its use has expanded in all districts. Okhaldhunga had a higher use of tarpaulin (45%) and bamboo (45%) than most other districts. In general those in temporary shelter were less optimistic about their shelter’s weather resistance than those not in temporary shelter, with 20% reporting they expect to be protected from snow and cold all of the time, and 11% not expecting to be protected at all, compared to 72% and 1% in non-temporary shelter.
Assistance and Access to Services
Assistance received
In all, 77% of respondents reported that they had received shelter assistance, although this includes 17% of those who received shelter assistance despite the fact their house were not damaged in the earthquakes. This is an increase on the baseline assessment finding that only 57% had received assistance. The highest percentage of households reporting they had not received shelter assistance by district was in Kathmandu, where 64% of affected households claimed they had received no shelter assistance. The district level findings for affected households reporting they had not received shelter assistance are shown in map 5.
Map 5: Proportion of affected households reporting no shelter assistance by district
Cash was the most commonly received assistance reported by respondents, at 57% in the priority districts and 55% overall. Cash assistance in this instance covers all cash, regardless of purpose, rather than cash specifically for shelter intervention. The most common shelter specific assistance reported in the priority districts were tarpaulin (36%), tents (32%), blankets and sleeping mats (31%) and CGI (23%).
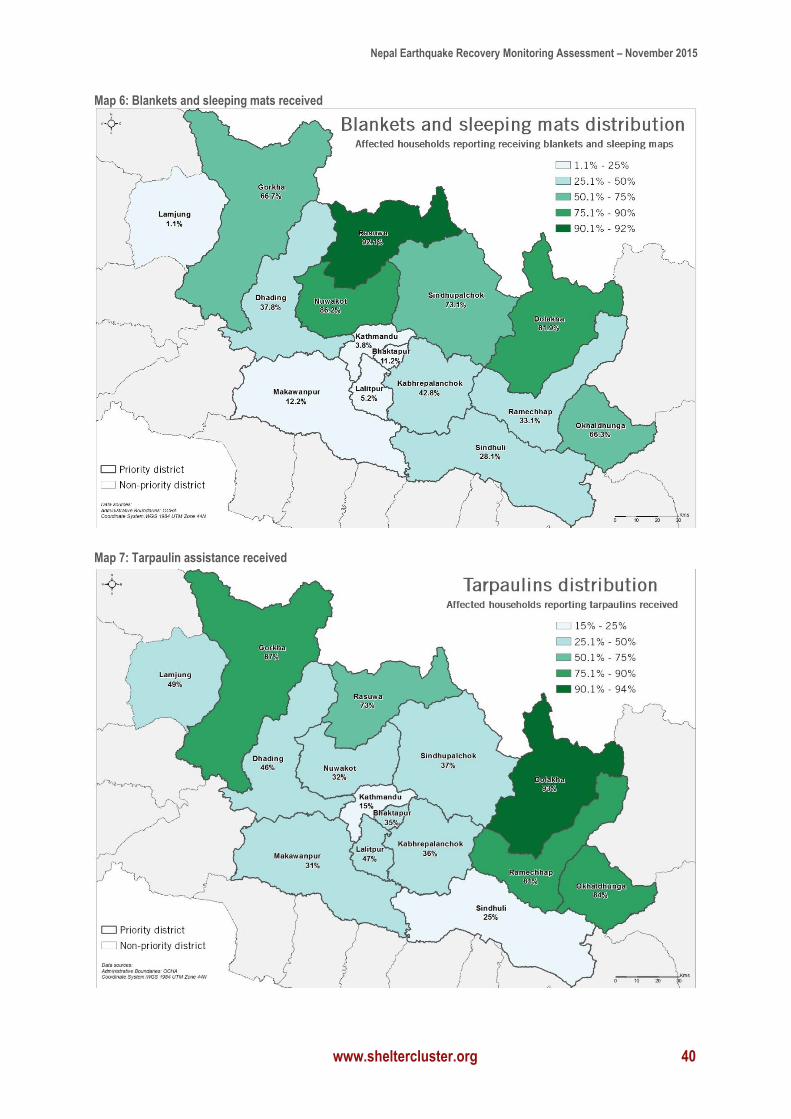
Nepal Earthquake Recovery Monitoring Assessment – November 2015
www.sheltercluster.org 40
Map 6: Blankets and sleeping mats received
Map 7: Tarpaulin assistance received
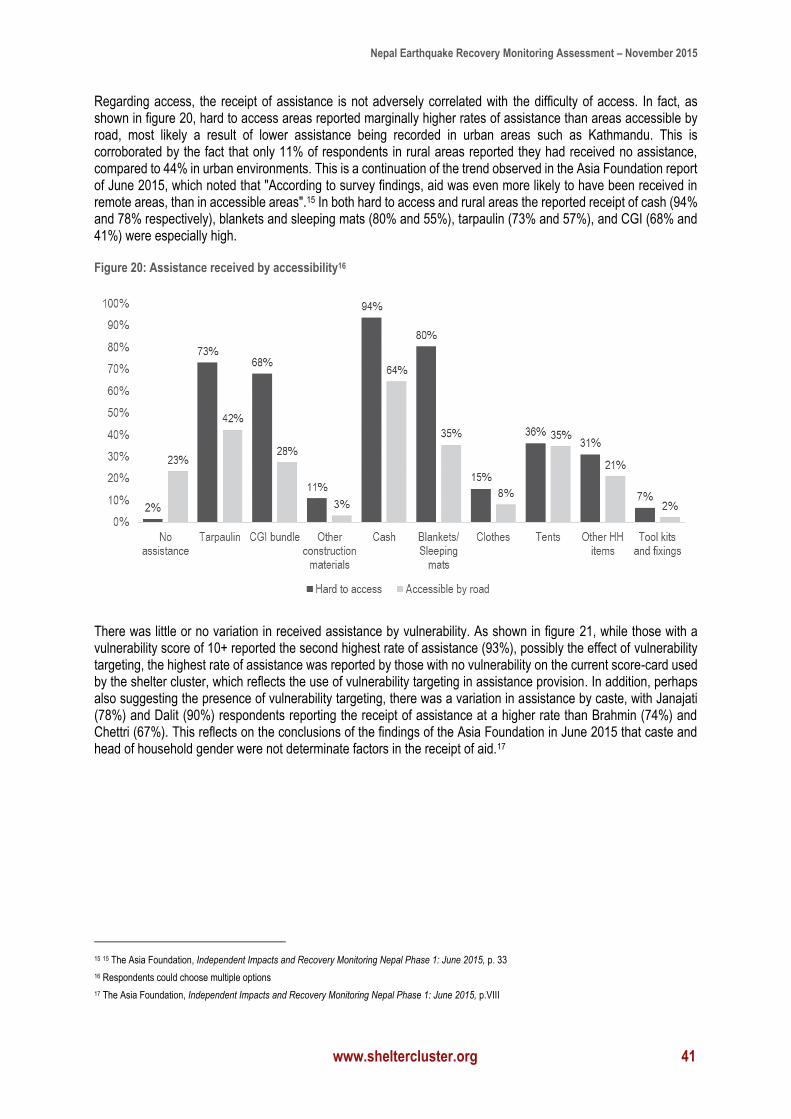
Nepal Earthquake Recovery Monitoring Assessment – November 2015
www.sheltercluster.org 41
Regarding access, the receipt of assistance is not adversely correlated with the difficulty of access. In fact, as shown in figure 20, hard to access areas reported marginally higher rates of assistance than areas accessible by road, most likely a result of lower assistance being recorded in urban areas such as Kathmandu. This is corroborated by the fact that only 11% of respondents in rural areas reported they had received no assistance, compared to 44% in urban environments. This is a continuation of the trend observed in the Asia Foundation report of June 2015, which noted that "According to survey findings, aid was even more likely to have been received in remote areas, than in accessible areas".15 In both hard to access and rural areas the reported receipt of cash (94% and 78% respectively), blankets and sleeping mats (80% and 55%), tarpaulin (73% and 57%), and CGI (68% and 41%) were especially high.
Figure 20: Assistance received by accessibility16
There was little or no variation in received assistance by vulnerability. As shown in figure 21, while those with a vulnerability score of 10+ reported the second highest rate of assistance (93%), possibly the effect of vulnerability targeting, the highest rate of assistance was reported by those with no vulnerability on the current score-card used by the shelter cluster, which reflects the use of vulnerability targeting in assistance provision. In addition, perhaps also suggesting the presence of vulnerability targeting, there was a variation in assistance by caste, with Janajati (78%) and Dalit (90%) respondents reporting the receipt of assistance at a higher rate than Brahmin (74%) and Chettri (67%). This reflects on the conclusions of the findings of the Asia Foundation in June 2015 that caste and head of household gender were not determinate factors in the receipt of aid.17
15 15 The Asia Foundation, Independent Impacts and Recovery Monitoring Nepal Phase 1: June 2015, p. 33
16 Respondents could choose multiple options
17 The Asia Foundation, Independent Impacts and Recovery Monitoring Nepal Phase 1: June 2015, p.VIII
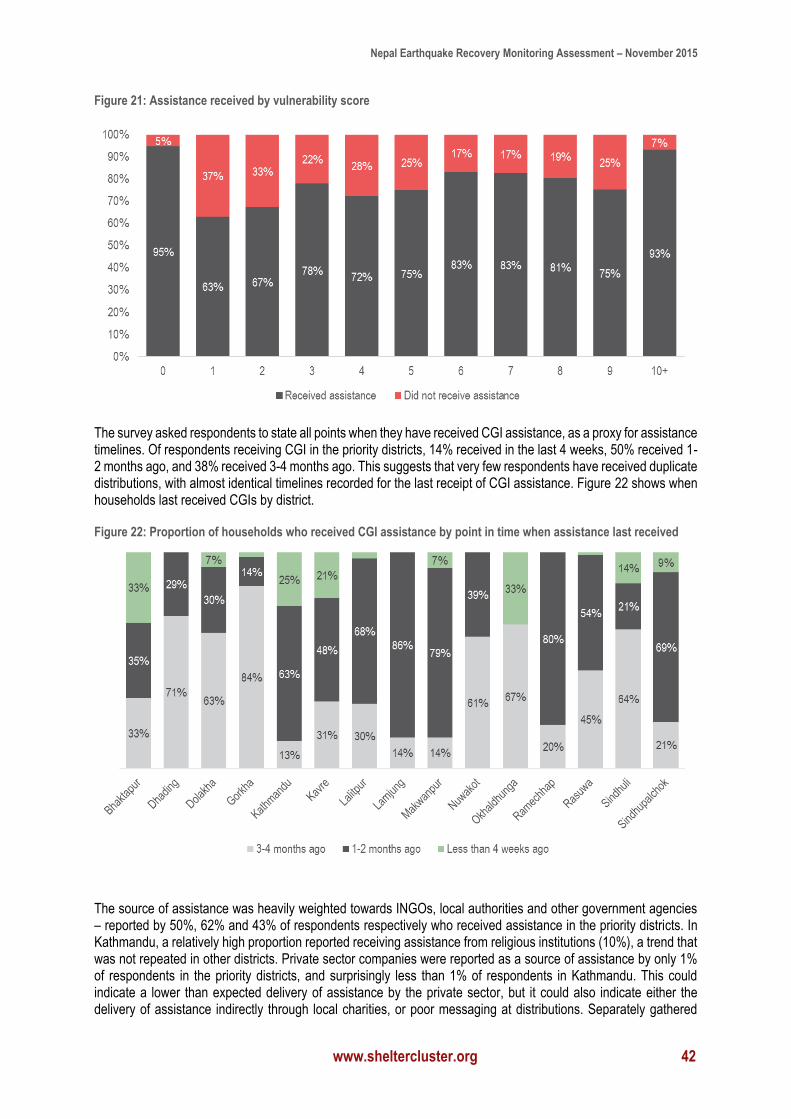
Nepal Earthquake Recovery Monitoring Assessment – November 2015
www.sheltercluster.org 42
Figure 21: Assistance received by vulnerability score
The survey asked respondents to state all points when they have received CGI assistance, as a proxy for assistance timelines. Of respondents receiving CGI in the priority districts, 14% received in the last 4 weeks, 50% received 1-2 months ago, and 38% received 3-4 months ago. This suggests that very few respondents have received duplicate distributions, with almost identical timelines recorded for the last receipt of CGI assistance. Figure 22 shows when households last received CGIs by district.
Figure 22: Proportion of households who received CGI assistance by point in time when assistance last received
The source of assistance was heavily weighted towards INGOs, local authorities and other government agencies – reported by 50%, 62% and 43% of respondents respectively who received assistance in the priority districts. In Kathmandu, a relatively high proportion reported receiving assistance from religious institutions (10%), a trend that was not repeated in other districts. Private sector companies were reported as a source of assistance by only 1% of respondents in the priority districts, and surprisingly less than 1% of respondents in Kathmandu. This could indicate a lower than expected delivery of assistance by the private sector, but it could also indicate either the delivery of assistance indirectly through local charities, or poor messaging at distributions. Separately gathered
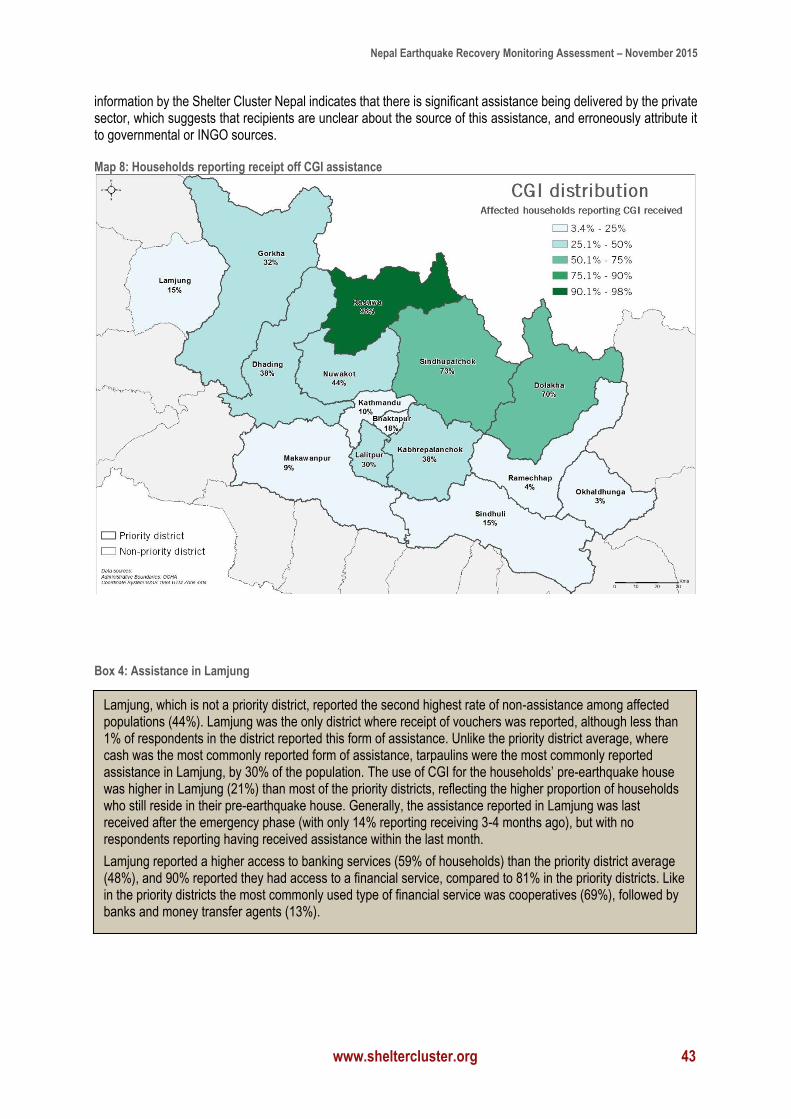
Nepal Earthquake Recovery Monitoring Assessment – November 2015
www.sheltercluster.org 43
information by the Shelter Cluster Nepal indicates that there is significant assistance being delivered by the private sector, which suggests that recipients are unclear about the source of this assistance, and erroneously attribute it to governmental or INGO sources.
Map 8: Households reporting receipt off CGI assistance
Lamjung, which is not a priority district, reported the second highest rate of non-assistance among affected populations (44%). Lamjung was the only district where receipt of vouchers was reported, although less than 1% of respondents in the district reported this form of assistance. Unlike the priority district average, where cash was the most commonly reported form of assistance, tarpaulins were the most commonly reported assistance in Lamjung, by 30% of the population. The use of CGI for the households’ pre-earthquake house was higher in Lamjung (21%) than most of the priority districts, reflecting the higher proportion of households who still reside in their pre-earthquake house. Generally, the assistance reported in Lamjung was last received after the emergency phase (with only 14% reporting receiving 3-4 months ago), but with no respondents reporting having received assistance within the last month.
Lamjung reported a higher access to banking services (59% of households) than the priority district average (48%), and 90% reported they had access to a financial service, compared to 81% in the priority districts. Like in the priority districts the most commonly used type of financial service was cooperatives (69%), followed by banks and money transfer agents (13%).
Box 4: Assistance in Lamjung
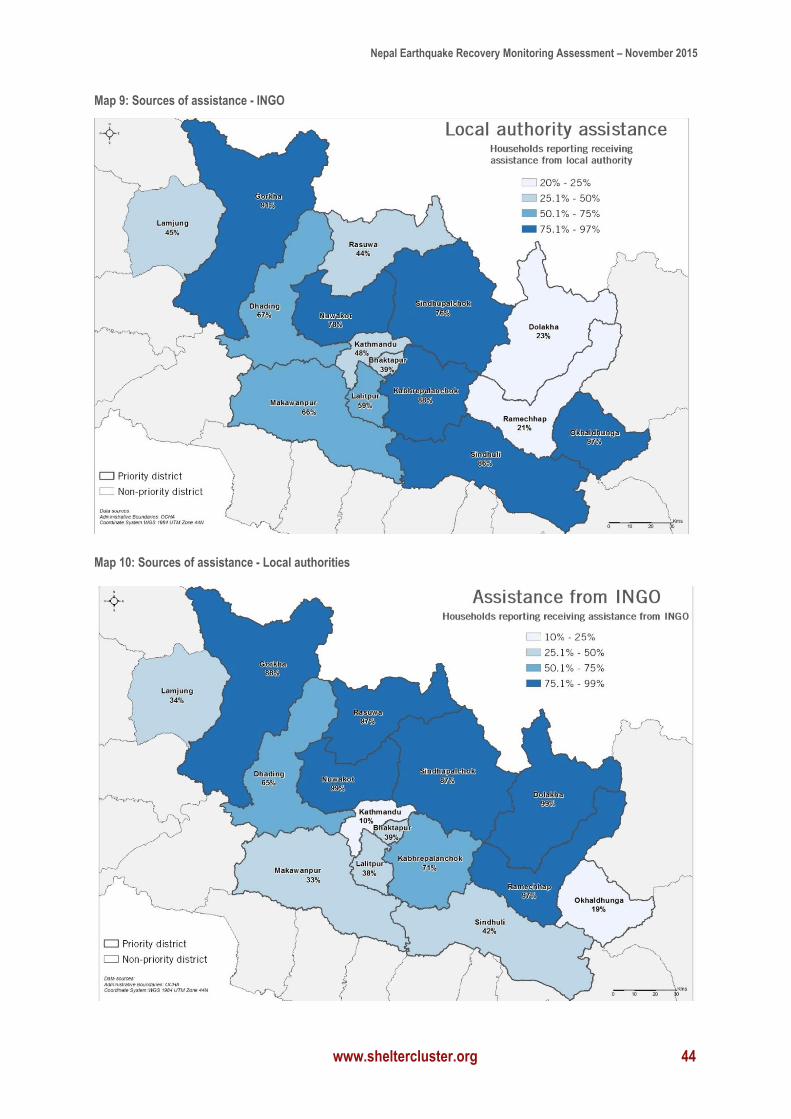
Nepal Earthquake Recovery Monitoring Assessment – November 2015
www.sheltercluster.org 44
Map 9: Sources of assistance - INGO
Map 10: Sources of assistance - Local authorities
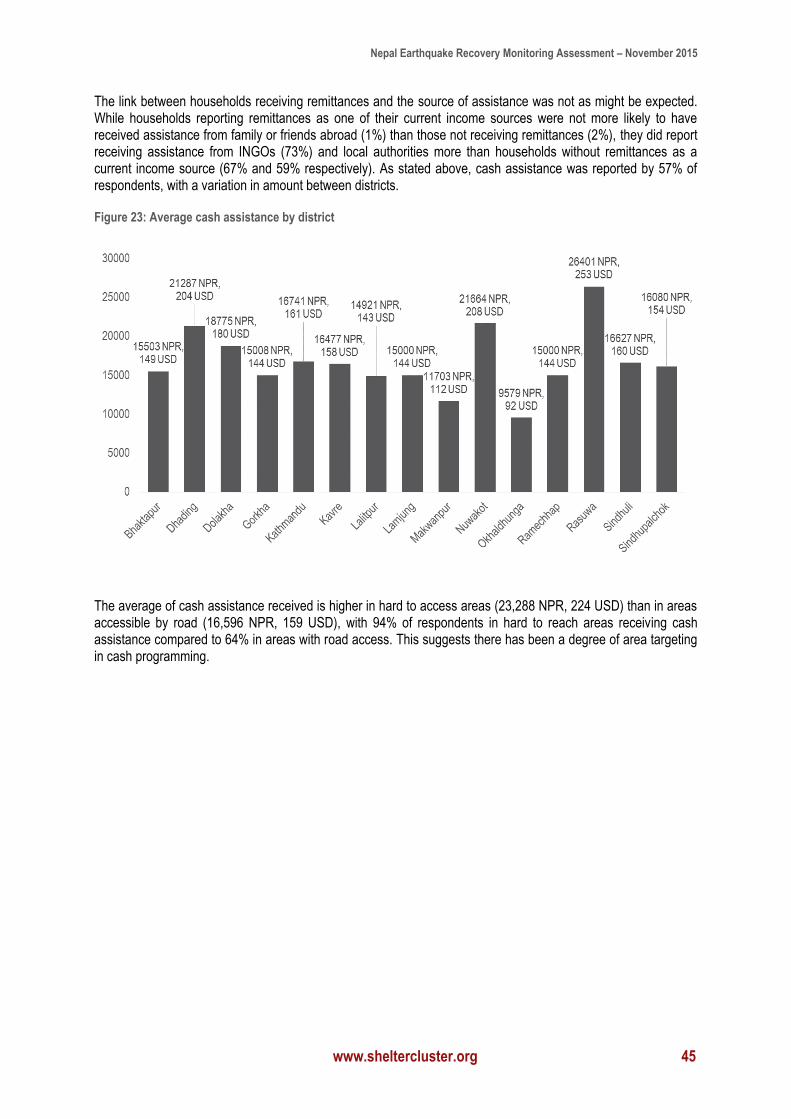
Nepal Earthquake Recovery Monitoring Assessment – November 2015
www.sheltercluster.org 45
The link between households receiving remittances and the source of assistance was not as might be expected. While households reporting remittances as one of their current income sources were not more likely to have received assistance from family or friends abroad (1%) than those not receiving remittances (2%), they did report receiving assistance from INGOs (73%) and local authorities more than households without remittances as a current income source (67% and 59% respectively). As stated above, cash assistance was reported by 57% of respondents, with a variation in amount between districts.
Figure 23: Average cash assistance by district
The average of cash assistance received is higher in hard to access areas (23,288 NPR, 224 USD) than in areas accessible by road (16,596 NPR, 159 USD), with 94% of respondents in hard to reach areas receiving cash assistance compared to 64% in areas with road access. This suggests there has been a degree of area targeting in cash programming.
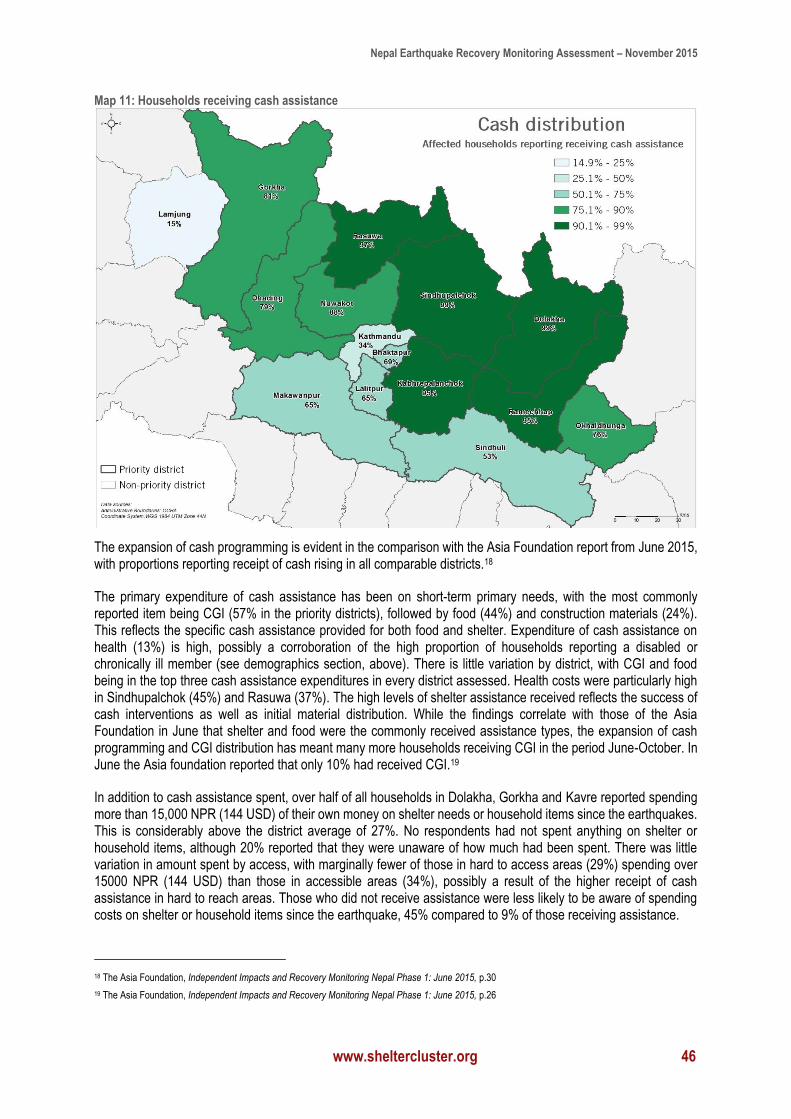
Nepal Earthquake Recovery Monitoring Assessment – November 2015
www.sheltercluster.org 46
Map 11: Households receiving cash assistance
The expansion of cash programming is evident in the comparison with the Asia Foundation report from June 2015, with proportions reporting receipt of cash rising in all comparable districts.18
The primary expenditure of cash assistance has been on short-term primary needs, with the most commonly reported item being CGI (57% in the priority districts), followed by food (44%) and construction materials (24%). This reflects the specific cash assistance provided for both food and shelter. Expenditure of cash assistance on health (13%) is high, possibly a corroboration of the high proportion of households reporting a disabled or chronically ill member (see demographics section, above). There is little variation by district, with CGI and food being in the top three cash assistance expenditures in every district assessed. Health costs were particularly high in Sindhupalchok (45%) and Rasuwa (37%). The high levels of shelter assistance received reflects the success of cash interventions as well as initial material distribution. While the findings correlate with those of the Asia Foundation in June that shelter and food were the commonly received assistance types, the expansion of cash programming and CGI distribution has meant many more households receiving CGI in the period June-October. In June the Asia foundation reported that only 10% had received CGI.19
In addition to cash assistance spent, over half of all households in Dolakha, Gorkha and Kavre reported spending more than 15,000 NPR (144 USD) of their own money on shelter needs or household items since the earthquakes. This is considerably above the district average of 27%. No respondents had not spent anything on shelter or household items, although 20% reported that they were unaware of how much had been spent. There was little variation in amount spent by access, with marginally fewer of those in hard to access areas (29%) spending over 15000 NPR (144 USD) than those in accessible areas (34%), possibly a result of the higher receipt of cash assistance in hard to reach areas. Those who did not receive assistance were less likely to be aware of spending costs on shelter or household items since the earthquake, 45% compared to 9% of those receiving assistance.
18 The Asia Foundation, Independent Impacts and Recovery Monitoring Nepal Phase 1: June 2015, p.30
19 The Asia Foundation, Independent Impacts and Recovery Monitoring Nepal Phase 1: June 2015, p.26
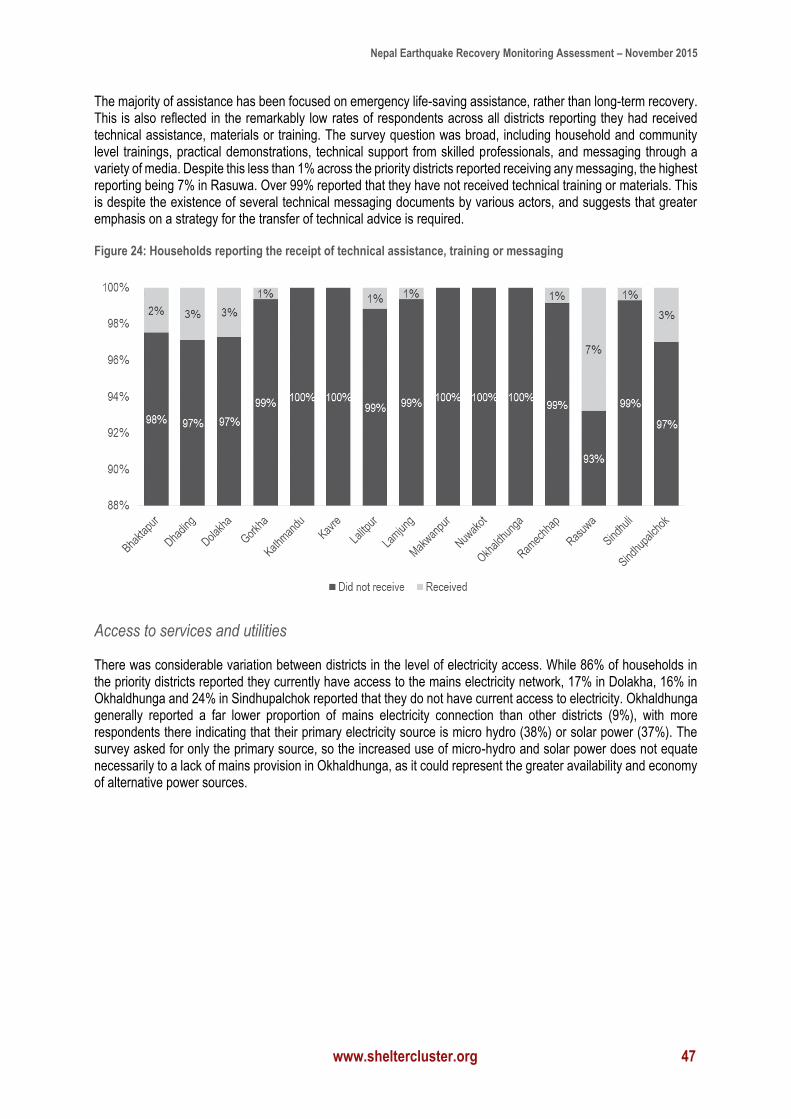
Nepal Earthquake Recovery Monitoring Assessment – November 2015
www.sheltercluster.org 47
The majority of assistance has been focused on emergency life-saving assistance, rather than long-term recovery. This is also reflected in the remarkably low rates of respondents across all districts reporting they had received technical assistance, materials or training. The survey question was broad, including household and community level trainings, practical demonstrations, technical support from skilled professionals, and messaging through a variety of media. Despite this less than 1% across the priority districts reported receiving any messaging, the highest reporting being 7% in Rasuwa. Over 99% reported that they have not received technical training or materials. This is despite the existence of several technical messaging documents by various actors, and suggests that greater emphasis on a strategy for the transfer of technical advice is required.
Figure 24: Households reporting the receipt of technical assistance, training or messaging
Access to services and utilities
There was considerable variation between districts in the level of electricity access. While 86% of households in the priority districts reported they currently have access to the mains electricity network, 17% in Dolakha, 16% in Okhaldhunga and 24% in Sindhupalchok reported that they do not have current access to electricity. Okhaldhunga generally reported a far lower proportion of mains electricity connection than other districts (9%), with more respondents there indicating that their primary electricity source is micro hydro (38%) or solar power (37%). The survey asked for only the primary source, so the increased use of micro-hydro and solar power does not equate necessarily to a lack of mains provision in Okhaldhunga, as it could represent the greater availability and economy of alternative power sources.
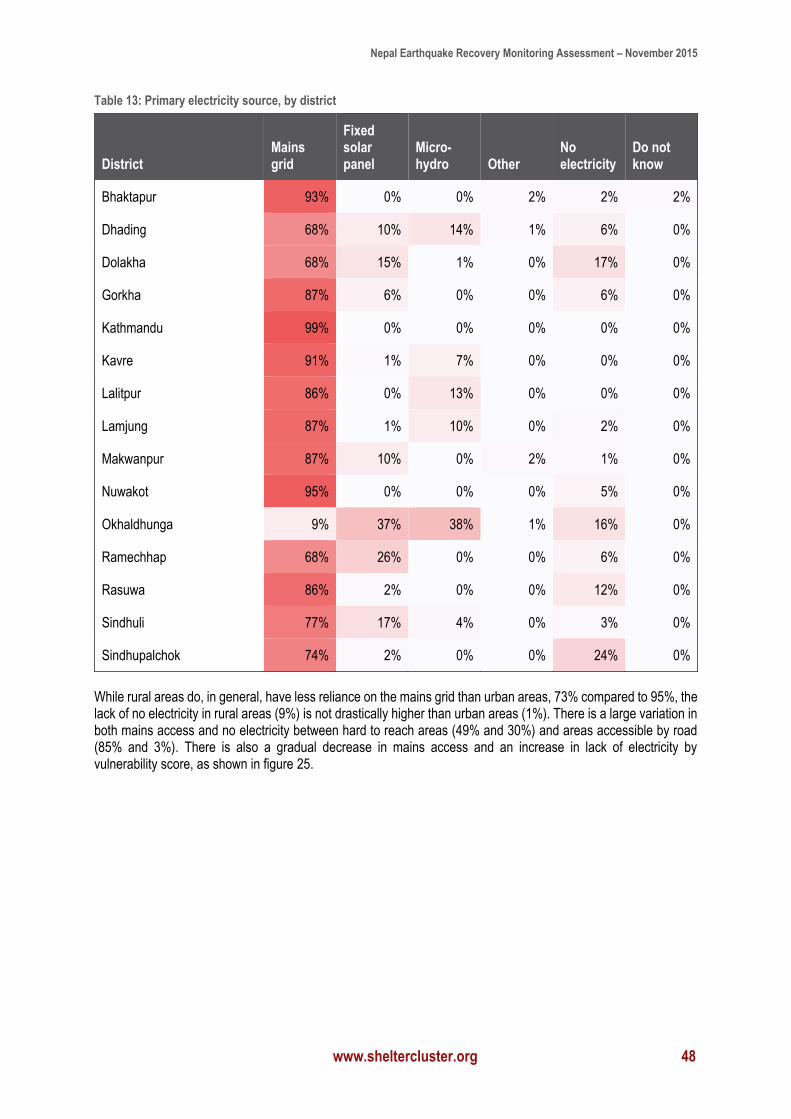
Nepal Earthquake Recovery Monitoring Assessment – November 2015
www.sheltercluster.org 48
Table 13: Primary electricity source, by district
District Mains grid
Fixed solar panel
Micro-hydro Other
No electricity
Do not know
Bhaktapur 93% 0% 0% 2% 2% 2%
Dhading 68% 10% 14% 1% 6% 0%
Dolakha 68% 15% 1% 0% 17% 0%
Gorkha 87% 6% 0% 0% 6% 0%
Kathmandu 99% 0% 0% 0% 0% 0%
Kavre 91% 1% 7% 0% 0% 0%
Lalitpur 86% 0% 13% 0% 0% 0%
Lamjung 87% 1% 10% 0% 2% 0%
Makwanpur 87% 10% 0% 2% 1% 0%
Nuwakot 95% 0% 0% 0% 5% 0%
Okhaldhunga 9% 37% 38% 1% 16% 0%
Ramechhap 68% 26% 0% 0% 6% 0%
Rasuwa 86% 2% 0% 0% 12% 0%
Sindhuli 77% 17% 4% 0% 3% 0%
Sindhupalchok 74% 2% 0% 0% 24% 0%
While rural areas do, in general, have less reliance on the mains grid than urban areas, 73% compared to 95%, the lack of no electricity in rural areas (9%) is not drastically higher than urban areas (1%). There is a large variation in both mains access and no electricity between hard to reach areas (49% and 30%) and areas accessible by road (85% and 3%). There is also a gradual decrease in mains access and an increase in lack of electricity by vulnerability score, as shown in figure 25.
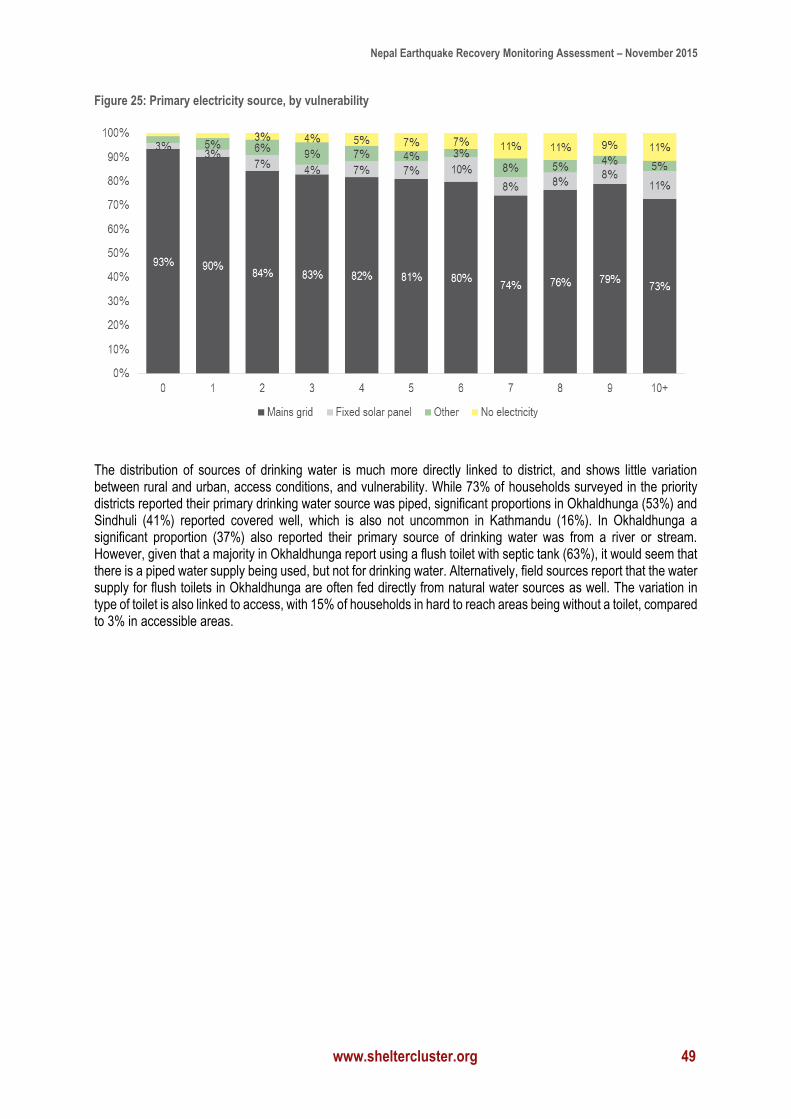
Nepal Earthquake Recovery Monitoring Assessment – November 2015
www.sheltercluster.org 49
Figure 25: Primary electricity source, by vulnerability
The distribution of sources of drinking water is much more directly linked to district, and shows little variation between rural and urban, access conditions, and vulnerability. While 73% of households surveyed in the priority districts reported their primary drinking water source was piped, significant proportions in Okhaldhunga (53%) and Sindhuli (41%) reported covered well, which is also not uncommon in Kathmandu (16%). In Okhaldhunga a significant proportion (37%) also reported their primary source of drinking water was from a river or stream. However, given that a majority in Okhaldhunga report using a flush toilet with septic tank (63%), it would seem that there is a piped water supply being used, but not for drinking water. Alternatively, field sources report that the water supply for flush toilets in Okhaldhunga are often fed directly from natural water sources as well. The variation in type of toilet is also linked to access, with 15% of households in hard to reach areas being without a toilet, compared to 3% in accessible areas.
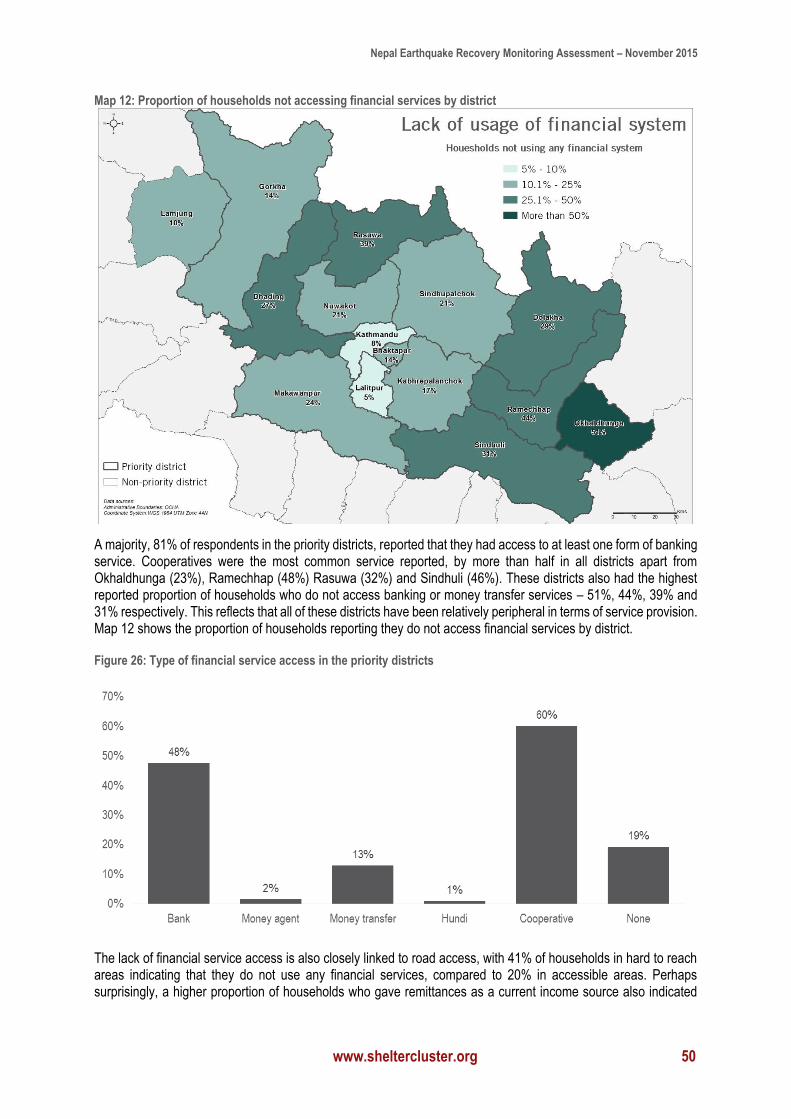
Nepal Earthquake Recovery Monitoring Assessment – November 2015
www.sheltercluster.org 50
Map 12: Proportion of households not accessing financial services by district
A majority, 81% of respondents in the priority districts, reported that they had access to at least one form of banking service. Cooperatives were the most common service reported, by more than half in all districts apart from Okhaldhunga (23%), Ramechhap (48%) Rasuwa (32%) and Sindhuli (46%). These districts also had the highest reported proportion of households who do not access banking or money transfer services – 51%, 44%, 39% and 31% respectively. This reflects that all of these districts have been relatively peripheral in terms of service provision. Map 12 shows the proportion of households reporting they do not access financial services by district.
Figure 26: Type of financial service access in the priority districts
The lack of financial service access is also closely linked to road access, with 41% of households in hard to reach areas indicating that they do not use any financial services, compared to 20% in accessible areas. Perhaps surprisingly, a higher proportion of households who gave remittances as a current income source also indicated
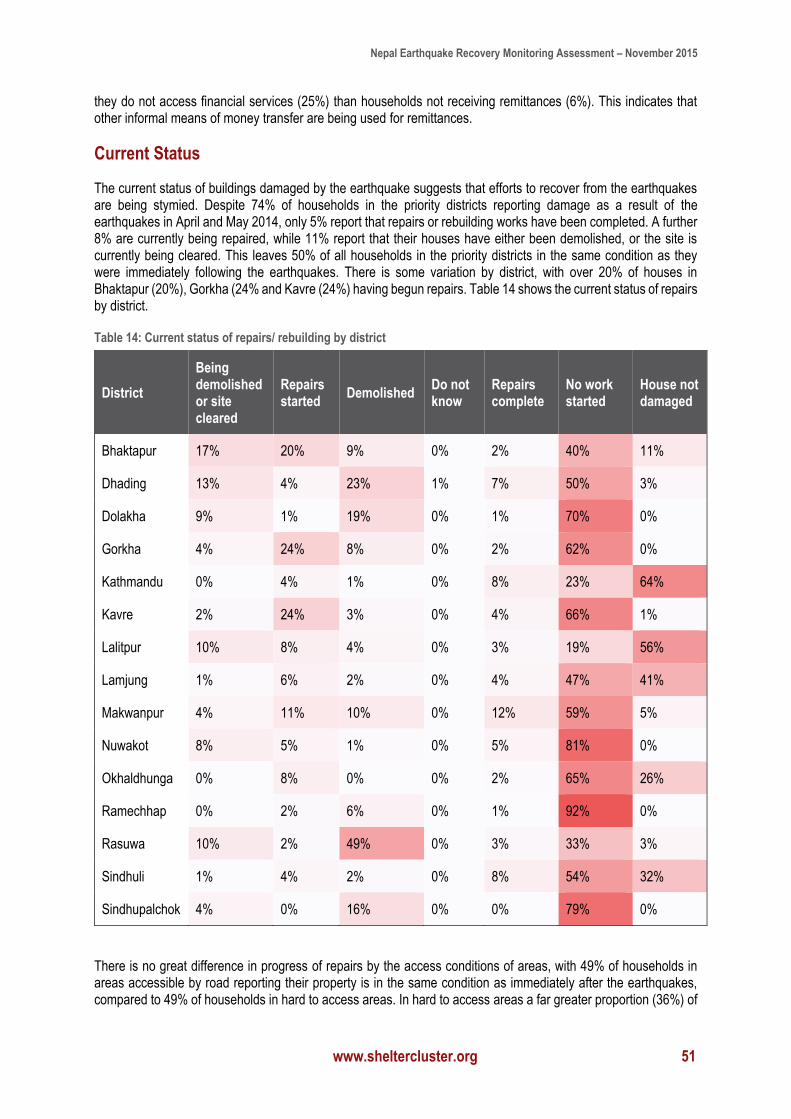
Nepal Earthquake Recovery Monitoring Assessment – November 2015
www.sheltercluster.org 51
they do not access financial services (25%) than households not receiving remittances (6%). This indicates that other informal means of money transfer are being used for remittances.
Current Status
The current status of buildings damaged by the earthquake suggests that efforts to recover from the earthquakes are being stymied. Despite 74% of households in the priority districts reporting damage as a result of the earthquakes in April and May 2014, only 5% report that repairs or rebuilding works have been completed. A further 8% are currently being repaired, while 11% report that their houses have either been demolished, or the site is currently being cleared. This leaves 50% of all households in the priority districts in the same condition as they were immediately following the earthquakes. There is some variation by district, with over 20% of houses in Bhaktapur (20%), Gorkha (24% and Kavre (24%) having begun repairs. Table 14 shows the current status of repairs by district.
Table 14: Current status of repairs/ rebuilding by district
District
Being demolished or site cleared
Repairs started
Demolished Do not know
Repairs complete
No work started
House not damaged
Bhaktapur 17% 20% 9% 0% 2% 40% 11%
Dhading 13% 4% 23% 1% 7% 50% 3%
Dolakha 9% 1% 19% 0% 1% 70% 0%
Gorkha 4% 24% 8% 0% 2% 62% 0%
Kathmandu 0% 4% 1% 0% 8% 23% 64%
Kavre 2% 24% 3% 0% 4% 66% 1%
Lalitpur 10% 8% 4% 0% 3% 19% 56%
Lamjung 1% 6% 2% 0% 4% 47% 41%
Makwanpur 4% 11% 10% 0% 12% 59% 5%
Nuwakot 8% 5% 1% 0% 5% 81% 0%
Okhaldhunga 0% 8% 0% 0% 2% 65% 26%
Ramechhap 0% 2% 6% 0% 1% 92% 0%
Rasuwa 10% 2% 49% 0% 3% 33% 3%
Sindhuli 1% 4% 2% 0% 8% 54% 32%
Sindhupalchok 4% 0% 16% 0% 0% 79% 0%
There is no great difference in progress of repairs by the access conditions of areas, with 49% of households in areas accessible by road reporting their property is in the same condition as immediately after the earthquakes, compared to 49% of households in hard to access areas. In hard to access areas a far greater proportion (36%) of
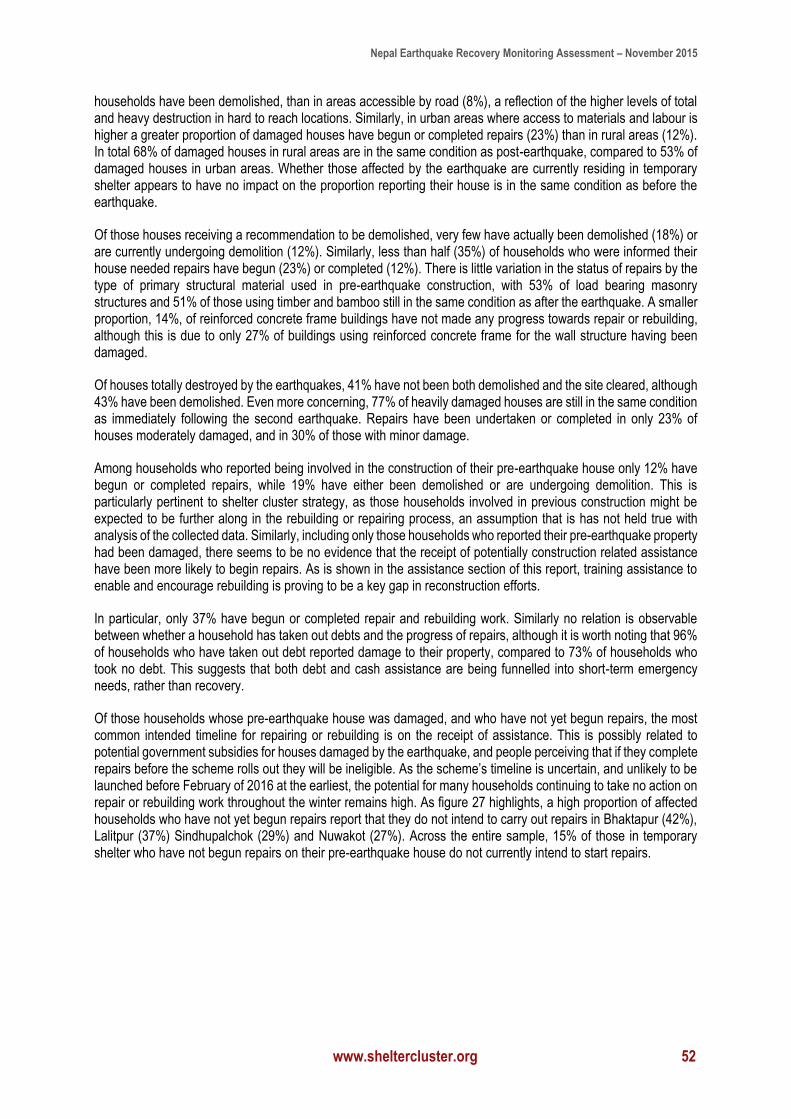
Nepal Earthquake Recovery Monitoring Assessment – November 2015
www.sheltercluster.org 52
households have been demolished, than in areas accessible by road (8%), a reflection of the higher levels of total and heavy destruction in hard to reach locations. Similarly, in urban areas where access to materials and labour is higher a greater proportion of damaged houses have begun or completed repairs (23%) than in rural areas (12%). In total 68% of damaged houses in rural areas are in the same condition as post-earthquake, compared to 53% of damaged houses in urban areas. Whether those affected by the earthquake are currently residing in temporary shelter appears to have no impact on the proportion reporting their house is in the same condition as before the earthquake.
Of those houses receiving a recommendation to be demolished, very few have actually been demolished (18%) or are currently undergoing demolition (12%). Similarly, less than half (35%) of households who were informed their house needed repairs have begun (23%) or completed (12%). There is little variation in the status of repairs by the type of primary structural material used in pre-earthquake construction, with 53% of load bearing masonry structures and 51% of those using timber and bamboo still in the same condition as after the earthquake. A smaller proportion, 14%, of reinforced concrete frame buildings have not made any progress towards repair or rebuilding, although this is due to only 27% of buildings using reinforced concrete frame for the wall structure having been damaged.
Of houses totally destroyed by the earthquakes, 41% have not been both demolished and the site cleared, although 43% have been demolished. Even more concerning, 77% of heavily damaged houses are still in the same condition as immediately following the second earthquake. Repairs have been undertaken or completed in only 23% of houses moderately damaged, and in 30% of those with minor damage.
Among households who reported being involved in the construction of their pre-earthquake house only 12% have begun or completed repairs, while 19% have either been demolished or are undergoing demolition. This is particularly pertinent to shelter cluster strategy, as those households involved in previous construction might be expected to be further along in the rebuilding or repairing process, an assumption that is has not held true with analysis of the collected data. Similarly, including only those households who reported their pre-earthquake property had been damaged, there seems to be no evidence that the receipt of potentially construction related assistance have been more likely to begin repairs. As is shown in the assistance section of this report, training assistance to enable and encourage rebuilding is proving to be a key gap in reconstruction efforts.
In particular, only 37% have begun or completed repair and rebuilding work. Similarly no relation is observable between whether a household has taken out debts and the progress of repairs, although it is worth noting that 96% of households who have taken out debt reported damage to their property, compared to 73% of households who took no debt. This suggests that both debt and cash assistance are being funnelled into short-term emergency needs, rather than recovery.
Of those households whose pre-earthquake house was damaged, and who have not yet begun repairs, the most common intended timeline for repairing or rebuilding is on the receipt of assistance. This is possibly related to potential government subsidies for houses damaged by the earthquake, and people perceiving that if they complete repairs before the scheme rolls out they will be ineligible. As the scheme’s timeline is uncertain, and unlikely to be launched before February of 2016 at the earliest, the potential for many households continuing to take no action on repair or rebuilding work throughout the winter remains high. As figure 27 highlights, a high proportion of affected households who have not yet begun repairs report that they do not intend to carry out repairs in Bhaktapur (42%), Lalitpur (37%) Sindhupalchok (29%) and Nuwakot (27%). Across the entire sample, 15% of those in temporary shelter who have not begun repairs on their pre-earthquake house do not currently intend to start repairs.
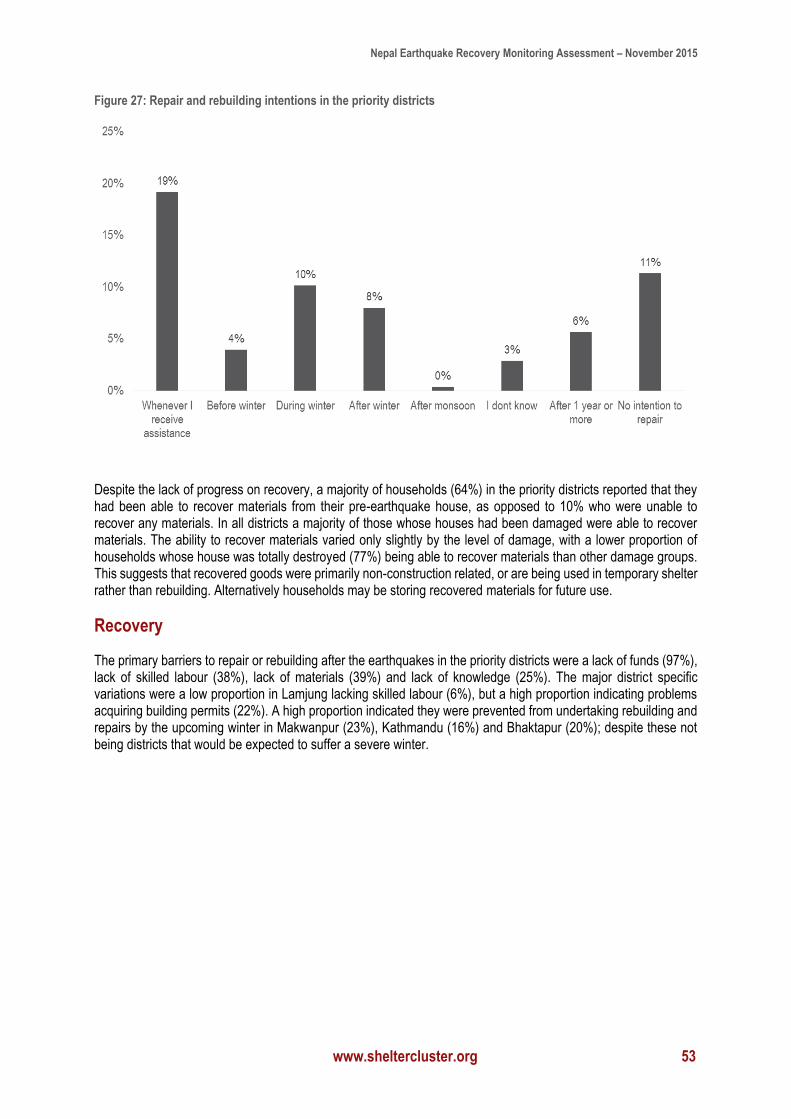
Nepal Earthquake Recovery Monitoring Assessment – November 2015
www.sheltercluster.org 53
Figure 27: Repair and rebuilding intentions in the priority districts
Despite the lack of progress on recovery, a majority of households (64%) in the priority districts reported that they had been able to recover materials from their pre-earthquake house, as opposed to 10% who were unable to recover any materials. In all districts a majority of those whose houses had been damaged were able to recover materials. The ability to recover materials varied only slightly by the level of damage, with a lower proportion of households whose house was totally destroyed (77%) being able to recover materials than other damage groups. This suggests that recovered goods were primarily non-construction related, or are being used in temporary shelter rather than rebuilding. Alternatively households may be storing recovered materials for future use.
Recovery
The primary barriers to repair or rebuilding after the earthquakes in the priority districts were a lack of funds (97%), lack of skilled labour (38%), lack of materials (39%) and lack of knowledge (25%). The major district specific variations were a low proportion in Lamjung lacking skilled labour (6%), but a high proportion indicating problems acquiring building permits (22%). A high proportion indicated they were prevented from undertaking rebuilding and repairs by the upcoming winter in Makwanpur (23%), Kathmandu (16%) and Bhaktapur (20%); despite these not being districts that would be expected to suffer a severe winter.
Nepal Earthquake Recovery Monitoring Assessment – November 2015
www.sheltercluster.org 54
Figure 28: Primary barriers to rebuild in the priority districts
Despite the limited progress towards rebuilding and repair of shelters damaged by the earthquake, the base elements necessary to assist in the recovery appear to be present. Firstly there are a degree of expertise present in the population that should allow rebuilding to start. 61% of respondents in the priority district indicated that a member of the household was involved in the construction of their pre-earthquake house. This indicates that there is a willingness and ability to be involved in construction, as well as to contribute unskilled labour. This is corroborated by the fact that 93% of households in the priority districts have adult members able to undertake unskilled labour, on average two members per family.
There is an availability of skilled labour within the workforce. Households indicated that 79% of pre-earthquake houses were built with the assistance of a local mason. Of the households surveys none indicated that they had no access to a mason, and only 3% of those surveyed in the priority districts indicated that there were no carpenters available for them to hire. However the primary barrier given by respondents to rebuilding was a lack of available funds, reflected in the availability of skilled labour.
While skilled labour is available, 83% in the priority districts indicated that the cost of a mason had risen, with 42% indicating that the cost had at least doubled since the earthquake. In only Kathmandu (56%) and Lamjung (52%) did less than 70% of respondents indicated that the cost of a mason had risen. The pattern was identical for access to carpenters across all districts, as shown in tables 15 and 16. There were particularly high rates of increased labour costs in those areas most severely affected by the earthquakes.
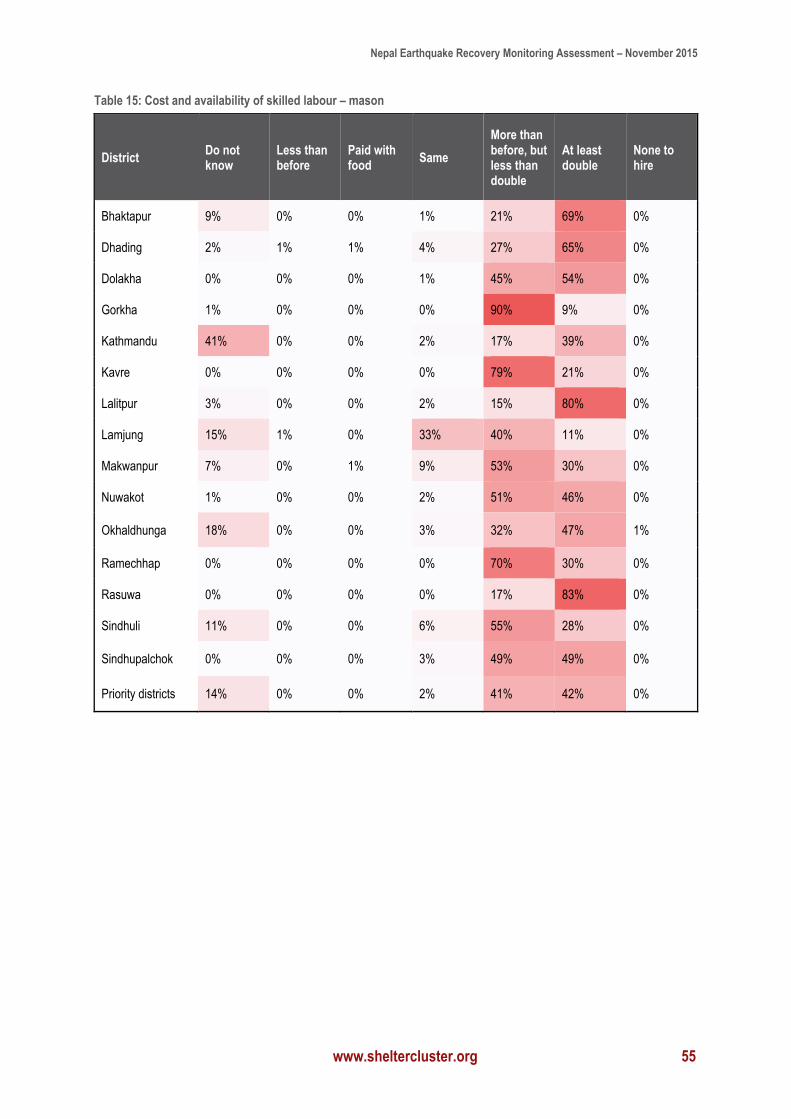
Nepal Earthquake Recovery Monitoring Assessment – November 2015
www.sheltercluster.org 55
Table 15: Cost and availability of skilled labour – mason
District Do not know
Less than before
Paid with food
Same
More than before, but less than double
At least double
None to hire
Bhaktapur 9% 0% 0% 1% 21% 69% 0%
Dhading 2% 1% 1% 4% 27% 65% 0%
Dolakha 0% 0% 0% 1% 45% 54% 0%
Gorkha 1% 0% 0% 0% 90% 9% 0%
Kathmandu 41% 0% 0% 2% 17% 39% 0%
Kavre 0% 0% 0% 0% 79% 21% 0%
Lalitpur 3% 0% 0% 2% 15% 80% 0%
Lamjung 15% 1% 0% 33% 40% 11% 0%
Makwanpur 7% 0% 1% 9% 53% 30% 0%
Nuwakot 1% 0% 0% 2% 51% 46% 0%
Okhaldhunga 18% 0% 0% 3% 32% 47% 1%
Ramechhap 0% 0% 0% 0% 70% 30% 0%
Rasuwa 0% 0% 0% 0% 17% 83% 0%
Sindhuli 11% 0% 0% 6% 55% 28% 0%
Sindhupalchok 0% 0% 0% 3% 49% 49% 0%
Priority districts 14% 0% 0% 2% 41% 42% 0%
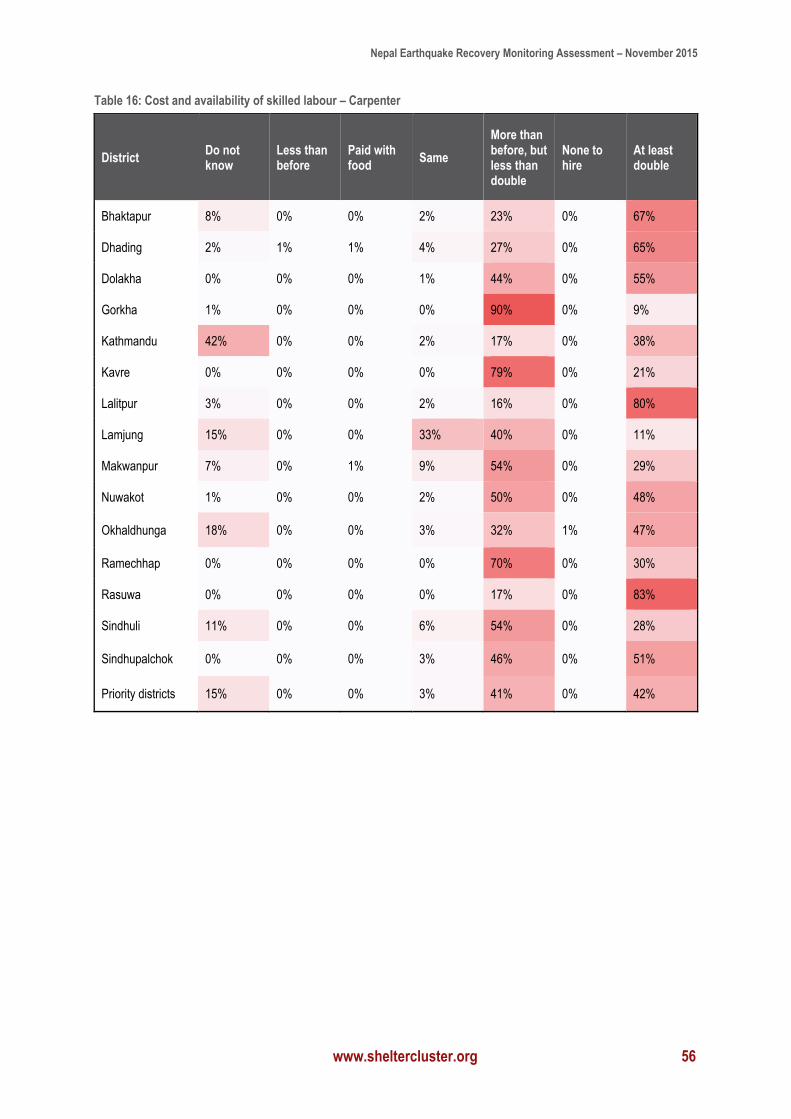
Nepal Earthquake Recovery Monitoring Assessment – November 2015
www.sheltercluster.org 56
Table 16: Cost and availability of skilled labour – Carpenter
District Do not know
Less than before
Paid with food
Same
More than before, but less than double
None to hire
At least double
Bhaktapur 8% 0% 0% 2% 23% 0% 67%
Dhading 2% 1% 1% 4% 27% 0% 65%
Dolakha 0% 0% 0% 1% 44% 0% 55%
Gorkha 1% 0% 0% 0% 90% 0% 9%
Kathmandu 42% 0% 0% 2% 17% 0% 38%
Kavre 0% 0% 0% 0% 79% 0% 21%
Lalitpur 3% 0% 0% 2% 16% 0% 80%
Lamjung 15% 0% 0% 33% 40% 0% 11%
Makwanpur 7% 0% 1% 9% 54% 0% 29%
Nuwakot 1% 0% 0% 2% 50% 0% 48%
Okhaldhunga 18% 0% 0% 3% 32% 1% 47%
Ramechhap 0% 0% 0% 0% 70% 0% 30%
Rasuwa 0% 0% 0% 0% 17% 0% 83%
Sindhuli 11% 0% 0% 6% 54% 0% 28%
Sindhupalchok 0% 0% 0% 3% 46% 0% 51%
Priority districts 15% 0% 0% 3% 41% 0% 42%
Nepal Earthquake Recovery Monitoring Assessment – November 2015
www.sheltercluster.org 57
There was little to no variation in access to labour between different damage levels sustained in the earthquake, except that those whose houses had been totally destroyed indicated that the cost of both masons and carpenters had doubled or more (61% for each) in comparison to those with heavy damage (45%), moderate damage (39%) and minor damage (44%). This indicates that, as one would expect, the higher the demand for skilled labour, the more the cost is increasing. The high percentage reporting lack of skilled labour as a barrier to rebuilding (38% across the priority districts), reflect not just the availability, but also their ability to hire skilled labour at a cost they can afford. This is confirmed in the fact that the reports on a lack of skilled labour increase as the cost of skilled labour increases – 56% of those who mentioned that the cost of a mason had doubled gave the lack of skilled labour as a barrier, compared to 45% of those who indicated the cost had risen by less than double, and 23% of those indicating the cost had remained the same. A key factor in recovery efforts will be concerted action to lower costs of rebuilding and repair to households with skilled labour being the key cost that will need to be reduced for safe rebuilding and repair to begin in earnest. This has been highlighted by the Government of Nepal as a key disaster mitigation strategy prior to the
earthquake: “The prevailing construction practice does not incorporate earthquake resistant components and the existing housing stock is highly vulnerable to earthquakes. This shows a clear need of producing more trained masons by skill upgrading of the practicing masons as well as the newcomers in the construction sector.”20
Households have also indicated that materials are available to purchase in their areas. There is some distance however in the length of time taken to access a market selling shelter supplies. In Gorkha (42%), Kavre (31%), Okhaldhunga (36%) and Sindhupalchok (39%) large proportions of households reported they had to travel over four hours by foot to reach a market. This is surprising for Kavre as other districts are more remote in terms of road access. This suggests that even in relatively central districts rural areas can have poor access to markets. This is indicated by the fact that 26% of respondents in rural areas indicated they had to travel for more than 4 hours by foot to reach a market, compared to 0% in urban areas, while 23% in rural areas have to travel 2-4 hours, compared to 5% in urban areas. This is also true of elevated areas, where 36% of those above 1500 metres reported traveling for more than 4 hours, compared to 10% below 1500 metres. This distinction appears to be mirrored by the current distribution strategy of humanitarian actors, with 26% of those receiving CGI having to travel more than 4 hours to a market.
20 Government of Nepal - Ministry of Home Affairs, National Disaster Report 2011, p.124
While Lamjung followed the general pattern of the priority districts in listing lack of funds as the primary barrier to recovery (100% of those surveyed), there were two key variations. Firstly, only 6% said lack of skilled labour was a barrier, compared to 38% in the priority districts, reflecting that the lower levels of damage and repair work are not inflating prices in the same way as in the priority districts. In fact a higher proportion of respondents in Lamjung indicated that a mason would cost the same now as before the earthquakes (33%) in comparison to other districts. Secondly, a higher proportion listed building permits as a potential barrier (22%) than other districts. This reflects the perceived greater inflexibility of pre-earthquake legislation and administration in a district that has not been prioritised for needs as a result of the earthquakes.
Box 5: Recovery barriers in Lamjung
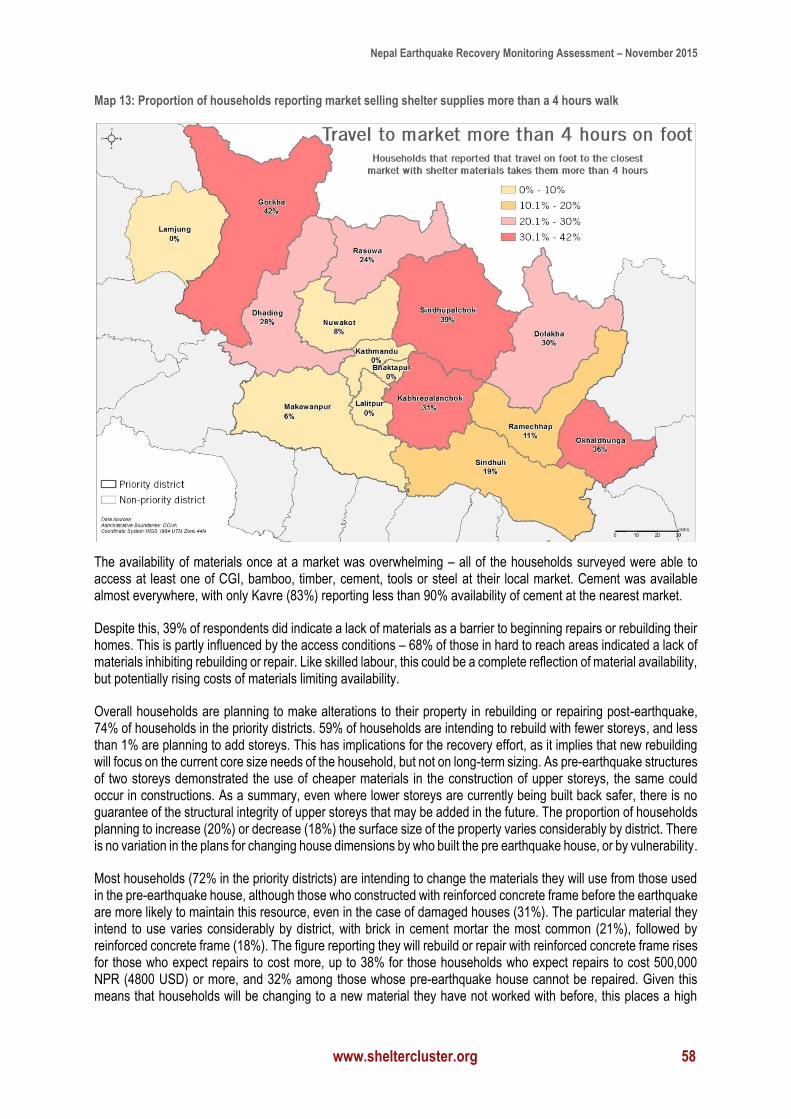
Nepal Earthquake Recovery Monitoring Assessment – November 2015
www.sheltercluster.org 58
Map 13: Proportion of households reporting market selling shelter supplies more than a 4 hours walk
The availability of materials once at a market was overwhelming – all of the households surveyed were able to access at least one of CGI, bamboo, timber, cement, tools or steel at their local market. Cement was available almost everywhere, with only Kavre (83%) reporting less than 90% availability of cement at the nearest market.
Despite this, 39% of respondents did indicate a lack of materials as a barrier to beginning repairs or rebuilding their homes. This is partly influenced by the access conditions – 68% of those in hard to reach areas indicated a lack of materials inhibiting rebuilding or repair. Like skilled labour, this could be a complete reflection of material availability, but potentially rising costs of materials limiting availability.
Overall households are planning to make alterations to their property in rebuilding or repairing post-earthquake, 74% of households in the priority districts. 59% of households are intending to rebuild with fewer storeys, and less than 1% are planning to add storeys. This has implications for the recovery effort, as it implies that new rebuilding will focus on the current core size needs of the household, but not on long-term sizing. As pre-earthquake structures of two storeys demonstrated the use of cheaper materials in the construction of upper storeys, the same could occur in constructions. As a summary, even where lower storeys are currently being built back safer, there is no guarantee of the structural integrity of upper storeys that may be added in the future. The proportion of households planning to increase (20%) or decrease (18%) the surface size of the property varies considerably by district. There is no variation in the plans for changing house dimensions by who built the pre earthquake house, or by vulnerability.
Most households (72% in the priority districts) are intending to change the materials they will use from those used in the pre-earthquake house, although those who constructed with reinforced concrete frame before the earthquake are more likely to maintain this resource, even in the case of damaged houses (31%). The particular material they intend to use varies considerably by district, with brick in cement mortar the most common (21%), followed by reinforced concrete frame (18%). The figure reporting they will rebuild or repair with reinforced concrete frame rises for those who expect repairs to cost more, up to 38% for those households who expect repairs to cost 500,000 NPR (4800 USD) or more, and 32% among those whose pre-earthquake house cannot be repaired. Given this means that households will be changing to a new material they have not worked with before, this places a high
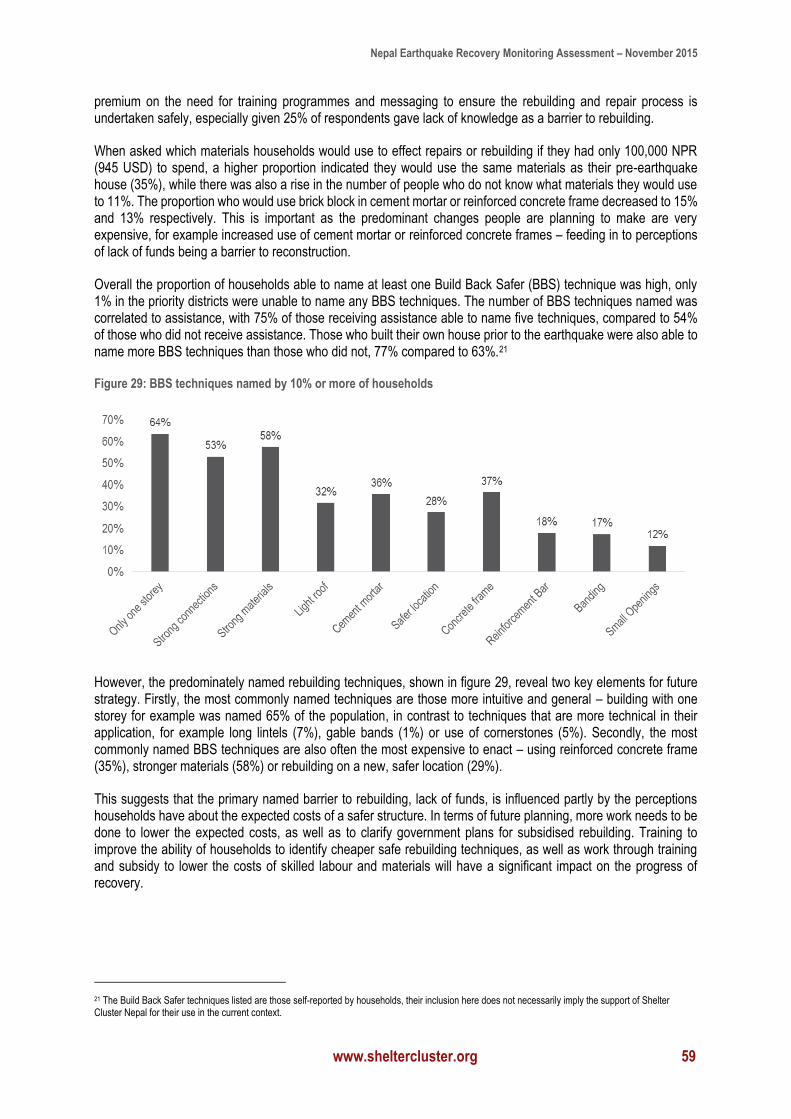
Nepal Earthquake Recovery Monitoring Assessment – November 2015
www.sheltercluster.org 59
premium on the need for training programmes and messaging to ensure the rebuilding and repair process is undertaken safely, especially given 25% of respondents gave lack of knowledge as a barrier to rebuilding.
When asked which materials households would use to effect repairs or rebuilding if they had only 100,000 NPR (945 USD) to spend, a higher proportion indicated they would use the same materials as their pre-earthquake house (35%), while there was also a rise in the number of people who do not know what materials they would use to 11%. The proportion who would use brick block in cement mortar or reinforced concrete frame decreased to 15% and 13% respectively. This is important as the predominant changes people are planning to make are very expensive, for example increased use of cement mortar or reinforced concrete frames – feeding in to perceptions of lack of funds being a barrier to reconstruction.
Overall the proportion of households able to name at least one Build Back Safer (BBS) technique was high, only 1% in the priority districts were unable to name any BBS techniques. The number of BBS techniques named was correlated to assistance, with 75% of those receiving assistance able to name five techniques, compared to 54% of those who did not receive assistance. Those who built their own house prior to the earthquake were also able to name more BBS techniques than those who did not, 77% compared to 63%.21
Figure 29: BBS techniques named by 10% or more of households
However, the predominately named rebuilding techniques, shown in figure 29, reveal two key elements for future strategy. Firstly, the most commonly named techniques are those more intuitive and general – building with one storey for example was named 65% of the population, in contrast to techniques that are more technical in their application, for example long lintels (7%), gable bands (1%) or use of cornerstones (5%). Secondly, the most commonly named BBS techniques are also often the most expensive to enact – using reinforced concrete frame (35%), stronger materials (58%) or rebuilding on a new, safer location (29%).
This suggests that the primary named barrier to rebuilding, lack of funds, is influenced partly by the perceptions households have about the expected costs of a safer structure. In terms of future planning, more work needs to be done to lower the expected costs, as well as to clarify government plans for subsidised rebuilding. Training to improve the ability of households to identify cheaper safe rebuilding techniques, as well as work through training and subsidy to lower the costs of skilled labour and materials will have a significant impact on the progress of recovery.
21 The Build Back Safer techniques listed are those self-reported by households, their inclusion here does not necessarily imply the support of Shelter Cluster Nepal for their use in the current context.
Nepal Earthquake Recovery Monitoring Assessment – November 2015
www.sheltercluster.org 60
CONCLUSION
In April and May 2015 two earthquakes of 7.8 and 7.4 magnitude struck Nepal, with epicentres in Gorkha district north-west of the capital Kathmandu (April), and in Dolakha district north-east of the capital (May). While the impacts on housing, social and economic infrastructure were widespread, the Nepalese government identified 14 priority districts with a combined population of around 2 million for intervention. The relief effort from both government and non-government actors implied 3 phases: 1) initial emergency needs coverage, including seasonal preparations; 2) recovery of pre-earthquake infrastructure, including rebuilding and repair of damaged housing; 3) long-term economic and social recovery. In acknowledging its timing at the transition between the emergency support and recovery phases, the report seeks to identify potential barriers to the upcoming recovery focus, especially within the paradigm of supporting an owner-led reconstruction, in order to inform strategic planning for recovery.
This report has used a cluster sampling methodology to analyse the comparative progress towards shelter recovery in 15 districts of Nepal affected by the dual earthquakes in April and May 2015. Key trends within and between the 14 priority districts have been identified, but further analysis of variations between smaller administrative boundaries will be required to fully implement an appropriate shelter response. Within this caveat, several key themes can be identified. Presented below are the key findings of the report, and recommendations for the future in order to assist the recovery of households who have been impacted by the earthquakes.
Following the earthquakes the National Planning Commission estimated that 609,938 temporary shelters were needed in Nepal in order to house those unable to remain in their homes.22 It is a reflection of the strength of the response effort in the emergency phases that relief did allow people to make seasonal preparations for the monsoon season, and that season preparation also means the majority of respondents are ready for the coming winter. A majority (77%) of households reported that they have received shelter assistance since the earthquakes. Cash was the most commonly received assistance reported by respondents, at 57% in the priority districts and 55% overall. The primary items purchased with cash assistance have been being CGI (57% in the priority districts) and food (44%), reflecting the use of cash assistance to transfer emergency life-saving assistance.
The majority of households have received victim cards (63%), in order to enable them to access assistance. The vast majority of houses reporting moderate (86%), heavy (96%) or total damage (98%) did possess a victim card, although high rates of non-possession of victim cards within households reporting these damage levels were found in Sindhuli (29%), Lamjung (21%), Lalitpur (19%) and Okhaldhunga (16%). Ensuring that the coverage of victim cards is consistent across districts, especially among those households with higher levels of housing damage, is paramount in ensuring the equity of assistance.
Direct winterization needs look to be less severe than some previous assessments have indicated, reflecting the strong emergency response in preparation for the monsoon season. Over 50% in all districts reported that they believed their shelter to be rain and weather proof most of the time or more, apart from Dolakha and Gorkha, where 33% and 35% respectively reported that their shelter was prepared for snow and cold most of the time or all of the time. There is limited variation in the proportion of households believing their shelter to be not at all prepared for winter by location type, access conditions or elevation; although lower proportions of those households in rural areas, hard to reach areas, and areas above 1500 meters report their household is always prepared for cold than in urban areas, road-accessible areas, and areas below 1500 meters.
There is more variation in winter preparations by whether or not a household is currently in a temporary shelter, with 11% of households in temporary shelter reporting the building is not at all prepared for cold weather, compared to 2% of households not currently in temporary shelter. In total 41% of households surveyed expect to spend the coming winter in temporary shelter, with large variations by district. Conditions in temporary shelter largely meet expected standards, with 86% of households in temporary shelter having a total covered living space per person over 3.5 metres, although there is a district variation meaning many still live in conditions below required standards, especially in Gorkha. The access to CGI either through assistance or markets is reflected in the common use of the material in temporary shelter wall (71%) and roof (90%) structures.
22 National Planning Commission, Post-Disaster Needs Assessment, p. 6
Nepal Earthquake Recovery Monitoring Assessment – November 2015
www.sheltercluster.org 61
Moving forward, more work will be required to enable a household-lead rebuilding effort for houses damaged by the earthquakes, although a solid base exists in the resources available to households, knowledge of building techniques and availability of labour. Further interventions will need to focus on advocacy of Build Back Safer (BBS) techniques using materials households are already familiar with, and on overcoming uncertainty in the degree of, and access to, financial assistance for recovery. There has been little change in the income sources reported by households before and after the earthquake. The continued prevalence of agricultural income sources, especially in rural areas, suggests that households have been prioritising agricultural inputs over shelter recovery in the distribution of household resources, both labour and financial. Any moves towards recovery will require a recalibration of these resources, for example in the distribution of household cash to shelter supplies, and the use of household members as labour on rebuilding/ repair rather than agriculture. The implicit fine margins of income stability, indicated by the high proportion of rural households reporting subsistence farming as an income source (56%), mean that recovery assistance must be mindful of the potential decrease in the stability of income as households have less time and resources to expend on agriculture.
A majority, 81% of respondents in the priority districts, reported that they had access to at least one form of banking service. However, significant proportions in all districts have no access to financial services. Furthermore, only 48% reported they currently use a bank for financial services. This has implications on the current plans for the disbursement of any government subsidy, with large numbers of households likely to be excluded if this subsidy is transferred exclusively using bank accounts.
The majority of structural materials used in pre-earthquake housing fall into the category of load bearing masonry – reported by 89% of households. The use of reinforced concrete frames (21%) is concentrated in urban areas. While damage levels in pre-earthquake housing are lower for those with a reinforced concrete frame (94% reporting no damage or minor damage) compared to load bearing masonry (35%), this should not be equated with a need to encourage a dramatic and expensive shift in the building materials that should be used in recovery.
Load bearing masonry houses also saw a higher proportion of household members involved in the original construction (69%) compared to 29% in buildings with a reinforced concrete frame, meaning that most households will already have a level of expertise in the use of load bearing masonry. A shift in the building materials used in recovery will consequentially entail a loss of these expertise, as households attempt to rebuild utilizing unfamiliar materials; aside from the added cost of reinforced concrete frames.
Current progress towards recovery has been limited, reflecting the initial requirements of focusing on emergency and life-saving assistance. Despite 74% of households in the priority districts reporting damage by the earthquakes in April and May 2014, only 5% report that repairs or rebuilding works have been completed. A further 8% are currently being repaired, while 11% report that their houses have either been demolished, or the site is currently being cleared. This leaves 50% of all households in the priority districts that are still in the same condition as after the earthquakes, with little variation by the degree to which households have taken on debt or received assistance. This reflects the current use of both debt and assistance for meeting emergency needs, rather than in supporting recovery. In the coming months, while preparations for seasonal needs are important, a strong emphasis of technical guidance and resources for recovery will be necessary. Currently very low rates of respondents across all districts report that they had received technical assistance, materials or training. Over 99% reported that they have not received technical training or materials.
This need for further technical support is also reflected in the finding that 72% of households intend to use a new material they have not worked with before when conducting repairs or rebuilding, and this places a high premium on the need for training programmes and messaging to ensure the rebuilding and repair process is undertaken safely, especially given 25% of respondents gave lack of knowledge as a barrier to rebuilding. The change in intended materials for repair/ rebuilding means that households are less likely to have an existing expertise in the use of materials. Concurrently, the increased intention to use reinforced concrete frames (21%) or brick in cement mortar (18%) would entail an unrealistic increase in the costs of rebuilding. Where perceptions about the prospective costs of rebuilding are cited as the primary barrier to recovery, there is a great deal of outreach needed to ensure that households are able to identify cheaper, safe alternatives in rebuilding/ repair than a shift in materials.
Nepal Earthquake Recovery Monitoring Assessment – November 2015
www.sheltercluster.org 62
Similarly, while only 1% of those surveyed were unable to name a build back safer technique, the techniques named most frequently tend to be more general, less technical, and more expensive than those techniques named less frequently. This indicates a need for high levels of technical guidance to support households in rebuilding safely with existing materials, which should serve the dual purpose of increasing the safety of recovery, and decreasing the anticipated costs households face. This is highlighted also by the National Planning Commission: “As the recovery is going to be largely owner led, it is essential to make them aware of need of disaster resistant construction. There will be need to guide them on choice of building typologies, materials and costing in addition to minimum disaster resistant features. As the owners hire artisans and take decision with regards to materials and construction system, their awareness is critical. Dissemination of required information on reconstruction, repairs and retrofitting to them is very important.”23
There is also a potential for uncertainty related to potential government subsidies for houses damaged by the earthquake stymying or delaying household-led recovery, with people perceiving that if they complete repairs before the scheme rolls out they will be ineligible. As the scheme’s timeline is uncertain, and unlikely to be launched before February of 2016 at the earliest, the potential for many households continuing to take no action on repair or rebuilding work throughout the winter remains high. Currently the government subsidies are funded only for a limited number of centrally located districts, with timelines and budgeting for the remaining areas uncertain.
A majority, 81% of respondents in the priority districts, reported that they had access to at least one form of banking service. However, significant proportions in all districts have no access to financial services. Furthermore, only 48% reported they currently use a bank for financial services. This has implications on the current plans for the disbursement of any government subsidy, with large numbers of households likely to be excluded if this subsidy is transferred exclusively using bank accounts.
The primary barriers to repair or rebuild after the earthquakes in the priority districts were reported as lack of funds (97%), lack of skilled labour (38%), lack of materials (39%) and lack of knowledge (25%). Despite these reports, more detailed examination of both the availability of skilled labour and materials suggests that both are available in all locations, but that the price is rising. In particular 83% of households indicated that masons are available in their location, but at an increased cost since before the earthquake. Any significant moves in recovery are thus likely to precipitate further price rises, as a result of increased demand. Thus a significant danger exists of pricing many households out of use of skilled labour in particular, which could result in fewer households contracting local skilled labour than in the construction of pre-earthquake housing. This could have significant implications for the application of build back safer techniques. Similarly, and as reflected throughout, a focus on lowering households perception of rebuilding and repair costs through technical assistance on the safe use of pre-existing housing materials will be required as the response focus shifts away from seasonal preparedness and emergency shelter provision towards long-term recovery.
The report has observed successful operations from aid actors and government in meeting the initial emergency needs of those affected by the earthquakes. The earthquakes immediately preceded the Nepali monsoon season from June-October, and assistance following this was required to make subsequent preparations for the December-March cold season, meaning that the transition to the recovery phase is nascent at the time of writing. Past experience of disaster recovery regionally and in Nepal suggests that people will begin reconstruction using their own resources. The key strategic aims of the assistance effort in the recovery phase will thus be activities aimed at expediting self-recovery in order to minimise the human and financial costs of repeated seasonal preparation; and activities aimed at facilitating safer rebuilding in order to mitigate the effects of future disasters.
23 National Planning Commission, Post-Disaster Needs Assessment, p. 18
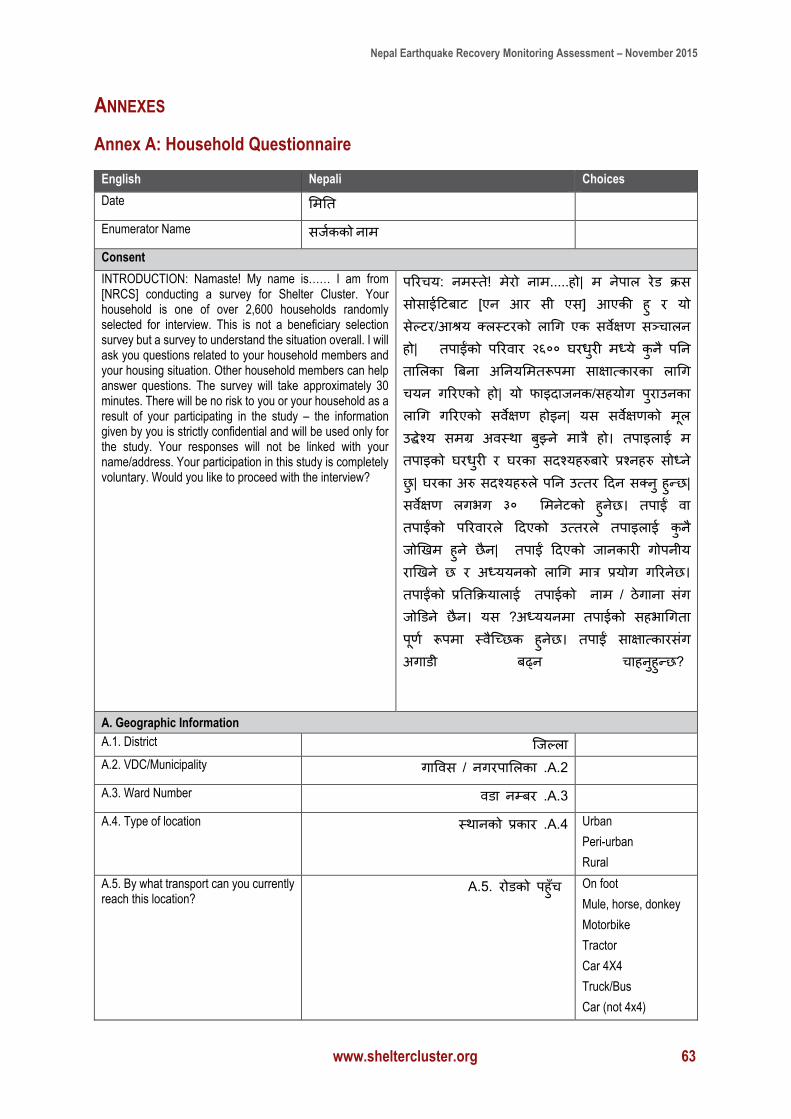
Nepal Earthquake Recovery Monitoring Assessment – November 2015
www.sheltercluster.org 63
ANNEXES
Annex A: Household Questionnaire
English Nepali Choices
Date मिति
Enumerator Name सर्जकको नाि
Consent
INTRODUCTION: Namaste! My name is…… I am from [NRCS] conducting a survey for Shelter Cluster. Your household is one of over 2,600 households randomly selected for interview. This is not a beneficiary selection survey but a survey to understand the situation overall. I will ask you questions related to your household members and your housing situation. Other household members can help answer questions. The survey will take approximately 30 minutes. There will be no risk to you or your household as a result of your participating in the study – the information given by you is strictly confidential and will be used only for the study. Your responses will not be linked with your name/address. Your participation in this study is completely voluntary. Would you like to proceed with the interview?
परिचय: निस्ि!े िेिो नाि.....हो| ि नेपाल िेड क्रस सोसाईटिबाि [एन आि सी एस] आएकी हु ि यो सेल्िि/आश्रय क्लस्ििको लागि एक सरे्वक्षण सञ्चालन हो| िपाईंको परिर्वाि २६०० घिधुिी िध्ये कुनै पतन िामलका बबना अतनयमििरूपिा साक्षात्कािका लागि चयन िरिएको हो| यो फाइदार्नक/सहयोि पुिाउनका लागि िरिएको सरे्वक्षण होइन| यस सरे्वक्षणको िूल उद्धेश्य सिग्र अर्वस्था बुझ्ने िात्र ै हो। िपाइलाई ि िपाइको घिधुिी ि घिका सदश्यहरुबािे प्रश्नहरु सोध्ने छु| घिका अरु सदश्यहरुले पतन उत्िि टदन सक्नु हुन्छ| सरे्वक्षण लिभि ३० मिनेिको हुनेछ। िपाईं र्वा िपाईंको परिर्वािले टदएको उत्ििले िपाइलाई कुनै र्ोखिि हुने छैन| िपाईं टदएको र्ानकािी िोपनीय िाखिने छ ि अध्ययनको लागि िात्र प्रयोि िरिनेछ। िपाईंको प्रतिक्रक्रयालाई िपाईको नाि / ठेिाना संि र्ोडडने छैन। यस ?अध्ययनिा िपाईको सहभागििा पूणज रूपिा स्र्वैच्छछक हुनेछ। िपाईं साक्षात्कािसंि अिाडी बढ्न चाहनुहुन्छ?
A. Geographic Information A.1. District च्र्ल्ला A.2. VDC/Municipality A.2 .िावर्वस / नििपामलका
A.3. Ward Number A.3 .र्वडा नम्बि
A.4. Type of location A.4 .स्थानको प्रकाि Urban
Peri-urban
Rural
A.5. By what transport can you currently reach this location?
A.5. िोडको पहुुँच On foot
Mule, horse, donkey
Motorbike
Tractor
Car 4X4
Truck/Bus
Car (not 4x4)
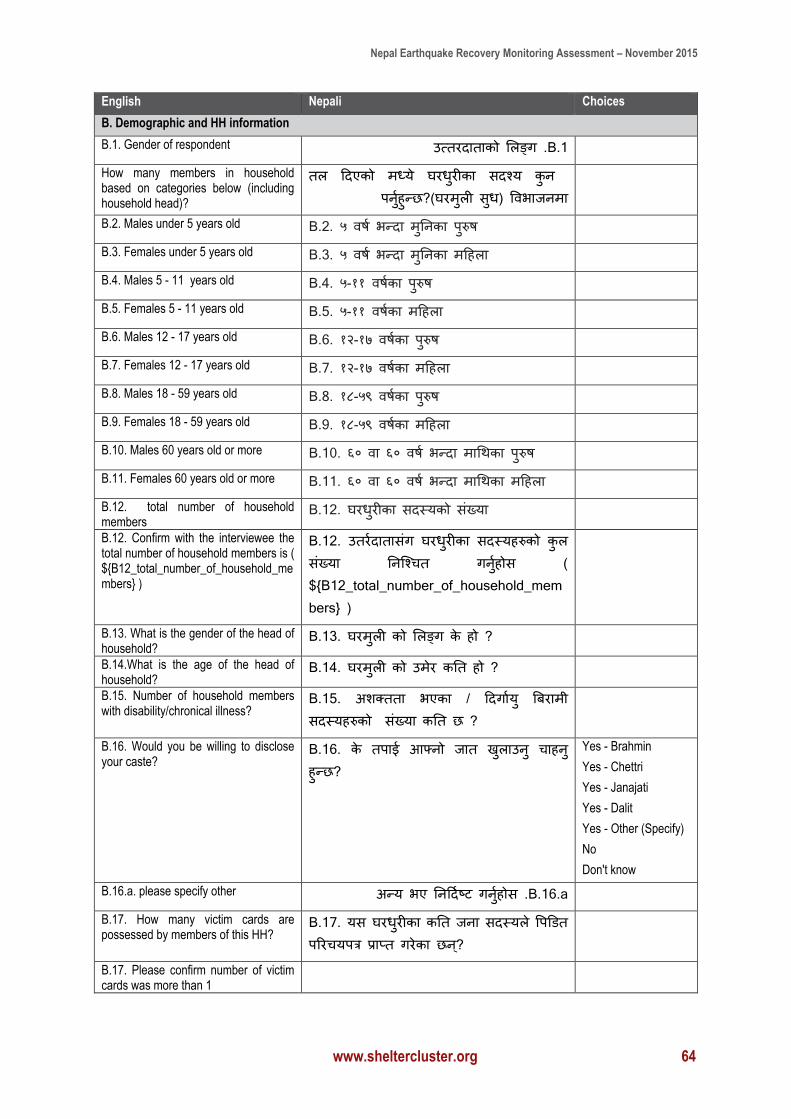
Nepal Earthquake Recovery Monitoring Assessment – November 2015
www.sheltercluster.org 64
English Nepali Choices
B. Demographic and HH information
B.1. Gender of respondent B.1 .उत्ििदािाको मलङ्ि
How many members in household based on categories below (including household head)?
िल टदएको िध्ये घिधुिीका सदश्य कुन वर्वभार्निा पनुजहुन्छ?(घििुली सुध)
B.2. Males under 5 years old B.2. ५ र्वर्ज भन्दा िुतनका पुरुर्
B.3. Females under 5 years old B.3. ५ र्वर्ज भन्दा िुतनका िटहला
B.4. Males 5 - 11 years old B.4. ५-११ र्वर्जका पुरुर्
B.5. Females 5 - 11 years old B.5. ५-११ र्वर्जका िटहला
B.6. Males 12 - 17 years old B.6. १२-१७ र्वर्जका पुरुर्
B.7. Females 12 - 17 years old B.7. १२-१७ र्वर्जका िटहला
B.8. Males 18 - 59 years old B.8. १८-५९ र्वर्जका पुरुर्
B.9. Females 18 - 59 years old B.9. १८-५९ र्वर्जका िटहला
B.10. Males 60 years old or more B.10. ६० र्वा ६० र्वर्ज भन्दा िागथका पुरुर्
B.11. Females 60 years old or more B.11. ६० र्वा ६० र्वर्ज भन्दा िागथका िटहला
B.12. total number of household members
B.12. घिधुिीका सदस्यको संख्या
B.12. Confirm with the interviewee the total number of household members is ( ${B12_total_number_of_household_members} )
B.12. उििजदािासंि घिधुिीका सदस्यहरुको कुल संख्या तनच्श्चि िनुजहोस ( ${B12_total_number_of_household_members} )
B.13. What is the gender of the head of household?
B.13. घििुली को मलङ्ि के हो ?
B.14.What is the age of the head of household?
B.14. घििुली को उिेि कति हो ?
B.15. Number of household members with disability/chronical illness?
B.15. अशक्ििा भएका / टदिाजयु बबिािी सदस्यहरुको संख्या कति छ ?
B.16. Would you be willing to disclose your caste?
B.16. के िपाई आफ्नो र्ाि िुलाउनु चाहनु हुन्छ?
Yes - Brahmin
Yes - Chettri
Yes - Janajati
Yes - Dalit
Yes - Other (Specify)
No
Don't know
B.16.a. please specify other B.16.a .अन्य भए तनटदजष्ि िनुजहोस
B.17. How many victim cards are possessed by members of this HH?
B.17. यस घिधुिीका कति र्ना सदस्यले वपडडि परिचयपत्र प्राप्ि ििेका छन?्
B.17. Please confirm number of victim cards was more than 1
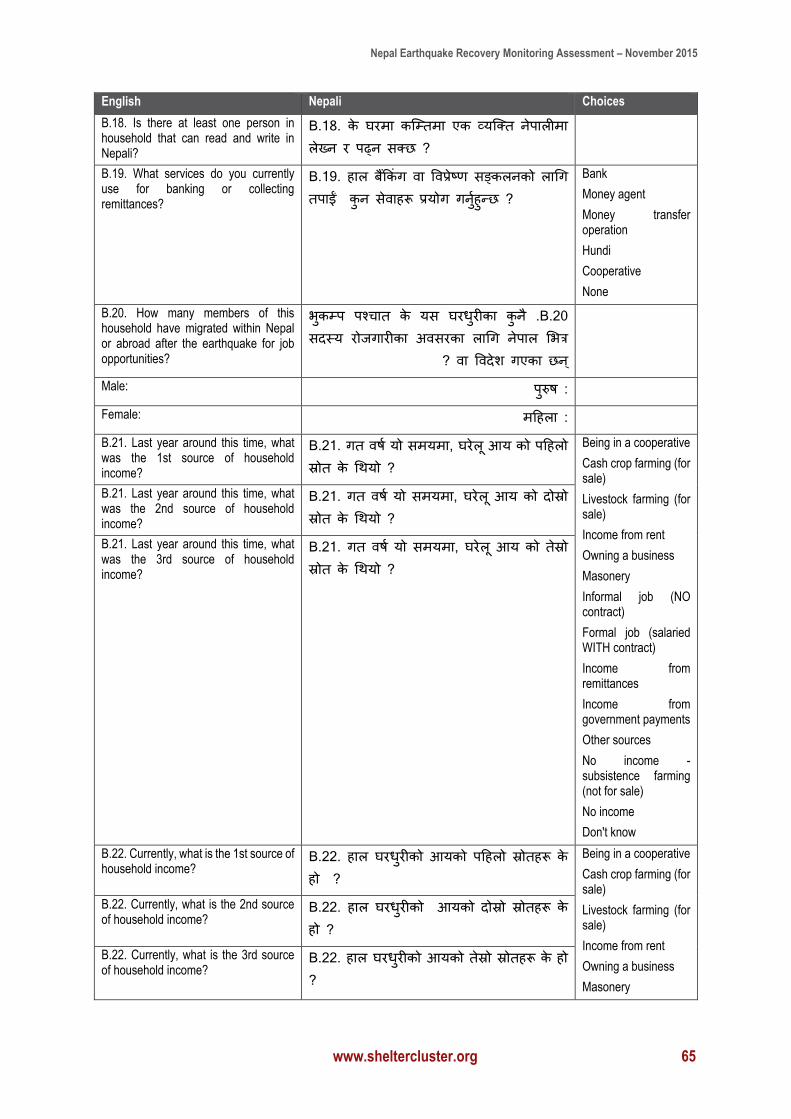
Nepal Earthquake Recovery Monitoring Assessment – November 2015
www.sheltercluster.org 65
English Nepali Choices
B.18. Is there at least one person in household that can read and write in Nepali?
B.18. के घििा कच्म्ििा एक व्यच्क्ि नेपालीिा लेख्न ि पढ्न सक्छ ?
B.19. What services do you currently use for banking or collecting remittances?
B.19. हाल बैंक्रकंि र्वा वर्वपे्रष्ण सङ्कलनको लागि िपाईं कुन सेर्वाहरू प्रयोि िनुजहुन्छ ?
Bank
Money agent
Money transfer operation
Hundi
Cooperative
None
B.20. How many members of this household have migrated within Nepal or abroad after the earthquake for job opportunities?
B.20 .भकुम्प पश्चाि के यस घिधुिीका कुनै सदस्य िोर्िािीका अर्वसिका लागि नेपाल मभत्र
र्वा वर्वदेश िएका छन ् ?
Male: :पुरुर्
Female: :िटहला
B.21. Last year around this time, what was the 1st source of household income?
B.21. िि र्वर्ज यो सियिा, घिेल ूआय को पटहलो स्रोि के गथयो ?
Being in a cooperative
Cash crop farming (for sale)
Livestock farming (for sale)
Income from rent
Owning a business
Masonery
Informal job (NO contract)
Formal job (salaried WITH contract)
Income from remittances
Income from government payments
Other sources
No income - subsistence farming (not for sale)
No income
Don't know
B.21. Last year around this time, what was the 2nd source of household income?
B.21. िि र्वर्ज यो सियिा, घिेल ूआय को दोस्रो स्रोि के गथयो ?
B.21. Last year around this time, what was the 3rd source of household income?
B.21. िि र्वर्ज यो सियिा, घिेल ूआय को िेस्रो स्रोि के गथयो ?
B.22. Currently, what is the 1st source of household income?
B.22. हाल घिधुिीको आयको पटहलो स्रोिहरू के हो ?
Being in a cooperative
Cash crop farming (for sale)
Livestock farming (for sale)
Income from rent
Owning a business
Masonery
B.22. Currently, what is the 2nd source of household income?
B.22. हाल घिधुिीको आयको दोस्रो स्रोिहरू के हो ?
B.22. Currently, what is the 3rd source of household income?
B.22. हाल घिधुिीको आयको िेस्रो स्रोिहरू के हो ?
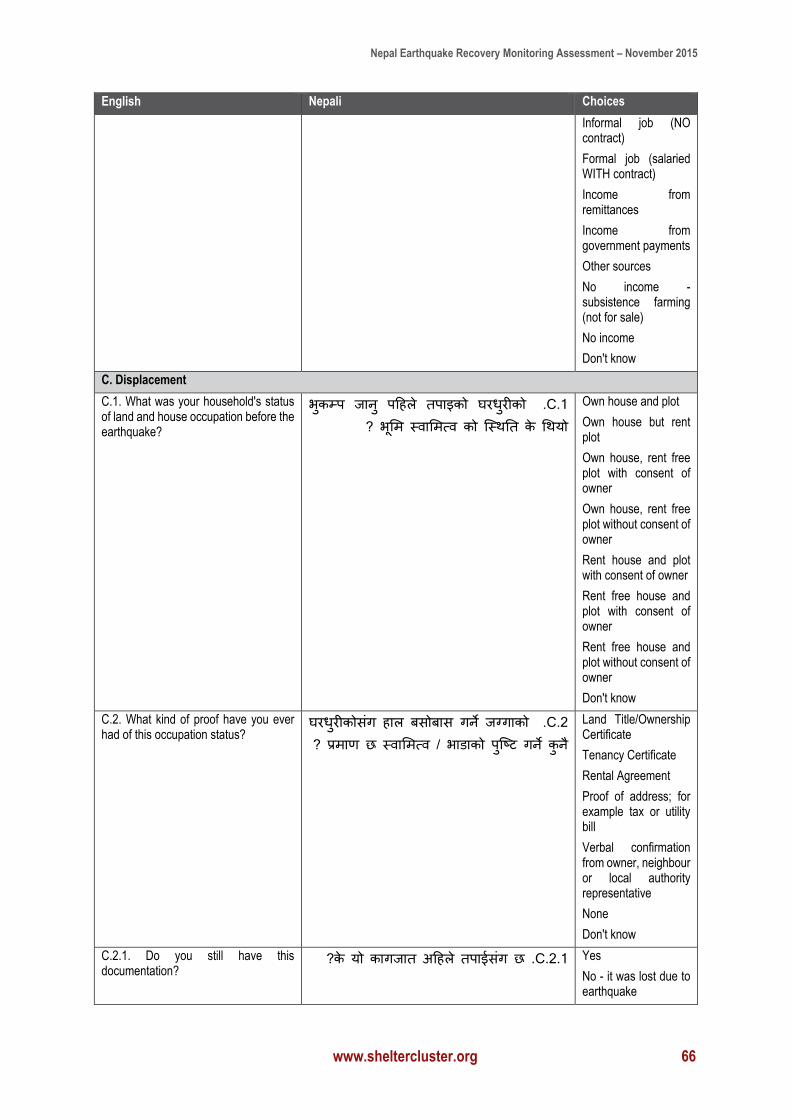
Nepal Earthquake Recovery Monitoring Assessment – November 2015
www.sheltercluster.org 66
English Nepali Choices
Informal job (NO contract)
Formal job (salaried WITH contract)
Income from remittances
Income from government payments
Other sources
No income - subsistence farming (not for sale)
No income
Don't know
C. Displacement
C.1. What was your household's status of land and house occupation before the earthquake?
C.1 .भकुम्प र्ानु पटहले िपाइको घिधुिीको भूमि स्र्वामित्र्व को च्स्थति के गथयो ?
Own house and plot
Own house but rent plot
Own house, rent free plot with consent of owner
Own house, rent free plot without consent of owner
Rent house and plot with consent of owner
Rent free house and plot with consent of owner
Rent free house and plot without consent of owner
Don't know
C.2. What kind of proof have you ever had of this occupation status?
C.2 .घिधुिीकोसंि हाल बसोबास िने र्ग्िाको स्र्वामित्र्व / भाडाको पुच्ष्ि िने कुनै प्रिाण छ ?
Land Title/Ownership Certificate
Tenancy Certificate
Rental Agreement
Proof of address; for example tax or utility bill
Verbal confirmation from owner, neighbour or local authority representative
None
Don't know
C.2.1. Do you still have this documentation?
C.2.1 .के यो कािर्ाि अटहले िपाईसंि छ ? Yes
No - it was lost due to earthquake
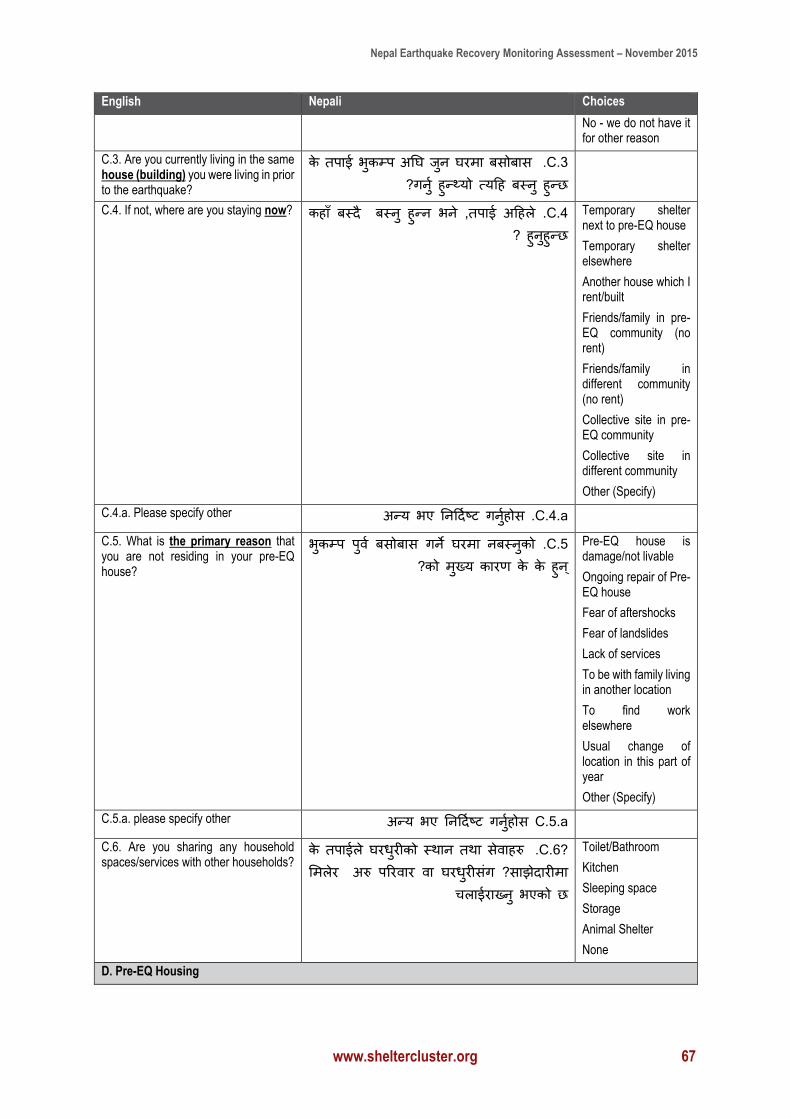
Nepal Earthquake Recovery Monitoring Assessment – November 2015
www.sheltercluster.org 67
English Nepali Choices
No - we do not have it for other reason
C.3. Are you currently living in the same house (building) you were living in prior to the earthquake?
C.3 .के िपाई भुकम्प अतघ रु्न घििा बसोबास िनुज हुन््यो त्यटह बस्नु हुन्छ ?
C.4. If not, where are you staying now? C.4 .बस्नु हुन्न भने ,िपाई अटहले कहाुँ बस्दै हुनुहुन्छ ?
Temporary shelter next to pre-EQ house
Temporary shelter elsewhere
Another house which I rent/built
Friends/family in pre-EQ community (no rent)
Friends/family in different community (no rent)
Collective site in pre-EQ community
Collective site in different community
Other (Specify)
C.4.a. Please specify other C.4.a .अन्य भए तनटदजष्ि िनुजहोस
C.5. What is the primary reason that you are not residing in your pre-EQ house?
C.5 .भुकम्प पुर्वज बसोबास िने घििा नबस्नुको को िुख्य कािण के के हुन ्?
Pre-EQ house is damage/not livable
Ongoing repair of Pre-EQ house
Fear of aftershocks
Fear of landslides
Lack of services
To be with family living in another location
To find work elsewhere
Usual change of location in this part of year
Other (Specify)
C.5.a. please specify other C.5.a अन्य भए तनटदजष्ि िनुजहोस
C.6. Are you sharing any household spaces/services with other households?
?C.6 .के िपाईले घिधुिीको स्थान िथा सेर्वाहरु अरु परिर्वाि र्वा घिधुिीसंि ?साझेदािीिा मिलेि
चलाईिाख्नु भएको छ
Toilet/Bathroom
Kitchen
Sleeping space
Storage
Animal Shelter
None
D. Pre-EQ Housing
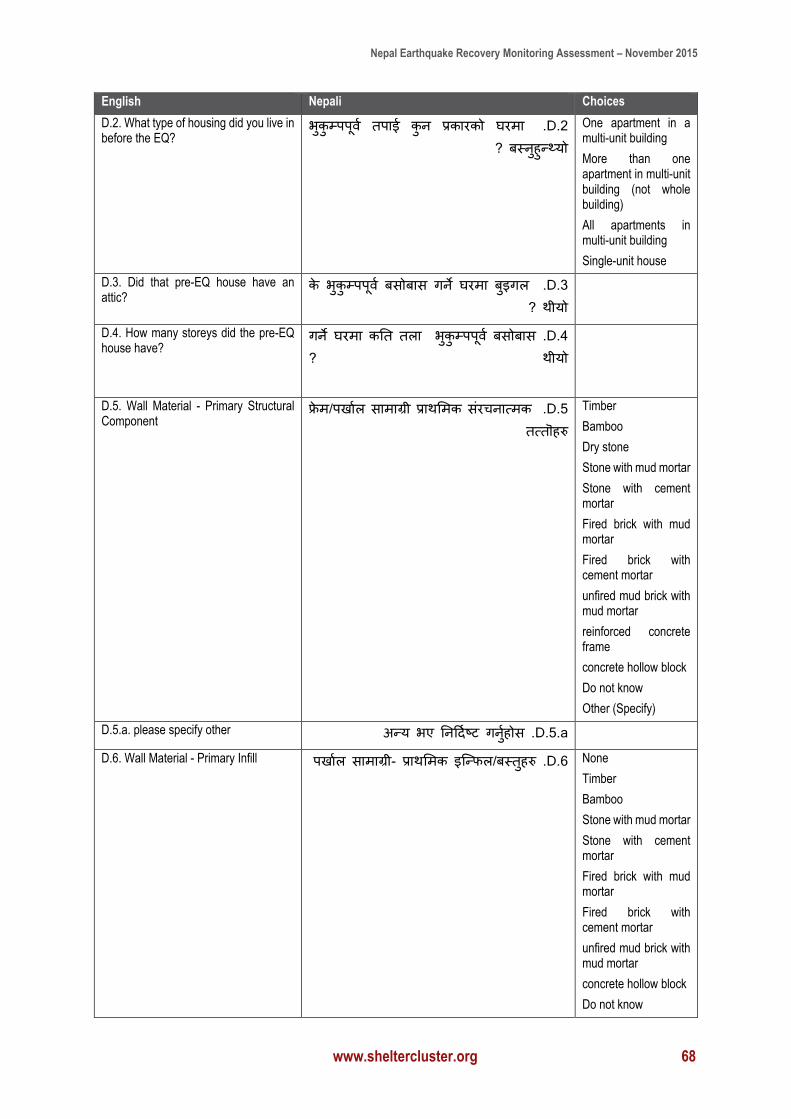
Nepal Earthquake Recovery Monitoring Assessment – November 2015
www.sheltercluster.org 68
English Nepali Choices
D.2. What type of housing did you live in before the EQ?
D.2 .भकुुम्पपूर्वज िपाई कुन प्रकािको घििा बस्नुहुन््यो ?
One apartment in a multi-unit building
More than one apartment in multi-unit building (not whole building)
All apartments in multi-unit building
Single-unit house
D.3. Did that pre-EQ house have an attic?
D.3 .के भुकुम्पपूर्वज बसोबास िने घििा बुइिल थीयो ?
D.4. How many storeys did the pre-EQ house have?
D.4 .भकुुम्पपूर्वज बसोबास िने घििा कति िला थीयो ?
D.5. Wall Material - Primary Structural Component
D.5 .फे्रि/पिाजल सािाग्री प्राथमिक संिचनात्िक ित्िॊहरु
Timber
Bamboo
Dry stone
Stone with mud mortar
Stone with cement mortar
Fired brick with mud mortar
Fired brick with cement mortar
unfired mud brick with mud mortar
reinforced concrete frame
concrete hollow block
Do not know
Other (Specify)
D.5.a. please specify other D.5.a .अन्य भए तनटदजष्ि िनुजहोस
D.6. Wall Material - Primary Infill D.6 .पिाजल सािाग्री- प्राथमिक इच्न्फल/बस्िुहरु None
Timber
Bamboo
Stone with mud mortar
Stone with cement mortar
Fired brick with mud mortar
Fired brick with cement mortar
unfired mud brick with mud mortar
concrete hollow block
Do not know
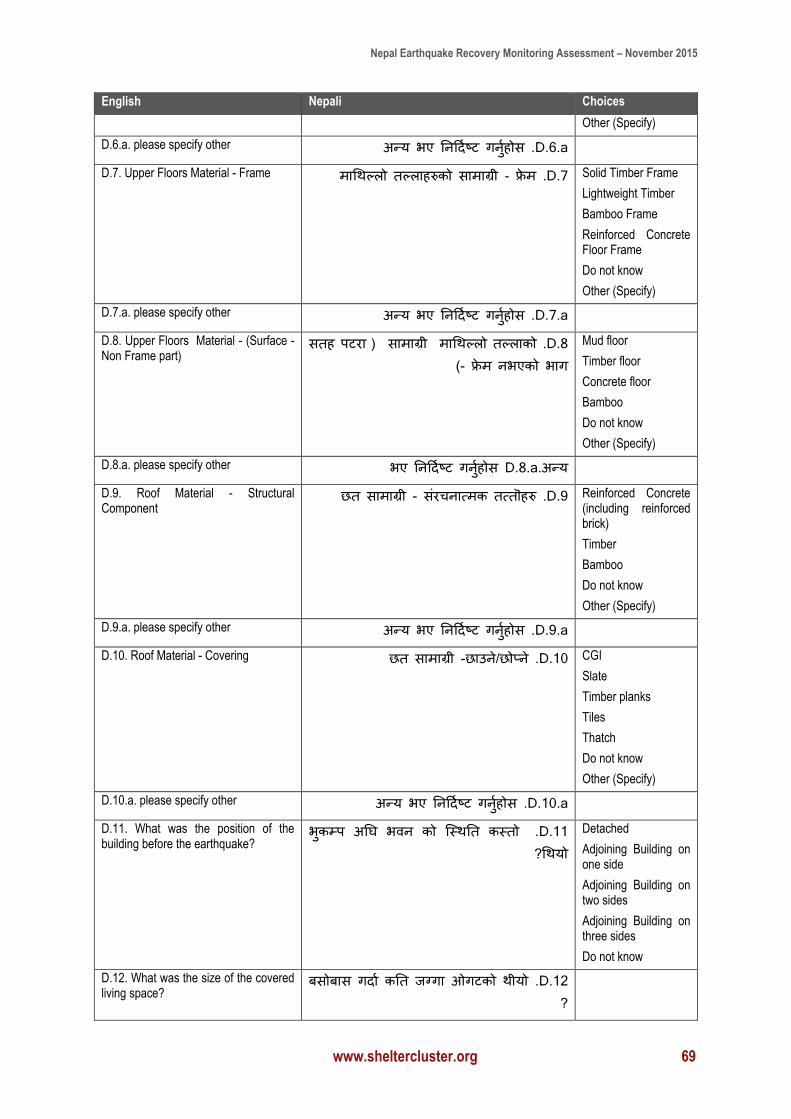
Nepal Earthquake Recovery Monitoring Assessment – November 2015
www.sheltercluster.org 69
English Nepali Choices
Other (Specify)
D.6.a. please specify other D.6.a .अन्य भए तनटदजष्ि िनुजहोस
D.7. Upper Floors Material - Frame D.7 .िागथल्लो िल्लाहरुको सािाग्री - फे्रि Solid Timber Frame
Lightweight Timber
Bamboo Frame
Reinforced Concrete Floor Frame
Do not know
Other (Specify)
D.7.a. please specify other D.7.a .अन्य भए तनटदजष्ि िनुजहोस
D.8. Upper Floors Material - (Surface - Non Frame part)
D.8 .िागथल्लो िल्लाको सािाग्री )सिह पििा - फे्रि नभएको भाि)
Mud floor
Timber floor
Concrete floor
Bamboo
Do not know
Other (Specify)
D.8.a. please specify other D.8.a.अन्य भए तनटदजष्ि िनुजहोस
D.9. Roof Material - Structural Component
D.9 .छि सािाग्री - संिचनात्िक ित्िॊहरु Reinforced Concrete (including reinforced brick)
Timber
Bamboo
Do not know
Other (Specify)
D.9.a. please specify other D.9.a .अन्य भए तनटदजष्ि िनुजहोस
D.10. Roof Material - Covering D.10 .छि सािाग्री -छाउने/छोप्ने CGI
Slate
Timber planks
Tiles
Thatch
Do not know
Other (Specify)
D.10.a. please specify other D.10.a .अन्य भए तनटदजष्ि िनुजहोस
D.11. What was the position of the building before the earthquake?
D.11 .भुकम्प अतघ भर्वन को च्स्थति कस्िो गथयो ?
Detached
Adjoining Building on one side
Adjoining Building on two sides
Adjoining Building on three sides
Do not know
D.12. What was the size of the covered living space?
D.12 .बसोबास िदाज कति र्ग्िा ओििको थीयो ?
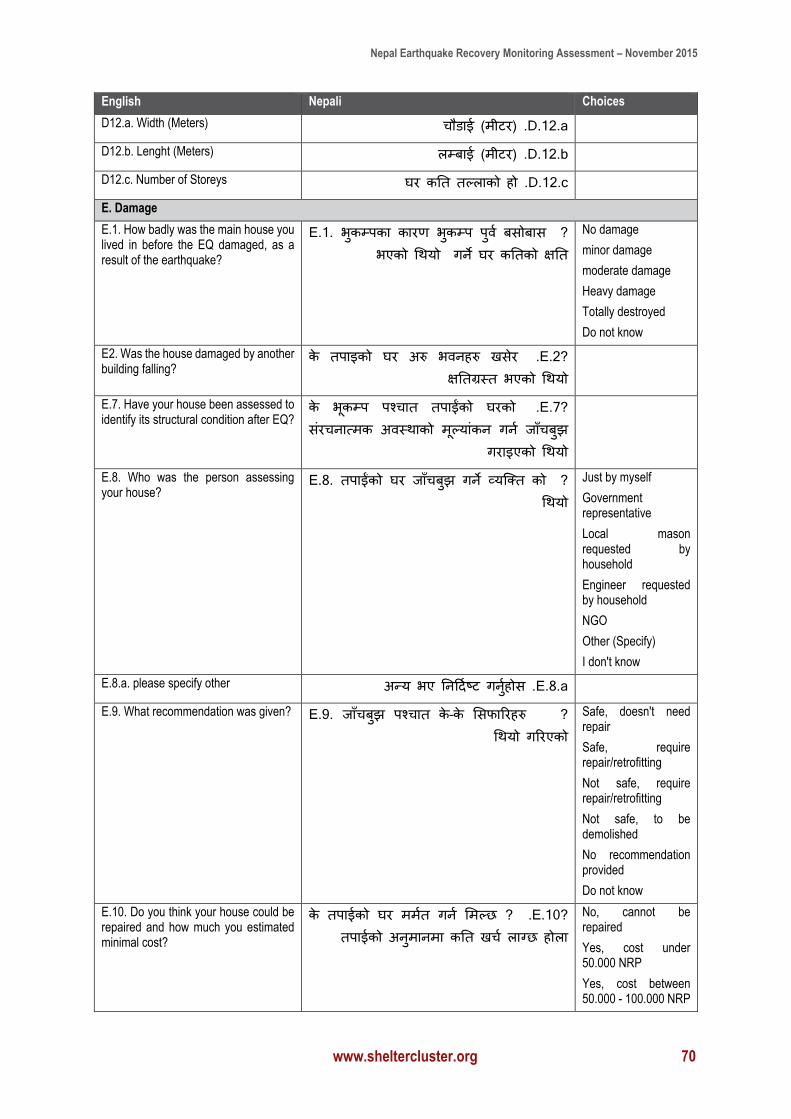
Nepal Earthquake Recovery Monitoring Assessment – November 2015
www.sheltercluster.org 70
English Nepali Choices
D12.a. Width (Meters) D.12.a .चौडाई )िीिि)
D12.b. Lenght (Meters) D.12.b .लम्बाई )िीिि)
D12.c. Number of Storeys D.12.c .घि कति िल्लाको हो
E. Damage
E.1. How badly was the main house you lived in before the EQ damaged, as a result of the earthquake?
?E.1. भुकम्पका कािण भकुम्प पुर्वज बसोबास िने घि कतिको क्षति भएको गथयो
No damage
minor damage
moderate damage
Heavy damage
Totally destroyed
Do not know
E2. Was the house damaged by another building falling?
?E.2 .के िपाइको घि अरु भर्वनहरु िसेि क्षतिग्रस्ि भएको गथयो
E.7. Have your house been assessed to identify its structural condition after EQ?
?E.7 .के भकूम्प पश्चाि िपाईंको घिको संिचनात्िक अर्वस्थाको िूल्यांकन िनज र्ाुँचबुझ
ििाइएको गथयो
E.8. Who was the person assessing your house?
?E.8. िपाईंको घि र्ाुँचबुझ िने व्यच्क्ि को गथयो
Just by myself
Government representative
Local mason requested by household
Engineer requested by household
NGO
Other (Specify)
I don't know
E.8.a. please specify other E.8.a .अन्य भए तनटदजष्ि िनुजहोस
E.9. What recommendation was given? ?E.9. र्ाुँचबुझ पश्चाि के–के मसफारिहरु िरिएको गथयो
Safe, doesn't need repair
Safe, require repair/retrofitting
Not safe, require repair/retrofitting
Not safe, to be demolished
No recommendation provided
Do not know
E.10. Do you think your house could be repaired and how much you estimated minimal cost?
?E.10 .के िपाईको घि ििजि िनज मिल्छ ? िपाईको अनुिानिा कति िचज लाग्छ होला
No, cannot be repaired
Yes, cost under 50.000 NRP
Yes, cost between 50.000 - 100.000 NRP
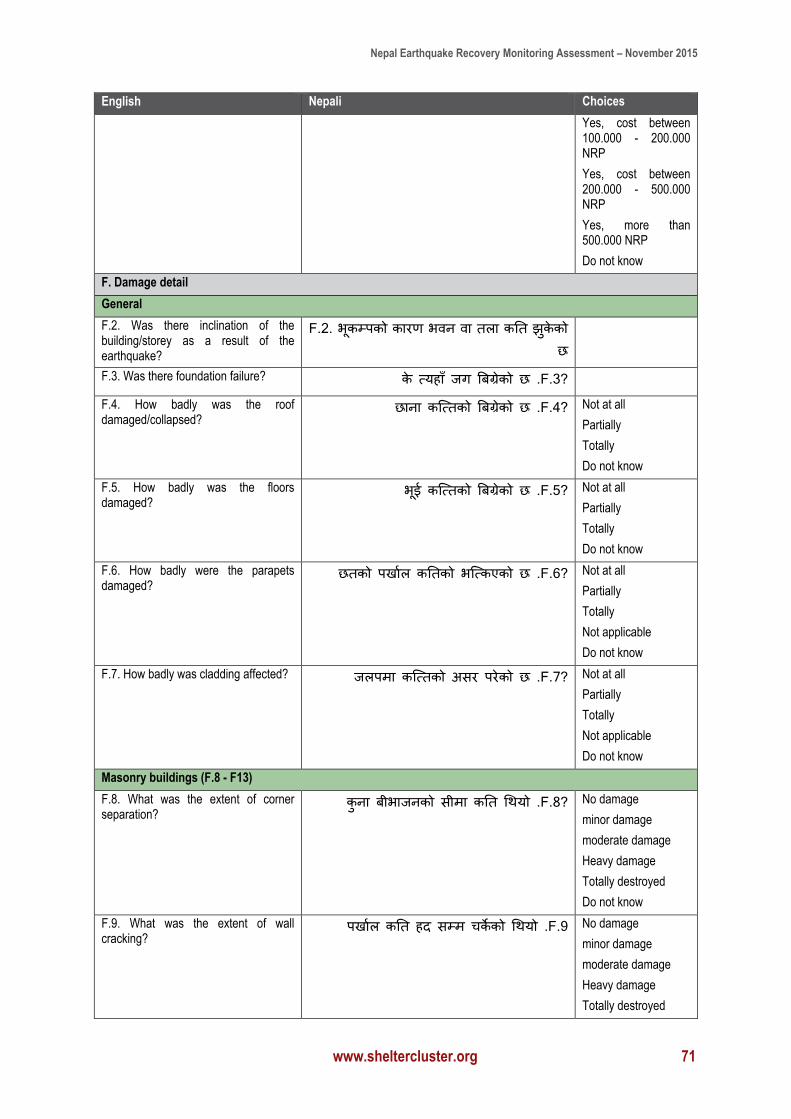
Nepal Earthquake Recovery Monitoring Assessment – November 2015
www.sheltercluster.org 71
English Nepali Choices
Yes, cost between 100.000 - 200.000 NRP
Yes, cost between 200.000 - 500.000 NRP
Yes, more than 500.000 NRP
Do not know
F. Damage detail
General
F.2. Was there inclination of the building/storey as a result of the earthquake?
F.2. भूकम्पको कािण भर्वन र्वा िला कति झकेुको छ
F.3. Was there foundation failure? ?F.3 .के त्यहाुँ र्ि बबगे्रको छ
F.4. How badly was the roof damaged/collapsed?
?F.4 .छाना कच्त्िको बबगे्रको छ Not at all
Partially
Totally
Do not know
F.5. How badly was the floors damaged?
?F.5 .भूई कच्त्िको बबगे्रको छ Not at all
Partially
Totally
Do not know
F.6. How badly were the parapets damaged?
?F.6 .छिको पिाजल कतिको भच्त्कएको छ Not at all
Partially
Totally
Not applicable
Do not know
F.7. How badly was cladding affected? ?F.7 .र्लपिा कच्त्िको असि पिेको छ Not at all
Partially
Totally
Not applicable
Do not know
Masonry buildings (F.8 - F13)
F.8. What was the extent of corner separation?
?F.8 .कुना बीभार्नको सीिा कति गथयो No damage
minor damage
moderate damage
Heavy damage
Totally destroyed
Do not know
F.9. What was the extent of wall cracking?
F.9 .पिाजल कति हद सम्ि चकेको गथयो No damage
minor damage
moderate damage
Heavy damage
Totally destroyed
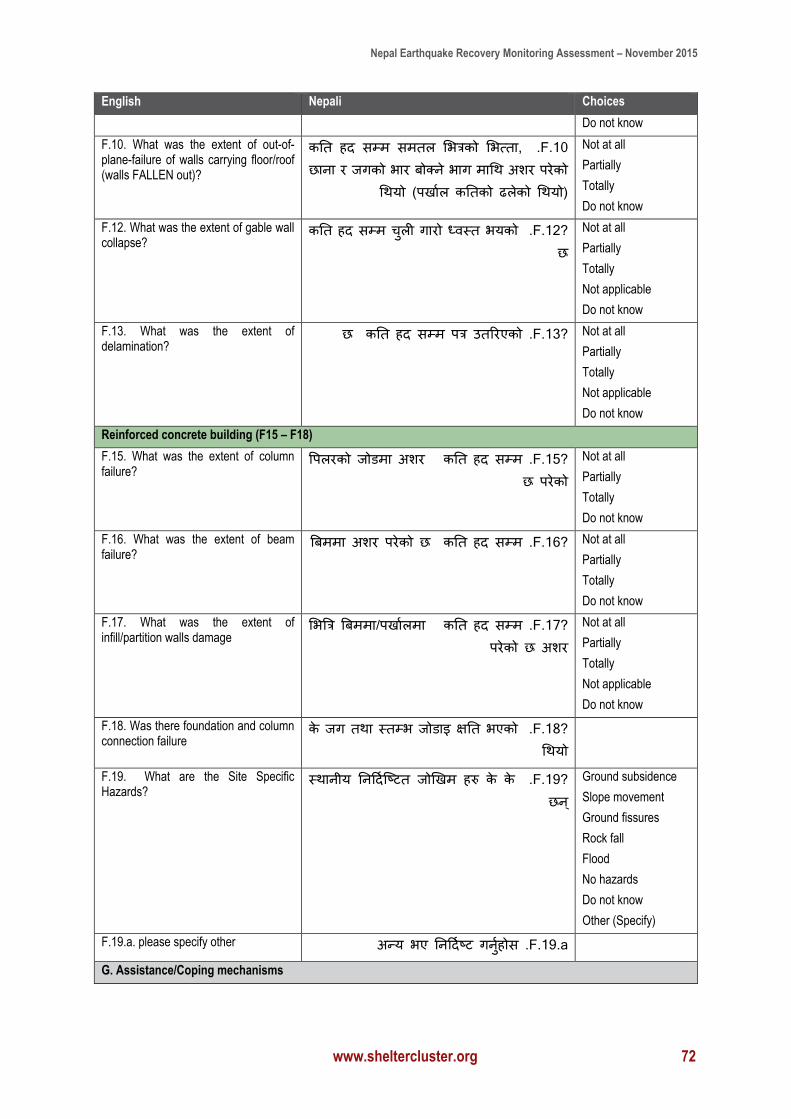
Nepal Earthquake Recovery Monitoring Assessment – November 2015
www.sheltercluster.org 72
English Nepali Choices
Do not know
F.10. What was the extent of out-of-plane-failure of walls carrying floor/roof (walls FALLEN out)?
F.10 .कति हद सम्ि सििल मभत्रको मभत्िा, छाना ि र्िको भाि बोक्ने भाि िागथ अशि पिेको
गथयो )पिाजल कतिको ढलेको गथयो)
Not at all
Partially
Totally
Do not know
F.12. What was the extent of gable wall collapse?
?F.12 .कति हद सम्ि चुली िािो ध्र्वस्ि भयको छ
Not at all
Partially
Totally
Not applicable
Do not know
F.13. What was the extent of delamination?
?F.13 .कति हद सम्ि पत्र उिरिएको छ Not at all
Partially
Totally
Not applicable
Do not know
Reinforced concrete building (F15 – F18)
F.15. What was the extent of column failure?
?F.15 .कति हद सम्ि वपलिको र्ोडिा अशि पिेको छ
Not at all
Partially
Totally
Do not know
F.16. What was the extent of beam failure?
?F.16 .कति हद सम्ि बबििा अशि पिेको छ Not at all
Partially
Totally
Do not know
F.17. What was the extent of infill/partition walls damage
?F.17 .कति हद सम्ि मभबत्र बबििा/पिाजलिा अशि पिेको छ
Not at all
Partially
Totally
Not applicable
Do not know
F.18. Was there foundation and column connection failure
?F.18 .के र्ि िथा स्िम्भ र्ोडाइ क्षति भएको गथयो
F.19. What are the Site Specific Hazards?
?F.19 .स्थानीय तनटदजच्ष्िि र्ोखिि हरु के के छन ्
Ground subsidence
Slope movement
Ground fissures
Rock fall
Flood
No hazards
Do not know
Other (Specify)
F.19.a. please specify other F.19.a .अन्य भए तनटदजष्ि िनुजहोस
G. Assistance/Coping mechanisms
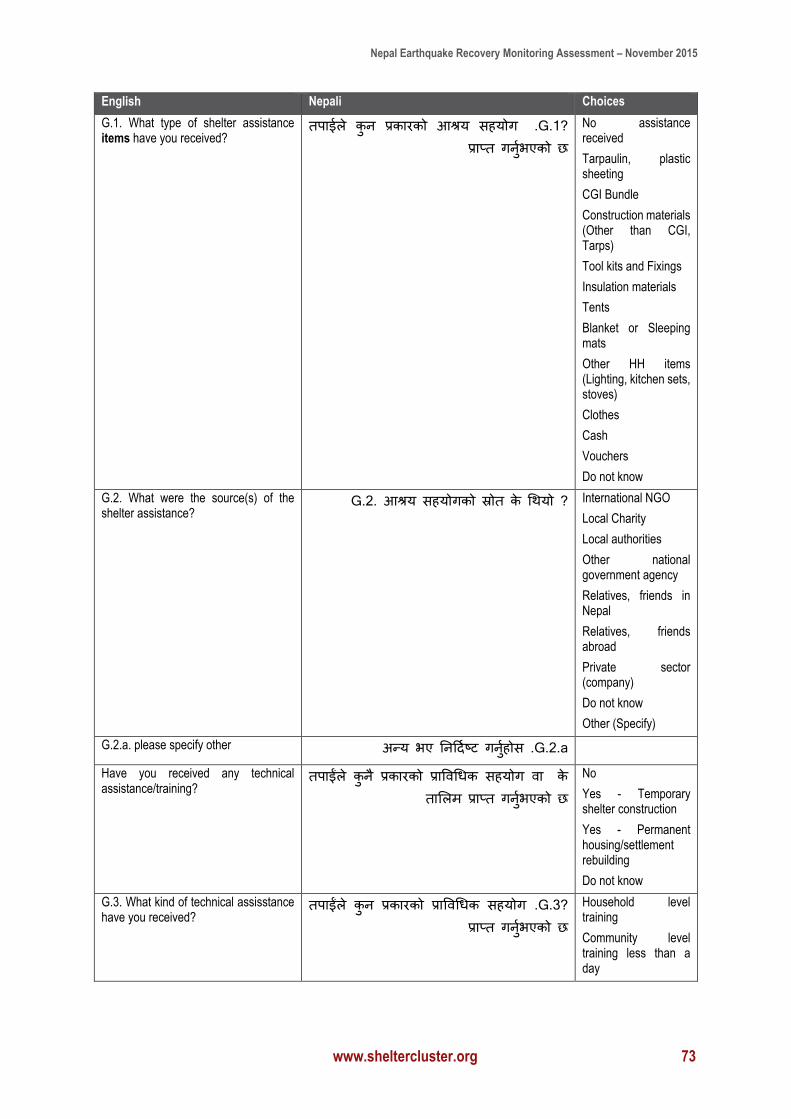
Nepal Earthquake Recovery Monitoring Assessment – November 2015
www.sheltercluster.org 73
English Nepali Choices
G.1. What type of shelter assistance items have you received?
?G.1 .िपाईले कुन प्रकािको आश्रय सहयोि प्राप्ि िनुजभएको छ
No assistance received
Tarpaulin, plastic sheeting
CGI Bundle
Construction materials (Other than CGI, Tarps)
Tool kits and Fixings
Insulation materials
Tents
Blanket or Sleeping mats
Other HH items (Lighting, kitchen sets, stoves)
Clothes
Cash
Vouchers
Do not know
G.2. What were the source(s) of the shelter assistance?
?G.2. आश्रय सहयोिको स्रोि के गथयो International NGO
Local Charity
Local authorities
Other national government agency
Relatives, friends in Nepal
Relatives, friends abroad
Private sector (company)
Do not know
Other (Specify)
G.2.a. please specify other G.2.a .अन्य भए तनटदजष्ि िनुजहोस
Have you received any technical assistance/training?
के िपाईंले कुनै प्रकािको प्रावर्वगधक सहयोि र्वा िामलि प्राप्ि िनुजभएको छ
No
Yes - Temporary shelter construction
Yes - Permanent housing/settlement rebuilding
Do not know G.3. What kind of technical assisstance have you received?
?G.3 .िपाईंले कुन प्रकािको प्रावर्वगधक सहयोि प्राप्ि िनुजभएको छ
Household level training
Community level training less than a day
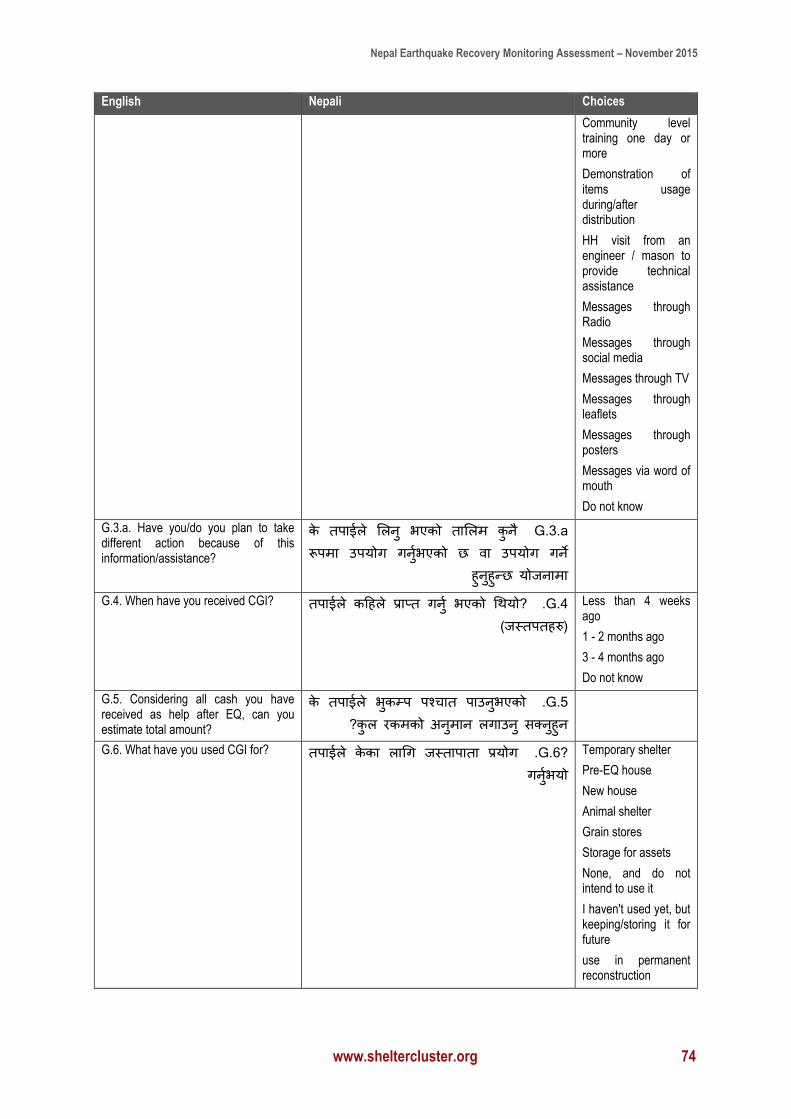
Nepal Earthquake Recovery Monitoring Assessment – November 2015
www.sheltercluster.org 74
English Nepali Choices
Community level training one day or more
Demonstration of items usage during/after distribution
HH visit from an engineer / mason to provide technical assistance
Messages through Radio
Messages through social media
Messages through TV
Messages through leaflets
Messages through posters
Messages via word of mouth
Do not know
G.3.a. Have you/do you plan to take different action because of this information/assistance?
G.3.a के िपाईले मलनु भएको िामलि कुनै रूपिा उपयोि िनुजभएको छ र्वा उपयोि िने
योर्नािा हुनुहुन्छ
G.4. When have you received CGI? G.4 .िपाईले कटहले प्राप्ि िनुज भएको गथयो? (र्स्िपिहरु)
Less than 4 weeks ago
1 - 2 months ago
3 - 4 months ago
Do not know
G.5. Considering all cash you have received as help after EQ, can you estimate total amount?
G.5 .के िपाईले भकुम्प पश्चाि पाउनुभएको कुल िकिको अनुिान लिाउनु सक्नुहुन?
G.6. What have you used CGI for? ?G.6 .िपाईले केका लागि र्स्िापािा प्रयोि िनुजभयो
Temporary shelter
Pre-EQ house
New house
Animal shelter
Grain stores
Storage for assets
None, and do not intend to use it
I haven't used yet, but keeping/storing it for future
use in permanent reconstruction
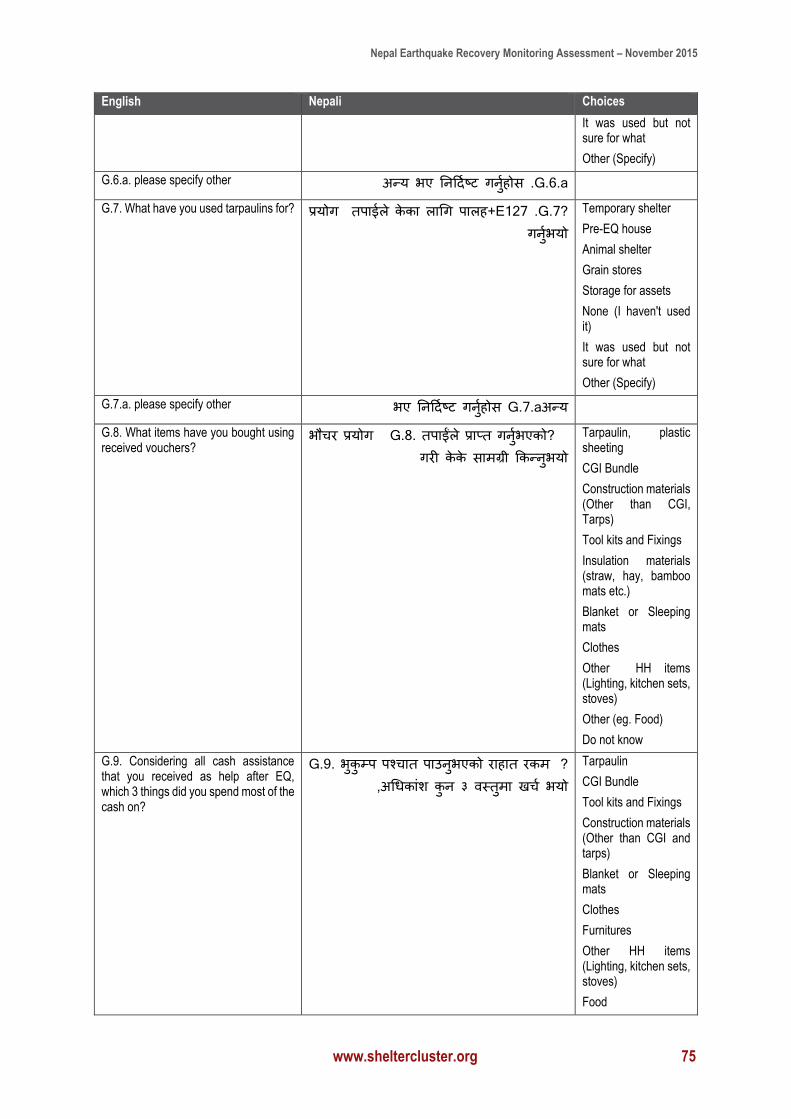
Nepal Earthquake Recovery Monitoring Assessment – November 2015
www.sheltercluster.org 75
English Nepali Choices
It was used but not sure for what
Other (Specify)
G.6.a. please specify other G.6.a .अन्य भए तनटदजष्ि िनुजहोस
G.7. What have you used tarpaulins for? ?G.7 .िपाईले केका लागि पालह+E127 प्रयोि िनुजभयो
Temporary shelter
Pre-EQ house
Animal shelter
Grain stores
Storage for assets
None (I haven't used it)
It was used but not sure for what
Other (Specify)
G.7.a. please specify other G.7.aअन्य भए तनटदजष्ि िनुजहोस
G.8. What items have you bought using received vouchers?
?G.8. िपाईंले प्राप्ि िनुजभएको भौचि प्रयोि ििी केके सािग्री क्रकन्नुभयो
Tarpaulin, plastic sheeting
CGI Bundle
Construction materials (Other than CGI, Tarps)
Tool kits and Fixings
Insulation materials (straw, hay, bamboo mats etc.)
Blanket or Sleeping mats
Clothes
Other HH items (Lighting, kitchen sets, stoves)
Other (eg. Food)
Do not know
G.9. Considering all cash assistance that you received as help after EQ, which 3 things did you spend most of the cash on?
?G.9. भुकुम्प पश्चाि पाउनुभएको िाहाि िकि ,अगधकाशं कुन ३ र्वस्िुिा िचज भयो
Tarpaulin
CGI Bundle
Tool kits and Fixings
Construction materials (Other than CGI and tarps)
Blanket or Sleeping mats
Clothes
Furnitures
Other HH items (Lighting, kitchen sets, stoves)
Food
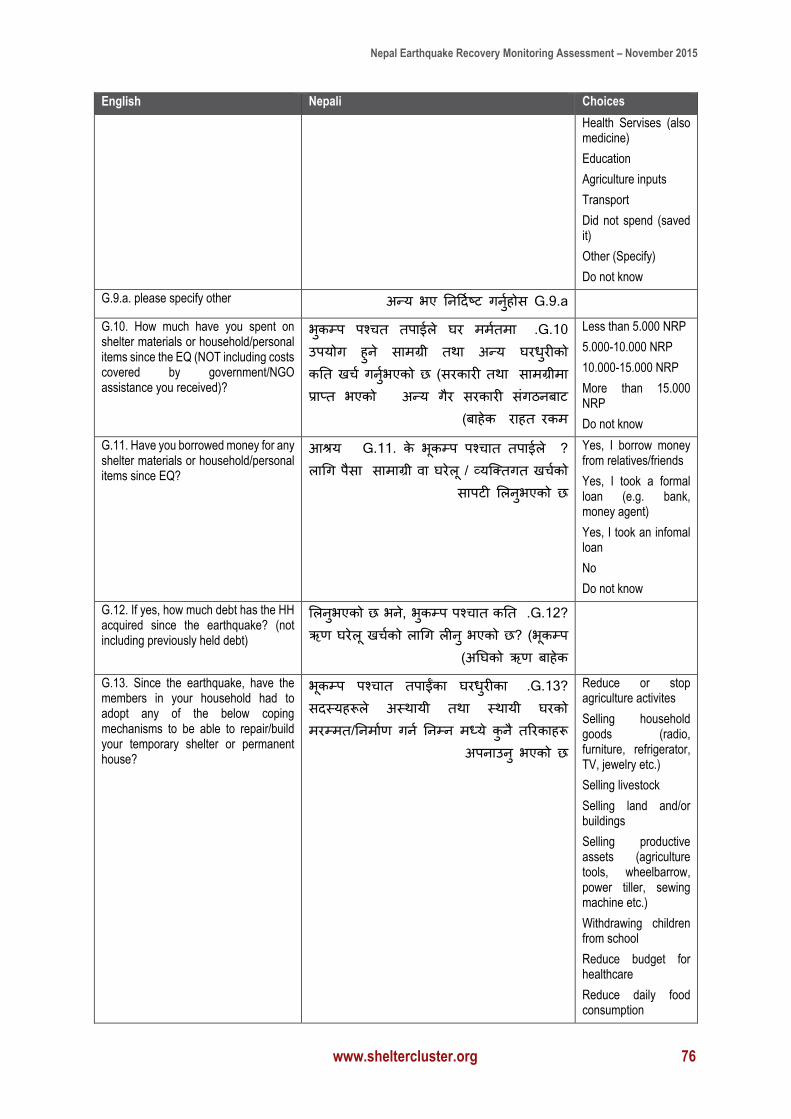
Nepal Earthquake Recovery Monitoring Assessment – November 2015
www.sheltercluster.org 76
English Nepali Choices
Health Servises (also medicine)
Education
Agriculture inputs
Transport
Did not spend (saved it)
Other (Specify)
Do not know
G.9.a. please specify other G.9.a अन्य भए तनटदजष्ि िनुजहोस
G.10. How much have you spent on shelter materials or household/personal items since the EQ (NOT including costs covered by government/NGO assistance you received)?
G.10 .भकुम्प पश्चि िपाईले घि ििजििा उपयोि हुने सािग्री िथा अन्य घिधुिीको
सािग्रीिा कति िचज िनुजभएको छ )सिकािी िथा अन्य िैि सिकािी संिठनबाि प्राप्ि भएको
िाहि िकि बाहेक)
Less than 5.000 NRP
5.000-10.000 NRP
10.000-15.000 NRP
More than 15.000 NRP
Do not know
G.11. Have you borrowed money for any shelter materials or household/personal items since EQ?
?G.11. के भूकम्प पश्चाि िपाईले आश्रय सािाग्री र्वा घिेलू / व्यच्क्ििि िचजको लागि पैसा
सापिी मलनुभएको छ
Yes, I borrow money from relatives/friends
Yes, I took a formal loan (e.g. bank, money agent)
Yes, I took an infomal loan
No
Do not know
G.12. If yes, how much debt has the HH acquired since the earthquake? (not including previously held debt)
?G.12 .मलनुभएको छ भने, भुकम्प पश्चाि कति ऋण घिेल ूिचजको लागि लीनु भएको छ? (भूकम्प
अतघको ऋण बाहेक)
G.13. Since the earthquake, have the members in your household had to adopt any of the below coping mechanisms to be able to repair/build your temporary shelter or permanent house?
?G.13 .भकूम्प पश्चाि िपाईँका घिधुिीका सदस्यहरूले अस्थायी िथा स्थायी घिको ििम्िि/तनिाजण िनज तनम्न िध्ये कुनै िरिकाहरू
अपनाउनु भएको छ
Reduce or stop agriculture activites
Selling household goods (radio, furniture, refrigerator, TV, jewelry etc.)
Selling livestock
Selling land and/or buildings
Selling productive assets (agriculture tools, wheelbarrow, power tiller, sewing machine etc.)
Withdrawing children from school
Reduce budget for healthcare
Reduce daily food consumption
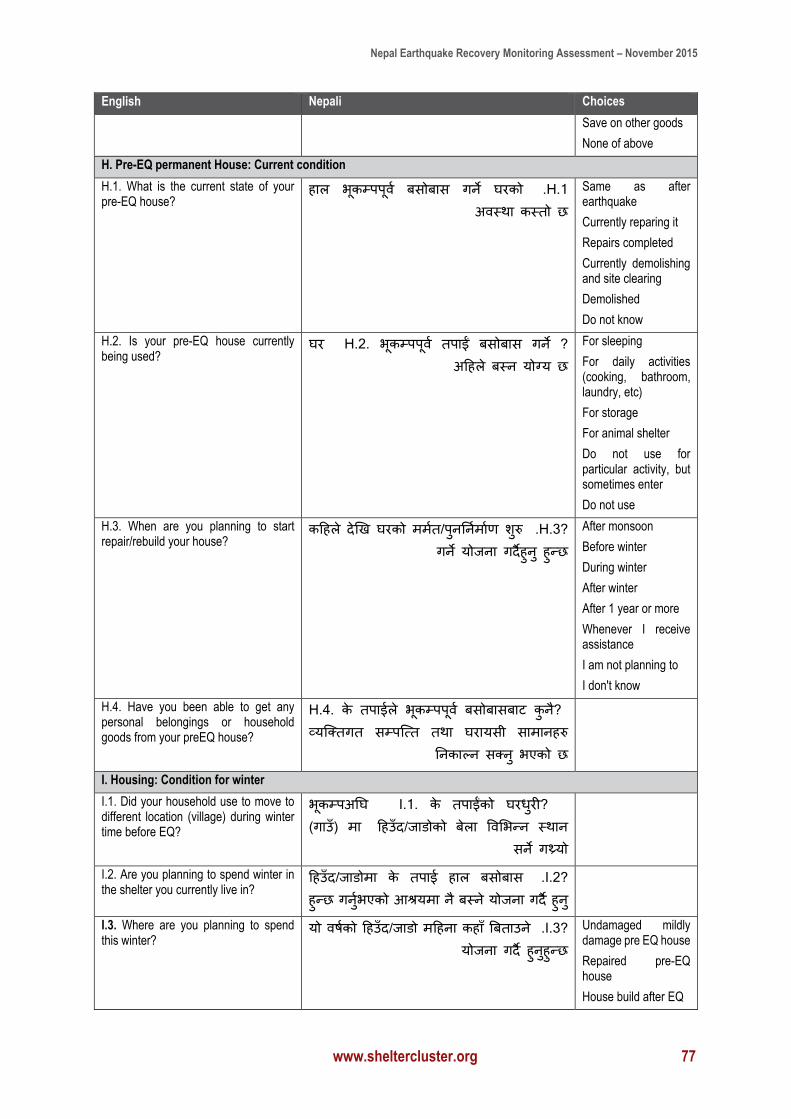
Nepal Earthquake Recovery Monitoring Assessment – November 2015
www.sheltercluster.org 77
English Nepali Choices
Save on other goods
None of above
H. Pre-EQ permanent House: Current condition
H.1. What is the current state of your pre-EQ house?
H.1 .हाल भकूम्पपूर्वज बसोबास िने घिको अर्वस्था कस्िो छ
Same as after earthquake
Currently reparing it
Repairs completed
Currently demolishing and site clearing
Demolished
Do not know
H.2. Is your pre-EQ house currently being used?
?H.2. भूकम्पपूर्वज िपाईं बसोबास िने घि अटहले बस्न योग्य छ
For sleeping
For daily activities (cooking, bathroom, laundry, etc)
For storage
For animal shelter
Do not use for particular activity, but sometimes enter
Do not use
H.3. When are you planning to start repair/rebuild your house?
?H.3 .कटहले देखि घिको ििजि/पुनतनजिाजण शुरु िने योर्ना िदैहुनु हुन्छ
After monsoon
Before winter
During winter
After winter
After 1 year or more
Whenever I receive assistance
I am not planning to
I don't know
H.4. Have you been able to get any personal belongings or household goods from your preEQ house?
?H.4. के िपाईले भकूम्पपूर्वज बसोबासबाि कुनै व्यच्क्ििि सम्पच्त्ि िथा घिायसी सािानहरु
तनकाल्न सक्नु भएको छ
I. Housing: Condition for winter
I.1. Did your household use to move to different location (village) during winter time before EQ?
?I.1. के िपाईंको घिधुिी भूकम्पअतघ टहउुँ द/र्ाडोको बेला वर्वमभन्न स्थान (िाउुँ ) िा
सने िथ्र्यो
I.2. Are you planning to spend winter in the shelter you currently live in?
?I.2 .टहउुँ द/र्ाडोिा के िपाई हाल बसोबास िनुजभएको आश्रयिा नै बस्ने योर्ना िदै हुनु हुन्छ
I.3. Where are you planning to spend this winter?
?I.3 .यो र्वर्जको टहउुँ द/र्ाडो िटहना कहाुँ बबिाउने योर्ना िदै हुनुहुन्छ
Undamaged mildly damage pre EQ house
Repaired pre-EQ house
House build after EQ
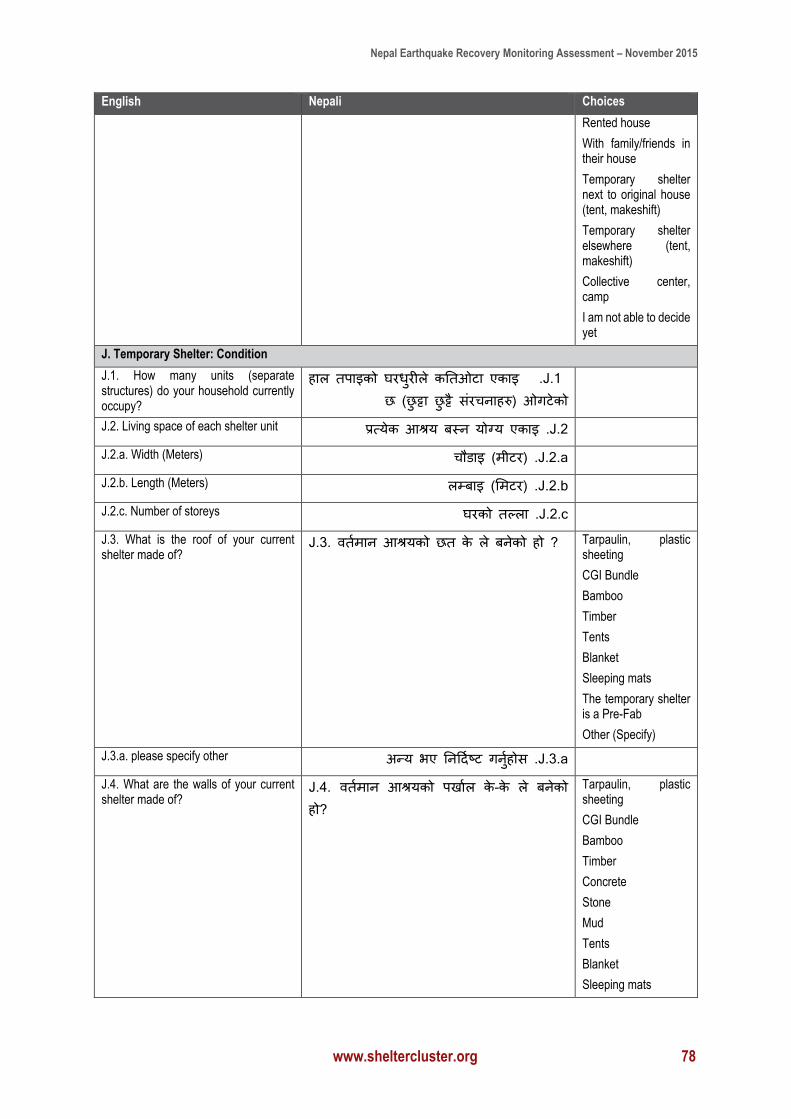
Nepal Earthquake Recovery Monitoring Assessment – November 2015
www.sheltercluster.org 78
English Nepali Choices
Rented house
With family/friends in their house
Temporary shelter next to original house (tent, makeshift)
Temporary shelter elsewhere (tent, makeshift)
Collective center, camp
I am not able to decide yet
J. Temporary Shelter: Condition
J.1. How many units (separate structures) do your household currently occupy?
J.1 .हाल िपाइको घिधुिीले कतिओिा एकाइ )छुट्टा छुटै्ट संिचनाहरु) ओििेको छ
J.2. Living space of each shelter unit J.2 .प्रत्येक आश्रय बस्न योग्य एकाइ
J.2.a. Width (Meters) J.2.a .चौडाइ )िीिि)
J.2.b. Length (Meters) J.2.b .लम्बाइ )मििि)
J.2.c. Number of storeys J.2.c .घिको िल्ला
J.3. What is the roof of your current shelter made of?
J.3. र्विजिान आश्रयको छि के ले बनेको हो ? Tarpaulin, plastic sheeting
CGI Bundle
Bamboo
Timber
Tents
Blanket
Sleeping mats
The temporary shelter is a Pre-Fab
Other (Specify)
J.3.a. please specify other J.3.a .अन्य भए तनटदजष्ि िनुजहोस
J.4. What are the walls of your current shelter made of?
J.4. र्विजिान आश्रयको पिाजल के-के ले बनेको हो?
Tarpaulin, plastic sheeting
CGI Bundle
Bamboo
Timber
Concrete
Stone
Mud
Tents
Blanket
Sleeping mats
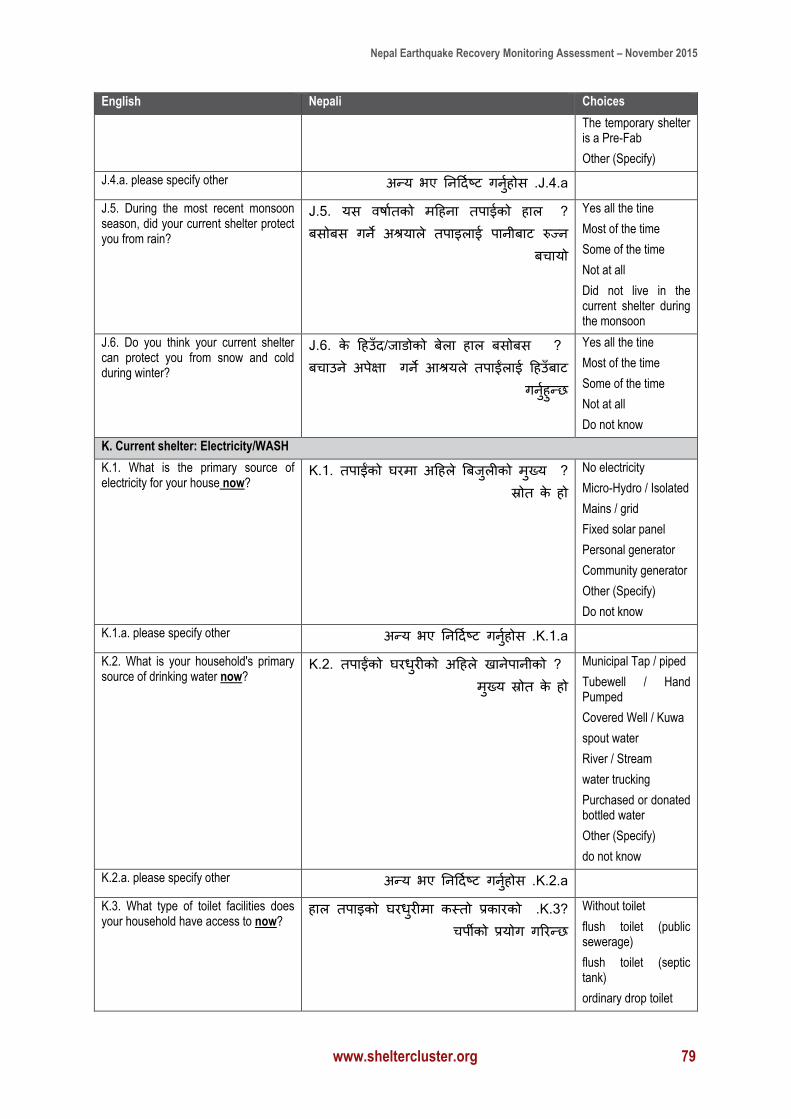
Nepal Earthquake Recovery Monitoring Assessment – November 2015
www.sheltercluster.org 79
English Nepali Choices
The temporary shelter is a Pre-Fab
Other (Specify)
J.4.a. please specify other J.4.a .अन्य भए तनटदजष्ि िनुजहोस
J.5. During the most recent monsoon season, did your current shelter protect you from rain?
?J.5. यस र्वर्ाजिको िटहना िपाईको हाल बसोबस िने अश्रयाले िपाइलाई पानीबाि रुज्न
बचायो
Yes all the tine
Most of the time
Some of the time
Not at all
Did not live in the current shelter during the monsoon
J.6. Do you think your current shelter can protect you from snow and cold during winter?
?J.6. के टहउुँ द/र्ाडोको बेला हाल बसोबस िने आश्रयले िपाईंलाई टहउुँबाि बचाउने अपेक्षा
िनुजहुन्छ
Yes all the tine
Most of the time
Some of the time
Not at all
Do not know
K. Current shelter: Electricity/WASH
K.1. What is the primary source of electricity for your house now?
?K.1. िपाईंको घििा अटहले बबरु्लीको िुख्य स्रोि के हो
No electricity
Micro-Hydro / Isolated
Mains / grid
Fixed solar panel
Personal generator
Community generator
Other (Specify)
Do not know
K.1.a. please specify other K.1.a .अन्य भए तनटदजष्ि िनुजहोस
K.2. What is your household's primary source of drinking water now?
?K.2. िपाईंको घिधुिीको अटहले िानेपानीको िुख्य स्रोि के हो
Municipal Tap / piped
Tubewell / Hand Pumped
Covered Well / Kuwa
spout water
River / Stream
water trucking
Purchased or donated bottled water
Other (Specify)
do not know
K.2.a. please specify other K.2.a .अन्य भए तनटदजष्ि िनुजहोस
K.3. What type of toilet facilities does your household have access to now?
?K.3 .हाल िपाइको घिधुिीिा कस्िो प्रकािको चपीको प्रयोि िरिन्छ
Without toilet
flush toilet (public sewerage)
flush toilet (septic tank)
ordinary drop toilet
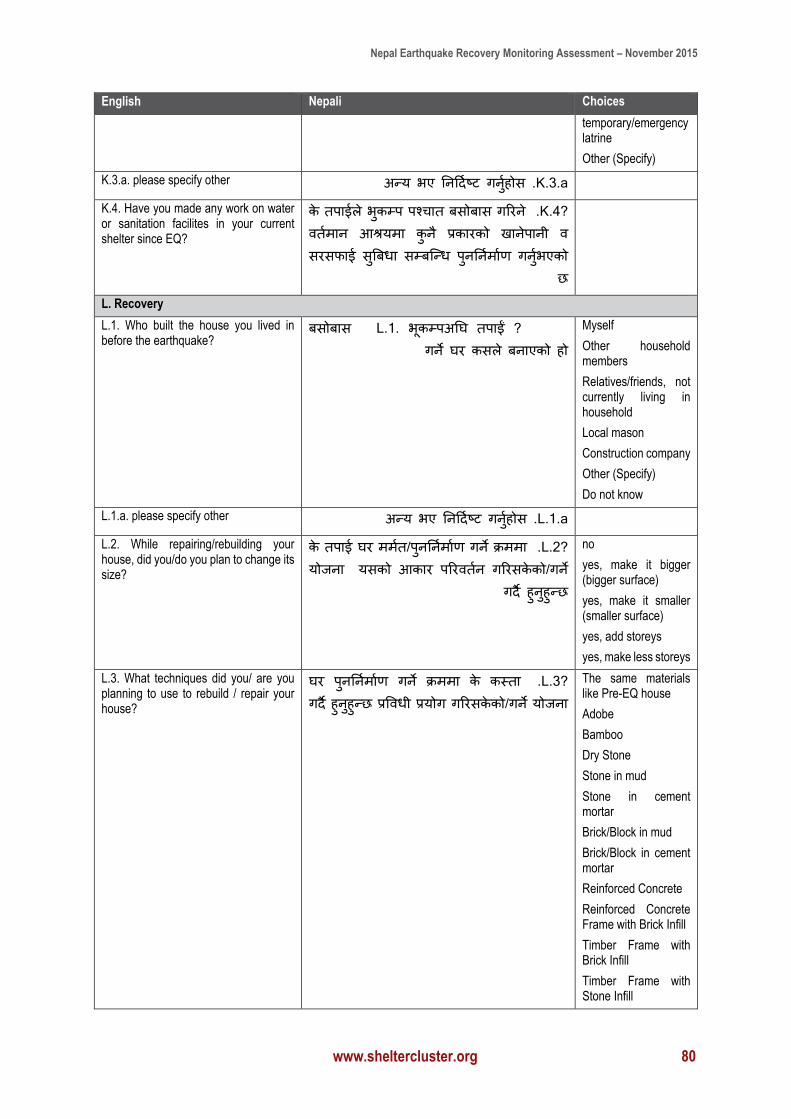
Nepal Earthquake Recovery Monitoring Assessment – November 2015
www.sheltercluster.org 80
English Nepali Choices
temporary/emergency latrine
Other (Specify)
K.3.a. please specify other K.3.a .अन्य भए तनटदजष्ि िनुजहोस
K.4. Have you made any work on water or sanitation facilites in your current shelter since EQ?
?K.4 .के िपाईले भकुम्प पश्चाि बसोबास िरिने र्विजिान आश्रयिा कुनै प्रकािको िानेपानी र्व सिसफाई सुबबधा सम्बच्न्ध पुनतनजिाजण िनुजभएको
छ
L. Recovery
L.1. Who built the house you lived in before the earthquake?
?L.1. भूकम्पअतघ िपाईं बसोबास िने घि कसले बनाएको हो
Myself
Other household members
Relatives/friends, not currently living in household
Local mason
Construction company
Other (Specify)
Do not know
L.1.a. please specify other L.1.a .अन्य भए तनटदजष्ि िनुजहोस
L.2. While repairing/rebuilding your house, did you/do you plan to change its size?
?L.2 .के िपाई घि ििजि/पुनतनजिाजण िने क्रििा यसको आकाि परिर्विजन िरिसकेको/िने योर्ना
िदै हुनुहुन्छ
no
yes, make it bigger (bigger surface)
yes, make it smaller (smaller surface)
yes, add storeys
yes, make less storeys
L.3. What techniques did you/ are you planning to use to rebuild / repair your house?
?L.3 .घि पुनतनजिाजण िने क्रििा के कस्िा प्रवर्वधी प्रयोि िरिसकेको/िने योर्ना िदै हुनुहुन्छ
The same materials like Pre-EQ house
Adobe
Bamboo
Dry Stone
Stone in mud
Stone in cement mortar
Brick/Block in mud
Brick/Block in cement mortar
Reinforced Concrete
Reinforced Concrete Frame with Brick Infill
Timber Frame with Brick Infill
Timber Frame with Stone Infill
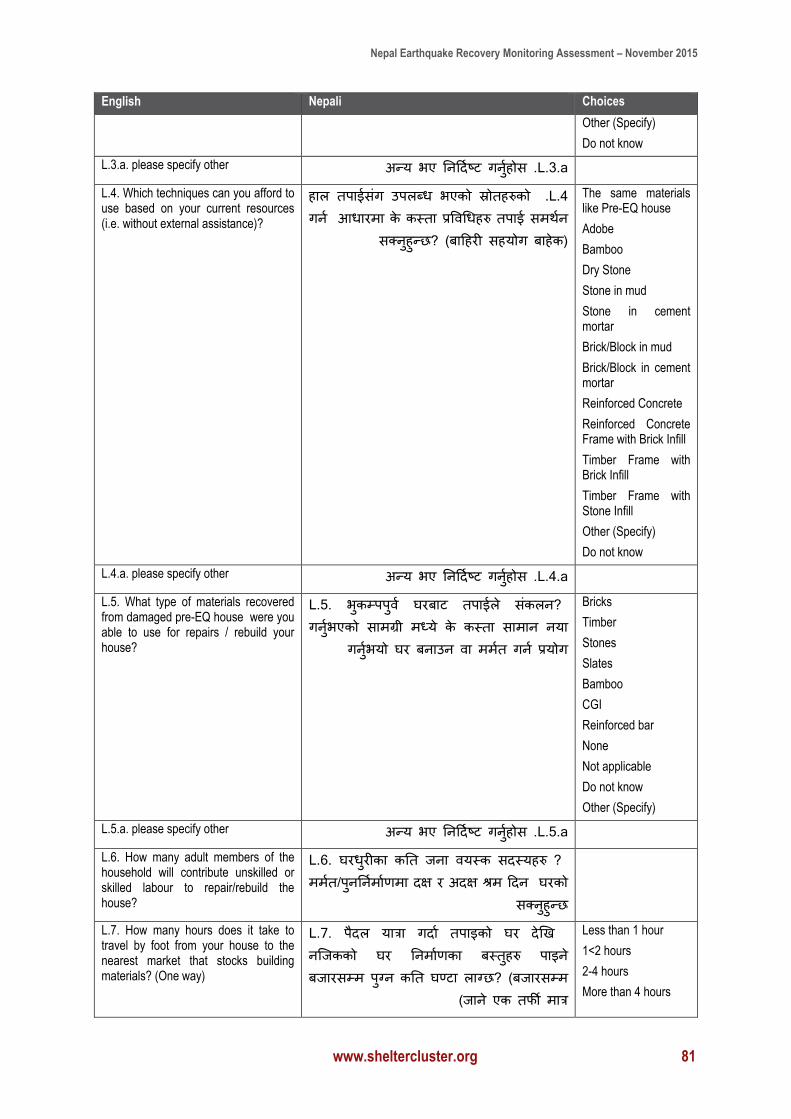
Nepal Earthquake Recovery Monitoring Assessment – November 2015
www.sheltercluster.org 81
English Nepali Choices
Other (Specify)
Do not know
L.3.a. please specify other L.3.a .अन्य भए तनटदजष्ि िनुजहोस
L.4. Which techniques can you afford to use based on your current resources (i.e. without external assistance)?
L.4 .हाल िपाईसंि उपलब्ध भएको स्रोिहरुको आधाििा के कस्िा प्रवर्वगधहरु िपाई सिथजन िनज
सक्नुहुन्छ? (बाटहिी सहयोि बाहेक)
The same materials like Pre-EQ house
Adobe
Bamboo
Dry Stone
Stone in mud
Stone in cement mortar
Brick/Block in mud
Brick/Block in cement mortar
Reinforced Concrete
Reinforced Concrete Frame with Brick Infill
Timber Frame with Brick Infill
Timber Frame with Stone Infill
Other (Specify)
Do not know
L.4.a. please specify other L.4.a .अन्य भए तनटदजष्ि िनुजहोस
L.5. What type of materials recovered from damaged pre-EQ house were you able to use for repairs / rebuild your house?
?L.5. भुकम्पपुर्वज घिबाि िपाईले सकंलन िनुजभएको सािग्री िध्ये के कस्िा सािान नया
घि बनाउन र्वा ििजि िनज प्रयोि िनुजभयो
Bricks
Timber
Stones
Slates
Bamboo
CGI
Reinforced bar
None
Not applicable
Do not know
Other (Specify)
L.5.a. please specify other L.5.a .अन्य भए तनटदजष्ि िनुजहोस
L.6. How many adult members of the household will contribute unskilled or skilled labour to repair/rebuild the house?
?L.6. घिधुिीका कति र्ना र्वयस्क सदस्यहरु घिको ििजि/पुनतनजिाजणिा दक्ष ि अदक्ष श्रि टदन
सक्नुहुन्छ
L.7. How many hours does it take to travel by foot from your house to the nearest market that stocks building materials? (One way)
L.7. पैदल यात्रा िदाज िपाइको घि देखि नच्र्कको घि तनिाजणका बस्िुहरु पाइने बर्ािसम्ि पुग्न कति घण्िा लाग्छ? (बर्ािसम्ि
र्ाने एक िफी िात्र)
Less than 1 hour
1<2 hours
2-4 hours
More than 4 hours
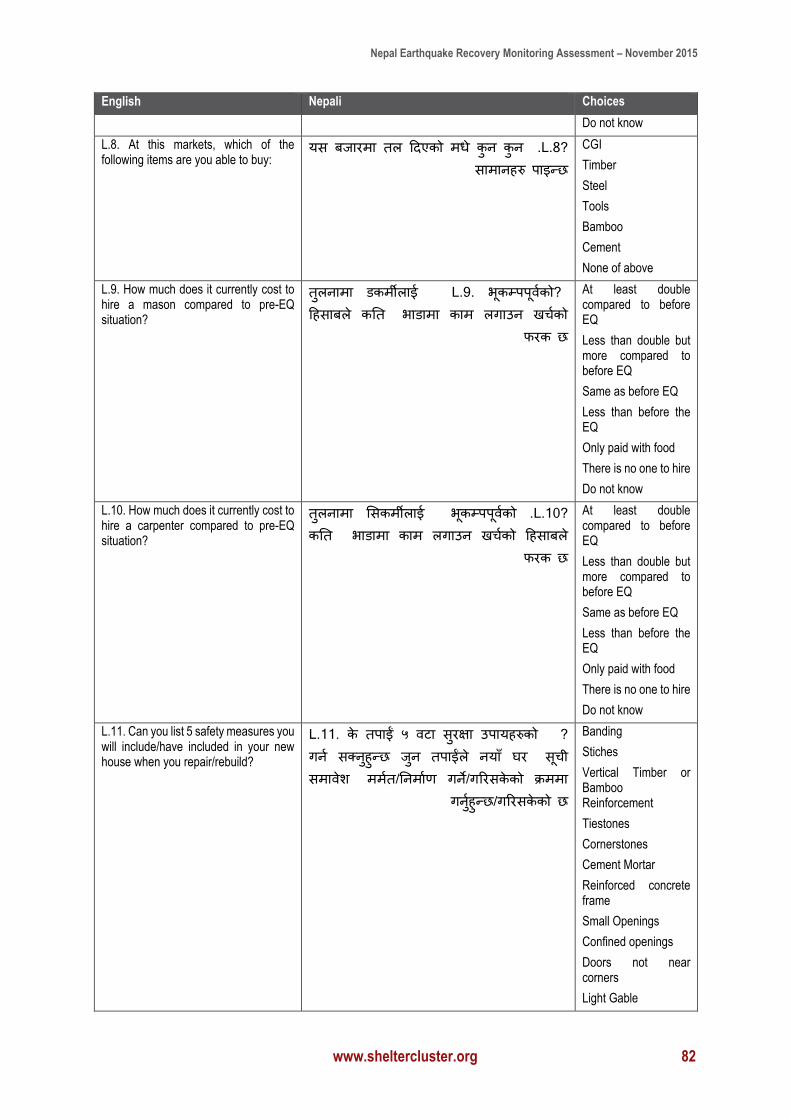
Nepal Earthquake Recovery Monitoring Assessment – November 2015
www.sheltercluster.org 82
English Nepali Choices
Do not know
L.8. At this markets, which of the following items are you able to buy:
?L.8 .यस बर्ाििा िल टदएको िधे कुन कुन सािानहरु पाइन्छ
CGI
Timber
Steel
Tools
Bamboo
Cement
None of above
L.9. How much does it currently cost to hire a mason compared to pre-EQ situation?
?L.9. भूकम्पपूर्वजको िुलनािा डकिीलाई भाडािा काि लिाउन िचजको टहसाबले कति
फिक छ
At least double compared to before EQ
Less than double but more compared to before EQ
Same as before EQ
Less than before the EQ
Only paid with food
There is no one to hire
Do not know
L.10. How much does it currently cost to hire a carpenter compared to pre-EQ situation?
?L.10 .भकूम्पपूर्वजको िुलनािा मसकिीलाई भाडािा काि लिाउन िचजको टहसाबले कति
फिक छ
At least double compared to before EQ
Less than double but more compared to before EQ
Same as before EQ
Less than before the EQ
Only paid with food
There is no one to hire
Do not know
L.11. Can you list 5 safety measures you will include/have included in your new house when you repair/rebuild?
?L.11. के िपाईं ५ र्विा सुिक्षा उपायहरुको सूची िनज सक्नुहुन्छ रु्न िपाईंले नयाुँ घि
ििजि/तनिाजण िने/िरिसकेको क्रििा सिारे्वश िनुजहुन्छ/िरिसकेको छ
Banding
Stiches
Vertical Timber or Bamboo Reinforcement
Tiestones
Cornerstones
Cement Mortar
Reinforced concrete frame
Small Openings
Confined openings
Doors not near corners
Light Gable
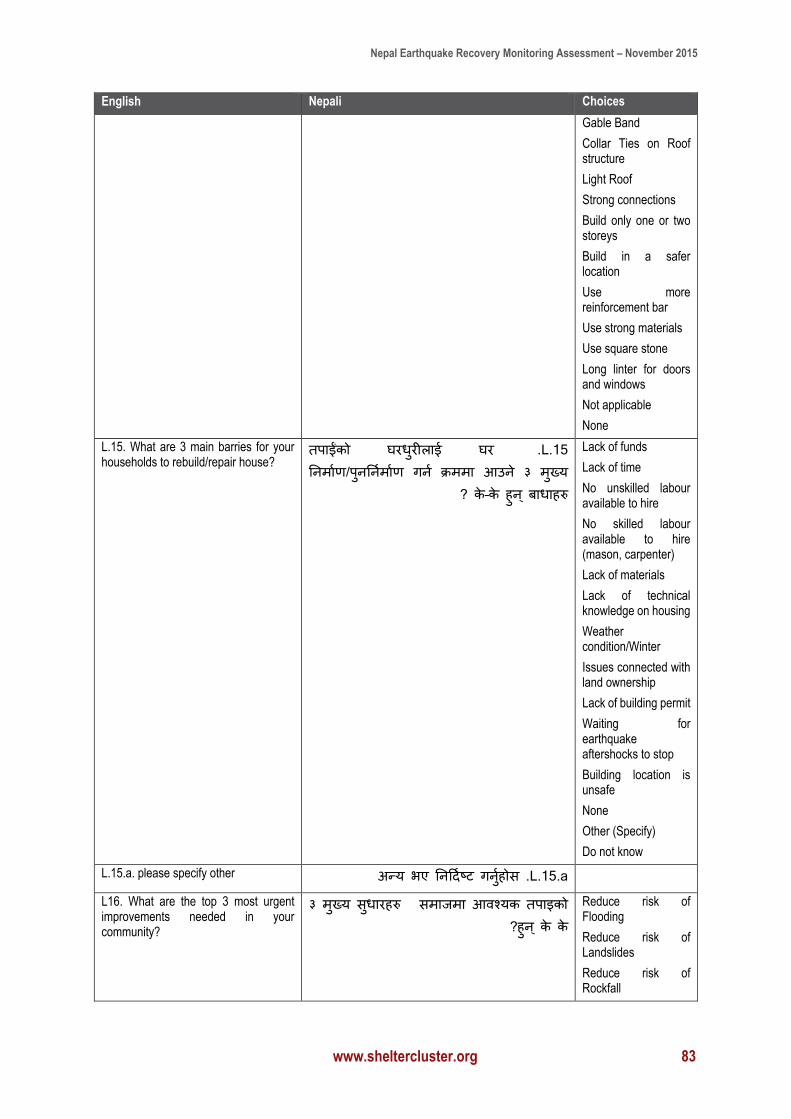
Nepal Earthquake Recovery Monitoring Assessment – November 2015
www.sheltercluster.org 83
English Nepali Choices
Gable Band
Collar Ties on Roof structure
Light Roof
Strong connections
Build only one or two storeys
Build in a safer location
Use more reinforcement bar
Use strong materials
Use square stone
Long linter for doors and windows
Not applicable
None
L.15. What are 3 main barries for your households to rebuild/repair house?
L.15 .िपाईंको घिधुिीलाई घि तनिाजण/पुनतनजिाजण िनज क्रििा आउने ३ िखु्य
बाधाहरु के–के हुन ् ?
Lack of funds
Lack of time
No unskilled labour available to hire
No skilled labour available to hire (mason, carpenter)
Lack of materials
Lack of technical knowledge on housing
Weather condition/Winter
Issues connected with land ownership
Lack of building permit
Waiting for earthquake aftershocks to stop
Building location is unsafe
None
Other (Specify)
Do not know
L.15.a. please specify other L.15.a .अन्य भए तनटदजष्ि िनुजहोस
L16. What are the top 3 most urgent improvements needed in your community?
िपाइको सिार्िा आर्वश्यक ३ िुख्य सधुािहरु के के हुन ्?
Reduce risk of Flooding
Reduce risk of Landslides
Reduce risk of Rockfall
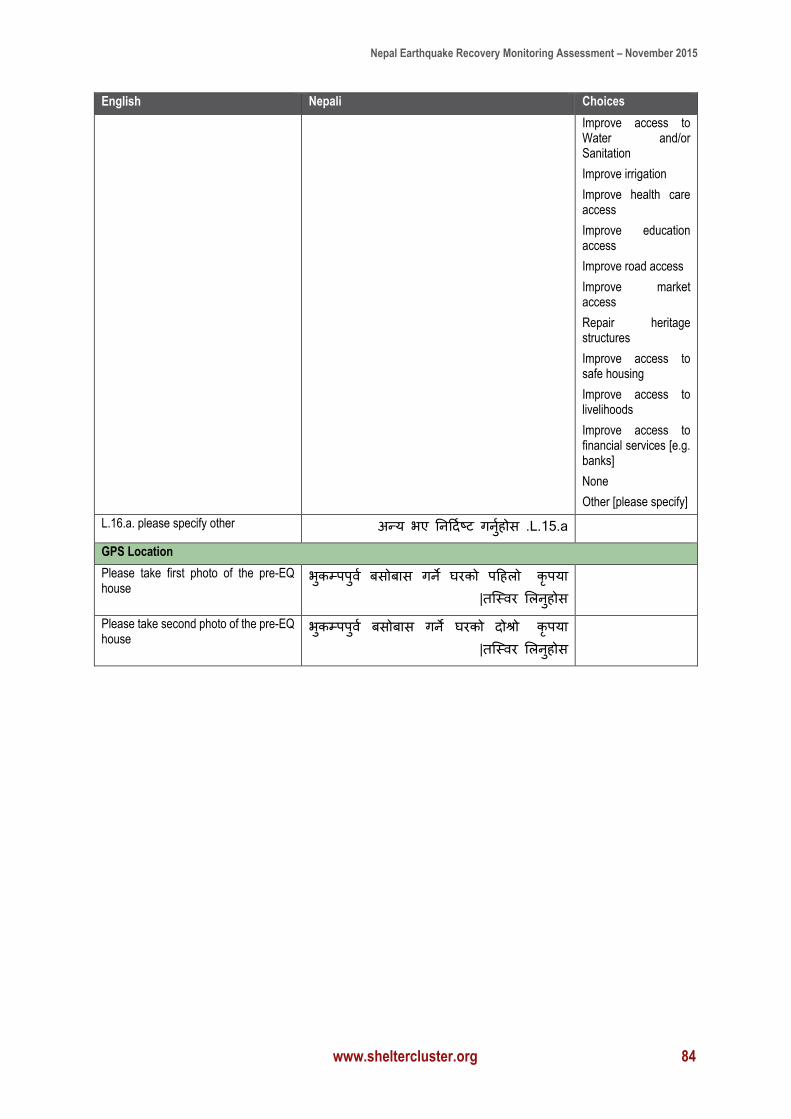
Nepal Earthquake Recovery Monitoring Assessment – November 2015
www.sheltercluster.org 84
English Nepali Choices
Improve access to Water and/or Sanitation
Improve irrigation
Improve health care access
Improve education access
Improve road access
Improve market access
Repair heritage structures
Improve access to safe housing
Improve access to livelihoods
Improve access to financial services [e.g. banks]
None
Other [please specify] L.16.a. please specify other L.15.a .अन्य भए तनटदजष्ि िनुजहोस
GPS Location
Please take first photo of the pre-EQ house
कृपया भकुम्पपुर्वज बसोबास िने घिको पटहलो िच्स्र्वि मलनुहोस|
Please take second photo of the pre-EQ house
कृपया भुकम्पपुर्वज बसोबास िने घिको दोश्रो िच्स्र्वि मलनुहोस|
Nepal Earthquake Recovery Monitoring Assessment – November 2015
www.sheltercluster.org 85
Annex B: Manual for Enumerators
Please see additional annex