Embed Size (px)
Citation preview
University of Calgary
PRISM: University of Calgary's Digital Repository
Graduate Studies The Vault: Electronic Theses and Dissertations
2015-09-30
NetFlix and Twitch Traffic Characterization
Laterman, Michel
Laterman, M. (2015). NetFlix and Twitch Traffic Characterization (Unpublished master's thesis).
University of Calgary, Calgary, AB. doi:10.11575/PRISM/27074
http://hdl.handle.net/11023/2562
master thesis
University of Calgary graduate students retain copyright ownership and moral rights for their
thesis. You may use this material in any way that is permitted by the Copyright Act or through
licensing that has been assigned to the document. For uses that are not allowable under
copyright legislation or licensing, you are required to seek permission.
Downloaded from PRISM: https://prism.ucalgary.ca
UNIVERSITY OF CALGARY
NetFlix and Twitch Traffic Characterization
by
Michel Laterman
A THESIS
SUBMITTED TO THE FACULTY OF GRADUATE STUDIES
IN PARTIAL FULFILLMENT OF THE REQUIREMENTS FOR THE
DEGREE OF MASTER OF SCIENCE
GRADUATE PROGRAM IN COMPUTER SCIENCE
CALGARY, ALBERTA
SEPTEMBER, 2015
c© Michel Laterman 2015
Abstract
Streaming video content is the largest contributor to inbound network traffic at the University
of Calgary. Over five months, from December 2014 – April 2015, over 2.7 petabytes of traffic
on 49 billion connections was observed.
This thesis presents traffic characterizations for two large video streaming services, namely
NetFlix and Twitch. These two services contribute a significant portion of inbound bytes.
NetFlix provides TV series and movies on demand. Twitch offers live streaming of video
game play. These services share many characteristics, including asymmetric connections,
content delivery mechanisms, and content popularity patterns.
This thesis sheds light on the usage of modern video streaming services on an edge
network. It’s one of only a few studies to utilize long-term network-level data. To the best
of our knowledge, it’s one of the first studies that uses network-level data for Twitch traffic
characterization, and content characterization for NetFlix and Twitch.
ii

Acknowledgements
First, I want to thank my advisors Carey Williamson and Martin Arlitt for their assistance
during the writing of the thesis. Their guidance and feedback improved my research and
writing abilities.
Second, I would like to thank Darcy Grant for taking time out of his very busy schedule
to answer my questions and help me configure the machines used for the thesis.
Finally, I want to thank my parents. Their contributions to my education throughout
my life made this possible.
iii
Table of Contents
Abstract . . . . . . . . . . . . . . . . . . . . . . . . . . . . . . . . . . . . . . . . iiAcknowledgements . . . . . . . . . . . . . . . . . . . . . . . . . . . . . . . . . . iiiTable of Contents . . . . . . . . . . . . . . . . . . . . . . . . . . . . . . . . . . . . ivList of Tables . . . . . . . . . . . . . . . . . . . . . . . . . . . . . . . . . . . . . . viiList of Figures . . . . . . . . . . . . . . . . . . . . . . . . . . . . . . . . . . . . . . ixList of Symbols . . . . . . . . . . . . . . . . . . . . . . . . . . . . . . . . . . . . . xi1 Introduction . . . . . . . . . . . . . . . . . . . . . . . . . . . . . . . . . . . . 11.1 Motivation . . . . . . . . . . . . . . . . . . . . . . . . . . . . . . . . . . . . . 1
1.1.1 Video Content Providers . . . . . . . . . . . . . . . . . . . . . . . . . 31.2 Objectives . . . . . . . . . . . . . . . . . . . . . . . . . . . . . . . . . . . . . 41.3 Contributions . . . . . . . . . . . . . . . . . . . . . . . . . . . . . . . . . . . 51.4 Organization . . . . . . . . . . . . . . . . . . . . . . . . . . . . . . . . . . . 62 Background and Related Work . . . . . . . . . . . . . . . . . . . . . . . . . . 72.1 TCP/IP Architecture . . . . . . . . . . . . . . . . . . . . . . . . . . . . . . . 7
2.1.1 Physical and Link Layers . . . . . . . . . . . . . . . . . . . . . . . . . 82.1.2 Network Layer . . . . . . . . . . . . . . . . . . . . . . . . . . . . . . 82.1.3 Transport Layer . . . . . . . . . . . . . . . . . . . . . . . . . . . . . . 92.1.4 Application Layer . . . . . . . . . . . . . . . . . . . . . . . . . . . . . 13
2.2 Media Streaming . . . . . . . . . . . . . . . . . . . . . . . . . . . . . . . . . 152.2.1 Audio Streaming . . . . . . . . . . . . . . . . . . . . . . . . . . . . . 162.2.2 Video Streaming . . . . . . . . . . . . . . . . . . . . . . . . . . . . . 172.2.3 Geo-Gating . . . . . . . . . . . . . . . . . . . . . . . . . . . . . . . . 172.2.4 Content Distribution Networks . . . . . . . . . . . . . . . . . . . . . 18
2.3 Related Work in Traffic Measurement . . . . . . . . . . . . . . . . . . . . . . 182.4 Related Work in Video Traffic Characterization . . . . . . . . . . . . . . . . 222.5 NetFlix . . . . . . . . . . . . . . . . . . . . . . . . . . . . . . . . . . . . . . 24
2.5.1 History . . . . . . . . . . . . . . . . . . . . . . . . . . . . . . . . . . . 252.5.2 Related Work . . . . . . . . . . . . . . . . . . . . . . . . . . . . . . . 26
2.6 Twitch . . . . . . . . . . . . . . . . . . . . . . . . . . . . . . . . . . . . . . . 262.6.1 History . . . . . . . . . . . . . . . . . . . . . . . . . . . . . . . . . . . 272.6.2 Related Work . . . . . . . . . . . . . . . . . . . . . . . . . . . . . . . 27
2.7 Summary . . . . . . . . . . . . . . . . . . . . . . . . . . . . . . . . . . . . . 293 Measurement Methodology . . . . . . . . . . . . . . . . . . . . . . . . . . . . 303.1 Network Throughput . . . . . . . . . . . . . . . . . . . . . . . . . . . . . . . 303.2 Bro . . . . . . . . . . . . . . . . . . . . . . . . . . . . . . . . . . . . . . . . . 313.3 Other Collection Tools . . . . . . . . . . . . . . . . . . . . . . . . . . . . . . 323.4 Traffic Overview . . . . . . . . . . . . . . . . . . . . . . . . . . . . . . . . . . 32
3.4.1 Outages . . . . . . . . . . . . . . . . . . . . . . . . . . . . . . . . . . 333.4.2 TCP . . . . . . . . . . . . . . . . . . . . . . . . . . . . . . . . . . . . 35
3.5 Summary . . . . . . . . . . . . . . . . . . . . . . . . . . . . . . . . . . . . . 424 Video Traffic Analysis . . . . . . . . . . . . . . . . . . . . . . . . . . . . . . 434.1 Video Content . . . . . . . . . . . . . . . . . . . . . . . . . . . . . . . . . . . 43
iv
4.1.1 External Video Domains . . . . . . . . . . . . . . . . . . . . . . . . . 444.2 Flash Content . . . . . . . . . . . . . . . . . . . . . . . . . . . . . . . . . . . 464.3 Octet-stream content . . . . . . . . . . . . . . . . . . . . . . . . . . . . . . . 474.4 Video Traffic . . . . . . . . . . . . . . . . . . . . . . . . . . . . . . . . . . . 48
4.4.1 HTTPS Traffic . . . . . . . . . . . . . . . . . . . . . . . . . . . . . . 494.4.2 YouTube Traffic Volume and Throughput . . . . . . . . . . . . . . . 494.4.3 Video Traffic . . . . . . . . . . . . . . . . . . . . . . . . . . . . . . . 50
4.5 Summary . . . . . . . . . . . . . . . . . . . . . . . . . . . . . . . . . . . . . 595 NetFlix Analysis . . . . . . . . . . . . . . . . . . . . . . . . . . . . . . . . . 605.1 Desktop and Mobile Requests . . . . . . . . . . . . . . . . . . . . . . . . . . 605.2 Movie IDs . . . . . . . . . . . . . . . . . . . . . . . . . . . . . . . . . . . . . 615.3 Monthly Breakdown . . . . . . . . . . . . . . . . . . . . . . . . . . . . . . . 62
5.3.1 Response Breakdown . . . . . . . . . . . . . . . . . . . . . . . . . . . 625.3.2 Breakdown of NetFlix video connections . . . . . . . . . . . . . . . . 635.3.3 NetFlix Usage Patterns . . . . . . . . . . . . . . . . . . . . . . . . . . 655.3.4 Popular movieids . . . . . . . . . . . . . . . . . . . . . . . . . . . . . 735.3.5 Caching . . . . . . . . . . . . . . . . . . . . . . . . . . . . . . . . . . 79
5.4 Weekly Traffic . . . . . . . . . . . . . . . . . . . . . . . . . . . . . . . . . . . 825.5 Daily Traffic . . . . . . . . . . . . . . . . . . . . . . . . . . . . . . . . . . . . 845.6 Summary . . . . . . . . . . . . . . . . . . . . . . . . . . . . . . . . . . . . . 856 Twitch Analysis . . . . . . . . . . . . . . . . . . . . . . . . . . . . . . . . . . 876.1 Live-streaming . . . . . . . . . . . . . . . . . . . . . . . . . . . . . . . . . . 87
6.1.1 Hosting . . . . . . . . . . . . . . . . . . . . . . . . . . . . . . . . . . 936.2 Monthly Traffic . . . . . . . . . . . . . . . . . . . . . . . . . . . . . . . . . . 946.3 Twitch Usage Patterns . . . . . . . . . . . . . . . . . . . . . . . . . . . . . . 956.4 Weekly Traffic . . . . . . . . . . . . . . . . . . . . . . . . . . . . . . . . . . . 1056.5 Daily Traffic . . . . . . . . . . . . . . . . . . . . . . . . . . . . . . . . . . . . 1066.6 eSports . . . . . . . . . . . . . . . . . . . . . . . . . . . . . . . . . . . . . . . 108
6.6.1 Case Study: ESL-One Katowice . . . . . . . . . . . . . . . . . . . . . 1096.7 Summary . . . . . . . . . . . . . . . . . . . . . . . . . . . . . . . . . . . . . 1127 Conclusions . . . . . . . . . . . . . . . . . . . . . . . . . . . . . . . . . . . . 1177.1 Thesis Summary . . . . . . . . . . . . . . . . . . . . . . . . . . . . . . . . . 1177.2 NetFlix Characterization . . . . . . . . . . . . . . . . . . . . . . . . . . . . . 1187.3 Twitch Characterization . . . . . . . . . . . . . . . . . . . . . . . . . . . . . 1197.4 Conclusions . . . . . . . . . . . . . . . . . . . . . . . . . . . . . . . . . . . . 1207.5 Future Work . . . . . . . . . . . . . . . . . . . . . . . . . . . . . . . . . . . . 121References . . . . . . . . . . . . . . . . . . . . . . . . . . . . . . . . . . . . . . . . 123A UDP Traffic . . . . . . . . . . . . . . . . . . . . . . . . . . . . . . . . . . . . 133A.1 NTP . . . . . . . . . . . . . . . . . . . . . . . . . . . . . . . . . . . . . . . . 134A.2 BitTorrent . . . . . . . . . . . . . . . . . . . . . . . . . . . . . . . . . . . . . 134B HTTP User Agents . . . . . . . . . . . . . . . . . . . . . . . . . . . . . . . . 136B.1 Total HTTP . . . . . . . . . . . . . . . . . . . . . . . . . . . . . . . . . . . . 136
B.1.1 Operating System . . . . . . . . . . . . . . . . . . . . . . . . . . . . . 136B.1.2 Browser . . . . . . . . . . . . . . . . . . . . . . . . . . . . . . . . . . 137
B.2 Video User-Agents . . . . . . . . . . . . . . . . . . . . . . . . . . . . . . . . 138
v

B.2.1 Flash User Agents . . . . . . . . . . . . . . . . . . . . . . . . . . . . 139B.3 NetFlix User Agents . . . . . . . . . . . . . . . . . . . . . . . . . . . . . . . 139B.4 Twitch User Agents . . . . . . . . . . . . . . . . . . . . . . . . . . . . . . . . 141C NetFlix User Interface . . . . . . . . . . . . . . . . . . . . . . . . . . . . . . 142D NetFlix IP range . . . . . . . . . . . . . . . . . . . . . . . . . . . . . . . . . 146E New NetFlix Paths . . . . . . . . . . . . . . . . . . . . . . . . . . . . . . . . 147E.1 Login . . . . . . . . . . . . . . . . . . . . . . . . . . . . . . . . . . . . . . . . 147E.2 Content Viewing . . . . . . . . . . . . . . . . . . . . . . . . . . . . . . . . . 147F Twitch Subscriptions and Partnership . . . . . . . . . . . . . . . . . . . . . . 149G Twitch User Interface . . . . . . . . . . . . . . . . . . . . . . . . . . . . . . . 151G.1 Twitch Domains . . . . . . . . . . . . . . . . . . . . . . . . . . . . . . . . . 152G.2 Twitch Chat . . . . . . . . . . . . . . . . . . . . . . . . . . . . . . . . . . . . 153H Twitch Video on Demand . . . . . . . . . . . . . . . . . . . . . . . . . . . . 157H.1 Flash Videos . . . . . . . . . . . . . . . . . . . . . . . . . . . . . . . . . . . . 158
vi
List of Tables
2.1 Well Known Port Numbers . . . . . . . . . . . . . . . . . . . . . . . . . . . . 12
3.1 Inbound TCP Traffic Breakdown . . . . . . . . . . . . . . . . . . . . . . . . 363.2 HTTP Summary Information . . . . . . . . . . . . . . . . . . . . . . . . . . 373.3 HTTP Inbound response content type headers . . . . . . . . . . . . . . . . . 383.4 Top 20 HTTP Server Domains by Traffic Volume . . . . . . . . . . . . . . . 393.5 Top 10 HTTPS Server Domains by Connections . . . . . . . . . . . . . . . . 41
4.1 HTTP Video Types . . . . . . . . . . . . . . . . . . . . . . . . . . . . . . . . 444.2 Popular HTTP Video Services . . . . . . . . . . . . . . . . . . . . . . . . . . 454.3 Unnamed HTTP Video Host subnets . . . . . . . . . . . . . . . . . . . . . . 464.4 HTTP Flash Types . . . . . . . . . . . . . . . . . . . . . . . . . . . . . . . . 464.5 HTTP Octet-Stream Types . . . . . . . . . . . . . . . . . . . . . . . . . . . 474.6 HTTP Inbound Video Traffic by Month . . . . . . . . . . . . . . . . . . . . . 484.7 HTTPS Inbound Video Services by Month . . . . . . . . . . . . . . . . . . . 494.8 YouTube Traffic by Month . . . . . . . . . . . . . . . . . . . . . . . . . . . . 50
5.1 Monthly Connection Statistics . . . . . . . . . . . . . . . . . . . . . . . . . . 645.2 NetFlix Responses - Monthly Summary . . . . . . . . . . . . . . . . . . . . . 655.3 NetFlix movieids by Rank on Campus . . . . . . . . . . . . . . . . . . . . . 755.4 Top 10 NetFlix movieids for December 2014 . . . . . . . . . . . . . . . . . . 765.5 Top 10 NetFlix movieids for January 2015 . . . . . . . . . . . . . . . . . . . 775.6 Top 10 NetFlix movieids for February 2015 . . . . . . . . . . . . . . . . . . . 785.7 Top 10 NetFlix movieids for March 2015 . . . . . . . . . . . . . . . . . . . . 785.8 Top 10 NetFlix movieids for April 2015 . . . . . . . . . . . . . . . . . . . . . 795.9 NetFlix File Sizes . . . . . . . . . . . . . . . . . . . . . . . . . . . . . . . . . 805.10 NetFlix Weekly Content Summary April 12-18, 2015 . . . . . . . . . . . . . 84
6.1 Twitch Live-stream Content Volumes . . . . . . . . . . . . . . . . . . . . . . 886.2 Twitch Top 20 Live-Streamers; rank by month . . . . . . . . . . . . . . . . . 906.3 Twitch Connection Summary . . . . . . . . . . . . . . . . . . . . . . . . . . 946.4 Twitch Content Types by Volume . . . . . . . . . . . . . . . . . . . . . . . . 956.5 Twitch Top Streamers - December 2014 . . . . . . . . . . . . . . . . . . . . . 966.6 Twitch Top Streamers - January 2015 . . . . . . . . . . . . . . . . . . . . . . 976.7 Twitch Top Streamers - February 2015 . . . . . . . . . . . . . . . . . . . . . 986.8 Twitch Top Streamers - March 2015 . . . . . . . . . . . . . . . . . . . . . . . 986.9 Twitch Top Streamers - April 2015 . . . . . . . . . . . . . . . . . . . . . . . 996.10 Twitch Weekly Traffic Summary April 12-18, 2015 . . . . . . . . . . . . . . . 1066.11 Twitch Top Streams April 12-18, 2015 . . . . . . . . . . . . . . . . . . . . . 1066.12 Twitch Live-stream Traffic Summary March 12-15 . . . . . . . . . . . . . . . 111
A.1 Outbound NTP Traffic Volumes . . . . . . . . . . . . . . . . . . . . . . . . . 134
B.1 HTTP User-Agent OS . . . . . . . . . . . . . . . . . . . . . . . . . . . . . . 137
vii

B.2 HTTP User-Agent Browser . . . . . . . . . . . . . . . . . . . . . . . . . . . 138B.3 Video User-Agents . . . . . . . . . . . . . . . . . . . . . . . . . . . . . . . . 139B.4 NetFlix User Agents . . . . . . . . . . . . . . . . . . . . . . . . . . . . . . . 140B.5 Twitch User Agents . . . . . . . . . . . . . . . . . . . . . . . . . . . . . . . . 141
H.1 Video On Demand (HLS) Content Volumes . . . . . . . . . . . . . . . . . . . 158H.2 Twitch FLV Content Summary . . . . . . . . . . . . . . . . . . . . . . . . . 159
viii
List of Figures and Illustrations
2.1 The TCP/IP Layered Protocol Stack . . . . . . . . . . . . . . . . . . . . . . 72.2 Packet Headers . . . . . . . . . . . . . . . . . . . . . . . . . . . . . . . . . . 102.3 TCP Connection Establishment Handshake Procedure . . . . . . . . . . . . 11
3.1 Campus Network Traffic, December 7-13, 2014 . . . . . . . . . . . . . . . . . 343.2 Campus Network Traffic, April 19-25, 2015 . . . . . . . . . . . . . . . . . . . 353.3 Monthly Traffic Breakdown . . . . . . . . . . . . . . . . . . . . . . . . . . . 36
4.1 YouTube Traffic for January 2015 . . . . . . . . . . . . . . . . . . . . . . . . 524.2 Video Traffic Comparison for December 2014 . . . . . . . . . . . . . . . . . . 534.3 Video Traffic Comparison for January 2015 . . . . . . . . . . . . . . . . . . . 544.4 Video Traffic Comparison for February 2015 . . . . . . . . . . . . . . . . . . 554.5 Video Traffic Comparison for March 2015 . . . . . . . . . . . . . . . . . . . . 564.6 Video Traffic Comparison for April 2015 . . . . . . . . . . . . . . . . . . . . 574.7 December 2014 - April 2015 Video Connection Characteristics . . . . . . . . 58
5.1 NetFlix Connections from December 2014 - April 2015 . . . . . . . . . . . . 645.2 NetFlix Response Characteristics December 2014 - April 2015 . . . . . . . . 665.3 December 2014 NetFlix Traffic . . . . . . . . . . . . . . . . . . . . . . . . . . 685.4 January 2015 NetFlix Traffic . . . . . . . . . . . . . . . . . . . . . . . . . . . 695.5 February 2015 NetFlix Traffic . . . . . . . . . . . . . . . . . . . . . . . . . . 705.6 March 2015 NetFlix Traffic . . . . . . . . . . . . . . . . . . . . . . . . . . . . 715.7 April 2015 NetFlix Traffic . . . . . . . . . . . . . . . . . . . . . . . . . . . . 725.8 NetFlix ID Popularity . . . . . . . . . . . . . . . . . . . . . . . . . . . . . . 745.9 NetFlix Traffic and Caching Space for top 25 Shows/Movies . . . . . . . . . 815.10 NetFlix Caching Space Estimation . . . . . . . . . . . . . . . . . . . . . . . 825.11 NetFlix Weekly Traffic April 12-18, 2015 . . . . . . . . . . . . . . . . . . . . 835.12 NetFlix: April 12-18, 2015, Top Content Trends . . . . . . . . . . . . . . . . 855.13 NetFlix Traffic Tuesday, April 14, 2015 . . . . . . . . . . . . . . . . . . . . . 86
6.1 Twitch Live-Stream Popularity . . . . . . . . . . . . . . . . . . . . . . . . . 896.2 Twitch Localized Streaming Traffic Estimation . . . . . . . . . . . . . . . . . 916.3 December 2014 - April 2015 Twitch HLS Response Characteristics . . . . . . 926.4 Twitch Connection Characteristics December 2014 - April 2015 . . . . . . . 956.5 Twitch Traffic for December 2014 . . . . . . . . . . . . . . . . . . . . . . . . 1006.6 Twitch Traffic for January 2015 . . . . . . . . . . . . . . . . . . . . . . . . . 1016.7 Twitch Traffic for February 2015 . . . . . . . . . . . . . . . . . . . . . . . . 1026.8 Twitch Traffic for March 2015 . . . . . . . . . . . . . . . . . . . . . . . . . . 1036.9 Twitch Traffic for April 2015 . . . . . . . . . . . . . . . . . . . . . . . . . . . 1046.10 Twitch Weekly Traffic April 12-18, 2015 . . . . . . . . . . . . . . . . . . . . 1056.11 Twitch Daily Traffic Tuesday, April 14, 2015 . . . . . . . . . . . . . . . . . . 1076.12 Twitch Viewers . . . . . . . . . . . . . . . . . . . . . . . . . . . . . . . . . . 1136.13 Twitch Viewers: ESL-One Katowice (March 12-15) . . . . . . . . . . . . . . 114
ix
6.14 Twitch Viewers March 10-17, 2015 . . . . . . . . . . . . . . . . . . . . . . . 1156.15 Twitch Traffic: March 9-15, 2015 . . . . . . . . . . . . . . . . . . . . . . . . 116
C.1 Screenshot of NetFlix Web Interface Homepage . . . . . . . . . . . . . . . . 143C.2 Screenshot of NetFlix Web Player . . . . . . . . . . . . . . . . . . . . . . . . 144C.3 Screenshot of NetFlix Sense8 series page . . . . . . . . . . . . . . . . . . . . 144C.4 A typical NetFlix session for a Canadian user, from login to browsing. . . . . 145
E.1 New NetFlix paths, from login to browsing . . . . . . . . . . . . . . . . . . . 148
G.1 Screenshot of the Twitch Homepage . . . . . . . . . . . . . . . . . . . . . . . 154G.2 Screenshot of a Twitch stream . . . . . . . . . . . . . . . . . . . . . . . . . . 155G.3 Screenshot of a Twitch Subscribe page . . . . . . . . . . . . . . . . . . . . . 155G.4 Screenshot of a Twitch Following Page . . . . . . . . . . . . . . . . . . . . . 156
H.1 Twitch VOD Response Characteristics . . . . . . . . . . . . . . . . . . . . . 159H.2 Twitch Flash Response Characteristics . . . . . . . . . . . . . . . . . . . . . 160
x
List of Abbreviations and Acronyms
Symbol Definition
API Application Programming Interface
CDF Cumulative Distribution Function
CDN Content Distribution Network
CIDR Classless Inter-Domain Routing
CS:GO Counter Strike: Global Offensive
DASH Dynamic Adaptive Streaming over HTTP
DNS Domain Name Service
DRM Digital Rights Management
eSports Electronic Sports
ESL Electronic Sports League
FPS First Person Shooter
HD High Definition
HLS HTTP Live Stream
HTML Hypertext Markup Language
HTTP Hypertext Transfer Protocol
HTTPS Hypertext Transfer Protocol Secure
IEM Intel Extreme Masters
IMDB Internet Movie Database
IP Internet Protocol
IRC Internet Relay Chat
ISP Internet Service Provider
LAN Local Area Network
LoL League of Legends
xi

MIME Multipurpose Internet Mail Extension
MOBA Multi-player Online Battle Arena
NAT Network Address Translation
NTP Network Time Protocol
OBS Open Broadcaster Software
OS Operating System
RTS Real-Time Strategy
SC2 Starcraft 2
SSH Secure Shell
SSL Secure Socket Layer
TCP Transmission Control Protocol
TLS Transport-Layer Security
TV Television
UDP User Datagram Protocol
URI Uniform Resourse Identifier
URL Uniform Resourse Locator
U of C University of Calgary
VOD Video on Demand
WAN Wide Area Network
xii
Chapter 1
Introduction
Usage of the World Wide Web has changed greatly since its introduction to the public. From
serving static documents and running servers from your home to dynamic content, content
distribution networks (CDN), and uploading information to the cloud, patterns have grown
more varied and asymmetrical; end users typically download far more data than they upload.
Video streaming content from the Web highlights the effects of these changes. As more users
are viewing streaming video content online, the volume of this type of traffic is expected to
grow. Characterizing this type of traffic allows us to gain a deeper understanding of how
network resources are utilized and how users are choosing to consume the content.
1.1 Motivation
Network traffic measurement is a mature area of research that is well understood. It’s used in
academia and in industry, for research and operational purposes. Measurement allows us to
gain a general understanding of how resources are being utilized, i.e., what’s the throughput
for a link? It may also allow us to improve the way we are utilizing the network, via better
policies, resource placement, or resource allocation. In order to plan for future improvements,
it is important to continuously characterize the traffic, to adapt the network infrastructure
to the evolving uses of the network.
Workload characterization in the context of a computer network explains network usage
by describing the traffic on the network. Different types of workloads have different prop-
erties. For example, with Web traffic, the amount of data downloaded from the Internet is
much larger than the amount of data uploaded to the Internet. Properties of traffic may be
determined by meta-data provided in the traffic, or by observing the traffic itself.
1
Large changes in Web usage patterns are occurring as the workloads evolve. Instead of
static images and text documents, users now are interested in viewing a diversity of media
types online. Previously, when a user wished to view different media content they would
have to acquire the file somehow. This was generally done via direct download or through
some peer-to-peer application. Currently, the most popular way to consume different media
is to stream it from the Web. In fact, media streaming, specifically for video, is the largest
category (by byte volume) of incoming content from the Internet at the University of Calgary,
as we will detail in Chapter 3.
The popularity of streaming media content has risen greatly; end users are now much
more interested in streaming content than downloading it as a result of the service model.
Online streaming media has grown in both the number of providers and the amount of
content available. Furthermore, the growth is expected to continue [14]. It seems that music
and video streaming will continue to be dominant contributers to network traffic in the
future.
Music or audio content streaming services were the first to demonstrate that media
streaming is viable. Popular music streaming sites today include Spotify, Rdio, and Google
Play Music. Spotify and Rdio both offer free services, while Google Play provides a subscription-
based music service as well as an on-demand store catalogue. These music streaming sites
all offer professionally produced content and are expected to grow in popularity [9, 20].
Video streaming sites have experienced tremendous growth within the past few years.
Many streaming video sites have a mix of user-generated, professionally-produced, and
live-streamed content. Popular video streaming sites include YouTube [83], NetFlix [49],
Twitch [75], Vimeo [79], DailyMotion [17], Hulu [31], and Yahoo Screen [82]. Online video
streaming is currently displacing the more traditional TV-Broadcast system [30]. For exam-
ple, the larger multi-channel networks of YouTube “are already delivering enough minutes to
US audiences to challenge major TV networks...” [30]. NetFlix and Twitch both also serve
2
enough content to viewers that they compete with some of the larger networks. NetFlix
already serves more traffic than two of the four major US television networks, while Twitch
serves enough content to rank in the top 75 networks, and is expected to rank in the top 25
networks next year based on its projected growth [30].
1.1.1 Video Content Providers
One of the most popular video content providers is NetFlix [35]. For this study we collected
information about (unencrypted) NetFlix traffic from December 2014 to the end of April
2015. NetFlix plans to encrypt all of their service later in 2015, starting with the Web in-
terface [50]. NetFlix charges a monthly subscription fee for unlimited access to its content.
Since NetFlix deals with licensing issues around the world, they sometimes impose a geo-
graphical restriction on its content; i.e., when accessing NetFlix in the United States, a lot
more content is available than if accessing from Canada. The selection of content in Canada
has improved greatly over recent years, but people still use various methods to bypass the
regional restrictions. We will discuss the methods to bypass such restrictions further in
Chapter 2.
Twitch is a video content site that primarily focuses on the live-streaming of video games
being played by other people. Twitch provides video-on-demand archives of streams for
later viewing. The content that Twitch serves is related to video games or non-sports games
of some sort. The games may be played and viewed at a professional level, with teams
of professional gamers facing off against each other and casters1 commentating about the
game as it happens, or it can be someone trying a game for the first time and explaining
what they are trying in the game and what they think of it. Twitch is the leading Web site
for eSports2 broadcasting [59]. All gaming tournaments have a stream on Twitch for their
1A caster is a professional commentator for these events.2eSports is the shorthand term for electronic sports, which are competitive multi-player video game
competitions. In this thesis, the term eSports generally refers to such games being played at a professionallevel.
3
matches. There are some other Web sites that provide live-streaming for eSports events or
for games generally, but they do not have nearly as much traffic as Twitch does, or in the
case of covering an eSports event, they provide a stream on Twitch as well. Twitch accounts
for a significant portion of Internet traffic in the United States, trailing sites like YouTube,
NetFlix, and Apple, but ahead of others such as Facebook and Hulu [22].
We did not characterize the traffic from other providers as deeply as we did for NetFlix
and Twitch. YouTube is the largest video sharing site in the world [3], and generates the
largest volume of video traffic on the University of Calgary’s network. Since December 2012,
however, they have essentially encrypted all of their traffic. The traffic generated from other
video sharing sites is low in volume and is less interesting than Twitch (since Twitch is
mostly live-streamed). Sites such as Vimeo and DailyMotion both offer similar services to
YouTube, however they have a smaller and less active user community, and do not generate as
much traffic. Vimeo and DailyMotion transport their content over unencrypted connections
and may be assisted by a third party, i.e., a content distribution network. Hulu and Yahoo
Screen both offer professionally-made content (such as TV shows), but are either not officially
provided in Canada, as is the case with Hulu, or have almost no content in Canada, as is the
case with Yahoo Screen. Hulu delivers its content over unencrypted connections, and may
be assisted by a third party. Yahoo Screen uses encrypted connections, and seems to serve
content from its own servers. Vimeo may provide all content in high definition (HD), uses
encrypted connections on its site, and uses services from third parties to deliver content.
DailyMotion uses unencrypted connections and serves content from its own servers. All of
these sites account for very little traffic overall at the University of Calgary.
1.2 Objectives
The objectives of this thesis are as follows:
• Develop a methodology to measure all campus traffic for an extended period
4
of time.
• Characterize the current usage trends for the University of Calgary’s network.
• Understand and characterize popular video streaming services accessed from
the University of Calgary’s network.
• Identify approaches to improve the delivery of popular streaming services.
In order to accomplish the latter two objectives, we need to accomplish the initial two
objectives.
1.3 Contributions
The four main contributions of this thesis are as follows. First, we construct the measurement
infrastructure needed to monitor all campus traffic for an extended period of time. Second,
we use the collected data to better understand network utilization at the University of
Calgary. Third, we focus on characterizing two popular unencrypted video services used on
campus, namely NetFlix and Twitch. Finally, we identify several approaches to improve the
delivery of popular streaming services.
Measuring all campus traffic identified a few issues that we describe in Chapter 3. When
characterizing the University of Calgary’s network utilization, we observed many phenom-
ena, including some recent changes to Web usage. While measuring traffic for an extended
period of time, we observed instances of abnormal behaviour on the network. A change
that has occurred in recent years with regards to Web usage is the increased usage of en-
crypted (HTTPS) connections. The usage of encrypted connections greatly limits our ability
to perform a detailed characterization of Web traffic. We focus on characterizing NetFlix
and Twitch traffic since they are relatively new services that are popular (both locally and
globally), and are expected to grow. Measuring the two providers is interesting since they do
not have overlap in content; NetFlix provides a catalogue of on-demand content for the user
5
to view, and Twitch focuses on live-streamed content. Furthermore, both of these services
were unencrypted during our collection period.
1.4 Organization
This thesis is organized as follows. Chapter 2 provides a brief overview of the Internet’s
TCP/IP architecture, approaches to streaming media, and an introduction to NetFlix and
Twitch. It also covers previous work done in network traffic measurement and video traffic
characterization. Chapter 3 describes the tools and methodology used to collect the data and
discusses some information about general traffic levels at the University of Calgary. Chapter 4
explains general information about the levels of video traffic that we have observed at the
University of Calgary. Chapter 5 contains an analysis and characterization of NetFlix, and
Chapter 6 provides the same for Twitch. Finally, Chapter 7 presents conclusions and future
work.
6
Chapter 2
Background and Related Work
This chapter provides an overview of the protocols involved in computer networking, as
well as approaches to media streaming, network measurement, and video traffic analysis.
Section 2.1 describes the TCP/IP stack used to transfer data over the Internet. Approaches
to media streaming are summarized in Section 2.2. Other studies in network and Web traffic
measurement are introduced in Section 2.3, and related work on video traffic characterization
is discussed in Section 2.4. Background information on NetFlix and Twitch is covered in
Sections 2.5 and 2.6, respectively.
2.1 TCP/IP Architecture
The Internet’s structure and usefulness have arisen from the organization of its protocols.
These protocols are layered, and are referred to as the Internet protocol suite or TCP/IP
(after two of the most important protocols in the suite). We will describe the standard
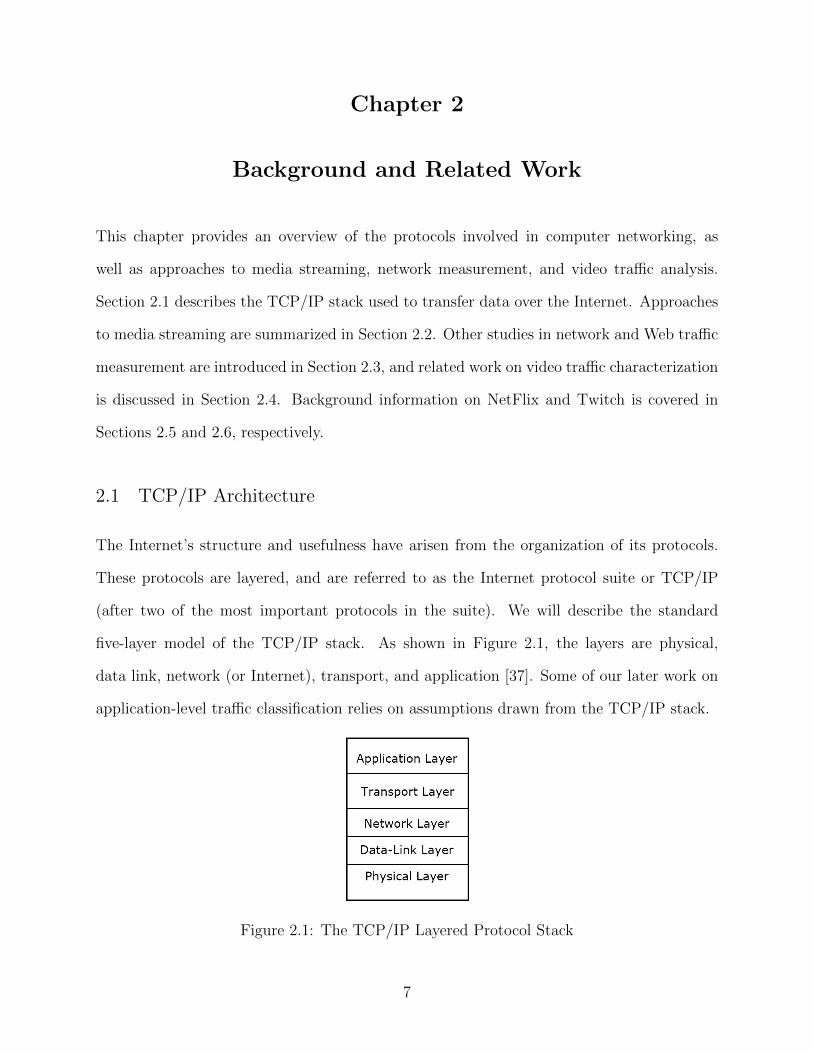
five-layer model of the TCP/IP stack. As shown in Figure 2.1, the layers are physical,
data link, network (or Internet), transport, and application [37]. Some of our later work on
application-level traffic classification relies on assumptions drawn from the TCP/IP stack.
Figure 2.1: The TCP/IP Layered Protocol Stack
7
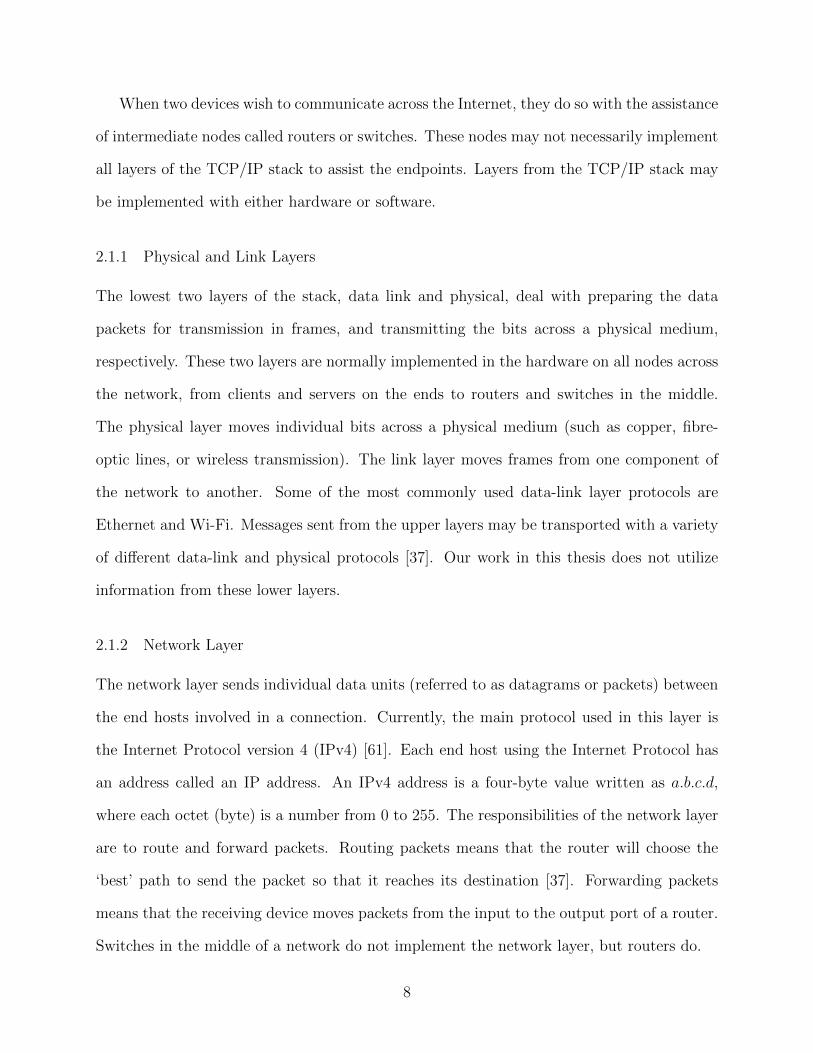
When two devices wish to communicate across the Internet, they do so with the assistance
of intermediate nodes called routers or switches. These nodes may not necessarily implement
all layers of the TCP/IP stack to assist the endpoints. Layers from the TCP/IP stack may
be implemented with either hardware or software.
2.1.1 Physical and Link Layers
The lowest two layers of the stack, data link and physical, deal with preparing the data
packets for transmission in frames, and transmitting the bits across a physical medium,
respectively. These two layers are normally implemented in the hardware on all nodes across
the network, from clients and servers on the ends to routers and switches in the middle.
The physical layer moves individual bits across a physical medium (such as copper, fibre-
optic lines, or wireless transmission). The link layer moves frames from one component of
the network to another. Some of the most commonly used data-link layer protocols are
Ethernet and Wi-Fi. Messages sent from the upper layers may be transported with a variety
of different data-link and physical protocols [37]. Our work in this thesis does not utilize
information from these lower layers.
2.1.2 Network Layer
The network layer sends individual data units (referred to as datagrams or packets) between
the end hosts involved in a connection. Currently, the main protocol used in this layer is
the Internet Protocol version 4 (IPv4) [61]. Each end host using the Internet Protocol has
an address called an IP address. An IPv4 address is a four-byte value written as a.b.c.d,
where each octet (byte) is a number from 0 to 255. The responsibilities of the network layer
are to route and forward packets. Routing packets means that the router will choose the
‘best’ path to send the packet so that it reaches its destination [37]. Forwarding packets
means that the receiving device moves packets from the input to the output port of a router.
Switches in the middle of a network do not implement the network layer, but routers do.
8
The Internet Protocol is a “best effort” protocol. This means that it does not guarantee
delivery of packets within time constraints (or delivery at all), or that the packets it sends
arrive in the same order that they were sent [61]. The “best effort” nature of the Internet
greatly influences application-level protocols, as we will see later in Section 2.4.
To more easily manage the IP addresses in various networks, Classless Inter-Domain
Routing (CIDR) [24] is used. With CIDR, an organization is given a ‘block’ of addresses,
referred to as a subnet. Blocks use the following notation in an IPv4 network: a.b.c.d/x,
where the first x bits are a common prefix across all addresses in the subnet. We use subnets
in this thesis when identifying traffic from NetFlix.
2.1.3 Transport Layer
The transport layer sits on top of the network layer, and is responsible for providing transpar-
ent end-to-end communications between processes on the individual end devices. Different
transport-layer protocols may provide additional services, such as ordered delivery. The two
most-used protocols at the transport layer are UDP [60] and TCP [62]. In the following sub-
sections, we will examine the UDP and TCP protocols, as well as explain the functionality
and purpose of port numbers.
UDP
The User Datagram Protocol (UDP) [60] is a connection-less protocol used to provide “best
effort” delivery. When using UDP to communicate, messages may arrive out-of-order, and
there is no effort made to ensure a message that has been sent is received. UDP also does
not have any sort of flow or congestion control mechanism. When compared to TCP, UDP
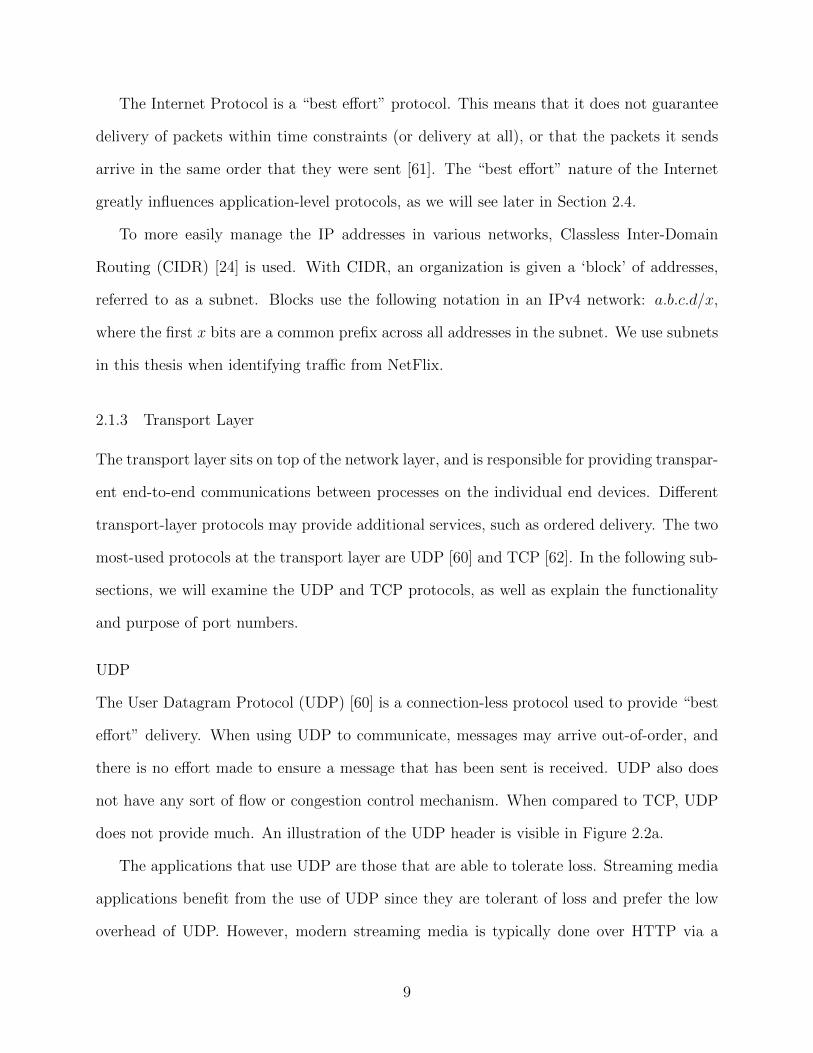
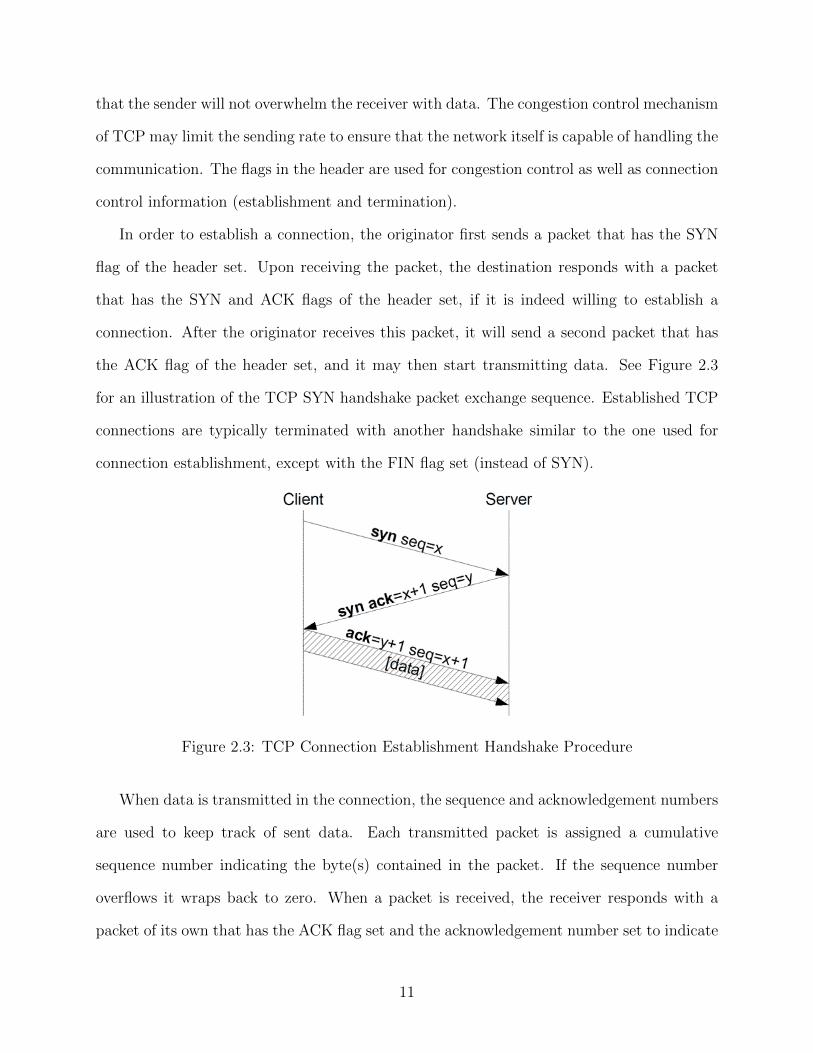
does not provide much. An illustration of the UDP header is visible in Figure 2.2a.
The applications that use UDP are those that are able to tolerate loss. Streaming media
applications benefit from the use of UDP since they are tolerant of loss and prefer the low
overhead of UDP. However, modern streaming media is typically done over HTTP via a
9
(a) UDP Header Fields (b) TCP Header Fields
Figure 2.2: Packet Headers
TCP connection. TCP-based connections are used since many firewalls block UDP traffic,
and video streaming protocols over HTTP are more robust, as discussed in Section 2.4.
Furthermore, usage of UDP may negatively impact TCP flows that traverse the same links.
TCP
The most commonly used transport protocol on the Internet is the Transmission Control
Protocol (TCP) [62]. TCP is a connection-oriented protocol. TCP connections provide a lot
of features when compared to UDP flows. TCP provides reliable delivery; packets that are
sent through TCP are delivered in order, but no guarantee is made on the amount of time
it takes to deliver a packet. Many services that use TCP cannot tolerate loss. Examples
include email, file transfer, and Web browsing (video streaming potentially can tolerate loss,
but still uses TCP).
All packets sent through TCP have some overhead associated with them in the form of the
TCP header. The TCP header is longer than a UDP header since it contains information
about the packet being sent as well as information about the connection itself. Header
information includes fields such as the sequence number of the packet, the acknowledgement
number, window size, as well as other options and various flags. See Figure 2.2b for an
illustration of a TCP header. The sequence and acknowledgement numbers in the packet
header are used to ensure that data is sent and delivered in the correct order. The window
size is used to indicate the receive window size for flow control; flow control in TCP ensures
10
that the sender will not overwhelm the receiver with data. The congestion control mechanism
of TCP may limit the sending rate to ensure that the network itself is capable of handling the
communication. The flags in the header are used for congestion control as well as connection
control information (establishment and termination).
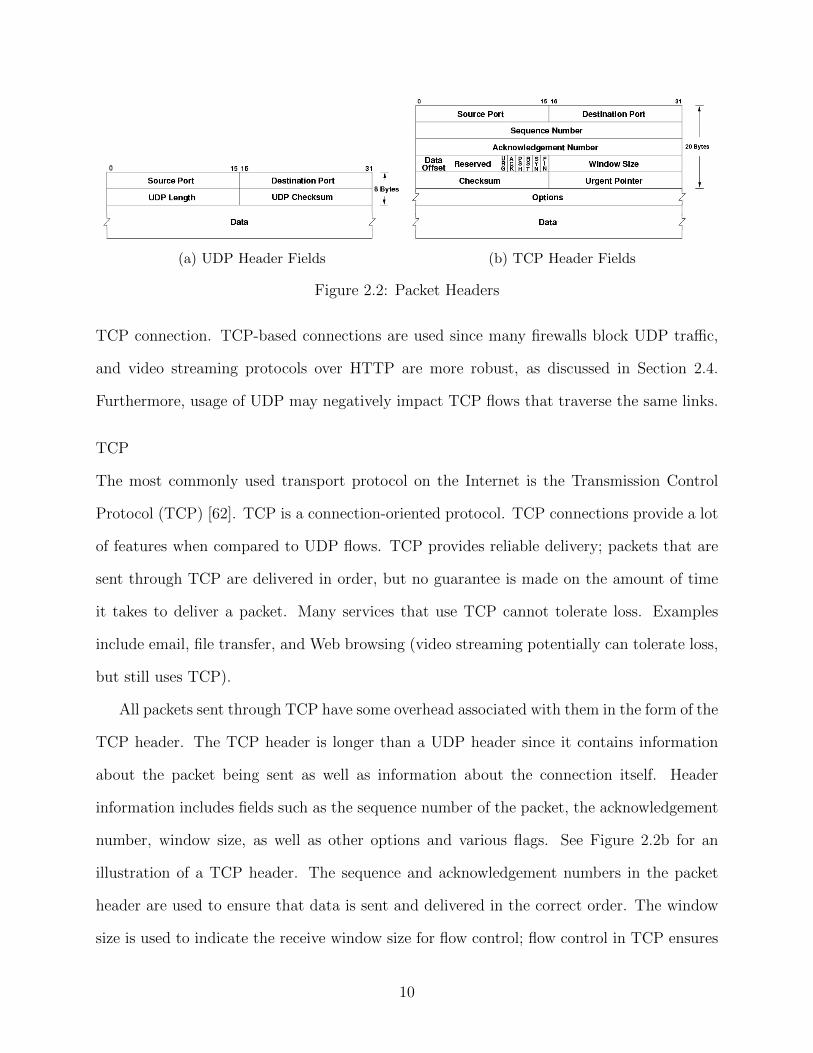
In order to establish a connection, the originator first sends a packet that has the SYN
flag of the header set. Upon receiving the packet, the destination responds with a packet
that has the SYN and ACK flags of the header set, if it is indeed willing to establish a
connection. After the originator receives this packet, it will send a second packet that has
the ACK flag of the header set, and it may then start transmitting data. See Figure 2.3
for an illustration of the TCP SYN handshake packet exchange sequence. Established TCP
connections are typically terminated with another handshake similar to the one used for
connection establishment, except with the FIN flag set (instead of SYN).
Figure 2.3: TCP Connection Establishment Handshake Procedure
When data is transmitted in the connection, the sequence and acknowledgement numbers
are used to keep track of sent data. Each transmitted packet is assigned a cumulative
sequence number indicating the byte(s) contained in the packet. If the sequence number
overflows it wraps back to zero. When a packet is received, the receiver responds with a
packet of its own that has the ACK flag set and the acknowledgement number set to indicate
11
the bytes received. This ACK packet tells the sender that the destination has received that
packet. If no ACK packet is received in time, the sender will assume that the packet has been
lost and try to retransmit it. When a group of three ACK packets for the same sequence
number is received, that indicates that the destination is informing the sender that a packet
has been lost and needs retransmission.
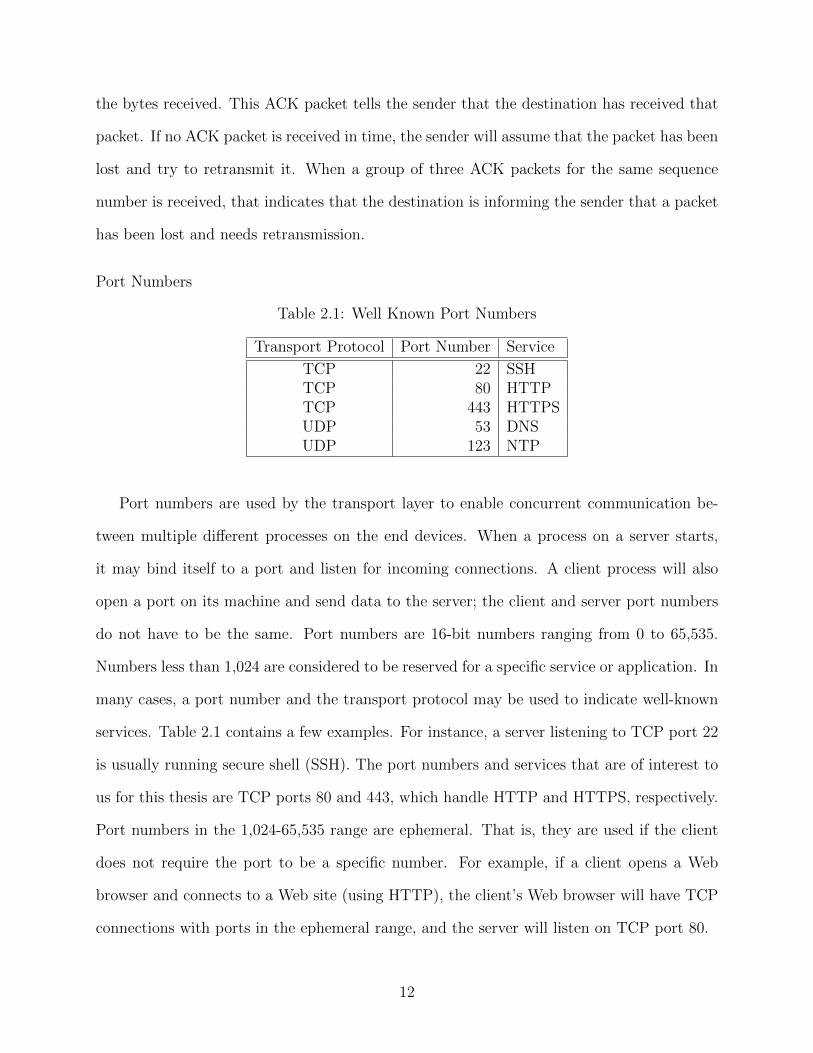
Port Numbers
Table 2.1: Well Known Port Numbers
Transport Protocol Port Number Service
TCP 22 SSHTCP 80 HTTPTCP 443 HTTPSUDP 53 DNSUDP 123 NTP
Port numbers are used by the transport layer to enable concurrent communication be-
tween multiple different processes on the end devices. When a process on a server starts,
it may bind itself to a port and listen for incoming connections. A client process will also
open a port on its machine and send data to the server; the client and server port numbers
do not have to be the same. Port numbers are 16-bit numbers ranging from 0 to 65,535.
Numbers less than 1,024 are considered to be reserved for a specific service or application. In
many cases, a port number and the transport protocol may be used to indicate well-known
services. Table 2.1 contains a few examples. For instance, a server listening to TCP port 22
is usually running secure shell (SSH). The port numbers and services that are of interest to
us for this thesis are TCP ports 80 and 443, which handle HTTP and HTTPS, respectively.
Port numbers in the 1,024-65,535 range are ephemeral. That is, they are used if the client
does not require the port to be a specific number. For example, if a client opens a Web
browser and connects to a Web site (using HTTP), the client’s Web browser will have TCP
connections with ports in the ephemeral range, and the server will listen on TCP port 80.
12
2.1.4 Application Layer
The Application layer is the uppermost layer of the protocol stack. Popular applications
include email, file transfer, voice over IP (VOIP), and Web browsing. The protocols used in
the TCP/IP stack should be transparent to the application. Encryption of communications
can be done at the application level, for example with the TLS [18] or SSL [23] protocols.
The World Wide Web was primarily created by Tim Berners-Lee in 1989 [6]. The Web
provides a platform to access content and services. Usage of the Web is how most people
interact with the Internet. This is primarily done over HTTP or HTTPS.
Hypertext Transfer Protocol
The HyperText Transfer Protocol, HTTP, is one of the protocols used when browsing the
World Wide Web [21]. HTTP specifies how a client requests documents from a server.
The client’s implementation of the protocol is typically done in a Web browser (such as
Google Chrome, Mozilla Firefox, or Microsoft’s Internet Explorer) to provide a user-friendly
interface. As Section 2.1.2 stated, devices on the Internet are assigned an IP address; IP
addresses are not intended to be human-friendly. To give users a better experience when
browsing the Web, we instead address machines with a host (or domain) name; these names
are translated to IP addresses by a service called the Domain Name Service (DNS) [47].
In order to differentiate between distinct objects on the Web, we use a Uniform Resource
Locator (URL) or a Uniform Resource Identifier (URI). The terms URI and URL may be used
interchangeably [77]. The difference between them is that a URI needs to uniquely identify a
resource [7], while a URL identifies the resource as well as an access mechanism [8]. A URL
is composed of two parts. The first part is the host name – which server to contact. The
second part is the request path – where the item is located on the server. For example, a
URL may look like “http://google.com/”. In this case, the HTTP protocol is being used
(‘http://’), the host name is ‘google.com’, and we are requesting the ‘root’ item (‘/’).
An HTTP request starts with a request line, which is the request method followed by
13
the URI, followed by the HTTP version. On the subsequent lines of the request, there may
be optional headers and then an optional body. An HTTP request may look like:
GET /index.html HTTP/1.1
Host: www.server.com
User-Agent: my-browser/1.0
In this example, ‘GET’ is the request method being used; ‘index.html’ is the file being
retrieved, and HTTP/1.1 is the version of the Hypertext Transfer Protocol being used for
the request. The response may indicate a different HTTP version that the server has decided
to use for the connection. The headers in our example include the Host as well as the User-
Agent used to request the element, and there is no body for this request. The most popular
request methods are GET, POST, and HEAD. GET requests are used to retrieve an item
from a server. POST requests are used to send information to a server (in the request body).
HEAD requests are used to retrieve just the meta-data about an object from the server (no
body in the response).
When a Web server receives an HTTP request, it will issue a response. Responses start
with a status line, then a set of optional headers, followed by the (optional) body. The status
line starts with the HTTP version, followed by the response status code, then the response
reason-phrase. An example of a response may look like:
HTTP/1.1 200 OK
Server: my-server/1.0
Content-Type: text/html
Content-Length: 1024
<html>
...
</html>
In this example, the server is responding with the HTTP/1.1 protocol, the status is 200
(OK), and it lists some headers followed by the content. In this case, an HTML document
of size 1,024 bytes is returned. The headers in this case include the server, content type,
and content length. The server is the name of the process that responded to the request.
14
The content type and length are meta-data about the response and may be used by the
client to better handle the response. There are numerous different response status codes,
but they fall into a few general categories such as: 1XX – Informational (i.e., 100 continue,
or 101 Switching Protocols), 2XX – Success (i.e., 200 OK, or 206 Partial Content), 3XX –
Redirection (i.e., 301 Moved Permanently, 302 Found, or 304 Not Modified), 4XX – Client
Error (i.e., 404 Not Found, or 418 I’m a Teapot [42]), and 5XX – Server Error (i.e., 500
Internal Server Error, or 503 Service Unavailable). Client error responses occur when the
client makes an error, i.e., requesting a page that does not exist, or for which they do not
have authorization to access. A server error exists when the server fails to fulfill a valid
request.
HTTPS
The secure version of the Hypertext Transfer Protocol is referred to as HTTPS [67]. A client
connecting to a server via HTTPS must first establish a connection with the Transport
Layer Security (TLS) protocol. After a TLS connection is established, it may send requests
through that connection. HTTPS identifiers are slightly different from HTTP URIs, since
they begin with ‘https://’ instead of ‘http://’. With regards to our monitoring capability,
we assume that a connection is providing HTTPS service if we see a TLS or SSL handshake
on port 443. That means if HTTPS transactions occur on a nonstandard port, we do not
count them.
2.2 Media Streaming
Media streaming over the Web has evolved with respect to how the content is provided
and presented. Audio and video streaming services have recently undergone many changes
with regards to the technologies driving them and the content itself. In this section, we will
present a higher-level overview of media streaming and highlight several of the relevant tech-
nologies. We do not, however, go into detail about lower-level approaches such as encoding
15
algorithms. The technologies in use can improve user experience, assist with copyright law
responsibilities, and assist service providers with content distribution.
2.2.1 Audio Streaming
Audio was the first type of media content to be streamed over the Internet. Audio streaming
includes things such as: audio clips, music (both professionally made and amateur record-
ings), podcasts, and live-streaming radio-like services (such as a sportscast). Audio clips
and podcasts are generally delivered as a static file (.mp3) from a Web site. Previously,
various plugins may have been used to enable audio playback from the Web in an attempt
to discourage piracy. For user-generated audio content, sites like SoundCloud are used, or a
more popular (video) site such as YouTube is used. In this case, the music being uploaded
would have a static image in the player on YouTube, and the content would arrive via mp3.
Streaming music content is the most popular application of audio streaming.
The two most popular service models for music streaming are to provide some catalogue
of content or a radio-like service. The difference between music streaming sites and radio-
like services over the Internet is how the end user interacts with the content. On a music
streaming site, the user may select songs and play lists from a list of content. A radio-like
service, on the other hand, behaves like a radio broadcast. The content is chosen for you
and is delivered ‘live’; this includes things such as live sports commentating, news, and talk
shows. Radio-like services are provided by users who set up an Internet radio station (with a
service such as ShoutCast), and radio stations rebroadcasting over the Internet. The popular
music streaming services (Spotify, Rdio, Google Play), offer both a catalogue of on-demand
content as well as play lists. The play lists offered do not count as a radio-like service, since
a user is able to skip or repeat songs.
16
2.2.2 Video Streaming
Video streaming has constantly evolved with regards to both the underlying technology used
to deliver it, and the types of video available. Previously, video streaming was done with
the use of third-party plugins such as RealPlayer, (Shockwave/Adobe) Flash, or Microsoft
Silverlight, but there has been a shift away from using these types of plugins and towards
using new features provided with HTML5. These features, in the form of a native ‘VIDEO’
tag, were designed with serving video content in mind. Sites like NetFlix and YouTube have
already abandoned third-party plugins in favour of an HTML-only approach.
There are various video streaming services observed on campus that provide the users with
different types of content. YouTube, Vimeo, and DailyMotion all allow for user-generated
content to be uploaded. Hulu, Yahoo Screen, and NetFlix provide professionally-produced
content. Twitch focuses mainly on live-streaming content – mainly of video games (YouTube
has been expanding its live-streaming capabilities too). In this thesis, we will discuss NetFlix
and Twitch in depth in Sections 2.5 and 2.6, respectively. We do not, however, characterize
YouTube traffic in great detail, since YouTube has switched to using HTTPS by default.
2.2.3 Geo-Gating
Geographical gating (geo-gating) is when a service provider restricts access to content based
on the user’s location. When a client connects to a server that is geo-gating content, the
server will determine where in the world the client’s IP address is by querying a database or
remote server. In this thesis, we observe this technology being used to restrict content due
to licensing issues.
Users may try to bypass these restrictions. There are two main approaches used to
bypass geo-gating. The first is to use a virtual private network (VPN), and the second is
to use a third-party plugin. If a VPN is used, then traffic to and from the destination is
sent through an encrypted tunnel. The other end of the tunnel in this case is in an area
17
where the content is not blocked, so the server sees all requests from the client (who is in
a blocked area) coming from the unblocked end-point of the tunnel. In this case, since the
tunnel is encrypted, we are unable to extract detailed application-level observations from the
connection, such as what content is being requested and what request method is being used.
When a third-party plugin such as Hola (a Web browser plugin) is used to access content, we
are able to see the requests and responses that are sent over the Internet; no encryption is
added. A third-party plugin generally works by re-routing (or proxying) some of the requests
made by the browser (such as DNS requests) to get around the regional content restrictions.
2.2.4 Content Distribution Networks
A content distribution network (CDN) is a collection of servers distributed across the In-
ternet. Content on a server is mirrored onto the others. The goals are to provide higher
availability of content, since having a server fail will not make the content unreachable, higher
performance, since the content may be closer to the end user, and improved scalability, since
there are more servers to respond to requests. A CDN is useful since it may provide better
service to the end user and requires less investment from the content provider (if using a
third-party network).
We see various CDNs in use when inspecting traffic. These CDNs can be operated
by the host organization, i.e., cdn-vimeo.net and cdn-0.nflximg.com (CDNs for Vimeo
and NetFlix). A CDN may also be operated by a third-party provider, such as Akamai or
Limelight.
2.3 Related Work in Traffic Measurement
There have been numerous studies focusing on the measurement and characterization of
network traffic. We will group these studies into two broad categories: studies focusing on
characterizing network traffic [10, 12, 13, 15, 16, 26, 41, 72, 81], and studies examining HTTP
18
traffic [40, 52, 63, 70, 71, 78].
Residential Internet usage was measured by Maier et al. [41] with a dataset from 2009
provided by a European Internet service provider (ISP). The study revealed that there was a
shift away from peer-to-peer file-sharing applications and back towards HTTP traffic. Since
the ISP provided DSL connections to its subscribers, the analysis focused on the consequences
of this, such as IP reassignment, and short session length.
Chatzis et al. [12] measured traffic in 2012 from a major European ISP for 17 weeks.
They found that many of the “critical Internet players” were trending towards homogeneous
networks. That is, they host servers with the assistance of third parties or deploy massive
numbers of their own servers.
Home networks were characterized in recent studies by Grover et al. [26] in 2013, and
Xu et al. [81] in 2014. These studies found that there are strong diurnal patterns on home
networks. They also provided empirical evidence of the popularity of YouTube and NetFlix.
Czyz et al. [16] studied denial of service attacks using the network time protocol (NTP)
in 2014. They characterized many aspects of this type of attack, including the volume of
traffic, number of devices, community response, etc. While this type of traffic is not the focus
of the thesis, we have observed NTP exploitation on the University of Calgary’s network.
See Chapter 3 for our observations.
IPv6 adoption rates were also studied in 2014 by Czyz et al. [15]. They observed that
adoption of the new addressing scheme is accelerating and that adoption is not geographically
uniform. At the University of Calgary, we have observed very limited use of IPv6. In fact,
all IPv6 traffic observed is currently tunnelled via IPv4.
Bustos-Jimenez and Fuenzalida [10] focused on measuring an ISP from the user’s end
to ensure that net-neutrality1 rights are met. Their probes collected data between October
2011 and April 2012. They found that most ISP’s provided less bandwidth to the consumer
1A basic description of net-neutrality is that an Internet service provider must treat all packets that itroutes equally. No content is to be given priority over others.
19
than stated (i.e., a 10 Mbps plan would only give 8 Mbps). They also found that available
speed varied depending on the time of day. During the night, the download speed would
be much less than what the user’s contract specified, indicating a policy-driven decision as
opposed to an infrastructure failure. The system they developed was used by consumers to
help defend their rights and enact positive service changes.
A study of machine-to-machine traffic by Shafiq et al. [72] focused on characterizing
traffic from cellular devices. They used a week-long traffic trace from August 2011, and
found that a majority of smartphone traffic was sent through TCP, and belonged to well-
known applications (such as HTTP or email).
Chung et al. [13] studied mobile devices in enterprise networks using data from April
12-22, 2011. The found that across the three main smartphone OS’s (Android, iOS, and
Windows), there was significant use of mobile devices to transfer files, sometimes using peer-
to-peer protocols such as BitTorrent. They also observed diurnal patterns with smartphone
usage. Activities such as checking the news and weather would occur in the morning, and
file transfers would occur overnight.
Newton et al. [52] conducted a long-term study of Web traffic from the University of
North Carolina at Chapel Hill. This study used outgoing Web logs from a 13-year time
period, from 1999-2012. They only counted traffic on TCP ports 80 and 443 (HTTP and
HTTPS). Their analysis focused on packet headers. They were able to identify and charac-
terize activity sessions. Their HTTPS analysis can count the number of connections in their
traces and estimate how many requests and responses were exchanged (as well as their sizes)
by comparing the sequence and acknowledgement numbers of the packet headers.
Mah developed an early model for HTTP network traffic [40] with data taken from late
1995. His model is based on the properties of request and response exchanges. The specific
characteristics in his model are: request-length, response-length, document-size, think-time,
consecutive document retrievals, and server selection. The model that Mah developed is
20
commonly used when studying static pages, or Web traffic in bulk. This type of model is
not commonly used when characterizing video traffic. In the paper, Mah removes anomalous
connections that poll a server every five minutes for new images. Video streaming (especially
live-streaming) makes many connections at regular intervals, thus making video streaming
connections unsuitable for this type of model.
Pries et al. [63] developed another model for HTTP traffic using statistics from many
popular Web pages around the world. Their model used data from 2012 and shows that
the number of embedded objects has increased, with images and scripts being the most
prominent. They also found that the number of inline objects has greatly increased (when
compared to past studies), and that much of the content is now being drawn from multiple
originating servers. They expect that both of these counts (inline objects and embedded
objects) will increase as HTML5 matures.
Schneider et al. [71] used data from residential networks in Europe, from 2008-2010,
to examine some common pitfalls in the measurement of HTTP requests themselves. They
found that there were three main classes of problems that arise when analyzing HTTP traffic:
ignoring persistent/pipelined HTTP requests; content-type mismatches; and content-length
mismatches. These issues are common across observed connections. We are able to observe
some of these issues with our investigation of video traffic as well. See Chapter 4 for an
explanation.
In 2009, Veres and Ionescu [78] proposed and demonstrated a measurement-based clas-
sification system for Web 2.0 applications. Web 2.0 applications include things like social
media and video streaming. They were able to characterize instances of devices accessing
these sites without using information above the transport layer. They found that video traf-
fic volume dominates other traffic, and video traffic is transported by relatively few flows,
compared to other applications such as photo album sharing.
HTTPS traffic flows were studied by Schatzmann et al. [70]. They looked specifically into
21
the classification of encrypted Web email traffic with an 11-day trace from March 2011. The
approach taken by the authors was a passive one. They looked for email-related protocols
across hosts that have similar client pools, identified known email servers, and then used
the proximity to those servers to identify Web mail servers. After identifying the relevant
servers, they characterized connections for their study.
2.4 Related Work in Video Traffic Characterization
Kuschnig et al. [38] examined request-response based HTTP streaming in 2011. By emulating
a network, the authors found that the use of HTTP request-response streams is more robust
than simple TCP streams for video transmission. In this case, a simple TCP stream is the
transmission of the video file over a single TCP connection, where smooth playback can
be achieved high over-provisioning. HTTP streams are better able to adapt to network
conditions. Swaminathan [74] arrives at the same conclusion, namely that other protocols
associated with streaming do not provide a good user experience. He states that HTTP-based
streaming can be developed further to address these issues.
Dynamic adaptive streaming over HTTP (DASH) has been the subject of multiple stud-
ies [4, 36, 54, 64]. DASH is a popular approach to video streaming, which makes efforts to
overcome the best-effort nature of the Internet. DASH is the basis of Apple’s HTTP live-
streaming (HLS), which is the service deployed by Twitch for their live-streaming solution.
It also seems that DASH is used by NetFlix [66]. DASH works by breaking a single large
video file into a sequence of many small video segment files that can be easily transmitted
individually over the Internet. For example, if a DASH server wanted to serve a large file
named video.mp4 it would split the file into smaller files named video-1.mp4, video-2.mp4,
..., video-N.mp4 ; a client wanting to view video.mp4 would request and play video-1.mp4,
then video-2.mp4, and so on. A DASH server also provides the files in different levels of qual-
22
ity. Clients interacting with the server will automatically choose the best quality possible2
(based on network conditions) and ask for the latest file in the sequence. With live-streaming
content, if a file cannot be transmitted in time, it is skipped and the next one is requested.
Li et al. [39] examined techniques used from 1993-2013 to provide a retrospective view
of the approaches and technologies used in video streaming. The overview described the
previous approaches to streaming videos, both over HTTP and through other mechanisms
such as peer-to-peer networks.
Plissanneau and Biersack investigated HTTP streaming for YouTube and DailyMotion
from an ISP’s perspective [58]. The dataset they use is composed of a set of ten one-hour
traces captured between 2008-2011. They found that most video downloads fall into two basic
groups: videos that are fully downloaded, and those that are not. The groups corresponded
strongly to video quality (both delivery quality and content quality); i.e., bad video quality
leads to early video cancellation. Another study by Din et al. [19] observed the same effect:
poor connection quality as indicated by dropped packets may lead to shorter connection
durations. An interesting observation was that even when the video quality was good, only
half of the videos are fully downloaded, likely due to a lack of user interest.
Wei and Swaminathan considered the future of live-streaming video over HTTP 2.0 [80].
The authors primarily investigate the technologies that could be used in HTTP 2.0 (since
HTTP 2.0 was not yet finalized [5]). One of the new features in HTTP 2.0 that may help
with video streaming is the server push feature, which allows the server to proactively send
data that has not yet been requested by the client. They found that this feature could reduce
latency significantly.
In 2013, Tyson et al. [76] used a Web crawler to study a video site that specializes in
pornographic content. With repeated use of the crawler, they were able to determine the
popularity of videos within a certain time-frame. They also observed some characteristics
that are present with other services, such as a small subset of the content being the most
2The user may request a specific quality level as well.
23
active. Unlike other video sharing sites, they found that popularity of a video rapidly
decreases with time.
A study of student interaction with video streaming content was conducted by He [29].
He analyzed the messages that were sent (both online and offline) in an education service
using data from the Fall 2009 semester. The chat analysis found that the primary use of the
utility was to chat with other students, not to interact with the instructor.
Gill et al. [25] studied YouTube requests from the University of Calgary’s network in 2007.
This study was on video traffic sent from YouTube and the CDNs assisting it. There have
been many changes since the study. First, YouTube’s architecture has changed drastically,
including a move to HTTPS. Second, the University’s network has been upgraded since then.
Finally, there are now many competing services available to choose from.
Metzger et al. [45] conducted an analysis of Web-based video delivery with YouTube in
2011. This study is more recent than the one by Gill [25], so it takes the infrastructure
changes at YouTube into account. They did not measure at a network-level. Instead, they
were more interested in video-playback characteristics, such as stalling time. Since these
studies [25, 45], YouTube has switched to using HTTPS, making it impossible to exactly
repeat this type of analysis, since the application-level details, such as content identifiers,
are encrypted.
2.5 NetFlix
NetFlix provides TV shows and movies on-demand. The content provided by NetFlix is
different from other video streaming sites, such as YouTube or Twitch, in several major
ways. Specifically, NetFlix does not have user-generated content, content is often geo-gated,
and NetFlix is a subscription-based service. NetFlix also does not have any support for
live-streaming events.
NetFlix’s model, i.e., providing only TV shows and movies, is important in differentiating
24
NetFlix from other services. Specifically, NetFlix does not offer other professionally-made
content such as music videos, product overviews, or professional commentary for large events.
YouTube and Yahoo Screen both offer these types of content. NetFlix has a mandatory
subscription plan starting at $7.99/month3. This differentiates NetFlix from other services
that offer movies and TV shows, like Yahoo Screen (no subscription) and Hulu (optional
subscription).
Hulu also provides similar content (movies and TV shows) with both a free and premium
service, but is not available in Canada. NetFlix’s geo-gating is an important characteristic.
Not all content on NetFlix is globally visible. That is, some content provided in the United
States may not be available in Canada or the rest of the world, and vice versa. Unlike Yahoo
Screen, NetFlix does not list the unavailable content4.
2.5.1 History
When NetFlix was founded in 1997, it provided an online interface to a DVD rental ser-
vice [51]. This service is still available in the United States. Starting in 2007, NetFlix
started to provide online streaming of content in the United States, and expanded this ser-
vice into Canada in 2010. When NetFlix started to offer streaming services over the Web,
they first used Microsoft’s Silverlight plugin for digital rights management (DRM) related
purposes, but more recently (in 2013) they have switched to using HTML5. In 2011, NetFlix
expanded into South America and Latin America, and in 2012 they began to expand into
Europe. NetFlix also started to provide original content to subscribers in 2013 with their
release of House of Cards5, and a new season of Arrested Development.
3The $7.99/month plan allows for up to two devices to be used at once with HD (1080p) streaming.There is also a $11.99/month plan that allows four devices and Ultra HD (4k) streams.
4Yahoo Screen produces and is the only distributor of season 6 of Community, but the content does notplay in Canada.
5The NetFlix original series House of Cards is based on a previous BBC series of the same name.
25
2.5.2 Related Work
Many of the previous studies [1, 2, 65, 43] involving NetFlix traffic do not reflect some of
the recent technical changes.
Studies done by Adhikari et al. [1, 2] studied how NetFlix connects to various clients across
the United States with data traces from 2011. The technical details, including hostnames,
usage of CDNs, and usage of SilverLight, have all changed since the study was published.
NetFlix traffic volumes were studied by Martin et al. [43] in 2013. This study was done in
2013, when NetFlix was using third-party CDNs to deliver video traffic. They observed that
NetFlix’s implementation of DASH defaults to TCP congestion control mechanisms when
the network is under heavy traffic.
Streaming behaviour of NetFlix and YouTube on the client’s end was also studied by Ito
et al. [33] in 2014. This study determined some network-level characteristics of the traffic
in many scenarios. They found that the NetFlix player consumes an average of 3.4 Mbps –
YouTube consumed around 1.2 Mbps. The behaviour of a NetFlix connection differed from
YouTube: NetFlix uses a period of high bandwidth at first to fill a buffer, then reduces to a
much lower level of bandwidth. This study was done in June 2014, after NetFlix switched
to HTML5, but another study by Rao et al. [65], in 2011, showed similar behaviour with the
Silverlight plugin.
2.6 Twitch
Twitch is a site that is focused on live-streaming of video game content. The content on
Twitch is focused on video games or other types of non-sports games, such as board games or
card games. Twitch provides live-streaming capabilities as well as video on demand (VOD)
capabilities for past broadcasts. Twitch does not have a mandatory subscription fee, nor does
it geo-gate content. However, Twitch allows users to pay an optional monthly subscription
fee (to Twitch or streamer(s)) for some benefits; this is described in Appendix F. Unlike
26
YouTube, a Twitch streamer may not upload pre-recorded videos. Twitch currently uses
Flash on the user’s end to stream videos.
Twitch, due to its content, is very different from other services like NetFlix or YouTube.
Twitch focuses on live-streaming video games and provides some utilities to help the streamer
interact with the viewers. Every live-stream on Twitch also has a ‘chat’ associated with it
(a Web embedded Internet Relay Chat (IRC)). The chat allows users to converse with the
streamer and amongst themselves about the content. Twitch primarily organizes live-streams
by game title. On the homepage, there are also listings for the top channels being broadcast
from gaming consoles (XBox One, PlayStation 4), but the console streams are much less
popular than the other ones (much fewer viewers).
2.6.1 History
Twitch started in 2011 as a self-sufficient spinoff from the more general streaming site
JustinTV.com6. Twitch was acquired by Amazon in September 2014. One of Twitch’s
earliest competitors, Own3d.tv, failed in early 2013 after controversy surrounding its busi-
ness practices [44]. The own3d.tv domain is still active today, but completely unaffiliated
with the original service. Twitch currently has a virtual monopoly on all video game stream-
ing events [59]. YouTube and DailyMotion are both trying to gain traction in video game
live-streaming, but have had limited success so far.
2.6.2 Related Work
Shea et al. [73] conducted a study of Twitch’s streaming service focused on streaming soft-
ware. They were specifically investigating Open Broadcast Software (OBS) – a popular
program used to send streams to Twitch. Their experiments with this software occurred in
2015. This study did not investigate network events, but instead profiled the workload of a
streaming computer.
6JustinTV was active from 2007-August 2014.
27
Hamilton et al. [28] characterized the Twitch community itself in 2014. The authors
of this study focused on the social aspects of the community as well as what environment
Twitch presents (in a social context). This study was able to get some information from
a variety of streamers (on both big and small channels) about the social interactions they
have.
The community that surrounds Twitch was studied by Nascimento et al. [48]. They
specifically targeted streamers involved in eSports for the game Star Craft 2 (SC2) from
October 2014 to February 2015. Their observations were based on interactions in Twitch
chat. They found that viewers displayed certain behaviours, such as channel surfing and
early exit (leaving a stream a few minutes before it was ending).
Twitch traffic was studied recently by Zhang and Liu [84], using data from the Twitch
API. They crawled Twitch in the fall of 2014 and found most viewers watch from a desktop as
opposed to a console device such as an XBox or Playstation. When examining the streamers
themselves, they observed that less than 1% of them triggered 70% of the views. Strong
diurnal patterns from these streamers was also observed.
A comparison of Twitch and YouTube’s live-streaming capabilities was conducted by
Pires and Simon [57] from January to April 2014. In this study, they found that Twitch is a
more mature system, with many more concurrent channels and sessions than YouTube. The
authors also conducted another study on Twitch’s use of DASH [56].
Another study with data obtained from crawling Twitch was done by Kaytoue et al. [34]
taking place from the end of September 2011 to the start of January 2012. This study
focused on the community around Twitch, with a special interest in the eSports community.
They found that many streams (41%) originate on the west coast of North America, 19% on
the East coast, and the rest were mostly from Europe or south-east Asia and Korea. They
also observed fluctuations in game popularity. These fluctuations occurred when a new game
was released; that is, new games receive a surge of popularity.
28
2.7 Summary
In this chapter, we described the TCP/IP protocol stack, and approaches to media streaming
for both audio and video content. We surveyed related work in the areas of network traffic
measurement and video traffic. Finally, we described the two main services we will study,
NetFlix and Twitch, and summarized previous studies done with these services. Our study
with these two services is novel since we are using a large network-level dataset.
In the next chapter, we will describe the tools and methodology used to collect our
dataset, as well as the characteristics of traffic on the University of Calgary’s network.
29
Chapter 3
Measurement Methodology
Our data is collected from a mirrored stream of all traffic that passes through the University
of Calgary’s edge routers. This means that we can observe all traffic that has one endpoint
in the Campus network and the other endpoint in the Internet.
We use a Dell server to monitor the mirrored traffic stream. This server is equipped with
two Intel Xeon E5-2690 CPUs (32 logical cores @2.9 GHz) with 64 GB of RAM and 5.5 TB
of local storage for logs. The operating system on the server is CentOS 6.6 x64. We backup
the logs nightly to a file server with more storage. Our monitoring server uses an Endace
DAG 8.1SX capture card with the firmware updated to the latest release (March 2013) to
capture the mirrored traffic. The features of this card will be detailed in Section 3.1.
We run a custom tool to collect aggregate throughput information about the traffic, such
as TCP or UDP bytes in and out. Section 3.1 has more information about this tool. In
addition, we run the Bro Network Monitor [55] to collect connection-level logs about all
traffic that we see. Section 3.2 has more information on our specific usage of Bro. We have
the capability to use other tools to analyze the traffic stream, as described in Section 3.3.
3.1 Network Throughput
The Endace card in the server is capable of filtering, steering, and splitting traffic across
many different streams. The tool that we use to log network throughput information is
written in C and uses the Endace DAG API. Using the API, we are able to look at incoming
packets and read header information, i.e., IP version, IP addresses, protocol number, and
packet length. This information is aggregated and logged at one-minute intervals to give us
network usage information.
30
We chose to use our own tool to collect this information for several reasons. First,
other throughput tools available were not written for the DAG API. Second, the program is
simple, robust and lightweight. Third, it is an independent way to validate summary results
in Bro. We can partially reconstruct this throughput information using Bro’s connection
logs, but we may miss information for a couple of reasons. First, connection log entries do
not have any way to determine how packets in a connection were delivered over time, so
when reconstructing throughput information, we assume all connections send/receive bytes
uniformly over their duration. For example, we assume that if a connection lasts two minutes
and sends two megabytes, then it sent one megabyte per minute. A second issue is that Bro
only logs connections when they terminate, so if we wanted to get throughput information
for a specific day, we may miss connections that extend beyond the end of the day1.
3.2 Bro
Bro is an open-source network security monitor [55]. By default, Bro records connection
events observed on an interface or from a pre-recorded packet capture file. The logs that
Bro produces that are of primary interest to us are the connection, HTTP, and SSL logs.
The connection logs list general information about each observed connection, i.e., start time,
endpoints, bytes/packets transferred by each endpoint, duration, termination-state. The
HTTP logs contain information about each HTTP request/response pair, with information
such as start time, endpoints, request/response body length, domain, path, referrer, etc. We
have extended Bro’s default behaviour to collect extra information about HTTP request-
response transactions. This extra information includes request and response start and end
times, as well as some select headers from the messages, such as cache policy and response
type. The SSL logs contain information about encrypted connections. We use the SSL logs to
identify connections that communicated with servers of interest, i.e., NetFlix authentication
1We found that some connections lasting multiple days were the result of network misuse.
31
servers, or GoogleVideo servers.
Using the information available in all the logs, as well as some other sources, we can gain
a general understanding of the usage of the University of Calgary’s network. See Section 3.4
for details.
The traffic splitting feature of the Endace card is used for load balancing in our deploy-
ment.
3.3 Other Collection Tools
With our configuration of the server, we can use other tools to process the traffic stream as
well. We have occasionally used tcpdump to look for specific traffic in the live-stream (i.e.,
NTP traffic). We also have occasionally used the Endace tool dagsnap to collect full-packet
traces, which are used for debugging purposes. dagsnap is capable of capturing all traffic on
the interface with no packet losses. Other tools that can be used on the server include any
that use the DAG API or libpcap, since we have compiled libpcap on the server with DAG
support.
3.4 Traffic Overview
Over the five months that we collected data from the Campus network, we have measured
over 2.7 PB of traffic. We observed numerous general trends in usage as well as some anoma-
lies in this traffic. We have produced throughput graphs with the information produced by
the tool described in Section 3.1. These graphs show inbound and outbound throughput
levels (in gigabits per second) split across the X-axis for various protocols. The most visible
protocols are TCP (in blue), and UDP (in yellow). When comparing traffic from December
2014, in Figure 3.1, with traffic from the end of April 2015 in Figure 3.2, we notice that there
was a significantly higher level of outbound UDP traffic in December. This UDP traffic was
due to a Network Time Protocol (NTP) exploitation attack. We examine UDP traffic in
32
Appendix A.
Our traffic follows a diurnal pattern that corresponds to when the majority of people are
on campus. The busy period starts in the late morning with usage peaking mid-day and
continuing until the late evening. The idle period starts late in the night and lasts until the
morning. The peak inbound rates approach 2.5 Gbps, consisting mostly of TCP traffic. Our
outbound traffic (excluding UDP-based NTP exploit traffic) is under 1 Gbps. The levels of
traffic dip slightly over the weekends and are much lower when there is an academic break
in the University’s calendar.
3.4.1 Outages
Our collection period for Bro logs starts on December 1, 2014 and runs until April 29,
2015. We missed collection with the throughput tool for the first week of December. Several
outages were due to power or network outages on Campus, or they were caused by issues
with our server configuration. The following are lists of interruptions:
Network/Power Interruptions
• January 30, 2015, 11:19-12:12 – power failure
• April 29, 2015 – full traffic mirror disconnected
The mirror disconnect corresponds to the end of our collection period.
Bro Interruptions
• December 22, 2014
• December 23, 2014, 00:00-11:15
• February 15, 2015, 18:00-19:00
• April 10, 2015, 10:00-24:00
• April 11, 2015
33
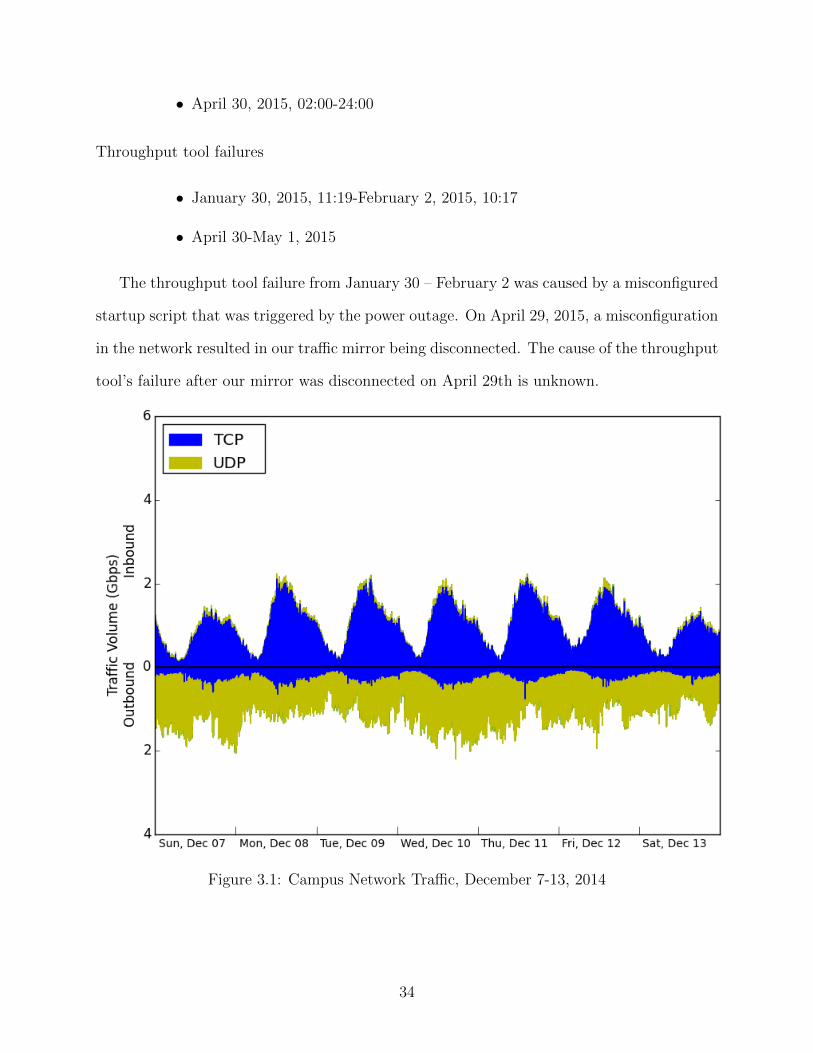
• April 30, 2015, 02:00-24:00
Throughput tool failures
• January 30, 2015, 11:19-February 2, 2015, 10:17
• April 30-May 1, 2015
The throughput tool failure from January 30 – February 2 was caused by a misconfigured
startup script that was triggered by the power outage. On April 29, 2015, a misconfiguration
in the network resulted in our traffic mirror being disconnected. The cause of the throughput
tool’s failure after our mirror was disconnected on April 29th is unknown.
Figure 3.1: Campus Network Traffic, December 7-13, 2014
34
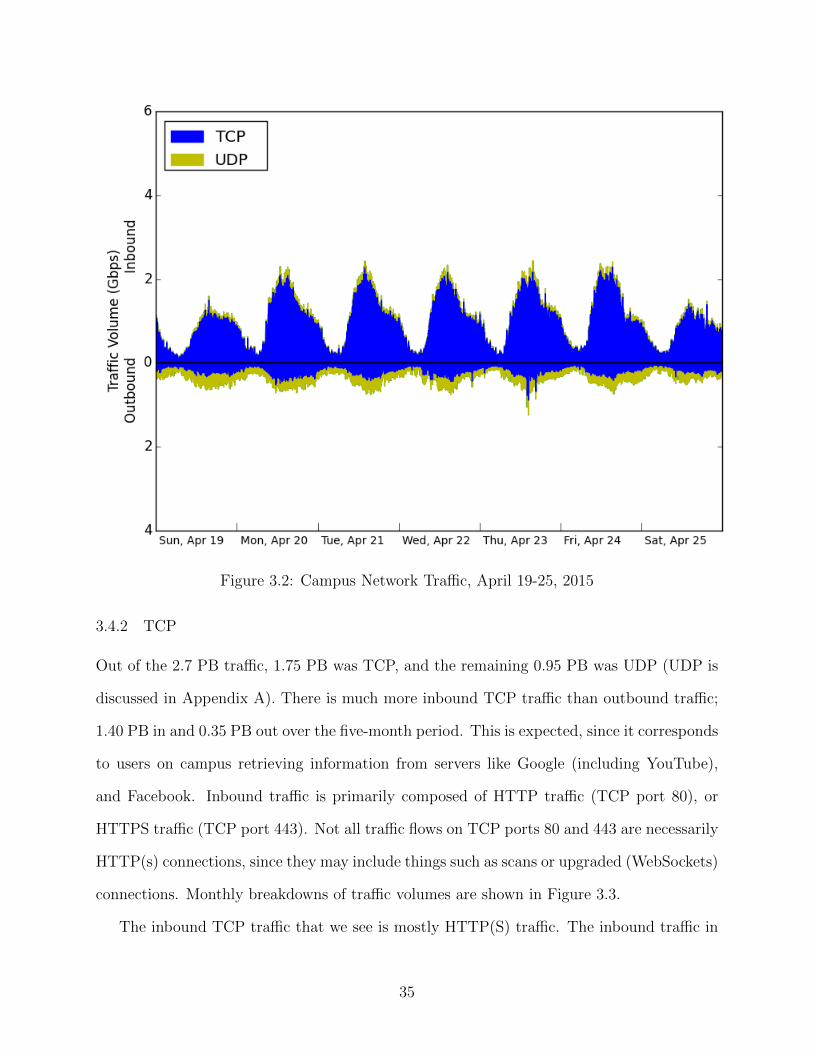
Figure 3.2: Campus Network Traffic, April 19-25, 2015
3.4.2 TCP
Out of the 2.7 PB traffic, 1.75 PB was TCP, and the remaining 0.95 PB was UDP (UDP is
discussed in Appendix A). There is much more inbound TCP traffic than outbound traffic;
1.40 PB in and 0.35 PB out over the five-month period. This is expected, since it corresponds
to users on campus retrieving information from servers like Google (including YouTube),
and Facebook. Inbound traffic is primarily composed of HTTP traffic (TCP port 80), or
HTTPS traffic (TCP port 443). Not all traffic flows on TCP ports 80 and 443 are necessarily
HTTP(s) connections, since they may include things such as scans or upgraded (WebSockets)
connections. Monthly breakdowns of traffic volumes are shown in Figure 3.3.
The inbound TCP traffic that we see is mostly HTTP(S) traffic. The inbound traffic in
35
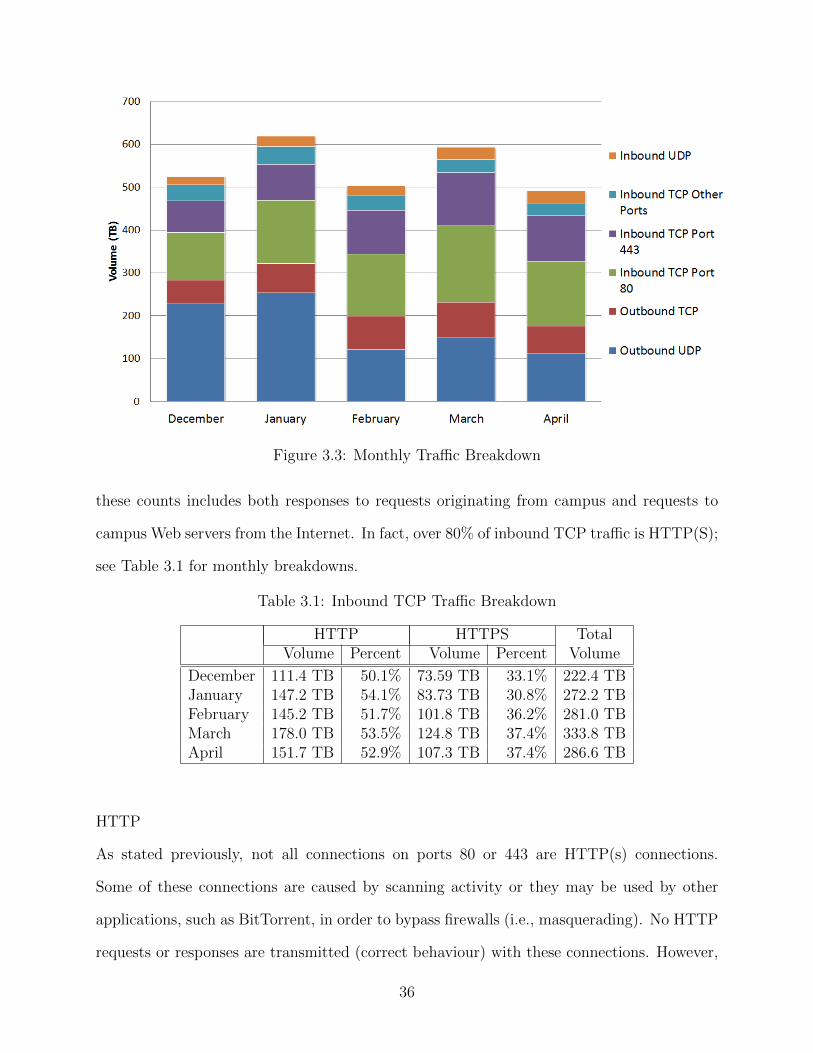
Figure 3.3: Monthly Traffic Breakdown
these counts includes both responses to requests originating from campus and requests to
campus Web servers from the Internet. In fact, over 80% of inbound TCP traffic is HTTP(S);
see Table 3.1 for monthly breakdowns.
Table 3.1: Inbound TCP Traffic Breakdown
HTTP HTTPS TotalVolume Percent Volume Percent Volume
December 111.4 TB 50.1% 73.59 TB 33.1% 222.4 TBJanuary 147.2 TB 54.1% 83.73 TB 30.8% 272.2 TBFebruary 145.2 TB 51.7% 101.8 TB 36.2% 281.0 TBMarch 178.0 TB 53.5% 124.8 TB 37.4% 333.8 TBApril 151.7 TB 52.9% 107.3 TB 37.4% 286.6 TB
HTTP
As stated previously, not all connections on ports 80 or 443 are HTTP(s) connections.
Some of these connections are caused by scanning activity or they may be used by other
applications, such as BitTorrent, in order to bypass firewalls (i.e., masquerading). No HTTP
requests or responses are transmitted (correct behaviour) with these connections. However,
36
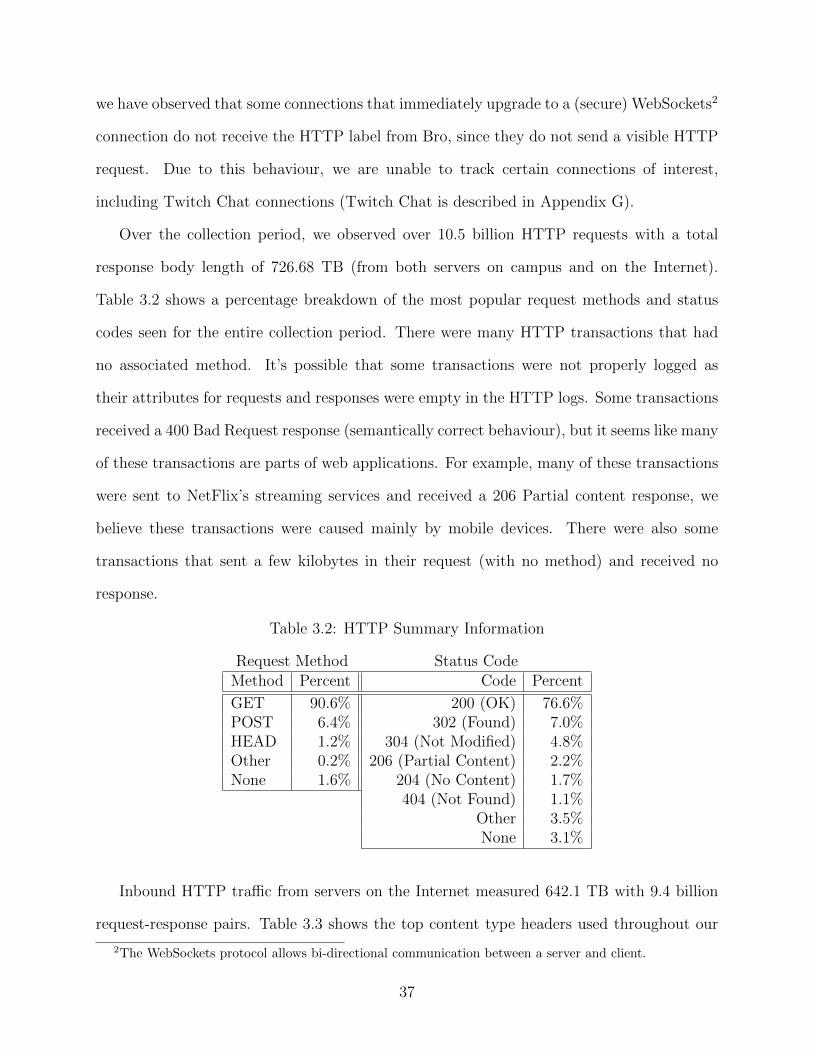
we have observed that some connections that immediately upgrade to a (secure) WebSockets2
connection do not receive the HTTP label from Bro, since they do not send a visible HTTP
request. Due to this behaviour, we are unable to track certain connections of interest,
including Twitch Chat connections (Twitch Chat is described in Appendix G).
Over the collection period, we observed over 10.5 billion HTTP requests with a total
response body length of 726.68 TB (from both servers on campus and on the Internet).
Table 3.2 shows a percentage breakdown of the most popular request methods and status
codes seen for the entire collection period. There were many HTTP transactions that had
no associated method. It’s possible that some transactions were not properly logged as
their attributes for requests and responses were empty in the HTTP logs. Some transactions
received a 400 Bad Request response (semantically correct behaviour), but it seems like many
of these transactions are parts of web applications. For example, many of these transactions
were sent to NetFlix’s streaming services and received a 206 Partial content response, we
believe these transactions were caused mainly by mobile devices. There were also some
transactions that sent a few kilobytes in their request (with no method) and received no
response.
Table 3.2: HTTP Summary Information
Request Method Status CodeMethod Percent Code Percent
GET 90.6% 200 (OK) 76.6%POST 6.4% 302 (Found) 7.0%HEAD 1.2% 304 (Not Modified) 4.8%Other 0.2% 206 (Partial Content) 2.2%None 1.6% 204 (No Content) 1.7%
404 (Not Found) 1.1%Other 3.5%None 3.1%
Inbound HTTP traffic from servers on the Internet measured 642.1 TB with 9.4 billion
request-response pairs. Table 3.3 shows the top content type headers used throughout our
2The WebSockets protocol allows bi-directional communication between a server and client.
37
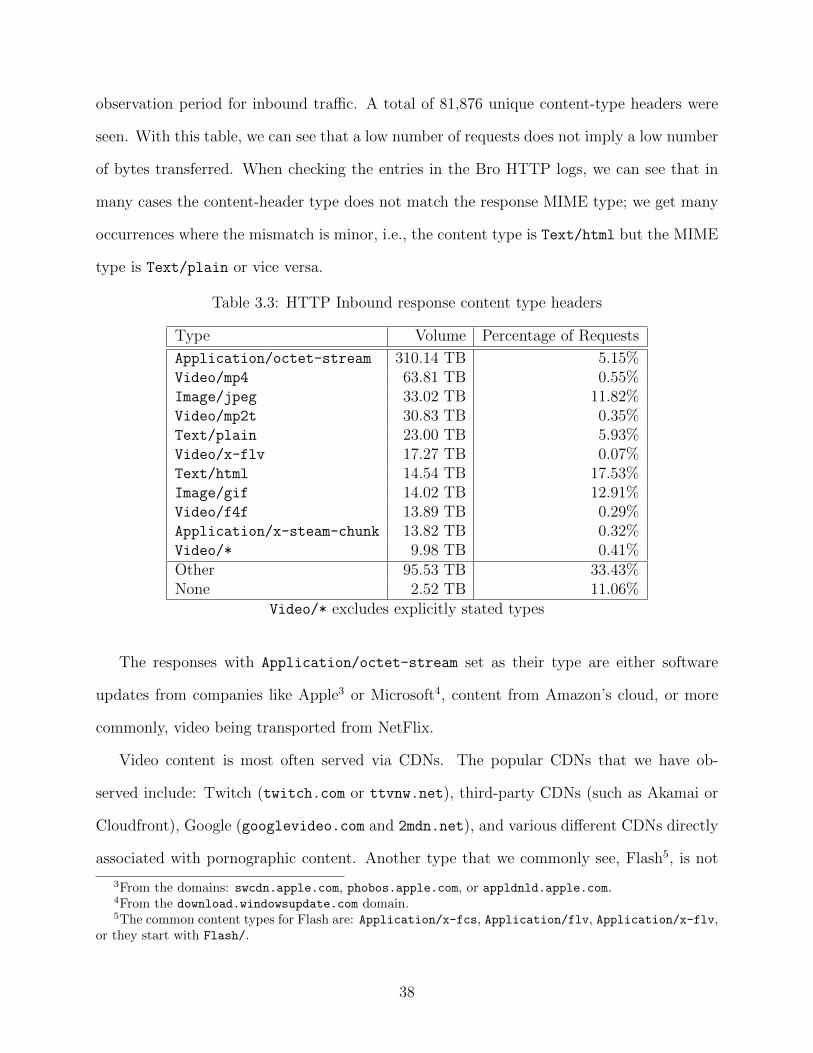
observation period for inbound traffic. A total of 81,876 unique content-type headers were
seen. With this table, we can see that a low number of requests does not imply a low number
of bytes transferred. When checking the entries in the Bro HTTP logs, we can see that in
many cases the content-header type does not match the response MIME type; we get many
occurrences where the mismatch is minor, i.e., the content type is Text/html but the MIME
type is Text/plain or vice versa.
Table 3.3: HTTP Inbound response content type headers
Type Volume Percentage of Requests
Application/octet-stream 310.14 TB 5.15%Video/mp4 63.81 TB 0.55%Image/jpeg 33.02 TB 11.82%Video/mp2t 30.83 TB 0.35%Text/plain 23.00 TB 5.93%Video/x-flv 17.27 TB 0.07%Text/html 14.54 TB 17.53%Image/gif 14.02 TB 12.91%Video/f4f 13.89 TB 0.29%Application/x-steam-chunk 13.82 TB 0.32%Video/* 9.98 TB 0.41%Other 95.53 TB 33.43%None 2.52 TB 11.06%
Video/* excludes explicitly stated types
The responses with Application/octet-stream set as their type are either software
updates from companies like Apple3 or Microsoft4, content from Amazon’s cloud, or more
commonly, video being transported from NetFlix.
Video content is most often served via CDNs. The popular CDNs that we have ob-
served include: Twitch (twitch.com or ttvnw.net), third-party CDNs (such as Akamai or
Cloudfront), Google (googlevideo.com and 2mdn.net), and various different CDNs directly
associated with pornographic content. Another type that we commonly see, Flash5, is not
3From the domains: swcdn.apple.com, phobos.apple.com, or appldnld.apple.com.4From the download.windowsupdate.com domain.5The common content types for Flash are: Application/x-fcs, Application/flv, Application/x-flv,
or they start with Flash/.
38
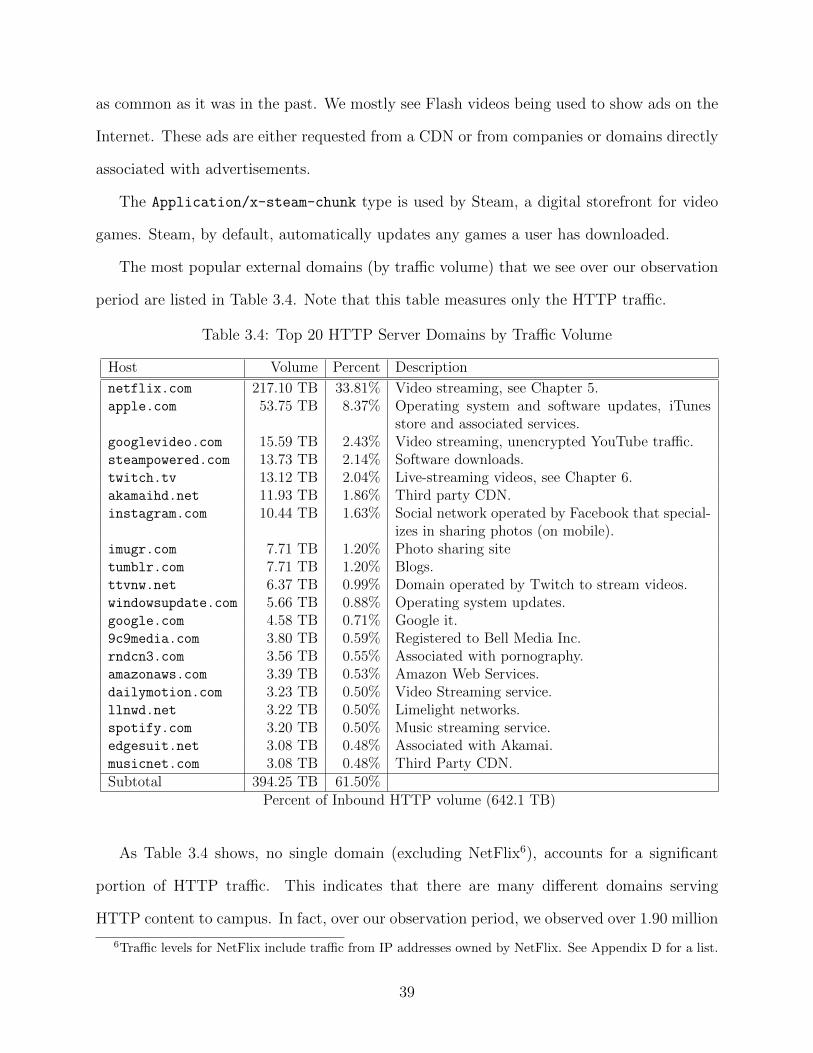
as common as it was in the past. We mostly see Flash videos being used to show ads on the
Internet. These ads are either requested from a CDN or from companies or domains directly
associated with advertisements.
The Application/x-steam-chunk type is used by Steam, a digital storefront for video
games. Steam, by default, automatically updates any games a user has downloaded.
The most popular external domains (by traffic volume) that we see over our observation
period are listed in Table 3.4. Note that this table measures only the HTTP traffic.
Table 3.4: Top 20 HTTP Server Domains by Traffic Volume
Host Volume Percent Description
netflix.com 217.10 TB 33.81% Video streaming, see Chapter 5.apple.com 53.75 TB 8.37% Operating system and software updates, iTunes
store and associated services.googlevideo.com 15.59 TB 2.43% Video streaming, unencrypted YouTube traffic.steampowered.com 13.73 TB 2.14% Software downloads.twitch.tv 13.12 TB 2.04% Live-streaming videos, see Chapter 6.akamaihd.net 11.93 TB 1.86% Third party CDN.instagram.com 10.44 TB 1.63% Social network operated by Facebook that special-
izes in sharing photos (on mobile).imugr.com 7.71 TB 1.20% Photo sharing sitetumblr.com 7.71 TB 1.20% Blogs.ttvnw.net 6.37 TB 0.99% Domain operated by Twitch to stream videos.windowsupdate.com 5.66 TB 0.88% Operating system updates.google.com 4.58 TB 0.71% Google it.9c9media.com 3.80 TB 0.59% Registered to Bell Media Inc.rndcn3.com 3.56 TB 0.55% Associated with pornography.amazonaws.com 3.39 TB 0.53% Amazon Web Services.dailymotion.com 3.23 TB 0.50% Video Streaming service.llnwd.net 3.22 TB 0.50% Limelight networks.spotify.com 3.20 TB 0.50% Music streaming service.edgesuit.net 3.08 TB 0.48% Associated with Akamai.musicnet.com 3.08 TB 0.48% Third Party CDN.Subtotal 394.25 TB 61.50%
Percent of Inbound HTTP volume (642.1 TB)
As Table 3.4 shows, no single domain (excluding NetFlix6), accounts for a significant
portion of HTTP traffic. This indicates that there are many different domains serving
HTTP content to campus. In fact, over our observation period, we observed over 1.90 million
6Traffic levels for NetFlix include traffic from IP addresses owned by NetFlix. See Appendix D for a list.
39
unique domains. In this domain count, we group domains to the highest level we can, i.e.,
image.google.com and plus.google.com are grouped into google.com, while google.ca
is excluded in this case.
HTTPS
Similar to the issue with tracking HTTP traffic, not all connections to port 443 are HTTPS,
since there may be scanning connections or other applications using the ports to bypass
firewalls. We may, however, use the SSL logs that Bro produces to identify HTTPS servers,
since the SSL log lists the server name associated with certificates that it sees. The downside
to this approach is that it becomes much harder to find out how much traffic was exchanged,
since there are many server names used and the SSL log does not list bytes exchanged in
connections.
By using the same grouping strategy as we did for HTTP domains, we can once again
aggregate sub-domains for popular services on the Web. When doing this, we can easily find
how often a server is contacted. We have counted 3.97 billion connections from over 5.59
million different domains in the SSL logs. The most popular external SSL servers are listed
in Table 3.5. Note that we chose to order by connections instead of volume since Bro’s SSL
logs, which list server names, do not list bytes transferred.
A strange entry in our SSL logs was majuwe.com, a domain associated with ad-ware.
We found that a single local machine was responsible for almost all the connections to the
domain. This domain is being hosted on a third-party CDN, so looking for more information,
such as the owner, based on an IP address does not result in more information. It also means
that attempting to block the domain at a network level does not work, since the CDN will
use another IP address for connections.
There was also a significant number of servers, with over 626 million connections (15.8%),
that had an empty name in the SSL log. We are able to uniquely identify these servers with
their IP addresses. We counted over 208,000 external devices that do not have a name in the
40
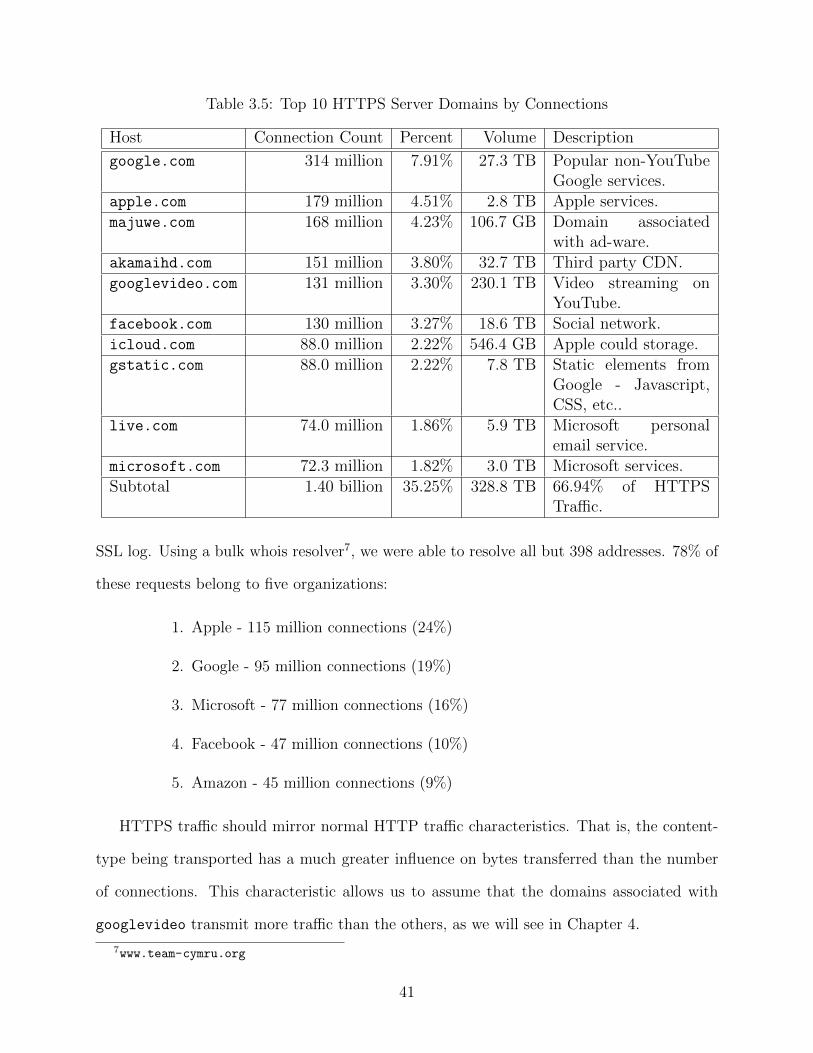
Table 3.5: Top 10 HTTPS Server Domains by Connections
Host Connection Count Percent Volume Description
google.com 314 million 7.91% 27.3 TB Popular non-YouTubeGoogle services.
apple.com 179 million 4.51% 2.8 TB Apple services.majuwe.com 168 million 4.23% 106.7 GB Domain associated
with ad-ware.akamaihd.com 151 million 3.80% 32.7 TB Third party CDN.googlevideo.com 131 million 3.30% 230.1 TB Video streaming on
YouTube.facebook.com 130 million 3.27% 18.6 TB Social network.icloud.com 88.0 million 2.22% 546.4 GB Apple could storage.gstatic.com 88.0 million 2.22% 7.8 TB Static elements from
Google - Javascript,CSS, etc..
live.com 74.0 million 1.86% 5.9 TB Microsoft personalemail service.
microsoft.com 72.3 million 1.82% 3.0 TB Microsoft services.Subtotal 1.40 billion 35.25% 328.8 TB 66.94% of HTTPS
Traffic.
SSL log. Using a bulk whois resolver7, we were able to resolve all but 398 addresses. 78% of
these requests belong to five organizations:
1. Apple - 115 million connections (24%)
2. Google - 95 million connections (19%)
3. Microsoft - 77 million connections (16%)
4. Facebook - 47 million connections (10%)
5. Amazon - 45 million connections (9%)
HTTPS traffic should mirror normal HTTP traffic characteristics. That is, the content-
type being transported has a much greater influence on bytes transferred than the number
of connections. This characteristic allows us to assume that the domains associated with
googlevideo transmit more traffic than the others, as we will see in Chapter 4.
7www.team-cymru.org
41
3.5 Summary
In this chapter, we described our monitoring capabilities and the tools used to gather data.
We summarized our collection period and interruptions encountered during this period. Fi-
nally, we provided a basic overview of traffic characteristics observed during this period.
In the next chapter, we will go into greater detail about video traffic levels and charac-
teristics seen during our five-month collection period.
42
Chapter 4
Video Traffic Analysis
In this chapter, we investigate inbound video traffic. As stated previously in Chapter 3, the
three most common content-type headers used to transport video are Video, Flash, and
Application/octet-stream. Together, these three types accounted for 432.9 TB (67.42%)
of inbound HTTP traffic. In Section 4.1, we characterize the different content types and
external domains observed serving video over HTTP. Section 4.2 shows the characteristics
of Flash content. Octet-stream content is summarized in Section 4.3. Finally, in Section 4.4,
we show how the traffic volumes from two popular HTTP providers, NetFlix and Twitch, as
well as YouTube (including HTTPS), compare to the overall inbound HTTP and HTTPS
traffic.
We occasionally see some other content types used to transport video content, such as
Application/x-silverlight-app, or Application/vnd.apple.mpegurl. The Silverlight
plugin from Microsoft was used before HTML5 to stream media that needed DRM protection.
Over the collection period, we have observed that only 29 GB (< 0.01% of inbound HTTP)
of data had the silverlight-app content-type. The apple.mpegurl content type is used in
Apple’s HLS service (that we see in use by Twitch); we have seen 191 GB (0.03% of inbound
HTTP) of this type of content sent over our collection period. Since the volumes for these
other types of content are low, we will not focus on analyzing this type of traffic.
4.1 Video Content
In this section, we investigate the inbound HTTP traffic that had a ‘Video’ type content
header. We counted over 123 million request-response pairs for HTTP video content respon-
sible for 104.0 TB (16.20%) of inbound HTTP traffic (6.85% of total inbound traffic). This
43
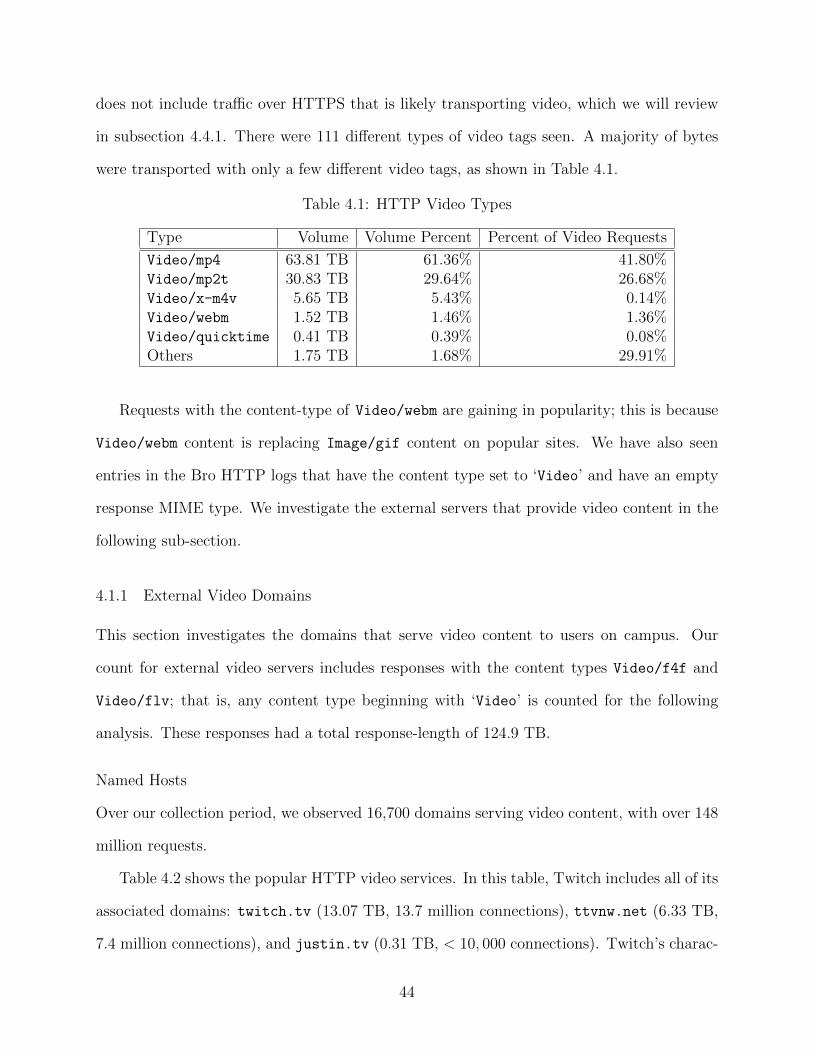
does not include traffic over HTTPS that is likely transporting video, which we will review
in subsection 4.4.1. There were 111 different types of video tags seen. A majority of bytes
were transported with only a few different video tags, as shown in Table 4.1.
Table 4.1: HTTP Video Types
Type Volume Volume Percent Percent of Video Requests
Video/mp4 63.81 TB 61.36% 41.80%Video/mp2t 30.83 TB 29.64% 26.68%Video/x-m4v 5.65 TB 5.43% 0.14%Video/webm 1.52 TB 1.46% 1.36%Video/quicktime 0.41 TB 0.39% 0.08%Others 1.75 TB 1.68% 29.91%
Requests with the content-type of Video/webm are gaining in popularity; this is because
Video/webm content is replacing Image/gif content on popular sites. We have also seen
entries in the Bro HTTP logs that have the content type set to ‘Video’ and have an empty
response MIME type. We investigate the external servers that provide video content in the
following sub-section.
4.1.1 External Video Domains
This section investigates the domains that serve video content to users on campus. Our
count for external video servers includes responses with the content types Video/f4f and
Video/flv; that is, any content type beginning with ‘Video’ is counted for the following
analysis. These responses had a total response-length of 124.9 TB.
Named Hosts
Over our collection period, we observed 16,700 domains serving video content, with over 148
million requests.
Table 4.2 shows the popular HTTP video services. In this table, Twitch includes all of its
associated domains: twitch.tv (13.07 TB, 13.7 million connections), ttvnw.net (6.33 TB,
7.4 million connections), and justin.tv (0.31 TB, < 10, 000 connections). Twitch’s charac-
44
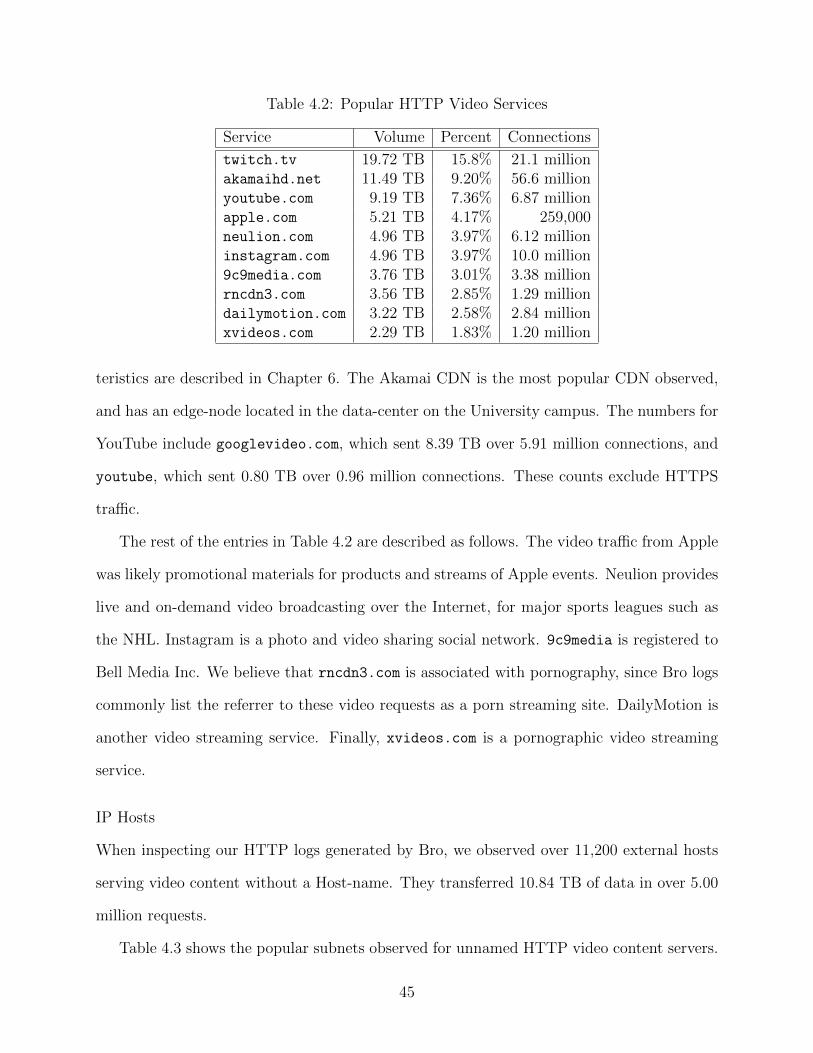
Table 4.2: Popular HTTP Video Services
Service Volume Percent Connections
twitch.tv 19.72 TB 15.8% 21.1 millionakamaihd.net 11.49 TB 9.20% 56.6 millionyoutube.com 9.19 TB 7.36% 6.87 millionapple.com 5.21 TB 4.17% 259,000neulion.com 4.96 TB 3.97% 6.12 millioninstagram.com 4.96 TB 3.97% 10.0 million9c9media.com 3.76 TB 3.01% 3.38 millionrncdn3.com 3.56 TB 2.85% 1.29 milliondailymotion.com 3.22 TB 2.58% 2.84 millionxvideos.com 2.29 TB 1.83% 1.20 million
teristics are described in Chapter 6. The Akamai CDN is the most popular CDN observed,
and has an edge-node located in the data-center on the University campus. The numbers for
YouTube include googlevideo.com, which sent 8.39 TB over 5.91 million connections, and
youtube, which sent 0.80 TB over 0.96 million connections. These counts exclude HTTPS
traffic.
The rest of the entries in Table 4.2 are described as follows. The video traffic from Apple
was likely promotional materials for products and streams of Apple events. Neulion provides
live and on-demand video broadcasting over the Internet, for major sports leagues such as
the NHL. Instagram is a photo and video sharing social network. 9c9media is registered to
Bell Media Inc. We believe that rncdn3.com is associated with pornography, since Bro logs
commonly list the referrer to these video requests as a porn streaming site. DailyMotion is
another video streaming service. Finally, xvideos.com is a pornographic video streaming
service.
IP Hosts
When inspecting our HTTP logs generated by Bro, we observed over 11,200 external hosts
serving video content without a Host-name. They transferred 10.84 TB of data in over 5.00
million requests.
Table 4.3 shows the popular subnets observed for unnamed HTTP video content servers.
45
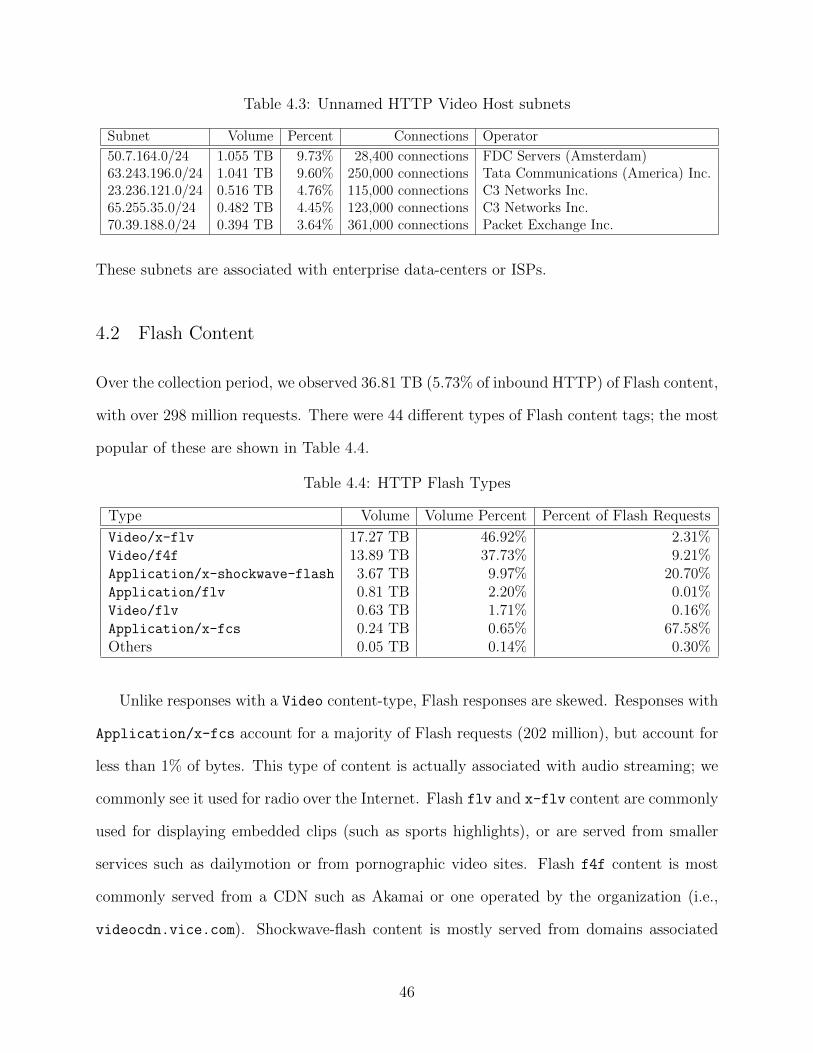
Table 4.3: Unnamed HTTP Video Host subnets
Subnet Volume Percent Connections Operator
50.7.164.0/24 1.055 TB 9.73% 28,400 connections FDC Servers (Amsterdam)63.243.196.0/24 1.041 TB 9.60% 250,000 connections Tata Communications (America) Inc.23.236.121.0/24 0.516 TB 4.76% 115,000 connections C3 Networks Inc.65.255.35.0/24 0.482 TB 4.45% 123,000 connections C3 Networks Inc.70.39.188.0/24 0.394 TB 3.64% 361,000 connections Packet Exchange Inc.
These subnets are associated with enterprise data-centers or ISPs.
4.2 Flash Content
Over the collection period, we observed 36.81 TB (5.73% of inbound HTTP) of Flash content,
with over 298 million requests. There were 44 different types of Flash content tags; the most
popular of these are shown in Table 4.4.
Table 4.4: HTTP Flash Types
Type Volume Volume Percent Percent of Flash Requests
Video/x-flv 17.27 TB 46.92% 2.31%Video/f4f 13.89 TB 37.73% 9.21%Application/x-shockwave-flash 3.67 TB 9.97% 20.70%Application/flv 0.81 TB 2.20% 0.01%Video/flv 0.63 TB 1.71% 0.16%Application/x-fcs 0.24 TB 0.65% 67.58%Others 0.05 TB 0.14% 0.30%
Unlike responses with a Video content-type, Flash responses are skewed. Responses with
Application/x-fcs account for a majority of Flash requests (202 million), but account for
less than 1% of bytes. This type of content is actually associated with audio streaming; we
commonly see it used for radio over the Internet. Flash flv and x-flv content are commonly
used for displaying embedded clips (such as sports highlights), or are served from smaller
services such as dailymotion or from pornographic video sites. Flash f4f content is most
commonly served from a CDN such as Akamai or one operated by the organization (i.e.,
videocdn.vice.com). Shockwave-flash content is mostly served from domains associated
46
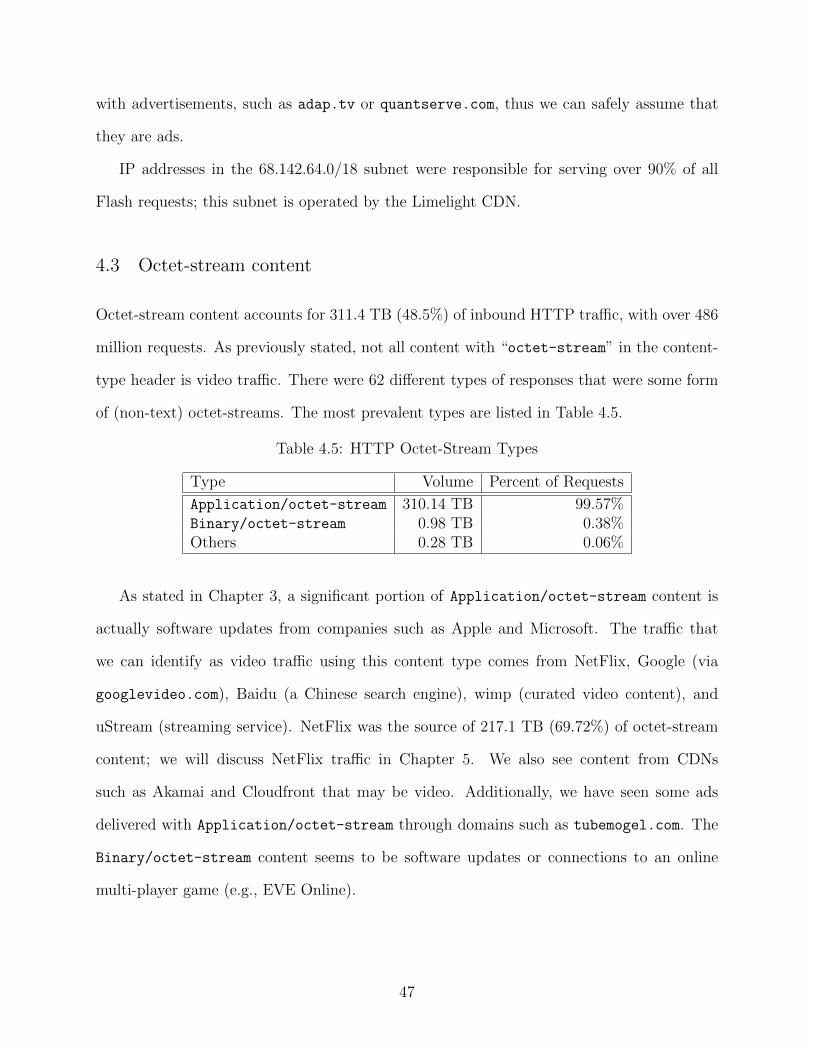
with advertisements, such as adap.tv or quantserve.com, thus we can safely assume that
they are ads.
IP addresses in the 68.142.64.0/18 subnet were responsible for serving over 90% of all
Flash requests; this subnet is operated by the Limelight CDN.
4.3 Octet-stream content
Octet-stream content accounts for 311.4 TB (48.5%) of inbound HTTP traffic, with over 486
million requests. As previously stated, not all content with “octet-stream” in the content-
type header is video traffic. There were 62 different types of responses that were some form
of (non-text) octet-streams. The most prevalent types are listed in Table 4.5.
Table 4.5: HTTP Octet-Stream Types
Type Volume Percent of Requests
Application/octet-stream 310.14 TB 99.57%Binary/octet-stream 0.98 TB 0.38%Others 0.28 TB 0.06%
As stated in Chapter 3, a significant portion of Application/octet-stream content is
actually software updates from companies such as Apple and Microsoft. The traffic that
we can identify as video traffic using this content type comes from NetFlix, Google (via
googlevideo.com), Baidu (a Chinese search engine), wimp (curated video content), and
uStream (streaming service). NetFlix was the source of 217.1 TB (69.72%) of octet-stream
content; we will discuss NetFlix traffic in Chapter 5. We also see content from CDNs
such as Akamai and Cloudfront that may be video. Additionally, we have seen some ads
delivered with Application/octet-stream through domains such as tubemogel.com. The
Binary/octet-stream content seems to be software updates or connections to an online
multi-player game (e.g., EVE Online).
47
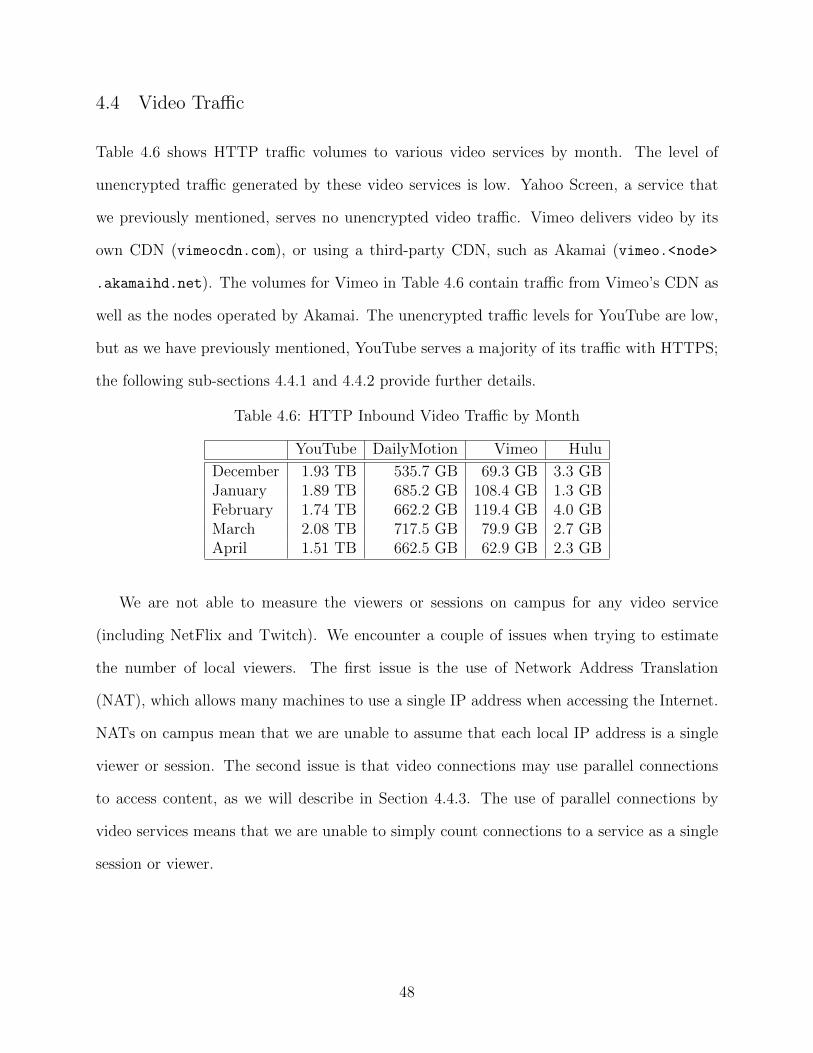
4.4 Video Traffic
Table 4.6 shows HTTP traffic volumes to various video services by month. The level of
unencrypted traffic generated by these video services is low. Yahoo Screen, a service that
we previously mentioned, serves no unencrypted video traffic. Vimeo delivers video by its
own CDN (vimeocdn.com), or using a third-party CDN, such as Akamai (vimeo.<node>
.akamaihd.net). The volumes for Vimeo in Table 4.6 contain traffic from Vimeo’s CDN as
well as the nodes operated by Akamai. The unencrypted traffic levels for YouTube are low,
but as we have previously mentioned, YouTube serves a majority of its traffic with HTTPS;
the following sub-sections 4.4.1 and 4.4.2 provide further details.
Table 4.6: HTTP Inbound Video Traffic by Month
YouTube DailyMotion Vimeo Hulu
December 1.93 TB 535.7 GB 69.3 GB 3.3 GBJanuary 1.89 TB 685.2 GB 108.4 GB 1.3 GBFebruary 1.74 TB 662.2 GB 119.4 GB 4.0 GBMarch 2.08 TB 717.5 GB 79.9 GB 2.7 GBApril 1.51 TB 662.5 GB 62.9 GB 2.3 GB
We are not able to measure the viewers or sessions on campus for any video service
(including NetFlix and Twitch). We encounter a couple of issues when trying to estimate
the number of local viewers. The first issue is the use of Network Address Translation
(NAT), which allows many machines to use a single IP address when accessing the Internet.
NATs on campus mean that we are unable to assume that each local IP address is a single
viewer or session. The second issue is that video connections may use parallel connections
to access content, as we will describe in Section 4.4.3. The use of parallel connections by
video services means that we are unable to simply count connections to a service as a single
session or viewer.
48
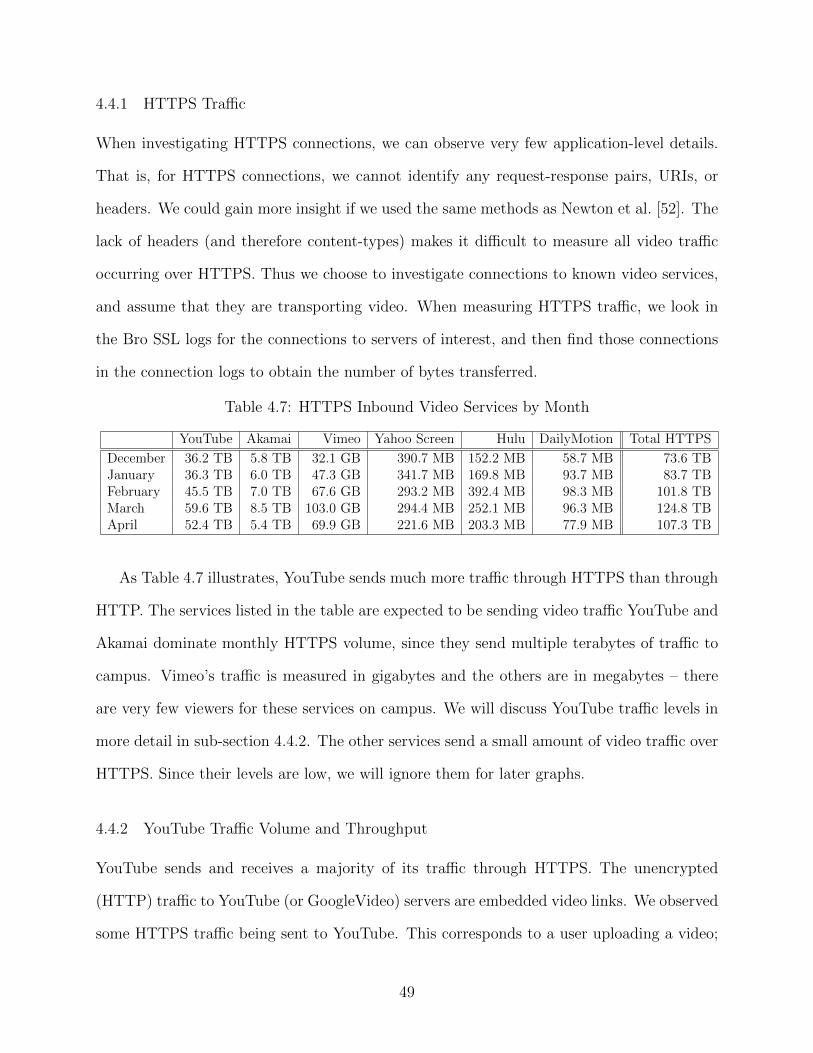
4.4.1 HTTPS Traffic
When investigating HTTPS connections, we can observe very few application-level details.
That is, for HTTPS connections, we cannot identify any request-response pairs, URIs, or
headers. We could gain more insight if we used the same methods as Newton et al. [52]. The
lack of headers (and therefore content-types) makes it difficult to measure all video traffic
occurring over HTTPS. Thus we choose to investigate connections to known video services,
and assume that they are transporting video. When measuring HTTPS traffic, we look in
the Bro SSL logs for the connections to servers of interest, and then find those connections
in the connection logs to obtain the number of bytes transferred.
Table 4.7: HTTPS Inbound Video Services by Month
YouTube Akamai Vimeo Yahoo Screen Hulu DailyMotion Total HTTPS
December 36.2 TB 5.8 TB 32.1 GB 390.7 MB 152.2 MB 58.7 MB 73.6 TBJanuary 36.3 TB 6.0 TB 47.3 GB 341.7 MB 169.8 MB 93.7 MB 83.7 TBFebruary 45.5 TB 7.0 TB 67.6 GB 293.2 MB 392.4 MB 98.3 MB 101.8 TBMarch 59.6 TB 8.5 TB 103.0 GB 294.4 MB 252.1 MB 96.3 MB 124.8 TBApril 52.4 TB 5.4 TB 69.9 GB 221.6 MB 203.3 MB 77.9 MB 107.3 TB
As Table 4.7 illustrates, YouTube sends much more traffic through HTTPS than through
HTTP. The services listed in the table are expected to be sending video traffic YouTube and
Akamai dominate monthly HTTPS volume, since they send multiple terabytes of traffic to
campus. Vimeo’s traffic is measured in gigabytes and the others are in megabytes – there
are very few viewers for these services on campus. We will discuss YouTube traffic levels in
more detail in sub-section 4.4.2. The other services send a small amount of video traffic over
HTTPS. Since their levels are low, we will ignore them for later graphs.
4.4.2 YouTube Traffic Volume and Throughput
YouTube sends and receives a majority of its traffic through HTTPS. The unencrypted
(HTTP) traffic to YouTube (or GoogleVideo) servers are embedded video links. We observed
some HTTPS traffic being sent to YouTube. This corresponds to a user uploading a video;
49
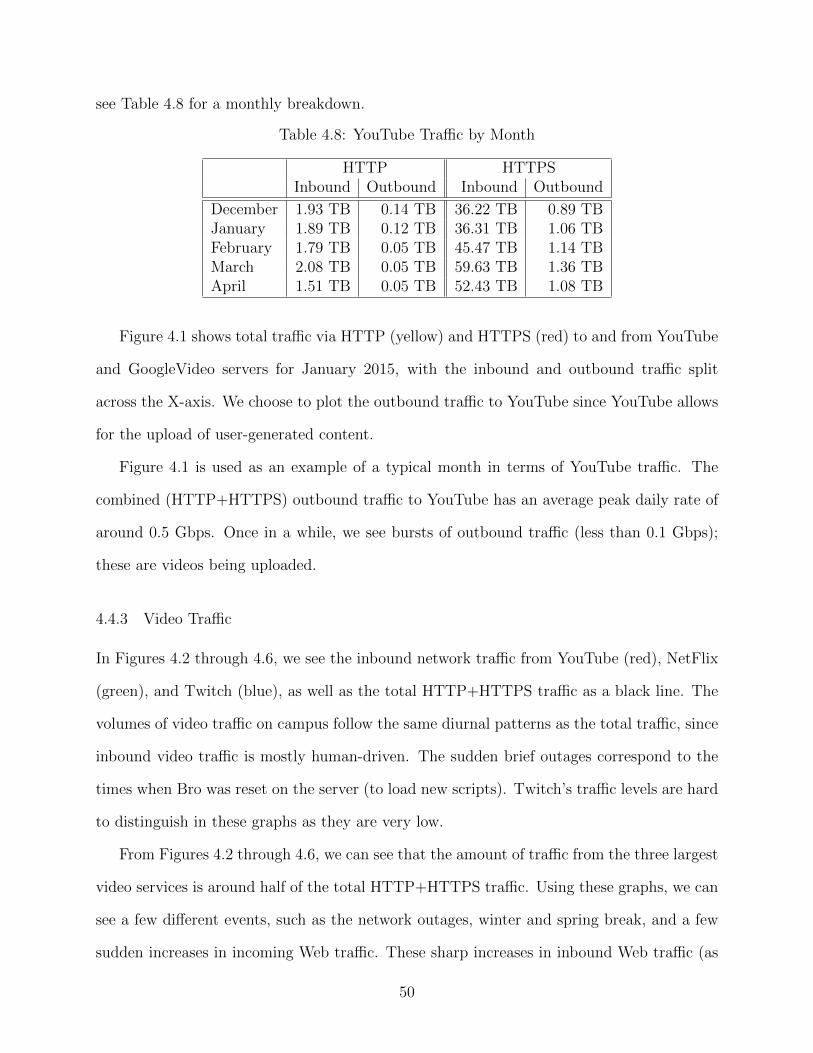
see Table 4.8 for a monthly breakdown.
Table 4.8: YouTube Traffic by Month
HTTP HTTPSInbound Outbound Inbound Outbound
December 1.93 TB 0.14 TB 36.22 TB 0.89 TBJanuary 1.89 TB 0.12 TB 36.31 TB 1.06 TBFebruary 1.79 TB 0.05 TB 45.47 TB 1.14 TBMarch 2.08 TB 0.05 TB 59.63 TB 1.36 TBApril 1.51 TB 0.05 TB 52.43 TB 1.08 TB
Figure 4.1 shows total traffic via HTTP (yellow) and HTTPS (red) to and from YouTube
and GoogleVideo servers for January 2015, with the inbound and outbound traffic split
across the X-axis. We choose to plot the outbound traffic to YouTube since YouTube allows
for the upload of user-generated content.
Figure 4.1 is used as an example of a typical month in terms of YouTube traffic. The
combined (HTTP+HTTPS) outbound traffic to YouTube has an average peak daily rate of
around 0.5 Gbps. Once in a while, we see bursts of outbound traffic (less than 0.1 Gbps);
these are videos being uploaded.
4.4.3 Video Traffic
In Figures 4.2 through 4.6, we see the inbound network traffic from YouTube (red), NetFlix
(green), and Twitch (blue), as well as the total HTTP+HTTPS traffic as a black line. The
volumes of video traffic on campus follow the same diurnal patterns as the total traffic, since
inbound video traffic is mostly human-driven. The sudden brief outages correspond to the
times when Bro was reset on the server (to load new scripts). Twitch’s traffic levels are hard
to distinguish in these graphs as they are very low.
From Figures 4.2 through 4.6, we can see that the amount of traffic from the three largest
video services is around half of the total HTTP+HTTPS traffic. Using these graphs, we can
see a few different events, such as the network outages, winter and spring break, and a few
sudden increases in incoming Web traffic. These sharp increases in inbound Web traffic (as
50
seen on February 11, 2015 in Figure 4.4) correspond to traffic from windowsupdate.com;
i.e., security patches downloaded to Windows machines on campus.
Over our collection period, we observed 40.3 million connections that were involved with
the transport of video content. That is, a response to a request in the connection had
the content type set to “Video/*”; this excludes connections that transported “Flash/*”
and “Application/octet-stream” content. When inspecting these video connections, we
find that the average connection duration is 51.3 seconds, and the median value was 7
seconds. Figure 4.7a shows the cumulative distribution function (CDF) for durations for
these connections. The Y-axis of a CDF graph shows probability and the X-axis shows
what is being measured; in this case duration. There are two sharp increases in connection
duration, one occurring at 1 second and the other at 30 seconds. We do not know the cause
of the first increase; the connections each contact different hosts and request different video-
types. The second increase may be associated with connections transporting ads, since 30
seconds is a common duration for ads (the same as TV).
Figure 4.7b shows the CDF for video connection sizes (in bytes) during the five-month ob-
servation period. In this case, we measure both inbound and outbound bytes per connection.
The median inbound byte value is 484.25 KB, while outbound is 9.49 KB.
The characteristics of video connections appear strange at first glance, since they transmit
little data and are very short. We believe that this behaviour is caused by DASH. The client
may open a connection, or parallel connections, to request segments of the video, and then
close the connection(s) when the client’s buffer is full. This behavior would lead to a client
using many small connections to stream a video, and this seems to be the behaviour we
consistently observe in modern video streaming services.
51
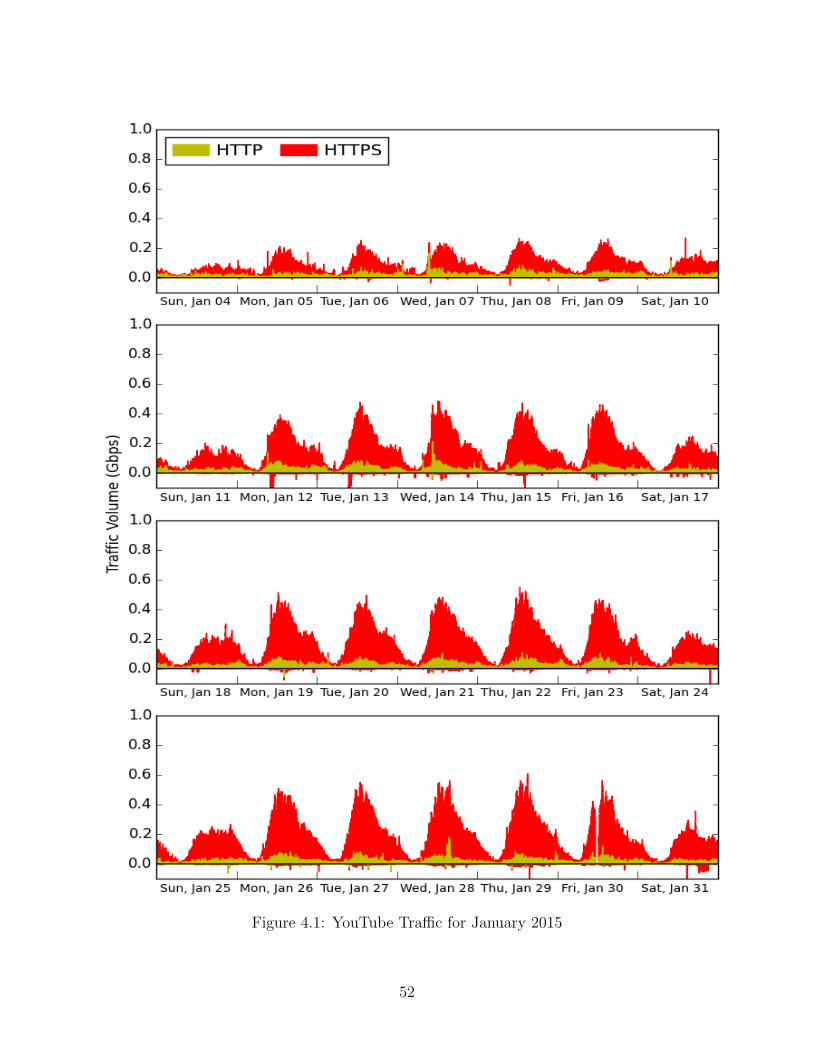
Figure 4.1: YouTube Traffic for January 2015
52
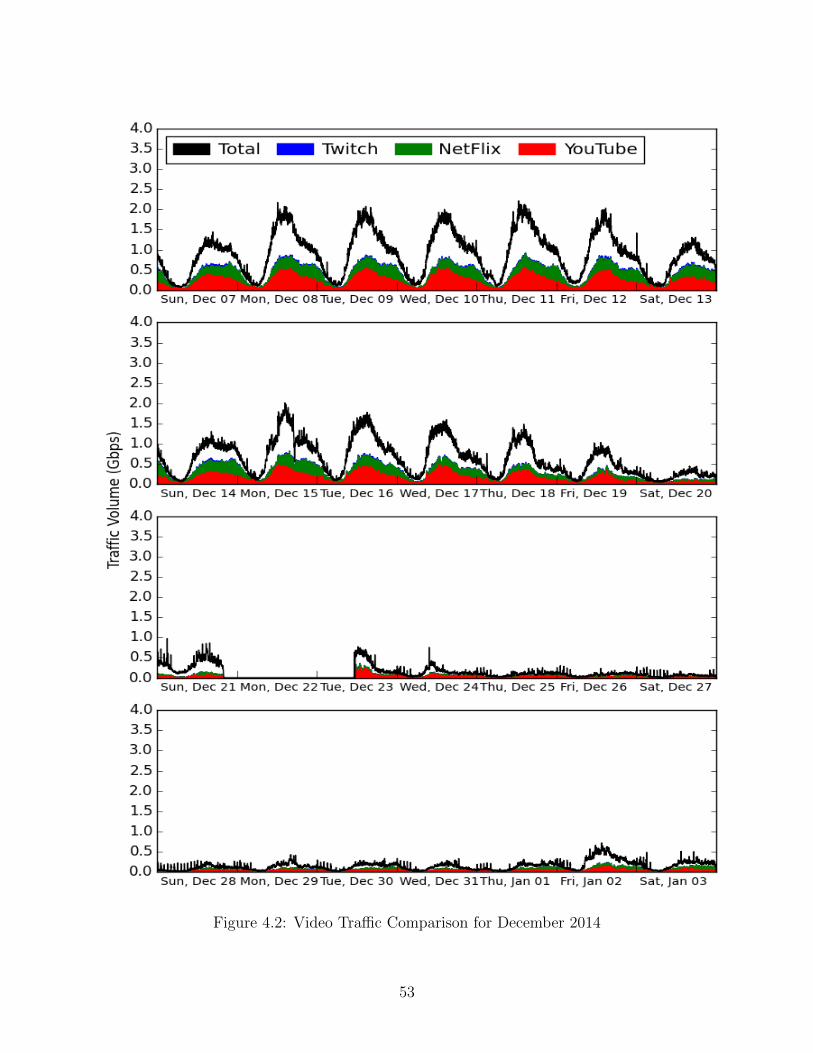
Figure 4.2: Video Traffic Comparison for December 2014
53
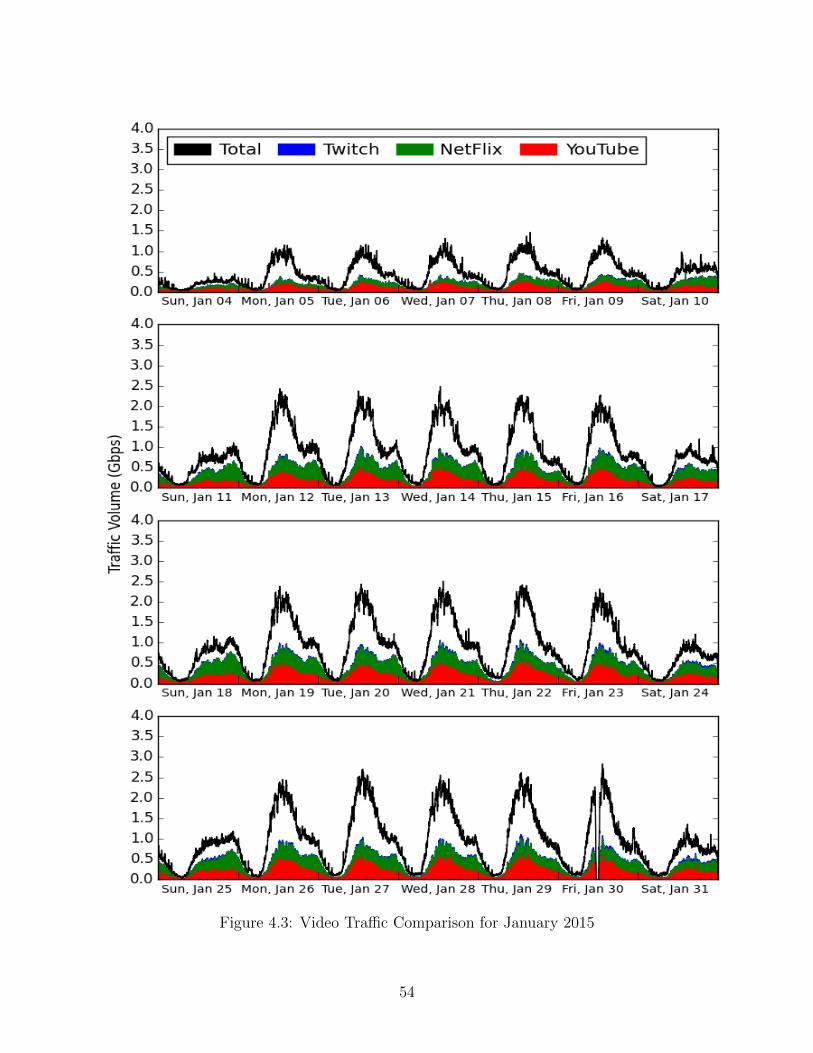
Figure 4.3: Video Traffic Comparison for January 2015
54
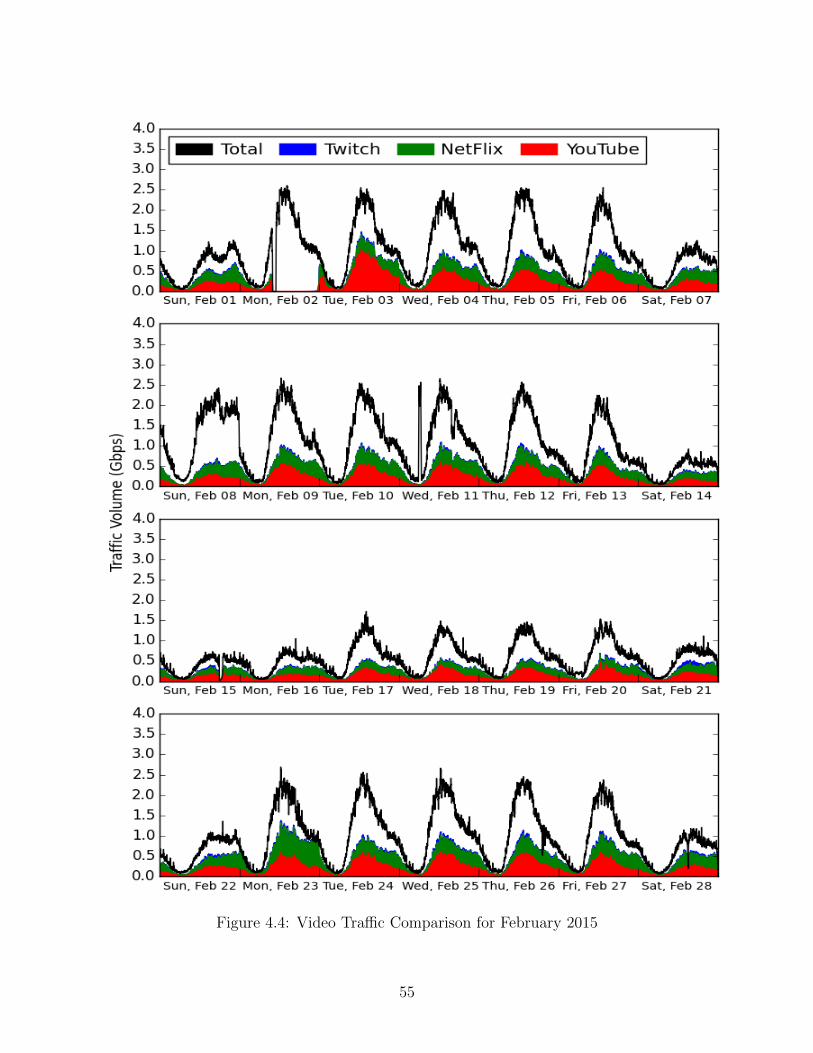
Figure 4.4: Video Traffic Comparison for February 2015
55
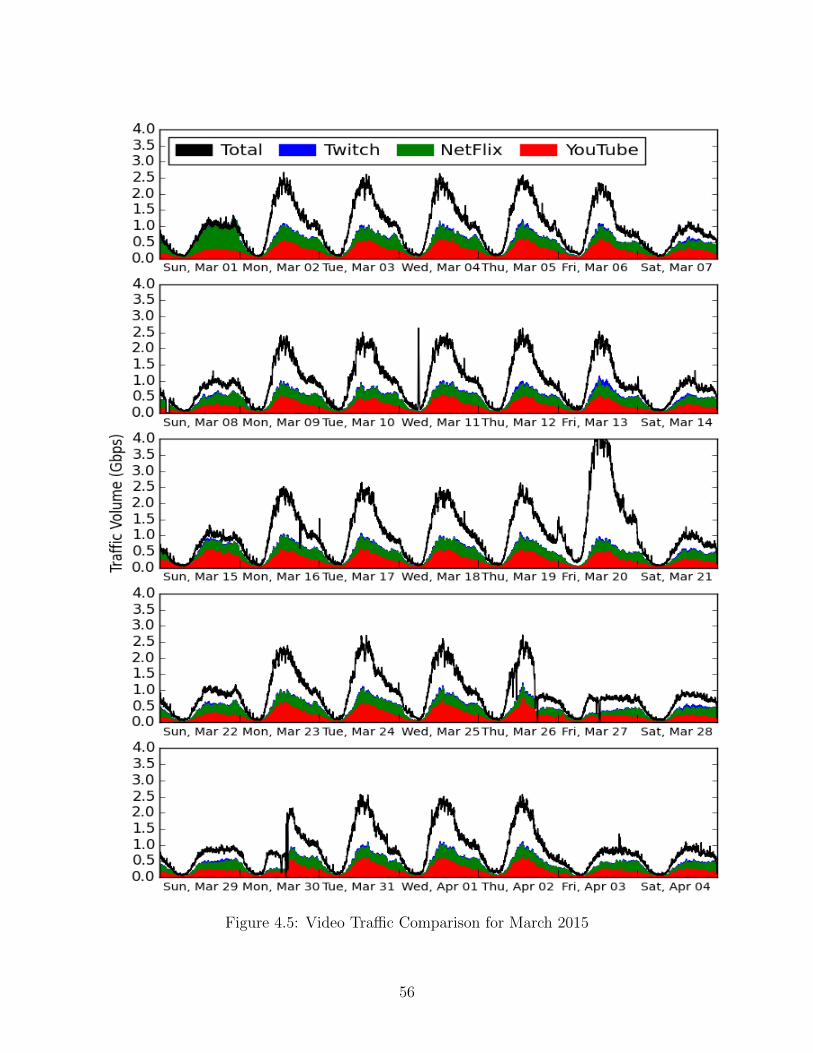
Figure 4.5: Video Traffic Comparison for March 2015
56
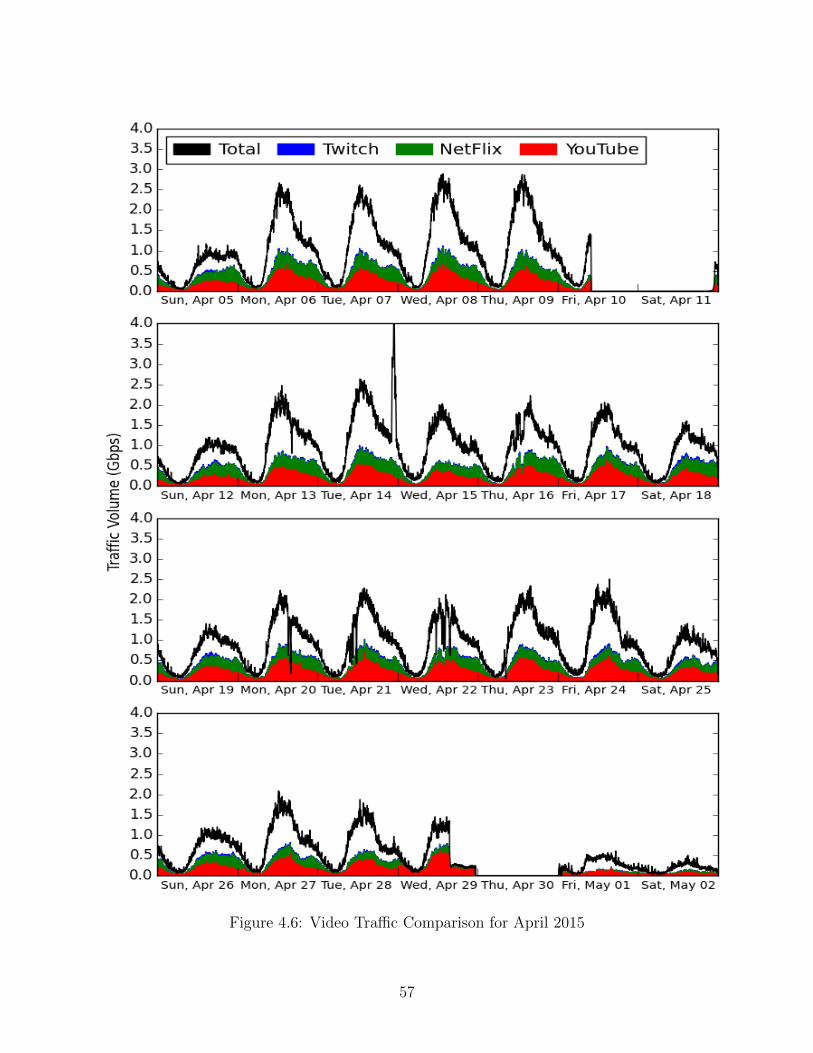
Figure 4.6: Video Traffic Comparison for April 2015
57
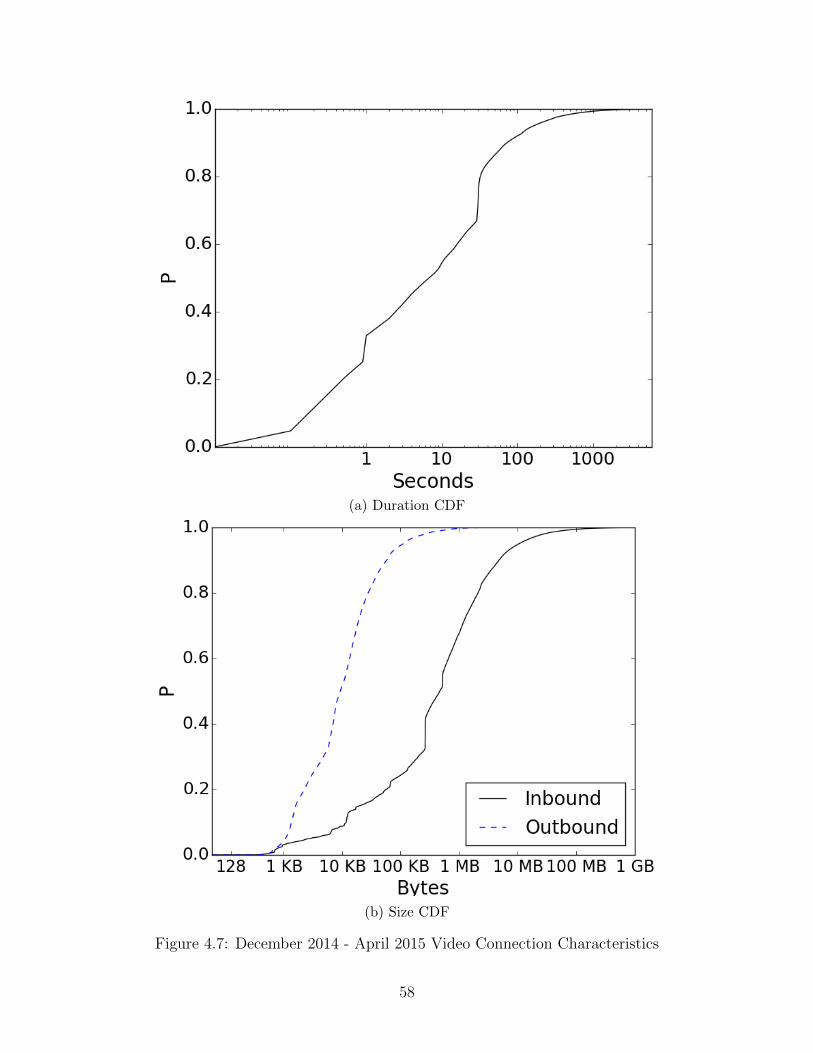
(a) Duration CDF
(b) Size CDF
Figure 4.7: December 2014 - April 2015 Video Connection Characteristics
58
4.5 Summary
In this chapter, we examined the visible video traffic levels on the University of Calgary’s
network. We determined the most popular types of video content, as well as the domains
from which they originate. We investigated the levels of other content-types, such as Flash
and Octet-streams. We find that most modern video services use a combination of their
own servers as well as content distribution networks to provide content. We also gave a
brief overview of YouTube traffic levels. Finally, we discuss general video traffic levels for
the observation period, as well as characteristics for video connections. However, we are not
able to measure the number of local viewers or sessions to video services.
In the next chapter, we examine the characteristics of NetFlix traffic during our obser-
vation period.
59

Chapter 5
NetFlix Analysis
NetFlix is a subscription-based video streaming service that is heavily used on campus1.
Originally, NetFlix required the use of Microsoft’s Silverlight plugin to stream content, but
in October 2014 they switched to streaming HTML5 video over HTTP connections.
5.1 Desktop and Mobile Requests
Requests sent from a desktop Web interface to NetFlix differ from requests sent from mobile
devices2. Mobile devices include Android phones and tablets as well as the Apple iPhones
and iPads.
The requests from the different devices result in different request URLs. For instance,
requests for (video) content from the NetFlix Web interface from a desktop look like:
http://<IP>/range/?o=<o>...
while requests from a mobile device’s NetFlix App look like:
http://<IP>/?o=<o>
The ‘range’ section of a desktop request indicates a byte-range [68], as a workaround
from the Silverlight implementation. These requests are made with the GET method and
the response has a content type header of Application/octet-stream.
We observed 306 million requests to NetFlix. About 40% of all requests for NetFlix
content over HTTP are made by mobile devices.
1Additional details about NetFlix can be found in the appendices. We describe the interface in Ap-pendix C, associated IPs in Appendix D, and changes made to the request paths in Appendix E.
2We also assume that gaming console devices such as Playstation or Xbox make mobile requests.
60
The final important difference between mobile device usage and desktop usage of NetFlix
is the collection of the referrer URI. In the case of a request for content by a desktop, the
referrer URI is the request to http://www.netflix.com/WiPlayer?.... When a mobile de-
vice makes a request for content, the referrer is empty. Having the requests to the /WiPlayer
path provides additional information. For example, these requests contain a parameter called
the movieid, which we examine next.
5.2 Movie IDs
NetFlix uses a query string parameter named movieid to deliver content to the user. The
movieid is a number that is sent with the requests to /WiPlayer (as part of a GET request).
Each piece of content, movie, TV-show, or trailer has a unique movieid number. When
sending a request to /WiPlayer, other parameters that are sent include trkid and tctx;
these are probably used for user tracking. The response for this request has a content-type
of Text/html. The movie content is requested by the player that loads from this page as
described in the previous section.
When a TV series is chosen from the NetFlix menu, a general-purpose movieid is used.
We will refer to this as IDm (ID-main). This ID differs from episode-specific content, which
we refer to as IDe (ID-episode). A movie or trailer’s movieid is IDm, that is to say movies
and trailers do not have any IDe.
For a TV show, there seems to be no relationship between its IDm and any of its IDe
values. For example, for the TV show Breaking Bad, the following IDs were observed:
• IDm : 70143836
• IDe Season 1 Episode 1 : 70196252
• IDe Season 1 Episode 2 : 70196253
In the case of Breaking Bad, IDm << IDe, and IDe numbers were allocated in sequential
61
blocks. For the case of Breaking Bad, when many seasons were uploaded at once, all the
IDe numbers are sequential, so episode 7 of season 1 (the last episode of season 1) has an
IDe of 70196258 and episode 1 of season 2 has an IDe of 70192659. However, sequential
numbers between seasons of a TV series are not guaranteed. In cases where NetFlix releases
one season of a show at a time, the numbers between episodes can have gaps. For example,
in House of Cards, season 1 episode 13 has an IDe of 70248301, and season 2 episode 1 has
an IDe of 70293579. We have also seen cases where numbers in a single season do not behave
sequentially.
If NetFlix auto-plays the next episode of a TV show, or if the user selects an episode to
play from the episode list in the Web interface’s player, the IDe is added in the fragment
section of the URI, i.e.,
http://www.netflix.com/WiPlayer?movieid=<id1>...#episodeid=<id2>
URI fragments are not transmitted over the network [7]. Instead, the video player reads
the fragment and makes a request for that ID. IDe numbers are not as common as IDm
numbers at a network level. We also are able to see movieid numbers for content that is not
available in Canada; this is an indication that a user is using a third-party plugin (like Hola
unblocker) to get around the geo-restrictions imposed by NetFlix.
5.3 Monthly Breakdown
5.3.1 Response Breakdown
We observed over 305 million request-response pairs for NetFlix on 14.3 million connections
during our five-month collection period. Over 62.9% of responses had a code of 200 (OK),
29.9% had 206 (Partial Content), 0.87% had 202 (Accepted), 6.09% had no code, and all
other response codes have < 0.1% of responses each. Out of the 305 million request-response
pairs, 195 million pairs (63.9%) were for desktop video content (including notebooks), and
62
102 million (33.4%) were for mobile video content, and the remaining 8 million were for other
non-video content, such as HTML, Javascript, images, etc.
Over the collection period, we observed 217.1 TB of traffic from NetFlix, 30% of inbound
HTTP traffic or 8% of total traffic. The total volume of mobile (video) content was 54.01
TB, while desktop (video) content used 162.6 TB. Unsurprisingly, on desktop or mobile,
no data was uploaded to NetFlix as part of requests for content. We observed over 15.1
million connections to NetFlix over HTTPS. These connections are mainly responsible for
user authentication, payment, and access to the help-center. User ratings and reviews for
content are sent over HTTP, through GET and POST requests, respectively. Over 357.4 GB
of traffic was sent and 256.0 GB of traffic was received from HTTPS NetFlix servers over
the collection period.
During the five-month collection period, we observed 35 different content-type headers
on responses from NetFlix servers. The most transmitted content-type for responses by
volume were: Application/octet-stream 216.7 TB (91% of responses), Text/html 328.3
GB (0.35%), Video/mp4 28.03 GB (0.01%), Application/x-silverlight-app 24.15 GB
(0.01%), and Application/javascript 21.76 GB (0.04%). 6.46% of responses (with no
volume transferred) had no content type.
5.3.2 Breakdown of NetFlix video connections
Table 5.1 summarizes connections transporting video content from NetFlix. The average
number of bytes NetFlix sends per connection is 26 MB, and the client sends around 370
KB. An important note about this count is that it includes the packet headers, thus we may
assume that most client activity is TCP data acknowledgements. We can see that the average
connection duration is just over two and a half minutes. This leads us to the conclusion that
a client uses multiple connections to view content, since the content durations are greater
than 2 minutes.
Figure 5.1a and 5.1b show the cumulative distribution function (CDF) plots for all Net-
63
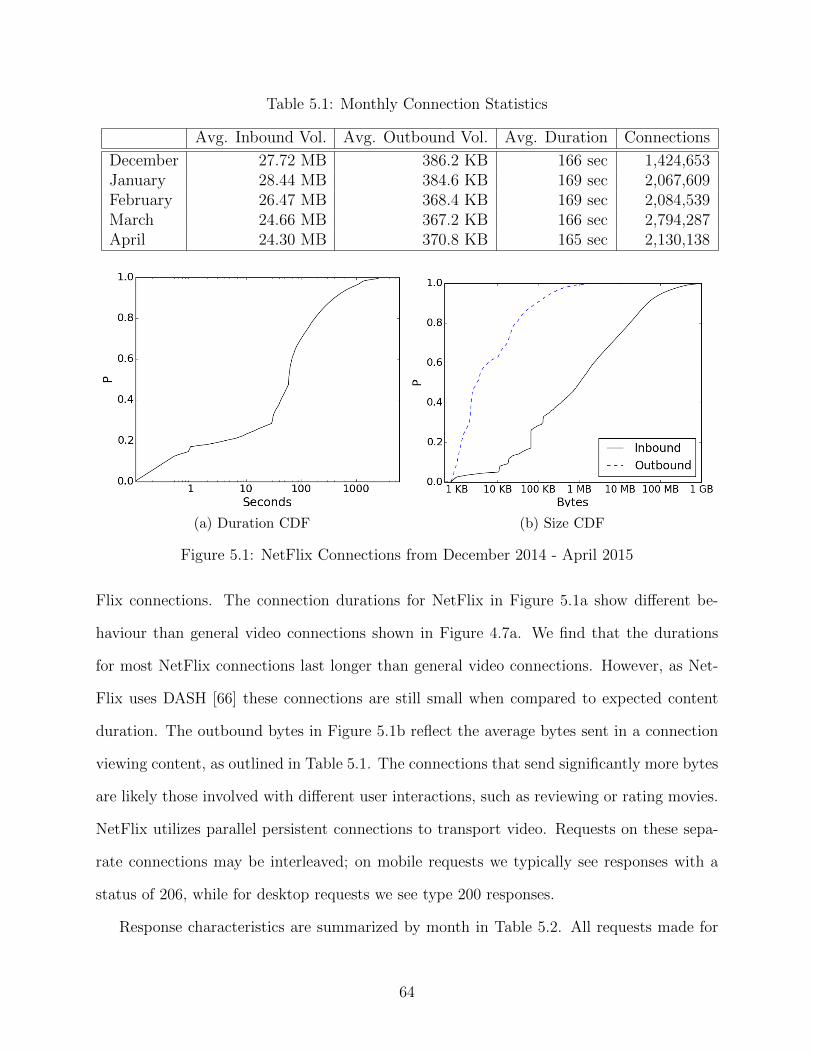
Table 5.1: Monthly Connection Statistics
Avg. Inbound Vol. Avg. Outbound Vol. Avg. Duration Connections
December 27.72 MB 386.2 KB 166 sec 1,424,653January 28.44 MB 384.6 KB 169 sec 2,067,609February 26.47 MB 368.4 KB 169 sec 2,084,539March 24.66 MB 367.2 KB 166 sec 2,794,287April 24.30 MB 370.8 KB 165 sec 2,130,138
(a) Duration CDF (b) Size CDF
Figure 5.1: NetFlix Connections from December 2014 - April 2015
Flix connections. The connection durations for NetFlix in Figure 5.1a show different be-
haviour than general video connections shown in Figure 4.7a. We find that the durations
for most NetFlix connections last longer than general video connections. However, as Net-
Flix uses DASH [66] these connections are still small when compared to expected content
duration. The outbound bytes in Figure 5.1b reflect the average bytes sent in a connection
viewing content, as outlined in Table 5.1. The connections that send significantly more bytes
are likely those involved with different user interactions, such as reviewing or rating movies.
NetFlix utilizes parallel persistent connections to transport video. Requests on these sepa-
rate connections may be interleaved; on mobile requests we typically see responses with a
status of 206, while for desktop requests we see type 200 responses.
Response characteristics are summarized by month in Table 5.2. All requests made for
64
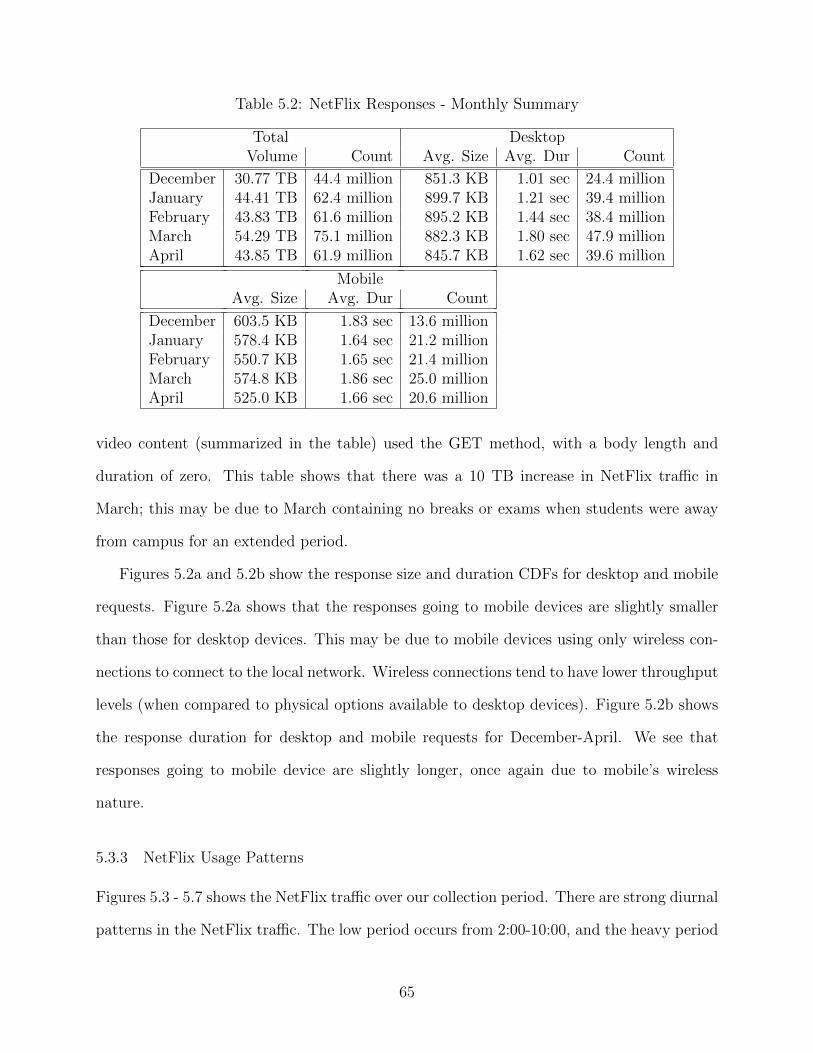
Table 5.2: NetFlix Responses - Monthly Summary
Total DesktopVolume Count Avg. Size Avg. Dur Count
December 30.77 TB 44.4 million 851.3 KB 1.01 sec 24.4 millionJanuary 44.41 TB 62.4 million 899.7 KB 1.21 sec 39.4 millionFebruary 43.83 TB 61.6 million 895.2 KB 1.44 sec 38.4 millionMarch 54.29 TB 75.1 million 882.3 KB 1.80 sec 47.9 millionApril 43.85 TB 61.9 million 845.7 KB 1.62 sec 39.6 million
MobileAvg. Size Avg. Dur Count
December 603.5 KB 1.83 sec 13.6 millionJanuary 578.4 KB 1.64 sec 21.2 millionFebruary 550.7 KB 1.65 sec 21.4 millionMarch 574.8 KB 1.86 sec 25.0 millionApril 525.0 KB 1.66 sec 20.6 million
video content (summarized in the table) used the GET method, with a body length and
duration of zero. This table shows that there was a 10 TB increase in NetFlix traffic in
March; this may be due to March containing no breaks or exams when students were away
from campus for an extended period.
Figures 5.2a and 5.2b show the response size and duration CDFs for desktop and mobile
requests. Figure 5.2a shows that the responses going to mobile devices are slightly smaller
than those for desktop devices. This may be due to mobile devices using only wireless con-
nections to connect to the local network. Wireless connections tend to have lower throughput
levels (when compared to physical options available to desktop devices). Figure 5.2b shows
the response duration for desktop and mobile requests for December-April. We see that
responses going to mobile device are slightly longer, once again due to mobile’s wireless
nature.
5.3.3 NetFlix Usage Patterns
Figures 5.3 - 5.7 shows the NetFlix traffic over our collection period. There are strong diurnal
patterns in the NetFlix traffic. The low period occurs from 2:00-10:00, and the heavy period
65

(a) Response Size CDF (b) Response Duration CDF
Figure 5.2: NetFlix Response Characteristics December 2014 - April 2015
is from 12:00-24:00. We can see a slight difference when examining weekday traffic versus
weekend traffic, although the University calendar has a greater influence on the volumes.
Weekday traffic often has two peak activity periods during the day. These peaks occur in
the afternoon around 12:00-14:00, and late in the evening around 22:00-24:00. Weekend
activity only shows the second period as a distinct peak. Behavior in residential networks
may differ from what we observed as the first peak (in mid-afternoon) occurs during work
hours; we do not believe any other characteristics we present would exhibit difference on a
residential ISP.
Figure 5.3 shows the NetFlix traffic levels for December 2014. The traffic levels decrease
during the second week since it was the final exam period for the University of Calgary.
Traffic levels remained low for the last two weeks of the month for the holiday break, when
many students left campus. In December, 23.35 TB of video content was sent to desktop
devices and 7.36 TB was sent to mobile devices from NetFlix. The total connections to all
NetFlix HTTP servers was 2,018,915. 70.6% of these connections were used to transport
content.
NetFlix traffic levels for January 2015 are shown in Figure 5.4. The first week of January
was “block week” for the University. Normal classes were not yet in session so the traffic
66
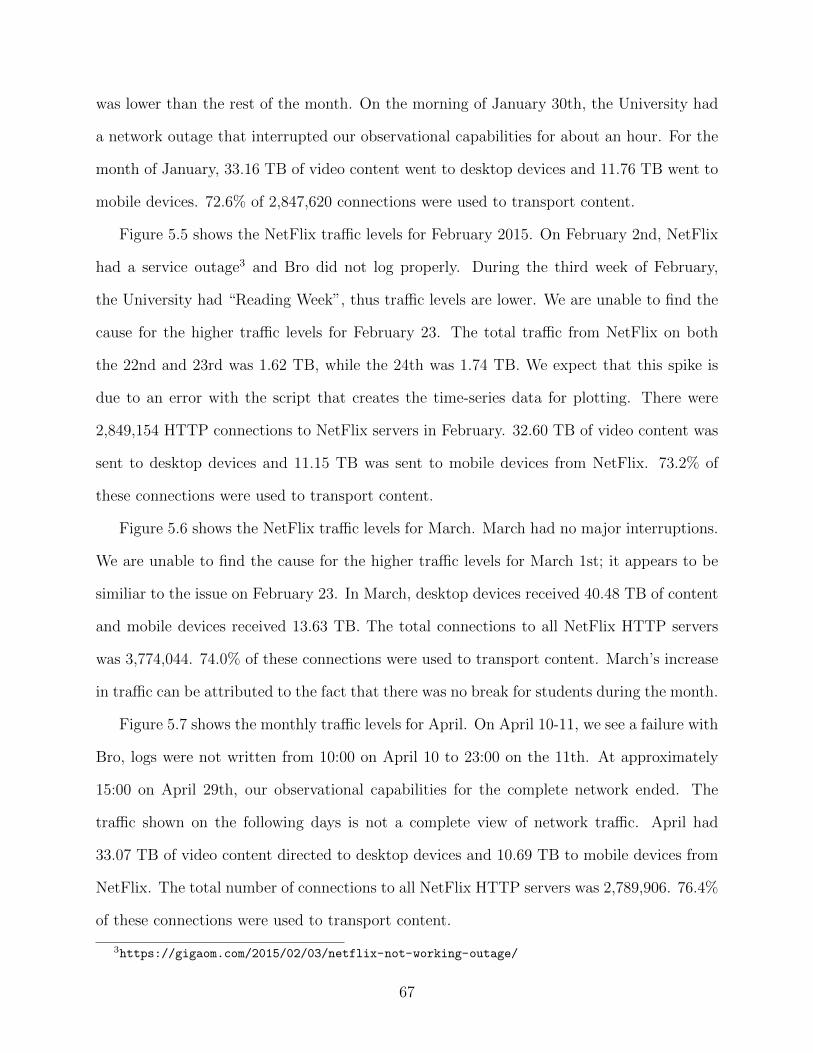
was lower than the rest of the month. On the morning of January 30th, the University had
a network outage that interrupted our observational capabilities for about an hour. For the
month of January, 33.16 TB of video content went to desktop devices and 11.76 TB went to
mobile devices. 72.6% of 2,847,620 connections were used to transport content.
Figure 5.5 shows the NetFlix traffic levels for February 2015. On February 2nd, NetFlix
had a service outage3 and Bro did not log properly. During the third week of February,
the University had “Reading Week”, thus traffic levels are lower. We are unable to find the
cause for the higher traffic levels for February 23. The total traffic from NetFlix on both
the 22nd and 23rd was 1.62 TB, while the 24th was 1.74 TB. We expect that this spike is
due to an error with the script that creates the time-series data for plotting. There were
2,849,154 HTTP connections to NetFlix servers in February. 32.60 TB of video content was
sent to desktop devices and 11.15 TB was sent to mobile devices from NetFlix. 73.2% of
these connections were used to transport content.
Figure 5.6 shows the NetFlix traffic levels for March. March had no major interruptions.
We are unable to find the cause for the higher traffic levels for March 1st; it appears to be
similiar to the issue on February 23. In March, desktop devices received 40.48 TB of content
and mobile devices received 13.63 TB. The total connections to all NetFlix HTTP servers
was 3,774,044. 74.0% of these connections were used to transport content. March’s increase
in traffic can be attributed to the fact that there was no break for students during the month.
Figure 5.7 shows the monthly traffic levels for April. On April 10-11, we see a failure with
Bro, logs were not written from 10:00 on April 10 to 23:00 on the 11th. At approximately
15:00 on April 29th, our observational capabilities for the complete network ended. The
traffic shown on the following days is not a complete view of network traffic. April had
33.07 TB of video content directed to desktop devices and 10.69 TB to mobile devices from
NetFlix. The total number of connections to all NetFlix HTTP servers was 2,789,906. 76.4%
of these connections were used to transport content.
3https://gigaom.com/2015/02/03/netflix-not-working-outage/
67
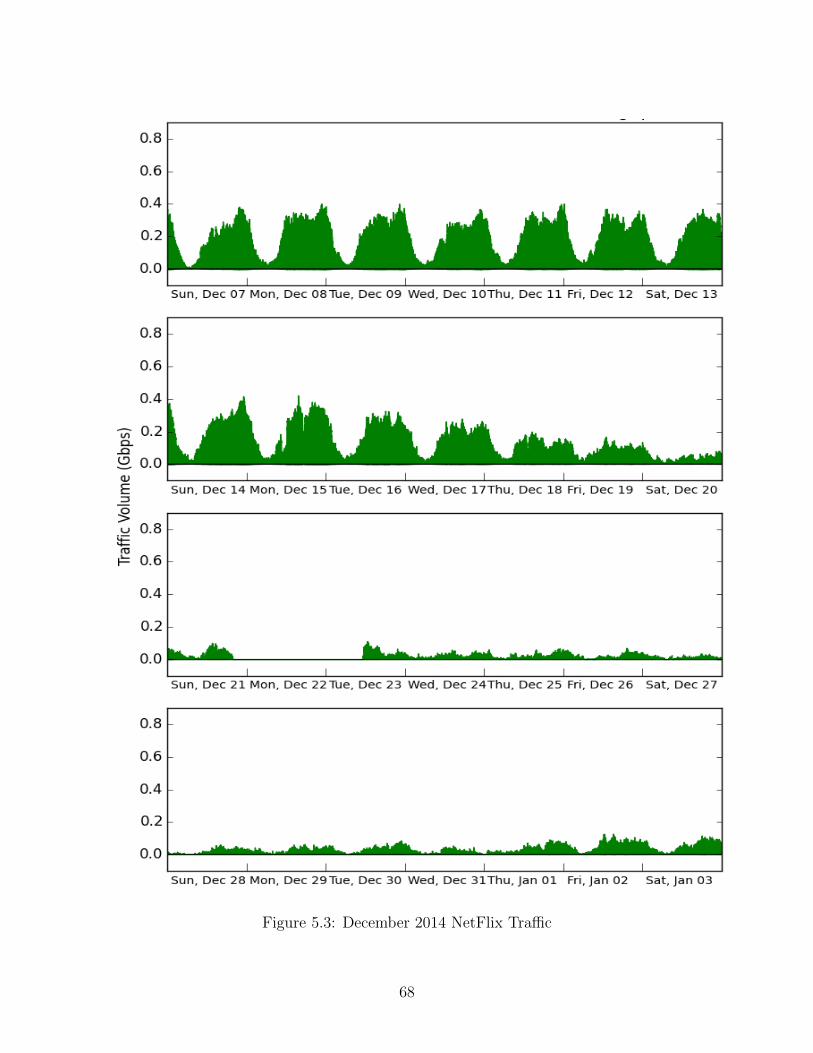
Figure 5.3: December 2014 NetFlix Traffic
68
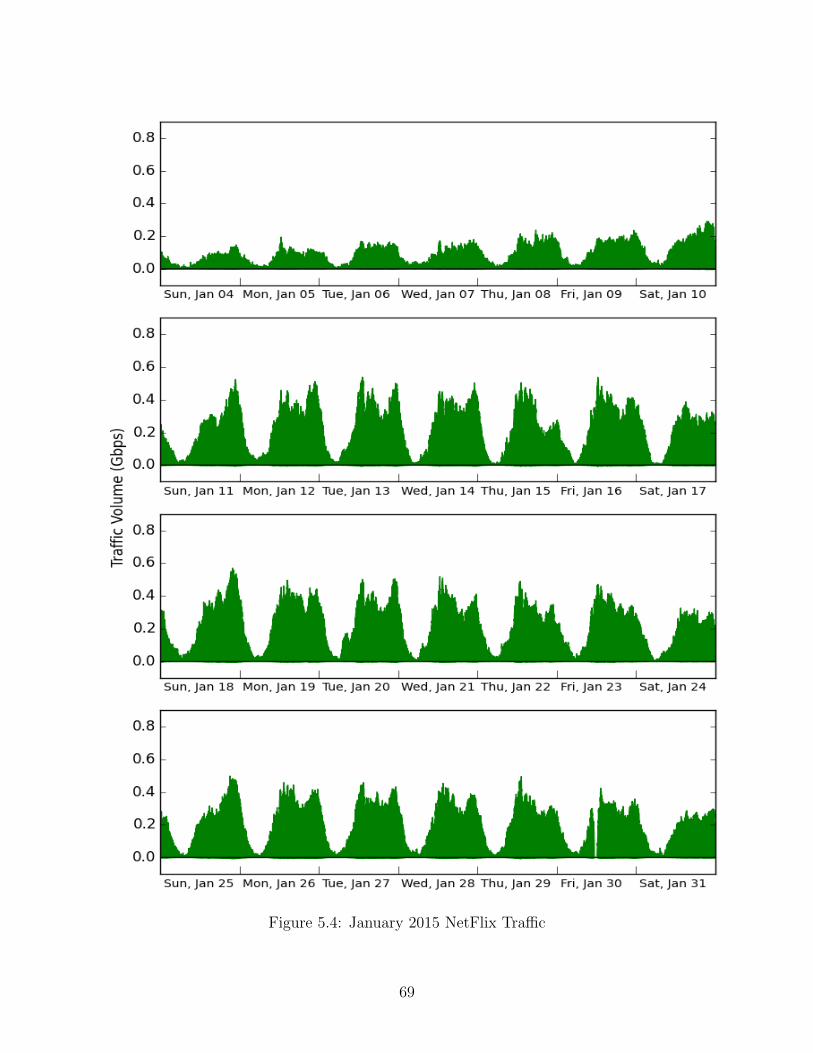
Figure 5.4: January 2015 NetFlix Traffic
69
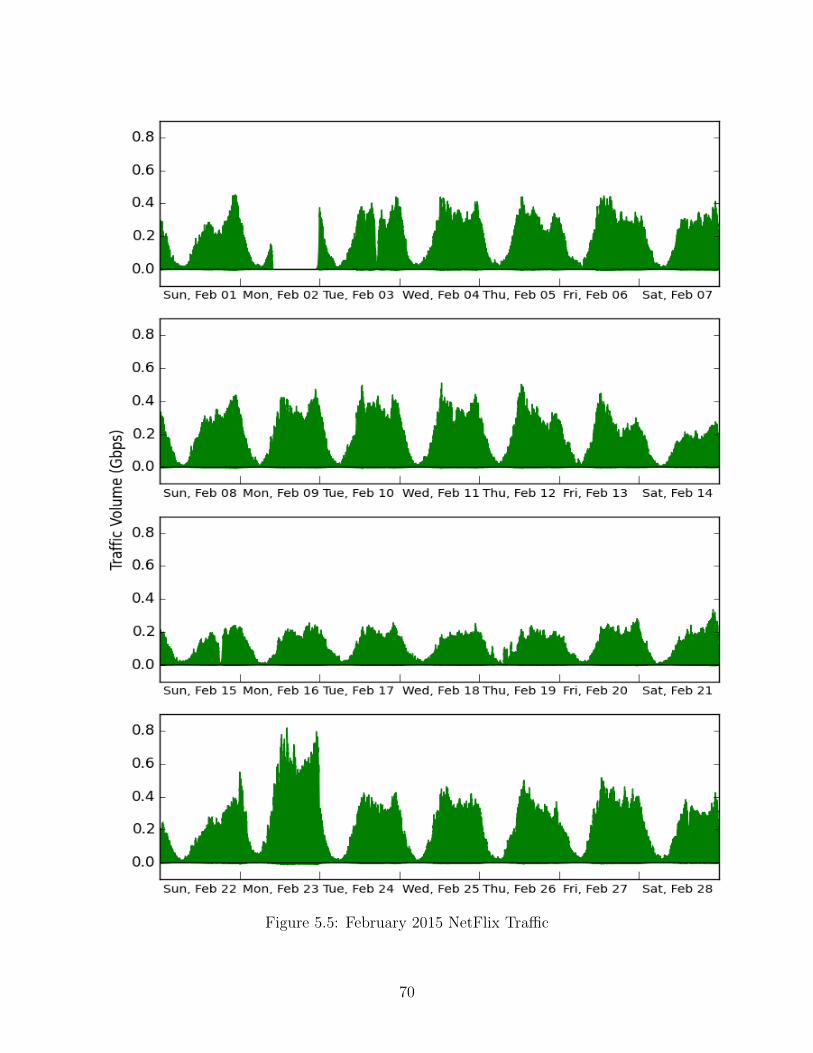
Figure 5.5: February 2015 NetFlix Traffic
70
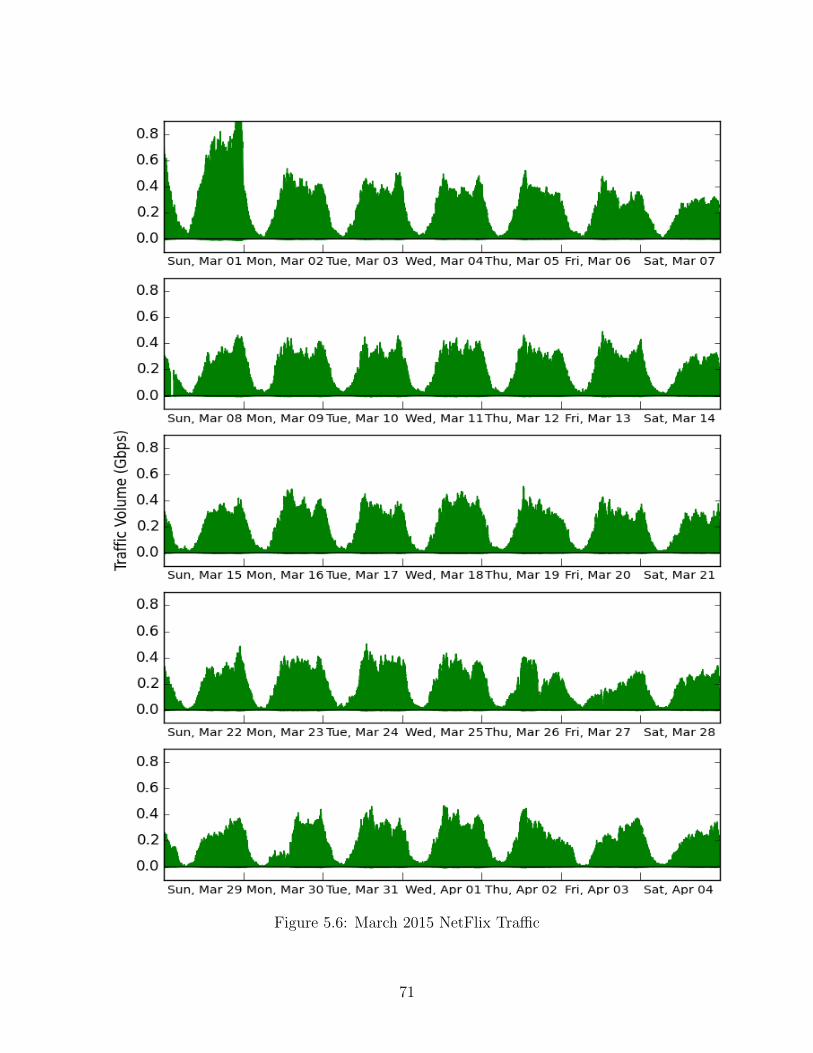
Figure 5.6: March 2015 NetFlix Traffic
71
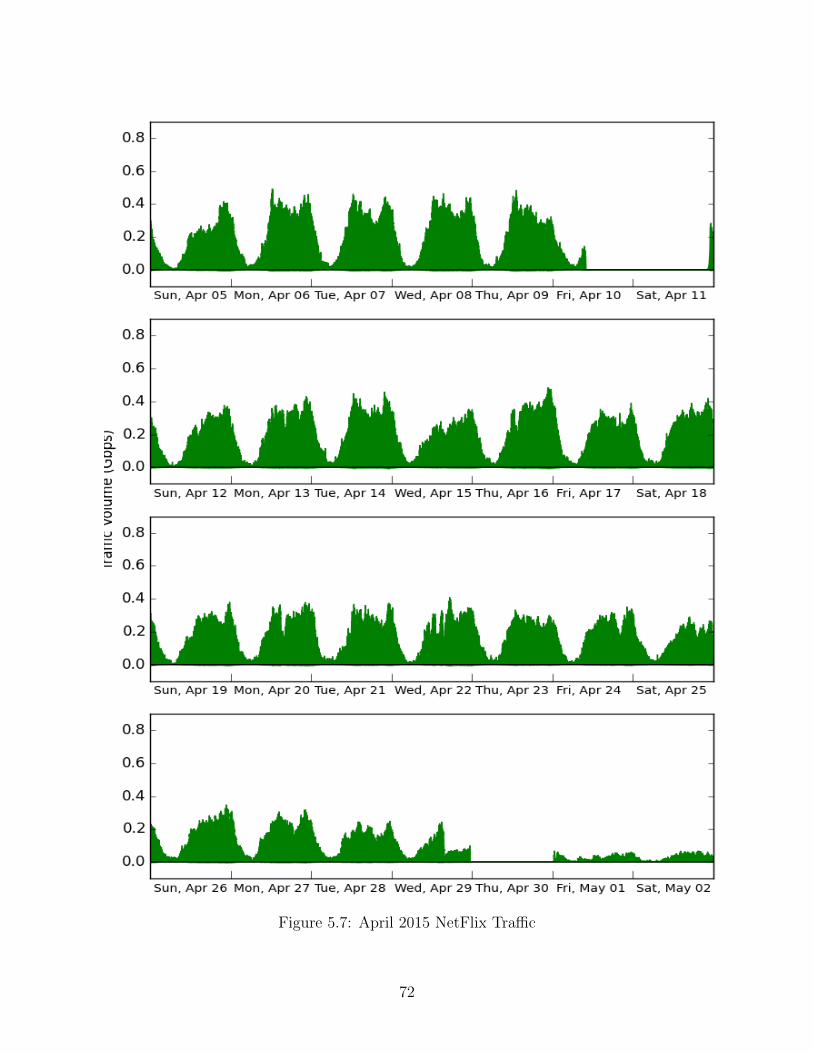
Figure 5.7: April 2015 NetFlix Traffic
72
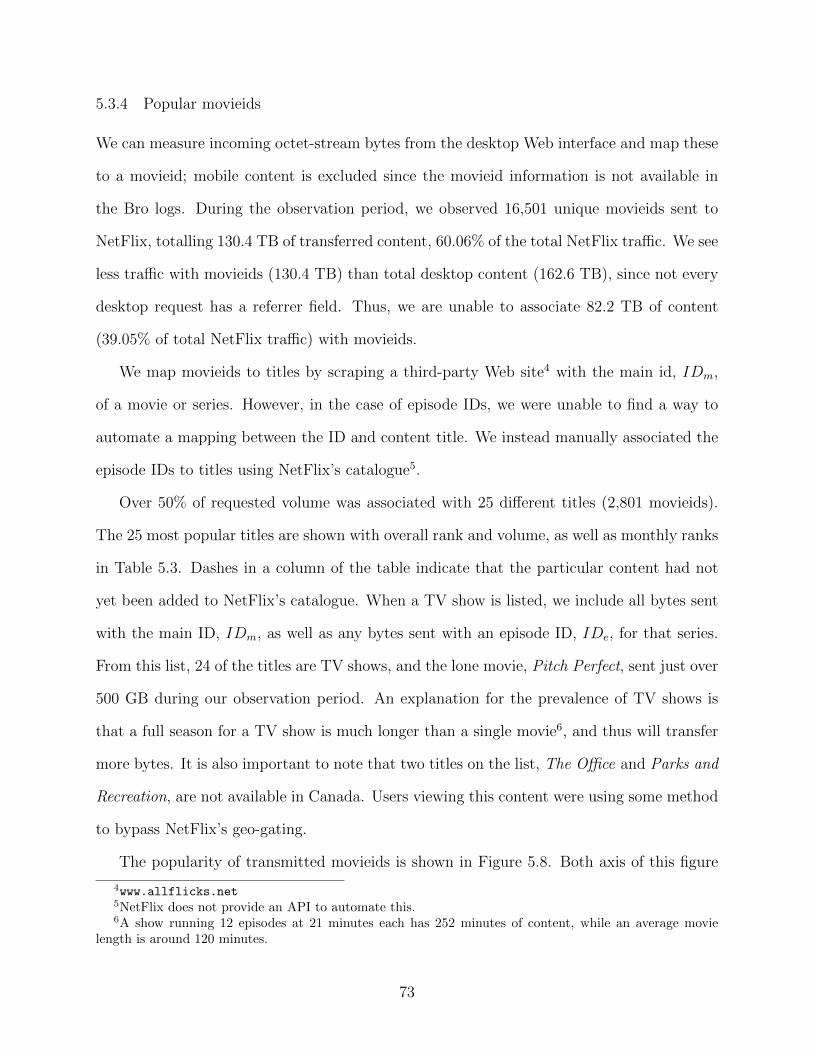
5.3.4 Popular movieids
We can measure incoming octet-stream bytes from the desktop Web interface and map these
to a movieid; mobile content is excluded since the movieid information is not available in
the Bro logs. During the observation period, we observed 16,501 unique movieids sent to
NetFlix, totalling 130.4 TB of transferred content, 60.06% of the total NetFlix traffic. We see
less traffic with movieids (130.4 TB) than total desktop content (162.6 TB), since not every
desktop request has a referrer field. Thus, we are unable to associate 82.2 TB of content
(39.05% of total NetFlix traffic) with movieids.
We map movieids to titles by scraping a third-party Web site4 with the main id, IDm,
of a movie or series. However, in the case of episode IDs, we were unable to find a way to
automate a mapping between the ID and content title. We instead manually associated the
episode IDs to titles using NetFlix’s catalogue5.
Over 50% of requested volume was associated with 25 different titles (2,801 movieids).
The 25 most popular titles are shown with overall rank and volume, as well as monthly ranks
in Table 5.3. Dashes in a column of the table indicate that the particular content had not
yet been added to NetFlix’s catalogue. When a TV show is listed, we include all bytes sent
with the main ID, IDm, as well as any bytes sent with an episode ID, IDe, for that series.
From this list, 24 of the titles are TV shows, and the lone movie, Pitch Perfect, sent just over
500 GB during our observation period. An explanation for the prevalence of TV shows is
that a full season for a TV show is much longer than a single movie6, and thus will transfer
more bytes. It is also important to note that two titles on the list, The Office and Parks and
Recreation, are not available in Canada. Users viewing this content were using some method
to bypass NetFlix’s geo-gating.
The popularity of transmitted movieids is shown in Figure 5.8. Both axis of this figure
4www.allflicks.net5NetFlix does not provide an API to automate this.6A show running 12 episodes at 21 minutes each has 252 minutes of content, while an average movie
length is around 120 minutes.
73
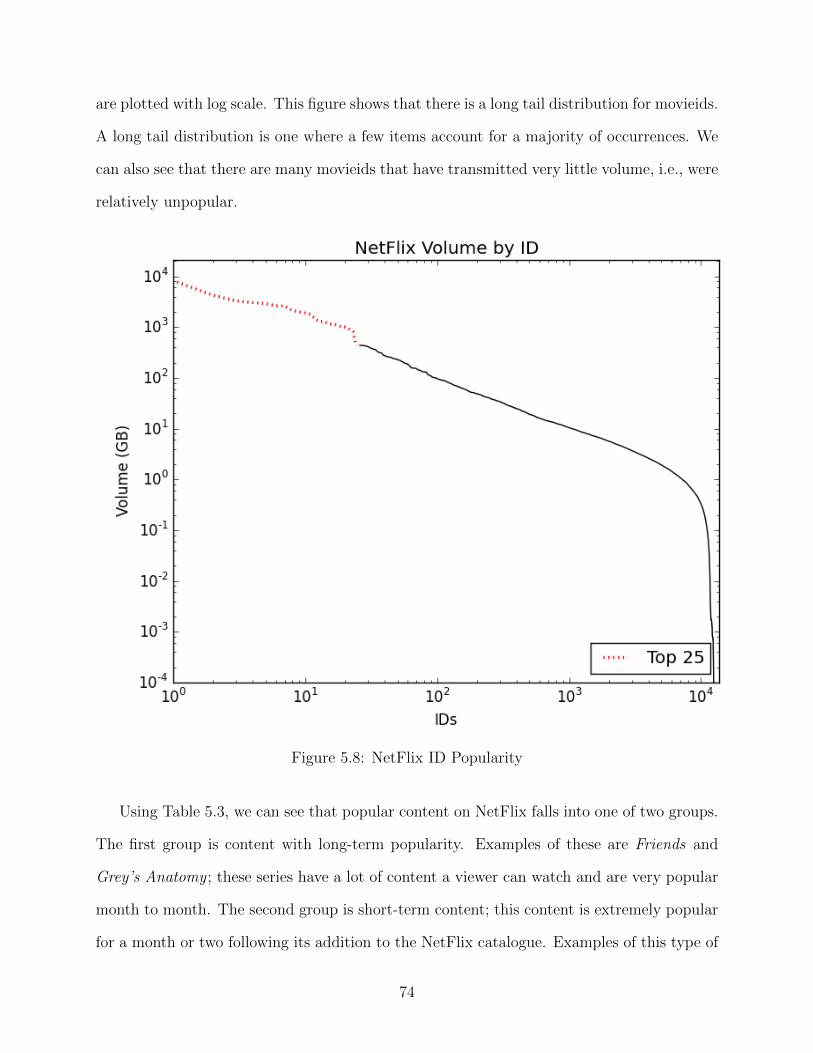
are plotted with log scale. This figure shows that there is a long tail distribution for movieids.
A long tail distribution is one where a few items account for a majority of occurrences. We
can also see that there are many movieids that have transmitted very little volume, i.e., were
relatively unpopular.
Figure 5.8: NetFlix ID Popularity
Using Table 5.3, we can see that popular content on NetFlix falls into one of two groups.
The first group is content with long-term popularity. Examples of these are Friends and
Grey’s Anatomy ; these series have a lot of content a viewer can watch and are very popular
month to month. The second group is short-term content; this content is extremely popular
for a month or two following its addition to the NetFlix catalogue. Examples of this type of
74
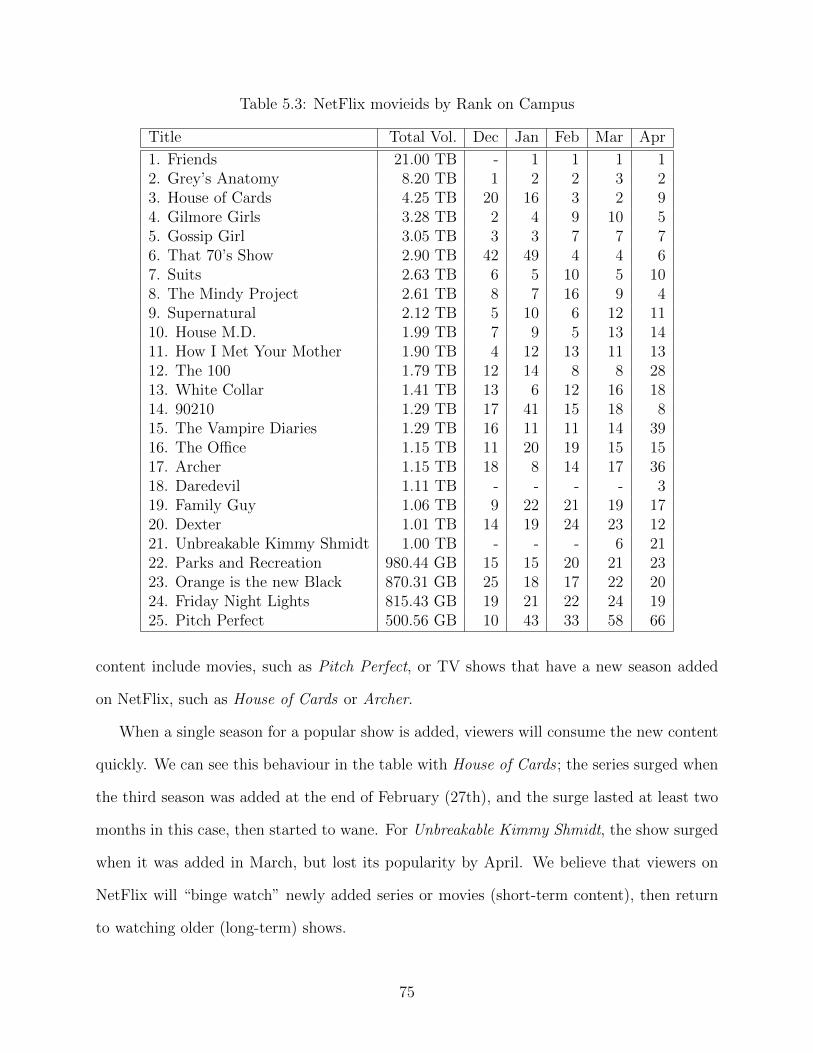
Table 5.3: NetFlix movieids by Rank on Campus
Title Total Vol. Dec Jan Feb Mar Apr
1. Friends 21.00 TB - 1 1 1 12. Grey’s Anatomy 8.20 TB 1 2 2 3 23. House of Cards 4.25 TB 20 16 3 2 94. Gilmore Girls 3.28 TB 2 4 9 10 55. Gossip Girl 3.05 TB 3 3 7 7 76. That 70’s Show 2.90 TB 42 49 4 4 67. Suits 2.63 TB 6 5 10 5 108. The Mindy Project 2.61 TB 8 7 16 9 49. Supernatural 2.12 TB 5 10 6 12 1110. House M.D. 1.99 TB 7 9 5 13 1411. How I Met Your Mother 1.90 TB 4 12 13 11 1312. The 100 1.79 TB 12 14 8 8 2813. White Collar 1.41 TB 13 6 12 16 1814. 90210 1.29 TB 17 41 15 18 815. The Vampire Diaries 1.29 TB 16 11 11 14 3916. The Office 1.15 TB 11 20 19 15 1517. Archer 1.15 TB 18 8 14 17 3618. Daredevil 1.11 TB - - - - 319. Family Guy 1.06 TB 9 22 21 19 1720. Dexter 1.01 TB 14 19 24 23 1221. Unbreakable Kimmy Shmidt 1.00 TB - - - 6 2122. Parks and Recreation 980.44 GB 15 15 20 21 2323. Orange is the new Black 870.31 GB 25 18 17 22 2024. Friday Night Lights 815.43 GB 19 21 22 24 1925. Pitch Perfect 500.56 GB 10 43 33 58 66
content include movies, such as Pitch Perfect, or TV shows that have a new season added
on NetFlix, such as House of Cards or Archer.
When a single season for a popular show is added, viewers will consume the new content
quickly. We can see this behaviour in the table with House of Cards ; the series surged when
the third season was added at the end of February (27th), and the surge lasted at least two
months in this case, then started to wane. For Unbreakable Kimmy Shmidt, the show surged
when it was added in March, but lost its popularity by April. We believe that viewers on
NetFlix will “binge watch” newly added series or movies (short-term content), then return
to watching older (long-term) shows.
75
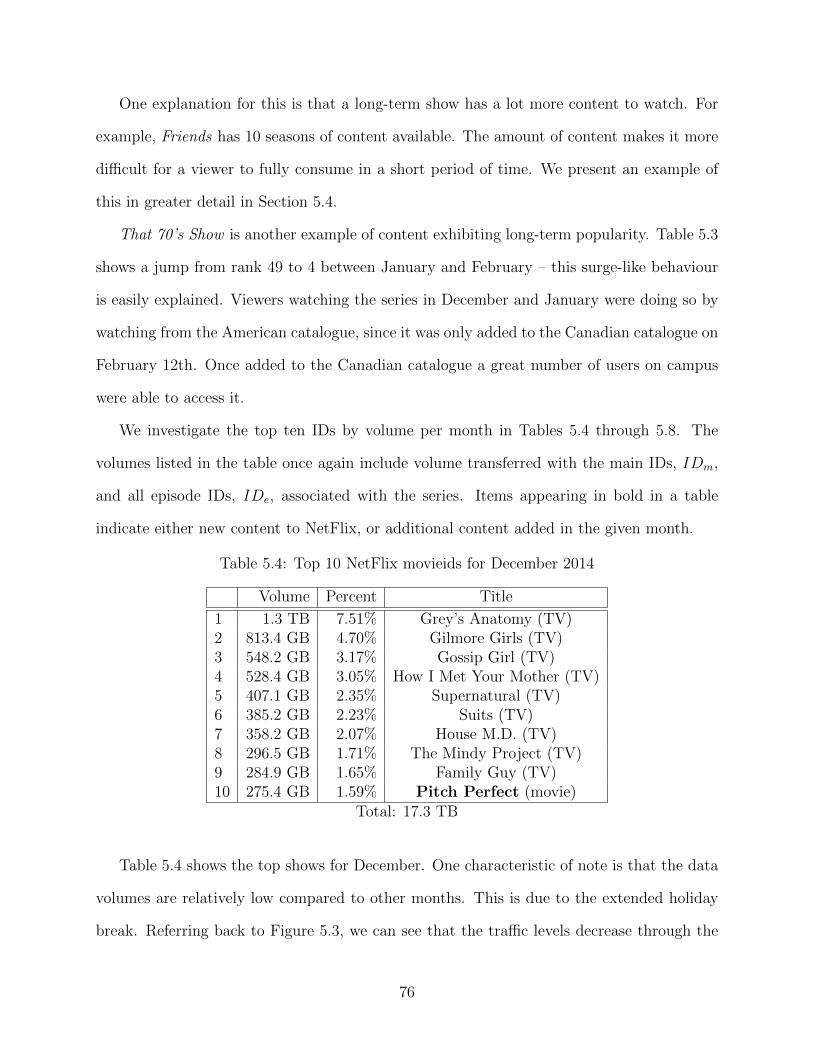
One explanation for this is that a long-term show has a lot more content to watch. For
example, Friends has 10 seasons of content available. The amount of content makes it more
difficult for a viewer to fully consume in a short period of time. We present an example of
this in greater detail in Section 5.4.
That 70’s Show is another example of content exhibiting long-term popularity. Table 5.3
shows a jump from rank 49 to 4 between January and February – this surge-like behaviour
is easily explained. Viewers watching the series in December and January were doing so by
watching from the American catalogue, since it was only added to the Canadian catalogue on
February 12th. Once added to the Canadian catalogue a great number of users on campus
were able to access it.
We investigate the top ten IDs by volume per month in Tables 5.4 through 5.8. The
volumes listed in the table once again include volume transferred with the main IDs, IDm,
and all episode IDs, IDe, associated with the series. Items appearing in bold in a table
indicate either new content to NetFlix, or additional content added in the given month.
Table 5.4: Top 10 NetFlix movieids for December 2014
Volume Percent Title
1 1.3 TB 7.51% Grey’s Anatomy (TV)2 813.4 GB 4.70% Gilmore Girls (TV)3 548.2 GB 3.17% Gossip Girl (TV)4 528.4 GB 3.05% How I Met Your Mother (TV)5 407.1 GB 2.35% Supernatural (TV)6 385.2 GB 2.23% Suits (TV)7 358.2 GB 2.07% House M.D. (TV)8 296.5 GB 1.71% The Mindy Project (TV)9 284.9 GB 1.65% Family Guy (TV)10 275.4 GB 1.59% Pitch Perfect (movie)
Total: 17.3 TB
Table 5.4 shows the top shows for December. One characteristic of note is that the data
volumes are relatively low compared to other months. This is due to the extended holiday
break. Referring back to Figure 5.3, we can see that the traffic levels decrease through the
76
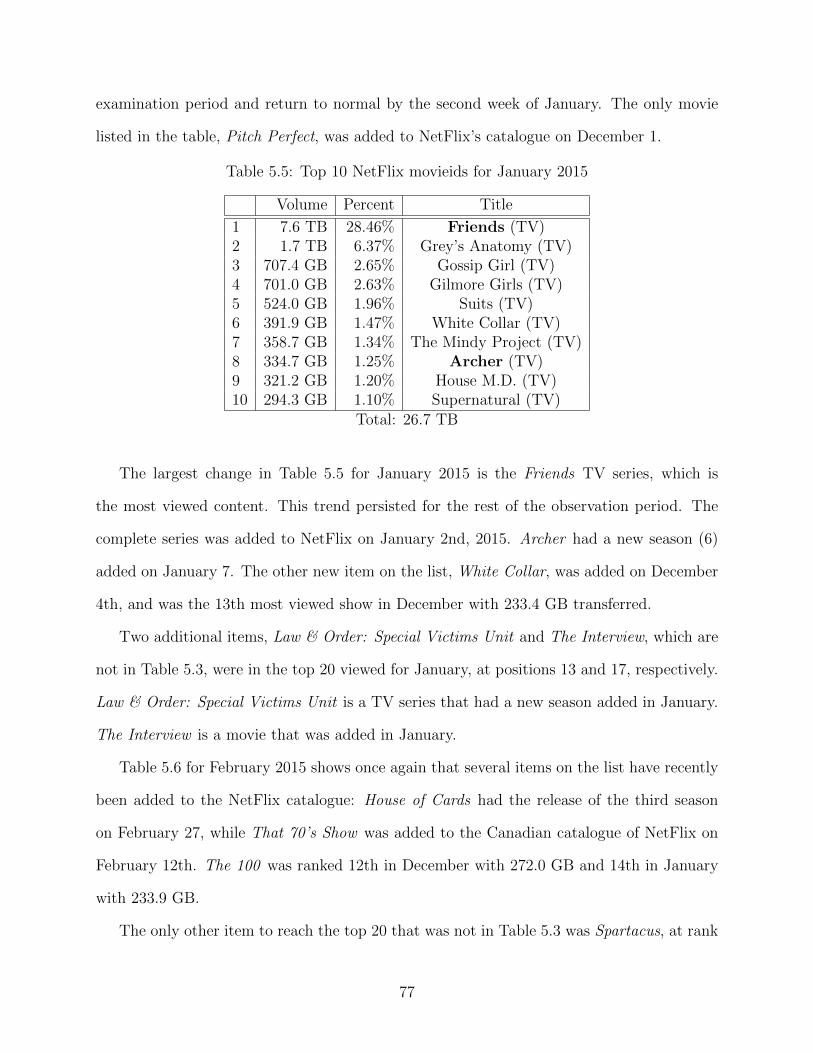
examination period and return to normal by the second week of January. The only movie
listed in the table, Pitch Perfect, was added to NetFlix’s catalogue on December 1.
Table 5.5: Top 10 NetFlix movieids for January 2015
Volume Percent Title
1 7.6 TB 28.46% Friends (TV)2 1.7 TB 6.37% Grey’s Anatomy (TV)3 707.4 GB 2.65% Gossip Girl (TV)4 701.0 GB 2.63% Gilmore Girls (TV)5 524.0 GB 1.96% Suits (TV)6 391.9 GB 1.47% White Collar (TV)7 358.7 GB 1.34% The Mindy Project (TV)8 334.7 GB 1.25% Archer (TV)9 321.2 GB 1.20% House M.D. (TV)10 294.3 GB 1.10% Supernatural (TV)
Total: 26.7 TB
The largest change in Table 5.5 for January 2015 is the Friends TV series, which is
the most viewed content. This trend persisted for the rest of the observation period. The
complete series was added to NetFlix on January 2nd, 2015. Archer had a new season (6)
added on January 7. The other new item on the list, White Collar, was added on December
4th, and was the 13th most viewed show in December with 233.4 GB transferred.
Two additional items, Law & Order: Special Victims Unit and The Interview, which are
not in Table 5.3, were in the top 20 viewed for January, at positions 13 and 17, respectively.
Law & Order: Special Victims Unit is a TV series that had a new season added in January.
The Interview is a movie that was added in January.
Table 5.6 for February 2015 shows once again that several items on the list have recently
been added to the NetFlix catalogue: House of Cards had the release of the third season
on February 27, while That 70’s Show was added to the Canadian catalogue of NetFlix on
February 12th. The 100 was ranked 12th in December with 272.0 GB and 14th in January
with 233.9 GB.
The only other item to reach the top 20 that was not in Table 5.3 was Spartacus, at rank
77
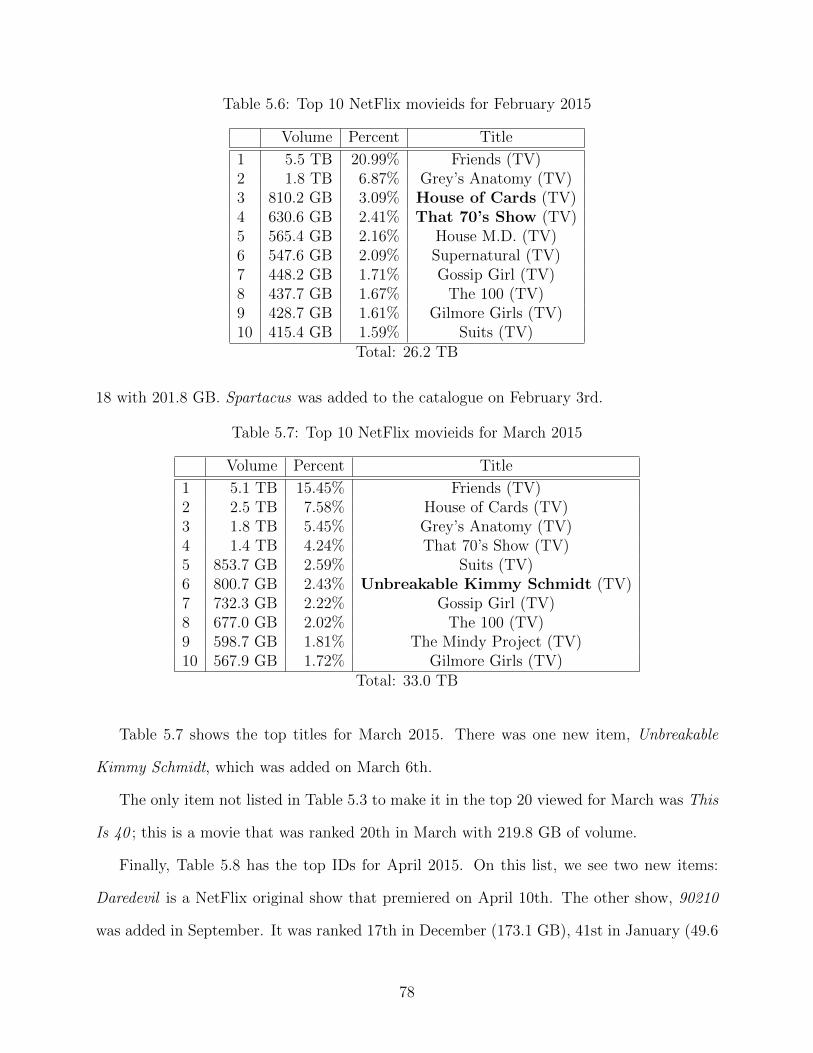
Table 5.6: Top 10 NetFlix movieids for February 2015
Volume Percent Title
1 5.5 TB 20.99% Friends (TV)2 1.8 TB 6.87% Grey’s Anatomy (TV)3 810.2 GB 3.09% House of Cards (TV)4 630.6 GB 2.41% That 70’s Show (TV)5 565.4 GB 2.16% House M.D. (TV)6 547.6 GB 2.09% Supernatural (TV)7 448.2 GB 1.71% Gossip Girl (TV)8 437.7 GB 1.67% The 100 (TV)9 428.7 GB 1.61% Gilmore Girls (TV)10 415.4 GB 1.59% Suits (TV)
Total: 26.2 TB
18 with 201.8 GB. Spartacus was added to the catalogue on February 3rd.
Table 5.7: Top 10 NetFlix movieids for March 2015
Volume Percent Title
1 5.1 TB 15.45% Friends (TV)2 2.5 TB 7.58% House of Cards (TV)3 1.8 TB 5.45% Grey’s Anatomy (TV)4 1.4 TB 4.24% That 70’s Show (TV)5 853.7 GB 2.59% Suits (TV)6 800.7 GB 2.43% Unbreakable Kimmy Schmidt (TV)7 732.3 GB 2.22% Gossip Girl (TV)8 677.0 GB 2.02% The 100 (TV)9 598.7 GB 1.81% The Mindy Project (TV)10 567.9 GB 1.72% Gilmore Girls (TV)
Total: 33.0 TB
Table 5.7 shows the top titles for March 2015. There was one new item, Unbreakable
Kimmy Schmidt, which was added on March 6th.
The only item not listed in Table 5.3 to make it in the top 20 viewed for March was This
Is 40 ; this is a movie that was ranked 20th in March with 219.8 GB of volume.
Finally, Table 5.8 has the top IDs for April 2015. On this list, we see two new items:
Daredevil is a NetFlix original show that premiered on April 10th. The other show, 90210
was added in September. It was ranked 17th in December (173.1 GB), 41st in January (49.6
78
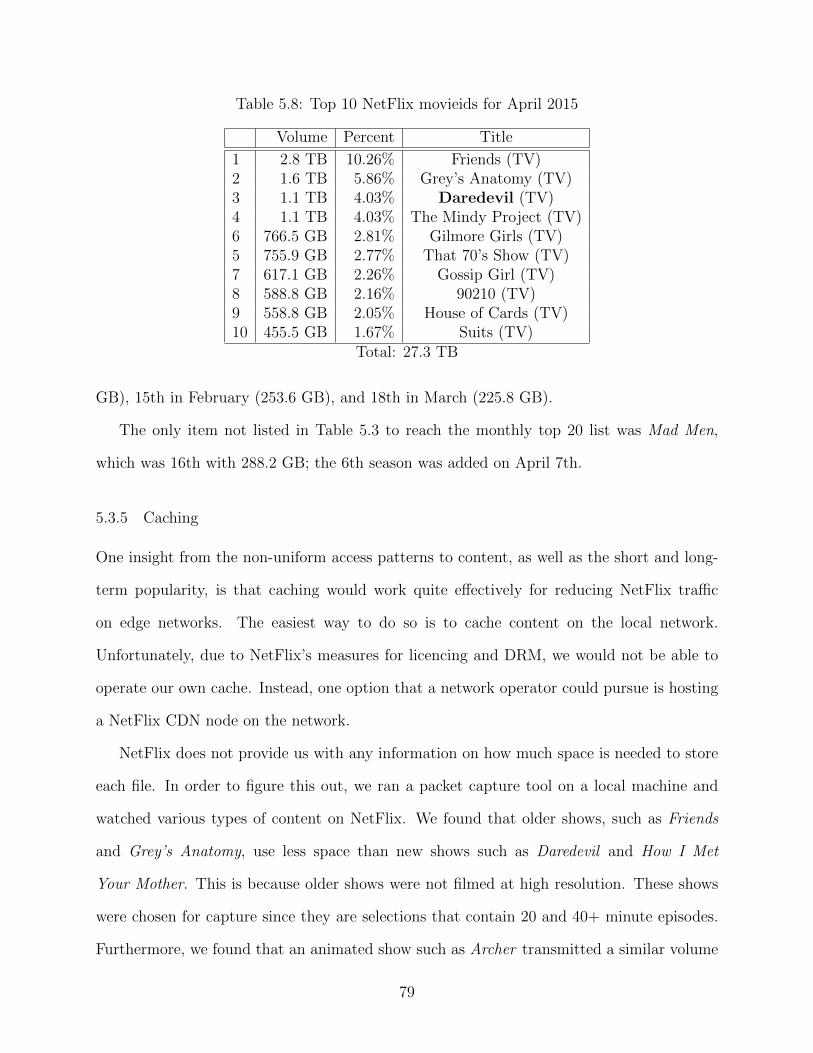
Table 5.8: Top 10 NetFlix movieids for April 2015
Volume Percent Title
1 2.8 TB 10.26% Friends (TV)2 1.6 TB 5.86% Grey’s Anatomy (TV)3 1.1 TB 4.03% Daredevil (TV)4 1.1 TB 4.03% The Mindy Project (TV)6 766.5 GB 2.81% Gilmore Girls (TV)5 755.9 GB 2.77% That 70’s Show (TV)7 617.1 GB 2.26% Gossip Girl (TV)8 588.8 GB 2.16% 90210 (TV)9 558.8 GB 2.05% House of Cards (TV)10 455.5 GB 1.67% Suits (TV)
Total: 27.3 TB
GB), 15th in February (253.6 GB), and 18th in March (225.8 GB).
The only item not listed in Table 5.3 to reach the monthly top 20 list was Mad Men,
which was 16th with 288.2 GB; the 6th season was added on April 7th.
5.3.5 Caching
One insight from the non-uniform access patterns to content, as well as the short and long-
term popularity, is that caching would work quite effectively for reducing NetFlix traffic
on edge networks. The easiest way to do so is to cache content on the local network.
Unfortunately, due to NetFlix’s measures for licencing and DRM, we would not be able to
operate our own cache. Instead, one option that a network operator could pursue is hosting
a NetFlix CDN node on the network.
NetFlix does not provide us with any information on how much space is needed to store
each file. In order to figure this out, we ran a packet capture tool on a local machine and
watched various types of content on NetFlix. We found that older shows, such as Friends
and Grey’s Anatomy, use less space than new shows such as Daredevil and How I Met
Your Mother. This is because older shows were not filmed at high resolution. These shows
were chosen for capture since they are selections that contain 20 and 40+ minute episodes.
Furthermore, we found that an animated show such as Archer transmitted a similar volume
79
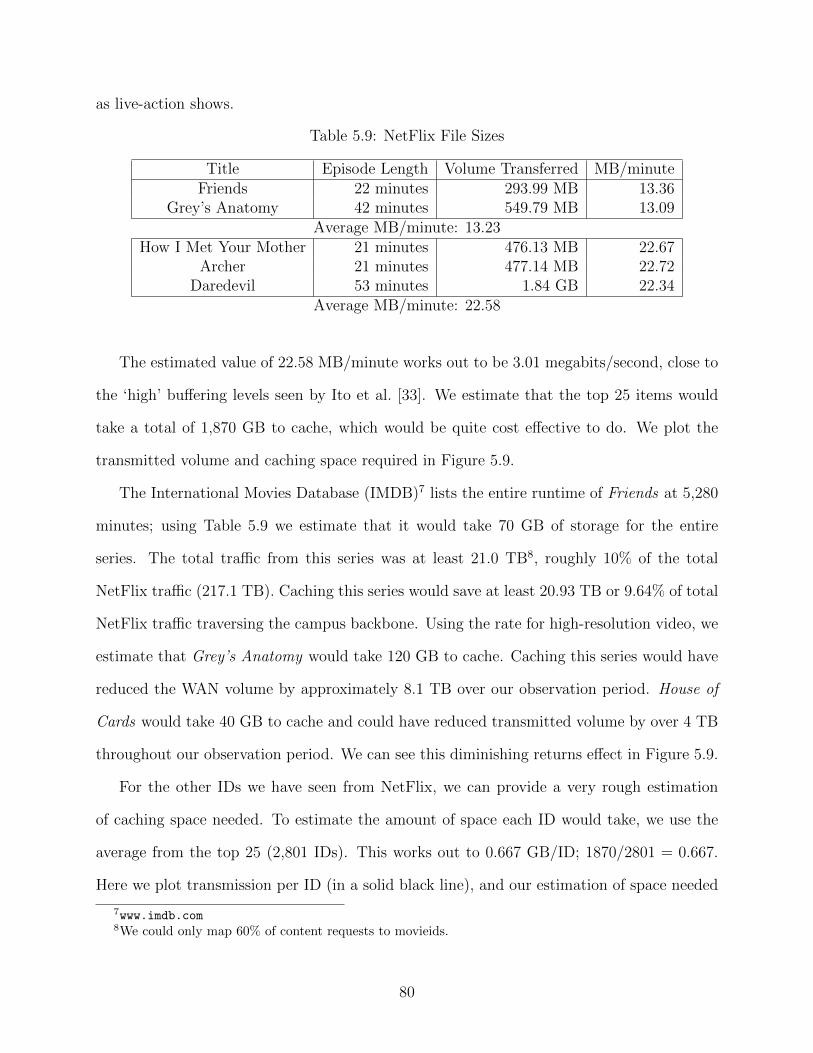
as live-action shows.
Table 5.9: NetFlix File Sizes
Title Episode Length Volume Transferred MB/minuteFriends 22 minutes 293.99 MB 13.36
Grey’s Anatomy 42 minutes 549.79 MB 13.09Average MB/minute: 13.23
How I Met Your Mother 21 minutes 476.13 MB 22.67Archer 21 minutes 477.14 MB 22.72
Daredevil 53 minutes 1.84 GB 22.34Average MB/minute: 22.58
The estimated value of 22.58 MB/minute works out to be 3.01 megabits/second, close to
the ‘high’ buffering levels seen by Ito et al. [33]. We estimate that the top 25 items would
take a total of 1,870 GB to cache, which would be quite cost effective to do. We plot the
transmitted volume and caching space required in Figure 5.9.
The International Movies Database (IMDB)7 lists the entire runtime of Friends at 5,280
minutes; using Table 5.9 we estimate that it would take 70 GB of storage for the entire
series. The total traffic from this series was at least 21.0 TB8, roughly 10% of the total
NetFlix traffic (217.1 TB). Caching this series would save at least 20.93 TB or 9.64% of total
NetFlix traffic traversing the campus backbone. Using the rate for high-resolution video, we
estimate that Grey’s Anatomy would take 120 GB to cache. Caching this series would have
reduced the WAN volume by approximately 8.1 TB over our observation period. House of
Cards would take 40 GB to cache and could have reduced transmitted volume by over 4 TB
throughout our observation period. We can see this diminishing returns effect in Figure 5.9.
For the other IDs we have seen from NetFlix, we can provide a very rough estimation
of caching space needed. To estimate the amount of space each ID would take, we use the
average from the top 25 (2,801 IDs). This works out to 0.667 GB/ID; 1870/2801 = 0.667.
Here we plot transmission per ID (in a solid black line), and our estimation of space needed
7www.imdb.com8We could only map 60% of content requests to movieids.
80
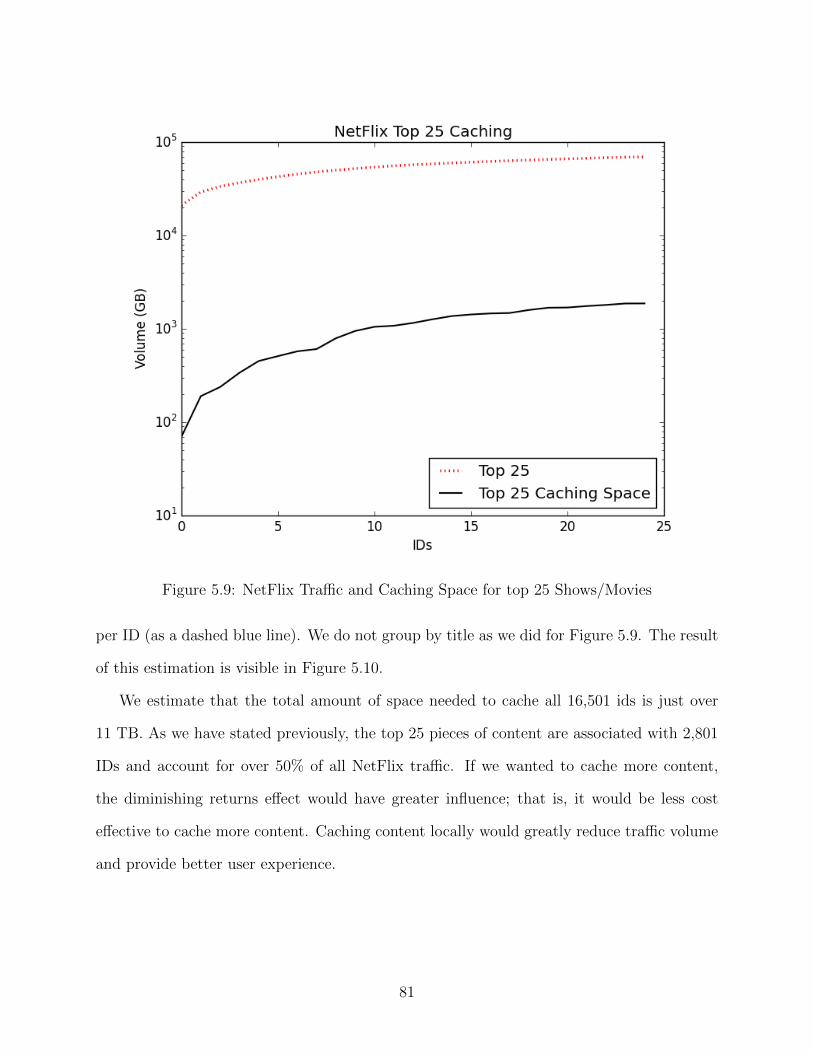
Figure 5.9: NetFlix Traffic and Caching Space for top 25 Shows/Movies
per ID (as a dashed blue line). We do not group by title as we did for Figure 5.9. The result
of this estimation is visible in Figure 5.10.
We estimate that the total amount of space needed to cache all 16,501 ids is just over
11 TB. As we have stated previously, the top 25 pieces of content are associated with 2,801
IDs and account for over 50% of all NetFlix traffic. If we wanted to cache more content,
the diminishing returns effect would have greater influence; that is, it would be less cost
effective to cache more content. Caching content locally would greatly reduce traffic volume
and provide better user experience.
81
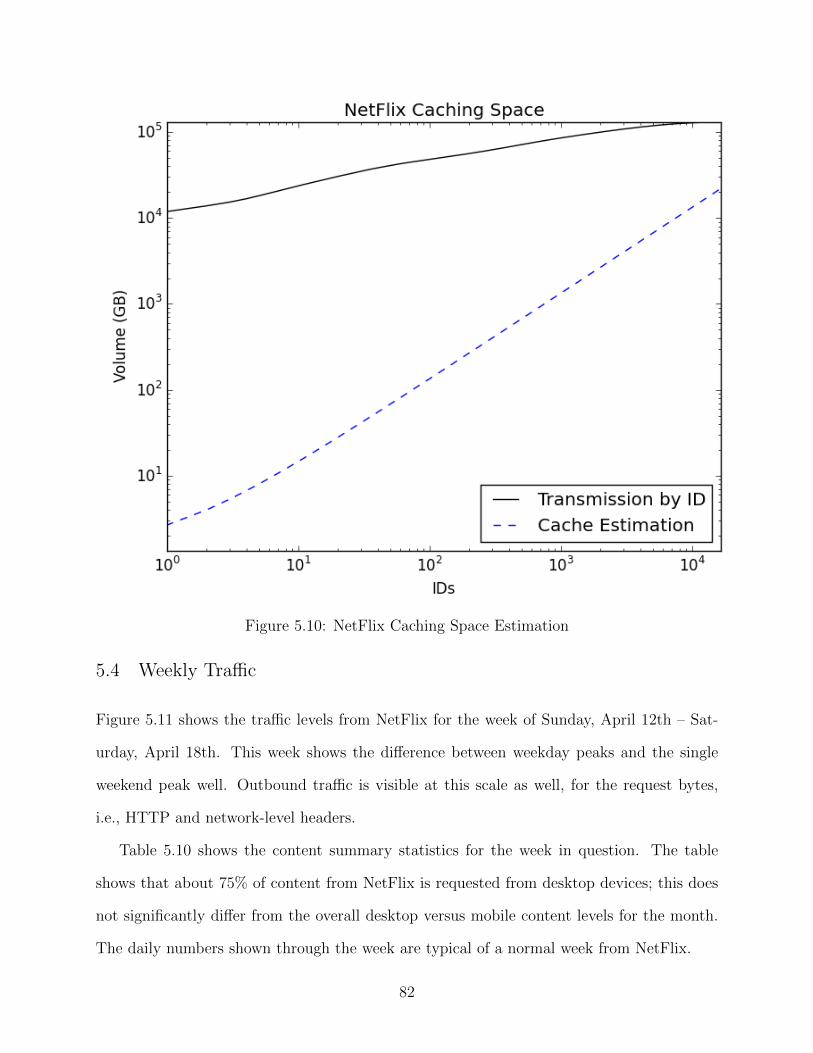
Figure 5.10: NetFlix Caching Space Estimation
5.4 Weekly Traffic
Figure 5.11 shows the traffic levels from NetFlix for the week of Sunday, April 12th – Sat-
urday, April 18th. This week shows the difference between weekday peaks and the single
weekend peak well. Outbound traffic is visible at this scale as well, for the request bytes,
i.e., HTTP and network-level headers.
Table 5.10 shows the content summary statistics for the week in question. The table
shows that about 75% of content from NetFlix is requested from desktop devices; this does
not significantly differ from the overall desktop versus mobile content levels for the month.
The daily numbers shown through the week are typical of a normal week from NetFlix.
82
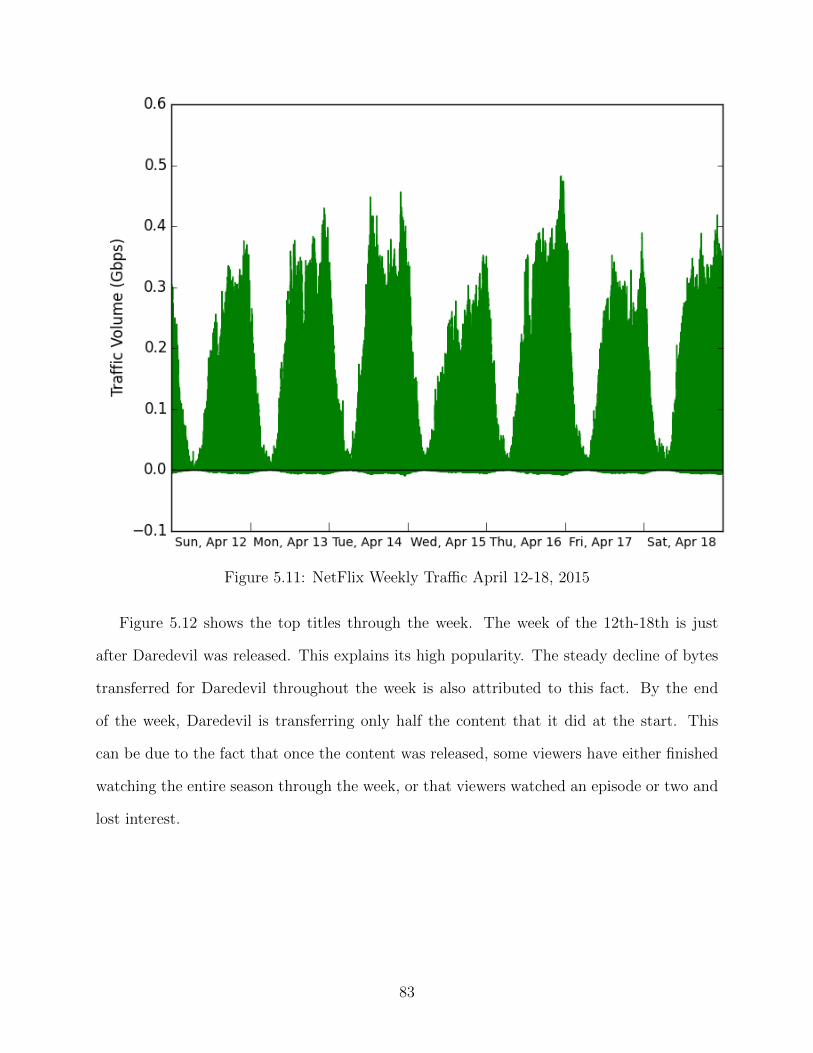
Figure 5.11: NetFlix Weekly Traffic April 12-18, 2015
Figure 5.12 shows the top titles through the week. The week of the 12th-18th is just
after Daredevil was released. This explains its high popularity. The steady decline of bytes
transferred for Daredevil throughout the week is also attributed to this fact. By the end
of the week, Daredevil is transferring only half the content that it did at the start. This
can be due to the fact that once the content was released, some viewers have either finished
watching the entire season through the week, or that viewers watched an episode or two and
lost interest.
83
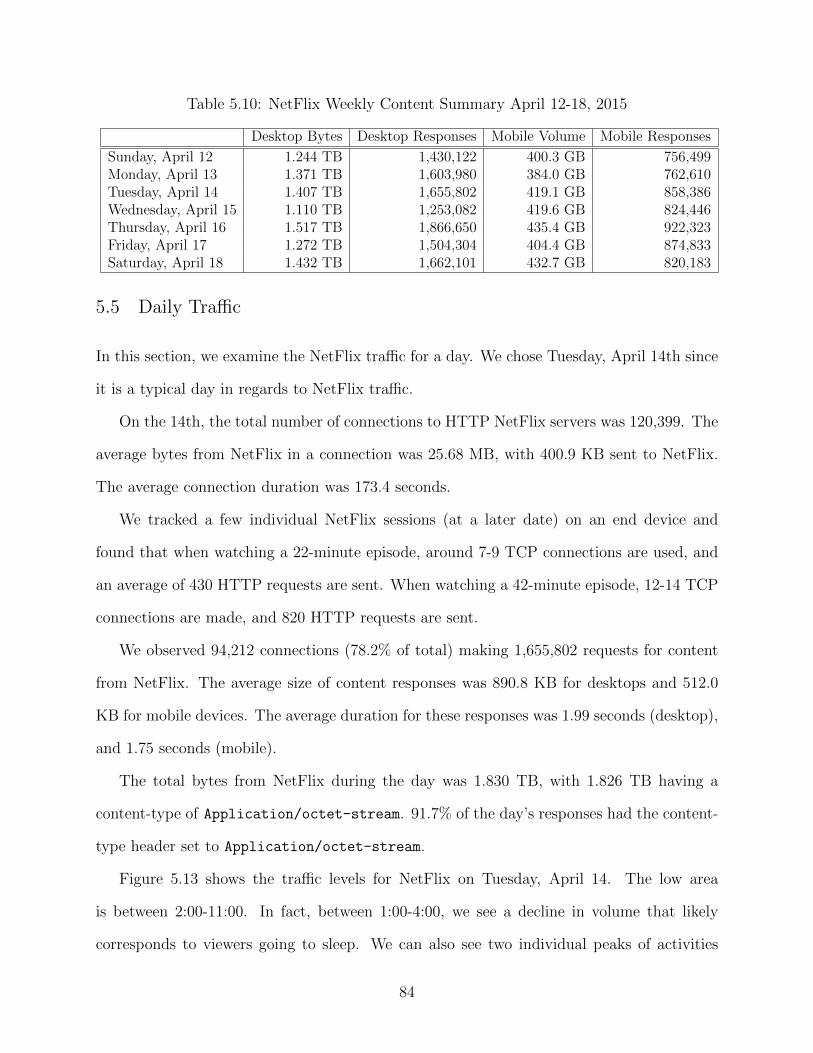
Table 5.10: NetFlix Weekly Content Summary April 12-18, 2015
Desktop Bytes Desktop Responses Mobile Volume Mobile Responses
Sunday, April 12 1.244 TB 1,430,122 400.3 GB 756,499Monday, April 13 1.371 TB 1,603,980 384.0 GB 762,610Tuesday, April 14 1.407 TB 1,655,802 419.1 GB 858,386Wednesday, April 15 1.110 TB 1,253,082 419.6 GB 824,446Thursday, April 16 1.517 TB 1,866,650 435.4 GB 922,323Friday, April 17 1.272 TB 1,504,304 404.4 GB 874,833Saturday, April 18 1.432 TB 1,662,101 432.7 GB 820,183
5.5 Daily Traffic
In this section, we examine the NetFlix traffic for a day. We chose Tuesday, April 14th since
it is a typical day in regards to NetFlix traffic.
On the 14th, the total number of connections to HTTP NetFlix servers was 120,399. The
average bytes from NetFlix in a connection was 25.68 MB, with 400.9 KB sent to NetFlix.
The average connection duration was 173.4 seconds.
We tracked a few individual NetFlix sessions (at a later date) on an end device and
found that when watching a 22-minute episode, around 7-9 TCP connections are used, and
an average of 430 HTTP requests are sent. When watching a 42-minute episode, 12-14 TCP
connections are made, and 820 HTTP requests are sent.
We observed 94,212 connections (78.2% of total) making 1,655,802 requests for content
from NetFlix. The average size of content responses was 890.8 KB for desktops and 512.0
KB for mobile devices. The average duration for these responses was 1.99 seconds (desktop),
and 1.75 seconds (mobile).
The total bytes from NetFlix during the day was 1.830 TB, with 1.826 TB having a
content-type of Application/octet-stream. 91.7% of the day’s responses had the content-
type header set to Application/octet-stream.
Figure 5.13 shows the traffic levels for NetFlix on Tuesday, April 14. The low area
is between 2:00-11:00. In fact, between 1:00-4:00, we see a decline in volume that likely
corresponds to viewers going to sleep. We can also see two individual peaks of activities
84
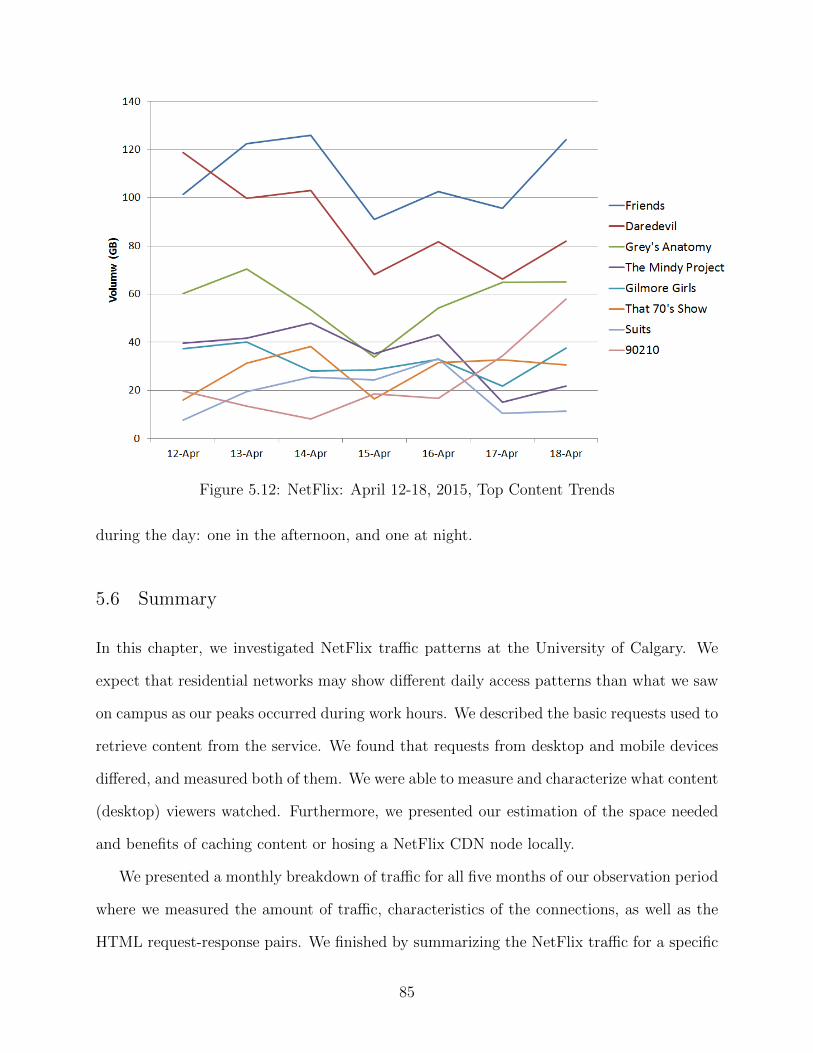
Figure 5.12: NetFlix: April 12-18, 2015, Top Content Trends
during the day: one in the afternoon, and one at night.
5.6 Summary
In this chapter, we investigated NetFlix traffic patterns at the University of Calgary. We
expect that residential networks may show different daily access patterns than what we saw
on campus as our peaks occurred during work hours. We described the basic requests used to
retrieve content from the service. We found that requests from desktop and mobile devices
differed, and measured both of them. We were able to measure and characterize what content
(desktop) viewers watched. Furthermore, we presented our estimation of the space needed
and benefits of caching content or hosing a NetFlix CDN node locally.
We presented a monthly breakdown of traffic for all five months of our observation period
where we measured the amount of traffic, characteristics of the connections, as well as the
HTML request-response pairs. We finished by summarizing the NetFlix traffic for a specific
85
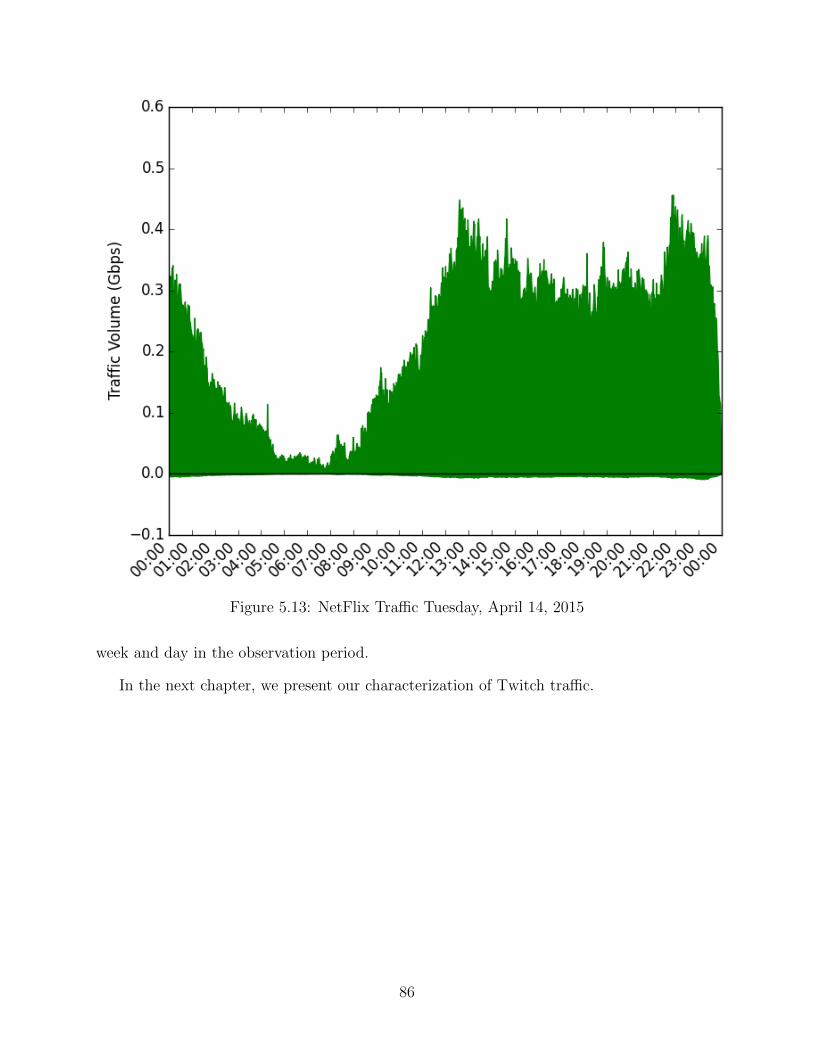
Figure 5.13: NetFlix Traffic Tuesday, April 14, 2015
week and day in the observation period.
In the next chapter, we present our characterization of Twitch traffic.
86
Chapter 6
Twitch Analysis
Twitch is a Web-based service that focuses on the live-streaming of non-sports games1. It
primarily hosts video-game streams, although there are occasional card or board games
featured as well. Twitch allows the streamer of a game to interact with viewers in (near)
real-time with the use of a chat room associated with the stream. There is a small delay
between the stream and real-time events, i.e., the stream shows events a few seconds after
the streamer has encountered them.
There is no mandatory login when visiting www.twitch.tv, unlike the case with NetFlix.
We will refer to Twitch users with two different terms for the rest of the chapter: a ‘streamer’
is a user who is creating content on Twitch, and a ‘viewer’ is a user who is viewing content
on Twitch.
6.1 Live-streaming
As previously stated, we see video content served from HLS Twitch servers. For simplicity,
we use the twitch.tv hosts instead of any other hosts for our examples (host names used
by Twitch are described in Appendix G), since there does not seem to be any difference in
requests made to them. Live-streamed content arrives from an HLS server that conforms to
the following naming scheme2:
video<i>.<Location><j>.hls.twitch.tv
1Additional details about Twitch can be found in the appendices. Twitch partnership and subscrip-tions are summarized in Appendix F, the interface is described in Appedix G, and VOD measurements arepresented in Appendix H.
2We have observed connections to Twitch servers after our observation period with the host names similarto video-edge-83612c.sfo01.hls.ttvnw.net, which does not conform to the previous schema.
87
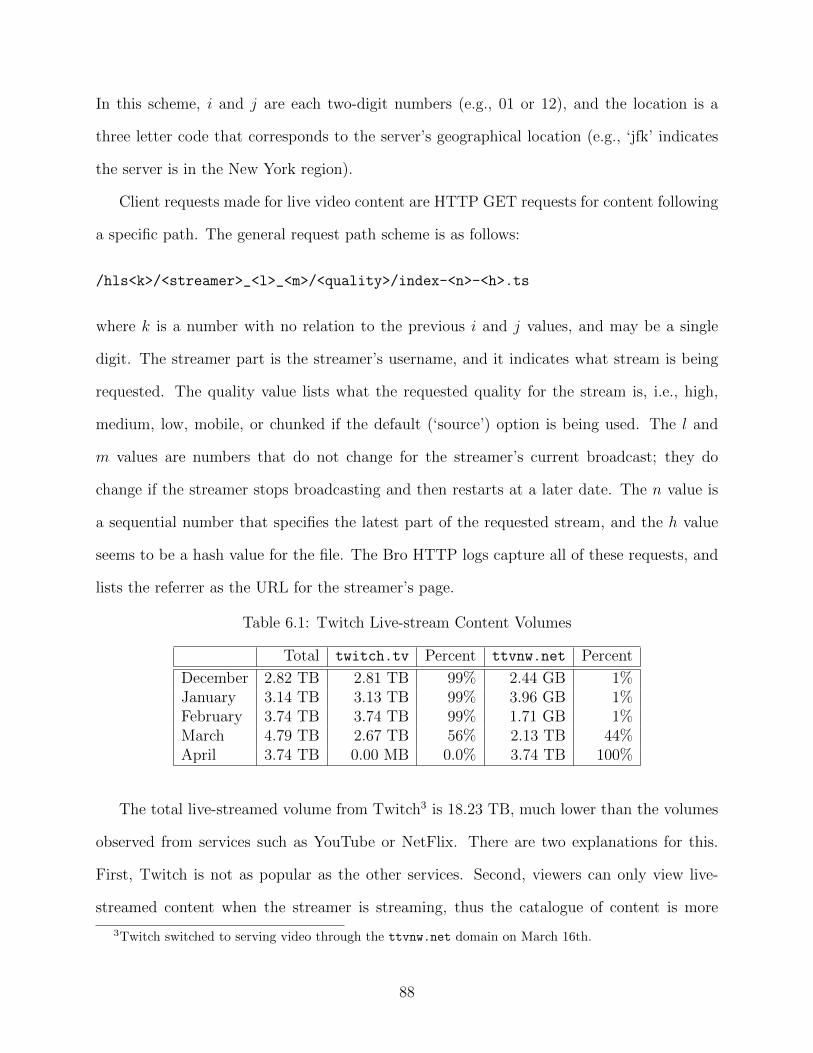
In this scheme, i and j are each two-digit numbers (e.g., 01 or 12), and the location is a
three letter code that corresponds to the server’s geographical location (e.g., ‘jfk’ indicates
the server is in the New York region).
Client requests made for live video content are HTTP GET requests for content following
a specific path. The general request path scheme is as follows:
/hls<k>/<streamer>_<l>_<m>/<quality>/index-<n>-<h>.ts
where k is a number with no relation to the previous i and j values, and may be a single
digit. The streamer part is the streamer’s username, and it indicates what stream is being
requested. The quality value lists what the requested quality for the stream is, i.e., high,
medium, low, mobile, or chunked if the default (‘source’) option is being used. The l and
m values are numbers that do not change for the streamer’s current broadcast; they do
change if the streamer stops broadcasting and then restarts at a later date. The n value is
a sequential number that specifies the latest part of the requested stream, and the h value
seems to be a hash value for the file. The Bro HTTP logs capture all of these requests, and
lists the referrer as the URL for the streamer’s page.
Table 6.1: Twitch Live-stream Content Volumes
Total twitch.tv Percent ttvnw.net Percent
December 2.82 TB 2.81 TB 99% 2.44 GB 1%January 3.14 TB 3.13 TB 99% 3.96 GB 1%February 3.74 TB 3.74 TB 99% 1.71 GB 1%March 4.79 TB 2.67 TB 56% 2.13 TB 44%April 3.74 TB 0.00 MB 0.0% 3.74 TB 100%
The total live-streamed volume from Twitch3 is 18.23 TB, much lower than the volumes
observed from services such as YouTube or NetFlix. There are two explanations for this.
First, Twitch is not as popular as the other services. Second, viewers can only view live-
streamed content when the streamer is streaming, thus the catalogue of content is more
3Twitch switched to serving video through the ttvnw.net domain on March 16th.
88
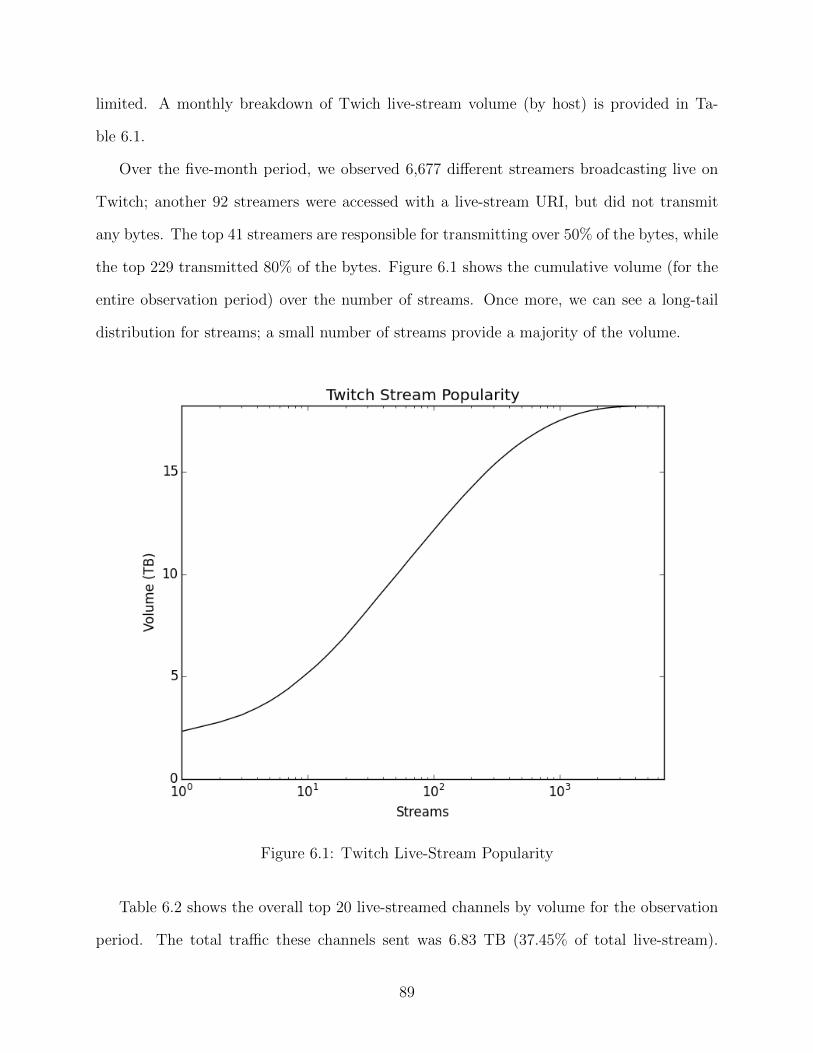
limited. A monthly breakdown of Twich live-stream volume (by host) is provided in Ta-
ble 6.1.
Over the five-month period, we observed 6,677 different streamers broadcasting live on
Twitch; another 92 streamers were accessed with a live-stream URI, but did not transmit
any bytes. The top 41 streamers are responsible for transmitting over 50% of the bytes, while
the top 229 transmitted 80% of the bytes. Figure 6.1 shows the cumulative volume (for the
entire observation period) over the number of streams. Once more, we can see a long-tail
distribution for streams; a small number of streams provide a majority of the volume.
Figure 6.1: Twitch Live-Stream Popularity
Table 6.2 shows the overall top 20 live-streamed channels by volume for the observation
period. The total traffic these channels sent was 6.83 TB (37.45% of total live-stream).
89
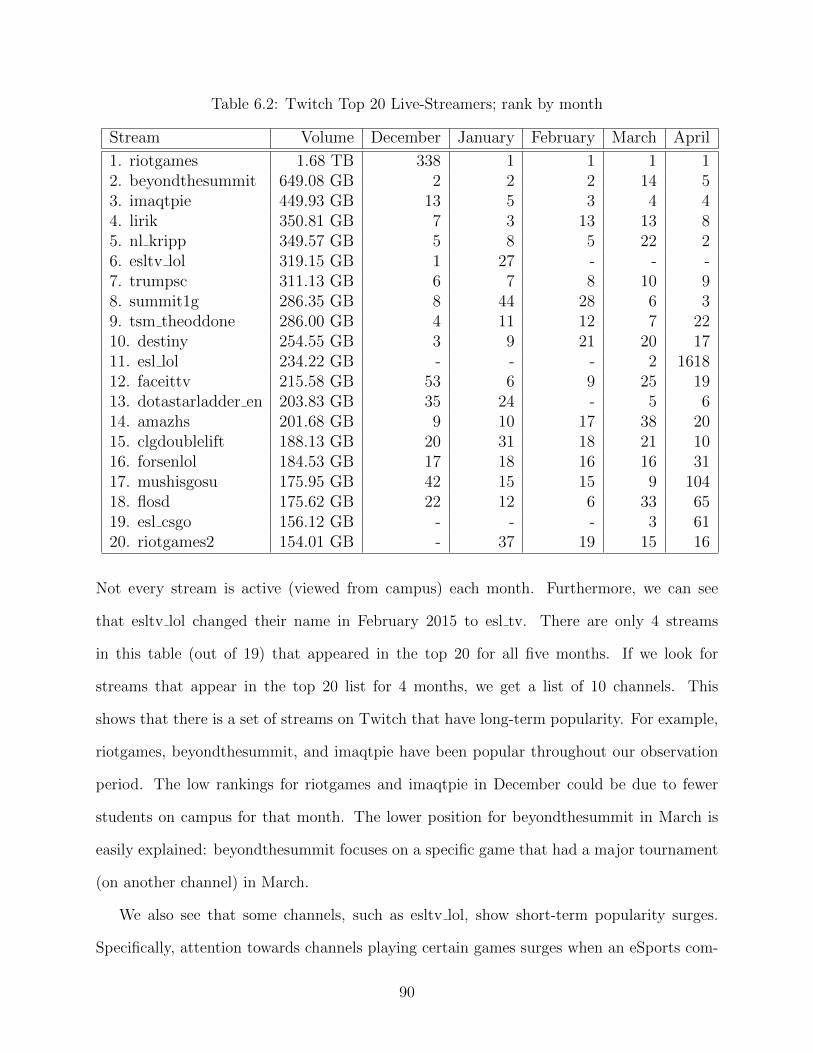
Table 6.2: Twitch Top 20 Live-Streamers; rank by month
Stream Volume December January February March April
1. riotgames 1.68 TB 338 1 1 1 12. beyondthesummit 649.08 GB 2 2 2 14 53. imaqtpie 449.93 GB 13 5 3 4 44. lirik 350.81 GB 7 3 13 13 85. nl kripp 349.57 GB 5 8 5 22 26. esltv lol 319.15 GB 1 27 - - -7. trumpsc 311.13 GB 6 7 8 10 98. summit1g 286.35 GB 8 44 28 6 39. tsm theoddone 286.00 GB 4 11 12 7 2210. destiny 254.55 GB 3 9 21 20 1711. esl lol 234.22 GB - - - 2 161812. faceittv 215.58 GB 53 6 9 25 1913. dotastarladder en 203.83 GB 35 24 - 5 614. amazhs 201.68 GB 9 10 17 38 2015. clgdoublelift 188.13 GB 20 31 18 21 1016. forsenlol 184.53 GB 17 18 16 16 3117. mushisgosu 175.95 GB 42 15 15 9 10418. flosd 175.62 GB 22 12 6 33 6519. esl csgo 156.12 GB - - - 3 6120. riotgames2 154.01 GB - 37 19 15 16
Not every stream is active (viewed from campus) each month. Furthermore, we can see
that esltv lol changed their name in February 2015 to esl tv. There are only 4 streams
in this table (out of 19) that appeared in the top 20 for all five months. If we look for
streams that appear in the top 20 list for 4 months, we get a list of 10 channels. This
shows that there is a set of streams on Twitch that have long-term popularity. For example,
riotgames, beyondthesummit, and imaqtpie have been popular throughout our observation
period. The low rankings for riotgames and imaqtpie in December could be due to fewer
students on campus for that month. The lower position for beyondthesummit in March is
easily explained: beyondthesummit focuses on a specific game that had a major tournament
(on another channel) in March.
We also see that some channels, such as esltv lol, show short-term popularity surges.
Specifically, attention towards channels playing certain games surges when an eSports com-
90
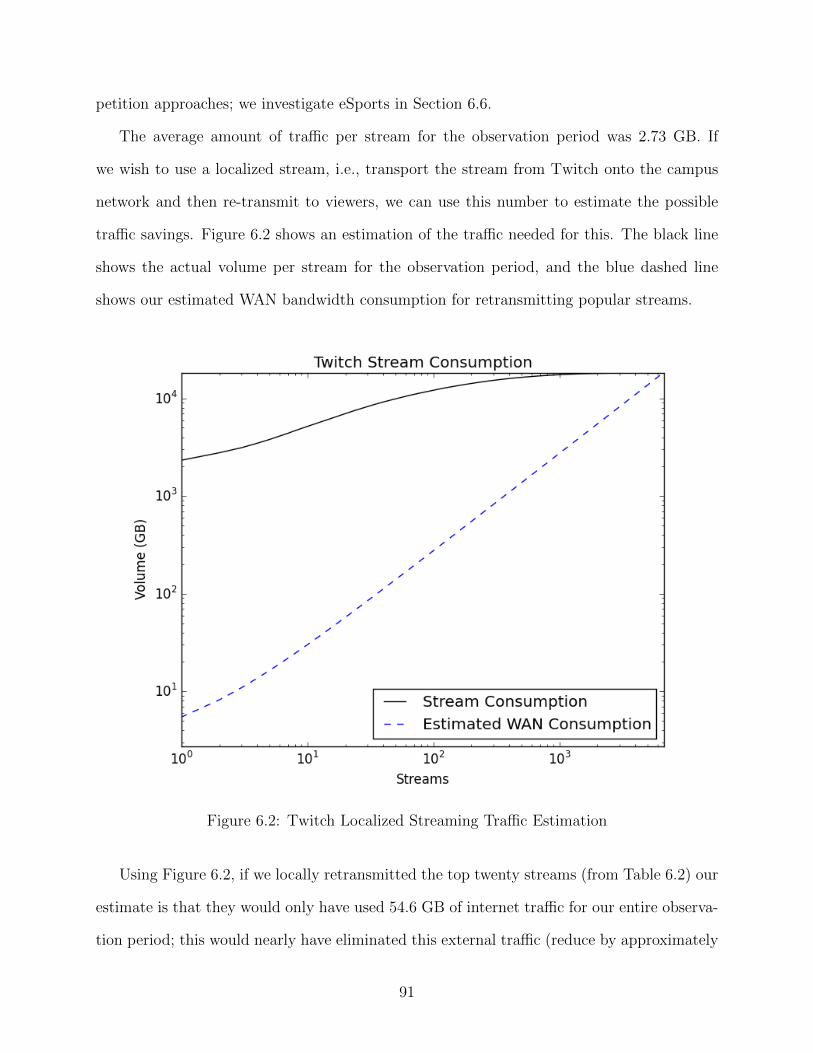
petition approaches; we investigate eSports in Section 6.6.
The average amount of traffic per stream for the observation period was 2.73 GB. If
we wish to use a localized stream, i.e., transport the stream from Twitch onto the campus
network and then re-transmit to viewers, we can use this number to estimate the possible
traffic savings. Figure 6.2 shows an estimation of the traffic needed for this. The black line
shows the actual volume per stream for the observation period, and the blue dashed line
shows our estimated WAN bandwidth consumption for retransmitting popular streams.
Figure 6.2: Twitch Localized Streaming Traffic Estimation
Using Figure 6.2, if we locally retransmitted the top twenty streams (from Table 6.2) our
estimate is that they would only have used 54.6 GB of internet traffic for our entire observa-
tion period; this would nearly have eliminated this external traffic (reduce by approximately
91
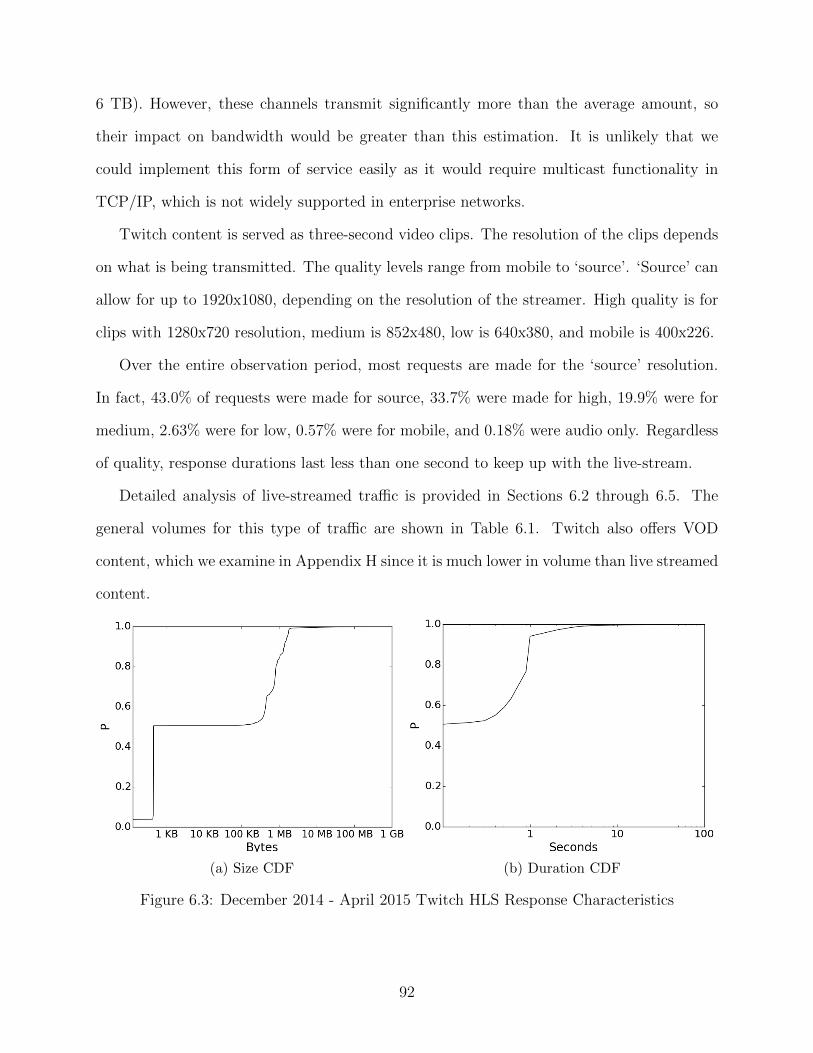
6 TB). However, these channels transmit significantly more than the average amount, so
their impact on bandwidth would be greater than this estimation. It is unlikely that we
could implement this form of service easily as it would require multicast functionality in
TCP/IP, which is not widely supported in enterprise networks.
Twitch content is served as three-second video clips. The resolution of the clips depends
on what is being transmitted. The quality levels range from mobile to ‘source’. ‘Source’ can
allow for up to 1920x1080, depending on the resolution of the streamer. High quality is for
clips with 1280x720 resolution, medium is 852x480, low is 640x380, and mobile is 400x226.
Over the entire observation period, most requests are made for the ‘source’ resolution.
In fact, 43.0% of requests were made for source, 33.7% were made for high, 19.9% were for
medium, 2.63% were for low, 0.57% were for mobile, and 0.18% were audio only. Regardless
of quality, response durations last less than one second to keep up with the live-stream.
Detailed analysis of live-streamed traffic is provided in Sections 6.2 through 6.5. The
general volumes for this type of traffic are shown in Table 6.1. Twitch also offers VOD
content, which we examine in Appendix H since it is much lower in volume than live streamed
content.
(a) Size CDF (b) Duration CDF
Figure 6.3: December 2014 - April 2015 Twitch HLS Response Characteristics
92
Requests for live-stream content from Twitch all have a body length and duration of zero.
Responses, on the other hand, are more varied. The size of the response depends on the re-
quested quality; high resolution videos can be very large. Figure 6.3a shows the response size
CDF for Twitch. There is a definite step behaviour in this graph. This is due to browsers in-
teracting with Apple HLS making two requests: one returns the video content, and the other
does not. The second request results in a much smaller Application/vnd.apple.mpegurl
response.
Figure 6.3b shows the response duration CDF for HLS content. Most of the responses
finish in less than one second. In this case, having very quick responses is important to the
quality of the content. If the response takes too long, then the user experience is greatly
diminished.
6.1.1 Hosting
A streamer may ‘host’ another streamer. We refer to the user whose content is being streamed
as the streamer, and the user who is hosting the streamer as the host. When this takes place,
the host will broadcast the streamer’s content. We can detect when a streamer is being hosted
in the Bro logs, since the referrer fields of the HTTP request-response pairs indicates the
host and not the streamer.
We see some traffic where one streamer is hosting another. The overall volume of this is
pretty low. In December 2014, this amounted to 20.84 GB. In January 2015, it was 47.36
GB, February was 61.18 GB, March was 64.33 GB, and finally, in April it was 58.87 GB.
The most bytes viewed from a single host-streamer pair in a month was in January when
7.12 GB was transferred.
93
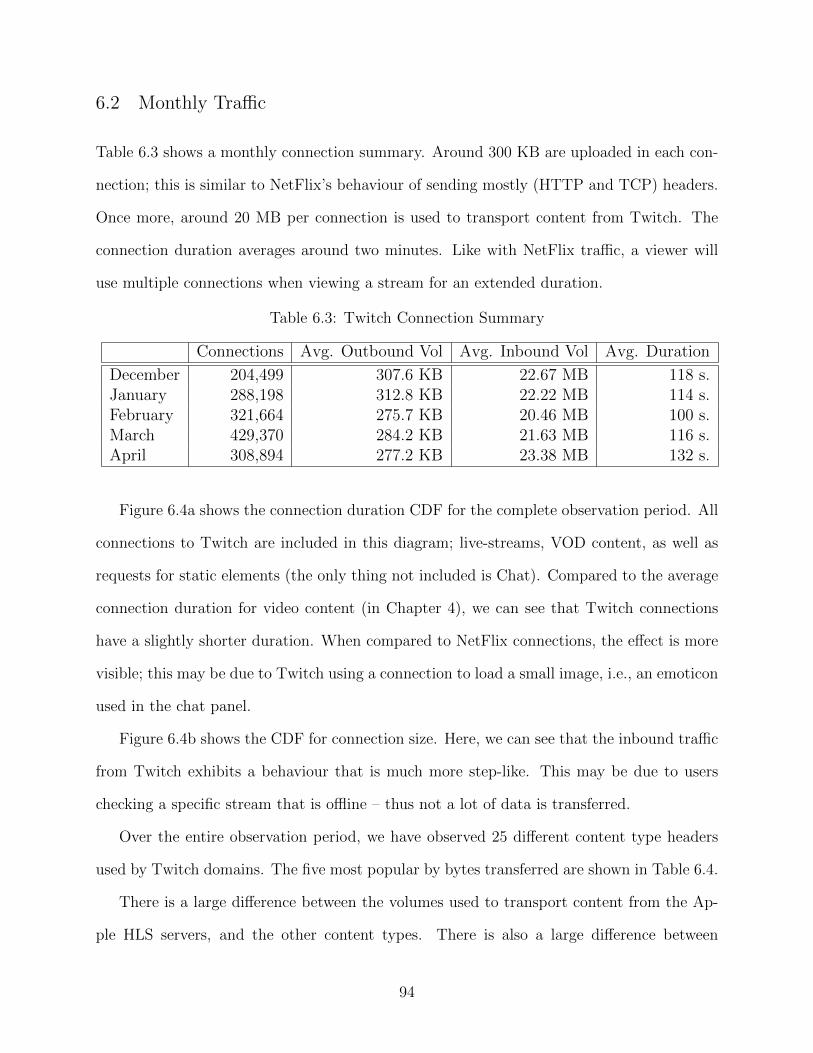
6.2 Monthly Traffic
Table 6.3 shows a monthly connection summary. Around 300 KB are uploaded in each con-
nection; this is similar to NetFlix’s behaviour of sending mostly (HTTP and TCP) headers.
Once more, around 20 MB per connection is used to transport content from Twitch. The
connection duration averages around two minutes. Like with NetFlix traffic, a viewer will
use multiple connections when viewing a stream for an extended duration.
Table 6.3: Twitch Connection Summary
Connections Avg. Outbound Vol Avg. Inbound Vol Avg. Duration
December 204,499 307.6 KB 22.67 MB 118 s.January 288,198 312.8 KB 22.22 MB 114 s.February 321,664 275.7 KB 20.46 MB 100 s.March 429,370 284.2 KB 21.63 MB 116 s.April 308,894 277.2 KB 23.38 MB 132 s.
Figure 6.4a shows the connection duration CDF for the complete observation period. All
connections to Twitch are included in this diagram; live-streams, VOD content, as well as
requests for static elements (the only thing not included is Chat). Compared to the average
connection duration for video content (in Chapter 4), we can see that Twitch connections
have a slightly shorter duration. When compared to NetFlix connections, the effect is more
visible; this may be due to Twitch using a connection to load a small image, i.e., an emoticon
used in the chat panel.
Figure 6.4b shows the CDF for connection size. Here, we can see that the inbound traffic
from Twitch exhibits a behaviour that is much more step-like. This may be due to users
checking a specific stream that is offline – thus not a lot of data is transferred.
Over the entire observation period, we have observed 25 different content type headers
used by Twitch domains. The five most popular by bytes transferred are shown in Table 6.4.
There is a large difference between the volumes used to transport content from the Ap-
ple HLS servers, and the other content types. There is also a large difference between
94
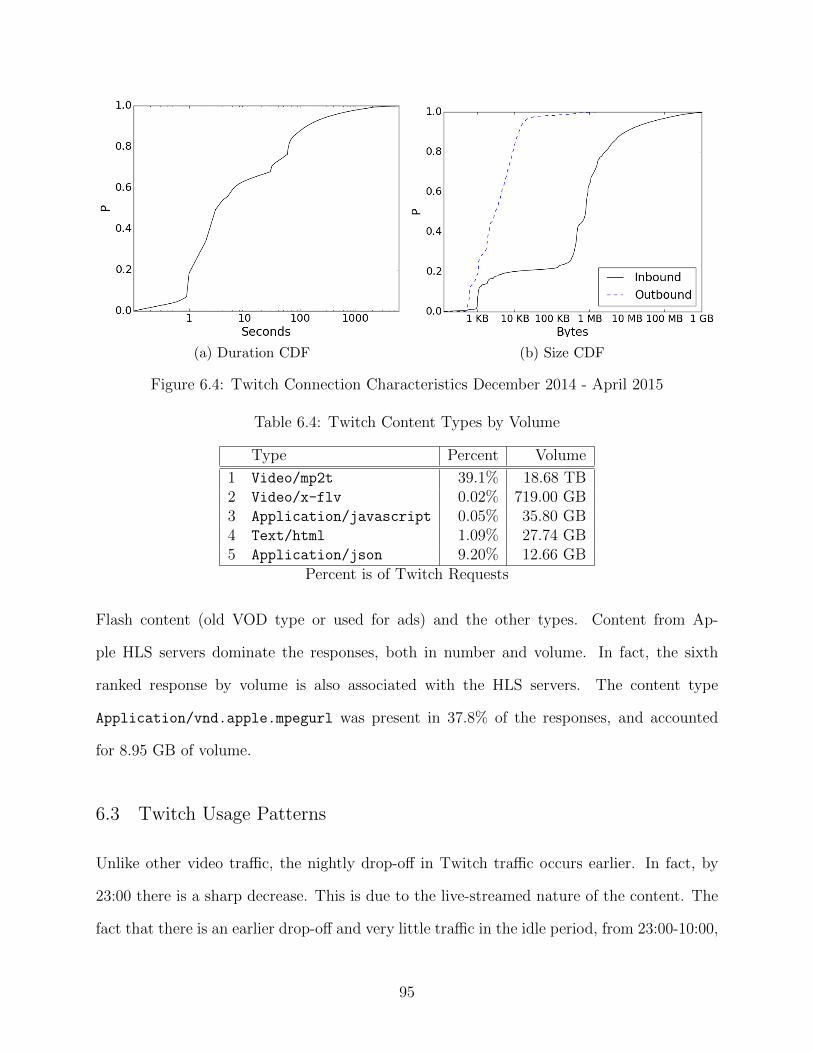
(a) Duration CDF (b) Size CDF
Figure 6.4: Twitch Connection Characteristics December 2014 - April 2015
Table 6.4: Twitch Content Types by Volume
Type Percent Volume
1 Video/mp2t 39.1% 18.68 TB2 Video/x-flv 0.02% 719.00 GB3 Application/javascript 0.05% 35.80 GB4 Text/html 1.09% 27.74 GB5 Application/json 9.20% 12.66 GB
Percent is of Twitch Requests
Flash content (old VOD type or used for ads) and the other types. Content from Ap-
ple HLS servers dominate the responses, both in number and volume. In fact, the sixth
ranked response by volume is also associated with the HLS servers. The content type
Application/vnd.apple.mpegurl was present in 37.8% of the responses, and accounted
for 8.95 GB of volume.
6.3 Twitch Usage Patterns
Unlike other video traffic, the nightly drop-off in Twitch traffic occurs earlier. In fact, by
23:00 there is a sharp decrease. This is due to the live-streamed nature of the content. The
fact that there is an earlier drop-off and very little traffic in the idle period, from 23:00-10:00,
95
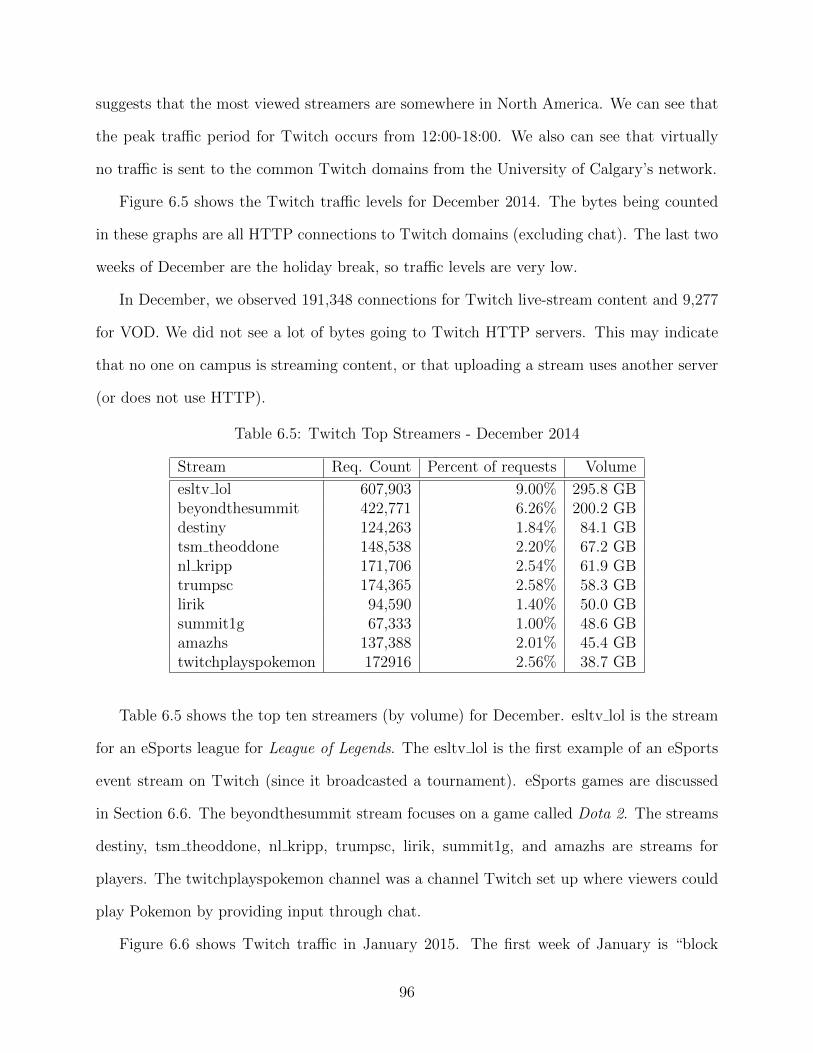
suggests that the most viewed streamers are somewhere in North America. We can see that
the peak traffic period for Twitch occurs from 12:00-18:00. We also can see that virtually
no traffic is sent to the common Twitch domains from the University of Calgary’s network.
Figure 6.5 shows the Twitch traffic levels for December 2014. The bytes being counted
in these graphs are all HTTP connections to Twitch domains (excluding chat). The last two
weeks of December are the holiday break, so traffic levels are very low.
In December, we observed 191,348 connections for Twitch live-stream content and 9,277
for VOD. We did not see a lot of bytes going to Twitch HTTP servers. This may indicate
that no one on campus is streaming content, or that uploading a stream uses another server
(or does not use HTTP).
Table 6.5: Twitch Top Streamers - December 2014
Stream Req. Count Percent of requests Volume
esltv lol 607,903 9.00% 295.8 GBbeyondthesummit 422,771 6.26% 200.2 GBdestiny 124,263 1.84% 84.1 GBtsm theoddone 148,538 2.20% 67.2 GBnl kripp 171,706 2.54% 61.9 GBtrumpsc 174,365 2.58% 58.3 GBlirik 94,590 1.40% 50.0 GBsummit1g 67,333 1.00% 48.6 GBamazhs 137,388 2.01% 45.4 GBtwitchplayspokemon 172916 2.56% 38.7 GB
Table 6.5 shows the top ten streamers (by volume) for December. esltv lol is the stream
for an eSports league for League of Legends. The esltv lol is the first example of an eSports
event stream on Twitch (since it broadcasted a tournament). eSports games are discussed
in Section 6.6. The beyondthesummit stream focuses on a game called Dota 2. The streams
destiny, tsm theoddone, nl kripp, trumpsc, lirik, summit1g, and amazhs are streams for
players. The twitchplayspokemon channel was a channel Twitch set up where viewers could
play Pokemon by providing input through chat.
Figure 6.6 shows Twitch traffic in January 2015. The first week of January is “block
96
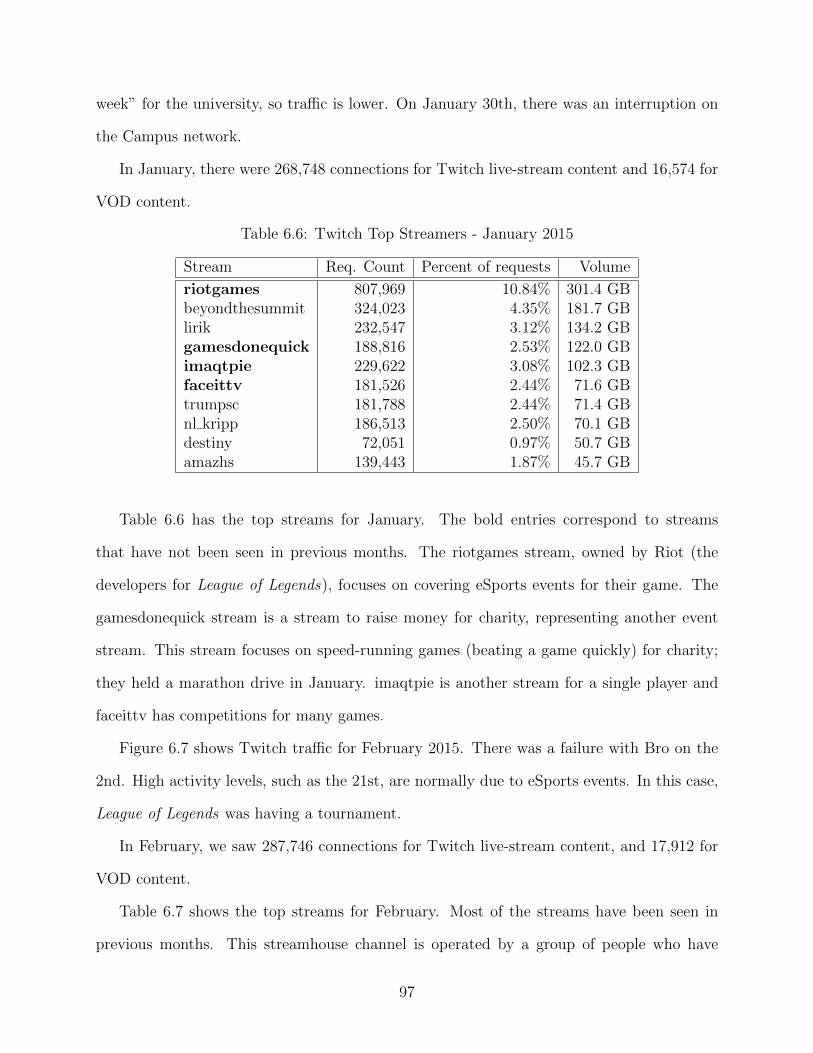
week” for the university, so traffic is lower. On January 30th, there was an interruption on
the Campus network.
In January, there were 268,748 connections for Twitch live-stream content and 16,574 for
VOD content.
Table 6.6: Twitch Top Streamers - January 2015
Stream Req. Count Percent of requests Volume
riotgames 807,969 10.84% 301.4 GBbeyondthesummit 324,023 4.35% 181.7 GBlirik 232,547 3.12% 134.2 GBgamesdonequick 188,816 2.53% 122.0 GBimaqtpie 229,622 3.08% 102.3 GBfaceittv 181,526 2.44% 71.6 GBtrumpsc 181,788 2.44% 71.4 GBnl kripp 186,513 2.50% 70.1 GBdestiny 72,051 0.97% 50.7 GBamazhs 139,443 1.87% 45.7 GB
Table 6.6 has the top streams for January. The bold entries correspond to streams
that have not been seen in previous months. The riotgames stream, owned by Riot (the
developers for League of Legends), focuses on covering eSports events for their game. The
gamesdonequick stream is a stream to raise money for charity, representing another event
stream. This stream focuses on speed-running games (beating a game quickly) for charity;
they held a marathon drive in January. imaqtpie is another stream for a single player and
faceittv has competitions for many games.
Figure 6.7 shows Twitch traffic for February 2015. There was a failure with Bro on the
2nd. High activity levels, such as the 21st, are normally due to eSports events. In this case,
League of Legends was having a tournament.
In February, we saw 287,746 connections for Twitch live-stream content, and 17,912 for
VOD content.
Table 6.7 shows the top streams for February. Most of the streams have been seen in
previous months. This streamhouse channel is operated by a group of people who have
97
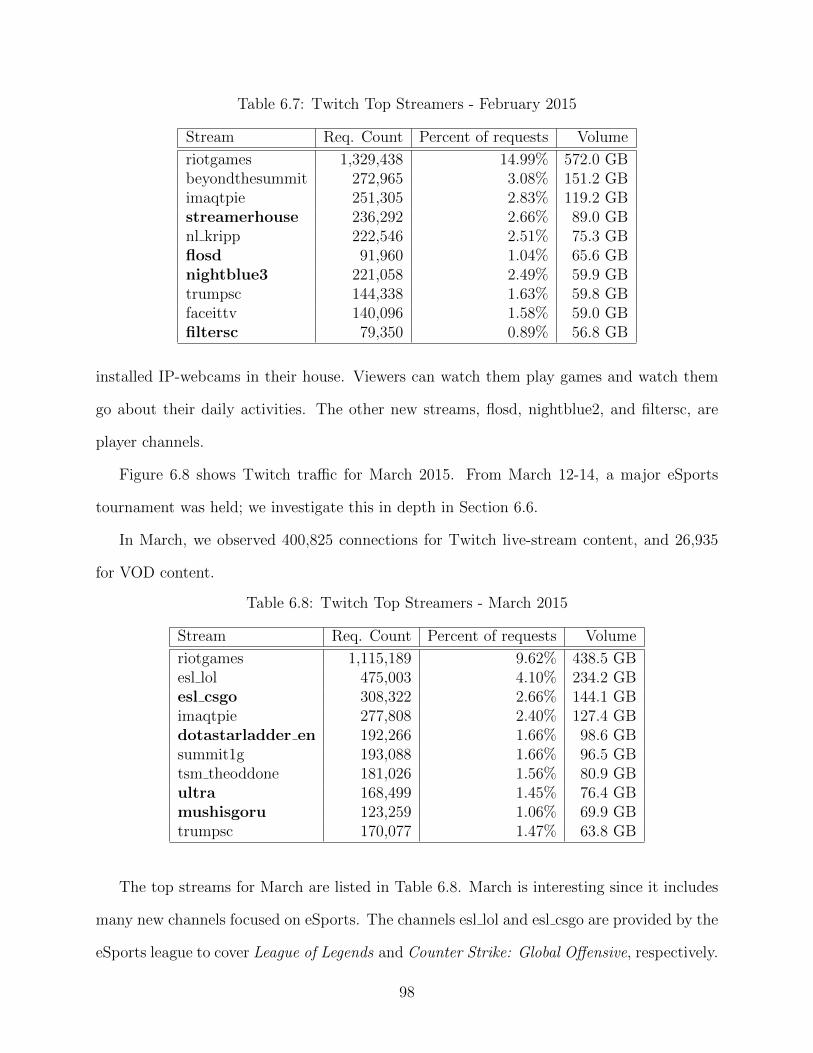
Table 6.7: Twitch Top Streamers - February 2015
Stream Req. Count Percent of requests Volume
riotgames 1,329,438 14.99% 572.0 GBbeyondthesummit 272,965 3.08% 151.2 GBimaqtpie 251,305 2.83% 119.2 GBstreamerhouse 236,292 2.66% 89.0 GBnl kripp 222,546 2.51% 75.3 GBflosd 91,960 1.04% 65.6 GBnightblue3 221,058 2.49% 59.9 GBtrumpsc 144,338 1.63% 59.8 GBfaceittv 140,096 1.58% 59.0 GBfiltersc 79,350 0.89% 56.8 GB
installed IP-webcams in their house. Viewers can watch them play games and watch them
go about their daily activities. The other new streams, flosd, nightblue2, and filtersc, are
player channels.
Figure 6.8 shows Twitch traffic for March 2015. From March 12-14, a major eSports
tournament was held; we investigate this in depth in Section 6.6.
In March, we observed 400,825 connections for Twitch live-stream content, and 26,935
for VOD content.
Table 6.8: Twitch Top Streamers - March 2015
Stream Req. Count Percent of requests Volume
riotgames 1,115,189 9.62% 438.5 GBesl lol 475,003 4.10% 234.2 GBesl csgo 308,322 2.66% 144.1 GBimaqtpie 277,808 2.40% 127.4 GBdotastarladder en 192,266 1.66% 98.6 GBsummit1g 193,088 1.66% 96.5 GBtsm theoddone 181,026 1.56% 80.9 GBultra 168,499 1.45% 76.4 GBmushisgoru 123,259 1.06% 69.9 GBtrumpsc 170,077 1.47% 63.8 GB
The top streams for March are listed in Table 6.8. March is interesting since it includes
many new channels focused on eSports. The channels esl lol and esl csgo are provided by the
eSports league to cover League of Legends and Counter Strike: Global Offensive, respectively.
98
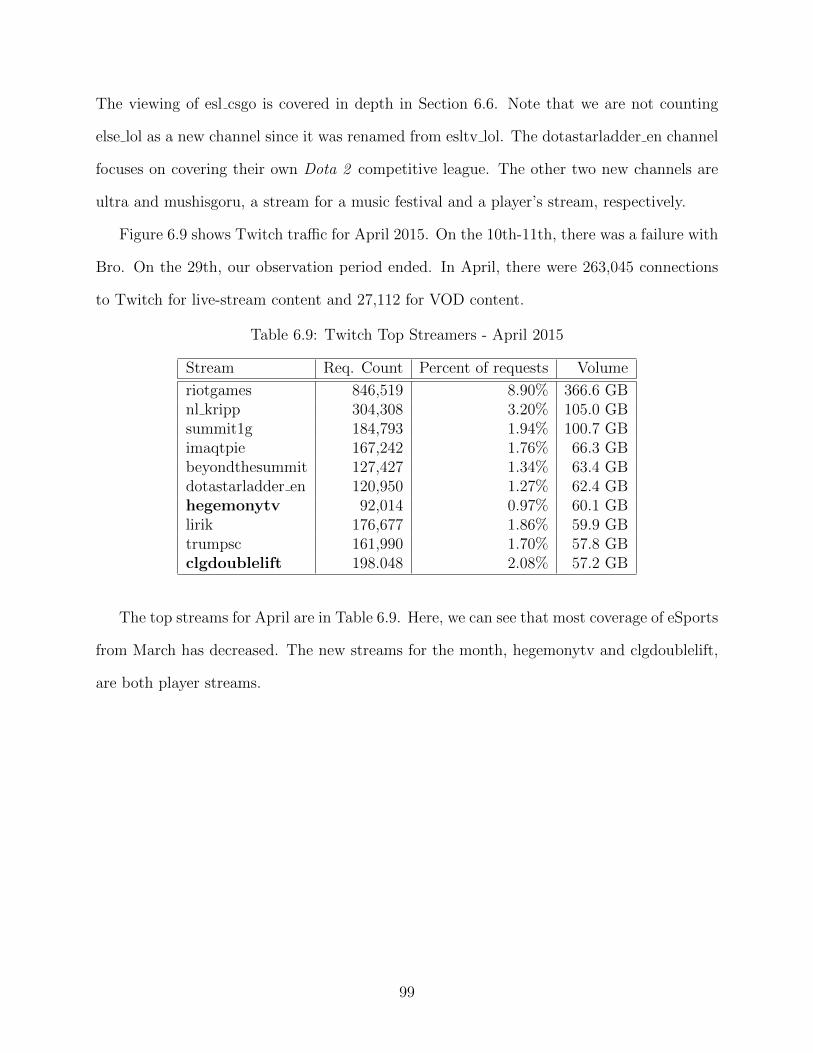
The viewing of esl csgo is covered in depth in Section 6.6. Note that we are not counting
else lol as a new channel since it was renamed from esltv lol. The dotastarladder en channel
focuses on covering their own Dota 2 competitive league. The other two new channels are
ultra and mushisgoru, a stream for a music festival and a player’s stream, respectively.
Figure 6.9 shows Twitch traffic for April 2015. On the 10th-11th, there was a failure with
Bro. On the 29th, our observation period ended. In April, there were 263,045 connections
to Twitch for live-stream content and 27,112 for VOD content.
Table 6.9: Twitch Top Streamers - April 2015
Stream Req. Count Percent of requests Volume
riotgames 846,519 8.90% 366.6 GBnl kripp 304,308 3.20% 105.0 GBsummit1g 184,793 1.94% 100.7 GBimaqtpie 167,242 1.76% 66.3 GBbeyondthesummit 127,427 1.34% 63.4 GBdotastarladder en 120,950 1.27% 62.4 GBhegemonytv 92,014 0.97% 60.1 GBlirik 176,677 1.86% 59.9 GBtrumpsc 161,990 1.70% 57.8 GBclgdoublelift 198.048 2.08% 57.2 GB
The top streams for April are in Table 6.9. Here, we can see that most coverage of eSports
from March has decreased. The new streams for the month, hegemonytv and clgdoublelift,
are both player streams.
99
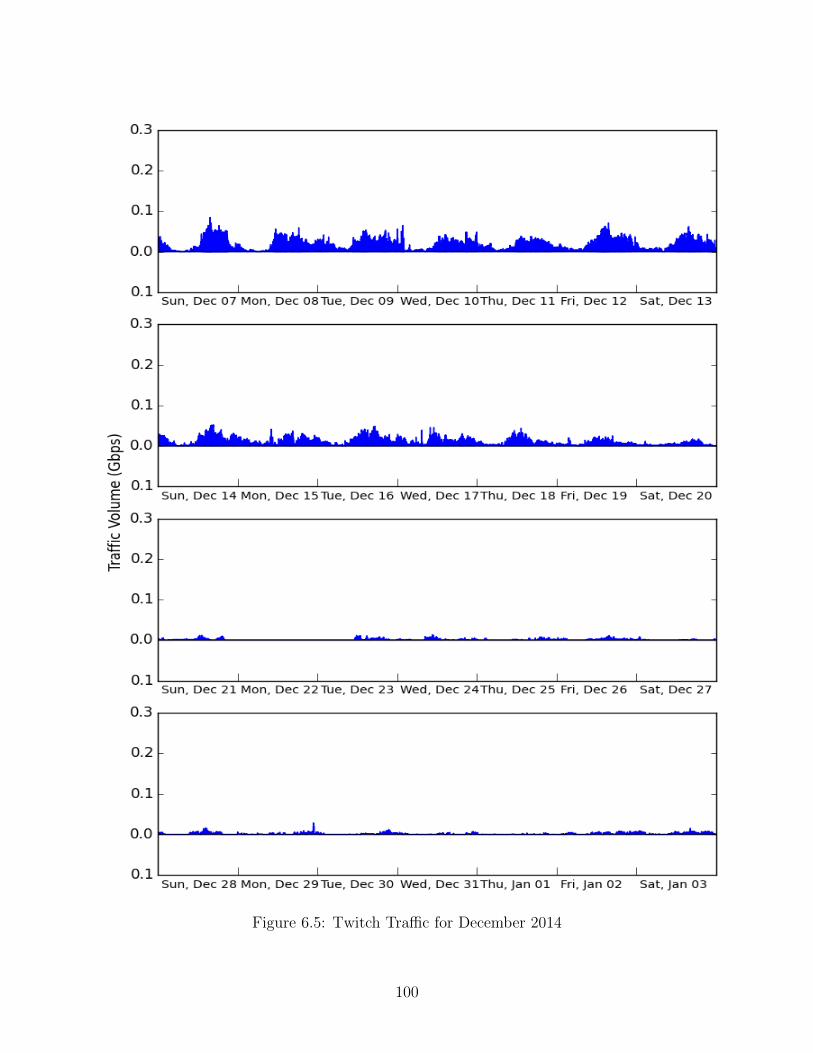
Figure 6.5: Twitch Traffic for December 2014
100
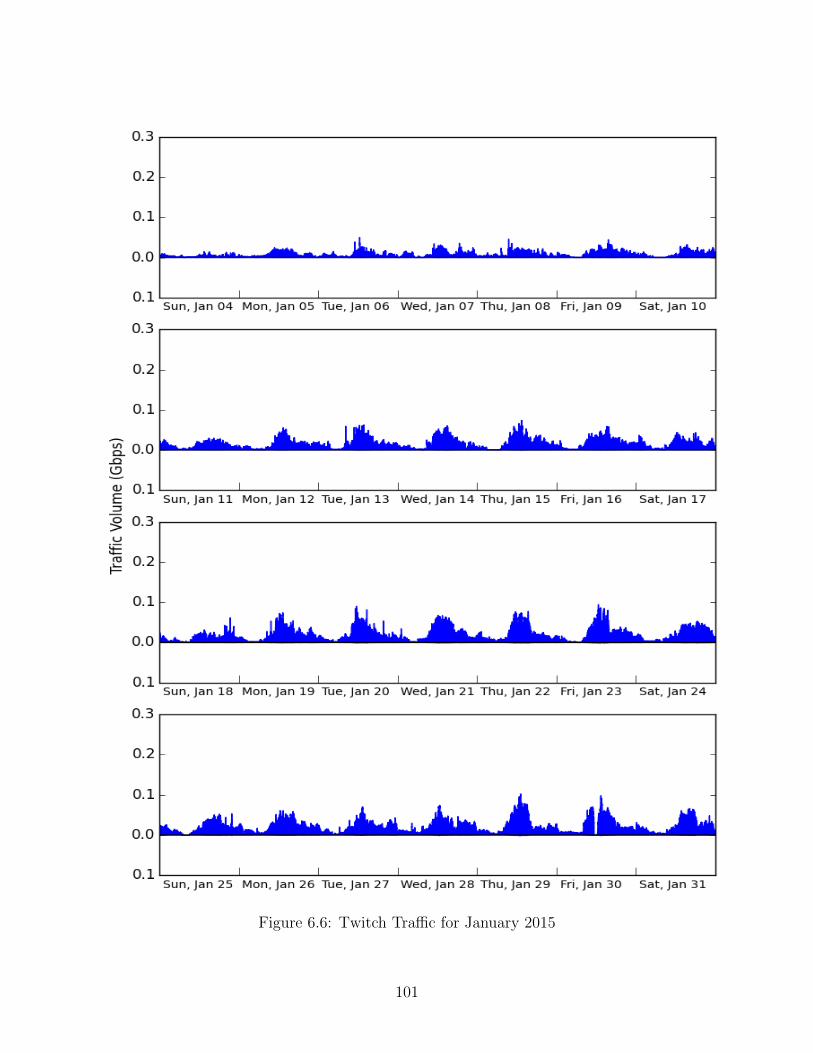
Figure 6.6: Twitch Traffic for January 2015
101
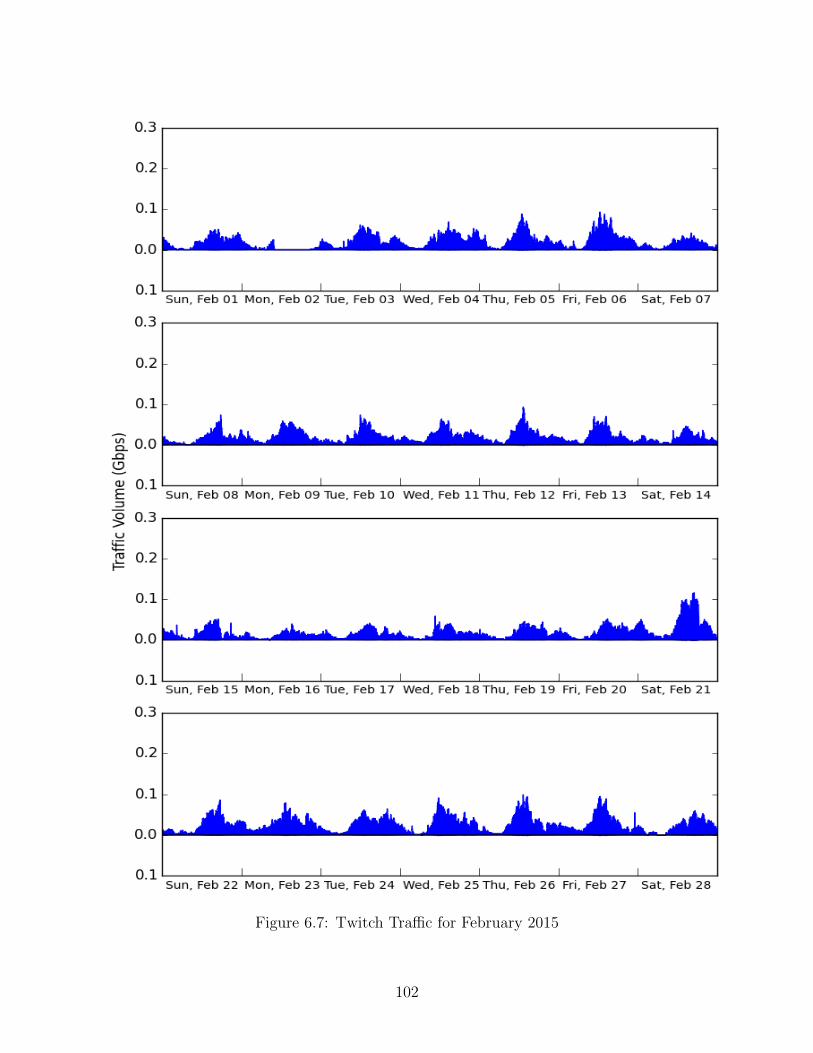
Figure 6.7: Twitch Traffic for February 2015
102
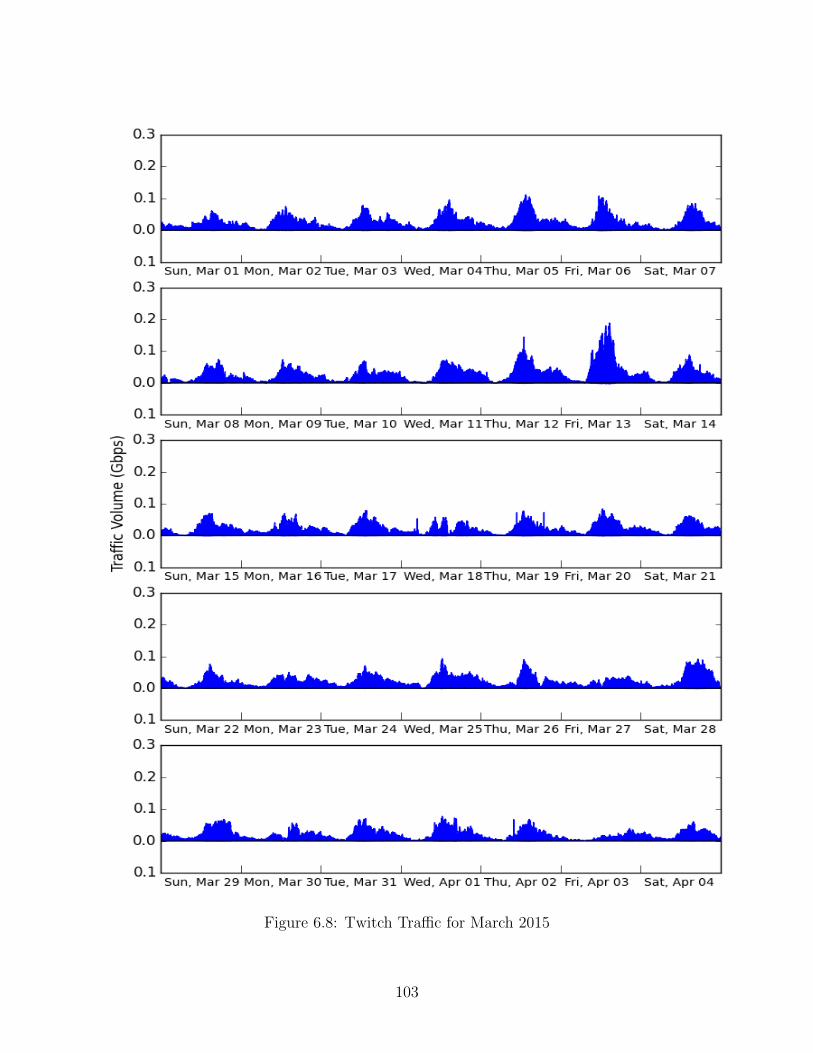
Figure 6.8: Twitch Traffic for March 2015
103
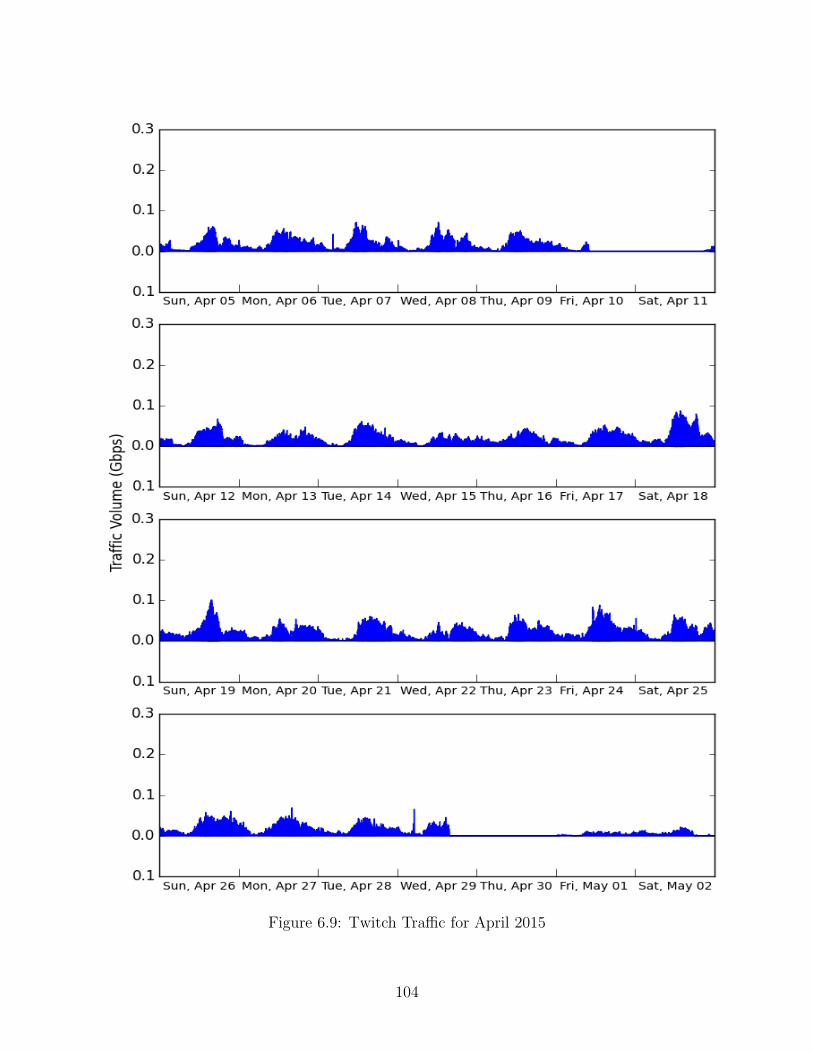
Figure 6.9: Twitch Traffic for April 2015
104
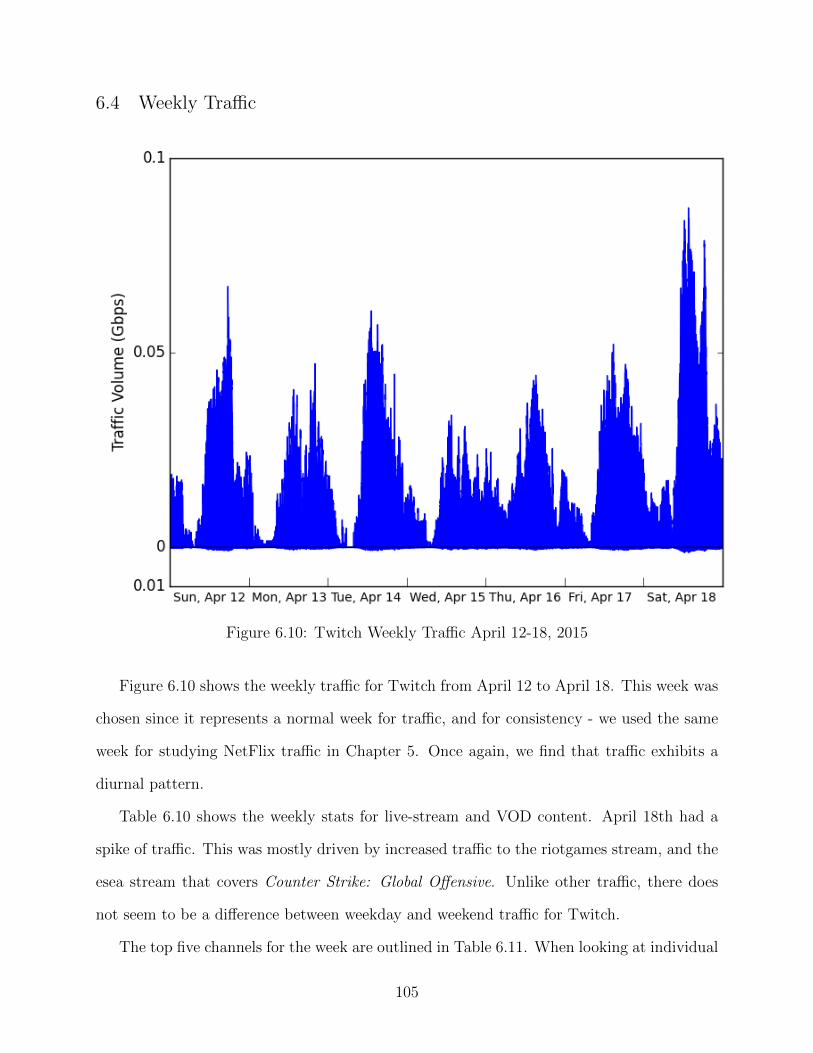
6.4 Weekly Traffic
Figure 6.10: Twitch Weekly Traffic April 12-18, 2015
Figure 6.10 shows the weekly traffic for Twitch from April 12 to April 18. This week was
chosen since it represents a normal week for traffic, and for consistency - we used the same
week for studying NetFlix traffic in Chapter 5. Once again, we find that traffic exhibits a
diurnal pattern.
Table 6.10 shows the weekly stats for live-stream and VOD content. April 18th had a
spike of traffic. This was mostly driven by increased traffic to the riotgames stream, and the
esea stream that covers Counter Strike: Global Offensive. Unlike other traffic, there does
not seem to be a difference between weekday and weekend traffic for Twitch.
The top five channels for the week are outlined in Table 6.11. When looking at individual
105
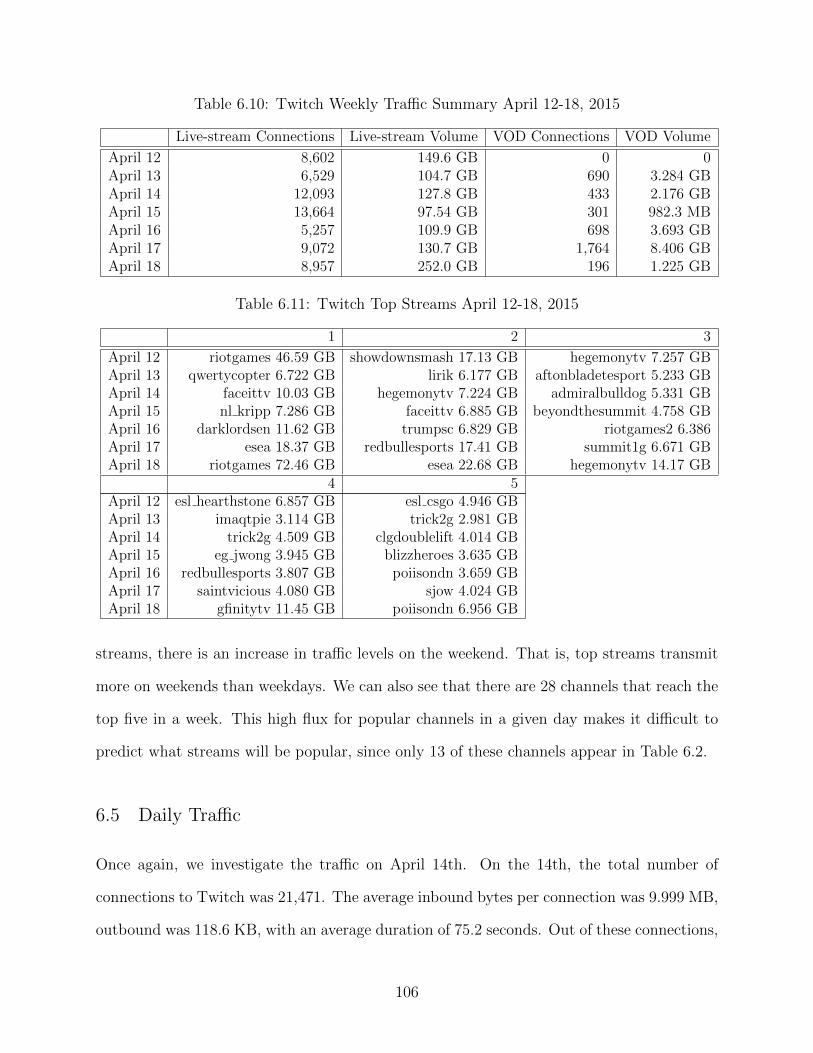
Table 6.10: Twitch Weekly Traffic Summary April 12-18, 2015
Live-stream Connections Live-stream Volume VOD Connections VOD Volume
April 12 8,602 149.6 GB 0 0April 13 6,529 104.7 GB 690 3.284 GBApril 14 12,093 127.8 GB 433 2.176 GBApril 15 13,664 97.54 GB 301 982.3 MBApril 16 5,257 109.9 GB 698 3.693 GBApril 17 9,072 130.7 GB 1,764 8.406 GBApril 18 8,957 252.0 GB 196 1.225 GB
Table 6.11: Twitch Top Streams April 12-18, 2015
1 2 3
April 12 riotgames 46.59 GB showdownsmash 17.13 GB hegemonytv 7.257 GBApril 13 qwertycopter 6.722 GB lirik 6.177 GB aftonbladetesport 5.233 GBApril 14 faceittv 10.03 GB hegemonytv 7.224 GB admiralbulldog 5.331 GBApril 15 nl kripp 7.286 GB faceittv 6.885 GB beyondthesummit 4.758 GBApril 16 darklordsen 11.62 GB trumpsc 6.829 GB riotgames2 6.386April 17 esea 18.37 GB redbullesports 17.41 GB summit1g 6.671 GBApril 18 riotgames 72.46 GB esea 22.68 GB hegemonytv 14.17 GB
4 5April 12 esl hearthstone 6.857 GB esl csgo 4.946 GBApril 13 imaqtpie 3.114 GB trick2g 2.981 GBApril 14 trick2g 4.509 GB clgdoublelift 4.014 GBApril 15 eg jwong 3.945 GB blizzheroes 3.635 GBApril 16 redbullesports 3.807 GB poiisondn 3.659 GBApril 17 saintvicious 4.080 GB sjow 4.024 GBApril 18 gfinitytv 11.45 GB poiisondn 6.956 GB
streams, there is an increase in traffic levels on the weekend. That is, top streams transmit
more on weekends than weekdays. We can also see that there are 28 channels that reach the
top five in a week. This high flux for popular channels in a given day makes it difficult to
predict what streams will be popular, since only 13 of these channels appear in Table 6.2.
6.5 Daily Traffic
Once again, we investigate the traffic on April 14th. On the 14th, the total number of
connections to Twitch was 21,471. The average inbound bytes per connection was 9.999 MB,
outbound was 118.6 KB, with an average duration of 75.2 seconds. Out of these connections,
106
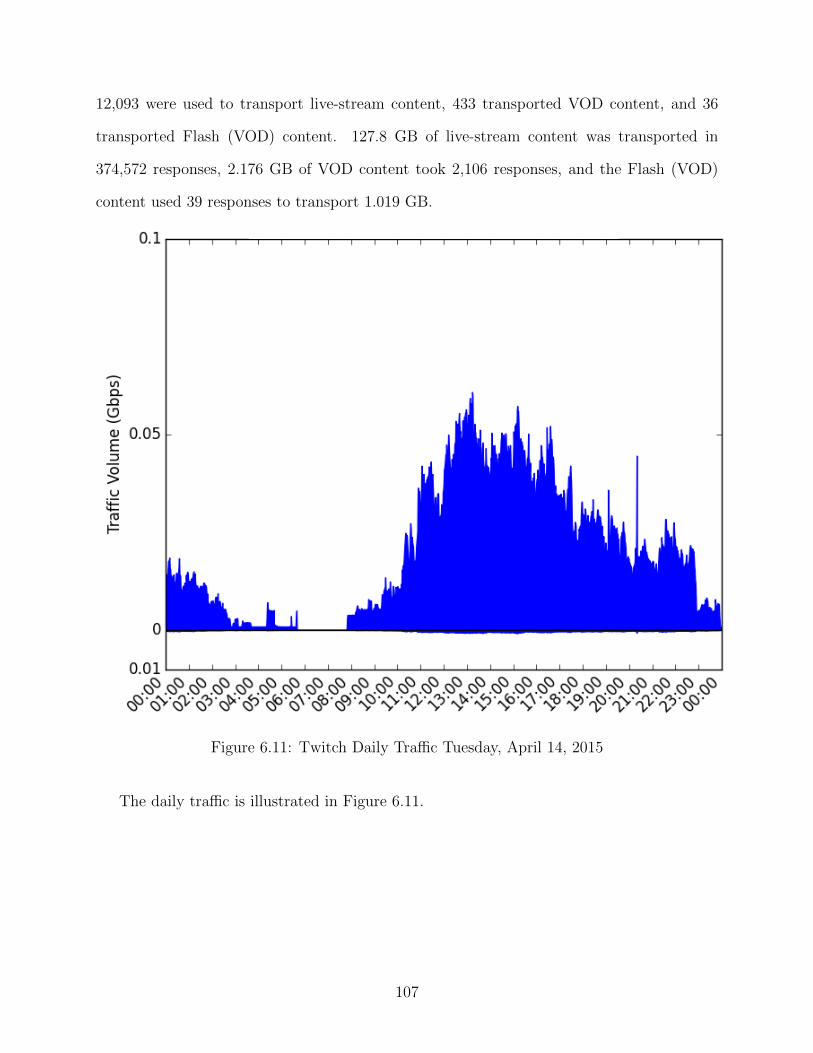
12,093 were used to transport live-stream content, 433 transported VOD content, and 36
transported Flash (VOD) content. 127.8 GB of live-stream content was transported in
374,572 responses, 2.176 GB of VOD content took 2,106 responses, and the Flash (VOD)
content used 39 responses to transport 1.019 GB.
Figure 6.11: Twitch Daily Traffic Tuesday, April 14, 2015
The daily traffic is illustrated in Figure 6.11.
107
6.6 eSports
Twitch often hosts streams from eSports tournaments. The most popular games for eSports
are the following: League of Legends (LoL)4, Dota 2, Starcraft 2 (SC2), Hearthstone, and
Counter Strike: Global Offensive (CS:GO). Dota 2 and LoL are team-based multi-player
online battle arena (MOBA) games. Hearthstone is an online card game. CS:GO is a team-
based first person shooter (FPS) and SC2 is a real-time strategy (RTS) game.
Dota 2 was released to the public on July 9, 2013, following an ongoing beta period that
started in 2011. League of Legends was released on October 27, 2009; its beta stage started
on April 10 of the same year. Counter Strike: Global Offensive was released on August 21,
2012. Starcraft 2 was released on July 27, 2010, and the first expansion to the game titled
Heart of the Swarm, was released on March 12, 2013. A second expansion titled Legacy of
the Void is currently being developed. When eSports matches for SC2 are played, they are
played with the latest expansions and updates to the game.
MOBA games started as custom maps for RTS games, the most famous being the Defense
Of The Ancients (DOTA) map for WarCraft 3. Unlike a typical RTS game, in a MOBA
game a player controls a single character. In a MOBA game, two teams of five players each
compete against each other. A team wins by destroying the other team’s base. Dota 2 is
regarded as having a higher skill ceiling than LoL.
A majority of eSports events are based on PC games. LoL, Dota 2, and CS:GO are all
team-based games where two teams of 5 players each compete against each other. SC2 has
support for team-based games, but is played 1 on 1 at eSports events. In eSports events, it
is common for each round to be played as a series (i.e., best of 7).
4These terms are listed in the List of Symbols.
108
6.6.1 Case Study: ESL-One Katowice
In this subsection, we present a case study for a major eSports tournament. We investigate
the eSports league (ESL) CS:GO tournament that was held in Katowice, Poland on March 12-
15, 2015. This tournament had 16 teams that competed in a group stage, then a playoff series.
This specific tournament was part of the greater Intel Extreme Masters (IEM) Tournament
held in Katowice [32]. The group stage was a double-elimination, best of one format, i.e.,
two out of four teams from each group advance; to advance they must win two matches.
Each round of the playoffs was a single-elimination best-of-three series. The first place prize
pool for the winning team in this tournament was $100,000 (USD).
When studying this event, we use network-level measurements from our monitor, as well
as statistics provided by third-party sources.
Third-Party Measurements
Using measurements obtained by third-party sources, we may construct a view of global
traffic on Twitch. ESL provided a basic info-graphic [53] with information about viewers
to the event. The information from this info-graphic that we are interested in is as follows:
36.95 million total Twitch sessions, 8.79 million unique Twitch viewers, 16 million hours of
content broadcast via Twitch, and a peak of 1.012 million concurrent viewers (in Twitch and
in game).
Using data from another third-party site5, we can determine how popular this event was
on Twitch. This second dataset uses data taken from Twitch’s public API at ten-minute
intervals. Figures 6.12 through 6.14 are provided by this dataset.
Figures 6.12 and 6.13 show the number of viewers on Twitch over time in blue. Fig-
ure 6.12a shows that the most concurrent viewers on Twitch occurred on March 13, 2015
with just over 1.5 million viewers. Figures 6.12b and 6.12c show concurrent viewers for
Twitch and CS:GO, respectively, for our observation period. They clearly show a spike in
5stats.twitchapps.com
109
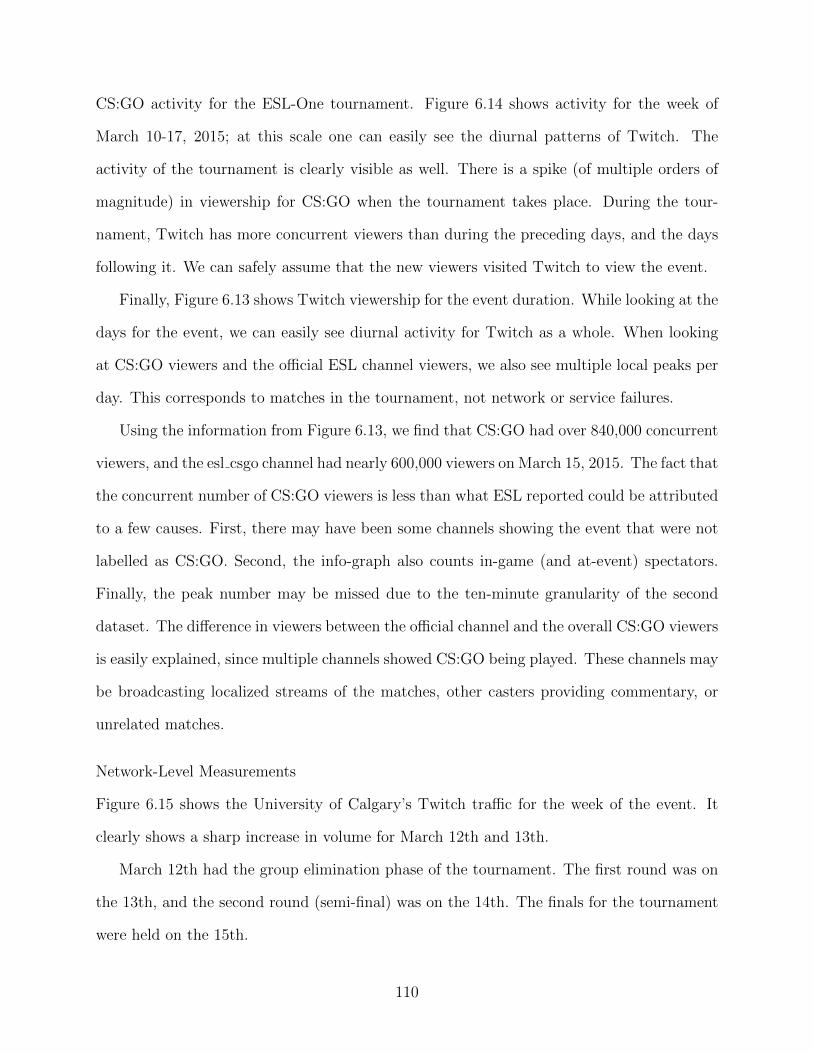
CS:GO activity for the ESL-One tournament. Figure 6.14 shows activity for the week of
March 10-17, 2015; at this scale one can easily see the diurnal patterns of Twitch. The
activity of the tournament is clearly visible as well. There is a spike (of multiple orders of
magnitude) in viewership for CS:GO when the tournament takes place. During the tour-
nament, Twitch has more concurrent viewers than during the preceding days, and the days
following it. We can safely assume that the new viewers visited Twitch to view the event.
Finally, Figure 6.13 shows Twitch viewership for the event duration. While looking at the
days for the event, we can easily see diurnal activity for Twitch as a whole. When looking
at CS:GO viewers and the official ESL channel viewers, we also see multiple local peaks per
day. This corresponds to matches in the tournament, not network or service failures.
Using the information from Figure 6.13, we find that CS:GO had over 840,000 concurrent
viewers, and the esl csgo channel had nearly 600,000 viewers on March 15, 2015. The fact that
the concurrent number of CS:GO viewers is less than what ESL reported could be attributed
to a few causes. First, there may have been some channels showing the event that were not
labelled as CS:GO. Second, the info-graph also counts in-game (and at-event) spectators.
Finally, the peak number may be missed due to the ten-minute granularity of the second
dataset. The difference in viewers between the official channel and the overall CS:GO viewers
is easily explained, since multiple channels showed CS:GO being played. These channels may
be broadcasting localized streams of the matches, other casters providing commentary, or
unrelated matches.
Network-Level Measurements
Figure 6.15 shows the University of Calgary’s Twitch traffic for the week of the event. It
clearly shows a sharp increase in volume for March 12th and 13th.
March 12th had the group elimination phase of the tournament. The first round was on
the 13th, and the second round (semi-final) was on the 14th. The finals for the tournament
were held on the 15th.
110
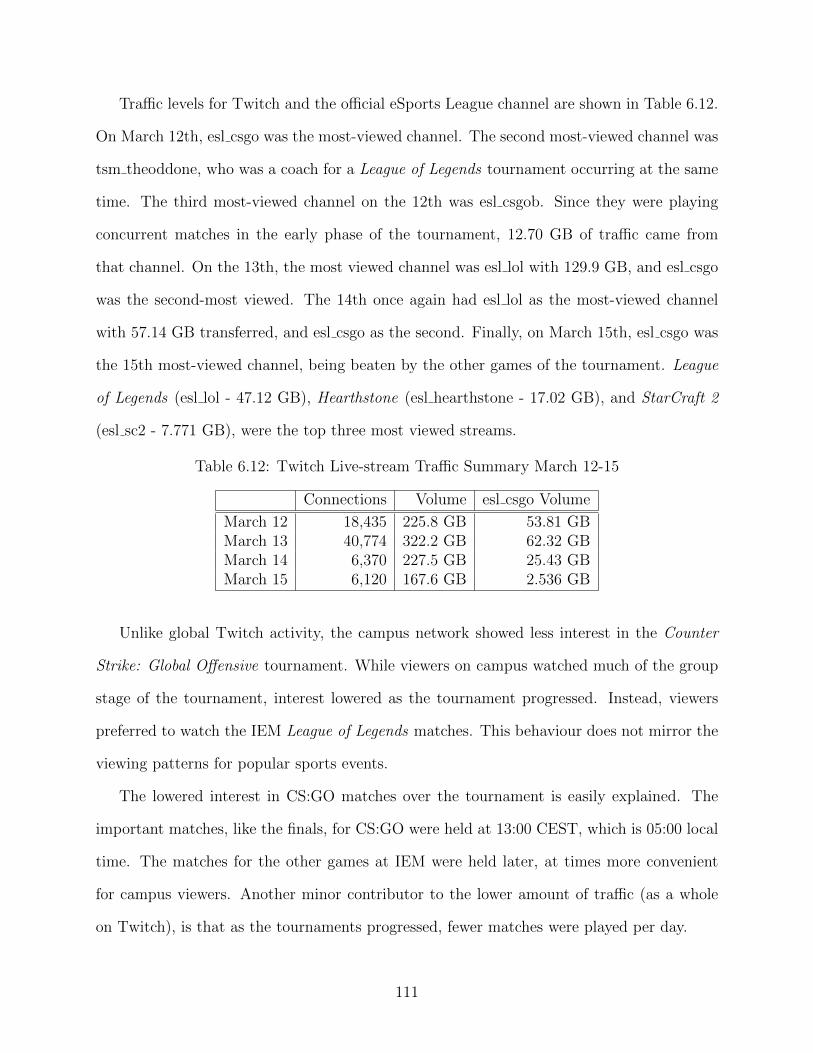
Traffic levels for Twitch and the official eSports League channel are shown in Table 6.12.
On March 12th, esl csgo was the most-viewed channel. The second most-viewed channel was
tsm theoddone, who was a coach for a League of Legends tournament occurring at the same
time. The third most-viewed channel on the 12th was esl csgob. Since they were playing
concurrent matches in the early phase of the tournament, 12.70 GB of traffic came from
that channel. On the 13th, the most viewed channel was esl lol with 129.9 GB, and esl csgo
was the second-most viewed. The 14th once again had esl lol as the most-viewed channel
with 57.14 GB transferred, and esl csgo as the second. Finally, on March 15th, esl csgo was
the 15th most-viewed channel, being beaten by the other games of the tournament. League
of Legends (esl lol - 47.12 GB), Hearthstone (esl hearthstone - 17.02 GB), and StarCraft 2
(esl sc2 - 7.771 GB), were the top three most viewed streams.
Table 6.12: Twitch Live-stream Traffic Summary March 12-15
Connections Volume esl csgo Volume
March 12 18,435 225.8 GB 53.81 GBMarch 13 40,774 322.2 GB 62.32 GBMarch 14 6,370 227.5 GB 25.43 GBMarch 15 6,120 167.6 GB 2.536 GB
Unlike global Twitch activity, the campus network showed less interest in the Counter
Strike: Global Offensive tournament. While viewers on campus watched much of the group
stage of the tournament, interest lowered as the tournament progressed. Instead, viewers
preferred to watch the IEM League of Legends matches. This behaviour does not mirror the
viewing patterns for popular sports events.
The lowered interest in CS:GO matches over the tournament is easily explained. The
important matches, like the finals, for CS:GO were held at 13:00 CEST, which is 05:00 local
time. The matches for the other games at IEM were held later, at times more convenient
for campus viewers. Another minor contributor to the lower amount of traffic (as a whole
on Twitch), is that as the tournaments progressed, fewer matches were played per day.
111
6.7 Summary
In this chapter, we studied Twitch traffic on campus. We explained the volume and char-
acteristics of live-streamed videos. Popular streams on Twitch were characterized and we
found that they fell into the same two behaviours that content on NetFlix follows. We esti-
mated the effects of local stream replication on WAN bandwidth. We presented a monthly
breakdown of traffic from Twitch, and described weekly and daily traffic specifically. Finally,
we investigated viewership of Twitch during one of the largest eSports events Twitch has
held to date, and compared our observations to Twitch’s global information.
In the next chapter, we present conclusions from our measurement study.
112
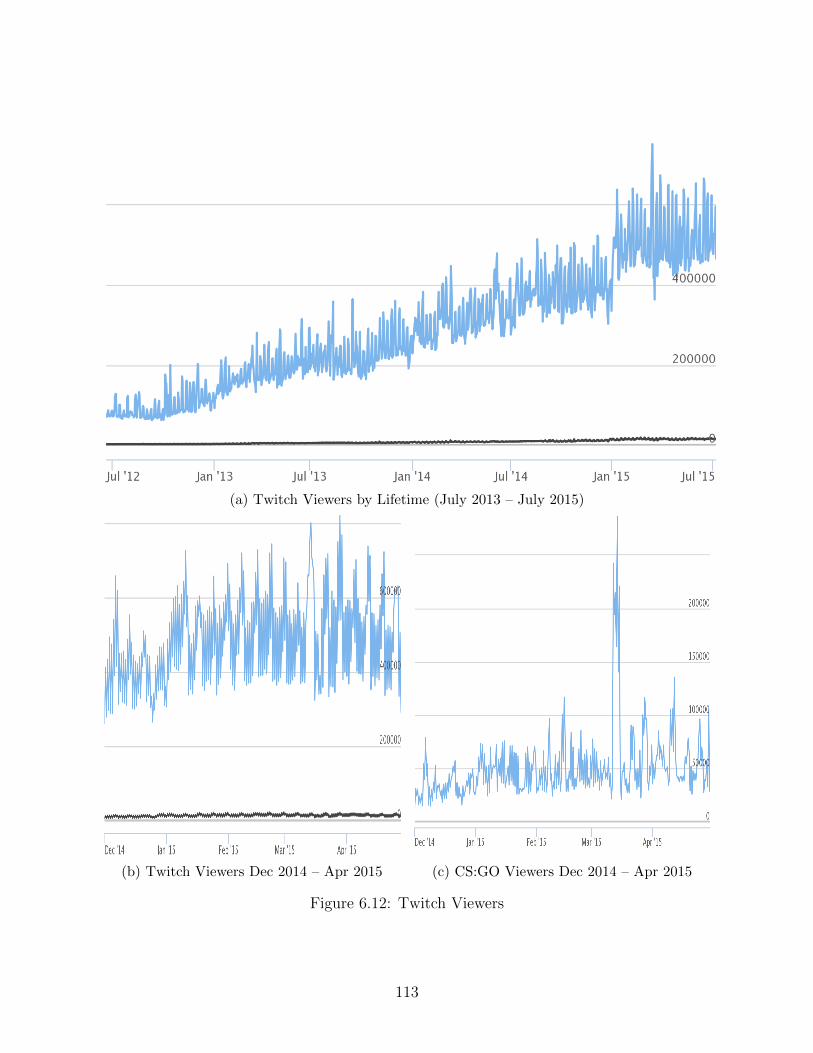
(a) Twitch Viewers by Lifetime (July 2013 – July 2015)
(b) Twitch Viewers Dec 2014 – Apr 2015 (c) CS:GO Viewers Dec 2014 – Apr 2015
Figure 6.12: Twitch Viewers
113
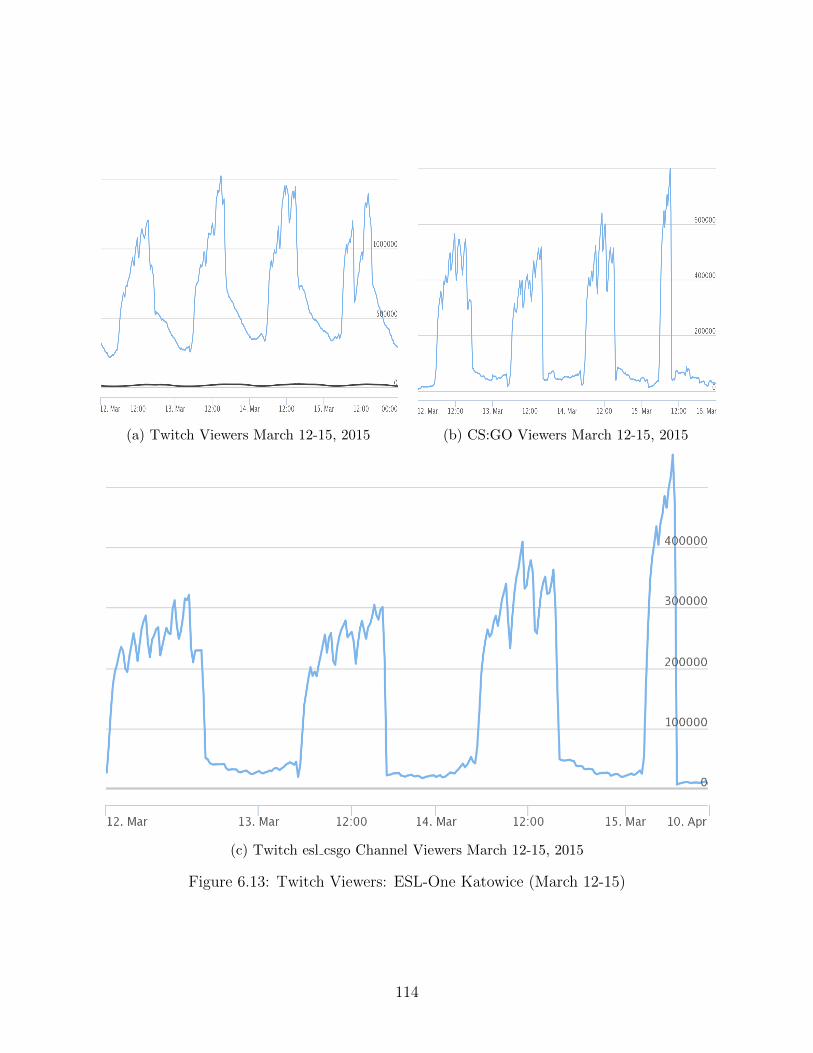
(a) Twitch Viewers March 12-15, 2015 (b) CS:GO Viewers March 12-15, 2015
(c) Twitch esl csgo Channel Viewers March 12-15, 2015
Figure 6.13: Twitch Viewers: ESL-One Katowice (March 12-15)
114
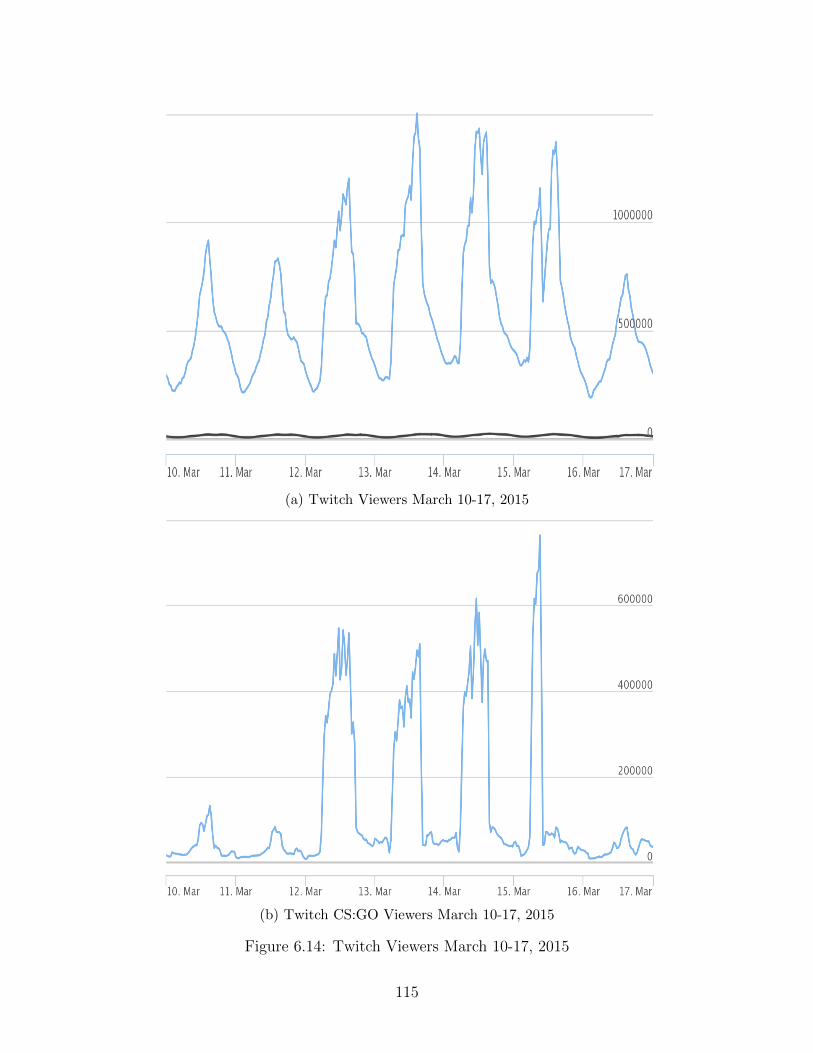
(a) Twitch Viewers March 10-17, 2015
(b) Twitch CS:GO Viewers March 10-17, 2015
Figure 6.14: Twitch Viewers March 10-17, 2015
115
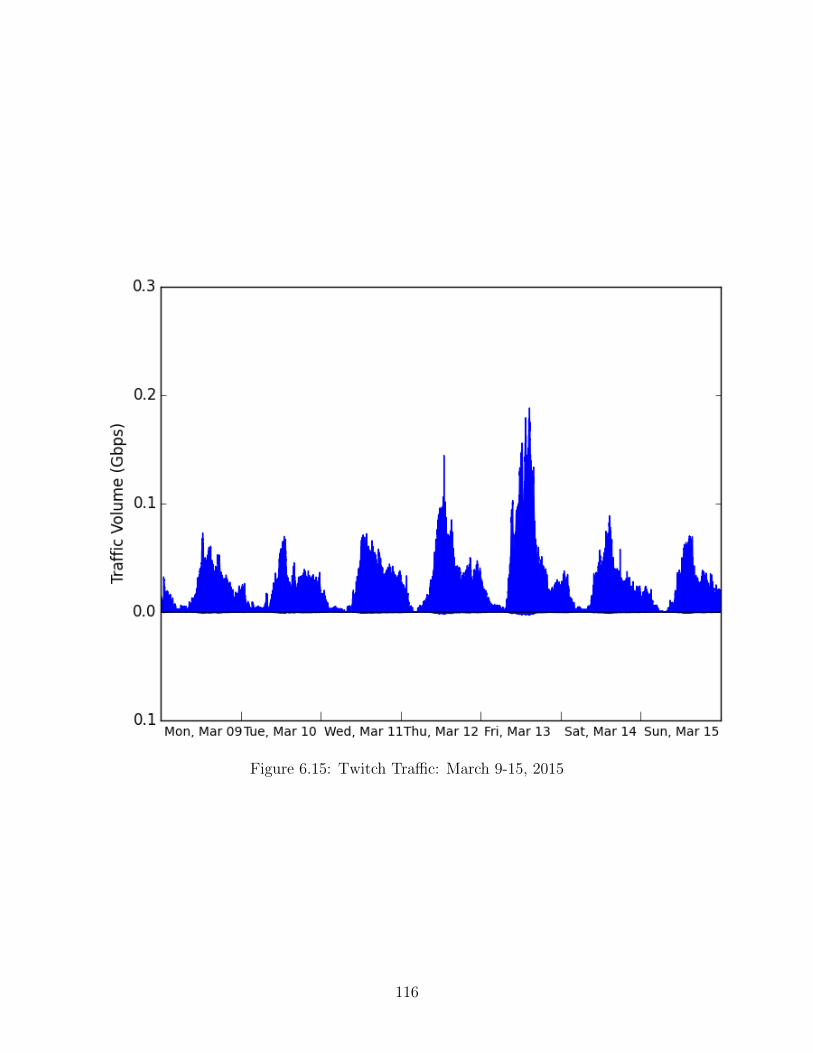
Figure 6.15: Twitch Traffic: March 9-15, 2015
116
Chapter 7
Conclusions
This chapter summarizes the observations made in the thesis. The thesis itself is summarized
in Section 7.1. Overall NetFlix and Twitch measurements are presented in Sections 7.2
and 7.3, respectively. Conclusions are discussed in Section 7.4. Finally, future work in the
area is summarized in Section 7.5.
7.1 Thesis Summary
This thesis presents an analysis of video traffic at the University of Calgary, focusing on
NetFlix and Twitch. Our observation period ran from December 1, 2014 to April 29, 2015.
In this study, we investigated how popular video services were used on campus. Our analysis
was done with data taken from the edge of the University of Calgary’s network. The results
of this thesis show that video traffic is a dominant contributor to overall network traffic.
Chapter 1 introduced the thesis and presented our goals.
Chapter 2 presented background information on the TCP/IP stack and technologies
used in media streaming. Modern video streaming is done over HTTP by a protocol called
DASH (Dynamic Adaptive Streaming over HTTP). We described related work in the areas
of network measurement and video traffic characterization. Finally, we introduced NetFlix
and Twitch and summarized recent studies involving these services.
Chapter 3 described our collection capabilities and methodology. We listed the interrup-
tions in our collection of data. We also presented a high level overview of campus traffic.
In Chapter 4, we presented aggregate video traffic measurements. We described the
content types that are typically associated with video and their origins. We gave a brief
overview of traffic levels associated with another popular video streaming service, YouTube,
117
and presented the high level trends of video streaming over our observation period.
Finally, in Chapters 5 and 6, we presented our analysis of NetFlix and Twitch, respec-
tively. We summarize these chapters in greater details in the following sections.
7.2 NetFlix Characterization
In Chapter 5, we overviewed the traffic NetFlix sends to campus. We described the URIs
NetFlix uses to transport content.
When viewing NetFlix, users have strong diurnal patterns, with peaks occurring in the
afternoon and late in the night. The diurnal patterns that NetFlix (and other video services)
display on campus may be different than what is observed in residential networks as the peak
rates occur during work hours. We found that TCP connections used to transport content
tend to be highly asymmetric, with an average of 370 KB sent to NetFlix, and 26 MB received
over 160 seconds. This leads to multiple connections being used to transport content from
NetFlix; we found 7-9 were used for a 22-minute episode and 12-14 for a 42-minute episode.
We expect that NetFlix’s use of DASH to serve video results in multiple connections. The
request-response pairs that were sent showed different characteristics, depending on whether
they were sent from desktop or mobile devices.
Finally, we were able to track what content was popular on NetFlix. Viewers had a
strong preference to watch TV series such as Friends. However, some newly added content
experienced short-term popularity on NetFlix. This characteristic was visible for both movies
and TV-shows. When a new season of a TV show was added to NetFlix, such as House of
Cards or Daredevil, the show had a brief surge in popularity as viewers consumed the new
content and then returned to previous viewing habits. We estimate that caching popular
shows on the local network will greatly reduce the amount of incoming traffic; i.e., it would
only take around 70 GB of space to store Friends, and that show transmitted more than
20 TB to the campus network during the collection period. Due to licencing and DRM issues
118
however, operating our own cache is impossible. If network operators wanted to reduce this
type of traffic they could offer to host a NetFlix CDN node on their network.
7.3 Twitch Characterization
In Chapter 6, we described Twitch’s live-streaming.
Twitch uses Apple’s HLS service as a base for their live-stream implementation. We
found that HLS response sizes showed step-like behaviour due to the underlying (Apple
HLS) technology. Response durations for HLS content tended to remain under one second;
fast responses greatly contribute to a positive user experience.
When viewing connections, we found that they mirrored the characteristics of general
video streaming, and were highly asymmetric. Since we did not see significant upload traffic
to Twitch servers, we can assume that either no one on campus has attempted to stream
video games during our collection period, or that the servers receiving a stream are different
from the ones providing the stream to viewers. We have observed once again, that multiple
connections are used to transport video and attribute this behaviour to DASH.
Twitch provides less content (in bytes) than NetFlix to viewers at the University of Cal-
gary. Viewers consuming content from Twitch showed strong diurnal activity that stopped
earlier in the night than other video services; we attribute this to the streamers going offline.
This suggests that the more popular streamers viewed on Twitch are somewhere in North
America.
The popularity of streamers and the volume they transmit was also examined, and we
found that very few streamers have long-term popularity. Many of the popular streams in a
given month are highly seasonal; they are popular because the stream is hosting an event and
the stream is no longer viewed when the event is over. We were able to give a rough estimate
of how much traffic volume could be saved if we were able to locally replicate Twitch streams.
Since local replication would need TCP/IP multicasting, which is not widely supported, this
119
solution cannot currently be implemented.
Finally, we also presented a case study of an eSports tournament. We used data both from
the campus network and from a third party that provided global information about Twitch.
We found that users on campus do watch these types of events – when it is convenient for
them; very few will adjust their schedules to watch the stream early in the morning.
7.4 Conclusions
Over our five-month observation period, we saw significant volumes of traffic to NetFlix and
Twitch. Since NetFlix does not have a public API to gather and compare data, we could
only state what is popular locally. Twitch, on the other hand, has an API that we can use to
gather and compare data; we used information from the API when investigating an eSports
tournament in March. Using the locally collected data, we found that these two services and
YouTube provide a majority of the video traffic on campus, and thus a majority of the Web
traffic that we see on campus.
Popular content from NetFlix tended to either be newly added content or TV shows
with long-term popularity. We do not believe that this differs from global trends. Caching
this content locally would greatly improve network utilization and user experience as well
as resilience in face of flash crowds. NetFlix traffic levels were not greatly affected by user-
generated activity (ratings and reviews). This is expected, as another study [11] (on other
services) revealed that relatively few users provide feedback and that ratings were slightly
more common than comments or reviews. On NetFlix, content ratings are sent via GET
requests and reviews are done via POST requests.
While our measurements showed that Twitch generated less traffic than other services
such as NetFlix and YouTube, Twitch generated significant levels of traffic over the ob-
servation period. A majority of Twitch’s traffic was for live content. The availability of
live content limits user consumption. The popular streams in each month are influenced
120
by events; i.e., streams associated with eSports gain a substantial amount of viewers when
a tournament takes place. There is also a small set of streams on Twitch with long-term
popularity, but the amount of traffic they contribute to total Twitch traffic does not have
the same impact as the top NetFlix titles have on NetFlix’s total traffic.
When measuring the connections and request-response pairs used to transport content
from these services, we find that they do not greatly differ from the general characteristics
of video traffic observed in other studies.
The findings of this thesis, issues we encountered, and the evolution of these services all
provide the basis for future studies of video traffic.
7.5 Future Work
The work done in this thesis can be extended in multiple dimensions. More work understand-
ing local user interaction with video services may be done. Identifying and characterizing
sessions on these services will provide more insight on user-level interactions. We were not
able to identify the number of sessions or viewers on campus for this thesis. Additionally, for
NetFlix, we did not take into account user ratings or reviews. While ratings and reviews do
not add a lot of traffic, we may find that users rating content “poor” may stop viewing part
way through, as in other studies [58]. When studying Twitch, we did not measure chat levels
or content. Measuring the contents of chat is a social study that was beyond the scope of
this thesis. Another difficulty in measuring the content of chat is that it must be done on a
room by room basis using the API (for authentication), to allow access to the IRC channels
themselves.
General content level measurements can be improved for both of these services. Net-
Flix content measurements may be further improved by aggregating more of the individual
episode IDs with the main content IDs. Work can be done with NetFlix in order to map
request URIs to content (without the referrer URI). Our brief investigation of the request
121
URIs did not reveal a link between the requests and the content being transported. This has
limited our understanding of mobile trends on NetFlix. More work can also be done mea-
suring other eSports tournaments on Twitch. We chose to measure the largest tournament
held during our collection period. We found that the tournament we chose to study was not
very popular locally, yet it was extremely popular on Twitch.
Other researchers conducting similar studies in the future will face two challenges. First,
both NetFlix and Twitch have recently changed aspects of their Web interfaces (briefly
overviewed in the appendices). Changes to the interface are accompanied by different re-
quests, which may also change response characteristics. Second, NetFlix has announced
its intention to switch to HTTPS (video content is already transported over HTTPS). We
expect that in the future Twitch will do the same. This will end the abilities of network
researchers to study the application-level interactions of these services.
122
References
[1] V. Adhikari, Y. Guo, F. Hao, V. Hilt, Z.-L. Zhang, M. Varvello, and M. Steiner. Mea-
surement Study of NetFlix, Hulu, and a Tale of Three CDNs. To appear, IEEE/ACM
Transactions on Networking, 2015. Accepted and online October 2014.
[2] V. Adhikari, Y. Guo, F. Hao, M. Varvello, V. Hilt, M. Steiner, and Z.-L. Zhang. Unreel-
ing NetFlix: Understanding and Improving Multi-CDN Movie Delivery. In Proceedings
of IEEE INFOCOM, pages 1620–1628, Orlando, Florida, March 2012.
[3] Alexa Top Sites. http://www.alexa.com/topsites, June 2015.
[4] S. Basso, A. Servetti, E. Masala, and J. De Martin. Measuring DASH Streaming Per-
formance from the End Users Perspective using Neubot. In Proceedings of the 5th ACM
Multimedia Systems Conference, MMSys, pages 1–6, Singapore, March 2014.
[5] M. Belshe and R. Peon. Hypertext Transfer Protocol Version 2 (HTTP/2). RFC 7540,
IETF Internet Engineering Task Force, May 2015.
[6] T. Berners-Lee. Information Management: A Proposal. Technical Report, CERN,
March 1989.
[7] T. Berners-Lee, R. Fielding, and L. Masinter. Standard Protocol: Uniform Resource
Identifier (URI): Generic Syntax. RFC 3986, IETF Internet Engineering Task Force,
January 2005.
[8] T. Berners-Lee, L. Manister, and M. McCahill. Uniform Resource Locators (URL).
RFC 1738, IETF Internet Engineering Task Force, December 1994.
[9] R. Burnett. Streaming Music, the New Business Model. In Proc. of the 2nd Inter-
national Conference on Trends in Multidisciplinary Business and Economics Research,
pages 288–294, Bangkok Silom, Thailand, March 2015.
123
[10] J. Bustos-Jimenez and C. Fuenzalida. All Packets Are Equal, but Some Are More Equal
Than Others. In Proceedings of the Latin America Networking Conference, LANC, pages
5:1–5:8, Montevideo, Uruguay, September 2014.
[11] M. Cha, H. Kwak, P. Rodriguez, Y.-Y. Ahn, and S. Moon. Analyzing the Video Pop-
ularity Characteristics of Large-scale User Generated Content Systems. IEEE/ACM
Transactions on Networking, 17(5):1357–1370, October 2009.
[12] N. Chatzis, G. Smaragdakis, J. Bottger, T. Krenc, and A. Feldmann. On the Benefits
of Using a Large IXP as an Internet Vantage Point. In Proceedings of the ACM Internet
Measurement Conference, IMC, pages 333–346, Barcelona, Spain, October 2013.
[13] J. Chung, Y. Choi, B. Park, and J.-K. Hong. Measurement Analysis of Mobile Traffic
in Enterprise Networks. In Proceedings of the Asia-Pacific Network Operations and
Management Symposium, APNOMS, pages 1–4, Hsinchu, Taiwan, September 2011.
[14] Cisco Systems Inc. Cisco Visual Networking Index: Forecasting and Methodology,
2014-2019. Technical Report, Cisco Systems Inc., May 2015.
[15] J. Czyz, M. Allman, J. Zhang, S. Iekel-Johnson, E. Osterweil, and M. Bailey. Measur-
ing IPv6 Adoption. ACM SIGCOMM Computer Communication Review, 44(4):87–98,
August 2014.
[16] J. Czyz, M. Kallitsis, M. Gharaibeh, C. Papadopoulos, M. Bailey, and M. Karir. Taming
the 800 Pound Gorilla: The Rise and Decline of NTP DDoS Attacks. In Proceedings of
the ACM Internet Measurement Conference, IMC, pages 435–448, Vancouver, British
Columbia, November 2014.
[17] DailyMotion. http://www.dailymotion.com, 2015.
[18] T. Dierks and E. Rescorla. The Transport Security Layer (TLS) Protocol Version 1.2.
RFC 5246, IETF Internet Engineering Task Force, August 2008.
124
[19] I. Din, N. Saqib, and A. Baig. Passive Analysis of Web Traffic Characteristics for
Estimating Quality of Experience. In IEEE GLOBECOM Workshops, pages 1–5, New
Orleans, Louisiana, November 2008.
[20] T. Dreier. Juniper Research Report Sees Slow Growth in Online Music Market.
http://www.streamingmedia.com/Articles/News/Online-Video-News/Juniper-
Research-Report-Sees-Slow-Growth-in-Online-Music-Market-98857.aspx,
August 2014.
[21] R. Fielding, J. Gettys, J. Mogul, H. Frystyk, L. Masinter, P. Leach, and T. Berners-Lee.
Hypertext Transfer Protocol – HTTP/1.1. RFC 2616, IETF Internet Engineering Task
Force, June 1999.
[22] D. Fitzgerald and D. Wakabayashi. Apple Quietly Builds New Networks. http://
www.wsj.com/articles/SB10001424052702304851104579361201655365302, Febru-
ary 2014.
[23] A. Freier, P. Karlton, and P. Kocher. The Secure Sockets Layer (SSL) Protocol Version
3.0. RFC 6101, IETF Internet Engineering Task Force, August 2011.
[24] V. Fuller and T. Li. Classless Inter-domain Routing (CIDR): The Internet Address
Assignment and Aggregation Plan. RFC 4632, IETF Internet Engineering Task Force,
August 2006.
[25] P. Gill, M. Arlitt, Z. Li, and A. Mahanti. Youtube Traffic Characterization: A View
from the Edge. In Proceedings of the ACM Internet Measurement Conference, IMC,
pages 15–28, San Diego, California, October 2007.
[26] S. Grover, S. Park, S. Sundaresan, S. Burnett, H. Kim, B. Ravi, and N. Feamster.
Peeking Behind the NAT: An Empirical Study of Home Networks. In Proceedings of
125
the ACM Internet Measurement Conference, IMC, pages 377–390, Barcelona, Spain,
October 2013.
[27] S. Grundberg and J. Hansegard. YouTube’s Biggest Draw Plays Games, Earns $4
Million a Year. http://www.wsj.com/articles/youtube-star-plays-videogames-
earns-4-million-a-year-1402939896, June 2014.
[28] W. Hamilton, O. Garretson, and A. Kerne. Streaming on Twitch: Fostering Participa-
tory Communities of Play Within Live Mixed Media. In Proceedings of the 32nd ACM
Conference on Human Factors in Computing Systems, CHI, pages 1315–1324, Toronto,
Ontario, April 2014.
[29] W. He. Examining Students Online Interaction in a Live Video Streaming Environment
using Data Mining and Text Mining. Computers in Human Behavior, 29(1):90 – 102,
2013.
[30] J. Hirschhorn. 7 Deadly Sins: Where Hollywood is Wrong about the Future
of TV. https://www.linkedin.com/pulse/7-deadly-sins-where-hollywood-is-
wrong-about-the-future-of-tv-jason-hirschhorn, 2015.
[31] Hulu. http://www.hulu.com, 2015.
[32] Intel Extreme Master’s World Championships. http://en.intelextrememasters.
com/season9/worldchampionship/, 2015.
[33] M. Ito, R. Antonello, D. Sadok, and S. Fernandes. Network Level Characterization of
Adaptive Streaming over HTTP Applications. In IEEE Symposium on Computers and
Communication, ISCC, pages 1–7, Madeira, Portugal, June 2014.
[34] M. Kaytoue, A. Silva, L. Cerf, W. Meira, Jr., and C. Raıssi. Watch Me Playing, I Am a
Professional: A First Study on Video Game Live Streaming. In Proceedings of the 21st
126
International Conference Companion on World Wide Web, WWW, pages 1181–1188,
Lyon, France, April 2012.
[35] D. Kerr. Video Streaming is on the Rise with NetFlix Dominating. http://www.
cnet.com/news/video-streaming-is-on-the-rise-with-netflix-dominating/,
May 2013.
[36] C. Kreuzberger, D. Posch, and H. Hellwagner. A Scalable Video Coding Dataset
and Toolchain for Dynamic Adaptive Streaming over HTTP. In Proceedings of the
6th ACM Multimedia Systems Conference, MMSys, pages 213–218, Portland, Oregon,
March 2015.
[37] J. Kurose and K. Ross. Computer Networking: A Top-Down Approach. Addison-Wesley
Publishing Company, USA, 5th edition, 2009.
[38] R. Kuschnig, I. Kofler, and H. Hellwagner. Evaluation of HTTP-based Request-
Response Streams for Internet Video Streaming. In Proceedings of the 2nd ACM Con-
ference on Multimedia Systems, MMSys, pages 245–256, San Jose, California, February
2011.
[39] B. Li, Z. Wang, J. Liu, and W. Zhu. Two Decades of Internet Video Streaming: A
Retrospective View. ACM Transactions on Multimedia Computing, Communications,
and Applications, 9(1s):33:1–33:20, October 2013.
[40] B. Mah. An Empirical Model of HTTP Network Traffic. In Proceedings of IEEE
INFOCOM, pages 592–600, Kobe, Japan, April 1997.
[41] G. Maier, A. Feldmann, V. Paxson, and M. Allman. On Dominant Characteristics of
Residential Broadband Internet Traffic. In Proceedings of the ACM Internet Measure-
ment Conference, IMC, pages 90–102, Chicago, Illinois, November 2009.
127
[42] L. Manister. Hyper Text Coffee Pot Control Protocol (HTCPCP/1.0). RFC 2324, IETF
Internet Engineering Task Force, April 1998.
[43] J. Martin, Y. Fu, N. Wourms, and T. Shaw. Characterizing NetFlix Bandwidth Con-
sumption. In Proceedings of the IEEE Consumer Communications and Networking
Conference, CCNC, pages 230–235, Las Vegas, Nevada, January 2013.
[44] J. Megretton. Own3d TV Shutting Down. http://www.gamebreaker.tv/news-main/
own3d-tv-shutting-down/, January 2013.
[45] F. Metzger, A. Rafetseder, D. Stezenbach, and K. Tutschku. Analysis of Web-based
Video Delivery. In Federation of Telecommunications Engineers of the European Com-
munity Congress, FITCE, pages 1–6, Palermo, Italy, August 2011.
[46] D. Mills. Network Time Protocol (Version 3) Specification, Implementation and Anal-
ysis. RFC 1305, IETF Internet Engineering Task Force, March 1992.
[47] P. Mockapetris. Domain Names - Implementation and Specification. RFC 1035, IETF
Internet Engineering Task Force, November 1987.
[48] G. Nascimento, M. Ribeiro, L. Cerf, N. Cesario, M. Kaytoue, C. Raissi, T. Vasconcelos,
and W. Meira. Modeling and Analyzing the Video Game Live-Streaming Community.
In Proceedings of the Latin American Web Congress, LA-WEB, pages 1–9, Ouro Perto,
Brazil, October 2014.
[49] NetFlix. http://www.netflix.com, 2015.
[50] NetFlix 2015 Quarterly Earnings. http://files.shareholder.com/downloads/
NFLX/0x0x821407/DB785B50-90FE-44DA-9F5B-37DBF0DCD0E1/Q1_15_Earnings_
Letter_final_tables.pdf, April 2015.
128
[51] NetFlix Company Timeline. https://pr.netflix.com/WebClient/
loginPageSalesNetWorksAction.do?contentGroupId=10477&contentGroup=
Company+Timeline, 2015.
[52] B. Newton, K. Jeffay, and J. Aikat. The Continued Evolution of Web Traffic. In
Proceedings of IEEE International Symposium on Modelling, Analysis and Simulation
of Computer and Telecommunication Systems, MASCOTS, pages 80–89, San Francisco,
California, August 2013.
[53] H. Oelschlagel. Record-breaking Numbers: The ESL One Katowice Info-
graphic. http://www.eslgaming.com/news/record-breaking-numbers-esl-one-
katowice-infographic-1060, March 2015.
[54] G. Papadogiannopoulos, I. Politis, T. Dagiuklas, and L. Dounis. Perceptual Quality
Assessment of HTTP Adaptive Video Streaming. In IEEE GLOBECOM Workshops,
pages 1174–1179, Atlanta, Georgia, December 2013.
[55] V. Paxson. Bro: A System for Detecting Network Intruders in Real-Time. Computer
Networks, 31(23-24):2435–2463, 1999.
[56] K. Pires and G. Simon. Dash in Twitch: Adaptive Bitrate Streaming in Live Game
Streaming Platforms. In Proceedings of the 2014 Workshop on Design, Quality and
Deployment of Adaptive Video Streaming, VideoNext, pages 13–18, Sydney, Australia,
December 2014.
[57] K. Pires and G. Simon. Youtube Live and Twitch: A Tour of User-generated Live
Streaming Systems. In Proceedings of the 6th ACM Multimedia Systems Conference,
MMSys, pages 225–230, Portland, Oregon, March 2015.
[58] L. Plissonneau and E. Biersack. A Longitudinal View of HTTP Video Streaming Per-
formance. In Proceedings of the 3rd ACM Multimedia Systems Conference, MMSys,
129
pages 203–214, Chapel Hill, North Carolina, February 2012.
[59] B. Popper. Field of Streams: How Twitch Made Video Games into a Spec-
tator Sport. http://www.theverge.com/2013/9/30/4719766/twitch-raises-20-
million-esports-market-booming, September 2013.
[60] J. Postel. User Datagram Protocol. RFC 768, IETF Internet Engineering Task Force,
August 1980.
[61] J. Postel. Internet Protocol. RFC 791, IETF Internet Engineering Task Force, Septem-
ber 1981.
[62] J. Postel. Transmission Control Protocol. RFC 793, IETF Internet Engineering Task
Force, September 1981.
[63] R. Pries, Z. Magyari, and P. Tran-Gia. An HTTP Web Traffic Model Based on the
Top One Million Visited Web Pages. In Proceedings of the on Next Generation Internet
Conference, EURO-NGI, pages 133–139, Karlskrona, Sweden, June 2012.
[64] W. Pu, Z. Zou, and C. Chen. Dynamic Adaptive Streaming over HTTP from Multi-
ple Content Distribution Servers. In Proceedings of IEEE Global Telecommunications
Conference, GLOBECOM, pages 1–5, Houston, Texas, December 2011.
[65] A. Rao, A. Legout, Y. Lim, D. Towsley, C. Barakat, and W. Dabbous. Network Charac-
teristics of Video Streaming Traffic. In Proceedings of the 7th Conference on Emerging
Networking Experiments and Technologies, CoNEXT, pages 25:1–25:12, Tokyo, Japan,
December 2011.
[66] A. Reed and J. Aikat. Modeling, Identifying, and Simulating Dynamic Adaptive Stream-
ing over HTTP. In Proceedings of IEEE International Conference on Network Protocols,
ICNP, pages 1–2, Goettingen, Germany, October 2013.
130
[67] E. Rescorla. HTTP over TLS. RFC 2818, IETF Internet Engineering Task Force, May
2000.
[68] D. Ronca. A Brief History of NetFlix Streaming. http://blog.streamingmedia.com/
wp-content/uploads/2013/07/2013SMEast-C101.pdf, May 2013.
[69] J. Roskind. Quick UDP Internet Connections. https://docs.google.com/document/
d/1RNHkx_VvKWyWg6Lr8SZ-saqsQx7rFV-ev2jRFUoVD34/, June 2013.
[70] D. Schatzmann, W. Muhlbauer, T. Spyropoulos, and X. Dimitropoulos. Digging into
HTTPS: Flow-based Classification of Webmail Traffic. In Proceedings of ACM Internet
Measurement Conference, IMC, pages 322–327, Melbourne, Australia, November 2010.
[71] F. Schneider, B. Ager, G. Maier, A. Feldmann, and S. Uhlig. Pitfalls in HTTP Traffic
Measurements and Analysis. In Proceedings of the 13th International Conference on
Passive and Active Measurement, PAM, pages 242–251, Vienna, Austria, March 2012.
[72] M. Shafiq, L. Ji, A. Liu, J. Pang, and J. Wang. Large-scale Measurement and Char-
acterization of Cellular Machine-to-Machine Traffic. IEEE/ACM Transactions on Net-
working, 21(6):1960–1973, December 2013.
[73] R. Shea, D. Fu, and J. Liu. Towards Bridging Online Game Playing and Live Broadcast-
ing: Design and Optimization. In Proceedings of the 25th ACM Workshop on Network
and Operating Systems Support for Digital Audio and Video, NOSSDAV, pages 61–66,
Portland, Oregon, March 2015.
[74] V. Swaminathan. Are We in the Middle of a Video Streaming Revolution? ACM Trans-
actions on Multimedia Computing, Communications, and Applications, 9(1s):40:1–40:6,
October 2013.
[75] Twitch. http://www.twitch.tv, 2015.
131
[76] G. Tyson, Y. Elkhatib, N. Sastry, and S. Uhlig. Demystifying Porn 2.0: A Look into a
Major Adult Video Streaming Website. In Proceedings of the ACM Internet Measure-
ment Conference, IMC, pages 417–426, Barcelona, Spain, October 2013.
[77] URI Planning Interest Group. URIs, URLs, and URNs: Clarifications and Recommen-
datations 1.0. Technical Report, IETF Internet Engineering Task Force, W3C World
Wide Web Consortium, September 2001.
[78] S. Veres and D. Ionescu. Measurement-based Traffic Characterization for Web 2.0
Applications. In Proceedings of IEEE Instrumentation and Measurement Technology
Conference, I2MTC, pages 536–541, Singapore, May 2009.
[79] Vimeo. https://vimeo.com, 2015.
[80] S. Wei and V. Swaminathan. Low Latency Live Video Streaming over HTTP 2.0. In
Proceedings of the 24th ACM Workshop on Network and Operating System Support for
Digital Audio and Video, NOSSDAV, pages 37:37–37:42, Singapore, March 2014.
[81] K. Xu, F. Wang, L. Gu, J. Gao, and Y. Jin. Characterizing Home Network Traffic: An
Inside View. Personal Ubiquitous Computing, 18(4):967–975, April 2014.
[82] Yahoo Screen. https://screen.yahoo.com, 2015.
[83] YouTube. https://www.youtube.com, 2015.
[84] C. Zhang and J. Liu. On Crowdsourced Interactive Live Streaming: A Twitch.tv-
based Measurement Study. In Proceedings of the 25th ACM Workshop on Network
and Operating Systems Support for Digital Audio and Video, NOSSDAV, pages 55–60,
Portland, Oregon, March 2015.
132
Appendix A
UDP Traffic
Over our collection period, we observed over 990.2 TB of UDP traffic, with 866.4 TB (87.5%
of UDP) outbound and the remaining 123.8 TB inbound. Non-standard ports were used to
transmit 198.7 TB (20.1%) of all bytes. i.e., n > 1, 023 where n was a port number involved
with the connection. This traffic is likely BitTorrent traffic (explained below).
The two greatest contributors to outbound UDP traffic were NTP exploitation attacks
(detailed later), and BitTorrent traffic. The volume of UDP traffic being used for legitimate
purposes is negligible, since outbound NTP and BitTorrent1 contributes 95% of all outbound
bytes; NTP accounts for 73.7% of outbound UDP traffic, and those transmitted from non-
standard ports account for over 22.9% of outgoing bytes.
Excluding connections that had non-standard values for both source and destination
ports, and NTP connections (destination port number 123) [46], the largest contributors
to outbound UDP traffic over our collection period were: 443 (HTTPS via QUIC2 – 19.24
TB), 53 (DNS – 2.629 TB), 80 (HTTP via QUIC – 1.835 TB), and 19 (Character Generator
Protocol (CHARGEN) – 1.386 TB). The other well-known services each sent less than 1
TB of UDP traffic over the collection period. These services include Simple Mail Transfer
Protocol (SMTP) and Simple Network Management Protocol (SNMP), these services provide
and manage Internet infrastructure.
Inbound UDP traffic, excluding NTP and non-standard ports, was primarily composed
of the following protocols: 80 (HTTP via QUIC – 15.11 TB), 22 (SSH – 5.182 TB), 443
(HTTPS via QUIC – 2.808 TB), and 53 (DNS – 0.804 TB). All other well-known services
accounted for less than 0.1 TB of inbound UDP traffic.
1A majority of BitTorrent volume is not attributed to legitimate filesharing.2Quick UDP Internet Connections (QUIC)[69], is a protocol designed by Google for the Chromium project
to improve the performance of Web applications.
133
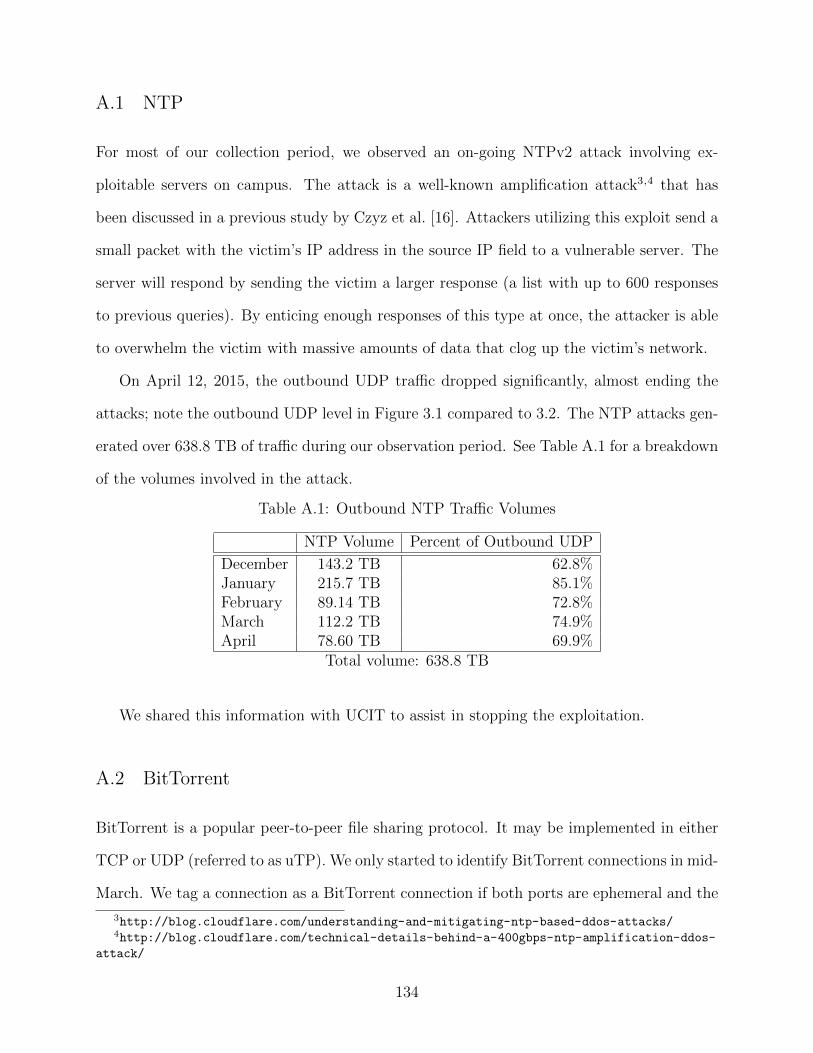
A.1 NTP
For most of our collection period, we observed an on-going NTPv2 attack involving ex-
ploitable servers on campus. The attack is a well-known amplification attack3,4 that has
been discussed in a previous study by Czyz et al. [16]. Attackers utilizing this exploit send a
small packet with the victim’s IP address in the source IP field to a vulnerable server. The
server will respond by sending the victim a larger response (a list with up to 600 responses
to previous queries). By enticing enough responses of this type at once, the attacker is able
to overwhelm the victim with massive amounts of data that clog up the victim’s network.
On April 12, 2015, the outbound UDP traffic dropped significantly, almost ending the
attacks; note the outbound UDP level in Figure 3.1 compared to 3.2. The NTP attacks gen-
erated over 638.8 TB of traffic during our observation period. See Table A.1 for a breakdown
of the volumes involved in the attack.
Table A.1: Outbound NTP Traffic Volumes
NTP Volume Percent of Outbound UDP
December 143.2 TB 62.8%January 215.7 TB 85.1%February 89.14 TB 72.8%March 112.2 TB 74.9%April 78.60 TB 69.9%
Total volume: 638.8 TB
We shared this information with UCIT to assist in stopping the exploitation.
A.2 BitTorrent
BitTorrent is a popular peer-to-peer file sharing protocol. It may be implemented in either
TCP or UDP (referred to as uTP). We only started to identify BitTorrent connections in mid-
March. We tag a connection as a BitTorrent connection if both ports are ephemeral and the
3http://blog.cloudflare.com/understanding-and-mitigating-ntp-based-ddos-attacks/4http://blog.cloudflare.com/technical-details-behind-a-400gbps-ntp-amplification-ddos-
attack/
134

connection contains the string “BitTorrent protocol” in the payload. A consequence of this is
that we are unable to detect encrypted BitTorrent connections, and we may unintentionally
tag non-BitTorrent connections.
In April 2015, we observed 51.9 TB of UDP traffic on non-standard ports, constituting
36.8% of UDP traffic (141 TB). We tagged over 64 million UDP connections as BitTorrent,
with a total volume of 23.2 TB (44.7% of non-standard UDP). Within this, 7.7 TB was
inbound and 15.5 TB was outbound.
135
Appendix B
HTTP User Agents
We are able to use the user-agent attribute in Bro’s HTTP logs to find what device/OS/browsers
are preferred by users.
B.1 Total HTTP
Over our collection period, we observed 2.11 million variations of user-agent strings making
over 10.5 billion requests. There are a total of 8.69 billion requests that we were able to parse
into (OS, Browser) tuples. The remaining 1.81 billion that we could not parse are discussed
in the Operating System subsection below. Tables B.1 and B.2 contain some summary
statistics for user-agents (inbound and outbound).
B.1.1 Operating System
Table B.1 lists information for most Web browser options. The percentage listed with each
item is out of total requests, not the 80% that were parsable. It shows that a majority of
requests (50.5%) come from a browser that states it is running a Windows variant, with the
most popular being Windows 7. Mac OS is the second most popular with 18.9% of requests.
Mobile devices (iOS and Android) account for 11.35% of requests that we see.
There are over 1.81 billion requests (17.2%) from over 1.14 million user-agents that have
not been listed in Table B.1 due to errors when parsing them. Out of these: 614 million
requests (5.85% of total) have empty user-agent strings, 164 million (1.57% of total) give
the user-agent string “Shockwave Flash”, 111 million (1.05% of total) are from Red Hat’s
implementation of the wget program, and the rest of the requests are from other terminal
user agents or, more commonly, bots.
136
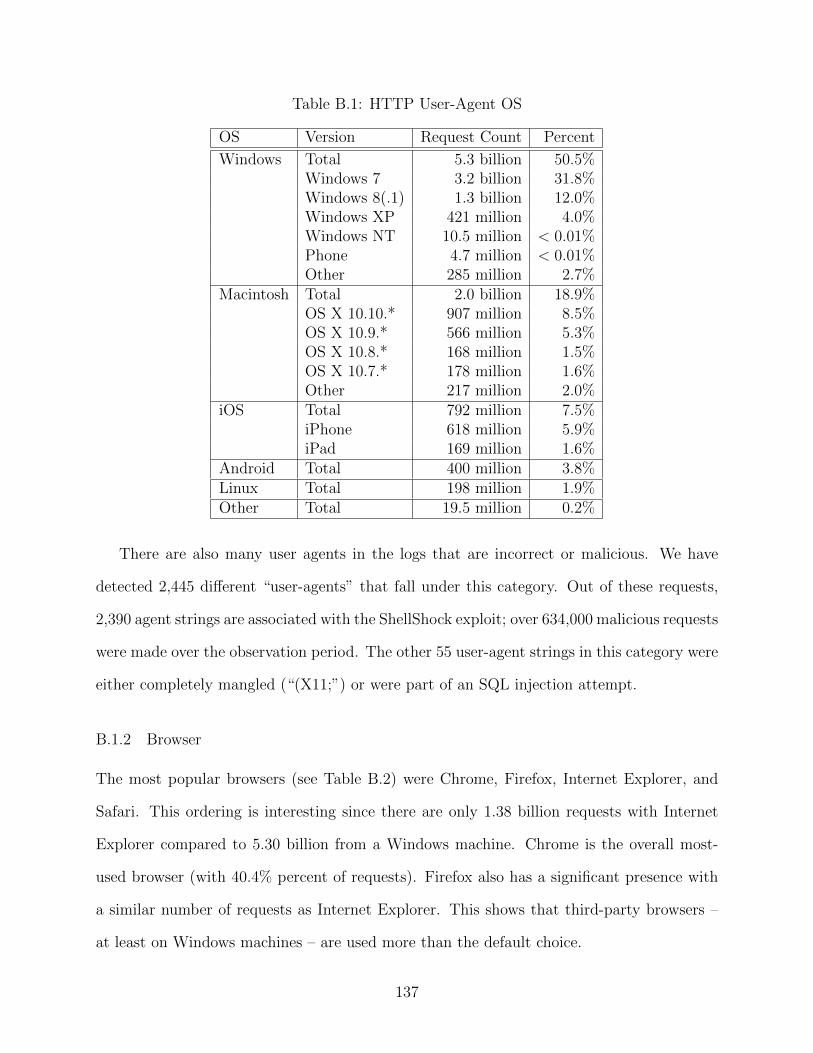
Table B.1: HTTP User-Agent OS
OS Version Request Count Percent
Windows Total 5.3 billion 50.5%Windows 7 3.2 billion 31.8%Windows 8(.1) 1.3 billion 12.0%Windows XP 421 million 4.0%Windows NT 10.5 million < 0.01%Phone 4.7 million < 0.01%Other 285 million 2.7%
Macintosh Total 2.0 billion 18.9%OS X 10.10.* 907 million 8.5%OS X 10.9.* 566 million 5.3%OS X 10.8.* 168 million 1.5%OS X 10.7.* 178 million 1.6%Other 217 million 2.0%
iOS Total 792 million 7.5%iPhone 618 million 5.9%iPad 169 million 1.6%
Android Total 400 million 3.8%Linux Total 198 million 1.9%Other Total 19.5 million 0.2%
There are also many user agents in the logs that are incorrect or malicious. We have
detected 2,445 different “user-agents” that fall under this category. Out of these requests,
2,390 agent strings are associated with the ShellShock exploit; over 634,000 malicious requests
were made over the observation period. The other 55 user-agent strings in this category were
either completely mangled (“(X11;”) or were part of an SQL injection attempt.
B.1.2 Browser
The most popular browsers (see Table B.2) were Chrome, Firefox, Internet Explorer, and
Safari. This ordering is interesting since there are only 1.38 billion requests with Internet
Explorer compared to 5.30 billion from a Windows machine. Chrome is the overall most-
used browser (with 40.4% percent of requests). Firefox also has a significant presence with
a similar number of requests as Internet Explorer. This shows that third-party browsers –
at least on Windows machines – are used more than the default choice.
137
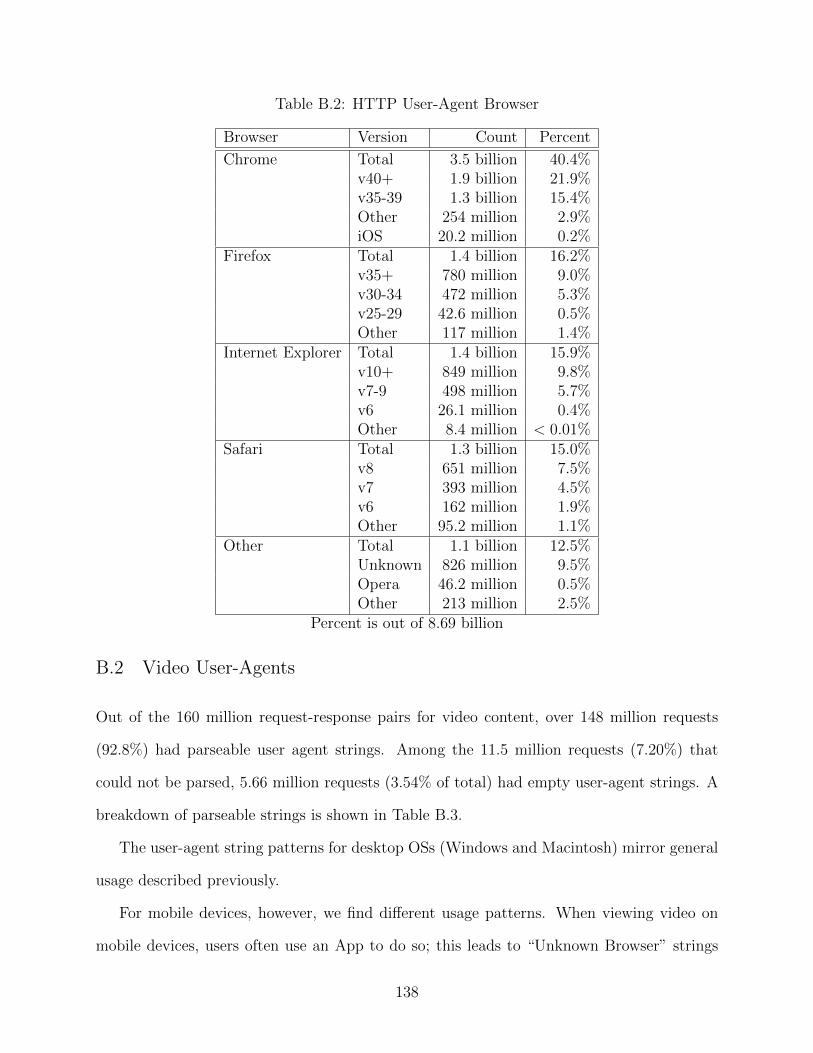
Table B.2: HTTP User-Agent Browser
Browser Version Count Percent
Chrome Total 3.5 billion 40.4%v40+ 1.9 billion 21.9%v35-39 1.3 billion 15.4%Other 254 million 2.9%iOS 20.2 million 0.2%
Firefox Total 1.4 billion 16.2%v35+ 780 million 9.0%v30-34 472 million 5.3%v25-29 42.6 million 0.5%Other 117 million 1.4%
Internet Explorer Total 1.4 billion 15.9%v10+ 849 million 9.8%v7-9 498 million 5.7%v6 26.1 million 0.4%Other 8.4 million < 0.01%
Safari Total 1.3 billion 15.0%v8 651 million 7.5%v7 393 million 4.5%v6 162 million 1.9%Other 95.2 million 1.1%
Other Total 1.1 billion 12.5%Unknown 826 million 9.5%Opera 46.2 million 0.5%Other 213 million 2.5%
Percent is out of 8.69 billion
B.2 Video User-Agents
Out of the 160 million request-response pairs for video content, over 148 million requests
(92.8%) had parseable user agent strings. Among the 11.5 million requests (7.20%) that
could not be parsed, 5.66 million requests (3.54% of total) had empty user-agent strings. A
breakdown of parseable strings is shown in Table B.3.
The user-agent string patterns for desktop OSs (Windows and Macintosh) mirror general
usage described previously.
For mobile devices, however, we find different usage patterns. When viewing video on
mobile devices, users often use an App to do so; this leads to “Unknown Browser” strings
138
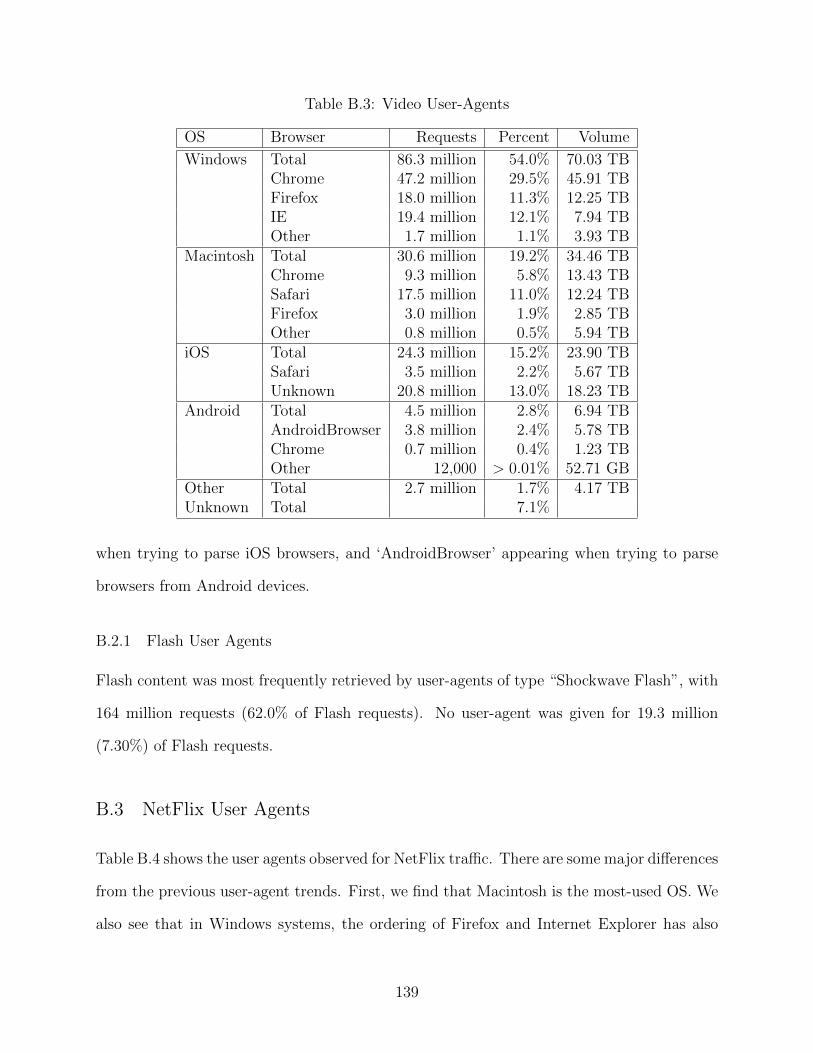
Table B.3: Video User-Agents
OS Browser Requests Percent Volume
Windows Total 86.3 million 54.0% 70.03 TBChrome 47.2 million 29.5% 45.91 TBFirefox 18.0 million 11.3% 12.25 TBIE 19.4 million 12.1% 7.94 TBOther 1.7 million 1.1% 3.93 TB
Macintosh Total 30.6 million 19.2% 34.46 TBChrome 9.3 million 5.8% 13.43 TBSafari 17.5 million 11.0% 12.24 TBFirefox 3.0 million 1.9% 2.85 TBOther 0.8 million 0.5% 5.94 TB
iOS Total 24.3 million 15.2% 23.90 TBSafari 3.5 million 2.2% 5.67 TBUnknown 20.8 million 13.0% 18.23 TB
Android Total 4.5 million 2.8% 6.94 TBAndroidBrowser 3.8 million 2.4% 5.78 TBChrome 0.7 million 0.4% 1.23 TBOther 12,000 > 0.01% 52.71 GB
Other Total 2.7 million 1.7% 4.17 TBUnknown Total 7.1%
when trying to parse iOS browsers, and ‘AndroidBrowser’ appearing when trying to parse
browsers from Android devices.
B.2.1 Flash User Agents
Flash content was most frequently retrieved by user-agents of type “Shockwave Flash”, with
164 million requests (62.0% of Flash requests). No user-agent was given for 19.3 million
(7.30%) of Flash requests.
B.3 NetFlix User Agents
Table B.4 shows the user agents observed for NetFlix traffic. There are some major differences
from the previous user-agent trends. First, we find that Macintosh is the most-used OS. We
also see that in Windows systems, the ordering of Firefox and Internet Explorer has also
139
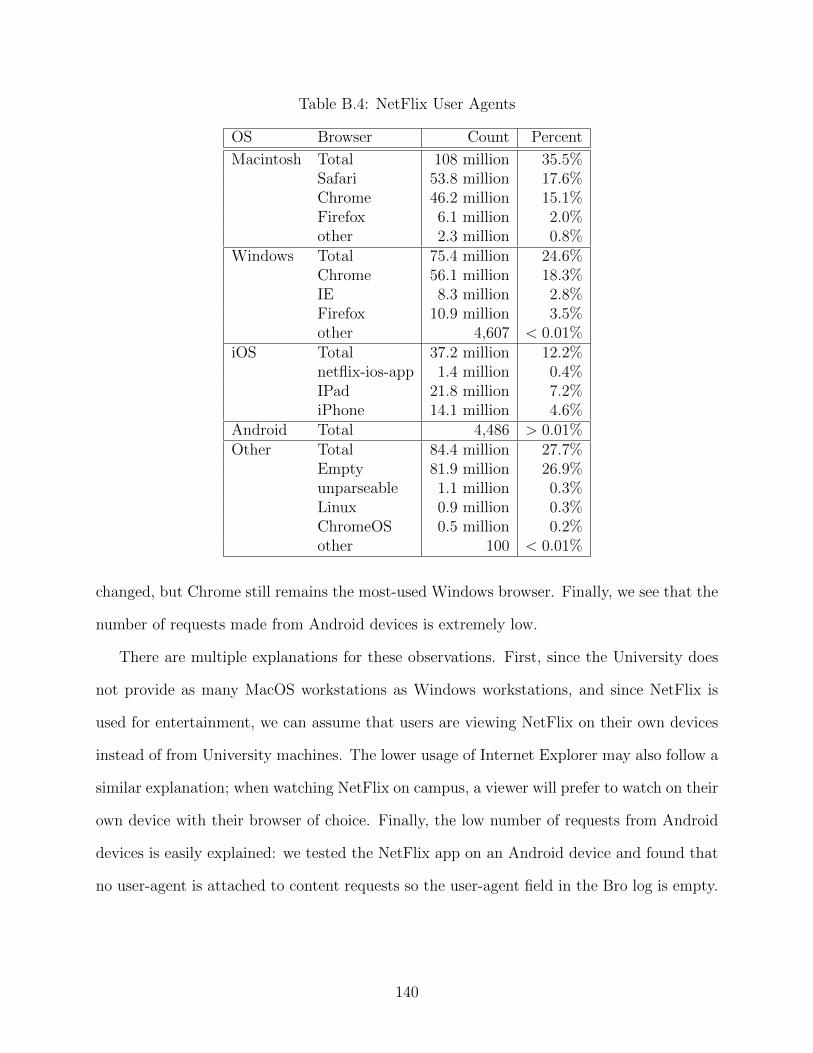
Table B.4: NetFlix User Agents
OS Browser Count Percent
Macintosh Total 108 million 35.5%Safari 53.8 million 17.6%Chrome 46.2 million 15.1%Firefox 6.1 million 2.0%other 2.3 million 0.8%
Windows Total 75.4 million 24.6%Chrome 56.1 million 18.3%IE 8.3 million 2.8%Firefox 10.9 million 3.5%other 4,607 < 0.01%
iOS Total 37.2 million 12.2%netflix-ios-app 1.4 million 0.4%IPad 21.8 million 7.2%iPhone 14.1 million 4.6%
Android Total 4,486 > 0.01%Other Total 84.4 million 27.7%
Empty 81.9 million 26.9%unparseable 1.1 million 0.3%Linux 0.9 million 0.3%ChromeOS 0.5 million 0.2%other 100 < 0.01%
changed, but Chrome still remains the most-used Windows browser. Finally, we see that the
number of requests made from Android devices is extremely low.
There are multiple explanations for these observations. First, since the University does
not provide as many MacOS workstations as Windows workstations, and since NetFlix is
used for entertainment, we can assume that users are viewing NetFlix on their own devices
instead of from University machines. The lower usage of Internet Explorer may also follow a
similar explanation; when watching NetFlix on campus, a viewer will prefer to watch on their
own device with their browser of choice. Finally, the low number of requests from Android
devices is easily explained: we tested the NetFlix app on an Android device and found that
no user-agent is attached to content requests so the user-agent field in the Bro log is empty.
140
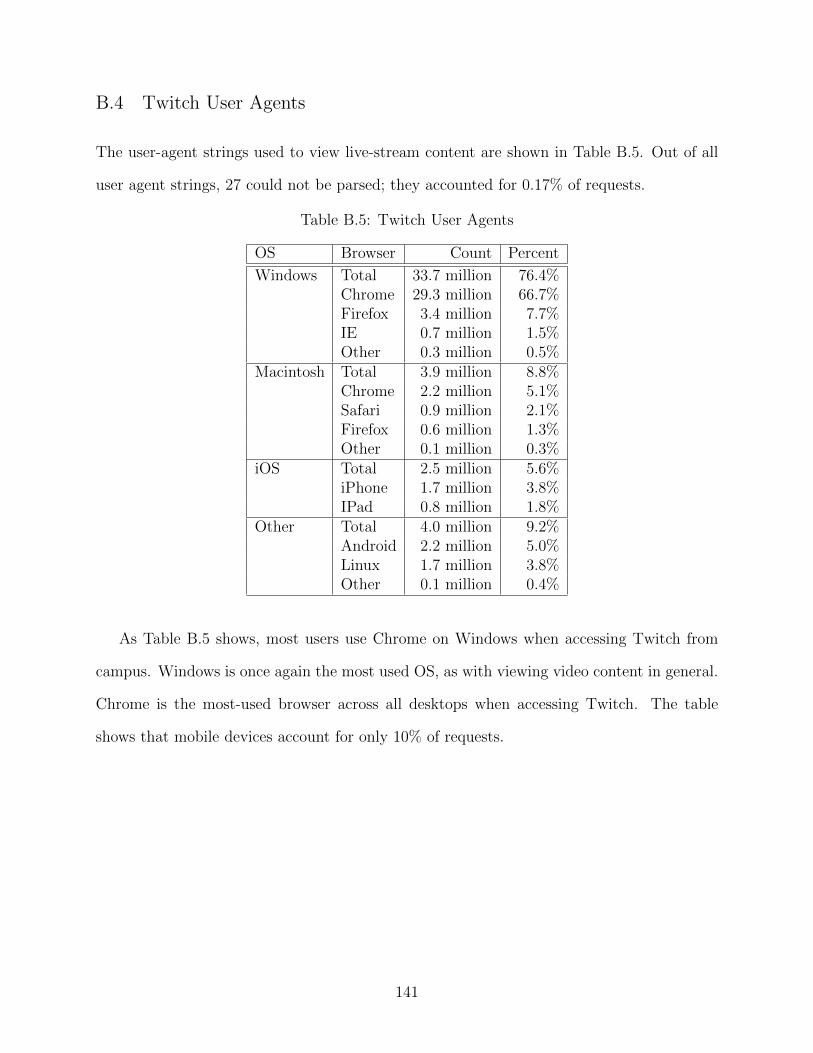
B.4 Twitch User Agents
The user-agent strings used to view live-stream content are shown in Table B.5. Out of all
user agent strings, 27 could not be parsed; they accounted for 0.17% of requests.
Table B.5: Twitch User Agents
OS Browser Count Percent
Windows Total 33.7 million 76.4%Chrome 29.3 million 66.7%Firefox 3.4 million 7.7%IE 0.7 million 1.5%Other 0.3 million 0.5%
Macintosh Total 3.9 million 8.8%Chrome 2.2 million 5.1%Safari 0.9 million 2.1%Firefox 0.6 million 1.3%Other 0.1 million 0.3%
iOS Total 2.5 million 5.6%iPhone 1.7 million 3.8%IPad 0.8 million 1.8%
Other Total 4.0 million 9.2%Android 2.2 million 5.0%Linux 1.7 million 3.8%Other 0.1 million 0.4%
As Table B.5 shows, most users use Chrome on Windows when accessing Twitch from
campus. Windows is once again the most used OS, as with viewing video content in general.
Chrome is the most-used browser across all desktops when accessing Twitch. The table
shows that mobile devices account for only 10% of requests.
141
Appendix C
NetFlix User Interface
The structure of a typical NetFlix session (on a desktop device) is as follows1. Upon visiting
http://www.netflix.com for the first time, NetFlix responds with a HTTP redirect (301)
towards https://www.netflix.com. It uses another redirect that handles geo-restrictions.
In Canada, users receive a 302 redirect pointing them to https://www.netflix.com/ca.
Next, NetFlix handles login authentication over HTTPS. After logging in through HTTPS,
NetFlix reverts back to unencrypted HTTP for communication.
After logging in, the client requests NetFlix over HTTP and is redirected to http://
www.netflix.com/WiHome to select the user’s profile. Once the profile is selected, a second
request to /WiHome is made and is successfully returned. The request path WiHome is
short for Web Interface home. On the homepage for the Web interface, there is a menu
with content that NetFlix suggests for the user, including a list of new (to NetFlix) content,
content the user has not finished watching, and content similar to previously watched content
(Figure C.1 provides a screenshot).
On selection of an item, the browser sends a request to www.netflix.com/WiPlayer?
movieid=<id>... that results in a JavaScript player being loaded. Content is then trans-
ported with a different set of requests as outlined in Section 5.1. Figure C.4 provides an
illustration of the session. Other domains involved when visiting NetFlix include CDNs op-
erated by NetFlix and by third parties to load thumbnail images (i.e., movie/series covers
as well as still frames from playing content).
A screenshot of the Web Interface player is visible in Figure C.2. Here we see the options
for playing the content (pausing, tracking to a point of the video, skipping episodes, etc.)
1The sessions and request paths detailed in this thesis were valid during our collection period. In June2015, NetFlix switched the desktop Web interface to use different paths.
142

Figure C.1: Screenshot of NetFlix Web Interface Homepage
on the bottom. On the right side of this bar (from left to right) there are options to skip to
the next episode, list episodes (discussed in Section 5.2), captioning and language options,
and finally a full screen mode option. If the user does not move their mouse cursor, this
navigation bar disappears after a few seconds.
In Figure C.1, the cursor is hovering over an item Sense8. If the title for this item is
selected, the user will be taken to a page similar to Figure C.3. The series page is the only
way to transmit an episode’s ID at the network level; autoplaying episodes or selecting from
within the player adds the ID to the URI as a fragment.
143
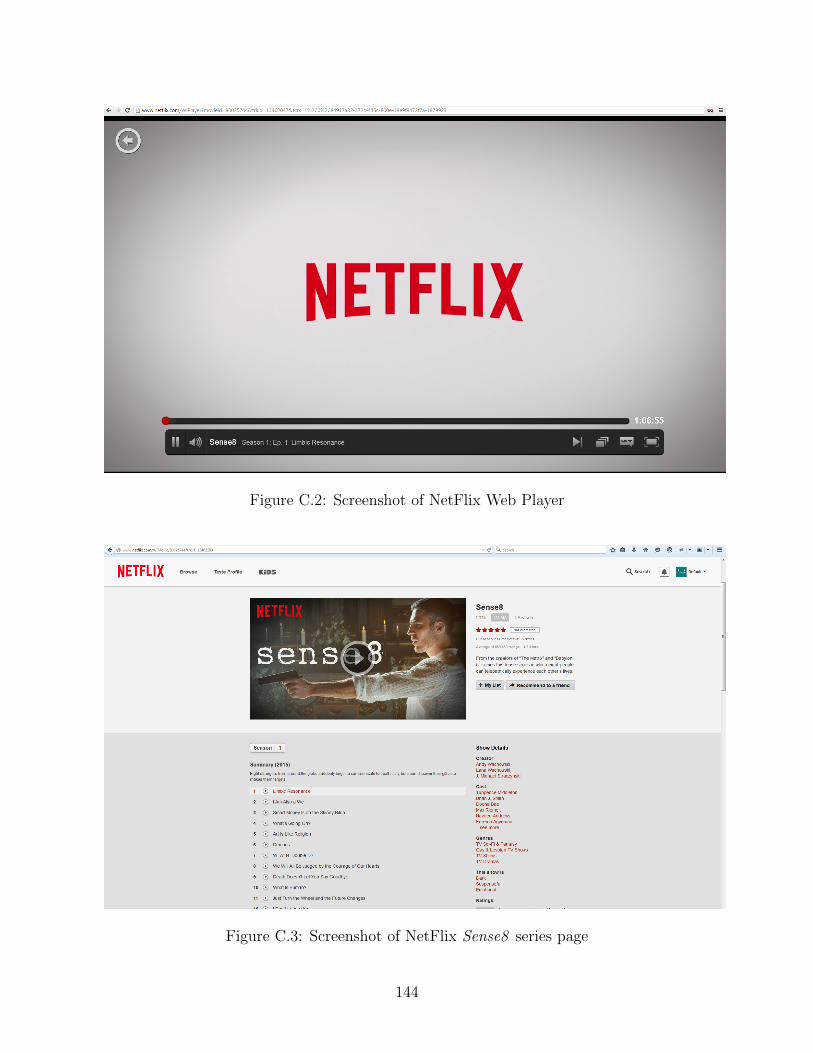
Figure C.2: Screenshot of NetFlix Web Player
Figure C.3: Screenshot of NetFlix Sense8 series page
144
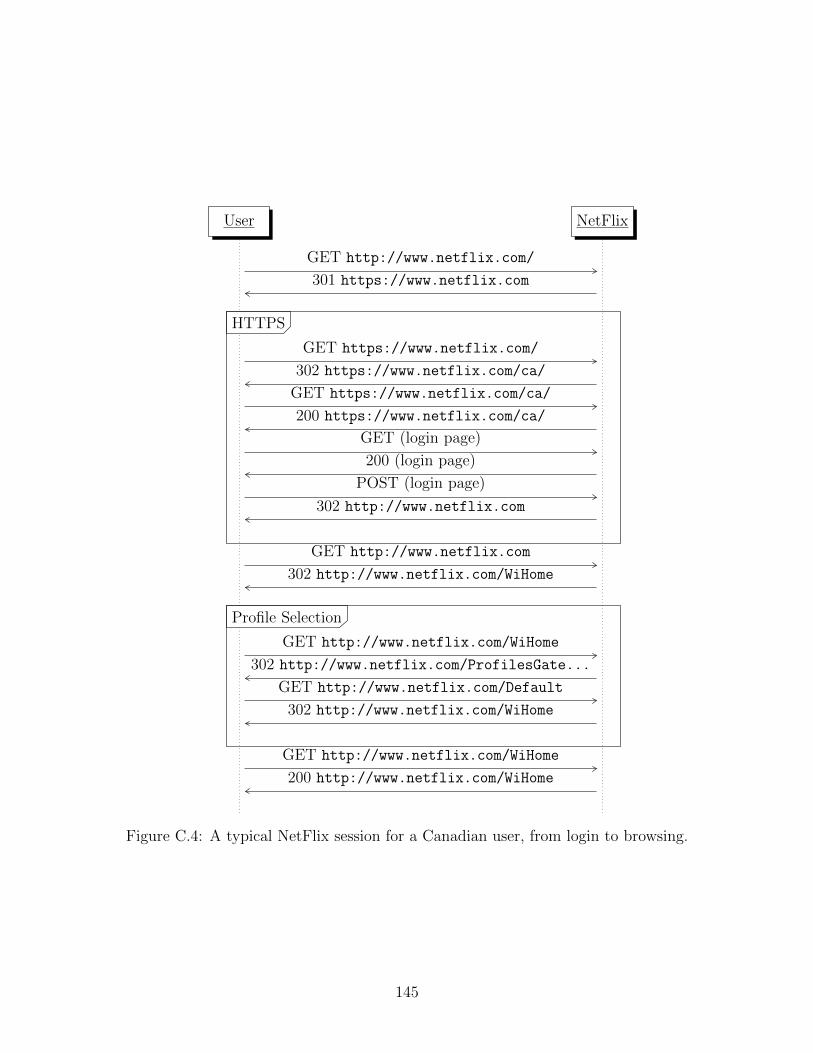
User NetFlix
GET http://www.netflix.com/
301 https://www.netflix.com
GET https://www.netflix.com/
302 https://www.netflix.com/ca/
GET https://www.netflix.com/ca/
200 https://www.netflix.com/ca/
GET (login page)
200 (login page)
POST (login page)
302 http://www.netflix.com
HTTPSHTTPS
GET http://www.netflix.com
302 http://www.netflix.com/WiHome
GET http://www.netflix.com/WiHome
302 http://www.netflix.com/ProfilesGate...
GET http://www.netflix.com/Default
302 http://www.netflix.com/WiHome
Profile SelectionProfile Selection
GET http://www.netflix.com/WiHome
200 http://www.netflix.com/WiHome
Figure C.4: A typical NetFlix session for a Canadian user, from login to browsing.
145
Appendix D
NetFlix IP range
During the collection period, the CIDR subnets that we found NetFlix traffic being trans-
mitted from are as follows:
• 108.175.32.0/20
• 198.45.48.0/20
• 198.38.96.0/19
• 23.246.0.0/18
• 192.173.64.0/18
The following IP ranges are listed as associated with NetFlix, but we have not found that
they transmitted any traffic of interest:
• 45.57.0.0/17
• 64.120.128.0/17
• 66.197.128.0/17
These IP addresses may be involved in serving other regions of the world, i.e., Europe or
South America.
146
Appendix E
New NetFlix Paths
E.1 Login
In June 2015, NetFlix updated their desktop Web Interface. The new interface uses a
different request structure that is outlined in Figure E.1.
In the new interface, a GET request is sent with profile information as parameters.
E.2 Content Viewing
When viewing content from NetFlix, the initial GET request from a desktop device is now
directed towards a URI with the schema:
http://www.netflix.com/watch/<ID>?trackId=...&tctx=...
The ID in this case is the IDe value when viewing a show. It seems that the previous
IDm values are used when viewing details about a show from the catalogue.
Additionally, some requests for content from the desktop are now transmitted over
HTTPS. They seem to come from hosts that conform to the following naming scheme:
https://ipv4_<X>.<Y>.ix.nflxvideo.net/range/<#>-<#>?o=...
The IP addresses for these servers are the same as the ones described in Appendix D. As
of July 27, 2015, mobile requests from Android devices remain unchanged.
147
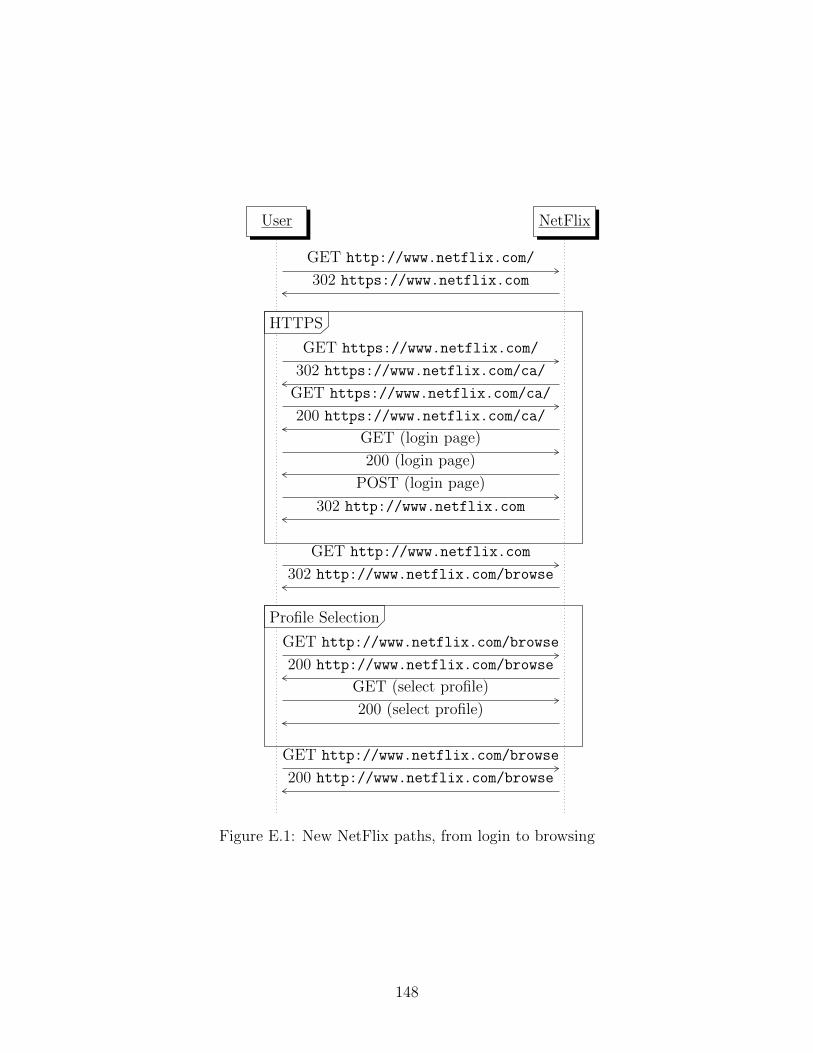
User NetFlix
GET http://www.netflix.com/
302 https://www.netflix.com
GET https://www.netflix.com/
302 https://www.netflix.com/ca/
GET https://www.netflix.com/ca/
200 https://www.netflix.com/ca/
GET (login page)
200 (login page)
POST (login page)
302 http://www.netflix.com
HTTPSHTTPS
GET http://www.netflix.com
302 http://www.netflix.com/browse
GET http://www.netflix.com/browse
200 http://www.netflix.com/browse
GET (select profile)
200 (select profile)
Profile SelectionProfile Selection
GET http://www.netflix.com/browse
200 http://www.netflix.com/browse
Figure E.1: New NetFlix paths, from login to browsing
148
Appendix F
Twitch Subscriptions and Partnership
A user on Twitch may subscribe for $8.99 a month to Twitch Turbo. This service gives
multiple benefits to the user: no ads on streams, a customizable emoticon set for use in
chat, a badge that appears beside your name in chat, extra colours for chat, and longer-term
broadcast storage for VOD content of 60 days as opposed to the non-turbo limit of 14 days
(for full broadcasts only, since highlights may be stored indefinitely).
Streamers who are popular on Twitch, or who have a large following for video game
content (or may otherwise be considered a professional gamer), may apply for partnership
with the site. Partnership offers several benefits to the streamer. The primary benefit is
that it allows the streamer monetization options. The primary mode of monetization is
allowing viewers to pay for subscriptions to a streamer ($4.99/month split between Twitch
and the streamer). This subscription does not always offer the same benefits as the Turbo
subscription. Another option is that Twitch allows the streamer to take donations (or
tips) from the users on their channel. The minimum donation amount is $1.001. Partnered
streamers may be able to play ads (i.e., mid-roll commercial ads), for additional monetization.
Streamers may promote other channels for monetization, such as selling merchandise on their
channels. Top streamers on Twitch (and YouTube) can make millions of dollars a year [27].
Other features that a partnered streamer gains include 60-day VOD storage limit, better
video transcoding options for viewers, delaying their stream by up to 15 minutes2, and
access to beta-test new features.
In return for subscribing to a channel, a user is often granted some privileges by Twitch
and the streamer. Some examples of these privileges include usage of custom emoticons for
1In local currency.2This delay is useful for multi-player games since it prevents viewers from influencing the outcome.
149

chat uploaded by the streamer, invitations to multi-player games with the streamer (the
streamer can access their subscriber list to disseminate needed information), chat badges,
and unthrottled chat usage (if a stream has a lot of viewers, chat may be set to a slow-
mode or a subscriber-only mode). Subscription benefits are listed per streamer (multi-player
invitations don’t count as a benefit in this case, since Twitch cannot enforce it).
150
Appendix G
Twitch User Interface
Figure G.1 shows a screenshot of the Twitch homepage. There is an embedded stream in
the centre of the page showcasing one of the featured streams, with a brief description of the
stream to the right. Directly below the stream, there is a short icon list of featured streams,
with the selected one highlighted (in this case, it is the one in the centre). Below the featured
streams is a list of featured games. This list shows the box-art of the game, the title, and
lists how many people are currently viewing the game. If the user were to scroll down on the
homepage, they would see more featured games than top channel lists. Across the top of the
page, from left to right, there is a link back to the homepage (the text ‘Twitch’), a search
bar, a link to browse Twitch’s directory, a link to subscribe to Twitch Turbo, followed by
the user’s account setting and following list (or options to log in or register if you are not
logged in).
Figure G.2 shows the page when a specific stream is being viewed. The request path
when accessing the page is just the username. For the example, the URL is www.twitch.
tv/ddrjake. On the left side are options to browse Twitch and access user settings. The
top of the page has information about the stream itself. The streamer’s avatar picture is on
the right, followed by the title, streamer, and game being played. In this case, the title of
the stream is “African Power as Loango” being broadcast by the streamer “DDRJake”. The
game being played is Europa Universais IV. Directly below the stream, from left to right,
are options to follow the streamer, subscribe to the streamer (if they are a Twitch partner),
a link to share the stream, a link to bookmark the stream, a theatre-mode option, followed
by options to message the streamer or report the stream. Below these options, there is a full
description of the streamer (that they upload themselves). On the right side of the page is
151
Twitch Chat, described in Section G.2.
The Twitch Player itself uses Flash1 to handle user interaction.
If a user chooses to subscribe to a streamer, they are taken to a page similar to Figure G.3.
This page lists the streamer that you are subscribing to on the left, as well as any benefits
granted. To the right side of this are the payment options; the subscribe page, and any
payment pages, are transmitted via HTTPS.
If a user is logged in and selects their following page, they see a page similar to Figure G.4.
This page has the same options as there were in Figure G.2 on the left side of the page. In
the centre of the page, there is a list of all live-streams that have been followed. The top
row shows live-streams, and below is a list of all streamers hosting a stream (described in
sub-section 6.1.1). Along the bottom of the page is a list of recent broadcasts (VOD content).
G.1 Twitch Domains
We have observed Twitch video content originating from two different domains owned by
Twitch: twitch.tv and ttvnw.net. From December 1st, 2014 through March 16th, 2015,
video traffic was mostly delivered by twitch.tv, but from March 16th until the end of our
collection period in April 2015, ttvnw.net was used. Other domains owned by Twitch, such
as jtvnw.net and justin.tv, are used by Twitch to deliver other elements, such as static
documents. Additionally, jtvnw.net has a CDN domain for serving images for Twitch.
Almost all video content from Twitch (from twitch.tv or ttvnw.net) comes from servers
running Apple’s HTTP Live-Streaming (HLS) service. HLS is an implementation of the
DASH protocol.
1As of July 22, 2015, Twitch has started to use an HTML5-based video player with underlying Flashcontent. They are planning on upgrading to a full HTML5-based solution soon.
152
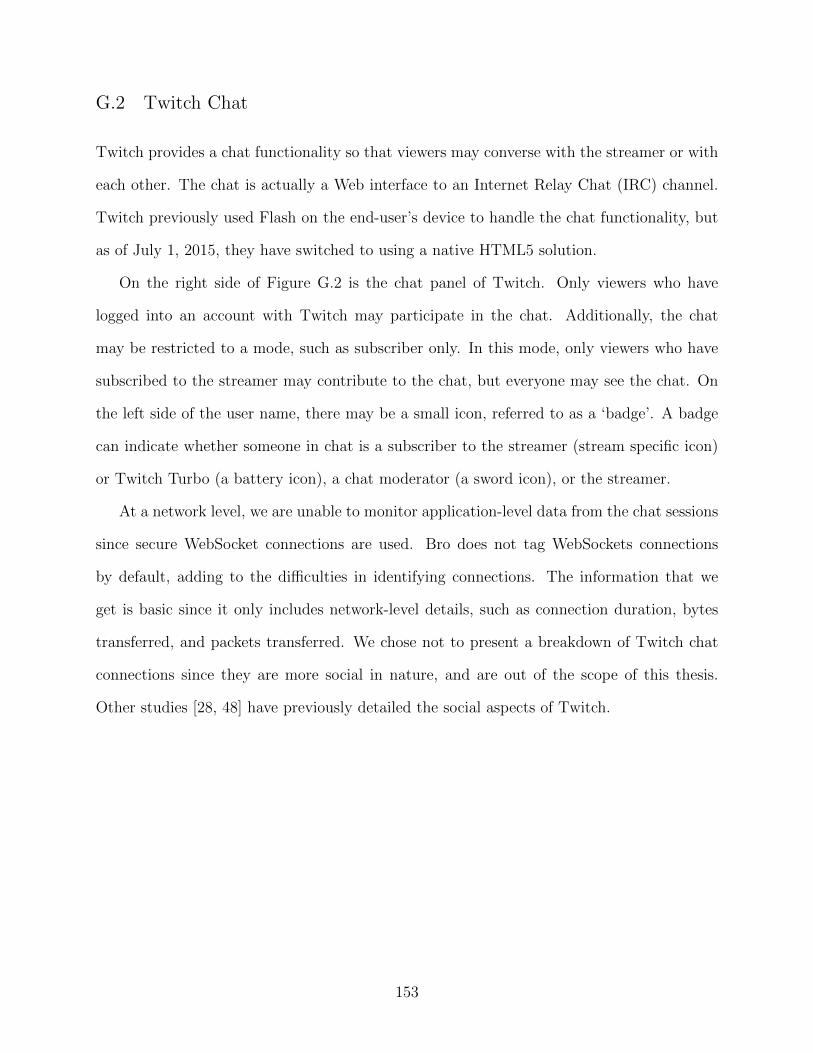
G.2 Twitch Chat
Twitch provides a chat functionality so that viewers may converse with the streamer or with
each other. The chat is actually a Web interface to an Internet Relay Chat (IRC) channel.
Twitch previously used Flash on the end-user’s device to handle the chat functionality, but
as of July 1, 2015, they have switched to using a native HTML5 solution.
On the right side of Figure G.2 is the chat panel of Twitch. Only viewers who have
logged into an account with Twitch may participate in the chat. Additionally, the chat
may be restricted to a mode, such as subscriber only. In this mode, only viewers who have
subscribed to the streamer may contribute to the chat, but everyone may see the chat. On
the left side of the user name, there may be a small icon, referred to as a ‘badge’. A badge
can indicate whether someone in chat is a subscriber to the streamer (stream specific icon)
or Twitch Turbo (a battery icon), a chat moderator (a sword icon), or the streamer.
At a network level, we are unable to monitor application-level data from the chat sessions
since secure WebSocket connections are used. Bro does not tag WebSockets connections
by default, adding to the difficulties in identifying connections. The information that we
get is basic since it only includes network-level details, such as connection duration, bytes
transferred, and packets transferred. We chose not to present a breakdown of Twitch chat
connections since they are more social in nature, and are out of the scope of this thesis.
Other studies [28, 48] have previously detailed the social aspects of Twitch.
153
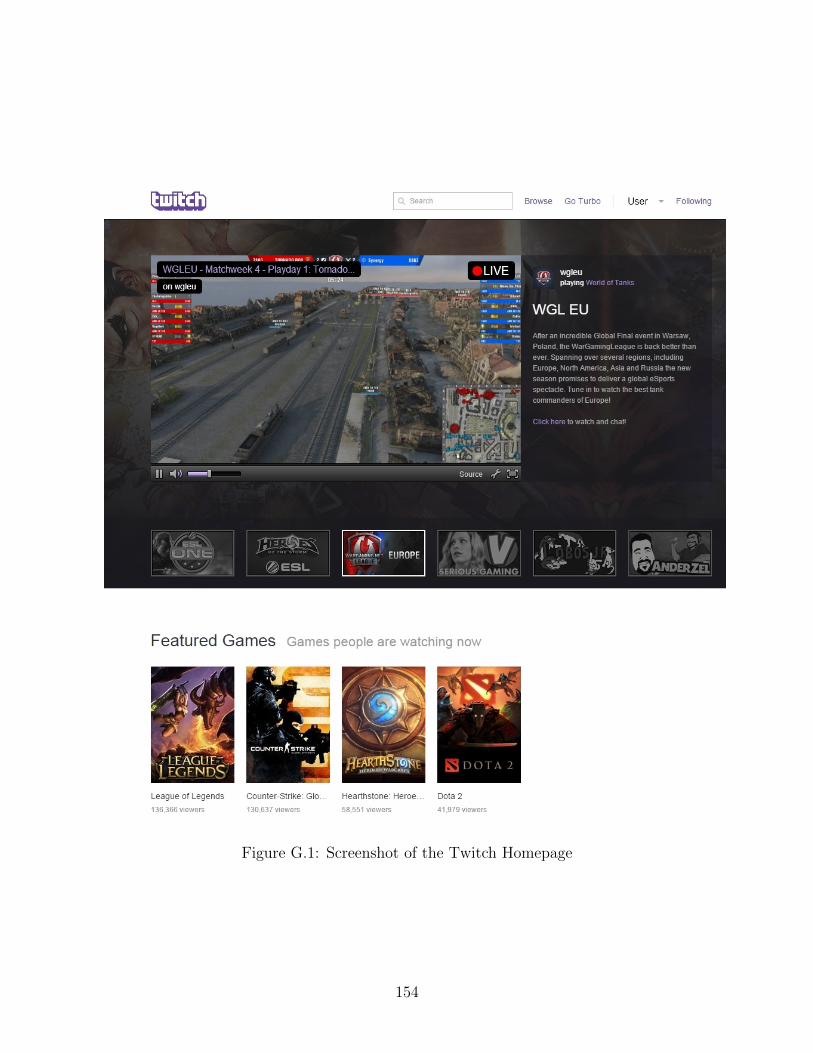
Figure G.1: Screenshot of the Twitch Homepage
154
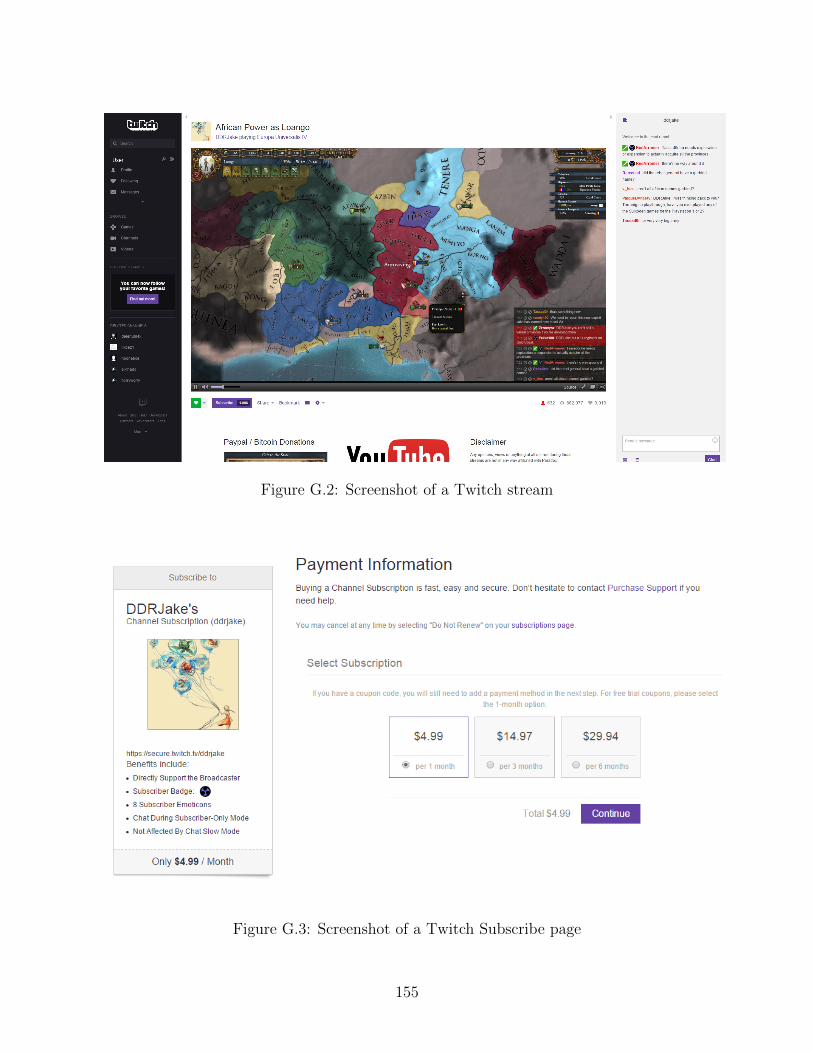
Figure G.2: Screenshot of a Twitch stream
Figure G.3: Screenshot of a Twitch Subscribe page
155
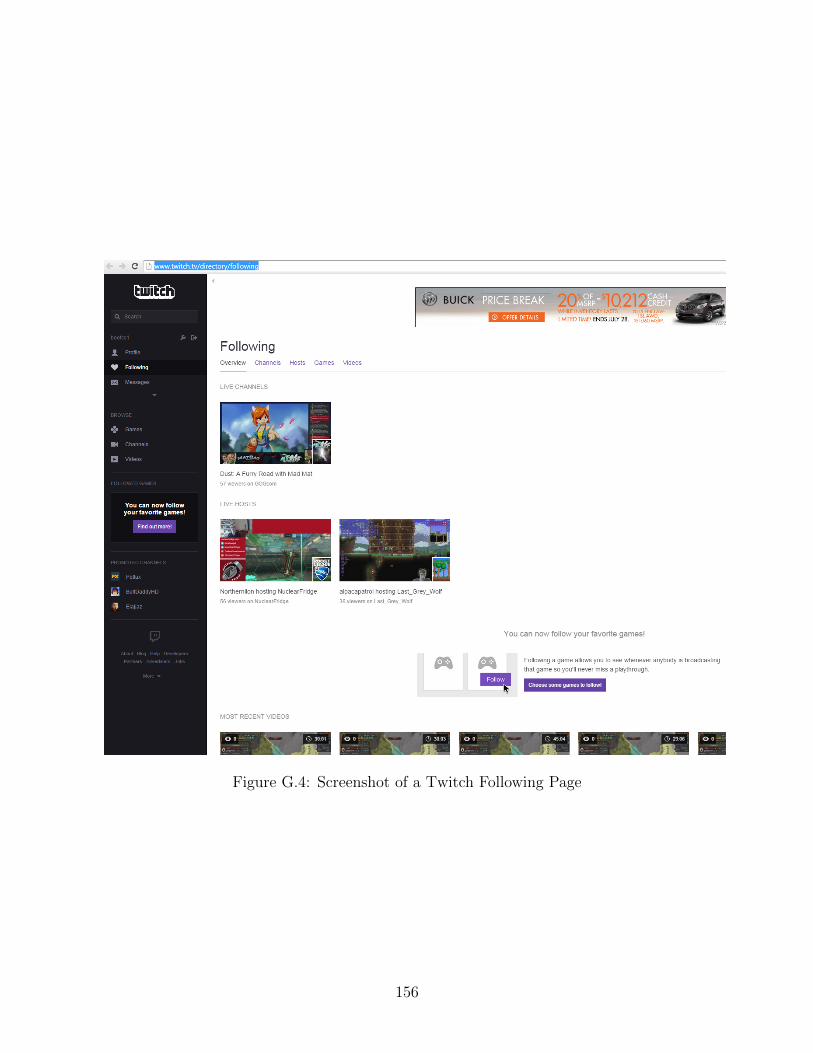
Figure G.4: Screenshot of a Twitch Following Page
156
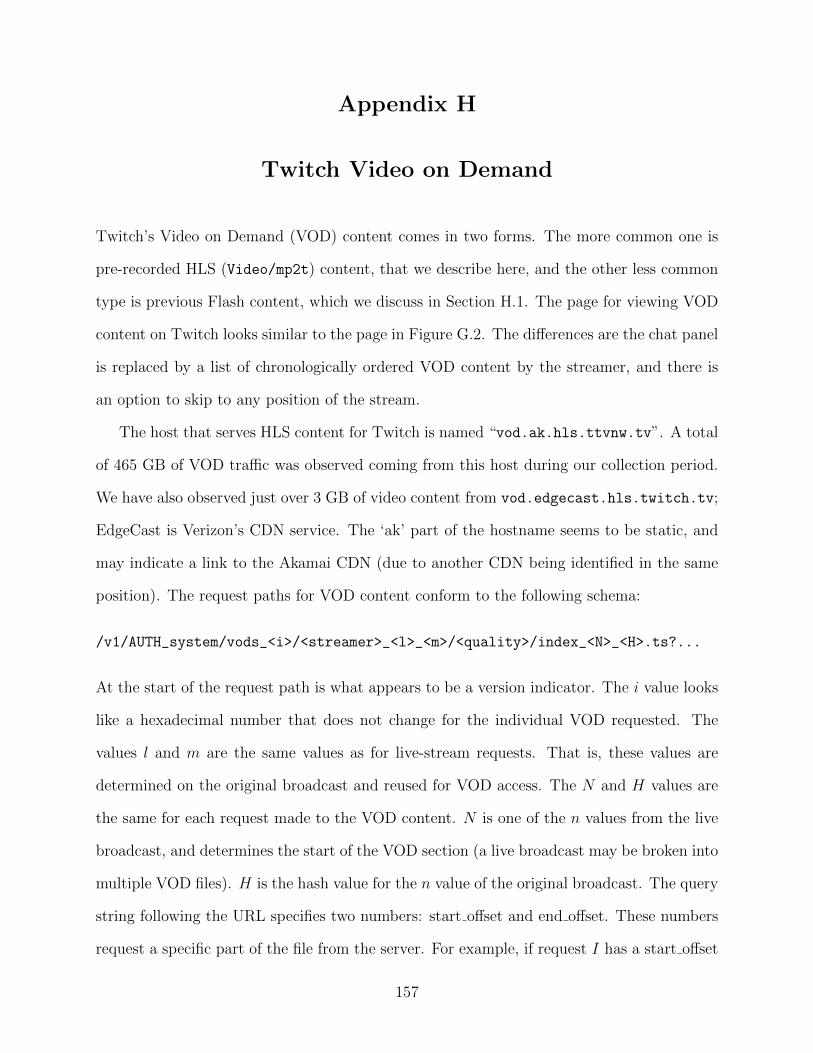
Appendix H
Twitch Video on Demand
Twitch’s Video on Demand (VOD) content comes in two forms. The more common one is
pre-recorded HLS (Video/mp2t) content, that we describe here, and the other less common
type is previous Flash content, which we discuss in Section H.1. The page for viewing VOD
content on Twitch looks similar to the page in Figure G.2. The differences are the chat panel
is replaced by a list of chronologically ordered VOD content by the streamer, and there is
an option to skip to any position of the stream.
The host that serves HLS content for Twitch is named “vod.ak.hls.ttvnw.tv”. A total
of 465 GB of VOD traffic was observed coming from this host during our collection period.
We have also observed just over 3 GB of video content from vod.edgecast.hls.twitch.tv;
EdgeCast is Verizon’s CDN service. The ‘ak’ part of the hostname seems to be static, and
may indicate a link to the Akamai CDN (due to another CDN being identified in the same
position). The request paths for VOD content conform to the following schema:
/v1/AUTH_system/vods_<i>/<streamer>_<l>_<m>/<quality>/index_<N>_<H>.ts?...
At the start of the request path is what appears to be a version indicator. The i value looks
like a hexadecimal number that does not change for the individual VOD requested. The
values l and m are the same values as for live-stream requests. That is, these values are
determined on the original broadcast and reused for VOD access. The N and H values are
the same for each request made to the VOD content. N is one of the n values from the live
broadcast, and determines the start of the VOD section (a live broadcast may be broken into
multiple VOD files). H is the hash value for the n value of the original broadcast. The query
string following the URL specifies two numbers: start offset and end offset. These numbers
request a specific part of the file from the server. For example, if request I has a start offset
157
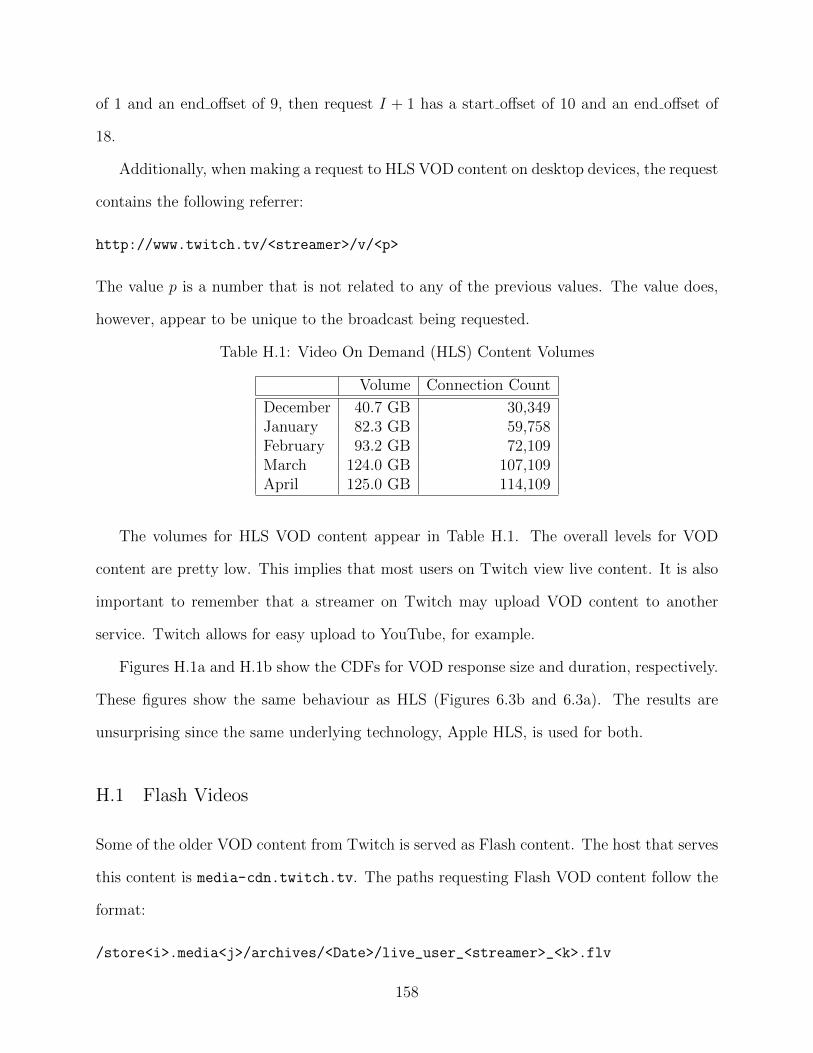
of 1 and an end offset of 9, then request I + 1 has a start offset of 10 and an end offset of
18.
Additionally, when making a request to HLS VOD content on desktop devices, the request
contains the following referrer:
http://www.twitch.tv/<streamer>/v/<p>
The value p is a number that is not related to any of the previous values. The value does,
however, appear to be unique to the broadcast being requested.
Table H.1: Video On Demand (HLS) Content Volumes
Volume Connection Count
December 40.7 GB 30,349January 82.3 GB 59,758February 93.2 GB 72,109March 124.0 GB 107,109April 125.0 GB 114,109
The volumes for HLS VOD content appear in Table H.1. The overall levels for VOD
content are pretty low. This implies that most users on Twitch view live content. It is also
important to remember that a streamer on Twitch may upload VOD content to another
service. Twitch allows for easy upload to YouTube, for example.
Figures H.1a and H.1b show the CDFs for VOD response size and duration, respectively.
These figures show the same behaviour as HLS (Figures 6.3b and 6.3a). The results are
unsurprising since the same underlying technology, Apple HLS, is used for both.
H.1 Flash Videos
Some of the older VOD content from Twitch is served as Flash content. The host that serves
this content is media-cdn.twitch.tv. The paths requesting Flash VOD content follow the
format:
/store<i>.media<j>/archives/<Date>/live_user_<streamer>_<k>.flv
158
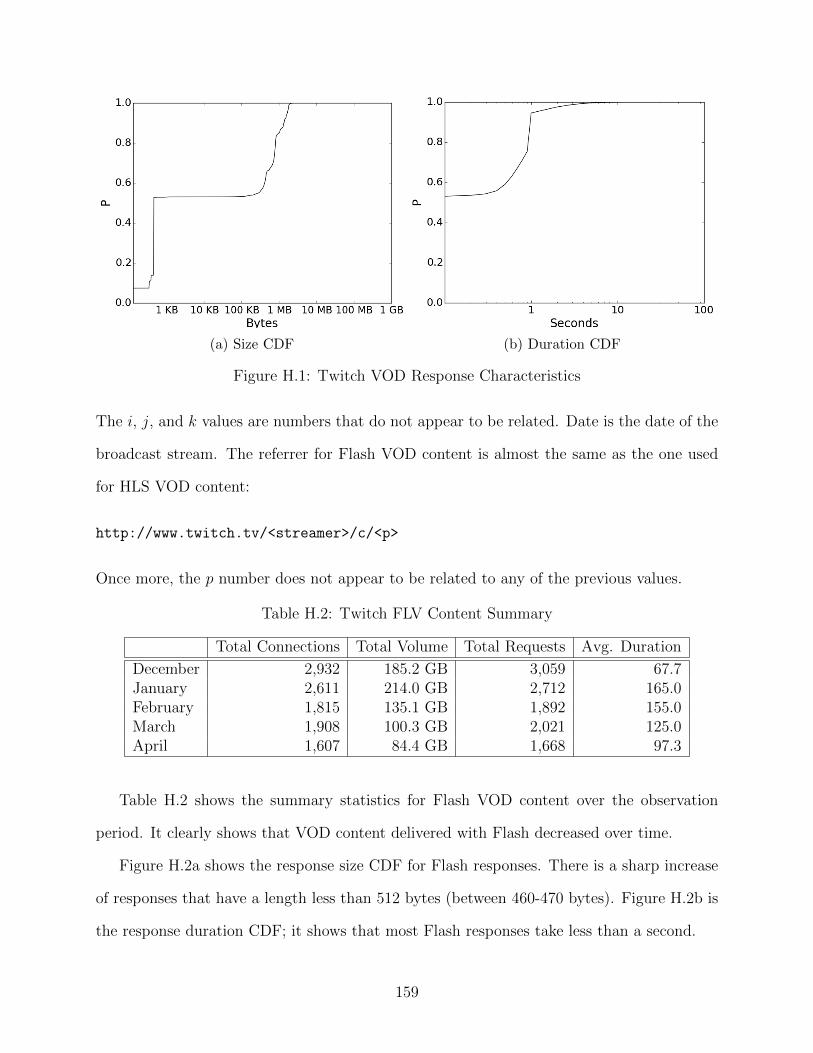
(a) Size CDF (b) Duration CDF
Figure H.1: Twitch VOD Response Characteristics
The i, j, and k values are numbers that do not appear to be related. Date is the date of the
broadcast stream. The referrer for Flash VOD content is almost the same as the one used
for HLS VOD content:
http://www.twitch.tv/<streamer>/c/<p>
Once more, the p number does not appear to be related to any of the previous values.
Table H.2: Twitch FLV Content Summary
Total Connections Total Volume Total Requests Avg. Duration
December 2,932 185.2 GB 3,059 67.7January 2,611 214.0 GB 2,712 165.0February 1,815 135.1 GB 1,892 155.0March 1,908 100.3 GB 2,021 125.0April 1,607 84.4 GB 1,668 97.3
Table H.2 shows the summary statistics for Flash VOD content over the observation
period. It clearly shows that VOD content delivered with Flash decreased over time.
Figure H.2a shows the response size CDF for Flash responses. There is a sharp increase
of responses that have a length less than 512 bytes (between 460-470 bytes). Figure H.2b is
the response duration CDF; it shows that most Flash responses take less than a second.
159
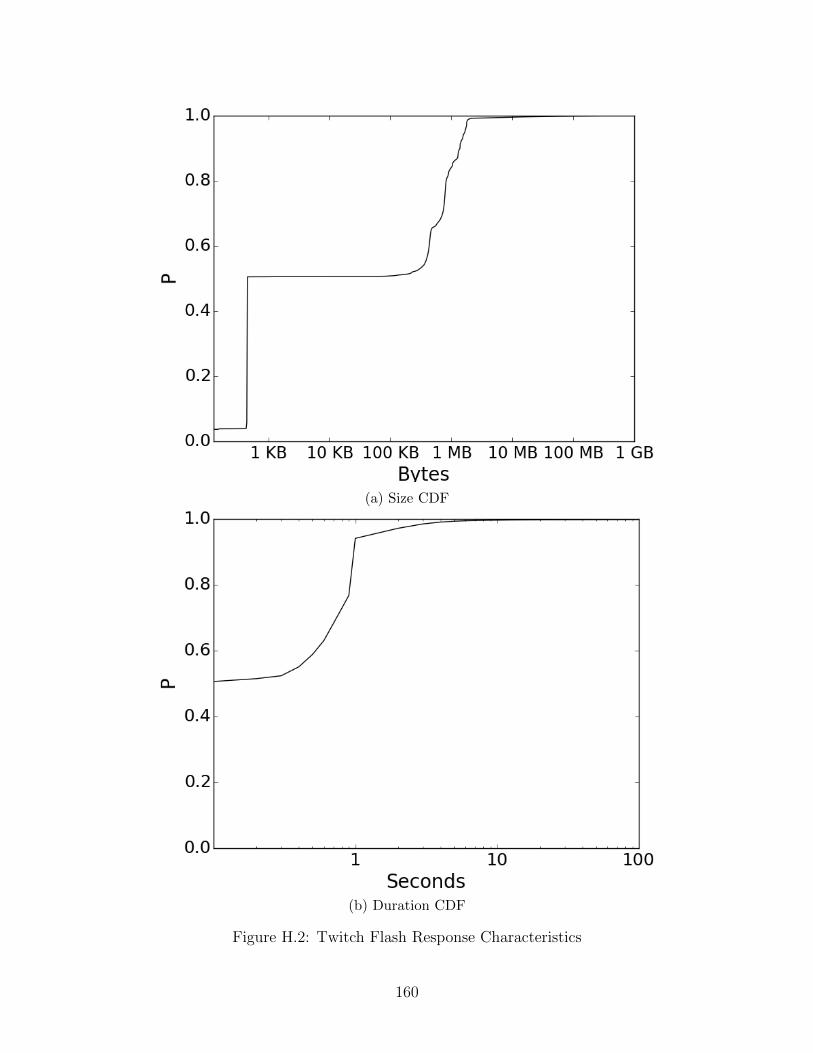
(a) Size CDF
(b) Duration CDF
Figure H.2: Twitch Flash Response Characteristics
160