Embed Size (px)
Citation preview

Iranian J Publ Health, Vol. 42, No. 12, Dec 2013, pp.1374-1386 Original Article
1374 Available at: http://ijph.tums.ac.ir
Neurobehavioral Performance of Estate Residents with Privately-Treated Water Supply
*Siti Farizwana MOHD RIDZWAN1, Zurahanim Fasha ANUAL 2, Mazrura SAHANI3,
Ahmad Rohi GHAZALI3
1. Faculty of Medicine, Universiti Kebangsaan Malaysia Medical Centre, Kuala Lumpur, Malaysia 2. Environmental Health Research Centre, Institute for Medical Research, Malaysia
3. Faculty of Health Sciences, Universiti Kebangsaan Malaysia, Kuala Lumpur, Malaysia
*Corresponding Author: Email: [email protected]
(Received 19 Aug 2013; accepted 09 Oct 2013)
Introduction
Water in adequate quantity and quality is essential and is a basic human right (1-3). Unsafe water supply, inadequate sanitation and hygiene contrib-uted to about 88% of diarrheal disease. In 2002 alone, 1.1 billion people lacked access to im-proved water sources, which represented 17% of the global population. Certainly, the high accessi-bility to water supply not only in urban areas en-sures better quality of life (4, 5).
Although access to safe water supply in Malaysia has somewhat improved over the last couple of years, a small percentage of the population is still relying on private water supply. Specifically in Ko-ta Tinggi District in the state of Johor Darul Takzim, 66.7% of estates are still using private water supply as a main source of drinking water (6). These estates are owned by private owners and they are usually located in the rural areas. The
Abstract Background: Neurotoxicants present in water supply may affect human functions in terms of attention, response speed and perceptual motor speed. Neurobehavioural performance can be influenced by gender, age and education levels. This study aims to assess the neurobehavioral performance of palm oil estate residents with private water sup-ply in southern Peninsular of Malaysia. Methods: A total of 287 and 246 participants from estates with private (PWS) and public water supply (PUB) were recruited to complete a demographic and subjective symptom questionnaire followed by the Neurobehavioral Core Test Battery (NCTB). Results: PWS participants who consumed privately-treated water performed poorly in all NCTB tests compared to PUB participants except for Santa Ana test. Significant group differences in neurobehavioral performance were found for Digit Span Backward (P=0.047), Benton Visual Retention (P=0.006) and Trail Making B tests (P<0.05); which measures the function of memory, attention and visual perception-conceptual. Gender, age and years of education influenced the NCTB scores (P<0.05). Female participants performed poorly in tests measuring latency but excellently tackled those tests that determined association. Younger participants from both PWS and PUB performed better on NCTB tests when compared to other age groups (P<0.05). PWS and PUB participants in this study who received a longer duration of education excelled in the NCTB tests (P=0.000). Conclusion: Poor neurobehavioral performance is associated with low water supply quality which affects neurofunc-tions in terms of attention, memory, response and perceptual motor speed. Keywords: NCTB, Neurobehavior, Water quality, Private water supply, Self-treated water

Iranian J Publ Health, Vol. 42, No.12, Dec 2013, pp. 1374-1386
Available at: http://ijph.tums.ac.ir 1375
public water service covers only part of the district, especially urban areas. The installation of public water pipes is very costly for the private owners of the estates, resorted them to supply the popula-tion with the nearest water sources. However, there are plans to upgrade the private water supply to public water supply in the near future. Private water supplies are those supplied by other than government authority and the maintenance rely solely upon the owners (7).Inappropriate treated water may expose the vulnerable water to contam-inants such as microbes, heavy metals, pesticides and pathogens which could lead to waterborne disease outbreaks and ill-health (8-11). A number of studies in Aberdeenshire, UK and Ontario, Canada have shown potential health con-cerns associated with contaminated private water supply as they receive minimal treatment when compared to the government regulated source (7, 12). Analysis of water quality in selected estates in Kota Tinggi District, Johor, Malaysia showed a failure to meet aluminium (Al) minimum standard (13); the Malaysian National Standard for Drink-ing Water Quality (NSDWQ) by the Ministry of Health, Malaysia in the private drinking water compared to the public water supply besides other parameters such as pH, turbidity and residual chlorine (14). The NSDWQ issued by the ministry was adopted from the World Health Organization (WHO); Guidelines for Drinking Water Quality (15). These contaminants from agricultural areas were believed to have the potential to become neuro-toxicant agents that affect human neurofunctions by contaminated water consumption. Exposure to pollutants like metals may impair the neurob-ehavioral development, inducing mental and psy-chomotor disturbances as well as learning beh-avioral and sensory disorders (16, 17). Neuro-behavioral tests such as the WHO Neurobehav-ioral Core Test Battery (NCTB) is widely used to assess neurotoxicity exposure besides other test versions such as a computerized evaluation system and Raven Colored Progressive Matrices (RCPM)(18-20). Researchers mainly used NCTB to assess neurobehavioral performance in workers exposed to occupational hazards such as industrial
facto-ries (21-24), agriculture areas (25-28) or in-dividuals exposed to prolonged polluted environ-ment through air and water (29-31). The NCTB test comprised subjective symptom questionnaires and a series of tests that assessed the following functions: attention/response speed, auditory memory, manual dexterity, perceptual-motor speed, visual perception/ memory and mo-tor steadiness. The NCTB is widely used because it is relatively economical, uncomplicated and ap-propriate battery consisting mainly of paper-and-pencil test, short administration time, not tiring and easy to administer to poorly literate subjects since it measures very basic functions. The battery test was developed for health hazard evaluations and field studies for which the testing time per person is restricted and circumstances do not tol-erate the use of more sophisticated methods. It is also to be used as standard indicator tests within larger test batteries to allow cross-comparisons between studies and countries (18, 32). There are numerous publications reported in the literature regarding human neurobehavioral defi-cits due to chemical exposure from the occupa-tional settings (33, 34), industrial pollution (35) as well as the unexpected incident that leads to a ma-jor damage towards the environment (31, 36). There were also a few research conducted on the voluntarily general population and also on labora-tory rats to assess their neurology functions (37-41). However, the health risk assessment relating to the consumption of minimally-treated water supply with the risk of health and neurobehavioral effect has never been reported in the region of Southeast Asia, particularly in Malaysia. Realizing the fact that private water supply in a previous study (13) is minimally treated and there may be a risk of exposure from neurotoxicants present in the water, this extension study attempts to assess the neurobehavioral performance of es-tate residents consuming private water supply. The finding of this research will generally provide a baseline data for preparation in developing an environmental health policy towards the implem-entation of 100% safe water supply in rural areas, specifically in plantation areas; compatible with the Tenth Malaysia Plan which included an objec-

Mohd Ridzwan et al.: Neurobehavioral Performance of Estate …
1376 Available at: http://ijph.tums.ac.ir
tive of enhancing the quality of life of the estates workers (42). The results of this study might sup-port and create an urge to upgrade the water sup-ply in those estates in the near future.
Materials and Methods Study population This cross-sectional study was conducted from 2009 to 2012 in palm oil estates with two types of water supply; private water supply (PWS) or pub-lic water supply (PUB). Participants from PWS estates and PUB estates were considered as ex-posed group and non-exposed group respectively. The sample size was calculated using a formula of n= [Z2p (1-p)] /d2(43,44) with expected percentage of incidence is 76% adopted from the Camelford water incident (31) where a total of 287 and 246 participants from both PWS and PUB were in-volved. All the participants were either estate workers or residents of the estates who have stayed for at least a year. Only literate Malaysians between the ages of 16 to 65 years were selected. Procedure A questionnaire with information sheet and con-sent form regarding the purpose of the study was given to the participants prior to the administra-tion of the neurobehavioral tests. The question-naire consisted of data on personal, educational, medical, occupational and exposure to neurotoxi-cants. The participants were interviewed by trained personnel and examined physically by a medical assistant. Neurobehavioral Core Test Battery (NCTB) Subjective symptom questionnaire
The participants were requested to complete a subjective symptoms questionnaire containing 37 questions which list the most common discomfort in behavior, feeling and sensations that a person may experience prior to the commencement of the NCTB tests as explained below. Simple Reaction Time
Simple reaction time (SRT) measures how fast a person reacts and requires sustained attention from the subject. The subjects’ task is to give fast motor responses to repetitive visual stimuli in randomly varied intervals of 3, 5 and 7 seconds. The test was measured using Lafayette Simple Re-action Time instrument. Benton Visual Retention
The Benton Visual retention test is a test of short term visual memory which utilizes the same geo-metric patterns and measures the ability to organ-ize geometrical patterns in space and memorize them. Pursuit Aiming
The test measures the ability to make quick and accurate movements with the hand. The partici-pants were requested to place one dot inside each circle following the pattern given on the Pursuit Aiming Test sheet.
Digit Symbol The Digit Symbol test is a test of perceptual
motor speed which also requires learning of asso-ciation. The Digit Symbol test worksheet contains a list of numbers that are associated with certain simple symbols in a list of random digits from 1 through 9 with blank squares below each digit.
Digit Span The Digit Span test is a test of immediate (short
term) auditory memory which requires focused attention. It consists of two different parts, Digits Forward and Digit Backward; each comprising seven pairs of progressively longer sequences of random numbers.
Trail-making The trail making is a test of visual conceptual and
visuomotor tracking which involves motor speed and attention functions. This test was divided into two parts namely Part A and Part B. Both parts consist of 25 circles distributed over a sheet of paper. The participants were asked to draw a line connecting the numbers in ascending order in Part

Iranian J Publ Health, Vol. 42, No.12, Dec 2013, pp. 1374-1386
Available at: http://ijph.tums.ac.ir 1377
A, while in Part B, they were requested to connect the circles by alternating numbers and alphabets. Santa Ana Manual Dexterity The Santa Ana test is a test of manual dexterity which required rapid eye-hand coordinated movements. The equipment consists of a base plate with 48 square holes and equal number of fitted pegs having a cylindrical upper part and square base. The participants were asked to turn
each peg 180 as fast as possible in 30 seconds. Statistical methods The statistical analysis was performed with SPSS 20.0 using parametric tests to test for differences between variables. Correlation (Spearman’s rho) analysis was used to explore the relationship be-tween variables. We then performed multiple lin-ear regressions for each of the WHO NCTB test scores controlling for gender, age and years of ed-ucation. All statistical tests were estimated at 95% level of confidence.
Results Table 1 shows the summary of demographic char-acteristics of participants. The response rate for both PWS and PUB was 82% and 67%. All ques-tions were successfully responded by the partici-pants except for one participant who failed to complete the question on the use of a water filter. Prevalence of subjective symptoms A total of 44 and 38 participants from PWS and PUB who were on long-term medication (diabetes, high blood pressure, renal failure) were excluded from the study. The prevalence of significant sub-jective symptoms among the PWS and PUB par-ticipants is shown in Table 2. The most significant symptoms were headache, diarrhea and difficulty walking in the dark (α=0.05). Neurobehavioral test performances The means of the outcome variables of the neu-robehavioral tests together with P-values for the significance tests of group differences are pre-
sented in Fig. 1. The PWS participants performed poorly in all NCTB tests (P<0.005) compared to PUB participants except for Santa Ana Manual Dexterity II and III. Table 1: Demographic characteristics of participants
Studied varia-bles
PWS partici-pants (n=287)
PUB partici-pants (n=248)
Age (years) Mean (SD) 39.04 (10.1) 35.9 (12.0) Gender Male (%) 152 (53.0) 117 (47.6) Female (%) 135 (47.0) 129 (52.4) Ethnic Malay (%) 284 (99.0) 216 (87.8) Indian (%) 3 (1.0) 30 (12.2) Education level No education (%) 2 (0.7) 1 (0.4) Primary (%) 82 (28.6) 72 (29.3) Secondary (%) 182 (63.4) 166 (67.5) Diploma (%) 18 (6.3) 5 (2.0) Degree (%) 3 (1.0) 2 (0.8) Length of stay (years)
Mean (SD) 10.1 (5.4) 19.8 (13.8) Water filter Yes (%) 60 (20.9) 38 (15.4) No (%) 226 (78.7) 208 (84.6) Smoking status Smokers (%) 98 (34.1) 73 (29.7) Non-smokers (%) 189 (65.9) 173 (70.3)
Significant group differences were found for Digit Span Backward (P=0.047), Benton Visual Reten-tion (P=0.006), and Trail Making B tests (P<0.05).When adjusted for gender, Fig. 2 showed that female PWS participants performed better in Pursuit Aiming test (P<0.00) while female PUB participants scored better in Digit Symbol test (P=0.002). Only male PUB participants were found to be faster in Simple Reaction Time (P=0.003). Score-wise, both female and male from PUB presented a higher score compared to PWS participants in most of the tests. On the other hand, different age categories showed different levels of performance.

Mohd Ridzwan et al.: Neurobehavioral Performance of Estate …
1378 Available at: http://ijph.tums.ac.ir
Table 2: Prevalence of subjective symptoms among PWS and PUB participants
Symptoms PWS participants (n=246)
PUB participants (n=287)
OR (CI)
Lethargy 126 51.4 169 59.5 1.39 (0.98,1.96) Early morning lethargy 81 33.1 110 38.6 1.27 (0.89, 1.82) Easily fall asleep 92 37.6 124 43.4 1.27 (0.90, 1.80) Sleepy while watching TV 75 30.7 83 29.1 0.93 (0.64, 1.34) Insomnia 32 13.1 53 18.6 1.51 (0.94, 2.44) Sudden awake up at night 78 32.0 99 34.7 1.13 (0.79, 1.63) Bad dream 15 6.1 14 4.9 0.79 (0.37, 1.68) Forgetful 89 36.3 114 40.0 1.17 (0.82, 1.66) Incoherence 38 15.5 51 18.0 1.19 (0.75, 1.89) Daydream 30 12.2 43 15.0 1.27 (0.77, 2.09) Difficulty concentrating 42 17.1 68 23.9 1.53 (1.00, 2.35)
Depressed 21 8.6 25 8.8 1.03 (0.56, 1.88) Poor interest 27 11.0 24 8.5 0.75 (0.42, 1.33) Fearful 28 11.4 29 10.2 0.89 (0.51, 1.53) Isolation 15 6.1 16 5.6 0.92 (0.44, 1.89) Irritability 45 18.3 52 18.2 1.00 (0.64, 1.55) Restlessness 36 14.8 37 13.0 0.86 (0.53, 1.41) Headache 80 32.9 119 41.9 1.47 (1.03, 2.10) Vertigo 81 33.3 103 36.7 1.16 (0.81, 1.66) Palpitation 24 9.8 32 11.2 1.16 (0.66, 2.03) Excessive sweating 95 38.9 106 37.3 0.93 (0.66, 1.33) Poor appetite 33 13.5 50 17.5 1.37 (0.85, 2.20) Diarrhea 6 2.4 19 6.7 2. 86 (1.12, 7.27) Constipation 16 6.5 30 10.5 1.68 (0.89, 3.17) Abdominal colic 24 9.8 34 12.0 1.25 (0.72, 2.17) Finger numbness 60 24.6 82 28.9 1.24 (0.84, 1.84) Upper limb numbness 30 12.2 40 14.1 1.17 (0.71, 1.95) Lower limb numbness 25 10.2 35 12.3 1.23 (0.71, 2.12) Upper limb weakness 31 12.7 34 11.9 0.94 (0.56, 1.57) Lower limb weakness 23 9.4 27 9.5 1.00 (0.56, 1.80) Tremor 27 11.1 23 8.1 0.71 (0.39, 1.27) Easily dropped things 17 6.9 10 3.5 0.49 (0.22, 1.09) Difficulty walking in the dark
48 19.6 88 30.9 1.83 (1.22, 2.74)
Changing smell sensation 11 4.5 13 4.6 1.02 (0.45, 2.31) Changing taste sensation 14 5.7 14 4.9 0.85 (0.40, 1.82) Facial numbness 8 3.3 8 2.8 0.86 (0.32, 2.31) Facial paraesthesia 5 2.0 10 3.5 1.75 (0.59, 5.20)
In this study, age of participants was categorized into five different groups. Overall, the PWS par-ticipants from the youngest age category (16-25 years) excelled in most of the sub-tests, signifi-cantly in five sub-tests out of eleven (P<0.014) compared to other age categories (Fig. 3(a)). Simi-lar achievements were shown by the PUB partici-
pants from the same age category that significantly did well in three sub-tests (Fig. 3 (b)). However, it is noticeable that participants from the age catego-ry of 26 to 35 years did better in Santa Ana for both groups (P<0.05). Level of education may also influence the neuro-behavioral performance. When the years of educa-

Iranian J Publ Health, Vol. 42, No.12, Dec 2013, pp. 1374-1386
Available at: http://ijph.tums.ac.ir 1379
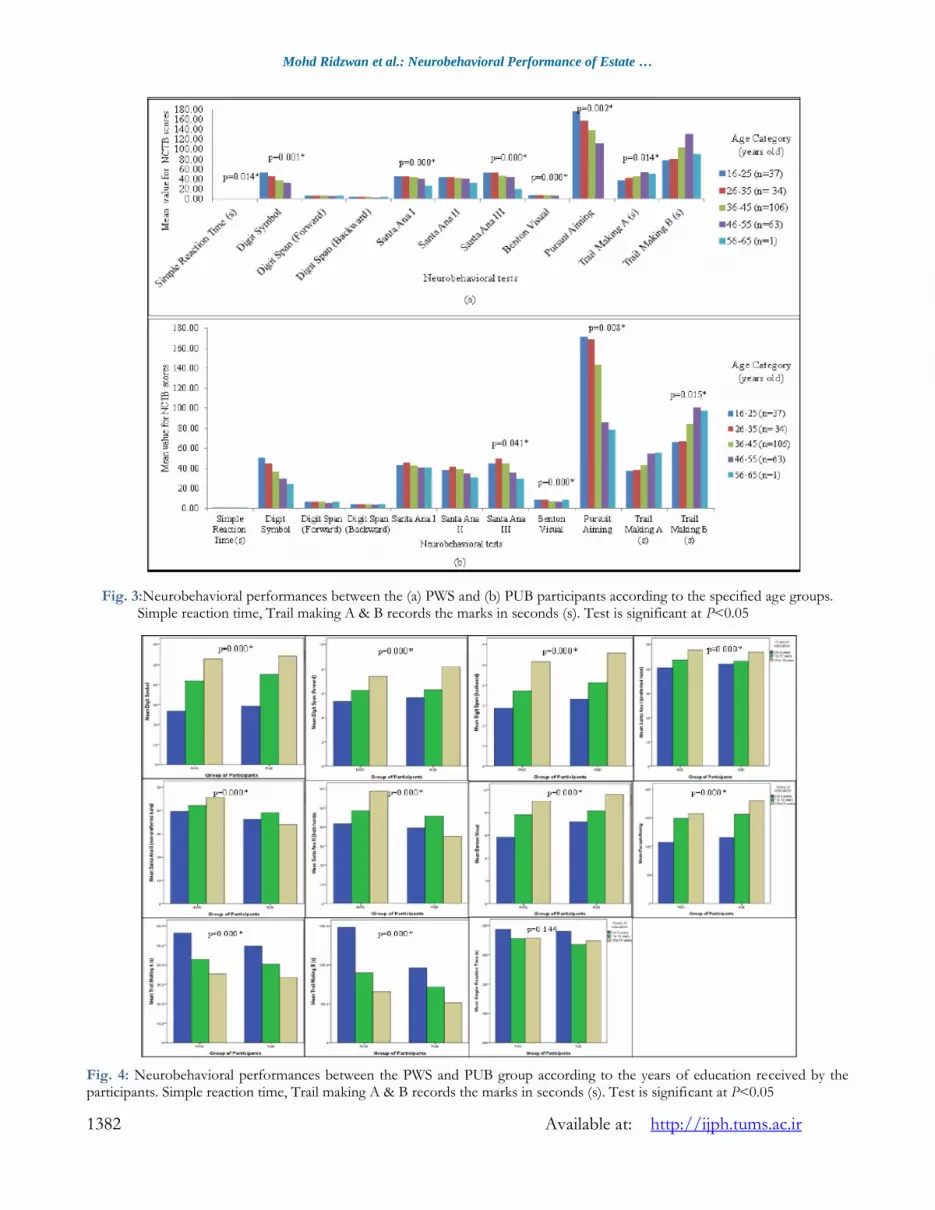
tion of the participants were assessed, PWS partic-ipants who had 13 to 18 years of education, scored excellently in all tests. Similar findings were observed in PUB participants except for Santa Ana II and III (Fig. 4). For tests that measured latency, better NCTB performance was observed in PWS and PUB participants who had 13-18 years of education except for Simple reaction Time for PUB participants. Table 3 shows the correlation between age and education level with neurobehavioral test perfor-mance for PWS and PUB participants. In PWS, Pursuit Aiming test showed significant moderate correlation with age category while Digit Symbol and Benton Visual Retention test showed moder-ate correlation with years of education. In PUB,
Digit symbol, Pursuit Aiming and Trail Making A and B showed moderate correlation with age cate-gory while Digit Symbol and Trail Making B showed moderate correlation with years of educa-tion. Multiple regression analyses revealed that age, level of education and gender do have signifi-cant contribution to the NCTB scores. The signif-icant contribution of age is towards all NCTB tests except for Digit Span Forward and Santa Ana II while the contribution of education level is towards all NCTB tests as well except for Simple reaction time and Santa Ana II. Gender plays role significantly in Simple reaction time, Digit symbol and Pursuit aiming. Table 4 summarized regres-sion model between those dependent and inde-pendent variables.
Fig. 1: Neurobehavioral performance of PWS participants and PUB participants

Mohd Ridzwan et al.: Neurobehavioral Performance of Estate …
1380 Available at: http://ijph.tums.ac.ir
Fig. 2: Neurobehavioral performance showed by the males and females of the PWS and PUB participants
Table 3: Correlation coefficient of NCTB tests with age category and years of education for PWS and PUB partici-
pants
NCTB Tests PWS PUB
Age category Years of Educa-tion
Age category Years of Education
Simple Reaction Time 0.159* -0.111 0.216** -0.172* Digit Symbol -0.433 0.481** -0.559** 0.525** Digit Span Forward -0.172** 0.268** -0.147* 0.199** Digit Span Backward -0.290** 0.349** -0.201** 0.262** Santa Ana (preferred hand) -0.185** 0.287** -0.176* 0.116 Santa Ana Dexterity (non-preferred hand)
-0.219** 0.262** -0.134 0.088
Santa Ana Dexterity (both hands) -0.294** 0.367** -0.239** 0.125 Benton Visual Retention -0.323** 0.511** -0.313** 0.255** Pursuit Aiming Test -0.462** 0.370** -0.550** 0.353** Trail-Making A 0.263** -0.330** 0.411** -0.304** Trail-Making B 0.232** -0.343** 0.423** -0.403**
** Correlation is significant at the 0.01 level * Correlation is significant at the 0.05 level

Iranian J Publ Health, Vol. 42, No.12, Dec 2013, pp. 1374-1386
Available at: http://ijph.tums.ac.ir 1381
Table 4: Summary of regression analysis for variables of age, education level and gender with each NCTB test
NCTB Test Variables Unstandardized Coef-
ficient Standardized Coefficient
t Sig. R R2 Adjusted R2
Std Error of the Estimate
B Std Error Beta
Simple Reaction Time
Age .002 .000 .181 3.675 .000 Education level .000 .009 -.001 -.013 .989 .279 .078 .069 .106
Gender .040 .010 .183 3.960 .000 Digit Symbol Age -.540 .061 -.398 -8.831 .000
Education level 8.675 1.137 .322 7.632 .000 .615 .378 .371 11.985 Gender 4.280 1.246 .142 3.437 .001
Digit Span For-ward
Age -.014 .010 -.078 -1.420 .156 Education level .727 .187 .201 3.879 .000 .258 .066 .056 1.980
Gender -.275 .204 -.068 -1.348 .178 Digit Span Backward
Age -.031 .008 -.209 -3.926 .000 Education level .710 .147 .241 4.817 .000 .355 .126 .116 1.558
Gender -.173 .161 -.052 -1.079 .281 Santa Ana I Age -.090 .033 -.152 -2.769 .006
Education level 1.837 .609 .156 3.019 .003 .267 .071 .061 6.435 Gender .866 .665 .065 1.302 .194
Santa Ana II Age -.050 .042 -.065 -1.200 .231 Education level 1.177 .785 .076 1.500 .134 .310 .096 .086 8.297
Gender .408 .857 .024 .476 .634 Santa Ana III Age -.234 .066 -.190 -3.547 .000
Education level 2.857 1.228 .117 2.326 .020 .346 .120 .109 12.989 Gender -1.025 1.343 -.037 -.763 .446
Benton Age -.045 .009 -.265 -5.254 .000 Education level 1.092 .161 .321 6.792 .000 .472 .223 .214 1.698
Gender -.302 .176 -.079 -1.716 .087 Pursuit Aiming Age -1.906 .212 -.419 -8.982 .000
Education level 15.686 3.963 .173 3.958 .000 .575 .330 .322 41.897
Gender 11.684 4.332 .115 2.697 .007 Trail-Making A Age .430 .082 .274 5.231 .000
Education level -5.929 1.536 -.190 -3.861 .000 .392 .154 .144 16.236 Gender 3.053 1.684 .087 1.813 .071
Trail-Making B Age 1.178 .294 .213 4.003 .000 Education level -28.641 5.502 -.260 -5.206 .000 .366 .134 .124 57.786
Gender -3.391 6.037 -.027 -.562 .575
Mohd Ridzwan et al.: Neurobehavioral Performance of Estate …
1382 Available at: http://ijph.tums.ac.ir
Fig. 3:Neurobehavioral performances between the (a) PWS and (b) PUB participants according to the specified age groups. Simple reaction time, Trail making A & B records the marks in seconds (s). Test is significant at P<0.05
Fig. 4: Neurobehavioral performances between the PWS and PUB group according to the years of education received by the participants. Simple reaction time, Trail making A & B records the marks in seconds (s). Test is significant at P<0.05

Iranian J Publ Health, Vol. 42, No.12, Dec 2013, pp. 1374-1386
Available at: http://ijph.tums.ac.ir 1383
Discussion This study provides information on neurobehav-ioral performance among populations consuming private and public water supply in several palm oil estates. The age of participants ranged from 16 to 65 years old. A significant difference of three years in the mean age was observed among the PWS and PUB participants (P<0.05). Only 33 (6.6%) Indian participants out of 500 participants from PWS and PUB took part in the study. The main reason for poor participation from the Indian community was largely due to the high illiteracy rate among them as they do not fulfill one of the inclusion criteria for the study which was literacy. As for the subjective symptom questionnaire, three out of 37 symptoms were the most promi-nent in this study: headache, diarrhea and diffi-culty walking in the dark. This finding was incom-parable with a study of population consuming contaminated municipal water supply by using the Profile of Mood State (POMS), which reported a profile of confusion and depression as their early signs of neurotoxicity (30). There are also re-searchers who recorded the high prevalence symp-toms of fatigue, insomnia, tremor in both hands, sleepiness during working and forgetful among workers exposed to lead in Selangor, Malaysia (21). In general, it was obviously shown that PWS par-ticipants had lower neurobehavioral performance compared to the other group of participants espe-cially in tests measuring the function of memory, attention and visual perception-conceptual. Inter-estingly, those exposed participants were better in Santa Ana which measured their hand-eye coordi-nation. These PWS participants were mostly workers in technical and mechanical job-scope which requires their dexterity skills in daily work. Several factors influence the performance of neu-robehavioral tests. Gender, age and education lev-el were found to have a significant impact on neu-robehavioral performance. Female participants in this study performed poorly as compared to male participants in tests that measured latency. This was evident from the Simple Reaction Time and Trail Making A tests by which the male PWS and
PUB participants outperformed the female PWS and PUB participants. This finding is in line with Anger et al. (45) and Rohlman et al. (25) who re-ported that female showed poorer performance than male in motor tests. However, for tests that determined association (Digit Symbol and Trail Making B), females performed better than males. Younger age category (16-25 years and 26-35 years) from both PWS and PUB performed better on NCTB tests when compared to other age groups. The age-related decline in performance of NCTB observed in this study is in good agree-ment with Chung et al. (23) who reported that NCTB performance declines with increasing age. Duration of education also affects the neurobe-havioral performance (22). PWS and PUB partici-pants in this study who had education between 13 to 18 years excelled in the NCTB tests when compared with those who had an education of less than 13 years. This finding is in line with those of Chung et al. (23) who reported worsened NCTB performance with less years of education. Age was found weakly to moderately correlated with neurobehavioral performance for both PWS and PUB participants in all tests. This means that participants showed poorer performance with in-creasing age. The finding of this study is also in agreement with the finding of Rohlman et al. (25) who reported poorer performance with increasing age for a test that measured coding and complex functioning. The poorer neurobehavioral performance be-tween PWS participants as compared with PUB participants could be associated with the poor wa-ter quality as reported by Siti Farizwana et al. (13). In this study, more than 60% of participants of the PWS and PUB had secondary level of educa-tion. A weak to moderate correlation was found between the level of education of PWS and PUB participants in this study with the NCTB tests. This implies that higher education determines higher neurobehavioral performance among par-ticipants (23, 25). Above-mentioned researchers also reported that neurobehavioral outcomes of agricultural and textile workers exposed to neuro-toxic chemicals were highly dependent on educa-tion level with participants of lower education

Mohd Ridzwan et al.: Neurobehavioral Performance of Estate …
1384 Available at: http://ijph.tums.ac.ir
found to perform poorly as compared to partici-pants with higher education level.
Conclusion The PWS participants showed poorer neurobe-havioral performance compared to the PUB parti-cipants. Their achievements were probably asso-ciated with the quality of water supplied to them. Further study such as biological monitoring and molecular epidemiology are recommended to de-termine the cause-effect relationship between poor water quality and neurobehavioral perfor-mance.
Ethical considerations
Ethical issues (Including plagiarism, Informed Consent, misconduct, data fabrication and/or fal-sification, double publication and/or submission, redundancy, etc.) have been completely observed by the authors. The study complies with the current laws of the country in which they are performed. The re-search and ethics approval had been given by the Secretariat of Medical Research and Industry, Universiti Kebangsaan Malaysia Medical Centre (NN-053-2009).
Acknowledgement
This study has been supported by the Ministry of Health research grant (JPP-IMR: 06-006) and Re-search University Grant by Universiti Kebangsaan Malaysia (UKM-GUP-PLW-08-12-313). Our ut-most appreciation goes to the estate managers and residents for participating in this study and also a heartfelt gratitude to Kota Tinggi District Health Office for the helpful staffs. The authors declare that there is no conflict of interest.
References
1. Gleick PH (1999). The human right to water. Wa-ter Policy, 1: 487-503.
2. Scanlon J, Cassar A, Nemes N (2004). Water as a human right? World Conservation Union.
3. Hardberger A (2005). Life, liberty, and the pursuit of water: evaluating water as a human right and the duties and obligations it creates. Northwest-ern University Journal of International Human Rights, 4 (2): 331-362.
4. World Health Organization (2006). Guidelines for drinking-water quality. Geneva:WHO.
5. WHO SEARO (2007). Environmental health in emergencies: technical notes on water and san-itation. WCO, Nepal.
6. Kota Tinggi District Health Office (2006) Basic data of estates in Kota Tinggi district. Minis-tryofHealth, Malaysia.
7. Reid D, Lamb A, Lilly A, McGaw B, Gauld J, Cooper D et al. (2001). Improvements to source protection for private water supplies in Scotland, UK. Water Policy, 3 (4): 273-281.
8. Swistock BR, Sharpe WE (2005). The influence ofwell construction on bacterial contamination of private water wells in Pennsylvania. J Envi-ron Health, 68 (2): 7-22.
9. Roper J, Roberts RW (1922) Deforestation: tropi-cal forests in decline. Canada: CIDA Forest-ryAdvisers Network. Accessed 14 February 2008.www.rcfa-cfan.org/English/issues.12. html
10. Hu H (2000). Exposure to metals. Primary Care, 27 (4): 983-996.
11. Bobeldijk I, Vissers JP, Kearney G, Major H, Van Leerdam JA (2001). Screening and identifica-tionof unknown contaminants in water with liquid chromatography and quadrupole-or-thogonal acceleration-time-of-flight tandem mass spectrometry. JChromatogr A, 929 (1-2): 63-74.
12. Strauss B, King W, Ley A, Hoey J (2001). A pro-spective study of rural drinking water quality and acute gastrointestinal illness. BMC Public Health, 1 (1): 8.
13. Siti Farizwana MR, Mazrura S, Zurahanim Fasha A, Ahmad Rohi G (2010). Determination of aluminium and physicochemical parameters in the palm oil estates water supply at Johor, Ma-laysia. Journal of Environmental and Public Health, 2010 (2) :1-7.
14. MOH (2004). National Standard for Drinking Water Quality (NSDWQ), Engineering Ser-vices Division of the Ministry of Health, Ma-laysia.
15. World Health Organization (1996) Guidelines for drinking-water quality. Volume 2. Health crite-

Iranian J Publ Health, Vol. 42, No.12, Dec 2013, pp. 1374-1386
Available at: http://ijph.tums.ac.ir 1385
ria and other supporting information. 2nd edi-tion. Geneva, Switzerland:WHO.
16. Binukumar BK, Gill KD (2011). Chronic expo-sure to pesticides-Neurological, neurobehav-ioral andmolecular targets of neurotoxicity. In: Pesticides in the modern world-Effects of pesticides expo-sure. Ed. Stoytcheva M. InTech.
17. Liu G, Elsner J (1995). Review of the multiple chemical exposure factors which may disturb human behavioral development. Sozial-Und Präventivmedizin, 40 (4): 209-217.
18. World Health Organization (1986). WHO recom-mended neurobehavioral core test battery (NCTB): Operational guide. Geneva: WHO.
19. Chen SS, Chen TJ, Lin CH, Tseng YT, Lai SL (2005). Neurobehavioral changes in Taiwanese lead-exposed workers. JOEM,47 (9): 902-908.
20. Counter SA, Buchanan LH, Ortega F (2005). Neurocognitive impairment in lead-exposed children of Andean lead-glazing workers. JO-EM, 47 (3): 306-312.
21. Mazrura S, Noor Hasim I (1998). Neurobehav-ioral performances among lead exposed work-ers in Malaysia: an early detection of lead tox-icity. Journal of Occupational Safety and Health, 2 (1): 1-7.
22. Lee CR, Jeong KS, Kim Y, Yoo CI, Lee JH, Choi YH et al. (2005). Neurobehavioral changes of shipyard painters exposed to mixed organic solvents. Industrial Health, 43 (2): 320-326.
23. Chung JH, Sakong J, Kang PS, Kim CY, Lee KS, Jeon MJ et al. (2003). Cross-cultural compari-son of neurobehavioral performance in Asian workers. Neurotoxicology, 24 (4-5): 533-540.
24. Seyedeh Monavar Yazdi, Akbar Sharifian, Mar-yam Dehghani-Beshne, Vahid Reza Momeni, Omid Aminian (2011). Effects of fluoride on psychomotor performance and memory of aluminum potroom workers. Fluoride, 44 (3): 158-162.
25. Rohlman DS, Lasarev M, Anger WK, Scherer J, Stupfel J, McCauley L et al. (2007). Neurobe-havioral performance of adult and adolescent agricultural workers. Neurotoxicology, 28 (2): 374-380.
26. Rohlman DS, Bailey SR, Anger WK, McCauley L (2001). Assessment of neurobehavioral func-tions with computerized tests in a population of hispanic adolescents working in agriculture. Environ Res, 85 (1): 14-24.
27. Farahat TM, Abdelrasoul GM, Amr MM, Shebl MM, Farahat FM, Anger WK et al. (2003). Neurobehavioural effects among workers oc-cupationally exposed to organophosphorous pesticides. JOEM, 60 (4): 279-286.
28. London L, Myers JE, Nell V, Taylor T, Thomp-son ML (1997). An investigation into neuro-logic and neurobehavioral effects of long-term agrichemical use among deciduous fruit farm workers in the Western Cape, South Africa. Environ Res, 73: 132-145.
29. Xiang Q, Liang Y, Chen B (2010). Retraction: se-rum fluoride level and children's intelligence quotient in two villages in China. Environmental HealthPerspectives, doi:10.1289/ehp.1003171.
30. Reif J (2003). Neurobehavioral effects of expo-sure to trichloroethylene through a municipal water supply. Environ Res, 93 (3): 248-258.
31. Altmann P, Cunningham J, Dhanesha U, Ballard M, Thompson J, Marsh F et al. (1999). Dis-turbance of cerebral function in people ex-posed to drinking water contaminated with al-uminium sulphate: retrospective study of the Camelford water incident. BMJ, 319: 807- 811.
32. Anger WK (2003). Neurobehavioural tests and systems to assess neurotoxic exposures in the workplace and community. Occup Environ Med, 60: 531–538.
33. Al-Batanony MA, Abdel-Rasul GM, Abu-Salem MA, et al. (2013). Occupational exposure to mercury among workers in a fluorescent lamp factory, Quisna industrial zone, Egypt. Int J Oc-cup Environ Med, 4: 149-156.
34. Ismail AA, Bodner TE, Rohlman DS (2012). Neurobehavioral performance among agricul-tural workers and pesticide applicators: A me-ta-analytic study. Occup EnvironMed, 69: 457-464.
35. National Research Council, Committee on Con-taminated Drinking Water at Camp Lejeune (2009). Contaminated water supplies at Camp Lejeune: Assessing potential health effects. Board on Environmental Studies and Toxicol-ogy, Division on Earth and Life Studies. The National Academies Press: Washington, D.C.
36. Kilburn KH, Warshaw RH (1993). Eeffects on neurobehavioral performance of chronic ex-posure to chemically contaminated well water. Toxicol Ind Health, 9 (3): 391-404.
37. Bhanegaonkar AJ. Exposure to volatile organic compounds and effect on neurobehavioral

Mohd Ridzwan et al.: Neurobehavioral Performance of Estate …
1386 Available at: http://ijph.tums.ac.ir
function [MPH Thesis]. East Tennessee State University, United State of America; 2005.
38. Krieg EF (2013). The relationships between pesti-cide metabolites and neurobehavioral test per-formance in the Third National Health and Nutrition Examination Survey. Arch Environ Occup Health, 68 (1): 39-46.
39. El-lethey HS, Kamel MM, Shaheed IB (2010). Neurobehavioral toxicity produced by sodium fluoride in drinking water of laboratory rats. J Am Sci, 6 (5): 54-63.
40. McInturf Sm, Bekkedal MY, Wilfong E, Arfsten D, Gunasekar PG, Chapman GD (2008). Neurobehavioral effects of sodium tungstate exposure on rats and their progeny. Neurotoxi-col Teratol, 30 (6): 455-61.
41. York RG, Lewis E, Brown WR, Girard MF, Mattie DR, Funk KA, Strawson JS (2005). Re-fining the effects observed in a developmental
neurobehavioral study of ammo-niumperchlorate administered orally in drink-ing water to rats. I. Thyroid and reproductive effects. Int J Toxicol, 24 (6): 403-418.
42. Economic Planning Unit (2010). Executive sum-mary of Tenth Malaysia Plan 2011-2015. Pu-trajaya, Malaysia: Prime Minister’s Department.
43. Lwanga SK, Lemeshow S (1991). Sample size de-termination in health studies: a practical manual. Geneva: World Health Organi-zation.
44. Daniel WW (2005). Biostatistics: a foundation for anal-ysis in the health sciences. John Wiley & Sons In-corporated, New York.
45. Anger WK, Sizemore OJ, Grossmann SJ, Glasser JA, Letz R, Bowler R et al. (1997). Human neurobehavioral research methods: impact of subject variables. Environ Res, 73 (1-2): 18-41.