Embed Size (px)
Citation preview

Neurophysiological monitoring in vascularsurgery
Lavern D. Gugino MD, PhD
Assistant Professor of AnesthesiaHarvard Medical School
Sta� Anesthesiologist and Director of Intraoperative Neurophysiological MonitoringBrigham and Women's Hospital, 75 Francis Street, Boston, MA 02115, USA
Linda S. Aglio MD
Assistant Professor of AnesthesiaHarvard Medical School
Sta� Anesthesiologist, Director of Neuroanesthesia and Associate Director of IntraoperativeNeurophysiological MonitoringBrigham and Women's Hospital, 75 Francis Street, Boston, MA 02115, USA
Harvey L. Edmonds Jr PhD
Professor and Director of Research, and Neuromonitoring ConsultantDepartment of Anesthesiology, University of Louisville Health Sciences Center, 545 S. Jackson Street,Suite 100, Louisville, Kentucky 40202-3617, USA
This chapter reviews current concepts involved with monitoring the well-being of the centralnervous system during vascular procedures. Electrophysiological techniques discussed includethe electroencephalogram, somatosensory and motor-evoked potentials. Recently developedtechniques which monitor changes in cerebral artery blood ¯ow velocity and relative cerebraloxygen saturation round out this review. Each technique is discussed with regard to theanatomical and physiological principles involved with their use. Clinical examples are used toillustrate the intraoperative use of each technique. Finally, for the monitoring techniquesextensively studied, a discussion concerning the prediction e�cacy for new postoperativeneurological de®cits is presented.
Key words: neurophysiological monitoring; EEG; evoked potentials; transcranial Doppler;transcranial spectroscopy.
This chapter reviews current concepts concerning monitoring the functional integrityof the central nervous system (CNS) during vascular surgical procedures known toplace the CNS at risk of ischaemic damage. These procedures include carotid anddescending aortic surgery. The monitoring techniques discussed can be divided intotwo categories. The ®rst utilizes electrophysiological properties of the CNS forassessing electrical conduction along de®ned pathways. This category also assesses thetranssynaptic e�cacy of relayed information within the CNS. Both electrophysiologicalattributes are assessed with externally driven evoked potentials in the form of
1521±6896/00/010017+46 $35.00/00 *c 2000 Harcourt Publishers Ltd.
BaillieÁ re's Clinical AnaesthesiologyVol. 14, No. 1, pp. 17±62, 2000doi:10.1053/bean.2000.0061, available online at http://www.idealibrary.com on
2

somatosensory evoked potentials (SEPs) and motor evoked potentials. Cortical CNSsynaptic e�cacy is additionally assessed by monitoring the spontaneous scalp acquiredelectrical activity represented by the electroencephalogram (EEG).
A more recently developed type of monitor utilized during carotid surgery assessescerebral blood ¯ow and/or the metabolic demand±supply relationship. TranscranialDoppler (TCD) ultrasound gives the clinician an indirect measure of blood ¯ow withinthe major conducting arteries of the circle of Willis, whereas the transcranial infraredoximeter monitors the cerebral capillary and venous haemoglobin oxygen saturation.With regard to carotid surgery, a thirdmajor approach formonitoring thewell-being ofthe CNS involves neurological testing during carotid endarteretctomies (CEAs) inpatients whose procedures are carried out under regional anaesthesia. Although shownto be an accurate monitor, many surgeons and anaesthesiologists prefer the use ofgeneral anaesthesia. For this reason, this monitoring modality will not be discussed.
Several studies have shown that the CNS metabolic requirements can be dividedinto substrate requirements for ongoing functional activities and metabolic demand formaintaining the normal neuronal ionic membrane gradients and structural integrity ofthe CNS structures. The metabolic requirements for maintaining functional activityare slightly less than half of the total CNS energy requirements.1,2 The remainder isused for maintenance of the normal ionic gradients across neuronal membranes.Astrup and others have demonstrated that when cerebral blood ¯ow decreases fromthe average normal ¯ow of 50 ml/(100 g) per minute to below a threshold of20 ml/(100 g) per minute, the EEG, perhaps the most sensitive monitor for mildischaemia, begins to demonstrate changes characteristic of minor ischaemia.3 Theabnormalities in the EEG become increasingly profound as cerebral blood ¯owdecreases to 12 ml/(100 g) per minute. Between 10 and 12 ml/(100 g) per minute, theEEG disappears (i.e. becomes isoelectric) (see Figure 1). Somatosensory potentials,similarly, show abnormalities below 18 ml/(100 g) per minute and also disappear
Thresholdsof
ischaemia
CBF
Normalrange
Oligaemia
Ischaemia
Electrical function affected
Electrical failure complete
Release of potassium(and cell death)
100
80
60
40
20
0
%
50
40
30
20
10
0
ml100 gmin %
Figure 1. Diagramatic representation of the relationship between the absolute and relative decreases inbcerebral blood ¯ow (CBF) and changes in the CNS electrical activity and cell death. Note that thresholdsare de®ned forelectrical failure andmembrane failure (release of cellularK). Long-lasting depolarization occursasaresultof theelevatedextracellularK.Reproduced fromAstrupetal (1997,Stroke,8:51±57)withpermission.
18 L. D. Gugino et al

between 10 and 12 ml/(100 g) per minute. In this regard, cortical generators of theSEP tend to be more sensitive to ischaemia than subcortical generators.4 The loss ofthe EEG and evoked potentials signals the inadequacy of cerebral blood ¯ow formaintaining action potential conduction and synaptic function with the CNS (i.e. lossof functional activity). At this level of perfusion, however, the CNS normal ionicgradients and cellular integrity are still maintained as there is an absence of CNSinfarction. Areas of the CNS experiencing these reduced ¯ows and thus loss offunctional activity have been referred to as an ischaemic penumbra, in that functionalloss is reversible if su�cient ¯ow is restored in a timely manner.1
When perfusion decreases below a threshold blood ¯ow from 10 to 6±8 ml/(100 g)per minute, insu�cient adenosine triphosphate (ATP) is available (i.e. less than 15% ofnormal values) for maintaining the membrane pumps necessary for establishing normaltransmembrane resting potentials.5 Loss of membrane ionic pump function leads toincreased intracellular Na and extracellular K ion concentrations. The results are along-lasting depolarization and cellular swelling within regions of ischaemic tissue. Thedepolarizations can be recorded with direct current ampli®ers usually within or at thesurface of the cortex. As the duration and intensity of the ischaemia continue, theduration and frequency of these slow potentials increase.6 Cellular depolarization itselftriggers in¯uxes of calcium ions through voltage-sensitive membrane channels whichcan serve as a potent trigger for initiating the cascade of biochemical and geneticevents leading to neuronal death.6 The in¯ux of Ca ions also causes the release ofexcitatory amino acids from pre-synaptic terminals, which further augments the in¯uxof neuronal calcium, exacerbating ischaemic necrosis of neuronal tissue. Although theconsequences of ischaemia-induced excitatory amino acid release have received a largeshare of research interest, release of other transmitters is now known to occur also.7
Their role in ischaemic damage is still unknown. Regions of the CNS experiencing thisphenomenon have a high likelihood of infarction.6
If focal ischaemia is transient, then the re-establishment of perfusion to severelyischaemic areas can result in further damage secondary to a re¯ow phenomenon.6 Theinitial ischaemic insult may prime these regions biochemically for infarction, in whichthe re-established blood ¯ow provides oxygen for free radical induced destruction ofneurones. Re¯ow, however, will also lead to a partial return of evoked potentialsand EEG from neurones still capable of electrophysiological function within thepenumbra.8 Flow, however, eventually decreases as swelling of capillaries and theprimed re¯ow ischaemic process spreads throughout the infarction zone and intopenumbral tissue.6 The EEG and evoked potentials at these delayed stages demonstrate®xed abnormalities.9 A reliable non-invasive method for detecting the stage of cellulardepolarization in clinical work is not yet available but would theoretically representthe most e�cacious electrophysiological predictor of CNS infarction.
The conventional EEG and evoked potentials, on the other hand, are also severelydepressed or lost during deep anaesthesia and profound hypothermia. In the absenceof these confounding variables, the abnormalities in the EEG and evoked potentialswhich occur within several seconds to minutes of acute ischaemia can serve as an earlywarning signal, in that these abnormalities occur at perfusion levels greater than thereduced cerebral blood ¯ows causing infarction.9 This attribute gives the clinician a`window of opportunity' for attempting to increase perfusion and reducing the chancefor CNS infarction.9 This fact also implies that both the EEG and evoked potentials,while sensitive to ischaemia, should have a high speci®city (i.e. in the absence of deepanaesthesia and profound hypothermia) and negative prediction value but a lowersensitivity and positive prediction value for new post-operative infarcts. The latter
Neurophysiological monitoring in vascular surgery 19

predictive parameters may improve when the loss of electrical activity persists for15±30 min during procedures carried out under general anaesthesia.10,11
TCD ultrasound and the infrared oximeter will, however, continue to give theclinician information regarding the presence and adequacy of cerebral blood ¯ow afterthe disappearance of the EEG and evoked potentials, whether their loss is due toischaemia, profound hypothermia or deep anaesthesia. The use of these newermonitors is, therefore, discussed in the later sections of this chapter.
THE ELECTROENCEPHALOGRAM
Origins of the electroencephalogram
The conventional EEG is best de®ned as the time domain recording of spontaneouselectrical activity within the cerebral cortex. This electrical activity, represented bytime-varying voltage ¯uctuations, is usually acquired from recording electrodes ®xedto the scalp. The signals are generally believed to be generated by extracellularmicrocurrents induced by a�erent synaptic activity impinging on cortical pyramidalneurones.12 These neurones have an orthogonal orientation with the cortical surface.The transmembrane synaptic potentials are activated by a�erent ®bres originatingfrom within the cortex and brainstem.13 Because of the long duration of post-synapticpotentials, compared with action potentials, temporal and spatial summation of thesevoltage transients due to repetitive a�erent input to pyramidal cells results in thecharacteristic ¯uctuations of the EEG.12
This model, however, is limited, in that it requires a�erent synaptic input toproduce the driving neuronal transmembrane voltage changes. The EEG is also, inpart, generated by pacemaker cells within the cortex.12 Extensive microelectroderecordings from voltage-clamped cells have resulted in descriptions of cyclical voltage-dependent changes in neuronal membrane ionic conductances which can also accountfor changing extracellular microcurrents leading to cortical surface voltage ¯uctua-tions. Similar autonomous conductance changes have been described for thalamo-cortical (TC) and the thalamic nucleus reticularis neurones which ultimately controlthe a�erent input to cortical neurones.13
As the majority of an EEG is acquired from the scalp, it is important to realize thatthe EEG recorded at the cortical surface is distorted by the presence of thecerebrospinal ¯uid (CSF), skull and scalp. The distortion of the scalp-derived EEG isbest characterized by an attenuation and `slurring' of the EEG acquired at the corticalsurface.14 Simultaneous recordings from both sites have shown that signi®cant corticalsurface areas must be synchronously activated in order to be detected at the scalp.14 Amathematical tool, known as the Laplacian transformation, is occasionally used forreversing the `slurring' e�ect of the CSF, cranium and scalp tissues. This trans-formation tends to make the scalp EEG more accurately re¯ect the cortical surfacerecord.15
Since the advent of readily accessible computers, analysis of the scalp EEG has led toquantitation of these complex signals.16 An EEG derived from either a single ormultiple channels is ®rst subjected to a variable degree of artifact removal. EEGs of2±4 second durations (referred to as epochs of the EEG) are then analysed by one ofseveral mathematical transformations. The most frequently used transformation is thefast Fourier transform (FFT).16 The conventional EEG, a time-varying voltage record-ing, is referred to as a time domain record. The FT transforms this time domain recordto the frequency domain, in which the complex conventional signal of discrete
20 L. D. Gugino et al

duration (epochs) is divided into component sine and cosine signals, each having acalculated amplitude, frequency and phase.16 The process results in a power spectrumin which the energy of each component sine or cosine wave is plotted as power versusfrequency for each analysed epoch. This process can be analogized with the e�ect of aglass prism on white light, in which the colour spectrum of a rainbow is produced. Asthe power spectrum represents the energy distribution of a single epoch of an EEG,stacking each spectrum according to the time that the epoch of the EEG was acquired(see Figure 6) may be used for depicting changes with time.
The power spectrum has traditionally been separated into four frequency bands,de®ned as d (1.5±3.5 Hz), y (3.6±7.5 Hz), a (7.6±12.5 Hz) and b (12.6±30 Hz).13
Extensive research on the origins of the rhythmic EEG activity in the variousfrequency bands suggests that the voltage ¯uctuations represented by the powerspectrum are regulated by anatomically complex homeostatic systems involving thebrainstem and cortical processes of large neuronal populations.13,17 All the majorneurotransmitters have been implicated in this regulation.18 For example, pacemakerTC neurones oscillate synchronously in the 7.6±12.5 Hz frequency range.13 TCe�erents globally, distributed across the cortex, are one source of the a frequency inthe power spectrum. A second generator of a activity appears to reside in the cortex.The thalamic nucleus reticularis hyperpolarizes TC neurones using g-amino butyricacid. This leads to a slowing of the TC pacemaker cells and results in a slowing of the aactivity. The hippocampal±septal-cortical pathway appears to generate y band activity,whereas the slower d activity is believed to originate from oscillator neurones in thethalamus and deep layers of the cortex.13 d band activity is normally inhibited bythalamic input from the mid-brain ascending reticular activating system in the awakestate.19 b band activity is probably a re¯ection of corticocortico and thalamocorticalactivity related to CNS information processing.13
Anaesthetic-induced changes in the electroencephalogram
CEAs are typically carried out under regional or general anaesthesia. It is, therefore,important to appreciate the changes in the awake (i.e. normal, relaxed, eyes closed)EEG record caused by anaesthetic agents used for sedation or anaesthesia. The normalEEG in a relaxed individual whose eyes are closed is characterized by rhythmicalactivity having a frequency of 8±10 Hz and recorded from posterior scalp leads. Thisactivity is known as the a rhythm (Figure 2). Occasionally rhythmic activity within thisfrequency range is acquired from the scalp overlying the cortex. When present, thisso-called m rhythm can be di�erentiated from the a rhythm by location and di�erencesin reactivity. The a rhythm attenuates with eye opening, whereas the m rhythmattenuates with contralateral voluntary movements.20 The frontal scalp regions in theawake patient typically show low-amplitude, fast activity in the b frequency range.
With increasing doses of sedation using benzodiazepine, propofol or otherhypnotics, frontal b activity migrates toward posterior aspects of the scalp withattenuation of the a rhythm amplitude.21 Occasionally, splindling is noted at lightstages of sedation, which is maximum at the vertex. At this stage, auditory stimuli willinduce K complexes (i.e. evoked potentials) much like the early stages of natural sleep(unpublished observations). When increasing doses of hypnotic agents are adminis-tered, posterior a activity attenuates further; b activity encompasses the entire scalpand then regresses toward the anterior scalp regions. Deeper levels of sedation alsoshow d and y activity initially appearing in the central to posterior recording leads andspreading toward the anterior aspect of the scalp. At loss of consciousness, the
Neurophysiological monitoring in vascular surgery 21

amplitude of all EEG activity is maximal in the anterior scalp regions, a phenomenonknown as EEG anteriorization of the anaesthetic state.22
When combinations of anaesthetic agents at maintenance are each given in less thanminimal alveolar concentration doses for inhalational agents or equivalent concen-tration of intravenous agents, the frontal EEG activity can be characterized by fastactivity consisting of a 5±20 Hz signal combined with intermittent slow EEG activity inthe d frequency range.23 The fast activity has been referred to as WAR activity,whereas the d activity is referred to as intermittent frontal predominant d waveactivity. The intermittent d activity appears as single or brief trains of dwaves. Figure 3shows referential recordings of conventional EEGs from a patient just prior toinduction and at maintenance. Note the posterior predominant a activity in the awakestage and the anteriorization of EEG activity acquired after induction and duringmaintenance of anaesthesia. Induction was accomplished with pentothal, fentanyl andmidazolam, whereas maintenance level of anaesthesia was achieved with nitrous oxide(60% by volume), iso¯urane (0.8% by volume) and a fentanyl infusion (1.2 mg/kg perhour). As the administration of anaesthetic agents is increased, the EEG will begin to
Fp1 Fp2
A2T4C4CzC3T3A1
F7F3 Fz F4
F8
T5 P3 Pz P4T6
O1 O2
(A) (B) (C)Signal acquisition Awake Anaesthetized
EEG record
Linked ears reference (A1A2)
Callibration
50 µV
1.0 sec
Fp1-A1A2Fp2-A1A2F3-A1A2F4-A1A2C3-A1A2C4-A1A2
P3-A1A2P4-A1A201-A1A202-A1A2Fz-A1A2Cz A1A2Pz-A1A2
T3-A1A2
T5-A1A2T6-A1A2
T4-A1A2
Fp1-F7F7-T3T3-T5
Fp2-F8F8-T4T4-T6
Leads
F7-A1A2F8-A1A2
T5-01
T6-02
Figure 2. (A) Conventional EEG is acquired from scalp electrodes placed according to the international10±20 system. The scalp ®gurine shows the scalp location and electrode nomenclature of the international10±20 system. This nomenclature is used for all EEG and evoked recordings used in this chapter. (B) Anexample of a lightly sedated patient's conventional EEG just prior to anaesthetic induction. Note that the®rst 19 traces from the top represent EEGs acquired using the same reference electrodes (A1A2 linked asears reference; voltage ¯uctuations from both ears). These traces are de®ned as referential recordings. Thenext six traces represent recordings taken between electrodes closely spaced across the scalp. These tracesare de®ned as bipolar traces. Negative voltage excursions are up. Time and voltage calibration marks aredepicted to the left of the traces. Sensitivity (ampli®cation factor) settings are shown above traces. (C) TheEEG record acquired from the patient at a maintenance level of anaesthesia. Note that large-amplitude fastactivity acquired from anterior recording leads at anaesthetic maintenance (`widespread anterior maximumrhythmic' (WAR) activity) and that the posterior a rhythm present in the awake record are not seen.
22 L. D. Gugino et al

show characteristic changes re¯ecting the individual agents used.22 Further augmenta-tion of anaesthetic administration will lead sequentially to bilateral attenuation of theWAR pattern and augmentation of d wave activity. This process ultimately will resultin an isoelectric EEG. While a few anaesthetic agents produce an atypical anaesthetizedEEG record{, the agents typically used to produce anaesthesia for CEAs willdemonstrate the changes described above. Figure 4 shows the spatial distribution oftopographical scalp EEG changes which occur during the same induction andmaintenance regimen used during collection of the conventional EEG depicted inFigure 3. The head maps in this ®gure show the dynamic nature of the spatial locationof power (power � voltage squared/resistance) for each of the frequency bandsdetermined by an FFT during induction and at anaesthetic maintenance for thispatient. The anteriorization of power is well demonstrated in Figure 4 at theanaesthetic maintenance phase of the anaesthetic.
Figure 3. An alternative representation of the EEG changes in the conventional EEG during induction ofanaesthesia derived from the patient's record shown in Figures 2(B) and 2(C). For this representation, thereferential EEG traces are transformed from the time domain to a frequency domain record using the FFT.This transformation derives the electrical power within each frequency band for an average of 15 seconds ofcontiguous artifact-free EEG. The results of this calculation are depicted as non-linear colour-coded headmaps. The power in each frequency band as a function of scalp location is determined by reference to thecolour scale to the right of the head maps. The power value between scalp recording sites was determinedby interpolation. Each head map row represents the spatial power distribution for each frequency bandlabelled above the top of each column. With respect to each head map, the front of the scalp is depicted atthe top as if looking down on the scalp. Each column represents the spatial power distribution during selectphases of the initial anaesthetic as labelled to the left of each row. The posterior a band activity seen duringthe awake state is shown in the top row. Note that, as induction progresses, b activity spreads from anteriorto central scalp regions and posterior a power attenuates with d and y power initially appearing in posteriorscalp regions. At maintenance, power in all frequency bands is maximal over frontal scalp regions. The colourscale at the right is a representation of power in which the bottom of the scale represents no power and theyellow colour at the top represents maximum power (in this case, 53 pW or mV2).
{ A few notable exceptions exist, i.e. high-dose narcotic and ketamine are characterized by predominant dand y activity respectively: neither agent produces an isoelectric EEG. Another exception is etomidate,which produces little b activity in the induction or maintenance EEG.
Neurophysiological monitoring in vascular surgery 23

Patients with pre-existing neurological de®cits may show focal changes in theanaesthetized EEG record which can include (1) an accentuation of focal d activity orattenuation of the WAR pattern on the side of the de®cit, (2) the appearance of a newfocal asymmetry involving d or fast activity again related to the cortical side having thepre-operative de®cit or (3) replacement of an abnormal awake EEG focus with asymmetrical WAR pattern.24 The mechanism of these anaesthetic-induced changes isincompletely understood at present but argues for a means of establishing a stablepost-induction EEG baseline during the monitoring phase of the surgical procedure.
Ischaemia-induced changes in the electroencephalogram
In the presence of a relatively constant level of anaesthetic depth, the conventional EEGhas been shown to change as a function of decreasing cerebral blood ¯ow.1,3,25,26 Thesechanges are usually categorized as moderate or severe depending on the type anddegree of changes seen in the conventional EEG.3,22,25 Mild ischaemia leads to anattenuation of less than 50% in the `WAR' pattern amplitude and/or an increase in dfrequency activity. Cerebral blood ¯ow during mild ischaemia usually ranges between18 and 20 ml/(100 mg) perminute.3,25 A possible origin for ischaemia-induced d activityis the loss of TC pacemaker, input to the cortex through the depressed subcorticalwhite matter. Changes in the conventional EEG felt to re¯ect major reductions incerebral blood ¯ow vary between `WAR' pattern amplitude attenuation greater than50% and an isoelectric EEG record or a doubling of the amplitude of the d wave22
(Figure 5). The reduction of cerebral blood ¯ow necessary for the appearance of major
Fp1-A1A2Fp2-A1A2F3-A1A2F4-A1A2C3-A1A2C4-A1A2
P3-A1A2P4-A1A201-A1A202-A1A2Fz-A1A2Cz A1A2Pz-A1A2
F8-A1A2T3-A1A2
T5-A1A2T6-A1A2
T4-A1A2
Fp1-F7F7-T3T3-T5
Fp2-F8F8-T4T4-T6
50 µV1.0 sec
(A) Anaesthetized (B) Carotid clamp on (C) Shunt placedSens: 10 µV/mm HF: 70 Hz LF: 1.60 HZComm:
F7-A1A2
T5-01
T6-02
Figure 4. Examples of conventional EEG changes depicting a right carotid occlusion induced ischaemicchange in both the referential and the bipolar EEG of the patient whose anaesthetized record is shown inFigure 2: (A) EEG just prior to occlusion; (B) attenuation of voltage in the EEG acquired from the right sideof the scalp (i.e. even-numbered recording channels), 1 min after occlusion; (C) return of right-sided EEGamplitude after carotid shunt inserted.
24 L. D. Gugino et al

EEG changes has been shown to be, in part, a function of the anaesthetic used.Michenfelder and colleagues have demonstrated that, during iso¯urane anaesthetic, thecerebral blood ¯ow reduction in which the EEG becomes isoelectric is lower thanduring halothane or en¯urane anaesthesia.27 These data suggested that iso¯urane wasprotective during cerebral ischaemia, although recent studies have shown that, in amiddle cerebral artery ischaemiamodel, iso¯uranemerely delays the ischaemia-induceddepletion of cortical ATP stores by approximately 15 seconds.8 Compared with otherinhalational agents, the volume of ischaemic necrosis was not signi®cantly decreased.
Quantitative EEG changes induced by ischaemia re¯ect the changes in the con-ventional EEG record.8,29,30 In this case, changes in two derived parameters have beenused for de®ning cerebral ischaemia (see Figures 6 and 7). These parameters re¯ect adecrease in power of higher frequencies, a typical concomitant increase in the dfrequency band power or a loss of power across the entire spectrum.30 One of theseparameters is the 95% spectral edge frequency, which depicts the frequency in thepower spectrum below which 95% of the spectral power is located.29 A 15% decreasein the spectral edge for more than 10±15 min has been correlated with new post-operative de®cits in some reported series.29 However, decreases in the spectral edgefrequency only re¯ect slowing of the EEG. Power attenuation across the entire powerspectrum may not reliably be detected by the spectral edge.30 Therefore, a measure ofabsolute power, in addition to use of the spectral edge, may serve as a better criterionfor de®ning ischaemia-induced EEG changes.23,30
Figure 5. FFT EEG acquired from the procedure shown in Figure 4, but displayed as head maps as describedin Figure 3. Each row of head maps represents the changes in spatial distribution of power observed duringselect phases of the pericarotid cross-clamp period. The loss of and return of spectral power duringapplication of the right carotid cross-clamp and shunt are easily appreciated using this display format. Notethat similar changes in spectral power are seen with clamping of the shunt for removal and ®nal removal ofthe carotid cross clamp at the completion of the endarterectomy.
Neurophysiological monitoring in vascular surgery 25

In general, for institutions which practise selective shunting, use of the EEG criteriadescribed results in an average of 15% of patients undergoing CEAs requiring a shunt.Anatomic studies have shown that 15±20% of the population have an incomplete circleof Willis.31 An angiographic study has, similarly, shown that, in a group of 20 patients,the patients requiring a shunt by EEG criteria failed to demonstrate the presence of apatent anterior and posterior communicating artery.32 This study suggested thatreversed ophthalmic artery ¯ow, as well as leptomeningeal collateral blood ¯ow, may
Figure 6. An alternative display of the change in spectral power during CEAs is the density-modulatedspectral display (DSA). DSA is derived from an FFT of a conventional bipolar EEG acquired during theprocedure shown in Figure 4. The top two DSA columns on the left and right of the display are derived fromtwo left and right frontal scalp recording sites. The corresponding lower displays on the left and right sidesare from the central to posterior aspects of the scalp. Each display is constructed as a rastered row of dotsrepresenting the power of each frequency contained within each consecutive EEG epoch. The power of eachfrequency is colour coded according to the colour scale at the right of the ®gure. The horizontal axis of eachdisplay represents frequency as labelled at the bottom of each column. The vertical axis represents time witholder epochs toward the top of each column and the most recently derived power spectral distribution atthe bottom of each channel display. The DSAs at select times during the cross-clamp period are labelledbetween the second and third DSA channel displays. Note that the initial changes in the EEG shown inFigure 5 are also seen in the DSAs. The vertically orientated line in all columns represents the spectral edge(95%). The DSA is more a compact format than the head map displays shown in Figure 5.
26 L. D. Gugino et al

not be su�cient for alleviating cortical ischaemia in the situation of acute ischaemiaproduced by cross-clamping the carotid artery.
Although the average shunt rate is around 15% across di�erent reported series,Whittemore and colleagues have demonstrated that shunt rate is also, in part, depen-dent on the patient's history (see Table 1). Thus, patients with only pre-operative TIAsrequired shunting less frequently than those that had ®xed neurological de®cits. Inaddition, the degree of stenosis of the carotid artery contralateral to the operated sidealso determined the need for a shunt during the endarterectomy.33
Table 2 compares the reliability of the EEG for predicting immediate post-operativede®cits as derived from a number of reports. Note that some centres never shunt,others use selective shunting and ®nally some shunt all patients undergoing CEAs. Inaddition, the use of quantitative and/or conventional EEG also varies across thisselection of reports. As predicted in the introduction, the speci®city and negativeprediction value of the EEG for new (immediate) post-operative de®cits is better thanthe sensitivity and positive prediction values. This is presumably due to the change
Cortical response
Cervical response
Latency
Amplitude
Control
Control
Changefromcontrol(S.D.)
Changefromcontrol(S.D.)
Event:
2.0µV
20 msec
Dissection Clampon
Shuntin
Shuntclamped
Clampoff
Closing
+9
0
-9
+9
0
-9
Ch 1 L. MED. CX
Ch 2 L. MED. C2
0 1.8 Time (hrs)
Figure 7. Intraoperative changes in right cortical (top) and cervical (bottom) median nerve SEPs fromanaesthetized control baselines during a right CEA. The vertical lines on the baseline central peaks show the99% con®dence limits for latency. The centre rectangles show amplitude and latency trajectories depictingchange from these baselines in standard deviation units for the cortical peak N19 (top) and the cervical N15peak (bottom). Associated with each trajectory are four sequences of updated SEPs (top to bottom in time)acquired at intraoperative carotid dissection, carotid clamping, shunt placement and clamp removal. Noteloss of cortical N19 (�) with clamp, reappearance with shunting and overall stability of the cervical response(�). The patient was neurologically intact post-operatively. Negative voltage excursions up.
Neurophysiological monitoring in vascular surgery 27

and/or loss of EEG in advance of reaching a cerebral blood ¯ow threshold forinfarction. Nevertheless, because an ischaemic brain will precede infarction, a positivelikelihood ratio suggests that a persistent abnormal EEG is nine times more likely to beassociated with a new de®cit post-operatively (see Table 2) than with a patient notdemonstrating an abnormal intraoperative EEG. Finally, because increasing depths ofanaesthesia can mimic cortical ischaemia, the occasional report of bilateral EEGchanges resulting from cross-clamp-induced ischaemia suggests the importance ofmaintaining a constant level of anaesthesia during EEG monitoring.34
SOMATOSENSORY EVOKED POTENTIALS
SEPs di�er from spontaneous electrophysiological signals (i.e. EEG, electromyogram) inthat they are externally driven phenomena. Typically, they are induced by applyingelectrical stimulating pulses (1) to the skin overlying peripheral nerves, (2) at the centreof a dermatome or (3) within the epidural, subthecal space or vertebral discssurrounding the spinal cord.41 They are acquired by recording the resulting electricalresponses during a®nite time interval, which starts from the stimulus pulse and extendsfor an appropriate period of time in order to capture the signal of interest. Averaging isused in order to retain the stimulus-driven signal while reducing unwarrantedextraneous electrical signals not related to the stimulus-driven response.42
Use of averaged evoked potentials requires knowledge of the anatomical pathwaywhich serves as the CNS structures responsible for generating these responses.42 SEPscan be acquired along the dorsal column±medial lemniscal pathway. Within the spinalcord, the pathway includes the posteriorally located dorsal columns, which represent acollection of peripheral nerve collaterals subserving proprioception, vibration and ®netouch sensations. This area of the spinal cord is perfused from the paired posterior spinalarterieswhich is amore secure perfusion source than the tenuous anterior spinal arterysupplying the anterior two-thirds of the spinal cord.43 A minimum of three synapticrelays are negotiated by ascending SEP signals en route from the peripheral nerves tothe somatosensory cortex. These include the ipsilateral dorsal column nuclei, thecontralateral speci®c ventral lateral thalamic nuclei and areas 3a and 3b of thecontralateral primary somatosensory cortex. Although this pathway is a high-®delitypath for transmitting sensory information to the cortex, the acquired signal character-ized by latency (time from stimuli pulse to the aspect of the signal of interest and given inmilliseconds) and amplitude (usually the voltage di�erence between a peak and troughwithin the signal) are a�ected by anaesthetic agents.41,42While ketamine, etomidate and
Table 1. Electroencephalogram changes during carotid endarterectomies as a function of pre-operativehistory and angiogram.
History Angiogram ®ndingsRequiring shunt using
EEG criteria
Asymptomatic transient ischaemic Unilateral stenosis 10%attacks (TIAs) Bilateral stenosis 22%
Contralateral occlusion 42%
Limited ®xed de®cits Unilateral stenosis 33%Bilateral stenosis 67%
Adapted from Whittemore et al.33
28 L. D. Gugino et al

Table
2.Reliability
ofelectroencephalogram
forpredictingnew
postoperativede®citsa :carotidendarterectomies.
Source
Nb
EEG
type
De®cits
(%)
Shuntprotocolc
Sensitivityd
Speci®city
ePositive
predictionvaluef
Negative
predictionvalueg
Chiappaet
al34
367
Conventional
6Selective(EEG)
67
92
17
99
Sundtetal
25
1145
Conventional
10
Selective(EEG)
100
85
80
100
RedekopandFerguson35
293
Conventional
4Noshunting
44
94
22
98
Fergussen36
211
Conventional
4Noshunting
100
89
16
100
Zam
pellaetal
37
431
Conventional
9Noshunting
45
88
15
97
Colliceetal
11
141
Conventional
3Selective(EEG)
100
88
15
100
Kresowik
etal
38
458
Conventional
3Selective
(EEG
orsurgeondiscretion)
20
100
100
97
Ram
piletal
29
111
QEEG
h6
Allshunted
89
99
89
99
Tempelho�etal
23
103
QEEG
14
Selective(EEG)
83
85
25
99
BakerandRoxburgh39
20
QEEG
2Selective(surgeo
ndiscretion)
50
94
50
94
Ahnetal
40
46
QEEG
2Selective(EEG)
100
100
100
100
Mean
73
92
48
90
Likelihoodratioi
9.1
a Predictive
param
eters,based
onnew
de®cits
recognized
immediately,aftersurgery.
bNumber
ofprocedures.
c Shuntprotocol,ifselective,
maincriterionforshuntinggivenin
parentheses.
dSensitivity
calculatedas
truepositives/(truepositives�
falsenegatives).
e Speci®city
calculatedas
truenegatives/(truenegatives�
falsepositives).
f Positive
predictionvaluecalculatedas
truepositives/(truepositives�
falsepositives).
g Negativepredictionvaluecalculatedas
truenegatives/(truenegatives�
falsenegatives).
hQEEG,FFTconventionalEEG.
i Likelihoodratiorefers
totheincrease
ordecrease(values
51)
intheprobability
that
anew
post-operativede®citwill
bepresentgivenabnorm
almonitoringresults.
Neurophysiological monitoring in vascular surgery 29

methohexital cause amplitude augmentation of the cortical SEP response, other agentscause either minimal change (i.e. narcotics) in amplitude or a dose-dependent decrease(i.e. nitrous oxide, inhalation agents) in amplitude. All anaesthetics increase cortical SEP(cSEP) latencies.41,42 Anaesthetic e�ects are less profound on subcortical SEPresponses.41,42 Because of these sources of intraoperative signal variability, it is prudentto maintain constant anaesthetic concentrations during monitoring sessions. SEPs havebeen used for monitoring CNS functional integrity for two types of vascular surgicalprocedures: CEAs and descending aortic artery procedures.
The use of somatosensory evoked potentials during carotidendarterectomies
Median nerve SEP responses have been used for monitoring the functional integrity ofthe CNS during carotid surgery. The middle cerebral artery (MCA) is the largest-diameter arterial conduit to emerge from the carotid artery.44 At the cortex, the MCAdivides into an anterior andposterior branch bringing blood, in part, to the anterior andposterior banks of the central sulcus and surrounding cortices.44 Thus, occlusion of thecarotid artery in the absence of appropriate collaterals within the circle of Willis oracross the surface of the cortex (i.e. leptomeningeal collaterals) can be expected to havea profound depressive in¯uence on median nerve elicited SEPs. Investigators havedemonstrated in primate models that occlusion of the carotid artery leads to ipsilateralattenuation and/or loss of cSEPs and brainstem SEPs.4 The brainstem generators of theSEP appear to be more resistant to carotid occlusion induced ischaemia compared withthe cSEP generators.4 cSEPs begin to be attenuated below regional cortical blood ¯owof15±20 ml/(100 g) per minute and are abolished at ¯ows below 12 ml/(100 g) perminute. Brainstem generators are not signi®cantly a�ected at 15±20 ml/(100 g) perminute but disappear below regional ¯ows of 10 ml/g per minute.4 Thus, whenappropriate collateral ¯ow is absent during carotid occlusion, the changes in the cSEPsshould be a sensitive indication of cortical ischaemia. Typically, investigators havemonitored themedian nerve induced scalp SEP during CEAs. Either the brachial plexusresponses (i.e. Erb's point) or the rostral spinal cord responses are used as controls forstimulus adequacy. In addition, the di�erence in latency between the Erb's point orcervical response and the cSEP responses is taken as a measure of central conductiontime, which is less sensitive than changes in the cSEP amplitude.45,46 Figure 7 shows anexample of ischaemia-induced changes in SEP responses during aCEA carried out undergeneral anaesthesia. Note the absence of change during carotid occlusion in the highcervical cSEP responses due to the vertebral arteries supplying this area of the CNS.During carotid occlusion, the SEP response is diminished, leaving in its wake the moreischaemia-resistant brainstem response.With shunting, these changes are reversed. Thissequence is repeated between the time interval that the shunt is removed and thecarotid is unclamped. Figure 8 shows a sequence of SEP responses acquired during aCEA carried out under regional anaesthesia. This case highlights clinical abnormalitieswhich accompany the cSEP changes induced by ischaemia. As is the case for EEGmonitoring, when cSEPs are used for determining the need for shunting, an increase inabnormal SEP responses is in part a function of degree of stenosis of the carotid arterycontralateral to the endarterectomized carotid artery.47
The advantages gained by monitoring SEPs during CEAs include the following: (1) asingle waveform in which an amplitude and latency are monitored as opposed tothe complexity involved in multichannel EEG; (2) quantitation of SEP change is easierthan determining change of conventional EEGs or quantitative EEGs; (3) SEPs are less
30 L. D. Gugino et al

Procedure insurgery
SER trace Clinicalfeatures
Just beforecarotid clamp
1 min ofclamping
2 min ofclamping
2 min aftershunt placement
4 min aftershunt placement
Just beforeremoval of shunt
2 min of clampingfor shunt removalafter repair
4 min afterclamp removal
Alert
Dazed, non-responsive,twitching rightface
Same asabove
Recoveredalertness
Alert, countsnumbers, movesfingers and toes
Dazed, non-responsive,aphasic
Alert, noneurologicaldeficits
Alert
50 100 150 200 250
Milliseconds
5 µV
Figure 8. Scalp-acquired SEPs monitored during a CEA carried out with a regional anaesthetic. Selectperiods during the pericarotid occlusion are labelled to the left of each trace, whereas the behaviouralchanges noted at each period are described to the right of each trace. Note that loss of the N20 peak (aftercarotid clamping) leaves a large residual subcortical waveform in its place with additional loss and/orattenuation of later peaks. Corresponding to these changes are decrements in neurological function whichreversed with shunt placement and eventual removal of the carotid cross-clamp. Reproduced from Markland(1994, in Loftus CM & Traynelis CV (eds) Intraoperative Monitoring Techniques in Neurosurgery. New York:McGraw-Hill) with permission.
Neurophysiological monitoring in vascular surgery 31

a�ected than EEGs by anaesthetic agents and hypothermia (down to 228C);(4) brainstem ischaemia (in the SEP pathway) can be monitored, whereas the EEG isa predominant cortical monitor.24,47 The disadvantage is that only the cortical areaperfused by the MCA is monitored, whereas a multichannel EEG can monitor all thecortical perfusion ®elds.48
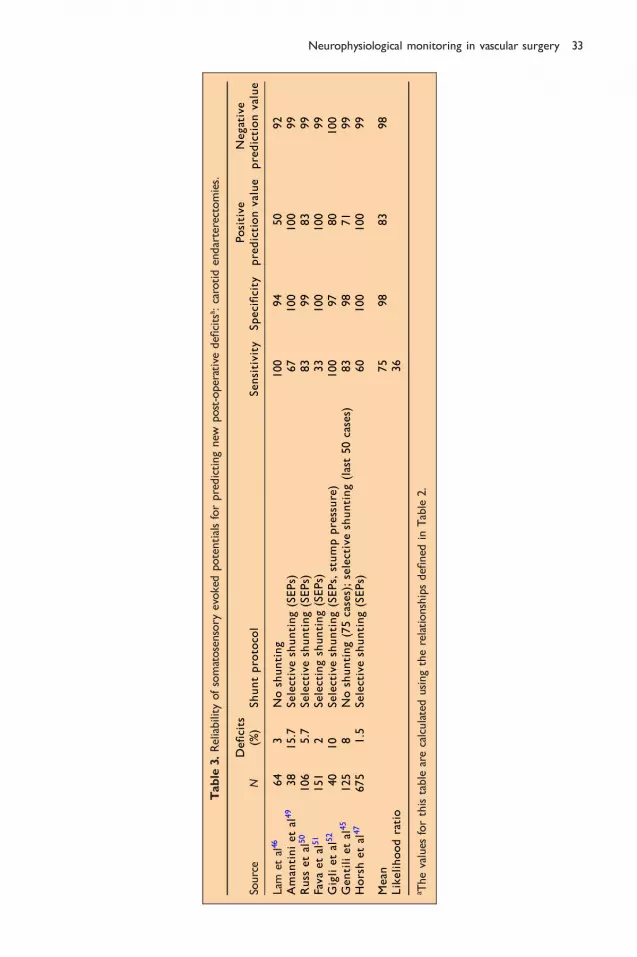
Table 3 is a compilation of several series showing the predictive e�cacy of SEPs forpredicting new immediate post-operative neurological de®cits. The reports of theseries included su�cient information for calculating the predictive parameters shown.The criterion for prediction was typically an absent or abnormal SEP at the conclusionof the procedure. An early report from Horsch et al is included as it represents thelargest of all series included in Table 3. A second report from these authors included260 additional cases for a total of 994 monitored cases.53 Permanent post-operativede®cits were correlated with irreversible loss of SEPs. This comparison resulted in apositive prediction value of 100% with one false-negative prediction. As seen inTable 3, monitoring SEPs may be superior to EEGs for predicting new post-operativede®cits, particularly when the likelihood ratios of the two modalities are considered.Thus, a persistent abnormal SEP is over 30 times as likely to be associated with a newde®cit compared with patients having normal SEPs at the end of the procedure.Opinions vary, however, concerning whether SEPs are a superior monitor to the EEGfor detecting cortical ischaemia.24,46,48
The use of somatosensory and mixed-modality evoked potentials duringaortic surgery
There are two major reasons for thoracolumbar spinal cord ischaemic injury duringrepair of descending aortic pathology. The ®rst includes global ischaemia to the cordbelow the level of the proximal clamp.54 In this situation, collateral circulation, mainlythrough the anterior chest and abdominal wall, is insu�cient to supply perfusion tothe cord below the clamp.54 This problem can be overcome by using a distal bypassprocedure which has included Gott shunts, axillofemoral graft bypasses and partial leftatrial or ventricular bypass to a femoral artery using a variety of cardiopulmonarybypass equipment. A distal aortic perfusion pressure of 60 Torr is usually consideredadequate.55 When the distal aortic clamp is placed, however, spinal cord infarction isstill possible in spite of adequate distal perfusion. In this case, at least one criticallumbar or intercostal artery has been isolated from the distal perfusion source. Theartery of Adamkowitz, considered to be the most important radicular artery supply ofthe thoracolumbar anterior spinal artery, can take its origin from the T11±L2 spinalcord segmental blood supply.43 The artery of Adamkowitz is considered to be a criticalradicular supply vessel because of the tenuous calibre of the anterior spinal arterysupplying the thoracolumbar spinal cord.56
The distribution of blood ¯ow to the cervical and lumbar grey matter enlargementsis up to four times that to the surrounding less metabolically active white matter.56 Itis expected, then, that the most sensitive area of spinal cord at risk of ischaemicinfarction is the central grey area of the lower thoracic and lumbar spinal cord.Nevertheless, the typical presentation of new neurological de®cits post descendingaortic repair is the anterior spinal artery syndrome.57 This syndrome includes loss ofpinprick and temperature sensation below T10, as well as upper and lower moto-neurone paresis or paralysis of the lower extremities.
Both cSEPs elicited by electrical stimulation of the posterior tibial nerves and spinalcord SEPs (sSEPs) evoked by peripheral nerve or spinal cord electrical stimulation have
32 L. D. Gugino et al
Table
3.Reliability
ofsomatosensory
evokedpotentialsforpredictingnew
post-operativede®citsa :carotidendarterectomies.
Source
NDe®
cits
(%)
Shuntprotocol
Sensitivity
Speci®city
Positive
predictionvalue
Negative
predictionvalue
Lam
etal46
64
3Noshunting
100
94
50
92
Amantinietal
49
38
15.7
Selectiveshunting(SEPs)
67
100
100
99
Russ
etal
50
106
5.7
Selectiveshunting(SEPs)
83
99
83
99
Favaetal
51
151
2Selectingshunting(SEPs)
33
100
100
99
Giglietal
52
40
10
Selectiveshunting(SEPs,stumppressure)
100
97
80
100
Gen
tilietal
45
125
8Noshunting(75cases);selectiveshunting(last50cases)
83
98
71
99
Horshetal
47
675
1.5
Selectiveshunting(SEPs)
60
100
100
99
Mean
75
98
83
98
Likelihoodratio
36
a Thevalues
forthistable
arecalculatedusingtherelationshipsde®ned
inTable
2.
Neurophysiological monitoring in vascular surgery 33

been used by some centres for monitoring the functional integrity of the spinal cordduring these repairs.58,59 Before discussing the predictive e�cacy of SEPs for spinal corddamage, a few caveatswill be discussed regarding the use of cSEPs and sSEPs.MonitoringcSEPs with lower-limb peripheral nerve stimulation has some disadvantages in theabsence of distal aortic bypass. One disadvantage includes the possibility of lower-limbischaemia, which at least temporarily will lead to loss of SEP propagation into the spinalcord (see Figure 9). Loss of cSEPs, due to aortic cross-clamping, usually requires20±30 min of lower-limb ischaemic time.60 A second disadvantage that exists involvesthe fact that cSEPs are transmitted through the dorsal column, a spinal cord structureperfused by the paired posterior spinal arteries. This blood supply represents a more
200%7 msec
−7 msec−200%
200%7 msec
−7 msec−200%
200%7 msec
−7 msec−200%
2.5 µV
2.0 µV
10.0 µV
Baseline
STIM: L Post Tib Nerve; Record: SEPcxLAT 41.9 msecAMP 1.0 µV
STIM: R Post Tib Nerve; Record: SEPcx
STIM: R Median Nerve; Record: SEPcx
Elapsed time0.0hrs
1 hourlater
Closingskin
Aortic cross-clamps removed
Aortic cross-clamps placed
Monitoring begunafter induction
Time (msec)
SEPcx
R med N
R Post Tib N
L Post Tib N
R
S
S
S
LAT 19.6 msecAMP 5.7 µV
LAT 42.3 msecAMP 1.4 µV
Latency (msec change from baseline)Amplitude (% change from baseline)
2.2 hrs5 85
Figure 9. Changes in cSEPs during repair of a descending aortic aneurysm. Boxes to the left of the ®gureshow the post-induction baseline SEPs from stimulation of the right median nerve (control for anaesthetic andtemperature changes) and the left and right posterior tibial nerves. The parallel vertical lines superimposed onthe peak or trough of each baseline SEP represent the 99% con®dence limits for latency. To the right of eachbaseline are trajectories depicting changes in latency ( ) or amplitude ( ) for each response duringthe surgical repair. Changes in amplitude are given as per cent decrease from baseline and for latency asmseconds increase from baseline. During application of the aortic cross-clamp, the latency of the lower-limbinduced SEPs was increased with a modest decrease in amplitude. The upper-limb induced SEPs showed littlechange. The SEP abnormalities reverted to normal with cross-clamp removal. During skin closure, the lower-limb SEPs again demonstrated abnormal changes which coincided with loss of bilateral femoral pulses. Withreturn of the femoral pulses, the SEPs returned to baseline. Exploration of the lower-limb vasculaturedemonstrated that embolization had occurred. Thus, lower-limb ischaemia can a�ect cSEPs. Negative voltageexcursion up for baseline response. Amplitude and time calibration located along vertical and horizontal edgesof baseline responses. Full-scale trajectory calibration to the right of each trajectory. Reproduced fromGuginoet al (1992, Journal of Cardiothoracic and Vascular Anesthesia 6(6): 715±719) with permission.
34 L. D. Gugino et al

secure perfusion system than the anterior spinal artery. The posterior spinal arteriesperfuse the posterior aspect of the spinal cord, not the anterior two-thirds containingthe descending motor tracts and the majority of the spinal cord central grey area.44
Finally, cSEPs aremore prone to change from anaesthetic agents and possibly decreasedcortical perfusion pressure owing to increased cortical blood volume and oedemasecondary to application of the proximal aortic cross-clamp.41,42 Most studies haveshown that, with functioning lower-limb peripheral nerves, 5±15 min of spinal cordischaemia is required for signi®cant attenuation of the cSEPs. This demonstrates apossible increased sensitivity of sensory spinal cord tracts to ischaemia compared withlower-limb peripheral nerves.61
In order to mitigate the confounding in¯uence of peripheral nerve ischaemia andcSEP variability, some centres have monitored spinal cord integrity using sSEPs.42 Themajority of work has involved placing epidural or subthecal or spinal column discstimulating electrodes, either proximal or distal to the spinal cord segments at risk ofdamage. Recording of the resulting spinal cord potentials is carried out at the oppositeend of the spinal cord in the epidural or subthecal space (Figure 10).This monitoringprotocol has the advantage of being less sensitive to anaesthetic agents and eliminatesthe in¯uence of peripheral nerve ischaemia. Controversy, however, surrounds thestructures of the spinal cord involved in the transmission of these potentials. Someinvestigators believe that posterior spinal white and grey matter mediates thesepotentials and as such gives analogous information to the cSEPs.62 Other investigatorshave postulated that both spinal cord motor and sensory systems are involved in theproduction of spinal cord stimulated responses and refer to these potentials as mixed-modality potentials.63,64
Finally, some centres use proximal spinal cord electrical stimulation with signalacquisition at the peripheral nerve (i.e. neurogenic motor evoked potentials)64 orlower-limb muscles.56 The fact that compound muscle action potentials are elicitedwith spinal cord stimulation has been used as further support that descending motorpaths are involved in these responses.56 It is important to point out that spinal cordelicited peripheral muscle responses cannot be obtained with inhalational agents butare obtained with high-dose fentanyl, propofol, etomidate and ketamine anaesthe-sia.41,42 The neurogenic response is obtained during inhalational anaesthesia but lostwith dorsal root section of the lower spinal cord, suggesting a predominant spinal cordsensory pathway for their genesis.65 In line with this reasoning is that spinal cordstimulated responses are lost during spinal cord ischaemia in 5±15 min, whereas puredescending motor path induced peripheral responses are lost within 1±3 min (see nextsection). Deletis and others have proposed that spinal cord induced muscle responsesare produced by antidromic activation of ascending dorsal column ®bres withbranching of descending activity through the dorsal root ®bres to peripheral nervesand along dorsal root collaterals to the anterior horn cell clusters.66 The latter pathwaycan lead to re¯ex synaptic excitation of peripheral muscle responses. The loss ofperipheral muscle responses with inhalational agents is due to depression of theanterior horn cell excitability by these agents.41 Because of the unresolved nature ofmultimodality spinal cord responses, the author has arbitrarily grouped thesetechniques with sensory system monitors.
There are at least two mechanisms which have been advanced for explaining whyactivity in posterior spinal cord structures can be used for detecting anterior spinalcord ischaemia.61 The ®rst involves the fact that both posterior and anterior aspects ofthe cord are susceptible to ischaemia even though the anterior two-thirds is muchmore susceptible than the dorsal columns. The second is that the more secure dorsal
Neurophysiological monitoring in vascular surgery 35

spinal cord perfusion may shunt blood to the profoundly ischaemic anterior spinalcord during aortic cross-clamping. This may eventually lead to inadequate dorsalcolumn perfusion. In either case, SEPs will become attenuated. In many studies, SEPsreturn to normal after aortic cross-clamps are removed despite new neurological
AXC I AXC II Pump off
CPBCPB
Ao clamp
Ao clamp
ControlAXC I
7 m
12 m
15 mAXC II
1 m
10 m
Pump off50 m
Figure 10. Monitoring descending aortic surgery with spinal cord `mixed-modality potentials' elicited byelectrical stimulation of the spinal cord between T12 and L1. Rostral epidural recordings of the responsesequences shown were obtained between C7 and T1. Three phases of the surgical procedure are illustratedabove. AXC I: after proximal and distal cross-clamps were applied, a decrease in the spinal cord responseamplitude was noted; AXC II: reimplantation of intercostal arteries completed, although proximal and distaliliac cross-clamps were still applied. The spinal cord response improves. Pump o�: distal perfusion stopped.All aortic clamps o�. Responses are back to control. The patient had a normal post-operative neurologicalexam; m: minutes after each phase described above. Reproduced from Matsui et al (1994, Journal of Thoracicand Cardiovascular Surgery 107: 1519±1527) with permission.
36 L. D. Gugino et al

motor de®cits appearing immediately post-operatively. This may speak to the relativeresistance of the posterior spinal cord to permanent damage compared with theanterior spinal cord areas.
In the presence of distal aortic perfusion, several centres utilize sequential clampingof lower intercostal and lumbar arteries while checking for changes in somatosensoryor mixed-modality potentials.56,57 Changes in these responses are taken as an indica-tion for reimplanting the occluded vessel which produces these changes (Figure 12). Asalready discussed, 5±15 min is required in order to detect focal spinal cord ischaemiaafter each vessel is clamped.60
Table 4 represents a survey targeted at the predictive e�cacy of cSEP and sSEP (ormixed-modality evoked potential) monitoring for predicting new immediate post-operative motor de®cits. As shown in Table 4, three reported series had insu�cientinformation for allowing prediction of new de®cits based on the ®nal intraoperativeSEP status. In these cases, the authors used the duration of transient SEP changes(greater than 30±40 min) as a predictor for new post-operative motor de®cits.70,73,75
The reported false negatives and false positives have kindled interest in developing apure descending motor pathway monitor as described in the next section.
The use of motor evoked potentials during aortic surgery
The spinal cord pathway predominantly responsible for peripheral nerve inducedsomatosensory and spinal cord elicited mixed-modality evoked potentials is the dorsalcolumn system. Because this path is anatomically and functionally separate from thedescending spinal cord motor paths, several investigators have developed a puredescending motor system monitor in the hope of improving the e�cacy for predictingspinal cord risk of new motor de®cits.76
In order to elicit isolated descending spinal cord motor path activity, stimuli areapplied to the scalp overlying themotor cortex.76 As long as the stimuli are restricted tothe cortex or underlying subcortical white matter, the motor path which is excited isthe CST.43 Currently two types of stimuli are used for exciting the motor cortex non-
Transcranialmagneticstimulation
Transcranial electrical stimulation
Motor cortex
Skin
Muscle
Millivoltsmsec
Amplitude
Spinal cordAnteriorHorn Cell
Motor cortex
Spinal cordAnteriorHorn Cell
Skin
Muscle
Millivoltsmsec
Amplitude
S
RR
Latency
Latency
+
−
Figure 11. Two approaches for producing transcranial motor cortex stimulation for activation of thecorticospinal tract (CST). Transcranial electrical stimulation (TCES) (right side of ®gure) directly produces astimulating voltage between two stimulating scalp electrodes. Transcranial magnetic stimulation (TCMS) (leftside of ®gure) indirectly produces cortical stimulation by the ability of a pulsed magnetic ®eld to elicit astimulating electric ®eld within the cortex. Both approaches elicit descending CST electrical activity whichleads to production of compound muscle action potentials in the periphery. Direct recording of the CST(from within the epidural space) is another possibility for monitoring spinal cord descending motor paths.
Neurophysiological monitoring in vascular surgery 37

0.0
Pos
terio
r
Brig
ham
and
Wom
en�s
Hos
pita
lA
naes
thes
iolo
gy D
epar
tmen
tN
euro
mon
itorin
g U
nit
Fro
mS
timul
ator
Ant
erio
r
Pat
ien
t: S
(M
ale)
Op
erat
ion
: A
ortic
Coa
rcta
tion
Rep
air
An
aest
hes
ia:
Hig
h D
ose
Fen
tany
l/Oxy
gen/
Eto
mid
ate
Mu
scle
Rel
axan
t: V
ecur
oniu
mS
tim
ulu
s: M
otor
- C
adw
ell M
es-1
0
Sen
sory
-Pos
terio
r Ti
bial
Ner
veC
oil:
Cap
Coi
lR
eco
rdin
g:
Mot
or-A
nter
ior
Tibi
alis
Sen
sory
-Cor
tex
Po
wer
Lev
el:
100%
Co
il P
osi
tio
n:
Cen
tre
Ant
erio
r to
CZ
585
585
585
585
3.5
µV
Aw
ake
LAT
30.
8 m
sec
AM
P 1
.0 µ
V
ST
IM: R
Pos
t Tib
Ner
ve: R
ecor
d; S
EP
cx
Ane
sthe
tized
LAT
20.
5 m
sec
AM
P 1
.0 µ
V
LAT
36.
0 m
sec
AM
P 4
30.9
µV
ST
IM: T
rans
cran
ial M
agne
tic: R
ecor
d R
CM
AP
Ant
Tib
Mus
LAT
EN
CY
(ch
ange
from
Bas
elin
e in
mse
c)A
MP
LIT
UD
E (
% c
hang
e fr
om B
asel
ine)
1000
.0 m
V
585
Tim
e (s
ec)
Ela
psed
tim
e2.
43.
34.
45.
3 hr
s
SE
Pcx
com
pare
dto
aw
ake
base
line
Aor
tic s
ide
clam
psre
mov
ed
Aor
ticsi
decl
amps
plac
ed
TC
M L
AT
MT
CM
R A
TM
TC
M L
AT
MT
CM
R A
TM
1000
µV
700
µV10
00 µ
V70
0 µV
Cro
ss-c
lam
p on
Sid
e cl
amp
on
End
of c
ase
AB C
Aor
ticcr
oss
clam
pof
f
Aor
ticcr
oss
clam
pon
Mot
orm
onito
ring
begu
n
SE
Pcx
com
pare
dto
ane
sth.
base
line
100%
7 −7 −100
%
Figure
12.captiononfacingpage.
38 L. D. Gugino et al

invasively.41 The ®rst is TCES. TCESuses single or trains of electrical pulses. The anode isplaced at the vertex (overlying the motor strip) with the cathode placed anteriorly,laterally or in a distributed array on the scalp surrounding the anode (see Figure 11).Because TCES is painful, it is restricted to use with anaesthetized patients. The secondstimulusmodality is TCMS.76 TCMS is simple in concept.Magnetic stimulators consist ofa power source for producing large current pulses and an insulated coil placed over thescalp through which the current pulses pass.76 A current pulse passed through a coil ofwire will induce a pulsed magnetic ®eld. Because the scalp and skull are transparent tomagnetic ®elds, the magnetic ®eld pulses attenuate as a function of distance only.Orthogonal to the magnetic ®eld pulse is an electric ®eld which will induce a currentloop beneath the coil within tissues capable of generating currents. Although there aredi�erences in the geometryof the cortical induced currentswhen using TCES or TCMS,both lead to direct, as well as indirect, synaptic excitation of CST cells. Activity withinthese nerves descends without synaptic interruption through the brainstem and spinalcord white matter.43 When the CST volleys reach the spinal cord segmental grey areassupplying the lower-limbmusculature, theCST terminates on spinal cord anterior horncells either monosynaptically or through a polysynaptic path involving spinal cordinterneurones.76
Clinically, the induced activity within this descending motor path can be recordedfrom several sites. The ®rst location is within the epidural or subthecal space overlyingthe spinal cord.66 Recordings at these sites monitor descending CST volleys. These siteshave been used for monitoring procedures on the spinal cord with good predictivevalue.66 On the other hand, epidural recordings for aortic procedures carries a highfalse-negative rate for predicting new motor de®cits.60,76 This is presumably due to therelative resistance to permanent damage of ischaemic white matter compared with thespinal cord central grey regions. In order to reduce the incidence of false negatives,recordings can be made from the cauda equina or lower-limb muscles.76 Both of thesesites will re¯ect the functional integrity of the ischaemia-sensitive, anterior horn cellsand surrounding interneurones. The muscle response, in the form of CMAPs, is theeasiest and most frequently used recording site.41,76 Because motor axons innervateseveral muscle ®bres, averaging is not necessary, as the CMAPs have large amplitudes.To date, the authors are unaware of any reported false negatives with respect to newpost-operative motor de®cits when transcranially induced CMAPs are monitoredduring operations placing the spinal cord motor paths at risk of damage.66,76
Transcranially induced CMAPs are extremely fastidious responses with respect toanaesthetic techniques. They can be acquired with ketamine, etomidate, high-dosenarcotic, propofol and methohexital-based anaesthetics.41,76 Inhalational agents andnitrous oxide at more than 50% by volume and most other barbiturates cause severe
Figure 12. Changes in left-sided cSEPs and TCMS-induced right tibialis anterior compound muscle actionpotentials (CMAPs) during repair of coarctation of the descending aorta. The baseline responses andtrajectories follow the same format as Figure 9. Changes in the right cSEPs and left tibialis CMAPs weresimilar and are, therefore, not shown. With the initial placement of the proximal aortic cross-clamp, theCMAPs suddenly disappeared but returned with its removal. Distal aortic bypass perfusion was not used.Side-biting clamps were then placed on the proximal and distal aorta in order to place a bypass conduitaround the coarctation. The motor responses decreased in amplitude but were not lost. With removal ofthe side-biting clamps, the motor responses returned to normal. Note the lack of change in the cSEPs. TheTCMS response sequences shown to the right correspond to events labelled along the trajectory. The patientrecovered from anaesthesia without new de®cits. Reproduced from Gugino et al (1992, Journal ofCardiothoracic and Vascular Anesthesia 6(6): 715±719) with permission.
Neurophysiological monitoring in vascular surgery 39

Table
4.Reliability
ofevokedresponsesforpredictingnew
post-operativede®citsa :descendingaorticaneurysm
procedures.
Source
Nb
EPTupec
De®cits
(%)
Criteriond
Sensitivitye
Speci®city
ePositive
predictionvaluee
Negative
predictionvaluee
Maedaet
al67
19
cSEPs
11
Norecovery
ofSEPs
100
100
100
100
Cunningham
etal
58
33
cSEPs
2SEPloss
430min
100
93
71
100
Galla
etal
68
25
cSEPs
8Norecovery
ofSEPs
50
96
50
96
Crawford
etal
69
99
cSEPs
8SEPloss
430min
50
66
11
94
Schepensetal
70
43
cSEPs
9Norecovery
ofSEPs
25
100
100
93
Mean
f65
91
66
97
Likelihoodratiof
7.2
Shigaetal
71
21
Mixedmodalityevo
ked
responses
19
Norecovery
ofresponse
100
82
57
100
Yam
amoto
etal
72
20
Mixedmodalityevo
ked
responses
10
Norecovery
ofresponse
100
100
100
100
Matsuietal
73
68
Mixedmodalityevo
ked
responses
6Norecovery
ofresponse
100
98
80
100
Grabitzetal
74
167
Mixedmodalityevo
ked
responses
11
Norecovery
ofresponse
84
69
26
97
StuÈhmeieretal
75
100
Mixedmodalityevo
ked
responses
14
Loss
440min
100
68
35
100
Mean
f97
83
60
99.4
Likelihoodratiof
5.7
Overallmean
g81
87
63
98
Overalllikelihood
ratiog
6.2
a Mixed
modalityevokedresponsesde®ned
asresponsesobtained
usingspinalcord
stim
ulationandrecordingin
theepiduralspace.cSEPsde®ned
asresponsesobtained
withlower-lim
bstim
ulationandscalprecordings.
bRefersto
thenumber
ofproceduresreported.
c EPtyperefers
towhether
corticalormixed
modalityevokedresponseswereusedformonitoring.
dCriterionusedforde®ningan
abnorm
alresponse
atendofcase
exceptwherenoted.
e Thede®nitionsforsensitivity,speci®city,positive
andnegativepredictive
values
andlikelihoodratioarede®ned
inTable
2.f Themeanandlikelihoodratiocalculatedforcorticalormixed
modalityresponse
reports.
g Thegrandmeanandlikelihoodratiocalculatedacross
allreports.
40 L. D. Gugino et al

attenuation of the induced peripheral muscle response.41,76 The non-permissiveanaesthetic agents interfere with transcranially induced muscle responses at both thecortical and at the CST spinal cord interneurone and anterior horn cell synaptic sites.Another matter for concern is that most surgical procedures require the use of musclerelaxants. Transcranially induced CMAPs, however, have been acquired with amyoneural junction block of less than 80%.41,76 The intensity of the junctional block,however, should be held relatively constant. Of interest, transcranially elicited caudaequina responses can be acquired in the presence of complete junctional blockade, asthese responses are generated by anterior horn cell axons.
Figure 12 illustrates changes in TCMS-induced myogenic responses acquired duringrepair of an aortic coarctation. Placement of the proximal cross-clamp resulted in lossof the lower-limb responses within 1 min of its application. There were no changes inthe posterior tibial nerve induced SEPs. As discussed above, SEPs usually require anaverage of 15 min for ischaemia-induced attenuation. The faster rate of myogenicresponse attenuation is presumably a re¯ection of the greater blood ¯ow requirementsof the functioning spinal cord grey matter. For the same reason, TCMS-inducedmyogenic responses disappeared well in advance of SEPs during an unsuccessfulresuscitation attempt in a patient undergoing an emergency thoracic aneurysm repair(unpublished results). de Haan and colleagues have shown that loss of myogenicresponses due to selective ischaemia of lower-limb nerves typically requires ichaemicperiods of 25±30 min.60 Therefore the time course of myogenic response attenuationduring aortic surgery can help in localizing the ischaemic site.
Qayumi and colleagues studied the predictive e�cacy of TCMs in swine.77 Theydemonstrated that global spinal cord ischaemia (i.e. cross-clamped descending aortawithout distal perfusion) resulted in loss of lower-limb myogenic responses within2 min. Peripheralmyogenic responses, however, reappeared inover 80%of theiranimalsduring reperfusion of the spinal cord. These response changes were not predictiveof neurological outcome as animals experiencing more than 20±25 min of spinal cordglobal ischaemia still demonstrated signi®cant de®cits post-operatively. Thus, whileTCMS-induced peripheral responses (CMAPs) were sensitive to spinal cord globalischaemia, they did not accurately predict post-ischaemia neurological function. On theother hand, the status of TCMS-induced myogenic responses accurately predictedregional spinal cord ischaemia induced motor de®cits. Regional (focal) ischaemia wasproduced by sequential clamping of intercostal arteries with distal aortic perfusionintact.
Similar results in humans were obtained by de Haan and colleagues using TCES-induced lower-limbmyogenic responses.78 Changes in tibialis anteriorCMAPs correctlypredicted post-operativemotor function in all 20 patients monitored during surgery onthe descending aorta. They used distal aortic perfusion and selective reimplanation ofcritical intercostal or lumbar arteries. Critical arteries for reimplanation were de®nedby the loss of lower-limb myogenic responses during sequential clamping of intercostalor lumbar arteries.
Of importance in this regard is the absence of false negatives in both studies as wellas elimination of false positives when distal perfusion was used and the status of lower-limb transcranially elicited motor-evoked CMAPs guided the preservation of criticalintercostal arteries. Because of the highly predictive e�cacy for monitoring descendingmotor paths as well as the fast attenuation of CMAPs (1±2 min during selectiveocclusion of critical intercostal and/or lumbar arteries), compared with somatosensoryand mixed modality evoked responses (see preceding section), interest in the use of
Neurophysiological monitoring in vascular surgery 41

transcranially induced motor-evoked potentials for monitoring descending aorticsurgical procedures will probably continue to increase.
TRANSCRANIAL DOPPLER ULTRASOUND
Vascular surgeons and anaesthesiologists worldwide are familiar with ultrasoundtechniques. Despite this familiarity and the international availability of commercial TCDultrasonographs for over 15 years, the application of this technology to vascular surgeryis still in its infancy. There are several factors responsible for this low utilization. Forexample, TCD ultrasound does not directly measure cerebral blood ¯ow. The TCDspectral display gives information on the range of erythrocyte velocities within speci®edarterial segments. Although change in velocity is generally proportional to change in¯ow, these relationships are heavily in¯uenced by vessel diameter and blood viscosity.Thus, ¯ow and velocity do not always change in parallel. In addition, the quality of TCDinformation is highly user dependent. Considerable skill, experience and continuouspractice are required to use and interpret the intracranial sonograms with maximumbene®t. Furthermore, wide variation in temporal bone thickness and density preventsinsonation of intracranial vessels at this preferred site in perhaps 10% of patients. Finally,current TCD machines can identify neither the size nor the composition of presumedembolicmaterial. Theymay fail to count the number of embolic particles accurately anddo not quantify the aggregate volume of gaseous emboli.
These limitations notwithstanding, thoughtful use of TCD monitoring in vascularsurgery involving the cerebral vessels has the opportunity to improve signi®cantly thequality of care while reducing its cost. The details of these opportunities for vascularsurgery are discussed below.
Carotid endarterectomy
CEA is now performed over 100 000 times annually in the United States. This numberis likely to increase owing to the greying of our society. Further increase has beenprompted by the Asymptomatic Carotid Atherosclerosis Study ®nding79 of a 50% riskreduction of ipsilateral stroke in asymptomatic patients with greater than 60% carotidnarrowing. A second important conclusion of this study was that surgical bene®t tosuch patients required that the combined incidence of peri-operative mortality andmorbidity be53%.80 Because both study sites and patients were selected to minimizerisk, the low absolute incidence of neurological complications in the study populationis not representative of national experience. Thus, an onus is placed on surgeons tomaintain a low complication rate in order to perform the surgery and/or to receivereimbursement.
Unfortunately, the role of neuromonitoring in helping the surgeon to achieve thisgoal is highly controversial. Despite a long and often favourable experience withelectrophysiological techniques during CEA, reports on their clinical bene®t are quiteinconsistent. For example, Wober et al81 used a meta-analysis of 3136 patients from15 previous studies to examine the e�ect of SEP monitoring on CEA outcome. Theyconcluded that SEP changes were unreliable predictors of neurological outcome andconsequently provided unsuitable criteria for selective use of an intravascular shunt.Although a similar meta-analysis has not been performed for EEG monitoring, somereports have failed to ®nd bene®t.38,82 From the perspective of many insurers, hospitaladministrators and surgeons, these negative reports have erased the impact of the
42 L. D. Gugino et al

considerable number of positive reports.83 Most importantly, not a single, adequatelypowered, randomized, prospective CEA outcome study has been performed on anyneuromonitoring modality. In the absence of such results, the controversy is likely tocontinue.
Two related factors seem largely responsible for the inconsistent results: statisticalsample size considerations and a multifactorial aetiology. Fortunately, the incidence ofclinically signi®cant peri-operative neurological complications of CEA generally is nothigh. This relatively low incidence thus requires large sample sizes to detect legitimatelyreal e�ect on outcome. For example, to detect a valid statistically signi®cant halving of a3% complication rate with an a value of 0.05 and 80% power would require randomassignment of 3068 patients to monitored and unmonitored groups. Not surprisingly,the underpowered studies in the SEP meta-analysis and elsewhere lead to randomresults that tell us more about peer review quality than monitoring utility.
In addition, the source of CEA neurological complications is clearly multifactorial:both embolic and haemodynamic. Furthermore, these processes may be initiated at anytime from anaesthetic induction through post-anaesthetic care recovery. Monitoringonly the period of intentional carotid occlusion will inevitably fail to detect somenoteworthy and treatable changes in cerebral perfusion. Because the incidence ofpreventable complications is low, failure to prevent even one injury in each hundredcases may obscure any earlier successes and degrade apparent cost-e�ectiveness.
The greatest hindrance to widespread use of neuromonitoring for CEA is the cost ofpersonnel, not monitors. Therefore, it makes both clinical and economic sense for themonitorist to do everything possible to prevent a peri-operative neurological com-plication. Counterproductive and parochial arguments over the relative bene®ts ofelectrophysiological, ultrasonic and near-infrared spectroscopic monitors miss theessential point. To justify the cost of the neuromonitoring technologist, the complica-tion rate must be reduced to zero. The multifactorial aetiology of the complicationssuggests that this is best achieved with multimodality monitoring of both haemo-dynamic and embolic processes. Total elimination of complications requires, in part,information only available through TCDmonitoring. Lennard et al84 recently were ableto achieve the zero complication goal with the aid of TCD monitoring. Their series of340 consecutive CEAs had no intraoperative morbidity or mortality. In addition, post-anaesthetic care TCD monitoring guided aggressive anti-platelet therapy to eliminatetotally post-operative complications as well.
Bilateral TCD insonation of the middle cerebral arteries prior to anaestheticinduction establishes the baseline haemodynamic pro®le. The absence of rhythmicoscillations in peak velocity (Figure 1) suggests diminished cerebral autoregulation andthus the need for careful blood pressure control.85 The bilateral baseline values alsoidentify marked interhemispheric ¯ow asymmetries. Armed with such knowledge, themonitorist may prevent cerebral infarcts resulting from inadvertent arterial compres-sion during neck hyperextension associated with endotracheal intubation or excessivehead rotation to achieve maximal carotid exposure.
TCD sensitivity to the presence of particulate emboli can help to guide surgicaldissection of the carotid prior to endarterectomy. Jansen et al86 found that TCD high-intensity transient signals (HITS) indicative of emboli were signi®cantly related to newischaemic lesions (Figure 13).
The need for an intravascular shunt and its proper functioning can both be objectivelydetermined by TCD monitoring (Figure 2). Spencer87 has de®ned hypoperfusionnecessitating shunt placement as a 470% decline in peak velocity below the pre-occlusion reference. Shunt patency may be quanti®ed by the magnitude of velocity
Neurophysiological monitoring in vascular surgery 43

increase, once it has been opened. Because most shunts are somewhat ¯ow restrictive,the velocity typically does not fully return to the pre-occlusion reference value(Figure 14).
Continued surveillance of the TCD waveform during the entire endarterectomyis essential to ensure adequate perfusion. Unexpected shunt kinking may be rapidlydetected and corrected with the aid of the TCDmonitoring. Even with a patent shunt,hypoperfusion during the endarterectomy may suddenly occur as the anaesthesiologistgradually decreases systemic arterial pressure (Figure 14). Controlled hypertensionis often used at initial carotid occlusion to facilitate collateral cerebral blood ¯ow.However, this represents a considerable stress to both the patient's and theanaesthesiologist's cardiovascular systems. Perfusion pressure decline may suddenlylead to a closure of high-resistance collaterals. Thus, TCD monitoring aids theanaesthesiologist in objectively determining the lowest adequate perfusion pressureduring the critical period of carotid occlusion. In Spencer's series of 500 CEAs87,hypoperfusion was identi®ed in 16% of the cases.
Post-endarterectomy hyperaemia, potentially leading to haemorrhagic stroke, ismost commonly seen in those patients with rapidly progressing stenotic lesions. Thecerebral vasculature in the a�ected territory maximally dilates and loses the ability toautoregulate. TCD monitoring provides a reliable and inexpensive method fordetection of this potentially catastrophic phenomenon. Spencer87 noted that hyper-aemia,manifested by a doubling of the pre-occlusion reference velocity, occurred in 15%of his series. The small number of patients ultimately experiencing post-operativehaemorrhagic infarcts came from this group. The vast majority of these at-risk
Figure 13. This 30 second display of the middle cerebral artery ¯ow velocity pro®le illustrates the cyclic¯uctuations in peak velocity associated with the respiratory cycle. These ¯uctuations, usually 10% or greater,are diminished or absent in those without cerebral autoregulation. The small white mark within the velocityspectrum above the arrow (i.e. HITS) indicates a presumed embolus. HITS within the spectrum are generallythought to represent particulates or bubbles coated with plasma lipids, ®brinogen or other materials. Incontrast, full-scale spikes appear to be uncoated gas bubbles. Unfortunately, neither the size nor compositionof presumed embolic material can be reliably determined by TCD ultrasound.
44 L. D. Gugino et al
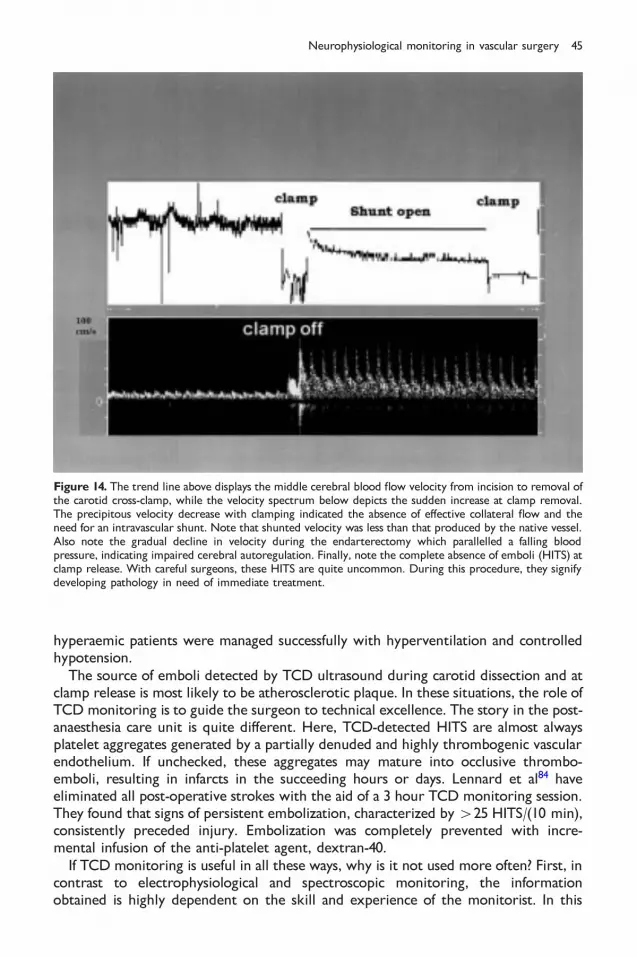
hyperaemic patients were managed successfully with hyperventilation and controlledhypotension.
The source of emboli detected by TCD ultrasound during carotid dissection and atclamp release is most likely to be atherosclerotic plaque. In these situations, the role ofTCDmonitoring is to guide the surgeon to technical excellence. The story in the post-anaesthesia care unit is quite di�erent. Here, TCD-detected HITS are almost alwaysplatelet aggregates generated by a partially denuded and highly thrombogenic vascularendothelium. If unchecked, these aggregates may mature into occlusive thrombo-emboli, resulting in infarcts in the succeeding hours or days. Lennard et al84 haveeliminated all post-operative strokes with the aid of a 3 hour TCD monitoring session.They found that signs of persistent embolization, characterized by425 HITS/(10 min),consistently preceded injury. Embolization was completely prevented with incre-mental infusion of the anti-platelet agent, dextran-40.
If TCDmonitoring is useful in all these ways, why is it not used more often? First, incontrast to electrophysiological and spectroscopic monitoring, the informationobtained is highly dependent on the skill and experience of the monitorist. In this
Figure 14. The trend line above displays the middle cerebral blood ¯ow velocity from incision to removal ofthe carotid cross-clamp, while the velocity spectrum below depicts the sudden increase at clamp removal.The precipitous velocity decrease with clamping indicated the absence of e�ective collateral ¯ow and theneed for an intravascular shunt. Note that shunted velocity was less than that produced by the native vessel.Also note the gradual decline in velocity during the endarterectomy which parallelled a falling bloodpressure, indicating impaired cerebral autoregulation. Finally, note the complete absence of emboli (HITS) atclamp release. With careful surgeons, these HITS are quite uncommon. During this procedure, they signifydeveloping pathology in need of immediate treatment.
Neurophysiological monitoring in vascular surgery 45

regard, Shen et al88 recently studied the reproducibility and variability of TCDinformation. They found excellent (490%) agreement with velocity measurementsamong a group of experienced ultrasonographers. However, they observed that lowvariance and high reproducibility required frequent practice. After an 8 week break,performance deteriorated markedly. The conclusion was that lack of regular practiceadversely a�ected the accuracy of both measured and calculated ¯ow velocity indices.Their recommendation was that the monitoring companies develop devices,i.e. phantom heads, to facilitate training and to enable e�cient practice regimens.These devices could dramatically improve the clinical acceptance of this technology.
Another important impediment to widespread TCD utilization is the inability toinsonate arteries of the anterior cerebral circulation in all patients. Increased temporalbone density in elderly patients may prevent use of this ultrasonic window in up to15% of a patient population. One approach to overcome this limitation is to use thetransorbital approach.89 With practice, the anterior circulation can almost always beinsonated via this nearly transparent ultrasonic window. Again, the burden lies withthe manufacturers to develop probe ®xation systems that permit safe insonationthrough the eye.
The third major obstacle to routine TCD use during CEA is the uncertainty ofautomatic emboli detection. Total elimination of post-operative strokes appearsto require aggressive anti-platelet therapy guided by TCD monitoring. Becausethese therapies are themselves not risk free, their optimal application depends onhighly accurate embolic detection. Although consensus criteria for TCD embolusdetection have been proposed by a respected international panel90, currently availablecommercial monitors fall short of these requirements. Like the previous limitations,this one must be overcome by the equipment manufacturers.
This brief report has sought to clarify the important role that TCD monitoring canplay in CEA surgery. The key concepts are that
1. virtually all neurological injury associated with CEA is preventable,2. the sources of this injury are both haemodynamic and embolic3. TCD monitoring is e�ective in detecting both types of abnormalities.
These concepts emphasize the value of TCD monitoring in responsible multimodalityneuromonitoring for CEA.
Surgery involving the aorta
Surgical repair of the thoracic aorta has considerable potential to result in brain injury.Aortic repairs involving the head vessels often require a period of deep hypothermiccirculatory arrest. Despite the neuroprotective e�ects of hypothermia, the incidenceof brain injury is both considerable and highly variable. In an attempt to minimizeischaemia injury, a number of centres have recently begun to perfuse the brainselectively during systemic circulatory arrest in either antegrade91 or retrograde92
fashion.Selective retrograde cerebral perfusion (RCP) has to date been more popular,
perhaps because of its technical simplicity: a redirection of oxygenated pump bloodfrom the femoral artery to a superior vena caval cannula coupled with Trendelenbergpositioning. Poorly oxygenated blood e�uxes from the open carotids and is returnedvia suction to the venous reservoir. However, TCD monitoring has shown that thistechnique is actually deceptively complex. Continuous insonation of both MCAsduring attempted initiation of RCP depicts a wide range of ¯ow patterns (Figure 15)
46 L. D. Gugino et al

that are totally independent of the dark blood leaving the carotids.93 In the extremecase, marked carotid ¯ow may occur in the total absence of detectable MCA ¯ow.Without TCDmonitoring, the surgeon's con®dence in his or her ability to perfuse thecerebral cortex successfully solely through examination of carotid ¯ow is unfounded.Because the converse situation may also occur, it is clear that our currentunderstanding of the haemodynamics of RCP is quite limited.
The general lack of TCD monitoring in RCP studies helps to explain some of thecurrent controversies regarding its management and e�ectiveness. Based on animalstudies, several authors have recommended that RCP perfusion pressure be limited to20 or 25 mmHg to avoid the possibility of haemorrhage in the relatively fragile cerebralvenous vasculature.93 However, TCD monitoring shows that somewhat higherpressures than this magic threshold are sometimes required to re-expand the collapsedcerebral veins at the initiation of RCP. Once retrograde ¯ow has been con®rmed byTCD measurements, lower pressures may be adequate. Thus, without direct monitor-ing of intracranial ¯ow, studies claiming lack of RCP e�cacy should be viewedsceptically.93 One should not assume retrograde cerebral ¯ow: it must be documented.
TCD monitoring is also a considerable aid in assessing the e�ectiveness of selectiveantegrade cerebral perfusion (ACP). To minimize the technical complexity of theadditional cannulations, surgeons often prefer to perfuse a single carotid or brachio-cephalic artery. If the patient has e�ective collateral ¯ow, the one extra cannulation issu�cient. E�ectiveness may be objectively and instantaneously determined withbilateral TCD monitoring of the anterior cerebral circulation. TCD monitoring is alsoimportant because requisite ¯ow is quite low. For example, in neonates an ACP ¯ow of30 cm3/kg per minute may produce cerebral arterial ¯ow velocities equivalent to thoseachieved with a 300 cm3/kg per minute systemic pump ¯ow (Figure 16). Thus, TCDmonitoring for ACP seems essential to avoid hyperaemia and potential intracerebralhaemorrhage.
In addition to aneurysmal repair, TCDmonitoring has proven valuable in coarctationrepair. Concern about CNS injury during this procedure is typically focused on thespinal cord. However, particularly in those patients with additional congenitalcardiovascular anomalies, temporary aortic cross-clamping may result in cerebralischaemia. This situation is graphically illustrated in Figure 17. Therefore, completeneuraxial protection during coarctation repair requires both electrophysiologicalmonitoring of ascending and descending spinal pathways aswell as assurance of adequatecerebral perfusion. TCD monitoring is one e�ective means of achieving the latterobjective.
Figure 15. The left MCA ¯ow-velocity spectrum documents the loss of antegrade (i.e. above the baseline)perfusion at the onset of deep hypothermic circulatory arrest. The right spectrum depicts the initiation ofretrograde (i.e. below the baseline) perfusion through the same vessel. Although in both cases the pump ¯owwas 1.0 l/min, the retrograde velocity is much lower, possibly re¯ecting its venous character.
Neurophysiological monitoring in vascular surgery 47

The current status of TCDmonitoring for vascular surgery is succinctly summarizedby the recent March 1999 policy statement of the Washington State Blue Shield healthinsurance provider. It states `TCD is considered medically necessary for assessing initialcollateral blood ¯ow and embolization during carotid endarterectomy. It is consideredinvestigational for assessing the adequacy of cerebral blood ¯ow and embolic eventsduring cardiopulmonary bypass surgery'.
CEREBRAL OXIMETRY
Non-invasive measurement of regional cerebral venous oxygen saturation (CVOS) inhumans using transcranial near-infrared specroscopy was ®rst reported by Jobsis morethan 20 years ago.94 Unfortunately, technical complexities retarded development ofmonitors suitable for routine clinical use. United States Food and Drug Administrationclearance for such a device was only recently achieved. Controversy regarding thistechnology tends to focus on three areas: the biophysics of transcranial infraredmeasurement, clinical interpretation and application.
Infrared biophysics
Regional cerebral oximetry is possible for two primary reasons. First, the human skullis transparent to near-infrared light. Second, haemoglobin concentration in the brain ishigh, representing 1% of the tissue weight. Thus, the major obstacle to measurement is
Figure 16. The middle panel is a trend of MCA ¯ow velocity from incision to the termination ofcardiopulmonary bypass in this 3 kg neonate. Selective antegrade perfusion at 90 cm3/min via a subclaviancannula (upper ¯ow-velocity spectrum) was initiated at the white arrow. The lower spectrum represents the¯ow velocity during weaning from bypass at a pump ¯ow of 900 cm3/min. Note that the selective cerebralperfusion facilitated selective cooling of the brain (258C) and body (308C). The EEG was maintainedthroughout the period of systemic circulatory arrest and there was no cerebrovenous oxygen desaturation.
48 L. D. Gugino et al

neither the bony enclosure nor the haemoglobin concentration but the opticalcharacteristics of the brain itself. This compositionally complex organ o�ers a highlyscattering medium to infrared light. Path-length measurements show that the meandistance travelled by photons is 4±6 times the distance from light source to detector.95
However, accurate path-length measurements are necessary if one employs the Beer±Lambert equation to calculate the absolute concentration of cerebral chromophoressuch as the haemoglobins and cytochromes. High scattering also means that only asmall fraction of the incident light will be received by surface detectors. The craniumand extracranial structures also reduce signal strength through the absorption ofinfrared light by tissue chromophores.
Dual-wavelength spatially resolved re¯ectance spectroscopy was developed tominimize the impact of these obstacles.96 Similarly to a pulse oximeter, use of twowavelengths allows determination of the relative amounts of oxy- and deoxyhaemoglo-bin because of their distinct infrared absorption spectra. By solving the two Beer±Lambert equations for the ratio of deoxy- tooxyhaemoglobin, theunknownpath-lengthvariable is eliminated. However, this approach precludes determination of absolutechromophore concentrations. Re¯ectance utilizes light bouncing back from the outercortical layers toward the region of the light source, avoiding the complexities oftransilluminating the entire skull. Extracranial contamination is removed by use of twodetectors located at di�erent distances from the source. Subtraction of the signal fromthe closer detector a�ected primarily by surface structures leaves only that obtained bycortical re¯ection to the more distant detector (Figure 18). Because the intravascularcompartment volumes of the cortex are normally about 25% arterial, 5% capillary
Figure 17. The MCA ¯ow-velocity trend in the upper panel depicts the marked decrease in brain perfusionduring coarctation repair in a neonate. Flow decreases were associated with two attempted applications ofthe aortic cross-clamp between what was thought to be the brachiocephalic and left carotid arteries.However, the brachiocephalic artery actually had an anomalous origin from the left subclavian.
Neurophysiological monitoring in vascular surgery 49

and 70%venous, theCVOSvalue represents avenous-weighted averageof the fractionofoxyhaemoglobin contained therein. The robustness of this algorithmic assumption isshown using worst-case scenarios. With a complete inversion of arterial and venouscompartmentation (i.e. arterial 75%), theCVOSvalue does not change bymore than 5%.
Clinical interpretation
When coupled with other vital physiological data, CVOS can improve patientmanagement through a continuous assessment of the balance between cerebral oxygenconsumption and the delivery of oxygenated haemoglobin. The following commentson CVOS interpretation are based on observations in over 3500 cases in anaesthetizedsurgical patients or conscious patients during implantable cardioverter±de®brillatortests or evaluation of syncope.
CVOS is designed to monitor change in the balance between oxygen supply anddemand. Its goal is to detect rapidly cerebral dysoxygenation: a clinically signi®cantoxygen imbalance in need of immediate correction. To identify imbalance, it is ®rstnecessary to de®ne balance, in the normal range of CVOS values in conscious patientswithout evidence of cerebral dysfunction. We made such a determination in 250 adultpatients scheduled for cardiac surgery. The CVOS group mean and standard deviationwere 65 and 9, respectively. In addition, we examined the clinical signi®cance of CVOSdecline in syncopal patients.97 A loss of consciousness was always preceded by a suddenCVOS drop of over 25%. Therefore, noteworthy cerebral oxygen desaturation could bede®ned either as a 425% decline or as a value of 50 scale units (25% decline from the
Figure 18. The mean path of photons travelling through the cranium from the infrared source to sensors onneighbouring scalp is banana shaped. Subtraction of the near (30 mm) from the distant (40 mm) signale�ectively removes most extracranial `contamination' of the regional CVOS estimate.
50 L. D. Gugino et al

groupmean of 65). A recent study by Roberts et al98 suggests which approach to follow.They examined CVOS decline associated with carotid occlusion in endarterectomypatients with regional anaesthesia. Changes of less than 25% never (46/50) resulted inneurological dysfunction, while larger changes always (4/4) did. Signs of cerebralischaemia developed in one patient with a 27% decline from a baseline of 83.
While major changes in CVOS identify episodes of cerebral dysoxygenation, theircause(s) must be determined by interpreting other physiological, anaesthetic andsurgical information. For example, there are at least six important physiologicalvariables in¯uencing the delivery of oxygenated haemoglobin to the brain. Additionalmonitoring can assess the in¯uence of each on oxygen delivery. Such information isessential to the accurate interpretation of CVOS changes.
First, the principle of cerebral autoregulation states that cerebral perfusion(i.e. oxygen delivery) is independent of mean systemic arterial pressure over therange 50±150 mmHg. Thus, profound hypotension (550 mmHg) will reduce oxygendelivery and probably result in a CVOS decrease. However, a pressure decrease withinthe 50±150 mmHg rangemay also result in a CVOS drop if autoregulation is diminishedor entirely absent. Cerebrovascular insu�ciency from dysautoregulation may besecondary to a pre-existing pathology (e.g. stroke, diabetes, hypertension, obesity,nicotine or alcohol abuse) or be iatrogenically induced during surgery (e.g. volatileanaesthetic agents, non-pulsatile perfusion, hypothermia). Therefore, a parallel trend ofsystemic arterial pressure is essential for the interpretationofCVOSchanges (Figure 19).
Second, delivery of oxygen to the brain depends on the relative concentration ofoxygenated haemoglobin in the arterial blood. An inadequate oxygen supply will thuseventually result in a decreased arterial oxygen saturation (SaO2). However, becausesystemic oxygen reserves far exceed those of the metabolically active brain, a CVOSdecrease will nearly always precede the pulse oximeter's eventual decline in SaO2. For
Nifedipinesublingual
Plasmaexpansion
Arterialhypertension
Stenosed carotid
Normal carotid
CV
OS
CV
OS
MA
P m
mH
g
1009590
8580
7060
50
40
7060
50
40
Figure 19. Administration of a sublingual nifedipine test dose in this CEA candidate transiently loweredarterial blood pressure (top trace). Transcranial CVOS trends ipsilateral (middle trend) and contralateral(bottom trend) to the stenosed carotid demonstrate regional cerebral dysautoregulation. Such localizeddisruptions of autoregulation often subside after endarterectomy. This recording is through the courtesy ofDr E. Bondio.
Neurophysiological monitoring in vascular surgery 51

example, we recently detected the formation of partially occluding blood clot on thetip of an endotracheal tube which was ®rst detected by a decrease in CVOS. Onlyseveral minutes later did the inadequate supply of oxygen become evident on thepulse oximeter. The valve-like e�ect of the clot also confounded capnographicinterpretation.
Third, oxygen delivery also depends on the availability of haemoglobin. Blood loss orhaemodilution can result in an insu�cient supply of oxygen to meet the brain'sdemands, even though the perfusion pressure and ¯ow (or ¯ow velocity) to the brainare within normal limits. It is essential to note any marked change in haemoglobin thatmay explain sudden changes in CVOS. In addition, the relationship betweenhaematocrit and red cell volume is less than perfect. Orth et al99 recently found that,at the same haematocrit, red cell volumes could di�er by 2 units of packed red cells.
Fourth, healthy cerebral arteries are exquisitely sensitive to the e�ects of CO2.Cerebral blood ¯ow velocity changes 4% for each 1 mmHg change in the arterial carbondioxide partial pressure. Because hyper- and hypocapnia may have a profound e�ect onCVOS, a CO2 trend is also necessary to interpret changes in cerebral oxygenation.100
Fifth, systemic arterial pressure re¯ects perfusion at sites distant from the head.Obstruction to one or more vessels carrying blood to the brain may result in aprofound decrease in regional cerebral oxygen delivery without altering eithersystemic pressure or oxygenation. For example, with bilateral carotid disease and anincomplete circle of Willis, head rotation may obstruct brain ¯ow by vertebral arterycompression (Figure 20). In addition, during cardiopulmonary bypass a malpositionedaortic cannula or balloon occluder may block ¯ow to a critical head vessel.
Regional cerebral hypoperfusion can be con®rmed directly by TCD ultrasonographyor indirectly by multilead EEG or evoked potentials. In the absence of change in other
LeftHead rotation
Right Neutral
Right cortex
Left cortex
80
70
60
50
40
300 10 20 30 40
% C
VO
S
Elapsed time (minutes)
Figure 20. This patient's head was initially left rotated (®rst arrow) to facilitate insertion of a pulmonaryartery catheter. Subsequent right rotation aided insertion of a left jugular rapid infusion cannula. Note themarked fall of CVOS in the left frontal cortex with left rotation. The patient awoke slowly, was combativeand displayed a transient right-sided weakness. Although the patient ultimately regained his pre-operativeneurological status, the duration of his intensive care stay was 4 days.
52 L. D. Gugino et al

physiological parameters, the clinical signi®cance of a sudden drop in CVOS can becon®rmed by a decrease in cerebral arterial peak blood ¯ow velocity, a loss of high-frequency EEG activity (i.e. ischaemic slowing) or a diminution±delay of long-latencycortical components of SEPs.
Sixth, continuous delivery of oxygen to the brain is impeded if the cerebral venousout¯ow is compromised. Impaired venous ¯ow may be the result of cerebral oedemaor an obstruction in the out¯ow tract (i.e. cannula or catheter malposition). Suchobstruction is readily detected by TCD monitoring, which shows a characteristicdecrease in diastolic velocity that is proportional to the severity of obstruction. Com-plete blockage of venous return actually produces a ¯ow velocity reversal duringdiastole. Hyperpulsatile patterns seen ®rst during weaning from cardiopulmonary by-passmay re¯ect developing cerebral oedema and the need for ultra®ltration (Figure 21).
In addition to these factors a�ecting oxygen delivery, there are at least threeimportant variables in¯uencing the brain's consumption of oxygen: temperature,hypnotic e�ect and seizure activity. Physiological monitoring is essential to documentthe role each plays in cerebral oxygen desaturation.
Temperature
Changes in CVOS cannot be fully understood without knowledge of the parallelmovements in cranial temperature.101 In a healthy normothermic brain, ¯ow andconsumption are coupled at a ratio of 20:1. The brain's ability to adjust ¯owcontinuously to meet its constantly changing metabolic demands is termed vasoneuralor ¯ow±metabolism coupling. Cranial temperature a�ects these functions di�erently,
Figure 21. Cerebral oedema impairs venous return owing to an increased cerebrovascular resistance. Thisincrease is manifested by a reduction in cerebral blood ¯ow velocity, initially only during diastole. Thus, theTCD spectrum becomes hyperpulsatile. The trend plot of the MCA ¯ow velocity from the onset ofcardiopulmonary bypass until its termination illustrates vasoneural uncoupling resulting, in part, from theolder strategy of rapid cooling and rewarming for a period of deep hypothermic circulatory arrest. Despitethe rapid increase in cerebral metabolic demand associated with rewarming, the low blood ¯ow velocityremains unchanged. This young patient post-operatively evidenced signs of neurological injury.
Neurophysiological monitoring in vascular surgery 53

because it is linearly related to cerebral blood ¯ow but exponentially related tocerebral oxygen consumption (i.e. an index of metabolism). Thus, at deep hypothermiathe coupling ratio has increased to 75:1 as ¯ow has become progressively moreluxuriant.
Cooling is used as a neuroprotectant during surgery requiring circulatory arrestbecause hypothermia decreases the brain's need for oxygen. Because the human brainis thought to have an oxygen consumption Q10 of 3.6 (ratio of consumptions over a108C temperature range), a safe arrest time of 5 min at 378C is extended to 60 min at178C. The excessive delivery of oxygen during hypothermia will thus result in anincreased CVOS. However, the magnitude of metabolic savings di�ers considerablyamong individuals because of the marked variability in regional cooling. In the absenceof cerebral functional monitoring, a ®xed low cranial temperature (i.e. 188C) cannotguarantee adequate metabolic suppression to sustain even a moderate 30 min periodof circulatory arrest without brain injury.
In contrast, during rewarming ¯ow falls relative to metabolism with an accom-panying CVOS decrease. The severity of the decrease is enhanced following moderate-to-deep hypothermia because of cold-induced cerebral vasoparesis. Disruption ofvasoneural coupling signi®es that the brain has lost its ability to meet the rewarming-induced metabolic demand increase with proportionate ¯ow enhancement. Ifundetected and uncorrected, the resulting desaturation may lead to preventablebrain injury (Figure 21).
Hypnotic e�ect
Cerebral oxygen consumption is largely due to interneuronal communication: a highlyactive cortex uses a great deal of oxygen. Therefore, CVOS is in¯uenced by the choiceof anaesthetic agent and the magnitude of cerebrocortical neuronal depression. Agentssuch as the opioids exert much of their anaesthetic action at subcortical sites. Withthese agents, the CVOS may remain unchanged over a wide dose range. Alternatively,the volatile inhalational agents, propofol and the barbiturates can virtually eliminateintraneuronal signalling (i.e. ¯at-line EEG) at high doses. This neurone-based metabolicdepression will lead to a CVOS increase. Should anaesthetic delivery becomeinadequate, the increased oxygen consumption of the waking brain causes a CVOSdecrease. Therefore, intraoperative interpretation of CVOS optimally requires anobjective quanti®able measure of hypnotic e�ect, such as the EEG bispectral index orpresence of middle latency auditory-evoked responses.
Seizure activity
Extraordinary neuronal activity associated with many forms of seizure activity places ahuge metabolic demand on the brain. Even in the presence of an intact vasoneuralcoupling, dramatic increases in oxygen extraction are needed to prevent hypoxic injury.Higher extraction results in a falling venous oxygen saturation. Thus, continuous CVOSmonitoring (Figure 22)may be used for the initial detection of suspected seizure activityin chemically paralysed, ventilated patients.102 Suspicions may then be con®rmed byEEG. The brief seizures associated with electroconvulsive therapy often do not result inmarked desaturation.103 However, the prolonged post-ictal hyperaemia is associatedwith a cerebral hyperoxia.104 Seizures are not uncommon, because post-operative ictalepisodes are thought to occur in up to 25% of paediatric cardiac surgery patients. In
54 L. D. Gugino et al

addition, a recent report described generalized seizures in a non-epileptic patientanaesthetized with sevo¯urane.105
Clinical application
CEA represents an ideal clinical setting to demonstrate the responsiveness of thecerebral oximeter to transient reduction in cerebral perfusion. In the absence ofimpaired cerebral perfusion, CVOS changes during the course of this surgery areconsistent and predictable.98,106 Initial awake CVOS baseline values from the left andright frontal cortical regions are typically greater than 45 scale units and relativelysymmetrical (less than 10 scale unit di�erence). Lowor asymmetric values in the absenceof pre-existing neurological de®cit suggest heightened oxygen extraction and adiminished tolerance for lowperfusion (Figure 19). Lowextraction globallyor regionallyis often accompanied by maximally dilated cerebral vessels. This persistent dilationsuggests impaired cerebral autoregulationwhichmay place these cortical regions at riskif perfusion pressure drops below the awake baseline (Figure 19).
Developing CVOS asymmetry after head positioning suggests regional malperfusionfrom an otherwise unrecognized carotid or vertebral compression. Sudden CVOSdeclines of 425% with carotid occlusion indicate inadequate collateral perfusion andthe need for an intravascular shunt. Because the ¯ow capacity of most shunts is lessthan that of the native carotid, even perfectly functioning shunts will usually notcompletely restore CVOS to pre-clamp baseline. The di�erence in pre-clamp andshunted values thus o�ers insight into shunt e�ciency. During the endarterectomy,CVOS decline is most often precipitated by cerebral perfusion pressure decline orshunt occlusion (Figure 23). Following the endarterectomy, supernormal CVOS valuessuggest hyperaemia with heightened risk of haemorrhage. In the early post-operativeperiod, CVOS can be used to help to manage those patients with unstable haemo-dynamics or peri-carotid haematomas (Figure 24).
Because this technology has only recently become available for routine clinical use,there are no prospective randomized studies available on its e�cacy for strokeprevention or cost savings. However, several investigators have demonstrated itsclinical utility in this setting.98,106
seizures
75
70
65
60
55
501 hour
rS02
Figure 22. The rapid transient ¯uctuations in CVOS were associated with both EEG and clinical evidence ofseizure activity. Partial seizures may result in transient increases in CVOS, while the higher metabolicdemand of generalized seizures often leads to transient CVOS decreases. This tracing was courtesy of Dr E.Nemoto.
Neurophysiological monitoring in vascular surgery 55

Aortic aneurysm repair
Another attractive opportunity to observe the bene®t of cerebral oximetry is in therepair of aortic aneurysms involving the head vessels. With or without total circulatoryarrest, deep hypothermia is generally used to provide maximum neuroprotection.However, it is a double-edged sword. Deep cooling unquestionably aids in brainprotection but it also may result in lethal coagulopathies. Cooling inevitably results inCVOS increase, but only to a point. With the eventual elimination of synaptic activity
Clamp on
Shunt open
Shunt twisted
Clamp off
0 10 20 30 40 50 60
Elapsed time (min)
110
100
90
80
70
60
50
CV
OS
(%
cha
nge
from
bas
elin
e)
Figure 23. The precipitous decline in CVOS ipsilateral to the occluded carotid indicated the need for anintravascular shunt. Shunt functioning was demonstrated by a partial CVOS recovery towards pre-clampbaseline. The source of the second large CVOS decline was ultimately discovered to be a non-functioningshunt. This prolonged period of marked desaturation was associated with a post-operative neurologicalde®cit.
9080
605040
70
9080
605040
70
Pre-op Surgery Recovery Peri-carotidHematoma
Evacuation
Left
CV
OS
Rig
ht C
VO
S
Figure 24. These trend plots represent 24 hour CVOS recordings from the forehead ipsi- (top) andcontralateral (bottom) to the site of a CEA. Note the symmetry and stability until a peri-carotid haematomacompromised cerebral perfusion ipsilateral to the endarterectomy. Its evacuation promptly restored cerebraloxygenation. Tracings are courtesy of Dr E. Bondio.
56 L. D. Gugino et al

(i.e. ¯at-line EEG or loss of cortical components of SEPs), CVOS plateaus. Thus, thein¯ection point on the CVOS trend seems to represent the cranial temperature ofmaximum neuroprotection. Because this temperature varies widely among patients, itsindividualization based on oximetric and/or electrophysiological indices appearsnecessary to avoid unnecessary cooling. Because extreme hypothermia also prolongsthe rewarming period, signi®cant operating room costs may be avoided by usingcerebral monitoring rather than recipe to determine the low-temperature limit.
Use of selective cerebral perfusion further increases the need for cerebral oximetricmonitoring. TCD ultrasonography is essential to document unquestionably theestablishment of measurable selective antegrade or retrograde perfusion of the cere-bral cortex. However, a measure of cortical function is needed to optimize ¯ow rate.Unnecessarily high ¯ow may increase the risk of haemorrhage, while inadequate ¯owmay eventually lead to ischaemic injury. Thus, once TCD monitoring has documented¯ow initiation, the actual ¯ow rate, temperature, oxygen and carbon dioxide tensionsmay be precisely titrated to just prevent a CVOS drop.
CVOS recording has also shown that the riskiest time of the procedure for hypoxicbrain injury is not during circulatory arrest but near the end of rewarming. It is at thistimewhen the lowest CVOS values may be recorded (Figure 25), most likely as a resultof vasoneural uncoupling. Although absolute blood ¯ow values may appear withinnormal limits according to TCD, xenon or single photon emission computerizedtomography measures, it may be insu�cient to meet the hypernormal metabolicdemand of the rewarmed brain. This vasoneural uncoupling has been visualized in head-injured patients using functional magnetic resonance imaging of cerebral oxyhaemo-globin distribution.107 Vasoparesis may be minimized by avoiding rapid cooling andunnecessarily low cranial temperatures, while cerebral hypermetabolism may beprevented by slow rewarming with in¯ow temperature limited to 378C.
Arrest Rewarm
55
50
45
40
359:30 10:00 10:30 11:00 11:30
CV
OS
Figure 25. This CVOS trend characterizes the typical changes seen with rapid cooling and rewarmingassociated with a period of deep hypothermic circulatory arrest. Note that the lowest CVOS values occurduring rewarming, not during arrest. In this case, the desaturation was reversed by reducing cerebralmetabolic demand to an EEG burst-suppression pattern with propofol and conversion of hypo- tonormocapnia. TCD ultrasonography con®rmed a subsequent increase in MCA ¯ow velocity.
Neurophysiological monitoring in vascular surgery 57

CONCLUSION
This chapter has reviewed several techniques available for monitoring the CNS duringvascular procedures. We have demonstrated that the electrophysiological monitors(EEG, evoked potentials) are characterized by high speci®city and negative predictivevalues. The sensitivity and positive predictive values are lower as synaptic function islost in advance of the reduced blood ¯ows necessary for cellular death. On the otherhand, TCD monitoring and transcranial oximetry continue to supply haemodynamicinformation after synaptic information is lost. Like evoked responses, which monitorselect neural pathways, TCD ultrasonography surveys ¯ow in the major conduitarteries at the base of the brain. Nevertheless, TCD monitoring can di�erentiateembolic phenomena from other causes of decreased CNS blood ¯ow. Transcranialoximetry, at this point in its development, measures change in cerebral oxygenationsaturation in the frontal cortex which includes the watershed area between the middleand anterior cerebral arteries. The technique remains blind to the circulation in theposterior aspects of the cortex.
Each of the discussed techniques, similarly, varies in the prerequisite training andskill required of clinicians interested in their use. As each monitor gives a di�erentappraisal of thewell-being of the CNS, the combined use of these monitors may be themost informative with respect to detecting changes in cerebral perfusion and de®ningits cause. Ultimately the latter approach should lead to the use of rational correctivemeasures whenever possible.97,106
REFERENCES
1. Astrup J. Energy-requiring cell functions in the ischemic brain. Journal of Neurosurgery 1982; 56:482±487.
2. Michenfelder JD, Milde JH & Katusic ZS. Postischemic canine cerebral blood ¯ow is coupled to cerebralmetabolic rate. Journal of Cerebral Blood Flow Metabolism 1991; 11: 611±616.
3. Astrup J. Cortical evoked potential and extracellular K� and H� at critical levels of brain ischemia.Stroke 1977; 8: 51±57.
4. Branston NM, Ladds A, Symon L, Wang AD et al. Comparison of the e�ects of ischaemia on earlycomponents at the somatosensory evoked potential in brainstem, thalamus, and cerebral cortex. Journalof Cerebral Blood Flow Metabolism 1984; 4: 68±81.
5. Verhaegen M, Iaizzo PA & Todd MM. A comparison of the e�ects of hypothermia, pentobarbital, andiso¯urane cerebral energy stores at the time of ischemic depolarization. Anesthesiology 1995; 82:1209±1215.
6. Beal MF. Excitotoxicity. In Albin MS (ed.) Textbook of Neuroanesthesia with Neurosurgical andNeuroscience Perspectives, pp 541±556. New York: McGraw-Hill, 1997.
7. Obrenovitch TP, Urenjak J, Richards DA et al. Extracellular neuroactive amino acids in the rat striatumduring ischaemia: comparison between penumbral conditions and ischaemia with sustained anoxicdepolarization. Journal of Neurochemistry 1993; 61: 178±186.
8. Peruche B, Klaassens H & Krieglstein J. Quantitative analysis of the electrocorticogram after forebrainischemia in the rat. Pharmacology 1995; 50: 229±237.
9. Komatsumoto S, Greenberg JH, Hickey WF & Reivich M. Clinicopathological observations in middlecerebral artery occlusion in the cat. Neurology Research 1995; 17: 120±128.
10. Allen BC. A clinical study of the parameters and e�ects of temporary arterial occlusion in themanagement of intracranial aneurysms. Neurosurgery 1994; 34: 22±28.
11. Collice M, Arena O, Fontana RA et al. Role of the EEG monitoring and cross-clamping duration incartoid endarterectomy. Journal of Neurosurgery 1986; 65: 815±819.
12. Speckmann E-J & Elger CE. Introduction to the neurophysiological basis of the EEG and DC potentials.In Niedermeyer E & Lopes da Silva F (eds) Electroencephalography: Basic Principles, Clinical Applications,and Related Fields, 3rd edn. pp 15±26. Baltimore, MD: Williams and Wilkins, 1993.
58 L. D. Gugino et al

13. Steriade M. Cellular substrates of brain rhythms. In Niedermeyer E & Lopes da Silva F (eds)Electroencephalography: Basic Principles, Clinical Applications, and Related Fields, 3rd edn. pp 27±62.Baltimore, MD: Williams and Wilkins, 1993.
14. Cooper R, Winter AL, Crow HJ & Walter WG. Comparison of subcortical and scalp activity usingchronically indwelling electrodes in man. Electroencephalograpy and Clinical Neurophysiology 1965; 18:217±228.
15. Hjorth B. An on-line transformation of EEG scalp potentials into orthogonal source derivations.Electroencephalography and Clinical Neurophysiology 1975; 39: 526±530.
16. Rampil IJ. A primer for EEG signal processing in anesthesia. Anesthesiology 1998; 89: 980±1002.17. Lopes da Silva F. Dynamics of EEGs as signals of neuronal populations: models and theoretical
considerations. In Niedermeyer E & Lopes da Silva F (eds) Electroencephalography: Basic Principles,Clinical Applications, and Related Fields, 3rd edn. pp 763±776. Baltimore, MD: Williams and Wilkins,1993.
18. McCormick DA. Neurotransmitter actions in the thalamus and cerebral cortex and their role inneuromodulation activity. Progressive Neurobiology 1992; 39: 337±388.
19. Prince DA & Shanzer S. E�ects of anesthetics upon the EEG response to reticular stimulation. Patternsof slow synchrony. Electroencephalography and Clinical Neurophysiology 1966; 21: 578±588.
20. Niedermeyer E. The normal EEG of the waking adult. In Niedermeyer E & Lopes da Silva F (eds)Electroencephalography: Basic Principles, Clinical Applications, and Related Fields, 3rd edn. pp 131±152.Baltimore, MD: Williams and Wilkins, 1993.
21. Kisimoto I, Kadoya C & Sneyd C. Topographic electroencephalogram of propofol induced conscioussedation. Clinical Pharmacology and Therapeutics 1995; 58: 665±674.
22. BlumeWT& Sharbrough FW. EEGmonitoring during carotid endarterectomy and open heart surgery.In Niedermeyer E & Lopes da Silva F (eds) Electroencephalography: Basic Principles, Clinical Applications,and Related Fields, 3rd edn. pp 747±756. Baltimore, MD: Williams and Wilkins, 1993.
23. Tempelho� R, Modica PA, Grubb RL et al. Selective shunting during carotid endarterectomy based ontwo-channel computerized electroencephalographic/compressed spectral array analysis. Neurosurgery1989; 24(3): 339±344.
24. Markand ON. Continuous assessment of cerebral function with EEG and somatosensory evokedpotential techniques during extracranial vascular reconstruction. In Loftus CM & Traynelis VC (eds)Intraoperative Monitoring Techniques in Neurosurgery, pp 19±32. New York: McGraw-Hill, 1994.
25. Sundt TM, Sharbrough FW, Piepgras DG et al. Correlation of cerebral blood ¯ow andelectroencephalographic changes during carotid endarterectomy. Mayo Clinic Proceedings 1981; 56:533±543.
26. Morawetz RB, Zeiger HE, McDowell HA et al. Correlation of cerebral blood ¯ow and EEG duringcarotid occlusion for endarterectomy (without shunting) and neurologic outcome. Surgery 1984;184±189.
27. Michenfelder JD, Sundt TM, Fode F et al. Iso¯urane when compared to en¯urane and halothanedecreases the frequency of cerebral ischemia during carotid endarterectomy. Anesthesiology 1987; 67:336±340.
28. Yerhaegen MJ, Todd MM & Warner DS. A comparison of cerebral ischemic ¯ow thresholds duringhalothane/N2O and iso¯urane/N2O anesthesia in rats. Anesthesiology 1992; 76: 743±754.
29. Rampil IJ, Holzer JA, Quest DO et al. Prognostic value of computerized EEG analysis during carotidendarterectomy. Anesthesia and Analgesia 1983; 62: 186±192.
30. Hanowell LH, Soriano S & Bennett HL. EEG power changes are more sensitive than spectral edgefrequency variation for detection of cerebral ischemia during carotid artery surgery: a prospectiveassessment of processed EEG monitoring. Journal of Cardiothoracic and Vascular Anesthesia 1992; 6(3):292±294.
31. Riggs HE & Rupp C. Variations in the form of the circle of Willis. Archives of Neurology 1963; 8: 24±30.32. Schwartz RB, Jones KM, LeClercq GT et al. The value of cerebral angiography in predicting cerebral
ischemia during carotid endarterectomy. American Journal of Radiology 1992; 159: 1057±1061.33. Whittemore AD, Kau�man JL, Kohler TR & Mannick JA. Routine electroencephalographic (EEG)
monitoring during carotid endarterectomy. Annals of Surgery 1983; 197(6): 707±713.34. Chiappa KH, Burke SR & Young RR. Results of electroencephalographic monitoring during 367 carotid
endarterectomies. Stroke 1979; 10(4): 381±388.35. Redekop G & Ferguson G. Correlation of contralateral stenosis and intraoperative electroencephalo-
gram change with risk of stroke during carotid endarterectomy. Neurosurgery 1992; 30(2): 191±194.36. Ferguson GG. Carotid endarterectomy. To shunt or not to shunt? Neurology 1986; 43: 615±616.37. Zampella E, Morawetz RB, Holt A et al. The importance of cerebral ischemia during carotid
endarterectomy. Neurosurgery 1991; 29(5): 727±731.
Neurophysiological monitoring in vascular surgery 59

38. Kresowik TF, Worsey MJ, Khoury MD et al. Limitations of electroencephalographic monitoring in thedetection of cerebral ischemia during carotid endarterectomy. Journal of Vascular Surgery 1991; 13:439±443.
39. Baker AB & Roxburgh AJ. Computerised EEG monitoring for carotid endarterectomy. AnesthesiaIntensive Care 1986; 14: 32±36.
40. Ahn SS, Jordan SE, Nuwer MR et al. Computed electroencephalographic topographic brain mapping.Journal of Vascular Surgery 1988; 8: 247±254.
41. Sloan TB. Evoked potentials. In Albin MS (ed.) Textbook of Neuroanesthesia with Neurosurgical andNeuroscience Perspectives, pp 221±276. New York: McGraw-Hill, 1997.
42. Gugino V & Chabot RJ. Somatosensory evoked potentials. International Anesthesiology Clinics 1990;28(3): 154±164.
43. Parent A. Spinal Cord: ®ber tracts. In Coryell P (ed.) Human Neuroanatomy, 9th edn. pp 368±420.Baltimore, MD: Williams and Wilkins, 1996.
44. Parent A. Blood supply of the central nervous system. In Coryell P (ed.)Human Neuroanatomy, 9th edn.pp 93±131. Baltimore, MD: Williams and Wilkins, 1996.
45. Gentili F, Loughheed WM, Ghate H & Schichuo F. The role of intraoperative monitoring of sensoryevoked potentials during cerebrovascular surgery. In Sukuki J (ed.) Advances in Surgery for CerebralStroke, pp 675±678. Tokyo: Springer, 1988.
46. Lam AM, Manninen PH, Ferguson GG & Nantau W. Monitoring electrophysiologic function duringcarotid endarterectomy: a comparison of somatosensory evoked potentials and conventionalelectroencephalogram. Anesthesiology 1991; 75: 15±21.
47. Horsch S, de Vleeschauwer P & Ktenidis K. Intraoperative assessment of cerebral ischemia duringcarotid surgery. Journal of Cardiovascular Surgery 1990; 31: 599±602.
48. Kearse LA, Brown EN & McPeck K. Somatosensory evoked potential sensitivity relative toelectroencephalography for cerebral ischemia during carotid endarterectomy. Stroke 1992; 23: 498±505.
49. Amantini A, Bartelli M, de Scisciolo G et al. Monitoring of somatosensory evoked potentials duringcartoid endarterectomy. Journal of Neurology 1992; 239: 241±247.
50. Russ W, Fraedrich G, Hehrlein FW & Hempelmann G. Intraoperative somatosensory evoked potentialsas a prognostic factor of neurologic state after carotid endarterectomy. Thoracic and CardiovascularSurgery 1985; 33: L392±L396.
51. Fava E, Bortolani E, Ducati A & Schieppati M. Role of SEP in identifying patients requiring temporaryshunt during carotid endarterectomy. Electroencephalography and Clinical Neurophysiology 1992; 84:426±432.
52. Gigli GL, Caramia M, Marciani MG et al. Monitoring of subcortical and cortical somatosensory evokedpotentials during carotid endarterectomy: comparison with stump pressure levels. Electroencephalo-graphy and Clinical Neurophysiology 1987; 68: 424±432.
53. Haupt WF & Horsch S. Evoked potential monitoring in carotid surgery: a review of 994 cases.Neurology 1992; 42: 835±838.
54. Wadouh F, Arndt C-F, Oppermann E et al. The mechanism of spinal cord injury after simple and doubleaortic cross-clamping. Journal of Thoracic and Cardiovascular Surgery 1986; 92: 121±127.
55. Laschinger JC, Cunningham JN, Nathan IM et al. Experimental and clinical assessment of the adequacyof partial bypass in maintenance of spinal cord blood ¯ow during operations on the thoracic aorta.Annals of Thoracic Surgery 1983; 36(4): 417±426.
56. Svensson LG, Patel V, Robinsoni MF et al. In¯uence of preservation or perfusion of intraoperativelyidenti®ed spinal cord blood supply on spinal motor evoked potentials and paraplegia after aorticsurgery. Journal of Vascular Surgery 1991; 13: 355±365.
57. Grace RR & Mattox KL. Anterior spinal artery syndrome following abdominal aortic aneurysmectomy.Archives of Surgery 1977; 112: 813±815.
58. Cunningham JN, Lashinger JC & Spencer FC. Monitoring of somatosensory evoked potentials duringsurgical procedures on the thoracoabdominal aorta. IV. Clinical observations and results. Journal ofThoracic and Cardiovascular Surgery 1987; 94: 275±285.
59. Gugino LD, Kraus KH, Heino R et al. Peripheral ischemia as a complicating factor duringsomatosensory and motor evoked potential monitoring of aortic surgery. Journal of Cardiothoracic andVascular Anesthesia 1992; 6(6): 715±719.
60. de Haan P, Kalkman CJ, Ubags LH et al. A comparison of the sensitivity of epidural and myogenictranscranial motor evoked responses in the detection of acute spinal cord ischemia in the rabbit.Anesthesia and Analgesia 1996; 83: 1022±1027.
61. Kaplan BJ, FriedmanWA, Alexander JA & Hampson SR. Somatosensory evoked potential monitoring ofspinal cord ischemia during aortic operations. Neurosurgery 1986; 19(1): 82±90.
62. Shimizu H, Shimoji K, Maruyama Y et al. Human spinal cord potentials produced in lumbosacralenlargement by descending volleys. Journal of Neurophysiology 1982; 48: 1108±1120.
60 L. D. Gugino et al

63. Poncelet L, Michaux C & Balligand M. Motor evoked potentials induced by electrical stimulation of thespine in dogs: which structures are involved? Electroencephalography and Clinical Neurophysiology 1995;97: 179±183.
64. Owen JH, Bridwell KH, Shimon SM et al. Sensitivity and speci®city of somatosensory and neurogenic-motor evoked potentials in animals and humans. Spine 1988; 12: 1111±1116.
65. Haghighi S, York D, Gaines R & Oro J. Monitoring of motor tracts with spinal cord stimulation. Spine1994; 19(13): 1518±1524.
66. Deletis V. Intraoperative monitoring of the functional integrity of the motor pathways. In Devinsky O,Beric A & Dogali M (eds) Electrical and Magnetic Stimulation of the Brain and Spinal Cord, vol. 2.pp 201±214. New York: Raven Press, 1993.
67. Maeda S, Miyamoto T, Murata H & Yamashita K. Prevention of spinal cord ischemia by monitoringspinal cord perfusion pressure and somatosensory evoked potentials. Journal of Cardiovascular Surgery1989; 30: 565±571.
68. Galla JD, Ergin MA, Sadeghi AM et al. A new technique using somatosensory evoked potential guidanceduring descending and thoracoabdominal aortic repairs. Journal of Cardiac Surgery 1994; 9: 662±672.
69. Crawford ES, Mizrahi EM, Hess KR et al. The impact of distal aortic perfusion and somatosensoryevoked potential monitoring on prevention of paraplegia after aortic aneurysm operation. Journal ofThoracic and Cardiovascular Surgery 1988; 95: 357±367.
70. Schepens MAAM, Boezeman EHJF, Ruben PHM et al. Somatosensory evoked potentials duringexclusion and reperfusion of critical aortic segments in thoracoabdominal aortic aneurysm surgery.Journal of Cardiac Surgery 1994; 9: 692±702.
71. Shiya N, Yasuda K, Matsui Y et al. Spinal cord protection during thoracoabdominal aortic aneurysmrepair: results of selective reconstruction of the critical segmental arteries guided by evoked spinal cordpotential monitoring. Journal of Vascular Surgery 1995; 21: 970±975.
72. Yamamoto N, Takano H, Kitigawa H et al. Monitoring for spinal cord ischemia by use of the evokedspinal cord potentials during aortic aneurysm surgery. Journal of Vascular Surgery 1994; 20: 826±833.
73. Matsui Y, Goh K, Shiya N et al. Clinical application of evoked spinal cord potentials elicited by directstimulation of the cord during temporary occlusion of the thoracic aorta. Journal of Thoracic andCardiovascular Surgery 1994; 107: 1519±1527.
74. Grabitz K, Sandmann W, StuÈ hmeier K et al. The risk of ischemic spinal cord injury in patientsundergoing graft replacement for thoracoabdominal aortic aneurysms. Journal of Vascular Surgery 1996;23(2): 230±240.
75. StuÈ hmeier K-D, Grabitz K, Mainzer B et al. Use of electrospinogram for predicting harmful spinal cordischemia during repair of thoracic or thoracoabdominal aortic aneurysms. Anesthesiology 1993; 79:1170±1176.
76. Gugino LD, Aglio LS, Segal ME et al. Use of transcranial magnetic stimulation for monitoring spinalcord motor paths. Seminars in Spine Surgery 1997; 9(4): 315±336.
77. Qayumi KA, Janusz MT, Jamieson EW et al. Transcranial magnetic stimulation: use of motor evokedpotentials in the evaluation of surgically induced spinal cord ischemia. Journal of Spinal Cord Medicine1997; 20(4): 395±401.
78. de Haan P, Kalkman CJ, de Mol BA et al. E�cacy of transcranial motor evoked myogenic potentials todetect spinal cord ischemia during operations for thoracoabdominal aneurysms. Journal of Thoracic andCardiovascular Surgery 1997; 113: 87±101.
79. Executive Committee for the Asymptomatic Carotid Atherosclerosis Study. Endarterectomy orasymptomatic carotid artery stenosis. Journal of the American Medical Association 1995; 273: 1421±1428.
80. Moore WS, Barnett HJM, Beebe HG et al. Guidelines for carotid endarterectomy. A multidisciplinarystatement from the ad hoc Committee, American Heart Association. Stroke 1995; 26(1): 188±201.
81. Wober C, Zeitlhofer J, Asenbaum S et al. Monitoring of median nerve somatosensory evoked potentialsin carotid surgery. Journal of Clinical Neurophysiology 1998; 15(5): 429±438.
82. Green RM, Messick WJ, Ricotta JJ et al. Bene®ts, shortcomings and costs of EEG monitoring. Annals ofSurgery 1985; 201(6): 785±792.
83. Nuwer MR. Intraoperative electroencephalography. Journal of Clinical Neurophysiology 1993; 10(4):437±444.
84. Lennard N, Smith J, Dumville J et al. Prevention of postoperative thrombotic stroke after carotidendarterectomy: the role of transcranial Doppler ultrasound. Journal of Vascular Surgery 1997; 26:579±584.
85. Blaber A, Bondar RL, Stein F et al. Transfer function analysis of cerebral autoregulation dynamics inautonomic failure patients. Stroke 1997; 28(9): 1686±1692.
86. Jansen C, Ramos LMP, van Heeswijk JPM et al. Impact of microembolism and hemodynamic changes inthe brain during carotid endarterectomy. Stroke 1994; 25: 992±997.
Neurophysiological monitoring in vascular surgery 61

87. Spencer M. Transcranial Doppler monitoring and causes of stroke from carotid endarterectomy. Stroke1997; 28(4): 685±691.
88. Shen Q, Stuart J, Venkatesh B et al. Inter-observer variability of the transcranial Doppler ultrasoundtechnique: impact of lack of practice on the accuracy of measurement. Journal of Clinical Monitoring andComputing 1999; 15: 179±184.
89. Bass A, Krupski WC, Schneider PA et al. Intraoperative transcranial Doppler: limitations of themethod. Journal of Vascular Surgery 1989; 10: 549±553.
90. Ringelstein EB, Droste DW, Babikian VL et al. Consensus on microembolus detection by TCD. Stroke1998; 29(3): 725±729.
91. Pigula FA, Nemoto EM, Gri�th BP & Siewers RD. Regional low ¯ow perfusion (RLFP) providescerebral circulatory support during neonatal aortic arch reconstruction. Journal of Thoracic andCardiovascular Surgery 1999; 117(5): 1023±1024.
92. Ganze BL, Edmonds HL Jr, Pank JR & Goldsmith LJ. Neurophysiological monitoring to assure deliveryof retrograde cerebral perfusion. Journal of Thoracic and Cardiovascular Surgery 1997; 113: 748±757.
93. Boeckxstaens CJ & FlamengWJ. Retrograde cerebral perfusion does not perfuse the brain in nonhumanprimates. Annals of Thoracic Surgery 1995; 60(2): 319±327.
94. Jobsis FF. Noninvasive, infrared monitoring of cerebral and myocardial oxygen su�ciency andcirculatory parameters. Science 1977; 198: 1264±1267.
95. Kurth CD & Uher B. Cerebral hemoglobin and optical path length in¯uence near-infrared spectro-scopy measurement of cerebral oxygen saturation. Anesthesia and Analgesia 1997; 84(6): 1297±1305.
96. McCormick PW, Stewart M, Goetting MG & Balakrishnan G. Regional cerebrovascular oxygensaturation measured by optical spectroscopy in humans. Stroke 1991; 22(5): 596±602.
97. Edmonds HL Jr, Singer I, Sehic A & Strickland TJ. Multimodality neuromonitoring for neurocardiology.Interventional Cardiology 1998; 11(3): 197±204.
98. Roberts KW, Crnkovic AP & Linneman LJ. Near-infrared spectroscopy detects critical cerebral hypoxiaduring carotid endarterectomy in awake patients. Anesthesiology 1998; 89(3A): A934.
99. Orth VH, Rehm M, Thiel M et al. First clinical implications of perioperative red cell volumemeasurement with a nonradioactive marker. Anesthesia and Analgesia 1998; 87(6): 1234±1238.
100. Brian JE Jr. Carbon dioxide and the cerebral circulation. Anesthesiology 1998; 88: 1365±1386.101. Nollert G, Mohnie P, Tessani-Press P & Reichart B. Determinants of cerebral oxygenation during
cardiac surgery. Circulation 1995; 92 (supplement II): 327±333.102. Adelson PD, Nemoto E, Scheuer M et al. Noninvasive continuous monitoring of cerebral oxygenation
peri-ictally using near-infrared spectroscopy. Epilepsia (in press).103. Saito S, Miyoshi S, Yoshikawa D et al. Regional cerebral oxygen saturation during electroconvulsive
therapy: monitoring by near-infrared spectrophotometry. Anesthesia and Analgesia 1996; 83(4):726±730.
104. Lang J, Pollard V, Early T & Mathru M. Cerebral oxygenation is preserved during electrically inducedseizures in humans. Anesthesia and Analgesia 1997; 84(2S): S364.
105. Woodforth IJ, Hicks RG, Crawford WR et al. Electroencephalographic evidence of seizure activityunder deep sevo¯urane anesthesia in a nonepileptic patient. Anesthesiology 1997; 87(4): 1579±1582.
106. Cho H, Nemoto EM, Yonas H et al. Cerebral monitoring by means of oximetry and somatosensoryevoked potentials during carotid endarterectomy. Journal of Neurosurgery 1998; 89: 533±538.
107. Bergsneider MA, Hovda DA, Shalmon E et al. Cerebral hyperglycolysis following severe humantraumatic brain injury: a positron emission tomography study. Journal of Neurosurgery 1997; 86: 241±251.
62 L. D. Gugino et al


