Embed Size (px)
Citation preview
1
New Steroidal Saponins from Rhizomes of Trillium govanianum: Gram
Scale Isolation and Acetylcholinesterase Inhibitory Activity Evaluation
Prithvi Pal Singh,a,b Patil Shivprasad Suresh,a Anmol, a,b and Upendra Sharmaa,b*
aChemical Technology Division CSIR-Institute of Himalayan Bioresource Technology,
Palampur, Himachal Pradesh, 176061, India.
bAcademy of Scientific and Innovative Research (AcSIR), Ghaziabad-201002, India
Correspondence: Dr. Upendra Sharma, Chemical Technology Division, CSIR-Institute of
Himalayan Bioresource Technology, Palampur, Himachal Pradesh-176061, INDIA
E-mail: [email protected]; [email protected]
2
Abstract
Three previously unknown steroidal saponins named as govanoside C-E (1-3) along with
four known compounds, govanoside B (4), protodioscin (5), 20β-hydroxyecdysone (6), and
polypodine B (7) have been isolated from the rhizomes of Trillium govanianum Wall. ex D.Don.
The structures of isolated compounds were elucidated by detailed analysis of 1D and 2D NMR,
mass and IR spectroscopic data. Compounds 1 and 2 contained a rare sugar moiety i.e. 6-deoxy
allose, while compound 3 has acetylated rhamnose moiety in its glycone part. Acid hydrolysis of
new compounds followed by derivatization for GC analysis of glycone moieties was carried out
for the confirmation of monomer saccharides present in each molecule. In addition, we have
developed a protocol for the isolation of major steroidal saponin present in the rhizomes of
Trillium govanianum i.e. borassoside E in gram scale. Parent extract, fractions and all pure
molecules were screened to evaluate their antagonistic effects on acetylcholinesterase activity.
Among extract and fractions, water fraction (IC50 value: 90.2 μg/ mL) was found most active
whereas among pure molecules govanoside E (3) (IC50 value: 8.62 μM) was found most active
against acetylcholinesterase. The molecular docking analysis was also carried out to further
study the molecular interactions and binding free energy of the pure molecules with
acetylcholinesterase.
Keywords: Trillium govanianum, steroidal saponins, acetylcholinesterase, molecular docking,
enrichment protocol.
3
1. Introduction
Trillium govanianum Wall. ex D.Don commonly known as “Nag Chhatri” (Melanthiaceae)
has been traditionally utilized as Ayurvedic medicine for treating inflammation and pain related
ailments (Sharma et al., 2014). The scatter distribution of this herb has been observed at 2500-
4000 m altitude of the Himalaya ranging from Hindu Kush mountain ranges of Afganisthna to
the North-Eastern part of India (Singh et al., 2017). This plant has not been much
phytochemically explored for its pure constituents, as till date merely thirteen molecules are
reported (Patil et al., 2021a; Bora et al., 2021). Earlier phytochemical studies reveled that
steroidal saponins are the principle phytoconstituents of this plant (Rahman et al., 2015; Singh et
al., 2020a). Recently, we also reported that borassoside E, protodioscin, and govanoside B are
the three major steroidal saponins in the rhizomes of T. govanianum (Singh et al., 2020b). Most
of the bioactivity studies on this plant have been carried out with the extract and fractions
including anti-inflammatory (Rahman et al., 2016), anticancer (Khan et al., 2016), anti-fertility
(Sharma et al., 2018), anti-leishmanial (Khan et al., 2018), antioxidant (Kundra et al., 2020),
anti-microbial (Verma et al., 2021), antidiarrheal and antispasmodic (Muhammad et al., 2021).
Few reports are documented on the bioactivities evaluation of pure compounds, which includes
antifungal (Rahman et al., 2015), insecticidal (Dolma et al., 2021), pro-diabetic enzymes
inhibitory (Patil et al., 2021b), and anti-inflammatory (Patil et al., 2021c) activities.
In continuation of our study on phytochemical and pharmacological investigation of T.
govanianum (Singh et al., 2020a and 2020b; Dolma et al., 2021; Patil et al., 2021b and 2021c)
we here with report isolation and characterization of three previously unknown steroidal
saponins named as govanoside C (1), govanoside D (2), and govanoside E (3) along with four
known compounds, govanoside B (4), protodioscin (5), 20β-hydroxyecdysone (6), and
polypodine B (7) from the rhizomes of Trillium govanianum. The parent extract, fractions, and
all pure molecules were in vitro evaluated for their antagonistic effects on acetylcholinesterase
activity. Molecular docking study was also carried out to analyze the molecular interactions and
binding free energy of the pure molecules with acetylcholinesterase. In addition, we have also
developed a simple protocol for the gram scale isolation of major compound present in this plant
i.e. borassoside E with >98% purity.
2. Result and Discussion
2.1 Isolation and characterization of phytomolecules
4
The water and n-butanol fraction was subjected to column chromatography to afford
govanoside C (1), govanoside D (2), govanoside B (4), and protodioscin (5) from the water
fraction, whereas govanoside E (3), 20β-hydroxyecdysone (6), and polypodine B (7) were
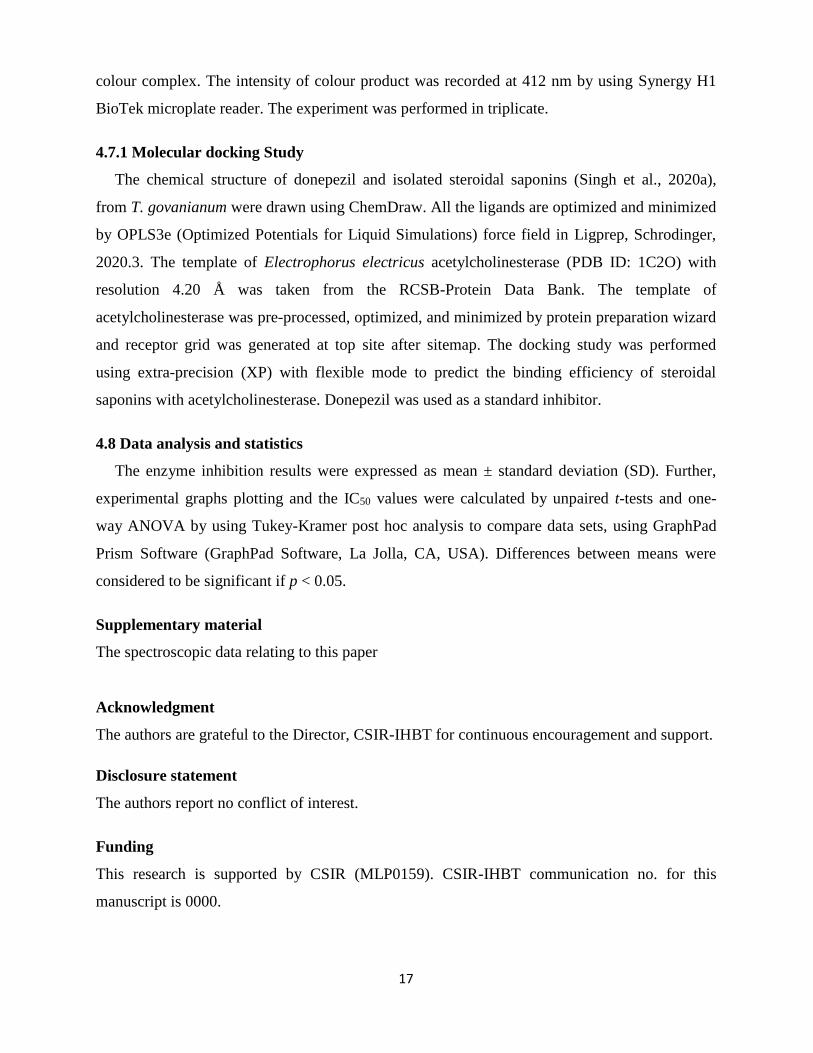
isolated from the n-butanol fraction (Fig. 1). The mono-saccharides present in the glycone
moieties were confirmed by NMR and then acid hydrolysis followed by GC analysis.
Compound 1 was isolated as a white amorphous powder with specific rotation [α]20D= -35.6º
(c = 0.003, CH3OH). The molecular formula for the compound 1 was determined as C50H78O24
from its observed sodiated molecular ion peak at m/z 1085.4768 [M+Na]+ (calculated for
C50H78O24Na+ as 1085.4775) in the HR-ESI-MS spectra (Fig. S11). IR spectrum of compound 1
(Fig. S10) exhibited bands at υmax 3358.07 cm-1 (hydroxy group), 2899.01 cm-1 (C-H group),
1643.35 cm-1 (olefinic group), and 1035.77 cm-1 (alcoholic C-O group). 1H NMR spectrum of
compound 1 (Fig. S1) exhibited characteristic signals for two methyl groups at δH 0.93 (3H, s)
and 1.09 (3H, s), one endo-cyclic olefinic proton at δH 5.56 (1H, d, J = 5.8 Hz), two exo-cyclic
methylene proton at δH 4.99 (1H, br s) and δH 5.10 (1H, br s), respectively. Also the 13C NMR
spectrum of compound 1 (Fig. S2) exhibited a total of fifty signals: twenty-seven signals
correspond to the aglycone portion and remaining twenty-three signals correspond to the glycone
part. Comparison of 13C with DEPT-135 spectrum (Fig. S3) revealed the presence of four
methyl, eleven methylene, thirty methine, and five quaternary carbon signals.
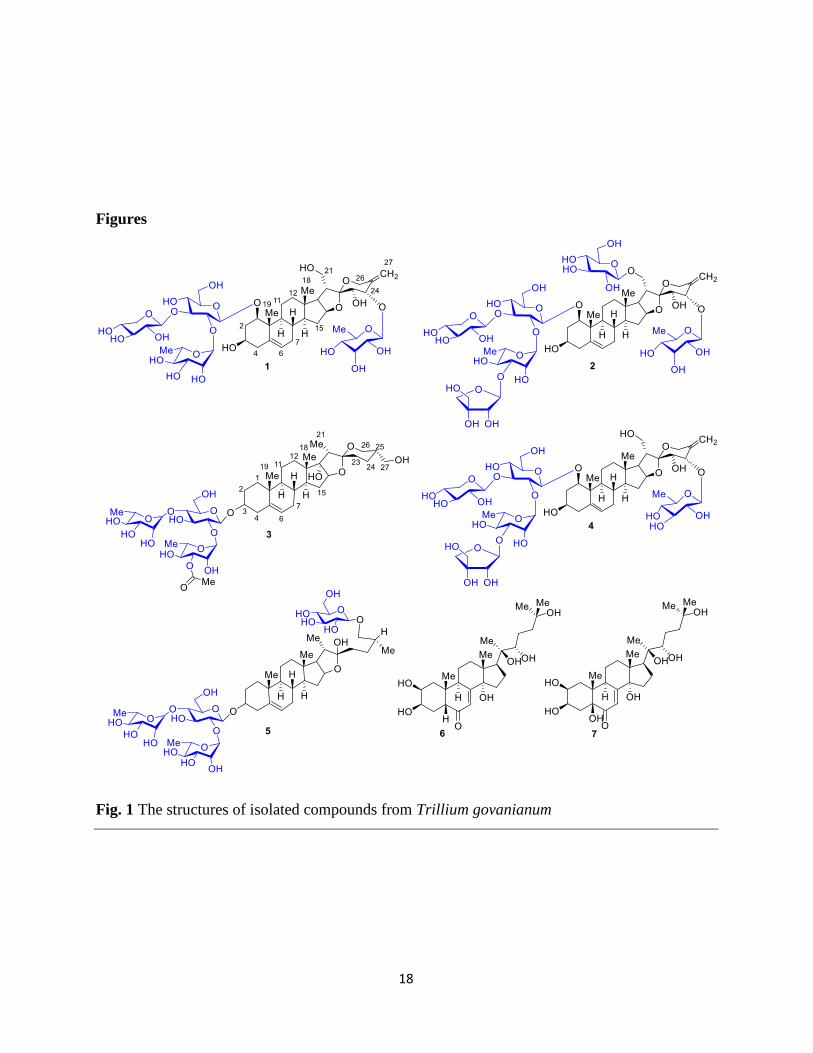
The aglycon moiety was confirmed by the hetero-nuclear correlations (HSQC, HMBC) and
homo-nuclear correlations (COSY). The olefinic proton at 5.56 (1H, d, J= 5.8Hz) showed the
HSQC correlation with δC 126.0 (C-6) (Fig. S6), and HMBC correlations (Fig. S5) with δC 32.6
(C-7), δC 34.1 (C-8), and δC 43.3 (C-10). The proton signal at δH 3.50 (H-1) showed the HMBC
correlation with δC 43.3 (C-10), δC 15.3 (C-19) δC 69.1 (C-3), and δH 2.08 (H-2) with δC 84.7 (C-
1), δC 69.1 (C-3), δC 43.4 (C-4) (Fig. 2). Also the positions of protons were confirmed by COSY
1H-1H correlations for δH 3.50 (H-1) with 1.73 (H-2a)/δH 2.08 (H-2b), and δH 3.37 (H-3) with δH
2.21 (H-4a)/δH 2.23 (H-4b), respectively (Fig. 2). The downfield shifts in the values at δC 84.7
(C-1); δH3.50 (H-1) and δC 69.1 (C-3); δH 3.37 (H-3) indicated the presence of hydroxyl or
glycosidic substitutions at these positions. The quaternary carbon at δC 111.9 (C-22) showed the
HMBC correlation with H-21 (δH 3.52), H-23 (δH 3.74), and H-24 (δH 4.29). The deshielded
value at these positions indicated the presence of hydroxyl groups at C-21 (δC 62.8), C-23 (δC
72.1), and C-24 (δC 83.3). The two singlet protons at δH 4.99 (H-27a) and δH 5.10 (H-27b, CH2)
correlating with 114.0 in HSQC and with δC 83.3 (C-24), δC144.4 (C-25), δC 62.1 (C-26) in
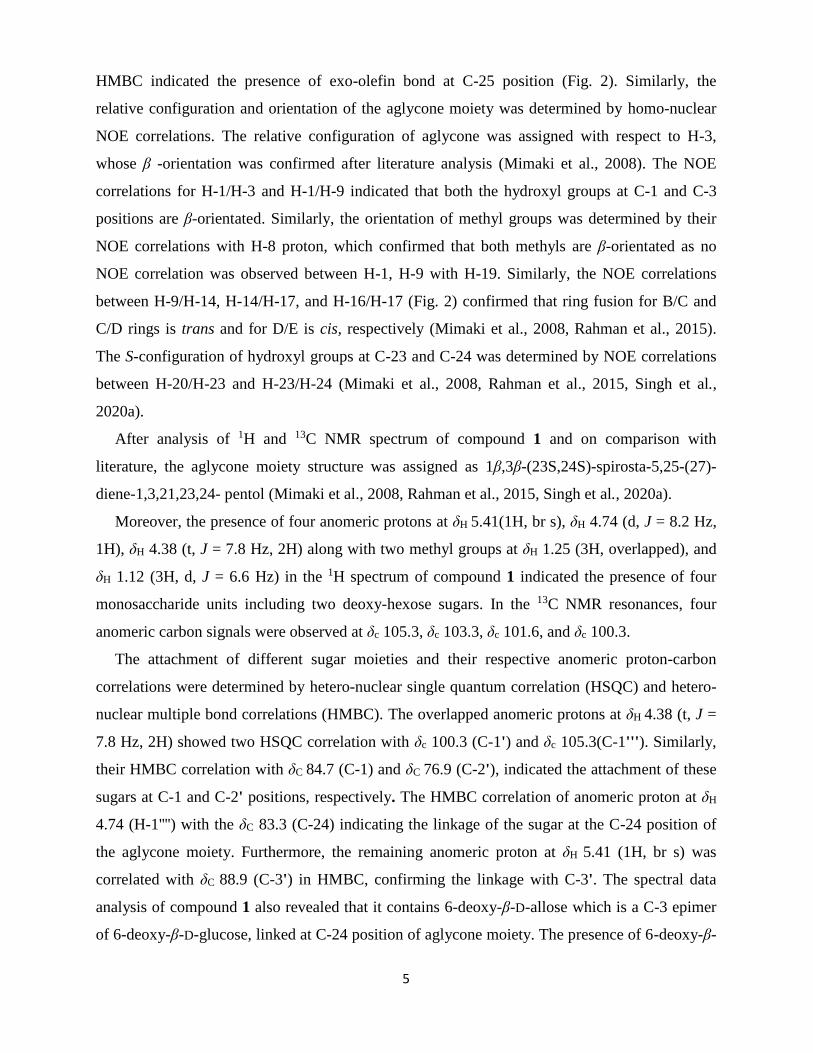
5
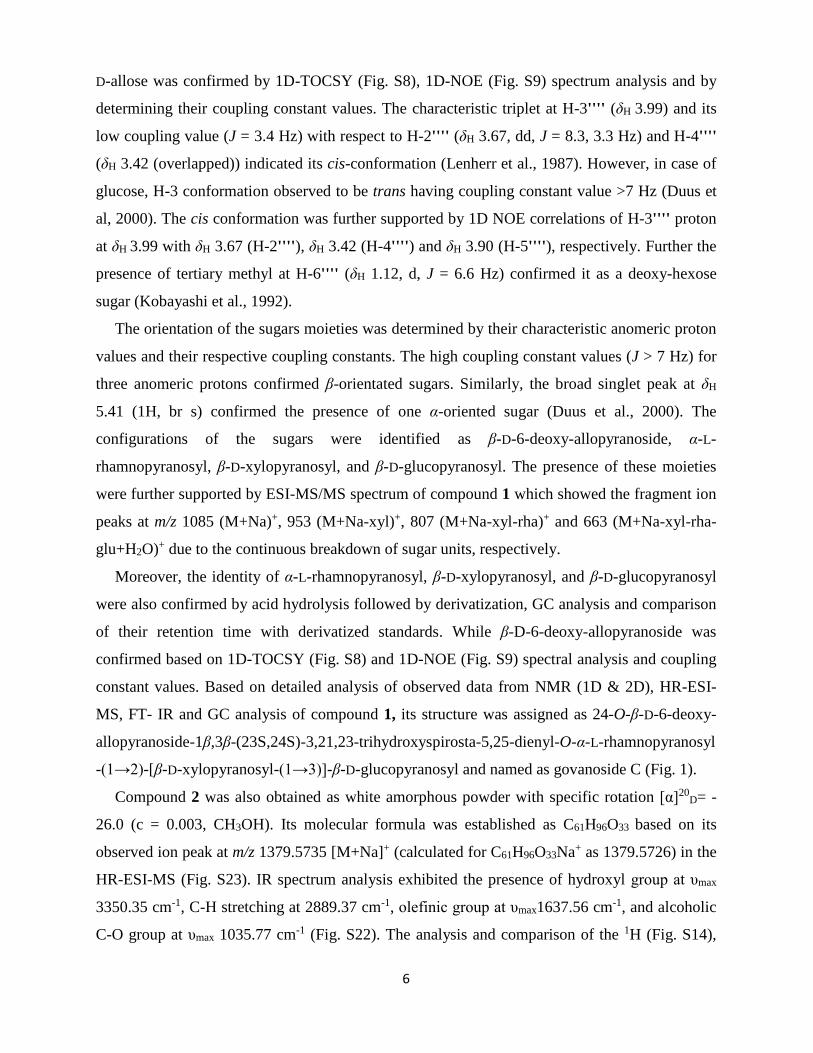
HMBC indicated the presence of exo-olefin bond at C-25 position (Fig. 2). Similarly, the
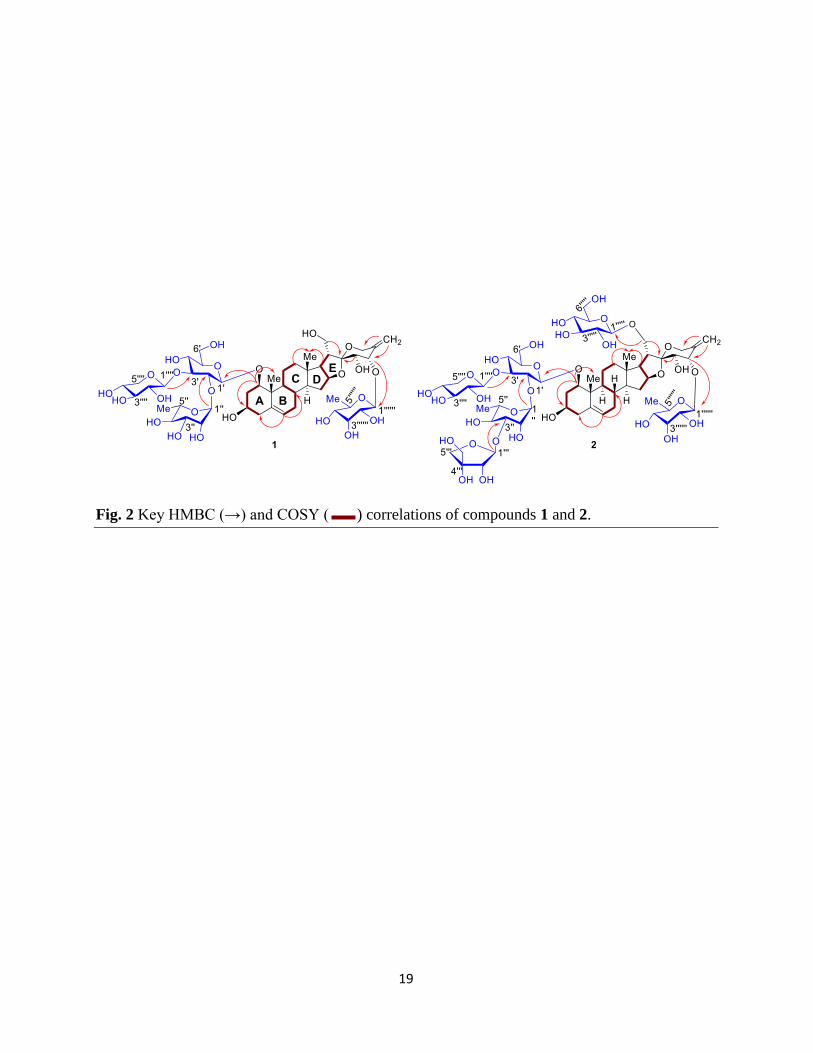
relative configuration and orientation of the aglycone moiety was determined by homo-nuclear
NOE correlations. The relative configuration of aglycone was assigned with respect to H-3,
whose β -orientation was confirmed after literature analysis (Mimaki et al., 2008). The NOE
correlations for H-1/H-3 and H-1/H-9 indicated that both the hydroxyl groups at C-1 and C-3
positions are β-orientated. Similarly, the orientation of methyl groups was determined by their
NOE correlations with H-8 proton, which confirmed that both methyls are β-orientated as no
NOE correlation was observed between H-1, H-9 with H-19. Similarly, the NOE correlations
between H-9/H-14, H-14/H-17, and H-16/H-17 (Fig. 2) confirmed that ring fusion for B/C and
C/D rings is trans and for D/E is cis, respectively (Mimaki et al., 2008, Rahman et al., 2015).
The S-configuration of hydroxyl groups at C-23 and C-24 was determined by NOE correlations
between H-20/H-23 and H-23/H-24 (Mimaki et al., 2008, Rahman et al., 2015, Singh et al.,
2020a).
After analysis of 1H and 13C NMR spectrum of compound 1 and on comparison with
literature, the aglycone moiety structure was assigned as 1β,3β-(23S,24S)-spirosta-5,25-(27)-
diene-1,3,21,23,24- pentol (Mimaki et al., 2008, Rahman et al., 2015, Singh et al., 2020a).
Moreover, the presence of four anomeric protons at δH 5.41(1H, br s), δH 4.74 (d, J = 8.2 Hz,
1H), δH 4.38 (t, J = 7.8 Hz, 2H) along with two methyl groups at δH 1.25 (3H, overlapped), and
δH 1.12 (3H, d, J = 6.6 Hz) in the 1H spectrum of compound 1 indicated the presence of four
monosaccharide units including two deoxy-hexose sugars. In the 13C NMR resonances, four
anomeric carbon signals were observed at δc 105.3, δc 103.3, δc 101.6, and δc 100.3.
The attachment of different sugar moieties and their respective anomeric proton-carbon
correlations were determined by hetero-nuclear single quantum correlation (HSQC) and hetero-
nuclear multiple bond correlations (HMBC). The overlapped anomeric protons at δH 4.38 (t, J =
7.8 Hz, 2H) showed two HSQC correlation with δc 100.3 (C-1') and δc 105.3(C-1'''). Similarly,
their HMBC correlation with δC 84.7 (C-1) and δC 76.9 (C-2'), indicated the attachment of these
sugars at C-1 and C-2' positions, respectively. The HMBC correlation of anomeric proton at δH
4.74 (H-1'''') with the δC 83.3 (C-24) indicating the linkage of the sugar at the C-24 position of
the aglycone moiety. Furthermore, the remaining anomeric proton at δH 5.41 (1H, br s) was
correlated with δC 88.9 (C-3') in HMBC, confirming the linkage with C-3'. The spectral data
analysis of compound 1 also revealed that it contains 6-deoxy-β-D-allose which is a C-3 epimer
of 6-deoxy-β-D-glucose, linked at C-24 position of aglycone moiety. The presence of 6-deoxy-β-
6
D-allose was confirmed by 1D-TOCSY (Fig. S8), 1D-NOE (Fig. S9) spectrum analysis and by
determining their coupling constant values. The characteristic triplet at H-3'''' (δH 3.99) and its
low coupling value (J = 3.4 Hz) with respect to H-2'''' (δH 3.67, dd, J = 8.3, 3.3 Hz) and H-4''''
(δH 3.42 (overlapped)) indicated its cis-conformation (Lenherr et al., 1987). However, in case of
glucose, H-3 conformation observed to be trans having coupling constant value >7 Hz (Duus et
al, 2000). The cis conformation was further supported by 1D NOE correlations of H-3'''' proton
at δH 3.99 with δH 3.67 (H-2''''), δH 3.42 (H-4'''') and δH 3.90 (H-5''''), respectively. Further the
presence of tertiary methyl at H-6'''' (δH 1.12, d, J = 6.6 Hz) confirmed it as a deoxy-hexose
sugar (Kobayashi et al., 1992).
The orientation of the sugars moieties was determined by their characteristic anomeric proton
values and their respective coupling constants. The high coupling constant values (J > 7 Hz) for
three anomeric protons confirmed β-orientated sugars. Similarly, the broad singlet peak at δH
5.41 (1H, br s) confirmed the presence of one α-oriented sugar (Duus et al., 2000). The
configurations of the sugars were identified as β-D-6-deoxy-allopyranoside, α-L-
rhamnopyranosyl, β-D-xylopyranosyl, and β-D-glucopyranosyl. The presence of these moieties
were further supported by ESI-MS/MS spectrum of compound 1 which showed the fragment ion
peaks at m/z 1085 (M+Na)+, 953 (M+Na-xyl)+, 807 (M+Na-xyl-rha)+ and 663 (M+Na-xyl-rha-
glu+H2O)+ due to the continuous breakdown of sugar units, respectively.
Moreover, the identity of α-L-rhamnopyranosyl, β-D-xylopyranosyl, and β-D-glucopyranosyl
were also confirmed by acid hydrolysis followed by derivatization, GC analysis and comparison
of their retention time with derivatized standards. While β-D-6-deoxy-allopyranoside was
confirmed based on 1D-TOCSY (Fig. S8) and 1D-NOE (Fig. S9) spectral analysis and coupling
constant values. Based on detailed analysis of observed data from NMR (1D & 2D), HR-ESI-
MS, FT- IR and GC analysis of compound 1, its structure was assigned as 24-O-β-D-6-deoxy-
allopyranoside-1β,3β-(23S,24S)-3,21,23-trihydroxyspirosta-5,25-dienyl-O-α-L-rhamnopyranosyl
-(1→2)-[β-D-xylopyranosyl-(1→3)]-β-D-glucopyranosyl and named as govanoside C (Fig. 1).
Compound 2 was also obtained as white amorphous powder with specific rotation [α]20D= -
26.0 (c = 0.003, CH3OH). Its molecular formula was established as C61H96O33 based on its
observed ion peak at m/z 1379.5735 [M+Na]+ (calculated for C61H96O33Na+ as 1379.5726) in the
HR-ESI-MS (Fig. S23). IR spectrum analysis exhibited the presence of hydroxyl group at υmax
3350.35 cm-1, C-H stretching at 2889.37 cm-1, olefinic group at υmax1637.56 cm-1, and alcoholic
C-O group at υmax 1035.77 cm-1 (Fig. S22). The analysis and comparison of the 1H (Fig. S14),
7
13C (Fig. S15), and DEPT (Fig. S16) spectrum of compound 2 with compound 1 indicated that
compound 2 is almost super imposable to compound 1 (Mimaki et al., 2008, Rahman et al.,
2015, Singh et al., 2020a), but the major differences were observed in the E ring of the aglycone
and the number of sugar units in its glycon portion. The downfield shift observed for C-21 (from
62.8 ppm in compound 1 to 70.8 ppm in compound 2) and upfield shift for C-20 (from 46.5 ppm
to 44.2 ppm) suggested an extra glycosylation at C-21 of compound 2.
Compound 2 exhibited six anomeric protons at δH 5.38 (1H, br s), δH 5.19 (d, J = 2.9 Hz, 1H)
δH 4.74 (1H, d, J = 8.3 Hz), δH 4.40 (2H, d, J = 7.6 Hz), δH 4.20 (d, J = 7.3 Hz, 1H) and two
tertiary methyl groups at δH 1.12 (3H, d, J = 6.5 Hz) and 1.25 (3H, d, J = 6.1 Hz), which
indicated the presence of six monosaccharide units including two deoxy-hexose sugars.
Similarly, the 13C spectrum exhibited six anomeric carbons at δc 111.9, 105.4, 105.2, 103.2,
101.5, and 100.3. The linkages of sugars were determined after the complete analysis of HMBC
correlations. The HMBC correlation of anomeric protons at δH 4.40, 2H (H-1', H-1'''') with 84.8
(C-1) and 88.6 (C-3') confirmed the attachment of two sugars at C-1 and C-3' positions in the
structure. Similarly, the major HMBC correlations of anomeric protons at δH 5.38 and δH 4.74
with 77.1 (C-2') and 83.4 (C-24) established their attachments at these positions. The
attachments of these four sugars were similar as in compound 1. Two extra anomeric protons at
δH 4.20 and δH 5.19 in the spectrum of compound 2 suggested the presence of a total six sugars
as compared to compound 1.
The HMBC correlation of anomeric proton at δH 4.20 (H-1''''') with the hydroxy-methylene
carbon at δC 70.8 (C-21) suggested the glycosylation at C-21 position, which was further
supported by the deshielded value at C-21 position. One major difference in the structure of
compound 2 is the presence of β-D-apiofuranosyl linked at C-3'' position, which was confirmed
by the HMBC correlation of anomeric proton at δH 5.19 with δC 80.32 (C-3'') and vice-versa
(Rahman et al., 2015). The presence of β-D-apiofuranosyl was confirmed by its characteristic
signals at δC 111.9 (C-1''') correlating with δH 5.19 (d, J = 2.9 Hz, 1H), one methylene signal at
δC 65.4 (C-3''') correlating with δH 3.61 s (2H) in HSQC and one quaternary carbon at δC 80.30
(C-4''') (Rahman et al., 2015).
The coupling constant values for anomeric protons at δH 4.74 (1H, d, J = 8.3 Hz), δH 4.40 (2H,
d, J = 7.6 Hz), δH 4.20 (d, J = 7.3 Hz, 1H) and δH 5.19 (d, J = 2.9 Hz, 1H) suggested that five
sugar units are β-oriented, while anomeric proton at δH 5.38 (1H, br s) is α-oriented (Duus et al.,
2000, Rahman et al., 2015).
8
The configurations of sugars were identified as β-D-6-deoxy-allopyranoside, β-D-apiofuranosyl,
α-L-rhamnopyranosyl, β-D-xylopyranosyl, and two β-D-glucopyranosyl, which were further
supported by ESI-MS/MS and GC analysis of derivatized product. The ESI-MS/MS spectrum of
compound 2 exhibited fragment ion peaks at m/z 1379 (M+Na)+, 1217 (M+Na-glu)+, 1085
(M+Na-glu-apiose)+, 953 (M+Na-glu-apiose-xyl)+, 807 (M+Na-glu-apiose-xyl-rha)+ and 663
(M+Na-glu-apiose-xyl-rha+H2O)+ due to simultaneous loss of sugar units, respectively.
Similarly acid hydrolysis was done to get the glycone moiety. The comparison of derivatized
hydrolyzed glycone product and available sugar standards also confirmed the presence of α-L-
rhamnopyranosyl, β-D-xylopyranosyl, and β-D-glucopyranosyl in the structure, while the other
two sugars were determined by their literature based NMR data values as discussed above.
After the complete analysis including 1D, 2D-NMR (HSQC, HMBC, COSY, NOE), HR-ESI-
MS, FT- IR and GC analysis of compound 2, the structure was established as 24-O-β-D-6-deoxy-
allopyranoside-21-O-β-D-glucopyranosyl-1β,3β-(23S,24S)-3,23-dihydroxyspirosta-5,25-dienyl-O-
β-D-apiofuranosyl-(1→3)-α-L-rhamnopyranosyl-(1→2)-[β-D-xylopyranosyl-(1→3)]-β-D-
glucopyranosyl and named as govanoside D (Fig 1).
Compound 3 was obtained as white amorphous powder with an optical rotation [α]20D= - 44.0
(c = 0.003, CH3OH). Its molecular formula was calculated as C47H74O19 from its observed
sodiated ionic peak at m/z 965.4712 [M+Na]+ (calculated for C47H74O19Na+ as 965.4717) from
HR-ESI-MS (Fig. S34). IR spectrum showed bands at υmax 3365.78 cm-1, 2931.80 cm-1,
1720.50 cm-1, 1641.42 cm-1 and 1037.70 cm-1,which attributed for O-H stretching, C-H
stretching, C=O stretching, olefinic stretching and C-O stretching, respectively (Fig. S33).
1H (Fig. S26), and 13C (Fig. S27) spectrums revealed that the basic skeleton of compound 3
was quite different from the compound 1 and compound 2. The 1H spectrum of compound 3
showed the presence of one olefinic proton at δH 5.36 (d, J = 4.6 Hz) and three methyl signals at
δH 0.95 s, δH 1.08 s, and δH 1.26 (d, J = 7.1 Hz) for aglycone portion. The presence of one endo-
cyclic olefinic bond, two quaternary and one tertiary methyl signals in the aglycone portion
indicated it as 5,6-spirostanol skeleton. Similarly, the 13C spectrum exhibited a total of forty
seven carbons signals. The analysis of these signals and comparison of 13C with DEPT-135
concluded that among these signals, six signals were attributed to methyl groups, twelve for
methylene, and twenty three for methine carbons, while remaining six were quaternary carbon
signals.
9
The presence of methine carbon values at δC 90.5 (C-16), along with a quaternary carbon at δC
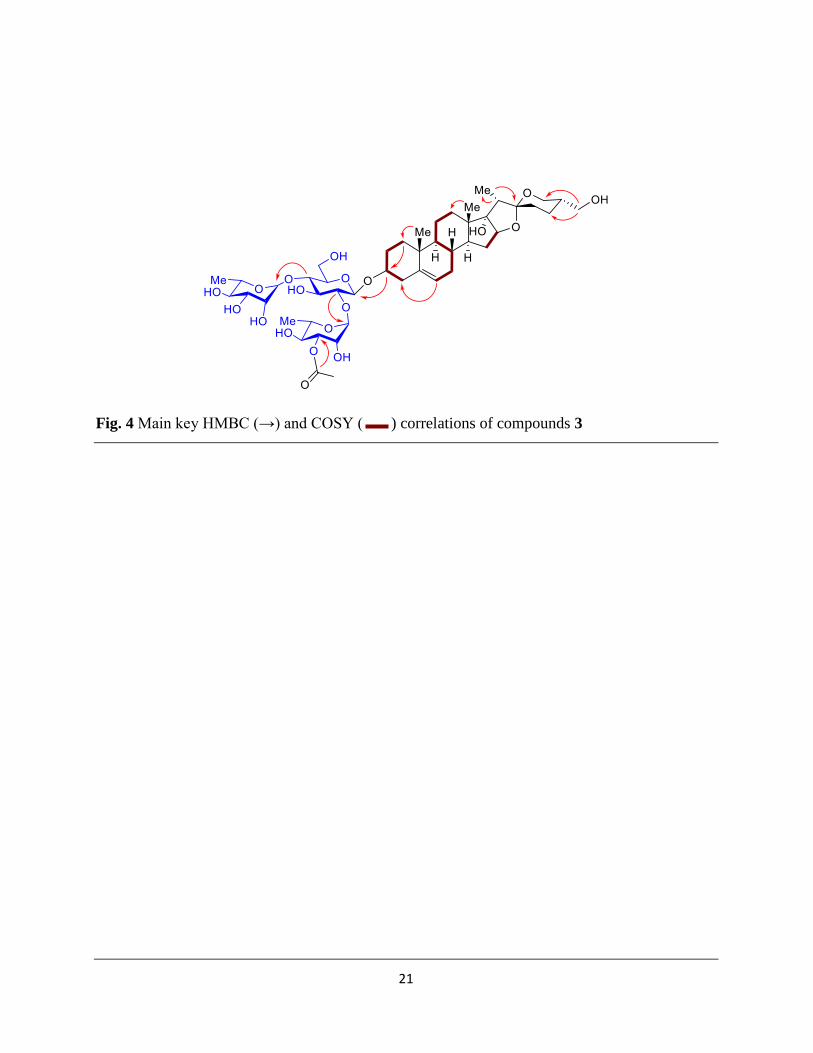
90.6 (C-17) showing HMBC correlation with the neighboring protons at δH 1.54 (m) (H-15a) and
2.22 (m) (H-15b) indicated it as pennogenin type moiety (Ju et al., 1992) (Fig. 4). But an unusual
behavior in the NMR values at δC 64.4 (C-26) and δC 64.8 (C-27) indicated slight change in the
structure from basic Pennogenin skeleton as the DEPT-135 spectrum confirmed two methylene
carbons at C-26 and C-27 positions. Also the deshielded value at δC 64.8 (C-27), indicated the
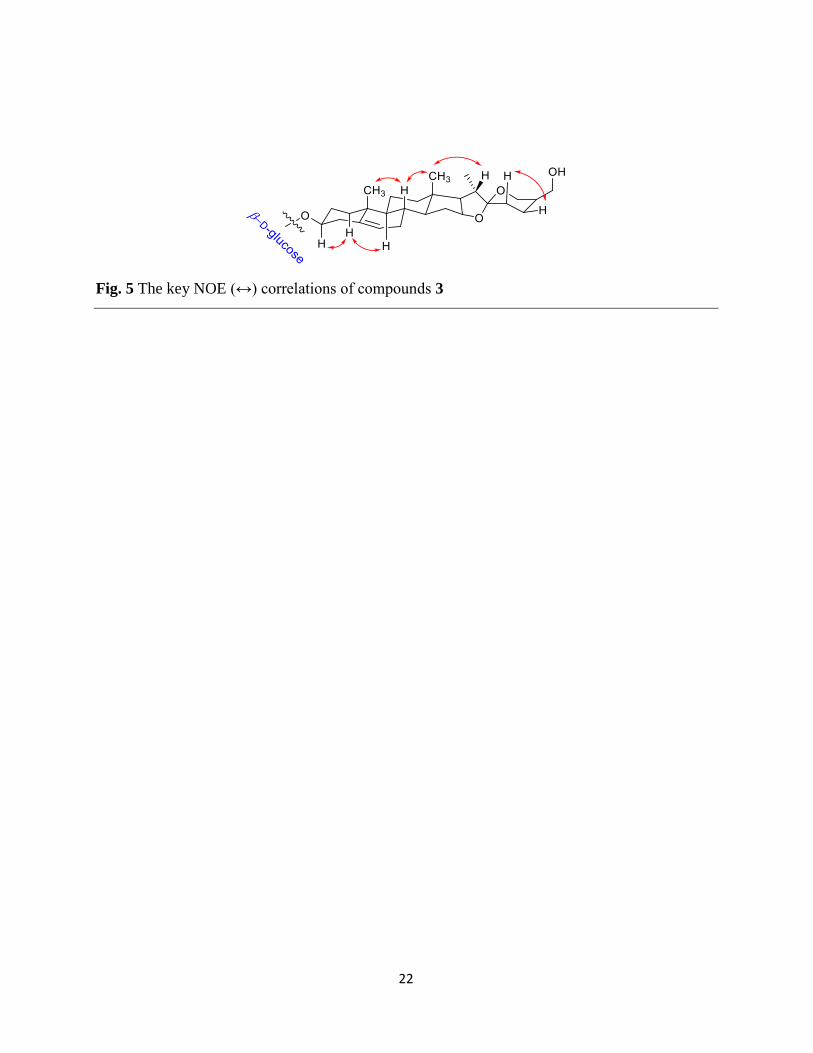
hydroxyl substitution at this position (Ju et al., 1992). The NOE correlations with respect to H-3
were analyzed and used to determine the relative configuration of aglycone skeleton. The methyl
groups were determined to be β-oriented after analyzing the NOE correlation of H-8 with H-18
and H-19. Similarly the ring fusion orientation were determined to be similar as previously
reported skeleton (Ju et al., 1992). After the NMR analysis (1D, 2D including HSQC, HMBC,
COSY, (Fig. 4) and NOE (Fig. 5) and comparison with literature reports aglycone moiety of
compound 3 was identified as (25S)-spirost-5-en-3β,17α,27-triol (Ju et al., 1992).
The 1H spectrum of compound 3 exhibited three anomeric protons at δH 6.38 s, δH 5.89 s, and
δH 5.01 (d, J = 7.6 Hz), and two methyl signals at δH 1.80 (d, J = 6.0 Hz) δH 1.66 (d, J = 6.0 Hz),
attached to tertiary carbons indicated the presence of three sugars including two deoxy-hexose
sugars in the structure. The anomeric proton at δH 5.01 (d, J = 7.6 Hz) correlated with δC100.4 in
HSQC and having HMBC correlation with δC 78.5 (C-3) indicated the glycosidic substitution at
C-3 position of aglycone moiety. The presence of two singlets at δH 6.38 s, and δH 5.89 s and two
methyl groups confirms the presence of two deoxy sugars in the structure. Anomeric protons at
δH 6.38 s (H-1''), 5.89 s (H-1'''') correlated with δC102.5, δC 103.3 in HSQC and in HMBC the
anomeric proton at δH 6.38 s (H-1'') showed correlation with the δC 78.7 (C-2') and 5.89 s (H-
1'''') with δC 78.9 (C-4'), respectively, which confirmed the linkage of the deoxy sugars at C-2'
and C-4' positions (Y. Ju. et. al., 1992). Furthermore, one highly deshielded carbon at δC 171.5
(C-1'''), identified as quaternary carbon after DEPT-135 analysis, showed HMBC correlation
with the singlet methyl signal at δH 1.91s (H-2''') indicated the presence of an acetyl group. The
HMBC correlation of acetyl carbon at δC 171.5 with δH 5.93 (dd, J = 9.7, 2.7 Hz) (H-3'') and the
deshielded value at δC 77.2 (C-3'') confirmed the acetylation at C-3'' position of first deoxy
sugar. Anomeric proton at δH 5.01 (d, J = 7.6 Hz) with a coupling constant value >7.0 Hz
indicated the presence β-oriented sugar, while anomeric protons at δH 6.38 s, and 5.89 s indicated
two α-oriented sugars (Duus et al., 2000). The ESI-MS/MS spectrum of compound 3 exhibited
fragment ion peaks at m/z 965 (M+Na)+, 758 (M+Na-acetyl rha-H2O)+, and 612 (758-rha)+, due
10
to simultaneous loss of acetylated rhamnose and rhamnose sugar moieties, respectively. The
sugars were identified as one β-D-glucopyranoside, and two α-L-rhamnopyranosyl
monosaccharides which were further confirmed by comparing their retention time in GC
analysis after acid hydrolysis with standards.
After the complete analysis of NMR (1D & 2D), HR-ESI-MS, FT-IR and GC analysis, the
structure of compound 3 was assigned as (25S)-spirost-5-en-3β,17α,27-triol-3-O-(3-O-acetyl-α-
L-rhamnopyranosyl-(1-2)]-[α-L-rhamnopyranosyl(l-4)]-β-D-glucopyranoside and named as
govanoside E (Fig. 1).
In addition to these three previously unknown molecules, four known molecules govanoside
B (4) [Singh et al., 2020a] (Fig. S37-S41), protodioscin (5) [Abdel-Sattar et al., 2008] (Fig. S42-
S46), 20β-hydroxyecdysone (6) [Maliński et al., 2021] (Fig. S47-S51), and polypodine B (7)
[Malińskiet al., 2021] (Fig. S52-S56), were also isolated from the water and n-butanol fractions
and identified by the NMR analysis and comparison of their observed spectral data with those
reported in the literature. The purity of all the isolated molecules were found >95% based on
UPLC analysis.
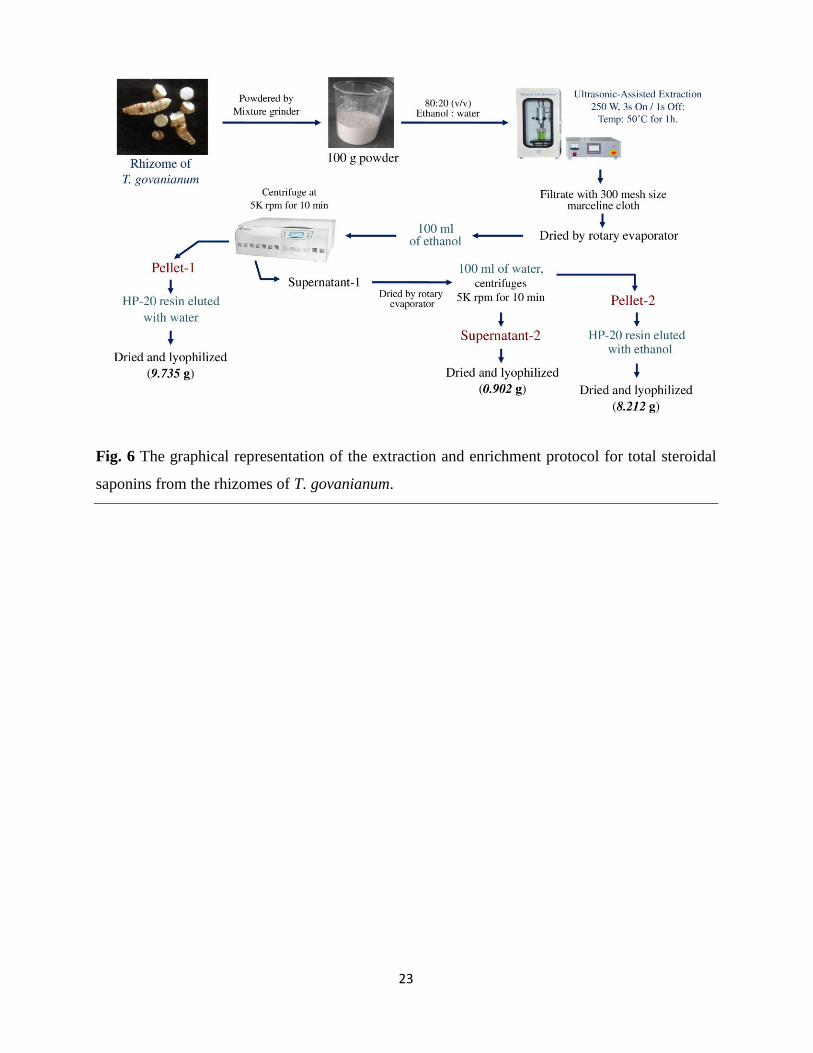
2.3 Protocol for extraction of total steroidal saponins and gram scale isolation of
borassoside E
The ultrasonic-assisted technique was used for the extraction and enrichment of total steroidal
saponins (TSS) from the rhizomes of T. govanianum (Fig. 6). Extraction was performed using
green solvents such as water and ethanol. Three final sub-fractions were collected i.e., pellet-1,
pellet-2, and supernatant-2 (Fig. S63). The TSS content in the collected sub-fractions was
estimated using the anisaldehyde-sulphuric acid-based spectroscopic method. This analysis
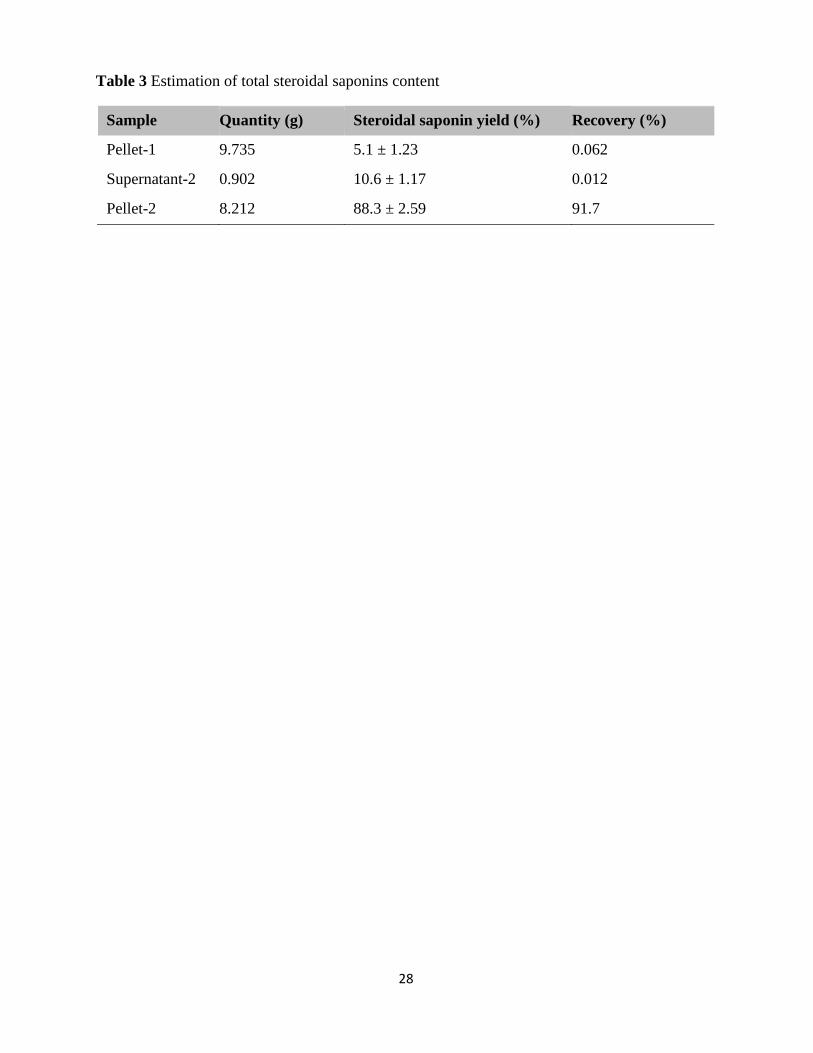
revealed that pellet-1 has approximately 5.1 ± 1.23% of TSS with 0.062% recovery, supernatant-
2 has 10.6 ± 1.17% of TSS with 0.012% recovery, and pellet-2 has 88.3 ± 2.59% of TSS with
91.7% recovery (Table 3).
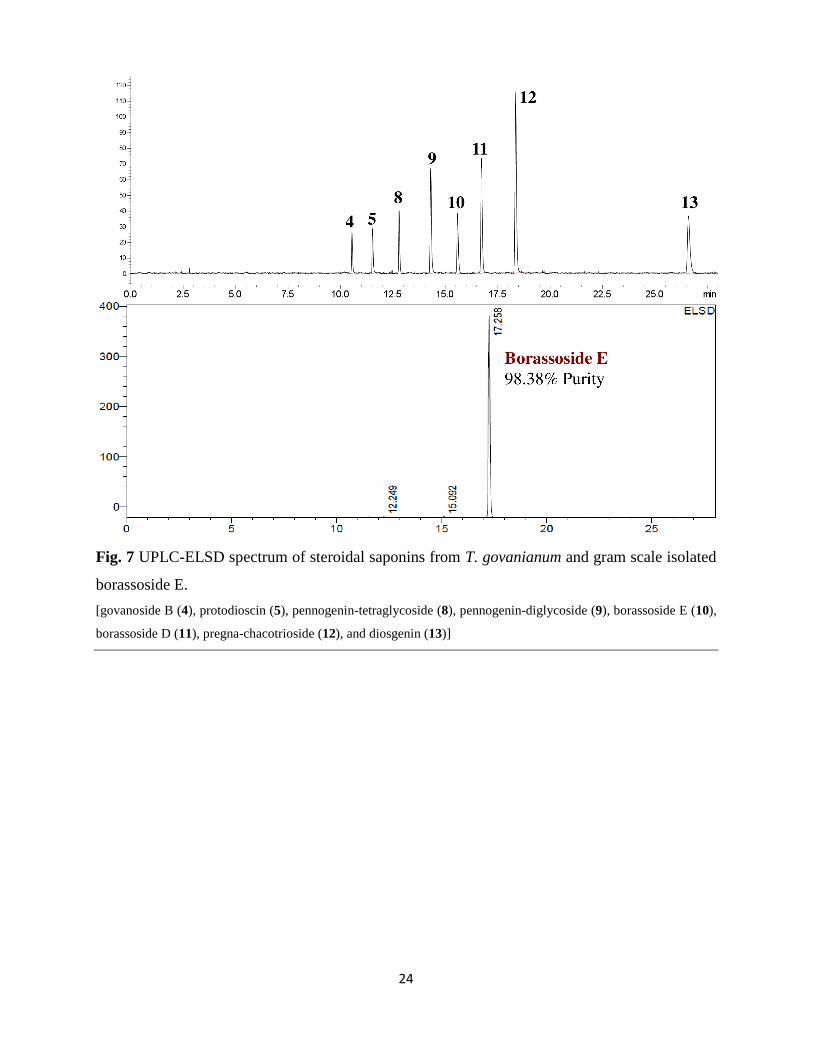
The result of the TSS estimation has indicated that pellet-2 is enriched with steroidal saponins
so this steroidal saponins enriched fraction (pellet-2) was further analyzed by using MALDI-
TOF mass spectrometry. The MALDI-TOF spectra showed that almost all the molecules were
found to be coupled with sodium ion (Na, 22.989 Dal), and the major ion peaks were observed at
745.378 (borassoside D); 891.433 (borassoside E); 1053.484 (pennogenin tetraglycoside);
1071.501 (protodioscin); 1217.474 (govanoside B), along with several other minor peaks (Fig.
S64 and Table S1).
11
The steroidal saponins enriched fraction (pellet-2) was further processed using column
chromatography to yield 2.46 g of borassoside E with 98.38% of purity (UPLC-ELSD) (Fig. 7).
The gram scale isolated borassoside E contain minor impurity of protodioscin (0.69%) and
pennogenin tetraglycoside (0.91%).
2.4 Acetylcholinesterase activity and Molecular docking
2.4.1 Effects on acetylcholinesterase activity
The inhibitory effect of the extract, fractions, and isolated molecules on acetylcholinesterase
(AChE) activity is expressed as percentages of inhibition and IC50 values (Table S2), calculated
based on the concentration-dependent inhibitory activity. The results of AChE inhibition by the
extract, fractions, and isolated molecules revealed that among the extract and fractions, WF (IC50
value: 90.2 μg/mL) exhibited highest inhibitory effect (Fig. S65). However, among the pure
molecules govanoside E (IC50 value: 8.62 μM) and protodioscin (IC50 value: 8.98 μM) showed
highest inhibitory effect on AChE activity in a concentration-dependent manner (Fig. 8). The
calculated IC50 value of Donepezil is approximately 5.40 μM. The PE (percentage of inhibition:
19.35 ± 1.62 at 100 μg/ mL) was found least active while WF (percentage of inhibition: 55.65 ±
7.39 at 100 μg/ mL) was found most active against AChE. Moreover, govanoside E (percentage
of inhibition: 57.97 ± 1.61 at 10 μM) and protodioscin (percentage of inhibition: 55.65 ± 1.40 at
10 μM) were 30.47 % and 32.79 % less active than Donepezil (percentage of inhibition: 88.44 ±
0.41 at 10 μM), respectively. The activity of WF may be attributed to the presence of
protodioscin (77.6 ± 0.8 mg/g).
2.4.2. Molecular docking
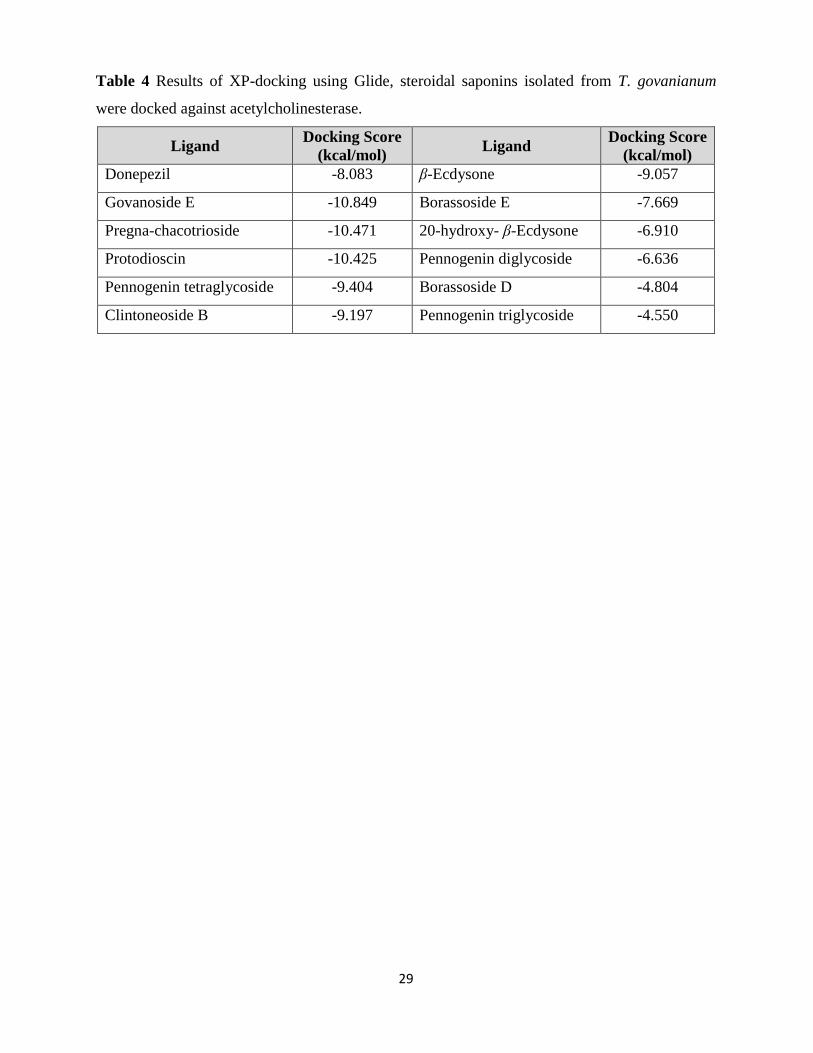
From molecular docking of steroidal saponins isolated from T. govanianum against
acetylcholinesterase, govanoside E (-10.849 kcal/mol), pregna-chacotrioside (-10.471 kcal/mol),
protodioscin (-10.425 kcal/mol) were found better as compared to donepezil (-8.083 kcal/mol)
(Table 4 and Fig. 8). Steroidal saponins bound with acetylcholinesterase as govanoside E via
Val73, Thr75, Asp283, and Arg296; pregna-chacotrioside via Thr75, Asp283, His287, and
Phe295; and protodioscin via Ser293 residues.
3. Conclusion
In summary, total seven steroidal saponins including three undescribed steroidal saponins
named govanoside C (1), govanoside D (2), and govanoside E (3) along with four known
12
compounds (4-7), were isolated from the rhizomes of T. govanianum. The structures of isolated
compounds were elucidated using the analysis of 1D and 2D NMR spectroscopic data, and the
relative stereochemistry of compounds was characterized using 1D TOCSY and NOE NMR
experiment. The antagonistic effects of the extract, fractions, and isolated molecules on
acetylcholinesterase activity were evaluated and further validated by molecular docking study to
predict binding free energy and molecular interactions. Govanoside E and protodioscin have
exhibited promising antagonistic effects on AChE activity. In addition, the easy and reliable
method was developed for the direct extraction of the total steroidal saponins and gram scale
isolation of bioactive borassoside E. This finding suggests, further phytochemical exploration of
T. govanianum has necessary to investigate bioactive and unique steroidal saponins. It was also
speculated that govanoside E and protodioscin might be the potential anti-acetylcholinesterase
agents and further in vitro and in vivo studies are essential to validate their inhibitory potential.
The gram scale isolated borassoside E, might be a potential source for the development of bio-
non-ionic detergent like digitonin.
4. Experimental
4.1 General experimental procedures
1H (600 MHz), 13C (150 MHz) and 2D NMR experiments were performed on a Bruker
Avance-600 spectrometer using CD3OD and pydidine-d5 deutrated solvents, which were
purchased from Sigma-Aldrich™ (St. Louis, MO, USA). HR-ESI-MS spectra were taken on
high-resolution 6560 Ion Mobility Q-TOF LC/MS (Agilent, Santa Clara, USA) mass
spectrometer equipped with an ESI source). IR data were recorded on Shimadzu IR Prestige-
21with ZnSe Single reflection ATR accessory. Silica gel of 60-120 mesh size and reverse-phase
fully end capped C-18 were used for column chromatography. Precoated TLC sheets of silica gel
60 F254 were used for thin-layer chromatography. Spot and separated compounds visualization
on TLC were performed by firstly under UV light and then after spraying visualization agent
para-anisaldehyde-H2SO4 followed by the heating of TLC plate at 100˚C. HPLC solvents used
were purchased from Sigma-Aldrich™ (St. Louis, MO, USA). Specific rotation and melting
point were determined on MCP 100 Modular circular Polarimeter and Visual Melting Range
Apparatus (MR-VIS), respectively.
4.2 Plant material
13
The rhizomes of T. govanianum were collected from Bharmour, Chamba district,
Himachal Pradesh, India (2580 m) in 2018. The plant material was identified by Dr. Amit
Chawla, High Altitude Biology, Department, CSIR-Institute of Himalayan Bioresource
Technology, Palampur, India. The voucher specimen (voucher no. PLP 13037) was deposited in
the herbarium of CSIR-Institute of Himalayan Bioresource Technology, Palampur, India.
4.3 Extraction and isolation of metabolites
The procedure for extraction and fractionation from rhizomes of T. govanianum was
reported in our previous research paper (Singh et al., 2020a). Water fraction (221.0 g) was
subjected to column chromatography over Diaion® HP-20 resin eluted with H2O: MeOH
(100:00-00:100), yielding 10 sub-fractions (WFA-WFJ; each of 500 mL). Fraction WF-D
(12.220 g), obtained from 50% methanol, was subjected to column chromatography over silica
gel (230-400 mesh) eluted with chloroform: methanol (100:00 to 00:100), resulting 10 different
sub-fractions (WF-D-1 to WF-D-10). WF-D-6 (4.9 g), obtained at 50% methanol, was applied
to column chromatography over RP C-18. Compound 1 (540 mg) was obtained at polarity 25%
MeOH: H2O. WF-A to WF-C (10.024 g) was mixed by comparing TLC analysis and then
subjected to RP C-18 column chromatography eluted with solvent system H2O: MeOH (100:00-
00:100), to give five sub-fractions. WF-AC-1 to WF-AC-5. Further WF-AC-4 (2.0 g), obtained
from 30 and 40% methanol, was subjected to RP C-18 column chromatography eluted with
H2O:MeOH (80: 20), result in the isolation of compound 2 (997 mg) and compound 4 (498
mg). Similarly the other sub-fraction WF-AC-2 subjected over RP C-18 yielded compound 5
(943 mg).
Other three compounds were isolated from n-butanol fraction of T. govanianum. The n-
butanol fraction (150.0g) yielded 10 sub-fractions after column chromatography (silica-gel 60-
120 mesh) as described in our previous research paper (Singh et al., 2020a). Sub-fraction BF-E
(906 mg) subjected over reverse phase column chromatography yield compound 3 (75 mg).
Similarly BF-C and BF-D collectively (2.60 g) subjected for CC on C-8 silica resulting in the
isolation of compound 6 (503 mg) and compound 7 (14 mg), respectively.
4.3.1 Govanoside C (1)
White amorphous solid; (540 mg); mp 240-242 ˚C; [α]20D= -35.6º (c = 0.003, CH3OH);
HR-ESI-MS (Positive) m/z 1085.4768 [M+Na]+ (cal for C50H78O24Na+,1085.4775); IR (ZnSe)
νmax: 3358.07 cm-1 (O-H stretching), 2899.01 cm-1 (C-H stretching), 1643.35 cm-1 (Olefinic
14
stretching), 1035.77 cm-1 (C-O stretching); 1H NMR (CD3OD, 600 MHz) and 13C NMR
(CD3OD, 150 MHz) data in Table 1.
4.3.2 Govanoside D (2)
Amorphous solid; (997 mg); mp 252-255 ˚C; [α]20D= -26.0º (c = 0.003, CH3OH); HR-
ESI-MS (Positive) m/z 1379.5735 [M+Na]+ (cal for C61H96O33Na+, 1379.5726 ); IR (ZnSe) νmax:
3350.35 cm-1 (O-H stretching), 2889.37 cm-1 (C-H stretching), 1637.56 cm-1 (C=C stretching),
1035.77 cm-1 (C-O stretching); 1H-NMR (CD3OD, 600 MHz)and 13C-NMR (CD3OD, 150 MHz)
data in Table 1.
4.3.3 Govanoside E (3)
Amorphous solid; (75 mg); mp 195-198 ˚C; [α]20D= -44.0º (c = 0.003, CH3OH);HR-ESI-
MS (Positive) m/ 965.4712 [M+Na]+ (cal for C47H74O19Na+, 965.4717); IR (ZnSe)νmax: 3365.78
cm-1 (O-H stretching), 2931.80 cm-1 (C-H stretching), 1720.50 cm-1 (C=O stretching), 1641.42
cm-1 (C=C stretching, 1037.70 cm-1 (C-O stretching); 1H-NMR (pyridine-d5, 600 MHz) and 13C-
NMR (pyridine-d5, 150 MHz) data in Table 2.
4.3.4 Govanoside B (4)
White amorphous solid; (498 mg); mp 268–270 ˚C; HR-ESI-MS (Positive) m/z
1217.5197 [M+Na]+ (cal. for C55H86O28Na+, 1217.5198); 1H-NMR (CD3OD, 600 MHz)and 13C-
NMR (CD3OD, 150 MHz). Observed data was compared with literature and compound was
identified as govanoside B [Singh et al., 2020a].
4.3.5 Protodioscin (5)
Amorphous solid; (943 mg); mp 220-222 ˚C HR-ESI-MS (Positive) m/z 1071.5360
[M+Na]+ (cal for C51H84O22Na+, 1071.5346); 1H-NMR (CD3OD, 600 MHz) and 13C-NMR
(CD3OD, 150 MHz). Observed data was compared with literature and compound was identified
as protodioscin [Abdel-Sattar et al., 2008].
4.3.6 20β-hydroxy ecdysone (6)
White powder; (503 mg); mp 243–244 °C; HR-ESI-MS (Positive) m/z 481.3164 [M+H]+
(cal for C27H45O7+, 481.3160) ;1H-NMR (CD3OD, 600 MHz) and 13C-NMR (CD3OD, 150
15
MHz). Observed data was compared with literature and compound was identified as 20β-
hydroxy ecdysone [Maliński et al., 2021].
4.3.7 Polypodine B (7)
Amorphous white solid; (14 mg); mp 225–227 °C; HR-ESI-MS (Positive) m/z 519.2895
[M+Na]+ (cal for C27H44O8Na+, 519.2928); 1H-NMR (CD3OD, 600 MHz) and 13C-NMR
(CD3OD, 150 MHz). Observed data was compared with literature and compound was identified
as polypodine B [Maliński et al., 2021].
4.4 Purity analysis of isolated molecules by UPLC-ELSD
The purity of all the isolated molecules was analyzed by using Ultra high performance
liquid chromatography (UPLC) with evaporative light scattering detector (ELSD). Sample
concentration (1mg/ mL) was prepared by dissolving each compound in HPLC grade methanol.
Our previously reported quantification method was applied for the purity determination (Singh et
al., 2020b).
4.5 Acid hydrolysis and GC analysis for sugar confirmation
4.5.1 Acid hydrolysis
Compound 1 (15 mg) was dissolved in 1 mL MeOH and then 10 mL 2N HCl (diluted in
1,4 dioxane:H2O (1:1) was added in the solution. The solution was heated on an oil bath at 95 oC
for 3 hours. After the completion of the reaction, the reaction mixture was cooled down at room
temperature. After cooling, the reaction mixture was neutralized by passing through
Amberlyst®A21 free base (Sigma-Aldrich). The neutralized solution was then fractionated with
water and methylene chloride to separate the glycone and aglycone moieties. The aqueous layer
containing sugar units was dried on a rotary evaporator under reduced pressure at temperature 50
oC.
Compound 2 (15 mg) and compound 3 (15 mg) were subjected for acid hydrolysis followed by
the same procedure as done for the compound 1.
4.5.2 Derivatization and GC analysis
The fully dried aqueous layer was dissolved in 100 μL pyridine and then .1 mL N, O-
bis(trimethylsilyl)trifluoroacetamide with trimethylchlorosilane was added. The reaction mixture
was incubated on magnetic stirrer at 40 oC for 12 hours. After the completion of reaction, 50 μL
16
from each sample was taken and diluted with GC grade DCM for GC analysis. The sugar units
were confirmed from GC analysis by comparing their retention time with available sugar
standards after derivatization. Peaks were identified for compound 1, 2 and 3 at 18.721 (β-D-
glucose), 16.992 (β-D-xylose), and 16.048 (α-L-rhamnose). Other sugars were determined based
on their characteristic NMR signals values reported in literature.
4.6 Extraction of total steroidal saponins and isolation of borassoside E
The ultrasound-assisted extraction was employed for the extraction of steroidal saponins. The
100 g of rhizome powder was suspended into the ethanol: water (80:20) and ultrasonicated with
250 watt (3 sec on/ 1sec off) at 50 ˚C for 1 hour with constant stirring. Followed by filtered with
marceline cloth and the filtrate was subsequently dried using a rotary evaporator. The dried
filtrate was suspended in 100 mL of ethanol and centrifugation at 5000 rpm for 10 min and
which separate out as supernatant-1 and pellet-1. The supernatant-1 was dried using rotary
evaporator followed by suspending into the 100 mL of distilled water and centrifugation at 5000
rpm for 10 min to yielded supernatant-2 and pellet-2. The pellet-1 and pellet-2 were passed
through the Diaion® HP-20 resin and eluted with water and ethanol respectively and dried using
lyophilizer. The extraction was performed thrice. The total steroidal saponin content in the
pellet-1, supernatant-2, and pellet-2 was estimated using previously developed anisaldehyde-
sulphuric-acid-ethyl acetate method (Patil et al., 2021c). The further chemical constituents of
pellet-2 were analyzed using MALDI-TOF.
Pellet-2 (5 g) was subjected to column chromatography over silica gel 100-200 mesh size and
eluted with gradient of methanol: chloroform (00:10 up to 05:05). At the gradient of 03:07
yielded borassoside E which was further qualitatively and quantitatively analyzed by ELSD-
UPLC (Singh et al., 2020b).
4.7 Acetylcholinesterase activity inhibition
The inhibitory effects of the extract, fraction, and isolated steroidal saponins (Singh et al.,
2020a), from T. govanianum on AChE activity was evaluated using Acetylcholinesterase
inhibitor screening kit (Sigma-Aldrich) based on an improved Ellman method (Ka et al., 2020).
The three concentrations were taken for the extract and fractions i.e., 100-300 μg/mL and three
for pure molecules 10-30 μM. Donepezil has taken as standard inhibitor. The experiment was
performed according to the standard protocol. AChE hydrolyzes acetylthiocholine (substrate)
into thiocholine which react with 5,5`-dithiobis(2-nitrobenzoic acid) (DTNB) to form a yellow
17
colour complex. The intensity of colour product was recorded at 412 nm by using Synergy H1
BioTek microplate reader. The experiment was performed in triplicate.
4.7.1 Molecular docking Study
The chemical structure of donepezil and isolated steroidal saponins (Singh et al., 2020a),
from T. govanianum were drawn using ChemDraw. All the ligands are optimized and minimized
by OPLS3e (Optimized Potentials for Liquid Simulations) force field in Ligprep, Schrodinger,
2020.3. The template of Electrophorus electricus acetylcholinesterase (PDB ID: 1C2O) with
resolution 4.20 Å was taken from the RCSB-Protein Data Bank. The template of
acetylcholinesterase was pre-processed, optimized, and minimized by protein preparation wizard
and receptor grid was generated at top site after sitemap. The docking study was performed
using extra-precision (XP) with flexible mode to predict the binding efficiency of steroidal
saponins with acetylcholinesterase. Donepezil was used as a standard inhibitor.
4.8 Data analysis and statistics
The enzyme inhibition results were expressed as mean ± standard deviation (SD). Further,
experimental graphs plotting and the IC50 values were calculated by unpaired t-tests and one-
way ANOVA by using Tukey-Kramer post hoc analysis to compare data sets, using GraphPad
Prism Software (GraphPad Software, La Jolla, CA, USA). Differences between means were
considered to be significant if p < 0.05.
Supplementary material
The spectroscopic data relating to this paper
Acknowledgment
The authors are grateful to the Director, CSIR-IHBT for continuous encouragement and support.
Disclosure statement
The authors report no conflict of interest.
Funding
This research is supported by CSIR (MLP0159). CSIR-IHBT communication no. for this
manuscript is 0000.
18
Figures
Fig. 1 The structures of isolated compounds from Trillium govanianum
19
Fig. 2 Key HMBC (→) and COSY ( ) correlations of compounds 1 and 2.
20
Fig. 3 The key NOE (↔) correlations of compounds 1 and 2.
21
Fig. 4 Main key HMBC (→) and COSY ( ) correlations of compounds 3
22
Fig. 5 The key NOE (↔) correlations of compounds 3
23
Fig. 6 The graphical representation of the extraction and enrichment protocol for total steroidal
saponins from the rhizomes of T. govanianum.
24
Fig. 7 UPLC-ELSD spectrum of steroidal saponins from T. govanianum and gram scale isolated
borassoside E.
[govanoside B (4), protodioscin (5), pennogenin-tetraglycoside (8), pennogenin-diglycoside (9), borassoside E (10),
borassoside D (11), pregna-chacotrioside (12), and diosgenin (13)]
25
Fig. 8 Graphical representation of antagonistic effects of isolated pure compounds on AChE
activity with putative interaction of best-docked compounds.
26
Tables
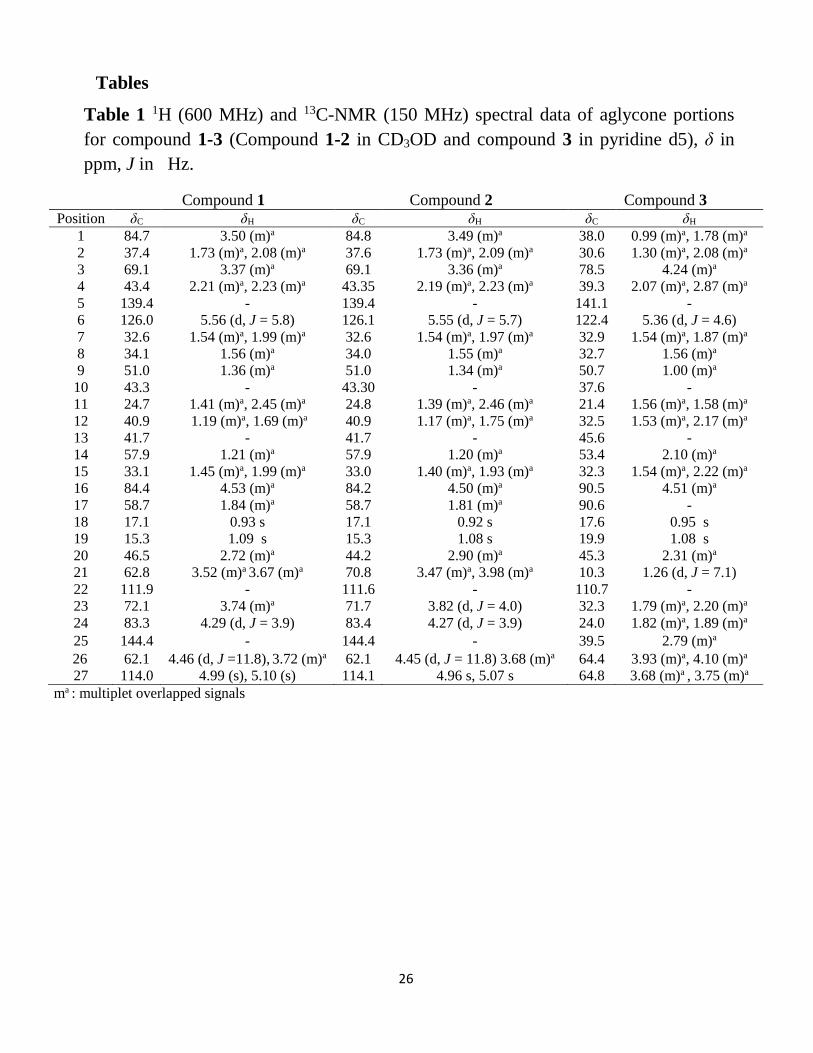
Table 1 1H (600 MHz) and 13C-NMR (150 MHz) spectral data of aglycone portions
for compound 1-3 (Compound 1-2 in CD3OD and compound 3 in pyridine d5), δ in
ppm, J in Hz.
Compound 1 Compound 2 Compound 3 Position δC δH δC δH δC δH
1 84.7 3.50 (m)a 84.8 3.49 (m)a 38.0 0.99 (m)a, 1.78 (m)a
2 37.4 1.73 (m)a, 2.08 (m)a 37.6 1.73 (m)a, 2.09 (m)a 30.6 1.30 (m)a, 2.08 (m)a
3 69.1 3.37 (m)a 69.1 3.36 (m)a 78.5 4.24 (m)a
4 43.4 2.21 (m)a, 2.23 (m)a 43.35 2.19 (m)a, 2.23 (m)a 39.3 2.07 (m)a, 2.87 (m)a
5 139.4 - 139.4 - 141.1 -
6 126.0 5.56 (d, J = 5.8) 126.1 5.55 (d, J = 5.7) 122.4 5.36 (d, J = 4.6)
7 32.6 1.54 (m)a, 1.99 (m)a 32.6 1.54 (m)a, 1.97 (m)a 32.9 1.54 (m)a, 1.87 (m)a
8 34.1 1.56 (m)a 34.0 1.55 (m)a 32.7 1.56 (m)a
9 51.0 1.36 (m)a 51.0 1.34 (m)a 50.7 1.00 (m)a
10 43.3 - 43.30 - 37.6 -
11 24.7 1.41 (m)a, 2.45 (m)a 24.8 1.39 (m)a, 2.46 (m)a 21.4 1.56 (m)a, 1.58 (m)a
12 40.9 1.19 (m)a, 1.69 (m)a 40.9 1.17 (m)a, 1.75 (m)a 32.5 1.53 (m)a, 2.17 (m)a
13 41.7 - 41.7 - 45.6 -
14 57.9 1.21 (m)a 57.9 1.20 (m)a 53.4 2.10 (m)a
15 33.1 1.45 (m)a, 1.99 (m)a 33.0 1.40 (m)a, 1.93 (m)a 32.3 1.54 (m)a, 2.22 (m)a
16 84.4 4.53 (m)a 84.2 4.50 (m)a 90.5 4.51 (m)a
17 58.7 1.84 (m)a 58.7 1.81 (m)a 90.6 -
18 17.1 0.93 s 17.1 0.92 s 17.6 0.95 s
19 15.3 1.09 s 15.3 1.08 s 19.9 1.08 s
20 46.5 2.72 (m)a 44.2 2.90 (m)a 45.3 2.31 (m)a
21 62.8 3.52 (m)a 3.67 (m)a 70.8 3.47 (m)a, 3.98 (m)a 10.3 1.26 (d, J = 7.1)
22 111.9 - 111.6 - 110.7 -
23 72.1 3.74 (m)a 71.7 3.82 (d, J = 4.0) 32.3 1.79 (m)a, 2.20 (m)a
24 83.3 4.29 (d, J = 3.9) 83.4 4.27 (d, J = 3.9) 24.0 1.82 (m)a, 1.89 (m)a
25 144.4 - 144.4 - 39.5 2.79 (m)a
26 62.1 4.46 (d, J =11.8), 3.72 (m)a 62.1 4.45 (d, J = 11.8) 3.68 (m)a 64.4 3.93 (m)a, 4.10 (m)a
27 114.0 4.99 (s), 5.10 (s) 114.1 4.96 s, 5.07 s 64.8 3.68 (m)a , 3.75 (m)a
ma : multiplet overlapped signals
27
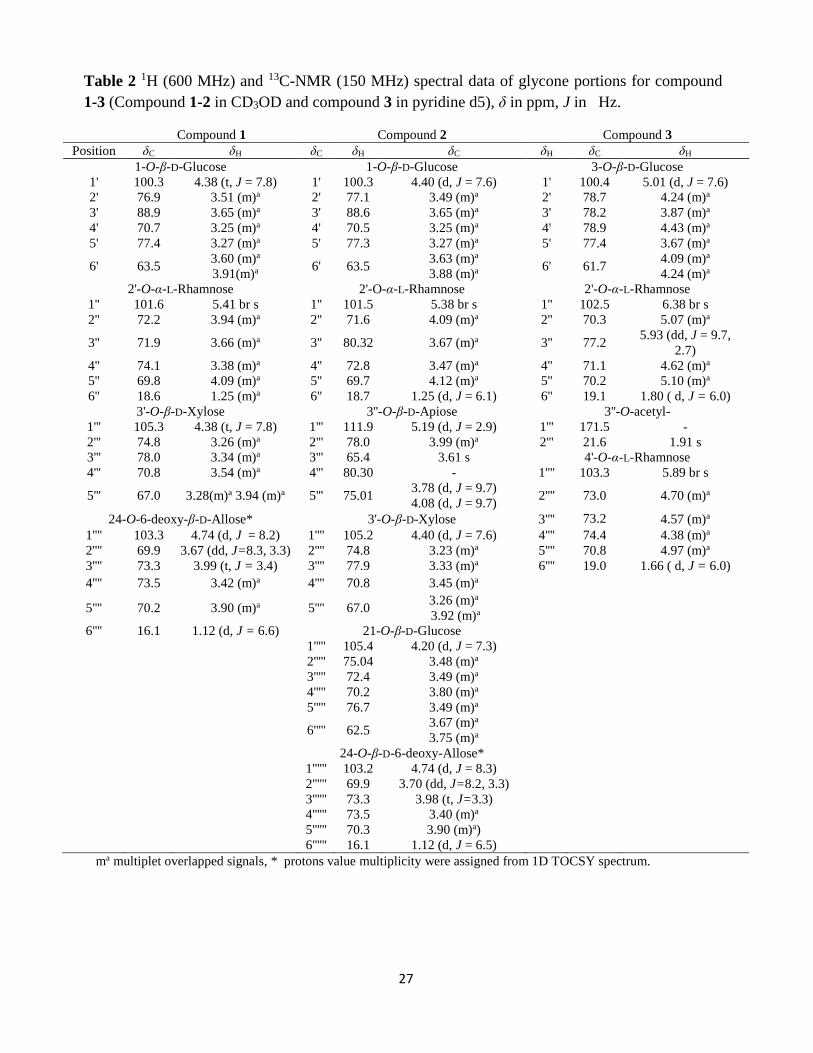
Table 2 1H (600 MHz) and 13C-NMR (150 MHz) spectral data of glycone portions for compound
1-3 (Compound 1-2 in CD3OD and compound 3 in pyridine d5), δ in ppm, J in Hz.
Compound 1 Compound 2 Compound 3
Position δC δH δC δH δC δH δC δH
1-O-β-D-Glucose 1-O-β-D-Glucose 3-O-β-D-Glucose
1' 100.3 4.38 (t, J = 7.8) 1' 100.3 4.40 (d, J = 7.6) 1' 100.4 5.01 (d, J = 7.6)
2' 76.9 3.51 (m)a 2' 77.1 3.49 (m)a 2' 78.7 4.24 (m)a
3' 88.9 3.65 (m)a 3' 88.6 3.65 (m)a 3' 78.2 3.87 (m)a
4' 70.7 3.25 (m)a 4' 70.5 3.25 (m)a 4' 78.9 4.43 (m)a
5' 77.4 3.27 (m)a 5' 77.3 3.27 (m)a 5' 77.4 3.67 (m)a
6' 63.5 3.60 (m)a
3.91(m)a 6' 63.5
3.63 (m)a
3.88 (m)a 6' 61.7
4.09 (m)a
4.24 (m)a
2'-O-α-L-Rhamnose 2'-O-α-L-Rhamnose 2'-O-α-L-Rhamnose
1'' 101.6 5.41 br s 1'' 101.5 5.38 br s 1'' 102.5 6.38 br s
2'' 72.2 3.94 (m)a 2'' 71.6 4.09 (m)a 2'' 70.3 5.07 (m)a
3'' 71.9 3.66 (m)a 3'' 80.32 3.67 (m)a 3'' 77.2 5.93 (dd, J = 9.7,
2.7)
4'' 74.1 3.38 (m)a 4'' 72.8 3.47 (m)a 4'' 71.1 4.62 (m)a
5'' 69.8 4.09 (m)a 5'' 69.7 4.12 (m)a 5'' 70.2 5.10 (m)a
6'' 18.6 1.25 (m)a 6'' 18.7 1.25 (d, J = 6.1) 6'' 19.1 1.80 ( d, J = 6.0)
3'-O-β-D-Xylose 3''-O-β-D-Apiose 3''-O-acetyl-
1''' 105.3 4.38 (t, J = 7.8) 1''' 111.9 5.19 (d, J = 2.9) 1''' 171.5 -
2''' 74.8 3.26 (m)a 2''' 78.0 3.99 (m)a 2''' 21.6 1.91 s
3''' 78.0 3.34 (m)a 3''' 65.4 3.61 s 4'-O-α-L-Rhamnose
4''' 70.8 3.54 (m)a 4''' 80.30 - 1'''' 103.3 5.89 br s
5''' 67.0 3.28(m)a 3.94 (m)a 5''' 75.01 3.78 (d, J = 9.7)
4.08 (d, J = 9.7) 2'''' 73.0 4.70 (m)a
24-O-6-deoxy-β-D-Allose* 3'-O-β-D-Xylose 3'''' 73.2 4.57 (m)a
1'''' 103.3 4.74 (d, J = 8.2) 1'''' 105.2 4.40 (d, J = 7.6) 4'''' 74.4 4.38 (m)a
2'''' 69.9 3.67 (dd, J=8.3, 3.3) 2'''' 74.8 3.23 (m)a 5'''' 70.8 4.97 (m)a
3'''' 73.3 3.99 (t, J = 3.4) 3'''' 77.9 3.33 (m)a 6'''' 19.0 1.66 ( d, J = 6.0)
4'''' 73.5 3.42 (m)a 4'''' 70.8 3.45 (m)a
5'''' 70.2 3.90 (m)a 5'''' 67.0 3.26 (m)a
3.92 (m)a
6'''' 16.1 1.12 (d, J = 6.6) 21-O-β-D-Glucose
1''''' 105.4 4.20 (d, J = 7.3)
2''''' 75.04 3.48 (m)a
3''''' 72.4 3.49 (m)a
4''''' 70.2 3.80 (m)a
5''''' 76.7 3.49 (m)a
6''''' 62.5 3.67 (m)a
3.75 (m)a
24-O-β-D-6-deoxy-Allose*
1'''''' 103.2 4.74 (d, J = 8.3)
2'''''' 69.9 3.70 (dd, J=8.2, 3.3)
3'''''' 73.3 3.98 (t, J=3.3)
4'''''' 73.5 3.40 (m)a
5'''''' 70.3 3.90 (m)a)
6'''''' 16.1 1.12 (d, J = 6.5)
ma multiplet overlapped signals, * protons value multiplicity were assigned from 1D TOCSY spectrum.
28
Table 3 Estimation of total steroidal saponins content
Sample Quantity (g) Steroidal saponin yield (%) Recovery (%)
Pellet-1 9.735 5.1 ± 1.23 0.062
Supernatant-2 0.902 10.6 ± 1.17 0.012
Pellet-2 8.212 88.3 ± 2.59 91.7
29
Table 4 Results of XP-docking using Glide, steroidal saponins isolated from T. govanianum
were docked against acetylcholinesterase.
Ligand Docking Score
(kcal/mol) Ligand
Docking Score
(kcal/mol)
Donepezil -8.083 β-Ecdysone -9.057
Govanoside E -10.849 Borassoside E -7.669
Pregna-chacotrioside -10.471 20-hydroxy- β-Ecdysone -6.910
Protodioscin -10.425 Pennogenin diglycoside -6.636
Pennogenin tetraglycoside -9.404 Borassoside D -4.804
Clintoneoside B -9.197 Pennogenin triglycoside -4.550
30
References
Abdel-Sattar E., Shabana M. M., El-Mekkawy S., 2008. Protodioscin and pseudoprotodioscin
from Solanum intrusum. Res. J. Phytochem. 2, 100-105.
Bora P.S., Suresh P.S., Kumari S., Anmol, Puri S., Sharma U. (2021) Integrated Approach for
the Quality Assurance of Commercially Important Himalayan Medicinal Plants. In: Ekiert H.M.,
Ramawat K.G., Arora J. (eds) Medicinal Plants. Sustainable Development and Biodiversity, vol
28. Springer, Cham. https://doi.org/10.1007/978-3-030-74779-4_22.
Dolma S. K.¸ Patil S. S., Singh P. P., Sharma U.¸ Reddy S.G. E., 2020. Insecticidal activity of
extract, fractions and pure steroidal saponins of Trillium govanianum Wall. ex D.Don for the
control of diamondback moth (Plutella xylostella L.) and aphid (Aphis craccivora Koch). Pest
Manag. Sci. 77, 956-962.
Duus, J.Ø., Gotfredsen, C.H. and Bock, K., 2000. Carbohydrate structural determination by
NMR spectroscopy: modern methods and limitations. Chem. Rev. 100, 4589-4614.
Ju, Y., Jia, Z.J., 1992. Steroidal saponins from the rhizomes of Smilax
menispermoidea. Phytochem. 31, 1349-1351.
Ka, S., Masi, M., Merindol, N., Di Lecce, R., Plourde, M.B., Seck, M., Górecki, M., Pescitelli,
G., Desgagne-Penix, I. and Evidente, A., 2020. Gigantelline, gigantellinine and gigancrinine,
cherylline-and crinine-type alkaloids isolated from Crinum jagus with anti-acetylcholinesterase
activity. Phytochemistry, 175, 112390.
Khan, Kashif M., Lutfun Nahar, Afaf Al‐Groshi, Alexandra G. Zavoianu, Andrew Evans, Nicola
M. Dempster, Jean D. Wansi, Fyaz MD Ismail, Abdul Mannan, and Satyajit D. Sarker., 2016.
Cytotoxicity of the roots of Trillium govanianum against breast (MCF7), liver (HepG2), lung
(A549) and urinary bladder (EJ138) carcinoma cells. Phytother. Res. 30,1716-1720.
Khan, Kashif Maqbool, Lutfun Nahar, Abdul Mannan, Ihsan Ul-Haq, Muhammad Arfan,
Ghazanfar Ali Khan, Izhar Hussain, and Satyajit D. Sarker., 2018. Cytotoxicity, In vitro anti-
Leishmanial and fingerprint HPLC-photodiode array analysis of the roots of Trillium
govanianum. Nat. Prod.Res. 32:2193-2201.
Kobayashi, S., Onozawa, S.Y. and Mukaiyama, T., 1992. An efficient synthesis of 6-deoxy-D-
allose from simple achiral starting materials. Chem. Lett. 21, 2419-2422.
Kundra, R., Samant, S. S., & Sharma, R. K., 2020. Assessment of Antioxidant Potential of
Trillium govanianum Wall. ex D. Don, a Critically Endangered Medicinal Plant of North-
western Indian Himalaya. Proc. Natl. Acad. Sci. India Sect. B Biol. Sci. 90, 95-101.
31
Lenherr, A. and Mabry, T.J., 1987. Acetylated allose-containing flavonoid glucosides from
Stachys anisochila. Phytochem. 26, 1185-1188.
Mimaki, Y., Watanabe, K., 2008. Clintoniosides A-C, new polyhydroxylated spirostanol
glycosides from the rhizomes of Clintonia udensis. Helv. Chim. Acta. 91, 2097-2106.
Maliński M. P., Budzianowski J., Kikowska M., Derda M., Jaworska M. M., Mlynarczyk D.T.,
Szukalska M., Florek E., Thiem B., 2021. Two Ecdysteroids Isolated from Micropropagated
Lychnis flos-cuculi and the Biological Activity of Plant Material. Molecules 26, 904.
Muhammad, N., Ur Rahman, S., Uddin, H., Shehzad, O., Ismail, M., Ali, N., Khan, A., Shahid,
M., Ullah, A., Ahmad, S. and Hussain, H., 2021. Antidiarrheal and antispasmodic activities of
Trillium govanianum rhizomes extract: involvement of calcium channel blockade. Nat. Prod.
Res. 1-5.
Patil S.S., Bhatt, V., Singh, P.P. and Sharma, U., 2021a. Steroidal sapogenins from genus
Trillium: Chemistry, synthesis, and opportunities in neuro-active steroids designing. Stud. Nat.
Prod. Chem. 68, 67-95, Elsevier.
Patil S. S., Singh P. P., Padwad Y., Sharma U., 2021b. Steroidal Saponins from Trillium
govanianum as α-Amylase, α-Glucosidase, and Dipeptidyl Peptidase IV Inhibitory Agents. J.
Pharm. Pharmacol. 73, 487-495.
Patil S. S., Singh P. P., Sharma A., Padwad Y., Sharma U., 2021c. Anti-inflammatory and
pharmacokinetics studies of steroidal saponins isolated from Trillium govanianum. Biocat. Agri.
Biotech. 35, 102071.
Rahman S. U., Ismail M., Shah M.R., Adhikari A., Anis I., Ahmad M.S., Khurram M., 2015.
Govanoside A, a new steroidal saponin from rhizomes of Trillium govanianum, Steroids 104,
270-275.
Rahman, S., Adhikari, A., Ismail, M., Raza Shah, M., Khurram, M., Shahid, M., Ali, F., Haseeb,
A., Akbar, F. and Iriti, M., 2016. Beneficial effects of Trillium govanianum rhizomes in pain and
inflammation. Molecules, 21, 1095.
Sharma P., Samant S., 2014. Diversity, distribution and indigenous uses of medicinal plants in
Parvati Valley of Kullu district in Himachal Pradesh, Northwestern Himalaya, Asian, J. Adv.
Basic Sci. 2, 77-98.
Sharma, S., Mehta, V., Sharma, P., Jaggi, K., Udayabanu, M., & Sood, H., 2018. Antifertility
activity and contraceptive potential of the hydro-alcoholic rhizome extract of Trillium
govanianum in female Wistar rats. Asian J. Pharm. Clin. Res. 11, 329-332.
32
Singh, P., Singh, G., Bhandawat, A., Singh, G., Parmar, R., Seth, R. and Sharma, R.K., 2017.
Spatial transcriptome analysis provides insights of key gene (s) involved in steroidal saponin
biosynthesis in medicinally important herb Trillium govanianum. Sci. Rep. 7, 1-12.
Singh, P.P., Bora, P.S., Suresh, P.S., Bhatt, V. Sharma, U., 2020b. Qualitative and quantitative
determination of steroidal saponins in Trillium govanianum by UHPLC-QTOF-MS/MS and
UHPLC-ELSD. Phytochem. Ana. 31, 861-873.
Singh, P.P., Suresh, P.S., Bora, P.S., Bhatt, V. Sharma, U., 2020a. Govanoside B, a new
steroidal saponin from rhizomes of Trillium govanianum. Nat. Prod. Res. 1-9.
Verma, R., Tapwal, A., Kumar, D. and Puri, S., 2021. Antimicrobial potential and
phytochemical profiling of ethnomedicinal plant Trillium govanianum Wall. ex D. Don in
Western Himalaya. J. Herbal Med. 29, 100491.


