Embed Size (px)
Citation preview

Marine Resource Economics. Volume 6, pp- 19-25 0738-1360/89 S3.00 + .00Printed in the UK. All righu reserved. Copyrighl © 1989 Ihylor & FruicU
New %rk Value of Chesapeake Striped Bass
ROBERT BUERGER
Department of Recreation and Leisure StudiesSUNY-CortlandCortland. NY
JAMES R. KAHN
Department of EconomicsSUNY-BinghamtonBinghamton, NY
Abstract This article looks at the interstate open-access externalities associatedwith Chesapeake Bay striped bass. These fish spawn in the Chesapeake Bay and thenmigrate to other areas of the East Coast. The Chesapeake striped bass have been insubstantial decline over the last decade. Of specific interest are the losses suffered inNew York from the decline in striped bass production from the Chesapeake Bay. Thisis done by estimating demand and supply curves for commercial fishing and thencomputing the losses in consumers' and producers' surplus associated with thedecline, estimated to be $396,000 per year.
Introduction
Many resource management problems are not contained within the confines of a particu-lar political jurisdiction. The Chesapeake Bay provides many examples of this phenome-non, as it is located within both Maryland and Virginia. Additionally, the tributaries ofthe Chesapeake Bay drain six states, so that water pollution in non-Bay states {NewYork, Pennsylvania, Delaware, and West Virginia) is exported to the Chesapeake Bay.Another less obvious example of these interstate impacts is that ecological outputs of theChesapeake Bay are naturally exported to other states' marine waters. A prime exampleis the striped bass, for which the Chesapeake Bay represented the primary spawning andnursery grounds for the entire northeastern coast.
The spawning success in the Chesapeake Bay has substantially deteriorated over thelast decade. As remedial actions are considered, an important question is who shouldpay for the costs of restoring the Chesapeake Bay. One of the important considerations injustifying federal fUnds for this type of effort is the fact that a portion of the benefits ofChesapeake clean-up are realized outside of Maryland and Virginia. This article seeks toquantify one group of these benefits, the value in New York of striped bass that originatein the Chesapeake Bay.
The Long Island coastal waters support important recreational and commercial fish-eries, striped bass {Morone saxatilis) constituting a historically important recreationally
19

20 R. Buerger and J. R. Kahn
and commercially sought species. The striped bass fishery peaked in the early to mid-1970s and then began a steady decline in terms of numbers of fish landed. During the1970s annual commercial striped bass landings averaged 1,095,000 pounds, but fell toan average of 536,800 pounds during the period 1980-1984.
The majority of striped bass found in New York marine waters were spawned in theChesapeake Bay or the Hudson River. Environmental degredations of the ChesapeakeBay (U.S. Department of Commerce 1985) and overharvesting by fishing interests dur-ing the 1970s resulted in a dramatic decrease in the number of striped bass juvenilesspawned in these waters. Coinciding with the decline of striped bass from the Chesa-peake was the increase in PCB levels in striped bass from the Hudson River. Since themid-1940s, industrial waste of poly chlorinated biphenyls has been released into theHudson River, which was found to exceed FDA levels in 1976 (Sloan et al.).
Studies conducted by the New York Department of Environmental Conservation in1984 found striped bass from the marine district of New York to exceed the U.S. Foodand Drug Administration's tolerance level for PCB in fish (2 parts per million). Largerfish (greater than 24 inches) taken from New York marine waters averaged 5.6 ppm PCBand the smaller fish (< 24 inches) averaged 4.3 ppm PCB (Sloan and Horn 1985). Basedon this information, in May of 1986 the New York Department of Environmental Con-servation placed a possession ban on recreational and commercial catch of striped bassfrom New York waters.
The impact of both the ban and the decline in Chesapeake spawning effects on bothrecreational and commercial fishing activity has been quite pronounced. In a previouspaper, Kahn (1987) developed a methodology for measuring impacts of this nature. Themethodology develops a bioeconomic model based on an equilibrium catch function, andmarginal cost and inverse demand functions for commercial fishing. These functions arepresented in equations (l)-(3).
EquUibrium catch: C - C(S, E) (1)
Commercial AC: AC - AC (S, C, ?„ OC) (2)
Commercial Inverse Demand: TT — 7r (C, SE, P.) (3)
where C -= catch, S — fish stock (index of abundance), E - a vector of environmentalvariables, OC — a vector of opportunity costs of commercial fishermen, P, - a vectorof input prices, SE - a vector of socioeconomic variables, and P, - a vector of pricesof substitute goods. Equations (1) through (3) are simultaneously solved to determine theequilibrium catch (C*) and fish stock, and then marginal cost curve (MC) is derivedfrom the average cost curve. The benefits can then be measured as
[ (Tr-MC)dCJo
The extension of this model to include a recreational fishing sector is rather straight-forward, but the application of this methodology to the problem at hand would require amajor extension of the model. However, this would be extremely difficult to estimatewith the data that is available. The primary complication introduced by the considerationof striped bass is the existence of overlapping fisheries. The fisheries overlap in the

New York Value of Chesapeake Bass 21
sense that New York fishermen catch fish out of both the Hudson River and Chesapeakepopulations, and they also overlap in the sense that Chesapeake striped bass are caughtin many different regional fisheries. Thus the number of behavioral equations in thebioeconomic model rises quickly. One needs separate equilibrium catch equations forboth the Hudson and Chesapeake populations, as well as separate demand and marginalcost (commercial and recreational) equations for each regional market that harvestsChesapeake spawned striped bass. Unfortunately, sufficient data on recreational catchare not available to allow estimation of these equations. Since recreational catch istypically a significant proportion of total catch, it is not appropriate to estimate theequilibrium assuming commercial catch is equal to total catch.
However, one can still develop meaningful estimates of the New York value ofChesapeake striped bass for commercial fishing, even without the estimation of theequilibrium catch equation by focusing solely on the economic variables. This wouldrequire making the implicit assumption that the economic equilibria generated by solvingthe economic behavioral functions are also biological equilibria, since it is no longerpossible to simultaneously solve for the bioeconomic equilibrium. The model estimatedconsists of equations (2) and (3) above.
Although sufficient data exists to estimate travel cost demand curves for recreationalfishing in general, the data are not specific enough to allow for the estimation of a travelcost demand curve for striped bass fishing activity. It is possible to extrapolate somevalue estimates from the general travel cost demand curve, but not in a fashion thatallows for testing the statistical significance of the estimates. For this reason, the recrea-tional sector is not examined in this article, but left as a topic for further study.
Value in Commercial Fishing
The value of Chesapeake spawned striped bass to New York commercial fishermen iscalculated by estimating demand and supply functions for striped bass caught in NewYork waters, where the supply function is a function of both the abundance of HudsonRiver spawned fish and the abundance of Chesapeake spawned fish. Measures of abun-dance of reasonable quality for both populations exist, although the measures are betterfor the Chesapeake populations. An index of Chesapeake juvenile abundance is collectedby the Maryland Department of Natural Resources, and published by the U.S. Depart-ment of Commerce (1986).
No single measure of Hudson River abundance spans the time period over which theequations are estimated (1964-1985). However, there are several different measuresfrom different sources that overlap to a great enough extent that it is possible to useregression techniques to develop a single measure spanning the whole period. Althoughwe would be very reluctant to use this measure of Hudson River abundance to analyzeresource management problems that were central to the Hudson River population, wefeel the measure is adequate for controlling for the level of the Hudson population whenwe analyze the Chesapeake population.
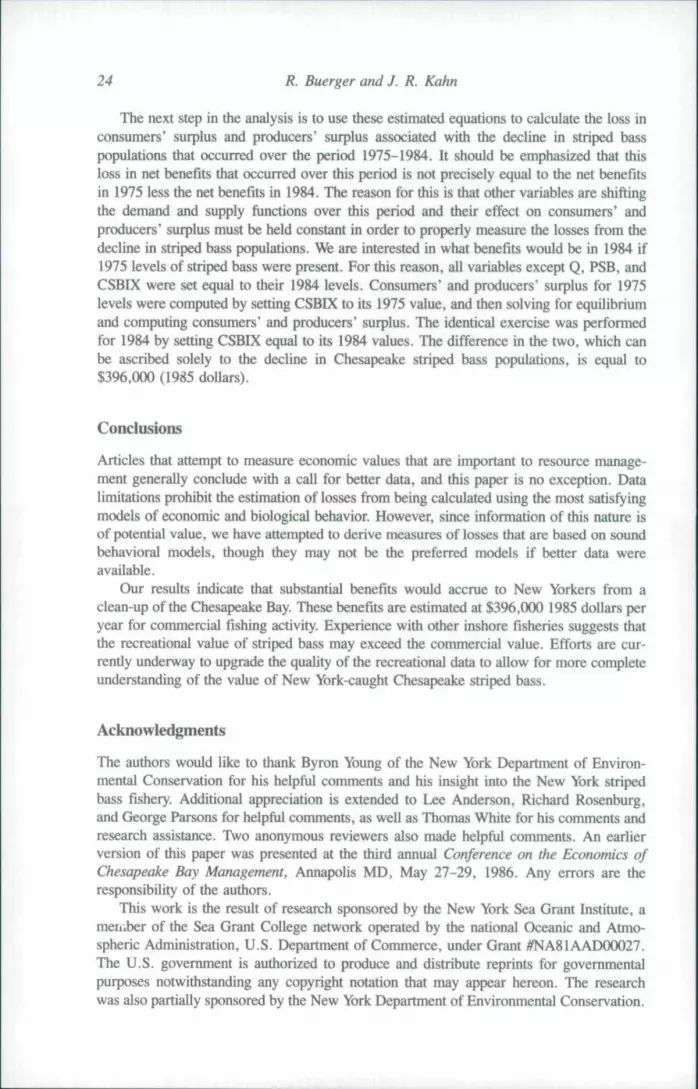
The loss of New York social benefits associated with the decline in Chesapeakestriped bass is graphically depicted in Figure 1, which shows the inverse demand curveand two inverse supply functions, AC75 and AC84. AC75 represents the inverse supplycurve in 1975 when Chesapeake populations were at their peak; ACg4 represents theinverse supply curve in 1984, the last date at which it is possible to analyze commercialfishing in New York, since the commercial striped bass fishery was partially closed in

22 R. Buerger and J. R. Kahn
Price
AC84
MC 75
Demand
Q . Q .'84 ^75 Catch
Figure 1 Loss in social benefits associated with the decline of striped bass.
1985. Note that the inverse supply curves are represented as average cost curves ratherthan marginal cost curves since this is an open-access fishery. The intersection betweenthe inverse demand function and the appropriate average cost function determines theopen-access catch, but social benefits are determined by the relationship between theinverse demand functions and marginal cost functions. In 1975 the social benefits wouldbe represented by area DCF minus area FGE. In 1985 the corresponding value would berepresented by area ACI minus IHB. Areas FGE and IHB represent the social lossesfrom overfishing in 1975 and 1985, respectively, so they are subtracted in each case.The losses from the decline in Chesapeake striped bass populations can be computed bysubtracting tbe net social benefits in 1985 from the net social benefits in 1975.
These functions were estimated using the two-stage least-squares regression packageon the GAUSS econometrics program for personal computers. The demand function ispresented as equation (4) and the supply function is presented as equation (5). T-statistics are in parentheses.
4217 -3193PSB(0.729) (-5.05)
2791PMPF - 33.63TIME + 1.71NYPCI - 0.616NYPOP(4.439) (-1.828) (4.664) ( - 2.099)
Q, + - 1900 + 1408PSB -t- 2.92HSBIX -(- 194CSBIX + 602PFLUKE(-2.573) (1.989) (1.235) (6.722) (1.985)
+ 963PPORG + 2744PYT + 591PBL - 185PLOBS(2.59) (4.11) (2.24) (-1.723)
(5)

New York Value of Chesapeake Bass 23
The R-squared for the demand equation was 0.91, whereas the R-squared for the supplyequation was 0.95. Both equations were remarkably robust considering the low degrees offreedom (10).
The estimated demand equation was estimated using the quantity of New %rk landingsof striped bass as the dependent variable. As expected, the price of New York striped bass(PSB) had a negative coefficient. The other right-hand side variables included a time trendvariable (TIME) to account for taste changes, PMPF (the CPI for meat poultry and fish) tocontrol for the price of substitute goods, and the New York per capital income (NYPCI).All money variables were deflated using the New York City CPI. All coefficients had the apriori expected sign except for TIME (for which there was no a priori expectation) and theregional population, which was both incorrectly signed and statistically significant. Wehave no explanation for the performance of the regional population variable except that itmight be serving as a proxy for other variables that are correlated with either time or theincrease in the size of the metropolitan area. The price elasticity of demand (evaluated atthe mean) is equal to ( —)1.32.
The estimated supply equation uses the same dependent variable. The coefficient onPSB is positive and significant, however, the elasticity of supply is relatively low (.58).This does not come as a large surprise, as there are many indicators that one would expectcatch to be relatively unresponsive to price changes. One of the most important of these isthe response of catch to an index of the adult Chesapeake populations of striped bass. (Thisindex was generated for each year t by taking the juvenile indices in years t-3, t-4, and t-5,and averaging them.) As can be seen in equation (5) the coefficient on this index (CSBIX)is positive and highly significant. However, the importance of these populations was high-lighted when catch was regressed on only a constant and CSBIX. The R-squared of thisregression was 0.67. In other words, 67% of the variation in New York commercial catchof striped bass can be explained by the variation in Chesapeake spawned striped basspopulations. In contrast the Hudson population (HSBIX) was insignificant in the supplyequation and in a separate regression accounted only for 7% of the variation in catch.
The behavioral explanation may be that the fishermen catch whatever they can in agiven year, irrespective of the price. However, in the short-run, price might have someaffects on species switching when seasons overlap, and in the long-run one would expectprice to have an effect on entry and exit. In other words, one of the important influences ofprice is that it partially determines the number of fishermen in a given year. Other determi-nants are the price of complementary outputs and substitute outputs. Complementary out-puts are defined as species that are either caught jointly with striped bass or are caught attimes of the year when the fishermen are not pursuing striped bass. Substitute outputs aredefined as those species that are pursued in lieu of striped bass and other alternativesoutside of fishing. Prices of the most important commercial species were included asexplanatory variables to account for these alternative opportunities. The coefficients on theprices of yellowtail flounder (PYT), fluke (PFLUKE), porgies (PPORG) and bluefish(PBL) were all positive, whereas the price of lobster had a negative coefficient. All ofthese had the a priori expected signs. Fluke, porgy, and fiounder are primarily pursuedoutside the times of peak striped bass abundance, whereas bluefish is jointly harvested withstriped bass. Lobster, on the other hand, is a substitute species (different fishing gear andtechniques) and had the expected negative sign. Oysters were not included since they arenot a common property resource in New York State. The hourly manufacturing wage wasincluded to act as a proxy for nonfishery alternatives; however, it was insignificant andincorrectly signed so it was dropped from the equation.
24 R. Buerger and J. R. Kahn
The next step in the analysis is to use these estimated equations to calculate the loss inconsumers' surplus and producers' surplus associated with the decline in striped basspopulations that occurred over the period 1975-1984. It should be emphasized that thisloss in net benefits that oeeurred over this period is not precisely equal to the net benefitsin 1975 less the net benefits in 1984. The reason for this is that other variables are shiftingthe demand and supply ftinctions over this period and their effect on consumers' andproducers' surplus must be held constant in order to properly measure the losses from thedecline in striped bass populations. We are interested in what benefits would be in 1984 if1975 levels of striped bass were present. For this reason, all variables except Q, PSB, andCSBIX were set equal to their 1984 levels. Consumers' and producers' surplus for 1975levels were computed by setting CSBIX to its 1975 value, and then solving for equilibriumand computing consumers' and producers' surplus. The identical exercise was performedfor 1984 by setting CSBIX equal to its 1984 values. The difference in the two, which canbe ascribed solely to the decline in Chesapeake striped bass populations, is equal to$396,000 (1985 dollars).
Conclusions
Articles that attempt to measure economic values that are important to resource manage-ment generally conclude with a call for better data, and this paper is no exception. Datalimitations prohibit the estimation of losses from being calculated using the most satisfyingmodels of economic and biological behavior. However, since information of this nature isof potential value, we have attempted to derive measures of losses that are based on soundbehavioral models, though they may not be the preferred models if better data wereavailable.
Our results indicate that substantial benefits would accrue to New Yorkers from aclean-up of the Chesapeake Bay. These benefits are estimated at $396,000 1985 dollars peryear for commercial fishing activity. Experience with other inshore fisheries suggests thatthe recreational value of striped bass may exceed the commercial value. Efforts are cur-rendy underway to upgrade the quality of the recreational data to allow for more completeunderstanding of the value of New York-caught Chesapeake striped bass.
Acknowledgments
The authors would like to thank Byron Young of the New York Department of Environ-mental Conservation for his helpftil comments and his insight into the New York stripedbass fishery. Additional appreciation is extended to Lee Anderson, Richard Rosenburg,and George Parsons for helpful comments, as well as Thomas White for his comments andresearch assistance. Two anonymous reviewers also made helpful comments. An earlierversion of this paper was presented at the third annual Conference on the Economics ofChesapeake Bay Management, Annapolis MD, May 27-29, 1986. Any errors are theresponsibility of the authors.
This work is the result of research sponsored by the New York Sea Grant Institute, ameiiiber of the Sea Grant College network operated by the national Oceanic and Atmo-spheric Administration, U.S. Department of Commerce, under Grant #NA81AAIX)0027.The U.S. government is authorized to produce and distribute reprints for governmentalpurposes notwithstanding any copyright notation that may appear hereon. The researchwas also partially sponsored by the New York Department of Environmental Conservation.

New York Value of Chesapeake Bass 25
References
Kahn, James R. 1987. Measuring the economic damages associated with the terrestrial pollution ofmarine ecosystems. Marine Resource Economics 4:193-209.
Sloan, Ronald, and E. G. Horn. 1985. PCB in striped bass in marine district of New York in 1984.Bureau of Environmental Protection, Division of Fish and Wildlife, New York Department ofEnvironmental Conservation, Albany, February 1985.
U S . Department of Commerce. 1985. Emergency Striped Bass Research Study: Report for 1985.Washington, D.C.
U.S. Department of Commerce. 1976. New York Landings, Annual Summary 1975. Current FisheryStatistics no. 6912.
U.S. Department of CotTimerce. 1986. Status of the Fishery Resources off the Northeastern UnitedStates for 1986. NOAA Technical Memorandum NMFS-F/NEC-43.