Embed Size (px)
Citation preview
4To reflect FOR IMMEDIATE RELEASE
CANFOR REPORTS RESULTS FOR FIRST QUARTER OF 2021 April 29, 2021 - Vancouver, B.C. - Canfor Corporation (“The Company” or “Canfor”) (TSX: CFP) today reported its first quarter 2021 results:
Overview
Record quarterly reported operating income of $603 million driven by historically high lumber prices and improved global pulp market conditions; record-high quarterly sales of $1.94 billion
Shareholder net income of $428 million, or $3.42 per share
Net debt of $85 million at March 31, 2021; $225 million repayment of term debt in the current quarter
Cumulative cash deposits of $615 million on countervailing and anti-dumping duties at March 31, 2021
Financial Results
The following table summarizes selected financial information for the Company for the comparative periods:
(millions of Canadian dollars, except per share amounts) Q1 Q4 Q1 2021 2020 2020
Sales $ 1,941.8 $ 1,618.0 $ 1,170.7 Reported operating income before amortization $ 696.7 $ 520.0 $ 5.6 Reported operating income (loss) $ 602.6 $ 419.6 $ (88.8) Adjusted operating income before amortization1 $ 694.5 $ 517.0 $ 58.9 Adjusted operating income (loss)1 $ 600.4 $ 416.6 $ (35.5) Net income (loss)2 $ 427.8 $ 335.6 $ (70.0) Net income (loss) per share, basic and diluted2 $ 3.42 $ 2.68 $ (0.56) Adjusted net income (loss)2, 3 $ 434.2 $ 321.7 $ (56.7) Adjusted net income (loss) per share, basic and diluted2, 3 $ 3.47 $ 2.57 $ (0.45) 1 Adjusted for inventory write-downs and recoveries ($2.2 million recovery in Q1 2021, $3.0 million recovery in Q4 2020, $52.3 net write-down in Q1 2020), and restructuring costs ($1.0 million in Q1 2020). Effective Q1 2021, results were no longer adjusted for countervailing and anti-dumping duties. Prior periods above have been restated to reflect this change ($95.5 million net recovery in Q4 2020, $44.4 million expense in Q1 2020). 2 Attributable to equity shareholders of the Company. 3 Adjusted for after-tax impact of certain one-time items, including restructuring costs, foreign exchange (gain) loss on term-debt, and (gain) loss on derivative financial instruments. Effective Q1 2021, net income (loss) and net income (loss) per share were no longer adjusted for the after-tax impact of duty deposits, net of duties recoverable, and foreign exchange on duty deposits recoverable. Prior periods above have been restated to reflect this change (favourable per share impact of $0.51 in Q4 2020, unfavourable $0.24 in Q1 2020).
For the first quarter of 2021, the Company reported operating income of $602.6 million, $183.0 million higher than operating income of $419.6 million reported for the fourth quarter of 2020, reflecting record results for the lumber segment and improved results in the pulp and paper segment.
In the lumber segment, earnings increased $145.7 million quarter-over-quarter, to an all-time high $606.7 million. These results largely reflected continued strength in global lumber market fundamentals, with demand continuing to outpace available supply and driving global benchmark lumber prices to new historical highs. This unprecedented pricing substantially outweighed the impacts of higher market-related log costs in Western Canada, combined with moderately lower North American shipment volumes stemming from transportation constraints, and a 2 cent, or 3%, stronger Canadian dollar.
Global lumber market fundamentals remained exceptionally strong in the first quarter of 2021, principally driven by sustained high levels of North American demand. The North American market continued to benefit from new home construction activity that reflected the ongoing urban-to-suburban shift, strong demand in the repair and remodeling sector and lean inventory in the supply chain.
For the current quarter overall, US housing starts averaged 1,613,000 units on a seasonally adjusted basis, up 2% from the previous quarter, and in March approached a fifteen-year high of 1,739,000 units. In Canada, housing starts were up 28% from the previous quarter, averaging 308,000 units on a seasonally adjusted basis in the first quarter of 2021, largely reflecting a significant up-tick in the Western Canadian market, and reaching an all-time record of 335,000 units in March.
News Release
1
Offshore lumber demand in Asia was relatively stable in the current quarter, with increased consumption in the industrial and construction sectors offset by lower imports as Asian-Pacific markets continue to adjust to the record North American pricing environment.
Western Europe and Scandinavian lumber demand strengthened further in the first quarter of 2021 largely due to increased residential construction activity and sustained growth in the repair and remodeling sector.
The average North American Random Lengths Western Spruce/Pine/Fir (“SPF”) 2x4 #2&Btr price of US$972 per Mfbm was up US$272 per Mfbm, or 39%, from the previous quarter, as downward pricing pressure in January was followed by five consecutive weeks of gains mid-quarter before stabilizing in March, ending the month at an all-time high of US$1,045 per Mfbm. The Company’s Western SPF unit sales realizations substantially increased quarter-over-quarter, primarily reflecting the notable uptick in benchmark pricing and, to a lesser extent, a reduction in countervailing (“CVD”) and anti-dumping (“ADD”) duties, which more than offset the stronger Canadian dollar and relatively unchanged offshore unit sales realizations.
The Southern Yellow Pine (“SYP”) East 2x4 #2 price remained above US$1,100 per Mfbm for most of the current quarter, and reached a new record of US$1,200 per Mfbm mid-March. As a result, the North American Random Lengths SYP East 2x4 #2 price averaged US$1,160 per Mfbm, up US$383 per Mfbm, or 49%, compared to the previous quarter. The material increase in the Company’s SYP lumber unit sales realizations quarter-over-quarter reflected the uplift in the SYP East 2x4 #2 price, combined with more pronounced pricing increases for wider-width dimension products.
The Company’s European lumber unit sales realizations also experienced a substantial uplift compared to the previous quarter, albeit less pronounced than the increases seen in both Western SPF and SYP lumber unit sales realizations to North America. The current quarter’s European lumber unit sales realizations principally reflected strengthening European market demand, combined with a favourable geographic sales mix and the significantly higher North American US-dollar benchmark pricing.
Total lumber shipments, at 1.45 billion board feet, were 7% lower than the previous quarter principally driven by a decline in North American shipments, while European shipments were comparable quarter-over-quarter. Lower shipments in the US South for the most part reflected reduced trucking availability due to unseasonably cold weather. Reduced shipments in Western Canada reflected transportation constraints, combined with a rebuild of finished lumber inventory significantly drawn down during the fourth quarter of 2020.
Total lumber production, at 1.47 billion board feet, was broadly in line with the prior quarter as modestly higher production at the Company’s European operations, tied to fewer statutory holidays in the current period, and slightly higher Western SPF production, was offset by capital-related downtime at the Company’s Camden and Estill mills reducing SYP production in the current period.
Lumber unit manufacturing and product costs were moderately higher than the previous quarter, largely reflecting higher log costs in Western Canada and a more modest increase at the Company’s European operations. In British Columbia (“BC”), log costs were up in the current quarter principally as a result of higher market-based stumpage costs stemming from record pricing in the prior quarter (due to the traditional quarterly lag in the stumpage rate reset). A modest uplift in log costs at the Company’s European operations primarily reflected market-related increases in the region, correlated in part to the rise in European lumber prices. Log costs in the US South were broadly in line with the prior quarter. Unit manufacturing costs also reflected slightly higher conversion costs in the current quarter, particularly for the Company’s European operations, mostly due to seasonally higher energy costs and planned maintenance.
Looking ahead, global lumber market fundamentals are anticipated to remain solid, with ongoing strength in new home construction and steady repair and remodeling activity projected to continue through the second quarter of 2021.
For offshore lumber markets in Asia, demand is anticipated to strengthen, particularly in Japan, as the material pricing pressures and lean inventories experienced in North America impact the region. Demand in Europe is projected to continue to improve through the second quarter of 2021, driven by an anticipated seasonal increase in the residential and construction sector, as well as ongoing strength in the “do-it-yourself” sector. As a result, pricing in Europe in the second quarter of 2021 is forecast to exceed pricing levels seen in the current quarter, reflecting similar trends to the North American market combined with the traditional lag in contract pricing.
2
Results in the pulp and paper segment reflected improving global pulp market conditions, combined with a 25% increase in production at Canfor Pulp Products Inc.’s (“CPPI”) pulp mills quarter-over-quarter.
During the first quarter of 2021, global pulp markets experienced a surge in US-dollar list prices in response to an uptick in demand, particularly from China, combined with ongoing global logistic constraints and supported by strong price increases on the Shanghai Futures Exchange. As a result, Northern Bleached Softwood Kraft (“NBSK”) pulp list prices on orders from China saw sharp increases throughout the period, reaching a high of US$973 per tonne in March, to average US$883 per tonne for the current quarter, up US$246 per tonne, or 39%, from the previous quarter. Prices to North America also saw sharp increases, although not at the same levels as those in China, up US$164 per tonne, or 14%, quarter-over-quarter, to US$1,302 per tonne (before discounts). Reflecting the lag between orders and shipments, the significant majority of these price gains will be realized in the second quarter.
In the pulp and paper segment, global softwood kraft pulp markets are projected to remain well positioned through the second quarter of 2021, driven by both continued solid demand and tight supply arising from the current global supply chain challenges, as well as the traditional spring maintenance period. Reflecting this ongoing positive pricing momentum, CPPI announced increases to its NBSK pulp list prices to China and North America for April 2021 to US$1,010 per tonne and US$1,565 per tonne, respectively. High yield markets are anticipated to see continued improvement through the second quarter of 2021, largely driven by strong demand for board products, especially in Asia, tempered somewhat by available supply.
Commenting on the Company’s first quarter results, Canfor’s President and Chief Executive Officer, Don Kayne, said, “As the world continues to deal with the impacts of the COVID-19 pandemic, we want to thank our employees for their unwavering commitment to safety along with their determination and resilience. They have continued to maintain our standards for producing high quality products for our global customers. Following the significant volatility experienced last year as a result of the pandemic, we are very pleased to see the sustained strength in global lumber markets continuing into 2021, as well as a welcome improvement in pulp market conditions. Our solid operating performance across all our regions enabled us to capitalize on these favourable market fundamentals and set record-high operating earnings. With the pricing outlook in the second quarter looking very positive across all of our businesses, we will be looking to take full advantage of these favourable market conditions.”
Additional Information and Conference Call A conference call to discuss the first quarter’s financial and operating results will be held on Friday, April 30, 2021 at 8:00 AM Pacific time. To participate in the call, in North America please dial Toll-Free 1-888-390-0546. For instant replay access until May 14, 2021, please dial 1-888-390-0541 and enter participant pass code 772487#. The conference call will be webcast live and will be available at www.canfor.com. This news release, the attached financial statements and a presentation used during the conference call can be accessed via the Company’s website at http://www.canfor.com/investor-relations/webcasts.
Non-IFRS Measures and Forward Looking Statements Operating Income before Amortization, Adjusted Operating Income (Loss) and Adjusted Net Income (Loss) and Adjusted Net Income (Loss) per Share are not generally accepted earnings measures and should not be considered as an alternative to net income (loss) or cash flows as determined in accordance with IFRS. Refer to the Company’s Management’s Discussion and Analysis for a reconciliation of Operating Income before Amortization and Adjusted Operating Income (Loss) to Operating Income (Loss) and Adjusted Net Income (Loss) to Net Income (Loss) reported in accordance with IFRS. Certain statements in this press release constitute “forward-looking statements” which involve known and unknown risks, uncertainties and other factors that may cause actual results to be materially different from any future results, performance or achievements expressed or implied by such statements. Words such as “expects”, “anticipates”, “projects”, “intends”, “plans”, “will”, “believes”, “seeks”, “estimates”, “should”, “may”, “could”, and variations of such words and similar expressions are intended to identify such forward-looking statements. These statements are based on management’s current expectations and beliefs and actual events or results may differ materially. There are many factors that could cause such actual events or results expressed or implied by such forward-looking statements to differ materially from any future results expressed or implied by such statements. Forward-looking statements are based on current expectations and Canfor assumes no obligation to update such information to reflect later events or developments, except as required by law. Canfor is a leading integrated forest products company based in Vancouver, BC with interests in BC, Alberta, North and South Carolina, Alabama, Georgia, Mississippi and Arkansas, as well as in Sweden with its majority acquisition of the Vida Group. Canfor produces primarily softwood lumber and also owns a 54.8% interest in Canfor Pulp Products Inc., which is one of the largest global producers of market Northern Bleached Softwood Kraft Pulp and a leading producer of high performance kraft paper. Canfor shares are traded on the Toronto Stock Exchange under the symbol CFP. For more information visit canfor.com. Media Contact: Investor Contact: Michelle Ward Pat Elliott Senior Director, Senior Vice President, Communications & Government Relations Corporate Finance & Sustainability (604) 661-5225 (604) 661-5441 [email protected] [email protected]
3
Canfor Corporation First Quarter 2021 Management’s Discussion and Analysis
This interim Management’s Discussion and Analysis (“MD&A”) provides a review of Canfor Corporation’s (“Canfor” or “the Company”) financial performance for the quarter ended March 31, 2021 relative to the quarters ended December 31, 2020 and March 31, 2020, and the financial position of the Company at March 31, 2021. It should be read in conjunction with Canfor’s unaudited interim consolidated financial statements and accompanying notes for the quarters ended March 31, 2021 and 2020, as well as the 2020 annual MD&A and the 2020 audited consolidated financial statements and notes thereto, which are included in Canfor’s Annual Report for the year ended December 31, 2020 (available at www.canfor.com). The financial information in this interim MD&A has been prepared in accordance with International Financial Reporting Standards (“IFRS”), which is the required reporting framework for Canadian publicly accountable enterprises.
Throughout this discussion, reference is made to Operating Income before Amortization and Adjusted Operating Income (Loss) which Canfor considers to be a relevant indicator for measuring trends in the performance of each of its operating segments and the Company’s ability to generate funds to meet its debt repayment and capital expenditure requirements. Reference is also made to Adjusted Shareholder Net Income (Loss) (calculated as Shareholder Net Income (Loss) less specific items affecting comparability with prior periods – for the full calculation, see the reconciliation included in the section “Analysis of Specific Material Items Affecting Comparability of Net Income (Loss)”) and Adjusted Shareholder Net Income (Loss) per Share (calculated as Adjusted Shareholder Net Income (Loss) divided by the weighted average number of shares outstanding during the period). Operating Income before Amortization and Adjusted Shareholder Net Income (Loss) and Adjusted Shareholder Net Income (Loss) per Share are not generally accepted earnings measures and should not be considered as an alternative to net income or cash flows as determined in accordance with IFRS. As there is no standardized method of calculating these measures, Canfor’s Operating Income before Amortization, Adjusted Operating Income (Loss), Adjusted Shareholder Net Income (Loss) and Adjusted Shareholder Net Income (Loss) per Share may not be directly comparable with similarly titled measures used by other companies. Reconciliations of Operating Income before Amortization to Operating Income (Loss) and Adjusted Shareholder Net Income (Loss) to Net Income (Loss) reported in accordance with IFRS are included in this MD&A. Throughout this discussion, reference is made to the current quarter, which refers to the results for the first quarter of 2021.
Factors that could impact future operations are also discussed. These factors may be influenced by both known and unknown risks and uncertainties that could cause the actual results to be materially different from those stated in this discussion. Factors that could have a material impact on any future oriented statements made herein include, but are not limited to: general economic, market and business conditions; product selling prices; raw material and operating costs; currency exchange rates; interest rates; changes in law and public policy; the outcome of labour and trade disputes; and opportunities available to or pursued by Canfor.
Certain comparative amounts for the prior period have been reclassified to conform to the current year’s presentation.
All financial references are in millions of Canadian dollars unless otherwise noted. The information in this report is as at April 28, 2021.
Forward Looking Statements
Certain statements in this MD&A constitute “forward-looking statements” which involve known and unknown risks, uncertainties and other factors that may cause actual results to be materially different from any future results, performance or achievements expressed or implied by such statements. Words such as “expects”, “anticipates”, “projects”, “intends”, “plans”, “will”, “believes”, “seeks”, “estimates”, “should”, “may”, “could”, and variations of such words and similar expressions are intended to identify such forward-looking statements. These statements are based on management’s current expectations and beliefs and actual events or results may differ materially. There are many factors that could cause such actual events or results expressed or implied by such forward-looking statements to differ materially from any future results expressed or implied by such statements. Forward-looking statements are based on current expectations and the Company assumes no obligation to update such information to reflect later events or developments, except as required by law.
4
FIRST QUARTER 2021 OVERVIEW
Selected Financial Information and Statistics
(millions of Canadian dollars, except ratios)
Q1 Q4 Q1
2021 2020 2020
Operating income (loss) by segment:
Lumber $ 606.7 $ 461.0 $ (89.1)
Pulp and Paper $ 4.9 $ (28.3) $ 6.1
Unallocated and Other $ (9.0) $ (13.1) $ (5.8)
Total operating income (loss) $ 602.6 $ 419.6 $ (88.8)
Add: Amortization1 $ 94.1 $ 100.4 $ 94.4
Total operating income before amortization $ 696.7 $ 520.0 $ 5.6
Add (deduct):
Working capital movements $ (354.7) $ (21.2) $ (76.5)
Defined benefit plan contributions, net $ (4.1) $ (2.4) $ (5.3)
Income taxes received (paid), net $ (60.1) $ (14.5) $ 28.8
Adjustment to accrued duties2 $ 10.4 $ (142.0) $ 11.3
Other operating cash flows, net3 $ 22.2 $ 20.2 $ 29.3
Cash from (used in) operating activities $ 310.4 $ 360.1 $ (6.8)
Add (deduct):
Capital additions $ (65.8) $ (93.9) $ (53.1)
Finance expenses paid $ (6.8) $ (10.3) $ (13.3)
Proceeds from (repayments of) term debt, net $ (229.1) $ (8.3) $ 0.6
Phased acquisition of Elliott $ (38.2) $ - $ -
Proceeds received from sale of Vavenby forest tenure $ - $ - $ 56.5
Other, net3 $ (20.8) $ (19.0) $ (3.5)
Change in cash / operating loans $ (50.3) $ 228.6 $ (19.6)
ROIC – Consolidated period-to-date4 17.7% 14.1% (2.7)%
Average exchange rate (US$ per C$1.00)5 $ 0.790 $ 0.767 $ 0.744
Average exchange rate (SEK per C$1.00)5 6.628 6.608 7.203 1 Amortization includes amortization of certain capitalized major maintenance costs. 2 Adjusted to true-up preliminary ADD deposits to the Company’s current accrual rates. 3 Further information on cash flows may be found in the Company’s unaudited interim consolidated financial statements. 4 Consolidated Return on Invested Capital (“ROIC”) is equal to operating income (loss) plus realize gains (losses) on derivative financial instruments (i.e. excluding mark-to-market adjustments), plus other income (expense) and excluding non-controlling interest, divided by the average invested capital during the period. Invested capital represents total assets excluding cash and total liabilities excluding term debt, retirement benefit obligations, long-term deferred reforestation obligations, and deferred taxes. 5 Source – Bank of Canada (monthly average rate for the period).
5
Analysis of Specific Material Items Affecting Comparability of Shareholder Net Income (Loss)
After-tax impact, net of non-controlling interests (millions of Canadian dollars, except per share amounts)
Q1 2021
Q4 2020
Q1 2020
Shareholder net income (loss), as reported $ 427.8 $ 335.6 $ (70.0)
Foreign exchange (gain) loss on term debt $ (2.6) $ (11.7) $ 15.0
(Gain) loss on derivative financial instruments $ 9.0 $ (2.2) $ (2.4)
Restructuring, mill closure and severance costs, net $ - $ - $ 0.7
Net impact of above items $ 6.4 $ (13.9) $ 13.3
Adjusted shareholder net income (loss)6 $ 434.2 $ 321.7 $ (56.7)
Shareholder net income (loss) per share (EPS), as reported $ 3.42 $ 2.68 $ (0.56)
Net impact of above items per share $ 0.05 $ (0.11) $ 0.11
Adjusted shareholder net income (loss) per share6 $ 3.47 $ 2.57 $ (0.45) 6 Effective Q1 2021, shareholder net income (loss) and shareholder net income (loss) per share were no longer adjusted for the after-tax impact of duty deposits, net of duties recoverable, or foreign exchange on duty deposits recoverable. Prior periods above have been restated to reflect this change (favourable per share impact of $0.51 in Q4 2020, unfavourable $0.24 in Q1 2020).
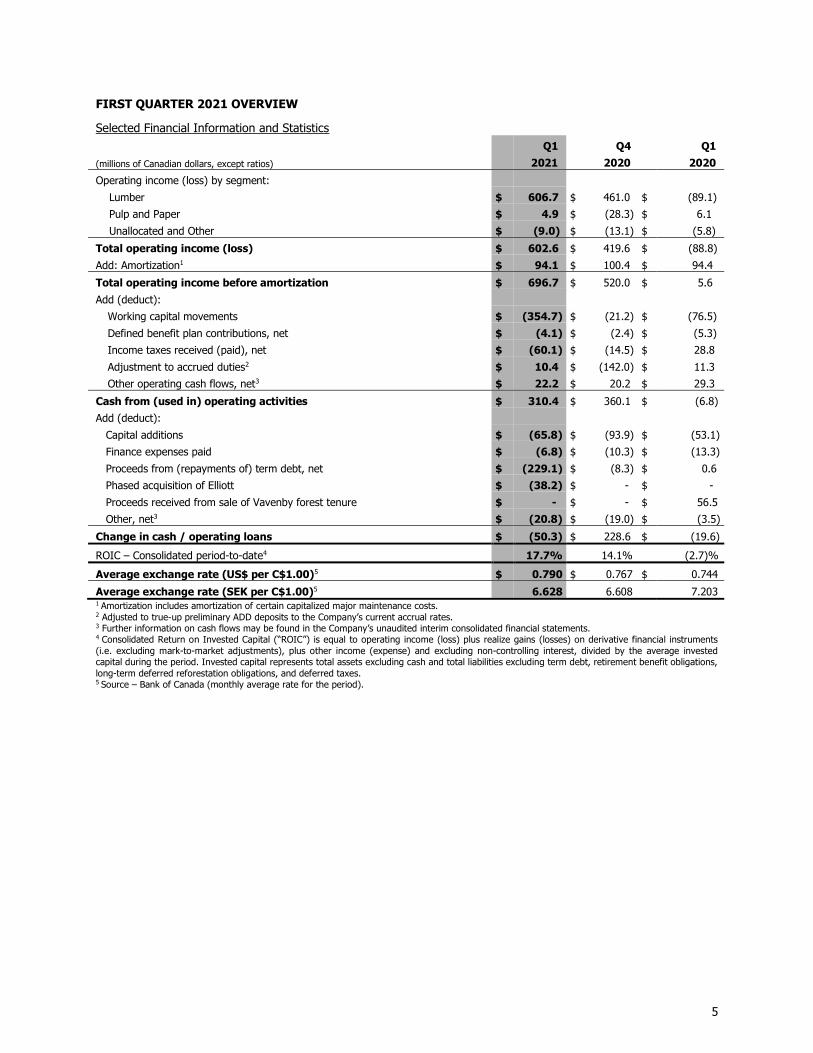
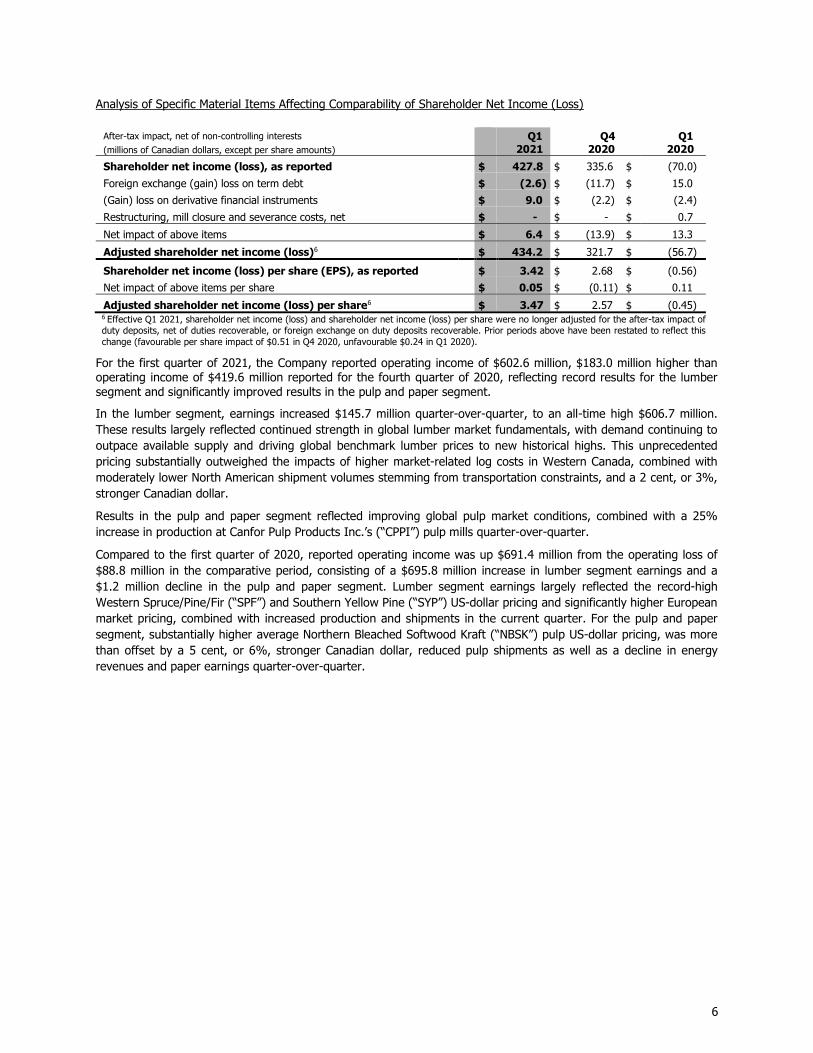
For the first quarter of 2021, the Company reported operating income of $602.6 million, $183.0 million higher than operating income of $419.6 million reported for the fourth quarter of 2020, reflecting record results for the lumber segment and significantly improved results in the pulp and paper segment.
In the lumber segment, earnings increased $145.7 million quarter-over-quarter, to an all-time high $606.7 million. These results largely reflected continued strength in global lumber market fundamentals, with demand continuing to outpace available supply and driving global benchmark lumber prices to new historical highs. This unprecedented pricing substantially outweighed the impacts of higher market-related log costs in Western Canada, combined with moderately lower North American shipment volumes stemming from transportation constraints, and a 2 cent, or 3%, stronger Canadian dollar.
Results in the pulp and paper segment reflected improving global pulp market conditions, combined with a 25% increase in production at Canfor Pulp Products Inc.’s (“CPPI”) pulp mills quarter-over-quarter.
Compared to the first quarter of 2020, reported operating income was up $691.4 million from the operating loss of $88.8 million in the comparative period, consisting of a $695.8 million increase in lumber segment earnings and a $1.2 million decline in the pulp and paper segment. Lumber segment earnings largely reflected the record-high Western Spruce/Pine/Fir (“SPF”) and Southern Yellow Pine (“SYP”) US-dollar pricing and significantly higher European market pricing, combined with increased production and shipments in the current quarter. For the pulp and paper segment, substantially higher average Northern Bleached Softwood Kraft (“NBSK”) pulp US-dollar pricing, was more than offset by a 5 cent, or 6%, stronger Canadian dollar, reduced pulp shipments as well as a decline in energy revenues and paper earnings quarter-over-quarter.
6
OPERATING RESULTS BY BUSINESS SEGMENT
Lumber
Selected Financial Information and Statistics – Lumber Q1 Q4 Q1 (millions of Canadian dollars, unless otherwise noted) 2021 2020 2020
Sales7 $ 1,679.5 $ 1,380.2 $ 895.2
Operating income (loss) before amortization7 $ 679.7 $ 539.0 $ (16.6)
Operating income (loss)7 $ 606.7 $ 461.0 $ (89.1)
Inventory write-down expense $ - $ - $ 63.0
Restructuring, mill closure and severance costs, net $ - $ - $ 1.0
Adjusted operating income (loss)8 $ 606.7 $ 461.0 $ (25.1)
Average WSPF 2x4 #2&Btr lumber price in US$9 $ 972 $ 700 $ 399
Average WSPF 2x4 #2&Btr lumber price in Cdn$9 $ 1,231 $ 911 $ 536
Average SYP 2x4 #2 lumber price in US$10 $ 1,160 $ 777 $ 386
Average SYP 2x4 #2 lumber price in Cdn$10 $ 1,469 $ 1,012 $ 519
Average European indicative SPF lumber price in SEK11 4,572 4,115 3,352
Average European indicative SPF lumber price in US$11 $ 545 $ 478 $ 346
Average European indicative SPF lumber price in Cdn$11 $ 690 $ 623 $ 466
US housing starts (thousand units SAAR)12 1,613 1,584 1,484
Production – WSPF lumber (MMfbm)13 713 697 628
Production – SYP lumber (MMfbm)13 414 433 364
Production – European lumber (MMfbm)13 347 331 293
Shipments – WSPF lumber (MMfbm)14 664 733 574
Shipments – SYP lumber (MMfbm)14 390 438 363
Shipments – European lumber (MMfbm)14 395 389 314 7 Q1 2021 includes sales of $384.5 million, operating income of $88.5 million, and operating income before amortization of $108.6 million from European operations (Q4 2020 – sales of $282.0 million, operating income of $63.1 million, and operating income before amortization of $82.7 million; Q1 2020 – sales of $227.9 million, operating income of $5.4 million, and operating income before amortization of $21.6 million). Operating income from the European operations in Q1 2021 includes $10.8 million in incremental amortization and other expenses driven by the purchase price allocation at acquisition date (Q4 2020 - $10.9 million; Q1 2020 - $10.0 million). 8 Effective Q1 2021, results were no longer adjusted for countervailing and anti-dumping duties. Prior periods above have been restated to reflect this change ($95.5 million net recovery in Q4 2020, $44.4 million expense in Q1 2020). 9 Western Spruce/Pine/Fir, per thousand board feet (Source – Random Lengths Publications, Inc.); Average Western SPF 2x4 #2&Btr lumber price in Cdn$ calculated as average Western SPF 2x4 #2&Btr lumber price in US$ multiplied by the average exchange rate – Cdn$ per US$1.00 according to Bank of Canada monthly average for the period. 10 Southern Yellow Pine, Eastside, per thousand board feet (Source – Random Lengths Publications, Inc.). 11 European indicative lumber price is an internally generated benchmark based on delivered price to the largest continental market; Average European indicative SPF lumber price in US$ and Cdn$ calculated as average European indicative lumber price in SEK multiplied by the average exchange rate – US$ and Cdn$ per SEK1.00, respectively, according to Bank of Canada monthly average rate for the period. 12 Source – US Census Bureau, seasonally adjusted annual rate (“SAAR”).
13 Excluding production of trim blocks. 14 Canfor produced lumber, including lumber purchased for remanufacture and engineered wood, excluding trim blocks, wholesale shipments and lumber sold on behalf of third parties.
Markets
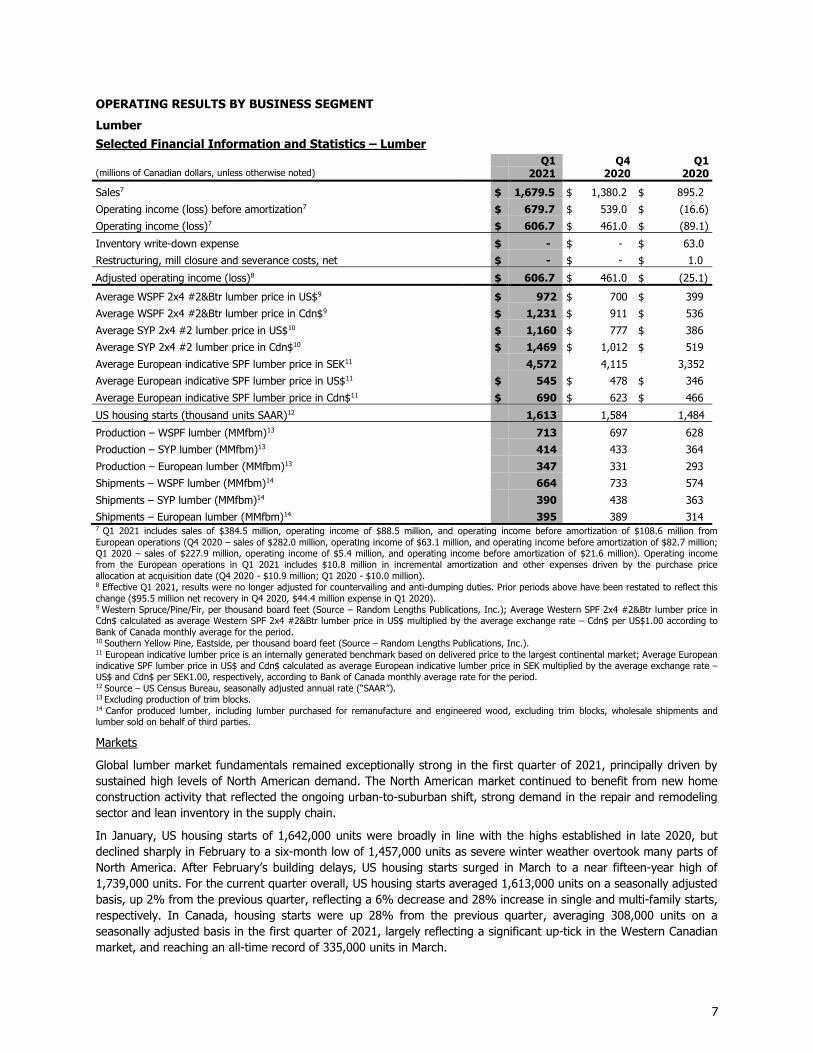
Global lumber market fundamentals remained exceptionally strong in the first quarter of 2021, principally driven by sustained high levels of North American demand. The North American market continued to benefit from new home construction activity that reflected the ongoing urban-to-suburban shift, strong demand in the repair and remodeling sector and lean inventory in the supply chain.
In January, US housing starts of 1,642,000 units were broadly in line with the highs established in late 2020, but declined sharply in February to a six-month low of 1,457,000 units as severe winter weather overtook many parts of North America. After February’s building delays, US housing starts surged in March to a near fifteen-year high of 1,739,000 units. For the current quarter overall, US housing starts averaged 1,613,000 units on a seasonally adjusted basis, up 2% from the previous quarter, reflecting a 6% decrease and 28% increase in single and multi-family starts, respectively. In Canada, housing starts were up 28% from the previous quarter, averaging 308,000 units on a seasonally adjusted basis in the first quarter of 2021, largely reflecting a significant up-tick in the Western Canadian market, and reaching an all-time record of 335,000 units in March.
7
Offshore lumber demand in Asia was relatively stable in the current quarter, with increased consumption in the industrial and construction sectors offset by lower imports as Asian-Pacific markets continue to adjust to the record North American pricing environment.
Western Europe and Scandinavian lumber demand strengthened further in the first quarter of 2021 largely due to increased residential construction activity and sustained growth in the repair and remodeling sector.
Sales
Sales revenues for the lumber segment for the first quarter of 2021 were $1,679.5 million, an all-time quarterly record, and up $299.3 million compared to the previous quarter and up $784.3 million from the first quarter of 2020. The 22% increase in sales revenue over the prior quarter principally reflected record-high Western SPF and SYP US-dollar pricing and significant increases in the European market pricing in the current quarter, offset to a small extent by moderately lower Western SPF and SYP shipment volumes, primarily tied to transportation constraints, and the 3% stronger Canadian dollar. Compared to the first quarter of 2020, sales revenues increased by 88%, reflecting a substantial spike in lumber benchmark pricing in all three operating regions and significantly higher shipments, despite a 6% stronger Canadian dollar.
Total lumber shipments, at 1.45 billion board feet, were 7% lower than the previous quarter principally driven by a decline in North American shipments, while European shipments were comparable quarter-over-quarter. Lower shipments in the US South for the most part reflected reduced trucking availability due to unseasonably cold weather. Reduced shipments in Western Canada reflected transportation constraints combined with a rebuild of finished lumber inventory significantly drawn down during the fourth quarter of 2020.
Total lumber shipments were 16% higher than the first quarter of 2020, largely reflecting increased production in the current period, combined with the benefit of improved quarter-over-quarter transportation conditions following weather-related constraints, rail line blockages and coronavirus (“COVID-19”) related vessel disruptions experienced in the comparative period.
The average North American Random Lengths Western SPF 2x4 #2&Btr price of US$972 per Mfbm was up US$272 per Mfbm, or 39%, from the previous quarter, as downward pricing pressure in January was followed by five consecutive weeks of gains mid-quarter before stabilizing in March, ending the month at an all-time high of US$1,045 per Mfbm. The Company’s Western SPF unit sales realizations substantially increased quarter-over-quarter, primarily reflecting the notable uptick in benchmark pricing and, to a lesser extent, a reduction in countervailing (“CVD”) and anti-dumping (“ADD”) duties, which more than offset the stronger Canadian dollar and relatively unchanged offshore unit sales realizations.
The SYP East 2x4 #2 price remained well above US$1,100 per Mfbm for most of the current quarter, and reached a new record of US$1,200 per Mfbm mid-March. As a result, the North American Random Lengths SYP East 2x4 #2 price averaged US$1,160 per Mfbm, up US$383 per Mfbm, or 49%, compared to the previous quarter. The material increase in the Company’s SYP lumber unit sales realizations quarter-over-quarter reflected the uplift in the SYP East 2x4 #2 price, combined with more pronounced pricing increases for wider-width dimension products.
The Company’s European lumber unit sales realizations also experienced a substantial uplift compared to the previous quarter, albeit less pronounced than the increases seen in both Western SPF and SYP lumber unit sales realizations to North America. The current quarter’s European lumber unit sales realizations principally reflected strengthening European market demand, combined with a favourable geographic sales mix and the significantly higher North American US-dollar benchmark pricing.
Compared to the first quarter of 2020, the Company’s lumber unit sales realizations were substantially higher in all three operating regions, primarily reflecting the significant surge in global lumber market fundamentals and, specifically, North American and European lumber prices in the current quarter, compared to the low benchmark pricing seen in the comparative period, as the initial effects of the pandemic began to impact global macroeconomics.
The North American Random Lengths Western SPF 2x4 #2&Btr price was up US$573 per Mfbm, or 144%, from the first quarter of 2020, while the SYP East 2x4 #2 increased US$774 per Mfbm, or 201%, with similar increases seen in SYP wider-width dimensions. Over the same comparative period, the Company’s European lumber unit sales realizations benefited from a substantial increase in European market pricing, as well as an 8% weaker Canadian dollar (versus the Swedish Krona (“SEK”)).
8
Other revenues for the Company’s lumber segment (which are primarily comprised of residual fibre, pulp log and pellets sales, as well as the Company’s European operations’ other related revenues) increased moderately when compared to the previous quarter, primarily driven by seasonally higher Western SPF log sales revenue related to pulp logs, and to a lesser extent, a timing-related increase in packaging and modular housing sales at the Company’s European operations. Compared to the first quarter of 2020, other revenues also experienced a moderate increase as a result of higher packaging sales (timing-related) in Europe, as well as a slight increase in residual fibre revenues.
Operations
Total lumber production, at 1.47 billion board feet, was broadly in line with the prior quarter as modestly higher production at the Company’s European operations, tied to fewer statutory holidays in the current period, and slightly higher Western SPF production, was offset by capital-related downtime at the Company’s Camden and Estill mills reducing SYP production in the current period.
Compared to the first quarter of 2020, total lumber production was up 15%, largely reflecting the acquisition of Elliott Sawmilling Co., LLC (“Elliott”) in May 2020 and capital ramp-ups in the US South, the Vida Group’s (“Vida”) purchase of Bergs Timber Production AB (“Bergs”) sawmill assets in September 2020, as well as improved productivity and an increase in operating days at the Company’s Western SPF operations following COVID-19 related curtailments at the end of the comparative period.
Lumber unit manufacturing and product costs were moderately higher than the previous quarter, largely reflecting higher log costs in Western Canada and a more modest increase at the Company’s European operations. In British Columbia (“BC”), log costs were up in the current quarter principally as a result of higher market-based stumpage costs stemming from record pricing in the prior quarter (due to the traditional quarterly lag in the stumpage rate reset). A modest uplift in log costs at the Company’s European operations primarily reflected market-related increases in the region, correlated in part to the rise in European lumber prices. Log costs in the US South were broadly in line with the prior quarter. Unit manufacturing costs also reflected slightly higher conversion costs in the current quarter, particularly for the Company’s European operations, mostly due to seasonally higher energy costs and planned maintenance.
Compared to the first quarter of 2020, lumber unit manufacturing costs were moderately higher, largely reflecting the aforementioned log cost increases in Western Canada and Europe in the current period.
Pulp and Paper
Selected Financial Information and Statistics – Pulp and Paper15
Q1 Q4 Q1 (millions of Canadian dollars, unless otherwise noted) 2021 2020 2020
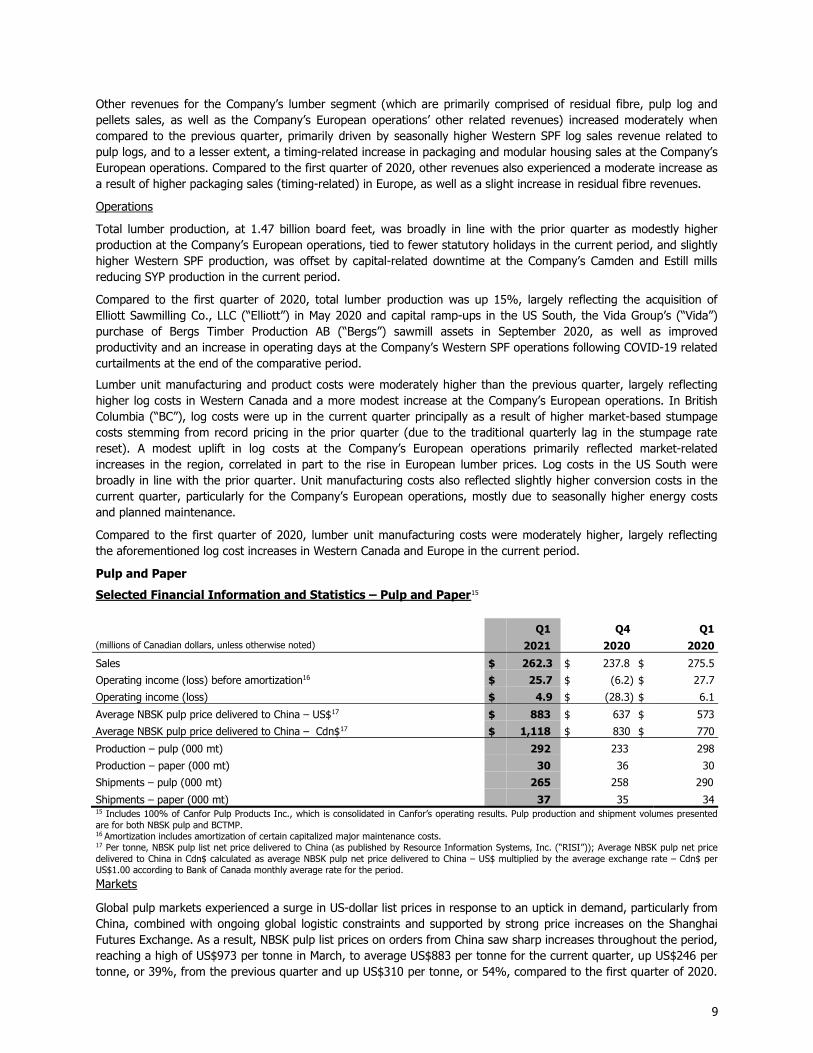
Sales $ 262.3 $ 237.8 $ 275.5
Operating income (loss) before amortization16 $ 25.7 $ (6.2) $ 27.7
Operating income (loss) $ 4.9 $ (28.3) $ 6.1
Average NBSK pulp price delivered to China – US$17 $ 883 $ 637 $ 573
Average NBSK pulp price delivered to China – Cdn$17 $ 1,118 $ 830 $ 770
Production – pulp (000 mt) 292 233 298
Production – paper (000 mt) 30 36 30
Shipments – pulp (000 mt) 265 258 290
Shipments – paper (000 mt) 37 35 34 15 Includes 100% of Canfor Pulp Products Inc., which is consolidated in Canfor’s operating results. Pulp production and shipment volumes presented are for both NBSK pulp and BCTMP. 16 Amortization includes amortization of certain capitalized major maintenance costs. 17 Per tonne, NBSK pulp list net price delivered to China (as published by Resource Information Systems, Inc. (“RISI”)); Average NBSK pulp net price delivered to China in Cdn$ calculated as average NBSK pulp net price delivered to China – US$ multiplied by the average exchange rate – Cdn$ per US$1.00 according to Bank of Canada monthly average rate for the period.
Markets
Global pulp markets experienced a surge in US-dollar list prices in response to an uptick in demand, particularly from China, combined with ongoing global logistic constraints and supported by strong price increases on the Shanghai Futures Exchange. As a result, NBSK pulp list prices on orders from China saw sharp increases throughout the period, reaching a high of US$973 per tonne in March, to average US$883 per tonne for the current quarter, up US$246 per tonne, or 39%, from the previous quarter and up US$310 per tonne, or 54%, compared to the first quarter of 2020.
9
Prices to North America also saw sharp increases, although not at the same levels as those in China, up US$164 per tonne, or 14%, from the previous quarter and up US$175 per tonne, or 16%, compared to the same period in the prior year, to US$1,302 per tonne (before discounts). Reflecting the lag between orders and shipments, the significant majority of these price gains will be realized in the second quarter of 2021.
Despite strong demand fundamentals, global softwood pulp producer inventories at the end of February 2021 were above the balanced range at 39 days18 of supply, up 4 days from December 2020, largely reflecting the aforementioned supply chain constraints. (Market conditions are generally considered balanced when inventories are in the 28-36 days of supply range).
Global bleached kraft paper markets improved in all major regions through the first quarter of 2021, driven largely by solid demand for kraft paper products that meet food grade specifications.
Sales
Pulp shipments for the first quarter of 2021 were 265,000 tonnes, up 7,000 tonnes, or 3%, from the previous quarter and down 25,000 tonnes, or 9%, from the first quarter of 2020. Increased shipments in the current quarter largely reflected improved pulp production, offset in part by the replenishment of inventory levels significantly drawn down during the fourth quarter of 2020 due to the Northwood NBSK pulp mill’s (“Northwood”) recovery boiler number five (“RB5”) outage. Global transportation constraints also impacted shipment volumes through the current period. Compared to the first quarter of 2020, the decrease in pulp shipments primarily reflected the rebuild of pulp inventories in the current quarter.
CPPI’s NBSK pulp unit sales realizations saw a significant increase compared to both comparative periods, largely reflecting improved prices on shipments in the current period, which more than offset the stronger Canadian dollar. Average Bleached Chemi-Thermo Mechanical Pulp (“BCTMP”) unit sales realizations were broadly in line with the previous quarter and moderately down compared to the first quarter of 2020, as more modest upward positive trends in BCTMP US-dollar pricing were offset by the stronger Canadian dollar in both comparative periods.
Energy revenues increased in the current quarter compared to the fourth quarter of 2020, largely reflecting a return to more normalized power generation levels combined with seasonally higher energy prices. Compared to the first quarter of 2020, energy revenues were down, principally due to a reduction in turbine operating days largely due to the continuation of Northwood’s RB5 lower furnace replacement into mid-January 2021.
Paper shipments in the first quarter of 2021 were 37,000 tonnes, up 2,000 tonnes from the previous quarter, and up 3,000 tonnes from the first quarter of 2020, principally reflecting the timing of shipments around quarter-end compared to both comparative periods.
Paper unit sales realizations in the first quarter of 2021 were broadly in line with the previous quarter, as a modest uptick in US-dollar pricing in North America was offset by the 3% stronger Canadian dollar. Compared to the first quarter of 2020, paper unit sales realizations were moderately lower reflecting a 6% stronger Canadian dollar on relatively flat US-dollar prices.
Operations
Pulp production was 292,000 tonnes for the first quarter of 2021, up 59,000 tonnes, or 25%, from the previous quarter, principally reflecting the benefit of increased operating days, following the completion in mid-January of Northwood’s RB5 capital-related downtime (approximately 10,000 tonnes), offset in part by several operational issues experienced at CPPI’s Prince George NBSK (“PG”) pulp mill in the current period. In the fourth quarter of 2020, pulp production was principally impacted by Northwood’s scheduled maintenance outage in October (approximately 25,000 tonnes), as well as the extended outage on one production line at Northwood to enable the replacement of RB5’s lower furnace (approximately 60,000 tonnes).
Compared to the first quarter of 2020, pulp production was down 6,000 tonnes, or 2%, primarily reflecting the completion of Northwood’s recovery boiler downtime in the current period, offset in part, by increased production at CPPI’s Intercontinental NBSK pulp mill quarter-over-quarter.
18 World 20 data is based on twenty producing countries representing 80% of world chemical market pulp capacity and is based on information compiled and prepared by the Pulp and Paper Products Council (“PPPC”).
10
Pulp unit manufacturing costs were moderately lower than the prior quarter as the benefit of increased production in the current quarter was offset in part by seasonally higher energy prices and, to a lesser extent, planned maintenance spend. Fibre costs were broadly in line with the previous period as higher market-based prices for sawmill residual chips in the current quarter offset seasonal pricing adjustments.
Pulp unit manufacturing costs were comparable to the first quarter of 2020, principally reflecting lower fibre costs offset by increased maintenance spend and, to a lesser extent, higher energy and chemical costs in the current quarter. Fibre costs were down compared to the first quarter of 2020, primarily driven by an increased proportion of lower-cost sawmill residual chips, mostly due to higher operating rates at Canfor’s sawmills.
Paper production for the first quarter of 2021 was 30,000 tonnes, down 6,000 tonnes from the previous quarter, largely due to reduced productivity, reflecting several operational challenges at the PG Pulp and Paper mill in the current quarter. Paper production was in line with the first quarter of 2020.
Higher paper unit manufacturing costs, compared to both the fourth quarter of 2020 and first quarter of 2020, principally reflected higher slush pulp costs associated with increased average NBSK pulp sales realizations in the current quarter.
Unallocated and Other Items
Selected Financial Information
Q1 Q4 Q1 (millions of Canadian dollars) 2021 2020 2020
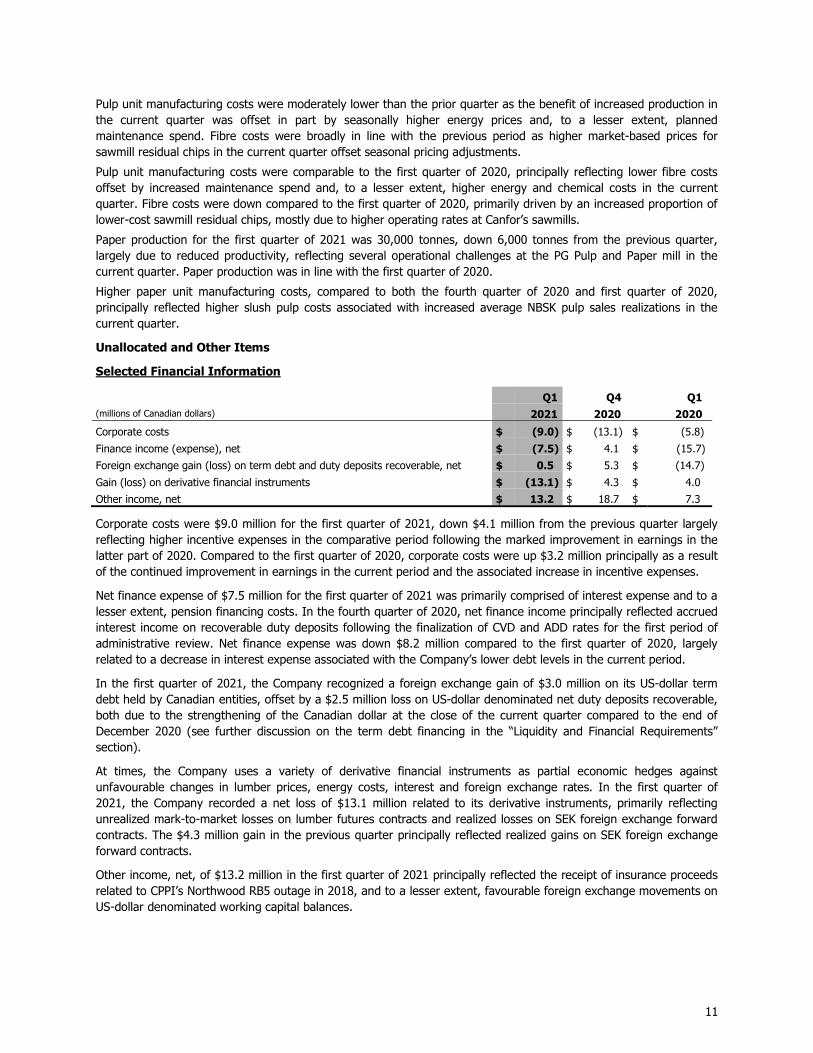
Corporate costs $ (9.0) $ (13.1) $ (5.8)
Finance income (expense), net $ (7.5) $ 4.1 $ (15.7)
Foreign exchange gain (loss) on term debt and duty deposits recoverable, net $ 0.5 $ 5.3 $ (14.7)
Gain (loss) on derivative financial instruments $ (13.1) $ 4.3 $ 4.0
Other income, net $ 13.2 $ 18.7 $ 7.3
Corporate costs were $9.0 million for the first quarter of 2021, down $4.1 million from the previous quarter largely reflecting higher incentive expenses in the comparative period following the marked improvement in earnings in the latter part of 2020. Compared to the first quarter of 2020, corporate costs were up $3.2 million principally as a result of the continued improvement in earnings in the current period and the associated increase in incentive expenses.
Net finance expense of $7.5 million for the first quarter of 2021 was primarily comprised of interest expense and to a lesser extent, pension financing costs. In the fourth quarter of 2020, net finance income principally reflected accrued interest income on recoverable duty deposits following the finalization of CVD and ADD rates for the first period of administrative review. Net finance expense was down $8.2 million compared to the first quarter of 2020, largely related to a decrease in interest expense associated with the Company’s lower debt levels in the current period.
In the first quarter of 2021, the Company recognized a foreign exchange gain of $3.0 million on its US-dollar term debt held by Canadian entities, offset by a $2.5 million loss on US-dollar denominated net duty deposits recoverable, both due to the strengthening of the Canadian dollar at the close of the current quarter compared to the end of December 2020 (see further discussion on the term debt financing in the “Liquidity and Financial Requirements” section).
At times, the Company uses a variety of derivative financial instruments as partial economic hedges against unfavourable changes in lumber prices, energy costs, interest and foreign exchange rates. In the first quarter of 2021, the Company recorded a net loss of $13.1 million related to its derivative instruments, primarily reflecting unrealized mark-to-market losses on lumber futures contracts and realized losses on SEK foreign exchange forward contracts. The $4.3 million gain in the previous quarter principally reflected realized gains on SEK foreign exchange forward contracts.
Other income, net, of $13.2 million in the first quarter of 2021 principally reflected the receipt of insurance proceeds related to CPPI’s Northwood RB5 outage in 2018, and to a lesser extent, favourable foreign exchange movements on US-dollar denominated working capital balances.
11
Other Comprehensive Income (Loss)
The following table summarizes Canfor’s Other Comprehensive Income (Loss) for the comparable periods:
Q1 Q4 Q1 (millions of Canadian dollars) 2021 2020 2020
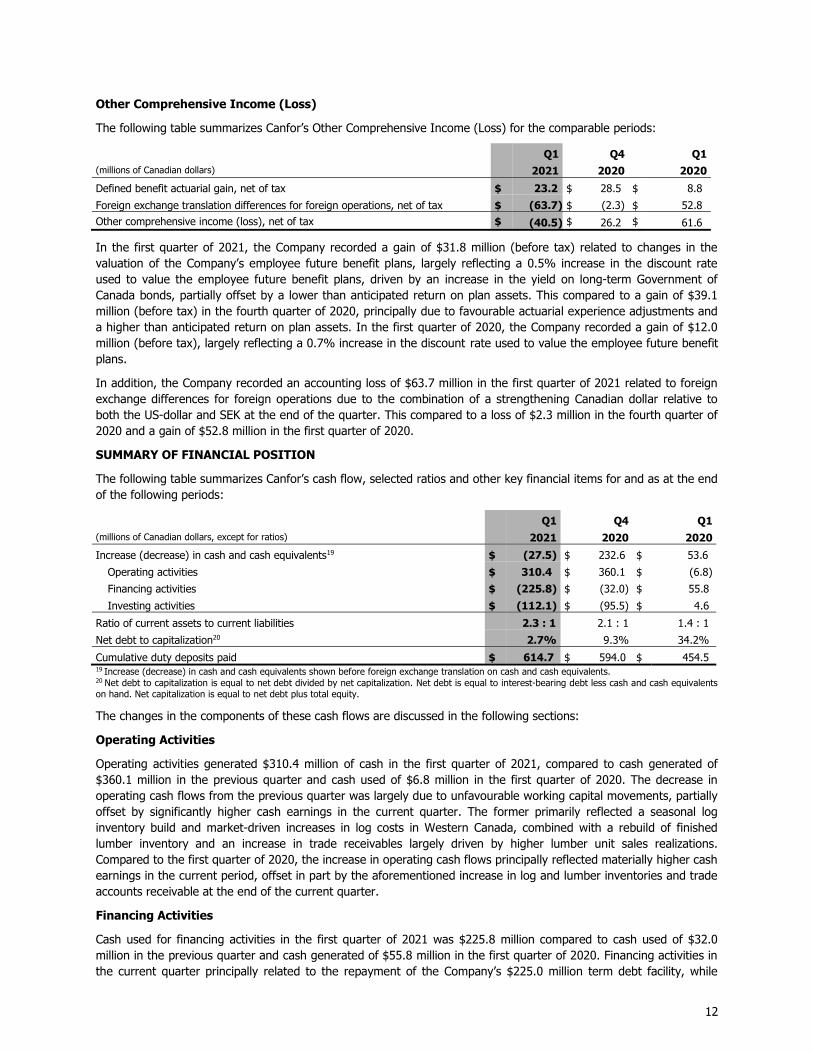
Defined benefit actuarial gain, net of tax $ 23.2 $ 28.5 $ 8.8
Foreign exchange translation differences for foreign operations, net of tax $ (63.7) $ (2.3) $ 52.8
Other comprehensive income (loss), net of tax $ (40.5) $ 26.2 $ 61.6
In the first quarter of 2021, the Company recorded a gain of $31.8 million (before tax) related to changes in the valuation of the Company’s employee future benefit plans, largely reflecting a 0.5% increase in the discount rate used to value the employee future benefit plans, driven by an increase in the yield on long-term Government of Canada bonds, partially offset by a lower than anticipated return on plan assets. This compared to a gain of $39.1 million (before tax) in the fourth quarter of 2020, principally due to favourable actuarial experience adjustments and a higher than anticipated return on plan assets. In the first quarter of 2020, the Company recorded a gain of $12.0 million (before tax), largely reflecting a 0.7% increase in the discount rate used to value the employee future benefit plans.
In addition, the Company recorded an accounting loss of $63.7 million in the first quarter of 2021 related to foreign exchange differences for foreign operations due to the combination of a strengthening Canadian dollar relative to both the US-dollar and SEK at the end of the quarter. This compared to a loss of $2.3 million in the fourth quarter of 2020 and a gain of $52.8 million in the first quarter of 2020.
SUMMARY OF FINANCIAL POSITION
The following table summarizes Canfor’s cash flow, selected ratios and other key financial items for and as at the end of the following periods:
Q1 Q4 Q1 (millions of Canadian dollars, except for ratios) 2021 2020 2020
Increase (decrease) in cash and cash equivalents19 $ (27.5) $ 232.6 $ 53.6
Operating activities $ 310.4 $ 360.1 $ (6.8)
Financing activities $ (225.8) $ (32.0) $ 55.8
Investing activities $ (112.1) $ (95.5) $ 4.6
Ratio of current assets to current liabilities 2.3 : 1 2.1 : 1 1.4 : 1
Net debt to capitalization20 2.7% 9.3% 34.2%
Cumulative duty deposits paid $ 614.7 $ 594.0 $ 454.5 19 Increase (decrease) in cash and cash equivalents shown before foreign exchange translation on cash and cash equivalents. 20 Net debt to capitalization is equal to net debt divided by net capitalization. Net debt is equal to interest-bearing debt less cash and cash equivalents on hand. Net capitalization is equal to net debt plus total equity.
The changes in the components of these cash flows are discussed in the following sections:
Operating Activities
Operating activities generated $310.4 million of cash in the first quarter of 2021, compared to cash generated of $360.1 million in the previous quarter and cash used of $6.8 million in the first quarter of 2020. The decrease in operating cash flows from the previous quarter was largely due to unfavourable working capital movements, partially offset by significantly higher cash earnings in the current quarter. The former primarily reflected a seasonal log inventory build and market-driven increases in log costs in Western Canada, combined with a rebuild of finished lumber inventory and an increase in trade receivables largely driven by higher lumber unit sales realizations. Compared to the first quarter of 2020, the increase in operating cash flows principally reflected materially higher cash earnings in the current period, offset in part by the aforementioned increase in log and lumber inventories and trade accounts receivable at the end of the current quarter.
Financing Activities
Cash used for financing activities in the first quarter of 2021 was $225.8 million compared to cash used of $32.0 million in the previous quarter and cash generated of $55.8 million in the first quarter of 2020. Financing activities in the current quarter principally related to the repayment of the Company’s $225.0 million term debt facility, while
12
financing activities in the fourth quarter of 2020 primarily reflected interest, lease and debt payments. Cash generated from financing activities in the first quarter of 2020 was largely related to draw-downs on the Company’s operating loan facility to finance working capital requirements.
Investing Activities
Cash used for investing activities was $112.1 million for the current quarter, compared to cash used of $95.5 million for the previous quarter and cash generated of $4.6 million for the same quarter of 2020. Investing activities in the current quarter included the third and final instalment payment of $38.2 million (US$30.3 million) associated with the phased acquisition of Elliott. In the first quarter of 2020, investing activities principally reflected the closing of the sale of the Company’s Vavenby forest tenure for net proceeds of $56.5 million.
Capital additions in the first quarter of 2021 were $65.8 million, down $28.1 million from the previous quarter and up $12.7 million from the first quarter of 2020. In the lumber segment, current quarter capital expenditures largely reflected maintenance-of-business in Western Canada and capital upgrades at the Company’s Camden and Estill mills in the US South. In the pulp and paper segment, capital expenditures were primarily comprised of the completion of Northwood’s RB5 capital upgrades, as well as maintenance-of-business capital.
Liquidity and Financial Requirements
Operating Loans - Consolidated
At March 31, 2021, on a consolidated basis, including CPPI and Vida, the Company had cash of $385.0 million, with $28.4 million drawn on its operating loan facilities, and an additional $79.8 million reserved for several standby letters of credit. Total available undrawn operating loans at the end of the quarter were $942.1 million, including the undrawn facilities for letters of credit.
Operating Loans – Canfor, excluding Vida and CPPI
On March 26, 2021, Canfor, excluding Vida and CPPI, repaid its Canadian dollar denominated floating rate term debt and in turn, increased the principal of its committed operating loan facility by $225.0 million, to $775.0 million. In addition, on March 26, 2021, Canfor, excluding Vida and CPPI, cancelled its $200.0 million revolving credit facility.
Interest is payable on Canfor’s committed operating loan facility, excluding Vida and CPPI, at floating rates based on the lenders’ Canadian prime rate, bankers’ acceptances, US-dollar base rate or US-dollar LIBOR rate, plus a margin that varies with the Company’s debt to total capitalization ratio.
As at March 31, 2021, Canfor, excluding CPPI and Vida, had operating loan facilities totaling $845.0 million, with no amounts drawn on its principal committed operating loan facility and $66.9 million reserved for several standby letters of credit, the majority of which related to unregistered pension plans, leaving $778.1 million available and undrawn on its operating loan facilities at the end of the period.
Operating Loans – Vida
Vida’s operating loan facilities are denominated in various currencies, with interest payable at fixed rates ranging from 1.0% to 1.3%. Vida also has separate overdraft facilities with fixed interest rates ranging from 1.7% to 4.7%. Vida’s operating loan facilities have certain financial covenants including minimum equity and interest coverage ratios.
At March 31, 2021, Vida had $13.4 million drawn on its $95.3 million operating loan facilities, leaving $81.9 million available and undrawn at the end of the quarter.
Operating Loans – CPPI
The terms of CPPI’s operating loan facility include interest payable at floating rates that vary depending on the ratio of debt to total capitalization and is based on lenders’ Canadian prime rate, bankers’ acceptances, US-dollar base rate or US-dollar LIBOR rate, plus a margin.
At March 31, 2021, CPPI had a $110.0 million operating loan facility, with $15.0 million drawn in the current quarter and a further $12.9 million reserved for several standby letters of credit under the operating loan facility, leaving $82.1 million available and undrawn on its operating loan facility at the end of the quarter.
13
Term Debt
On March 26, 2021, Canfor, excluding Vida and CPPI, repaid its $225.0 million Canadian dollar denominated floating rate term debt.
Canfor’s and CPPI’s term debt, excluding Vida, is unsecured. Vida’s term debt is secured by its property, plant and equipment assets.
The Company’s consolidated net debt to total capitalization at the end the first quarter of 2021 was 2.7%. For Canfor, excluding CPPI, net debt to capitalization at the end of the first quarter of 2021 was 0.9%.
Net Debt and Liquidity - Consolidated
At March 31, 2021, on a consolidated basis, including CPPI and Vida, the Company had total net debt of $85.0 million, down $184.9 million from the end of the previous quarter, and available liquidity of $1,327.1 million. Available liquidity decreased by $30.7 million during the current quarter.
Debt Covenants
Canfor, Vida and CPPI remained in compliance with all covenants relating to their respective operating loan facilities and term debt during the quarter and expect to remain so for the foreseeable future. Substantially all borrowings of Vida and CPPI are non-recourse to other entities within the Company.
Shares Outstanding
As at March 31, 2021 and April 28, 2021, there were 125,219,400 common shares of the Company outstanding, and Canfor’s ownership interest in CPPI and Vida was at 54.8% and 70.0%, respectively.
OUTLOOK
Lumber
Looking ahead, global lumber market fundamentals are anticipated to remain solid, with ongoing strength in new home construction and steady repair and remodeling activity projected to continue through the second quarter of 2021.
For offshore lumber markets in Asia, demand is anticipated to strengthen, particularly in Japan, as the material pricing pressures and lean inventories experienced in North America impact the region. Demand in Europe is projected to continue to improve through the second quarter of 2021, driven by an anticipated seasonal increase in the residential and construction sector, as well as ongoing strength in the “do-it-yourself” sector. As a result, pricing in Europe in the second quarter of 2021 is estimated to exceed pricing levels seen in the current quarter, reflecting similar trends to the North American market combined with the traditional lag in contract pricing.
Pulp and Paper
Global softwood kraft pulp markets are projected to remain well positioned through the second quarter of 2021, driven by both continued solid demand and tight supply arising from the current global supply chain challenges, as well as the traditional spring maintenance period. Reflecting this ongoing positive momentum, CPPI announced increases to its NBSK pulp list prices to China and North America for April 2021 to US$1,010 per tonne and US$1,565 per tonne, respectively. High yield markets are anticipated to see continued improvement through the second quarter of 2021, largely driven by strong demand for board products, especially in Asia, tempered somewhat by available supply.
Results in the second quarter of 2021 are anticipated to reflect the record-high pricing as well as a scheduled maintenance outage at CPPI’s Intercontinental NBSK pulp mill, with a projected 14,000 tonnes of reduced NBSK pulp production, combined with higher associated maintenance costs and lower projected shipment volume.
Bleached kraft paper demand is currently anticipated to show continued strength through the second quarter of 2021 and stabilize through the balance of 2021.
CRITICAL ACCOUNTING ESTIMATES
The preparation of financial statements in conformity with International Financial Reporting Standards (“IFRS”) requires management to make estimates and assumptions that affect the amounts recorded in the financial statements. On an ongoing basis, management reviews its estimates, including those related to useful lives for amortization, impairment of long-lived assets, certain accounts receivable, pension and other employee future benefit
14
plans, asset retirement and deferred reforestation obligations, and the determination of ADD expensed and recorded as recoverable based upon currently available information. While it is reasonably possible that circumstances may arise which cause actual results to differ from these estimates, management does not believe it is likely that any such differences will materially affect the Company’s financial condition, other than the possibility of material effects to the income statement from the Company’s estimated ADD net duty deposits recoverable as discussed in Note 4 of the consolidated interim financial statements.
ADOPTION OF NEW ACCOUNTING STANDARDS
Effective January 1, 2021, the Company has adopted amendments to IFRS 9 Financial Instruments, IAS 39 Financial Instruments: Recognition and Measurement, IFRS 7 Financial Instruments: Disclosures, and IFRS 16 Leases, Interest Rate Benchmark Reform – Phase 2 (“Phase 2”) as issued in August 2020. Phase 2 of the amendments required financial instruments measured using amortized cost to be adjusted to reflect changes to the effective interest rate. For the Company, the adoption of Phase 2 is applicable to its Canadian dollar denominated floating rate term debt and its committed operating loan facilities, excluding Vida, which have yet to transition to an alternative benchmark interest rate as at March 31, 2021. As a result, there was no impact to the Company’s financial results upon adoption of Phase 2.
INTERNAL CONTROLS OVER FINANCIAL REPORTING
During the quarter ended March 31, 2021, there were no changes in the Company’s internal controls over financial reporting that materially affected, or would be reasonably likely to materially affect, such controls.
RISKS AND UNCERTAINTIES
A comprehensive discussion of risks and uncertainties is included in the Company’s 2020 annual statutory reports which are available on www.canfor.com or www.sedar.com.
There have been no adverse impacts of COVID-19 on the Company in the first quarter of 2021. Please see the Company’s annual disclosures referenced above for further information.
In addition to exposure to changes in product prices and foreign exchange, the Company’s financial results are impacted by seasonal factors such as weather and building activity. Adverse weather conditions, as well as forest fires, can cause logging curtailments, which can affect the supply of raw materials to sawmills and pulp mills. Market demand also varies seasonally to some degree. For example, building activity and repair and renovation work, which affects demand for lumber products, is generally stronger in the spring and fall months. Shipment volumes are affected by these factors as well as by global supply and demand conditions. Net income is also impacted by fluctuations in Canadian dollar exchange rates, and the revaluation to the period end rate of US-dollar and SEK denominated working capital balances, US-dollar and SEK denominated debt and revaluation of outstanding derivative financial instruments.
15
SELECTED QUARTERLY FINANCIAL INFORMATION
Q1 2021
Q4 2020
Q3 2020
Q2 2020
Q1 2020
Q4 2019
Q3 2019
Q2 2019
Sales and income (loss) (millions of Canadian dollars)
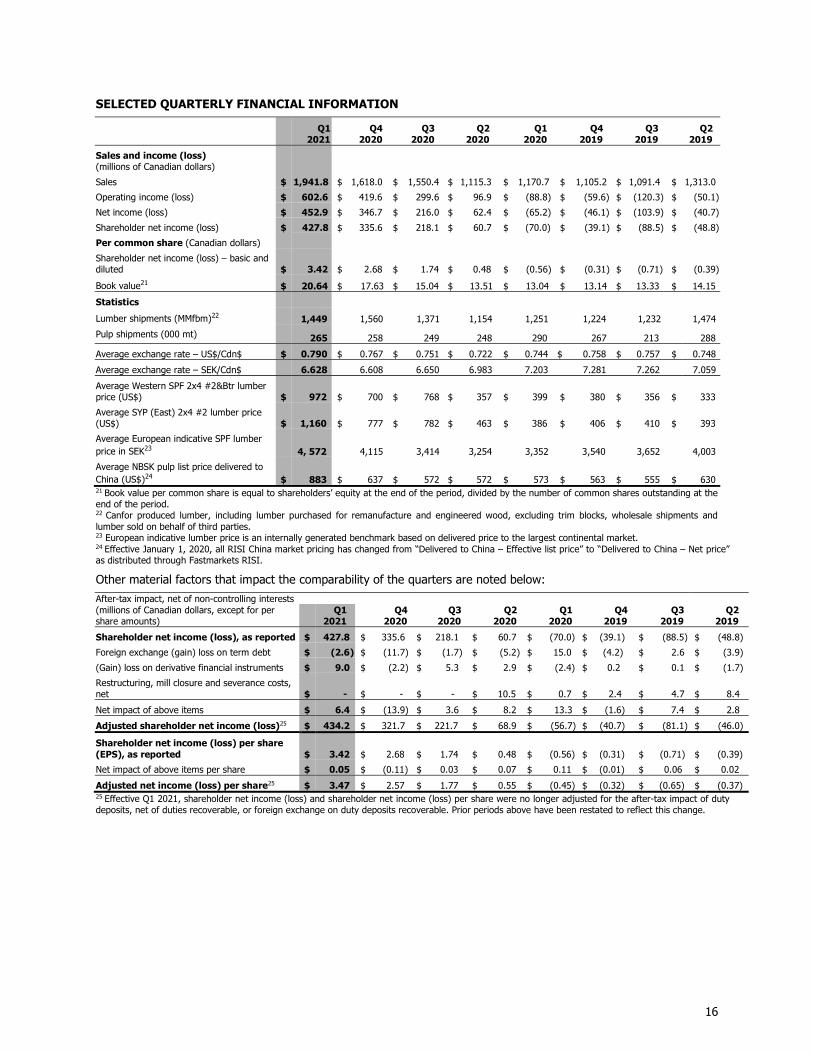
Sales $ 1,941.8 $ 1,618.0 $ 1,550.4 $ 1,115.3 $ 1,170.7 $ 1,105.2 $ 1,091.4 $ 1,313.0
Operating income (loss) $ 602.6 $ 419.6 $ 299.6 $ 96.9 $ (88.8) $ (59.6) $ (120.3) $ (50.1)
Net income (loss) $ 452.9 $ 346.7 $ 216.0 $ 62.4 $ (65.2) $ (46.1) $ (103.9) $ (40.7)
Shareholder net income (loss) $ 427.8 $ 335.6 $ 218.1 $ 60.7 $ (70.0) $ (39.1) $ (88.5) $ (48.8)
Per common share (Canadian dollars)
Shareholder net income (loss) – basic and diluted $ 3.42 $ 2.68 $ 1.74 $ 0.48 $ (0.56) $ (0.31) $ (0.71) $ (0.39)
Book value21 $ 20.64 $ 17.63 $ 15.04 $ 13.51 $ 13.04 $ 13.14 $ 13.33 $ 14.15
Statistics
Lumber shipments (MMfbm)22 1,449 1,560 1,371 1,154 1,251 1,224 1,232 1,474
Pulp shipments (000 mt) 265 258 249 248 290 267 213 288
Average exchange rate – US$/Cdn$ $ 0.790 $ 0.767 $ 0.751 $ 0.722 $ 0.744 $ 0.758 $ 0.757 $ 0.748
Average exchange rate – SEK/Cdn$ 6.628 6.608 6.650 6.983 7.203 7.281 7.262 7.059
Average Western SPF 2x4 #2&Btr lumber price (US$) $ 972 $ 700 $ 768 $ 357 $ 399 $ 380 $ 356 $ 333
Average SYP (East) 2x4 #2 lumber price (US$) $ 1,160 $ 777 $ 782 $ 463 $ 386 $ 406 $ 410 $ 393
Average European indicative SPF lumber price in SEK23 4, 572 4,115 3,414 3,254 3,352 3,540 3,652 4,003
Average NBSK pulp list price delivered to China (US$)24 $ 883 $ 637 $ 572 $ 572 $ 573 $ 563 $ 555 $ 630 21 Book value per common share is equal to shareholders’ equity at the end of the period, divided by the number of common shares outstanding at the end of the period. 22 Canfor produced lumber, including lumber purchased for remanufacture and engineered wood, excluding trim blocks, wholesale shipments and lumber sold on behalf of third parties. 23 European indicative lumber price is an internally generated benchmark based on delivered price to the largest continental market. 24 Effective January 1, 2020, all RISI China market pricing has changed from “Delivered to China – Effective list price” to “Delivered to China – Net price” as distributed through Fastmarkets RISI.
Other material factors that impact the comparability of the quarters are noted below:
After-tax impact, net of non-controlling interests (millions of Canadian dollars, except for per share amounts)
Q1 2021
Q4 2020
Q3 2020
Q2 2020
Q1 2020
Q4 2019
Q3 2019
Q2 2019
Shareholder net income (loss), as reported $ 427.8 $ 335.6 $ 218.1 $ 60.7 $ (70.0) $ (39.1) $ (88.5) $ (48.8)
Foreign exchange (gain) loss on term debt $ (2.6) $ (11.7) $ (1.7) $ (5.2) $ 15.0 $ (4.2) $ 2.6 $ (3.9)
(Gain) loss on derivative financial instruments $ 9.0 $ (2.2) $ 5.3 $ 2.9 $ (2.4) $ 0.2 $ 0.1 $ (1.7)
Restructuring, mill closure and severance costs, net $ - $ - $ - $ 10.5 $ 0.7 $ 2.4 $ 4.7 $ 8.4
Net impact of above items $ 6.4 $ (13.9) $ 3.6 $ 8.2 $ 13.3 $ (1.6) $ 7.4 $ 2.8
Adjusted shareholder net income (loss)25 $ 434.2 $ 321.7 $ 221.7 $ 68.9 $ (56.7) $ (40.7) $ (81.1) $ (46.0)
Shareholder net income (loss) per share (EPS), as reported $ 3.42 $ 2.68 $ 1.74 $ 0.48 $ (0.56) $ (0.31) $ (0.71) $ (0.39)
Net impact of above items per share $ 0.05 $ (0.11) $ 0.03 $ 0.07 $ 0.11 $ (0.01) $ 0.06 $ 0.02
Adjusted net income (loss) per share25 $ 3.47 $ 2.57 $ 1.77 $ 0.55 $ (0.45) $ (0.32) $ (0.65) $ (0.37) 25 Effective Q1 2021, shareholder net income (loss) and shareholder net income (loss) per share were no longer adjusted for the after-tax impact of duty deposits, net of duties recoverable, or foreign exchange on duty deposits recoverable. Prior periods above have been restated to reflect this change.
16
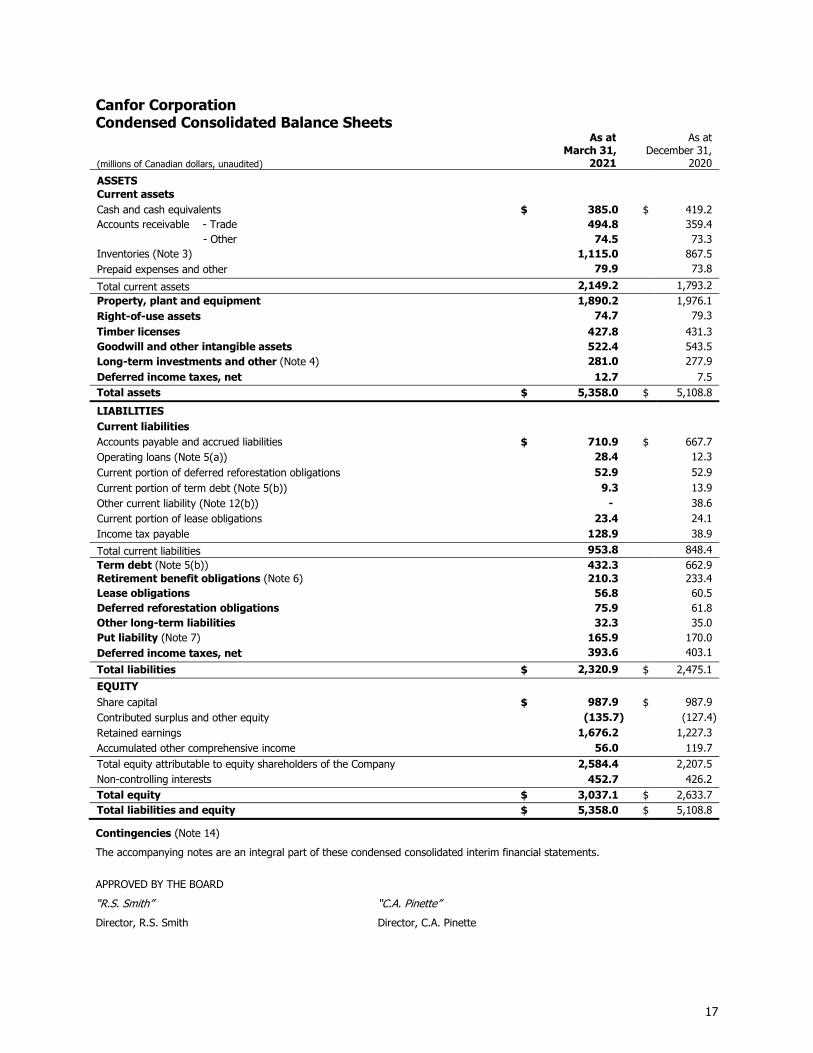
Canfor Corporation Condensed Consolidated Balance Sheets
(millions of Canadian dollars, unaudited)
As at March 31,
2021
As at December 31,
2020
ASSETS Current assets Cash and cash equivalents $ 385.0 $ 419.2 Accounts receivable - Trade 494.8 359.4 - Other 74.5 73.3 Inventories (Note 3) 1,115.0 867.5 Prepaid expenses and other 79.9 73.8
Total current assets 2,149.2 1,793.2 Property, plant and equipment 1,890.2 1,976.1 Right-of-use assets 74.7 79.3
Timber licenses 427.8 431.3 Goodwill and other intangible assets 522.4 543.5 Long-term investments and other (Note 4) 281.0 277.9 Deferred income taxes, net 12.7 7.5 Total assets $ 5,358.0 $ 5,108.8
LIABILITIES
Current liabilities Accounts payable and accrued liabilities $ 710.9 $ 667.7 Operating loans (Note 5(a)) 28.4 12.3 Current portion of deferred reforestation obligations 52.9 52.9 Current portion of term debt (Note 5(b)) 9.3 13.9 Other current liability (Note 12(b)) - 38.6 Current portion of lease obligations 23.4 24.1 Income tax payable 128.9 38.9
Total current liabilities 953.8 848.4 Term debt (Note 5(b)) 432.3 662.9 Retirement benefit obligations (Note 6) 210.3 233.4 Lease obligations 56.8 60.5 Deferred reforestation obligations 75.9 61.8 Other long-term liabilities 32.3 35.0 Put liability (Note 7) 165.9 170.0 Deferred income taxes, net 393.6 403.1
Total liabilities $ 2,320.9 $ 2,475.1
EQUITY Share capital $ 987.9 $ 987.9 Contributed surplus and other equity (135.7) (127.4) Retained earnings 1,676.2 1,227.3 Accumulated other comprehensive income 56.0 119.7
Total equity attributable to equity shareholders of the Company 2,584.4 2,207.5 Non-controlling interests 452.7 426.2 Total equity $ 3,037.1 $ 2,633.7 Total liabilities and equity $ 5,358.0 $ 5,108.8
Contingencies (Note 14)
The accompanying notes are an integral part of these condensed consolidated interim financial statements. APPROVED BY THE BOARD
“R.S. Smith” “C.A. Pinette”
Director, R.S. Smith Director, C.A. Pinette
17
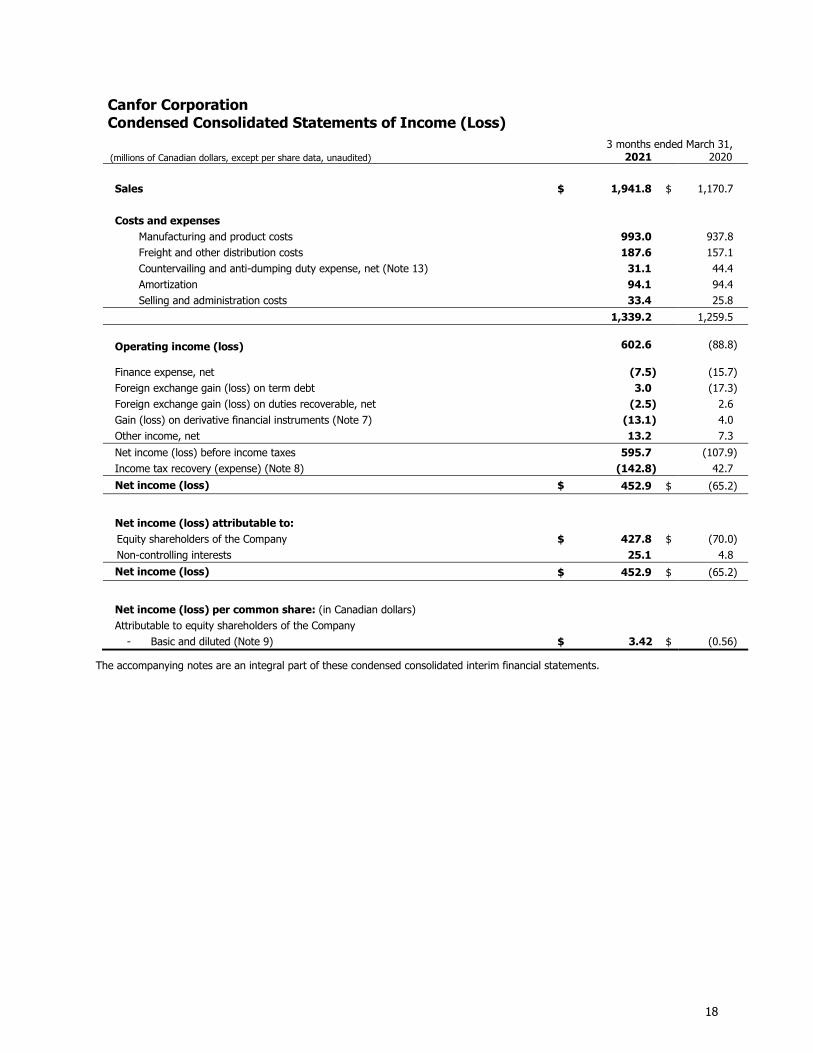
Canfor Corporation
Condensed Consolidated Statements of Income (Loss) 3 months ended March 31,
(millions of Canadian dollars, except per share data, unaudited) 2021 2020 Sales $ 1,941.8 $ 1,170.7
Costs and expenses
Manufacturing and product costs 993.0 937.8 Freight and other distribution costs 187.6 157.1 Countervailing and anti-dumping duty expense, net (Note 13) 31.1 44.4 Amortization 94.1 94.4 Selling and administration costs 33.4 25.8
1,339.2 1,259.5
Operating income (loss) 602.6 (88.8)
Finance expense, net (7.5) (15.7) Foreign exchange gain (loss) on term debt 3.0 (17.3) Foreign exchange gain (loss) on duties recoverable, net (2.5) 2.6 Gain (loss) on derivative financial instruments (Note 7) (13.1) 4.0 Other income, net 13.2 7.3
Net income (loss) before income taxes 595.7 (107.9) Income tax recovery (expense) (Note 8) (142.8) 42.7
Net income (loss) $ 452.9 $ (65.2)
Net income (loss) attributable to: Equity shareholders of the Company $ 427.8 $ (70.0) Non-controlling interests 25.1 4.8
Net income (loss) $ 452.9 $ (65.2)
Net income (loss) per common share: (in Canadian dollars) Attributable to equity shareholders of the Company
- Basic and diluted (Note 9) $ 3.42 $ (0.56)
The accompanying notes are an integral part of these condensed consolidated interim financial statements.
18
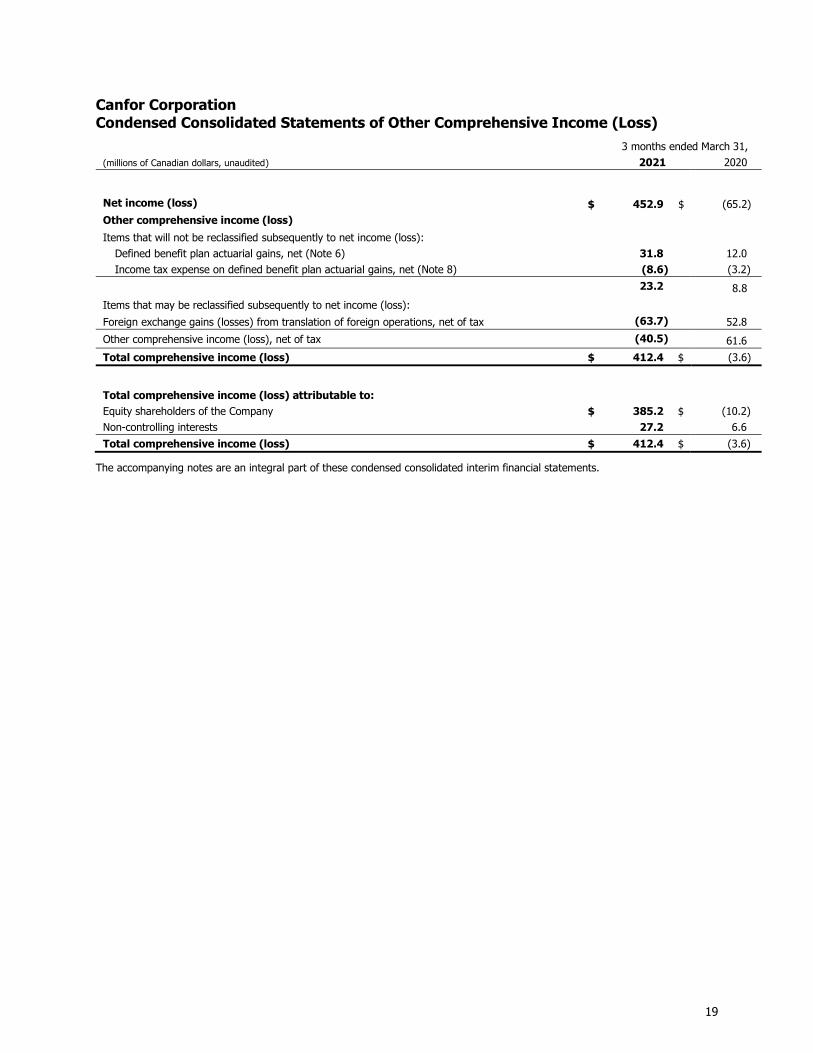
Canfor Corporation
Condensed Consolidated Statements of Other Comprehensive Income (Loss)
3 months ended March 31, (millions of Canadian dollars, unaudited) 2021 2020
Net income (loss) $ 452.9 $ (65.2) Other comprehensive income (loss) Items that will not be reclassified subsequently to net income (loss):
Defined benefit plan actuarial gains, net (Note 6) 31.8 12.0 Income tax expense on defined benefit plan actuarial gains, net (Note 8) (8.6) (3.2)
23.2 8.8
Items that may be reclassified subsequently to net income (loss):
Foreign exchange gains (losses) from translation of foreign operations, net of tax (63.7) 52.8
Other comprehensive income (loss), net of tax (40.5) 61.6
Total comprehensive income (loss) $ 412.4 $ (3.6)
Total comprehensive income (loss) attributable to: Equity shareholders of the Company $ 385.2 $ (10.2) Non-controlling interests 27.2 6.6
Total comprehensive income (loss) $ 412.4 $ (3.6)
The accompanying notes are an integral part of these condensed consolidated interim financial statements.
19
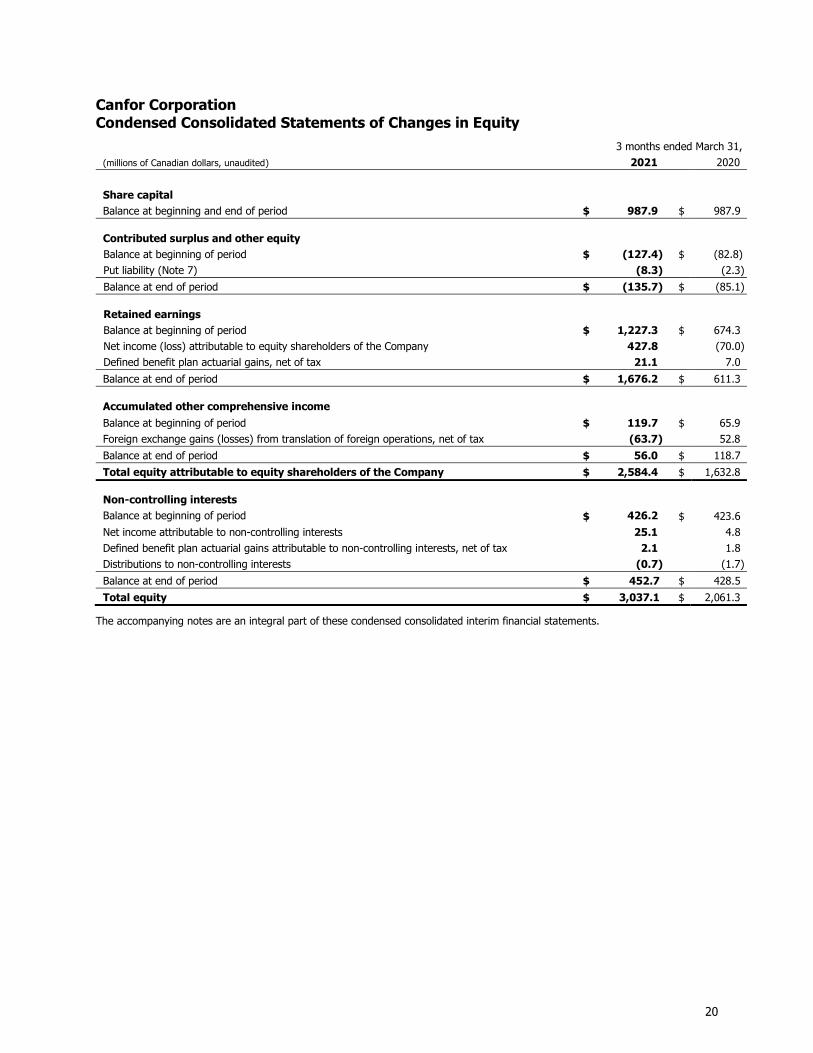
Canfor Corporation
Condensed Consolidated Statements of Changes in Equity
3 months ended March 31, (millions of Canadian dollars, unaudited) 2021 2020
Share capital Balance at beginning and end of period $ 987.9 $ 987.9 Contributed surplus and other equity Balance at beginning of period $ (127.4) $ (82.8) Put liability (Note 7) (8.3) (2.3)
Balance at end of period $ (135.7) $ (85.1)
Retained earnings Balance at beginning of period $ 1,227.3 $ 674.3 Net income (loss) attributable to equity shareholders of the Company 427.8 (70.0) Defined benefit plan actuarial gains, net of tax 21.1 7.0
Balance at end of period $ 1,676.2 $ 611.3 Accumulated other comprehensive income Balance at beginning of period $ 119.7 $ 65.9 Foreign exchange gains (losses) from translation of foreign operations, net of tax (63.7) 52.8
Balance at end of period $ 56.0 $ 118.7
Total equity attributable to equity shareholders of the Company $ 2,584.4 $ 1,632.8 Non-controlling interests Balance at beginning of period $ 426.2 $ 423.6 Net income attributable to non-controlling interests 25.1 4.8 Defined benefit plan actuarial gains attributable to non-controlling interests, net of tax 2.1 1.8 Distributions to non-controlling interests (0.7) (1.7)
Balance at end of period $ 452.7 $ 428.5
Total equity $ 3,037.1 $ 2,061.3
The accompanying notes are an integral part of these condensed consolidated interim financial statements.
20
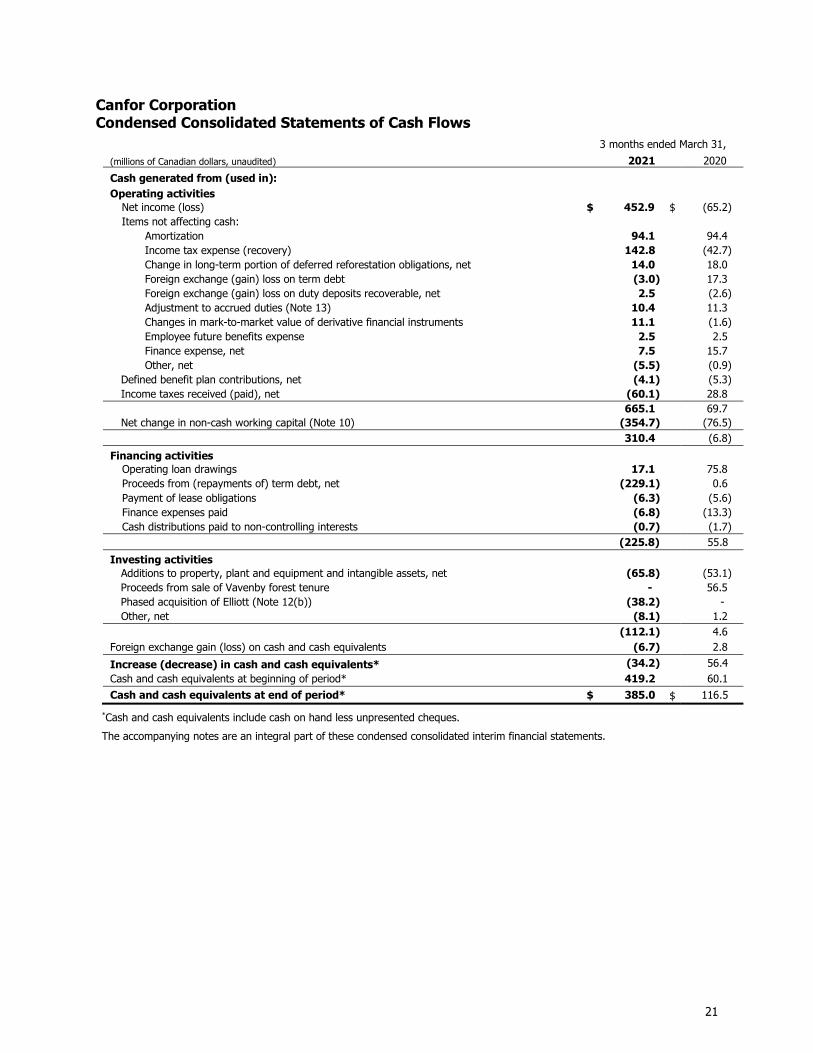
Canfor Corporation Condensed Consolidated Statements of Cash Flows
3 months ended March 31,
(millions of Canadian dollars, unaudited) 2021 2020
Cash generated from (used in): Operating activities Net income (loss) $ 452.9 $ (65.2) Items not affecting cash:
Amortization 94.1 94.4 Income tax expense (recovery) 142.8 (42.7) Change in long-term portion of deferred reforestation obligations, net 14.0 18.0 Foreign exchange (gain) loss on term debt (3.0) 17.3 Foreign exchange (gain) loss on duty deposits recoverable, net 2.5 (2.6)
Adjustment to accrued duties (Note 13) 10.4 11.3 Changes in mark-to-market value of derivative financial instruments 11.1 (1.6) Employee future benefits expense 2.5 2.5 Finance expense, net 7.5 15.7 Other, net (5.5) (0.9) Defined benefit plan contributions, net (4.1) (5.3) Income taxes received (paid), net (60.1) 28.8 665.1 69.7 Net change in non-cash working capital (Note 10) (354.7) (76.5)
310.4 (6.8)
Financing activities Operating loan drawings 17.1 75.8 Proceeds from (repayments of) term debt, net (229.1) 0.6 Payment of lease obligations (6.3) (5.6)
Finance expenses paid (6.8) (13.3) Cash distributions paid to non-controlling interests (0.7) (1.7) (225.8) 55.8
Investing activities Additions to property, plant and equipment and intangible assets, net (65.8) (53.1)
Proceeds from sale of Vavenby forest tenure - 56.5 Phased acquisition of Elliott (Note 12(b)) (38.2) -
Other, net (8.1) 1.2 (112.1) 4.6 Foreign exchange gain (loss) on cash and cash equivalents (6.7) 2.8
Increase (decrease) in cash and cash equivalents* (34.2) 56.4 Cash and cash equivalents at beginning of period* 419.2 60.1
Cash and cash equivalents at end of period* $ 385.0 $ 116.5
*Cash and cash equivalents include cash on hand less unpresented cheques.
The accompanying notes are an integral part of these condensed consolidated interim financial statements.
21
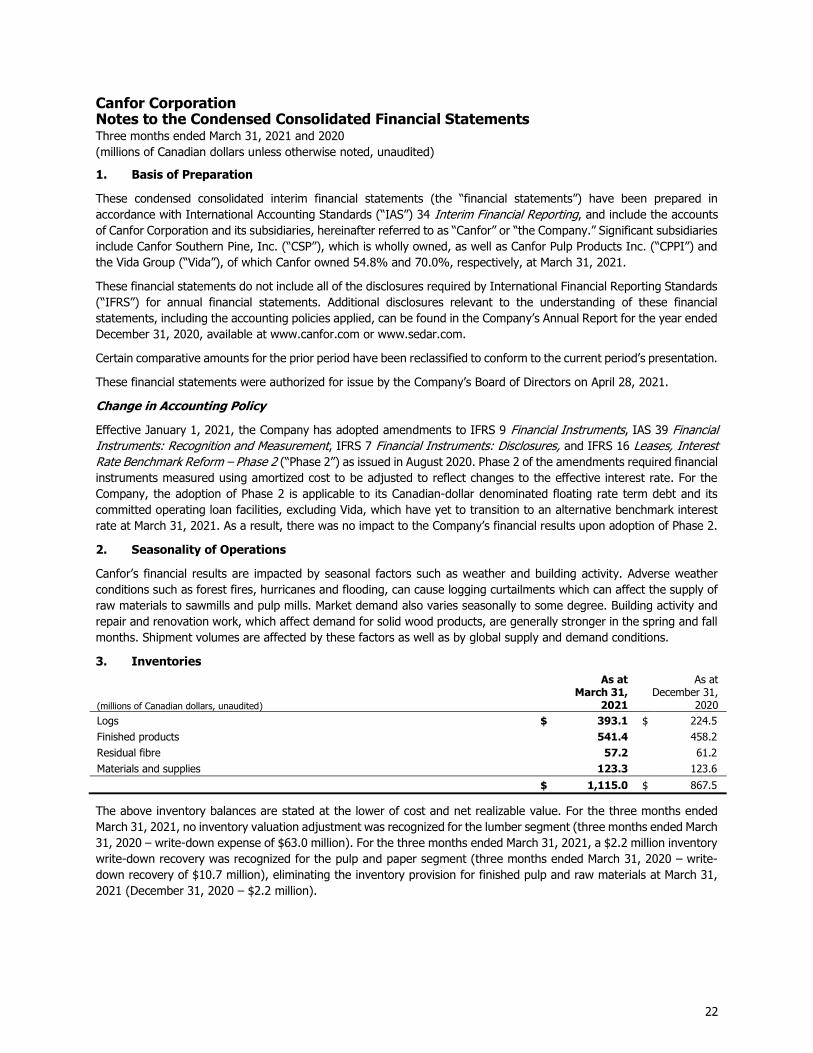
Canfor Corporation Notes to the Condensed Consolidated Financial Statements Three months ended March 31, 2021 and 2020 (millions of Canadian dollars unless otherwise noted, unaudited)
1. Basis of Preparation
These condensed consolidated interim financial statements (the “financial statements”) have been prepared in accordance with International Accounting Standards (“IAS”) 34 Interim Financial Reporting, and include the accounts of Canfor Corporation and its subsidiaries, hereinafter referred to as “Canfor” or “the Company.” Significant subsidiaries include Canfor Southern Pine, Inc. (“CSP”), which is wholly owned, as well as Canfor Pulp Products Inc. (“CPPI”) and the Vida Group (“Vida”), of which Canfor owned 54.8% and 70.0%, respectively, at March 31, 2021.
These financial statements do not include all of the disclosures required by International Financial Reporting Standards (“IFRS”) for annual financial statements. Additional disclosures relevant to the understanding of these financial statements, including the accounting policies applied, can be found in the Company’s Annual Report for the year ended December 31, 2020, available at www.canfor.com or www.sedar.com.
Certain comparative amounts for the prior period have been reclassified to conform to the current period’s presentation.
These financial statements were authorized for issue by the Company’s Board of Directors on April 28, 2021.
Change in Accounting Policy
Effective January 1, 2021, the Company has adopted amendments to IFRS 9 Financial Instruments, IAS 39 Financial Instruments: Recognition and Measurement, IFRS 7 Financial Instruments: Disclosures, and IFRS 16 Leases, Interest Rate Benchmark Reform – Phase 2 (“Phase 2”) as issued in August 2020. Phase 2 of the amendments required financial instruments measured using amortized cost to be adjusted to reflect changes to the effective interest rate. For the Company, the adoption of Phase 2 is applicable to its Canadian-dollar denominated floating rate term debt and its committed operating loan facilities, excluding Vida, which have yet to transition to an alternative benchmark interest rate at March 31, 2021. As a result, there was no impact to the Company’s financial results upon adoption of Phase 2.
2. Seasonality of Operations
Canfor’s financial results are impacted by seasonal factors such as weather and building activity. Adverse weather conditions such as forest fires, hurricanes and flooding, can cause logging curtailments which can affect the supply of raw materials to sawmills and pulp mills. Market demand also varies seasonally to some degree. Building activity and repair and renovation work, which affect demand for solid wood products, are generally stronger in the spring and fall months. Shipment volumes are affected by these factors as well as by global supply and demand conditions.
3. Inventories
(millions of Canadian dollars, unaudited)
As at March 31,
2021
As at December 31,
2020 Logs $ 393.1 $ 224.5 Finished products 541.4 458.2 Residual fibre 57.2 61.2 Materials and supplies 123.3 123.6
$ 1,115.0 $ 867.5
The above inventory balances are stated at the lower of cost and net realizable value. For the three months ended March 31, 2021, no inventory valuation adjustment was recognized for the lumber segment (three months ended March 31, 2020 – write-down expense of $63.0 million). For the three months ended March 31, 2021, a $2.2 million inventory write-down recovery was recognized for the pulp and paper segment (three months ended March 31, 2020 – write-down recovery of $10.7 million), eliminating the inventory provision for finished pulp and raw materials at March 31, 2021 (December 31, 2020 – $2.2 million).
22
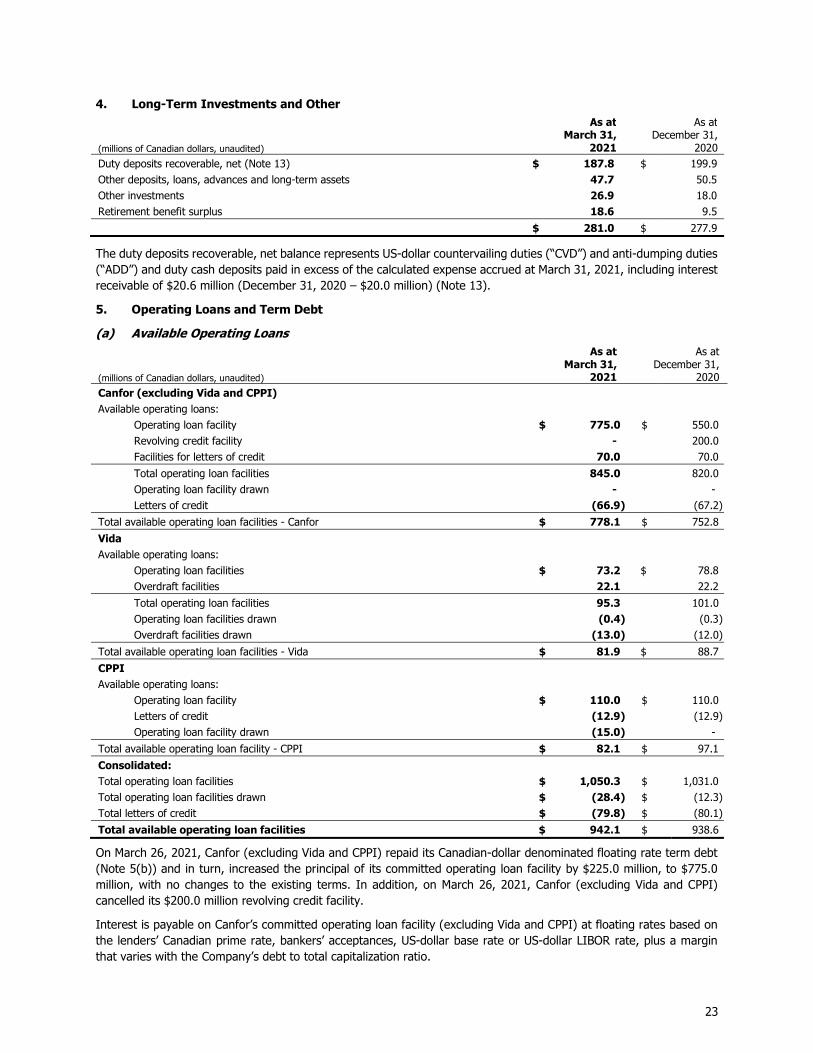
4. Long-Term Investments and Other
(millions of Canadian dollars, unaudited)
As atMarch 31,
2021
As at December 31,
2020 Duty deposits recoverable, net (Note 13) $ 187.8 $ 199.9 Other deposits, loans, advances and long-term assets 47.7 50.5 Other investments 26.9 18.0 Retirement benefit surplus 18.6 9.5
$ 281.0 $ 277.9
The duty deposits recoverable, net balance represents US-dollar countervailing duties (“CVD”) and anti-dumping duties (“ADD”) and duty cash deposits paid in excess of the calculated expense accrued at March 31, 2021, including interest receivable of $20.6 million (December 31, 2020 – $20.0 million) (Note 13).
5. Operating Loans and Term Debt
(a) Available Operating Loans
(millions of Canadian dollars, unaudited)
As at March 31,
2021
As at December 31,
2020 Canfor (excluding Vida and CPPI) Available operating loans:
Operating loan facility $ 775.0 $ 550.0 Revolving credit facility - 200.0 Facilities for letters of credit 70.0 70.0
Total operating loan facilities 845.0 820.0 Operating loan facility drawn - - Letters of credit (66.9) (67.2)
Total available operating loan facilities - Canfor $ 778.1 $ 752.8
Vida Available operating loans:
Operating loan facilities $ 73.2 $ 78.8 Overdraft facilities 22.1 22.2
Total operating loan facilities 95.3 101.0 Operating loan facilities drawn (0.4) (0.3) Overdraft facilities drawn (13.0) (12.0)
Total available operating loan facilities - Vida $ 81.9 $ 88.7
CPPI Available operating loans:
Operating loan facility $ 110.0 $ 110.0 Letters of credit (12.9) (12.9) Operating loan facility drawn (15.0) -
Total available operating loan facility - CPPI $ 82.1 $ 97.1
Consolidated: Total operating loan facilities $ 1,050.3 $ 1,031.0 Total operating loan facilities drawn $ (28.4) $ (12.3) Total letters of credit $ (79.8) $ (80.1)
Total available operating loan facilities $ 942.1 $ 938.6
On March 26, 2021, Canfor (excluding Vida and CPPI) repaid its Canadian-dollar denominated floating rate term debt (Note 5(b)) and in turn, increased the principal of its committed operating loan facility by $225.0 million, to $775.0 million, with no changes to the existing terms. In addition, on March 26, 2021, Canfor (excluding Vida and CPPI) cancelled its $200.0 million revolving credit facility.
Interest is payable on Canfor’s committed operating loan facility (excluding Vida and CPPI) at floating rates based on the lenders’ Canadian prime rate, bankers’ acceptances, US-dollar base rate or US-dollar LIBOR rate, plus a margin that varies with the Company’s debt to total capitalization ratio.
23
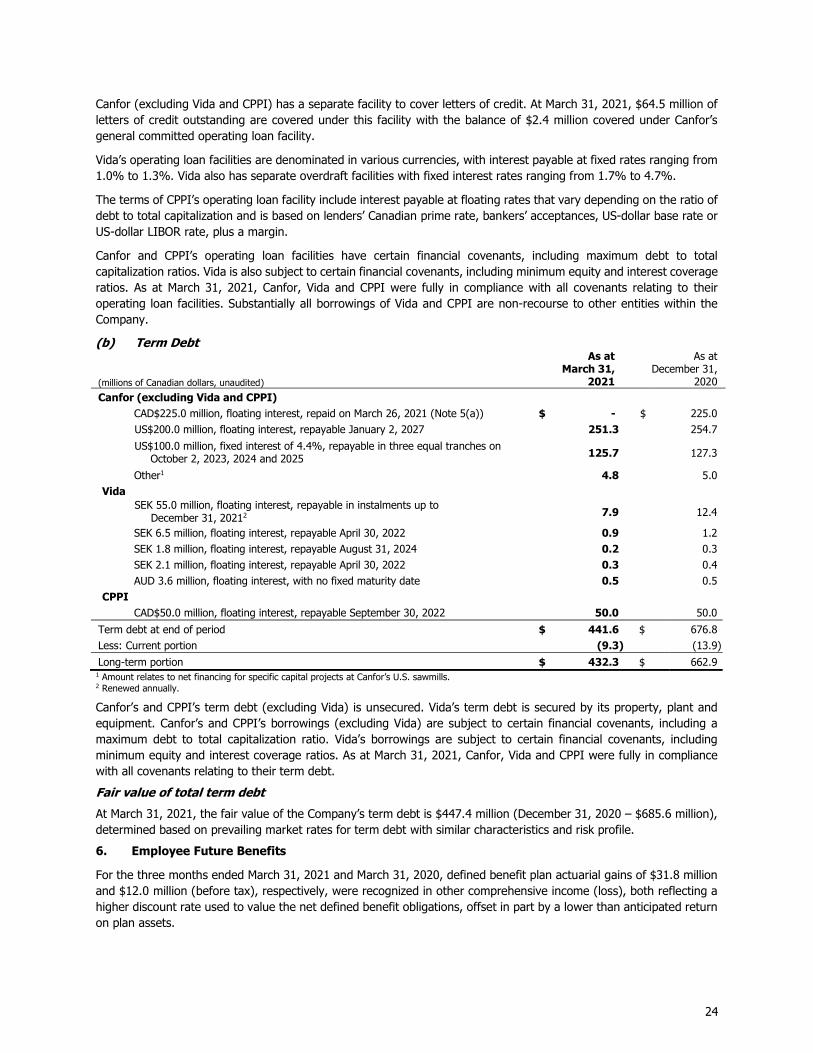
Canfor (excluding Vida and CPPI) has a separate facility to cover letters of credit. At March 31, 2021, $64.5 million of letters of credit outstanding are covered under this facility with the balance of $2.4 million covered under Canfor’s general committed operating loan facility.
Vida’s operating loan facilities are denominated in various currencies, with interest payable at fixed rates ranging from 1.0% to 1.3%. Vida also has separate overdraft facilities with fixed interest rates ranging from 1.7% to 4.7%.
The terms of CPPI’s operating loan facility include interest payable at floating rates that vary depending on the ratio of debt to total capitalization and is based on lenders’ Canadian prime rate, bankers’ acceptances, US-dollar base rate or US-dollar LIBOR rate, plus a margin.
Canfor and CPPI’s operating loan facilities have certain financial covenants, including maximum debt to total capitalization ratios. Vida is also subject to certain financial covenants, including minimum equity and interest coverage ratios. As at March 31, 2021, Canfor, Vida and CPPI were fully in compliance with all covenants relating to their operating loan facilities. Substantially all borrowings of Vida and CPPI are non-recourse to other entities within the Company.
(b) Term Debt
(millions of Canadian dollars, unaudited)
As at March 31,
2021
As at December 31,
2020 Canfor (excluding Vida and CPPI)
CAD$225.0 million, floating interest, repaid on March 26, 2021 (Note 5(a)) $ - $ 225.0 US$200.0 million, floating interest, repayable January 2, 2027 251.3 254.7
US$100.0 million, fixed interest of 4.4%, repayable in three equal tranches on October 2, 2023, 2024 and 2025 125.7 127.3
Other1 4.8 5.0 Vida
SEK 55.0 million, floating interest, repayable in instalments up to December 31, 20212
7.9 12.4
SEK 6.5 million, floating interest, repayable April 30, 2022 0.9 1.2 SEK 1.8 million, floating interest, repayable August 31, 2024 0.2 0.3 SEK 2.1 million, floating interest, repayable April 30, 2022 0.3 0.4 AUD 3.6 million, floating interest, with no fixed maturity date 0.5 0.5
CPPI CAD$50.0 million, floating interest, repayable September 30, 2022 50.0 50.0
Term debt at end of period $ 441.6 $ 676.8 Less: Current portion (9.3) (13.9)
Long-term portion $ 432.3 $ 662.9 1 Amount relates to net financing for specific capital projects at Canfor’s U.S. sawmills. 2 Renewed annually.
Canfor’s and CPPI’s term debt (excluding Vida) is unsecured. Vida’s term debt is secured by its property, plant and equipment. Canfor’s and CPPI’s borrowings (excluding Vida) are subject to certain financial covenants, including a maximum debt to total capitalization ratio. Vida’s borrowings are subject to certain financial covenants, including minimum equity and interest coverage ratios. As at March 31, 2021, Canfor, Vida and CPPI were fully in compliance with all covenants relating to their term debt.
Fair value of total term debt
At March 31, 2021, the fair value of the Company’s term debt is $447.4 million (December 31, 2020 – $685.6 million), determined based on prevailing market rates for term debt with similar characteristics and risk profile.
6. Employee Future Benefits
For the three months ended March 31, 2021 and March 31, 2020, defined benefit plan actuarial gains of $31.8 million and $12.0 million (before tax), respectively, were recognized in other comprehensive income (loss), both reflecting a higher discount rate used to value the net defined benefit obligations, offset in part by a lower than anticipated return on plan assets.
24
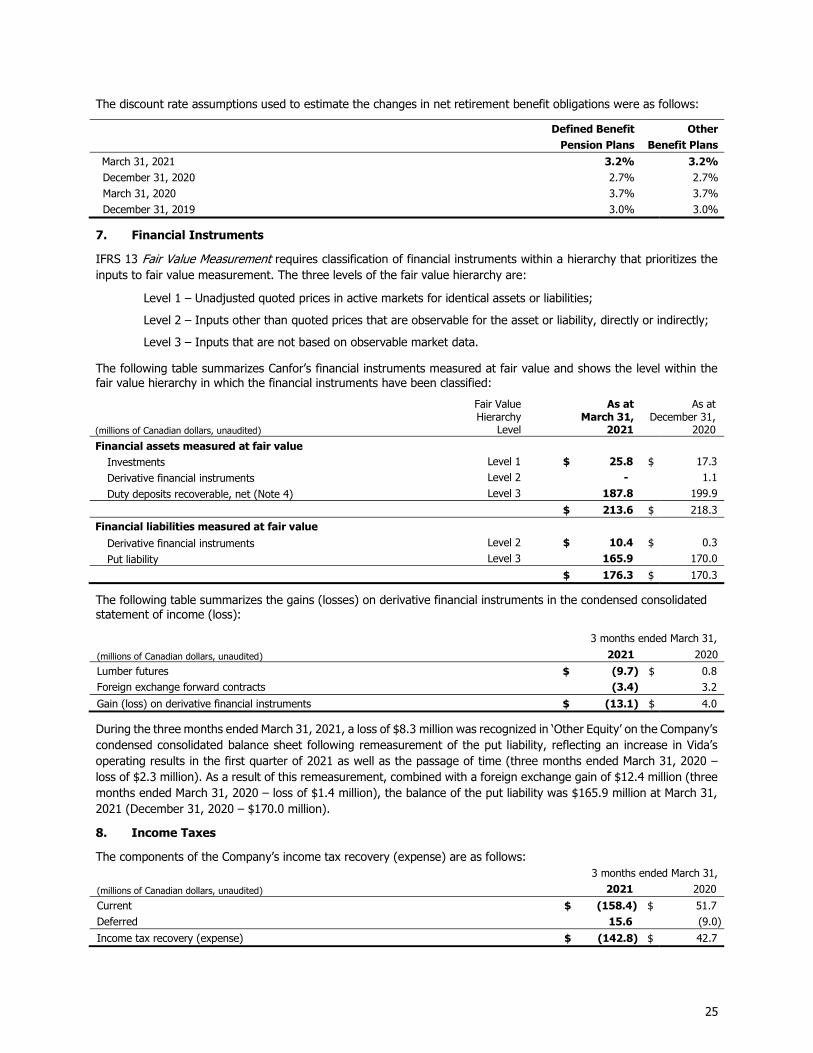
The discount rate assumptions used to estimate the changes in net retirement benefit obligations were as follows:
Defined Benefit Pension Plans
Other Benefit Plans
March 31, 2021 3.2% 3.2% December 31, 2020 2.7% 2.7% March 31, 2020 3.7% 3.7% December 31, 2019 3.0% 3.0%
7. Financial Instruments
IFRS 13 Fair Value Measurement requires classification of financial instruments within a hierarchy that prioritizes the inputs to fair value measurement. The three levels of the fair value hierarchy are:
Level 1 – Unadjusted quoted prices in active markets for identical assets or liabilities;
Level 2 – Inputs other than quoted prices that are observable for the asset or liability, directly or indirectly;
Level 3 – Inputs that are not based on observable market data.
The following table summarizes Canfor’s financial instruments measured at fair value and shows the level within the fair value hierarchy in which the financial instruments have been classified:
(millions of Canadian dollars, unaudited)
Fair Value Hierarchy
Level
As at March 31,
2021
As at December 31,
2020
Financial assets measured at fair value
Investments Level 1 $ 25.8 $ 17.3
Derivative financial instruments Level 2 - 1.1
Duty deposits recoverable, net (Note 4) Level 3 187.8 199.9
$ 213.6 $ 218.3
Financial liabilities measured at fair value
Derivative financial instruments Level 2 $ 10.4 $ 0.3
Put liability Level 3 165.9 170.0
$ 176.3 $ 170.3
The following table summarizes the gains (losses) on derivative financial instruments in the condensed consolidated statement of income (loss):
3 months ended March 31,
(millions of Canadian dollars, unaudited) 2021
2020
Lumber futures
$ (9.7) $ 0.8 Foreign exchange forward contracts
(3.4) 3.2
Gain (loss) on derivative financial instruments
$ (13.1) $ 4.0
During the three months ended March 31, 2021, a loss of $8.3 million was recognized in ‘Other Equity’ on the Company’s condensed consolidated balance sheet following remeasurement of the put liability, reflecting an increase in Vida’s operating results in the first quarter of 2021 as well as the passage of time (three months ended March 31, 2020 – loss of $2.3 million). As a result of this remeasurement, combined with a foreign exchange gain of $12.4 million (three months ended March 31, 2020 – loss of $1.4 million), the balance of the put liability was $165.9 million at March 31, 2021 (December 31, 2020 – $170.0 million).
8. Income Taxes
The components of the Company’s income tax recovery (expense) are as follows: 3 months ended March 31,
(millions of Canadian dollars, unaudited) 2021 2020
Current $ (158.4) $ 51.7 Deferred 15.6 (9.0)
Income tax recovery (expense) $ (142.8) $ 42.7
25
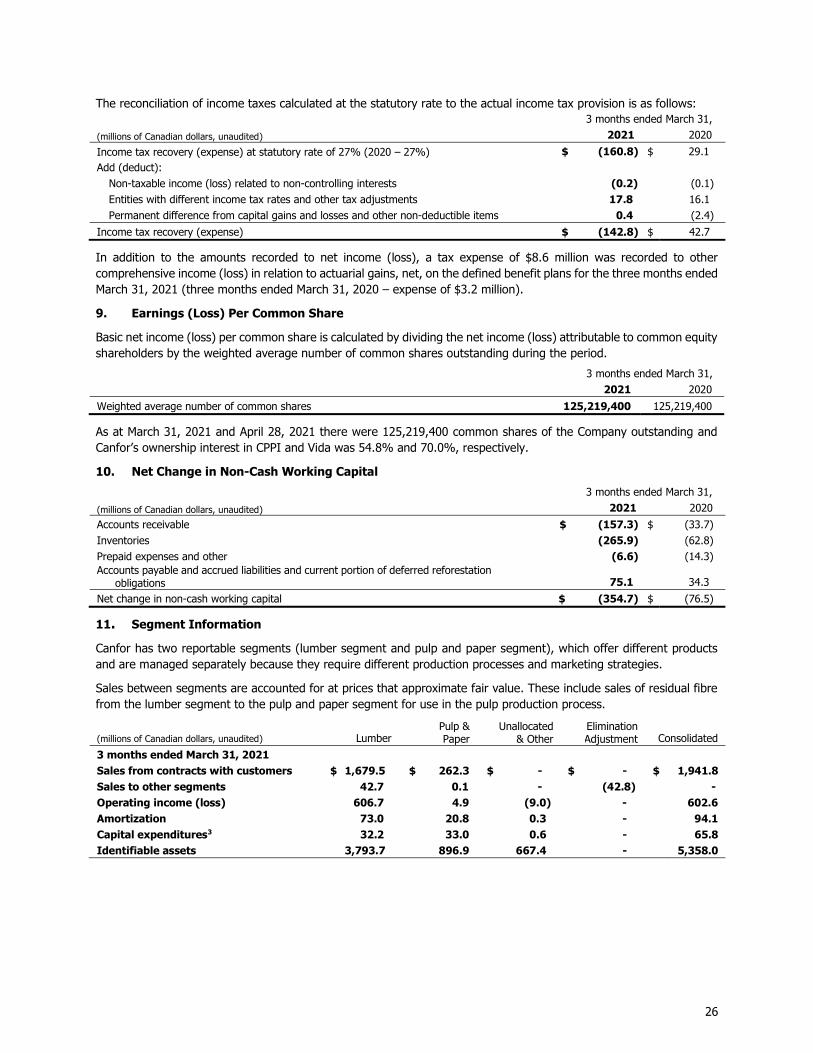
The reconciliation of income taxes calculated at the statutory rate to the actual income tax provision is as follows: 3 months ended March 31,
(millions of Canadian dollars, unaudited) 2021 2020
Income tax recovery (expense) at statutory rate of 27% (2020 – 27%) $ (160.8) $ 29.1 Add (deduct):
Non-taxable income (loss) related to non-controlling interests (0.2) (0.1) Entities with different income tax rates and other tax adjustments 17.8 16.1 Permanent difference from capital gains and losses and other non-deductible items 0.4 (2.4)
Income tax recovery (expense) $ (142.8) $ 42.7
In addition to the amounts recorded to net income (loss), a tax expense of $8.6 million was recorded to other comprehensive income (loss) in relation to actuarial gains, net, on the defined benefit plans for the three months ended March 31, 2021 (three months ended March 31, 2020 – expense of $3.2 million).
9. Earnings (Loss) Per Common Share
Basic net income (loss) per common share is calculated by dividing the net income (loss) attributable to common equity shareholders by the weighted average number of common shares outstanding during the period.
3 months ended March 31, 2021 2020
Weighted average number of common shares 125,219,400 125,219,400
As at March 31, 2021 and April 28, 2021 there were 125,219,400 common shares of the Company outstanding and Canfor’s ownership interest in CPPI and Vida was 54.8% and 70.0%, respectively.
10. Net Change in Non-Cash Working Capital
3 months ended March 31,
(millions of Canadian dollars, unaudited) 2021 2020
Accounts receivable $ (157.3) $ (33.7) Inventories (265.9) (62.8) Prepaid expenses and other (6.6) (14.3) Accounts payable and accrued liabilities and current portion of deferred reforestation
obligations 75.1
34.3
Net change in non-cash working capital $ (354.7) $ (76.5)
11. Segment Information
Canfor has two reportable segments (lumber segment and pulp and paper segment), which offer different products and are managed separately because they require different production processes and marketing strategies.
Sales between segments are accounted for at prices that approximate fair value. These include sales of residual fibre from the lumber segment to the pulp and paper segment for use in the pulp production process.
(millions of Canadian dollars, unaudited)
Lumber Pulp &
Paper Unallocated
& Other Elimination Adjustment Consolidated
3 months ended March 31, 2021 Sales from contracts with customers $ 1,679.5 $ 262.3 $ - $ - $ 1,941.8 Sales to other segments 42.7 0.1 - (42.8) - Operating income (loss) 606.7 4.9 (9.0) - 602.6 Amortization 73.0 20.8 0.3 - 94.1 Capital expenditures3 32.2 33.0 0.6 - 65.8 Identifiable assets 3,793.7 896.9 667.4 - 5,358.0
26
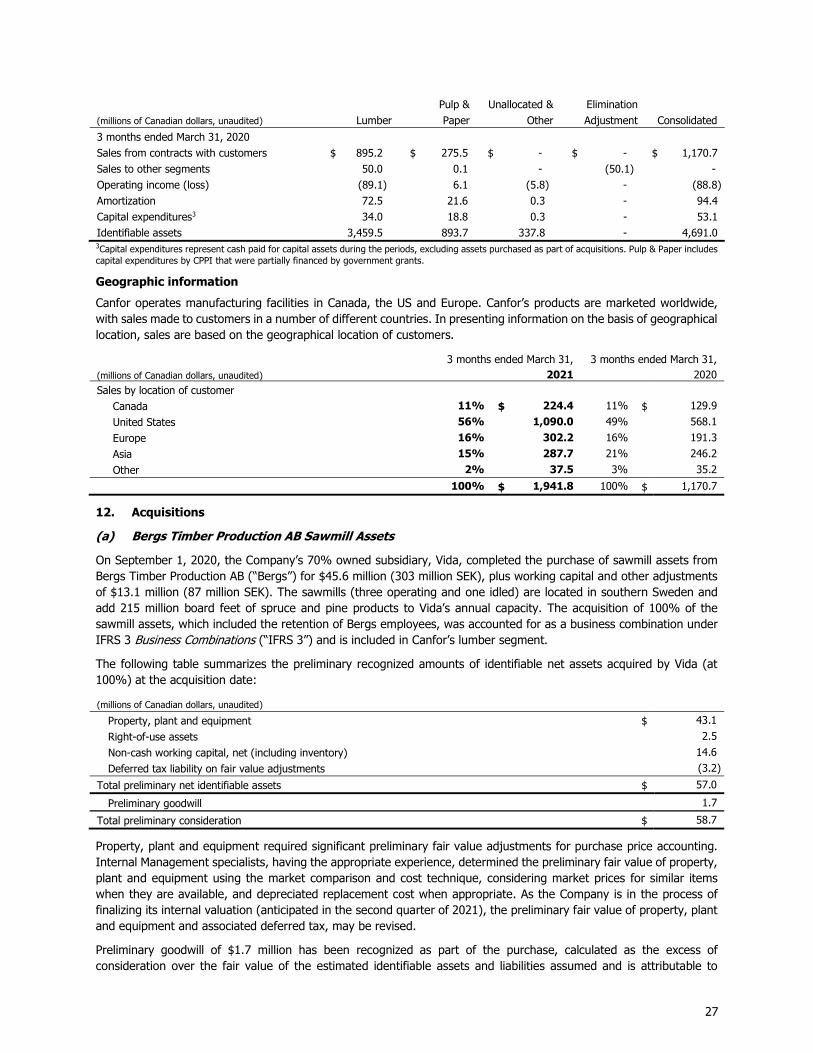
(millions of Canadian dollars, unaudited)
Lumber Pulp & Paper
Unallocated & Other
Elimination Adjustment Consolidated
3 months ended March 31, 2020 Sales from contracts with customers $ 895.2 $ 275.5 $ - $ - $ 1,170.7 Sales to other segments 50.0 0.1 - (50.1) - Operating income (loss) (89.1) 6.1 (5.8) - (88.8) Amortization 72.5 21.6 0.3 - 94.4 Capital expenditures3 34.0 18.8 0.3 - 53.1 Identifiable assets 3,459.5 893.7 337.8 - 4,691.0 3Capital expenditures represent cash paid for capital assets during the periods, excluding assets purchased as part of acquisitions. Pulp & Paper includes capital expenditures by CPPI that were partially financed by government grants.
Geographic information
Canfor operates manufacturing facilities in Canada, the US and Europe. Canfor’s products are marketed worldwide, with sales made to customers in a number of different countries. In presenting information on the basis of geographical location, sales are based on the geographical location of customers.
3 months ended March 31, 3 months ended March 31, (millions of Canadian dollars, unaudited) 2021 2020 Sales by location of customer
Canada 11% $ 224.4 11% $ 129.9 United States 56% 1,090.0 49% 568.1 Europe 16% 302.2 16% 191.3 Asia 15% 287.7 21% 246.2 Other 2% 37.5 3% 35.2 100% $ 1,941.8 100% $ 1,170.7
12. Acquisitions
(a) Bergs Timber Production AB Sawmill Assets
On September 1, 2020, the Company’s 70% owned subsidiary, Vida, completed the purchase of sawmill assets from Bergs Timber Production AB (“Bergs”) for $45.6 million (303 million SEK), plus working capital and other adjustments of $13.1 million (87 million SEK). The sawmills (three operating and one idled) are located in southern Sweden and add 215 million board feet of spruce and pine products to Vida’s annual capacity. The acquisition of 100% of the sawmill assets, which included the retention of Bergs employees, was accounted for as a business combination under IFRS 3 Business Combinations (“IFRS 3”) and is included in Canfor’s lumber segment.
The following table summarizes the preliminary recognized amounts of identifiable net assets acquired by Vida (at 100%) at the acquisition date:
(millions of Canadian dollars, unaudited)
Property, plant and equipment $ 43.1
Right-of-use assets 2.5
Non-cash working capital, net (including inventory) 14.6
Deferred tax liability on fair value adjustments (3.2)
Total preliminary net identifiable assets $ 57.0
Preliminary goodwill 1.7
Total preliminary consideration $ 58.7
Property, plant and equipment required significant preliminary fair value adjustments for purchase price accounting. Internal Management specialists, having the appropriate experience, determined the preliminary fair value of property, plant and equipment using the market comparison and cost technique, considering market prices for similar items when they are available, and depreciated replacement cost when appropriate. As the Company is in the process of finalizing its internal valuation (anticipated in the second quarter of 2021), the preliminary fair value of property, plant and equipment and associated deferred tax, may be revised.
Preliminary goodwill of $1.7 million has been recognized as part of the purchase, calculated as the excess of consideration over the fair value of the estimated identifiable assets and liabilities assumed and is attributable to
27
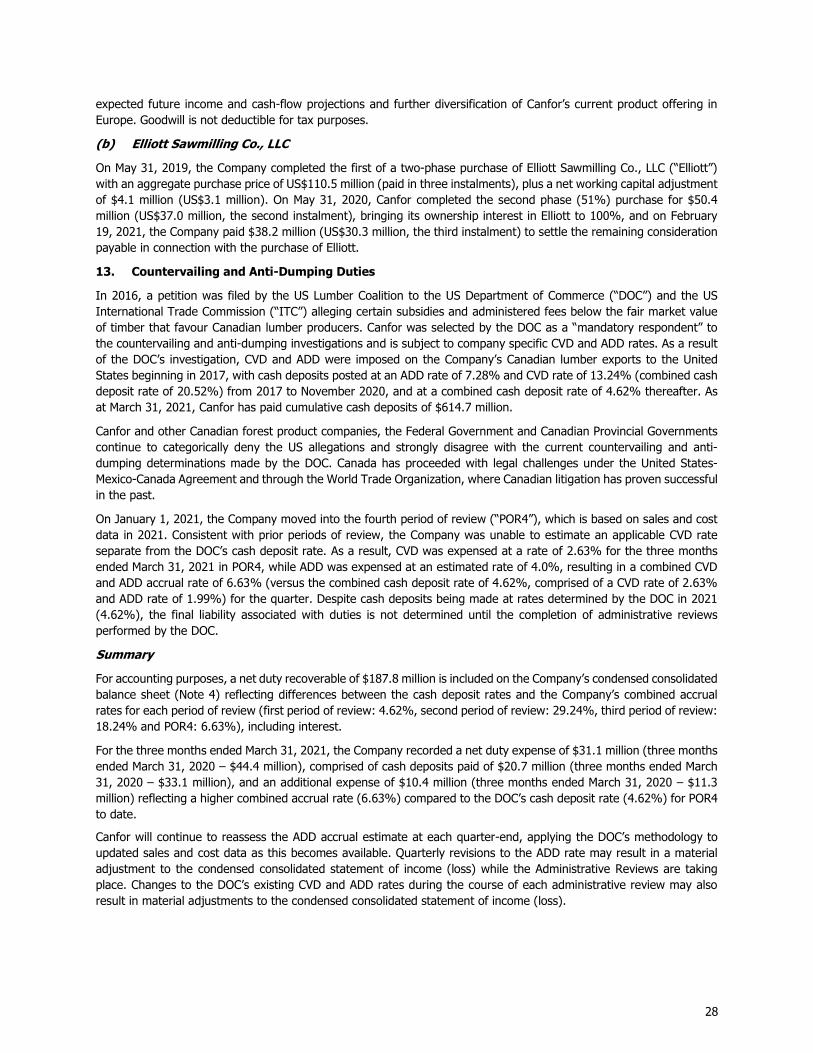
expected future income and cash-flow projections and further diversification of Canfor’s current product offering in Europe. Goodwill is not deductible for tax purposes.
(b) Elliott Sawmilling Co., LLC
On May 31, 2019, the Company completed the first of a two-phase purchase of Elliott Sawmilling Co., LLC (“Elliott”) with an aggregate purchase price of US$110.5 million (paid in three instalments), plus a net working capital adjustment of $4.1 million (US$3.1 million). On May 31, 2020, Canfor completed the second phase (51%) purchase for $50.4 million (US$37.0 million, the second instalment), bringing its ownership interest in Elliott to 100%, and on February 19, 2021, the Company paid $38.2 million (US$30.3 million, the third instalment) to settle the remaining consideration payable in connection with the purchase of Elliott.
13. Countervailing and Anti-Dumping Duties
In 2016, a petition was filed by the US Lumber Coalition to the US Department of Commerce (“DOC”) and the US International Trade Commission (“ITC”) alleging certain subsidies and administered fees below the fair market value of timber that favour Canadian lumber producers. Canfor was selected by the DOC as a “mandatory respondent” to the countervailing and anti-dumping investigations and is subject to company specific CVD and ADD rates. As a result of the DOC’s investigation, CVD and ADD were imposed on the Company’s Canadian lumber exports to the United States beginning in 2017, with cash deposits posted at an ADD rate of 7.28% and CVD rate of 13.24% (combined cash deposit rate of 20.52%) from 2017 to November 2020, and at a combined cash deposit rate of 4.62% thereafter. As at March 31, 2021, Canfor has paid cumulative cash deposits of $614.7 million.
Canfor and other Canadian forest product companies, the Federal Government and Canadian Provincial Governments continue to categorically deny the US allegations and strongly disagree with the current countervailing and anti-dumping determinations made by the DOC. Canada has proceeded with legal challenges under the United States-Mexico-Canada Agreement and through the World Trade Organization, where Canadian litigation has proven successful in the past.
On January 1, 2021, the Company moved into the fourth period of review (“POR4”), which is based on sales and cost data in 2021. Consistent with prior periods of review, the Company was unable to estimate an applicable CVD rate separate from the DOC’s cash deposit rate. As a result, CVD was expensed at a rate of 2.63% for the three months ended March 31, 2021 in POR4, while ADD was expensed at an estimated rate of 4.0%, resulting in a combined CVD and ADD accrual rate of 6.63% (versus the combined cash deposit rate of 4.62%, comprised of a CVD rate of 2.63% and ADD rate of 1.99%) for the quarter. Despite cash deposits being made at rates determined by the DOC in 2021 (4.62%), the final liability associated with duties is not determined until the completion of administrative reviews performed by the DOC.
Summary
For accounting purposes, a net duty recoverable of $187.8 million is included on the Company’s condensed consolidated balance sheet (Note 4) reflecting differences between the cash deposit rates and the Company’s combined accrual rates for each period of review (first period of review: 4.62%, second period of review: 29.24%, third period of review: 18.24% and POR4: 6.63%), including interest.
For the three months ended March 31, 2021, the Company recorded a net duty expense of $31.1 million (three months ended March 31, 2020 – $44.4 million), comprised of cash deposits paid of $20.7 million (three months ended March 31, 2020 – $33.1 million), and an additional expense of $10.4 million (three months ended March 31, 2020 – $11.3 million) reflecting a higher combined accrual rate (6.63%) compared to the DOC’s cash deposit rate (4.62%) for POR4 to date.
Canfor will continue to reassess the ADD accrual estimate at each quarter-end, applying the DOC’s methodology to updated sales and cost data as this becomes available. Quarterly revisions to the ADD rate may result in a material adjustment to the condensed consolidated statement of income (loss) while the Administrative Reviews are taking place. Changes to the DOC’s existing CVD and ADD rates during the course of each administrative review may also result in material adjustments to the condensed consolidated statement of income (loss).
28
14. Contingencies
On March 11, 2020, the World Health Organization declared the coronavirus (“COVID-19”) outbreak a pandemic. Although there have been no adverse impacts of COVID-19 on the Company in the first quarter of 2021, Management continues to closely monitor its effects, and should its duration, spread or intensity further develop, the supply chain, market pricing and customer demand could be affected, impacting the Company’s operating plan, liquidity, cash flows, and the valuation of its long-lived assets.
29


