Embed Size (px)
Citation preview

ORIGINAL ARTICLE
Nitrogen and phosphorus capture and recovery efficiencies,and crop responses to a range of soil fertility managementstrategies in sub-Saharan Africa
R. Chikowo Æ M. Corbeels Æ P. Mapfumo ÆP. Tittonell Æ B. Vanlauwe Æ K. E. Giller
Received: 5 March 2008 / Accepted: 11 July 2009 / Published online: 1 August 2009! Springer Science+Business Media B.V. 2009
Abstract This paper examines a number of agro-
nomic field experiments in different regions of sub-Saharan Africa to assess the associated variability in
the efficiencies with which applied and available
nutrients are taken up by crops under a wide range ofmanagement and environmental conditions. We con-
sider N and P capture efficiencies (NCE and PCE, kguptake kg-1 nutrient availability), and N and P
recovery efficiencies (NRE and PRE, kg uptake kg-1
nutrient added). The analyzed cropping systemsemployed different soil fertility management prac-
tices that included (1) N and P mineral fertilizers (as
sole or their combinations) (2) cattle manure com-posted then applied or applied directly to fields
through animal corralling, and legume based systems
separated into (3) improved fallows/cover crops-
cereal sequences, and (4) grain legume-cereal rota-tions. Crop responses to added nutrients varied
widely, which is a logical consequence of the wide
diversity in the balance of production resourcesacross regions from arid through wet tropics, coupled
with an equally large array of management practicesand inter-season variability. The NCE ranged from
0.05 to 0.98 kg kg-1 for the different systems (NP
fertilizers, 0.16–0.98; fallow/cover crops, 0.05–0.75;animal manure, 0.10–0.74 kg kg-1), while PCE
ranged from 0.09 to 0.71 kg kg-1, depending on soil
conditions. The respective NREs averaged 0.38, 0.23and 0.25 kg kg-1. Cases were found where NREs
were[1 for mineral fertilizers or negative when poor
R. Chikowo (&) ! P. MapfumoSoil Science & Agricultural Engineering Department,University of Zimbabwe, Box MP 167, Mt Pleasant,Harare, Zimbabwee-mail: [email protected];[email protected]
M. Corbeels ! P. TittonellDepartement Persyst, Centre de CooperationInternationale en Recherche Agronomique pour leDeveloppement (CIRAD), Av Agropolis TA B-102/02,34398 Montpellier Cedex 5, France
M. CorbeelsTropical Soil Biology and Fertility Institute of theInternational Centre for Tropical Agriculture (TSBF-CIAT), P.O. Box MP 228, Mt Pleasant, Harare,Zimbabwe
P. MapfumoThe Soil Fertility Consortium for Southern Africa(SOFECSA), CIMMYT- Zimbabwe, Box MP 163, MountPleasant, Harare, Zimbabwe
B. VanlauweTropical Soil Biology and Fertility Institute of CIAT(TSBF-CIAT), Nairobi, Kenya
K. E. GillerPlant Production Systems, Department of Plant Sciences,Wageningen University, P.O. Box 430, 6700 AKWageningen, The Netherlands
123
Nutr Cycl Agroecosyst (2010) 88:59–77
DOI 10.1007/s10705-009-9303-6
quality manure immobilized soil N, while response to
P was in many cases poor due to P fixation by soils.
Other than good agronomy, it was apparent thatflexible systems of fertilization that vary N input
according to the current seasonal rainfall pattern offer
opportunities for high resource capture and recoveryefficiencies in semi-arid areas. We suggest the use of
cropping systems modeling approaches to hasten the
understanding of Africa’s complex cropping systems.
Keywords Nutrient use efficiency !Sub-Saharan Africa ! Nutrient mining !Fertilizers ! Manure ! Legumes !Cropping systems modeling
Introduction
Soils with poor nutrient contents, particularly of Nand P, are widespread in sub-Saharan Africa (SSA),
and this has been widely recognized as one of the
pivotal causes of poor agricultural productivity.Compared to other parts of the world were agricul-
tural green revolutions have been stimulated by
mechanization and high fertilizer use, SSA soilnutrient balances remain largely negative (Smaling
et al. 1997). Where nutrients are applied, albeit often
in small doses, their capture and utilization by cropshas been poor largely due to nutrient imbalances
(Kho 2000). It is well established that efficient
nutrient recovery by crops is a function of a multitudeof factors that should be in a balanced state (Janssen
1998). Recovery efficiencies of added nutrients
depend on soil and plant characteristics, crop man-agement, fertilizer dosage and timing, and season
quality. For example, while crop rooting density
requirements to remove nitrate from soil is small inrelation to that required for less mobile nutrients such
as P, nitrate not taken up may be quickly lost through
leaching in sandy soils during periods of high rainfallwhen residence time is short (Cadisch et al. 2004;
Chikowo et al. 2003). On the other hand, P
availability is often heavily restricted by the ironand aluminum oxides which are common in highly
weathered tropical soils (e.g. Vanlauwe et al. 2002;
Sanchez et al. 1997). These are the some of the manydifficult scenarios that resource-constrained small-
holder farmers in Africa have to grapple with in their
production systems.
Short-range spatial variability in soils commonlyexist within and between farms due to localized
differences in parent material and/or management
(Tittonell et al. 2005; Mtambanengwe and Mapfumo2005; Samake et al. 2006), with major implications on
water and nutrient use efficiency. In most cases fields
that are poor in N and/or P will give poor returns evenwhen these nutrients are amply supplied through
fertilizers, as there would be other nutrients limiting
production, beyond N and P (e.g. Vanlauwe et al. 2005;Wopereis et al. 2006; Zingore et al. 2007). Therefore,
any fertilization strategy that seeks to optimize
resource use efficiency by crops has to recognize theimportant role of the inherent and distinct capacity of
different soils to supply nutrients to the crops.
In the face of limited external resources, thequestion of how to efficiently target the available
nutrients on the farms in a continuum of circumstances
becomes critical (Giller et al. 2006). Therefore, a keyobjective of this study was to analyze nutrient use
management options in SSA agriculture and obtain
insights on the associated nutrient use efficiencies, avital step for magnifying cropping systems or system
components that offer opportunities for intensification.
We illustrate the performance of different croppingsystems in the different regions of SSA using data from
key publications based on field experiments spanning
over the past two decades. The various data in thepublications were re-analyzed, taking into account
the indigenous nutrient supplying (INS) capacity of the
soils, and the fertilizers and organic amendmentsadded to estimate N and P availability and associated
nutrient capture efficiencies.
Description of database and data computation
Literature searches were done on various electronic
library platforms using key words such as nitrogen,
phosphorus or nutrient use efficiency. Relevantarticles published from 1990 to date were reviewed
and those based on field experiments in SSA wereidentified. This involved a large array of cropping
systems that managed soil fertility in equally varied
approaches. The principal cereal crop is maize, butthere is a significant component of the small grains
(millet and sorghum) in the semi-arid parts of
southern Africa and the Sahelian region, and uplandand lowland rice in West Africa.
60 Nutr Cycl Agroecosyst (2010) 88:59–77
123

Throughout this study we make reference to twoslightly different nutrient use efficiency terms: (1) N
and P capture efficiency (NCE or PCE, respectively,
for N and P) as the amount of nutrient captured perunit of nutrient availability, and (2) N and P recovery
efficiency (NRE or PRE) as the amount of nutrient
recovered per unit added through the differentfertilization strategies. To compute NCE for the
different experiments, N availability was taken as the
sum of the external N supply through mineral ororganic fertilizers and the indigenous soil N supply.
i:e:NCE " Crop N uptake=#externally supplied N$ indigenous soil N supply%:
Indigenous soil supply of N was estimated from
data on N uptake from a treatment in which all othernutrients were amply supplied except for N. Similarly,
the indigenous soil P supply was estimated from P
uptake in plots where other nutrients had been amplysupplied except P. To be included in the database, it
was desirable, though not strictly necessary, that the
trials contained treatments that resemble this descrip-tion. Where the treatments were such that this
information could not be extracted easily, the soil
organic carbon (SOC) content was used to estimatepotential N or P availability through mineralization
using the transfer functions used in the model QUE-
FTS, that were derived from experimental data fromEast Africa (Janssen et al. 1990). In cases where the
authors did not provide information on nutrient uptake
we assumed an internal N conversion efficiency of55 kg grain (kg N uptake)-1, a value slightly higher
than the intermediate between the physiologically
possible maximal dilution and maximal concentra-tions for maize (Janssen et al. 1990). Estimations for
other crops were done using their respective average
internal N efficiencies, 35 kg kg-1 for millet andsorghum, and 55 kg kg-1 for rice, given from an
extensive review by van Duivenbooden et al. (1996).
Results and discussion
The database
Restricting our scope to SSA excluded a large volume
of information on N and P use efficiencies available
worldwide. A lot of set backs were encounteredduring literature retrieval, as many authors only
provided information just enough to meet theirimmediate objectives. As a result many potentially
useful articles could not be included in our database.
An overview of the literature data grouped into cropresponses to N and P fertilizers, legume cover crop/
fallow and manure presented as summary statistics
reveal the existence of broad ranges in nutrientavailability and use efficiencies for the different
cropping systems, with the indigenous soil N supply
ranging from 10 to 91 kg ha-1 (Table 1). Thenumber of experiments testing N fertilizers was
considerably larger than for P or manure. When all
data from experiments that involved N and Pfertilizers with maize were pooled, it was clear that
other than N availability, there were other important
explanatory variables that explained N uptake(Fig. 1). The description of the cropping systems
and of some of the key experiments that constitute the
database is given in the following sections.
Capture and recovery efficiency of N and P
from mineral sources for maize
A wide array of experiments with N and P fertilizers
have been carried out both on-station and on-farmwith equally varied responses (Tables 2, 3, 4, 5 and
6). In an experiment that was carried out over three
seasons in Togo, Wopereis et al. (2006) reportedresponses of maize to N and P on farmers’ fields that
had received organic inputs for at least 10 years
(infields) and those that did not (outfields). Being onthe same soil type, the main difference between
infields and outfields on an individual farm was
SOC content. Averaged over three seasons at sole100 kg ha-1 N application, NCE was significantly
higher on infields compared to outfields (0.52 vs.
0.38 kg kg-1). In a related experiment on degradedand non-degraded soils in Togo, Fofana et al. (2005)
also demonstrated that NCE was always superior on a
non-degraded soil. Significant improvements in theNRE of applied N and overall NCE on the degraded
soil was only realized when N and P were simulta-neously applied. Upon application of 40 kg P ha-1
on the degraded soil, NCE increased from 0.29 to
0.46 kg kg-1 at N rate of 50 kg ha-1, and from 0.29to 0.38 kg kg-1 at 100 kg N ha-1 N. As expected,
NCE was lower at higher N application rate as N
availability increased and its shortage relative toother production resources decreased. The data shows
Nutr Cycl Agroecosyst (2010) 88:59–77 61
123

that N fertilization alone significantly increased Puptake by maize and that a moderate P rate of
20 kg ha-1 was sufficient for maximum P uptake.
Experiments with N fertilizers and rock phosphatein Mali resulted in NCE ranging between 0.33 and
0.50 kg kg-1 for maize over a 4-year period (Bationo
et al. 1997; Table 4). In southern and easternTanzania, application of a large amount of P fertilizer
(80 kg ha-1) across sites with acid P-fixing soils
resulted in NCE range of 0.16–0.42 kg kg-1 (Msollaet al. 2005). Across four sites, NCE ranged from 0.28
to 0.48 kg kg-1 with P fertilizer, and from 0.25 to
0.35 kg kg-1 when an equivalent amount of rock Pwas used. The highly P fixing soils responded poorly
to N application, marginally increasing NCE from
0.10 kg kg-1 without P to 0.16 kg kg-1 when P wasapplied.
In an experiment that spanned over a 6-year period on
two contrasting soils in Zimbabwe, NCE varied between0.24 and 0.50 kg kg-1 on poor farmers’ fields, compared
with NCE ranging between 0.52 and 0.77 kg kg-1 at an
on-station site (Waddington and Karingwindi 2001).Despite the annual addition of 18 kg ha-1 P, apparent
recovery of applied N at on-farms sites was in some
Table 1 Soil N availability, maize yields, NCE, NRE and summary statistics of the variables for experiments that involved (a) NPfertilizers (b) improved fallows/cover crops and (c) animal manure, in sub-Saharan Africa
Variable/fertility managementpractice
n Minimum Maximum Mean Median Standarddeviation
Coefficientof variation
(a) NP fertilizers
Indigenous soil N (kg ha-1) 41 10 91 34 30 18 54
Total N availability (kg ha-1) 86 13 191 94 100 49 52
Maize yields (Mg ha-1) 84 0.29 7.70 2.61 2.1 1.68 64
N uptake (kg ha-1) 85 6 136 53 44 32 61
NCE (kg kg-1) 64 0.16 0.98 0.53 0.52 0.19 35
NRE (kg kg-1) 58 0.05 1.00 0.38 0.35 0.22 56
(b) Improved fallow/cover crops
Indigenous soil N (kg ha-1) 26 12 82 33 30 17 51
N availability (kg ha-1) 64 13 400 146 147 86 59
Maize yields (Mg ha-1) 69 0.30 8.20 2.14 1.92 1.47 68
N uptake (kg ha-1) 68 8 149 48 46 29 61
NCE (kg kg-1) 51 0.05 0.75 0.34 0.32 0.19 56
NRE (kg kg-1) 51 0 0.66 0.23 0.20 0.17 71
(c) Animal manure
Indigenous soil N (kg ha-1) 10 15 70 36 31 19 54
N availability (kg ha-1) 21 25 433 132 115 103 78
Maize yields (Mg ha-1) 23 0.40 5.90 2.42 2.1 1.27 52
N uptake (kg ha-1) 23 8 107 46 37 26 58
NCE (kg kg-1) 15 0.10 0.74 0.37 0.35 0.20 53
NRE (kg kg-1) 15 0.0 0.65 0.25 0.19 0.19 77
(d) P relations
Indigenous soil P (kg ha-1) 10 5 18 9 8.5 4.2 47
P availability (kg ha-1) 28 5.0 113 49 44 31 62
Maize yields (Mg ha-1) 32 0.50 8.4 3.06 2.0 2.3 77
P uptake (kg ha-1) 27 2.90 34.0 12.4 11.0 7.7 62
PCE (kg kg-1) 22 0.09 0.71 0.25 0.20 0.17 69
PRE (kg kg-1) 23 0 0.29 0.16 0.17 0.07 45
Summary statistics for P relations involving experiments with P fertilizers are shown in (d)
n number of publications on the data set
62 Nutr Cycl Agroecosyst (2010) 88:59–77
123

cases as low as 0.1 kg kg-1, a scenario that has forced
some croplands to be abandoned. This is considered as
a classical example of little mileage gained when N andP fertilizers are added to a soil with multiple constraints
that may include acute micronutrient deficiencies and
soil acidity.On an Alfisol and Oxisol in Nigeria, average
NCE was 0.57 kg kg-1 when 45 kg ha-1 N and
12 kg ha-1 P were annually applied to maize fieldsover a 10-year period (Kang et al. 1999). Another long-
term experiment on a Ferric Lixisol in the same region
under ample P supply had average NRE of0.32 kg kg-1 when 120 kg ha-1 N was applied, which
increased to 0.68 kg kg-1 at a reduced N application
rate of 60 kg ha-1 (Vanlauwe et al. 2005). Applicationof adequate N and P to five maize varieties in the moist
savanna of Nigeria resulted in average NCE of
0.50 kg kg-1 and NRE of 0.30 kg kg-1 (Oikeh et al.2003). In Cameroon, application of P fertilizer on two
basaltic soils led to variable yield responses by maize
(Osiname et al. 2000). Response to P was significant atboth sites with grain yield increasing with P rates up to
88 kg ha-1 at one site, compared with no additionalyield gains beyond an application rate of 22 kg ha-1 P
at another site, in spite of the low soil P test. Large
responses at low rates are encouraging, as it is possiblefor resource poor farmers to benefit from small
amounts of fertilizer P, at the same time avoiding the
degradation of soil P status through small maintenance
fertilization rates.
In Kenya, Probert and Okalebo (1992) showed thatunder non-N limiting conditions and when extractable
P was 8 lg g-1, maize responded to P application but
there was no significant difference between three Papplication rates (20, 40 and 60 kg ha-1) or any
tendency for the higher rates to give increased yields
of maize. At application rates of 20 kg P ha-1, PRE bymaize averaged 0.14 kg kg-1 (Table 2). However, in
a separate experiment where the same authors
employed surface soil management through mulchingand tied-ridging, there was a significant response to P
inputs as high as 60 kg ha-1. A plausible explanation
for this could be that conservation measures resultedin more water retention and thus better root growth
and exploitation of P. This is another example on
resource interactions and the importance of balancedresource availability for increased resource use effi-
ciency. In southern Malawi, farms usually stretch
through three landscape positions, from steep erodedslopes through dambo margins to dambo valleys, with
increasing fertility towards the valley. Phiri et al.(1999) studied the effect of landscape position on the
utilization of fertilizer N, and got significantly higher
NRE on the dambo and dambo margin positions(0.46 kg kg-1 N) compared with poor recovery
(0.22 kg kg-1) on the steep slopes.
r2 = 0.58
Mai
ze g
rain
yie
ld (M
g ha
-1)
0
2
4
6
8
r2=0.61
N u
ptak
e (k
g ha
-1)
30
60
90
120
r2= 0
N availability (kg ha-1) N availability (kg ha-1)
0 25 50 75 100 125 150 175
0 25 50 75 100 125 150 175 0 25 50 75 100 125 150 175
NC
E (k
g kg
-1)
0.0
0.2
0.4
0.6
0.8
1.0
r2 = 0
0 25 50 75 100 125 150 175
NR
E (k
g kg
-1)
0.0
0.2
0.4
0.6
0.8
1.0
(a) (b)
(c) (d)
Fig. 1 The relationshipsbetween N availability anda maize grain yield b Nuptake c N captureefficiency (NCE) and d Nrecovery efficiency (NRE)for experiments thatinvolved N and P fertilizers
Nutr Cycl Agroecosyst (2010) 88:59–77 63
123

Tab
le2
Ind
igen
ou
sso
ilP
sup
ply
(IP
S),
tota
lP
avai
lab
ilit
y,
and
esti
mat
edP
cap
ture
and
app
aren
tre
cov
ery
effi
cien
cies
for
exp
erim
ents
that
inv
olv
edN
and
Pfe
rtil
izer
sw
ith
mai
zean
dm
ille
tan
dri
ce
Tre
atm
ent
des
crip
tio
n(h
a-1)
So
ilco
nd
itio
ns
IPS
(kg
ha-
1)
Pav
aila
bil
ity
(kg
ha-
1)
Gra
iny
ield
s(k
gh
a-1)
Pu
pta
ke
(kg
ha-
1)
PC
E(k
gk
g-1
P)
PR
E(k
gk
g-1
P)
Co
un
try
and
reg
ion
/cl
imat
icco
nd
itio
ns
Ref
eren
ce
Mai
ze 40
kg
PD
egra
ded
,0
.4%
C1
05
00
.50
3.6
0T
og
o,
coas
tal
sav
ana
Fo
fan
aet
al.
(20
05
)
50
kg
Ure
a-N
?4
0k
gP
50
1.3
01
0.0
0.2
00
.17
10
0k
gU
rea-
N?
40
kg
P5
01
.70
11
.90
.24
0.2
2
60
kg
N,
43
kg
PC
lay
,k
aoli
nit
ic7
50
1.0
11
0.1
0.2
10
.12
Ben
in,
wes
tA
fric
aS
aıd
ou
etal
.(2
00
3)
10
0k
gP
Ver
tiso
ls1
31
13
3.6
01
3K
eny
aS
igu
ng
aet
al.
(20
02
)
10
0k
gN
P1
13
5.8
02
20
.19
0.0
9
10
0k
gN
P?
dra
inag
e1
13
7.7
03
40
.30
0.2
1
Co
ntr
ol
San
dy
loam
,0
.43
%C
11
31
0.5
92
.9K
eny
a,se
mi
arid
Pro
ber
tan
dO
kal
ebo
(19
92
)
90
kg
N3
.86
11
90
kg
N?
20
kg
P4
.54
13
.80
.19
0.1
4
Co
ntr
ol
(25
kg
P)
Kao
lin
itic
,P
fix
ing
53
00
.80
40
.13
0K
eny
a,h
um
idtr
op
ics
Gac
hen
go
etal
.(1
99
9)
Senn
asp
ecta
bili
s1
51
.50
60
.40
.2
Tit
honi
adi
vers
ifol
ia2
22
.00
90
.41
0.2
9
Senn
a?
25
kg
P4
02
.00
80
.20
.11
Tit
honi
a?
25
kg
P4
73
.20
12
0.2
60
.19
Mil
let
60
kg
PL
oam
ysa
nd
,0
.26
%C
76
70
.90
0.1
Nig
er,
sem
iar
idK
ho
(20
00
)
18
0k
gN
,6
0k
gP
67
1.3
40
.12
0.1
9
90
kg
N,
30
kg
P3
71
.20
0.2
0.2
3
Ric
e 10
0k
gN
Ult
iso
l5
50
.75
5Iv
ory
coas
t,h
um
idS
ahra
wat
etal
.(1
99
7)
10
0k
gN
?4
5k
gP
(Cu
ltiv
ar1
)5
52
.05
90
.09
0.0
9
10
0k
gN
?9
0k
gP
95
2.3
51
20
.09
0.0
8
64 Nutr Cycl Agroecosyst (2010) 88:59–77
123

Tab
le2
con
tin
ued
Tre
atm
ent
des
crip
tio
n(h
a-1)
So
ilco
nd
itio
ns
IPS
(kg
ha-
1)
Pav
aila
bil
ity
(kg
ha-
1)
Gra
iny
ield
s(k
gh
a-1)
Pu
pta
ke
(kg
ha-
1)
PC
E(k
gk
g-1
P)
PR
E(k
gk
g-1
P)
Co
un
try
and
reg
ion
/cl
imat
icco
nd
itio
ns
Ref
eren
ce
10
0k
gN
(Cu
ltiv
ar2
)5
51
.07
5.5
10
0k
gN
?4
5k
gP
cv2
55
1.6
91
00
.10
0.1
1
10
0k
gN
?9
0k
gP
95
1.6
11
10
.11
0.0
7
20
kg
P,
50
kg
KA
llu
via
lV
erti
sols
10
–3
84
44
.0S
eneg
al,
Wes
tA
fric
aH
aefe
lean
dW
op
erei
s(2
00
5)
15
1k
gN
20
kg
P4
47
.80
.11
15
1N
,2
0P
,5
0k
gK
44
8.4
0.1
8
Co
ntr
ol
Lo
amy
,0
.4%
C1
81
81
.80
6M
auri
tan
ia,
Sah
elia
nv
anA
sten
etal
.(2
00
5)
17
5k
gN
18
5.0
01
8
17
5k
gN
,1
3k
gP
31
5.6
02
20
.71
0.2
9
17
5k
gN
,2
6k
gP
44
6.1
02
40
.55
0.2
1
17
5k
gN
,2
6k
gP
?st
raw
44
6.2
02
80
.64
0.2
5
WA
wes
tA
fric
a,E
Aea
stA
fric
a,SA
sou
ther
nA
fric
a,C
Ace
ntr
alA
fric
a
Nutr Cycl Agroecosyst (2010) 88:59–77 65
123

Tab
le3
Ind
igen
ou
sso
ilN
sup
ply
(IN
S),
tota
lN
avai
lab
ilit
y,
and
esti
mat
edN
cap
ture
and
app
aren
tre
cov
ery
effi
cien
cyfo
rex
per
imen
tsth
atin
vo
lved
man
ure
s,sh
ort
term
fall
ow
s,an
dN
Pfe
rtil
izer
so
nri
cein
sub
-Sah
aran
Afr
ica
Tre
atm
ent
des
crip
tio
nG
ener
alco
nd
itio
ns
INS
(kg
ha-
1)
Nav
aila
bil
ity
(kg
ha-
1)
Gra
iny
ield
s(M
gh
a-1)
Nu
pta
ke
(kg
ha-
1)
NC
E(k
gk
g-1)
NR
E(k
gk
g-1)
Co
un
try
Ref
eren
ce
10
0k
gN
Ult
iso
l1
51
15
0.7
51
20
.11
Ivo
ryco
ast
Sah
raw
atet
al.
(19
97
)
10
0k
gN
?4
5k
gP
(WA
B5
6–
12
5)
11
52
.05
34
0.2
90
.22
10
0k
gN
?9
0k
gP
11
52
.35
39
0.3
40
.27
10
0k
gN
(Lo
cal
CV
)1
15
1.0
71
70
.15
10
0k
gN
?4
5k
gP
cv2
11
51
.69
28
0.2
40
.11
10
0k
gN
?9
0k
gP
11
51
.61
26
0.2
20
.10
20
kg
P,
50
kg
KA
llu
via
lV
erti
sols
18
–7
84
44
.0N
iger
Hae
fele
and
Wo
per
eis
(20
05)
15
1k
gN
,2
0k
gP
19
57
.81
30
0.6
60
.34
15
1N
,2
0P
,5
0k
gK
19
58
.41
40
0.7
10
.41
Wee
dfa
llo
wA
lfiso
l1
01
00
.32
6Iv
ory
coas
tB
eck
eran
dJo
hn
son
(19
99
)
81
kg
Leg
um
efa
llo
wa
19
1.0
11
70
.16
0.1
2
Co
ntr
ol
Lo
amy
,0
.4%
C3
93
91
.80
21
Mau
rita
nia
van
Ast
enet
al.
(20
05
)
17
5k
gN
21
45
.00
78
0.3
60
.32
17
5k
gN
,1
3k
gP
21
45
.60
94
0.4
30
.41
17
5k
gN
,2
6k
gP
21
46
.10
94
0.4
30
.41
17
5k
gN
,2
6k
gP
?st
raw
21
46
.20
13
00
.60
0.5
2
Co
ntr
ol
0.5
%C
25
25
0.9
72
1S
ierr
aL
eon
eB
aret
al.
(20
00
)
60
kg
N8
51
.33
29
0.3
50
.14
Sesb
ania
rost
rata
fall
ow
11
91
.36
30
0.2
50
.10
Sesb
ania
?3
0k
gN
15
02
.14
47
0.3
10
.21
aM
ean
of
fiv
ele
gu
mes
(Cal
opog
oniu
m,
Can
aval
ia,
Cen
tros
ema,
Muc
una,
Pue
rari
a)
66 Nutr Cycl Agroecosyst (2010) 88:59–77
123

Tab
le4
Ind
igen
ou
sso
ilN
sup
ply
(IN
S),
tota
lN
avai
lab
ilit
y,
and
esti
mat
edN
cap
ture
and
app
aren
tre
cov
ery
effi
cien
cies
for
exp
erim
ents
that
inv
olv
edm
anu
res,
sho
rtte
rmfa
llo
ws,
and
NP
fert
iliz
ers
on
sorg
hu
min
sub
-Sah
aran
Afr
ica
Tre
atm
ent
des
crip
tio
nG
ener
alco
nd
itio
ns
INS
(kg
ha-
1)
Nav
aila
bil
ity
(kg
ha-
1)
Gra
iny
ield
s(M
gh
a-1)
Nu
pta
ke
(kg
ha-
1)
NC
E(k
gk
g-
1)
NR
E(k
gk
g-1)
Co
un
try
/re
gio
nR
efer
ence
Co
ntr
ol
San
dy
loam
45
45
1.5
44
3N
iger
Zao
ng
oet
al.
(19
97
)
Mu
lch
45
2.1
06
0
50
kg
Nh
a-1
95
2.3
76
70
.71
0.4
5
50
kg
Nh
a-1
?m
ulc
hin
g9
52
.49
71
0.7
50
.52
Co
ntr
ol
48
48
1.6
84
81
.00
Ug
and
aH
aged
orn
etal
.(1
99
7)
11
2k
gN
(Tep
hro
sia)
16
01
.87
53
0.3
30
.04
52
kg
man
ure
N1
00
2.7
67
90
.79
0.5
9
Co
ntr
ol
(sit
e1
)L
ixis
ol
33
33
1.1
63
3B
urk
ina
Fas
oO
ued
rao
go
etal
.(2
00
1)
65
kg
com
po
stN
(sit
e1
)9
81
.68
48
0.4
90
.23
Co
ntr
ol
(sit
e2
)F
erri
cL
ixis
ol
15
15
0.4
01
1
13
0k
gco
mp
ost
N(s
ite
2)
14
21
.38
39
0.2
70
.21
Co
ntr
ol
Av
erag
e0
.7%
C2
83
50
.86
–1
.04
Mal
iB
atio
no
etal
.(1
99
7)
7k
gN
?1
1k
gP
1.2
4–
1.9
23
5–
54
[1
[1
12
kg
N?
27
kg
Pro
ckp
ho
sph
ate
1.1
6–
2.2
13
3–
63
0.6
4–
1.0
[0
.5
Co
ntr
ol
Fer
ric
Lix
iso
l3
53
11
.10
Bu
rkin
aF
aso
Zo
ug
mo
reet
al.
(20
04)
50
kg
Ure
a-N
81
2.1
06
00
.74
0.5
8
50
kg
com
po
st-N
81
2.2
76
50
.80
0.6
8
Co
ntr
ol
(yea
r2
)3
53
11
.16
33
1.0
7
50
kg
Ure
a-N
(yea
r2
)8
11
.40
40
0.4
90
.14
50
kg
com
po
st-N
(yea
r2
)8
12
.38
68
0.8
40
.70
65
kg
N?
10
kg
Po
nly
Fer
ric
Lix
iso
l(y
ear
1)
30
95
1.1
23
20
.33
Bu
rkin
aF
aso
Man
do
etal
.(2
00
5)
10
tca
ttle
man
ure
?6
5k
gN
?1
0k
gP
20
52
.53
72
0.3
5
65
kg
N?
10
kg
Po
nly
Fer
ric
Lix
iso
l(y
ear
2)
95
0.6
21
80
.19
Nutr Cycl Agroecosyst (2010) 88:59–77 67
123

Tab
le4
con
tin
ued
Tre
atm
ent
des
crip
tio
nG
ener
alco
nd
itio
ns
INS
(kg
ha-
1)
Nav
aila
bil
ity
(kg
ha-
1)
Gra
iny
ield
s(M
gh
a-1)
Nu
pta
ke
(kg
ha-
1)
NC
E(k
gk
g-
1)
NR
E(k
gk
g-1)
Co
un
try
/re
gio
nR
efer
ence
10
tca
ttle
man
ure
?6
5k
gN
?1
0k
gP
20
52
.35
67
0.3
2
60
kg
PL
oam
ysa
nd
,0
.26
%C
25
25
0.9
02
5N
iger
Kh
o(2
00
0)
18
0k
gN
,6
0k
gP
20
51
.34
43
0.3
20
.19
90
kg
N,
30
kg
P1
15
1.2
03
00
.31
0.2
3
Co
ntr
ol
San
dy
12
12
0.3
71
0N
iger
Ro
ckst
rom
and
de
Ro
uw
(19
97
)
5t
Man
ure
82
0.5
21
50
.18
0.0
7
30
kg
N,
13
Pk
gP
fert
iliz
er4
20
.65
18
0.4
40
.28
13
kg
N?
22
kg
Pfe
rtil
izer
San
dy
(0.2
–0
.6%
C)
20
33
0.4
1–
0.9
71
1–
27
0.4
8–
0.7
80
.33
–0
.47
Mal
iB
atio
no
etal
.(1
99
7)
23
kg
N?
27
kg
Pro
ckp
ho
sph
ate
43
0.3
5–
0.9
61
0–
27
0.2
8–
0.6
40
.05
–0
.41
Co
ntr
ol
San
dy
,0
.13
%C
,lo
wP
25
25
0.5
82
5N
iger
San
gar
eet
al.
(20
02
)
3t
Lo
wq
ual
ity
man
ure
83
0.8
83
70
.45
0.2
1
3t
Hig
hq
ual
ity
man
ure
98
0.9
23
90
.39
0.1
9
3t
Lo
wq
ual
ity
man
ure
?m
ulc
h9
21
.15
49
0.5
30
.36
3t
Hig
hq
ual
ity
man
ure
?m
ulc
h1
06
1.4
15
8.5
0.5
50
.41
Co
ntr
ol
(cre
st)
0.2
%C
,8
5%
san
d1
51
50
.36
12
Nig
erB
rou
wer
and
Po
wel
l(1
99
8)
1.5
tm
anu
re(c
rest
)4
60
.81
27
0.5
90
.48
8.5
tm
anu
re(c
rest
)1
83
0.9
73
20
.18
0.1
2
Co
ntr
ol
(co
nca
ve)
15
0.2
48
.1
2.9
tm
anu
re(c
on
cav
e)7
40
.35
12
0.1
60
.07
Co
ntr
ol
[9
0%
san
d(n
itis
ols
)2
02
00
.48
16
Nig
erG
and
ahet
al.
(20
03
)
3.5
3t
man
ure
74
1.1
03
60
.49
0.3
8
Ara
ng
ein
dic
ates
dat
ais
der
ived
fro
mm
ult
iple
seas
on
s
68 Nutr Cycl Agroecosyst (2010) 88:59–77
123

Tab
le5
Ind
igen
ou
sso
ilN
sup
ply
(IN
S),
tota
lN
avai
lab
ilit
y,
and
esti
mat
edN
cap
ture
and
app
aren
tre
cov
ery
effi
cien
cies
for
exp
erim
ents
that
inv
olv
edm
anu
res,
sho
rtte
rmfa
llo
ws,
and
NP
fert
iliz
ers
on
mil
let
insu
b-S
ahar
anA
fric
a
Tre
atm
ent
des
crip
tio
nG
ener
alco
nd
itio
ns
INS
(kg
ha-
1)
Nav
aila
bil
ity
(kg
ha-
1)
Gra
iny
ield
s(M
gh
a-1)
Nu
pta
ke
(kg
ha-
1)
NC
E(k
gk
g-
1)
NR
E(k
gk
g-
1)
Co
un
try
/re
gio
nR
efer
ence
60
kg
PL
oam
ysa
nd
,0
.26
%C
25
25
0.9
02
5N
iger
Kh
o(2
00
0)
18
0k
gN
,6
0k
gP
20
51
.34
43
0.3
20
.19
90
kg
N,
30
kg
P1
15
1.2
03
00
.31
0.2
3
Co
ntr
ol
San
dy
12
12
0.3
71
0N
iger
Ro
ckst
rom
and
de
Ro
uw
(19
97
)
5t
Man
ure
82
0.5
21
50
.18
0.0
7
30
kg
N,
13
Pk
gP
fert
iliz
er4
20
.65
18
0.4
40
.28
13
kg
N?
22
kg
Pfe
rtil
izer
San
dy
(0.2
–0
.6%
C)
20
33
0.4
1–
0.9
71
1–
27
0.4
8–
0.7
80
.33
–0
.47
Mal
iB
atio
no
etal
.(1
99
7)
23
kg
N?
27
kg
Pro
ckp
ho
sph
ate
43
0.3
5–
0.9
61
0–
27
0.2
8–
0.6
40
.05
–0
.41
Co
ntr
ol
San
dy
,0
.13
%C
,lo
wP
25
25
0.5
82
5N
iger
San
gar
eet
al.
(20
02
)
3t
Lo
wq
ual
ity
man
ure
83
0.8
83
70
.45
0.2
1
3t
Hig
hq
ual
ity
man
ure
98
0.9
23
90
.39
0.1
9
3t
Lo
wq
ual
ity
man
ure
?m
ulc
h9
21
.15
49
0.5
30
.36
3t
Hig
hq
ual
ity
man
ure
?m
ulc
h1
06
1.4
15
8.5
0.5
50
.41
Co
ntr
ol
(cre
st)
0.2
%C
,8
5%
san
d1
51
50
.36
12
Nig
erB
rou
wer
and
Po
wel
l(1
99
8)
1.5
tm
anu
re(c
rest
)4
60
.81
27
0.5
90
.48
8.5
tm
anu
re(c
rest
)1
83
0.9
73
20
.18
0.1
2
Co
ntr
ol
(co
nca
ve)
15
0.2
48
.1
2.9
tm
anu
re(c
on
cav
e)7
40
.35
12
0.1
60
.07
Co
ntr
ol
[9
0%
san
d(n
itis
ols
)2
02
00
.48
16
Nig
erG
and
ahet
al.
(20
03
)
3.5
3t
man
ure
74
1.1
03
60
.49
0.3
8
Ara
ng
ein
dic
ates
dat
ais
der
ived
fro
mm
ult
iple
seas
on
s
Nutr Cycl Agroecosyst (2010) 88:59–77 69
123

Tab
le6
Ind
igen
ou
sso
ilN
sup
ply
(IN
S),
tota
lN
avai
lab
ilit
y,
and
esti
mat
edN
cap
ture
and
app
aren
tre
cov
ery
effi
cien
cies
by
mai
zein
exp
erim
ents
that
inv
olv
edm
anu
reap
pli
cati
on
(wit
ho
rw
ith
ou
tN
Pfe
rtil
izer
s)in
sub
Sah
aran
Afr
ica
Tre
atm
ent
des
crip
tio
nG
ener
alco
nd
itio
ns
INS
(kg
ha-
1)
Nav
aila
bil
ity
(kg
ha-
1)
Gra
iny
ield
s(M
gh
a-1)
Nu
pta
ke
(kg
ha-
1)
NC
E(k
gk
g-
1)
NR
E(k
gk
g-
1)
Co
un
try
Ref
eren
ce
Co
ntr
ol
Lo
amy
san
d2
52
51
.15
25
Zim
bab
we
Ny
aman
gar
aet
al.
(20
03
)
12
tm
anu
re1
42
2.2
04
90
.35
0.2
0
12
tm
anu
re?
60
kg
N2
02
3.5
17
80
.38
0.2
9
37
tm
anu
re3
73
3.1
97
10
.19
0.1
3
37
tm
anu
re?
60
kg
N4
33
4.0
59
00
.20
0.1
5
17
tm
anu
reP
oo
rsa
nd
y1
51
48
0.4
01
50
.10
0.0
8Z
imb
abw
eC
hik
ow
oet
al.
(20
04
)
17
tm
anu
re?
40
kg
N1
88
1.6
02
50
.13
0.1
2
2t
man
ure
Deg
rad
edso
il1
85
81
.40
34
0.5
80
.40
Tan
zan
iaB
aiju
ky
aet
al.
(20
06
)
2t
man
ure
?5
0k
gN
10
82
.30
63
0.5
80
.50
Co
ntr
ol
San
dy
loam
20
0.4
08
Mal
iK
aya
and
Nai
r(2
00
1)
10
tm
anu
re1
.12
20
Co
ntr
ol
Alfi
sol
30
30
1.5
82
5E
thio
pia
Lu
pw
ayi
etal
.(1
99
9)
3t
man
ure
11
72
.00
32
0.2
80
.08
40
kg
N,
30
kg
P1
27
2.1
53
30
.26
0.1
9
Co
ntr
ol
(sit
e1
)H
um
icn
itis
ols
,ac
idic
69
69
2.3
04
2K
eny
aS
mal
ing
etal
.(1
99
2)
5t
man
ure
14
44
.50
82
0.5
60
.53
Co
ntr
ol
(sit
e2
)C
lay
ey,
mo
der
ate
fert
ilit
y7
07
03
.20
58
5t
man
ure
14
55
.90
10
70
.74
0.6
5
Co
ntr
ol
(sit
e3
)S
and
ylo
am,
low
NP
K3
23
21
.60
29
5t
man
ure
10
71
.20
21
0.2
00
Co
ntr
ol
(Sem
i-ar
id)
37
1.7
83
7T
anza
nia
Jen
sen
etal
.(2
00
3)
7.5
tm
anu
re(s
ite
1)
San
dy
loam
37
10
42
.17
44
0.4
20
.10
7.5
tm
anu
re(s
ite
2)
San
dy
45
11
53
.46
69
0.6
00
.32
70 Nutr Cycl Agroecosyst (2010) 88:59–77
123

Low-lying areas with Vertisols can constitutelocally productive soils in otherwise largely unpro-
ductive areas. However, these soils are often not fully
exploited due to excess water problems duringperiods of high rainfall, as their high content of
expansive clays prevents the rapid drainage of excess
water. Sigunga et al. (2002) investigated the effect ofimproved drainage on N and P utilization efficiencies
on such soils using 0.4–0.6 m deep furrows. At
100 kg ha-1 N and P fertilizer application, drainageincreased NCE from 0.56 to 0.74 kg kg-1 N and PRE
from 0.09 to 0.21 kg kg-1 P (Table 2).
Capture and recovery efficiency of N and P
with rice, millet and sorghum
Rice is an important crop in West Africa, with
various alternatives currently being proposed towards
its intensified production. Becker and Johnson (1999)investigated the role of several legume accessions on
rice yields when grown for 6 months during the dry
season, under a range of hydrological and soilconditions. Overall, legumes increased rice yields
by 0.23 Mg ha-1, while some five selected legumes
raised rice yields from 0.32 to 1 Mg ha-1 (Table 3).In Mauritania, application of N fertilizer increased
rice yields, and addition of straw had a positive
effect, independent of fertilizer dose or soil type (vanAsten et al. 2005). On neutral soils, NRE ranged from
0.32 kg kg-1 in the absence of P to 0.41 kg kg-1
when P was added, and further increased to0.52 kg kg-1 in the presence of rice straw. On
alkaline soils the NRE was lower and the range was
0.20–0.42 kg kg-1. Recovery of P ranged between0.1 and 0.35 on both alkaline and neutral soils, but
was high and confined between 0.21 and
0.29 kg kg-1 on neutral soils (Table 2). Haefeleand Wopereis (2005) demonstrated the significance
of localized soil variability to nutrient use efficiency
in rice on a 3 ha experimental farm. They reportedNRE ranging from 0.34 to 0.41 kg kg-1 N, and PRE
ranging from 0.11 to 0.19 kg kg-1 P, depending on Kaddition and the indigenous soil N or P supply. The
suitability of Sesbania rostrata as green manure in
combination with N fertilizer for lowland riceproduction was evaluated in Sierra Leone (Bar
et al. 2000). Rice recovered 0.14 kg kg-1 N added
as urea, while NCE was 0.35 kg kg-1. Recovery ofSesbania N alone was 0.10 kg kg-1, and overall
recovery efficiency doubled when 30 kg urea-N wasadded as top dressing.
A summary of calculated capture and recovery
efficiencies of N by millet and sorghum for varioussystems is presented in Tables 4 and 5. Among the
important findings was that mulching alone signifi-
cantly increased yields in dry environments. Milletand sorghum experiments with small doses of N
fertilizers and rock phosphate in Mali resulted in
NCE ranging between 0.05 and 0.41 kg kg-1 formillet and at least 0.50 kg kg-1 for sorghum over a
4-year period (Bationo et al. 1997). On a ferric
Lixisol in Burkina Faso, Zougmore et al. (2004)reported large sorghum yield increase from either
urea or compost application in 1 year, with urea NRE
of 0.58 kg kg-1, but poor NRE of only 0.14 kg kg-1
for urea during the following season that was linked
to in-season dry spells.
Capture and recovery efficiency of N
from animal manure
Animal manure is an important resource on small-
holder farms, as nutrients are concentrated from
common rangelands. Animal ownership is thereforea strong determinant for farm SOC and N manage-
ment. The potential and pitfalls for efficient utilization
of N through crop-livestock systems have beenrecently reviewed (Rufino et al. 2006). We summarize
results of experiments with manure in Table 6. Some
early experiments with cattle manure in severalagroecological zones in Kenya showed that maize
response to manure application was different
across sites (Smaling et al. 1992). At a site withP-fixing soils, manure was shown to be particularly
effective in increasing maize yields, with application
of 5 Mg ha-1 increasing yields from 2.3 to4.5 Mg ha-1. Contrasting results across sites were
also found in Tanzania, where at one site NRE was
only 0.1 kg kg-1 compared with 0.32 kg kg-1 at theother site, when 7.5 Mg manure of similar quality
were applied to maize (Jensen et al. 2003). InZimbabwe, NRE ranged between 0.15 and
0.29 kg kg-1 when manure was applied alone or in
combination with N fertilizer (Nyamangara et al.2003), while on a degraded sandy soil application of
17 Mg ha-1 poor quality manure alone could not
supply sufficient nutrients to a maize crop (Chikowoet al. 2004). Mando et al. (2005) reported the long-
Nutr Cycl Agroecosyst (2010) 88:59–77 71
123

term effects of tillage and manure application onsorghum in the Sudano-Sahelian conditions. The
increase in yields was associated with increased N
availability due to manure and greater water avail-ability that improved the efficiency of use of the
applied fertilizer.
Capture and recovery efficiency of N and P
in fallow/cover crop-cereal crop sequences
Inputs of N from N2-fixation in tropical cropping
systems are limited by both the small proportion of
legumes actually grown and by the restrictions placedon the fixation rate by drought and nutrient deficien-
cies (Giller 2001). Nitrogen cycling through legumi-
nous shrubs has had mixed fortunes on manysmallholder farms, with N recovery from organic
materials on light textured soils found to be pitifully
poor in some cases and promising in others (e.g.Chikowo et al. 2004; Mafongoya and Dzowela 1999;
Mtambanengwe and Mapfumo 2006). Carsky et al.
(1999) showed that many legumes accumulated largeamounts of N, but there also were large N losses
during the long dry season resulting in poor transla-
tion into improved rotational maize yields. In contrastto these results, Sanginga et al. (1996) estimated
Mucuna pruriens N fertilizer replacement value of
120 kg N ha-1 in a derived savanna where the dryseason is only 3 months long. So far, the general
experience with the cover crops is that they have to
be targeted on fields that are not yet extremelydepleted and acidic, to be able to produce acceptable
biomass of at least 2 Mg ha-1.
In Kenya, Stahl et al. (2002) reported the contri-bution of 22-month fallows of Sesbania sesban and
Calliandra on two subsequent maize crops. The
immediate post-fallow maize crop suffered fromdrought, resulting in poor N recovery. During the
more favorable second season, Sesbania more than
doubled maize yields, with similar effects as60 kg ha-1 fertilizer N. Nitrogen recovery efficiency
with Calliandra was comparatively poor, in line withits low quality. In eastern Zambia, Kwesiga and Coe
(1994) demonstrated that maize yields following
2-year Sesbania fallows were equivalent to applica-tion of 112 kg N ha-1. Mafongoya and Dzowela
(1999) also showed Sesbania as a promising
improved fallow species on Alfisols in Zimbabwe,though research on sandy soils (Chikowo et al. 2004)
indicated that Sesbania produced very little biomassand was therefore unsuitable.
In western Kenya Gachengo et al. (1999) reported
increased N uptake and NRE when the Sennaspectablis or Tithonia where applied in combination
with P fertilizer. Highest yields were obtained with
Tithonia plus P fertilizer treatment. Overall, PREranged from 0.11 to 0.29 kg kg-1. The range of plant
materials with critical total P concentrations of
2.4 g kg-1 with the propensity to cause net P releaseis narrow and a soil fertility strategy that involves
replenishing soil P with plant materials alone seems
to be bound to failure in many African croppingsystems (Kwabiah et al. 2003; Palm et al. 2001).
When all data from experiments that involved
improved fallows and cover crops were pooled, onlya weak relationship between N availability and N
uptake could be established, while a general tendency
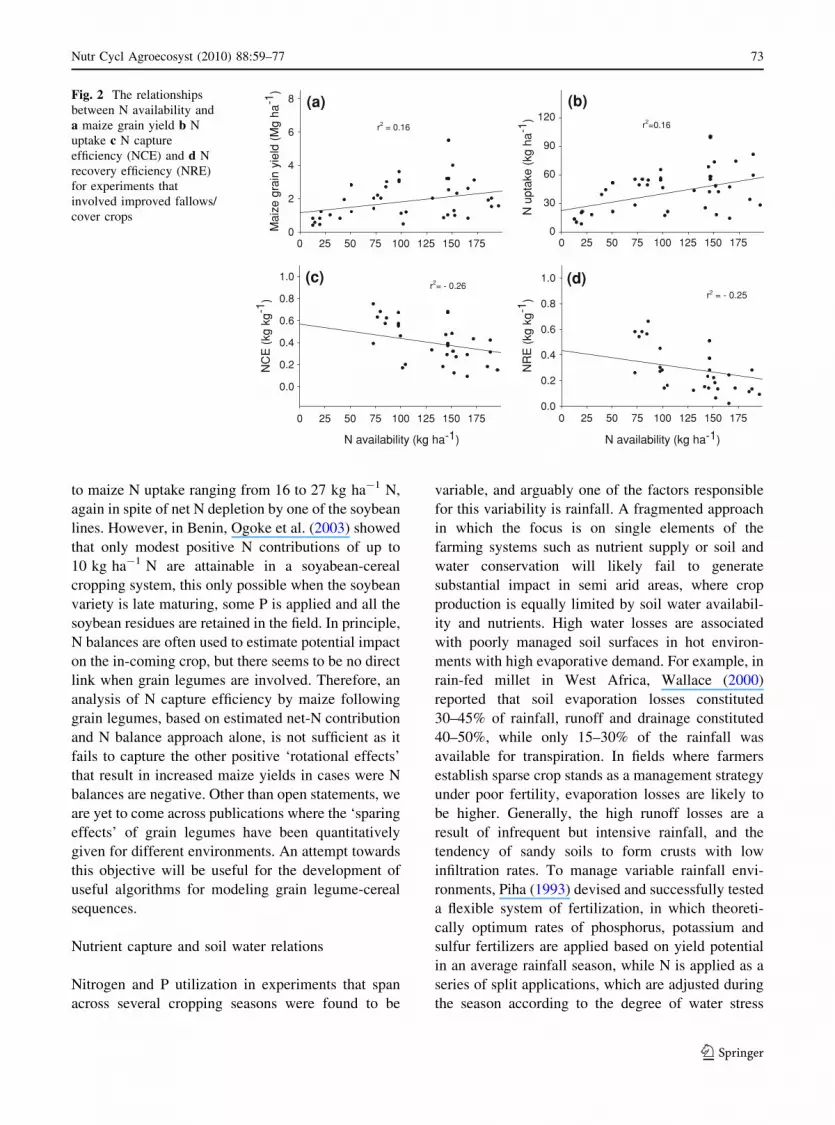
for reduced NRE with increased N availabilityexisted (Fig. 2).
Resource capture and recovery efficienciesin grain legume-cereal rotations
Grain legumes fortify food security in many ruralcommunities in SSA through strengthening sustain-
able production of cereals grown in sequence. For
example, a review by Mpepereki et al. (2000) indicatesthat promiscuous soybean varieties with low N harvest
indices have been successfully grown in rotation with
maize over years by smallholder farmers in southernAfrica. The benefits to the rotational cereal crop have
also been demonstrated, e.g. Osunde et al. (2003) and
Sanginga et al. (2002) in West Africa (Table 7).However, the reasons for the increased rotational
maize yields are often not straight forwardly related to
the N balances as a result of the legume N fixation. Forexample, in the Guinea savanna zone of Nigeria,
Osunde et al. (2003) showed that despite a cumulative
negative N balance of 147 kg N ha-1 after twosuccessive cropping of soybean with stover exported,
maize yields were at least 2 Mg ha-1 (45 kg ha-1 Nuptake) compared with 0.5 Mg ha-1 (11 kg ha-1 N
uptake) for the fallow plots (Table 7). Also, in the
moist savanna, Sanginga et al. (1996, 2002) used fivesoyabean lines and investigated their residual effects
on maize. Soybean net N input from fixation ranged
from -8 to 43 kg ha-1 N, and the rotational effects onmaize were all positive with soyabean N contribution
72 Nutr Cycl Agroecosyst (2010) 88:59–77
123
to maize N uptake ranging from 16 to 27 kg ha-1 N,again in spite of net N depletion by one of the soybean
lines. However, in Benin, Ogoke et al. (2003) showed
that only modest positive N contributions of up to10 kg ha-1 N are attainable in a soyabean-cereal
cropping system, this only possible when the soybean
variety is late maturing, some P is applied and all thesoybean residues are retained in the field. In principle,
N balances are often used to estimate potential impact
on the in-coming crop, but there seems to be no directlink when grain legumes are involved. Therefore, an
analysis of N capture efficiency by maize following
grain legumes, based on estimated net-N contributionand N balance approach alone, is not sufficient as it
fails to capture the other positive ‘rotational effects’
that result in increased maize yields in cases were Nbalances are negative. Other than open statements, we
are yet to come across publications where the ‘sparing
effects’ of grain legumes have been quantitativelygiven for different environments. An attempt towards
this objective will be useful for the development of
useful algorithms for modeling grain legume-cerealsequences.
Nutrient capture and soil water relations
Nitrogen and P utilization in experiments that spanacross several cropping seasons were found to be
variable, and arguably one of the factors responsiblefor this variability is rainfall. A fragmented approach
in which the focus is on single elements of the
farming systems such as nutrient supply or soil andwater conservation will likely fail to generate
substantial impact in semi arid areas, where crop
production is equally limited by soil water availabil-ity and nutrients. High water losses are associated
with poorly managed soil surfaces in hot environ-
ments with high evaporative demand. For example, inrain-fed millet in West Africa, Wallace (2000)
reported that soil evaporation losses constituted
30–45% of rainfall, runoff and drainage constituted40–50%, while only 15–30% of the rainfall was
available for transpiration. In fields where farmers
establish sparse crop stands as a management strategyunder poor fertility, evaporation losses are likely to
be higher. Generally, the high runoff losses are a
result of infrequent but intensive rainfall, and thetendency of sandy soils to form crusts with low
infiltration rates. To manage variable rainfall envi-
ronments, Piha (1993) devised and successfully testeda flexible system of fertilization, in which theoreti-
cally optimum rates of phosphorus, potassium andsulfur fertilizers are applied based on yield potential
in an average rainfall season, while N is applied as a
series of split applications, which are adjusted duringthe season according to the degree of water stress
r2 = 0.16
Mai
ze g
rain
yie
ld (M
g ha
-1)
0
2
4
6
8
r2=0.16
N u
ptak
e (k
g ha
-1)
0
30
60
90
120
r2= - 0.26
0 25 50 75 100 125 150 175
NC
E (k
g kg
-1)
0.0
0.2
0.4
0.6
0.8
1.0
r2 = - 0.25
N availability (kg ha-1)N availability (kg ha-1)
0 25 50 75 100 125 150 175
0 25 50 75 100 125 150 175 0 25 50 75 100 125 150 175
NR
E (k
g kg
-1)
0.0
0.2
0.4
0.6
0.8
1.0
(a) (b)
(c) (d)
Fig. 2 The relationshipsbetween N availability anda maize grain yield b Nuptake c N captureefficiency (NCE) and d Nrecovery efficiency (NRE)for experiments thatinvolved improved fallows/cover crops
Nutr Cycl Agroecosyst (2010) 88:59–77 73
123

Tab
le7
Est
imat
edn
etN
inp
ut
fro
mN
2-fi
xat
ion
,co
nti
nu
ou
so
rro
tati
on
alce
real
gra
iny
ield
s,to
tal
Nu
pta
ke,
and
the
leg
um
eco
ntr
ibu
tio
nto
mai
zeN
up
tak
efo
rg
rain
leg
um
e-ce
real
seq
uen
ces
insu
b-S
ahar
anA
fric
a
Tre
atm
ent
des
crip
tio
n/c
rop
sequ
ence
sG
ener
alco
nd
itio
ns
Net
Nin
pu
tfr
omN
2-fi
xat
ion
(kg
ha-
1)
Gra
iny
ield
s(M
gh
a-1)
Nu
pta
ke
(kg
ha-
1)
Leg
um
eco
ntr
ibut
ion
toce
real
Nu
pta
ke
(kg
ha-
1)
Cou
ntr
yR
efer
ence
Fal
low
Guin
easa
van
na
0.5
010
Nig
eria
Osu
nde
etal
.(2
00
3)
So
yab
ean
(pro
mis
cuo
us)
—m
aize
-6
52
.10
38
28
So
yab
ean
(sp
ecifi
cv
arie
ty)—
mai
ze-
47
2.6
04
73
7
Con
tinuous
mai
zeA
lfiso
l,sa
van
na
soil
1.2
24
1N
iger
iaS
ang
ing
aet
al.
(20
02)
So
ybea
nv
arie
ty1
-m
aize
-8
1.5
45
71
6
So
ybea
nv
arie
ty2
-m
aize
11
2.4
26
82
7
So
ybea
nv
arie
ty3
-m
aize
15
3.0
26
72
6
So
ybea
nv
arie
ty4
-m
aize
30
1.4
55
81
7
So
ybea
nv
arie
ty5
-m
aize
43
1.9
86
42
3
Con
tin
uo
us
mai
zeL
oam
ysa
nd
(sit
e1
)0
.38
8Z
imba
bw
eK
asas
aet
al.
(19
99)
So
ybea
n(p
rom
iscu
ou
s)—
mai
ze1
31
.59
30
22
So
ybea
n(s
pec
ific
var
iety
)—m
aize
71
.11
23
15
Con
tin
uo
us
mai
zeL
oam
ysa
nd
(sit
e2
)0
.36
7
So
ybea
n(p
rom
iscu
ou
s)—
mai
ze2
61
.62
36
30
So
ybea
n(s
pec
ific
var
iety
)—m
aize
-7
1.1
72
51
8
Mai
ze–m
aize
San
dy
soil
0.2
06
Zim
bab
we
Ch
ikow
oet
al.
(20
04)
So
ybea
n-m
aize
80
.50
15
7
Con
tin
uo
us
mil
let
0.1
6–
0.5
%C
0.9
42
6N
iger
Bag
ayo
ko
etal
.(2
00
0)
Cow
pea
–m
ille
tN
ot
giv
en1
.26
36
10
Con
tin
uo
us
sorg
hu
m0
.40
12
Cow
pea
—so
rghum
Not
giv
en0.5
616
4
Con
tinuous
mai
zeL
oam
ysa
nd
2.4
644
Zim
babw
eW
addin
gto
nan
dK
arin
gw
indi
(20
01)
Gro
un
dn
ut-
mai
zeN
ot
giv
en4
.61
84
40
74 Nutr Cycl Agroecosyst (2010) 88:59–77
123
observed. This system optimized resource use effi-ciency during good rainfall seasons, while ensuring
minimum losses in case of drought due to the reduced
fertilizer inputs.
Conclusions and future perspectives
This study is an exhibit of research carried out on
soils that have been degraded and run-down overyears due to lack of soil fertility investments and
therefore decades of nutrient mining. Cases of
naturally fragile soils and tropical ecosystems e.g.extremely sandy soils and P-fixing acid soils, also
presented challenges to increased nutrient use effi-
ciency. The complexity of systems across Africa callsfor complementary exploration with modeling tools.
Recently, the NUANCES modeling framework,
which recognizes the heterogeneity between farmersand within farming systems, allowing the exploration
of trade-offs between different options, has been
developed and tested (Tittonell et al. 2008, 2009).The study has been an ambitious project to define
N and P use efficiencies in cropping systems across
SSA as we endeavor to have an in depth understand-ing of the systems. This work indicated that N and P
use efficiencies in SSA cropping systems are diverse,
being a logical consequence of poor correlationbetween yields and N or P availability in environ-
ments with other multiple constrains. For example,
NCE ranged from as little as 0.05 to [0.70 kg kg-1.Numerous examples were found in which response to
nutrients applied were meager when other resources
were limiting. Flexible systems of fertilization thatvary N input according to the current seasonal rainfall
pattern offer opportunities for high resource capture
and recovery efficiencies in semi-arid areas. In muchof our work, we employ integrated soil fertility
management (ISFM) as a gateway to increased
resource use efficiencies, in the process stronglysubscribing to the need to balance nutrient inputs for
efficient use as discussed in ‘Efficient use of nutri-ents—an art of balancing’ (Janssen 1998).
This study will probably direct some readers into a
‘so what’ mode. In the years ahead, scientistsworking across SSA will continue to re-design and
execute their experimental research programs that
will produce extra scientific information. Those asoptimistic as us will continue to hope that strides are
being made towards the coveted Green revolution forAfrica in the light of the many challenges we have
highlighted in this paper. Undoubtedly, there is
another constituency of scientists who are gettingweary and frustrated by what they perceive as an
extremely slow sub-continent.
Acknowledgments We are grateful to the EuropeanCommission for funding of the Africa-NUANCES projectunder the INCO program. Funding from the Soil FertilityConsortium for Southern Africa (SOFECSA), through itsactivities under the Forum for Agricultural Research inAfrica (FARA)’s sub-Saharan Africa Challenge Program(SSA-CP), enabled the completion of this study.
References
Bagayoko M, Buerkert A, Lung G, Bationo A, Romheld V(2000) Cereal/legume rotation effects on cereal growth inSudano-Sahelian West Africa: soil mineral nitrogen,mycorrhizae and nematodes. Plant Soil 218:103–116
Baijukya FP, de Ridder N, Giller KE (2006) Nitrogen releasefrom decomposing residues of leguminous cover cropsand their effect on maize yield on depleted soils of Buk-oba district, Tanzania. Plant Soil 279:77–93
Bar AR, Baggie I, Sanginga N (2000) The use of Sesbania(Sesbania rostrata) and urea in lowland rice production inSierra Leone. Agrofor Syst 48:111–118
Bationo A, Ayuk E, Ballo D, Kone M (1997) Agronomic andeconomic evaluation of Tilemsi phosphate rock in dif-ferent agroecological zones of Mali. Nutr Cycl Agroeco-syst 48:179–189
Becker M, Johnson DE (1999) The role of legume fallows inupland rice-based systems of West Africa. Nutr CyclAgroecosyst 53:71–81
Brouwer J, Powell JM (1998) Increasing nutrient use efficiencyin West-African agriculture: the impact of micro-topog-raphy on nutrient leaching from cattle and sheep manure.Agric Ecosyst Environ 71:229–239
Cadisch G, de Willigen P, Suprayogo D, Mobbs DC, vanNoordwijk M, Rowe EC (2004) Catching and competingfor mobile nutrients in soils. In: van Noordwijk M,Cadisch G, Ong CK (eds) Below-ground interactions intropical agroecosystems: concepts and models with mul-tiple plant components. CAB International, Wallingford,pp 171–191
Carsky RJ, Oyewole B, Tian G (1999) Integrated soil man-agement for the savanna zone of W. Africa: legume rota-tion and fertilizer N. Nutr Cycl Agroecosyst 55:95–105
Chikowo R, Mapfumo P, Nyamugafata P, Nyamadzawo G,Giller KE (2003) Nitrate-N dynamics following improvedfallows and spatial maize root development in a Zim-babwean sandy clay loam. Agrofor Syst 59:187–195
Chikowo R, Mapfumo P, Nyamugafata P, Giller KE (2004) Maizeproductivity and mineral N dynamics following different soilfertility management practices on a depleted sandy soil inZimbabwe. Agric Ecosyst Environ 102:119–131
Nutr Cycl Agroecosyst (2010) 88:59–77 75
123
Fofana B, Tamelokpo A, Wopereis MCS, Breman H, Dzotsi K,Carsky RJ (2005) Nitrogen use efficiency by maize asaffected by a mucuna short fallow and P application in thecoastal savanna of West Africa. Nutr Cycl Agroecosyst71:227–237
Gachengo CN, Palm CA, Jama B, Othieno C (1999) Tithoniaand senna green manure and inorganic fertilizers asphosphorus sources for maize in Western Kenya. AgroforSyst 44:2–36
Gandah M, Bouma J, Brouwer J, Hiernaux P, van Duiven-booden N (2003) Strategies to optimize allocation oflimited nutrients to sandy soils of the Sahel: a case studyfrom Niger, West Africa. Agric Ecosyst Environ 94:311–319
Giller KE (2001) Nitrogen fixation in tropical cropping sys-tems, 2nd edn. CAB International, Wallingford
Giller KE, Rowe EC, de Ridder N, van Keulen H (2006)Resource use dynamics and interactions in the tropics:scaling up in space and time. Agric Syst 88:8–27
Haefele SM, Wopereis MCS (2005) Spatial variability ofindigenous supplies of N, P and K and its impact onfertilizer strategies for irrigated rice in West Africa. PlantSoil 270:57–72
Hagedorn F, Steiner KG, Sekayange L, Zech W (1997) Effectof rainfall pattern on nitrogen mineralization and leachingin a green manure experiment in south Rwanda. Plant Soil195:365–375
Janssen BH (1998) Efficient use of nutrients: an art of bal-ancing. Field Crops Res 56:197–201
Janssen BH, Guiking FCT, van der Eijk D, Smaling EMA,Wolf J, van Reuler H (1990) A system for quantitativeevaluation of tropical soils (QUEFTS). Geoderma46:299–318
Jensen JR, Bernhard RH, Hansen S, McDonagh J, Moberg JP,Nielsen NE, Nordbo E (2003) Productivity in maize basedcropping systems under various soil-water-nutrient man-agement strategies in a semi-arid, Alfisol environment inEast Africa. Agric Water Man 59:217–237
Kang BT, Caveness FE, Tian G, Kolawole GO (1999) Long-term alley cropping with hedgerow species on an Alfisolin southwestern Nigeria—effect on crop performance, soilchemical properties and nematode populations. Nutr CyclAgroecosyst 54:145–155
Kasasa P, Mpepereki S, Musiiwa K, Makonse F, Giller KE(1999) Residual nitrogen fixation benefits of promiscuoussoybeans to maize under smallholder field conditions. AfrCrop Sci 7:375–382
Kaya B, Nair PKR (2001) Soil fertility and crop yields underimproved fallow systems in southern Mali. Agrofor Syst52:1–11
Kho RM (2000) On crop production and the balance ofavailable resources. Agric Ecosyst Environ 80:71–85
Kwabiah AB, Stoskopf NC, Palm CA, Voroney RP (2003) SoilP availability as affected by the chemical composition ofplant materials: implications for P-limited agriculture intropical Africa. Agric Ecosyst Environ 100:53–61
Kwesiga FR, Coe R (1994) The effect of short rotation Ses-bania sesban planted fallows on maize yield. For EcolManag 64:199–208
Lupwayi NZ, Haque I, Saka AR, Siaw DEKA (1999) Leucaenahedgerow intercropping and cattle manure application in
the Ethiopian highlands II. Maize yields and nutrientuptake. Biol Fertil Soil 28:196–203
Mafongoya PL, Dzowela BH (1999) Biomass production oftree fallows and their residual effects on maize in Zim-babwe. Agrofor Syst 47:139–151
Mando A, Ouattara B, Somado AE, Wopereis MCS, Stro-osnijder L, Breman H (2005) Long-term effects of fallow,tillage and manure application on soil organic matter andnitrogen fractions and on sorghum yield under Sudano-Sahelian conditions. Soil Use Manag 21:25–31
Mpepereki S, Javaheri F, Davis P, Giller KE (2000) Soyabeansand sustainable agriculture: promiscuous soyabeans insouthern Africa. Field Crop Res 65:137–149
Msolla MM, Semoka JMR, Borggaard OK (2005) HardMinjingu phosphate rock: an alternative P source formaize production on acid soils in Tanzania. Nutr CyclAgroecosyst 72:299–308
Mtambanengwe F, Mapfumo P (2005) Organic matter man-agement as an underlying cause for soil fertility gradientson smallholder farms in Zimbabwe. Nutr Cycl Agroeco-syst 73:227–243
Mtambanengwe F, Mapfumo P (2006) Effects of organicresource quality on soil profile N dynamics and maizeyields on sandy soils in Zimbabwe. Plant Soil 281:173–191
Nyamangara J, Bergstrom LF, Piha MI, Giller KE (2003)Fertilizer use efficiency and nitrate leaching in a tropicalsandy soil. J Environ Qual 32:599–606
Ogoke IJ, Carsky RJ, Togun AO, Dashiell K (2003) Effect of Pfertilizer application on N balance of soybean crop in theguinea savanna of Nigeria. Agric Ecosyst Environ100:153–159
Oikeh SO, Carsky RJ, Kling JG, Chude VO, Horst WJ (2003)Differential N uptake by maize cultivars and soil nitratedynamics under N fertilization in West Africa. AgricEcosyst Environ 100:181–191
Osiname OA, Meppe F, Everett L (2000) Response of maize(Zea mays) to phosphorus application on basaltic soils inNorthwestern Cameroon. Nutr Cycl Agroecosyst 56:209–217
Osunde AO, Bala A, Gwam MS, Tsado PA, Sanginga N,Okogun JA (2003) Residual benefits of promiscuoussoybean to maize grown on farmers’ fieds around Minnain the southern Guinea savanna zone of Nigeria. AgricEcosyst Environ 100:209–220
Ouedraogo E, Mando A, Zombre NP (2001) Use of compost toimprove soil properties and crop productivity under lowinput agricultural system in West Africa. Agric EcosystEnviron 84:259–266
Palm CA, Gachengo CN, Delve RJ, Cadisch G, Giller KE(2001) Organic inputs for soil fertility management intropical agroecosystems: application of an organicresource database. Agric Ecosyst Environ 83:27–42
Phiri ADK, Kanyama-Phiri GY, Snapp S (1999) Maize andSesbania production in relay cropping at three landscapepositions in Malawi. Agrofor Syst 47:153–162
Piha MI (1993) Optimizing fertilizer use and practical rainfallcapture in a semi-arid environment with variable rainfall.Exp Agric 29:405–415
Probert ME, Okalebo JR (1992) Effects of phosphorus on thegrowth and development of maize In: Probert ME (ed) A
76 Nutr Cycl Agroecosyst (2010) 88:59–77
123

search for strategies for sustainable dryland cropping insemi-arid Kenya. Proceedings of a symposium held inNairobi, Kenya, 10–11 December 1990. Canberra, Aus-tralia, ACIAR proceedings No. 41
Rockstrom J, de Rouw A (1997) Water, nutrients and slopeposition in on-farm pearl millet cultivation in the Sahel.Plant Soil 195:311–327
Rufino MC, Rowe EC, Delve RJ, Giller KE (2006) Nitrogencycling efficiencies through resource-poor African crop-livestock systems. Agric Ecosyst Environ 112:261–282
Sahrawat KL, Jones MP, Diatta S (1997) Direct and residualfertilizer phosphorus effects on yield and phosphorusefficiency of upland rice in an Ultisol. Nutr Cycl Agro-ecosyst 48:209–215
Saıdou A, Janssen BH, Temminghoff EJM (2003) Effects ofsoil properties, mulch and NPK fertilizer on the maizeyields and nutrient budgets on ferralitic soils in southernBenin. Agric Ecosyst Environ 100:265–273
Samake O, Smaling EMA, Kropff MJ, Stomph TJ, Kodio A(2006) Effects of cultivation practices on spatial variationof soil fertility and millet yields in the Sahel of Mali.Agric Ecosyst Environ 109:335–345
Sanchez PA, Sherperd KD, Soule MJ, Place FM, Buresh RJ,Izac AM, Mokunywe AU, Kwesiga FR, Ndiritu CG,Woomer PL (1997) Soil fertility replenishment in Africa:an investment in natural resource capital. In: Buresh RJ,Sanchez PA, Calhoun F (eds) Replenishing soil fertility inAfrica. SSSA Spec. Publ. 51 ASA and SSSA, Madison
Sangare M, Rernandez_Rivera S, Hiernaux P, Bationo A,Pandey V (2002) Influence of dry season supplementationfor cattle on soil fertility and millet (Pennisetum glaucumL.) yield in a mixed crop/livestock production system ofthe Sahel. Nutr Cycl Agroecosyst 62:209–217
Sanginga N, Ibewiro B, Houngnandan P, Vanlauwe B, OkogunJA, Okobundu IO, Versteeg M (1996) Evaluation ofsymbiotic properties and the nitrogen contribution ofmucuna to maize grown in the derived savanna of WestAfrica. Plant Soil 179:119–129
Sanginga N, Okogun J, Vanlauwe B, Dashiell K (2002) Thecontribution of nitrogen by promiscuous soybeans tomaize based cropping in the moist savanna of Nigeria.Plant Soil 241:223–231
Sigunga DO, Janssen BH, Oenema O (2002) Effects ofimproved drainage and nitrogen source on yields nutrient,uptake and utilization efficiencies by maize (Zea mays L.)on Vertisols in sub-humid environments. Nutr CyclAgroecosyst 62:263–275
Smaling EMA, Nandwa SM, Prestele H, Roetter R, MuchenaFN (1992) Yield response of maize to fertilizers andmanure under different agro-ecological conditions inKenya. Agric Ecosyst Environ 41:241–252
Smaling EMA, Nandwa SM, Janssen BH (1997) Soil fertilityin Africa is at stake. In: Buresh RJ, Sanchez PA, CalhounF (eds) Replenishing soil fertility in Africa. SSSA Publi-cation 51 SSSA and ASA, Madison, pp 47–61
Stahl L, Nyberg G, Hogberg P, Buresh RJ (2002) Effects ofplanted tree fallows on oil nitrogen dynamics, aboveground and root biomass, N2-fixation and subsequent
maize crop productivity in Kenya. Plant Soil 243:103–117
Tittonell P, Vanlauwe B, Leffelaar PA, Shepherd KD, GillerKE (2005) Exploring diversity in soil fertility manage-ment of smallholder farms in western Kenya. II. Within-farm variability in resource allocation, nutrient flows andsoil fertility status. Agric Ecosyst Environ 110:166–184
Tittonell P, Corbeels M, van Wijk MT, Vanlauwe B, Giller KE(2008) Targeting nutrient resources for integrated soilfertility management in smallholder farming systems ofKenya. Agron J 100:1511–1526
Tittonell P, van Wijk MT, Herrero M, Rufino MC, de RidderN, Giller KE (2009) Beyond resource constraints—Exploring the biophysical feasibility of options for theintensification of smallholder crop-livestock systems inVihiga district, Kenya. Agric Syst 101:1–19
van Asten PJA, van Bodegom PM, Mulder LM, Kropff MJ(2005) Effect of straw application on rice yields andnutrient availability on an alkaline and a pH-neutral soil ina Sahelian irrigation scheme. Nutr Cycl Agroecosyst72:255–266
Van Duivenbooden N, de Wit CT, van Keulen H (1996)Nitrogen, phosphors and potassium relations in five majorcereals reviewed in respect to fertilizer recommendationsusing simulation modelling. Fertil Res 44:37–49
Vanlauwe B, Diels J, Lyasse O, Aihou K, Iwuafor ENO,Sanginga N, Merckx R, Deckers J (2002) Fertility statusof soils of the derived savanna and northern guineasavanna and the response to plant nutrients, as influencedby soil type and land use management. Nutr Cycl Agro-ecosyst 62:139–150
Vanlauwe B, Diels J, Sanginga N, Merckx R (2005) Long-termintegrated fertility management in South-western Nigeria:crop performance and impact on the soil fertility status.Plant Soil 273:337–354
Waddington SR, Karingwindi J (2001) Productivity and prof-itability of maize ? groundnut rotations compared withcontinuous maize on smallholder farms in Zimbabwe. ExpAgric 37:83–98
Wallace JS (2000) Increasing agricultural water use efficiencyto meet future food production. Agric Ecosyst Environ82:105–119
Wopereis MCS, Tamelokpo A, Ezui K, Gnakpenou D, FofanaB, Breman H (2006) Mineral fertilizer management ofmaize on farmer fields differing in organic inputs in theWest African savanna. Field Crop Res 96:355–362
Zaongo CGL, Wendt CW, Lascano RJ, Juo ASR (1997)Interactions of water, mulch and nitrogen on sorghum inNiger. Plant Soil 197:119–126
Zingore S, Murwira HK, Delve RJ, Giller KE (2007) Influenceof nutrient management strategies on variability of soilfertility, crop yields and nutrient balances on smallholderfarms in Zimbabwe. Agric Ecosyst Environ 119:112–126
Zougmore R, Mando A, Stroosnijder L, Ouedraogo E (2004)Economic benefits of combining soil and water conser-vation measures with nutrient management in semiaridBurkina Faso. Nutr Cycl Agroecosyst 70:261–269
Nutr Cycl Agroecosyst (2010) 88:59–77 77
123