Embed Size (px)
Citation preview

Retrospective Theses and Dissertations Iowa State University Capstones, Theses andDissertations
1982
Nitrogen and phosphorus fertilization ofSparganium eurycarpum and Typha glauca stands,Eagle Lake, IowaRobert Kyle NeelyIowa State University
Follow this and additional works at: https://lib.dr.iastate.edu/rtd
Part of the Botany Commons
This Dissertation is brought to you for free and open access by the Iowa State University Capstones, Theses and Dissertations at Iowa State UniversityDigital Repository. It has been accepted for inclusion in Retrospective Theses and Dissertations by an authorized administrator of Iowa State UniversityDigital Repository. For more information, please contact [email protected].
Recommended CitationNeely, Robert Kyle, "Nitrogen and phosphorus fertilization of Sparganium eurycarpum and Typha glauca stands, Eagle Lake, Iowa "(1982). Retrospective Theses and Dissertations. 7521.https://lib.dr.iastate.edu/rtd/7521

INFORMATION TO USERS
This reproduction was made from a copy of a document sent to us for microfilming. While the most advanced technology has been used to photograph and reproduce this document, the quality of the reproduction is heavily dependent upon the quality of the material submitted.
The following explanation of techniques is provided to help clarify markings or notations which may appear on this reproduction.
1. The sign or "target" for pages apparently lacking from the document photographed is "Missing Page(s)". If it was possible to obtain the missing page(s) or section, they are spliced into the film along with adjacent pages. This may have necessitated cutting through an image and duplicating adjacent pages to assure complete continuity.
2. When an image on the film is obliterated with a round black mark, it is an indication of either blurred copy because of movement during exposure, duplicate copy, or copyrighted materials that should not have been filmed. For blurred pages, a good image of the page can be found in the adjacent frame. If copyrighted materials were deleted, a target note will appear listing the pages in the adjacent frame.
3. When a map, drawing or chart, etc., is part of the material being photographed, a definite method of "sectioning" the material has been followed. It is customary to begin filming at the upper left hand comer of a large sheet and to continue from left to right in equal sections with small overlaps. If necessary, sectioning is continued again—beginning below the first row and continuing on until complete.
4. For illustrations that cannot be satisfactorily reproduced by xerographic means, photographic prints can be purchased at additional cost and inserted into your xerographic copy. These prints are available upon request from the Dissertations Customer Services Department.
5. Some pages in any document may have indistinct print. In all cases the best available copy has been filmed.
Universi Microrilms
Intemationêil 300 N. Zeeb Road Ann Arbor, Ml 48106


8224239
Neely, Robert Kyle
NTTROGEN AND PHOSPHORUS FERTILIZATION OF SPARGANIUM EURYCARPUM AND TYPHA GLAUCA STANDS, EAGLE LAKE, IOWA
lov/a State University Ph.D. 1982
University Microfilms
Intsrnâtionâl m N. Zeeb Road. Ann Arbor. MI 48106

Nitrogen and phosphorus fertilization of Sparganium eurycarpum
and Typha glauca stands. Eagle Lake, Iowa
•by
Robert Kyle Neely
A Dissertation Submitted to the
Graduate Faculty in Partial Fulfillment of the
Requirements for the Degree of
DOCTOR OF PHILOSOPHY
Major: Botany
Approved:
In Chag^e of Major Work
For the Major Departme^
ror the Gradfete College
Iowa State University Ames, Iowa
1982
Signature was redacted for privacy.
Signature was redacted for privacy.
Signature was redacted for privacy.

ii
TABLE OF CONTENTS
Page
GENERAL INTRODUCTION 1
Explanation of Thesis Format 2
SECTION I. NITROGEN AND PHOSPHORUS CONCENTRATIONS IN SURFACE AND INTERSTITIAL WATER OF A PRAIRIE MARSH 6
ABSTRACT 7
INTRODUCTION 9
METHODS 11
Study Site 11
Experimental Design 12
Collection and Analysis of Samples 14
Statistical Procedures 16
RESULTS 18
Seasonal Patterns 18
Surface water 18
Nitrogen 18
Phosphorus 20
Interstitial water 23
1979 23
1980 26
Nitrogen 26
Phosphorus 28
Short-Term Patterns 30
Surface water 30

iii
15-cm interstitial water 30
DISCUSSION 33
LITERATURE CITED 38
SECTION II. NUTRIENT LIMITATION OF SPARGANIUM EURYCARPUM AND TYPHA GLAUCA IN A PRAIRIE MARSH 43
ABSTRACT 44
INTRODUCTION 45
METHODS 48
Study Site 48
Construction and Fertilization of Enclosures 49
Collection and Analysis of Samples 49
Sediment and interstitial H^O 49
Vegetation 51
Statistical Analyses 52
RESULTS 54
Interstitial H^O 54
Sediment 56
Above-ground Vegetative Response 58
Nitrogen content 58
Shoot density 60
Biomass and production 60
Below-ground Vegetative Response 66
Nitrogen content 66
Biomass 67
DISCUSSION 69

iv
Nutrient Availability 69
Production 70
LITERATURE CITED 74
SECTION III. NITROGEN, PHOSPHORUS, AND THE DECOMPOSITION OF TYPHA GLAUCA AND SPARGANIDM EURYCARPDM IN A PRAIRIE MARSH 80
ABSTRACT 81
INTRODUCTION 83
METHODS 87
Study Site 87
Fertilization Experiments 87
Shoot tissues 88
Root-rhizome tissues 89
Shoot Decomposition and Initial Nutrient Content 89
Statistical Analyses 90
RESULTS 92
Shoot Decomposition 92
Dry weight 92
Nitrogen content 94
Phosphorus content 97
Root-rhizome Decomposition 99
Dry weight 99
Nitrogen content 100
DISCUSSION 102
Dry Weight 102
Shoot litter 102

V
Eoot-rhizome litter 105
Nutrient Content 106
Shoot litter 106
Below-ground litter 110
CONCLUSIONS 112
LITERATURE CITED 115
ST3MMARY 120
LITERATURE CITED 123
ACKNOWLEDGEMENTS 125

vi
LIST OF FIGURES
Page
Figure 1. The location of Eagle Lake marsh, Iowa 3
Figure 2. The location of fertilized and unfertilized
sampling plots at Eagle Lake marsh 4
Figure 3. The internal arrangement of Eagle Lake sampling
plots 5
Figure I-l. The location of fertilized and unfertilized
sampling plots at Eagle Lake marsh 13
Figure 1-2. Interstitial water sampling well 15
Figure 1-3. The average concentration of NH^-N, NO^-N, and
organic nitrogen in Eagle Lake fertilized and
unfertilized surface water during 1979 and 1980 19
Figure 1-4. The average concentration of PO^-P, total
dissolved phosphorus (TDP), and particulate
phosphorus (PP) in Eagle Lake fertilized and
unfertilized surface water in 1979 and 1980 21
Figure 1-5. The average concentration of NH^-N, NO^-N, and
organic nitrogen in Eagle Lake fertilized and
unfertilized interstitial water at 15-cm and
45-cm depths 27
Figure 1-6. The average concentration of PO.-P and total 4 •
phosphorus (TP) in Eagle Lake fertilized and
unfertilized interstitial waters at 15-cm and
45-cm depths 29

vii
Figure 1-7. The average concentration of NO^-N, and
PO^-P in surface water (n=6) and in 15-cm inter
stitial water (n=2) on successive days after
fertilization in July and October
Figure II-l. Location of Sparganium and Typha control and
fertilized enclosures at each of 3 sites in
Eagle Lake marsh. The actual arrangement of
plots at each site is not indicated
Figure II-2. Average NH^-N, NO^-N, and PO^-P concentrations
in interstitial water and sediments of control
and fertilized plots during 1979 and 1980
Figure II-3. Average percentage nitrogen in Sparganium and
Typha shoot and root-rhizome tissues from con
trol and fertilized plots during 1979 and 1980
Figure II-4. Average Sparganium and Typha shoot density in
control and fertilized plots in 1979 and 1980
Figure II-5. Average Sparganium and Typha total above-ground
biomass in control and fertilized plots during
1979 and 1980
Figure II-6. Summary of the 1980 effects of fertilization on
Sparganium and Typha stands on NH^-N, NO^-N, and
PO^-P concentrations in interstitial waters;
NH,-N and PO,-P concentrations in sediments; 4 4
percentage nitrogen in shoots and roots-rhizomes
maximum shoot density; net primary production

viii
(NPP); and autumn below-ground biomass. Signif
icance at the 0.10 confidence level is desig
nated by an asterisk. Summer averages are used
for all nutrient concentrations 72
Figure III-l. Sources of carbon, nitrogen, and phosphorus
for microbial decomposers 84
Figure III-2- The average percentage of original dry weight
remaining in submerged Typha and Spar gam'um
shoot and root-rhizome litterbags 93
Figure III-3. The average concentration of nitrogen in
submerged Typha and Sparganium shoot and root-
rhizome litterbags 95
Figure III-4. The average percentage of original nitrogen
remaining in submerged Typha and Sparganium
shoot and root-rhizome litterbags 96
Figure III-5. The average concentration of phosphorus and
the percentage of original phosphorus re
maining in submerged Typha and Sparganium
shoot litterbags 98
Figure 4. The movement and effect of nitrogen and phos
phorus fertilizer in Eagle Lake marsh. After
application, the fertilizer moved through the
litter layer into the interstitial water column.
As a result, nitrogen and phosphorus concentra
tions in both compartments were elevated. Emer-

ix
gent plant uptake and accumulation of nitrogen
from interstitial waters in 1979 and 1980 stimu
lated an increase in shoot density in 1980, an
increase in net primary production (NPP) in
1980, and eventually an increase in the rate
of decomposition. Percentages denote the 1980
post-fertilization changes in nitrogen and phos
phorus concentration of interstitial water and
live tissues; the change in the absolute quan
tity of nitrogen and phosphorus in litter; the
change in shoot density; the change in NPP;
and the change in the rate of decomposition

X
LIST OF TABLES
Page
Table I-l. 1979 15-cm interstitial concentrations (mg/1) in
Typha glauca and Sparganium eurycarpum experi
mental plots 24
Table 1-2. 1979 45-cm interstitial concentrations (mg/1) in
Typha glauca and Sparganium eurycarpum experi
mental plots 25
Table II-l. 1979 15-cm interstitial concentrations (ppm) in
Typha glauca and Sparganium eurycarpum experi
mental plots 57
Table II-2. 1979 and 1980 average net annual above-ground
2 production (g/m ), average maximum above-ground
2 biomass (g/m ), average autumn below-ground bio-
2 mass (g/m ), and below-ground: above-ground bio
mass ratios for Typha glauca and Spar gam'urn
eurycarpxmi in control and fertilized plots 64
Table II-3. Typha and Sparganium above-ground biomass or
annual production values in inland freshwater
marshes 65
Table III-l. The amount of precipitation (cm) at Eagle Lake
between fall, 1978 and spring, 1979 104
Table III-2. Approximate C:N and C:P ratios (assuming C as 45%
of dry weight - Prentki et al., 1978) of unferti
lized, fertilized, and swine enriched litter 108

xi
Table III-3- Percentage remaining of original dry-weight,
nitrogen, and phosphorus quantities in Typha
glauca and Sparganium eurycarpum litter after
505 days 113

1
GENERAL INTRODUCTION
Through the combination of unique biological, chemical and
physical properties, wetland ecosystems can act as sinks for inor
ganic nitrogen and phosphorus. In a review of 17 studies, van der Valk
et al. (1978) reported that all wetland types function as nitrogen and
phosphorus traps on at least a seasonal basis. Anaerobic interstitial
water and anaerobic water at the sediment-water interface accelerate
the loss of NOg-N by denitrification (Brezonik and Lee 1968; Chen et al.
1972; Patrick and Tusneem 1972; Keeney et al. 1971; Bartlett et al.
1979; Reddy et al. 1980); and anaerobic conditions also inhibit the
mineralization of nitrogen and phosphorus from decomposing vegetation
(Chamie and Richardson 1978; Heal et al. 1978). Aerobic surface
waters cause the precipitation of PO^-P with iron (Stumm and Morgan
1970). Live plants remove inorganic nitrogen and phosphorus from
interstitial waters (Valiela and Teal 1974). And, microbes associated
with decomposing emergent macrophyte litter remove inorganic nitro
gen and phosphorus from surface waters (De La Cruz and Gabriel 1974;
Klopatek 1975; Brinson 1977; Davis and Harris 1978; Davis and
van der Valk 1978a, 1978b; and others). Thus, considerable interest
and research has been focused on the use of wetlands for wastewater
renovation (See Spangler et al. 1976; Til ton et al. 1976; Tourbier
and Pierson 1976; Good et al. 1978; Greeson et al. 1978).
Although data exist regarding the effectiveness of a marsh as
a nutrient sink, few studies have assessed the effect of high loadings

2
on abiotic and biotic marsh components. If natural wetlands are to
be utilized as wastewater renovation sites, the short- and long-term
effects of nutrient enrichment on the ecosystem must be known. This
study is such an assessment. This dissertation describes and quanti
fies the change in interstitial and surface water chemistry, emergent
plant decomposition, and emergent vegetation dynamics during two
years of nitrogen and phosphorus enrichment of a prairie marsh.
Eagle Lake, Iowa (Figure 1).
Explanation of Thesis Format
This dissertation is divided into three sections, each of which
is written in a format suitable for publication in a technical journal.
References cited in the general introduction may be found at the end of
the dissertation. References cited within a section may be found at
the end of that section.
The three sections of this dissertation discuss interstitial and
surface water chemistry, emergent vegetation dynamics, and emergent
plant decomposition, respectively. Each section is a subdivision
of a single research project. The experimental design of this project
was based on a series of fertilized watertight enclosures and unfer
tilized open plots within Eagle Lake marsh (Figure 2). All data in
this thesis were obtained from these structures. The internal
arrangement of each enclosure and open plot is presented in Figure 3.
Refer to the individual sections for a detailed description of the
sampling procedures used within enclosures and open plots.

3
IOWA
EagI* Laic*
Ames 42
I-80
Des Moines
.Council Bluffs
80 km
Figure 1, The location of Eagle Lake marsh, Iowa

4
1/4 mi.
• CONTROL • FERTILIZED
Figure 2. The location of fertilized and unfertilized sampling plots at Eagle Lake marsh

5
3m 2m •f Im -|
M
Root/Shoot (Root Production)
Shoot Litter Bags
Walkway
Turnover Plots (Shoot Production)
J.
Root litter Bags
J "5. E 0 Ui
o U)
o o X (A
0
S
Figure 3. The internal arrangement of Eagle Lake sampling plots

6
SECTION I. NITROGEN AND PHOSPHORUS CONCENTRATIONS IN SURFACE
AND INTERSTITIAL WATER OF A PRAIRIE MARSH

7
ABSTRACT
In 1979 and 1980, nitrogen and phosphorus concentrations in surface
and interstitial water at 15-cm and 45-cm depths were examined in
fertilized and unfertilized sample plots at Eagle Lake marsh, Iowa.
In the unfertilized plots, the average concentration of NH^-N in
surface water was 0.71 mg/1 in 1979 and 0.25 mg/1 in 1980. The average
15-cm interstitial NH^-N concentration in these plots was 0.50 mg/1 in
1979 and 0.28 mg/1 in 1980. NO^-N concentrations in unfertilized plots
averaged 0.92 and 1.44 mg/1 in surface water during 1979 and 1980, re
spectively, and averaged 0.32 and 0.20 mg/1 in 15-cm interstitial water
during 1979 and 1980, respectively. Concentrations of organic
nitrogen in surface water and 15-cm interstitial water of unfertilized
plots ranged between 6.6 and 8.7 mg/1. The average PO^-P concentra
tion in unfertilized surface water was 0.34 mg/1 in 1979 and 0.47 mg/1
in 1980, and the average 15-cm interstitial PO^-P concentration in
unfertilized plots was 0.53 mg/1 in 1979 and 0.58 mg/1 in 1980.
Total dissolved phosphorus in unfertilized surface water averaged
0.56 and 0.54 mg/1 in 1979 and 1980, respectively. Particulate
phosphorus in these plots was usually less than 0.75 mg/1. Total
phosphorus in 15-cm interstitial water of the unfertilized plots
averaged 0.75 mg/1 in 1980. In general, nitrogen and phosphorus
concentrations in 45-cm interstitial water resembled concentrations
in 15-cm interstitial water.
On the basis of seasonal averages, fertilization in 1979 caused in
8
creases of NH^-N (+144%), NO^-N (+291%), and PO^-P (+47%) in 15-cm
interstitial water. In 1980, fertilization caused increases in NH^-N
(+189%), PO^-P (+60%), and also the non-PO^-P fraction of total
phosphorus (+50%). Although NO^-N concentrations were not permanently
elevated in 1980, NO^-N concentrations in 15-cm interstitial water did
increase temporarily by 0.3-0.4 mg/1 in the first 24 hours after
fertilization. Concentrations of NH^-N, NOg-N, and PO^-P in 45-cm
interstitial water in fertilized plots during 1979 were increased by
250%, 7%, and 106%, respectively. Fertilization had no effect on
nitrogen and phosphorus concentrations in 45-cm interstitial water
in 1980.
Key words: interstitial water, nitrogen, phosphorus, nutrients,
marsh, wetland, submerged sediments, wastewater renovation.

9
INTRODUCTION
The chemical transformations within and movement of minerals
between sediments, interstitial water, and overlying surface water
have been studied in lake ecosystems (Mortimer 1941; Keeney et al.
1970; Konrad et al. 1977; Brunskill et al. 1971; Lerman and
Brunskill 1971; Graetz et al. 1973; Syers et al. 1973; Serruya et al.
1974; Viner 1975, 1977; Holdren et al. 1977; and others) and in
marine ecosystems (Bischoff et al. 1970; Bray et al. 1973;
Sholkovitz 1973; Li and Gregory 1974; Martens et al. 1978). Inter
stitial water chemistry of wetlands dominated by emergent macrophytes,
however, is less well-understood. Our current understanding of wet
land interstitial water chemistry comes mostly from a few studies
of coastal marshes (Valiela and Teal 1974; Correll et al. 1975) and
from the more extensive literature on flooded rice soils (Singlachar
and Samaniego 1973; Sevant and De Datta 1979, 1980; Alva et al.
1980). Because of high levels of plant biomass productivity, litter
accumulation, and the penetration of rhizomes and fibrous root
systems to depths of at least 30 cm, the subsurface characteristics
of an emergent plant dominated wetland differ fundamentally from
subsurface characteristics of open water systems. First, nutrients
are assimilated from wetland interstitial water by growing plants.
Second, large deposits of organic matter at the sediment-water
interface may reduce movement of dissolved nutrients between surface

10
and interstitial water. Third, while a lake sediment is an anaerobic
(reducing) zone, wetland sediments are essentially anaerobic environ
ments permeated by extensive oxidized microzones around living below-
ground macrophyte tissues; hence, oxidative processes such as
nitrification (Irzumi et al. 1980) and phosphate immobilization by
precipitation with iron (Alva et al. 1980) can occur in this otherwise
anoxic environment.
The purposes of this investigation were (1) to characterize
seasonal patterns of nitrogen and phosphorus concentrations in
interstitial water at two depths, (2) to examine the change in
concentration and form of interstitial nitrogen and phosphorus after
surface water fertilization, and (3) to assess the rate of nitrogen
and phosphorus depletion in surface water and nitrogen and phosphorus
increase in interstitial water during 28-day intervals after fertiliza
tion.

11
METHODS
Study Site
Eagle Lake, Hancock County, Iowa is a hardwater marsh of the North
American prairie pothole region (Davis and van der Valk 1978a).
Eagle Lake has a surface area of 365 ha and drains approximately
2,653 ha. Water depth can be regulated by a dam at the northern
edge of the marsh and rarely exceeds 1 m. A semipermanent zone of
open water is found in the center of the marsh; thus, the marsh is
classified as a Type I? wetland.
Over 76% of the Eagle Lake drainage basin is used for agricul
tural purposes; 66% is used in row-crop cultivation of corn and
soybeans. Runoff and drainage from cultivated fields carry large
amounts of nitrogen and phosphorus into the marsh. In 1979, 9.1 kg
NH^-N/ha, 210 kg NO^-N/ha, and 3.5 kg PO^-P/ha entered the: marsh
in precipitation and agricultural runoff (Davis et al. 1981). Of
these amounts, 86% of the entering NO^-N and 78% of NH^-N was
removed from the water as it passed through the marsh. Conversely,
PO^-P was not removed appreciably by the marsh.
More than 40 species of aquatic plants occur in Eagle Lake.
But, in years of high water levels such as 1979 and 1980, the
marsh is dominated by Typha glauca and Sparganium eurycarpum.
Currier (1979), Davis and van der Valk (1978a, 1978b, 1978c), and
van der Valk and Davis (1978a, 1978b, 1979, 1980) have described
the production, decomposition, seed bank dynamics, and nutrient
12
fluctuations of the major plant species in Eagle Lake.
Average annual precipitation for the Eagle Lake area is
approximately 802 mm. Precipitation during 1979 and 1980 was 957
and 710 mm, respectively. Average daily temperatures ranged from a
winter 1979 temperature of -8.1 C to 23 C in the summer of 1980.
Experimental Design
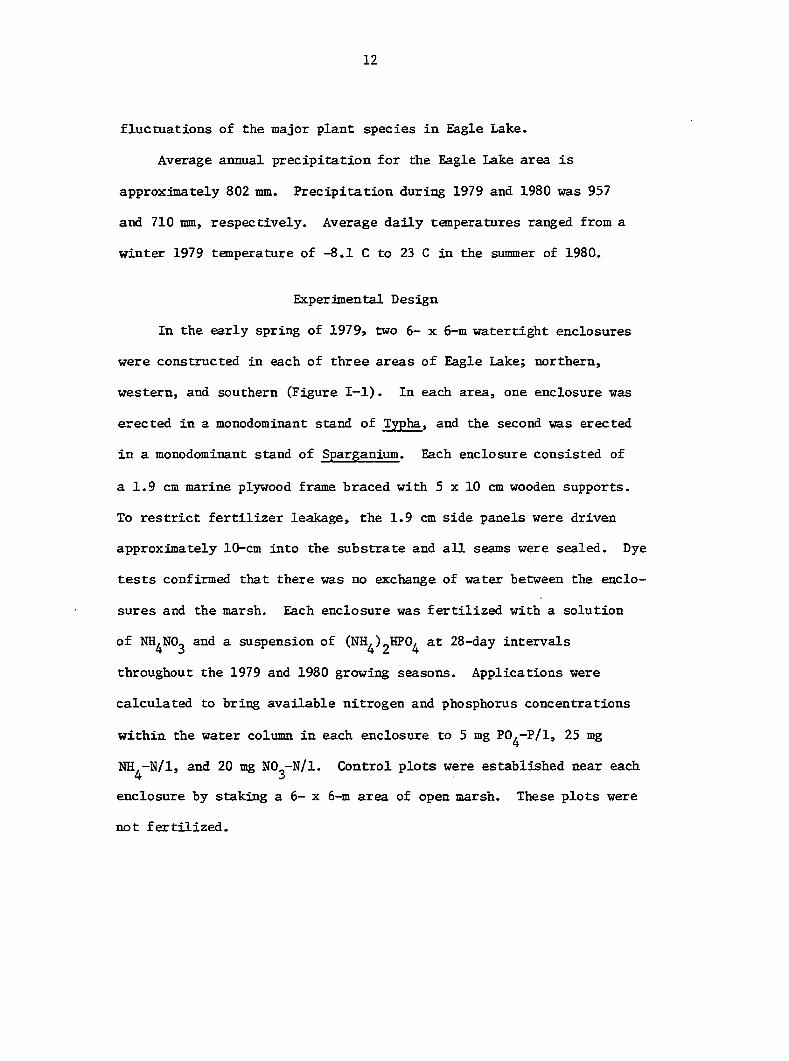
In the early spring of 1979, two 6- x 6-m watertight enclosures
were constructed in each of three areas of Eagle Lake; northern,
western, and southern (Figure I-l). In each area, one enclosure was
erected in a monodominant stand of Typha, and the second was erected
in a monodominant stand of Sparganium. Each enclosure consisted of
a 1.9 cm marine plywood frame braced with 5 x 10 cm wooden supports.
To restrict fertilizer leakage, the 1.9 cm side panels were driven
approximately 10-cm into the substrate and all seams were sealed. Dye
tests confirmed that there was no exchange of water between the enclo
sures and the marsh. Each enclosure was fertilized with a solution
of NH^NOg and a suspension of (NH^)gHPO^ at 28-day intervals
throughout the 1979 and 1980 growing seasons. Applications were
calculated to bring available nitrogen and phosphorus concentrations
within the water column in each enclosure to 5 mg PO^-P/1, 25 mg
NH -N/1, and 20 mg NO -N/1. Control plots were established near each
enclosure by staking a 6- x 6-m area of open marsh. These plots were
not fertilized.

13
1/4 mi.
• CONTROL •FERTILIZED
Figure I-l. The location of fertilized and unfertilized sampling plots at Eagle Lake marsh

14
Collection and Analysis of Samples
Single, 300 ml surface water samples and 121 ml interstitital
water samples at 15-cm and 45-cm depths were collected biweekly from
treatment and control plots during the 1979 and 1980 growing seasons.
The interstitial samples were obtained from permanently situated,
suction-operated sampling wells. The wells were constructed of PVC
pipe fitted with a plexiglass plate which lay flush with the sediment-
water interface, with a filtered water intake at the sampling depth,
with two tygon tubes for suction and air intake, and with a plexi
glass seal inside the pipe to prevent water movement up the entire
length of the pipe (Figure 1-2). Each well was tested for leakage
before it was used.
During a warm summer month (July) and a cool autumn month
(October), surface and interstitial water sampling was intensified;
triplicate surface samples and iS-cm deep interstitital samples were
collected from selected enclosures throughout the entire 28-day inter
val between fertilizations. Samples were taken 1, 3, 5, 8, 11, 13,
21, and 28 days after fertilization in July. And, samples were
collected 1, 3, 5, 10, 15, 21, and 27 days after fertilization in
October. This intensified sampling provided a more accurate estimate
of nutrient change and variation within the fertilized enclosures
over shorter time inteirvals.
All water samples were preserved immediately in the field by adding
1 ml concentrated H^SO^/l of sample and placing the sample on ice.
In the lab, all samples were stored at 5 C until analyzed. Surface

15
>ing
Suction Tube Air intake
PVC Pipe & Fittings Plexiglass Plate
15 or 45 cm
10 cm
Nylon Cloth Filter ' ~
Interstitial Water
Figure 1-2. Interstitial water sampling well

16
water samples were analyzed for PO^-P, total dissolved phosphorus (TDP,
as PO^-P), particulate phosphorus (PP, as PO^-P), NO^-N, and
organic nitrogen (as NH^-N). Biweekly interstitial samples were
analyzed for PO^-P, total phosphorus (TP, as PO^-P), NO^-N, and
organic nitrogen. Interstitial sançles collected in the short-term
studies were analyzed for NO^-N and PO^-P only. Phosphorus
analyses were conducted by using ascorbic acid reduction (Murphey and
Riley 1962). Phosphorus forms other than PO^-P were differentially
filtered (Gelman GA-6 membrane filter, 0.45 um, 47 mm) and digested
with 5% potassium persulfate prior to reduction (Lind 1979; A.P.H.A.
1975). NH^-N concentrations were determined by the phenate colori-
metric procedure (Stainton et al. 1974). NO^-N concentrations were
carried out by using the Technicon Auto-Analyzer II system cadmium
reduction procedure. Microkjeldahl procedures were used to determine
organic nitrogen concentrations (A.P.H.A. 1975).
Statistical Procedures
Data analysis was performed by using Statistical Analysis Systems
(SAS). Analyses of variance (ANOVA) were calculated using a factorial
model with 2 species and 2 treatments over all sampling dates. Each
MOVA was used to evaluate the significance of the following factors
or interactions in influencing nutrient concentrations: site, species,
treatment, species x treatment, site x species x treatment, time,
time X species, time x treatment, and time x species x treatment.
Nitrogen and phosphorus concentrations in wetland interstitial

17
water typically esdiibit high variability; thus, statistical
significance was established at the a = 0.1 critical level CSee
Richardson et al. 1976). Mean square values for site, species, treat
ment and species x treatment were computed by using the site x species x
treatment interaction as an error term. Mean square values for the
remaining ANOVA terms were calculated with the standard error term,
but conservative degrees of freedom were used to evaluate the F values.

18
RESULTS
Seasonal Patterns
Surface water
Nitrogen Figure 1-3 depicts the change in mean concentra
tions of NH^-N, NO^-N, and organic nitrogen during the 1979 and
1980 growing seasons. During both study years, NH^-N concentrations
within fertilized enclosures oscillated in an expected manner. The
oscillations were the result of repeated application of NH^-N and
the subsequent declines of the elevated NH^-N levels over 28-day
intervals. Concentration differences between fertilized and unfer
tilized plots were significant in 1979 and 1980. The NH^-N seasonal
averages were as follows: 0.71 mg/1 in 1979 unfertilized plots,
0.25 mg/1 in 1980 unfertilized plots, 3.35 mg/1 in 1979 fertilized
enclosures and 1.53 mg/1 in 1980 unfertilized enclosures. During the
2-year study period, and particularly in 1979, highest NH^-N levels
were detected near the end of thé growing season.
Fluctuations in NO^-N concentrations did not resemble those for
NH^-N (Figure 1-3). Because NO^-N was removed rapidly after applica
tion, no oscillation of concentrations was detected. On the basis
of the biweekly samples, NO^-N levels in surface water were not
influenced by fertilization. Seasonal averages were 0.92 and 1.44 mg/1
in unfertilized.plots in 1979 and 1980, respectively. Averages in
fertilized enclosures were 0.90 mg/1 in 1979 and 0.73 mg/1 in 1980.

1979 1980
J A S O
unfert i l ized fert i l ized
ë
Figure 1-3. The average concentration of NH^-N, NO^-N, and organic nitrogen in Eagle Lake ferti
lized and unfertilized surface water during 1979 and 1980

20
Through each season, NO^-N levels were variable, but maximum concen
trations generally occurred in the mid to latter part of each growing
season (Figure 1-3).
Organic nitrogen concentrations were not affected significantly
by fertilization in either study year (Figure 1-3), The average
1979 organic nitrogen concentration was 8.2 mg/1 in unfertilized
plots and 8.7 mg/1 in fertilized enclosures. The 1980 averages were
slightly lower, 6.6 mg/1 in unfertilized plots and 7.0 mg/1 in fer
tilized enclosures. Consistent seasonal trends of organic nitrogen
concentration were not observed. In 1979, concentrations fluctuated
eradically, ranging from 4.5 to 14 mg/1 in treatments. In 1980, a
peak of 16.3 mg/1 in control plots and 18.9 mg/1 in fertilized plots
occurred in July.
Phosphorus The 1979 and 1980 changes in average PO^-P, total
dissolved phosphorus (TOP), and particulate phosphorus (PP) concentra
tions in unfertilized and fertilized areas are illustrated in
Figure 1-4. In both years, PO^-P concentrations were significantly
higher in fertilized enclosures; averages were 0.34 mg/1 in 1979
unfertilized plots, 1.06 mg/1 in 1979 fertilized enclosures, 0.47
mg/1 in 1980 unfertilized plots, and 1,25 mg/1 in 1980 fertilized
enclosures. The slow disappearance of applied PO^-P after fertiliza
tion in 1979 produced an oscillating concentration pattern similar to
that for NH^-N (Figure 1-3). In contrast to 1979, 1980 PO^-P
concentrations only occasionally showed any correlation with PO^—P

1979
m g 2.0
0.5—
1980
— V"
J ' J ' A ' S ' O
unfert i l ised fert i l ized
Figure 1-4. The average concentration of PO^-P, total dissolved phosphorus (TDP), and particulate
phosphorus (PP) in Eagle Lake fertilized and unfertilized surface water in 1979 and
1980

22
application. Maximum PO^-P concentrations occurred in autumn of both
years, 2.1 mg/1 in October, 1979 and 2.3 mg/1 in September, 1980.
Concentrations in unfertilized plots were relatively stable during
the summer, with levels consistently below 1 mg/1.
Because PO^-P represented a large portion of TDP, there was
little difference between the seasonal fluctuations of the phosphorus
fractions (Figure 1-4). In each year, TDP concentrations were signif
icantly greater in fertilized enclosures. TDP values in unfertilized
plots averaged 0.56 and 0.54 mg/1 in 1979 and 1980, respectively.
The fertilized averages were almost 200% higher, 1.53 mg/1 in 1979
and 1.31 mg/1 in 1980. On the basis of seasonal averages, dissolved
phosphorus other than PO^-P amounted to only 39% in 1979 and 7% in
1980 of TDP in unfertilized plots. Similarly, the non-PO^-P fraction
of TDP in fertilized enclosures was 31% in 1979 and 5% in 1980. In
1979 only was the non-PO^-P fraction of TDP significantly higher in
fertilized enclosures.
Particulate phosphorus (PP) concentrations were not affected by
fertilizations in either study year (Figure 1-4). With the exception
of isolated peaks in July of each year, concentrations were stable
and usually less than 0.75 mg/1. Averaged over both treatments, mean
PP concentration was 0.27 mg/1 in 1978 and 0.13 mg/1 in 1980.

23
Interstitial Water
1979 In 1979, 15-cm and 45-cm interstitial water samples were
analyzed for NH^-N, NO^-N, and PO^-P only. Because of extensive
muskrat damage to sampling wells in 1979, numerous wells were removed
from the field, repaired and replaced; thus, we were unable to gather
data on several dates. On other dates we were able to gather informa
tion from 1 site only. Because of numerous gaps in the 1979 data,
no statistical analyses were performed. The data, however, are
summarized in Table I-l and 1-2.
Tables I-l and 1-2 indicate tremendous variability among sampling
dates, but on the basis of seasonal averages some trends are sug
gested. 15-cm NH^-N and PO^-P mean concentrations in Typha and
Sparganium fertilized enclosures were substantially greater than
values from unfertilized plots. Sparganium NO^-N values at 15-cm
were evidently unaffected by fertilization. But, because of an
extraordinarily high June 3 NO^-N value in fertilized Typha plots,
the average Typha NO^-N concentration in fertilized plots -was 5 times
the unfertilized concentrations. Mean Typha concentrations at 15-cm
for all nutrients under both treatments were consistently higher
than Sparganium levels.
At 45-cm, NH^-N and PO^-P concentrations in fertilized enclosures of
both species were generally at least twice the unfertilized concentra
tions (Table 1-2). NO^-N concentrations at 45 cm in unfertilized and
fertilized Typha plots were similar; however, the Sparganium fertilized

Table I-l, 1979 15-cm interstitial concentrations (rag/1) in Typha glauca and Sparganium eurycarpum experimental plots
Typha glauca
Control Fertilized
Date NH^-N NOg-N PO,-P 4
NH,-N 4
NOg-N PO,-P 4
June 3^ 0.80 0,00 0.70 1.80 7.00 1.53
June 30^ — — — —
Aug. 8 0.70 1.80 0.65 2.48 0.17 1.10
Aug. 25 = — — — —
Sept. 8 — — — —
Sept. 22* 0.32 0.01 0.99 1.87 2.20 0.53
Oct. 7 0.45 0.03 0.97 0.08 0.09 1.18
Mean 0.57 0.46 0.83 1.56 2.36 1.08
Sparganlum eurycarpum
Control Fertilized
m.-N 4
NOg-N PO4-P NH,-N 4
NOg-N PO4-P
1.51 0.15 0.40 1.86 0.07 1.00
0.40 0.55 0.30 1.58 0.18 0.82
0.00 0.01 0.06 0.13 0.04 0.51
— — 0.23 0.06 0.10 0.02 0.19
0.06 0.07 0.18 0.58 0.38 0.16
0.11 0.05 0.32 1.00 0.07 0.14
0.42 0.18 0.22 0.87 0.13 0.47
^ater sample collected immediately before fertilizer application.

Table 1-2. 1979 45-cm interstitial concentrations (mg/1) in Typha glauca and Sparganium eurycarpum experimental plots
Typha glauca Sparganium eurycarpum
Control Fertilized Control Fertilized
Date NH^-N NOg-N PO4-P NH^-N NOg-N PC, -P 4
NH^-N NOg-N PO4-P NH,-N 4
NOg-N PO4-P
June 30^ 0.33 0.39 0.41 2.18 0.16 1.19 0.35 0.08 0.24 3.58 0.16 0.93
Aug. 8 0.59 0.69 0.53 0.14 0.06 0.07 0.26 0.10 0.26 0.59 0.07 0.59
Aug. 25® 0.00 1.58 0.49 0.75 0.23 0.82 — — —
Sept. 8 0.05 0.03 0.09 0.08 0.01 0.32 — — —
Sept. 22* 0.26 0.13 0.37 1.04 0.91 0.58 0.37 0.01 0.31 0.05 0.01 0.19
Oct. 7 0.38 0.04 0.25 0.11 0.90 0.67 0.00 0.13 0.25 0.00 0.61 0.89
Mean 0.27 0.48 0.36 0.72 0.38 0.71 0.25 0.08 0.27 1.10 0.22 0.60
^ater sample collected immediately before fertilizer application.

26
concentrations were nearly 3 times the unfertilized values.
1980
Nitrogen The mean 1980 NO^-N, and organic
nitrogen concentrations in 15-cm and 45-cm deep interstitial water
from fertilized enclosures and unfertilized plots are illustrated in
Figure 1-5. From early June, 1980 through October, 1980, NH^-N
concentrations at 15-cm in fertilized enclosures declined from
1.73 to 0.13 mg/1; however, an isolated peak of 1.3 mg/1 did occur
in September. Concentrations in unfertilized plots declined from
0.44 mg/1 to below detection. At 15-cm, average NH^-N concentrations
were significantly higher in fertilized plots; concentrations averaged
0.81 mg/1 in fertilized enclosures and 0.28 mg/1 in unfertilized
areas. The NH^-N increase at 15-cm in Sparganium enclosures was 25
times the increase at 15-cm in Typha stands. This species x treatment
interaction was statistically significant.
NOg-N and organic nitrogen concentrations at 15-cm were highest
in fertilized enclosures; however, the differences were not signifi
cant. The seasonal averages for NO^-N in unfertilized and fertilized
plots were 0.06 and 0.20 mg/1, respectively. Organic nitrogen con
centrations averaged 8.56 mg/1 in unfertilized plots and 11.03 mg/1
in fertilized enclosures. NO^-N concentrations underwent an obvious
decline through the summer, and throughout August NO^-N concentrations
were below detection (Figure 1-5). Organic nitrogen concentrations
were also generally lower late in the year but were highly variable.

z X z
15-cm
? o E Z 0.5-
e D D)
-4
'-n
45-cm
ro
unfert i l ized fert i l ized
Figure 1-5. The average concentration of NH^-N, NO^-N, and organic nitrogen in Eagle Lake ferti
lized and unfertilized interstitial water at 15-cm and 45-cm depths

28
NH^-N, NO^-N, and organic nitrogen concentrations at 45-cm
were not affected by fertilizer application in 1980. NH^-N concen
trations averaged 0.29 mg/1 in unfertilized plots and 0.32 mg/1 in
fertilized enclosures. Seasonal averages of NO^-N were 0.10 mg/1 in
unfertilized plots and 0.06 mg/1 in fertilized enclosures. Organic
nitrogen averaged 7.1 mg/1 and 6.4 mg/1 in unfertilized and fertilized
plots, respectively. Concentrations of the three forms of nitrogen
tended to decline throughout the summer (Figure 1-5).
Phosphorus The change in interstitial PO^-P and TP
concentrations at 15-cm and 45-cm depths is presented in Figure 1-6.
The 15-cm PO^-P concentrations averaged 0.58 mg/1 in unfertilized
plots and 0.93 mg/1 in fertilized enclosures. This difference was
statistically significant. The 45-cm PO^-P concentrations were
0.48 and 0.42 mg/1 in unfertilized and fertilized plots, respectively.
The difference at 45-cm was not significant.
Total phosphorus concentrations at 15-cm were significantly
higher in fertilized plots; averages were 1.19 mg/1 in fertilized
enclosures and 0.75 mg/1 in unfertilized plots. 45-cm averages were
0.61 mg/1 in unfertilized plots and 0.64 mg/1 in fertilized enclosures.
The 45-cm difference was not significant. An ANOVA calculated on the
dissolved and particulate phosphorus, excluding PO^-P (TP - PO^-P),
also indicated a significant increase after fertilization in these
other phosphorus forms at 15-cm, but not at 45-cm. The PO^-P concen
trations accounted for 77% of TP in 15-cm unfertilized and fertilized

15-cm 45-cm
\ D)
E
fert i l ized
j A S
unfert i l ized
Figure 1-6. The average concentration of PO^-P. and total phosphorus (TP) in Eagle Lake fertilized and
unfertilized interstitial waters at 15-cm and 45-cm depths

30
samples, 79% in 45-cm unfertilized sangles, and 66% in 45-cm ferti
lized samples. At 15-cm, PO^-P and TP tended to decline through
the summer (Figure 1-6).
Short-Term Patterns
Surface water
Figure 1-7 gives the change in concentrations of NH^-N, NO^-N, and
PO^-P in surface water and 15-cm interstitial of the fertilized enclo
sures water on successive days after fertilization in July and October,
1980. Elevation of PO^-P, NH^-N, and NO^-N surface water levels after
fertilization was transitory. After each application, NO^-N concentra
tions declined quickly; 5-8 mg/l/day immediately after fertilization in
July. The rate of NH^-N removal was much slower, averaging 1.5 to 3.5
mg/l/day during the first two weeks after fertilization in July. PO^-P
disappeared at a rate of about 0.3 to 0.5 mg/l/day during the first
two weeks after fertilization in July. During the cooler autumn
months, removal rates were slower for each nutrient. The mean
surface water temperature was 23.8 C in July and approximately 7 C
in October.
15-cm interstitial water
After fertilization in July and October, 15-cm NO^-N concentra
tions increased 0.3-0.4 mg/1 within 24 hours (Figure 1-7). The
NO^-N levels returned to normal 3 days after fertilization in July
and after approximately 5 days in October. Because the July NH^-N

31
Surface 15 cm
1.0 +
\ 0>
E CO 0.2
O 0.8
DAYS
JULY OCTOBER Figure 1-7. The average concentration of NH^-N, NO^-N, and PO^-P in
surface water (n=6) and in 15-cm interstitial water (n=2)
on successive days after fertilization in July and October.
Bars denote ± 1 standard deviation

32
concentrations at 15-cm were initially high before application, an
increase after fertilization did not occur. In October, however,
NH^-N concentrations rose approximately 0.5 mg/1 in a 24-hour period
after fertilization. This concentration then declined slowly over
the 27-day interval. There was no increase in PO^-P concentration
after fertilization in either month (Figure 1-7). But, as
demonstrated in Figure 1-6, 15-cm PO^-P concentrations were elevated
by fertilization throughout 1980.

33
DISCUSSION
It is clear that the- interstitial water down to 15-cm was responding
to fertilization of Eagle Lake surface waters. Kadlec (1976) found
that added nutrients did not accumulate in interstitial waters of a
Michigan peatland. But, in that study no effort was made to confine
the applied nutrients. Other studies have reported an increase in
NH,-N concentration of 10-cm interstitial water of an estuarine 4
Spartina alterniflora stand after application of urea (Valiela and
32 Teal 1974); an accumulation of P (acid-labile phosphorus, ortho-
phosphate, and total phosphorus) in approximately 3-cm interstitial
water of an estuarine Typha angustifolia stand (Correll et al. 1975);
an elevation of NH,-N concentration in 1- to 4-cm interstitial water
of a wetland rice soil after application of urea (Sevant and De Datta
1980) ; and an increase in NO^-N, NH^-N, and SKP in interstitial water
from cultivated, fertilized plots of the Holland Marsh, Ontario
(Nicholls and MacCrimmon 1974). At Eagle Lake, fertilization caused
significant increases in PO^-P and NH^-N concentrations at 15-cm
(Figures 1-5 and 1-6). Data collected one day after fertilization
also indicated that 15-cm NO^-N concentrations were elevated
temporarily.
The mechanisms accounting for the movement of these nutrients
into the sediment profile at Eagle Lake are not well understood.
Correll et al. (1975) presented evidence that phosphorus was transferred
into an estuarine sediment by downward moving microbial cells. In

34
that study, the movement of phosphorus was extremely slow, requiring
20 days for less than 5-cm penetration. Studies of wastewater
renovation and fertilizer application in soils have also suggested
very slow penetration of phosphorus into a soil profile (Hill 1972;
Kao and Blanchar 1973; Sawney and Hill 1975). Interstitial PO^-P
concentrations did not change during 28-day periods after fertiliza
tion at Eagle Lake (Figure 1-7); but, over the entire 1980 summer
PO^-P levels were elevated significantly because of fertilization
(Figure 1-6). Thus, PO^-P penetration into interstitial water
obviously occurred to a depth of 15-cm; however, on a short-term
basis the downward penetration of PO^-P was evidently a gradual
process in balance with the removal or transformation of PO^-P already
in the interstitial water column.
In contrast to PO^-P, NO^-N 15-cm concentrations increased
approximately 0.3-0.4 mg/1 within a 24-hour period after fertilization
in July and October (Figure 1-7). Such rapid penetration probably
cannot be explained by downward moving microbes. Immediately after
fertilization, an extreme concentration gradient did exist between
interstitial and surface water NO^-N concentrations; usually less
than 1.0 mg/1 in interstitial water versus 20 mg/1 in surface water.
Thus, diffusion may in part account for the movement of NO^-N.
Over the 1980 summer, NH^-N concentrations were elevated in
15-cm interstitial water because of fertilization. In July, 1980
concentrations of NH^-N in 15-cm interstitial water, however, did
not increase after fertilization; thereby suggesting a gradual down

35
ward penetration of NH^-N in a manner similar to that of PO^-P. On
the other hand, NH^-N penetration into the interstitial water in
October was rapid (nearly 0.4 mg/1 in a 24-hour period) and resembled
more closely the movement of NO^-N.
The separation of the aerobic surface water column from the
anaerobic interstitial water profile of lakes and ponds can lead
to accumulation of some nutrients in interstitial water. This is
particularly true of phosphate, e.g., in Lake Mendota phosphate
has been reported to reach a level in 0-6 cm water 5-20 times surface
water concentrations (Holdren et al. 1977). In the Eagle Lake
unfertilized plots, concentrations of NH^-N and PO^-P in 15-cm
interstitial water resembled NH,-N and P0,-P concentrations in surface 4 4
water. In both study years, PO^-P concentrations were highest in
the interstitial water, 56% higher in 1979 and 21% higher in 1980;
but, these differences are small compared to Holdren et al.'s data.
The concentration of NH^-N in Eagle Lake 15-cm interstitial water
was 12% greater in 1979, but 42% less in 1980 than surface water
concentrations. These smaller differences at Eagle Lake indicate
that a near steady state situation may exist for PO^-P and NH^-N
across the sediment-water interface. The concentrations of
and PO^-P in fertilized plots were also similar between surface
and interstitial waters, but as one might expect, surface NH^-N
and PO^-P concentrations were slightly higher. In marshes, oxygen
concentrations in shallow surface water can be reduced by decomposi
tion of vegetation (Maystrenko et al. 1969; Jewell 1971); and

36
Planter (1970) and Pribil and Dykjova (1973) have observed that dis
solved oxygen concentrations inside shallow emergent stands can be
less than concentrations in or near open water. Oxygen measure
ments at Eagle Lake in November, 1980 revealed an average surface
water Og concentration of 1.1 mg/1, less than 10% of saturation.
Interstitial 0^ concentrations averaged less than 0.1 mg/1. Thus,
the distinction between an anaerobic interstitial water column and
an aerobic surface water column is probably less pronounced in a
shallow marsh than in an oligotrophic lake.
Although surface and interstitial waters of marshes may be
more similar than their counterparts in lakes, substantial buildup
of emergent litter at the sediment-water interface in a marsh may
potentially contribute to a separation of marsh surface and
interstitial waters. Because of microbial activity, nitrogen and
phosphorus can be immobilized in the fallen litter compartment
(Kaushik and Hynes 1968, 1971; Odum and De La Cruz 1967; Maystrenko
et al. 1969; Boyd 1970; Klopatek 1975; Mason and Bryant 1975;
Richardson et al. 1976; Davis and Harris 1978; Davis and van der Valk
1978a, 1978b, 1978c; and others) thereby minimi zing the amounts
of nitrogen and phosphorus available to move into the interstitial
water. At Eagle Lake, the increase in NH^-N concentration in 15-cm
interstitial water of lypha plots was significantly less than the
increase in interstitial waters of Sparganium plots. Although
PO^-P interstitial concentrations at 15-cm did not show a signif
icant species-specific response to fertilization, the accumulation
37
of PO^—P in 15-cm interstitial water of Sparganium stands was 15%
greater than the accumulation in Typha stands. These differences
may be a function of the amount of litter deposited at the sediment-
water interface by the two plant species. Larger quantities of
Typha litter which take several years for complete decomposition
(Davis and van der Valk 1978a, 1978b) may reduce the interaction of
surface and interstitial water constituents in Typha stands.
Conversely, Sparganiiim litter, which decomposes rapidly, may have
only a slight effect on the movement of nutrients between surface
and interstitial waters. The buildup of litter at the sediment-
water interface may be as important in influencing interstitial
water chemical components as is the oxygen status of the surface
and interstitial waters. The role of litter in minimizing the down
ward movement of nutrients is (1) as a physical barrier and (2) as
a substrate for microbes which remove nutrients from the surface
water.

38
LITERATURE CITED
Alva, A. K., S. Larsen, S. W. Billle. 1980. The Influence of rhizosphere in rice crop on resin-extractable phosphate in flooded soils at various levels of phosphate application. Plant and Soil 56:17-25.
American Public Health Association, American Water Works, and Water Pollution Control Federation. 1975. Standard methods for the examination of water and wastewater. 14th ed. A.P.H.A., Washington, D.C. 1193 pp.
Bischoff, J. L., R. E. Greer, and A.O. Luistro. 1970. Composition of interstitial waters of marine sediments; Temperature of squeezing effect. Science 167:1245-1246.
Boyd, C. E. 1970. Losses of mineral nutrients during decomposition of Typha latifolia. Archiv fur Hydrobiologie 66:511-517.
Bray, J. T., 0. P. Bricker, and B. N. Troup. 1973. Phosphate in interstitial waters of anoxic sediments: Oxidation effects during sampling procedure. Science 180:1362-1364.
Brunskill, G. J., D. Povoledo, B. W. Graham and M. P. Stainton. 1971. Chemistry of surface sediments in sixteen lakes in the Experimental Lakes Area (ELA), northwestern Ontario. Journal of Fisheries Research Board of Canada 28:277-294.
Correll, D. L., M. A. Faust, and D. J. Severn. 1975. Phosphorus flux and cycling in estuaries. Pages 108-136 L. E. Cronin, ed. Estuarine Research. Vol. I. Academic Press, New York. 738 pp.
Currier, P. J. 1979. Floristic composition and primary production of the postdrawdown vegetation of Eagle Lake marsh, Hancock County, Iowa. M.S. Thesis. Iowa State University. 149 pp.
Davis, C. B. and A. G. van der Valk. 1978a. The decomposition of standing and fallen litter of Typha glauca and Scirpus fluviatilis. Canadian Journal of Botany 56:662-675.
Davis, C. B. and A. G. van der Valk. 1978b. Litter decomposition in prairie glacial marshes. Pages 99-113 R. E. Good, D. F. Whigham and R. L. Simpson, eds. Freshwater wetlands: Ecological processes and management potential. Academic Press, New York. 378 pp.

39
Davis, C. B. and A. G. van der Valk. 1978c. Minerai release from the litter of Bid ens cernua L., a mudflat annual at Eagle Lake, Iowa. Proceedings of the International Association for Theoretical and Applied Limnology, 20:452-457.
Davis, C. B., J. L. Baker, A. G. van der Valk, and C. E. Baker. 1981. Prairie pothole marshes as traps for nitrogen and phosphorus in agricultural runoff. Pages 153-163 B. Richardson, ed. Proceedings of the Midwest Conference on Wetland Values and Management. Freshwater Society, 2500 Shadywood Road, Box 90, Navarre, Minnesota. 55372. 660 pp.
Davis, S. M. and L. A. Harris. 1978. Marsh plant production and phosphorus flux in Everglades Conservation Area 2. Pages 105-131 in M. A. Drew, ed. Environmental quality through wetland utilization. Coordinating Council on the Restoration of the Kissimmee River Valley and Taylor Creek-Nubbin Slough Basin, Tallahassee, Florida. 243 pp.
Graetz, D. A., D. R. Keeney, and R. B. Aspiras. 1973. Eh status of lake sediment-water systems in relation to nitrogen transformations. Limnology and Oceanography 18:908-918.
Hill, D. E. 1972. Wastewater renovation in Connecticut soils. Journal of Environmental Quality 1:163-167.
Holdren, G. C., D. E. Armstrong, and R. F. Harris. 1977. Interstitial inorganic phosphorus concentrations in Lakes Mendota and Wingra. Water Research 11:1041-1047,
Irzumi, H., A. Hattori, and C. P. McRoy. 1980. Nitrate and nitrite in interstitial waters of eelgrass beds in relation to the rhizosphere. Journal of Experimental Marine Biology and Ecology 47:191-201.
Jewell, W. J. 1971. Aquatic weed decay: dissolved oxygen utilization and nitrogen and phosphorus regeneration. Journal-Water Pollution Control Federation 43:1457-1467.
Kadlec, R. H. 1976. Dissolved nutrients in a peatland near Houghton Lake, Michigan. Pages 27-50 D, L. Til ton, R. H. Kadlec, and C. J. Richardson, eds. Freshwater wetlands and sewage effluent disposal. The University of MicTiigan, Ann Arbor, Michigan. 343 pp.
Kao, C. W. and R. W. Blanchar. 1973. Distribution and chemistry of phosphorus in an Albaqualf soil after 82 years of phosphate fertilization. Journal of Environmental Quality 2:237-240.

40
Kaushik, N. K. and H. B. N. Hynes. 1968. Experimental study on the role of auttmn-shed leaves in aquatic environments. Journal of Ecology 56:229-243.
Kaushik, N. K. and H. B. N. Hynes. 1971. The fate of the dead leaves that fall into streams. Archiv fur Hydrobiologie 68:465-515.
Keeney, D. R., J. G. Konrad and G. Chesters. 1970. Nitrogen distribution in some Wisconsin lake sediments. Journal-Water Pollution Control Federation 42:411-417.
Klopatek, J. M. 1975. The role of emergents in mineral cycling in a freshwater marsh. Pages 357-393 F. Howell, J. B. Gentry, and M. H. Smith, eds. Symposium on mineral cycling in southeastern ecosystems. ERDA Symposium Series (CONF 740513). 898 pp.
Konrad, J. G., D. R. Keeney, G. Chesters, and K. L. Chen. 1970. Nitrogen and carbon distribution in sediment cores of selected Wisconsin lakes. Journal-Water Pollution Control Federation 42:2094-2101.
Lerman, A. and G. J. Brunskill. 1971. Migration of major constituents from lake sediments into lake water and its bearing on lake water composition. Limnology and Oceanography 16:880-890.
Li, Y. H. and S. Gregory. 1974. Diffusion of ions in sea water and deep sea sediments. Geochimica et Cosmochimica Acta 38:703-714.
Lind, 0. T. 1979. Handbook of common methods in limnology. 2nd ed. C. V. Mosby Co., St. Louis. 199 pp.
Martens, C. S., R. A. Berner, and J. K. Rosenfeld. 1978. Interstitial water chemistry of anoxic Long Island Sound sediments. 2. Nutrient regeneration and phosphate removal. Limnology and Oceanography 23:605-617.
Mason, C. F. and R. J. Bryant. 1975. Production, nutrient content and decomposition of Phragmites communis Trin. and Typha angustifolia L. Journal of Ecology 63:71-95.
Maystrenko, Yu, A. I. Denisova, V. M. Bognyuk and Zh. M. Arymaova. 1969. The role of higher aquatic plants in the accumulation of organic and biogenic substances in water bodies. Hydrobiological Journal 5:20-31.
Mortimer, C. H. 1941. The exchange of dissolved substances between mud and water in lakes. Journal of Ecology 30:147-199.

41
Murphey, J. and J. Riley. 1962. A modified single solution method for the determination of phosphate in natural waters. Analytica Chemica Acta 27:31-36.
Nicholls, K. H. and H. R. MacCrinmon. 1974. Nutrients in subsurface and runoff waters of the Holland Marsh, Ontario. Journal of Environmental Quality 3:31-35.
Odum, E. P. and A. A. De La Cruz. 1967. Particulate organic detritus in a Georgia salt marsh-estuarlne ecosystem. Pages 383-388 G. H, Lauff, ed. Estuaries. American Association for the Advancement of Science, University of Georgia, Athens. 757 pp.
Planter, M. 1970. Physico-chemical properties of the water of reed-belts in Nikola j skie, Taltowisko, and Sniardwy Lakes. Pol skie Archiwum Hydrobiologii 17:337-356.
Pribil, S. and D. Dykyjova. 1973. Variation in some physical and chemical properties of the water in the stand of Phragmites communis. Pages 71-78 S. Hejny, ed. Ecosystem study on wetland biome in Czechoslovakia. Czechoslovak Acadmy of Sciences. 262 pp.
Richardson, C. J., W. A. Wentz, J. P. M. Chamie, J. A. Kadlec, and D. L. Til ton. 1976. Plant growth, nutrient accumulation and decomposition in a central Michigan peatland used for effluent treatment. Pages 77-117 D. L. Til ton, R. H. Kadlec, and C. J. Richardson, eds. Freshwater wetlands and sewage effluent disposal. The University of Michigan, Ann Arbor, Michigan. 343 pp.
Sawney, B. L. and D. E. Hill, 1975. Phosphate sorption characteristics of soils treated with domestic waste water. Journal of Environmental Quality 4:342-346.
Serruya, C., M. Edelstein, U. Pollingher, and S. Serruya. 1974. Lake Kinneret sediments: Nutrient conqjosition of the pore water and mud water exchanges. Limnology and Oceanography 19:489-508.
Sevant, N. K. and S. K. De Datta. 1979. Nitrogen release patterns from deep placement sites of urea in a wetland rice soil. Soil Science Society of America Journal 43:131-134.
Sevant, N. K. and S. K. De Datta. 1980. Movement and distribution of ammonium-N following deep placement of urea in a wetland rice soil. Soil Science Society of America Journal 44:559-565.
Sholkovitz, E. 1973. Interstitial water chemistry of the Santa Barbara Basin sediments. Geochlmica et Cosmochlmica Acta 37:2043-2073.

42
Singlachar, M. A., and R. Samaniego. 1973. Effect of floodi^ and cropping on the changes in the inorganic phosphate fractions in some rice soils. Plant and Soil 39:351-359.
Stainton, M. P., M. J. Carpel, and F. A. J. Armstrong. 1974. The chemical analysis of freshwater. Fisheries Research Board of Canada Miscellaneous Special Publication 25. 125 pp.
Syers, J. K., R. F. Harris, and D. E. Armstrong. 1973. Phosphate chemistry in lake sediments. Journal of Environmental Quality 2:1-14.
Valiela, I., and J. M. Teal. 1974. Nutrient limitation in salt marsh vegetation. Pages 547-563 R. J. Reimold and W. H. Queen, eds. Ecology of Halophytes. Academic Press, New York and London. 605 pp.
van der Valk, A. G. and C. B. Davis. 1978a. Primary production in prairie glacial marshes. Pages 21-37 R. E. Good, D. F. Whigham, and R. L. Simpson, eds. Freshwater wetlands: Ecological processes and management potential- Academic Press, New York. 378 pp.
van der Valk, A. G., and C. B. Davis. 1978b. The role of the seed bank in the vegetation dynamics of prairie glacial marshes. Ecology 59:322-335.
van der Valk, A. G., and C. B. Davis. 1979. A reconstruction of recent vegetational history of a prairie glacial marsh. Eagle Lake, Iowa, from its seed bank. Aquatic Botany 5:19-51.
van der Valk, A. G. and C. B. Davis. 1980. The impact of a natural draw-down on the growth of four emergent species in a prairie glacial marsh. Aquatic Botany 9:301-322.
Viner, A. B. 1975. The sediments of Lake George (Uganda) III: Uptake of phosphate. Archiv fur Hydrobiologie 76:393-410.
Viner, A. B. 1977. The sediments of Lake George (Uganda) IV: Vertical distribution of chemical features in relation to. ecological history and nutrient recycling. Archiv fur Hydrobiologie 80:40-69.

43
SECTION II. NUTRIENT LIMITATION OF SPARGANIDM EURYCAEPUM
AND TYPHA GLAUCA IN A PRAIRIE MARSH

44
ABSTRACT
In 1979 and 1980, nitrogen and phosphorus fertilizer was applied
to stands of Typha glauca and Sparganiurn eurycarpum in a prairie marsh.
Eagle Lake, Iowa. Fertilizer additions resulted in significant in
creases of NH^-N and PO^-P in interstitial waters, significant increases
in sediment and nonsignificant increases in sediment PO^-P.
Nitrogen concentrations in above-ground and below-ground plant structures
were significantly increased because of the fertilizer treatment. That
both species had been nutrient limited was indicated by significant 1980
increases in above-ground biomass and net annual above-ground production
in fertilized plots. Increases in shoot density and below-ground biomass
also occurred in fertilized plots in 1980, but were not statistically
significant.
Keywords: Typha glauca, Sparganium eurycarpum, cattail, bur-reed,
freshwater wetland, emergent production, interstitial water, nitrogen,
phosphorus, nutrient cycling.

45
INTRODUCTION
Marine and freshwater wetlands dominated by emergents have long
been recognized as productive ecosystems (Westlake 1963). The high
primary production of emergent communities generally is attributed to
the assumption that emergent macrophyte growth is not limited by defi
ciencies of water, light, or nutrients. But, more recent data indicate
that nutrient availability can and does limit the potential production
of some emergents.
Most evidence of emergent nutrient limitation comes from studies
of coastal salt marshes and shore communities (Tyler 1967; Sullivan
and Daiber 1974; Valiela and Teal 1974; Valiela et al. 1975, 1976;
Gallagher 1975; Broome et al. 1975). An experimental approach, adding
known amounts of specific nutrients or sewage sludge fertilizer to
plant stands, has demonstrated that nitrogen often is limiting to
coastal species. Sullivan and Daiber (1974), Valiela and Teal (1974),
and Gallagher (1975) reported positive responses in above-ground stand
ing crop of Spartina alterniflora to applications of urea or ammonium
nitrate. Similarly, the standing biomass of Juncus gerardi and
Plantago maritima increased after application of (Tyler 1967). In
greenhouse studies, Pigott (1969) demonstrated that soil nitrogen
levels influence the zonation and growth of Salicomia species and
Suaeda maritime. Because of an adequate supply in seawater, phosphorus
is rarely limiting in coastal marshes (Valiela and Teal 1974). Under
some circumstances, however, phosphorus may be limiting in coastal
systems (Tyler 1967; Broome et al. 1975).

46
There have been numerous studies of growth, nutrient assimilation,
and water purification by freshwater species and wetlands under enriched
conditions (Steward and Omes 1975; de Jong 1976; Ewel 1976; Seidel 1976;
Richardson et al. 1976; Spangler et al. 1976, 1977; Turner et al. 1976;
Whigham and Simpson 1976a, 1976b; Werblan 1979); however, not all of
these studies are useful for an assessment of nutrient limitation. And,
the useful studies are contradictory. Steward and Omes (1975) found
that stands of Cladium jamaicense in the Everglades were not limited by
nitrogen or phosphorus. Additionally, Whigham and Simpson (1976b) found
above-ground biomass values in a freshwater tidal marsh to be suppressed
by sewage application, particularly when the sewage was applied contin
uously. In the latter study, however, the presence of chlorine in the
sewage effluent undoutedly had an inhibitory effect on the vegetation.
In contrast to these two studies, standing crops of Phrapinites
coTmmmis, Sagittaria falcata, Scirpus validus, and Spartina patens in
a Louisiana marsh increased after application of fisheries wastewater
(Turner et al. 1976). In Iowa, the above-ground biomass of Typha glauca
and Sparganium eurycarpum grown in artificial marshes enriched with raw
swine waste was substantially higher than biomass values for the same
species growing in nearby prairie marshes (Werblan 1979). Sichardson
et al. (1976) noted that the biomass of Carex species in the field was
unaffected by low concentrations of an added nutrient solution, but was
stimulated by higjier concentrations of the same solution. These studies
do not allow one to assess the role of any one nutrient, nor was it
their intent; but, in other studies, Cyperus esculentus and Scinjus

47
valldus, grown in the greenhouse on sediments of varying texture,
nitrogen concentration, and phosphorus concentration, were reported
to be limited by nitrogen on most sediments (Barko and Smart 1978,
1979). Cyperus esculentus was thought to be limited by phosphorus on
one sediment (Barko and Smart 1978). Boyd and Hess (1970) also found
that standing crops of Typha latifolla were positively correlated
with phosphorus in saturated sediments and surface waters.
The need for additional baseline data in freshwater systems is
obvious and has been stated (De la Cruz 1978; Kadlec 1979). The
purpose of this study was to examine the effects of nitrogen and
phosphorus enrichment on above- and below-groimd production of
natural stands of Typha glauca and Sparganium eurycarpum in a prairie
marsh.

48
METHODS
Study Site
Eagle Lake, Hancock Co., Iowa, is a 365-ha, Type IV (Stewart and
Kantrud 1971) prairie marsh dominated by Typha glauca, Sparganium
eurycarpum, and Carex atherodes. The marsh is owned and managed by
the Iowa Conservation Commission. Water depth can be controlled by a
dam across the northern edge of the marsh and rarely exceeds 1 m. The
production, decomposition, seed bank dynamics, and nutrient fluctua
tions of plant species in Eagle Lake have been described by Currier
(1979), Davis and van der Valk (1978a, 1978b), and van der Valk and
Davis (1978a, 1978b, 1979, 1980).
The Eagle Lake drainage basin covers 2,563 ha. Approximately
1,959 ha are used for agricultural purposes, including over 1,700 ha
used exclusively in row-crop cultivation of com and soybeans. During
occurrences of high precipitation, surface runoff and tile drainage
from these fields can add large quantities of nutrients, particularly
nitrate, to the marsh. In 1979, 2.5 kg NH^-N/ha, 204 kg NO^-N/ha
and approximately 3.5 kg PO^-P/ha entered the marsh with surface runoff
and subsurface drainage. An additional 6.6 kg NH^-N/ha and 6.3 kg
NOg-N/ha were added to the marsh by precipitation (Davis et al. 1981).
During the study period, 1979 and 1980, annual precipitation was
957 mm and 710 mm, respectively. Average annual precipitation for
this area is 802 mm. Average daily temperatures during the study
ranged from a low 1979 winter temperature of -8 C to a high 1980
summer temperature of 23 C.

49
Construction and Fertilization of Enclosures
During May, 1979, 6 watertight enclosures (6 m x 6 m) for fertiliza
tion were constructed in monodominant stands of Typha glauca (Typha) and
Sparganium eurycarpum (Sparganlum) at Eagle Lake marsh. Three enclosures
were built for each species and located in the northern, southern, and
western parts of the marsh (Figure II-l). A control plot was established
near each enclosure by staking a 6- x 6-m area of open marsh. Each enclo
sure was constructed of 1.9 cm thick marine plywood with 6-cm x 10-cm wood
supports. To minimize fertilizer leakage, all sides were driven approxi
mately 10 cm into the substrate and 5-cm x 10-cm boards were used as in
terior and exterior seals. Dye tests revealed no leakage.
The area within each watertight enclosure was fertilized at 28-day
intervals. All fertilizer additions were calculated to restore available
nitrogen and phosphorus concentrations in the water column to approxi
mately 25 mg NH^-N/1, 20 mg NG^-N/l, and 5 mg PO^-P/1. Nitrogen was added
as a solution of NH^NO^ and phosphorus as a suspension of (NH^) 2^^^^ '
Collection and Analysis of Samples
Sediment and interstitial H«0
One sediment sample and one 15-cm deep interstitial water sample
were collected biweekly from Typha and Sparganium enclosures and control
plots during the 1979 and 1980 growing seasons. During both years,
interstitial samples were collected from only the northern and western
sites. The interstitial water samples were collected from permanent
sanqpling wells and were preserved in the field by addition of 1 ml

50
1/4 mi.
• CONTROL • FERTILIZED
Figure II-l. Location of Sparganium and Typha control and fertilized enclosures at each of 3 sites in Eagle Lake marsh. The actual arrangement of plots at each site is not indicated

51
concentrated HgSO^/l sançle. Sediment and water samples were refrigerated
at 5 C until analyzed.
In the laboratory, NH^-N, NO^-N, and PO^-P analyses were performed
on all interstitial water samples. The phenate method (Stainton et al.
1974) was used for NH^-N determinations. PO^-P concentrations were
determined by using the ascorbic acid reduction procedure (Murphey and
Riley 1962). NO^-N analyses were carried out according to the Technicon
Auto-Analyzer II system cadmium reduction procedure. Sediment samples
from 1979 and 1980 were dried and analyzed for PO^-P after extraction
in a sodium bicarbonate solution (North Dakota Agricultural Experiment
Station Bulletin No. 499, 1973). NH^-N concentrations in wet 1980
sediment samples were determined by titration with 0.005 N HgSO^ after
distillation with MgO (A.O.A.C. 1960).
Vegetation
Throughout the study, vegetative and flowering shoot densities
were counted at biweekly intervals. Within each enclosure and control
2 plot, counts were made in 3 permanent 1-m quadrats. Flowering and
vegetative dry—shoot weights were obtained after each count by
collecting approximately 50 shoots in and near unfertilized plots and
10-15 shoots from fertilized enclosures. Shoots were dried for 1 week
at 60 C before being weighed. Shoot densities were used to calculate
standing biomass and net annual above-ground production (van der Valk
and Davis 1978a).
Combined root and rhizome biomass (root-rhizome) was estimated

52
by excavating 50- x 50-cm substrate samples in unfertilized and ferti
lized plots to a depth of approximately 30 cm. Thirty samples were
collected before fertilization in May, 1979. In November, 1979 and
October, 1980, 15 samples were collected from each treatment. In the
laboratory, dead below-ground material was removed and discarded from
each sample, but no effort was made to separate roots and rhizomes.
All remaining live material was thorou^ly washed in distilled water,
dried at 60 C for 1 week, and weighed. Dried root-rhizome and shoot
material was subsampled and groiind in a Wiley mill with a #20 mesh.
Microkjeldahl procedures were used to determine total N in these
subsamples.
Statistical Analyses
The experimental design used in this study represents a 2 x 2
factorial model with 3 replicates carried through time; i.e., 2 species
and 2 treatments at each of 3 sites on each sample data. An analysis
of variance was used to determine the effects of site, species, treat
ment, species x treatment, time, time x species, time x treatment,
and time x species x treatment on the following parameters in each
year: NH^-N, NO^-N, and PO^-P concentrations in interstitial water;
NH^-N and PO^-P sediment concentrations; shoot density; dry-shoot
weight; above-ground biomass; and percentage nitrogen in shoots and
roots. Net annual above-ground production and the final root-rhizome
biomass data were used in a second ANOVÂ generated as a 2 x 2 factorial;
but, because these measurements did not take place over time, time

53
effects were excluded from the ANOVA.
Because of the intrinsic variability characteristic of wetlands,
statistical significance was set at the a = 0.10 confidence level (see
Richardson et al. 1976). In both analyses, the site x species x
treatment interaction was used as an error term when computing site,
species, treatment, and species x treatment mean square values. Mean
square values for the remaining ANOVA terms were calculated by using
the standard error term, but the F values were evaluated by using con
servative degrees of freedom. These modifications were incorporated
because measurements over time and multiple measurements in a single
treatment plot do not represent true replicates.

54
RESULTS
Interstitial H^O
The mean NO^-N, and PO^-P concentrations in interstitial
water from fertilized and control plots over the 1980 growing season
are presented in Figure II-2. At Eagle Lake, a general decline in
interstitial concentrations of these nutrients in fertilized and control
plots occurred during the 1980 growing season, but only the NH^-N
concentration change in time was significant. Fertilization of surface
waters significantly increased NH^-N and PO^-P interstitial concentra
tions. On all dates, levels of these two nutrients were higher in
fertilized plots. In contrast, NO^-N concentrations were greater in
fertilized plots only during the early summer and fall months, and not
significantly so. Probably because of denitrification (Patrick and
Tusneem 1972), NO^-N levels in control and fertilized plots were below
the detection limit during the mid-summer months. Although differences
between all control and fertilized nutrient concentrations seem to
change with time, the effect of fertilization was statistically uniform
throughout the season.
An effect not shown in Figure II-2 was a significant species-
specific increase in interstitial NH^-N concentrations of fertilized
plots. The mean summer NH^-N concentration in Sparganium fertilized
plots was 25 times greater than the increase in Typha plots. For both
species, the amount of NH^-N moving into the interstitial water was small
relative to the concentration of the surface water. Despite restoration
of surface water NH^-N concentrations to 25 ppm every 4 weeks, inter-

INTERSTITIAL H^O 1.5
Z 1
41 : »•' I i 10
E 30 Q.
T I I r
JUNE JULY AUG. SEPT.
SEDIMENT .
' *
f 10
T
P* A. #
1 1 1 1
JUNE JULY AUG. SEPT.
Ln
C O N T R O L F E R T I L I Z E D 1 9 8 0 o 1979
Figure II-2. Average NH^-N, NO^-N, and PO^-P concentrations in interstitial water and sediments
of control and fertilized plots during 1979 and 1980

56
stitial concentrations never reached 2 ppm.
Because of continuous damage to sampling wells by muskrats, few
interstitial samples were collected in 1979. On several of the dates,
we could collect only 1 sample; thus, the 1979 interstitial data were
not statistically analyzed. The data that we could obtain are pre
sented in Table II-l. Fertilization in 1979 did seem to increase
NH,-N and PO.-P interstitial concentrations. NO -N concentrations in 4 4 3
Sparganium plots were unaffected by fertilization, and the NO^-N
values from Typha plots show no trend.
Sediment
1979 and 1980 available sediment phosphorus and 1980 sediment
NH^-N concentrations are also illustrated in Figure II-2. Available
soil phosphorus concentrations in fertilized and control plots are
similar until near the end of the 1979 growing season. In late August,
phosphorus concentrations in fertilized plots rose quickly and remained
elevated through the 1980 season. In neither year were the increases
significant, but in 1979 the late increase produced a significant time
X treatment interaction. Because Eagle Lake surface waters contain
oxygen, an elevation of PO^-P levels in sediments of fertilized plots
is to be expected. PO^-P is removed from an aerated water column to
the soil compartment as an iron precipitate (Stumm and îlorgan 1970).
Mean 1980 sediment NH^-N response to nutrient enrichment was posi
tive (Figure II-2) and statistically significant. This measurement
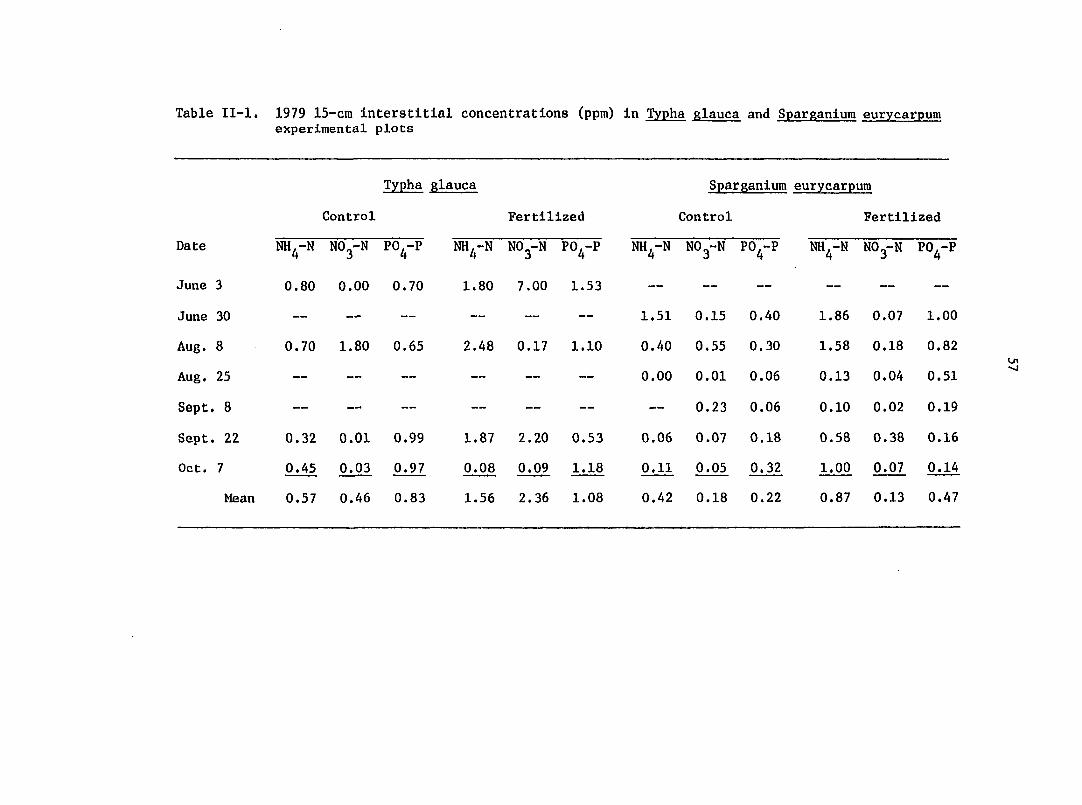
Table II-l, 1979 15-cra interstitial concentrations (ppm) in Typha glauca and Sparganium eurycarpum experimental plots
Date
June 3
Typha glauca
Control
NH,-N NO -N PO,-P 4 3 4
0.80 0.00 0.70
Fertilized
NH,-N NO.-N P0,-P 4 3 4
1.80 7.00 1.53
Sparganium eurycarpum
Control Fertilized
NH,-N N0_-N P0,-P 4 3 4
NH^-N NOg-N PO^-P
June 30 — — — — — — — 1.51 0.15 0.40 1.86 0.07 1.00
Aug. 8 0.70 1.80 0.65 2.48 0.17 1.10 0.40 0.55 0.30 1.58 0.18 0.82
Aug. 25 — - - — — — — 0.00 0.01 0.06 0.13 0.04 0.51
Sept . 8 — — — — — — — 0.23 0.06 0.10 0.02 0.19
Sept . 22 0.32 0.01 0.99 1.87 2.20 0.53 0.06 0.07 0.18 0.58 0.38 0.16
Oct, 7 0.45 0.03 0.97 0.08 0.09 1.18 0.11 0.05 0.32 1.00 0.07 0.14
Mean 0.57 0.46 0.83 1.56 2.36 1.08 0.42 0.18 0.22 0.87 0.13 0.47

58
represents the amount of NH^-N adsorbed to sediment particles. Thus,
an increase in interstitial NH,-N concentration should cause an increase
in adsorbed NH^-N. In mid-June and late September, concentrations in
fertilized plots were lower than in control plots, but the time x treat
ment interaction was not signficant.
Above-ground Vegetative Response
Nitrogen content
1979 and 1980 nitrogen concentrations in Typha and Sparganium
live shoots of control and fertilized plots are given in Figure II-3.
The steady decline in nitrogen concentration over the growing season
is a pattern typical of many emergent species and various nutrients
(Boyd 1969, 1970; Boyd and Hess 1970; Boyd and Vickers 1971; Bayly and
O'Neill 1972; Mason and Bryant 1975; Prentki et al. 1978). Although
fertilization had no effect on this pattern, the treatment did cause
a significant increase in tissue nitrogen levels. Average summer
nitrogen concentrations of Sparganium in fertilized plots were 30% and
34% hi^er than in control plots in 1979 and 1980, respectively.
Increases in the nitrogen concentration of Typha were smaller, 7% in
1979 and 14% in 1980. The difference in the degree of response between
the two species was significant and may be due to the smaller concentra
tions of NH^-N in interstitial water of fertilized Typha plots.

SHOOT •A,
1979
Z
1- -1980
JUNE JULY AUG. SEPT.
ROOT 2 -
1 %e • • • ••
1979
Z
1980
JUNE JULY AUG. SEPT,
ASPARGANIUM «TYPHA CONTROL FERTILIZED
Figure II-3. Average percentage nitrogen in Sparganlum and Typha shoot and root-rhizome tissues from control and fertilized plots during 1979 and 1980

60
Shoot density
2 The average number of shoots/m for each species, treatment, and
year are presented in Figure II-4. During 1979, Sparganitim mean
2 maximum shoot density was 110 shoots/m in unfertilized plots and 109
2 shoots/m in fertilized plots. In this same year, Typha shoots peaked
2 2 at 64 shoots/m and 77 shoots/m in unfertilized and fertilized plots,
respectively. The occurrence of higher Typha shoot densities in fer
tilized plots during 1979 was probably not the result of fertilization.
Typha rhizomes begin forming new shoots in autumn, and these overwinter
until spring (Bernard and Bernard 1973); hence, 1979 shoot density may
have been fixed 6 months before the initiation of this study. The
2 1980 mean maximum shoot densities reached 94 shoots/m in unfertilized
2 and 113 shoots/m in fertilized Sparganium stands. Similarly, Typha
2 mean shoot densities peaked at 74 shoots/m in unfertilized plots and
2 96 shoots/m in fertilized plots. Differences between fertilized and
control plots were not significant in 1979 or 1980.
Biomass and production
The product of shoot weight and density provides an estimate of
above-ground biomass on each sampling date. Total biomass data for
1979 and 1980 are presented in Figure II-5. The pattern in 1979
illustrates no difference in biomass between treatments in early summer
and larger differences in mid- to late-summer. The time x treatment
interaction was significant. Maximum biomass estimates in control
2 2 plots were 816 g/m for Sparganium and 1,351 g/m for Typha. These

61
Z
JUNE ' JULY ' AUG. ' SEPT. '
SPARGANIUM TYPHA • •
CONTROL FERTILIZED
Figure II-4. Average Sparganium and Typha shoot density in control and fertilized plots in 1979 and 1980

62
«A «m < % O 2 1980
*A*
J U N E ' J U L Y ' A U G . ' S E P T
SPARGANIUM TYPHA A •
CONTROL FERTILIZED
Figure I1-5. Average Sparganium and Typha total above-ground biomass in control and fertilized plots during 1979 and 198.0

63
2 2 values compare with biomass estimates of 904 g/m and 1,781 g/m in
Sparganium and Typha fertilized plots, respectively (Table II-2).
There was no significant treatment effect in 1979.
In 1980, biomass values were significantly larger in fertilized
plots. Again, the effect of fertilization was most noticeable later
in the growing season and produced a significant time x treatment
2 interaction. The Sparganium maximum biomass estimates were 637 g/m
2 in control plots and 1,185 g/m in fertilized plots. Typha plots pro-
2 2 duced a maximum biomass of 1,726 g/m in control plots and 2,343 g/m
in fertilized plots (Table II-2).
Mean annual net above-ground primary production values are listed
in Table II-2. In both years, the Eagle Lake fertilized plots were
more productive. Typha production in fertilized plots exceeded pro-
2 2 duction in unfertilized plots by 532 g/m in 1979 and 405 g/m in
1980. Likewise, Sparganium production in fertilized plots surpassed
that in unfertilized plots by 129 g/m^ in 1979 and 524 g/m^ in 1980.
Because of high variation between plots, only the 1980 differences were
statistically significant, van der Valk and Davis estimated produc-
2 2 tion of Typha to be 2,297 g/m and Sparganium to be 1,066 g/m in
Eagle Lake (Table II-3) . Our control values are all within ± 1
standard deviation of their production figures (Table II-2). Mean
production of Typha in fertilized plots at Eagle Lake is similar to the
estimate of 2,630 g/m produced by Typha after enrichment with swine
waste (Werblan 1979). Sparganium values are lower than Werblan's
2 production estimate of 2,092 g/m . •

2 Table II-2. 1979 and 1980 average net annual above-ground production (g/m ), average maximum
above-ground biomass (g/m^), average autumn below-ground biomass (g/m^), and below-ground:above-ground biomass ratios for Typha glauca and Sparganium eurycarpum in control and fertilized plots
Typha glauca
Control Fertilized
Sparganlum eurycarpum
Control Fertilized
Annual Net Above-ground production
1979
1980
Above-ground Biomass
1979
1980
Below-ground Biomass
May, 1979
Nov., 1979
Oct., 1980
Root-Rhizome/Shoot
1979
1980
1,623 ± 704
2,173 ± 544
1,351 ± 692
1,726 ± 479
1,300 ± 676
1,679 ± 511
1,451 ± 409
1.55
0.84
2,155 + 646
2,578 ± 775
1,781 ± 781
2,343 ± 645
1,654 ± 516
1,779 ± 590
0.93
0.76
1,058 ± 135
924 ± 134
816 ± 254
637 ± 150
681 ± 252
1,123 ± 508
855 + 356
1.38
1.34
1,187 ± 309
1,448 ± 200
904 ± 135
1,185 ± 210
1,010 ± 434
1,046 ± 580
1.11 0.88

Table II-3. Typha and Sparganlum above-ground biomass or annual production values in inland freshwater marshes
Biomass or Site Production
Typha sp. 1,527 g/mf OK
1,360 g/mf MN
1,336 g/m^ TX
730 g/mf OK
416 g/m^ NE
378 g/mf SD
404 g/ra^ ND
Typha latifolia 686 g/m^ SC
530-1,132 g/mf SC
428-2,252 g/mf S.E. U.S
2,456 g/m^/yr WI
1,483 g/mf SC
Typha glauca 1,549 g/mf lA
2,106 g/mf lA®
2,297 g/m^/yr lA^
Sparganium eurycarpum 1,950 g/mf WI
770 g/mf lA
1,054 g/m^ lA^
1,066 g/m^/yr lA®
^Values from Eagle Lake.
Reference
Penfound 1956
Bray 1962
McNaughton 1966
McNaughton 1966
McNaughton 1966
McNaughton 1966
McNaughton 1966
Boyd 1970
Boyd 1971
Boyd and Hess 1970
Klopatek 1975
Polisini and Boyd 1972
Van Dyke 1972
van der Valk and Davis 1978a
van der Valk and Davis 1978a
Lindsley et al, 1976
Van Dyke 1972
van der Valk and Davis 1978a
van der Valk and Davis 1978a

66
Below-ground Vegetative Response
Nitrogen content
The change in percentage of nitrogen in root-rhizome tissues for
each study species and treatment during 1979 and 1980 is presented in
Figure II-2. Nitrogen concentrations in below-ground structures of
wetland species are usually replenished in the autumn months after a
summer decline (Bjork 1967; Klopatek 1975; Prentki et al. 1978). This
pattern occurred in both study years at Eagle Lake. Fertilization in
1979 produced little change in root-rhizome nitrogen concentration
until late in the growing season. By mid-September of 1979, root-rhizome
nitrogen levels in Sparganium fertilized plots surpassed those of un
fertilized plots. Also, during the final sampling interval of 1979,
Typha underground tissues in fertilized plots exhibited a faster rate
of nitrogen increase than did roots-rhizomes in unfertilized plots
(Figure II-2). There was not a significant treatment effect in 1979.
At the onset of the 1980 growing season, root-rhizome nitrogen
concentrations of both species were higher in fertilized plots and
greater than maximum values in 1979. Early in the season, however,
these high concentrations declined more rapidly than did levels in
control plots. By the third sampling date, root-rhizome nitrogen
concentrations in fertilized plots had decreased to levels equal to
or lower than those of control plots. After this, nitrogen levels in
fertilized plots increased rapidly to concentrations again greater
than unfertilized plots. For the entire season, concentrations were
significantly greater in fertilized plots. The faster nitrogen

67
disappearance from 1980 roots-rrhizomes in fertilized enclosures was
probably due to the high 1980 shoot densities in the fertilized enclo
sures and suggests the positive influence of winter root—rhizome
nutrient concentrations on shoot initiation and growth.
Biomass
Mean 1979 spring, 1979 autumn, and 1980 autumn below-ground biomass
estimates are recorded in Table II-2. Estimates of Typha autumn below-
2 ground biomass in prairie marshes have ranged from 1,431 g/m (Davis
2 and van der Valk, unpublished) to 1,450 g/m (Van Dyke 1972). Van Dyke
2 also estimated Sparganium below-ground biomass at 1,638 g/m . In
artificial, manure-enriched marshes, Werblan (1979) estimated Typha
2 and Sparganium below-ground biomass of these species to be 2,642 g/m
2 and 737 g/m , respectively. Estimates of autumn below-ground biomass
of Typha and Sparganium in 1979 and 1980 at Eagle Lake are within these
ranges.
On the basis of the autumn biomass estimates, fertilization in
1979 did not stimulate root-rhizome production of the species and may
have inhibited growth during the first summer (Table II-2). Control
2 biomass values exceeded those in fertilized plots by 25 g/m and
2 113 g/m for Typha and Sparganium, respectively. These differences
were not significant. Between autumn, 1979, and autumn, 1980,
below-ground biomass declined in control plots and increased in
fertilized plots (Table II-2). Because of this occurrence, 1980
root-rhizome biomass in fertilized plots surpassed that of control

68
2 plots by 328 g/m . The difference between Sparganium biomass estimates
2 from fertilized and control plots was 191 g/m . These differences were
not significant.

69
DISCUSSION
Nutrient Availability
Fertilization of surface waters in Eagle Lake increased concen
trations of NH^-N, NOg-N, and PO^-P available to the plants (Figure
II-6). The accumulation of these nutrients in sediments and intersti
tial waters, however, was small relative to quantities added to the
surface water. Past studies indicate the complexity of the process
whereby nutrients are made available to emergent vegetation after sur
face enrichment. Valiela and Teal (1974) recorded increases in nitro
gen and phosphorus parameters of sediment waters in a tidal salt marsh
after fertilization. On the other hand, sediment nutrient status of a
freshwater sawgrass stand did not change after nitrogen, phosphorus,
and potassium additions (Steward and Omes 1975); added nutrients did
not accumulate in the interstitial water of a Wisconsin peatland (Kadlec
1976); and, applications of a dilute nutrient solution did not raise
sediment nutrient levels at depths of 15, 30, or 105 cm (Richardson
et al. 1976). Such discrepancies between systems are probably the
result of differences between forms of nutrients added, sediment types,
and the quantities and combinations of other nutrients already present.
But, the most important factors responsible for removal of some nu
trients before penetration into the sediment/interstitial water column
are evidently litter buildup and high organic content in sediments
(Kadlec 1976; Richardson et al. 1976; Whigham and Bayly 1978).
At Eagle Lake, NH^-N movement into the interstitial water was
correlated with some feature of the plants themselves. The increase

70
in NH^-N concentrations in interstitial waters of Typha fertilized
plots was much less than the response in Sparganium fertilized plots.
Because microbial populations on decomposing plant litter remove nitro
gen from surface water, the movement of NH^-N into the interstitial
water may have been a function of the amounts of dead plant litter at
the sediment-water interface. Typha litter requires several years
before conçlete decomposition occurs (Davis and van der Valk 1978a,
1978b); thus, substantial litter buildup occurs. Sparganium tissue,
however, decomposes relatively rapidly, with little litter persisting
after one year. Large quantities of Typha litter and the associated
populations of microbes could reduce the amount of NH^-N available
to move into the interstitial water column.
Production
Eagle Lake receives high inputs of nitrogen and phosphorus from
precipitation and, more importantly, from field runoff and subsurface
drainage. Perhaps because of this loading, the production of Typha
and Sparganium in Eagle Lake is at the high end of the range of values
typical for these genera in inland freshwater marshes (Table II-3).
Our Typha production values (Table II-2) and those of van der Valk and
Davis (1978a, Table II-3) from Eagle Lake, exceed most other Typha
values in Table II-3. The only exceptions are Klopatek (1975) and
Boyd and Hess (1970). There are few Sparganium estimates from inland
freshwater marshes for comparison with Eagle Lake estimates. But,
2 Lindsley et al. (1976) reported a maximum biomass of 1,950 g/m for

71
SpargaiiTnm in Wisconsin. Although Sparganium maximum biomass at
Eagle Lake is substantially lower than this value, Sparganium at Eagle
Lake demonstrates considerable production, particularly when compared
with some of the Typha values (Table II-3).
Despite their already high production, Typha and Sparganium in
Eagle Lake are limited by nitrogen and/or phosphorus. Valiela et al.
(1976) presented data indicating that, when nutrients are limiting,
fertilization may not stimulate production until after the first year
of application. This was the case at Eagle Lake. The best indication
of nutrient limitation occurred in 1980, the second year of the study.
During that year, above-ground biomass, net annual production, and
percentage nitrogen in roots and shoots were significantly higher in
fertilized plots. Increases also occurred in below-ground biomass and
shoot density, but they were not significant (Figure II-6) . The one
year lag in vegetative response seems related to the timing of nutrient
accumulation and storage in roots and rhizomes (Valiela and Teal
1974). Our results suggest that shoot density, biomass, and production
increased in 1980 because of the storage of nitrogen, and possibly
phosphorus, in below-ground structures during the previous autumn and
winter. Thus, nutrient quantities stored in below-ground structures
after one season can probably influence the initiation and production
of shoots in the next season.
Although shoot initiation and growth may be related to the supply
of nutrients in overwintering below-ground tissues, the effect of
elevated root-rhizome nutrient level on root—rhizome production is

72
TYPHA ABOVE-GROUND
I DENSITY
SPARQANIUM ABOVE-GROUND
• -control
ENSITY
BE LOW-GROUND
SEDIMENT INTERSTITIAL HgQ,
BELOW-GROUND
NH^N PO|$-P NH4-N NO3-N PO4-P (ppm)
«N BIOMASS «N BIOMASS
Figure II-6. Summary of the 1980 effects of fertilization in
Sparganium and Typha stands on NO^-N, and
PO^-P concentrations in interstitial waters; NH^-N
and PO^-P concentrations in sediments; percentage
nitrogen in shoots and roots-rhizomes; mavimmn
shoot density; net primary production (NPP); and
autumn below—ground biomass. Significance at the
0.10 confidence level is designated by an asterisk.
Summer averages are used for all nutrient concen
trations

73
unclear. Past studies of below-ground biomass and production have
produced various responses to enrichment. Valiela et al. (1976) have
demonstrated that, although Spartina altemiflora net annual below-
ground production is enhanced by fertilization, the effect is not equal
between roots and rhizomes, i.e., root biomass tended to decrease
with enrichment. Steward and Omes (1975) found that sawgrass
root-rhizome biomass decreased with increasing nutrient additions.
And, Broome et al. (1975) observed a significant increase in Spartina
alterniflora root and rhizome biomass after additions of nitrogen
fertilizer. In the first year at Eagle Lake, fertilization had no
effect on rootrrhizome biomass of either species. In the second year,
mean biomass estimates were greater in fertilized plots, but dif
ferences were not statistically significant. Although it is debatable
whether fertilization stimulated production, fertilization did not have
a negative effect on root-rhizome biomass over the two-year span.
Barko and Smart (1979) presented evidence from their own work and
the literature indicating that emergent below-ground :above-ground
biomass ratios decline on fertile sites. Our Eagle Lake data support
this hypothesis (Table II-2). Most Sparganium and Typha ratios of
autumn rootrrhizome biomass to maximum shoot biomass were above 1 in
control areas and below 1 in fertilized plots. Barko and Smart (1979)
theorize that greater biomass allocation to below-ground tissues may
be a phenotypic modification in nutrient-poor habitats whereby root
absorptive area and/or storage capacity are increased.

74
LITERATURE CITED
Association of Official Agricultural Chemists. I960. Methods of Analysis. A.O.A.C., Washington, D.C. 832 pp.
Bar ko, J. W., and R. Michael Smart. 1978. The growth and biomass distribution of two emergent freshwater plants, Cyperus exculentus and Scirpus validus, on different sediments. Aquatic Botany 5:109-117.
Barko, J. W., and R. Michael Smart. 1979. The nutritional ecology of Cyperus esculentus, an emergent aquatic plant, grown on different sediments. Aquatic Botany 6:13-28.
Bayly, I. L., and T. A. O'Neill. 1972. Seasonal ionic fluctuations in a Phragmites communis community. Canadian Journal of Botany 50:2103-2109.
Bernard, J. M., and F. A. Bernard. 1973. Winter biomass in Typha glauca Godr. and Sparganitmi eurycarpum Engelm. Bulletin of the Torrey Botanical Club 100:125-131.
Bjork, S. 1967. Ecologic investigations of Phragmites communis. Studies in theoretical and applied limnology. Folia Limnologica Scandinavica 14:1-148.
Boyd, C. E. 1969. Production, mineral nutrient absorption and biochemical assimilation by Justicia americana and Alternanthera philoxeroides. Archiv fur Hydrobiologie 66:139-160.
Boyd, C. E. 1970. Production, mineral accumulation and pigment concentrations in Typha latifolia and Scirpus americanus. Ecology 51:285-290.
Boyd, C. E. 1971. Further studies on productivity, nutrient and pigment relationships in Typha latifolia populations. Bulletin of the Torrey Botanical Club 98:144-150.
Boyd, C. E., and L. W. Hess. 1970. Factors influencing shoot production and mineral nutrient levels in Typha latifolia. Ecology 51:285-290.
Boyd, C. E., and D. H. Vickers. 1971. Relationship between production, nutrient accumulation and chlorophyll synthesis in an Eleocharis quadrangulata population. Canadian Journal of Botany 49:883-888.
75
Bray, J. R. 1962. Estimates of energy budgets for a Typha (cattail) marsh. Science 136:1119-1120.
Broome, S. W., W. W. Woodhouse, and E. D. Seneca. 1975. The relationship of mineral nutrients to growth of Spartina altemiflora in North Carolina. II. The effects of N, P and Ee fertilizers. Soil Science Society of America Proceedings 39:301-307.
Currier, P. J. 1979. Floristic composition and primary production of the postdrawdown vegetation of Eagle Lake marsh, Hancock County, Iowa. M.S. thesis. Iowa State University. 149 pp.
Davis, C. B., and A. G. van der Valk. 1978a. The decomposition of standing and fallen litter of Typha glauca and Scirpus fluviatilis. Canadian Journal of Botany 56:662-675.
Davis, C. B., and A. G. van der Valk. 1978b. Litter decomposition in prairie glacial marshes. Pages 99-113 R. E. Good, D. F. Whigham, and R. L. Simpson, eds. Freshwater wetlands: Ecological processes and management potential. Academic Press, New York. 378 pp.
Davis, C. B., J. L. Baker, A. G. van der Valk, and C. E. Baker. 1981. Prairie pothole marshes as traps for nitrogen and phosphorus in agricultural runoff. Pages 153-163 B. Richardson, ed. Proceedings of the Midwest Conference on Wetland Values and Management. Freshwater Society, 2500 Shadywood Road,
Box 90, Navarre, Minnesota. 55372. 660 pp.
de Jong, J. 1976. The purification of wastewater with the aid of rush or reed ponds. Pages 133-149 J. Tourbier and R. W. Pierson, Jr., eds. Biological control of water pollution. University of Pennsylvania, Philadelphia, Pennsylvania. 340 pp.
De la Cruz, A. A. 1978. Primary production processes: Summary and recommendations. Pages 79-86 R. E. Good, D. F. Whigham, and R. L. Simpson, eds. Freshwater wetlands: Ecological processes and management potential. Academic Press, New York. 378 pp.
Ewel, K. C. 1976. Effects of sewage effluent on ecosystem dynamics in cypress domes. Pages 169-195 D. L. Tilton, R. H. Kadlec, and C. J. Richardson, eds. Freshwater wetlands and sewage effluent disposal. The University of Michigan, Ann Arbor, Michigan. 343 pp.
Gallagher, J. L. 1975. Effect of ammonium nitrate pulse on the growth and elemental composition of natural stands of Spartina altemiflora and Juncus roemerianus. American Journal of Botany 62:644—648.

76
Polisini, J. M., and C. E. Boyd. 1972. Relationships between cell-wall fractions, nitrogen, and standing crop in aquatic macrophytes. Ecology 53:484-488.
Prentki, R. G., T. D. Gustafson, and H. S- Adams. 1978. Nutrient movements in lakeshore marshes. Pages 168-194 R. E. Good, D. F. Whigham, and R. L. Simpson, eds. Freshwater wetlands: Ecological processes and management potential. Academic Press, New York. 378 pp.
Richardson, C. J., W. A. Wentz, J. P. M. Chamie, J. A. Kadlec, and D. L. Tilton. 1976. Plant growth, nutrient accumulation and decomposition in a central Michigan peatland used for effluent treatment. Pages 77-117 D. L. Tilton, R. H. Kadlec, and C. J. Richardson, eds. Freshwater wetlands and sewage effluent disposal. The University of Michigan, Ann Arbor, Michigan. 343 pp.
Seidel, K. 1976. Macrophytes and water purification. Pages 109-121 in J. Tourbier and R. W. Pierson, Jr., eds. Biological control of water pollution. University of Pennsylvania, Philadelphia, Pennsylvania. 340 pp.
Spangler, F., W. E. Sloey, and C. W. Fetter. 1976. Experimental use of emergent vegetation for the biological treatment of municipal wastewater in Wisconsin. Pages 161-171 J. Tourbier and R. W. Pierson, Jr., eds. Biological control of water pollution. University of Pennsylvania, Philadelphia, Pennsylvania. 340 pp.
Spangler, F., C. W. Fetter, and W. E. Sloey. 1977. Phosphorus accumulation—discharge cycles in marshes. Water Resources Bulletin 13:1191-1201.
Stainton, M. P., M. J. Carpel, and F. A. J. Armstrong. 1974. The chemical analysis of freshwater. Fisheries Research Board of Canada Miscellaneous Special Publication 25. 125 pp.
Steward K. K., and W- H. Omes. 1975. Assessing a marsh environment for wastewater renovation. Journal-Water Pollution Control Federation 47:1880-1891.
Stewart, R. E., and H. A. Kantrud. 1971. Classification of natural ponds and lakes in the glaciated prairie region. U.S. Fish and Wildlife Service, Resource Publication 92. 57 pp.
Stumm, W., and J. J. Morgan. 1970. Aquatic Chemistry. Wiley-Inter-science. New York. 583 pp.
Sullivan, J. J., and F. C. Daiber. 1974. Response in production of cord grass, Spartina altemiflora, to inorganic nitrogen and phosphorus fertilizer. Chesapeake Science 15:121-123.

77
Kadlec, J. A. 1979. Nitrogen and phosphorus in inland freshwater wetlands. Pages 17-41 R. A. Bookhour, ed. Waterfowl and wetlands—An integrated review. La Cross Printing Co., La Crosse, Wisconsin. 152 pp.
Kadlec, R. H. 1976. Dissolved nutrients in a peatland near Houghton Lake, Michigan. Pages 27-50 D. L. Tilton, R. H. Kadlec, and C. J. Richardson, eds. Freshwater wetlands and sewage effluent disposal. The University of Michigan, Ann Arbor, Michigan. 343 pp.
Klopatek, J. M. 1975. The role of emergent macrophytes in mineral cycling in a freshwater marsh. Pages 367-393 i^ F. G. Howell, J. B. Gentry, and M. H. Smith, eds. Mineral cycling in southeastern ecosystem. ERDA (Energy Res. Dev. Admin.) (Conf-740513). 898 pp.
Lindsley, D., T. Schuck, and F. Steams. 1976. Productivity and nutrient content of emergent macrophytes in two Wisconsin marshes. Pages 51-75 D. L. Tilton, R. H. Kadlec, and C. J. Richardson, eds. Freshwater wetlands and sewage effluent disposal. The University of Michigan, Ann Arbor, Michigan. 343 pp.
Mason, C. F., and R. J. Bryant. 1975. Production, nutrient content and decomposition of Phragmites communis Trin. and Typha angustifolia L. Journal of Ecology 63:71-95.
McNaughton, S. J. 1966. Ecotype function in the Typha community-type. Ecological Monographs 36:297-325.
Murphey, J., and J. Riley. 1962. A modified single solution method for the determination of phosphate in natural waters. Analytical Chemica Acta 27:31-36.
North Dakota Agricultural Experiment Station. 1975. Recommended chemical soil test procedures for the north central region. North Dakota Agricultural Experiment Station Bulletin 499. 23 pp.
Penfound, W. T. 1956. Production of vascular aquatic plants. Limnology and Oceanography 1:92-101.
Patrick, W. H., Jr., and Tusneem, M. E. 1972. Nitrogen loss from a flooded soil. Ecology 53:735-737.
Pigott, C. D. 1969. Influence of mineral nutrition on the zonation of flowering plants in coastal salt marshes. Pages 25-35 I. H. Rorison, ed. Ecological aspects of mineral nutrition in plants. Blackwell Scientific Publications, Oxford and Edinburgh. 484 pp.

78
Turner, R. E., J. J. Day, Jr., M. Meo, P. M. Payonk, T. B. Ford, and W. G. Smith. 1976. Aspects of land-treated waste application in Louisiana wetlands. Pages 77-117 D. L. Tilton, R. H. Kadlec, and C. J. Richardson, eds. Freshwater wetlands and sewage effluent disposal. The University of Michigan, Ann Arbor, Michigan. 343 pp.
Tyler, G. 1967. On the effects of phosphorus and nitrogen supplied to Baltic shore meadow vegetation. Botanisk Notiser 120:433-447.
Valiela, I., and J. M. Teal. 1974. Nutrient limitation in salt marsh vegetation. Pages 547-563 R. J. Reimold and W. H. Queen, eds. Ecology of halophytes. Academic Press, New York. 605 pp.
Valiela, I., J. M. Teal,, and N. Y. Persson. 1976. Production and dynamics of experimentally enriched salt marsh vegetation: below-ground biomass. Limnology and Oceanography 21:245-252.
Valiela, I., J. M. Teal, and W. J- Sass. 1975. Production and dynamics of salt marsh vegetation and the effect of experimental treatment with sewage sludge. I. Biomass, production, and species composition. Journal of Applied Ecology 12:973-981.
van der Valk, A. G., and C. B. Davis. 1978a. Primary production in prairie glacial marshes. Pages 21-37 R. E. Good, D. F. Whigham, and R. L. Simpson, eds. Freshwater wetlands: Ecological processes and management potential. Academic Press, New York. 378 pp.
van der Valk, A. G., and C. B. Davis. 1978b. The role of the seed bank in the vegetation dynamics of prairie glacial marshes. Ecology 59:322-335.
van der Valk, A. G., and C. B. Davis. 1979. A reconstruction of recent vegetational history of a prairie glacial marsh. Eagle Lake, Iowa from its seed bank. Aquatic Botany 6:29-51.
van der Valk, A. G., and C. B. Davis. 1980. The impact of a natural drawdown on the growth of four emergent species in a prairie glacial marsh. Aquatic Botany 9:301-322.
Van Dyke, G. 1972. Aspects relating to emergent vegetation dynamics in a deep marsh, northcentral Iowa. Ph.D. thesis. Iowa State University (Libr. Congr. Card No. Mic. 73-3940). 162 pp. University Microfilms, Ann Arbor, Michigan.
Werblan, D. M. 1979. Artificial marshes as a means of treating wastes from a confined swine feeding unit. M.S. thesis. Iowa State University. 119 pp.

79
Westlake, D. F. 1963. Comparisons of plant productivity. Biological Review 38:385-425.
Whigham, D. F., and S. E. Bayly. 1978. Nutrient dynamics in freshwater wetlands. Pages 468-478 in P. E. Greeson, J. R. Clark, and J. E. Clark, eds. Wetland functions and values: The state of our understanding. American Water Resources Association, Minneapolis, Minnesota. 674 pp-.
Whigham, D. F., and R. L. Simpson. 1976a. The potential use of freshwater tidal marshes in the management of water quality in the Delaware River. Pages 173-186 J. Tourbier and R. W. Pierson, Jr., eds. Biological control of water pollution. University of Pennsylvania, Philadelphia, Pennsylvania. 340 pp.
Whigham, D. F., and R. L. Simpson. 1976b. Sewage spray irrigation in a Delaware River freshwater tidal marsh. Pages 119-144 D. L. Tilton, R. H. Kadlec, and C. J. Richardson, eds. Freshwater wetlands and sewage effluent disposal. The University of îlichigan, Ann Arbor, Michigan. 343 pp.

80
SECTION III. NITROGEN, PHOSPHORUS, AND THE DECOMPOSITION OF TYPHA
GLAUCA AND SPARGANIDM EURYCAEPUM IN A PRAIRIE MARSH

81
ABSTRACT
Sparganixm eurycarpum shoot litter with an initial nitrogen con
centration of 1.41% lost 27% more dry weight over a 505-day period
than did Sparganivm with an initial nitrogen concentration of 0.59%.
Typha glauca shoot litter with an initial nitrogen concentration of
0.55% lost 2% more dry weight during 505 days than Typha tissues with
an initial nitrogen concentration of 0.48%. Elevation of available
nitrogen and phosphorus concentrations in marsh surface waters to 20 ppm
NO^-N, 25 ppm NH^-N, and 5 ppm PO^-P did not alter the rate of
Sparganium or Typha shoot decomposition. After 505 days, losses of
shoot material totaled 39% for both species under fertilized and
unfertilized conditions. Fertilization also had no effect on decompo
sition of root and rhizomes of both species. The below-ground tissues
lost 28-50% of their dry weight over 505 days.
During the 505-day sampling interval, quantities of nitrogen
in shoot litter increased 31% for Sparganium and decreased 10% for
Typha under unfertilized conditions. Nitrogen quantities increased
35% for the two species under fertilized conditions. The quantity
of phosphorus in Sparganium and Typha shoot litter increased 7% and
121%, respectively, with fertilization. Under unfertilized conditions,
Sparganium shoot litter lost 2% and Typha litter gained 25% of original
phosphorus quantities. Sparganium shoot litter with a high initial
nitrogen concentration lost 50% of its original quantity of nitrogen
over 505 days; but high nitrogen Typha shoot litter gained an additional
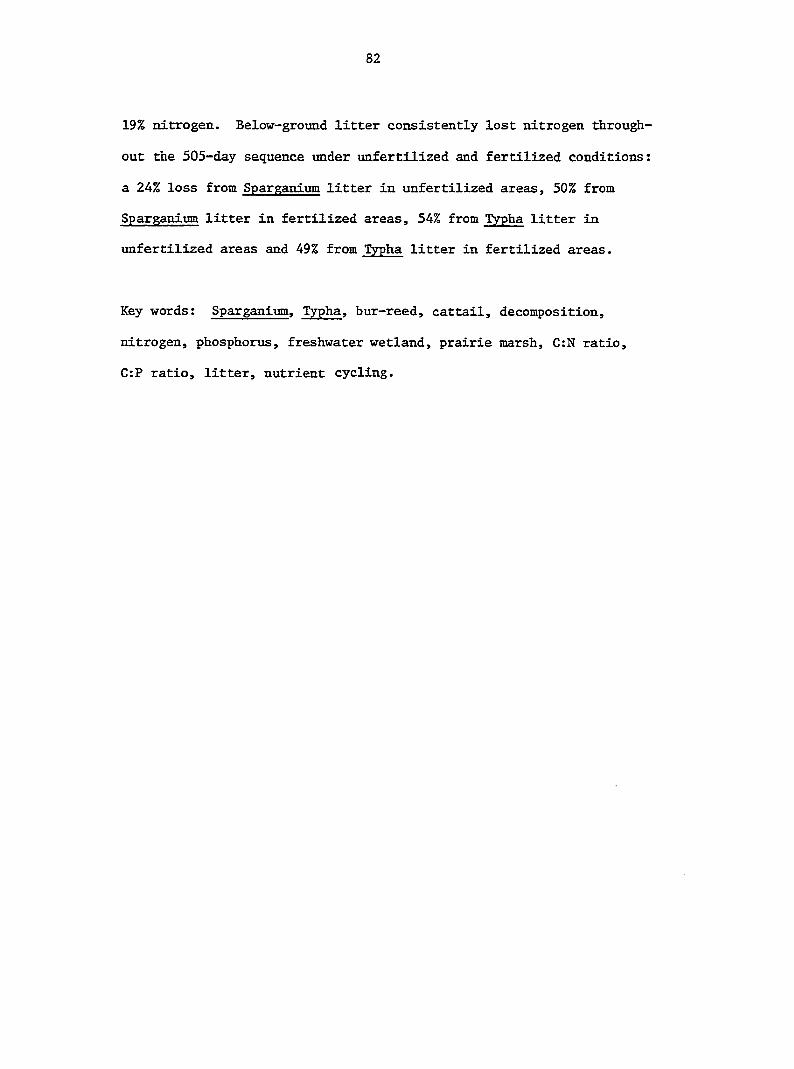
82
19% nitrogen. Below-ground litter consistently lost nitrogen through
out the 505-day sequence under unfertilized and fertilized conditions:
a 24% loss from Sparganium litter in unfertilized areas, 50% from
Sparganium litter in fertilized areas, 54% from Typha litter in
unfertilized areas and 49% from Typha litter in fertilized areas.
Key words: Sparganium, Typha, bur-reed, cattail, decomposition,
nitrogen, phosphorus, freshwater wetland, prairie marsh, C:N ratio,
C:P ratio, litter, nutrient cycling.

83
INTRODUCTION
A nimber of studies have demonstrated that at least during the
growing season wetland ecosystems can act as effective nutrient sinks
(Seidel 1971, 1976; Toth 1972; Lee et al. 1975; Kitchens et al. 1975;
Steward and Omes 1975; Spangler et al. 1976; Tilton et al. 1976;
Tourbier and Pierson 1976; Fetter et al. 1978; van der Valk. et al.
1978; Davis et al. 1981; and others). The fallen emergent litter
compartment has been postulated as a major compartment for the
accumulation and storage of some nutrients in wetlands (Richardson
et al. 1976; Davis and Harris 1978; Davis and van der Valk 1978a,
1978b, 1978c). Nitrogen and phosphorus removal associated with
fallen litter is the result of microbes using the litter as a carbon
source, but obtaining nutrients from surrounding waters. The
microbe-litter association (detritus) is a complex entity with an
endogenous primary source of carbon (litter) and an endogenous (litter)
as well as exogenous (water) source of nutrients for the associated
microorganisms (Figure III-l). High C:N and C:P ratios within litter
(>16-23:1 and 200:1, respectively) are indicative of microbial nitro
gen and phosphorus demands exceeding the initial content of the litter
and require the microbial populations to utilize exogenous sources of
nitrogen and phosphorus (Gosz et al. 1973; Enwezor 1976; Brinson 1977;
Prentki et al. 1978).
The effectiveness of emergent litter as a nutrient sink during
decomposition depends on 3 criteria: (1) the quantity of nutrients

84
Ni IC^ PC ^ h Surface Waters
CK
'2
u
' '
Microbes
Litter
Figure III-l. Sources of carbon, nitrogen, and phosphorus for microbial decomposers

85
leached from the litter, (2) the rate of decomposition and mineraliza
tion, and (3) the rate nutrients are accrued through microbial activity.
When the rate of litter decomposition is slower than the rate of litter
deposition, the nutrient content of the litter is eventually incor
porated into the sediment and retained in the system (Davis and Harris
1978). Factors which affect the rate of decomposition will therefore
determine to some extent the capacity of the litter to function as a
nutrient sink. The concentration of nitrogen and phosphorus in the
litter and in the surrounding waters are the major factors that can
influence the rate of litter decomposition. The rate of emergent
decomposition has been suggested as positively correlated with the
initial nutrient concentration of the litter (Kaushik and Hynes 1971;
Almazan and Boyd 1978; Coulson and Butterfield 1978; Davis and
van der Valk 1978b). In laboratory stream microcosms (Kaushik and
Hynes 1971; Howarth and Fisher 1976) and in natural stream ecosys
tems (Elwood et al. 1981), high concentrations of nitrogen and
phosphorus in waters have also been shown to accelerate decomposition
of litter. This may also be true in lentic systems (Andersen 1978;
Davis and Harris 1978).
The major emphasis of this investigation was to assess the sig
nificance of initial litter nutrient concentrations versus concentra
tions of nitrogen and phosphorus in ambient waters for emergent plant
litter decomposition rates and nitrogen and phosphorus accumulation
and/or losses by this litter. This was accomplished by comparing
under field conditions the decomposition of Typha glauca and Sparganium

86
eurycarpum shoot litter obtained from 2 sources, each source with
litter of a different initial nutrient content; and by determining
the effect of surface water fertilizer application on decomposi
tion of Typha and Sparganitim tissues with the same initial nutrient
content. A second objective of this study was to characterize the
decomposition of below-ground tissues of emergent macrophytes. The
contribution of root and rhizome decomposition to wetland nutrient
cycles is poorly understood. In only a few instances has root
decomposition even been described (Heal et al. 1978; Hackney and
De La Cruz 1980; Puriveth 1980). Our study compared root-rhizome
decomposition with the decomposition of above-ground plant parts
under fertilized and unfertilized conditions.

87
METHODS
Study Site
Eagle Lake, Iowa is a 365-ha natural prairie marsh of glacial
origin. The center of the marsh is a semi-permanent zone of open
water that rarely exceeds 1 m in depth. During this study, nitrogen
and phosphorus concentrations within the marsh water averaged approx
imately 0.41 ppm PO^-P, 0.56 ppm total dissolved phosphorus (as
PO^-P), 0.21 ppm particulate phosphorus (as PO^-P), 0.56 ppm NO^N, 0.47
ppm NH^-N, and 7.36 ppm organic nitrogen (as NH^-N). The sediments are
highly organic (99 - 115 kg organic material/ha for a 16.51 cm depth)
with a total nitrogen content of 2.3% and total phosphorus quantities
of about 16.5 kg/ha. Althou^ more than 40 aquatic plant species
occur in Eagle Lake (Currier 1979), during years of high water levels
such as 1979-1980 the marsh is dominated by two emergent macrophytes,
Sparganium eurycarpum and Typha glauca.
Fertilization Experiments
In early May, 1979 a series of 6 watertight enclosures (6 x 6 m )
were erected in monodominant stands of Sparganium and Typha, 3 enclo
sures per species. During the 1979 and 1980 growing seasons, each
enclosure was fertilized at 28-day intervals with (NE^) 2^^^ and
NE^NOg. Each fertilizer application was calculated to restore
available nitrogen and phosphorus concentrations in the water
column to 45 ppm available nitrogen (25 mg NH^-N/l; 20 mg NO^-N/l)
and 5 ppm available phosphorus (5 mg P-PO^/1). Near each ferti

88
lized enclosure, an unfertilized control plot was established
by staking a 6- x 6-m area of open marsh. Although the unfertilized
plots were not enclosed and do not represent true controls. Eagle Lake
is a fairly stagnant system; thus, the difference between open and
enclosed areas was assumed minimal.
Shoot tissues
Standing 1978 litter was collected in March, 1979 in monodominant
stands of Typha and Sparganium at Eagle Lake. This material was
dried at 60 C for 1 week, weighed, subsampled, and used to prepare
144 mesh (1 mm) fiberglass litterbags (30 x 20 cm) for each species.
Each bag contained approximately 10 gm of Typha or Sparganium tissue.
On 31 May, 1979, 24 litterbags of Typha or Sparganium were placed in
each unfertilized and fertilized plot. Three bags were removed
from all plots after 1, 14, 30, 50, 100, 150, 350, and 505 day inter
vals; thus, on each sampling date 9 bags were collected from the
unfertilized and fertilized plots for each species.
All litterbags were rinsed in distilled HgO, dried at 60 C
for 1 week, weighed, and subsampled. The subsamples were ground
in a Wiley mill with a #20 mesh and analyzed for total nitrogen and
total phosphorus. Litter weights were used to determine the rate
of decomposition as an expression of the percentage of original
weight.

89
Root-rhizome tissues
Root—rhizome tissues were collected in April, 1979 by excavating
2 0.25 m samples of Typha and Sparganium below-ground material Oroot
and rhizome). In the laboratory, the root-rhizome material was
washed in distilled HgO, killed by drying at 60 C for 1 week, weighed,
and used to prepare 98 litterbags for each species. 14 root litter-
bags were placed in each control and fertilized plot. These bags
were buried at approximately 30 cm. Two bags were collected from
each plot after 14, 30, 50, 100, 150, 350, and 505 day intervals.
Root-rhizome litter bags were processed in the same manner as the
shoot litterbags; however, because of funding constraints, only
total nitrogen was determined.
Shoot Decomposition and Initial Nutrient Content
Standing litter was obtained in March, 1979 from artificial
marshes used in the treatment of raw swine-waste (Werblan 1979).
Initial nitrogen concentrations in this litter were 1.41% and
0.55% for Sparganium and Typha, respectively. Nitrogen concen
trations in the litter obtained from Eagle Lake were 0.59% for
Sparganium and 0.48% for Typha. This litter was rinsed,
dried, weighed, and placed in 48 litterbags for each species. 24
bags of each species were distributed in two control areas. Three
bags were collected from each area after 1, 14, 30, 50, 100, 150,
350, and 505 day intervals and processed the same as all other litter
bags. Only total nitrogen analyses were performed. Litter in

90
fertilized plots, in unfertilized plots, and from the artificial,
swine-waste treatment marshes are referred to as fertilized litter,
unfertilized litter, and enriched litter, respectively, throughout
the remainder of this paper.
Statistical Analyses
The decomposition and change in nitrogen and phosphorus content
of litter was tested by using 3-way analyses of variance (ANOVA).
The ANOVA's were used to determine whether the following factors or
interactions affected decomposition: site, species, treatment,
species x treatment, site x species x treatment, time, time x species,
time x treatment, and time x species x treatment. This model was
used to compare the breakdown of shoot and root-rhizome material
between unfertilized and fertilized plots. The model was also used
to contrast the breakdown of litter initially high in nutrient con
centrations with the breakdown of Eagle Lake litter in unfertilized
plots-
Wetlands typically exhibit high intrinsic variation; thus,
statistical significance was set at o = 0.1 (see Richardson et al.
1976). Because multiple measurements within the same treatment
plot, e.g., 3 bags from 1 plot on a single date, and measurements
over time do not represent true replicates, the analyses of variance
were modified in two ways. First, when computing site, species,
treatment, and species x treatment mean square values, the site x
species x treatment interaction was used as an error term. Secondly,

91
mean square values for the remaining ANOVA terms were computed by
using conservative degrees of freedom (personal communication,
D. F. Cox, Iowa State University Statistics Department).

92
RESULTS
Shoot Decomposition
Dry weight
The percentage remaining of dry shoot weight is presented in
Figure III-2. Fertilized and unfertilized Sparganium and Typha litter
lost 20% and 16%, respectively, of their original weight within 24
hours after being submerged. The loss of dry weight continued for
approximately 50 days. After 50 days, dry weights of Sparganium in
unfertilized and fertilized litterbags had declined 39%, and Typha
losses during that period were approximately 26%. After these initial
losses, Typha dry weight dropped slightly, but Sparganium dry weight
remained relatively constant. After 505 days, 61% of the initial litter
weight remained in Sparganium unfertilized and fertilized litterbags,
and 61% of the initial material remained in the Typha unfertilized
and fertilized litterbags.
The pattern of dry-weight loss from the enriched litter paralleled
the weight losses in Eagle Lake litter; however, the rate of decomposi
tion was statistically greater in the swine-waste enriched litter.
24-hour dry-weight loss from the enriched litter was 27% for Sparganium
and 19% for Typha. After 50 days, 55% of the Spargam'urn dry material
and 31% of the Typha dry material was lost. Over the remaining period,
Sparganium continued to decompose rapidly; only 34% of the original
dry weight remained after 505 days. In contrast, 59% of the original
dry weight of the enriched Typha tissues remained after 505 days.

SHOOT ROOT 100-t-
$ s 60 z < s 20
H
gioo-
: it-'.——1 LL'.'jJ^Tî:^
TYPHA
100 200 300 400 500
20+ SPARGANIUM
1 1 h—H f 100 200 300 400 500
100-t-
100 200 300 400 500
100
60
20
f
SPARGANIUM
100 200 300 400 500
vo w
TIME ELAPSED (DAYS)
FERTILIZED UNFERTILIZED — ENRICHED
Figure III-2. The average percentage of original dry weight remaining in submerged Typha and
Sparganium shoot and root-rhizome litterbags

94
Although decomposition of both species was significantly accelerated
by the waste enrichment, the Sparganium response to the treatment
was greater than the Typha response, i.e., a significant species x
treatment interaction.
Nitrogen content
Figure III-3 illustrates the change in nitrogen concentration of
unfertilized, fertilized, and enriched litter. Over the entire
sampling interval, nitrogen concentrations of shoot litter increased
under all treatments. Sparganium percentages increased from an initial
concentration of 0.59% to a final concentration of 1.26% in control
plots (an increase of 114%) and 1.30% in fertilized plots (+ 120%).
Typha nitrogen concentrations increased from an initial concentration
of 0.48% to final concentrations of 0.70% (+ 46%) and 1.05% (+ 119%)
in control and fertilized plots, respectively. Sparganium and Typha
enriched litter increased from 1.41% to 2.06% (+ 46%) and from 0.55% to
1.12% (+ 104%), respectively. All nitrogen increases with time were
significant. Among treatments, nitrogen concentrations in the enriched
litter were significantly greater than concentrations in the unfertilized
litter. In contrast, no significant difference was observed between
nitrogen concentrations of litter in fertilized and unfertilized plots.
Nitrogen concentrations were converted to absolute quantities
remaining in litterbags by adjustment for dry-weight loss (Boyd 1970).
These data are presented in Figure III-4. Most of these curves show
an initial loss of nitrogen, corresponding to the loss in dry weight.

2.0- - SHOOT
100 200 300 400 500
V
8 1.0
-r*
SPARGANIUM
100 200 300 400 500
2.0-1-ROOT
TYPHA
100 200 300 400 500 VO Ui
2.0
1.0
SPARGANIUM
100 200 300 400 500
FERTILIZED
TIME ELAPSED (DAYS)
UNFERTILIZED ENRICHED
Figure III-3. The average concentration of nitrogen in submerged Typha and Sparganium shoot and root-rhizome litterbags

o z z < s 111 K
z
140
100
BO- •
20
' *
SHOOT ROOT ...»
TYPHA
1 4 h—1-
...—
SPARGANIUM
H 1 1—H h 100 200 300 400 500
20 -
140- '
100
60* "
20--SPARGANIUM
-4 h 1 1 h 100 200 300 400 500
TIME ELAPSED (DAYS)
FERTILIZED UNFERTILIZED ENRICHED
VO o\
Figure III-4. The average percentage of original nitrogen remaining in submerged Typha and Spar-ganiym shoot and root-rhizome litterbags

97
followed by a gradual accrual of nitrogen. Typha litter in unferti
lized plots and Sparganium enriched litter represent the only
exceptions to this trend. Amounts of nitrogen declined in unfertilized
Typha litter between 150-505 days. In Sparganium enriched litter,
nitrogen declined slowly throughout the entire 505 day period. Both
of these variations reflect the pattern of dry-weight loss (Figure
III-2).
After 505 days, the percentage of the initial quantity of nitrogen
remaining in litterbags were as follows: 131% in unfertilized Sparganium
litter, 135% in fertilized Sparganium litter, 50% in swine-waste
enriched Sparganium litter, 90% in unfertilized Typha litter, 135% in
Typha fertilized litter, and 119% in swine-waste enriched Typha litter.
Over the entire sampling interval, litter in fertilized plots contained
significantly greater quantities of nitrogen than did the litter in
unfertilized plots. Also, the enriched litter contained significantly
less amounts of nitrogen than did litter in unfertilized plots. The
latter response is clearly evident, with the exception of day 505 for
Typha (Figure III-4). In addition to the significant treatment effects,
the accumulation of nitrogen in enriched litter was species-specific.
Sparganium lost 50% of its original nitrogen content, but Typha con
tained an additional 19% nitrogen.
Phosphorus content
Figure III-5 presents the change in phosphorus concentration in
unfertilized and fertilized shoot litter. Initial concentrations in
the litter were 0.079% for Sparganium and 0.025% for Typha, and final

1.5-
GO.5-
Z o % H z 1.5-Ul V
11.0
U 0.5
TYPHA
r-1 1 1 1 L
SPARGANIUM
200-
0
Z 100-z
1 a!
Z 200-lU
% Ul
100-
TYPHA
—
SPARGANIUM VO 00
!
100 200 300 400 500 100 200 300 400 500
TIME ELAPSED (DAYS)
FERTILIZED UNFERTILIZED
Figure III-5. The average concentration of phosphorus and the percentage of original phosphorus remaining in submerged Typha and Sparganium shoot litterbags

99
concentrations were 0.12% in unfertilized Sparganium litter (an
increase of 52%), 0.13% in fertilized Sparganium litter C+ 65%),
0.05% in Typha unfertilized litter (+ 100%), and 0.09% in Typha
fertilized litter (+ 260%). The effect of fertilization on phosphorus
concentrations was not significant- Although the data suggest a
species-specific increase to fertilization, the species x treatment
and species x treatment x time interactions were not significant.
Figure III-5 also illustrates the change in absolute amounts of
phosphorus in litterbags. After 505 days, quantities of phosphorus
remaining in Sparganium unfertilized and fertilized litter were 98%
and 107%, respectively. Amounts of phosphorus in Typha litter in
creased to 125% of the initial amount in unfertilized plots and 221%
of the initial amount in fertilized plots over 505 days. Despite the
discrepancy between amounts of phosphorus accumulated by each
species, the species x treatment interaction was not significant;
however, the time x species, time x treatment, and time x species x
treatment interactions were all significant.
Root-rhizome Decomposition
Dry weight
The percentage remaining of root-rhizome dry weight is presented
in Figure III-2. Weight loss from below-ground tissues was similar
to the pattern of loss from shoot tissues. Initial loss of material
extended from 30-50 days. Dry weight of unfertilized and fertilized
Sparganium root-rhizome tissues initially declined by 33%. Typha
root-rhizomes declined by 42% in unfertilized plots and 36% in the

100
fertilized plots during the same period. For Sparganium, the percen
tages of initial dry weight lost in the first 30-50 days were similar
between shoots and roots-rhizomes. In Typha, however, initial root-
rhizome losses were approximately 22% greater than shoot losses in
unfertilized plots and 10% greater in fertilized plots. Further dry-
weight losses from root-rhizome tissues after the initial phase were
minimal. By day 505, only 28% and 47% of the original Sparganium
tissue had disappeared in unfertilized litterbags and fertilized
litterbags, respectively. Loss of Typha tissue totaled 50% in
unfertilized plots and 38% in fertilized plots. Fertilization did
not statistically alter the loss of dry weight from the root-rhizome
tissues•
Nitrogen content
The change in nitrogen concentration of root-rhizome tissue is
presented in Figure III-3. Spargaaium values fluctuated between 1.15%
and 1.73%, and Typha values between 1.10% and 1.66%. Slight declines
in nitrogen concentration with time, however, seem obvious. Initial
nitrogen percentages for Sparganium and Typha roots-rhizomes were
1.38% and 1.49%, respectively. With one exception, the concentration
in Sparganium root-rhizomes of control plots (1.49%), final concen
trations were lower than the initial concentrations. Final nitrogen
concentrations in the remaining treatment plots were 1.28% in
Spargam' urn fertilized plots (a decrease of 7%), 1.37% in Typha control
plots (-8%), and 1.19% in Typha fertilized plots (-20%). The fertili

101
zation treatment did not cause an increase in concentrations of
roots and rhizomes. Rather, nitrogen concentrations of below-ground
tissues were significantly lower in fertilized plots. Seasonal
averages were 1.46% in Sparganium control plots and 1.36% in fertilized
plots. Similarly, Typha averages were 1.44% in control plots and
1.26% in fertilized plots.
The absolute quantities of nitrogen remaining in root-rhizome
litterbags appear in Figure III-4. This pattern is in contrast to
that for shoot material. Significant quantities of nitrogen were
lost early from below-ground tissues after placement in the unferti
lized and fertilized plots. During the first 100 days, 58% (unferti
lized) and 52% (fertilized) of the original quantity of nitrogen was
lost from Typha root-rhizome tissues. The losses from Sparganium
below-ground tissues occurred over a shorter period of time, 14 days,
and were smaller, 26% in unfertilized plots and 23% in fertilized
plots. After the initial period of loss, remaining quantities of
nitrogen were constant (Figure III-3).

102
DISCUSSION
Dry Weight
Shoot litter
Most studies of emergent plant decomposition have been conducted
by placing material collected soon after shoot death into marsh water
or artificially prepared water. After inundation, the litter undergoes
two phases of decomposition: an initial period of rapid weight loss
because of leaching of soluble compounds and a longer period of
microbial breakdown (Boyd 1970; Mason and Bryant 1975; Howard-Williams
and Howard-Williams 1978; Davis and van der Valk 1978a, 1978b;
Puriveth 1980; Rogers and Breen 1982). In contrast to the submerged
litter, standing litter is affected primarily by leaching and frag
mentation (Davis and van der Valk 1978a). The loss of soluble com
pounds is a slower process in standing litter (Boyd 1970) and is
essentially a function of the timing and quantity of precipitation
events (Davis and van der Valk 1978a). We collected standing shoot
litter approximately 7 months after shoot death; hence, leaching
should have been virtually complete. Fertilized, unfertilized, and
enriched litter, however, lost 16-27% of their original weight
within 24 hours after being submerged (Figure III-2). These rates
are comparable to a 24-hour loss of 22% dry weight from anaerobic
Fraxinus excelsior leaf litter (Nykvist 1959). The dramatic Eagle
Lake losses suggest that leaching by precipitation immediately after

103
shoot death was incomplete or that exposure of standing litter to
alternate periods of drying, wetting, freezing, and thawing through
the winter rendered the vegetation more susceptible to leaching once
in the fallen litter compartment. Because fall, 1978 through spring,
1979 was a period of near normal precipitation (Table III-l), the
latter alternative seems more probable.
Neither leaching or the rate of decomposition of shoot litter
was affected by the application of fertilizer (Figure III-2).
Andersen (1978) found a 10% increase in the rate of decomposition
of Phragmites communis between a nutrient-rich lake and a nutrient-
poor lake. Fertilization studies in the laboratory and field have
also shown that rates of decomposition in stream ecosystems can be
accelerated by increased nitrogen and phosphorus concentrations in
the water (Kaushik and Hynes 1971; Howarth and Fisher 1976; Elwood
et al. 1981). The decomposition of litter in a bog ecosystem,
however, was not altered by fertilization; rather, decomposition
in that study was positively correlated with the initial concentration
of nitrogen in the litter (Coulson and Butterfield 1978). Davis and
van der Valk (1978b) also alluded to an increase in the rate of
dry-weight loss with an increase in initial nitrogen concentration;
and, Almazan and Boyd (1978) demonstrated a positive correlation
between oxygen consumption by microbial decomposers and nitrogen
concentrations of various macrophytes and algae. In a terres
trial system, initial concentrations, however, have been shown
important only during the early phase of leaf litter decomposition

Table Ill-l. The amount of precipitation (cm) at Eagle Lake between fall, 1978 and spring, 1979
1978 1979
Aug. Sept. Oct. Nov. Dec. Jan. Feb. Mar. Apr.
Precipitation 6.99 12.37 2.77 3.76 4.47 1.60 4.72 1.19 5.79
Departure from normal -1.12 +4.22 -1.85 +0.61 +0.89 -1.04 +2.01 -4.26 -1.12

105
(Staaf 1980). Initial Sparganium and Typha nitrogen values in
the enriched litter were 138% and 15% higher than initial values
from litter collected in Eagle Lake. These enriched tissues exhibited
statistically faster rates of decomposition, with the effect most pro
nounced in Sparganium tissues (Figure 111-2).
Root-rhizome litter
Root-rhizome tissues at Eagle Lake had high rates of dry-wei^it
loss at the outset of the study. The results of this study are compara
ble to a reported dry-weight loss of over 20% from Sparganiurn and Typha
latifolia below-ground tissues in a Wisconsin marsh after 1 month
(Puriveth 1980). These early losses from Sparganium and Typha roots-
rhizomes are greater than early losses described for other wetland
species. Early losses from Juncus roemerianus and Sparina cynosuroides
root-rhizome tissues have been reported as minimal (Hackney and
De La Cruz 1980) . In fact, raoemerianus below-ground tissues
buried at depths of 15 and 25 cm increased 8.7% and 6.1% in weight
after 43 days. Heal et al. (1978) also reported very slight losses
of weight from below-ground tissues of Eriophorum vaginaturn and
Calluna vulgaris. After 1 year, decomposition of these latter two
species had progressed by only 0.6% and 5.0%, respectively.
After 505 days in the field, Sparganium had lost as much as 47%
of its dry weight and Typha as much as 50%, with fertilization having
no effect on the loss. These losses are more than twice as great
as the losses from roots and rhizomes of Juncus and Spartina after

106
360 days (Hackney and De La Cruz 1980); and approximately 4-40 times
greater than losses from Eriophorum and Calluna after 2 years.
Puriveth reported losses of 27.8% from 2- latifolia and 42.1% from
Sparganium after 348 days. Puriveth's values are lower than comparable
data for the species at Eagle Lake on day 350, i.e., 37% for Spargam" imi
and 48% for Typha in control plots. Hackney and De La Cruz (1980)
reported that rhizomes decompose faster than roots. Both Sparganixim
and Typha below-ground structures are predominantly rhizomatous,
which may partially account for their high rates of decomposition.
It is certainly possible that our results and those of Puriveth
(1980) may have been affected by the initial drying of the live root
and rhizome tissues. That drying alters organic compounds and cell
wall components and increases leaching has been observed or suggested
for submergent macrophytes (Harrison and Mann 1975; Godshalk and
Wetzel 1978; Rogers and Breen 1982). Similar alteration may have
occurred in our study. Hackney and De La Cruz (1980) have cited the
possible alteration of chemical constituents as a reason for air
drying roots and rhizomes instead of oven drying them.
Nutrient Content
Shoot litter
An eventual rise in nitrogen and phosphorus concentrations of dead
tissues is typical (Kaushik and Hynes 1968, 1971; Odum and De La Cruz
1967; Maystrenko et al. 1969; Boyd 1970; Klopatek 1975; Mason and
Bryant 1975; Andersen 1978; Richardson et al. 1976; Davis and Harris

107
1978; Davis and van der Valk 1978a, 1978b, 1978c; Puriveth 1980; Staaf
1980; and others). Concentration increases of N and P in litter may be
caused by more rapid loss of organic material than nitrogen or phosphorus,
accumulation of nitrogen and phosphorus, or a combination of these
two factors (Brinson 1977). Although this study does not address
the relative importance of these two processes specifically, the
assumption is probably valid that increases in the fertilized and
and unfertilized Typha and Sparganium tissues were due to nutrient
accumulation by microbes (Kaushik and Hynes 1971; De La Cruz
and Gabriel 1974; Brinson 1977; Davis and van der Valk 1978a,
1978b) . C:N ratios of 16-23 (Enwezor 1976; Brinson 1977) and
a C:P ratio of 200 (Brinson 1977) are presumably minimum levels for
complete mineralization of detritus by microbes. Ratios above these
values are indicative of a microbial nitrogen and phosphorus demand
in excess of the nitrogen and phosphorus content of the litter. Thus,
nitrogen and phosphorus concentrations within the litter increase
because of microbial immobilization from the surrounding water and
adjacent soil particles. Table III-2 summarizes the initial and
final C:N and C:P ratios in the litter at Eagle Lake. These ratios
suggest a nitrogen and phosphorus demand by the microbes. Over the
course of this study, both C:N and C:P ratios did decline, and Typha
ratios were consistently higher than Spargam'iini ratios.
Nitrogen concentration increases in the enriched litter were as like
ly due to a differential loss of carbonaceous material and nitrogen con
taining compounds as to an actual accumulation of nitrogen (Figure III-2).

Table III-2. Approximate C:N and C:P ratios (assuming C as 45% of dry weight - Prentkl et al. 1978) of unfertilized, fertilized, and swine enriched litter
C:N C:P
Typha Sparganlum Typha Sparganium
Shoot Root-rhizome Shoot Root-rhizome Shoot
Unfertilized
Initial 94 30 76 33 1800 570
Final 64 33 36 30 882 385
Fertilized
Initial 94 30 76 33 1800 570
Final 43 38 35 35 500 354
Enriched
Initial 82 — 32 — —
Final 41 — 22 — ——

109
The C:N ratios for both species do indicate that some accumulation
should have occurred (Table III-2), but the Spargani nm ratios (an
initial ratio of 32 and a final ratio of 22) do approximate ratios
sufficient to insure complete microbial decomposition.
Kaushik and Hynes (1971) presented data which indicate that
nitrogen immobilization in excess of demand can occur, i.e., luxuriant
uptake. In that study, an ambient concentration of 10 ppm nitrogen
was more than the nitrogen quantity required for breakdown of leaf
litter, but an increase to 100 ppm stimulated even greater immobiliza
tion. Fertilization did not cause any significant elevation in nitro
gen or phosphorus concentration in our work. But, absolute quantities
of nitrogen and phosphorus immobilized in the litter of fertilized
' plots were significantly greater than those amounts in the litter of
unfertilized plots.
Absolute quantities of nitrogen and phosphorus in submerged
litter of some species have been reported to exceed temporarily the
original quantities of nitrogen or phosphorus (Boyd 1970; Brinson
1977; Davis and Harris 1978; Davis and van der Valk 1978a, 1978b).
In each of these studies the quantity of nutrient eventually declined.
But, at Eagle Lake only nitrogen in Typha unfertilized litter declined
after an increase. At 505 days, all other nitrogen values were at
their highest level (Figure III-4). Similarly, phosphorus values
continued to rise or remain stable (Figure III-5).
In contrast to the fertilized and unfertilized litter.

110
Sparganium enriched litter was a nitrogen source (Figure III-3).
After 505 days, 50% of the original nitrogen had disappeared. Al
ternately, Typha enriched litter eventually functioned as a nitrogen
sink, but was less effective than the fertilized litter (final
quantities of 119% and 135%, respectively, of original amounts).
Thus, it seems that the ability of litter to function as a nutrient
sink is closely related to initial nutrient content, and to a
lesser extent the amount of structural tissue. These data indicate
that plants with high initial nutrient content, are likely to act
as sinks only while living.
Below-ground litter
Table III-2 indicates a range of C:N ratios from 33-38 for the
below-ground detritus of Sparganium and Typha at Eagle Lake, thereby
indicating that nitrogen immobilization should have occurred. But,
nitrogen concentrations were stable or increased only slightly
(Figure III-3). Hackney and De La Cruz (1980) have reported slight
elevations of nitrogen in root-rhizome tissues over a 360-day period.
Although nitrogen concentrations of roots-rhizomes were significantly
lower in fertilized enclosures, the absolute quantities of nitro
gen remaining in litterbags were not statistically different between
fertilized and unfertilized sites. Based on the absolute nitrogen
values within the litterbags, the below-ground material of Sparganium
and Typha was a net exporter of nitrogen (Figure III-4). Similar
trends have been reported by Puriveth (1980) for below^ground tissues

Ill
of the same genera. Puriveth, however, observed major increases in
nitrogen quantities after 3-8 months of decomposition. Any increases
in the Eagle Lake species were minimal.
The absence of a change in nitrogen quantities with, fertiliza
tions was unexpected, particularly because the above-ground litter
responded to fertilization, and analyses of interstitial waters
substantiated that concentrations of available nitrogen and phosphorus
in 15-cm interstitial waters were significantly elevated by fertiliza
tion (unpublished). Because decomposition rates can be limited by
oxygen (Chamie and Richardson 1978; Heal et al. 1978), the effects
of fertilization may have been minimized by subsurface anaerobiosis.
The interaction of microbial demands for oxygen and available nutrients
is not understood, but is probably complex and seasonally variable
(Brinson 1977).
112
CONCLUSIONS
Table III-3 summarizes the final amounts of dry weight, nitrogen
and phosphorus remaining in Sparganlum and Typha litter after 505
days decomposition. On the basis of these data, decomposition of
emergent plant shoot litter was evidently limited by the initial
nutrient supply in the litter rather than the supply of nutrients
in surrounding waters; and shoot litter with a high initial nutrient
content was less effective as a nutrient sink than shoot litter
with an initially low nutrient concentration in high nutrient waters.
At Eagle Lake, an increase in initial nutrient concentrations of
emergent shoot litter, including a 138% increase in nitrogen concen
tration of Sparganium litter and a 15% increase in nitrogen concen
tration of Typha litter, resulted in a loss of 27% and 2% more dry
weight than unfertilized and fertilized Sparganium and Typha litter
with a lower initial nutrient content. During the 505 day period,
the enriched Sparganium shoot litter lost 50% of its original quantity
of nitrogen. Enriched Typha shoot litter was also a nitrogen expor
ter through 350 days of decomposition, but by 505 days exhibited a
net gain of 19% nitrogen. On the other hand, quantities of nitrogen
in fertilized Typha and Sparganium shoot litter increased by 35%;
and quantities of phosphorus in fertilized Typha and Sparganium
shoot litter increased by 121% and 7%, respectively.
Sparganium and Typha roots-rhizomes decomposed at nearly the
same rate as shoot litter (Table III-3), but the role of below-ground

113
Table III-3. Percentage remaining of original dry-weight, nitrogen, and phosphoinis quantities in Typha glauca and Sparganium eurycarpum litter after 505 days
% Remaining
Typha glauca
fertilized
unfertilized
enriched
Shoot
Dry Wt.
61
61
59
N
135
90
119
221
125
Root-rhizome
Dry Wt.
62
50
N
51
46
Sparganium eurycarpum
fertilized
unfertilized
enriched
61
61
34
135
131
50
107
98
53
72
50
76

114
litter in wetland nutrient cycles seems quite different from that of
shoot litter. Our data suggest decomposing below-ground litter is
a continuous source of nitrogen under both fertilized and unfertilized
conditions. After 505 days decomposition, maximum nitrogen losses
were between 50 and 54% of original quantities in root-rhizome
litter of both species.

115
LITERATURE CITED
Almazan, G. and C. E. Boyd. 1978. Effects of nitrogen levels on rates of oxygen consumption during decay of aquatic plants. Aquatic Botany 5:119-126.
Andersen, F. 0. 1978. Effects of nutrient level on the decomposition of Phragmites communis Trin. Archiv fiir Hydrobiologie 84:42-54.
Boyd, C. E. 1970. Losses of mineral nutrients during deconçosition of Typha latifolia. Archiv fiir Eydrobiologie 66:511-517.
Brinson, M. M. 1977. Decomposition and nutrient exchange of litter in an alluvial swamp forest. Ecology 58:601-609.
Chamie, J. P. M. and C. J. Richardson. 1978. Decomposition in northern wetlands. Pages 115-130 R. E. Good, D. F. Whigham, and R. L. Simpson, eds. Freshwater wetlands: Ecological processes and management potential. Academic Press, New York. 378 pp.
Coulson, J. C. and J. Butterfield. 1978. An investigation of the biotic factors determining the rates of plant decomposition on blanket bog. Journal of Ecology 66:631-650.
Currier, P. J. 1979. Floristic composition and primary production of the postdrawdown vegetation of Eagle Lake marsh, Hancock County, Iowa. M.S. thesis. Iowa State University. 149 pp.
Davis, C. B. and A. G. van der Valk. 1978a. The decomposition of standing and fallen litter of Typha glauca and Scirpus fluviatilis. Canadian Journal of Botany 56:662-675.
Davis, C. B. and A. G. van der Valk. 1978b. Litter decomposition in prairie glacial marshes. Pages 99-113 R. E. Good, D. F. Whigham, and R. L. Simpson, eds. Freshwater wetlands: Ecological processes and management potential. Academic Press, New York. 378 pp.
Davis, C. B. and A. G. van der Valk. 1978c. Mineral release from the litter of Bidens cernua L., a mudflat annual at Eagle Lake, Iowa. Proceedings of the International Association for Theoretical and Applied Limnology 20:452-457.

116
Davis, C. B., J. L. Baker, A. G. van der Valk, and C. E. Baker. 1981. Prairie pothole marshes as traps for nitrogen and phosphorus in agricultural runoff. Pages 153-163 B. Richardson, ed. Proceedings of the Midwest Conference on Wetland Values and Management. Freshwater Society, 2500 Shadywood Road, Box 90, Navarre, Minnesota. 55372. 660 pp.
Davis, S. M. and L. A. Harris. 1978. Marsh plant production and phosphorus flux in Everglades Conservation Area 2. Pages 105-131 in M. A. Drew, ed. Environmental quality through wetland utilization. Coordinating Council on the Restoration of the Kissimmee River Valley and Taylor Creek-Nubbin Slough Basin, Tallahassee, Florida. 243 pp.
De La Cruz, A. A. and B. C. Gabriel. 1974. Caloric, elemental, and nutritive changes in decomposing Juncus roemerianus leaves. Ecology 55:882-886.
Elwood, J. W., J. D. Newbald, A. F. Trimble and R. W. Stark. 1981. The limiting role of phosphorus in a woodland stream ecosystem: Effects of P enrichment on leaf decomposition and primary producers. Ecology 62:146-158.
Enwezor, W. 0. 1976. The mineralization of nitrogen and phosphorus in organic materials of varying C:N and C:P ratios. Plant and Soil 44:237-240.
Fetter, C. W., W. E. Sloey, and F. L. Spangler. 1978. Use of a natural marsh for wastewater polishing. Journal-Water Pollution Control Federation 50:290-307.
Godshalk, G. L. and R. G. Wetzel. 1978. Decomposition of aquatic angiosperms. I. Dissolved components. Aquatic Botany 5:281-300.
Good, R. E., D. F. Whigham, and R. L. Simpson. 1978. Freshwater wetlands: Ecological processes and management potential. Academic Press, New York. 378 pp.
Gosz, J. R., G. E. Likens, and F. H. Borman. 1973. Nutrient release from decomposing leaf branch litter in the Hubbard Brook Forest, New Hampshire. Ecological Monographs 43:173-191.
Hackney, C. T. and A. A. De La Cruz. 1980. In situ decomposition of roots and rhizomes of two tidal marsh plants. Ecology 61:226-231.
Harrison, P. G. and K. H. Mann. 1975. Detritus formation from eelgrass (Zostera marina L.): The relative effects of fragmentation, leaching and decay. Limnology and Oceanography 20:924-934.

117
Heal, 0. W., P. M. Latter and G. Hows on. 1978. A study of the rates of decomposition or organic matter. Pages 136-159 0. W. Heal and D. F. Perkins, eds. Production ecology of British moors and montane grasslands. Springer Verlag, New York. 426 pp.
Howard-Williams, C. and W. Howard-Williams. 1978. Nutrient leaching from the swamp vegetation of Lake Chilwa, a shallow African lake. Aquatic Botany 4:257-267.
Howarth, R. W. and S. G. Fisher. 1976. Carbon, nitrogen, and phosphorus dynamics during leaf decay in nutrient-enriched stream microsystems. Freshwater Biology 6:221-228.
Kaushik, N. K. and H. B. N. Hynes. 1968. Experimental study on the role of autumn-shed leaves in aquatic environments. Journal of Ecology 56:229-243.
Kaushik, N. K. and H. B. N. Hynes. 1971. The fate of the dead leaves that fall into streams. Archiv fur Hydrobiologie 68:465-515.
Kitchens, W. M., J. M. Dean, L. H. Stevenson, and J. H. Hooper. 1975. The Santee Swamp as a nutrient sink. Pages 349-366 F. Howell, J. B. Gentry, and M. H. Smith, eds. Symposium on mineral cycling in southeastern ecosystems. ERDA Symposium Series (CONF 740513). 898 pp.
Klopatek, J. M. 1975. The role of emergents in mineral cycling in a freshwater marsh. Pages 357-393 F. Howell, J. B. Gentry, and M. H. Smith, eds. Synç>osixim on mineral cycling in southeastern ecosystems. ERDA Symposium Series (CONF 740513). 898 pp.
Lee, G. F., E. Bentley, and R. Almundson. 1975. Effects of marshes on water quality. Pages 105-127 A. D. Hasler, ed. Coupling of land and water systems. Springer-Verlag, New York. 309 pp.
îfeson, C. F. and R. J. Bryant. 1975. Production, nutrient content and decomposition of PhraRmites communis Trin. and Typha angustifolia L. Journal of Ecology 63:71-95.
Maystrenko, Yu, A. I. Denisova, V. M. Bognyuk and Zh. M. Arymaova. 1969. The role of higher aquatic plants in the accumulation of organic and biogenic substances in water bodies. Hydrobiological Journal 5:20-31.
Nykvist, N. 1959. Leaching and decomposition of litter. I. Experiments on leaf litter of Fraxinus excelsior. Oikos 10:190-211.

118
Odum, E. P. and A. A. De La Cruz. 1967. Particulate organic detritus in a Georgia salt marsh - estuarine ecosystem. Pages 383-388 G. H. Lauff, ed. Estuaries. American Association for the Advancement of Science, University of Georgia, Athens. 757 pp.
Prentki, R. F., T. D. Gustafson, and H. S. Adams. 1978. Nutrient movements in lakeshore marshes. Pages 169-194 ia Freshwater wetlands; Ecological processes and management potential. Academic Press, New York. 378 pp.
Puriveth, P. 1980. Decomposition of emergent macrophytes in a Wisconsin marsh. Hydrobiologia 72:231-242.
Richardson, C. J., W. A. Wentz, J. P. M. Chamie, J. A. Kadlec, and D. L. Tilton. 1976. Plant growth, nutrient accumulation and decomposition in a central Michigan peatland used for effluent treatment. Pages 77-117 D. L. Tilton, R. H. Kadlec, and C. J. Richardson, eds. Freshwater wetlands and sewage effluent disposal. The University of Michigan, Ann Arbor. 343 pp.
Rogers, K. H. and C. M. Breen. 1982. Decomposition of Potamogeton crispus L. : The effects of drying on the pattern of mass and nutrient loss. Aquatic Botany 12:1-12.
Seidel, K. 1971. Macrophytes as functional elements in the environment of man. Hydrobiologia 12:121-130.
Seidel, K. 1976. Macrophytes and water purification. Pages 109-121 in J. Tourbier and R. W. Pierson, eds. Biological control of water pollution. University of Pennsylvania Press, Philadelphia, Pennsylvania. 340 pp.
Spangler, F. L., W. E. Sloey, and C. W. Fetter. 1976. Wastewater treatment by natural and artificial marshes. EPA-600/2-76-207, EPA Robert S. Kerr. Environmental Research Laboratory, Ala,
OK. 171 pp.
Staaf, H. 1980. Influence of chemical composition, addition of raspberry leaves, and nitrogen supply on decomposition rate and dynamics of nitrogen and phosphorus in beech leaf litter. Oikos 35:55-62.
Steward, K. K. and W. H. Ornes. 1975. Assessing a marsh environment for wastewater renovation. Journal - Water Pollution Control Federation 47:1880-1891.

119
Tilton, D. L., R. H. Kadlec, and C. J. Richardson. 1976. Freshwater wetlands and sewage effluent disposal. University of Michigan, Ann Arbor, Michigan. 343 pp.
Toth, L. 1972. Reeds control eutrophication of Balaton Lake. Water Research 6:1533-1539.
Tourbier, J. and R. W. Pierson. 1976. Biological control of water pollution. University of Pennsylvania Press, Philadelphia, Pennsylvania. 340 pp.
van der Valk, A. G., C. B. Davis, J. L. Baker, and C. E. Beer. 1978. Natural freshwater wetlands as nitrogen and phosphorus traps for land runoff. Pages 457-467 P. E. Greeson, J. R. Clark, and J. E. Clark, eds. Wetland functions and values: The state of our understanding. American Water Resources Association, Minneapolis, Minnesota. 674 pp.
Werblan, D. M. 1979. Artificial marshes as a means of treating wastes from a confined swine feeding unit. M.S. thesis. Iowa State University. 119 pp.

120
SUMMARY
The goal of this project was to determine the impact of nitrogen
and phosphorus loading on three wetland compartments: interstitial
water, living emergent vegetation, and submersed emergent litter.
Repeated application of NH^NO^ and (NH^) 2^^^^ in 1979 and 1980 indicated
that (1) interstitial concentrations of nitrogen and phosphorus increase
with an elevation of surface water concentrations, (2) that emergent
plant production can be a function of the fertility of the surface water,
and (3) that the rate of emergent litter decomposition, and thus its
capacity to act as a nutrient sink, is controlled by the initial nutrient
concentration of the litter itself and not the nutrient concentration of
the surrounding water.
The impact of fertilization has been considered separately for each
marsh compartment in the three sections of this dissertation; however,
this does not imply that the compartments responded independently to
fertilization. Rather, the movement and effect of applied nitrogen was
a sequential process involving the interaction of all 3 compartments
(Figure 4)• Applied nitrogen and phosphorus moved first from the sur
face water into the interstitial water, causing an increase in PO^-P
(+47% in 1979 and +60% in 1980) and NH^-N (+144% in 1979 and +189% in
1980) in the top 15-cm of interstitial water beneath stands of Spar-
ganitm eurycarpum and Typha glauca» Fallen emergent plant litter was
found to function as a physical and biological (microbial uptake)
barrier to the downward movement of surface nutrients across the sedi-

121
Emergen* Vtgrtatîon
Shoot N
Sporgonium +34* + 14* Typho
d*nitrifî<otion
^— Surface HgO
NH4 (25mg/l)
Spargonium +20* PO4 Typho +30*
(Sms/i) N,P
Shoot NPP
Litter-Microbe Complex litter-Micrbbe Complex Sporganium +57*
I+«>*> Sporgonium +25* V Typho Interstitial HgO
Figure 4. The movement and effect of nitrogen and phosphorus fertilizer in Eagle Lake marsh. After application, the fertilizer moved through the litter layer into the interstitial water column.
As a result, nitrogen and phosphorus concentrations in both compartments were elevated. Emergent plant uptake and accumulation of nitrogen from interstitial waters in 1979 and 1980 stimulated an increase in shoot density in 1980, an increase in net primary production (ïîPP) in 1980, and eventually an increase in the rate of decomposition. Percentages denote the 1980 post—fertilization changes in nitrogen and phosphorus concentration of interstitial water and live tissues; the change in the absolute quantity of nitrogen and phosphorus in litter; the change in shoot density; the change in NPP; and the change in the rate of decomposition

122
ment-water interface. With fertilization, absolute quantities of nitro
gen (+35% for both species) and phosphorus (+7% for Sparganium and +121%
for Typha) accumulated in the fallen litter over 505 days of decomposi
tion. After movement of the added PO,-P and NH,-N into the inter-4 4
stitial water column in 1979, percentage nitrogen increased in the roots-
rhizomes of Sparganium (+14%) and the shoots of both species (+30% for
Sparganium and +7% for Typha); however, these increases did not signif
icantly alter plant production. In 1980, root-rhizome nitrogen concen
tration (+25% for Sparganium and +38% for Typha), shoot nitrogen concen
tration (+34% for Sparganium and +14% for Typha), shoot density (+20%
for Sparganium and +30% for Typha), and net primary productivity (+57%
for Sparganium and +19% for Typha) increased. The 1-year delay for a
production response was presumably related to the storage of the nutri
ents in overwintering below-ground tissues (see Section II for furthur
discussion). Eventually, the elevated nitrogen concentration of the
live tissues resulted in an acceleration of emergent litter decomposi
tion (+138% .nitrogen in Sparganium litter caused a loss of 27% more dry
weight over 505 days, and +15% nitrogen in Typha litter resulted in a
loss of 2% more dry weight over 505 days).

123
LITERATORE CITED
Bartlett, M. S., L. C. Brown, N. B. Hanes, and N. H. Nicker son. 1979. Denitrification in freshwater wetland soil. Journal of Environmental Quality 8:460-464.
Brezonik, P. L, and G. R. Lee. 1968. Denitrification as a nitrogen sink in Lake Mendota, Wisconsin. Environmental Science and Technology 2:120-125.
Brinson, M. M. 1977. Decomposition and nutrient exchange of litter in an alluvial swamp forest. Ecology 58:601-609.
Chamie, J. P. M. and C. J. Richardson. 1978. Decomposition in northern wetlands. Pages 115-130 R. E. Good, D. F. Whigham, and R. L. Simpson, eds. Freshwater wetlands: Ecological processes and management potential. Academic Press, New York. 378 pp.
Chen, R. L., D. R. Keeney, D. A. Graetz, and A. J. Holding. 1972. Denitrification and nitrate reduction in Wisconsin lake sediments. Journal of Environmental Quality 1:158-162.
Davis, C. B. and A. G. van der Valk. 1978a. The decomposition of standing and fallen litter of Typha glauca and Scirpus fluviatilis. Canadian Journal of Botany 56:662-675-
Davis, C. B. and A. G. van der Valk. 1978b. Litter deconçosition in prairie glacial marshes. Pages 99-113 R. E. Good, D. F. Whigham, and R. L. Simpson, eds. Freshwater wetlands: Ecological processes and management potential. Academic Press, New York. 378 pp.
Davis, S. M. and L. A. Harris. 1978. Marsh plant production and phosphorus flux in Everglades Conservation Area 2. Pages 105-131 in M. A. Drew, ed. Environmental quality through wetland utilization. Coordinating Council on the Restoration of the Kissimmee River Valley and Taylor Creek-Nubbin Slough Basin, Tallahassee, Florida. 243 pp.
De La Cruz, A. A. and B. C. Gabriel. 1974. Caloric, elemental, and nutritive changes in decomposing Juncus roemerianus leaves. Ecology 55:882-886.
Good, R. E., D. F. Whigham, and R. L. Simpson. 1978. Freshwater wetlands: Ecological processes and management potential. Academic Press, New York. 378 pp.

124
Greeson, P. E., J. R. Clark, and J. E. Clark. 1978. Wetland functions and values: The state of our understanding. American Water Resources Association, Minneapolis, Minnesota. 674 pp.
Heal, 0. W., P. M. Latter and G. Howson. 1978. A study of the rates of decomposition of organic matter. Pages 136-159 0, W. Heal and D. F. Perkins, eds. Production ecology of British moors and montane grasslands. Springer Verlag, New York. 426 pp.
Keeney, D. R., R. L. Chen and D. A. Graetz. 1971. Importance of denitrification and nitrate reduction in sediments to the nitrogen budgets of lakes. Nature 233:66-67.
Klopatek, J. M. 1975. The role of emergents in mineral cycling in a freshwater marsh. Pages 357-393 F. Howell, J. B. Gentry, and M. H. Smith, eds. Symposium on mineral cycling in southeastern ecosystems. ERDA Symposium Series (CONF 740513). 898 pp.
Patrick, W. H. and M. E. Tusneem. 1972. Nitrogen loss from a flooded soil. Ecology 53:735-737.
Reddy, K. R., P. D. Saceo and D. A. Graetz. 1980. Nitrate reduction in an organic soil-water system. Journal of Environmental Quality 9:283-288.
Spangler, F. L-, W. E. Sloey, and C. W. Fetter. 1976. Wastewater treatment by natural and artificial marshes. EPA-600/2-76-207, EPA, Robert S. Kerr Environmental Research Laboratory, Ada, Okalahoma. 171 pp.
Stumm, W. and J. J. Morgan. 1970. Aquatic Chemistry. Wiley-Inter-science. New York. 583 pp.
Til ton, D. L., R. H. Kadlec, and C. J. Richardson. 1976. Freshwater wetlands and sewage effluent disposal. University of Michigan, Ann Arbor, Michigan. 343 pp.
Tourbier, J. and R. W. Pierson. 1976. Biological control of water pollution. University of Pennsylvania Press, Philadelphia, Pennsylvania. 340 pp.
Valiela, I. and J. M. Teal. 1974. Nutrient limitation in salt marsh vegetation. Pages 547-563 R. J. Reimold and W. H. Queen, eds. Ecology of halophytes. Academic Press, New York and London, 605 pp.
van der Valk, A. G., C. B. Davis, J. L. Baker, and C. E. Beer. 1978. Natural freshwater wetlands as nitrogen and phosphorus traps for land runoff. Pages 457-467.

125
ACKNOWLEDGEMENTS
This study was supported by grants from the Iowa Agriculture
and Home Economics Experiment Station (Project 2071), the U.S.
Environmental Protection Agency (Grant #805826-012), the U.S. Office
of Water Resources Technology (Grant #A-080-IA), and Sigma Xi, the
Scientific Research Society. Gratitude is expressed to each of my
committee members, James Baker, Craig Davis, Richard Smith,
Cecil Stewart, and Arnold van der Valk, for their constructive
comments on this dissertation. Special thanks are given to James
Baker and Richard Smith for donation of their laboratory facilities.
I would also like to thank Rose Griffin, Mike Martin, Steven Schaff,
and Scott Thompson for their help in the field and laboratory, and
Sandy Wade for her careful typing of this dissertation. Very special
appreciation goes to my wife. Renée, for her long hours of assistance
in the laboratory and field, and her secretarial help in finishing
this manuscript.