Embed Size (px)
Citation preview

Ecotogy, 81(8), 2000, pp. 2198-22100 2000 by the Ecological Society of America
NITROGEN BUDGETS OF PHLOEM-FEEDING BARK BEETLESWITH AND WITHOUT SYMBIOTIC FUNGI
MATTHEW I? AYRES,',~ RICHARD T. WILKENS,* JONATHAN J. RUEL,' MARIA J. LOMBARDERO,’ AND
ERICH VALLERY~
‘Department of Biological Sciences, Dartmouth College, Hanover, New Hampshire 03755 USA2Department of Biology, Dowling College, Oakdale, New York I 1769- I1 19 USA
SDepartment of Biological Sciences, Northern Arizona University, Flagstag Arizona 8601 I-5640 USA4Southern Research Station, USDA Forest Service, 2500 Shreveport Highway, Pineville, Louisiana 71360 USA
Abstract. The nitrogen content of plant tissue is low relative to that of herbivores; asa consequence, dietary N can limit the growth and reproduction of herbivores and selectfor attributes that increase N acquisition. Bark beetles face a particularly severe challengebecause the phloem that they consume is very low in nitrogen and phosphorus relative totheir requirements. We quantified variation in the phloem concentrations of N and P in thehost tree, Pinus taeda, and evaluated the following hypotheses regarding the role of sym-biotic fungi in nutrient budgets of the herbivore Dendroctonus frontalis: D. frontalis ex-perience variation in phloem nutrient concentrations across several spatial scales (H,);mycangial fungi enhance the diet of D. frontalis larvae by contributing to the acquisitionof N and P (HZ); Ophiostoma minus, an apparently antagonistic fungal symbiont, hindersD. larvae because it does not enhance nutrient concentrations of the phloem asmuch as mycangial fungi do (H3); and larvae of bark beetle species that lack mycangialfungi must consume more phloem to accomplish the same growth as larvae of D. frontalis(H4). In addition, we developed a general model for the N budgets of herbivorous insectsthat identifies the possible combinations of dietary and physiological parameters that canallow developmental success on low-nutrient diets.
Spatial variation in phloem N was mostly at the level of trees within sites (a scale ofmeters) while P mostly varied among sites (a scale of kilometers). Trees with higher Ncontent produced larger D. frontalis adults. Prior to infestation by beetles, phloem nutrientconcentrations were very uniform within trees and very low relative to that of the barkbeetles (N and P concentrations of D. frontalis adults were 28 and 8 times greater, re-spectively). During infestation, phloem nutrient concentrations increased overall and be-came highly variable within trees. Nitrogen concentrations increased from 0.40 + 0.01%(mean ? 1 SE) in uninfested phloem to 0.86 2 0.03% in the phloem surrounding successfullydeveloping D. frontalis larvae, which are typically associated with one or two species ofmutualistic mycangial fungi. Nitrogen concentrations were intermediate in other micro-habitats within infested trees, including regions with no adult colonization, with failedlarval development, or colonized by the antagonistic bluestain fungus 0. minus. We pa-rameterized a general nutrient-budget model for D. frontalis and a sympatric non-mycangialbark beetle, Zps grandicollis, which indicated that (1) mycangial fungi provide their benefitsby concentrating dietary N for larvae; (2) 0. minus may exert its antagonist& effects onD. frontalis larvae by failing to concentrate dietary N as much as mycangial fungi do; (3)non-mycangial bark beetles meet their N budgets through high consumption of unaltered,low-N phloem; and (4) larvae should easily meet their P requirements with any combinationof consumption rate and development time that allows them to meet their N requirements.Alternative strategies for N acquisition may have general consequences for the populationdynamics and community interactions of bark beetles.
Key words: bark beetles and dietary N; Dendroctonus frontalis; fungi, bluestain and mycangial;herbivory; Ips grandicollis; mutualism; mycangial fungi and N acquisition: nitrogen acquisition byherbivores; Ophiostoma minus; phosphorus; symbiotic fungi.
INTRODUCTION bivores and select for attributes that increase nitrogen
The nitrogen content of plant tissue is very low rel- acquisition (Mattson 1980). Herbivores can potentially
ative to that of herbivores. As a consequence, dietary solve the problem of low dietary nitrogen by (1) in-
nitrogen can limit the growth and reproduction of her- creasing nitrogen-use efficiency, (2) increasing con-sumption rate, (3) protracting the duration of the feed-
Manuscript received 10 February 1999; revised 29 July 1999; ing life stage, (4) adjusting life histories to exploit sea-accepted 30 July 1990. sonal pulses in plant nutrient content, (5) feeding in
5 E-mail: [email protected] tissue microsites of relatively high nitrogen content,
2198


August 2000 DIETARY NITROGEN FOR BARK BEETLES 2199
.
and/or (6) manipulating the diet to increase nitrogencontent (Forcella 1981, Tabashnik 1982, Robbins 1983,Ayres and MacLean 1987, Clancy et al. 1988, Clancy1992, Slansky and Wheeler 1992, Slansky 1993, White1993, Yang and Joern 1994, Trier and Mattson 1997).Phosphorus also occurs in lower concentrations inplants than in herbivores and is also a potentially lim-iting nutrient for herbivores (Ayres and MacLean 1987,Popp et al. 1989, Skinner and Cohen 1994). Bark bee-tles (Coleoptera: Scolytidae) face a particularly severechallenge because of the very low nutritional value ofphloem (Scriber and Slansky 1981, Slansky and Scriber1985). For example, nitrogen content of the phloem inhealthy loblolly pine is -0.38% (Hodges and Lorio1969) compared to l-S% in plant foliage (Mattson1980). Because insects are typically 6-10% nitrogenthemselves, growing bark beetles must therefore con-centrate dietary nitrogen by 16-26 fold.
Some bark beetles, including Ips grandicollis (Ei-chhoff), appear to meet their nutritional needs with highconsumption rates. Other bark beetles, including thesouthern pine beetle (Dendroctonus frontalis Zimmer-man), appear to have relatively low consumption rates,but are thought to benefit from associations with fungiand other microorganisms that improve the nutritionalquality of ingested phloem (Henry 1962, Becker 197 1,Barras and Perry 1975, Martin 1979). Phloem nitrogenin one loblolly pine increased to 13 1% of control levelsfollowing the introduction of D. frontalis and associ-ated microorganisms (Hodges et al. 1968). Adult fe-male D. frontalis have elaborately modified structures(mycangium) that house and nurture two species ofmutualistic fungi: Ceratocystiopsis ranaculosus Perryand Bridges and Entomocorticium sp. A (formerly SJB122) (Barras and Perry 1972, Hsiau 1996). As theadults construct oviposition galleries, the fungal hy-phae are exuded from the mycangium and begin togrow within the phloem tissue as D. frontalis progenyare hatching. Larvae subsequently feed upon the phlo-em-fungal complex. D. frontalis adults that lacked my-cangial fungi laid half as many eggs as control beetles(Goldhammer et al. 1990) and D. frontalis larvae feed-ing in the absence of mycangial fungi had reducedsurvival and increased development time (Barras 1973,estimated potential population growth rate, r, to be0.026 vs. 0.057 beetlesbeetle-‘&’ in no-fungi andcontrol populations, respectively).
The nutritional challenge for bark beetles can becompounded by intraspecific and interspecific com-petition for phloem. Interspecific competitors includeother beetles (chiefly Scolytidae, Buprestidae, and Cer-ambycidae) and phoretic microorganisms. D. frontalisis not only associated with two species of apparentlybeneficial mycangial fungi but also with numerous oth-er microorganisms such as the bluestain fungus(Ophiostoma minus H. & P. Sydow). Some bluestainfungi are thought to be mutualistic with some barkbeetle species (Lewinsohn et al. 1994, Paine et al. 1997,
Ross and Solheim 1997), but accumulating evidencesuggests that 0. minus is an antagonist of D. frontalis.There are strong negative correlations between theabundance of 0. minus and the reproductive successof D. frontalis across infestation sites within a region,across trees within infestations, and across phloempatches within individual trees (Bridges 1983, Bridges1985, Bridges et al. 1985, M. F’. Ayres, personal ob-servations). Experimental additions of 0. minus in thelaboratory reduce the growth performance of D. fron-talis larvae (Barras 1970, Bridges and Perry 1985). Themechanisms underlying antagonistic effects of 0. mi-nus are not clear. It is possible that 0. minus impedesbeetle growth because it does not elevate nutrients asmuch as mycangial fungi do. Field and laboratory stud-ies suggest that 0. minus strongly outcompetes the mu-tualistic mycangial fungi (Bridges and Perry 1985, Kle-pzig and Wilkens 1997), indicating that the presenceof 0. minus may preclude the establishment of my-cangial fungi in larval feeding chambers. It is also pos-sible that secondary metabolites produced by 0. minus(e.g., isocoumarins, Hemingway et al. 1977) have al-lelopathic effects on mycangial fungi or D. frontalislarvae.
In this study we evaluated the following hypotheses:(H,) D. frontalis experience variation in phloem nu-trient concentrations across many scales (within thebole of individual trees, among trees within infesta-tions, and among infestation sites); (Hz) mycangial fun-gi enhance the diet of D. frontalis by contributing totheir intake of nitrogen and phosphorus; (HJ 0. minusnegatively impacts D. frontalis larval development be-cause it does not enhance the nutrient concentrationsof the phloem to the same degree as the mycangialfungi do; (HJ larvae of I. grandicollis, which lackmycangial fungi, must consume more phloem to attainthe same mass as D. frontalis larvae. In addition, wedevelop a general model for the nitrogen budgets ofherbivorous insects that identifies the possible com-binations of dietary and physiological parameters thatcan allow developmental success on low-nutrient diets.
M E T H O D S
Phloem nitrogen and phosphorus
Phloem samples were collected from five natural in-festations of Dendroctonus frontalis within the Kis-atchie National Forest of Louisiana and the IndianMounds wilderness area of Texas (USA). Infestationsites were separated by lo-200 km. Within each in-festation site, phloem samples were collected from fiveinfested trees and five uninfested trees (all loblollypine, Pinus taeda L., 15-30 cm in diameter at breastheight). The infested trees that we sampled were all atthe same stage of attack (most D. frontalis were latein the final larval stadium). The uninfested trees thatwe sampled within each site were within 40 m of theinfested trees but were just outside the perimeter of the

2200 MATTHEW P. AYRES ET AL. Ecology, Vol. 81, No. 8
infestation at the time of sampling. Within a site, in-fested and uninfested trees appeared to be comparablein all respects except for the presence or absence of D.frontalis. Samples from each infested tree were drawnfrom each of four mutually exclusive phloem classes(Fig. 1): (1) within 7 mm of adult galleries with suc-cessful brood (= good brood); (2) within 7 mm of adultgalleries with unsuccessful brood (= failed brood); (3)separated from adult and larval galleries by >lO mm(= no brood); and (4) covered with fruiting bodies(perithecia) of 0. minus (= bluestain). Phloem samplesfrom the good brood, failed brood, and sometimes fromthe bluestain classes included the tissue that D. fron-talk larvae were consuming. Good brood was definedby the presence of well-developed, oval, feeding gal-leries, while failed brood was defined by narrow, me-andering feeding galleries that typically indicate larvalmortality. We never observed successful larval devel-opment in regions with 0. minus perithecia. Two rep-licate tissue samples from each phloem class in eachtree were drawn from regions of phloem separated by40-150 cm. Similarly, two replicate samples weredrawn from each of the unattacked trees, but in thiscase there was only one phloem class (unattackedhealthy phloem). Thus, each infestation site yielded apossible total of 50 phloem samples (40 from attackedtrees and 10 from unattacked trees). In a few trees, notall possible phloem classes were represented (3 of 25trees lacked 0. minus samples and 5 of 25 trees lacked“no brood” samples). In 10 other trees, we could onlyobtain one sample from one of the phloem classes. Intotal, we analyzed 224 phloem samples.
Phloem samples were freeze-dried, ground, then an-alyzed for total nitrogen and phosphorus with a stan-dard micro-Kjeldahl procedure (sulfuric acid digestionfollowed by analysis with a Technicon Auto-Analyzer[Pulse Instrumentation, Ltd., Saskatoon, Saskatche-wan, Canada]). We also analyzed D. frontalis larvae(feeding final instars) and adults (-2 d after eclosion)that had been feeding upon the phloem. Plant tissue ofknown nitrogen concentration (National Institute ofStandards and Technology, United States Departmentof Commerce) was included with each digestion lot toensure quality control. Because results showed a sur-prising increase in the nitrogen concentration of adultsrelative to larvae, we made additional measurementson larvae, pupae, and adults removed from their feed-ing chambers (larvae) or pupation chambers (pupae andcallow adults). Subsets of the callow adults were al-lowed to mature prior to measurements for 2 or 4 dwithin humidified petri dishes at -24°C with no food(adults do not normally feed between emergence fromone tree and attack of another tree).
Beetle success as a funct ion of phloem nutrients
We evaluated patterns of variation in the size of adultbeetles emerging from different trees and different in-festation sites. D. frontalis adults from each of the at-
tacked trees were collected as they emerged. A sub-sample of these beetles (8-10 of each sex from eachtree) were measured for total length using an ocularmicrometer (ntota, = 5 infestation sites X 5 trees X 2sexes X 8-10 beetles = 446 total adults sampled).
Stat is t ics
We used an ANOVA to test for variation in phloemN and P content among infestation sites, trees nestedwithin infestation sites, and (in the case of attackedtrees) phloem classes within trees. Infestation sites andtrees were treated as random effects, while phloem clas-ses were treated as a fixed effect. We estimated thevariance attributable to random effects (Sokal andRohlf 1981). Infested and uninfested trees were ana-lyzed separately because the phloem classes only ap-plied to infested trees. A similar ANOVA model wasused to evaluate variation in adult beetle size attrib-utable to infestations, trees nested within infestations,and beetle sex (sex treated as a fixed effect). Correlationanalyses tested for associations across trees betweenthe average size of emerging beetles and the nitrogenand phosphorus content of phloem from the tree inwhich each developed; these analyses used nitrogenand phosphorus concentrations from the “good brood”phloem class because by definition most emerging bee-tles fed on phloem of this class.
Consumption and ni trogen-use efJiciency
We estimated the consumption of phloem by D. fron-talis larvae by measuring the size of successful larvalgalleries within five trees at each of two natural infes-tations within unthinned loblolly pine stands in theHomochitto National Forest of Mississippi (ntota, =100). We traced the galleries on clear mylar and cal-culated the area of phloem consumed using a videocapture system. Some simpler measurements (with cal-ipers) of D. frontalis gallery size in infestations withinLousiana, East Texas, and Alabama (USA) verified thatthere was no conspicuous variation in gallery sizeamong forests. Virtually every successful D. frontalisgallery is in the range of 3 X 5 mm to 4 X 7 mm (seeFig. 1). We also measured the larval galleries of Zpsgrandicollis (3-13 individual galleries from each offour loblolly pine logs encompassing a range of phloemthicknesses). I. grandicollis galleries are long (40-130mm) and narrow (<2 mm), not spherical like those ofD. frontalis. So we measured initial and final gallerywidths with digital calipers, measured the lengths witha digital planimeter after tracing the galleries on clearmylar, and estimated gallery size as the area of a trap-ezoid of these dimensions. For both species the massof consumed phloem was calculated by multiplying thegallery area by phloem mass per unit area. Our primaryestimate of phloem specific mass was based on two1.25cm* phloem samples collected from each I. gran-dicollis log during early larval development (logs: 29.8? 7.4 mg/cm2 [mean + 1 SD]). Because phloem specific

August 2000 DIETARY NITROGEN FOR BARK BEETLES 2201
FIG. 1. Two patches of inner bark from Pinus tuedu infested with Dendroctonusfrontalis. D.frontaZis had high reproductivesuccess in the patch at left and low success in the patch at right. Darkly stained areas in the the patch at right are peritheciaof the putatively antagonistic symbiotic fungi, Ophiostoma minus. Adult oviposition gallery (aog), successful larval feedingchambers (sfc), and meandering larval galleries (mlg; characteristic of dying larvae) are indicated. Ellipses show patchesrepresentative of the subsamples on which we measured the N and P concentrations of phloem: GB = good brood, NG =no gallery, and BS = bluestain. The remaining class, failed brood, was sampled from microhabitats with meandering larvalgalleries but no bluestain. At the time of our phloem sampling, successful feeding chambers still contained feeding late-instar larvae. In these photos, animals are pupating just out of sight in the outer bark below successful feeding chambers.
mass can vary depending upon tree physiological status(Wilkens et al. 1997), and because we could not mea-sure phloem mass in the same individual trees wherewe measured front&s galleries, we performed sen-sitivity analyses to evaluate the effects of phloem masson estimates of D. frontalis nitrogen budgets. For this,we used phloem measurements from a survey of 11loblolly pine stands that were chosen to span the rangeof growth conditions in our study area (12 trees/stand,8 measurements/tree; M. E? Ayres, unpublished data).
We estimated nitrogen-use efficiency (NUE, per-centage N consumed that is converted to insect tissue)for each beetle species using measurements of adultmass (Mad&, neonate mass (M,,,,,,,), nitrogen concen-tration of adults (Nadult), total consumption (TC) anddietary nitrogen concentration (N,,&:
For I. grundicollis, estimates of M,,,,,, came fromdrying and weighing 4-7 eggs from each of 3-4 ovi-position galleries on each of two logs, and estimatesof Madult and Xdult came from measurements of 3-10adults from each of four logs and two multi-bolt emer-gence traps. For D. frontalis, estimates of M,,,,,, camefrom 5-10 eggs from each of three oviposition galleriesin naturally infested trees, and estimates of Madult camefrom measurements of 446 adults that emerged fromthe bark samples collected for phloem nutrient analyses(lengths were converted to dry mass as Mdr,, = (0.76X length) - 1.45; Clarke et al. 1979). Eq. 1 assumesthat the percentage nitrogen in eggs is similar to thatof adults; this assumption has little consequence be-cause the mass of eggs is so small that they containvery little N regardless of the concentration.
Modeling insect nitrogen budgets
Eq. 1 can be rearranged to show that the minimumtotal consumption required for insect development(TC,,) is a function of adult mass (Ma&, neonate mass(M,,,,,,), adult nitrogen concentration (Nadult), nitrogen-use efficiency (NUE) and dietary N concentration(Ndie,). Given a specified larval development time (T,&,TC,,, can be used to calculate the minimum relativeconsumption rate (RCR, in milligrams of biomass con-sumed per milligram of larva per day) as a function ofminium total consumption (Eq. 2), which itself is afunction of dietary nitrogen given NUE (Eq. 1). Eq. 2follows Gordon (1968) where MexP = mean exponentialmass = @fadult - M,,,,,,,)/ln(M,d,l~M”/Mn,,,,,,). Alternative-ly, if RCR is specified, minimum development time(Tdev, min) can be calculated as a function of minimumtotal consumption (Eq. 3) or dietary nitrogen givenNUE (Eq. 1).
TCminRCR,,, = ~Kxp . Tdev
(2)
T ‘%,ndevmin =
f RCR Lf RCR ‘I’
(3)
Calculations used mean values of adult mass, neo-nate mass, and adult N concentration reported in thisstudy. Larval development time for D. frontalis larvae(egg hatch to pupation) ranges from -17 to 40 d at25°C (Barras 1973, Gagne et al. 1982, Wagner et al.1984) Relative consumption rate and nitrogen-use ef-ficiency have not been measured for D. frontalis larvae,

2 2 0 2 MATTHEW P. IXlr.7.” -m IT -. --.---- JIxology, Vol. Xl, No. b
0.80
Qe5
0 . 6 0
E?.g 0 . 4 0z
30 . 1 2
8g 0 .08
8i f
0 . 0 4
G o o d F a i l e d Blue Nob r o o d b r o o d s t a i n g a l l e r y
PFJW
Infested trees
FIG. 2. Concentrations of nitrogen and phosphorus in fourclasses of phloem within infested trees and within the phloemof healthy uninfested trees. Data are means and 1 SE and arebased on samples of five infested trees and five uninfestedtrees at each of five infestations within the Kisatchie NationalForest in Lousiana, USA. Phloem classes (see Methods: Phlo-em nitrogen and phosphorus) with the same uppercase letterare not significantly different at P < 0.05 (Student-Newman-Keuls post-hoc multiple comparisons).
but, based on measured values for other insects (andtheoretical limits of 0 to 1 for efficiencies), probablyfall within the range of 1.5-3.5 mg.mg-‘d’ for RCR(at 25°C) and 30-90% for NUE (Scriber and Slansky1981, Slansky and Scriber 1985).
Nitrogen concentration of fungi associatedwith D. frontalis
Replicated pure cultures of Entomocorticium, Cer-atocystiopsis ranaculosus, and Ophiostoma minus weregrown in a malt-extract medium (15 g dehydrated maltextract/L distilled water), in a shaking water bath (150rpm), for 14 d at 25°C. The resulting fungal tissue wasisolated by filtration (0.2~pm pore size), lyophilized,and analyzed for nitrogen content.
RESULTS
Nitrogen and phosphorus concentrations of phloem
The N concentration of phloem around successfullydeveloping Dendroctonus frontalis larvae was morethan twice as high as that of the phloem in uninfestedtrees (0.86 + 0.03% vs. 0.40 Z? 0.01% [mean 5 1 SE],respectively, P < 0.0001; Fig. 2). The N concentrationof phloem within infested trees that was associated withfailed D. frontalis brood, bluestain, or no D. frontalisgallery was significantly higher than that of uninfestedtrees but significantly lower than that found in regionsof good brood development (0.69-0.73%; Fig. 2,Phloem class in Table 1). Phosphorus concentrationsin phloem averaged 6-7 fold less than N concentra-tions; the pattern across phloem classes matched thatfor nitrogen (Fig. 2, Table 1). Because D. frontalisattack virtually every pine tree along the advancingfront of an outbreak (Thatcher et al. 1980), differencesin N and P concentrations between infested and un-infested trees were almost certainly due to the intro-duction of microbes rather than to selection by the bee-tles for trees that were already high in phloem nutrients.Indeed, many of the trees included in our sample ofuninfested phloem were subsequently infested by D.frontalis.
Within phloem classes, N concentrations varied con-siderably among trees within sites (Tables 1 and 2: Treewithin infestation site). Among 18 infested trees, theN concentration in phloem with successful broodranged from 0.52 to 1.08%. Variance among trees ac-counted for 76% of the total random variance in N
TABLE 1. Results from ANOVAs of phloem nitrogen and phosphorus concentration, for four phloem classes within loblollypines infested with late-instar Dendroctonus frontalis (see Fig. 2).
Nitrogen (%) Phosphorus (%)
Source of variation d f M S x lo4 F M S x lo6 F
Phloem class 3 2 0 2 9 9.64** 7 2 5 0Infestation site
11.88***4 6 2 7 0 . 8 2 1 1 0 9 2 20.46***
Phloem class X Infestation site 2 1 2 1 0 1.76 610 1.61Tree (Infestation site) 1 3 7 6 3 16.44*** 5 4 2 5.38***Phloem class X Tree (Infestation site) 3 9 1 2 0 2.58*** 3 7 9 3.76***Error 6 3 4 6 1 0 1
Notes: The F-test denominator for Phloem class was M S
for Phloem class X Infestation site, it was MSPhkxrn EIPSS x lnfestatlo” s,te, for Infestation site, it was MS~,~~ unfesla,ron s,t,.,; and
sponding analysis of uninfested trees.)Phloem da% x Tree (Infestatron we). Others were tested over MS,,,,. (Table 2 shows corre-
* P < 0.05; ** P < 0.01; *** P < 0.001.

August 2000 DIETARY NITROGEN FOR BARK BEETLES 2 2 0 3
TABLE 2. Results from ANOVAs of phloem nitrogen and phosphorus concentration in healthy uninfested loblolly pinesadjacent to those infested with Dendrocfonus frontalis (see Fig. 2).
Nitrogen (%) Phosphorus (%)
Source of variation d f MS x lo4 MS x lo6 FInfestation site 4 8 3 1 . 6 1 2 2 1 1 20.22***Tree (Infestation site) 2 0 5 2 7.58*** 1 0 9 2.51*Error 2 5 I 6 6
Note: The F-test denominator for Infestation was ~~~~~~~~~~~~~~~~~~~~ and for Tree, it was MS,,,,,.*P < 0.05; ** P < 0.01; *** P < 0.001.
concentration in infested trees and 60% in uninfestedtrees. The variance in N concentration was dramaticallyhigher among infested trees than uninfested trees (6among trees = 0.196 vs. 0.047% N; F,,,,, = 17.36, P< 0.001). The pattern of N concentrations among phlo-em classes within infested trees remained quite con-stant; although the phloem class X tree interaction wassignificant, it accounted for only 8% of the total randomvariance. There was no significant variation in phloemnitrogen attributable to infestation site (Tables 1 and 2).
In contrast to nitrogen, phloem concentrations ofphosphorus varied markedly among infestation sitesbut relatively little (although still detectable) amongtrees within infestations (Tables 1 and 2). Varianceamong infestation sites accounted for 44% of the totalrandom variance in P concentrations in infested treesand 74% in uninfested trees (6 among infestations =0.0149 and 0.0203% phosphorus, respectively). Vari-ance among trees within infestation sites accounted for11% and 15% of the total random variance in P con-centrations among infested and uninfested trees, re-spectively (Tables 1 and 2). As with N concentrations,the variance in P concentrations among infested treeswas significantly greater than among uninfested trees(6 = 0.0153 vs. 0.0057% phosphorus; F,,,,, = 7.20, P< 0.001). The pattern of P concentrations among phlo-em classes within infested trees remained quite con-stant across infestation sifes and trees within infesta-tions (phloem class X infestation site interaction wasnonsignificant and phloem class X tree interaction, al-though statistically significant, accounted for only 16%of the total random variance). The variance among rep-licate phloem samples within trees (i.e., the error termin Tables 1 and 2) was also low, accounting for only9-19% of the total random variance in N and P con-centrations in infested and uninfested trees.
Concentrations of N and P in phloem seemed to varyindependently of each other across uninfested trees, butwere positively correlated across infested trees (Fig.3). Among infested trees, there was a significant pos-itive correlation between phloem nitrogen and phos-phorus for all phloem classes except those without anyD. frontalis gallery (Y = 0.58, 0.58, and 0.62 for goodbrood, poor brood, and bluestain, respectively; r = 0.25for no gallery).
Beetle size and phloem nutrition
Beetle size varied among trees within infestations(F ,8,400 = 6.77, P < O.OOOl), and infested trees withhigher N concentrations tended to produce larger bee-tles of both sexes (Fig. 4). Given the relationship be-tween female adult size and fecundity (Clarke et al.1979), the range in beetle size among trees translatesinto an 18% difference in fecundity (152 vs. 180 eggs/female at 0.5% vs. 1.1% N, respectively). Beetle sizedid not vary between sexes (F,,, = 5.39, P = 0.081)or among infestation sites (F4,,8 = 2.49, P = 0.080).Phosphorus concentration was weakly related to malesize (r* = 0.25, P = 0.035) and unrelated to femalesize (r* = 0.15, P = 0.12). Multiple regressions thatincluded both N and P did not provide a better fit thanmodels that included only N.
N and P concentrations of bark beetles
The nitrogen content of Dendroctonus frontalisadults averaged 11.53 2 0.13% (mean 2 1 SE; n = 45individuals), which is 13.4-fold higher than the con-centration of phloem in regions of successful brood.The phosphorus content of D. frontalis adults averaged0.749 +- 0.058% (n = 17 individuals), which is -5.8-
$j 0.605 I
0 . 0 8 0 . 1 2 0 . 1 6Phloem P concentration (% dry mass)
FIG. 3. Correlation between concentrations of nitrogenand phosphorus in the phloem of loblolly pine. Solid circlesrepresent phloem samples from within infested trees that wereassociated with successful development of southern pine bee-tle brood; open circles represent healthy uninfested trees.Each symbol represents one tree.

2204 MATTHEW P. AYRES ET AL. Ecology, Vol. 81, No. 8
(uz 3.0-
00
2 -1600
i
, . * I , , ,0 . 5 0 . 7 0 . 9 1 . 1
Phloem N (% dry mass)
FIG. 4. Relationships between phloem nitrogen and theaverage size of emerging beetles in 18 naturally infested lob-1011~ pines. For females, length = 2.89 + 0.35 X N (P =0.048, rz = 0.22); for males, length = 2.92 + 0.26 X N (P= 0.020, r* = 0.29). The right-hand axis shows the expectedfecundity (number of eggs per female) for southern pine bee-tle adults as a function of size (eggs = 140 X length - 277;after Clarke et al. [1979]).
fold higher than the concentration of phloem in regionsof successful brood. Males and females did not differin their concentrations of N or P (P > 0.19). D.frontalislarvae had significantly lower concentrations of N thanadults (8.13 + 0.35% N [mean 2 1 SE], t59 = 3.40, P< O.OOOl), but similar concentrations of P (0.672 ?0.026% P, t,, = 0.62, P = 0.54). The increase in Nconcentration from larvae to adults was due to decreas-es in total dry biomass (with no change in total Ncontent) during developmental processes followingadult eclosion (Fig. 5). Pupae, callow adults, and ma-ture adults (2-4 d after eclosion) all contained an av-erage of - 105 pg of N, but the total biomass decreasedfrom an average of 1.3 mg in pupae and callow adultsto 0.96 mg two days after eclosion (N concentration:7.8 ? 0.2% N [mean If: 1 SE] for pupae, 8.2 ? 0.3%N for callow adults, 11.7 2 0.4% N for adult at 2 d,and 13.4 ? 0.3% N for adults at 4 d). This develop-mental change (also reported by Barras and Hodges[1974]) does not affect the nitrogen-budget model solow as Adult and Adult in Eq. 1 were measured on thesame developmental stage (the numerator of Eq. 1equals -105 kg N in any case). Our N budgets werebased on 2-d-old adults, which were estimated to be11.49 2 0.13% N in one sample (biomass: 0.93 ? 0.05mg) and 11.67 2 0.46% N in another sample (biomass:0.95 ? 0.07 mg). These measurements indicate that theouter bark through which prepupae and adults borebefore emergence is nutritionally inert. The N concen-tration of 2-d-old adult Ips. grandicollis was 8.61 20.27% N, significantly less than that of D. frontalis (tT2= 10.81, P < 0.0001 for comparison between species).
Nitrogen concentrat ion o f fungiNitrogen concentrations of fungi were 8.7-l 1.6 fold
higher than that of uncolonized phloem and the N con-
centration of Entomocorticium was significantly higherthan that of the other two species: 4.62 + 0.07% N,3.86 t 0.23% N, and 3.55 ? 0.07% N (mean -C 1 SE)for Entomocorticium, Ceratocystiopsis ranaculosus,and Ophiostoma minus, respectively (F2,9 = 21.95, P= 0.0006).
N and P budgetsAlthough D. frontalis adults were larger than I. gran-
dicollis adults, D. front&s larvae appeared to acquiretheir mass by consuming only 21% as much phloem asZ. grandicollis (5.7 vs. 27.4 mg; Table 3). Analysis ofnitrogen budgets indicated that I. grandicollis could meettheir physiological demands with a realistic nitrogen-useefficiency of 46% (Table 3). The requisite consumptionrate for I. grandicollis to complete development in 25-35 d is 3.5-4.0 mg biomass(mg larva))‘dl (Fig. 6). Thisconsumption rate is in the upper range of those reportedfor insects (Scriber and Slansky 1981, Slansky and Scriber1985) and this development time is somewhat longer thanthe 20-30 d that appeared to be required for our colony,but in general it seems easy to reconcile the N budgetsof I. grandicollis with an empirically and physiologicallyreasonable parameterization of Eqs. l-3.
In contrast, the nitrogen budgets of D.frontulis couldnot be immediately reconciled (note impossible nitro-gen-use efficiency in Table 3; see also analyses ofMishra et al. [ 19851 for a cerambycid beetle). D. fron-t&is larvae appeared to accumulate over twice as muchnitrogen as was present in the phloem that they con-sumed from their feeding chamber (NUE = 216%, Ta-ble 3). Because a nitrogen-use efficiency >lOO% i simpossible, one or more of the estimates used in ourinitial parameterization of Eq. 1 must be incorrect. IfNUE is 80%, D. frontalis N budgets could be explainedif the actual dietary nitrogen content is 1.5-2.0% (vs.estimate of 0.86%) and the actual total consumption is8.8-6.6 mg (vs. estimate of 5.7 mg). This scenario is
1407 0
0 . 4 0 . 6 0 . 8 1 . 0 1 . 2 1 . 4 1 . 6 1 . 8T o t a l dry b i o m a s s ( m g )
FIG. 5. N i t r o g e n c o n t e n t o f Dendroctonus frontal is at d i f -ferent developmental stages following the cessation of larvalfeeding. Total dry mass decreased following adult eclosion,but total N content remained quite constant at 80-120 p,g.

August 2000 DIETARY NITROGEN FOR BARK BEETLES 2205
TABLE 3. Estimated consumption and nitrogen-use efficiency (and values used in the estimates) for larvae of Dendroctonusfrontalis and Ips grandicollis.
Variable
D. fronta1i.s 1. grandicollis
Mean 1 SE n Mean 1 SE n
Egg mass (w) 0.015 0.001 1 0 0.018 0.001 31Adult mass (mg) 0 . 9 3 0 . 0 5 4 4 6 0 . 7 8 0 . 0 9 3 5Adult N content (%) 11.56 0.13 4 5 8 . 6 1 0 . 2 7 2 9Adult N content (kg) 107 6 7Area of feeding gallery (mm*)? 1 9 . 1 1.1 1 0 9 2 . 8 1 3 . 5 4Specific mass of phloem (mg/cm2)t 2 9 . 8 2 9 . 8 3 . 9 4Mass of consumed phloem (mg)t 5 . 7 2 7 . 4 5 . 0 4Relative consumption (mg/mg)$ 6 . 2 3 5 . 9Nitrogen in consumed phloem (%)t 0 . 8 6 0 . 0 3 2 5 0 . 5 2 0 . 0 3 2 6Nitrogen in consumed phloem (pg) 142Nitrogen-use efficiency, NUE (%)§ 2;: 4 6
t n = number of trees (based on 5-10 replicate measurements per tree).$ Consumed phloem mass/(adult mass - egg mass).5 Calculated from Eq. 1. Note that the estimated NUE for I. grandicollis is reasonable, but that of D. frontalis is impossibly
high.
H 6
I p s g r a n d i c o l l i s
0 . 5 1 . 0 1 . 5 2 . 0N c o n t e n t o f d i e t (% d ry mass )
FIG. 6. Theoretical combinations of nitrogen-use effi-ciency (NUE), relative consumption rate (RCR), and devel-opment time that could allow successful development of Ipsgrundicollis larvae on diets with a range of nitrogen concen-trations. Minimum consumption rates (top panel) were cal-culated from Eq. 2 assuming a larval development time of30 d. Minimum development times (bottom panel) were cal-culated from Eq. 3 assuming NUE of 40%. Shaded ellipsesindicate the realized parameter space for successful I. gran-dicollis larvae.
consistent with the hypothesis that D. frontalis feedextensively on fungal hyphae that grow within the feed-ing chamber and that import biomais and N into thefeeding chamber. Any realistic budgets also requirehigher NUE for D. frontalis than the 46% estimatedfor I. grandicollis. The N budgets for D. frontalis can-not be reconciled by any realistic adjustments of phlo-em specific mass. Even if phloem mass was 45 mg/cm*, which is 50% higher than our best estimate, and15% higher than the maximum from a survey of 11stands, the calculated nitrogen-use efficiency is still143%. We could not identify any plausible N budgetsfor D. frontalis that do not require higher dietary ni-trogen content and bigher biomass consumption thanthe estimates in Table 3.
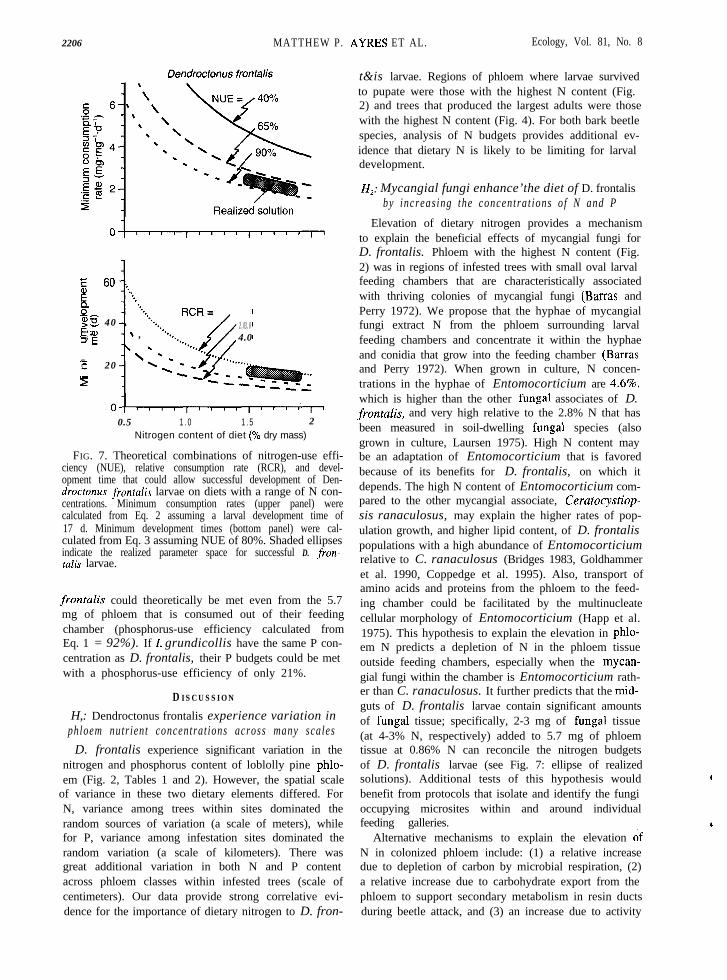
What are the consequences of variation in dietarynitrogen for bark beetle larvae? If consumption rateand NUE are held to some constant upper limit (asexpected if larvae are routinely consuming and assim-ilating at their physiological limits; Ayres and Mac-Lean 1987), then larvae would be forced to compensatefor reduced dietary N with increased larval develop-ment time (Figs. 6 and 7, lower panels). For example,if the dietary nitrogen of I. grandicollis is 0.8% N inone tree vs. 0.5% N in another tree, then the minimumdevelopment time increases from 23.8 to 38.1 d (withNUE = 46% and RCR = 3.7 mg.mg-‘&I; Fig. 6, lowerpanel). If the dietary nitrogen of D. frontalis larvaedecreases from 1.5% to 0.5% (e.g., due to the absenceof mycangial fungi) the minimum development timeincreases from 19.9 to 59.6 d (with NUE = 80% andRCR = 2.0 mg.mg-l&l; Fig. 7, lower panel).
Similar calculations with phosphorus indicate thatlarvae should easily meet their P requirements with anycombination of consumption rate and developmenttime that allows them to meet their N requirements(because the factor by which insects must concentrateN is 2.3 times greater than the factor by which theymust concentrate P). Phosphorus requirements of D.
2206 MATTHEW P. AYRES ET AL. Ecology, Vol. 81, No. 8
E 60 . .E ‘**.*Et3 s 40$5 ‘= g
E‘E 20.-z i
= . *2 . 0 3 . 0
’ , 4.0
\
0.5 1 . 0 1 . 5 2Nitrogen content of diet (% dry mass)
FIG. 7. Theoretical combinations of nitrogen-use effi-ciency (NUE), relative consumption rate (RCR), and devel-opment time that could allow successful development of Den-droctonus frontalis larvae on diets with a range of N con-centrations. Minimum consumption rates (upper panel) werecalculated from Eq. 2 assuming a larval development time of17 d. Minimum development times (bottom panel) were cal-culated from Eq. 3 assuming NUE of 80%. Shaded ellipsesindicate the realized parameter space for successful D. fron-f&is larvae.
frontalis could theoretically be met even from the 5.7mg of phloem that is consumed out of their feedingchamber (phosphorus-use efficiency calculated fromEq. 1 = 92%). If I. grundicollis have the same P con-centration as D. frontalis, their P budgets could be metwith a phosphorus-use efficiency of only 21%.
D ISCUSSION
H,: Dendroctonus frontalis experience variation inphloem nutrient concentrat ions across many scales
D. frontalis experience significant variation in thenitrogen and phosphorus content of loblolly pine phlo-em (Fig. 2, Tables 1 and 2). However, the spatial scale
of variance in these two dietary elements differed. ForN, variance among trees within sites dominated therandom sources of variation (a scale of meters), whilefor P, variance among infestation sites dominated therandom variation (a scale of kilometers). There wasgreat additional variation in both N and P contentacross phloem classes within infested trees (scale ofcentimeters). Our data provide strong correlative evi-dence for the importance of dietary nitrogen to D. fron-
t&is larvae. Regions of phloem where larvae survivedto pupate were those with the highest N content (Fig.2) and trees that produced the largest adults were thosewith the highest N content (Fig. 4). For both bark beetlespecies, analysis of N budgets provides additional ev-idence that dietary N is likely to be limiting for larvaldevelopment.
H,: Mycangial fungi enhance’the diet of D. frontalisby increas ing the concentrat ions o f N and P
Elevation of dietary nitrogen provides a mechanismto explain the beneficial effects of mycangial fungi forD. frontalis. Phloem with the highest N content (Fig.2) was in regions of infested trees with small oval larvalfeeding chambers that are characteristically associatedwith thriving colonies of mycangial fungi (Barras andPerry 1972). We propose that the hyphae of mycangialfungi extract N from the phloem surrounding larvalfeeding chambers and concentrate it within the hyphaeand conidia that grow into the feeding chamber (Barrasand Perry 1972). When grown in culture, N concen-trations in the hyphae of Entomocorticium are 4.6%,which is higher than the other fungal associates of D.front&is, and very high relative to the 2.8% N that hasbeen measured in soil-dwelling fungal species (alsogrown in culture, Laursen 1975). High N content maybe an adaptation of Entomocorticium that is favoredbecause of its benefits for D. frontalis, on which itdepends. The high N content of Entomocorticium com-pared to the other mycangial associate, Ceratocystiop-sis ranaculosus, may explain the higher rates of pop-ulation growth, and higher lipid content, of D. frontalispopulations with a high abundance of Entomocorticiumrelative to C. ranaculosus (Bridges 1983, Goldhammeret al. 1990, Coppedge et al. 1995). Also, transport ofamino acids and proteins from the phloem to the feed-ing chamber could be facilitated by the multinucleatecellular morphology of Entomocorticium (Happ et al.1975). This hypothesis to explain the elevation in phlo-em N predicts a depletion of N in the phloem tissueoutside feeding chambers, especially when the mycan-gial fungi within the chamber is Entomocorticium rath-er than C. ranaculosus. It further predicts that the mid-guts of D. frontalis larvae contain significant amountsof fungal tissue; specifically, 2-3 mg of fungal tissue(at 4-3% N, respectively) added to 5.7 mg of phloemtissue at 0.86% N can reconcile the nitrogen budgetsof D. frontalis larvae (see Fig. 7: ellipse of realizedsolutions). Additional tests of this hypothesis wouldbenefit from protocols that isolate and identify the fungioccupying microsites within and around individualfeeding galleries.
Alternative mechanisms to explain the elevation ofN in colonized phloem include: (1) a relative increasedue to depletion of carbon by microbial respiration, (2)a relative increase due to carbohydrate export from thephloem to support secondary metabolism in resin ductsduring beetle attack, and (3) an increase due to activity

August 2000 DIETARY NITROGEN FOR BARK BEETLES 2207
of N-fixing bacteria. Alternative 1 must be true to someextent (Martin 1979) because there is considerable CO,evolution from microbially infested phloem (M. I? Ay-res, unpublished data), but neither it, nor alternative2, can easily explain the differences in N content be-tween phloem infested with mycangial fungi andOphiostoma minus. Alternative 3 has been suggested(Peklo and Satava 1949, Peklo 1968), but discreditedbecause of the very low abundance and metabolic ac-tivity of nitrogen-fixing bacteria associated with D.frontalis (Bridges 1981). Assuming that actual dietaryN is 152.0%, a nitrogen budget model (Eq. 3) withnitrogen-use efficiency (NUE) of 80% and relative con-sumption rate (RCR) of 2.0 mg biomass(mg lar-vae)-r.d-’ accurately predicts that the minimum de-velopment time for D. frontalis larvae in the presenceof mycangial fungi would be -18 d vs. >40 d in theabsence of mycangial fungi (Fig. 7; Barras 1973, Wag-ner et al. 1984).
H3: Ophiostoma minus negatively impacts the larvaldevelopment of D. frontalis
At the scale of our sampling (Fig. l), phloem nitro-gen concentrations were significantly lower in patchescolonized by 0. minus than in patches presumablydominated by mycangial fungi (Fig. 2). This differencein N content (0.86% vs. 0.70% N, respectively) wouldbe enough to increase minimum development time oflarvae from 34.7 d to 42.6 d (with RCR of2.0 mg.mg-‘d’ and NUE of 80%; Fig. 7). There areno apparent concentrations of 0. minus tissue analo-gous to the feeding chambers of D. frontalis. Instead,0. minus appears to be very evenly dispersed withinpatches of - 1 dm* or more. D. front&is larvae feedingin phloem infested with 0. minus create meanderingtunnels (and almost always die) rather than the smallfeeding chamber typical of successful larvae (Fig. 1).Thus the larvae in phloem infested with 0. minus arefeeding at a similar scale to our sampling and the di-etary nitrogen of these larvae is probably close to the0.70% that we measured. If, as we hypothesize, thedietary N in bluestain vs. mycangial feeding sites is0.70 vs. 1.52.0%, then the nutritional benefit of themycangial fungi vs. 0. minus is to more than halvelarval development time from 42.6 d to -20 d (withRCR of 2.0 mg.mg-I&’ and NUE of 80%; Fig. 7). Wecannot reject the hypothesis that 0. minus further im-pedes D. frontalis reproduction by allelopathic effectsof isocoumarins (Hemingway et al. 1977) or other sec-ondary metabolites. However, Yearian et al. (1972)found no negative effects of 0. minus on larvae of Zpsavulsus, I. calligraphus or I. grandicollis. In any case,0. minus appears to be an antagonist of D. frontalis,and the antagonism is strengthened by strong compet-itive inhibition of mycangial fungi by 0. minus (Kle-pzig and Wilkens 1997). Consequently, any factors thatfavor colonization of phloem by 0. minus will have anegative impact on the potential reproduction of D.
frontalis. Factors that might affect 0. minus abundanceand growth include phloem chemistry, temperature,relative humidity, and the abundance of Tarsonemusmites that are phoretic on D. frontalis adults and actas vectors of 0. minus spores (Bridges and Moser 1986,Bridges 1987, Cook and Hain 1987, Lieutier and Yart1989, Paine et al. 1997).
H& Ips grandicollis, which lack mycangial fungi,must consume m&-e phloem to attain the
same mass as D. frontalis
D. frontalis and I. grandicollis employ differentstrategies to meet their nitrogen budgets. I. grandicollisconsumes large quantities of low-N phloem, while D.frontalis modifies the diet by introducing mutualisticfungi and consumes much less of a relatively high-Ndiet. We hypothesize that these two species representalternative nutritional strategies of bark beetles. TheScolytidae includes -6000 species worldwide (1430species in the Nearctic). Based on the morphologicaldiversity of specialized anatomical structures thathouse and nurture fungal associates, close mutualisticrelationships between scolytids and fungi have evolvedat least 6 times (Wood 1982). Genetic studies of thefungal associates also indicate multiple evolutionaryorigins (Cassar and Blackwell 1996). It seems unlikelythat nutritional strategies intermediate to that of D.frontalis and I. grandicollis would be viable becausethe high consumption rates necessary without mycan-gial fungi are incompatible with the small feedingchambers needed to maintain physical associationswith slow-growing mycangial fungi (Klepzig and Wilk-ens 1997). In this case, evolutionary transitions be-tween strategies should be relatively rapid. Estimatesof relative consumption provide one easily obtainedmeasure for comparing the nutritional strategies of spe-cies; I. grandicollis larvae consume -35.9 mg/mgcompared to -6.2 mglmg for D. frontalis (Table 3).We predict that similar measurements of additional spe-cies will reveal a bimodal frequency distribution withthe two peaks corresponding to alternative strategies.Sterilization studies allow a more direct, but technicallychallenging, means to test for effects of microbial as-sociates on bark beetle development and reproduction(Barras 1973, Fox et al. 1992, Colineau and Lieutier1994, Six and Paine 1998).
Population and community consequences ofalternative nutritional strategies
The suite of traits that are correlated with mycangialvs. non-mycangial strategies may have general con-sequences for population dynamics and community in-teractions. For example, we predict that nonmycangialspecies (e.g., I. grundicollis) will generally be moresensitive than mycangial species (e.g., D. frontalis) tovariation among trees in phloem nitrogen (because aunit change in dietary N has the greatest impact onlarval nutrition at low dietary N; Figs. 6 and 7). Thus,

2208 MATTHEW P. AYRES ET AL. Ecology, Vol. 81, No. 8
one effect of mycangial associations may be a damping ACKNOWLEDGMENTS
of ecological effects for the consumer of variation in Bill Mattson generously assisted with the nitrogen andhost plants (Auerbach and Strong 1981). phosphorus analyses. John Reeve provided access to his Ips
While populations of mycangial beetle species might grandicollis. Stan Barras, Bob Bridges, Greg Eaton, Jane
be less sensitive than their non-mycangial counterpartsHayes, Kier Klepzig, Pete Lorio, John Moser, and John Reeve
to exogenous forces, they may be more influenced byparticipated in many useful conversations. Mark Abraham-son, Bruce Ayres, Heather Govenor, K. Klepzig, Frank Slan-
complex endogenous dynamics because they exist sky, Mac Strand, and two anonymous reviewers improved the
within a community matrix that involves numerous manuscript. Research was supported by NRI CGP number
strong interactions and therefore a greater potential for 9835302 and the Southern Global Change Research Programof the U. S. Forest Service.
delayed density dependence (Berryman 1979, Turchin1991, Hanski and Henttonen 1996). In fact, D. frontalispopulations tend to cycle with a period of -8 yearsand an amplitude of -50X, but the cause of the cy-clicity is unknown (Turchin et al. 1991, Reeve et al.1995). We hypothesize that these cycles are producedby delayed density dependence resulting from the pos-itive effect of growing beetle populations on the trans-mission of 0. minus, which has an inverse effect onbeetle population growth because 0. minus outcom-petes the mycangial fungi on which beetles depend tomeet their nitrogen budgets. Similar community inter-actions may be common in mycangial species. At leastit seems that a disproportionate number of the mosteconomically important bark beetle species are my-cangial: e.g., D. ponderosae, D. jeffreyi, D. brevicomis,D. adjunctatus, Ips acuminatus, I. sexdentatus, andScoZytis ventralis (Francke-Grosmann 1963, Barras andPerry 1971, Livingston and Berryman 1972, Paine andBirch 1983, Berryman 1986, Liebhold et al. 1986, Ber-ryman and Ferrell 1988, Raffa 1988, Levieux et al.1991, Six and Paine 1996). In contrast, non-mycangialbeetles exist within a weaker matrix of community in-teractions and should be less likely to experience en-dogenous feedback from the rest of the community(Hochberg and Holt 1990, Wilson et al. 1996).
Mycangial species should generally have higher re-source-use efficiency (which translates into lower rel-ative consumption, Table 3). Bark beetles frequentlyexperience strong intra- and inter-specific competition(Raffa and Berryman 1983, Miller 1984, Flamm et al.1987, Rankin and Borden 1991, Zhang et al. 1992,Schlyter and Anderbrandt 1993, Gara et al. 1995, Reeveet al. 1998). When phloem resources are limiting, andother factors are equal, mycangial species should beable to sustain larger populations than non-mycangialspecies and be favored in interspecific competition (Til-man 1982). Also because of their higher resource-useefficiency, populations of mycangial species may beless likely to experience intense intraspecific compe-tition (larger numbers of beetles could successfullycomplete development in the same tree bole), and there-fore be less likely to experience instantaneous densitydependence and stable population dynamics. Studiesthat characterize the N acquisition strategies of addi-tional bark beetle species will allow tests for the pop-ulation and community consequences of alternative nu-tritional strategies.
LITERATURE CITED
Auerbach, M. J., and D. R. Strong. 1981. Nutritional ecologyof Heliconia herbivores: experiments with plant fertiliza-tion and alternative hosts. Ecological Monographs 51:63-84.
Ayres, M. P., and S. E MacLean, Jr. 1987. Development ofbirch leaves and the growth energetics of Epirrita autum-nata (Geometridae). Ecology 68:558-568.
Barras, S. J. 1970. Antagonism between Dendroctonusfron-tulis and the fungus Cerutocystis minor. Annals of the En-tomological Society of America 63: 1187-l 190.
Barras, S. J. 1973. Reduction of progeny and developmentin the southern pine beetle following removal of symbioticfungi. Canadian Entomologist 105:1295-1299.
Barras, S. J., and J. D. Hodges. 1974. Weight, moisture, andlipid changes during life cycle of the southern pine beetle.USDA Forest Service Research Note SO-178.
Barras, S. J., and T. Perry. 1971. Gland cells and fungi as-sociated with prothoracic mycangium of Dendroctonus ud-junctus (Coleoptera: Scolytidae). Annals of the Entomo-logical Society of America 64:123-126.
Barras, S. J., and T. Perry. 1972. Fungal symbionts in theprothoracic mycangium of Dendroctonus frontalis (Co-leopt.: Scolytidae). Zeitschrift fur angewandte Entomologie71:95-104.
Barras, S. J., and T. J. Perry. 1975. Interrelationships amongmicroorganisms, bark or ambrosia beetles, and woody planttissue: an annotated bibliography, 1965-1974. UnitedStates Department of Agriculture Forest Service, SouthernForest Experiment Station, General Technical Report SO-lo.
Becker, G. 1971. Physiological influences on wood-destroy-ing insects of wood compounds and substances producedby microorganisms. Wood Science and Technology 5:236-246.
Berryman, A. A. 1979. Towards a theory of insect epide-miology. Research on Population Ecology 19: 18 1-196.
Berryman, A. A. 1986. Forest insects: principles and practiceof population management. Plenum, New York, New York,USA.
Berryman, A. A., and G. T. Ferrell. 1988. The fir engraverbeetle in western states. Pages 556-578 in A. A. Berryman,editor. Dynamics of forest insect populations: patterns,causes, and implications. Plenum, New York, New York,USA.
Bridges, J. R. 1981. Nitrogen-fixing bacteria associated withbark beetles. Microbial Ecology 7: 131-137.
’Bridges, J. R. 1983. Mycangial fungi of Dendroctonus fron-tulis (Coleoptera: Scolytidae) and their relationship to bee-tle population trends. Environmental Entomology 12:858-861.
Bridges, J. R. 1985. Relationship of symbiotic fungi to south-ern pine beetle population trends. Pages 127-135 in S. J.Branhan and R. C. Thatcher, editors. Integrated pest man-agement research symposium: the proceedings. UnitedStates Department of Agriculture Forest Service, SouthernForest Experiment Station, General Technical Report SO-56.
Bridges, J. R. 1987. Effects of terpenoid compounds on

August 2000 DIETARY NITROGEN FOR BARK BEETLES 2209
growth of symbiotic fungi associated with the southern pinebeetle. Phytopathology 77:83-85.
Bridges, J. R., and J. C. Moser. 1986. Relationship of phoreticmites (Atari: Tarsonemidae) to the bluestaining fungus,Cerutocystis minor, in trees infested by southern pine beetle(Coleoptera: Scolytidae). Environmental Entomology 15:95 l-953.
Bridges, J. R., W. A. Nettleton, and M. D. Connor. 1985.Southern pine beetle (Coleoptera: Scolytidae) infestationswithout the bluestain fungus, Ceratocystis minor. Journalof Economic Entomology 78:325-327.
Bridges, J. R., and T. J. Perry. 1985. Effects of mycangialfungi on gallery construction and distribution of bluestainin southern pine beetle-infested pine bolts. Journal of En-tomological Science 20:271-275.
Cassar, S., and M. Blackwell. 1996. Convergent origins ofambrosia fungi. Mycologia 88:596-601.
Clancy, K. M. 1992. Response of western spruce budworm(Lepidoptera: Tortricidae) to increased nitrogen in artificialdiets. Environmental Entomology 21:33 l-344.
Clancy, K. M., M. R. Wagner, and R. W. Tinus. 1988. Var-iation in host foliage nutrient concentrations in relation towestern spruce budworm herbivory. Canadian Journal ofForest Research 18:530-544.
Clarke, A. L., J. W. Webb, and R. T. Franklin. 1979. Fecundityof the southern pine beetle in laboratory pine bolts. Annalsof the Entomological Society of America 72:229-321.
Colineau, B., and E Lieutier. 1994. Production of Ophios-toma-free adults of Ips sexdentatus Boern. (Coleoptera:Scolytidae) and comparison with naturally contaminatedadults. Canadian Entomologist 126: 103-l 10.
Cook, S. P., and E F? Hain. 1987. Four parameters of thewound response of loblolly and shortleaf pines to inocu-lation with the blue-staining fungus associated with thesouthern pine beetle. Canadian Journal of Botany 65:2403-2409.
Coppedge, B. R., E M. Stephen, and G. W. Felton. 1995.Variation in female southern pine beetle size and lipid con-tent in relation to fungal associates. Canadian Entomologist127:145-154.
Flamm, R. O., T. L. Wagner, S. P. Cook, P. E. Pulley, R. N.Coulson, and T. M. McArdles. 1987. Host colonization bycohabiting Dendroctonus frontalis, Ips avulsus, and I. cal-ligruphus (Coleoptera: Scolytidae). Environmental Ento-mology 16:390-399.
Forcella, E 1981. Twig nitrogen content and larval survivalof twig girdling beetles Oncideres cingulata (Coleoptera:Cerambycidae). Coleopterists Bulletin 35:21 l-212.
Fox, J. W., D. L. Wood, R. P Akers, and J. R. Parmeter. 1992.Survival and development of Ips paraconfusus Lanier (Co-leoptera, Scolytidae) reared axenically and with tree-path-ogenic fungi vectored by cohabiting Dendroctonus species.Canadian Entomologist 124: 1157-l 167.
Francke-Grosmann, H. 1963. Some new aspects in forestentomology. Annual Review of Entomology 8:415-438.
Gagne, J. A., T. L. Wagner, P. J. H. Sharpe, R. N. Coulson,and W. S. Fargo. 1982. Reemergence of Dendroctonusfrontalis (Coleoptera: Scolytidae) at constant temperatures.Environmental Entomology 11: 1216-1222.
Gara, R. I., R. A. Werner, M. C. Whitmore, and E. H. Holsten.1995. Arthropod associates of the spruce beetle Dendroc-tonus rufipennis (Kirby) (Col., Scolytidae) in spruce standsof south-central and interior Alaska. Journal of AppliedEntomology 119:585-590.
Goldhammer, D. S., E M. Stephen, and T. D. Paine. 1990.The effect of the fungi Cerutocystis minor (Hedgecock)Hunt, Ceratocystis minor (Hedgecock) Hunt var. barrasiiTaylor, and SJB 122 on reproduction of the southern pinebeetle, Dendroctonus frontal is Zimmerman (Coleoptera:Scolytidae). Canadian Entomologist 122:407-418.
Gordon, G. T. 1968. Quantitative aspects of insect nutrition.American Zoologist 8:131-138.
Hanski, I., and H. Henttonen. 1996. Predation on competingrodent species: a simple explanation of complex patterns.Journal of Animal Ecology 65:220-232.
Happ, G. M., C. M. Happ, and S. J. Barras. 1975. Bark beetle-fungal symbiosis. III. Ultrastructure of conidiogenesis in aSporothrix ectosymbiont of the southern pine beetle. Ca-nadian Journal of Botany 53:2702-27 11.
Hemingway, R. W., G. W. McGraw, and S. J. Barras. 1977.Polyphenols in Cerutocystis minor infected Pinus taedu:fungal metabolites, phloem and xylem phenols. Journal ofAgricultural and Food Chemistry 25:717-722.
Henry, S. M. 1962. The significance of microorganisms inthe nutrition of insects. Transactions of the New York Acad-emy of Sciences, Series II 24:676-683.
Hochberg, M. E., and R. D. Holt. 1990. The coexistence ofcompeting parasites. I. The role of cross-species infection.American Naturalist 136:5 17-541.
Hodges, J. D., S. J. Barras, and J. K. Mauldin. 1968. Aminoacids in inner bark of loblolly pine, as affected by thesouthern pine beetle and associated microorganisms. Ca-nadian Journal of Botany 46: 1467-1472.
Hodges, J. E., and P. L. Lorio, Jr. 1969. Carbohydrate andnitrogen fractions of the inner bark of loblolly pines undermoisture stress. Canadian Journal of Botany 47: 165 l-1657.
Hsiau, 0. T.-H. 1996. The taxonomy and phylogeny of themycangial fungi from Dendroctonus brevicomis and Den-droctonus front&s (Coleoptera: Scolytidae). Dissertation.Iowa State University, Ames, Iowa, USA.
Klepzig, K. D., and R. T. Wilkens. 1997. Competitive inter-actions among symbiotic fungi of the southern pine beetle.Applied and Environmental Microbiology 63:621-627.
Laursen, G. 1975. Higher fungi in soils of coastal arctictundra communities. Dissertation. Virginia Polytechnic In-stitute and State University, Blacksburg, Virginia, USA.
LCvieux, J., P. Cassier, D. Guillaumin, and A. Roques. 1991.Structures implicated in the transportation of pathogenicfungi by the European bark beetle Ips sexdentutus Boerner:ultrastructure of a mycangium. Canadian Entomologist1231245-254.
Lewinsohn, D., E. Lewinsohn, C. L. Bertagnolli, and A. D.Patridge. 1994. Blue-stain fungi and their transport struc-tures on the Douglas fir beetle. Canadian Journal of ForestResearch 24:2275-2283.
Liebhold, A. M., P Berck, N. A. Williams, and D. L. Wood.1986. Estimating and valuing western pine beetle Den-droctonus brevicomis impacts. Forest Science 32:325-338.
Lieutier, F., and A. Yart. 1989. Temperature preference of thefungi associated with Ips sexdentutus Boern. and Tomicuspiniperda L. Coleoptera Scolytidae. Annales des SciencesForesti&res (Paris) 46:41 l-415.
Livingston, R. L., and A. A. Berryman. 1972. Fungus trans-port structures in the fir engraver, Scolytus ventralis (Co-leoptera: Scolytidae). Canadian Entomologist 104: 1793-1800.
Martin, M. M. 1979. Biochemical implications of insect my-cophagy. Biological Reviews 54:1-21.
Mattson, W. J. 1980. Herbivory in relation to plant nitrogencontent. Annual Review of Ecology and Systematics 11:119-161.
Miller, M. C. 1984. Effect of exclusion of insect associateson ips culligruphus Coleoptera Scolytidae brood emer-gence. Zeitschrift Ftir Angewandte Entomologie 97:298-304.
Mishra, S. C., Sarma l? K. Sen, and R. Singh. 1985. Chemicalchanges in wood during the digestive process in larvae ofHoplocerumbyx spinicornis (Insecta: Coleoptera: Ceram-bycidae). Material und Organismen (Berlin) 20:53-64.
Paine, T. D., and M. C. Birch. 1983. Acquisition and main-
2210 MATTHEW P. AYRES ET AL. Ecology, Vol. 81, No. 8
tenance of mycangial fungi by Dendroctonus brevicomis(Coleoptera Scolytidae). Environmental Entomology 12:1384-1386.
Paine, T. D., K. E Raffa, and T. C. Harrington. 1997. Inter-actions among scolytid bark beetles, their associated fungi,and live host conifers. Annual Review of Entomology 42:179-206.
Peklo, J. 1968. Symbiosis of Azotobacter with insects. Nature158:795-796.
Peklo, J., and J. Satava. 1949. Fixation of free nitrogen bybark beetles. Nature 163:336-337.
Popp, M. P., R. C. Wilkinson, E. J. Jokela, R. B. Harding,and T. W. Phillips. 1989. Effects of slash pine phloemnutrition on the reproductive performance of Ips calligru-phus Coleoptera: Scolytidae. Environmental Entomology18:795-799.
Raffa, K. E 1988. The mountain pine beetle in western NorthAmerica. Pages 506-530 in A. A. Berryman, editor. Dy-namics of forest insect populations: patterns, causes, andimplications. Plenum, New York, New York, USA.
Raffa, K. F., and A. A. Berryman. 1983. The role of hostplant resistance in the colonization behavior and ecologyof bark beetles (Coleoptera: Scolytidae). Ecological Mono-graphs 53~27-49.
Rankin, L. J., and J. H. Borden. 1991. Competitive inter-actions between the mountain pine beetle and the pine en-graver in lodgepole pine. Canadian Journal of Forest Re-search 21:1029-1036.
Reeve, J. R., M. I? Ayres, and l? L. Lorio, Jr. 1995. Hostsuitability, predation, and bark beetle population dynamics.Pages 339-357 in N. Cappuccino and P W. Price, editors.Population dynamics: new approaches and synthesis. Ac-ademic Press, San Diego, California, USA.
Reeve, J. D., D. A. Rhodes, and P. Turchin. 1998. Scramblecompetition in southern pine beetle (Coleoptera: Scolyti-dae). Ecological Entomology 23:433-443.
Robbins, C. T. 1983. Wildlife feeding and nutrition. Aca-demic Press, New York, New York, USA.
Ross, D. W., and H. Solheim. 1997. Pathogenicity to Douglashr of Ophiostoma pseudotsugae and Leptographium abie-tinum, fungi associated with the Douglas fir beetle. Ca-nadian Journal of Forest Research 27:39-43.
Schlyter, E, and 0. Anderbrant. 1993. Competition and nicheseparation between two bark beetles: existence and mech-anisms. Oikos 68:437-447.
Scriber, J. M., and E Slansky, Jr. 1981. The nutritional ecol-ogy of immature insects. Annual Review of Entomology26:183-211.
Six, D. L., and T. D. Paine. 1996. Leptogruphium pyrinumis a mycangial fungus of Dendroctonus adjunctus. Mycol-ogia 88:739-744.
Six, D. L., and T. D. Paine. 1998. Effects of mycangial fungiand host tree species on progeny survival and emergenceof Dendroctonus ponderosae (Coleoptera: Scolytidae). En-vironmental Entomology 27:1393-1401.
Skinner, R. H., and A. C. Cohen. 1994. Phosphorus nutritionand leaf age effects on sweet potato whitefly (Homoptera:Aleyrodidae). Environmental Entomology 23:693-698.
Slansky, E 1993. Nutritional ecology - the fundamentalquest for nutrients. Pages 29-91 in N. E. Stamp and T. M.Casey, editors. Caterpillars. Chapman & Hall, New York,New York, USA.
Slansky, F., Jr., and J. M. Scriber. 1985. Food consumptionand utilization. Pages 87-163 in G. A. Kerkut and L. I.Gilbert, editors. Comprehensive insect physiology, bio-chemistry, and pharmacology. Pergamon, Oxford, UK.
Slansky, F., and G. S. Wheeler. 1992. Caterpillars compen-satory feeding response to diluted nutrients leads to toxicallelochemical dose. Entomologia Experimentalis et Ap-plicata 65:171-186.
Sokal, R. R., and E J. Rohlf. 1981. Biometry. W. H. Freeman& Company, San Francisco, California, USA.
Tabashnik, B. E. 1982. Responses of pest and nonpest Coliasbutterfly larvae to intraspecific variation in leaf nitrogenand water content. Oecologia 55:389-394.
Thatcher, R. C., J. L. Searcy, J. E. Coster, and G. D. Hertel.1980. The southern pine beetle. Technical Bulletin 1631.USDA Forest Service, Combined Forest Pest Research andDevelopment Program, Pineville, Laouisiana, USA.
Tilman, D. 1982. Resource competition and communitystructure. Monographs in population biology. PrincetonUniversity Press, Princeton, New Jersey, USA.
Trier, T. M., and W. J. Mattson. 1997. Needle mining by thespruce budworm provides sustenance in the midst of pri-vation. Oikos 79:241-246.
Turchin, P. 1991. Nonlinear modeling of time series data:limit cycles and chaos in forest insects, voles and epidem-ics. Pages 39-62 in J. A. Logan and E P Hain, editors.Chaos and insect ecology. Virginia Polytechnic Instituteand State University, Blacksburg, Virginia, USA.
Turchin, P., l? L., Lorio, Jr., A. D. Taylor, and R. E Billings.1991. Why do populations of southern nine beetles (Co-leoptera: Scolytihae) fluctuate? Environmental Entomology20:401-409.
Wagner, T. L., J. A. Gagne, P J. H. Sharpe, and R. N. Coulson.1984. A biophysical model of southern pine beetle, Den-droctonusfrontalis Zimmermann (Coleoptera: Scolytidae),development. Ecological Modelling 21: 125-147.
White, T. C. R. 1993. The inadequate environment: nitrogenand the abundance of animals. Springer-Verlag, New York,New York, USA.
Wilkens, R. T., M. P Ayres, l? L. Lorio, Jr., and J. D. Hodges.1997. Environmental effects on pine tree carbon budgetsand resistance to bark beetles. Pages 591-616 in R. A.Mickler and S. Fox, editors. The productivity and sustain-ability of southern forest ecosystems in a changing envi-ronment. Springer-Verlag, New York, New York, USA.
Wilson, H. B., M. I? Hassell. and H. C. J. Godfrav. 1996.Host-parasitoid food webs: dynamics, persistence: and in-vasion. American Naturalist 148:787-806.
Wood, S. L. 1982. The bark beetles and ambrosia beetles ofNorth and Central America (Coleoptera Scolytidae), a tax-onomic monograph. Great Basin Naturalist Memoirs 6: l-1359.
Yang, Y., and A. Joern. 1994. Compensatory feeding in re-sponse to food quality by Melanopus differentiallis. Phys-iological Entomology 19:75-82.
Yearian, W. C., R. J. Gouger, and R. C. Wilkinson. 1972.Effects of the bluestain fungus, Cerutocvstis ios. on de-.velopment of Ips bark beetles in pine bolts. Annals of theEntomological Society of America 65:48 l-487.
Zhang, Q. H., J. A. Byers, and E Schlyter. 1992. Optimalattack density in the larch bark beetle Ips cembrae (Cole-optera Scolytidae). Journal of Applied Ecology 29:672-6 7 8 .
I


