Embed Size (px)
Citation preview
Nitrogen Transformationsin Flowpaths Leading from Soils
to Streams in Amazon Forestand Pasture
Joaquın Chaves,1,2* Christopher Neill,1 Sonja Germer,3 Sergio GouveiaNeto,4 Alex V. Krusche,4 Adriana Castellanos Bonilla,4
and Helmut Elsenbeer3
1The Ecosystems Center, Marine Biological Laboratory, Woods Hole, Massachusetts 02543, USA; 2Department of Ecology
and Evolutionary Biology, Brown University, Providence, Rhode Island 02912, USA; 3Institut fur Geookologie, Universitat Potsdam,Potsdam, Germany; 4Laboratorio de Ecologia Isotopica, CENA – USP, Piracicaba, SP, Brazil
ABSTRACT
The modification of large areas of tropical forest to
agricultural uses has consequences for the move-
ment of inorganic nitrogen (N) from land to water.
Various biogeochemical pathways in soils and
riparian zones can influence the movement and
retention of N within watersheds and affect the
quantity exported in streams. We used the concen-
trations of NO3- and NH4
+ in different hydrological
flowpaths leading from upland soils to streams to
investigate inorganic N transformations in adjacent
watersheds containing tropical forest and estab-
lished cattle pasture in the southwestern Brazilian
Amazon Basin. High NO3- concentrations in forest
soil solution relative to groundwater indicated a
large removal of N mostly as NO3- in flowpaths
leading from soil to groundwater. Forest ground-
water NO3- concentrations were lower than in other
Amazon sites where riparian zones have been
implicated as important N sinks. Based on water
budgets for these watersheds, we estimated that 7.3–
10.3 kg N ha-1 y-1 was removed from flowpaths
between 20 and 100 cm, and 7.1–10.2 kg N ha-1 y-1
was removed below 100 cm and the top of the
groundwater. N removal from vertical flowpaths in
forest exceeded previously measured N2O emissions
of 3.0 kg N ha-1 y-1 and estimated emissions of NO
of 1.4 kg N ha-1 y-1. Potential fates for this large
amount of nitrate removal in forest soils include
plant uptake, denitrification, and abiotic N reten-
tion. Conversion to pasture shifted the system from
dominance by processes producing and consuming
NO3- to one dominated by NH4
+, presumably the
product of lower rates of net N mineralization and
net nitrification in pasture compared with forest. In
pasture, no hydrological flowpaths contained sub-
stantial amounts of NO3- and estimated N removal
from soil vertical flowpaths was 0.2 kg N ha-1 y-1
below the depth of 100 cm. This contrasts with the
extent to which agricultural sources dominate N
inputs to groundwater and stream water in many
temperate regions. This could change, however, if
Received 28 April 2008; accepted 7 July 2009; published online
10 September 2009
Author Contributions: Chaves: Collected and analyzed isotope sam-
ples, constructed ecosystem budgets, and wrote paper. Neill: Designed
study, co-wrote paper. Germer: Instrumented watersheds, collected field
samples, analyzed flowpath chemistry, and contributed to data analyses.
Neto: Instrumented watersheds, collected field samples, ran laboratory
chemistry, and organized flowpath chemistry. Krusche: Assisted with
watershed instrumentation and oversaw laboratory chemistry. Bonilla:
Instrumented watersheds, collected field samples, ran laboratory chem-
istry, and organized flowpath chemistry. Elsenbeer: Co-designed study,
supervised watershed instrumentation, and contributed to paper writing.
*Corresponding author; e-mail: [email protected]
Ecosystems (2009) 12: 961–972DOI: 10.1007/s10021-009-9270-4
� 2009 Springer Science+Business Media, LLC
961
pasture agriculture in the tropics shifts toward
intensive crop cultivation.
Key words: nitrogen; soils; Amazon; forest;
pasture; flowpaths; land use.
INTRODUCTION
Controls on the retention and movement of nitro-
gen (N) within watersheds are important ecosys-
tem variables because N often acts as a regulator of
plant production and thus can affect carbon storage
(Finzi and others 2007) and cycling of other plant
nutrients such as phosphorus (P) (Perring and
others 2008). At the same time, the processes that
control N retention are only partially effective at
compensating for increased anthropogenic N loads
to the terrestrial portions of watersheds, leading to
increasing concentrations of inorganic N in major
rivers of the world (Peierls and others 1991; Goo-
lsby and Battaglin 2001; Boyer and others 2002;
Mulholland and others 2008).
Fertilizer use and anthropogenic releases of N
from fossil fuel burning are growing rapidly in
tropical regions (Matthews 1994; Matson and oth-
ers 1999). Meanwhile, tropical forests are under-
going more rapid rates of conversion to agriculture
than any other biome (Matthews and others 2000;
Achard and others 2002; Fearnside 2005). Under-
standing processes that control N removal in trop-
ical landscapes is important because N in primary
moist tropical forests behaves largely as if vegeta-
tion and soils are N-saturated (Hall and Matson
1999). Foliar N, litterfall fluxes (Vitousek 1984),
and rates of N mineralization and nitrification in
soils are high (Robertson 1989; Neill and others
1997b; Verchot and others 1999). This leads to high
concentrations of NO3- in solution of mineral soil
in tropical forest (Neill and others 2001, 2006;
Markewitz and others 2004). This is consistent with
limitation of plant growth by an element other
than N (likely P in most cases), which allows a
‘‘leakier’’, open soil N cycle (Hall and Matson 1999;
Markewitz and others 2004). In contrast, replace-
ment of forest with pasture lowers rates of soil N
stocks and cycling, NO3- production, and solution
N concentrations on a variety of Amazon soils
(Neill and others 1997b, 2006; Verchot and others
1999; Markewitz and others 2004).
In tropical forest, concentrations of NO3- and
dissolved inorganic N (DIN: NO3- + NH4
+) in small
streams draining seemingly N-saturated forests,
such as those in the lowland Amazon, are low and
typically two orders of magnitude less than con-
centrations in soil solution (Lesack 1993; Williams
and Melack 1997; Neill and others 2001; Markewitz
and others 2004). It has been suggested that high N
removal occurs in flowpaths leading from soils to
streams, primarily by denitrification in saturated
riparian zones (McClain and others 1994; Brandes
and others 1996; Williams and others 1997).
Compared with riparian zones, which occur in
limited areas in watersheds, upland soils dominate
the landscape in terra firme lowland tropical forests
not subjected to seasonal inundation. Because soil
saturation is not required for denitrification, which
can occur in soils where anaerobic microsites exist
(Tiedje and others 1984), upland soil denitrification
losses could also be a significant path for N loss at
the ecosystem level. Multiple sources of evidence
suggest that a large fraction of the N2O emissions
from terra firme tropical forest soils with percentage
water-filled pore space greater than 50% can be
attributed to denitrification (Davidson and others
2000; Neill and others 2005). In tropical montane
forests in Hawaii, comparisons of N isotope mass
balances across a precipitation gradient suggested
that denitrification in soil accounted for 24–53% of
total ecosystem N loss (Houlton and others 2006).
We examined the fate of N in forest and pasture
watersheds of the Amazon basin. The Amazon
contains the world’s largest area of contiguous
tropical forest and now experiences steadily high
rates of deforestation and conversion to cattle pas-
ture and other agricultural uses (INPE 2008). In
this study, we examined the concentrations of
NO3- and NH4
+ in soil solution, groundwater, and
different hydrological flowpaths that lead to forest
and pasture stream flow over an entire rainy season
in two adjacent watersheds in the southwestern
Amazon Basin. We also quantified d15N values of
NO3- in each flowpath. We use the results to
estimate ecosystem N fluxes and losses in pathways
from upland soils to small order streams in con-
trasting forest and pasture land covers.
STUDY SITE
Field measurements were carried out at Rancho
Grande (10�18¢ S, 62�52¢ W, 143 m a.s.l.), a cattle
ranch in the Brazilian state of Rondonia, in the
southwestern Amazon Basin (Figure 1). Mean
annual precipitation is 2300 mm with a pro-
nounced dry season of less than 100 mm month-1
from June through August (Zimmermann and
962 J. Chaves and others
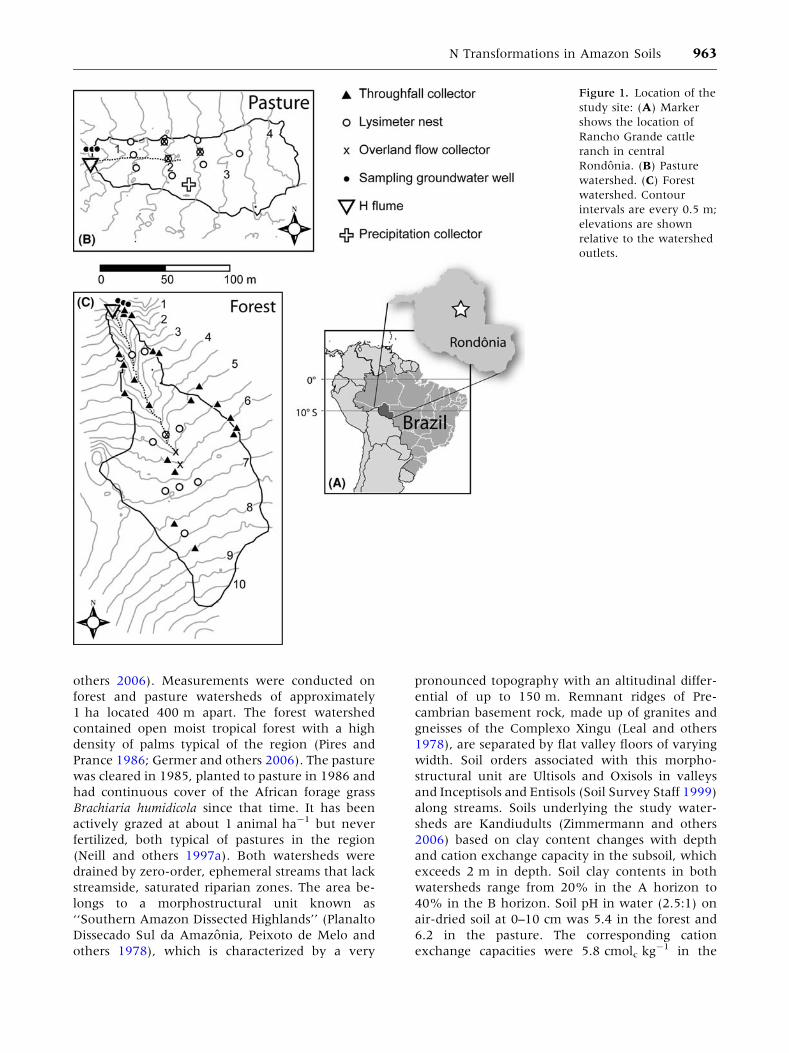
others 2006). Measurements were conducted on
forest and pasture watersheds of approximately
1 ha located 400 m apart. The forest watershed
contained open moist tropical forest with a high
density of palms typical of the region (Pires and
Prance 1986; Germer and others 2006). The pasture
was cleared in 1985, planted to pasture in 1986 and
had continuous cover of the African forage grass
Brachiaria humidicola since that time. It has been
actively grazed at about 1 animal ha-1 but never
fertilized, both typical of pastures in the region
(Neill and others 1997a). Both watersheds were
drained by zero-order, ephemeral streams that lack
streamside, saturated riparian zones. The area be-
longs to a morphostructural unit known as
‘‘Southern Amazon Dissected Highlands’’ (Planalto
Dissecado Sul da Amazonia, Peixoto de Melo and
others 1978), which is characterized by a very
pronounced topography with an altitudinal differ-
ential of up to 150 m. Remnant ridges of Pre-
cambrian basement rock, made up of granites and
gneisses of the Complexo Xingu (Leal and others
1978), are separated by flat valley floors of varying
width. Soil orders associated with this morpho-
structural unit are Ultisols and Oxisols in valleys
and Inceptisols and Entisols (Soil Survey Staff 1999)
along streams. Soils underlying the study water-
sheds are Kandiudults (Zimmermann and others
2006) based on clay content changes with depth
and cation exchange capacity in the subsoil, which
exceeds 2 m in depth. Soil clay contents in both
watersheds range from 20% in the A horizon to
40% in the B horizon. Soil pH in water (2.5:1) on
air-dried soil at 0–10 cm was 5.4 in the forest and
6.2 in the pasture. The corresponding cation
exchange capacities were 5.8 cmolc kg-1 in the
Figure 1. Location of the
study site: (A) Marker
shows the location of
Rancho Grande cattle
ranch in central
Rondonia. (B) Pasture
watershed. (C) Forest
watershed. Contour
intervals are every 0.5 m;
elevations are shown
relative to the watershed
outlets.
N Transformations in Amazon Soils 963
forest and 3.8 cmolc kg-1 in the pasture (Neill and
others 1997a). The stocks of N in pasture soils are
reduced by approximately 50% compared with the
adjacent forest (Neill and others 1997a).
We chose these watersheds after an extensive
survey of many potential sites. They are closely
matched in geomorphology, soil characteristics, and
elevation and are representative of the soils and
vegetation of Rondonia. Our earlier surveys of soil
hydraulic properties indicated that infiltration rates
were significantly lower in pasture, where average
rates were 13 times lower than those in forest, and
that infiltration rates decrease considerably at soil
depths of 12.5–20 cm where an impeding layer
occurs regardless of land cover (Zimmermann and
others 2006). Permeability at a depth of 20 cm is as
much as two orders of magnitude lower than infil-
trability (Zimmermann and others 2006). This leads
to a 20-fold increase in pasture streamflow relative
to forest streamflow (Chaves and others 2008;
Germer and others 2009).
MATERIALS AND METHODS
Water Balance
Hydrological measurements were made in both
watersheds from the end of the dry season in August
2004 through July 2005. A tipping bucket rain gauge
(Hydrological Services P/L, Liverpool, Australia) and
a Campbell logger installed in the pasture recorded
rainfall intensity. Forest throughfall quantities were
measured after each rain event at 20 trough collec-
tors installed 1 m above the ground distributed
throughout the watershed (Figure 1) and forest
stream flow was measured from the same events
from January to March 2005 (Germer and others
2006). Rainfall quantities were measured in two
trough collectors in the pasture watershed. Stream
flow was calculated from stage height measured
continually for the duration of the study with 50 cm
water level loggers (TruTrack, Christchurch, New
Zealand) at H-flumes (30.5 cm) at the outlet of each
watershed.
Estimated ranges for evapotranspiration (ET)
from dry to wet years for the forest and pasture
central Rondonia sites, Reserva Jaru (1387–
1629 mm y-1) and Nossa Senhora Ranch (1024–
1419 mm y-1), respectively, were derived from
Kabat and others (1997). Reserva Jaru is 100 km
northwest of Rancho Grande, and Nossa Senhora is
160 km southeast. Both lie in a zone of similar
annual rainfall. During the year of our study,
rainfall at our site was close to the 18-year average,
which should make the range of ET values appro-
priate for our computations. Groundwater recharge
ranges were calculated by difference from the other
components of the water balance measured in each
watershed and the range of ET values for each land
use type.
Hydrochemistry
We sampled a subset of the precipitation events
that generated runoff in the forest (22 events) and
pasture (27 events) watersheds for chemical anal-
yses. Precipitation during those sampled events
accounted for approximately 30% of the total
precipitation recorded during the study. Rainfall
and throughfall samples were collected after each
event into 20 l acid-washed polyethylene contain-
ers (Germer and others 2006). Overland flow
samplers (Kirkby and others 1976) were placed at
three locations in each watershed. Stream water
was collected at the outlet of each watershed from
the H-flumes using automatic water samplers
(ISCO, Lincoln, Nebraska, USA). Rain, throughfall,
overland flow, and stream water samples were
recovered no later than 2 h after each event, or
alternatively the next morning for events that
ended after 9 pm (Germer and others 2007).
Samples of up to 1 l were transferred into poly-
ethylene acid-washed bottles and returned to the
field laboratory and stored on ice in coolers.
Samples of soil solution from the vadose zone,
above and below the texture break at the top of the
B horizon (20, 100 cm), were taken every 10 days
from tension lysimeters installed at the 10 instru-
ment nests in each watershed (Figure 1). Ground-
water was sampled once weekly from three wells in
each watershed. Wells were 4–6 m deep, 5 m apart,
and approximately 10 m from the outlet of each
watershed. Each well was bailed 10 times
(2.5 times well volume) and let recharge before
each sample was taken. Soil and groundwater
samples were handled and stored in the field as
those for event water samples.
Once in the field laboratory all samples were
filtered through Whatman GF/F filters (0.7 lm
pore size), preserved with approximately 5 mg of
thymol and stored frozen in 60 ml acid-washed
polyethylene bottles. Samples were then packed in
Styrofoam coolers and shipped to Centro de Ener-
gia Nuclear na Agricultura (CENA), at the Univer-
sity of Sao Paulo, in Piracicaba, SP, where they
arrived still partially frozen. Once received, the
samples were stored frozen until chemical analyses.
Samples for 15NO3- isotopic analyses were col-
lected during the second half of the rainy season,
from January to April. The timing, choice, and
964 J. Chaves and others
amount of these samples depended on adequate
sample volumes and simultaneous sampling of
flowpath chemistry. Precipitation was sampled
from a rain event on February 23. Samples of
throughfall were obtained from eight collectors
during a rain event on February 17 and pooled into
four composite samples. Groundwater samples
were taken from each of the three wells at each
watershed on January 20 and processed individu-
ally. Samples of soil solution were collected from all
the lysimeters on February 26 and pooled into
composite samples; one sample from each soil
depth from each watershed, for a total of four
samples. Forest stream flow was collected on Feb-
ruary 9; the 15 samples collected by the ISCO
sampler on that flow event were pooled into seven,
consecutive two-sample composites plus an addi-
tional individual sample. Pasture stream flow was
obtained on January 29 from 21 ISCO sampler
bottles; samples were pooled into seven consecu-
tive three-sample composites, one sample was lost
to breakage. Four individual samples of forest
overland flow were collected during rain events on
February 19 and 21. Pasture overland flow samples
(2) were collected on February 23.
Laboratory Analyses
Concentrations of NO3- and NH4
+ were deter-
mined by ion chromatography (Dionex DX-500).
Stable isotope analyses of 15NO3- were carried out
in 1- to 4-l samples by raising the pH to eliminate
NH4+, subsequent reduction of NO3
- to NH4+ by
addition of Devarda’s Alloy, and diffusion of NH4+
onto acidified filters using the method of Sigman
and others (1997). Sample processing and diffu-
sions were carried out at the field laboratory. Iso-
topic ratios of the samples diffused onto the
acidified filters were measured on a Finnigan Delta
S continuous flow mass spectrometer at CENA.
Data Analysis
We used analysis of variance (ANOVA) to test for
differences in NO3- and NH4
+ concentrations be-
tween watersheds and among flowpaths. Data were
averaged by rain event or sampling date for each
flowpath and watershed, so that the mean of each
event or sampling date for each flowpath consti-
tuted a separate sample. Data were log-transformed
to minimize departures from normality. To test
differences between watersheds, we performed a
two-way factorial ANOVA with watershed and
flowpath as factors. To compare equivalent flow-
paths between watersheds, we excluded rain and
throughfall data from this analysis because
throughfall is exclusive to forest, and rain is com-
mon to both watersheds. Rain and throughfall data
were included separately in analyses to test for
differences among flowpaths within watersheds
using independent one-way ANOVAs for each
watershed; rain and throughfall data were included
in the forest analysis, and rain in the pasture
analysis. Further differences among flowpaths were
evaluated with Tukey’s HSD post hoc tests (Craw-
ley 2002). Differences in d15NO3- between water-
sheds were evaluated with Student’s t-test on data
averaged by flowpath; rain and throughfall data
were excluded as well for this analysis. Differences
in d15NO3- among flowpaths with sufficient sam-
ple numbers were also evaluated using t-tests. All
statistical analyses were carried out using the lan-
guage for statistical computing R version 2.3.1 (R
Development Core Team 2006).
We used the water budget, throughfall from Ger-
mer and others (2007), ranges of groundwater re-
charge, and the changes in median concentrations of
NO3- and NH4
+ from soil solution at 20–100 cm and
groundwater to estimate ecosystem N fluxes in forest
and pasture ecosystems. N losses from flowpaths
were calculated as the differences in fluxes between
flowpaths or soils depths. We assumed no intercep-
tion and change in throughfall chemistry in pasture.
The uncertainty in the N flux estimates was provided
by the uncertainty introduced in the groundwater
recharge by the range of ET values for both land uses.
N fluxes in surface runoff were calculated from the
concentrations of NO3- and NH4
+ in stream flow and
stream water discharge.
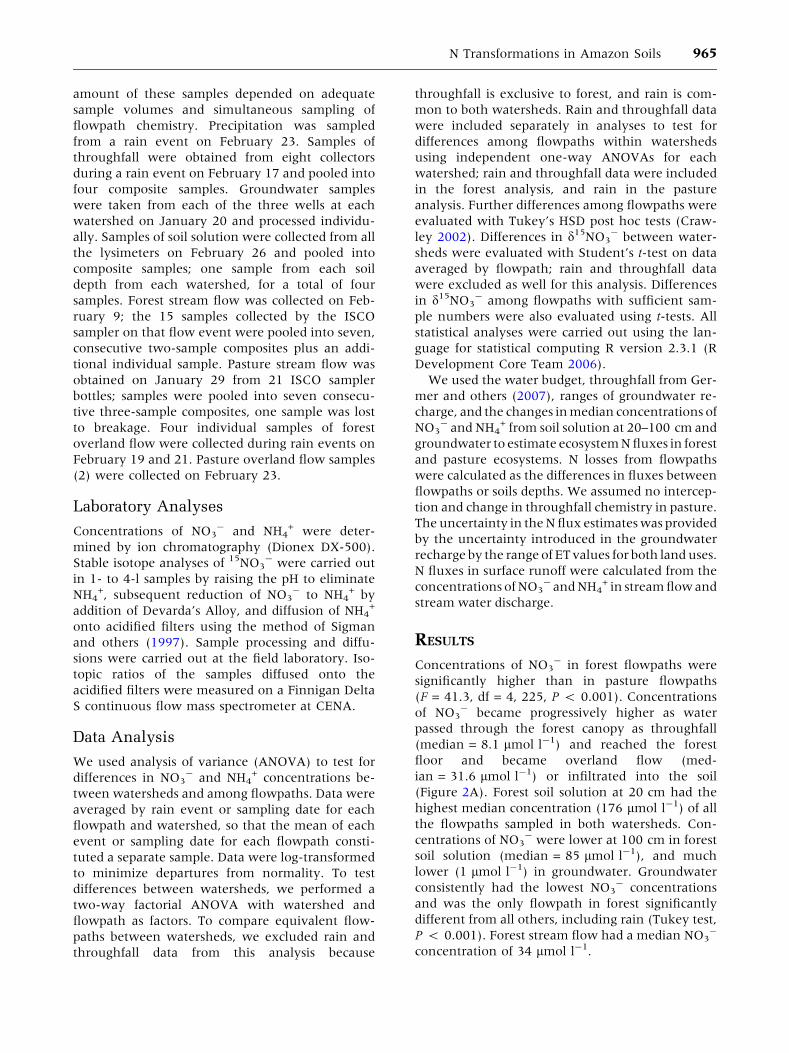
RESULTS
Concentrations of NO3- in forest flowpaths were
significantly higher than in pasture flowpaths
(F = 41.3, df = 4, 225, P < 0.001). Concentrations
of NO3- became progressively higher as water
passed through the forest canopy as throughfall
(median = 8.1 lmol l-1) and reached the forest
floor and became overland flow (med-
ian = 31.6 lmol l-1) or infiltrated into the soil
(Figure 2A). Forest soil solution at 20 cm had the
highest median concentration (176 lmol l-1) of all
the flowpaths sampled in both watersheds. Con-
centrations of NO3- were lower at 100 cm in forest
soil solution (median = 85 lmol l-1), and much
lower (1 lmol l-1) in groundwater. Groundwater
consistently had the lowest NO3- concentrations
and was the only flowpath in forest significantly
different from all others, including rain (Tukey test,
P < 0.001). Forest stream flow had a median NO3-
concentration of 34 lmol l-1.
N Transformations in Amazon Soils 965
All flowpaths and stream flow in pasture had
median NO3- concentrations of 1 lmol l-1 or
lower (Figure 2A). With the exception of ground-
water, which also had the lowest NO3- values
(median = 0.2 lmol l-1) among flowpaths, con-
centrations of NO3- in pasture flowpaths were
indistinguishable from each other or precipitation
(Tukey test, P > 0.05).
Although mean NH4+ concentrations were
higher in forest flowpaths, they were not statisti-
cally different from those in pasture (F = 1.25, df =
4, 207, P > 0.05). Median NH4+ concentrations
ranged between 1 and 12.5 lmol l-1 (Figure 2B).
The highest NH4+ concentrations were generally in
precipitation and throughfall and the lowest con-
centrations were in groundwater regardless of
landcover (Figure 2B). Groundwater NH4+ was in
all cases significantly lower than other flowpaths
(Tukey test, P < 0.05).
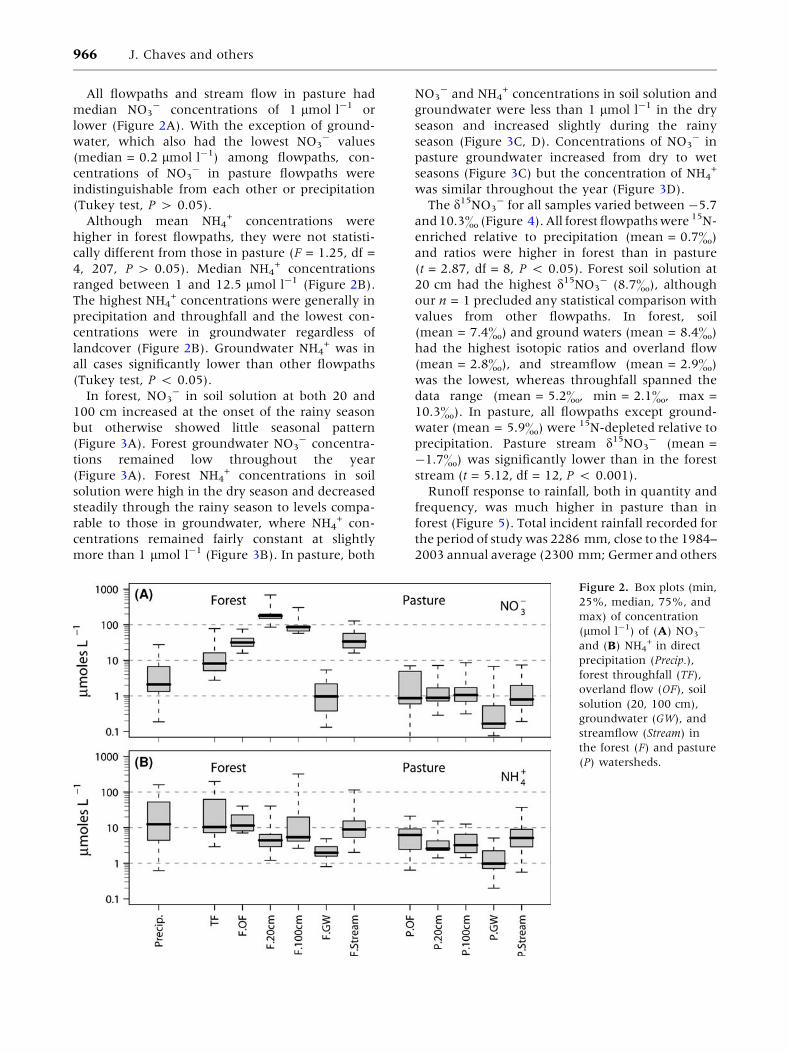
In forest, NO3- in soil solution at both 20 and
100 cm increased at the onset of the rainy season
but otherwise showed little seasonal pattern
(Figure 3A). Forest groundwater NO3- concentra-
tions remained low throughout the year
(Figure 3A). Forest NH4+ concentrations in soil
solution were high in the dry season and decreased
steadily through the rainy season to levels compa-
rable to those in groundwater, where NH4+ con-
centrations remained fairly constant at slightly
more than 1 lmol l-1 (Figure 3B). In pasture, both
NO3- and NH4
+ concentrations in soil solution and
groundwater were less than 1 lmol l-1 in the dry
season and increased slightly during the rainy
season (Figure 3C, D). Concentrations of NO3- in
pasture groundwater increased from dry to wet
seasons (Figure 3C) but the concentration of NH4+
was similar throughout the year (Figure 3D).
The d15NO3- for all samples varied between -5.7
and 10.3& (Figure 4). All forest flowpaths were 15N-
enriched relative to precipitation (mean = 0.7&)
and ratios were higher in forest than in pasture
(t = 2.87, df = 8, P < 0.05). Forest soil solution at
20 cm had the highest d15NO3- (8.7&), although
our n = 1 precluded any statistical comparison with
values from other flowpaths. In forest, soil
(mean = 7.4&) and ground waters (mean = 8.4&)
had the highest isotopic ratios and overland flow
(mean = 2.8&), and streamflow (mean = 2.9&)
was the lowest, whereas throughfall spanned the
data range (mean = 5.2&, min = 2.1&, max =
10.3&). In pasture, all flowpaths except ground-
water (mean = 5.9&) were 15N-depleted relative to
precipitation. Pasture stream d15NO3- (mean =
-1.7&) was significantly lower than in the forest
stream (t = 5.12, df = 12, P < 0.001).
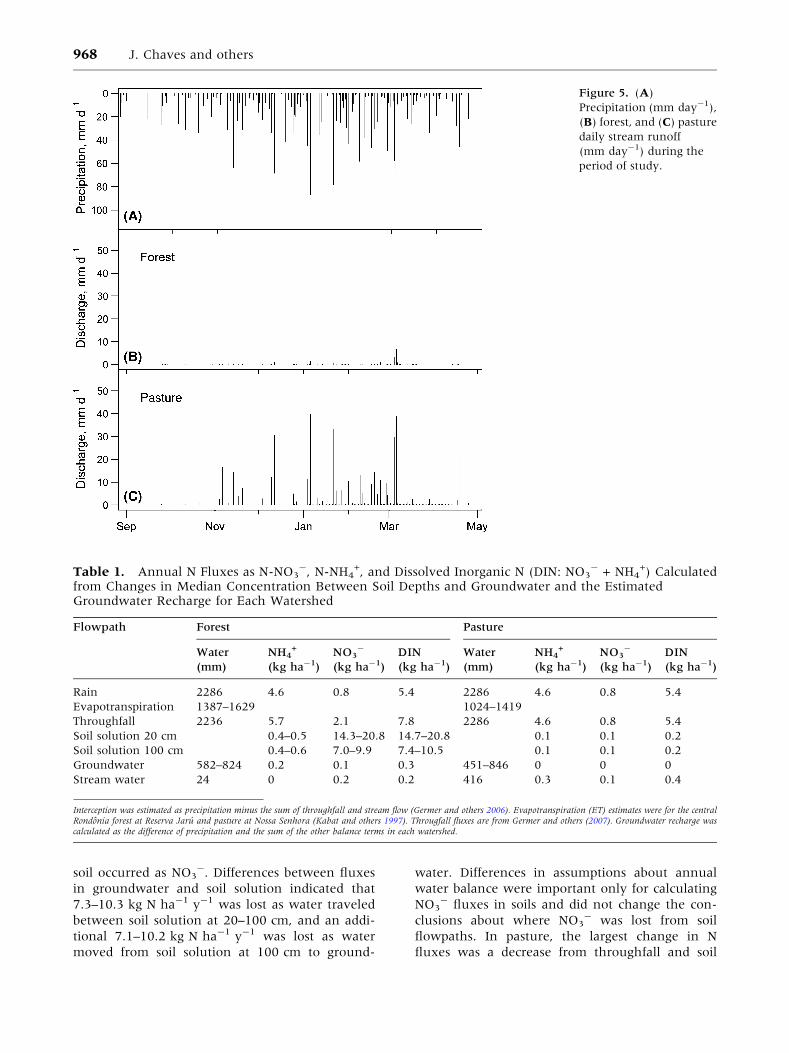
Runoff response to rainfall, both in quantity and
frequency, was much higher in pasture than in
forest (Figure 5). Total incident rainfall recorded for
the period of study was 2286 mm, close to the 1984–
2003 annual average (2300 mm; Germer and others
Figure 2. Box plots (min,
25%, median, 75%, and
max) of concentration
(lmol l-1) of (A) NO3-
and (B) NH4+ in direct
precipitation (Precip.),
forest throughfall (TF),
overland flow (OF), soil
solution (20, 100 cm),
groundwater (GW), and
streamflow (Stream) in
the forest (F) and pasture
(P) watersheds.
966 J. Chaves and others
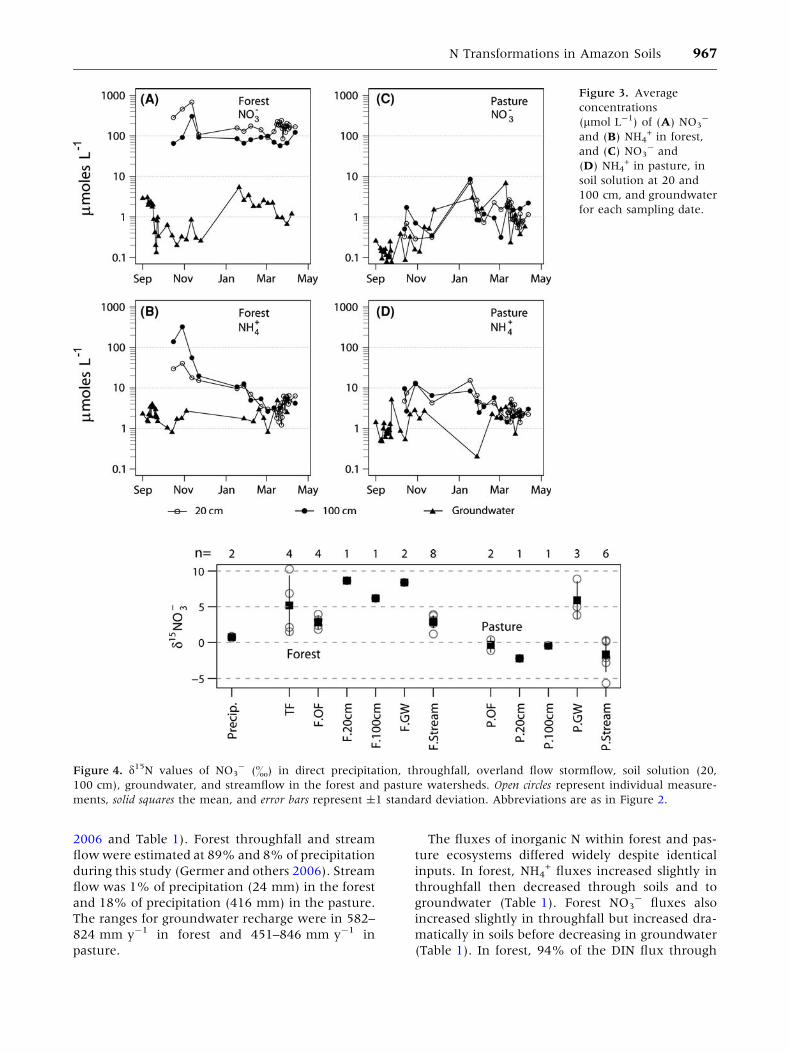
2006 and Table 1). Forest throughfall and stream
flow were estimated at 89% and 8% of precipitation
during this study (Germer and others 2006). Stream
flow was 1% of precipitation (24 mm) in the forest
and 18% of precipitation (416 mm) in the pasture.
The ranges for groundwater recharge were in 582–
824 mm y-1 in forest and 451–846 mm y-1 in
pasture.
The fluxes of inorganic N within forest and pas-
ture ecosystems differed widely despite identical
inputs. In forest, NH4+ fluxes increased slightly in
throughfall then decreased through soils and to
groundwater (Table 1). Forest NO3- fluxes also
increased slightly in throughfall but increased dra-
matically in soils before decreasing in groundwater
(Table 1). In forest, 94% of the DIN flux through
Figure 3. Average
concentrations
(lmol L-1) of (A) NO3-
and (B) NH4+ in forest,
and (C) NO3- and
(D) NH4+ in pasture, in
soil solution at 20 and
100 cm, and groundwater
for each sampling date.
Figure 4. d15N values of NO3- (&) in direct precipitation, throughfall, overland flow stormflow, soil solution (20,
100 cm), groundwater, and streamflow in the forest and pasture watersheds. Open circles represent individual measure-
ments, solid squares the mean, and error bars represent ±1 standard deviation. Abbreviations are as in Figure 2.
N Transformations in Amazon Soils 967
soil occurred as NO3-. Differences between fluxes
in groundwater and soil solution indicated that
7.3–10.3 kg N ha-1 y-1 was lost as water traveled
between soil solution at 20–100 cm, and an addi-
tional 7.1–10.2 kg N ha-1 y-1 was lost as water
moved from soil solution at 100 cm to ground-
water. Differences in assumptions about annual
water balance were important only for calculating
NO3- fluxes in soils and did not change the con-
clusions about where NO3- was lost from soil
flowpaths. In pasture, the largest change in N
fluxes was a decrease from throughfall and soil
Figure 5. (A)
Precipitation (mm day-1),
(B) forest, and (C) pasture
daily stream runoff
(mm day-1) during the
period of study.
Table 1. Annual N Fluxes as N-NO3-, N-NH4
+, and Dissolved Inorganic N (DIN: NO3- + NH4
+) Calculatedfrom Changes in Median Concentration Between Soil Depths and Groundwater and the EstimatedGroundwater Recharge for Each Watershed
Flowpath Forest Pasture
Water
(mm)
NH4+
(kg ha-1)
NO3-
(kg ha-1)
DIN
(kg ha-1)
Water
(mm)
NH4+
(kg ha-1)
NO3-
(kg ha-1)
DIN
(kg ha-1)
Rain 2286 4.6 0.8 5.4 2286 4.6 0.8 5.4
Evapotranspiration 1387–1629 1024–1419
Throughfall 2236 5.7 2.1 7.8 2286 4.6 0.8 5.4
Soil solution 20 cm 0.4–0.5 14.3–20.8 14.7–20.8 0.1 0.1 0.2
Soil solution 100 cm 0.4–0.6 7.0–9.9 7.4–10.5 0.1 0.1 0.2
Groundwater 582–824 0.2 0.1 0.3 451–846 0 0 0
Stream water 24 0 0.2 0.2 416 0.3 0.1 0.4
Interception was estimated as precipitation minus the sum of throughfall and stream flow (Germer and others 2006). Evapotranspiration (ET) estimates were for the centralRondonia forest at Reserva Jaru and pasture at Nossa Senhora (Kabat and others 1997). Througfall fluxes are from Germer and others (2007). Groundwater recharge wascalculated as the difference of precipitation and the sum of the other balance terms in each watershed.
968 J. Chaves and others
solution (Table 1). Little N was lost as water moved
from soils to groundwater because N fluxes
through soils were extremely low. The export of
DIN in stream water was 0.2 kg N ha-1 y-1 from
forest and 0.4 kg ha-1 y-1 from pasture (Table 1).
The range of groundwater recharge estimates for
the pasture resulted in little variation in estimates
of N fluxes from soil to groundwater due to the low
DIN levels at all soil depths.
DISCUSSION
There were important differences in the location,
form, and magnitude of DIN fluxes through forest
and pasture watersheds. In forest, fluxes of NH4+
decreased and fluxes of NO3- increased as water
moved from throughfall to shallow soil solution.
This led to high DIN fluxes through soil solution. In
pasture, fluxes of both NH4+ and NO3
- decreased
from throughfall to soils, and DIN fluxes through
soils were very low. This pattern is consistent with
high rates of net N mineralization and net nitrifi-
cation in soils of Amazon forest compared with
pasture (Neill and others 1997b; Verchot and others
1999). Davidson and others (2007) showed that old
growth Amazon forests exhibit abundant soil NO3-
and high rates of N cycling, but young Amazon
forests regrowing on abandoned pastures have low
soil NO3- and low soil N availability that reflect
high N losses and inducement of plant N limitation
during deforestation and pasture management. Our
forest showed the same high soil NO3- availability
and our pasture exhibited the same low soil N
availability consistent with plant N limitation at the
extreme young forest end of that gradient.
In forest, soil solution NO3- was high and
showed little seasonal variation during the year,
but soil solution NH4+ declined following wetting of
soils after the first major rains in November. Sta-
bilization of wet season concentrations just below
those in rain and throughfall suggested dilution of
soil solution by rain during the wettest period.
Higher seasonal rates of net nitrification in wet soils
(Neill and others 1995) may also contribute to de-
cline in NH4+ after the dry season. The increase in
NO3- in pasture from dry to wet seasons may also
be influenced by rain inputs; only in this case, soil
solution NO3- was likely depleted by plant demand
during the dry season but replenished by rain and
approached concentrations in rain after the begin-
ning of the wet season. Groundwater concentra-
tions varied little, probably because different travel
times for soil solution resulted in water reaching
the groundwater throughout the year.
Our results indicated a large removal of N (14.5–
20.5 kg ha-1 y-1), mostly as NO3-in hydrological
flowpaths leading from soil solution at 20 cm to
groundwater in the forest watershed. Evidence for
this comes from both the decline in concentration
of NO3- from soil solution to groundwater and the
vertical water movement from the unsaturated
zone to groundwater as derived from the water
balance. Lower concentrations of NO3- in ground-
water cannot be explained by lateral transfers of
soil solution to streams above the regional
groundwater because water export as stream flow
in the forest watershed amounted to only 1% of
annual precipitation (2286 mm), whereas vertical
flowpaths moved an estimated range of 582–
824 mm from soil solution to groundwater.
We cannot unequivocally establish the fate of the
N that disappeared from the forest soil-to-ground-
water flowpath, but N fluxes at this site and work
in other tropical forests suggest that denitrification
is an important component of this loss. Emissions of
N2O from forest soil at Rancho Grande have been
reported at 3.0 kg N ha-1 y-1 (Garcia-Montiel
and others 2004), whereas forest NO fluxes at
nearby Fazenda Nova Vida were estimated at
1.4 kg N ha-1 y-1 (Neill and others 2005). Com-
bined, these fluxes could account for gaseous N gas
loss of 4.4 kg ha-1 y -1, which is 43–62% of the
calculated N loss below 100 cm. Because the
potential contribution to gaseous N flux from deni-
trification to N2 in Amazon forest soil remains
unquantified and poorly constrained, denitrifica-
tion potentially could account for all of the
observed hydrologic N loss in soil flowpaths.
Mature tropical forests are largely presumed to be
P rather than N limited (Denslow and others 1987;
Herbert and Fownes 1995; Vitousek and Farrington
1997; Vitousek 2004; Davidson and others 2007).
Observations from multiple tropical forest sites
suggest that stocks of N and leaching and gaseous
losses are high (Martinelli and others 1999) and that
cycling of N is not conservative (Vitousek 1984). N
concentrations and fluxes in our forest watershed
were consistent with that view. We suggest that
plant N demand may contribute to the concentra-
tion gradient and N lost from hydrologic flowpaths
in shallow soil; however, plant N demand is un-
likely to explain losses between soils at 100 cm and
groundwater. This is because fine roots in Amazon
forest are most abundant in the top 30 cm of soil
and an order of magnitude lower below 1 m
(Nepstad and others 1994). In a forest in French
Guiana fine roots below 50 cm contributed little
or no significant Ca and Sr uptake to the whole
tree economy (Poszwa and others 2002). If root
N Transformations in Amazon Soils 969
distribution in our forest site is comparable to that at
these locations, plant uptake might account for
some of the 7.3–10.3 kg ha-1 y-1 N loss between
20 and 100 cm. However, it would be unlikely to
explain uptake from deeper depths where root
biomass is dramatically lower and where invest-
ment in N uptake would require greater plant
investment compared with uptake from shallower
depths where N in soil solution is abundant.
The higher d15NO3- values measured in forest
soil solution and groundwater relative to precipi-
tation and other forest flowpaths provided some
indication that denitrification could be one of the
pathways for the estimated N losses. In Hawaiian
forests, preferential 14N loss through denitrification
explained elevated d15N values inputs in bulk soil
N, and soil solution NO3- relative to those in pre-
cipitation (Houlton and others 2006). In that study,
stream N loss had high d15N values as well and
could not account for the 15N enrichment in soil N.
In our forest watershed, N losses to both stream
water and groundwater were 15N-enriched relative
to precipitation (Figure 4). Therefore, a gaseous
preferential 14N loss would be necessary to account
for the higher N isotope ratios in soil solution and
groundwater. A well-constrained N isotope budget,
which is precluded by our low sample number,
would be necessary to provide unequivocal evi-
dence for denitrification as the major N sink
mechanism.
Despite large differences in DIN fluxes within
forest and pasture watersheds, export of DIN in
stream water was low and similar (0.2–
0.4 kg N ha-1 y-1) in forest and pasture. In small
watersheds in the central Amazon, abrupt decreases
of NO3- concentration and 15N enrichment of NO3
-
along groundwater toposequences from upland
forest to stream riparian zones have been interpreted
to indicate denitrification and N removal in the
streamside zone, leading to low export of N in stream
water (McClain and others 1994; Brandes and others
1996). One prominent difference between these
sites and our study site is that ours lacked a saturated
riparian zone. Our results, in contrast, suggest that N
removal occurs in terra firme soils and is likely dis-
tributed throughout the watershed, rather than
concentrated in riparian zones.
Compared to N dynamics in other Amazon
watersheds, the groundwater NO3- concentrations
we measured in forest were much lower than the
approximately 30–50 lmol l-1 measured in the
upland portions of watersheds in the central
Amazon (McClain and others 1994; Brandes and
others 1996; Williams and others 1997) or in deep
soil solution in the eastern Amazon (Markewitz
and others 2004). These differences may be a
function of differences in the hydraulic properties
of soils among these locations. Our study was on
Ultisols, which exhibit sharp downward increases
in clay content and decreases in macroporosity
(Elsenbeer 2001) and therefore relatively lower
hydraulic conductivity (Zimmermann and others
2006). These other studies were on Oxisols, where
deep and potentially rapid flowpaths leading to
groundwater may predominate (Elsenbeer 2001).
Differences in the location and magnitude of N
cycling in tropical watersheds with soils of different
hydraulic properties have been documented at the
Luquillo Experimental Forest in Puerto Rico
(McDowell and others 1992). At Luquillo, NO3-
concentrations in upland groundwater were lower
under an Ultisol, with an impeding layer, than
under an Inceptisol, where subsoil was dominated
by sands of high hydraulic conductivity. This con-
trast, though currently based on few sites, suggests
that in the Amazon, unsaturated vadose zones
could be a major site of NO3- removal in forests on
soils with low hydraulic conductivities, whereas
soils with rapid water infiltration allow a larger
proportion of NO3- from soil solution to reach the
groundwater.
It is also possible that the observed decline in
NO3- from soil solution to groundwater could be
caused by retention of NO3- on anion exchange
sites deep in the soils. This has been reported in
tropical locations with volcanic soils, such as the
Caribbean lowlands of Costa Rica (Matson and
others 1987), where this process accounted for 12%
of N tracer additions. We did not directly measure
NO3- retention deep in the soil profile in our
watersheds. However, several basic features of these
Ultisols suggest that the presence of the significant
anion exchange capacity needed to promote
retention of NO3- on forest soil exchange sites is
unlikely. These features include shallow contact
with bedrock and relatively high pH (5.4), signifi-
cant cation exchange capacity (5.8 cmolc kg-1) and
73% base saturation in the surface (0–10 cm)
horizon (Neill and others 1997a).
Patterns of N fluxes in our watersheds show
some fundamental differences compared with pat-
terns in the temperate zone where most of our
understanding of watershed-level N fluxes has
been developed. First, high NO3- fluxes through
soils in forest do not lead to high groundwater N
concentrations and large stream water losses from
hydrologic flowpaths. Second, loss or retention of
NO3- in forest occurs largely between soil solution
and groundwater, not in riparian zones. Third,
conversion of forest to typical unfertilized Amazon
970 J. Chaves and others
pasture agriculture does not cause increases in
watershed N inputs and stream water N losses, but
instead results in lower N fluxes through soils and
into groundwater and streams. This contrasts with
the predominant pattern in the temperate zone,
where watersheds with higher proportions of agri-
cultural land typically receive large N inputs and
have higher riverine N exports (Howarth and others
1996; Boyer and others 2002). This could change as
the sources of anthropogenic N deposition, such as
N oxides from fossil fuel combustion and N fertil-
ization in intensive agriculture expand in the tropics
(Matson and others 1999). Understanding the
locations and mechanisms of N retention across
differences in tropical soils and across upland and
riparian soilscapes will help to understand
watershed N response to these potential future
changes in land use and land management.
ACKNOWLEDGEMENTS
We thank Alexandra A. Montebelo, Gustavo G.
Baldi, and Maıra O. Bezerra at the Centro de Energia
Nuclear na Agricultura in Piracicaba for conducting
the chemical analyses. Shelby Hayhoe, Sonya
Remington, Mathew Shamey, Tobias Vetter, and
Lisa Werther helped during the field work phase of
this study. The subject editor and two anonymous
reviewers provided helpful criticism and insights
that greatly improved the final product. Support for
this study was provided by the US National Science
Foundation (DEB-0315656), the NASA LBA Pro-
gram (NCC5-690) and by grants from Brazilian
agencies FAPESP (# 03/13172-2) and CNPq
(# 420199/2005-5). Special thanks to the Schmitz
family for allowing us to work on their land.
REFERENCES
Achard F, Eva HD, Stibig HJ, Mayaux P, Gallego J, Richards T,
Malingreau JP. 2002. Determination of deforestation rates of
the world’s humid tropical forests. Science 297:999–1002.
Boyer EW, Goodale CL, Jaworski NA, Howarth RW. 2002.
Anthropogenic nitrogen sources and relationships to riverine
nitrogen export in the northeastern U.S.A. Biogeochemistry
57–58:137–69.
Brandes J, McClain M, Pimentel T. 1996. 15N evidence for the
origin and cycling of inorganic nitrogen in a small Amazonian
catchment. Biogeochemistry 34:45.
Chaves JE, Neill C, Germer S, Gouveia Neto S, Krusche AV,
Elsenbeer H. 2008. Land management impacts on runoff sources
in small Amazon watersheds. Hydrol Process 22:1766–75.
Crawley MJ. 2002. Statistical computing: an introduction to data
analysis using S-Plus. Chichester: Wiley.
Davidson EA, Keller M, Erickson HE, Verchot LV, Veldkamp E.
2000. Testing a conceptual model of soil emissions of nitrous
and nitric oxides. Bioscience 50:667–80.
Davidson EA, de Carvalho CJR, Figueira AM, Ishida FY, Ometto
JPHB, Nardoto GB, Saba RT, Hayashi SN, Leal EC, Vieira ICG,
Martinelli LA. 2007. Recuperation of nitrogen cycling in
Amazonian forests following agricultural abandonment. Nat-
ure 447:995–8.
Denslow JS, Vitousek PM, Schultz JC. 1987. Bioassays of nutrient
limitation in a tropical rain forest soil. Oecologia 74:370–6.
Elsenbeer H. 2001. Hydrologic flowpaths in tropical rainforest
soilscapes—a review. Hydrol Process 15:1751–9.
Fearnside PM. 2005. Deforestation in Brazilian Amazonia: his-
tory, rates, and consequences. Conserv Biol 19:680–8.
Finzi AC, Norby RJ, Calfapietra C, Gallet-Budynek A, Gielen B,
Holmes WE, Hoosbeek MR, Iversen CM, Jackson RB, Kubiske
ME, Ledford J, Liberloo M, Oren R, Polle A, Pritchard S, Zak
DR, Schlesinger WH, Ceulemans R. 2007. Increases in nitro-
gen uptake rather than nitrogen-use efficiency support higher
rates of temperate forest productivity under elevated CO2.
Proc Natl Acad Sci USA 104:14014–19.
Garcia-Montiel D, Melillo JM, Steudler PA, Tian H, Neill C,
Kicklighter D, Feigl BJ, Piccolo MC, Cerri CC. 2004. Emissions
of N2O and CO2 from terra firme forests in Rondonia, Brazil.
Ecol Appl 14:S214–20.
Germer S, Elsenbeer H, Moraes JM. 2006. Throughfall and
temporal trends of rainfall redistribution in an open tropical
rainforest, south-western Amazonia (Rondonia, Brazil). Hy-
drol Earth Syst Sci 10:383–93.
Germer S, Neill C, Krusche A, Neto S, Elsenbeer H. 2007. Sea-
sonal and within-event dynamics of rainfall and throughfall
chemistry in an open tropical rainforest in Rondonia, Brazil.
Biogeochemistry 86:155–74.
Germer S, Neill C, Vetter T, Chaves J, Krusche AV, Elsenbeer H.
2009. Implications of long-term land-use change for the
hydrology and solute budgets of small catchments in
Amazonia. J Hydrol 364:349–63.
Goolsby DA, Battaglin WA. 2001. Long-term changes in con-
centrations and flux of nitrogen in the Mississippi River Basin,
USA. Hydrol Process 15:1209–26.
Hall SJ, Matson PA. 1999. Nitrogen oxide emissions after
nitrogen additions in tropical forests. Nature 400:152–5.
Herbert D, Fownes J. 1995. Phosphorus limitation of forest leaf
area and net primary production on a highly weathered soil.
Biogeochemistry 29:223–35.
Houlton BZ, Sigman DM, Hedin LO. 2006. Isotopic evidence for
large gaseous nitrogen losses from tropical rainforests. Proc
Natl Acad Sci USA 103:8745–50.
Howarth RW, Billen G, Swaney D, Townsend A, Jaworski N,
Lajtha K, Downing JA, Elmgren R, Caraco N, Jordan T, Ber-
endse F, Freney J, Kudeyarov V, Murdoch P, Zhao-Liang Z.
1996. Regional nitrogen budgets and riverine N & P fluxes for
the drainages to the North Atlantic Ocean: natural and human
influences. Biogeochemistry 35:75–139.
INPE. 2008. Monitoramento da floresta Amazonica Brasileira
por satelite: Projeto PRODES. Sao Jose dos Campos: Instituto
Nacional de Pesquisas Espacias.
Kabat P, Dolman AJ, Ashby M, Gash JHC, Wright IR, Culf AD,
Calvet JC, Delire C, Noilhan J, Jochum A, Silva Dias MA,
Fisch GA, Santos Alval RC, Nobre A, Prince SD, Steininger M.
1997. The large scale biosphere—atmosphere experiment: use
of integrated modelling for experimental design. Report 145,
Wageningen.
Kirkby M, Callan J, Weyman D, Wood J. 1976. Measurement
and modeling of dynamic contributing areas in very small
N Transformations in Amazon Soils 971
catchments. Working Paper No. 167, University of Leeds,
School of Geography, Leeds, p 39.
Leal JWL, Silva GH, dos Santos DB, Texeira W, de Lima MIC,
Fernandes CAC, Pinto A. 1978. Geologia—Folha SC.20 Porto
Velho. Projeto Radambrasil 17:219–355.
Lesack LFW. 1993. Export of nutrients and major ionic solutes
from a rain forest catchment in the central Amazon basin.
Water Resour Res 29:743–58.
Markewitz D, Davidson EA, Moutinho P, Nepstad D. 2004.
Nutrient loss and redistribution after forest clearing on a
highly weathered soil in Amazonia. Ecol Appl 14:177–99.
Martinelli LA, Piccolo MC, Townsend AR, Vitousek PM, Cuevas
E, McDowell W, Robertson GP, Santos OC, Treseder K. 1999.
Nitrogen stable isotopic composition of leaves and soil: tropical
versus temperate forests. Biogeochemistry 46:45.
Matson PA, Vitousek PM, Ewel JJ, Mazzarino MJ, Robertson GP.
1987. Nitrogen transformations following tropical forest fell-
ing and burning on a volcanic soil. Ecology 68:491–502.
Matson PA, McDowell W, Townsend AR, Vitousek PM. 1999.
The globalization of N deposition: ecosystem consequences in
tropical environments. Biogeochemistry 46:67–83.
Matthews E. 1994. Nitrogenous fertilizers: global distribution of
consumption and associated emissions of nitrous oxide and
ammonia. Global Biogeochem Cycles 8:411–40.
Matthews E, Rohweder M, Payne R, Murray S. 2000. Pilot
analysis of global ecosystems: forest ecosystems. Washington,
DC: World Resources Institute.
McClain ME, Richey JE, Pimentel TP. 1994. Groundwater
nitrogen dynamics at the terrestrial-lotic interface of a small
catchment in the Central Amazon basin. Biogeochemistry
27:113–27.
McDowell W, Bowden WB, Asbury CE. 1992. Riparian nitrogen
dynamics in two geomorphologically distinct rain forest
watersheds: subsurface solute patterns. Biogeochemistry
18:53–75.
Mulholland PJ, Helton AM, Poole GC, Hall RO, Hamilton SK,
Peterson BJ, Tank JL, Ashkenas LR, Cooper LW, Dahm CN,
Dodds WK, Findlay SEG, Gregory SV, Grimm NB, Johnson SL,
McDowell WH, Meyer JL, Valett HM, Webster JR, Arango CP,
Beaulieu JJ, Bernot MJ, Burgin AJ, Crenshaw CL, Johnson
LT, Niederlehner BR, O’Brien JM, Potter JD, Sheibley RW,
Sobota DJ, Thomas SM. 2008. Stream denitrification across
biomes and its response to anthropogenic nitrate loading.
Nature 452:202–5.
Neill C, Piccolo MC, Steudler PA, Melillo JM, Feigl BJ, Cerri CC.
1995. Nitrogen dynamics in soils of forests and active pastures
in the western Brazilian Amazon Basin. Soil Biol Biochem
27:1167–75.
Neill C, Melillo JM, Steudler PA, Cerri CC, De Moraes JM, Pic-
colo MC, Brito M. 1997a. Soil carbon and nitrogen stocks
following forest clearing for pasture in the southwestern
Brazilian Amazon. Ecol Appl 7:1216–25.
Neill C, Piccolo MC, Cerri CC, Steudler PA, Melillo JM, Brito M.
1997b. Net nitrogen mineralization and net nitrification rates
in soils following deforestation for pasture across the south-
western Brazilian Amazon Basin landscape. Oecologia 110:
243–52.
Neill C, Deegan L, Thomas S, Cerri CC. 2001. Deforestation for
pasture alters nitrogen and phosphorus in small Amazonian
streams. Ecol Appl 11:1817–28.
Neill C, Steudler P, Garcia-Montiel ADC, Melillo JM, Feigl BJ,
Piccolo MC, Cerri CC. 2005. Rates and controls of nitrous
oxide and nitric oxide emissions following conversion of forest
to pasture in Rondonia. Nutr Cycl Agroecosyst 71:1–15.
Neill C, Piccolo M, Cerri CC, Steudler PA, Melillo JM. 2006. Soil
solution nitrogen losses during clearing of lowland Amazon
forest for pasture. Plant Soil 281:233–45.
Nepstad DC, de Carvalho CR, Davidson EA, Jipp PH, Lefebvre
PA, Negreiros GH, da Silva ED, Stone TA, Trumbore SE, Vieira
S. 1994. The role of deep roots in the hydrological and carbon
cycles of Amazonian forests and pastures. Nature 372:666–9.
Peierls BL, Caraco NF, Pace ML, Cole JJ. 1991. Human influence
on river nitrogen. Nature 350:386.
Peixoto de Melo D, da Costa RC, Natali Filho T. 1978. Geo-
morfologia—Folha SC.20 Porto Velho. Projeto Radambrasil
16:187–250.
Perring MP, Hedin LO, Levin SA, McGroddy M, de Mazancourt
C. 2008. Increased plant growth from nitrogen addition
should conserve phosphorus in terrestrial ecosystems. Proc
Natl Acad Sci USA 105:1971–6.
Pires JM, Prance GT. 1986. The vegetation types of the Brazilian
Amazon. In: Prance GT, Lovejoy TM, Eds. Key environments:
Amazonia. Oxford: Pergamon. p 109–29.
Poszwa A, Dambrine E, Ferry B, Pollier B, Loubet M. 2002. Do
deep tree roots provide nutrients to the tropical rainforest?
Biogeochemistry 60:97–118.
R Development Core Team. 2006. R: a language and environ-
ment for statistical computing. Vienna, Austria: R Foundation
for Statistical Computing.
Robertson GP. 1989. Nitrification and denitrification in humid
tropical ecosystems. In: Proctor J, Ed. Mineral nutrients in
tropical forest and savanna ecosystems. Cambridge (MA):
Blackwell Scientific. p 55–70.
Sigman DM, Altabet MA, Michener R, McCorkle DC, Fry B,
Holmes RM. 1997. Natural abundance-level measurements of
the nitrogen isotopic composition of oceanic nitrate: an
adaptation of the ammonia diffusion method. Marine Chem
57:227–42.
Soil Survey Staff. 1999. Soil taxonomy—a basic system of soil
classification for making and interpreting soil surveys.
Washington, DC: US Government Printing Office.
Tiedje JM, Sexstone AJ, Parkin TB, Revsbech NP. 1984. Anaer-
obic processes in soil. Plant Soil 76:197–212.
Verchot LV, Davidson EA, Cattanio JH, Ackerman IL, Erickson
HE, Keller M. 1999. Land use change and biogeochemical
controls of nitrogen oxide emissions from soils in eastern
Amazonia. Global Biogeochem Cycles 13:31–46.
Vitousek PM. 1984. Litterfall, nutrient cycling, and nutrient
limitation in tropical forests. Ecology 65:285–98.
Vitousek PM. 2004. Nutrient cycling and limitation. Princeton
(NJ): Princeton University Press.
Vitousek PM, Farrington H. 1997. Nutrient limitation and soil
development: experimental test of a biogeochemical theory.
Biogeochemistry 37:63–75.
Williams MR, Melack JM. 1997. Solute export from forested and
partially deforested catchments in the central Amazon. Bio-
geochemistry 38:67.
Williams MR, Fisher TR, Melack JM. 1997. Solute dynamics in
soil water and groundwater in a central Amazon catchment
undergoing deforestation. Biogeochemistry 38:303.
Zimmermann B, Elsenbeer H, De Moraes JM. 2006. The influ-
ence of land-use changes on soil hydraulic properties: impli-
cations for runoff generation. Forest Ecol Manag 222:29–38.
972 J. Chaves and others


